Applying Fuzzy Logic to Risk Assessment and … Fuzzy Logic to Risk Assessment and Decision-Making...
59
Applying Fuzzy Logic to Risk Assessment and Decision-Making Sponsored by CAS/CIA/SOA Joint Risk Management Section Prepared by Kailan Shang 1 Zakir Hossen 2 November 2013 ©2013 Casualty Actuarial Society, Canadian Institute of Actuaries, Society of Actuaries, All Rights Reserved The opinions expressed and conclusions reached by the authors are their own and do not represent any official position or opinion of the sponsoring organizations or their members. The sponsoring organizations make no representation or warranty to the accuracy of the information. 1 Kailan Shang, FSA, CFA, PRM, SCJP, of Manulife Financial, can be reached at [email protected] . 2 Zakir Hossen, MA, of Scotiabank, can be reached at [email protected] .
Transcript of Applying Fuzzy Logic to Risk Assessment and … Fuzzy Logic to Risk Assessment and Decision-Making...
Applying Fuzzy Logic to Risk Assessment
and Decision-Making
Sponsored by
CAS/CIA/SOA
Joint Risk Management Section
Prepared by
Kailan Shang1
Zakir Hossen2 November 2013
©2013 Casualty Actuarial Society, Canadian Institute of Actuaries, Society of
Actuaries, All Rights Reserved
The opinions expressed and conclusions reached by the authors are their own and do not represent any official
position or opinion of the sponsoring organizations or their members. The sponsoring organizations make no
representation or warranty to the accuracy of the information.
1 Kailan Shang, FSA, CFA, PRM, SCJP, of Manulife Financial, can be reached at [email protected].
2 Zakir Hossen, MA, of Scotiabank, can be reached at [email protected].
©2013 Casualty Actuarial Society, Canadian Institute of Actuaries, Society of Actuaries, All Rights Reserved
Page 2 of 59
Acknowledgements
The authors would like to thank the members of the Project Oversight Group (POG) for their
guidance, reviews, comments and full support throughout this project. This paper would not
have its current level of relevance without the POG’s insightful input. The authors are grateful
for funding sponsored by the Joint Risk Management Section of the Casualty Actuarial
Society, the Canadian Institute of Actuaries and the Society of Actuaries.
“Applying Fuzzy Logic to Risk Assessment and Decision-Making” POG members are:
Andrei Titioura
Casey Malone
Christopher Coulter
Fred Tavan
Jason Sears
Joshua Parker
Mark Bergstrom
Mary Neumann
Steven Siegel
Zhiwei Zhu
The authors also would like to thank Barbara Scott for her effective coordination of this
project.
©2013 Casualty Actuarial Society, Canadian Institute of Actuaries, Society of Actuaries, All Rights Reserved
Page 3 of 59
Executive Summary
Complex models have long been used in risk management to assess uncertainty. With the
growing availability of computing resources, advanced methods such as stochastic modeling,
stress testing or even stochastic on stochastic modeling used for hedging programs are
increasingly prevalent. While risk professionals strive for a better understanding of risk and
employ complex models for risk assessment, many risks are still not well understood. Some
remain unknown, and new risks have emerged. Many risk types still cannot be analyzed
sufficiently using classical probability models. The lack of experience data and entangled
cause-and-effect relationships make it difficult to assess the degree of exposure to certain risk
types.
Traditional risk models are based on probability and classical set theory. They are widely
used for assessing market, credit, insurance and trading risk. In contrast, fuzzy logic models
are built upon fuzzy set theory and fuzzy logic, and they are useful for analyzing risks with
insufficient knowledge or imprecise data. These latter types of risk typically fall into the
operational risk or emerging risk category.
The fundamental difference between traditional set theory and fuzzy set theory is the
nature of inclusion of the elements in the set. In traditional sets, an element is either included
in the set or is not. In a fuzzy set, an element is included with a degree of truth normally
ranging from 0 to 1. Fuzzy logic models allow an object to be categorized in more than one
exclusive set with different levels of truth or confidence. Fuzzy logic recognizes the lack of
knowledge or absence of precise data, and it explicitly considers the cause-and-effect chain
among variables. Most variables are described in linguistic terms, which makes fuzzy logic
models more intuitively similar to human reasoning. These fuzzy models are helpful for
demystifying, assessing and learning about risks that are not well understood.
Fuzzy logic systems help simplify large-scale risk management frameworks. For risks
that do not have a proper quantitative probability model, a fuzzy logic system can help model
the cause-and-effect relationships, assess the degree of risk exposure and rank the key risks in
a consistent way, considering both the available data and experts’ opinions. For companies
with diversified business, broad risk exposure and operations in multiple geographic regions,
the long list of risks that need to be monitored makes in-depth risk analysis unaffordable,
especially when there are entangled relationships among risk factors. Such an analysis could
be costly and extremely tedious without the use of a fuzzy logic system. In addition, fuzzy
logic systems include rules that explicitly explain the linkage, dependence and relationships
among modeled factors. It is helpful for identifying risk mitigation solutions. Resources can
then be used to mitigate the risks with the highest level of exposure and relatively low
hedging cost.
Fuzzy set theory and fuzzy logic models can also be used with other types of pattern
recognition and decision models. These include Bayesian and artificial neural networks, and
hidden Markov and decision tree models. These extended models have the potential to solve

©2013 Casualty Actuarial Society, Canadian Institute of Actuaries, Society of Actuaries, All Rights Reserved
Page 4 of 59
difficult risk assessment problems.
This paper explores areas where fuzzy logic models may be applied to improve risk
assessment and risk decision-making. It discusses the methodology, framework and process of
using fuzzy logic systems for risk management. With the help of practical examples, it is
hoped that it will encourage wise application of fuzzy logic models to risk modeling.
©2013 Casualty Actuarial Society, Canadian Institute of Actuaries, Society of Actuaries, All Rights Reserved
Page 5 of 59
Contents
1. Introduction ................................................................................................................................... 6
2. Fuzzy Logic and Fuzzy Set Theory............................................................................................... 7
2.1 Basics of Fuzzy Set Theory and Fuzzy Logic ..................................................................... 7
2.2 A Numerical Example ....................................................................................................... 15
2.3 Alternative Models ............................................................................................................ 19
3 Application of Fuzzy Set Theory and Fuzzy Logic – A Literature Review ................................. 27
4 Risk Assessment Framework Based on Fuzzy Logic ................................................................... 32
4.1 Risk Assessment and Decision-Making ............................................................................ 32
4.2 Required Economic Capital Model ................................................................................... 35
5 Key Considerations ...................................................................................................................... 37
5.1 Expert Opinions – Collection and Analysis ...................................................................... 37
5.2 Selection of Membership Functions .................................................................................. 38
5.3 The Role of Experience Data ............................................................................................ 39
5.4 Fuzzy Logic System Review ............................................................................................. 39
5.5 Linkage to Decision-Making............................................................................................. 40
6 Case Studies ................................................................................................................................. 41
6.1 Negative Public Opinion Identification and Assessment .................................................. 41
6.2 Risk Aggregation and Budgeting ...................................................................................... 45
7 Conclusion ................................................................................................................................... 50
8 References .................................................................................................................................... 51
Appendix. The Use of Experience Data .......................................................................................... 55
©2013 Casualty Actuarial Society, Canadian Institute of Actuaries, Society of Actuaries, All Rights Reserved
Page 6 of 59
1. Introduction
Probability models are prevalent in risk quantification and assessment. They have become
the fundamental basis for informed decision-making related to risk in many areas. However, a
probability model built upon classic set theory may not be able to describe some risks in a
meaningful and practical way. Lack of experience data, entangled cause-and-effect
relationships and imprecise data make it difficult to assess the degree of exposure to certain
risk types using only traditional probability models. Sometimes, even with a credible
quantitative risk model calibrated to experience data, the cause of the risk and its
characteristics may be incompletely understood. Other models, such as fuzzy logic, hidden
Markov and decision tree models, and artificial neural and Bayesian networks, explicitly
consider the underlying cause-and-effect relationships and recognize the unknown complexity.
These newer models might do a better job in understanding and assessing certain risks, such
as operational risk.
Interestingly, while well-accepted and complex quantitative models are available for
market, credit and insurance risk, these risks are normally outside the control of business
managers. On the other hand, with appropriate risk identification and risk control in place,
operational risk can be significantly mitigated, despite the lack of consensus concerning
which quantitative models should be used. Therefore, it may be beneficial to build and
implement more appropriate operational risk models using a newer approach such as fuzzy
logic.
This report focuses on the application of fuzzy logic and fuzzy set theory, introduced by
mathematician Lotfi A. Zadeh in 1965, to risk management. Unlike probability theory, fuzzy
logic theory admits the uncertainty of truth in an explicit way; it also can easily incorporate
information described in linguistic terms. Fuzzy logic models are more convenient for
incorporating different expert opinions and more adapted to cases with insufficient and
imprecise data. They provide a framework in which experts’ input and experience data can
jointly assess the uncertainty and identify major issues. Using approximation and making
inferences from ambiguous knowledge and data, fuzzy logic models may be used for
modeling risks that are not fully understood. Some operational and emerging risks evolve
quickly. Risk managers may not have enough knowledge or data for a full-blown assessment
using models based on probability theory. Fuzzy logic models can be instrumental in
assessing a business enterprise’s exposure to these risks.
The remainder of the paper proceeds as follows:
Section 2 (Fuzzy Logic and Fuzzy Set Theory) introduces the theoretical
background of the fuzzy logic model and compares it to other models.
Section 3 (Application of Fuzzy Logic) discusses the potential application of
fuzzy logic to risk management.
Section 4 (Risk Assessment Framework Based on Fuzzy Logic) discusses using a
©2013 Casualty Actuarial Society, Canadian Institute of Actuaries, Society of Actuaries, All Rights Reserved
Page 7 of 59
fuzzy logic model for the identification, assessment and quantification of risks.
Section 5 (Key Considerations) touches on some key factors for a practical risk
management framework built on a fuzzy logic model.
Section 6 (Case Studies) illustrates the risk identification, risk assessment and
decision-making process at a micro level for a certain risk type and at an
aggregate level for all enterprise risks.
Section 7 summarizes the key points of this research and concludes the main
body of the report.
2. Fuzzy Logic and Fuzzy Set Theory
This section introduces some basic concepts in fuzzy set theory and a comparison with
other methods used for risk assessment and decision-making. It may be skipped by readers
with a background in artificial intelligence or control engineering.
2.1 Basics of Fuzzy Set Theory and Fuzzy Logic
Fuzzy Sets
In classical set theory, an individual object is either a member or a nonmember of a set.
However, in reality, due to insufficient knowledge or imprecise data, it is not always clear
whether an object belongs to a set or not. In contrast, fuzzy sets interpret uncertainty in an
approximate way. Conceptually, fuzzy set theory allows an object belonging to multiple
exclusive sets in the reasoning framework. For each set, there is a degree of truth that an
object belongs to a fuzzy set. Take credit scores as an example. Assume there are three levels
of the score: low, average and high, which can be considered as three sets. Based on classical
set theory, the full set is composed of these three exclusive sets. Once the credit score is
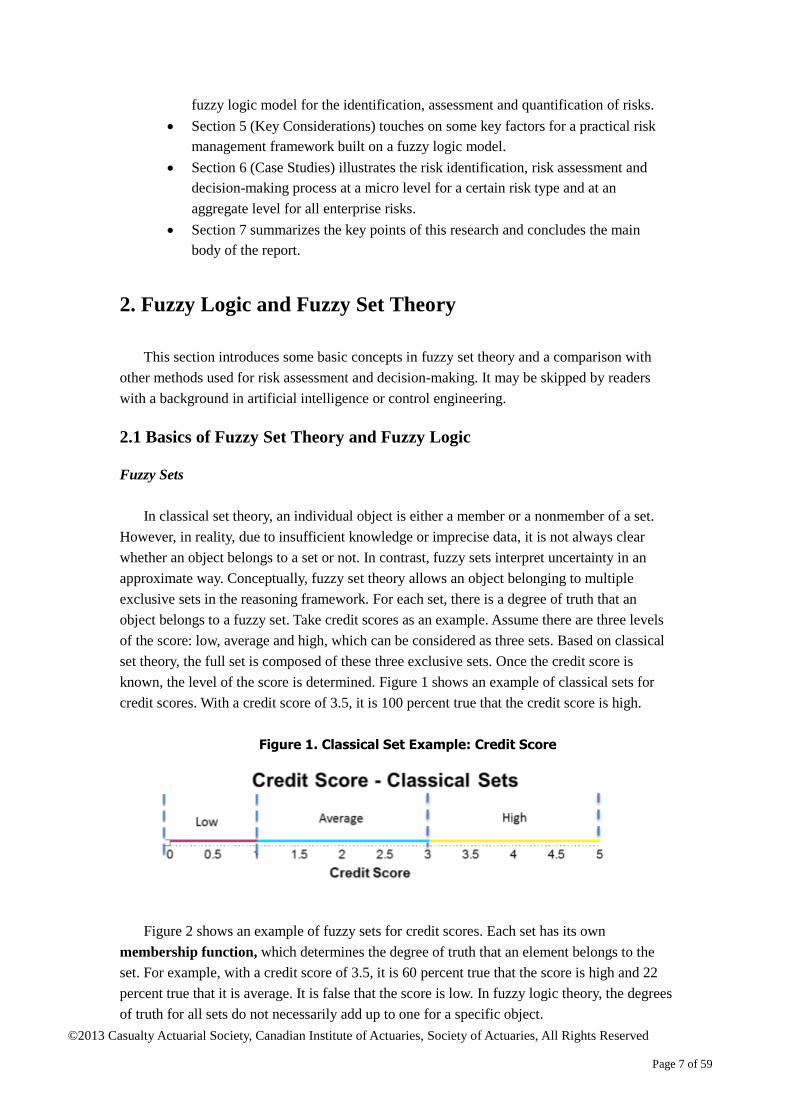
known, the level of the score is determined. Figure 1 shows an example of classical sets for
credit scores. With a credit score of 3.5, it is 100 percent true that the credit score is high.
Figure 1. Classical Set Example: Credit Score
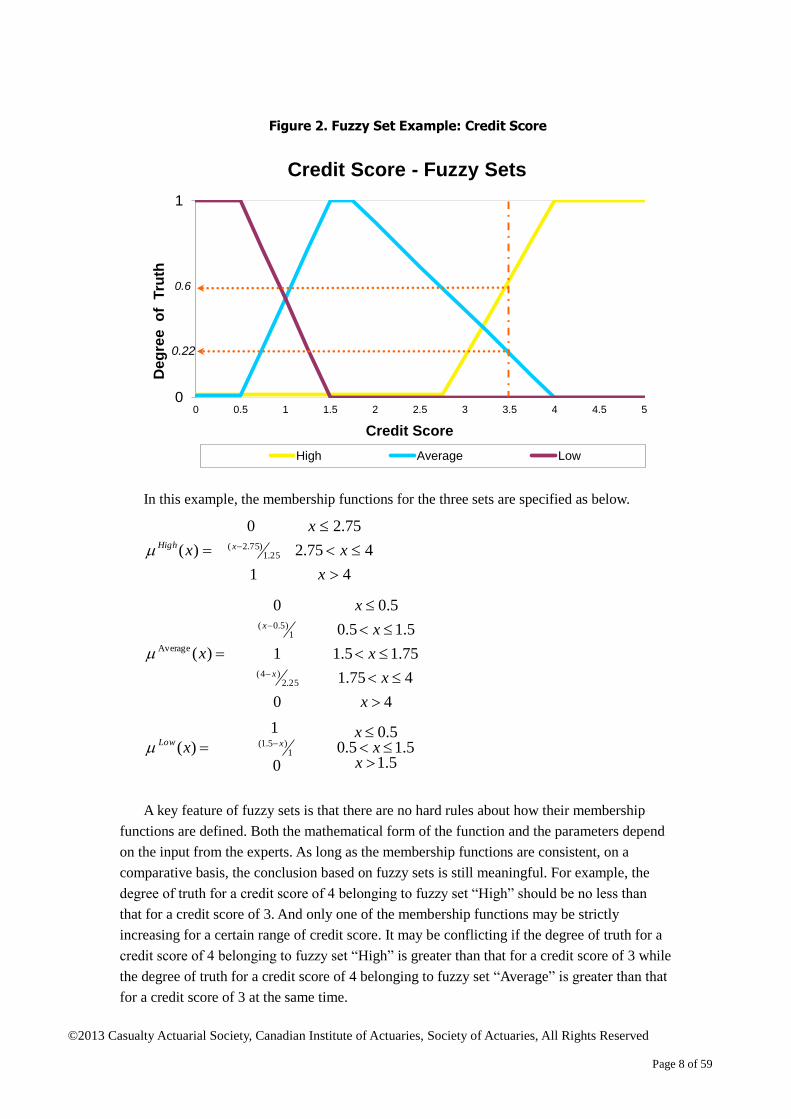
Figure 2 shows an example of fuzzy sets for credit scores. Each set has its own
membership function, which determines the degree of truth that an element belongs to the
set. For example, with a credit score of 3.5, it is 60 percent true that the score is high and 22
percent true that it is average. It is false that the score is low. In fuzzy logic theory, the degrees
of truth for all sets do not necessarily add up to one for a specific object.
©2013 Casualty Actuarial Society, Canadian Institute of Actuaries, Society of Actuaries, All Rights Reserved
Page 8 of 59
Figure 2. Fuzzy Set Example: Credit Score
In this example, the membership functions for the three sets are specified as below.
4
475.2
75.2
1
0
)( 25.1)75.2(
x
x
x
x xHigh
4
475.1
75.15.1
5.15.0
5.0
0
1
0
)(
25.2)4(
1)5.0(
Average
x
x
x
x
x
x
x
x
5.15.15.0
5.0
0
1
)( 1)5.1(
xx
xx xLow
A key feature of fuzzy sets is that there are no hard rules about how their membership
functions are defined. Both the mathematical form of the function and the parameters depend
on the input from the experts. As long as the membership functions are consistent, on a
comparative basis, the conclusion based on fuzzy sets is still meaningful. For example, the
degree of truth for a credit score of 4 belonging to fuzzy set “High” should be no less than
that for a credit score of 3. And only one of the membership functions may be strictly
increasing for a certain range of credit score. It may be conflicting if the degree of truth for a
credit score of 4 belonging to fuzzy set “High” is greater than that for a credit score of 3 while
the degree of truth for a credit score of 4 belonging to fuzzy set “Average” is greater than that
for a credit score of 3 at the same time.
0.22
0
1
0 0.5 1 1.5 2 2.5 3 3.5 4 4.5 5
De
gre
e o
f T
ruth
Credit Score
Credit Score - Fuzzy Sets
High Average Low
0.6
©2013 Casualty Actuarial Society, Canadian Institute of Actuaries, Society of Actuaries, All Rights Reserved
Page 9 of 59
Membership functions are typically simple for fuzzy sets. They are frequently linear and
often take the shape of a triangle, trapezoid, L or r. They may also be Gaussian or gamma.
Different people may have their own membership functions for a fuzzy set due to different
levels of knowledge and experience. However, in general, they may still mean similar things
when they make reference to a fuzzy set. For example, people may have the same opinion that
a loan applicant with a high credit score is likely to get the application approved with a
relatively low mortgage loan rate. Here “high credit score” fits naturally to the description of
a fuzzy set. But different mortgage loan risk assessors may have different membership
functions for fuzzy set “high credit score.” Fuzzy sets allow us to set up a system using our
everyday language and reasoning methods.
Fuzzy Sets Operation
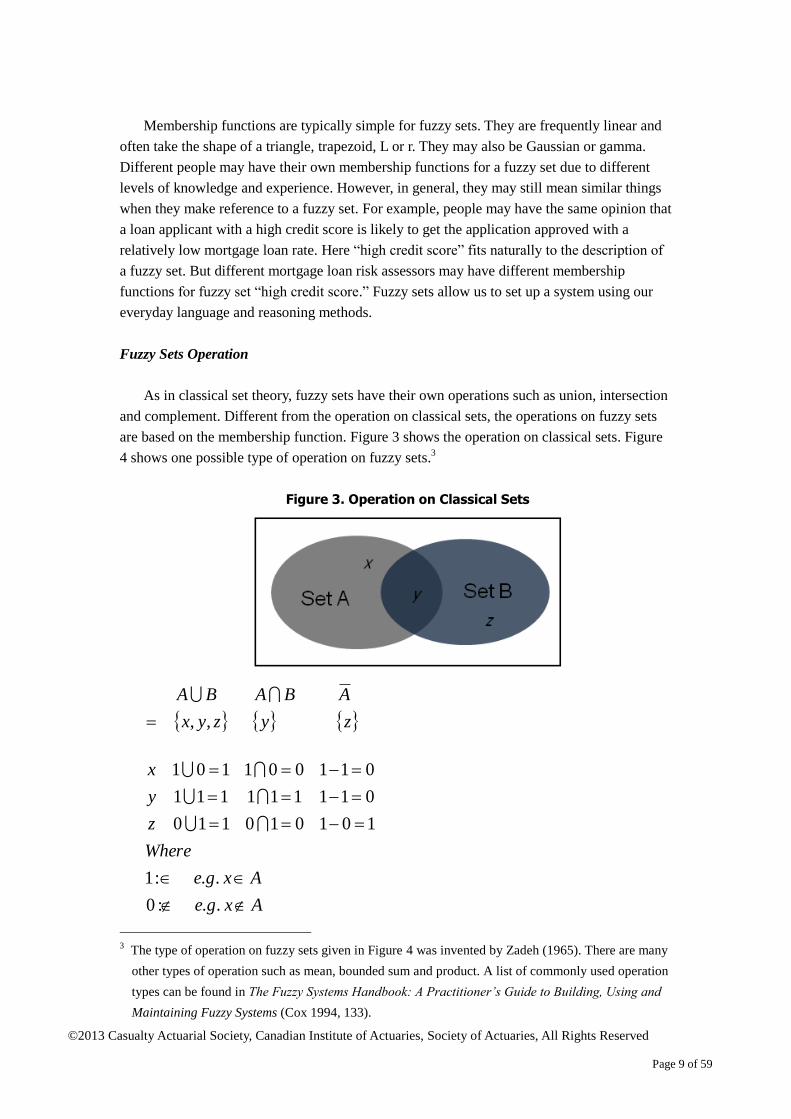
As in classical set theory, fuzzy sets have their own operations such as union, intersection
and complement. Different from the operation on classical sets, the operations on fuzzy sets
are based on the membership function. Figure 3 shows the operation on classical sets. Figure
4 shows one possible type of operation on fuzzy sets.3
Figure 3. Operation on Classical Sets
Axge
Axge
Where
z
y
x
z
A
y
BA
zyx
BA
..:0
..:1
101010110
011111111
011001101
,,
3 The type of operation on fuzzy sets given in Figure 4 was invented by Zadeh (1965). There are many
other types of operation such as mean, bounded sum and product. A list of commonly used operation
types can be found in The Fuzzy Systems Handbook: A Practitioner’s Guide to Building, Using and
Maintaining Fuzzy Systems (Cox 1994, 133).

©2013 Casualty Actuarial Society, Canadian Institute of Actuaries, Society of Actuaries, All Rights Reserved
Page 10 of 59
Figure 4. Operation on Fuzzy Sets
7.0)(1.0)(
4.0)(6.0)(
1.0)(5.0)(
zz
yy
xx
BA
BA
BA
9.01.07.0
4.04.06.0
5.01.05.0
1),min(),max(
z
y
x
ABABA ABABA
In this example, a max-min rule is used. The degree of truth that an element belongs to
the union of some fuzzy sets is the maximum of the degrees of truth that the element belongs
to each of the fuzzy sets. The degree of truth that an element belongs to the intersection of
some fuzzy sets is the minimum of the degrees of truth that the element belongs to each of the
fuzzy sets. The degree of truth that an element belongs to the complement of a fuzzy set is
one deducted by the degree of truth that the element belongs to the fuzzy set.
Inference Rules and Fuzzy Hedges
With logical operations on fuzzy sets, inference rules can be built to establish the
relationship among different variables. One type of fuzzy inference rule is called the max-min
inference rule.4 It is the max-min rule shown in Figure 4 applied to inference.
1. If A and B, then C.
The maximum degree of truth for C is the lesser of the degree of truth for A and that
for B.
2. If A or B, then C.
The maximum degree of truth for C is the greater of the degree of truth for A and that
for B.
3. If not A, then C.
The maximum degree of truth for C is one deducted by the degree of truth for A.
4 In addition to the max-min reference rule, there are many other fuzzy inference rules available, such
as monotonic reasoning, fuzzy addictive rule, correlation minimum and correlation product.

©2013 Casualty Actuarial Society, Canadian Institute of Actuaries, Society of Actuaries, All Rights Reserved
Page 11 of 59
For example, when assessing the risk of an economic downturn, term premium5 and
investors’ confidence level are the two key indicators. A possible inference rule is given
below.
If the term premium is small and investors’ confidence level is low, the risk of economic
downturn in the near future is high.
The term premium is 2 percent with a degree of truth small(2 percent) of 0.6. The
investor’s confidence index value is 65 with a degree of truth low(65) of 0.72. Using the
intersection operation on fuzzy sets as the minimum of the two degrees of truth small(2
percent) and low(65), the maximum degree of truth that there is a high risk of economic
downturn is 0.6. The resulting fuzzy set membership function is truncated at the true value of
0.6 from the top, as shown in Figure 5.
Figure 5. Fuzzy Inference Rule
Notes:
1. Unconditional membership function for fuzzy set “High Risk of Economic Downturn”:
level exposurerisk theis x where12
5.2)(
2
2
12
5
x
High
nalunconditio ex
2. Conditional membership function for fuzzy set “High Risk of Economic Downtown”:
level exposurerisk theis x where12
5.2,6.0)(
2
2
12
5
x
High
lconditiona eMinx
5 Term premium can be calculated as the difference between long-term bond yield and short-term bond
yield.
©2013 Casualty Actuarial Society, Canadian Institute of Actuaries, Society of Actuaries, All Rights Reserved
Page 12 of 59
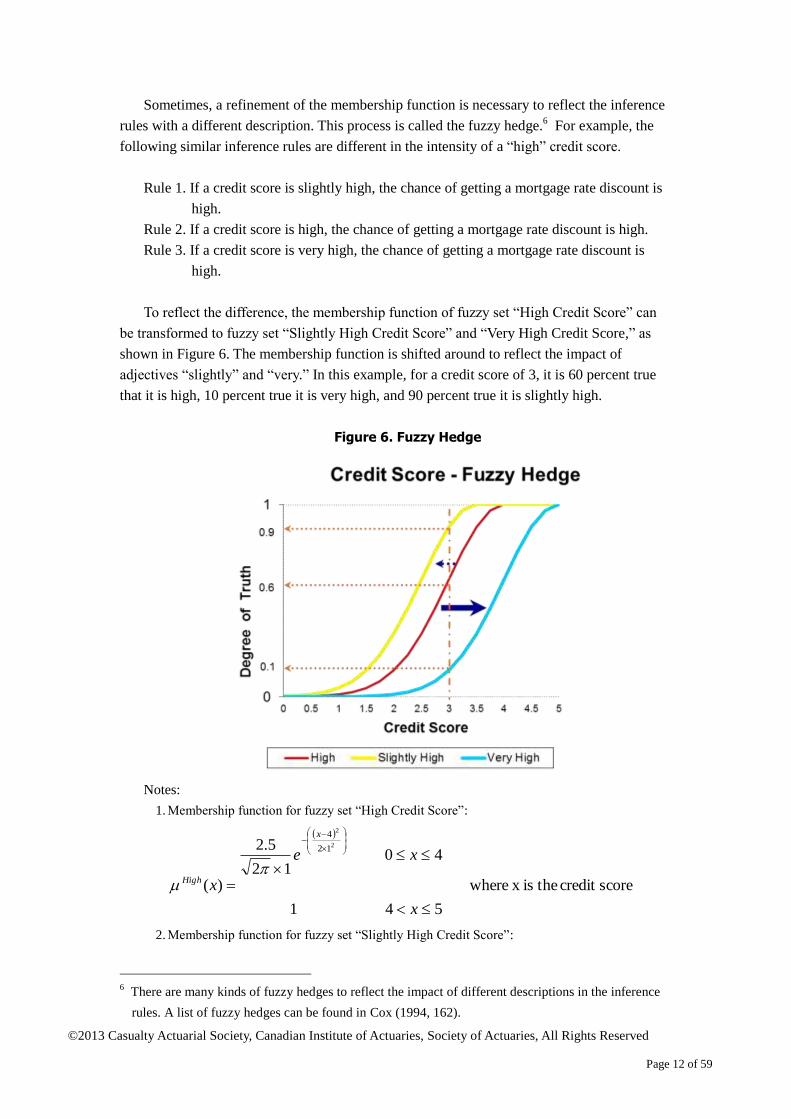
Sometimes, a refinement of the membership function is necessary to reflect the inference
rules with a different description. This process is called the fuzzy hedge.6 For example, the
following similar inference rules are different in the intensity of a “high” credit score.
Rule 1. If a credit score is slightly high, the chance of getting a mortgage rate discount is
high.
Rule 2. If a credit score is high, the chance of getting a mortgage rate discount is high.
Rule 3. If a credit score is very high, the chance of getting a mortgage rate discount is
high.
To reflect the difference, the membership function of fuzzy set “High Credit Score” can
be transformed to fuzzy set “Slightly High Credit Score” and “Very High Credit Score,” as
shown in Figure 6. The membership function is shifted around to reflect the impact of
adjectives “slightly” and “very.” In this example, for a credit score of 3, it is 60 percent true
that it is high, 10 percent true it is very high, and 90 percent true it is slightly high.
Figure 6. Fuzzy Hedge
Notes:
1. Membership function for fuzzy set “High Credit Score”:
scorecredit theis x where
541
4012
5.2
)(
2
2
12
4
x
xe
x
x
High
2. Membership function for fuzzy set “Slightly High Credit Score”:
6 There are many kinds of fuzzy hedges to reflect the impact of different descriptions in the inference
rules. A list of fuzzy hedges can be found in Cox (1994, 162).
©2013 Casualty Actuarial Society, Canadian Institute of Actuaries, Society of Actuaries, All Rights Reserved
Page 13 of 59
scorecredit theis x where
55.31
5.3012
5.2
)(
2
2
12
5.3
x
xe
x
x
High
3. Membership function for fuzzy set “Very High Credit Score”:
scorecredit theis x where50 12
5.2)(
2
2
12
5
xex
x
High
Defuzzification
Defuzzification is the process of estimating the value of the dependent variable based on
the resulting fuzzy set after applying the fuzzy inference rule. Three typical defuzzification
methods are described below.
1. Average method: The average numerical value of the dependent variable in the output
fuzzy set.
2. Average of maximum method: The average numerical value of the dependent variable
with the maximum degree of truth in the output fuzzy set.
3. Centroid method: The weighted average numerical value of the dependent variable in
the output fuzzy set. The weight is the degree of truth.
Different methods are appropriate in different situations. Continuing with the inference
rule example from Figure 5, the output fuzzy set is the area between the conditional
membership function and the x-axis.
Conditional membership function:
level exposurerisk theis 0,5 x where12
5.2,6.0)(
2
2
12
5
x
High
lconditiona eMinx
1. Average method: The range of the risk exposure level in the output fuzzy set is [0,5].
Therefore, the result of defuzzification is 2.5, the average of 0 and 5.
2. Average of maximum method: When x is greater than 4, the value of the conditional
membership function is 0.6, the maximum degree of truth in the output fuzzy set.
Therefore, the result of defuzzification is 4.5, the average of 4 and 5.
3. Centroid method: The value of defuzzification is calculated as
4.2
5
0
12
5
5
0
2
2
12
5.2,6.0)(
x
High
lconditiona eMinxxx
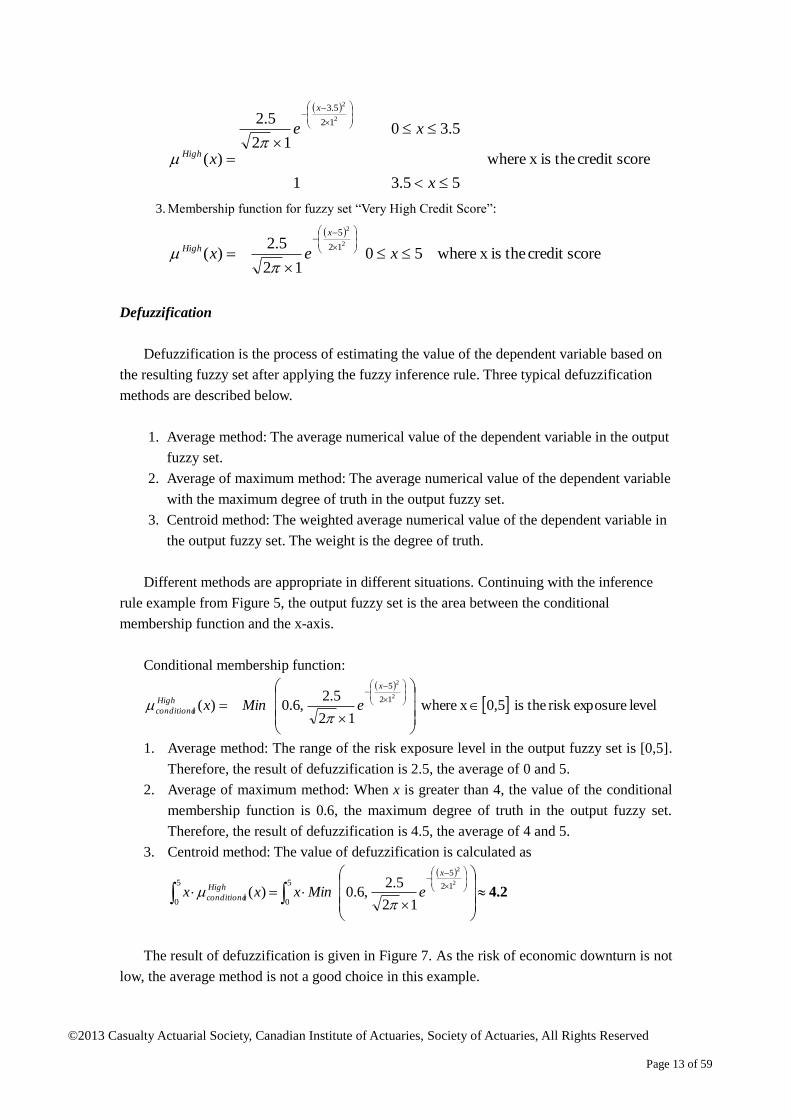
The result of defuzzification is given in Figure 7. As the risk of economic downturn is not
low, the average method is not a good choice in this example.
©2013 Casualty Actuarial Society, Canadian Institute of Actuaries, Society of Actuaries, All Rights Reserved
Page 14 of 59
Figure 7. Defuzzification Example
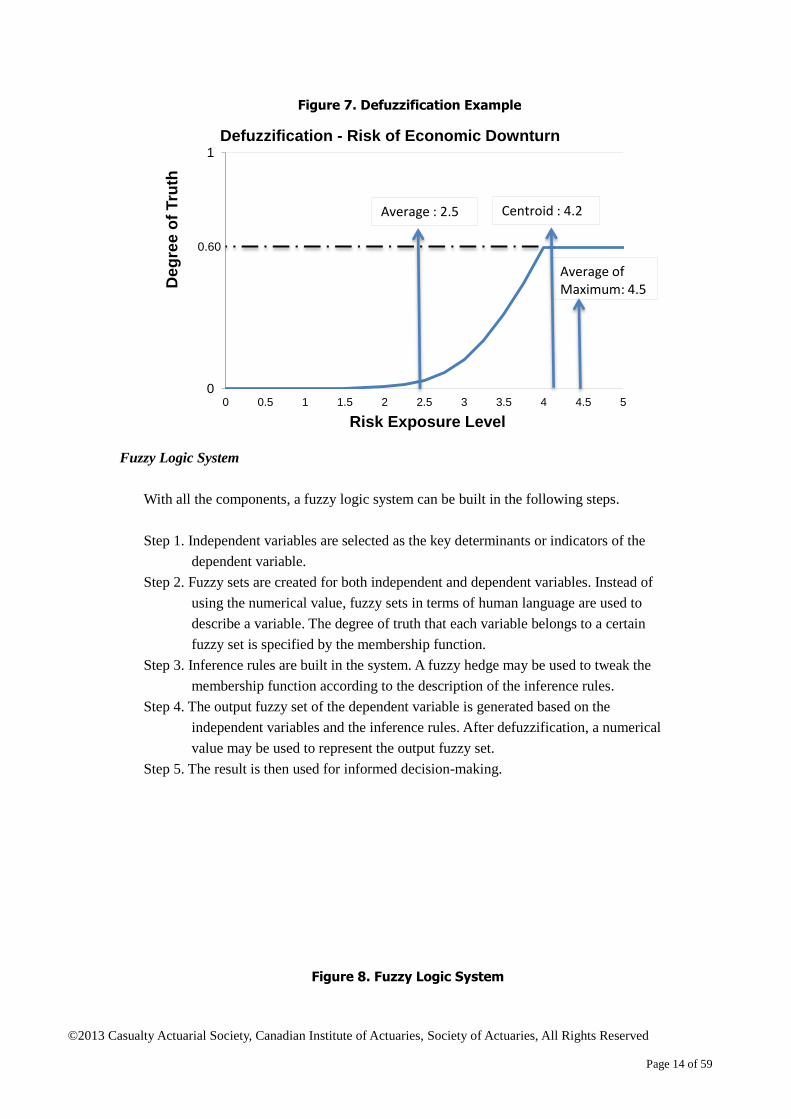
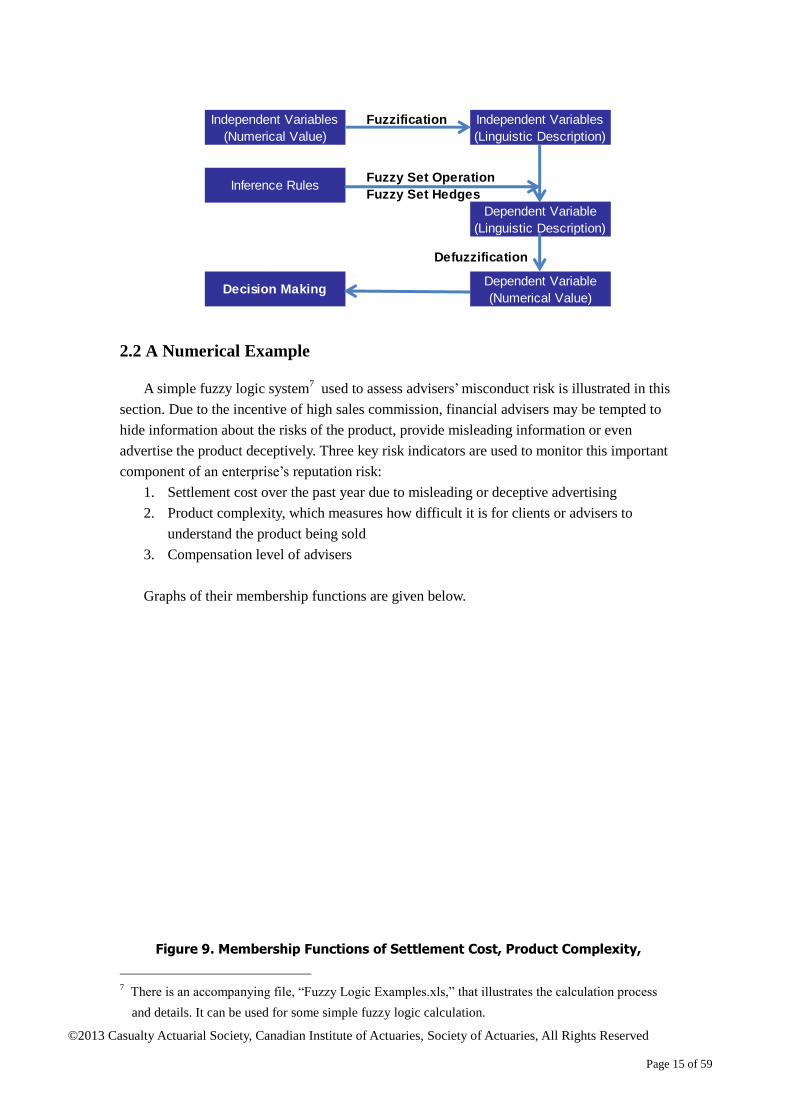
Fuzzy Logic System
With all the components, a fuzzy logic system can be built in the following steps.
Step 1. Independent variables are selected as the key determinants or indicators of the
dependent variable.
Step 2. Fuzzy sets are created for both independent and dependent variables. Instead of
using the numerical value, fuzzy sets in terms of human language are used to
describe a variable. The degree of truth that each variable belongs to a certain
fuzzy set is specified by the membership function.
Step 3. Inference rules are built in the system. A fuzzy hedge may be used to tweak the
membership function according to the description of the inference rules.
Step 4. The output fuzzy set of the dependent variable is generated based on the
independent variables and the inference rules. After defuzzification, a numerical
value may be used to represent the output fuzzy set.
Step 5. The result is then used for informed decision-making.
Figure 8. Fuzzy Logic System
0
1
0 0.5 1 1.5 2 2.5 3 3.5 4 4.5 5
De
gre
e o
f T
ruth
Risk Exposure Level
Defuzzification - Risk of Economic Downturn
Average of Maximum: 4.5
0.60
Average : 2.5 Centroid : 4.2
©2013 Casualty Actuarial Society, Canadian Institute of Actuaries, Society of Actuaries, All Rights Reserved
Page 15 of 59
2.2 A Numerical Example
A simple fuzzy logic system7 used to assess advisers’ misconduct risk is illustrated in this
section. Due to the incentive of high sales commission, financial advisers may be tempted to
hide information about the risks of the product, provide misleading information or even
advertise the product deceptively. Three key risk indicators are used to monitor this important
component of an enterprise’s reputation risk:
1. Settlement cost over the past year due to misleading or deceptive advertising
2. Product complexity, which measures how difficult it is for clients or advisers to
understand the product being sold
3. Compensation level of advisers
Graphs of their membership functions are given below.
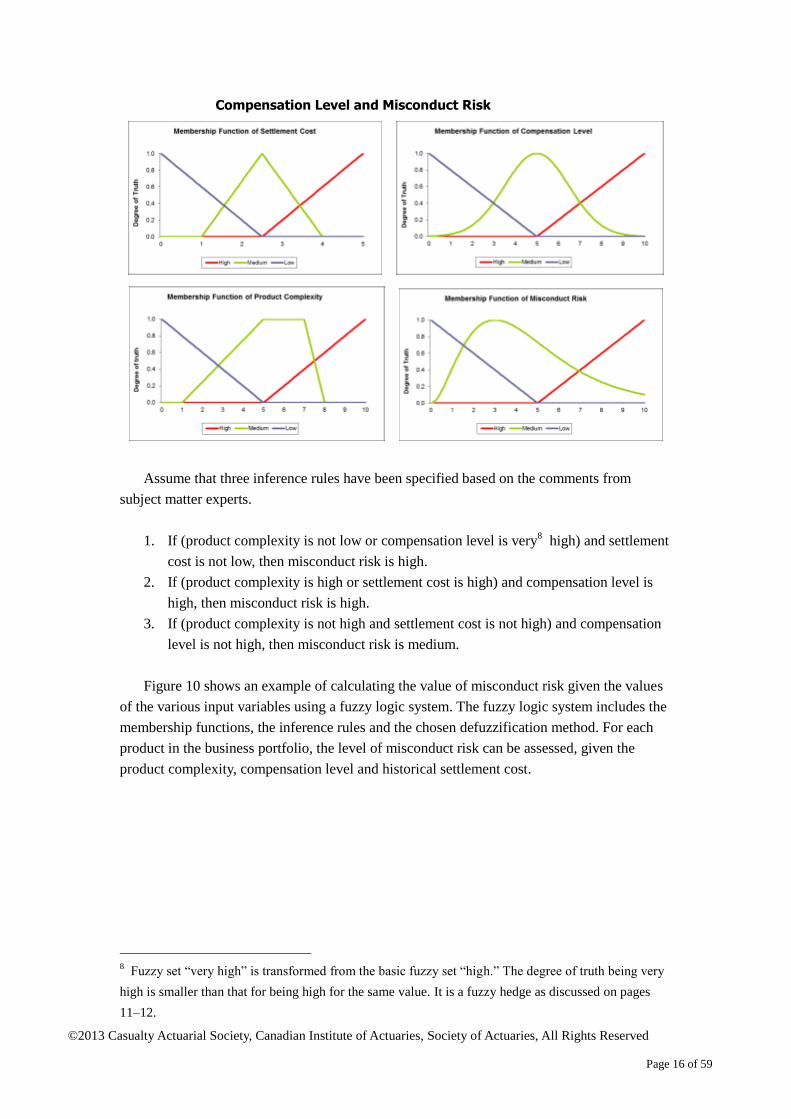
Figure 9. Membership Functions of Settlement Cost, Product Complexity,
7 There is an accompanying file, “Fuzzy Logic Examples.xls,” that illustrates the calculation process
and details. It can be used for some simple fuzzy logic calculation.
Fuzzification
Fuzzy Set Operation
Fuzzy Set Hedges
Defuzzification
Dependent Variable
(Numerical Value)
Independent Variables
(Numerical Value)
Independent Variables
(Linguistic Description)
Inference Rules
Dependent Variable
(Linguistic Description)
Decision Making
©2013 Casualty Actuarial Society, Canadian Institute of Actuaries, Society of Actuaries, All Rights Reserved
Page 16 of 59
Compensation Level and Misconduct Risk
Assume that three inference rules have been specified based on the comments from
subject matter experts.
1. If (product complexity is not low or compensation level is very8 high) and settlement
cost is not low, then misconduct risk is high.
2. If (product complexity is high or settlement cost is high) and compensation level is
high, then misconduct risk is high.
3. If (product complexity is not high and settlement cost is not high) and compensation
level is not high, then misconduct risk is medium.
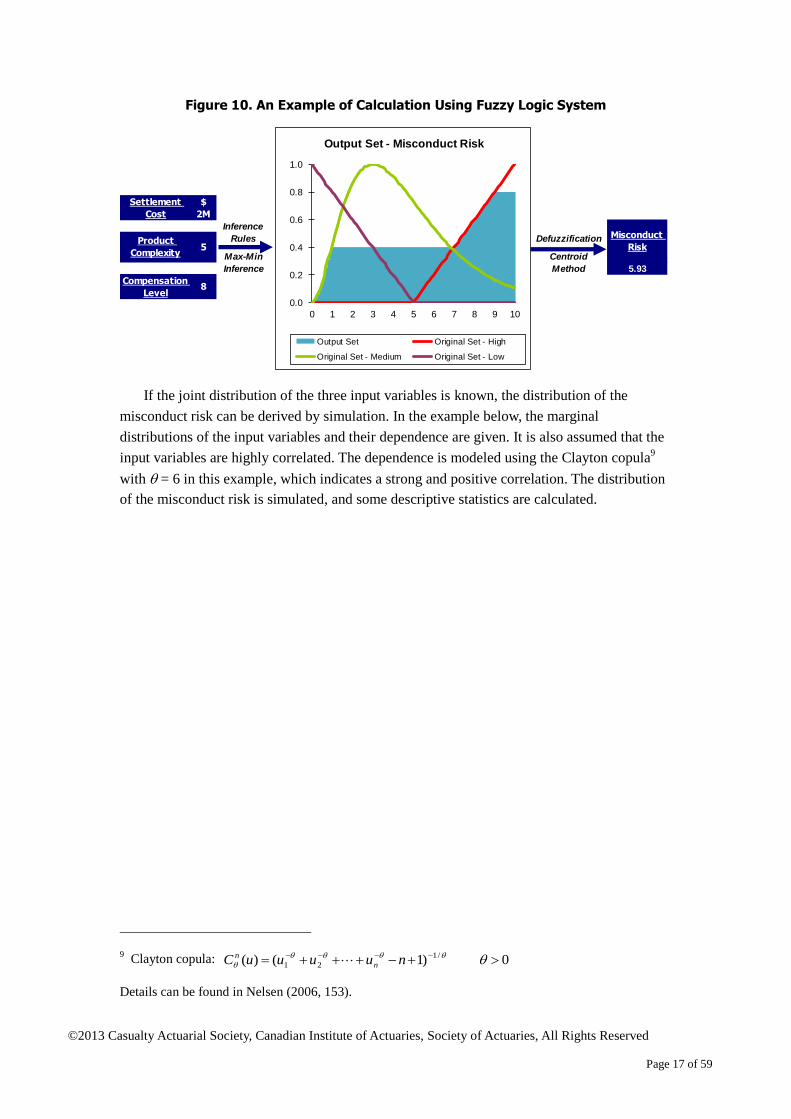
Figure 10 shows an example of calculating the value of misconduct risk given the values
of the various input variables using a fuzzy logic system. The fuzzy logic system includes the
membership functions, the inference rules and the chosen defuzzification method. For each
product in the business portfolio, the level of misconduct risk can be assessed, given the
product complexity, compensation level and historical settlement cost.
8 Fuzzy set “very high” is transformed from the basic fuzzy set “high.” The degree of truth being very
high is smaller than that for being high for the same value. It is a fuzzy hedge as discussed on pages
11–12.
©2013 Casualty Actuarial Society, Canadian Institute of Actuaries, Society of Actuaries, All Rights Reserved
Page 17 of 59
Figure 10. An Example of Calculation Using Fuzzy Logic System
If the joint distribution of the three input variables is known, the distribution of the
misconduct risk can be derived by simulation. In the example below, the marginal
distributions of the input variables and their dependence are given. It is also assumed that the
input variables are highly correlated. The dependence is modeled using the Clayton copula9
with = 6 in this example, which indicates a strong and positive correlation. The distribution
of the misconduct risk is simulated, and some descriptive statistics are calculated.
9 Clayton copula: 0)1()( /1
21 nuuuuC n
n
Details can be found in Nelsen (2006, 153).
Defuzzification
Max-Min Centroid
Inference Method 5.93
Inference
Rules Misconduct
Risk
Settlement
Cost
Product
Complexity
Compensation
Level
$
2M
5
8
0.0
0.2
0.4
0.6
0.8
1.0
0 1 2 3 4 5 6 7 8 9 10
Output Set - Misconduct Risk
Output Set Original Set - High
Original Set - Medium Original Set - Low
©2013 Casualty Actuarial Society, Canadian Institute of Actuaries, Society of Actuaries, All Rights Reserved
Page 18 of 59
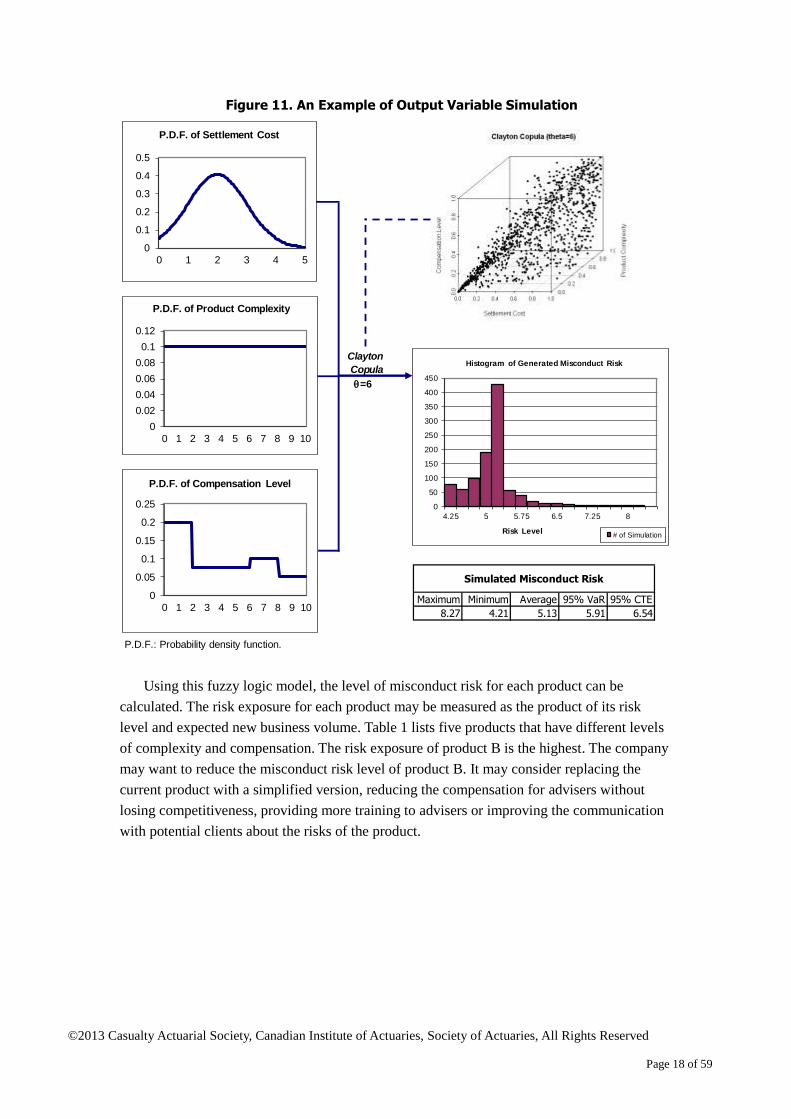
Figure 11. An Example of Output Variable Simulation
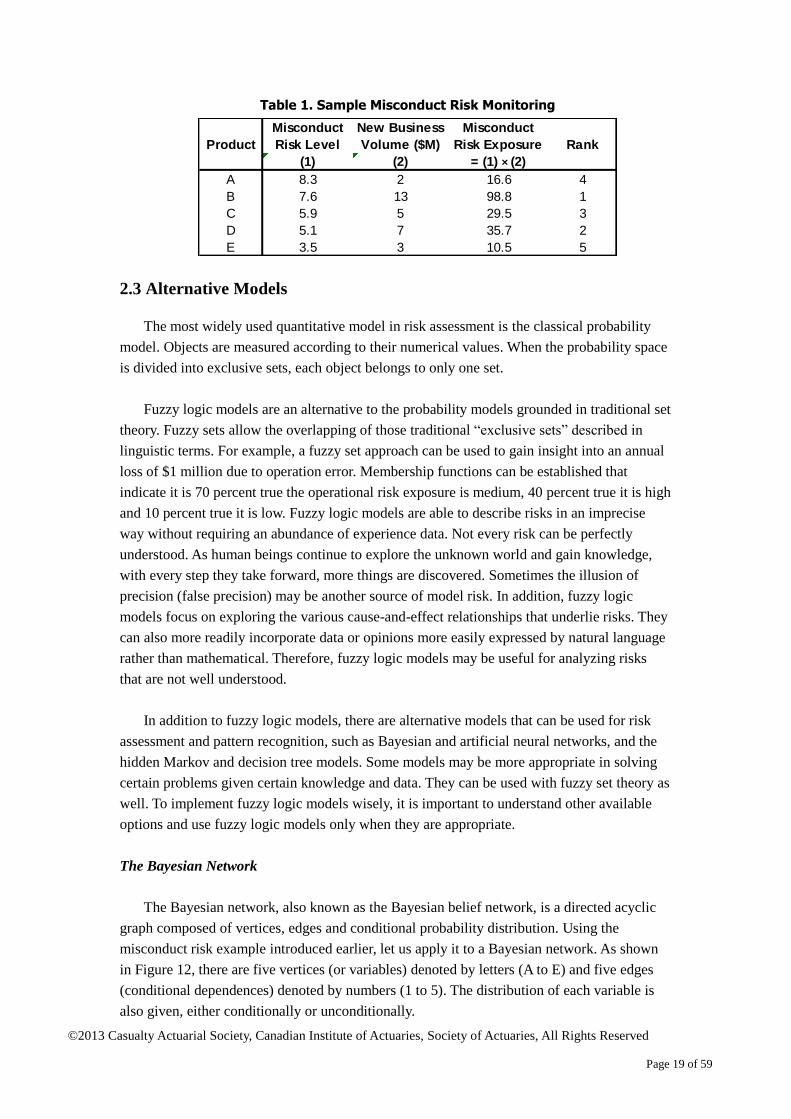
Using this fuzzy logic model, the level of misconduct risk for each product can be
calculated. The risk exposure for each product may be measured as the product of its risk
level and expected new business volume. Table 1 lists five products that have different levels
of complexity and compensation. The risk exposure of product B is the highest. The company
may want to reduce the misconduct risk level of product B. It may consider replacing the
current product with a simplified version, reducing the compensation for advisers without
losing competitiveness, providing more training to advisers or improving the communication
with potential clients about the risks of the product.
Clayton
Copula
=6
Maximum Minimum Average 95% VaR 95% CTE
8.27 4.21 5.13 5.91 6.54
P.D.F.: Probability density function.
Simulated Misconduct Risk
0
0.1
0.2
0.3
0.4
0.5
0 1 2 3 4 5
P.D.F. of Settlement Cost
0
0.02
0.04
0.06
0.08
0.1
0.12
0 1 2 3 4 5 6 7 8 9 10
P.D.F. of Product Complexity
0
0.05
0.1
0.15
0.2
0.25
0 1 2 3 4 5 6 7 8 9 10
P.D.F. of Compensation Level
0
50
100
150
200
250
300
350
400
450
4.25 5 5.75 6.5 7.25 8
Risk Level
Histogram of Generated Misconduct Risk
# of Simulation
©2013 Casualty Actuarial Society, Canadian Institute of Actuaries, Society of Actuaries, All Rights Reserved
Page 19 of 59
Table 1. Sample Misconduct Risk Monitoring
2.3 Alternative Models
The most widely used quantitative model in risk assessment is the classical probability
model. Objects are measured according to their numerical values. When the probability space
is divided into exclusive sets, each object belongs to only one set.
Fuzzy logic models are an alternative to the probability models grounded in traditional set
theory. Fuzzy sets allow the overlapping of those traditional “exclusive sets” described in
linguistic terms. For example, a fuzzy set approach can be used to gain insight into an annual
loss of $1 million due to operation error. Membership functions can be established that
indicate it is 70 percent true the operational risk exposure is medium, 40 percent true it is high
and 10 percent true it is low. Fuzzy logic models are able to describe risks in an imprecise
way without requiring an abundance of experience data. Not every risk can be perfectly
understood. As human beings continue to explore the unknown world and gain knowledge,
with every step they take forward, more things are discovered. Sometimes the illusion of
precision (false precision) may be another source of model risk. In addition, fuzzy logic
models focus on exploring the various cause-and-effect relationships that underlie risks. They
can also more readily incorporate data or opinions more easily expressed by natural language
rather than mathematical. Therefore, fuzzy logic models may be useful for analyzing risks
that are not well understood.
In addition to fuzzy logic models, there are alternative models that can be used for risk
assessment and pattern recognition, such as Bayesian and artificial neural networks, and the
hidden Markov and decision tree models. Some models may be more appropriate in solving
certain problems given certain knowledge and data. They can be used with fuzzy set theory as
well. To implement fuzzy logic models wisely, it is important to understand other available
options and use fuzzy logic models only when they are appropriate.
The Bayesian Network
The Bayesian network, also known as the Bayesian belief network, is a directed acyclic
graph composed of vertices, edges and conditional probability distribution. Using the
misconduct risk example introduced earlier, let us apply it to a Bayesian network. As shown
in Figure 12, there are five vertices (or variables) denoted by letters (A to E) and five edges
(conditional dependences) denoted by numbers (1 to 5). The distribution of each variable is
also given, either conditionally or unconditionally.
Misconduct
Risk Level
New Business
Volume ($M)
Misconduct
Risk Exposure
(1) (2) = (1) × (2)
A 8.3 2 16.6 4
B 7.6 13 98.8 1
C 5.9 5 29.5 3
D 5.1 7 35.7 2
E 3.5 3 10.5 5
Product Rank

©2013 Casualty Actuarial Society, Canadian Institute of Actuaries, Society of Actuaries, All Rights Reserved
Page 20 of 59
Figure 12. Bayesian Network Example: Misconduct Risk
Bayesian network models use Bayes’ rules and conditional probability to describe the
joint probability of the network. The relationship is embedded in the system as conditionally
dependent on the parent(s) and conditionally independent of nondecedents given the value of
the parent(s). Therefore, it considers both the distribution of the variables and their
dependence. Bayesian network models can be used to calculate conditional probabilities, such
as the probability of misleading advertisement if the product is not complex and the penalty
cost is high.
Considering the number of relationships and conditional probabilities that need to be
specified in a Bayesian network, however, it can be highly time consuming to build. The
inference in a big network is expensive as well. Expertise about the cause-and-effect
relationships is required to build the system, whether it is learned from human reasoning or
from data. There is also a demand for data that specifies the conditional probability. All those
features make Bayesian network models suitable for small-sized problems for which we have
sufficient knowledge of the relationships.
On the other hand, fuzzy logic systems are constrained only slightly by the size of the
system. They also allow for an incomplete set of rules or relationships specified in the
inference system. Therefore, the fuzzy logic model is more suitable for analyzing issues with
insufficient knowledge.
There have been some efforts to incorporate fuzzy set theory and fuzzy logic into
Bayesian network models so that the variables can have both discrete and continuous values.
Fuzzy sets were tested to improve the inference system in the general Bayesian network.
Product
Penalty CostMisunder-standing
Compensation Level
Misleading
A
B D
E
1
34
5
2
P (Complex) = 0.3
P (High|Complex) = 0.8P (Low|Complex) = 0.2
P (High) = 0.5
P (High|Complex) = 0.65P (Low|Complex) = 0.35 P (High|High B & High C
& High D) = 0.95P (Low|High B & High C &
High D) = 0.05... ...
C
©2013 Casualty Actuarial Society, Canadian Institute of Actuaries, Society of Actuaries, All Rights Reserved
Page 21 of 59
Those extended Bayesian networks are usually referred to as fuzzy Bayesian networks.10
But
the incorporation of fuzzy sets into Bayesian networks does not necessarily reduce the need
for: a) knowledge of the cause-and-effect relationships, and b) the data for calibrating the
conditional probability.
Artificial Neural Networks
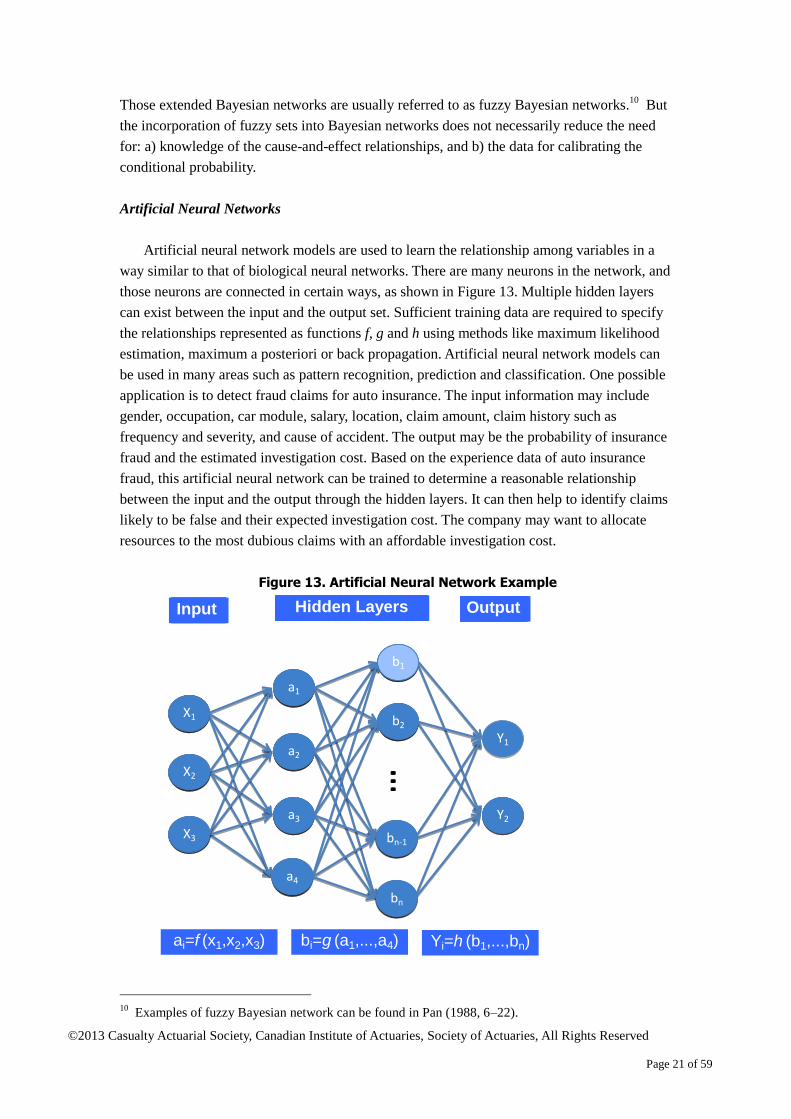
Artificial neural network models are used to learn the relationship among variables in a
way similar to that of biological neural networks. There are many neurons in the network, and
those neurons are connected in certain ways, as shown in Figure 13. Multiple hidden layers
can exist between the input and the output set. Sufficient training data are required to specify
the relationships represented as functions f, g and h using methods like maximum likelihood
estimation, maximum a posteriori or back propagation. Artificial neural network models can
be used in many areas such as pattern recognition, prediction and classification. One possible
application is to detect fraud claims for auto insurance. The input information may include
gender, occupation, car module, salary, location, claim amount, claim history such as
frequency and severity, and cause of accident. The output may be the probability of insurance
fraud and the estimated investigation cost. Based on the experience data of auto insurance
fraud, this artificial neural network can be trained to determine a reasonable relationship
between the input and the output through the hidden layers. It can then help to identify claims
likely to be false and their expected investigation cost. The company may want to allocate
resources to the most dubious claims with an affordable investigation cost.
Figure 13. Artificial Neural Network Example
10
Examples of fuzzy Bayesian network can be found in Pan (1988, 6–22).
X1
...
X3
X2
a1
a2
a3
a4
b1
b2
bn-1
bn
Y1
Y1
Input OutputLayers
X1
...
X3
X2
a1
a2
a3
a4
b1
b2
bn-1
bn
Y1
Input OutputLayers
X1
...
X3
X2
a1
a2
a3
a4
b1
b2
bn-1
bn
Y2
Input OutputLayersInput OutputLayers
X1
...
X3
X2
a1
a2
a3
a4
b1
b2
bn-1
bn
Input OutputHidden Layers
ai=f (x1,x2,x3) bi=g (a1,...,a4) Yi=h (b1,...,bn)

©2013 Casualty Actuarial Society, Canadian Institute of Actuaries, Society of Actuaries, All Rights Reserved
Page 22 of 59
Artificial neural network models rely on large sets of training data to produce a good
estimate of the relationship. The required computation is resource demanding. It is more
appropriate for complex systems with sufficient observation data but vague or unknown
relationships. This is quite different from fuzzy logic systems where sparse or imprecise data
are often the case but there are some known relationships between the input and the output.
Neural network models have been used in some fuzzy logic systems where the inference
rules are expressed in some form of the functions used in artificial neural network models,
such as Output = f (Input). Jang (1993) introduced the adaptive neuro fuzzy inference system
(ANFIS) in which the neural networks are used to model and refine the membership function
of fuzzy sets. ANFIS may be useful when some training data for the fuzzy logic system exist.
The inference rules or membership functions can be trained to better fit the experience.
However, it is more complicated and difficult to implement than a pure fuzzy logic system.
Hidden Markov Models
A hidden Markov model studies the Markov process of a hidden state with observations
that highly depend on the hidden state. The next hidden state depends on the current hidden
state but not the history of the hidden state. In most cases, a transition matrix is used to define
the probability of the next state given the current one. The distribution of the observation
changes with the hidden state. Based on the actual observation, an inference system built on
Bayes’ rule can be used to predict future hidden states. Figure 14 illustrates a hidden Markov
model.
©2013 Casualty Actuarial Society, Canadian Institute of Actuaries, Society of Actuaries, All Rights Reserved
Page 23 of 59
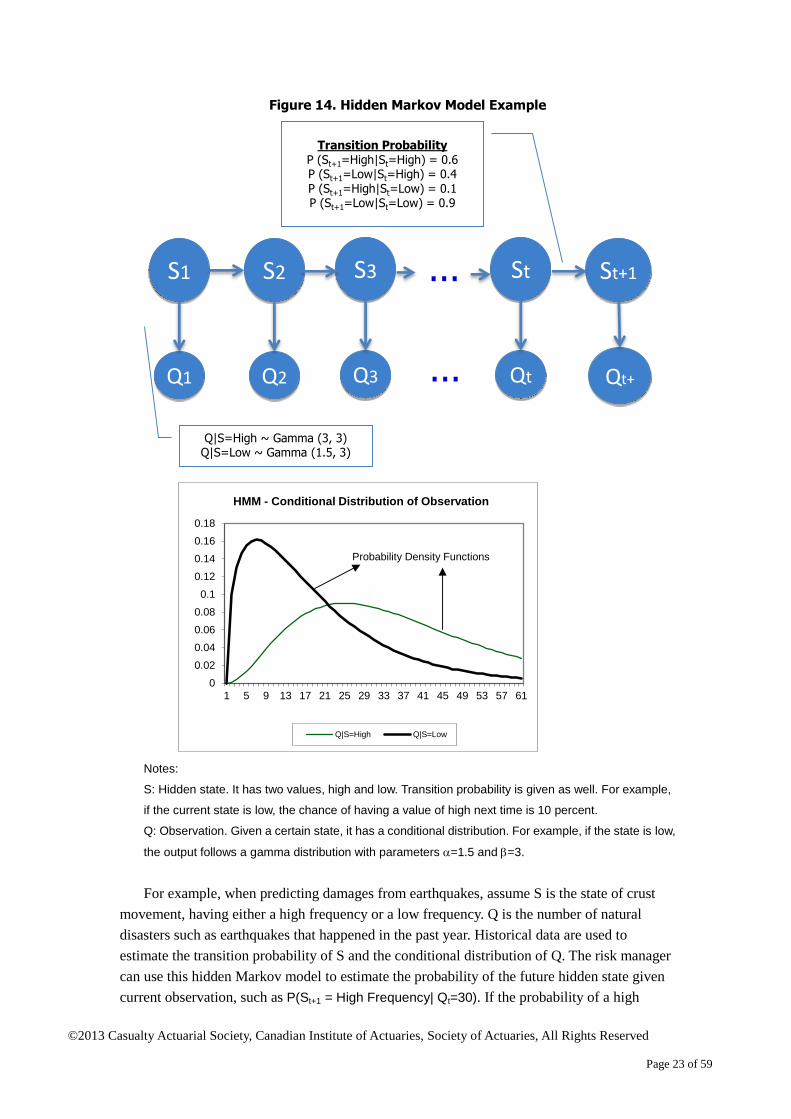
Figure 14. Hidden Markov Model Example
Notes:
S: Hidden state. It has two values, high and low. Transition probability is given as well. For example,
if the current state is low, the chance of having a value of high next time is 10 percent.
Q: Observation. Given a certain state, it has a conditional distribution. For example, if the state is low,
the output follows a gamma distribution with parameters =1.5 and =3.
For example, when predicting damages from earthquakes, assume S is the state of crust
movement, having either a high frequency or a low frequency. Q is the number of natural
disasters such as earthquakes that happened in the past year. Historical data are used to
estimate the transition probability of S and the conditional distribution of Q. The risk manager
can use this hidden Markov model to estimate the probability of the future hidden state given
current observation, such as P(St+1 = High Frequency| Qt=30). If the probability of a high
0
0.02
0.04
0.06
0.08
0.1
0.12
0.14
0.16
0.18
1 5 9 13 17 21 25 29 33 37 41 45 49 53 57 61
HMM - Conditional Distribution of Observation
Q|S=High Q|S=Low
Probability Density Functions
S1
Q1
Transition Probability
P (St+1=High|St=High) = 0.6P (St+1=Low|St=High) = 0.4P (St+1=High|St=Low) = 0.1P (St+1=Low|St=Low) = 0.9
Q|S=High ~ Gamma (3, 3)Q|S=Low ~ Gamma (1.5, 3)
St
Qt
S2
Q2
S3
Q3
St+1
Qt+...
...

©2013 Casualty Actuarial Society, Canadian Institute of Actuaries, Society of Actuaries, All Rights Reserved
Page 24 of 59
frequency state is high, the company may consider increasing the rate of its insurance
products or raising extra capital to be able to survive more severe losses due to natural
disasters.
Similar to Bayesian networks, hidden Markov models need training data to set the
appropriate transition probability and the conditional distribution of the observation based on
a certain hidden state. These models also emphasize the randomness of transition from one
state to another. In reality, the transition from state to state may be deterministic given
exogenous factors. But those factors may be ignored in hidden Markov models due to their
complexity or a lack of understanding of the cause-and-effect relationships that drive the
transitions from one hidden state to the next.
Different from fuzzy logic models, hidden Markov models require a clear specification of
the relationship between observations and the hidden state using conditional probability rather
than possibly incomplete inference rules. It focuses on the prediction of future states in a
trained but uncertain way. It is more appropriate for modeling a system where there is enough
knowledge of the current situation but the evolvement of the system is uncertain.
Fuzzy set theory has been used in hidden Markov models as well. The possibility of the
hidden state can be described by fuzzy sets instead of classical sets,11
except that fuzzy
hidden Markov models have the same features as hidden Markov models based on classical
set theory.
Decision Tree
A decision tree model is used to facilitate decision-making based on a set of rules
presented as a tree. It uses the attributes of objects for classification and decision. For
example, one can build a tree that classifies credit risk based on the person’s income, age and
other factors. Unlike most of the black-box modeling techniques where the internal logic can
be difficult to work out, the reasoning process behind the model is clearly shown in the tree.
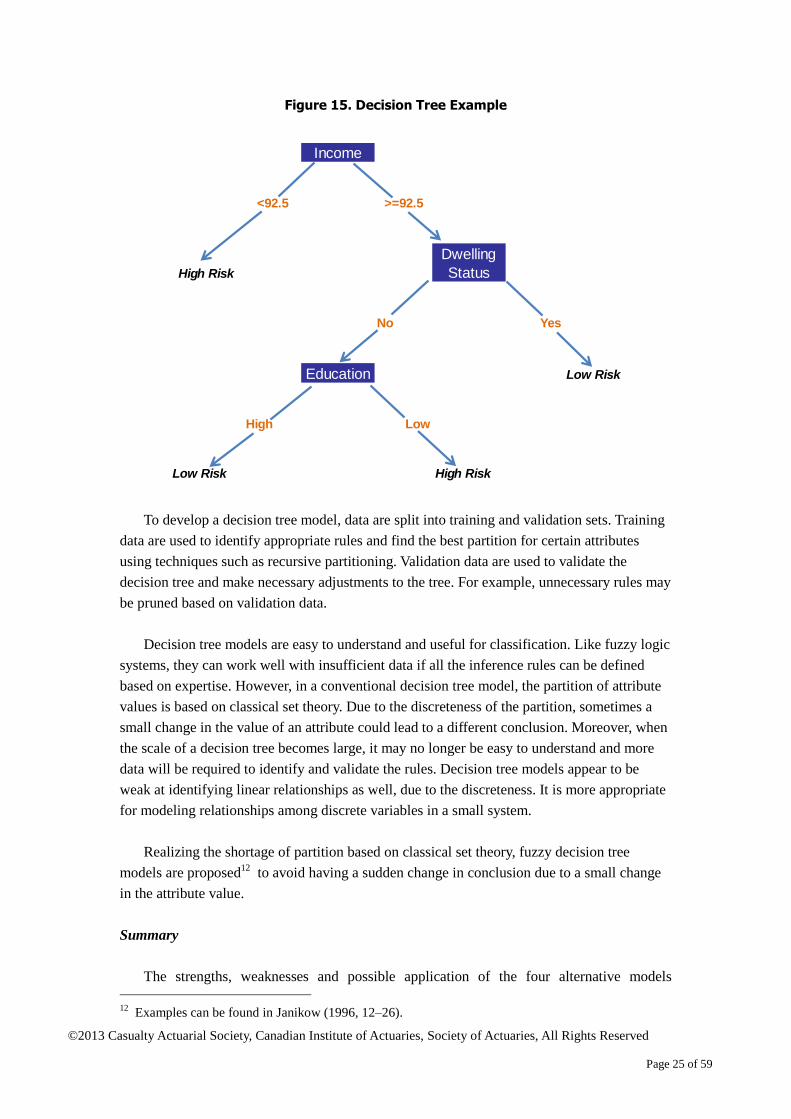
Figure 15 describes a decision tree for classifying bank customers regarding the level of credit
risk based on their income, education level and dwelling status. It can easily be translated into
a set of rules used to classify a customer to make a loan decision. An example is given below.
If (income ≥ 92.5) and (dwelling status = no) and (education = high),
then (low level of credit risk = loan will be granted).
11
An example of fuzzy hidden Markov model can be found in Zhang and Naghdy (2005, 3–8).
©2013 Casualty Actuarial Society, Canadian Institute of Actuaries, Society of Actuaries, All Rights Reserved
Page 25 of 59
Figure 15. Decision Tree Example
To develop a decision tree model, data are split into training and validation sets. Training
data are used to identify appropriate rules and find the best partition for certain attributes
using techniques such as recursive partitioning. Validation data are used to validate the
decision tree and make necessary adjustments to the tree. For example, unnecessary rules may
be pruned based on validation data.
Decision tree models are easy to understand and useful for classification. Like fuzzy logic
systems, they can work well with insufficient data if all the inference rules can be defined
based on expertise. However, in a conventional decision tree model, the partition of attribute
values is based on classical set theory. Due to the discreteness of the partition, sometimes a
small change in the value of an attribute could lead to a different conclusion. Moreover, when
the scale of a decision tree becomes large, it may no longer be easy to understand and more
data will be required to identify and validate the rules. Decision tree models appear to be
weak at identifying linear relationships as well, due to the discreteness. It is more appropriate
for modeling relationships among discrete variables in a small system.
Realizing the shortage of partition based on classical set theory, fuzzy decision tree
models are proposed12
to avoid having a sudden change in conclusion due to a small change
in the attribute value.
Summary
The strengths, weaknesses and possible application of the four alternative models
12
Examples can be found in Janikow (1996, 12–26).
Income
<92.5 >=92.5
High Risk
Dwelling
Status
No Yes
Education Low Risk
High Low
Low Risk High Risk
©2013 Casualty Actuarial Society, Canadian Institute of Actuaries, Society of Actuaries, All Rights Reserved
Page 26 of 59
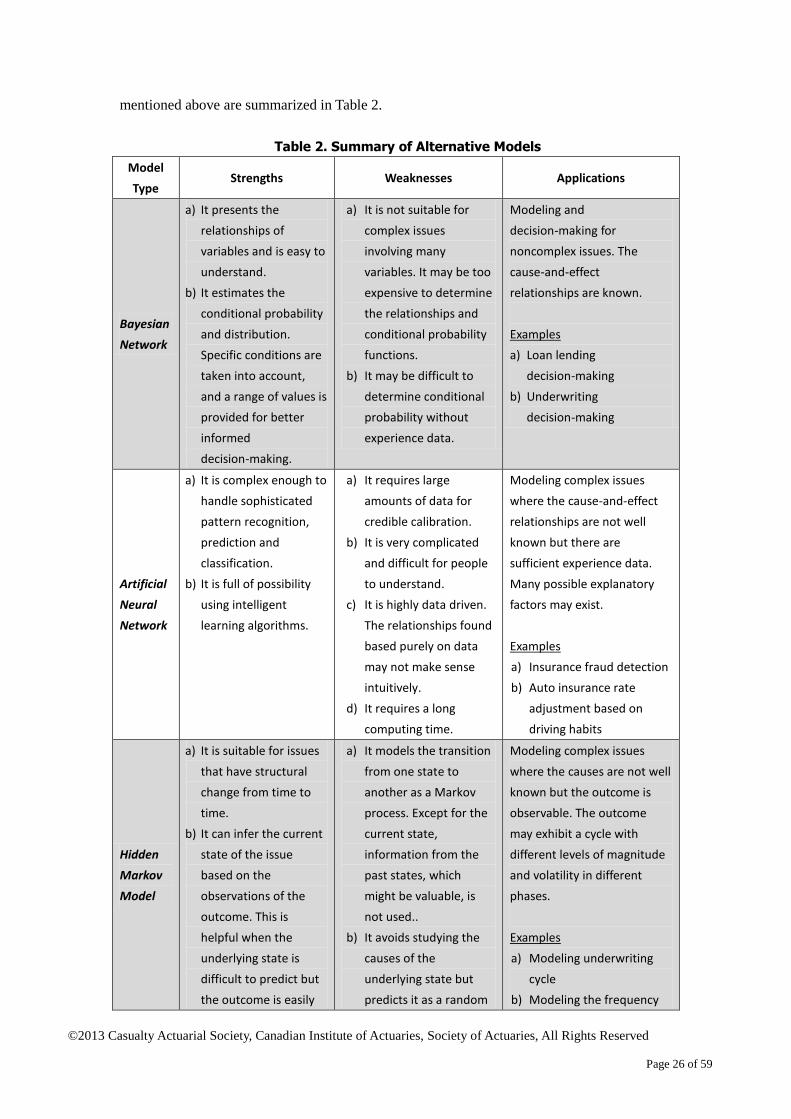
mentioned above are summarized in Table 2.
Table 2. Summary of Alternative Models
Model
Type Strengths Weaknesses Applications
Bayesian
Network
a) It presents the
relationships of
variables and is easy to
understand.
b) It estimates the
conditional probability
and distribution.
Specific conditions are
taken into account,
and a range of values is
provided for better
informed
decision-making.
a) It is not suitable for
complex issues
involving many
variables. It may be too
expensive to determine
the relationships and
conditional probability
functions.
b) It may be difficult to
determine conditional
probability without
experience data.
Modeling and
decision-making for
noncomplex issues. The
cause-and-effect
relationships are known.
Examples
a) Loan lending
decision-making
b) Underwriting
decision-making
Artificial
Neural
Network
a) It is complex enough to
handle sophisticated
pattern recognition,
prediction and
classification.
b) It is full of possibility
using intelligent
learning algorithms.
a) It requires large
amounts of data for
credible calibration.
b) It is very complicated
and difficult for people
to understand.
c) It is highly data driven.
The relationships found
based purely on data
may not make sense
intuitively.
d) It requires a long
computing time.
Modeling complex issues
where the cause-and-effect
relationships are not well
known but there are
sufficient experience data.
Many possible explanatory
factors may exist.
Examples
a) Insurance fraud detection
b) Auto insurance rate
adjustment based on
driving habits
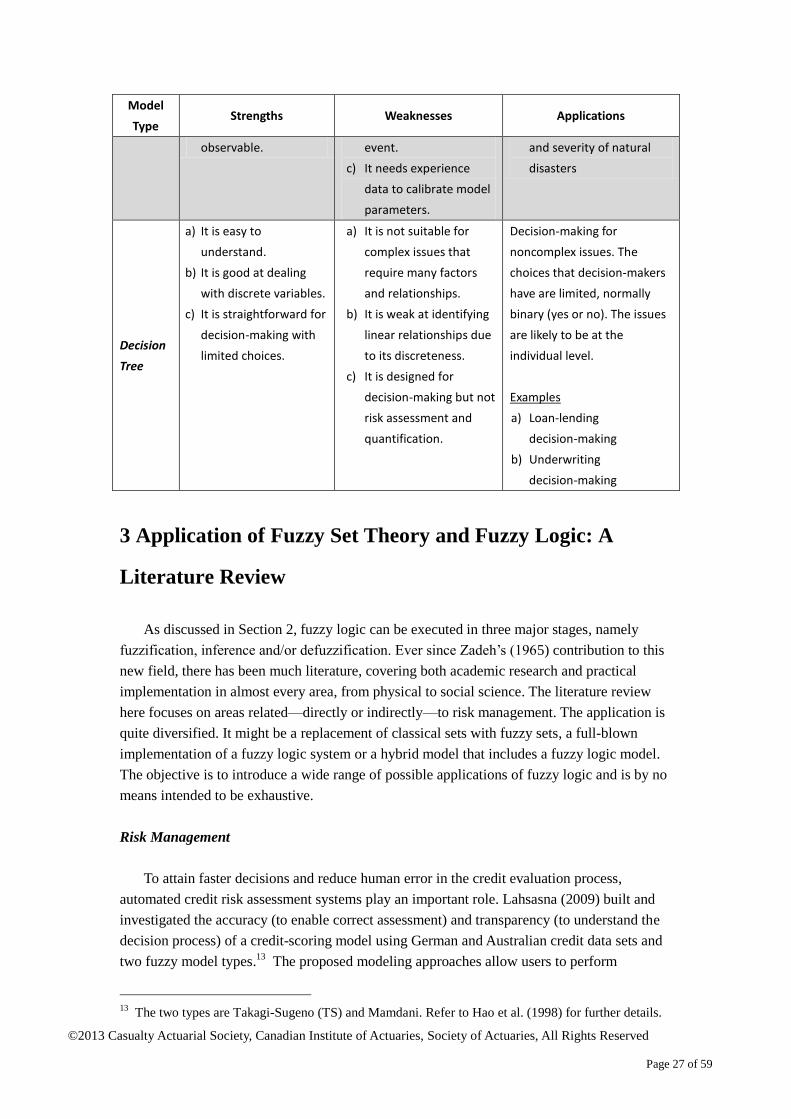
Hidden
Markov
Model
a) It is suitable for issues
that have structural
change from time to
time.
b) It can infer the current
state of the issue
based on the
observations of the
outcome. This is
helpful when the
underlying state is
difficult to predict but
the outcome is easily
a) It models the transition
from one state to
another as a Markov
process. Except for the
current state,
information from the
past states, which
might be valuable, is
not used..
b) It avoids studying the
causes of the
underlying state but
predicts it as a random
Modeling complex issues
where the causes are not well
known but the outcome is
observable. The outcome
may exhibit a cycle with
different levels of magnitude
and volatility in different
phases.
Examples
a) Modeling underwriting
cycle
b) Modeling the frequency
©2013 Casualty Actuarial Society, Canadian Institute of Actuaries, Society of Actuaries, All Rights Reserved
Page 27 of 59
Model
Type Strengths Weaknesses Applications
observable. event.
c) It needs experience
data to calibrate model
parameters.
and severity of natural
disasters
Decision
Tree
a) It is easy to
understand.
b) It is good at dealing
with discrete variables.
c) It is straightforward for
decision-making with
limited choices.
a) It is not suitable for
complex issues that
require many factors
and relationships.
b) It is weak at identifying
linear relationships due
to its discreteness.
c) It is designed for
decision-making but not
risk assessment and
quantification.
Decision-making for
noncomplex issues. The
choices that decision-makers
have are limited, normally
binary (yes or no). The issues
are likely to be at the
individual level.
Examples
a) Loan-lending
decision-making
b) Underwriting
decision-making
3 Application of Fuzzy Set Theory and Fuzzy Logic: A
Literature Review
As discussed in Section 2, fuzzy logic can be executed in three major stages, namely
fuzzification, inference and/or defuzzification. Ever since Zadeh’s (1965) contribution to this
new field, there has been much literature, covering both academic research and practical
implementation in almost every area, from physical to social science. The literature review
here focuses on areas related—directly or indirectly—to risk management. The application is
quite diversified. It might be a replacement of classical sets with fuzzy sets, a full-blown
implementation of a fuzzy logic system or a hybrid model that includes a fuzzy logic model.
The objective is to introduce a wide range of possible applications of fuzzy logic and is by no
means intended to be exhaustive.
Risk Management
To attain faster decisions and reduce human error in the credit evaluation process,
automated credit risk assessment systems play an important role. Lahsasna (2009) built and
investigated the accuracy (to enable correct assessment) and transparency (to understand the
decision process) of a credit-scoring model using German and Australian credit data sets and
two fuzzy model types.13
The proposed modeling approaches allow users to perform
13
The two types are Takagi-Sugeno (TS) and Mamdani. Refer to Hao et al. (1998) for further details.
©2013 Casualty Actuarial Society, Canadian Institute of Actuaries, Society of Actuaries, All Rights Reserved
Page 28 of 59
additional analysis such as defining customer attributes that influence the credit underwriting
decision and quantifying the approximate values of these attributes.
Recognizing that the data reported in financial statements may not be exactly comparable
due to differences in accounting practices and may include inaccuracy in reported numbers,
Cheng at el. (2006) claimed that the observed value may be better considered as a fuzzy
phenomenon but not a random one. They thereby used an interval instead of a single value for
financial variables. They constructed an early-warning model for financial distress using
fuzzy regression as an alternative to well-known methods, namely discriminant, logit and
artificial neural network analysis.
Matsatsinis at el. (2003) found that oftentimes the analytic dependencies among the
variables of a process or system are unknown or difficult to construct. Therefore, they used
fuzzy rules to formulate the dependencies between the variables in the context of
classification analysis for a business failures model. They used these rules in the data mining
phase to predict corporate bankruptcy.
Leveraging the findings on classification problems with respect to financial and credit
risk analysis, Li at el. (2011) used a fuzzy linear programming classification method with soft
constraints to analyze credit cardholders’ behavior.
Cherubini and Lunga (2001) observed that in pricing contingent claims, the probability
measure used may not be precisely known, and therefore used a class of fuzzy measures to
account for this uncertainty. They used this approach to quantify liquidity risk for pricing an
asset in the presence of illiquid markets, and they further extended this to construct a fuzzified
version of the seminal Merton’s credit risk model.
Yu et al. (2009) proposed a multicriteria decision analysis tool for credit risk evaluation
using fuzzy set theory. The tool is developed to initially allocate results obtained from
alternative competing credit evaluation techniques in the form of fuzzy opinions, then
aggregated into a group consensus and, lastly, defuzzified into a discrete numerical value to
support an ultimate credit decision. Human reasoning, expert knowledge and imprecise
information are considered valuable inputs in the estimation of operational risk.
Reveiz and Leon (2009) studied operational risk using the fuzzy logic inference system
(FLIS) to account for the complex interaction as well as nonlinearity in these inputs. The
choice of FLIS allows one to utilize the qualitative and quantitative inputs in a sound and
convenient way, as well as to evaluate risk mitigation efforts ex ante.
Asset Liability Management (ALM) and Insurance
Brotons and Terceno (2011) used fuzzy logic to study immunization strategies to mitigate
the risk of interest rate movements within an ALM framework where the combination of
expected return and risk, chosen to achieve higher liquidity, are obtained from the midpoint
©2013 Casualty Actuarial Society, Canadian Institute of Actuaries, Society of Actuaries, All Rights Reserved
Page 29 of 59
and width of relevant fuzzy numbers respectively. A risk-return map is created using this
approach to account for the investor’s risk aversion, which allows the investor to track
differences in return of the adopted strategy for a given level of duration.
Huang et al. (2009) studied probability of ultimate ruin in an insurance risk framework
where the individual claim amount is modeled as an exponentially distributed fuzzy random
variable and the claim process is characterized by a Poisson process.
Lai (2006) conducted an empirical study of the underwriting profit margin of a Taiwanese
property/liability (P/L) insurance company in an intertemporal capital asset pricing model
(ICAPM)14
framework. He found that the best fitting parameters of the models can be
expressed as an asymmetric triangular fuzzy number. He also showed how the derived skew
factors could be used to forecast the underwriting profit margin. Lai (2008) extended the
above study to investigate transportation underwriting of systematic risk made by the
insurances related to major lines of transportation, ranging from automobile to aviation.
De Andres Sanchez and Gomez (2003) applied fuzzy regression techniques to analyze the
term structure of interest rates. They focused on the quantification of interest rates and
discussed applications to the pricing of life insurance contracts and P/L insurance policies.
Lazzari and Moulia (2012) studied certain parameters describing cardiovascular risk by
developing a diagnosis model formulated within a fuzzy framework, and they proposed a
framework for a health insurance company’s expansion strategy.
Derrig and Ostaszewski (1996) studied the tax burden of a property-liability insurance
company in an option theoretic framework where the appropriately priced insurance liabilities
are used as a hedging instrument. The relevant parameters were modeled using fuzzy numbers
to account for uncertainty in the tax rate, rate of return and the hedge liability.
Economics and Finance
Horgby (1999) provided an introduction to techniques of fuzzy inference for applications
in economics. Using a set of examples, he showed the way to internalize information that is,
by nature, fuzzy, and infer conclusions from a set of fuzzy “if-then” rules. Caleiro (2003)
conducted an interesting study analyzing how subjective measures like consumer confidence
can be approximated by objective economic measures such as the unemployment rate using
fuzzy logic. Blavatksyy (2011) studied risk aversion when outcomes may not be measurable
in monetary terms and people have fuzzy preferences over lotteries, i.e., preferences over
lotteries are expressed in a probabilistic manner.
Ng at el. (2002) established a fuzzy membership function of procurement selection
criteria through an empirical study in Australia recognizing that numerous selection criteria—
14
ICAPM is a hybrid model where the algebraic insurance model is linked to CAPM to price
insurance products.
©2013 Casualty Actuarial Society, Canadian Institute of Actuaries, Society of Actuaries, All Rights Reserved
Page 30 of 59
such as speed, complexity, flexibility, responsibility, quality level, risk allocation and price
competition—are fuzzy in nature. Xu at el. (2011) extended this approach by developing a
practical risk evaluation model for public-private partnership procurement projects where the
underlying risk factors are established using the Delphi survey technique and fuzzy set theory.
The risk evaluation model is developed using a fuzzy synthetic evaluation approach.
Oliveira and Silva (2004) studied environmental regulation where the imperfect link
between regulations and pollution-generating processes are modeled using a fuzzy logic
approach. To aid effective decision-making, this study aims to provide a reasonable
understanding of the complexity in interactions, which may lead to costly regulation,
corruption and excessive pollution, as well as rent-seeking behavior of legislators such as
providing monopoly privileges.
Sun and van Kooten (2005) applied fuzzy logic to contingent valuation of environmental
amenities and public goods using a fuzzy random utility maximization (FRUM) framework.
They conducted an empirical study to measure the elicited residents’ willingness to pay for
enhanced forest conservation using Swedish data.
Cai at el. (2009) developed a fuzzy-random interval programming (FRIP) model to
identify optimal strategies in the planning of energy management systems under multiple
uncertainties caused by economic, environmental and political factors. Their FRIP model was
constructed by integrating interval linear programming, fuzzy-stochastic programming and
mixed integer linear programming to deal with uncertainties presented as interval values.
Tucha and Brem (2006) proposed a quantitative approach to analyze functions and risk
patterns in international transfer prices using the fuzzy framework. Dow and Ghosh (2004)
studied the speculative demand for money using a fuzzy logic framework. They incorporate
different opinions and recognize that expectations may differ when the nature of the problem
prevents a precise and definitive description of the underlying variables.
Lin at el. (2008) presented a hybrid model for predicting the occurrence of currency crises
by using the neuro fuzzy modeling approach. They integrate the learning ability of neural
networks with the inference mechanism of fuzzy logic to uncover the causal relationships
among the variables. Gulick (2010) studied the allocation problem using a fuzzy
game-theoretic framework. Gulick discussed several applications ranging from cooperative
investment decisions to risk capital allocation for banks and insurance companies. Leon and
Machado (2011) proposed an index built using a fuzzy-logic-based inference system to
conduct a comprehensive relative assessment of a financial institution’s systematic
importance. The proposed index uses some key importance indicators of the institution’s size,
its connectedness and substitutability. Expert knowledge is used for combining those
indicators.
Caetano and Caleiro (2005) studied how corruption influences decisions concerning
direct, foreign investment with a fuzzy logic approach recognizing that a certain level of
©2013 Casualty Actuarial Society, Canadian Institute of Actuaries, Society of Actuaries, All Rights Reserved
Page 31 of 59
perceived corruption can be subject to different subjective evaluations by investors. Brochado
and Martins (2005) studied cross-country variation in political indicators and their association
with the level of economic, human and gender-specific development indicators using a fuzzy
k-means classification algorithm. The aim was to enhance the understanding of the
heterogeneity of behaviors with respect to political indicators. Sveshnikov and Bocharnikov
(2009) developed a model to study the international politico-economic risk where
contradictory and opposing views of countries concerning decisions on political, economic,
internal and international issues are combined together using fuzzy measures and integrals.
They conducted an empirical study to estimate the politico-economic risk of Ukraine.
Magni et al. (2006) studied an alternative method of firm valuation based on fuzzy logic
and expert systems. In this study, the discounted cash flow analysis accounted for quantitative
and qualitative variables, e.g., financial, strategic and business aspects, as well as their mutual
integration via “if-then” rules used to rate and rank firms, as well as to assess the impact of
managers’ decisions on value-creation and the quality of corporate governance. Smimou
(2006) conducted an empirical study for the Canadian commodities futures market within the
capital asset pricing model (CAPM) framework using a fuzzy regression method. Smimou
provided a comparative analysis to show the superiority of the application of a fuzzy
approach to capturing the risk premium in commodity futures over other competing
approaches. Giovanis (2009) extended the fuzzy regression framework to generalized
autoregressive conditional heteroskedasticity (GARCH) modeling and studied the
day-of-the-week effect on four major stock exchanges. The principal motivation was to
incorporate nonlinearities in finance and human behavior and avoid the use of binary
classification in this context. Su and Fen (2011) constructed a trading strategy using a
risk-controllable fuzzy inference system built on structural equation modeling, and they
confirmed that it outperforms the buy-and-hold strategy.
Option Pricing
Muzzioli and Torricelli (2001) proposed a one-period binomial option pricing model
(OPM) based on a risk-neutral valuation technique. They incorporated different levels of
market information while modeling the option payoff by means of triangular fuzzy numbers.
Lee et al. (2005) applied fuzzy set theory to the Cox, Ross and Rubinstein (CRR) interest rate
model to develop a fuzzy binomial OPM that allows investors to update their portfolio
strategy based on their individual risk preferences. The proposed model provides reasonable
ranges of option prices allowing investors to use it for arbitrage or hedging. An empirical
study using S&P 500 index options is also conducted to support their theoretical results. In the
context of a real option valuation model, Zmeskal (2010) observed that the required input data
often lack quality and therefore identified two types of input data uncertainty: risk and
vagueness. Since risk is stochastic in nature and vagueness results from inherent fuzziness in
the reported input, he proposed a fuzzy-stochastic American real option model where the
inputs are used in the form of fuzzy numbers and the option value is determined as a fuzzy
set.
©2013 Casualty Actuarial Society, Canadian Institute of Actuaries, Society of Actuaries, All Rights Reserved
Page 32 of 59
4 Risk Assessment Framework Based on Fuzzy Logic
4.1 Risk Assessment and Decision-Making
A risk assessment and decision-making platform built on a fuzzy logic system can
provide consistency when analyzing risks with limited data and knowledge. It allows people
to focus on the foundation of risk assessment, which involves the cause-and-effect
relationship between key factors as well as the exposure for each individual risk. Rather than
a direct input for the likelihood and potential severity of a risk event, it encourages human
reasoning from the facts and knowledge to the conclusion in a consistent and
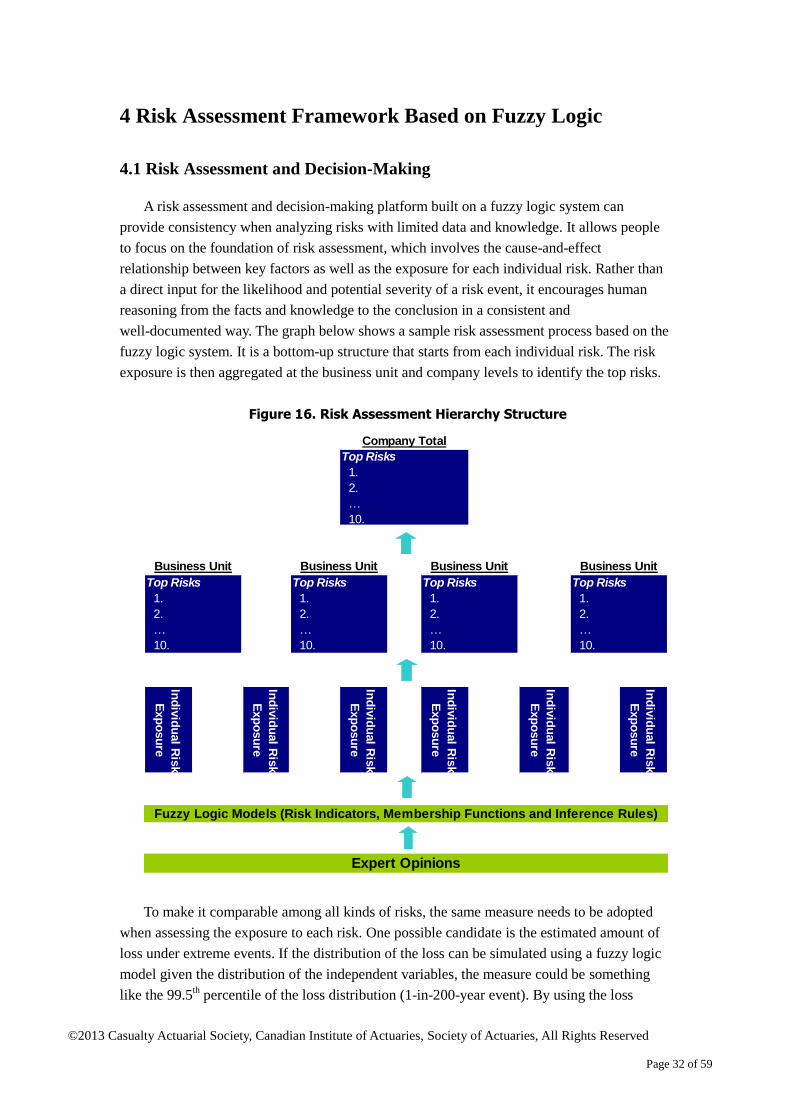
well-documented way. The graph below shows a sample risk assessment process based on the
fuzzy logic system. It is a bottom-up structure that starts from each individual risk. The risk
exposure is then aggregated at the business unit and company levels to identify the top risks.
Figure 16. Risk Assessment Hierarchy Structure
To make it comparable among all kinds of risks, the same measure needs to be adopted
when assessing the exposure to each risk. One possible candidate is the estimated amount of
loss under extreme events. If the distribution of the loss can be simulated using a fuzzy logic
model given the distribution of the independent variables, the measure could be something
like the 99.5th percentile of the loss distribution (1-in-200-year event). By using the loss
Ind
ivid
ual R
isk
Exp
osu
re
Ind
ivid
ual R
isk
Exp
osu
re
Ind
ivid
ual R
isk
Exp
osu
re
Ind
ivid
ual R
isk
Exp
osu
re
Ind
ivid
ual R
isk
Exp
osu
re
Ind
ivid
ual R
isk
Exp
osu
re
Business Unit
Top Risks
1.
2.
…
10.
Business Unit
Top Risks
1.
2.
…
10.
Company Total
Top Risks
1.
2.
…
10.
Fuzzy Logic Models (Risk Indicators, Membership Functions and Inference Rules)
Expert Opinions
Business Unit
Top Risks
1.
2.
…
10.
Business Unit
Top Risks
1.
2.
…
10.
©2013 Casualty Actuarial Society, Canadian Institute of Actuaries, Society of Actuaries, All Rights Reserved
Page 33 of 59
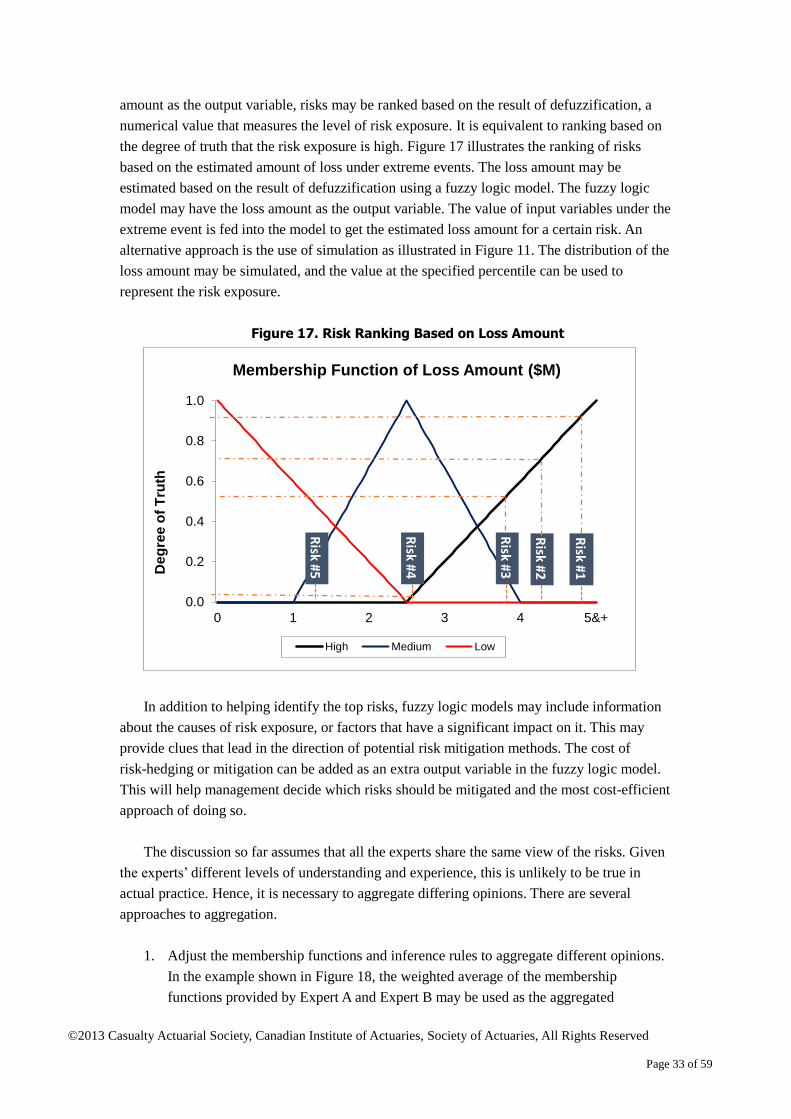
amount as the output variable, risks may be ranked based on the result of defuzzification, a
numerical value that measures the level of risk exposure. It is equivalent to ranking based on
the degree of truth that the risk exposure is high. Figure 17 illustrates the ranking of risks
based on the estimated amount of loss under extreme events. The loss amount may be
estimated based on the result of defuzzification using a fuzzy logic model. The fuzzy logic
model may have the loss amount as the output variable. The value of input variables under the
extreme event is fed into the model to get the estimated loss amount for a certain risk. An
alternative approach is the use of simulation as illustrated in Figure 11. The distribution of the
loss amount may be simulated, and the value at the specified percentile can be used to
represent the risk exposure.
Figure 17. Risk Ranking Based on Loss Amount
In addition to helping identify the top risks, fuzzy logic models may include information
about the causes of risk exposure, or factors that have a significant impact on it. This may
provide clues that lead in the direction of potential risk mitigation methods. The cost of
risk-hedging or mitigation can be added as an extra output variable in the fuzzy logic model.
This will help management decide which risks should be mitigated and the most cost-efficient
approach of doing so.
The discussion so far assumes that all the experts share the same view of the risks. Given
the experts’ different levels of understanding and experience, this is unlikely to be true in
actual practice. Hence, it is necessary to aggregate differing opinions. There are several
approaches to aggregation.
1. Adjust the membership functions and inference rules to aggregate different opinions.
In the example shown in Figure 18, the weighted average of the membership
functions provided by Expert A and Expert B may be used as the aggregated
0.0
0.2
0.4
0.6
0.8
1.0
0 1 2 3 4 5&+
De
gre
e o
f T
ruth
Membership Function of Loss Amount ($M)
High Medium Low
Risk #1
Risk #2
Risk #3
Risk #4
Risk #5

©2013 Casualty Actuarial Society, Canadian Institute of Actuaries, Society of Actuaries, All Rights Reserved
Page 34 of 59
membership function for the high fuzzy set. Weights can be determined based on each
expert’s experience, knowledge of the investigated issue, confidence in his/her
opinion and the accuracy of past estimation.
Figure 18. Aggregation of Membership Functions
It is also possible there are different opinions about the inference rules themselves. If
the difference is not too large, an adjustment to the membership function may be able
to incorporate that difference. Assume there are two inference rules as given below.
Expert A: If X is high, then Y is high.
Expert B: If X is not low (medium or high), then Y is high.
The aggregated membership function of the high fuzzy set can be shifted to the left,
as shown in Figure 18. By changing the membership function of the high fuzzy set, it
partially reflects the inference rule that If X is medium, then Y is high. Meanwhile,
only one inference rule needs to be included in the fuzzy logic model.
If X is high, then Y is high.
However, if there are opposite opinions about the inference rules, it is necessary to
understand the reasoning behind each opinion. Experts may revise their opinions after
learning from the opposite side. In the event there are still opposite opinions at the
end of the discussion, both inference rules may be removed entirely from the model
since the disagreement may indicate a lack of knowledge and a low level of
credibility.
0.0
0.2
0.4
0.6
0.8
1.0
0 1 2 3 4 5&+
De
gre
e o
f T
ruth
Membership Function of High Fuzzy Set
Expert A Expert B
Aggregated Aggregated - With Adjustment
©2013 Casualty Actuarial Society, Canadian Institute of Actuaries, Society of Actuaries, All Rights Reserved
Page 35 of 59
2. Each expert may have his/her own fuzzy logic model with unique membership
functions and inference rules. The aggregated risk assessment result is simply the
weighted average of the results generated from the different individual models.
Unlike the first approach that adjusts the model inputs, the second adjusts the model
outputs by melding them all together
3. A specific case of the second approach is to assign an equal weight to all opinions,
which is prevalent in the literature about fuzzy logic models. This is normally used
when there are quite a few experts and the goal is to rank based on the level of risk.
For example, there are n experts that provide the view of the risk level of A and B. If
more than n/2 experts vote for A as the riskier one, A will be considered riskier than B.
It may be appropriate for identifying the riskiest cases for a specific individual risk.
But it does not fit well for the aggregation at the level of the business unit and the
total company.
4.2 Required Economic Capital Model
It is a challenge to determine the required economic capital (REC) for risks with
insufficient experience data. The lack of relevant historical loss data and the wide scope and
potential range of losses resulting from these risks make it hard to quantify the exposure to
them. Some companies use regulatory models or rating agency models. Others estimate
exposure by making reference to peers’ REC for operational risk. However, these methods are
normally high-level factor-based approaches, such as x percent of revenue/premium, earnings,
assets or the required capital for another risk type. Such factors may not always be able to
take a full account of the difference in actual risk exposure and risk management practices
among different companies.
Even without sufficient loss data for quantification, fuzzy logic systems may help
estimate the REC for certain risks using a bottom-up approach, given sufficient inputs from
subject matter experts. As shown in Section 2.2 A Numerical Example, the output variable can
be simulated to get the distribution, the value at risk (VaR) and the conditional tail expectation
(CTE). If the output variable is the annual loss of the risk, the REC can be determined as, for
example, the 99.5th percentile15
of the simulated loss distribution less the– average loss. An
alternative is to take the difference between the estimated loss under an extreme event and the
expected loss. The REC at an aggregated level may be estimated by two methods.
1. Aggregate the REC for each individual risk using a correlation matrix, as shown in an
example of three risk factors given below.
15
The 99.5th percentile is equivalent to a 1-in-200-year event. The percentile may be chosen based on
the risk appetite of the company.

©2013 Casualty Actuarial Society, Canadian Institute of Actuaries, Society of Actuaries, All Rights Reserved
Page 36 of 59
3
2
1
2313
2312
1312
321
1
1
1
REC
REC
REC
RECRECREC
TotalREC
Notations
RECTotal: Aggregated required economic capital
RECi: Required economic capital for risk factor i
ρij: Correlation Coefficient of risk factors i and j
2. Generate correlated values for all input variables and run the simulation to get the
distribution of the aggregated loss and then the aggregated REC, as illustrated below.
Figure 19. Aggregated REC Using Simulation
Notations
KRI: Key risk indicators
RECTotal: Aggregated required economic capital
RECi: Required economic capital for risk factor i
It is not an easy task to determine the correlation of the REC for individual risks. In many
cases where the fuzzy logic model is used, there is a lack of experience data. It will be even
harder to figure out the appropriate correlation among different risks as it normally requires a
time series of panel data for calibration. In addition, the correlation among the REC for
different risks is not the same as the correlation among the risks themselves. A theoretically
more reasonable approach is to build in the correlation or dependency at the root of the fuzzy
logic system, which is at the level of input variables. The distribution of loss at different
levels can be simulated, and the REC can be calculated based on the simulated distribution.
For this reason, the second method is more appropriate for REC calculation in a fuzzy logic
1st Risk Factor 2nd Risk Factor 3rd Risk Factor
KRI(1) KRI(2) … … … … KRI(n)
Key
Risk
Indicators
Individual
Risk
Exposure
Aggregated
Risk
Exposure
REC1REC2 REC3
RECTotal
Sim
ula
tion
bas
ed
on
fuzzy
log
ic s
ys
tem

©2013 Casualty Actuarial Society, Canadian Institute of Actuaries, Society of Actuaries, All Rights Reserved
Page 37 of 59
system. An example of REC calculation and aggregation is given in Section 6 Case Studies.
5 Key Considerations
In the application of fuzzy logic systems to risk assessment and risk decision-making,
many practical issues and challenges will be encountered. Even with a solid theoretical
foundation, the success of a system depends on many factors such as the quality of the experts’
opinions, the system’s own credibility and its linkage to management decisions. This section
covers some key factors to be considered in the development and application of a practical
fuzzy logic system.
5.1 Expert Opinions: Collection and Analysis
Opinions of subject matter experts or business managers are the main information source
of a fuzzy logic system. It is not a one-time effort but an iterative process. A sample process is
given below.
Step 1. The request for opinions about the issue or risk is sent out. It may include
questions about the key factors that may cause any risk event, the value of each
factor for existing business, any known cause-and-effect relationship, any risk
measures that could be used and any relationship with other risk types. It can be
done electronically, via interview with each expert or by means of a group
discussion. If the issue is new and complicated, an introduction and discussion in
a conference is more effective.
Step 2. Collected opinions are aggregated and analyzed. If there are conflicting opinions,
further explanation from the experts may be needed to understand the thinking
behind their opinions. After that, a proposed fuzzy logic model with specified
variables, membership functions and inference rules will be communicated back
to experts to get their comments and agreement.
Step 3. Feedback about the proposed model is digested and reflected in the final model
specification. This may require several rounds of communication.
Step 4. After the model is finalized, relevant data collection and a risk-monitoring process
need to be set up. Regular reports about the current risk exposure are prepared
based on the fuzzy logic model. They are distributed to the experts for comments
and information. Based on the model results, past experience, changing
environment or improved understanding, experts may revise their opinions. This
requires a regular review and update of the model.
To encourage the contribution of the experts to the fuzzy logic system, it is essential to
present the final product and report to them so that they understand the outcome of their
efforts. Normally the experts are business managers. If the model can provide them
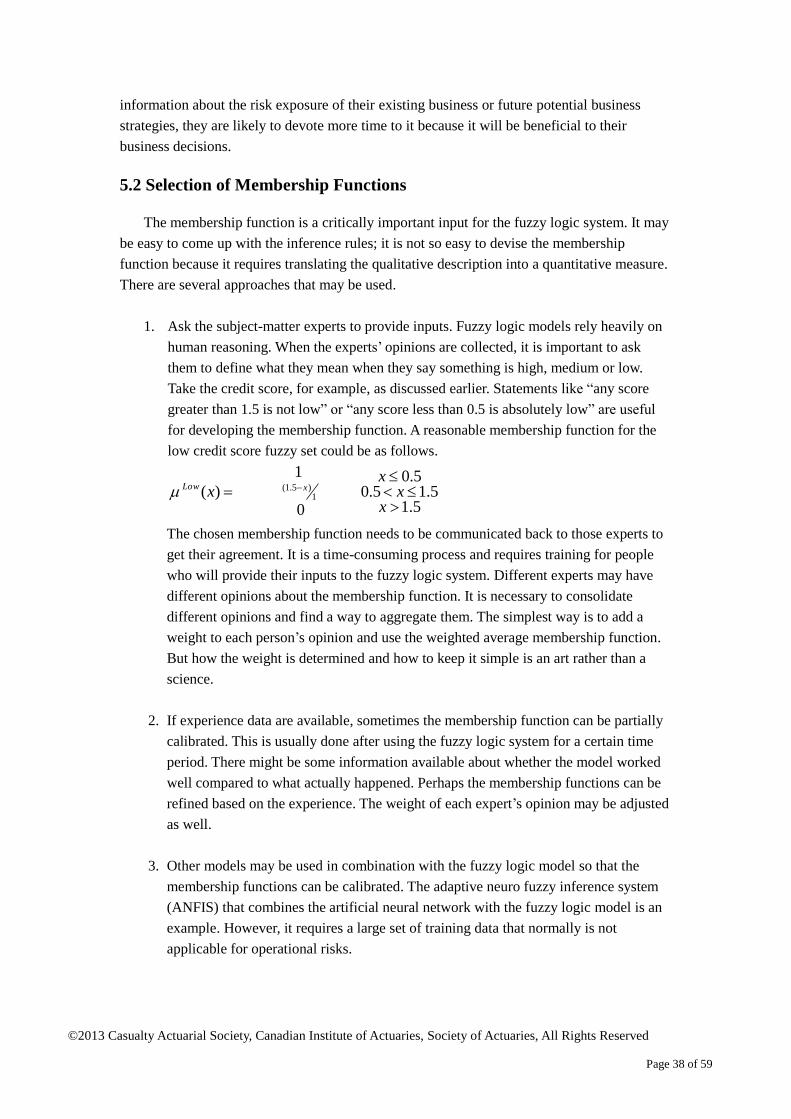
©2013 Casualty Actuarial Society, Canadian Institute of Actuaries, Society of Actuaries, All Rights Reserved
Page 38 of 59
information about the risk exposure of their existing business or future potential business
strategies, they are likely to devote more time to it because it will be beneficial to their
business decisions.
5.2 Selection of Membership Functions
The membership function is a critically important input for the fuzzy logic system. It may
be easy to come up with the inference rules; it is not so easy to devise the membership
function because it requires translating the qualitative description into a quantitative measure.
There are several approaches that may be used.
1. Ask the subject-matter experts to provide inputs. Fuzzy logic models rely heavily on
human reasoning. When the experts’ opinions are collected, it is important to ask
them to define what they mean when they say something is high, medium or low.
Take the credit score, for example, as discussed earlier. Statements like “any score
greater than 1.5 is not low” or “any score less than 0.5 is absolutely low” are useful
for developing the membership function. A reasonable membership function for the
low credit score fuzzy set could be as follows.
5.15.15.0
5.0
0
1
)( 1)5.1(
xx
xx xLow
The chosen membership function needs to be communicated back to those experts to
get their agreement. It is a time-consuming process and requires training for people
who will provide their inputs to the fuzzy logic system. Different experts may have
different opinions about the membership function. It is necessary to consolidate
different opinions and find a way to aggregate them. The simplest way is to add a
weight to each person’s opinion and use the weighted average membership function.
But how the weight is determined and how to keep it simple is an art rather than a
science.
2. If experience data are available, sometimes the membership function can be partially
calibrated. This is usually done after using the fuzzy logic system for a certain time
period. There might be some information available about whether the model worked
well compared to what actually happened. Perhaps the membership functions can be
refined based on the experience. The weight of each expert’s opinion may be adjusted
as well.
3. Other models may be used in combination with the fuzzy logic model so that the
membership functions can be calibrated. The adaptive neuro fuzzy inference system
(ANFIS) that combines the artificial neural network with the fuzzy logic model is an
example. However, it requires a large set of training data that normally is not
applicable for operational risks.
©2013 Casualty Actuarial Society, Canadian Institute of Actuaries, Society of Actuaries, All Rights Reserved
Page 39 of 59
5.3 The Role of Experience Data
For most risks dealt with using fuzzy logic models, there may not be sufficient data. The
reasonableness of the model is primarily in the hands of the experts or business managers.
The comments on the inference rules or on the membership functions may have a material
impact on the result of risk assessment. However, back testing based on experience data, if
available, may be used to validate or improve the models. Comparing the actual experience
with the model is an option that may be used after implementing the fuzzy logic system.
Based on the experience data, the membership functions may be adjusted or calibrated to
better predict the output variable. Tracking the inputs from each expert may also tell us how
well they fit the experience data; the weight on each expert’s opinions may be adjusted
accordingly. In addition, when enough data have been collected, it may also have an impact
on the experts’ understanding of the subject and may change their inputs as well, including the
inference rules and membership functions. In the end, with sufficient data, fuzzy logic models
may be migrated to models based on probability theory, but not necessarily.16
Unlike some data-driven models, the weight put on experience data when specifying a
fuzzy logic model is not heavy in most cases.
1. Experience data collected may not be statistically credible for revising the existing
model parameters and inference rules. It is likely that only after the fuzzy logic model
is implemented will relevant data be collected in a meaningful way.
2. For risk management, the most useful piece of information is about tail events. It will
be even harder to collect data for tail events.
3. The explicit cause-and-effect relationships built in the fuzzy logic model prevent the
model from changing solely based on experience data, contrary to some data-mining
models. Unless the experience is analyzed and fully understood, it may not cause a
change in the model.
Analyzing experience data provides opportunities to enhance our knowledge of the risks
and improve the accuracy of the fuzzy logic model. The data may have information contrary
to the assumed inference rules. By analyzing the data, people may be able to correct
misunderstanding, discover new underlying factors and revise the inference rules.
5.4 Fuzzy Logic System Review
Like other risk management tools such as risk appetite, fuzzy logic systems need to be
reviewed and updated from time to time.
1. There may be new risks to be included in the system due to new business or a change
in the business environment.
16
A simple example of using experience data is included in the Appendix.
©2013 Casualty Actuarial Society, Canadian Institute of Actuaries, Society of Actuaries, All Rights Reserved
Page 40 of 59
2. There may be better understanding of the issue, based on recent academic research or
recently emerged loss experience.
3. There may be changes in the company’s strategy. In this case, the exposure to each of
the company’s risks needs to be updated.
Depending on the scope of the fuzzy logic system, it may be a difficult task to produce a
full update. A balance is needed to make the best use of the experts’ time. It is important to
make the updating process as easy and rewarding as possible. A user-friendly interface for the
experts to update their opinions may be helpful. Regular reporting about the risk exposure and
the implications of potential risk strategies help maintain people’s interest and their
willingness to engage in the ongoing process.
5.5 Linkage to Decision-Making
The ultimate goal of any risk-assessment system is to help decision-makers make
informed risk decisions. Although fuzzy logic systems can be used to estimate the risk
exposure quantitatively, what is really meaningful is the ranking of the risks. This enables
decision-makers to identify the major risks and provides them with a better understanding of
the relative magnitude of the risks. As long as the assumptions and approaches used for
assessing risks are consistent, the ranking based on the fuzzy logic system will be meaningful.
In addition, fuzzy logic systems can be used to estimate the cost of risk mitigation.
1. At the individual risk level: For each individual risk, the major contributors to the risk
exposure may be identified by the fuzzy logic model. For example, the misconduct
risk of each product a company offers can be assessed and ranked. The products
exposed to high misconduct risk may then be monitored and even revised if there is a
sustained period of bad risk experience. Actions may include more training for the
advisers, an adjusted adviser compensation scheme that will penalize misleading
advertisement or a simplification of the product. Another example is identifying the
key events that may deteriorate a company’s reputation. A list of events with potential
risks may be collected either from the company’s own risk assessment or from
analyzing public opinions. A fuzzy logic model can be used to rank those events and
necessary actions can be taken to manage the risk.
2. At the business unit level: The top risks can be identified by the fuzzy logic system
and necessary risk monitoring and management action can then be taken at the level
of the business unit. In addition to existing risks, exposure to emerging risks and new
risks that may be caused by new business strategies can be assessed by the fuzzy
logic system. This in turn can be fed into the business-decision process so that future
business strategies include adequate consideration of the potential risks.
3. At the overall company level: At the top level, in addition to risk identification and
assessment, fuzzy logic systems may play an important role in strategic planning, and
may affect new business plans and strategic capital management. Decision-makers
can obtain a more holistic view of the company’s risks when planning its future.
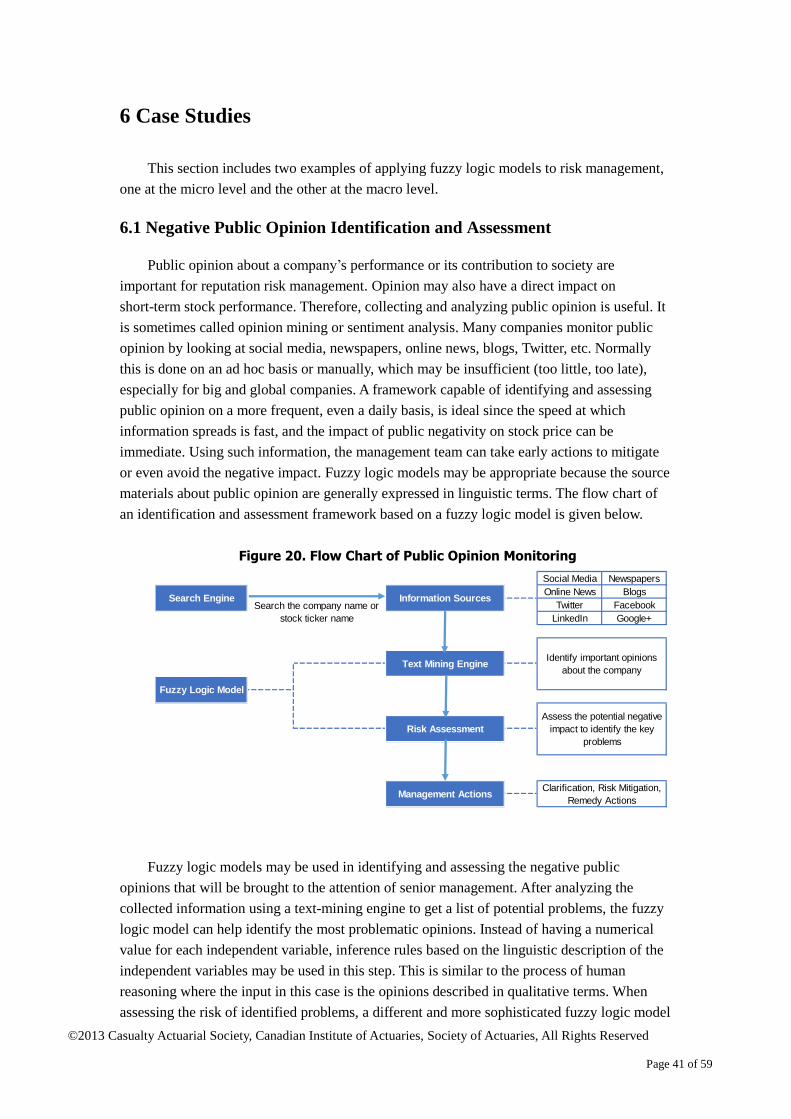
©2013 Casualty Actuarial Society, Canadian Institute of Actuaries, Society of Actuaries, All Rights Reserved
Page 41 of 59
6 Case Studies
This section includes two examples of applying fuzzy logic models to risk management,
one at the micro level and the other at the macro level.
6.1 Negative Public Opinion Identification and Assessment
Public opinion about a company’s performance or its contribution to society are
important for reputation risk management. Opinion may also have a direct impact on
short-term stock performance. Therefore, collecting and analyzing public opinion is useful. It
is sometimes called opinion mining or sentiment analysis. Many companies monitor public
opinion by looking at social media, newspapers, online news, blogs, Twitter, etc. Normally
this is done on an ad hoc basis or manually, which may be insufficient (too little, too late),
especially for big and global companies. A framework capable of identifying and assessing
public opinion on a more frequent, even a daily basis, is ideal since the speed at which
information spreads is fast, and the impact of public negativity on stock price can be
immediate. Using such information, the management team can take early actions to mitigate
or even avoid the negative impact. Fuzzy logic models may be appropriate because the source
materials about public opinion are generally expressed in linguistic terms. The flow chart of
an identification and assessment framework based on a fuzzy logic model is given below.
Figure 20. Flow Chart of Public Opinion Monitoring
Fuzzy logic models may be used in identifying and assessing the negative public
opinions that will be brought to the attention of senior management. After analyzing the
collected information using a text-mining engine to get a list of potential problems, the fuzzy
logic model can help identify the most problematic opinions. Instead of having a numerical
value for each independent variable, inference rules based on the linguistic description of the
independent variables may be used in this step. This is similar to the process of human
reasoning where the input in this case is the opinions described in qualitative terms. When
assessing the risk of identified problems, a different and more sophisticated fuzzy logic model
Social Media Newspapers
Online News Blogs
Twitter Facebook
LinkedIn Google+
Management Actions
Identify important opinions
about the company
Assess the potential negative
impact to identify the key
problems
Fuzzy Logic Model
Clarification, Risk Mitigation,
Remedy Actions
Search Engine Information SourcesSearch the company name or
stock ticker name
Text Mining Engine
Risk Assessment
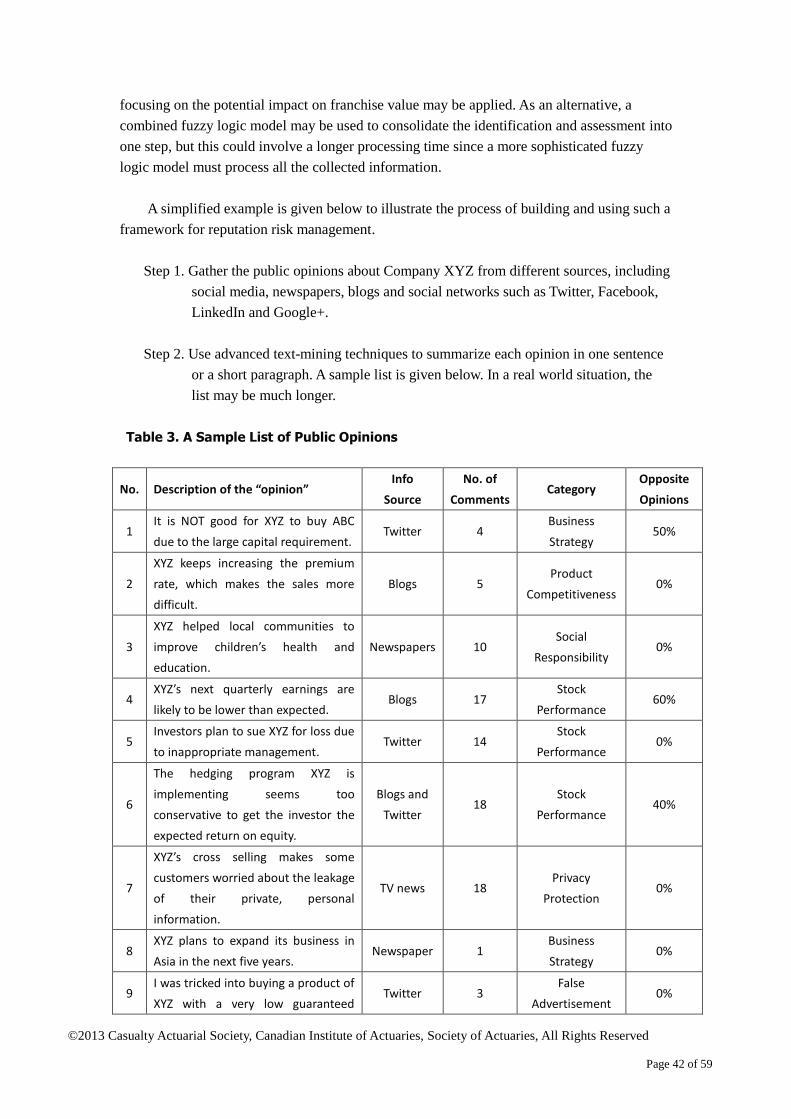
©2013 Casualty Actuarial Society, Canadian Institute of Actuaries, Society of Actuaries, All Rights Reserved
Page 42 of 59
focusing on the potential impact on franchise value may be applied. As an alternative, a
combined fuzzy logic model may be used to consolidate the identification and assessment into
one step, but this could involve a longer processing time since a more sophisticated fuzzy
logic model must process all the collected information.
A simplified example is given below to illustrate the process of building and using such a
framework for reputation risk management.
Step 1. Gather the public opinions about Company XYZ from different sources, including
social media, newspapers, blogs and social networks such as Twitter, Facebook,
LinkedIn and Google+.
Step 2. Use advanced text-mining techniques to summarize each opinion in one sentence
or a short paragraph. A sample list is given below. In a real world situation, the
list may be much longer.
Table 3. A Sample List of Public Opinions
No. Description of the “opinion” Info
Source
No. of
Comments Category
Opposite
Opinions
1 It is NOT good for XYZ to buy ABC
due to the large capital requirement. Twitter 4
Business
Strategy 50%
2
XYZ keeps increasing the premium
rate, which makes the sales more
difficult.
Blogs 5 Product
Competitiveness 0%
3
XYZ helped local communities to
improve children’s health and
education.
Newspapers 10 Social
Responsibility 0%
4 XYZ’s next quarterly earnings are
likely to be lower than expected. Blogs 17
Stock
Performance 60%
5 Investors plan to sue XYZ for loss due
to inappropriate management. Twitter 14
Stock
Performance 0%
6
The hedging program XYZ is
implementing seems too
conservative to get the investor the
expected return on equity.
Blogs and
Twitter 18
Stock
Performance 40%
7
XYZ’s cross selling makes some
customers worried about the leakage
of their private, personal
information.
TV news 18 Privacy
Protection 0%
8 XYZ plans to expand its business in
Asia in the next five years. Newspaper 1
Business
Strategy 0%
9 I was tricked into buying a product of
XYZ with a very low guaranteed Twitter 3
False
Advertisement 0%
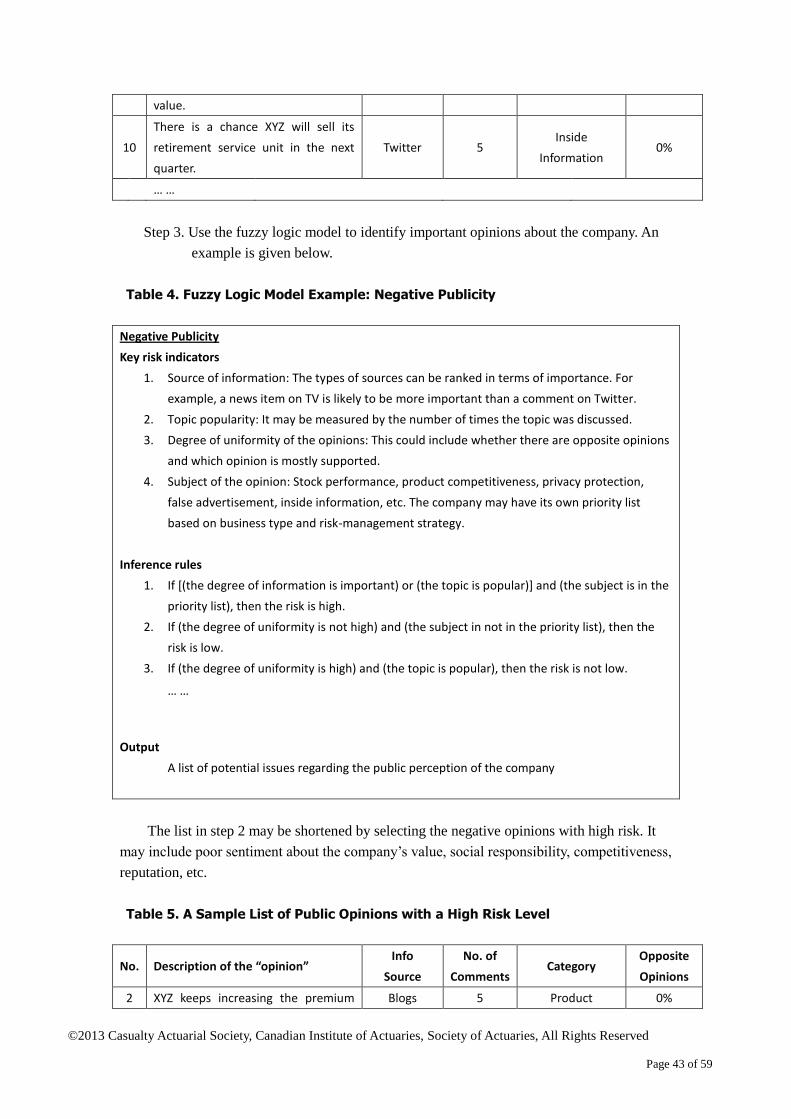
©2013 Casualty Actuarial Society, Canadian Institute of Actuaries, Society of Actuaries, All Rights Reserved
Page 43 of 59
value.
10
There is a chance XYZ will sell its
retirement service unit in the next
quarter.
Twitter 5 Inside
Information 0%
… …
Step 3. Use the fuzzy logic model to identify important opinions about the company. An
example is given below.
Table 4. Fuzzy Logic Model Example: Negative Publicity
Negative Publicity
Key risk indicators
1. Source of information: The types of sources can be ranked in terms of importance. For
example, a news item on TV is likely to be more important than a comment on Twitter.
2. Topic popularity: It may be measured by the number of times the topic was discussed.
3. Degree of uniformity of the opinions: This could include whether there are opposite opinions
and which opinion is mostly supported.
4. Subject of the opinion: Stock performance, product competitiveness, privacy protection,
false advertisement, inside information, etc. The company may have its own priority list
based on business type and risk-management strategy.
Inference rules
1. If [(the degree of information is important) or (the topic is popular)] and (the subject is in the
priority list), then the risk is high.
2. If (the degree of uniformity is not high) and (the subject in not in the priority list), then the
risk is low.
3. If (the degree of uniformity is high) and (the topic is popular), then the risk is not low.
… …
Output
A list of potential issues regarding the public perception of the company
The list in step 2 may be shortened by selecting the negative opinions with high risk. It
may include poor sentiment about the company’s value, social responsibility, competitiveness,
reputation, etc.
Table 5. A Sample List of Public Opinions with a High Risk Level
No. Description of the “opinion” Info
Source
No. of
Comments Category
Opposite
Opinions
2 XYZ keeps increasing the premium Blogs 5 Product 0%
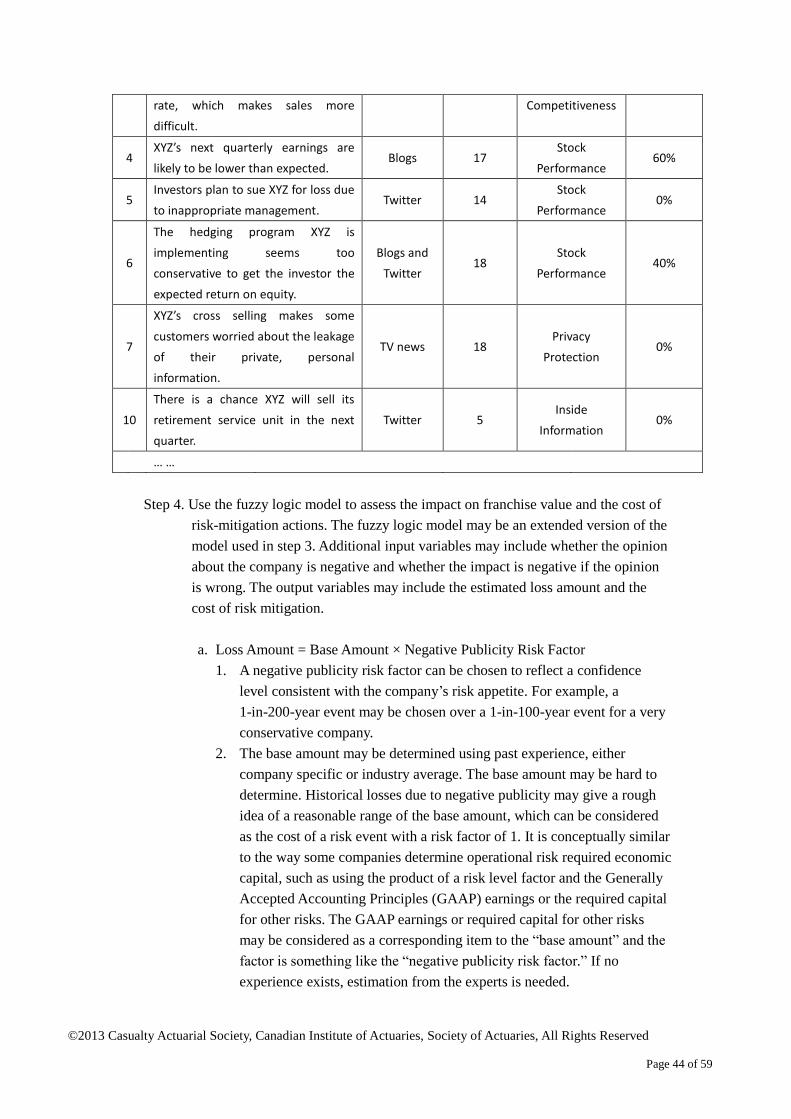
©2013 Casualty Actuarial Society, Canadian Institute of Actuaries, Society of Actuaries, All Rights Reserved
Page 44 of 59
rate, which makes sales more
difficult.
Competitiveness
4 XYZ’s next quarterly earnings are
likely to be lower than expected. Blogs 17
Stock
Performance 60%
5 Investors plan to sue XYZ for loss due
to inappropriate management. Twitter 14
Stock
Performance 0%
6
The hedging program XYZ is
implementing seems too
conservative to get the investor the
expected return on equity.
Blogs and
Twitter 18
Stock
Performance 40%
7
XYZ’s cross selling makes some
customers worried about the leakage
of their private, personal
information.
TV news 18 Privacy
Protection 0%
10
There is a chance XYZ will sell its
retirement service unit in the next
quarter.
Twitter 5 Inside
Information 0%
… …
Step 4. Use the fuzzy logic model to assess the impact on franchise value and the cost of
risk-mitigation actions. The fuzzy logic model may be an extended version of the
model used in step 3. Additional input variables may include whether the opinion
about the company is negative and whether the impact is negative if the opinion
is wrong. The output variables may include the estimated loss amount and the
cost of risk mitigation.
a. Loss Amount = Base Amount × Negative Publicity Risk Factor
1. A negative publicity risk factor can be chosen to reflect a confidence
level consistent with the company’s risk appetite. For example, a
1-in-200-year event may be chosen over a 1-in-100-year event for a very
conservative company.
2. The base amount may be determined using past experience, either
company specific or industry average. The base amount may be hard to
determine. Historical losses due to negative publicity may give a rough
idea of a reasonable range of the base amount, which can be considered
as the cost of a risk event with a risk factor of 1. It is conceptually similar
to the way some companies determine operational risk required economic
capital, such as using the product of a risk level factor and the Generally
Accepted Accounting Principles (GAAP) earnings or the required capital
for other risks. The GAAP earnings or required capital for other risks
may be considered as a corresponding item to the “base amount” and the
factor is something like the “negative publicity risk factor.” If no
experience exists, estimation from the experts is needed.
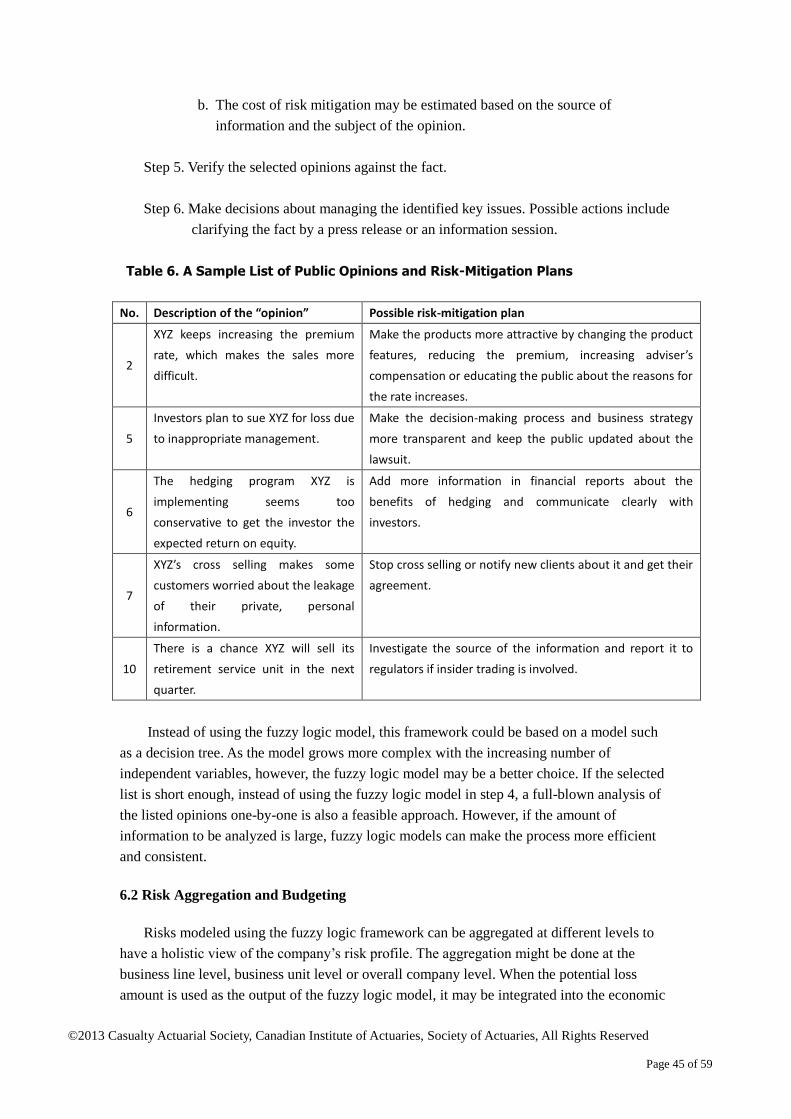
©2013 Casualty Actuarial Society, Canadian Institute of Actuaries, Society of Actuaries, All Rights Reserved
Page 45 of 59
b. The cost of risk mitigation may be estimated based on the source of
information and the subject of the opinion.
Step 5. Verify the selected opinions against the fact.
Step 6. Make decisions about managing the identified key issues. Possible actions include
clarifying the fact by a press release or an information session.
Table 6. A Sample List of Public Opinions and Risk-Mitigation Plans
No. Description of the “opinion” Possible risk-mitigation plan
2
XYZ keeps increasing the premium
rate, which makes the sales more
difficult.
Make the products more attractive by changing the product
features, reducing the premium, increasing adviser’s
compensation or educating the public about the reasons for
the rate increases.
5
Investors plan to sue XYZ for loss due
to inappropriate management.
Make the decision-making process and business strategy
more transparent and keep the public updated about the
lawsuit.
6
The hedging program XYZ is
implementing seems too
conservative to get the investor the
expected return on equity.
Add more information in financial reports about the
benefits of hedging and communicate clearly with
investors.
7
XYZ’s cross selling makes some
customers worried about the leakage
of their private, personal
information.
Stop cross selling or notify new clients about it and get their
agreement.
10
There is a chance XYZ will sell its
retirement service unit in the next
quarter.
Investigate the source of the information and report it to
regulators if insider trading is involved.
Instead of using the fuzzy logic model, this framework could be based on a model such
as a decision tree. As the model grows more complex with the increasing number of
independent variables, however, the fuzzy logic model may be a better choice. If the selected
list is short enough, instead of using the fuzzy logic model in step 4, a full-blown analysis of
the listed opinions one-by-one is also a feasible approach. However, if the amount of
information to be analyzed is large, fuzzy logic models can make the process more efficient
and consistent.
6.2 Risk Aggregation and Budgeting
Risks modeled using the fuzzy logic framework can be aggregated at different levels to
have a holistic view of the company’s risk profile. The aggregation might be done at the
business line level, business unit level or overall company level. When the potential loss
amount is used as the output of the fuzzy logic model, it may be integrated into the economic
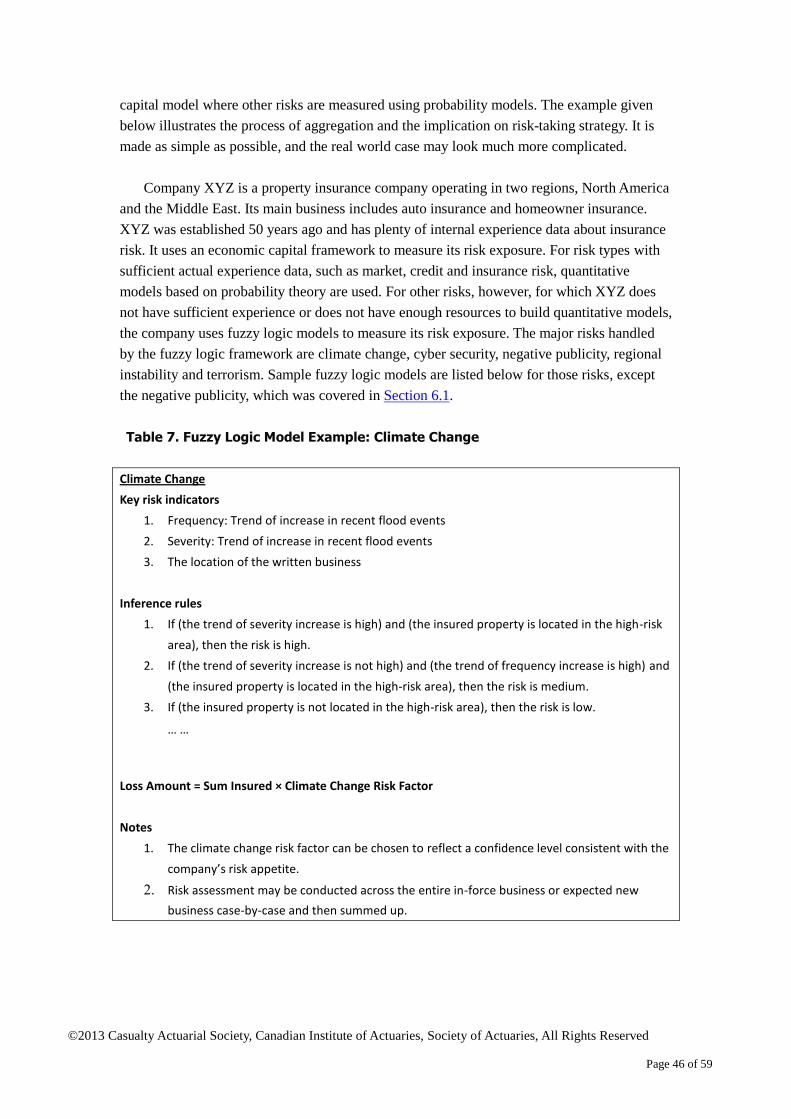
©2013 Casualty Actuarial Society, Canadian Institute of Actuaries, Society of Actuaries, All Rights Reserved
Page 46 of 59
capital model where other risks are measured using probability models. The example given
below illustrates the process of aggregation and the implication on risk-taking strategy. It is
made as simple as possible, and the real world case may look much more complicated.
Company XYZ is a property insurance company operating in two regions, North America
and the Middle East. Its main business includes auto insurance and homeowner insurance.
XYZ was established 50 years ago and has plenty of internal experience data about insurance
risk. It uses an economic capital framework to measure its risk exposure. For risk types with
sufficient actual experience data, such as market, credit and insurance risk, quantitative
models based on probability theory are used. For other risks, however, for which XYZ does
not have sufficient experience or does not have enough resources to build quantitative models,
the company uses fuzzy logic models to measure its risk exposure. The major risks handled
by the fuzzy logic framework are climate change, cyber security, negative publicity, regional
instability and terrorism. Sample fuzzy logic models are listed below for those risks, except
the negative publicity, which was covered in Section 6.1.
Table 7. Fuzzy Logic Model Example: Climate Change
Climate Change
Key risk indicators
1. Frequency: Trend of increase in recent flood events
2. Severity: Trend of increase in recent flood events
3. The location of the written business
Inference rules
1. If (the trend of severity increase is high) and (the insured property is located in the high-risk
area), then the risk is high.
2. If (the trend of severity increase is not high) and (the trend of frequency increase is high) and
(the insured property is located in the high-risk area), then the risk is medium.
3. If (the insured property is not located in the high-risk area), then the risk is low.
… …
Loss Amount = Sum Insured × Climate Change Risk Factor
Notes
1. The climate change risk factor can be chosen to reflect a confidence level consistent with the
company’s risk appetite.
2. Risk assessment may be conducted across the entire in-force business or expected new
business case-by-case and then summed up.

©2013 Casualty Actuarial Society, Canadian Institute of Actuaries, Society of Actuaries, All Rights Reserved
Page 47 of 59
Table 8. Fuzzy Logic Model Example: Cyber Security
Cyber Security
Key risk indicators
1. Cyber security technology
2. Cyber security standards
3. The scope of collected private information
4. Impact of past incidents
Inference rules
1. If (the technology is advanced) and (the standard is high), then the risk is not high.
2. If (the impact of past incidents is high), then the risk is not low.
3. If (the scope is not narrow), then the risk is not low.
… …
Loss Amount = Base Amount × Cyber Security Risk Factor
Notes
1. The cyber security risk factor can be chosen to reflect a confidence level consistent with the
company’s risk appetite.
2. The base amount may be determined using past experience or input from experts.
Table 9. Fuzzy Logic Model Example: Regional Instability
Regional Instability
Key risk indicators
1. The location of the written business
2. Loss experience due to wars
3. Intervention from outside
Inference rules
1. If (the insured property is located in a high-risk area) and (the impact of intervention from
outside is high), then the risk is high.
2. If (the loss due to wars was high), then the risk is not low.
3. If (the insured property is not located in the high-risk area), then the risk is low.
… …
Loss Amount = Covered Sum Insured × Regional Instability Risk Factor
Notes
1. The regional instability risk factor can be chosen to reflect a confidence level consistent with
the company’s risk appetite.
2. Covered sum insured: The sum insured covered in the event of wars, turmoil, chaos, etc.
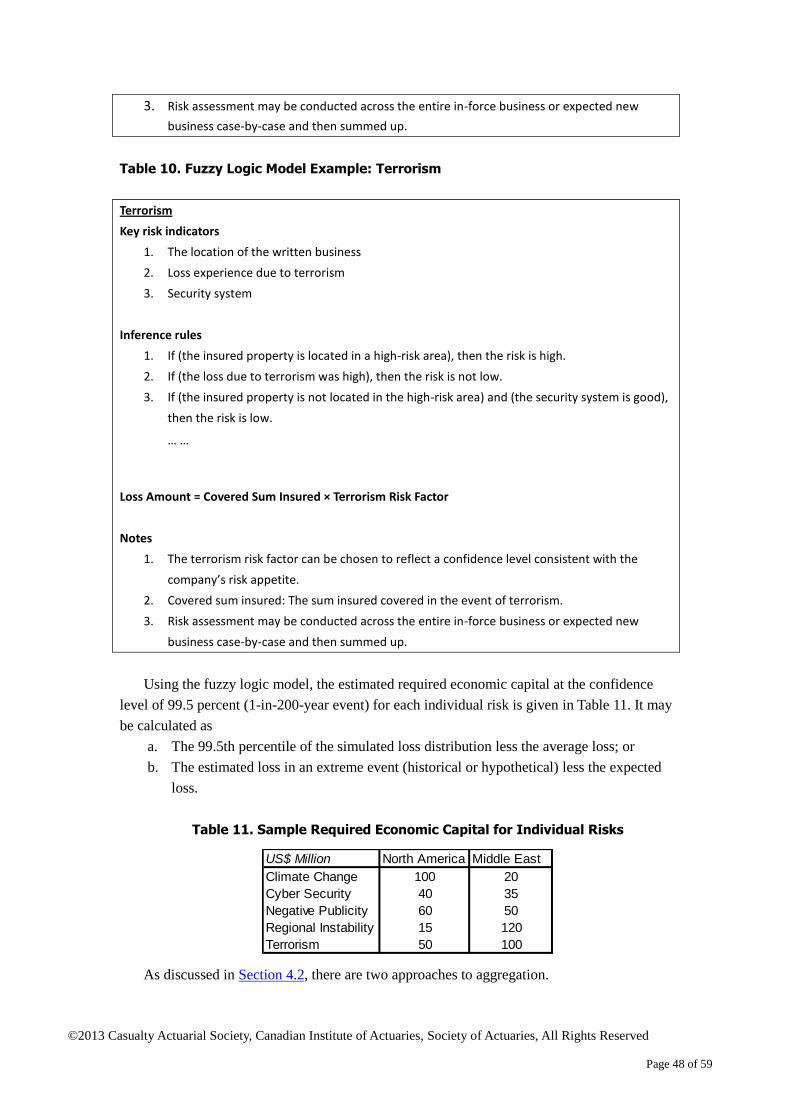
©2013 Casualty Actuarial Society, Canadian Institute of Actuaries, Society of Actuaries, All Rights Reserved
Page 48 of 59
3. Risk assessment may be conducted across the entire in-force business or expected new
business case-by-case and then summed up.
Table 10. Fuzzy Logic Model Example: Terrorism
Terrorism
Key risk indicators
1. The location of the written business
2. Loss experience due to terrorism
3. Security system
Inference rules
1. If (the insured property is located in a high-risk area), then the risk is high.
2. If (the loss due to terrorism was high), then the risk is not low.
3. If (the insured property is not located in the high-risk area) and (the security system is good),
then the risk is low.
… …
Loss Amount = Covered Sum Insured × Terrorism Risk Factor
Notes
1. The terrorism risk factor can be chosen to reflect a confidence level consistent with the
company’s risk appetite.
2. Covered sum insured: The sum insured covered in the event of terrorism.
3. Risk assessment may be conducted across the entire in-force business or expected new
business case-by-case and then summed up.
Using the fuzzy logic model, the estimated required economic capital at the confidence
level of 99.5 percent (1-in-200-year event) for each individual risk is given in Table 11. It may
be calculated as
a. The 99.5th percentile of the simulated loss distribution less the average loss; or
b. The estimated loss in an extreme event (historical or hypothetical) less the expected
loss.
Table 11. Sample Required Economic Capital for Individual Risks
As discussed in Section 4.2, there are two approaches to aggregation.
US$ Million North America Middle East
Climate Change 100 20
Cyber Security 40 35
Negative Publicity 60 50
Regional Instability 15 120
Terrorism 50 100
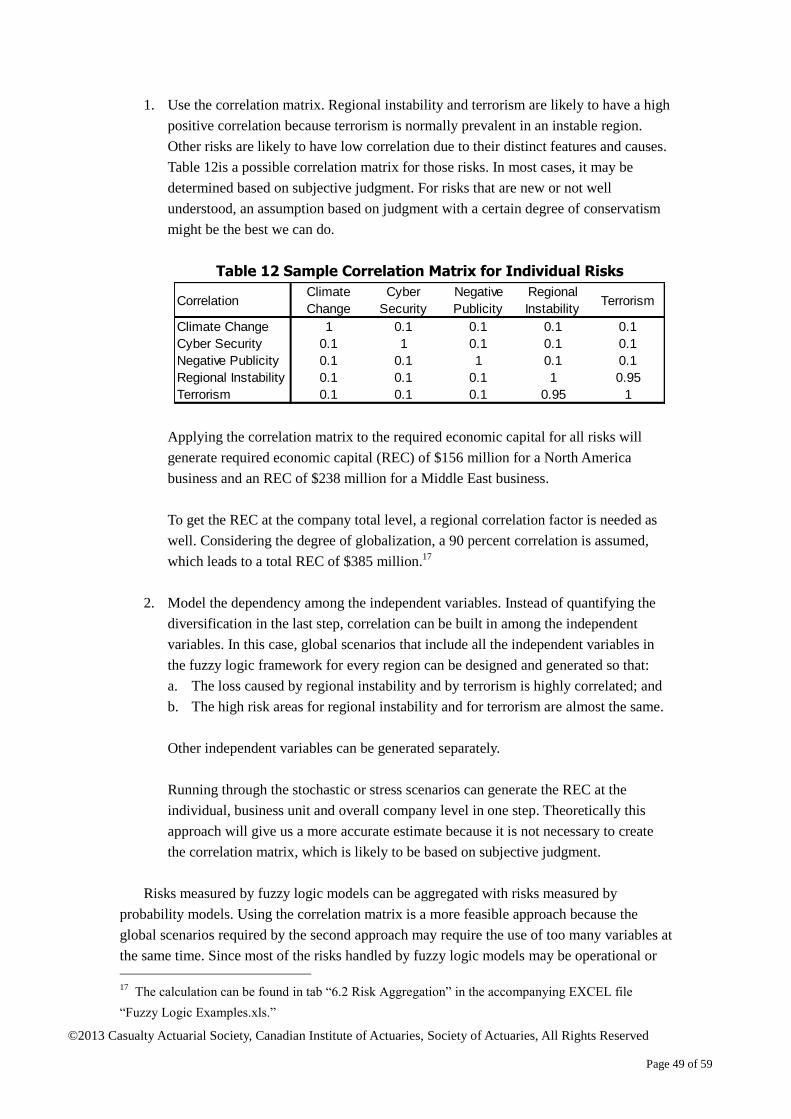
©2013 Casualty Actuarial Society, Canadian Institute of Actuaries, Society of Actuaries, All Rights Reserved
Page 49 of 59
1. Use the correlation matrix. Regional instability and terrorism are likely to have a high
positive correlation because terrorism is normally prevalent in an instable region.
Other risks are likely to have low correlation due to their distinct features and causes.
Table 12is a possible correlation matrix for those risks. In most cases, it may be
determined based on subjective judgment. For risks that are new or not well
understood, an assumption based on judgment with a certain degree of conservatism
might be the best we can do.
Table 12 Sample Correlation Matrix for Individual Risks
Applying the correlation matrix to the required economic capital for all risks will
generate required economic capital (REC) of $156 million for a North America
business and an REC of $238 million for a Middle East business.
To get the REC at the company total level, a regional correlation factor is needed as
well. Considering the degree of globalization, a 90 percent correlation is assumed,
which leads to a total REC of $385 million.17
2. Model the dependency among the independent variables. Instead of quantifying the
diversification in the last step, correlation can be built in among the independent
variables. In this case, global scenarios that include all the independent variables in
the fuzzy logic framework for every region can be designed and generated so that:
a. The loss caused by regional instability and by terrorism is highly correlated; and
b. The high risk areas for regional instability and for terrorism are almost the same.
Other independent variables can be generated separately.
Running through the stochastic or stress scenarios can generate the REC at the
individual, business unit and overall company level in one step. Theoretically this
approach will give us a more accurate estimate because it is not necessary to create
the correlation matrix, which is likely to be based on subjective judgment.
Risks measured by fuzzy logic models can be aggregated with risks measured by
probability models. Using the correlation matrix is a more feasible approach because the
global scenarios required by the second approach may require the use of too many variables at
the same time. Since most of the risks handled by fuzzy logic models may be operational or
17
The calculation can be found in tab “6.2 Risk Aggregation” in the accompanying EXCEL file
“Fuzzy Logic Examples.xls.”
CorrelationClimate
Change
Cyber
Security
Negative
Publicity
Regional
InstabilityTerrorism
Climate Change 1 0.1 0.1 0.1 0.1
Cyber Security 0.1 1 0.1 0.1 0.1
Negative Publicity 0.1 0.1 1 0.1 0.1
Regional Instability 0.1 0.1 0.1 1 0.95
Terrorism 0.1 0.1 0.1 0.95 1
©2013 Casualty Actuarial Society, Canadian Institute of Actuaries, Society of Actuaries, All Rights Reserved
Page 50 of 59
emerging risks, the assumption of correlation between operational risk and other risk types
may be used. This assumption may exist in the company’s current economic capital
framework, regulatory capital models such as the European Union’s Solvency II Directive,
rating agency capital models and industry-level research reports.
Using required economic capital, for example, risks analyzed using fuzzy logic models
can be compared to risks analyzed using data-driven quantitative models on the same basis. In
the past, those operational and emerging risks were normally ignored during capital
management and the risk-budgeting process. But now they can fit in the existing framework
and become part of a more comprehensive risk profile. Most of the risks modeled by fuzzy
logic models are not tradable, and therefore it is difficult to get a high return for taking the
risks. The focus during the risk-budgeting and -review process is more on risk avoidance and
risk mitigation to reduce exposure. For example, XYZ is highly exposed to regional
instability and terrorism risk in the Middle East market. The company may consider hedging
these two risks by reinsurance or changing the product features to reduce the insured amount
for losses caused by wars, turmoil, terrorism, etc.
7 Conclusion
As a complement to probability models, fuzzy logic models can be applied to assess risks
for which there is insufficient data and incomplete knowledge. Fuzzy logic provides a
framework where human reasoning and imprecise data can contribute to risk analysis. The
scope of possible applications is wide for fuzzy logic systems. Many risks are beyond control,
not well understood or even unknown, as evidenced by the growing list of emerging risks.
Using an appropriate fuzzy logic system, it is possible to consistently analyze multiple
risks that are not well understood. The exposure to each risk can be assessed and ranked. Key
risks can be identified and managed. Resources may be used to monitor and mitigate these
key risks with high exposure. Inference rules in a fuzzy logic model may help not only to
identify the cause of a certain risk but also to design efficient and effective mitigation plans.
Fuzzy logic systems assist us in building knowledge of risks in two ways.
1. The systems keep risk managers and subject matter experts free from the inference
part for many risks and let them focus on cause-and-effect relationships based on
their knowledge.
2. Risk assessment results flow into the risk decision-making process, and the outcome
of the decision can then be fed back into the system to refine the fuzzy sets, rules and
understanding.
Fuzzy logic models may be used with other risk models such as decision trees and
artificial neural networks to model complicated risk issues like policyholder behaviors.

©2013 Casualty Actuarial Society, Canadian Institute of Actuaries, Society of Actuaries, All Rights Reserved
Page 51 of 59
8 References
Blavatskyy, Pavlo R. “Probabilistic Risk Aversion with an Arbitrary Outcome Set.” Economics Letters
112, no. 1 (July 2011): 34–37.
Brochado, Ana Margarida Oliveira, and Francisco Vitorino Martins. “Democracy and Economic
Development: A Fuzzy Classification Approach.” FEP Working Paper 180, Universidade do Porto,
Faculdade de Economia do Porto, Portugal, 2005.
http://www.fep.up.pt/investigacao/workingpapers/05.07.04_WP180_ana.pdf.
Brotons, Jose M., and Antonio Terceno. “Return Risk Map in a Fuzzy Environment.” Fuzzy Economic
Review 16, no. 2 (November 2011): 33.
Caetano, Jose Manuel Martins, and Antonio Caleiro. “Corruption and Foreign Direct Investment: What
Kind of Relationship is There?” Economics Working Paper 18, University of Evora, Department
of Economics, Portugal, 2005. http://hdl.handle.net/10174/8434.
Cai, Y.P., G. H. Huang, Z. F. Yang and Q. Tan. “Identification of Optimal Strategies for Energy
Management Systems Planning Under Multiple Uncertainties.” Applied Energy 86, no. 4 (April
2009): 480–95.
Caleiro, Antonio. “A Subjective Versus Objective Economic Measures: A Fuzzy Logic Exercise.”
Economics Working Paper 11, University of Evora, Department of Economics, Portugal, 2003.
http://dspace.uevora.pt/rdpc/bitstream/10174/8397/1/wp_2003_11.pdf.
Cheng, Wen-Ying, Ender Su and Sheng-Jung Li. “A Financial Distress Prewarning Study by Fuzzy
Regression Model of TSE-Listed Companies.” Asian Academy of Management Journal of
Accounting and Finance 2, no. 2 (2006): 75–93.
http://web.usm.my/journal/aamjaf/vol%202-2/2-2-5.pdf.
Cherubini, Umberto, and Giovanni Della Lunga. “Liquidity and Credit Risk.” Applied Mathematical
Finance 8, no. 2 (2001): 79–95.
Cox, Earl. The Fuzzy Systems Handbook: A Practitioner’s Guide to Building, Using and Maintaining
Fuzzy Systems. Boston: AP Professional, 1994: 107–268.
de Andres Sanchez, Jorge, and Antonio Terceno Gomez. “Applications of Fuzzy Regression in
Actuarial Analysis.” The Journal of Risk and Insurance 70, no. 4 (2003): 665–99.
Derrig, Richard, and Krysztof Ostaszewski. “Hedging the Tax Liability of a Property-Liability
Insurance Company.” Center for Financial Institutions Working Paper 96-30, Wharton School
Center for Financial Institutions, University of Pennsylvania, Philadelphia, May 1996.
Dow, Sheila C., and Dipak Ghosh. “Variety of Opinion and the Speculative Demand for Money: An
Analysis in Terms of Fuzzy Concepts.” SCEME Working Papers: Advances in Economic
Methodology No. 007/2004. Scottish Centre for Economic Methodology, Adam Smith Business
School, University of Glasgow, 2004.
Giovanis, Eleftherios. “Bootstrapping Fuzzy-GARCH Regressions on the Day of the Week Effect in
Stock Returns: Applications in MATLAB.” MPRA Working Paper 22326, Munich Personal
©2013 Casualty Actuarial Society, Canadian Institute of Actuaries, Society of Actuaries, All Rights Reserved
Page 52 of 59
RePEc Archive, 2009.
Gulick, Gerwald van. “Game Theory and Applications in Finance.” PhD thesis, Tilburg University,
Netherlands, 2010.
Hao, Ying, Yongsheng Ding, Shaokuan Li and Shihuang Shao. “Typical Takagi-Sugeno and Mamdani
Fuzzy Systems as Universal Approximators: Necessary Conditions and Comparison.” 1998 IEEE
International Congress on Fuzzy Systems Proceedings, Institute of Electrical and Electronics
Engineers (IEEE) World Congress on Computational Intelligence, Alaska, May 1998: vol. 1,
824–28.
Horgby, Per-Johan. “An Introduction to Fuzzy Inference in Economics.” Homo Oeconomicus 15,
(1999): 543–59.
Huang, Tao, Ruiqing Zhao and Wansheng Tang. “Risk Model with Fuzzy Random Individual Claim
Amount.” European Journal of Operational Research 192, no. 3 (2009): 879–90.
Jang, J.-S.R. “ANFIS: Adaptive-Network-Based Fuzzy Inference System.” IEEE Transactions on
Systems, Man and Cybernetics 23, no. 3 (1993): 665–85.
Jang, J.-S.R. and C.-T. Sun. “Neuro-Fuzzy Modeling and Control.” Proceedings of the IEEE 83, no. 3
(1995): 378–406.
Janikow, Cezary Z. “Fuzzy Decision Trees: Issues and Methods.” University of Missouri–St. Louis,
Department of Mathematics and Computer Science (1996): 12–26.
http://www.cs.umsl.edu/~janikow/fid/fid34/papers/fid.ieeesmc.pdf.
Klir, George J., and Bo Yuan. Fuzzy Sets and Fuzzy Logic Theory and Applications. Upper Saddle
River, New Jersey: Prentice Hall, 1995: 367–77 and 390–415.
Lahsasna, Adel. “Evaluation of Credit Risk Using Evolutionary-Fuzzy Logic Scheme.” Master’s diss.,
Faculty of Computer Science and Information Technology, University of Malaya, 2009.
Lai, Li-Hua. “An Evaluation of Fuzzy Transportation Underwriting Systematic Risk.” Transportation
Research Part A: Policy and Practice 42, no. 9 (2008): 1231–37.
———. “Underwriting Profit Margin of P/L Insurance in the Fuzzy-ICAPM.” Geneva Risk and
Insurance 31, no. 1 (2006): 23–34.
Lazzari, Luisa L., and Patricia I. Moulia. “Fuzzy Sets Application to Healthcare Systems.” Fuzzy
Economic Review 17, no. 2 (2012): 43–58.
Lee, Cheng, Gwo-Hshiung Tzeng and Shin-Yun Wang. “A Fuzzy Set Approach for Generalized CRR
Model: An Empirical Analysis of S&P 500 Index Options.” Review of Quantitative Finance and
Accounting 25, no. 3 (2005): 255–75.
Leon, Carlos, and Clara Machado. “Designing an Expert Knowledge-Based Systemic Importance
Index for Financial Institutions.” Borradores de Economia 669 (2011).
Li, Aihua, Yong Shi, Jing He and Yanchun Zhang. “A Fuzzy Linear Programming-Based
Classification Method.” International Journal of Information Technology and Decision Making 10,
no. 6 (2011): 1161–74.
©2013 Casualty Actuarial Society, Canadian Institute of Actuaries, Society of Actuaries, All Rights Reserved
Page 53 of 59
Lin, Chin-Shien, Haider A. Khan, Ying-Chieh Wang and Ruei-Yuan Chang. “A New Approach to
Modeling Early Warning Systems for Currency Crises: Can a Machine-Learning Fuzzy Expert
System Predict the Currency Crises Effectively?” Journal of International Money and Finance 27,
no. 7 (2008): 1098–1121.
Magni, Carlo Alberto, Stefano Malagoli and Giovanni Mastroleo. “An Alternative Approach to Firms’
Evaluation: Expert Systems and Fuzzy Logic.” International Journal of Information Technology
and Decision Making 5, no. 1 (2006): 195–225.
Matsatsinis, M., K. Kosmidou, M. Doumpos and C. Zopounidis. “A Fuzzy Decision Aiding Method for
the Assessment of Corporate Bankruptcy.” Fuzzy Economic Review 3, no. 1 (2003): 13–23.
Mitchell, Tom M. Machine Learning. New York: McGraw-Hill, 1997: 52–127 and 154–200.
Muzzioli, Silvia, and Constanza Torricelli. “A Model for Pricing an Option with a Fuzzy Payoff.”
Fuzzy Economic Review 6, no. 1 (2001): 49–87.
Nelsen, Roger B. An Introduction to Copulas. 2nd ed. Springer Series in Statistics. New York: Springer,
2006: 109–55.
Ng, S. Thomas, Duc Thanh Luu, Swee Eng Chen and Ka Chi Lam. “Fuzzy Membership Functions of
Procurement Selection Criteria.” Construction Management and Economics 20, no. 2 (2002):
285–96.
Oliveira, Elizabeth Real de, and Manuela Castro e Silva. “A Political Economy Model of Regulation
Explained Through Fuzzy Logics.” European Regional Science Association Conference Paper
ersa04p189, 2004. http://www-sre.wu-wien.ac.at/ersa/ersaconfs/ersa04/PDF/189.pdf.
Pan, Heping. “Fuzzy Bayesian Networks: A General Formalism for Representation, Inference and
Learning with Hybrid Bayesian Networks.” (1998): 6–22.
http:/perso.telecom-paristech.fr/~chollet/Biblio/Articles/Domaines/BayesianNet/fuzzy-bayesian-n
etworks-a.pdf.
Pokoadi, Laszlo. “Fuzzy Logic-Based Risk Assessment.” Academic and Applied Research in Military
Science 1, no. 1 (2002): 63–73.
Reveiz, Alejando, and Carlos Leon. “Operational Risk Management using a Fuzzy Logic Inference
System.” Borradores de Economia 574 (2009): 9–24.
http://papers.ssrn.com/sol3/papers.cfm?abstract_id=1473614.
Shah, Samir. “Measuring Operational Risks using Fuzzy Logic Modeling.” (2003): 1-8,
Sivanandam, S. N., S. Sumathi and S. N. Deepa. Introduction to Fuzzy Logic using MATLAB. Berlin:
Springer, 2007: 277–320.
Smimou, Kamal. “Estimation of Canadian Commodity Market Risk Premiums Under Price Limits:
Two-Phase Fuzzy Approach.” Omega 34, no. 5 (2006): 477–91.
Su, EnDer and Yu-Gin Fen. “Applying the Structural Equation Model Rule-Based Fuzzy System with
Genetic Algorithm for Trading in Currency Market.” MPRA Working Paper 35474, Munich
Personal RePEc Archive, 2011.
http://mpra.ub.uni-muenchen.de/35474/1/MPRA_paper_35474.pdf.
Sun, Lili, and G. Cornelis van Kooten. “Fuzzy Logic and Preference Uncertainty in Non-Market
©2013 Casualty Actuarial Society, Canadian Institute of Actuaries, Society of Actuaries, All Rights Reserved
Page 54 of 59
Valuation.” Working Paper 2005-11, Resource Economics and Policy Analysis (REPA) Research
Group, Department of Economics, University of Victoria, 2005.
https://web.uvic.ca/~repa/publications/REPA%20working%20papers/WorkingPaper2005-11.pdf.
Sveshnikov, Sergey, and Victor Bocharnikov. “Modeling Risk of International Country Relations.”
MPRA Working Paper 15745, Munich Personal RePEc Archive, 2009.
http://mpra.ub.uni-muenchen.de/15745/1/MPRA_paper_15745.pdf.
Tucha, Thomas, and Markus Brem. “Fuzzy Transfer Pricing World: On the Analysis of Transfer
Pricing with Fuzzy Logic Techniques.” IIMA Working Paper 2005-12-03, Indian Institute of
Management, Ahmedabad, India, 2006.
Xu, Yelin, Yujie Lu, Albert P. C. Chan, Miroslaw J. Skibniewski and John F. Y. Yeung. “A
Computerized Risk Evaluation Model for Public-Private Partnership (PPP) Projects and Its
Application.” International Journal of Strategic Property Management 16, no. 2 (2012): 277–97.
Yu, Lean, Shouyang Wang and Kin Keung Lai. “An Intelligent-Agent-Based Fuzzy Group
Decision-Making Model for Financial Multicriteria Decision Support: The Case of Credit Scoring.”
European Journal of Operational Research 195, no. 3 (2009): 942–59.
Zadeh, Lotfi A. “Fuzzy Sets.” Information and Control 8 (1965): 338–53.
———. “Probability Measures of Fuzzy Events.” Journal of Mathematical Analysis and Applications
23, no. 2 (1968): 421–27.
Zhang, X., and F. Naghdy. “Human Motion Recognition through Fuzzy Hidden Markov Model.”
Research Online, University of Wollongong, 2005: 3–8.
http://ro.uow.edu.au/cgi/viewcontent.cgi?article=1468.
Zmeskal, Zdenek. “Generalised Soft Binomial American Real Option Pricing Model (Fuzzy-Stochastic
Approach).” European Journal of Operational Research 207, no. 2 (2010): 1096–1103.

©2013 Casualty Actuarial Society, Canadian Institute of Actuaries, Society of Actuaries, All Rights Reserved
Page 55 of 59
Appendix. The Use of Experience Data
In Section 5.3, the role of experience data is discussed. In this section, a simple example
is used to illustrate how experience data can be used to refine the model parameters or even
switch to a new model when the data is sufficient. The example and assumption used may not
make much sense in the business world, but it was chosen for ease of understanding.
Company ABC plans to provide personal mortgage loan services to its clients. Since it
does not have any experience, it uses a fuzzy logic model based on the inputs from
experienced credit analysts to make loan decisions.
Using information such as age, gender, income, current debt and job title, each loan
applicant will get a credit score. The credit score is then input into the fuzzy logic model to
assess the risk of default and make its loan decision. The initial model set up is given below.
Input Variable: Credit Score
Membership functions
53
30)(
2)3(
x
xx
x
High
4
43
32
0
20
)(1
)4(
1)2(
Medium
x
x
xx
x x
x
30
30)(
3)3(
x
xx
xLow
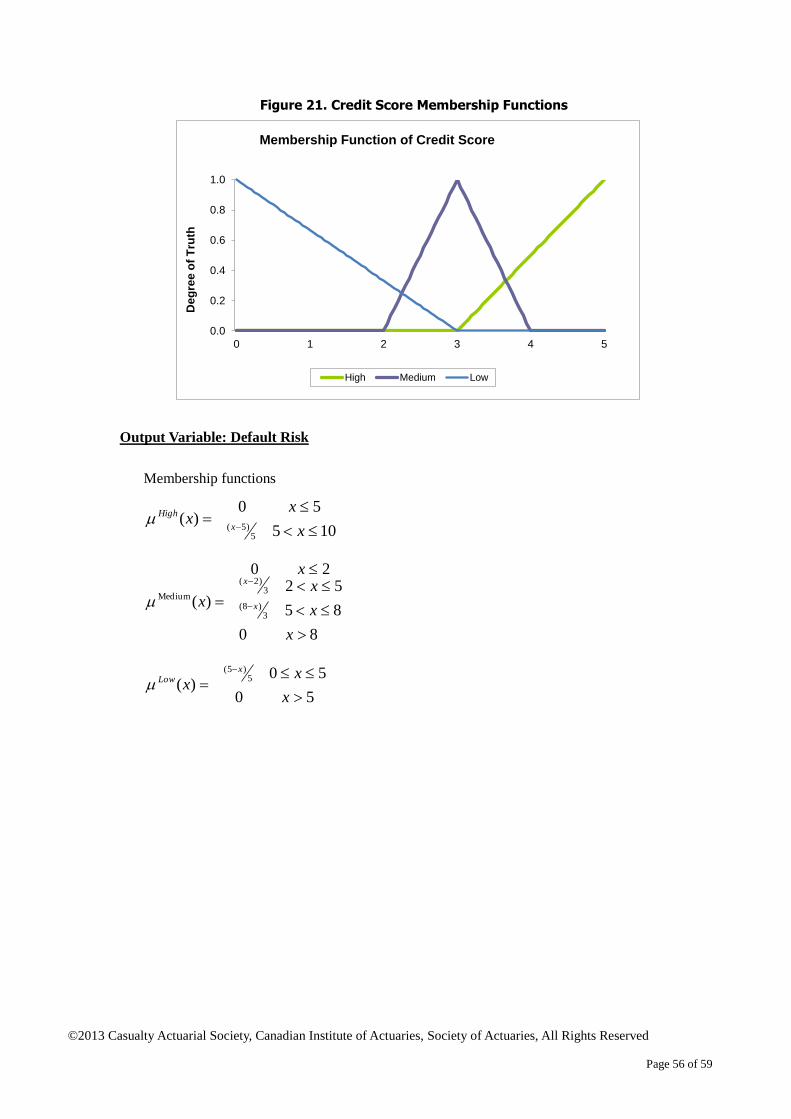
©2013 Casualty Actuarial Society, Canadian Institute of Actuaries, Society of Actuaries, All Rights Reserved
Page 56 of 59
Figure 21. Credit Score Membership Functions
Output Variable: Default Risk
Membership functions
105
50)(
5)5(
x
xx
x
High
8
85
52
0
20
)(3
)8(
3)2(
Medium
x
x
xx
x x
x
50
50)(
5)5(
x
xx
xLow
0.0
0.2
0.4
0.6
0.8
1.0
0 1 2 3 4 5
De
gre
e o
f T
ruth
Membership Function of Credit Score
High Medium Low
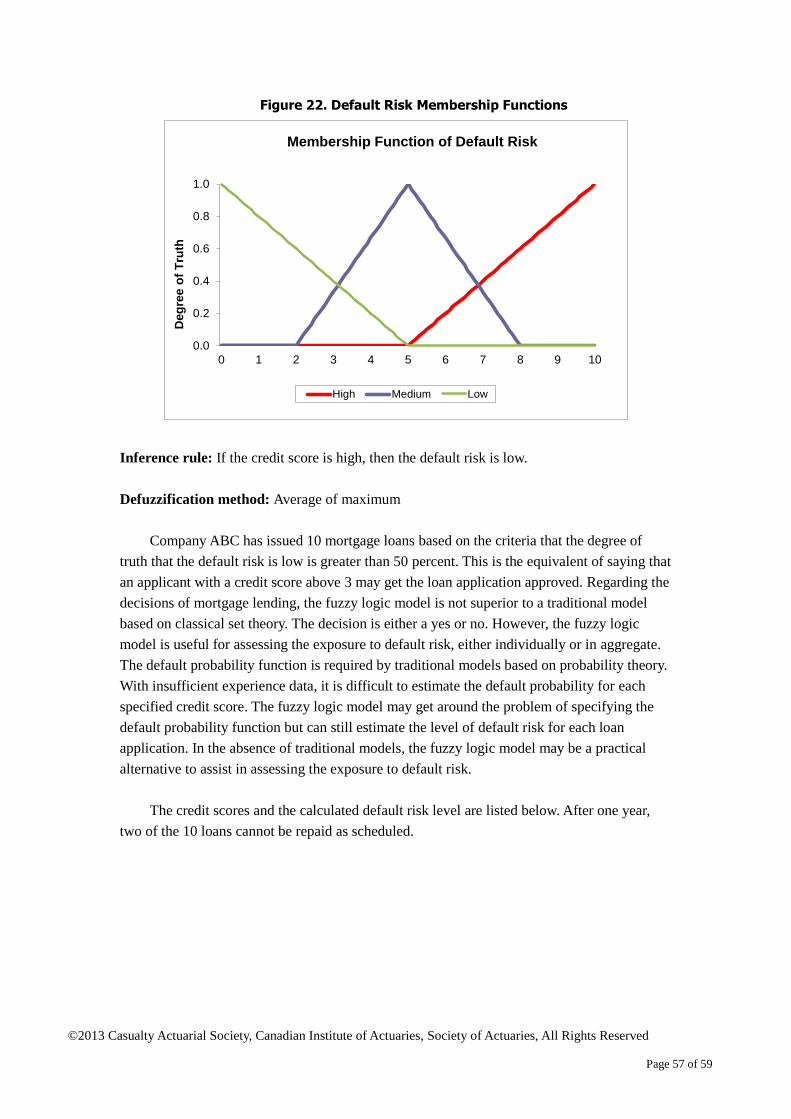
©2013 Casualty Actuarial Society, Canadian Institute of Actuaries, Society of Actuaries, All Rights Reserved
Page 57 of 59
Figure 22. Default Risk Membership Functions
Inference rule: If the credit score is high, then the default risk is low.
Defuzzification method: Average of maximum
Company ABC has issued 10 mortgage loans based on the criteria that the degree of
truth that the default risk is low is greater than 50 percent. This is the equivalent of saying that
an applicant with a credit score above 3 may get the loan application approved. Regarding the
decisions of mortgage lending, the fuzzy logic model is not superior to a traditional model
based on classical set theory. The decision is either a yes or no. However, the fuzzy logic
model is useful for assessing the exposure to default risk, either individually or in aggregate.
The default probability function is required by traditional models based on probability theory.
With insufficient experience data, it is difficult to estimate the default probability for each
specified credit score. The fuzzy logic model may get around the problem of specifying the
default probability function but can still estimate the level of default risk for each loan
application. In the absence of traditional models, the fuzzy logic model may be a practical
alternative to assist in assessing the exposure to default risk.
The credit scores and the calculated default risk level are listed below. After one year,
two of the 10 loans cannot be repaid as scheduled.
0.0
0.2
0.4
0.6
0.8
1.0
0 1 2 3 4 5 6 7 8 9 10
De
gre
e o
f T
ruth
Membership Function of Default Risk
High Medium Low
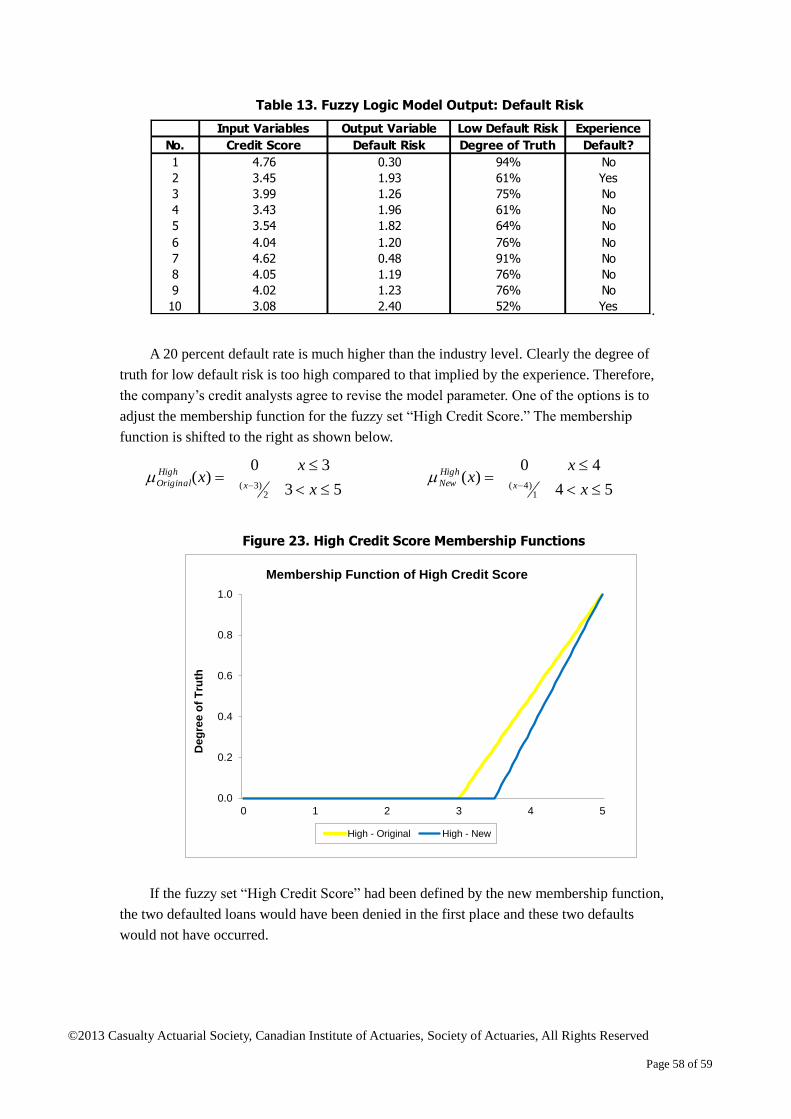
©2013 Casualty Actuarial Society, Canadian Institute of Actuaries, Society of Actuaries, All Rights Reserved
Page 58 of 59
Table 13. Fuzzy Logic Model Output: Default Risk
.
A 20 percent default rate is much higher than the industry level. Clearly the degree of
truth for low default risk is too high compared to that implied by the experience. Therefore,
the company’s credit analysts agree to revise the model parameter. One of the options is to
adjust the membership function for the fuzzy set “High Credit Score.” The membership
function is shifted to the right as shown below.
53
30)(
2)3(
x
xx
x
High
Original 54
40)(
1)4(
x
xx
x
High
New
Figure 23. High Credit Score Membership Functions
If the fuzzy set “High Credit Score” had been defined by the new membership function,
the two defaulted loans would have been denied in the first place and these two defaults
would not have occurred.
Input Variables Output Variable Low Default Risk Experience
No. Credit Score Default Risk Degree of Truth Default?
1 4.76 0.30 94% No
2 3.45 1.93 61% Yes
3 3.99 1.26 75% No
4 3.43 1.96 61% No
5 3.54 1.82 64% No
6 4.04 1.20 76% No
7 4.62 0.48 91% No
8 4.05 1.19 76% No
9 4.02 1.23 76% No
10 3.08 2.40 52% Yes
0.0
0.2
0.4
0.6
0.8
1.0
0 1 2 3 4 5
Deg
ree o
f T
ruth
Membership Function of High Credit Score
High - Original High - New

©2013 Casualty Actuarial Society, Canadian Institute of Actuaries, Society of Actuaries, All Rights Reserved
Page 59 of 59
Table 14. Revised Fuzzy Logic Model Output: Default Risk
Other options for model adjustment include adjusting the membership functions for the
output set and refining the inference rules by adding a fuzzy hedge or new rules. The goal,
however, should be the same in this case: reduce the degree of truth for low default risk
implied by the model.
Once sufficient experience data are available, more refined models may be used for loan
decision-making. For example, instead of relying on the experts’ opinions about the
membership functions, the models can be fully calibrated to the experience data.
Taking it a step further, models based on probability theory may be used to replace the
fuzzy logic model. The default probability can be modeled as a function of the credit score,
removing the process of fuzzification and defuzzification in the fuzzy logic model. The loan
decision can be made based on the estimated default probability. For example, each loan with
a probability of default less than 1 percent can be issued.
Input Variables Output Variable Low Default Risk Experience
No. Credit Score Default Risk Degree of Truth Default?
1 4.76 0.40 92% No
2 3.45 5.00 0% Yes
3 3.99 1.68 66% No
4 3.43 5.00 0% No
5 3.54 2.43 51% No
6 4.04 1.60 68% No
7 4.62 0.63 87% No
8 4.05 1.58 68% No
9 4.02 1.63 67% No
10 3.08 5.00 0% Yes