Complex Risk Analysis of Natural Hazards through Fuzzy Logic
6
Complex Risk Analysis of Natural Hazards through Fuzzy Logic P. Zlateva ISER, Bulgarian Academy of Sciences, Sofia 1113, Bulgaria Email: [email protected] D. Velev University of National and World Economy, Sofia 1700, Bulgaria Email: [email protected] Abstract—The paper presents a fuzzy logic approach to complex risk analysis in regard to each of the natural hazards for a given monitoring region. This approach is based on the available statistical data and the expert knowledge. The calculations of the complex risk are done for five regions in SW Bulgaria (Dupnitsa, Blagoevgrad, Simitli, Kresna and Sandanski). The proposed risk analysis is envisaged to be implemented as a part of a Web information system for risk management of natural disasters. Index Terms—risk analysis, fuzzy logic, natural hazards, Europe, SW Bulgaria I. INTRODUCTION Recently the negative impact of natural hazards on human life, economy and environment is increased [1]. Statistic data and scientific research show a growth in number and severity of natural disasters compared to previous years [2]. The annual losses resulting from floods, hurricanes, droughts, earthquakes, tornadoes, etc. cost billions of dollars. Despite the tremendous progress in science and technology, the natural hazards considerably affect to the socioeconomic conditions of all regions of the globe. The natural hazards are impossible to avoid, and infrastructure elements and communities cannot be made totally invulnerable. The only viable solution is the complex risk analysis and subsequent development of combination of mitigation and adaptation strategies [3]. There are many qualitative and quantitative methods for the risk analysis. However, it is necessary to point out, that the complex risk analysis from the natural hazards is done under the subjective and uncertain conditions. The fuzzy logic is an appropriate tool for risk analysis. This method provides adequate processing the expert knowledge and uncertain quantitative data [4], [5]. The purpose of the paper is to propose a fuzzy logic approach to complex risk analysis in regard to each of the Manuscript received July 25, 2013; revised September 30, 2013. This work was supported in part by the University of National and World Economy, Sofia, Bulgaria under Grant NI 1-8/2011. natural hazard for given monitoring region. This approach is based on the available statistical data and the expert knowledge. The proposed risk analysis is envisaged to be implemented as a part of a Web information system for risk management of natural disasters. This system can be successfully used in e-government [6]. II. AN APPROACH TO COMPLEX RISK ANALYSIS OF NATURAL HAZARDS THROUGH FUZZY LOGIC The idea is the approach to complex risk analysis to take into account quantitative and qualitative characteristics of all natural hazards in monitoring region. The approach is designed on basis of fuzzy logic and includes the following steps: Step 1: The basic sets and subsets for risk level of given region and severities of natural hazard are introduced and they are described in natural language: 1) Complete set of risk level of monitoring region R is divided into five subsets of the form: R 1 – subset “Very low level of regional risk”; R 2 - subset “Low level of regional risk”; R 3 - subset “Middle level of regional risk”; R 4 - subset “High level of regional risk”; R 5 - subset “Very high level of regional risk”. 2) Complete set of severity of natural hazard H is divided into five subsets of the form: VS – subset “Very small severity of natural hazard”; S - subset “Small severity of natural hazard”; M - subset “Middle severity of natural hazard”; B - subset “Big severity of natural hazard”; VB - subset “Very big severity of natural hazard”. Here and below it is assumed that the all elements of set R and D accept values in the interval [0, 10]. Step 2: The natural hazards (risk indicators) H={H i }, n i ,..., 1 , which are typical for monitored regions, are determined. 395 Journal of Advanced Management Science Vol. 1, No. 4, December 2013 ©2013 Engineering and Technology Publishing doi: 10.12720/joams.1.4.395-400
Transcript of Complex Risk Analysis of Natural Hazards through Fuzzy Logic

Complex Risk Analysis of Natural Hazards
through Fuzzy Logic
P. Zlateva ISER, Bulgarian Academy of Sciences, Sofia 1113, Bulgaria
Email: [email protected]
D. Velev
University of National and World Economy, Sofia 1700, Bulgaria
Email: [email protected]
Abstract—The paper presents a fuzzy logic approach to
complex risk analysis in regard to each of the natural hazards
for a given monitoring region. This approach is based on the
available statistical data and the expert knowledge. The
calculations of the complex risk are done for five regions in
SW Bulgaria (Dupnitsa, Blagoevgrad, Simitli, Kresna and
Sandanski). The proposed risk analysis is envisaged to be
implemented as a part of a Web information system for risk
management of natural disasters.
Index Terms—risk analysis, fuzzy logic, natural hazards,
Europe, SW Bulgaria
I. INTRODUCTION
Recently the negative impact of natural hazards on
human life, economy and environment is increased [1].
Statistic data and scientific research show a growth in
number and severity of natural disasters compared to
previous years [2].
The annual losses resulting from floods, hurricanes,
droughts, earthquakes, tornadoes, etc. cost billions of
dollars. Despite the tremendous progress in science and
technology, the natural hazards considerably affect to the
socioeconomic conditions of all regions of the globe.
The natural hazards are impossible to avoid, and
infrastructure elements and communities cannot be made
totally invulnerable. The only viable solution is the
complex risk analysis and subsequent development of
combination of mitigation and adaptation strategies [3].
There are many qualitative and quantitative methods for
the risk analysis. However, it is necessary to point out, that
the complex risk analysis from the natural hazards is done
under the subjective and uncertain conditions. The fuzzy
logic is an appropriate tool for risk analysis. This method
provides adequate processing the expert knowledge and
uncertain quantitative data [4], [5].
The purpose of the paper is to propose a fuzzy logic
approach to complex risk analysis in regard to each of the
Manuscript received July 25, 2013; revised September 30, 2013.
This work was supported in part by the University of National and
World Economy, Sofia, Bulgaria under Grant NI 1-8/2011.
natural hazard for given monitoring region. This approach
is based on the available statistical data and the expert
knowledge.
The proposed risk analysis is envisaged to be
implemented as a part of a Web information system for risk
management of natural disasters. This system can be
successfully used in e-government [6].
II. AN APPROACH TO COMPLEX RISK ANALYSIS OF
NATURAL HAZARDS THROUGH FUZZY LOGIC
The idea is the approach to complex risk analysis to take
into account quantitative and qualitative characteristics of
all natural hazards in monitoring region.
The approach is designed on basis of fuzzy logic and
includes the following steps:
Step 1: The basic sets and subsets for risk level of
given region and severities of natural hazard are
introduced and they are described in natural
language:
1) Complete set of risk level of monitoring region R is divided into five subsets of the form:
R1 – subset “Very low level of regional risk”;
R2 - subset “Low level of regional risk”;
R3 - subset “Middle level of regional risk”;
R4 - subset “High level of regional risk”;
R5 - subset “Very high level of regional risk”.
2) Complete set of severity of natural hazard H is
divided into five subsets of the form:
VS – subset “Very small severity of natural
hazard”;
S - subset “Small severity of natural hazard”;
M - subset “Middle severity of natural hazard”;
B - subset “Big severity of natural hazard”;
VB - subset “Very big severity of natural hazard”.
Here and below it is assumed that the all elements of set
R and D accept values in the interval [0, 10].
Step 2: The natural hazards (risk indicators)
H={Hi}, ni ,...,1 , which are typical for monitored
regions, are determined.
395
Journal of Advanced Management Science Vol. 1, No. 4, December 2013
©2013 Engineering and Technology Publishingdoi: 10.12720/joams.1.4.395-400

Step 3: The corresponding degree of importance in
the risk analysis i is assigned to each natural
hazard Hi. In order to appreciate this degree, it is
necessary to arrange all the hazards in decreasing
importance so as to satisfy the rule
0...21 n and 1
1
n
i
i (1)
If all indicators are equal importance, then
ni
1 , ni ,...,1 (2)
Step 4: A classification of the current value r of the
level of regional risk as a criterion to split the set R
into fuzzy subsets is constructed (see Table I).
Step 5: The membership function “severity of
natural hazard” for each value of hazard variable H
is calculated
Each hazard variable iH , ni ,...,1 has a
corresponding membership function ij , 5,...,1j to the
five fuzzy subsets.
The membership functions ij are defined with the
following formulae:
102.50,
2.51.5,- 2.5
5.1 0,1
1
i
ii
i
i
H
HH
H
μ
104.50,
4.53.5,-4.5
3.52.51,
2.51.55,.1
1.50,0
2
i
ii
i
ii
i
i
H
HH
H
HH
H
μ
106.50,
6.55.5,-6.5
5.54.51,
4.53.55,.3
3.50,0
3
i
ii
i
ii
i
i
H
HH
H
HH
H
μ
108.50,
8.57.5,-8.5
7.56.51,
6.55.55,.5
5.50,0
4
i
ii
i
ii
i
i
H
HH
H
HH
H
μ
108.51,
8.57.5,5.7
5.7 0,0
5
i
ii
i
i
H
HH
H
μ
(3)
It are carried out the calculation of the values of the five
membership functions “severity of natural hazard” ijk in
regard to each of the natural hazard Hi, ni ,...,1
for each of the monitoring regions Xk, mk ,...,1 .
The results are presented in tables for each of the natural
hazard, as shown in Table II.
TABLE I. RISK LEVEL CLASSIFICATION OF MONITORING REGION
Risk value
interval, r
Classification of
the risk level, Ri
Membership function of
the risk level, i
0 r 1.5 R1 1
1.5 < r < 2.5 R1 1 = 2.5 - r
R2 1- 1 = 2
2.5 r 3.5 R2 1
3.5 < r < 4.5 R2 2 = 4.5 - r
R3 1- 2 = 3
4.5 r 5.5 R3 1
5.5< r < 6.5 R3 3 = 6.5 - r
R4 1- 3 = 4
6.5 r 7.5 R4 1
7.5 < r < 8.5 R4 4 = 8.5 - r
R5 1- 4 = 5
8.5 r 10 R5 1
Step 6: The value r of the “level of regional risk" in
regard to all the considered natural hazards for each
of the monitoring regions is calculated
The value rk of the “level of regional risk" in regard to
all the considered natural hazards Hi, ni ,...,1 for each of
the monitoring regions Xk, mk ,...,1 are determined as
follows
n
i
ijk
i
j
jkr
1
5
1
5
1j
kjjq ,
5
1i
ijijq (4)
A node point vector ,,,,, 54321 is
introduced. In this investigation the node point vector has
following elements 9,7,5,3,1 .
TABLE II. MEMBERSHIP FUNCTIONS OF iHFOR MONITORING
REGIONS
No Monitorin
g region, X
Membership functions of iH
VS S M B VB
1. X1 11i 2
1i 3
1i 4
1i 5
1i
2. …
3. Xk 1ik 2i
k 3ik 4i
k 5ik
4. …
5. Xm 1im 2i
m 3im 4i
m 5im
Step 7: The linguistic classification of the risk level
of monitoring regions in regard to all the considered
natural hazards is carried out.
The calculated value r of the variable “level of regional
risk" is classifies on the basis of the data in Table I.
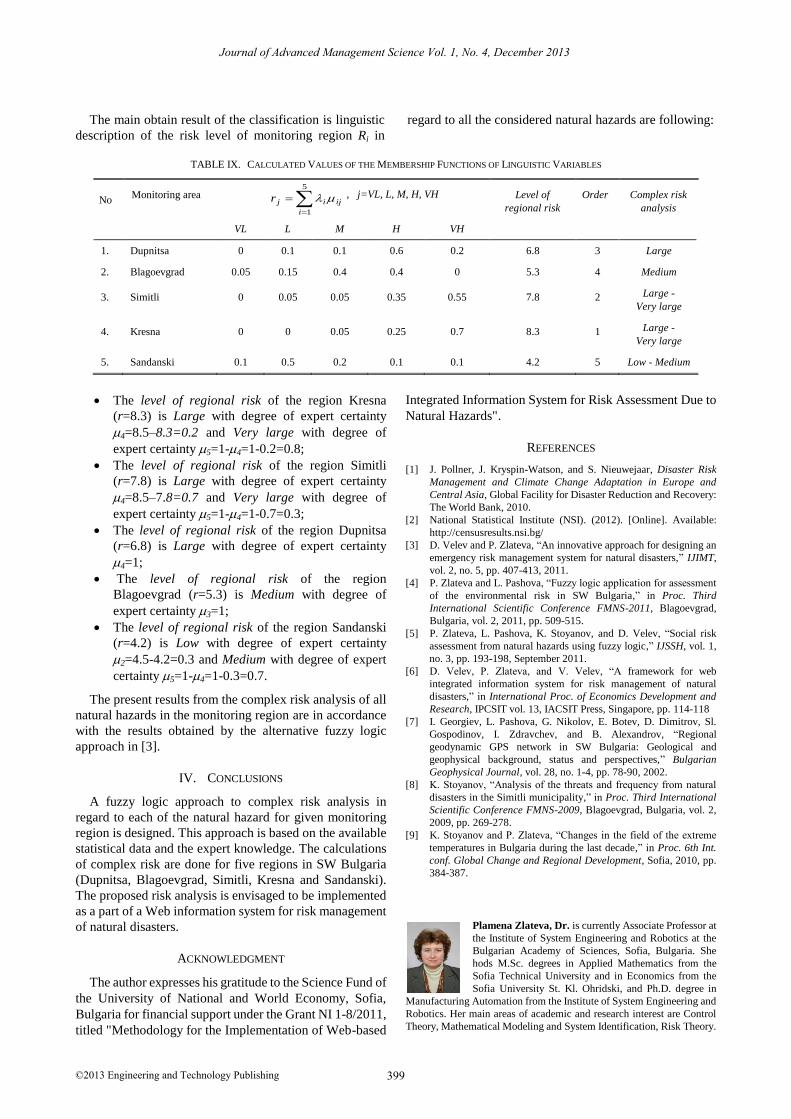
The main result of the classification is linguistic
description of the risk level of monitoring region Ri in
regard to all the considered natural hazards. Additional
result is the degree of expert certainty in the correctness of
396
Journal of Advanced Management Science Vol. 1, No. 4, December 2013
©2013 Engineering and Technology Publishing

the classification which is given by value of corresponding
membership function i.
Thus the conclusion about “level of regional risk”
acquires not only linguistic form, but also characterization
for the reliability of this assertion.
III. A COMPLEX RISK ANALYSIS OF NATURAL HAZARDS
FOR DIFFERENT REGIONS IN SOUTHWESTERN
BULGARIA
Bulgaria is located on the Balkan Peninsula,
Southeastern Europe (see Fig. 1). It is exposed to natural
hazards, such as earthquakes, floods, landslides, debris
flows, forest fires, hail storms, rock falls, snow avalanches,
storm surge, wind storms, extreme temperature.
In particular, the Southwestern (SW) part of the country
is the district with the most expressed tectonic and
seismotectonic activity on the whole territory of the
country. Besides the seismic activity, the simultaneously
influence of many endogenous and exogenous factors
(recent vertical crustal movements, erosion and ground
water level fluctuations) provoke the activation of
gravitational processes.
Over the last century several big and destructive
landslides have been observed with different degree of the
landslide hazard, as part of them happened in SW Bulgaria.
In this district the manifestation of active landslides and
mud-rock falls can be closely connected with the
contemporary tectonic activity, the erosion and the
rainfalls [7].
The studied middle valley of the Struma River is
characterized by a transition between the
moderate-continental and continental-Mediterranean
climate. Its main features are: long, hot and dry summers;
mild and wet winters. The mean annual temperatures vary
between 120C to 14
0C from north to south for the studied
area [8].
The rainfalls are relatively low 500-650 mm and are
unevenly distributed. They are rare, but intense with
overflowing character. These rainfalls in combination with
easily-disintegrated rock cause the intense erosion,
mud-rock flows and floods.
High summer temperatures, which frequency over the
last decade increases, are a serious danger for the
population. Throughout in the flat part of the Struma valley
the annual maximum temperatures reach 38-400C. In very
hot summers of 2000, 2006, 2007 and 2009 the absolute
values over 400C are reported, for example in Sandanski -
44.60C (2007). In the last decade the average maximum
temperature for this town is about 40.30C [9].
In this Southwestern part of Bulgaria the international
transport corridor № 4, connecting Western with Eastern
Europe is situated (see Fig. 1). This corridor is formed
from the highway I-1 /E-79/ of the national transport
system and the V-th
main railway line. The E79 highway,
railway line and gas pipeline along the Struma River are a
part of the national critical infrastructure.
In present paper, the proposed approach for complex
risk analysis of natural hazards through fuzzy logic is
applied to five regions in SW Bulgaria: Dupnitsa,
Blagoevgrad, Simitli, Kresna, and Sandanski.
The complex risk analysis is performed in respect to the
following natural hazards: Seismic, Landslides, Mud rock,
Extreme temperature and Floods.
In particular according to the proposed approach is valid:
X1=Dupnitsa, X2=Blagoevgrad, X3=Simitli, X4=Kresna,
and X5=Sandanski.
Figure 1. Location of the monitored regions.
E U R O P E
397
Journal of Advanced Management Science Vol. 1, No. 4, December 2013
©2013 Engineering and Technology Publishing

TABLE III. NATURAL HAZARDS AND MONITORING REGIONS
No Natural hazard, Hi Dupnitsa Blagoevgrad Simitli Kresna Sandanski
1. Seismic 7 6 8 10 3
2. Landslides 8 6 9 7 6
3. Mud rock 8 6 8 10 4
4. Extreme temperature 3 3 4 6 10
5. Floods 5 2 8 10 1
The regions are assessed using quantity statistical data
and quality expert evaluations as given in Table III.
It is assigned to each natural hazard Hi, 5,...,1i the
corresponding degree of importance in the risk analysis i .
Here the hazards are arranged in decreasing importance as
follows: Seismic > Landslides = Mud rock > Extreme
temperature = Floods.
Therefore, the above assertion can be overwritten as:
H1 > H2 = H3 >H4 = H5 (5)
where H1=Seismic, H2=Landslides, H3=Mud rock,
H4=Extreme temperature and H5=Floods.
In this case the corresponding importance degrees of
natural hazards in the risk analysis are assigned as follows:
4.01 ; 2.02 ; 2.03 ; 1.04 ; 1.05 (6)
The calculation of the values of the five membership
functions “severity of natural hazard” ijk in regard to
each of the natural hazard Hi, 5,...,1i for each of the
monitoring regions Xk, 5,...,1k are carried out using the
formulae (5) and condition (6). The calculated values of
the membership functions are presented for each of the
natural hazard Hi, 5,...,1i in the corresponding tables:
from Table III to Table VIII.
TABLE IV. MEMBERSHIP FUNCTIONS OF 1H AND MONITORING
REGIONS
No Monitoring region Membership functions of 1H
VS S M B VB
1. Dupnitsa 0 0 0 1 0
2. Blagoevgrad 0 0 0.5 0.5 0
3. Simitli 0 0 0 0.5 0.5
4. Kresna 0 0 0 0 1
5. Sandanski 0 1 0 0 0
TABLE V. MEMBERSHIP FUNCTIONS OF 2H AND MONITORING
REGIONS
No Monitoring region Membership functions of 2H
VS S M B VB
1. Dupnitsa 0 0 0 0.5 0.5
2. Blagoevgrad 0 0 0.5 0.5 0
3. Simitli 0 0 0 0 1
4. Kresna 0 0 0 1 0
5. Sandanski 0 0 0.5 0.5 0
TABLE VI. MEMBERSHIP FUNCTIONS OF 3H AND MONITORING
REGIONS
No Monitoring region Membership functions of 3H
VS S M B VB
1. Dupnitsa 0 0 0 0.5 0.5
2. Blagoevgrad 0 0 0.5 0.5 0
3. Simitli 0 0 0 0.5 0.5
4. Kresna 0 0 0 0 1
5. Sandanski 0 0.5 0.5 0 0
TABLE VII. MEMBERSHIP FUNCTIONS OF 4H AND MONITORING
REGIONS
No Monitoring region Membership functions of 4H
VS S M B VB
1. Dupnitsa 0 1 0 0 0
2. Blagoevgrad 0 1 0 0 0
3. Simitli 0 0.5 0.5 0 0
4. Kresna 0 0 0.5 0.5 0
5. Sandanski 0 0 0 0 1
TABLE VIII. MEMBERSHIP FUNCTIONS OF 5H AND MONITORING
REGIONS
No Monitoring regions Membership functions of 5H
VS S M B VB
1. Dupnitsa 0 0 1 0 0
2. Blagoevgrad 0.5 0.5 0 0 0
3. Simitli 0 0 0 0.5 0.5
4. Kresna 0 0 0 0 1
5. Sandanski 1 0 0 0 0
The value rk of the “level of regional risk" in regard to
all the considered natural hazards Hi, 5,...,1i for each of
the monitoring regions Xk, 5,...,1k are determined using
(4) and obtained results as follows:
5
1
5
1 i
ijk
i
j
jkr
5
1j
kjj q
, 5,...,1k , (7)
where ,,,,, 54321 9,7,5,3,1 .
The calculated values of the membership functions of
linguistic variable “level of regional risk", rk 5,...,1k are
given in Table IX.
398
Journal of Advanced Management Science Vol. 1, No. 4, December 2013
©2013 Engineering and Technology Publishing
The main obtain result of the classification is linguistic
description of the risk level of monitoring region Ri in
regard to all the considered natural hazards are following:
TABLE IX. CALCULATED VALUES OF THE MEMBERSHIP FUNCTIONS OF LINGUISTIC VARIABLES
No Monitoring area
5
1i
ijijr , j=VL, L, M, H, VH Level of
regional risk
Order Complex risk
analysis
VL L M H VH
1. Dupnitsa 0 0.1 0.1 0.6 0.2 6.8 3 Large
2. Blagoevgrad 0.05 0.15 0.4 0.4 0 5.3 4 Medium
3. Simitli 0 0.05 0.05 0.35 0.55 7.8 2 Large -
Very large
4. Kresna 0 0 0.05 0.25 0.7 8.3 1 Large -
Very large
5. Sandanski 0.1 0.5 0.2 0.1 0.1 4.2 5 Low - Medium
The level of regional risk of the region Kresna
(r=8.3) is Large with degree of expert certainty
4=8.5–8.3=0.2 and Very large with degree of
expert certainty 5=1-4=1-0.2=0.8;
The level of regional risk of the region Simitli
(r=7.8) is Large with degree of expert certainty
4=8.5–7.8=0.7 and Very large with degree of
expert certainty 5=1-4=1-0.7=0.3;
The level of regional risk of the region Dupnitsa
(r=6.8) is Large with degree of expert certainty
4=1;
The level of regional risk of the region
Blagoevgrad (r=5.3) is Medium with degree of
expert certainty 3=1;
The level of regional risk of the region Sandanski
(r=4.2) is Low with degree of expert certainty
2=4.5-4.2=0.3 and Medium with degree of expert
certainty 5=1-4=1-0.3=0.7.
The present results from the complex risk analysis of all
natural hazards in the monitoring region are in accordance
with the results obtained by the alternative fuzzy logic
approach in [3].
IV. CONCLUSIONS
A fuzzy logic approach to complex risk analysis in
regard to each of the natural hazard for given monitoring
region is designed. This approach is based on the available
statistical data and the expert knowledge. The calculations
of complex risk are done for five regions in SW Bulgaria
(Dupnitsa, Blagoevgrad, Simitli, Kresna and Sandanski).
The proposed risk analysis is envisaged to be implemented
as a part of a Web information system for risk management
of natural disasters.
ACKNOWLEDGMENT
The author expresses his gratitude to the Science Fund of
the University of National and World Economy, Sofia,
Bulgaria for financial support under the Grant NI 1-8/2011,
titled "Methodology for the Implementation of Web-based
Integrated Information System for Risk Assessment Due to
Natural Hazards".
REFERENCES
[1] J. Pollner, J. Kryspin-Watson, and S. Nieuwejaar, Disaster Risk
Management and Climate Change Adaptation in Europe and
Central Asia, Global Facility for Disaster Reduction and Recovery:
The World Bank, 2010.
[3] D. Velev and P. Zlateva, “An innovative approach for designing an
emergency risk management system for natural disasters,” IJIMT,
vol. 2, no. 5, pp. 407-413, 2011.
[4] P. Zlateva and L. Pashova, “Fuzzy logic application for assessment
of the environmental risk in SW Bulgaria,” in Proc. Third
International Scientific Conference FMNS-2011, Blagoevgrad,
Bulgaria, vol. 2, 2011, pp. 509-515.
[5] P. Zlateva, L. Pashova, K. Stoyanov, and D. Velev, “Social risk
assessment from natural hazards using fuzzy logic,” IJSSH, vol. 1,
no. 3, pp. 193-198, September 2011.
[6] D. Velev, P. Zlateva, and V. Velev, “A framework for web
integrated information system for risk management of natural
disasters,” in International Proc. of Economics Development and
Research, IPCSIT vol. 13, IACSIT Press, Singapore, pp. 114-118
[7] I. Georgiev, L. Pashova, G. Nikolov, E. Botev, D. Dimitrov, Sl.
Gospodinov, I. Zdravchev, and B. Alexandrov, “Regional
geodynamic GPS network in SW Bulgaria: Geological and
geophysical background, status and perspectives,” Bulgarian
Geophysical Journal, vol. 28, no. 1-4, pp. 78-90, 2002.
[8] K. Stoyanov, “Analysis of the threats and frequency from natural
disasters in the Simitli municipality,” in Proc. Third International
Scientific Conference FMNS-2009, Blagoevgrad, Bulgaria, vol. 2,
2009, pp. 269-278.
[9] K. Stoyanov and P. Zlateva, “Changes in the field of the extreme
temperatures in Bulgaria during the last decade,” in Proc. 6th Int.
conf. Global Change and Regional Development, Sofia, 2010, pp.
384-387.
Plamena Zlateva, Dr. is currently Associate Professor at
the Institute of System Engineering and Robotics at the
Bulgarian Academy of Sciences, Sofia, Bulgaria. She
hods M.Sc. degrees in Applied Mathematics from the
Sofia Technical University and in Economics from the
Sofia University St. Kl. Ohridski, and Ph.D. degree in
Manufacturing Automation from the Institute of System Engineering and
Robotics. Her main areas of academic and research interest are Control
Theory, Mathematical Modeling and System Identification, Risk Theory.
399
Journal of Advanced Management Science Vol. 1, No. 4, December 2013
©2013 Engineering and Technology Publishing
[2] National Statistical Institute (NSI). (2012). [Online]. Available:
http://censusresults.nsi.bg/

Dimiter Velev, Dr. is a Professor in the Department of
Information Technologies and Communications at the
University of National and World Economy, Sofia,
Bulgaria. He holds M.Sc. degree in Electro- engineering
from the Sofia Technical University, Bulgaria and Ph.D.
degree in Engineering Sciences from the Institute of
Modeling Problems in Power Engineering at the National Academy of
Sciences of Ukraine, Kiev, Ukraine. His main areas of academic and
research interest are Internet-Based Business Systems Modeling and
Development, Service Oriented Architectures, Online Social Networks,
Cloud Computing, Web Applications Development and Programming.
His lectures cover such disciplines.
400
Journal of Advanced Management Science Vol. 1, No. 4, December 2013
©2013 Engineering and Technology Publishing