APPLYING FACIAL EMOTION RECOGNITION TO USABILITY ...
42
APPLYING FACIAL EMOTION RECOGNITION TO USABILITY EVALUATIONS TO REDUCE ANALYSIS TIME A Thesis presented to the Faculty of California Polytechnic State University, San Luis Obispo In Partial Fulfillment of the Requirements for the Degree Master of Science in Computer Science by Gavin Kam Chao June 2021
Transcript of APPLYING FACIAL EMOTION RECOGNITION TO USABILITY ...
APPLYING FACIAL EMOTION RECOGNITION TO USABILITY EVALUATIONS
TO REDUCE ANALYSIS TIME
A Thesis
presented to
the Faculty of California Polytechnic State University,
San Luis Obispo
In Partial Fulfillment
of the Requirements for the Degree
Master of Science in Computer Science
by
Gavin Kam Chao
June 2021

ii
© 2021
Gavin Kam Chao
ALL RIGHTS RESERVED
iii
COMMITTEE MEMBERSHIP
TITLE: Applying Facial Emotion Recognition to
Usability Evaluations to Reduce Analysis
Time
AUTHOR:
Gavin Kam Chao
DATE SUBMITTED:
June 2021
COMMITTEE CHAIR:
Franz Kurfess, Ph.D.
Professor of Computer Science
COMMITTEE MEMBER: Dongfeng Fang, Ph.D.
Professor of Computer Science
COMMITTEE MEMBER:
Sandrine Fischer, Ph.D.
Human-Computer Interaction Researcher
iv
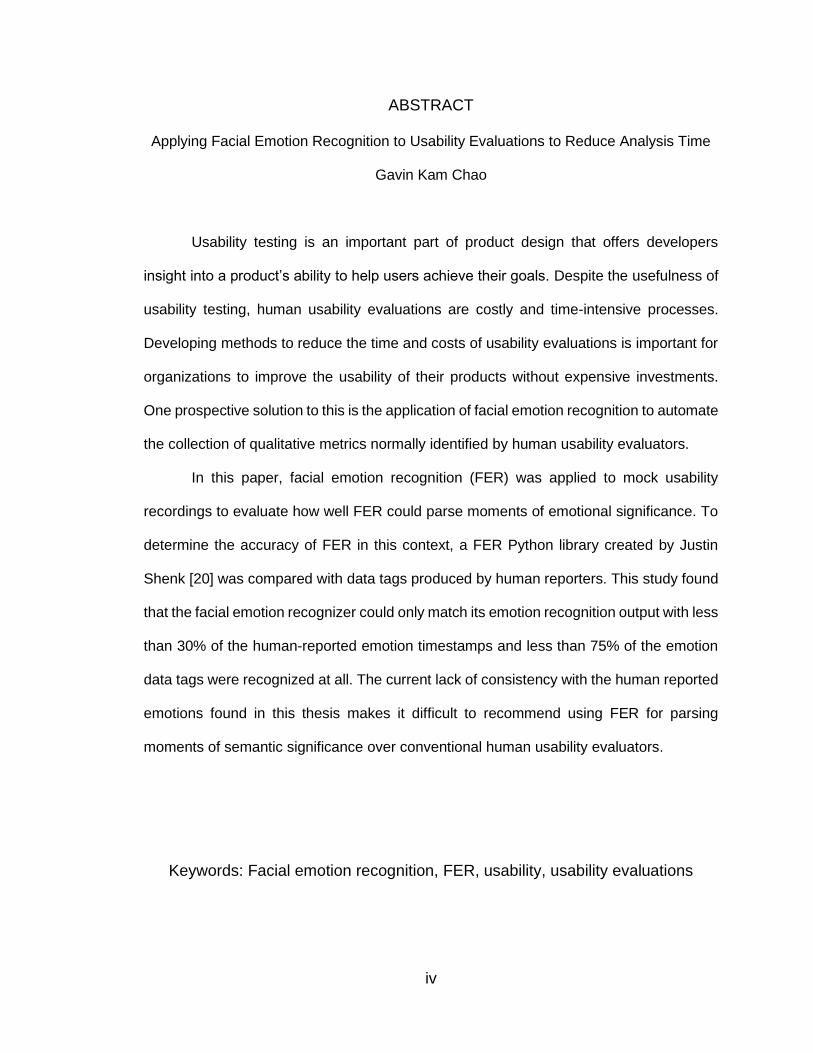
ABSTRACT
Applying Facial Emotion Recognition to Usability Evaluations to Reduce Analysis Time
Gavin Kam Chao
Usability testing is an important part of product design that offers developers
insight into a product’s ability to help users achieve their goals. Despite the usefulness of
usability testing, human usability evaluations are costly and time-intensive processes.
Developing methods to reduce the time and costs of usability evaluations is important for
organizations to improve the usability of their products without expensive investments.
One prospective solution to this is the application of facial emotion recognition to automate
the collection of qualitative metrics normally identified by human usability evaluators.
In this paper, facial emotion recognition (FER) was applied to mock usability
recordings to evaluate how well FER could parse moments of emotional significance. To
determine the accuracy of FER in this context, a FER Python library created by Justin
Shenk [20] was compared with data tags produced by human reporters. This study found
that the facial emotion recognizer could only match its emotion recognition output with less
than 30% of the human-reported emotion timestamps and less than 75% of the emotion
data tags were recognized at all. The current lack of consistency with the human reported
emotions found in this thesis makes it difficult to recommend using FER for parsing
moments of semantic significance over conventional human usability evaluators.
Keywords: Facial emotion recognition, FER, usability, usability evaluations

v
ACKNOWLEDGMENTS
I would like to thank:
• My advisor, Dr. Franz Kurfess for his guidance and support throughout my study.
• My committee members Dr. Phoenix (Dongfeng) Fang and Dr. Sandrine Fischer
for their assistance and expertise that provided much needed insight.
• Erin Sheets for her help with creating a dataset we could use in our thesis.
• Kelsi Van Damme for working with me on a complementary thesis and her overall
friendship throughout my time at Cal Poly.
• My family, who supported me in everything that I’ve done.
vi
TABLE OF CONTENTS Page
LIST OF TABLES ............................................................................................................. vii LIST OF FIGURES .......................................................................................................... viii
CHAPTER
1. INTRODUCTION ........................................................................................................... 1 2. BACKGROUND ............................................................................................................. 4 2.1 Usability Evaluations .............................................................................................. 4 2.2 Facial Emotion Recognition .................................................................................. 5
2.2.1 Convolutional Neural Networks ................................................................... 6 3. RELATED WORKS ...................................................................................................... 7 3.1 Automatic vs Crowdsourced Sentiment Analysis ................................................ 7 3.2 A Comparison of Students’ Emotional Self-Reports with Automated Facial Emotion Recognition ................................................................................... 8 3.3 Toward Usability Problem Identification Based on User Emotions Derived from Facial Expressions ......................................................................... 8 3.4 Discussion of Related Works ................................................................................ 9 4. METHODOLOGY ...................................................................................................... 11 4.1 Gathering Data .................................................................................................... 11 4.1.1 Finding Participants ................................................................................... 11 4.1.2 Assigning Usability Tasks ......................................................................... 13 4.1.3 Emotion Timestamps for Usability Task Recordings .............................. 16 4.2 Experiments on Data .......................................................................................... 16 5. RESULTS AND DISCUSSION ................................................................................ 19 5.1 Metrics Used to Analyze Results ....................................................................... 20 5.1.1 Precision ..................................................................................................... 21 5.1.2 Recall .......................................................................................................... 21 5.2 fer Without Focus on Modality ........................................................................... 21 5.3 fer Based on Modality in Data Tags .................................................................. 22 5.4 fer in Emotion Matching for Each Modality........................................................ 24 5.5 Processing Time ................................................................................................. 25 6. LIMITATIONS AND FUTURE WORK ..................................................................... 27 6.1 Limitations............................................................................................................ 27 6.2 Future Work......................................................................................................... 27 7. CONCLUSION ........................................................................................................... 29 REFERENCES ............................................................................................................... 31
vii
LIST OF TABLES
Table Page
4.1 Tasks for Each Website .................................................................................. …...…14
5.1 Recall for ‘Finding’ Timestamps and Matching Emotions/Sentiment Without
Regarding Modality of the Data Tags ............................................................................ 22
5.2 Timestamps ‘Found’ By Modality ............................................................................. 23
5.3 Emotion Matching By Modality ................................................................................. 24
5.4 Visual and Both Modality Precision.......................................................................... 25
5.5 Comparison of Processing Time and Video Recording Length ............................ 26
viii
LIST OF FIGURES
Figure Page
4.1 Example of the Recording Structure .................................................................... …15
4.2 Example of an Excel File With Data Tags ............................................................... 16
4.3 An Example of a Processed Image Using the fer Library ...................................... 17
1
Chapter 1
INTRODUCTION
Adults in the United States are increasing their usage of smartphones and other
internet-connected devices. The Pew Research Center reports that nearly a third of U.S.
adults report almost constantly being online and 85% of Americans go online on a daily
basis [1]. With such a wide market of consumers, usability of these types of products has
become an important aspect to capture their interest for as long as possible. Usability is
especially important for websites, which need to quickly and easily provide their users
with the content they are looking for [3]. There are hundreds of websites and software
that serve the same purpose and they must all compete to maintain a population of
users to sustain their business. 73% of consumers stated that content “must display well
on the device” or else they would give up on the content [2]. Thus, companies spend 60-
90 minutes per user test to gather usability data [4] to improve the usability of their
products. The recent pandemic has reduced the possible methods for usability testing,
as in-person testing has become much more difficult to conduct. There are usability
testing methods that are relatively unaffected by the COVID-19 pandemic as they can be
conducted over the internet with a standard web camera and screen recorder. These
types of usability evaluation will require usability evaluators to review various recordings
from participants during the usability testing rather than analyzing and interacting with
participants in real-time. However, reviewing these recordings may be tedious and may
not be fruitful by the end of a review. Automating usability evaluation analysis can
quickly show immediate insights without needing the usability evaluator to review all the
recordings one at a time.
At the moment, there are some solutions available for automating usability
evaluations. One solution leverages opinion mining to collect user text responses to be
2
processed and return data based on positive and negative input about the software [7].
Others have resorted to capture the actions a test user takes while using the software
[6]. Automated evaluation performance has also been tested with online usability
evaluators [6] and Handheld User Interface (HUI) analyzers [5]. However, HUI analyzer
solutions rely on analyzing user interfaces (UI) without user input about their experience
with the UI or their general opinion about the appearance of the UI. Opinion mining
methods would be able to quickly analyze collected responses from users, but text-
based responses will only include user-reported opinions and may not include initial user
reactions that cannot be captured by user reviews. An automatic method that can collect
how a user feels during usability testing could show how the users feel about the
usability of the software without needing them to self-report it. One common method to
view emotions is with facial emotion recognition.
In this paper, I analyze the usefulness of using facial emotion recognition (FER)
to detect moments of interest in a mock usability evaluation. A facial emotion recognition
method is intended to be used by usability evaluators to discover possible insights
through the detected facial expressions to reduce the total amount of video scrubbing
required to analyze the recording. This method should automatically mark possible
moments of interest for usability experts to reduce the time required to find important
moments that would help inform the usability of their current system. Compared to other
systems, the facial emotion recognition method would be used to help simplify the
analysis process, rather than an automated tool to perform the evaluations for the
usability experts.
This paper provides two contributions: an analysis of how well facial emotion
recognition can identify emotional moments recognized by human evaluators; and a
small dataset that contains recordings of usability testing and associated human-created
data tags that list the emotions found in recordings, the timestamp when those emotions
3
occur, the sentiment score given to that timestamp, and the modality that was used to
identify the emotion. The rest of this paper will be structured as follows: Chapter 2 will
have background information about usability evaluations, the significance of conducting
usability testing, and an overview of facial emotion recognition; Chapter 3 will discuss
related works that cover topics such as automating usability testing and the use of facial
emotion recognition in similar spaces; Chapter 4 will explain the methodology of my data
gathering process and experiment; Chapter 5 will provide an overview of the results of
the experiments and a discussion of the results; Chapter 6 will detail the limitations of
this study and possible avenues for future work; finally, Chapter 7 will conclude the
thesis with a summary of the paper and my final thoughts.
4
Chapter 2
BACKGROUND
2.1 Usability Evaluations
Usability is a measure of how well a system, product, or service can be used by
the intended users to achieve their specified goals with effectiveness, efficiency, and
satisfaction in its intended context of use [8]. An important part of system, product, and
service development are usability evaluations to receive user feedback about the usability
of its current state.
Usability testing involves two parties: the participant and the usability expert. The
participant serves as a possible user of the product or system and completes tasks for the
usability expert to collect data about the product’s or system’s current usability. The
usability expert is trained to observe and listen to participants while the participants
complete usability tasks to determine the usability of the product or system. The usability
expert will also plan and design the tasks that the participants will complete.
Usability evaluations can be conducted based on two factors: moderated or
unmoderated; in-person or remote. A moderated usability test has the usability expert
observe the participant while they complete usability tasks. An unmoderated usability test
will not have the usability expert observe the participant while they complete the list of
usability tasks. An in-person usability test will have the usability expert in the same room
or building as the participant such that the usability expert has physical access to the
participant. A remote usability test will not have the usability expert in the same location
as the usability tester and will likely be conducted over the phone, video conferencing
software, or usability testing tools that automatically moderate usability tests or record the
usability tests for the usability testers to complete on their own time. In this study, we
5
focused on unmoderated remote usability testing due to restrictions imposed by the
COVID-19 pandemic. Thus, the usability tests in this study were recorded by the
participants to be submitted for processing by the facial emotion recognizer later.
2.2 Facial Emotion Recognition
Facial emotion recognition is a long-standing research topic. In 1970 Paul Ekman
studied [14] if six facial expressions (happy, sad, angry, fear, surprise, and disgust) that
are universally found in all cultures. Ekman studied if humans from different cultures could
correctly identify posed facial expressions. Ekman’s study of the six emotions concluded
by stating, “These findings provide conclusive evidence that there is a pan-cultural
element in facial expressions of emotion” [14]. Ekman’s study is the common justification
to use happy, sad, angry, fear, surprise, and disgust as the facial expressions to recognize.
However, there is some pushback against Ekman’s claims that these facial expressions
are truly universal [10, 11]. Gendron et al. completed a study similar to Ekman but did not
inform the local community about their definitions of each facial expressions and had
difficulty replicating the results of Ekman’s study [10]. Reisenzein et al. found that there is
low coherence between some of the universal basic emotions and the associated facial
expressions [11]. The consensus about universal basic emotions and the associated facial
expressions are still being debated and there is no clear conclusion. Thus, researchers
continue to study how well emotions can be identified visually.
With the advancements in technology, researchers have studied the efficacy of
using computers for automatic facial emotion recognition. Currently, the Convolutional
Neural Network (CNN) is one of the most popular deep learning methods for computer
vision tasks and is used in the facial emotion recognizer for this study [20].
6
2.2.1 Convolutional Neural Networks (CNNs)
CNNs are a type of deep neural networks that are commonly used for computer
vision tasks [21]. Like other neural networks, CNNs consist of an input layer, a number of
hidden layers in between, and an output layer that reports classification of the input. The
hidden layers in a CNN can be at least one convolution layer, at least one pooling layer,
and one fully-connected layer [21].
The convolution layer is used to reduce the original area that the neural network
would need to work in by extracting high-level features, like discernable shapes, rather
than analyze each individual pixel of an image [21]. Additional convolution layers will focus
on more specific features of an image; in the case of facial recognition, the first convolution
layer will attempt to detect general faces in the image and later convolution layers will try
to extract facial features from the faces for analysis [21]. More convolution layers add more
granularity in image feature extraction but will also increase computation time [21].
Pooling layers further reduce the size of the output from convolution layers so that
the image is computationally less intensive to process [21]. Pooling layers reduce the size
of the data by combining sections of the input matrix such that a small area of the matrix
is summarized into one value of the smaller output matrix. There are two methods used
for pooling layers: max pooling and average pooling. Max pooling will find the largest value
from the small section and use that as the value to represent that section for the smaller
output matrix. Average pooling finds the average value of all the values in a small section
to represent that section for the smaller output matrix. The CNN developed in the FER
library for this study used max pooling layers [18].
The fully-connected layer will connect every node in the layer to each node in the
output layer such that every node in the output layer will have every node from the fully-
connected layer as input [21]. This allows every value in the matrix to be used for image
classification.
7
Chapter 3
RELATED WORKS
3.1 Automatic vs Crowdsourced Sentiment Analysis
In [15], Burromeo and Toyama compared crowdsourced manual sentiment and
automatic sentiment analysis with the manual sentiment analysis conducted by a faculty
member at a university from the Philippines. The manual sentiment analysis by the faculty
member served as the baseline accuracy to compare with the manual crowdsourced and
automatic methods. The automatic sentiment analysis was conducted using an API by an
algorithm by Narayanan, Arora, and Bhatia [15] that identifies the sentiment polarity of
comments after training with the IMDB movie review dataset. The crowdsourcing was split
into two implementations: paid and volunteer-based. Both versions of crowdsourcing used
an online platform to post the details of the sentiment analysis tasks. Burromeo and
Toyama analyzed the results of each sentiment analysis method by determining their
agreement using the Cohen’s kappa coefficient, which measures how reliable two different
evaluators are. Using the faculty based manual sentiment analysis as a baseline for an
accurate sentiment analysis, the automatic sentiment analysis had the lowest “accuracy”
with a Cohen’s kappa coefficient of 0.384, while both crowdsourced methods had fairly
higher Cohen’s kappa coefficient at 0.577 for paid crowdsourced sentiment analysis and
0.597 for volunteer-based sentiment analysis [15]. However, Burromeo and Toyama argue
that one positive of using automatic sentiment analysis is the speed compared to any
manual method [15]. The automatic sentiment analysis took only 3.6 minutes to execute,
while the shortest manual method took 2.9 hours to complete [15].
8
3.2 A Comparison of Students’ Emotional Self-reports with Automated Facial Emotion
Recognition
In [12] Hirt et al. studied if there was a significant difference between student self-
reported emotions and the emotions reported by an automated facial emotion recognition,
FaceReader. FaceReader was validated with an 89% accuracy in recognizing the basic
emotions in two facial picture databases, but could only match human reports of emotions
in video settings in only 56% of cases [12]. Thus, Hirt et al. used the experimental “affective
attitudes'' estimation from FaceReader, which focused on epistemic emotion analysis
(interest and boredom) [12]. Moreover, Hirt et al. measured “valence of affect” using a
modified version of SAM (Self-Assessment-Manikin) which classifies if the subject is in a
positive or negative emotional state rather than attempting to classify the subject’s facial
expression to a specific emotion [12]. Hirt et al. used FaceReader on recordings of
students reading some text to output the epistemic emotion predictions and compared the
output to the self-reports of moments where the students stated that they were bored or
interested in the text. Hirt et al.’s study found that FaceReader’s experimental epistemic
emotion predictions had low agreements with the student reported self-reports and
recommended waiting for more comprehensive evidence on the agreement of FER
software and self-reported emotions.
3.3 Toward Usability Problem Identification Based on User Emotions Derived from Facial
Expressions
In [16] Johanssen et al. developed the framework EmotionKit for Apple’s iOS to
collect user emotions and relate the emotions to user interface events. Unlike other
common automatic facial expression recognition systems, EmotionKit does not require a
machine learning approach and uses facial action units (AUs) to map facial features and
9
facial movements to emotions in facial expressions. Specifically, EmotionKit uses Apple’s
ARKit to collect facial data, such as face detection and facial feature extraction. EmotionKit
was applied in a university seminar room, where each participant of the study would be
seated across two of the three authors of the paper. Johanssen et al. observed each
participant as the participants completed usability tasks assigned to them. While
observing, Johanssen et al. recorded if participants made an emotional response when
encountering a known usability problem in the software they were testing. After the
usability tests were completed, Johanssen et al. also reviewed the observer notes with the
recordings to manually determine the emotions found in the responses.
Three metrics were used to quantify the results of the study: sensitivity, specificity,
and accuracy. Sensitivity was reporting the ratio of actual emotional responses that were
identified by EmotionKit to be emotional responses. Specificity referred to the ratio of non-
emotional responses by a participant were correctly identified by EmotionKit to not be an
emotional response. Accuracy referred to the ratio of instances that were correctly
detected. Johanssen et al. found that EmotionKit could correctly detect 98% of emotional
responses, 60% of non-emotional responses, and was able to correctly classify the
response around 74% of the time [16].
3.4 Discussion of Related Works
Research for studies related to FER and usability evaluations was surprisingly
difficult to find. However, there was some work in similar fields, such as sentiment analysis.
Although [15] by Burromeo and Toyama did not implement FER for their study, their study
was related to this thesis as it involves a comparison between automatic and human
reports of sentiments, which is an often used metric for usability evaluations to determine
the satisfaction of users while operating the tested product. Burromeo and Toyama
conclude that automatic sentiment analysis methods did not have high agreement with
10
human-created reports of sentiment. However, Burromeo and Toyama state that one
benefit of using automatic methods is the reduced time needed to complete a sentiment
analysis [15]. Hirt et al. [12] used Noldus’ FaceReader as a FER tool to measure epistemic
emotions (interest and boredom) rather than the basic emotions that were available for
use. Hirt et al. found that FaceReader could not match the student self-reports but
recommends waiting for more evidence of the relationship between FER and human-
created reports of emotions [12]. Johanssen et al. created the framework EmotionKit [16]
that could be used to identify user emotions during usability evaluations. Unlike the other
two related works discussed, EmotionKit compared well with human-reported emotions
and presented evidence that facial emotion recognition is a viable method to classify
emotions in usability testing contexts.
Overall, the efficacy of FER in usability contexts is unknown. FER in [12] and [16]
show opposing results in similar contexts. [15] does not directly use FER but uses similar
metrics in sentiment analysis to determine the opinions of users. In [12] and [15], emotion
and sentiment analysis was not able to match human reports; while [16] presents evidence
that FER can be implemented to improve analysis of the emotional states of usability test
participants. Thus, this thesis continues these studies by implementing FER in mock
usability recordings for analysis. The output of the implemented FER tool will be used to
observe the efficacy of FER on usability evaluations. The next section will describe the
methodology used for the data gathering process and experiments for this study.
11
Chapter 4
METHODOLOGY
The steps for this experiment will be split into two sections: gathering data and
facial emotion analysis to view moments of interest from a recording.
4.1 Gathering Data
The data gathering process involved three primary parts: finding participants,
creating the recordings for usability testing, and reviewing the recordings to create emotion
timestamps.
4.1.1 Finding Participants
The experiment requires recordings of usability testing to run facial emotion
recognition on and a set of data tags for each recording that lists the emotions found and
the timestamp that those emotions were found. However, we were not able to find existing
datasets of recordings for usability experiments. Recordings of usability evaluations
created by companies are unlikely to be open to the public, as they would prefer to keep
their research hidden from their competitors. We also explored the availability of such data
sets from academic researchers, but without success. Thus, to gather the usability
evaluation recordings required for the experiments, Kelsi Van Damme (who required
similar data for her thesis) [17] and I looked to gather data from students in two sections
of CSC 486 - a Computer Science course about Human-Centered Interaction (HCI) at our
university, Cal Poly San Luis Obispo. After collecting the recordings, we asked students
to annotate recordings with the emotions found, the time that emotion was found, whether
the emotion was found through an audio and/or video cue, and the sentiment score at that
time. Thus, we could obtain both the set of recordings of usability tests and the data tags
12
that list the timestamps of observed emotions that we required for our experiments. The
data tags approximate listing the moments of significance that a usability expert would like
to analyze in usability evaluations.
The two instructors for CSC 486, Dr. Franz Kurfess and Erin Sheets, provided us
access to the students in their class by using our usability tasks as an assignment for their
courses. To participate in the data gathering study, students were asked to complete and
submit a consent form. In the consent form, we provided an overview of the study to gather
usability testing recordings and associated data tags. More importantly, we detailed the
possible privacy risks involved with our data gathering process. The primary risk we
identified was allowing at least three other students to view the recording, which allows
those students to possibly take screenshots or save their recordings to have a record of
compromising information that may be present. The consent form also prompted students
for their “level of future access” to their recordings and data tags. Students had three
choices:
• No future use, after the completion of this thesis research.
• Allow use in future projects conducted by Professor Kurfess and collaborators.
• Open access to the scientific community through an open source repository
If a student chooses the “no future use...” option, any copy of that student’s
recording and the data tags associated with their recording will be deleted once the thesis
work is completed. Choosing the “allow use in future projects…” option provides future
access to Professor Kurfess to use with his collaborators, such as students who work with
Professor Kurfess on a project or thesis that requires the recordings and data tags. Finally,
the “open access to the scientific community…” option will give us permission to create a
repository of the usability testing recordings and associated data tags that will be freely
available online. If students are not comfortable with any of these choices, students can
opt-out of participating in our data gathering process. Students who opted out were given
13
the same tasks as other students who participate (who will be called ‘participants’ from
this point on in this paper) in the study, but provide their data to their instructor as proof of
completing the assignment. We did not collect the recordings of the students who opted
out. Participants of the data gathering process were given a Google Drive link to a folder
specific to them to hold their recording.
4.1.2 Assigning Usability Tasks
For our data gathering process, students were given a list of five tasks to complete
on a website. Participants were equally assigned to one of two websites to complete tasks
for. Website one was the Library of Congress website (www.loc.gov); website two was the
state website for California (www.ca.gov). These websites were chosen as fairly “neutral”
websites that were not expected to elicit emotions that could be brought about by factors
unrelated to the usability of the websites. Two websites were chosen to reduce possible
bias when participants would review recordings for emotion identification and timestamps.
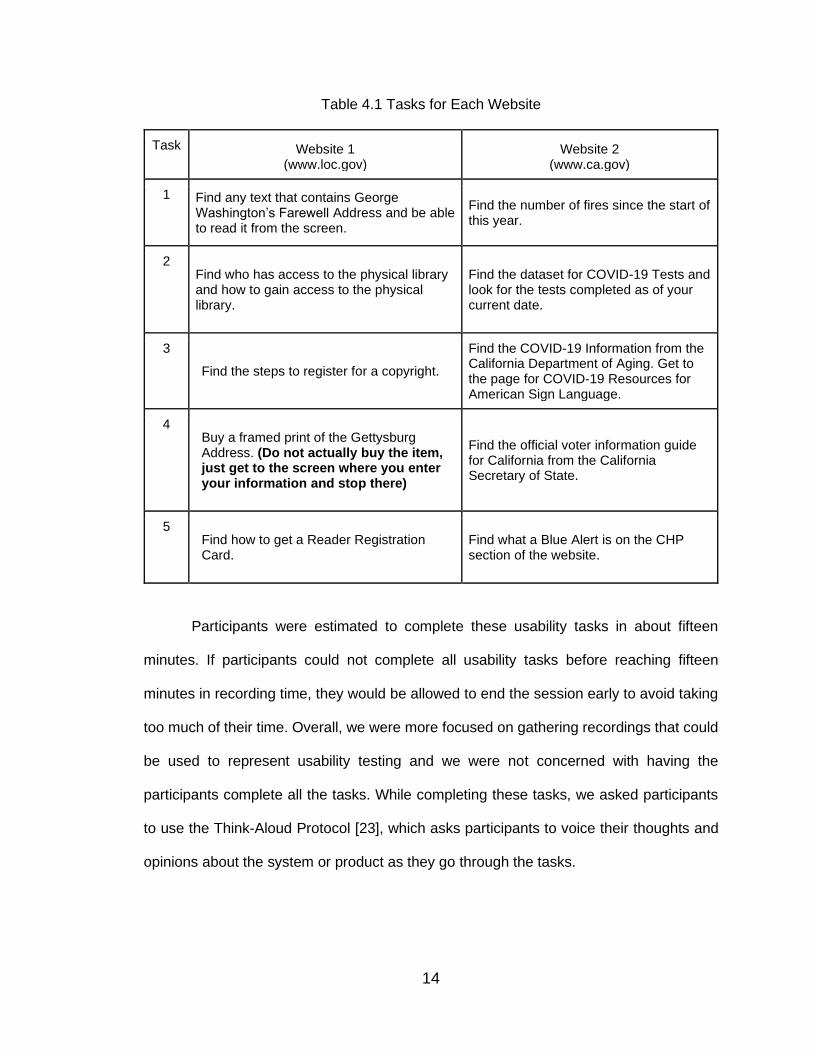
Table 4.1 shows the five usability tasks assigned to the students for each website.
14
Table 4.1 Tasks for Each Website
Task
#
Website 1 (www.loc.gov)
Website 2 (www.ca.gov)
1 Find any text that contains George Washington’s Farewell Address and be able to read it from the screen.
Find the number of fires since the start of this year.
2 Find who has access to the physical library and how to gain access to the physical library.
Find the dataset for COVID-19 Tests and look for the tests completed as of your current date.
3
Find the steps to register for a copyright.
Find the COVID-19 Information from the California Department of Aging. Get to the page for COVID-19 Resources for American Sign Language.
4 Buy a framed print of the Gettysburg Address. (Do not actually buy the item, just get to the screen where you enter your information and stop there)
Find the official voter information guide for California from the California Secretary of State.
5 Find how to get a Reader Registration Card.
Find what a Blue Alert is on the CHP section of the website.
Participants were estimated to complete these usability tasks in about fifteen
minutes. If participants could not complete all usability tasks before reaching fifteen
minutes in recording time, they would be allowed to end the session early to avoid taking
too much of their time. Overall, we were more focused on gathering recordings that could
be used to represent usability testing and we were not concerned with having the
participants complete all the tasks. While completing these tasks, we asked participants
to use the Think-Aloud Protocol [23], which asks participants to voice their thoughts and
opinions about the system or product as they go through the tasks.
15
To normalize the recording process, we required all participants to record using Zoom.
Zoom was chosen for our recording software for ease of access and familiarity for our
participants. Since the data gathering study was conducted in the fourth quarter of
distance learning, we expected that most students have Zoom and know how to use the
software. Participants used the record function in the Zoom Meetings software to record
their browser using screen sharing. Participants were also required to have their cameras
on while completing the usability tasks so that we could capture their facial expressions
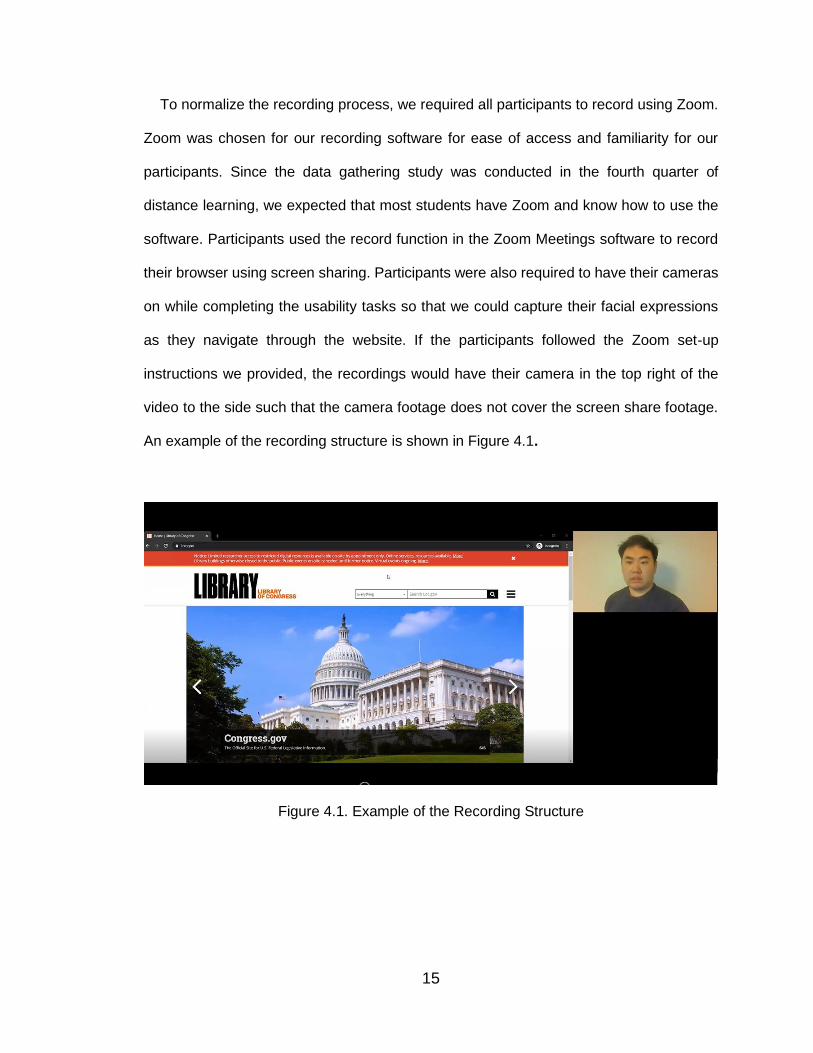
as they navigate through the website. If the participants followed the Zoom set-up
instructions we provided, the recordings would have their camera in the top right of the
video to the side such that the camera footage does not cover the screen share footage.
An example of the recording structure is shown in Figure 4.1.
Figure 4.1. Example of the Recording Structure
16
4.1.3 Emotion Timestamps for Usability Task Recordings
In the second portion of our data gathering process, we assigned participants to
review the recordings of three others. The recordings were assigned based on the website
the participants were assigned to on part one of the data gathering process. Thus,
participants who recorded usability tasks for website one were assigned three different
recordings on website two and vice versa.
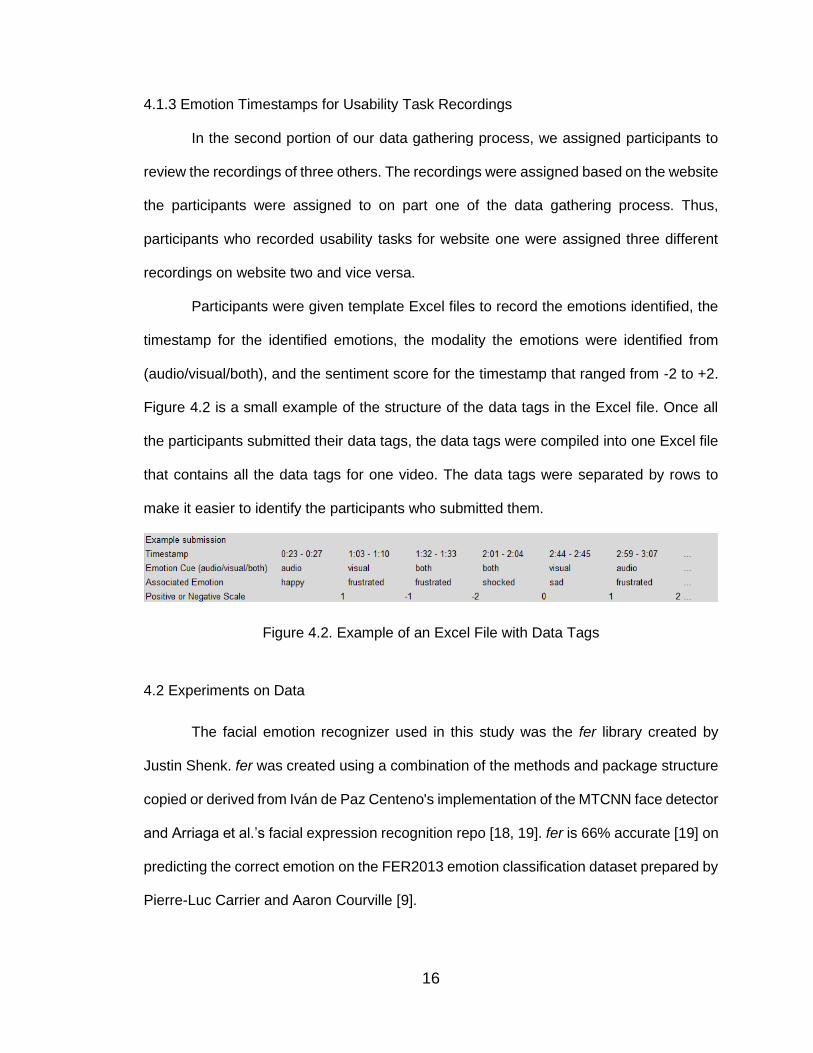
Participants were given template Excel files to record the emotions identified, the
timestamp for the identified emotions, the modality the emotions were identified from
(audio/visual/both), and the sentiment score for the timestamp that ranged from -2 to +2.
Figure 4.2 is a small example of the structure of the data tags in the Excel file. Once all
the participants submitted their data tags, the data tags were compiled into one Excel file
that contains all the data tags for one video. The data tags were separated by rows to
make it easier to identify the participants who submitted them.
Figure 4.2. Example of an Excel File with Data Tags
4.2 Experiments on Data
The facial emotion recognizer used in this study was the fer library created by
Justin Shenk. fer was created using a combination of the methods and package structure
copied or derived from Iván de Paz Centeno's implementation of the MTCNN face detector
and Arriaga et al.’s facial expression recognition repo [18, 19]. fer is 66% accurate [19] on
predicting the correct emotion on the FER2013 emotion classification dataset prepared by
Pierre-Luc Carrier and Aaron Courville [9].
17
The goal of this study is to validate the feasibility of using facial emotion recognition
tools in usability evaluation contexts, rather than a performance comparison between
multiple facial emotion recognition tools. Therefore, fer was selected because it is a pre-
trained, easily available Python library that could be installed using the command “pip
install fer” in a terminal of a computer with Python installed. So, fer is a free solution that
could be quickly and easily implemented by a relative beginner to Python. Moreover, a
pre-trained model, like fer, allows for quicker implementation that skips the training phase
to develop a working deep learning model to detect facial expressions.
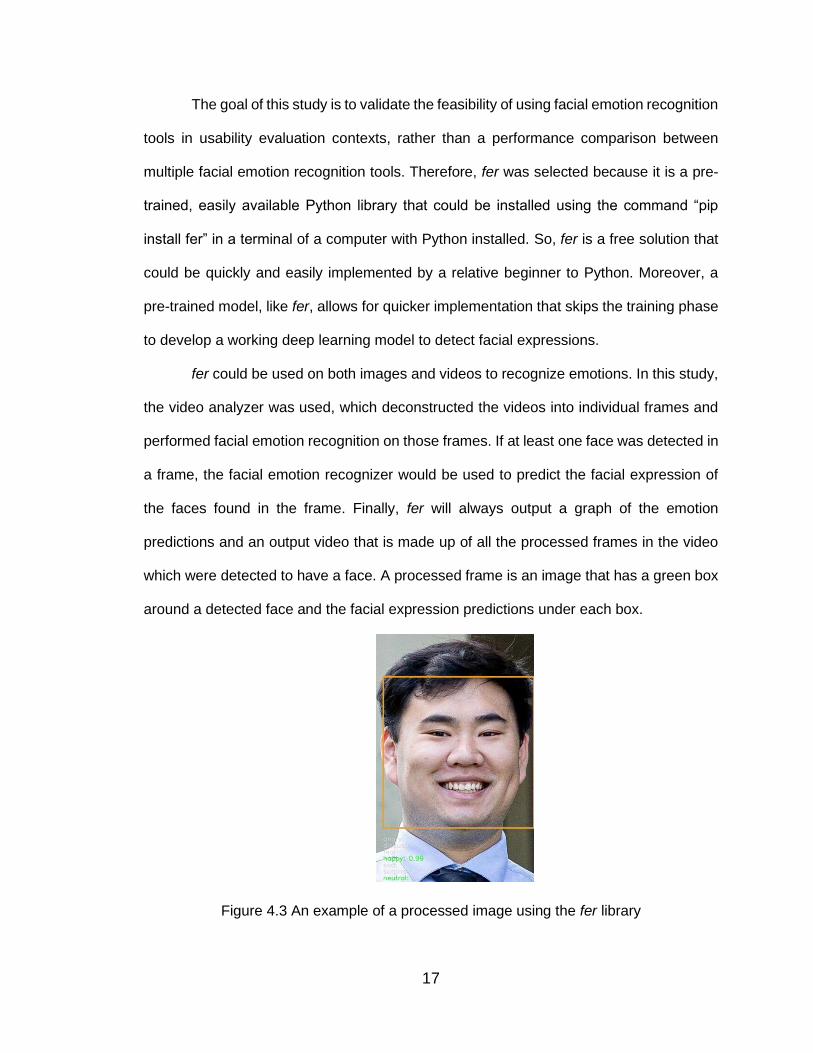
fer could be used on both images and videos to recognize emotions. In this study,
the video analyzer was used, which deconstructed the videos into individual frames and
performed facial emotion recognition on those frames. If at least one face was detected in
a frame, the facial emotion recognizer would be used to predict the facial expression of
the faces found in the frame. Finally, fer will always output a graph of the emotion
predictions and an output video that is made up of all the processed frames in the video
which were detected to have a face. A processed frame is an image that has a green box
around a detected face and the facial expression predictions under each box.
Figure 4.3 An example of a processed image using the fer library
18
Since we used Zoom to be our recording software, which can only provide camera
footage and screen recordings in one video file, the videos needed to be cropped so that
only the face camera footage remained to reduce possible noise from the screen recording
and reduce the size of the footage to speed up processing time. Without cropping the
videos, fer would take approximately one and a half seconds to process one frame in the
video. Thus, the processing time for an average 15 minute recording that was recorded at
30 frames per second could take upwards of five hours for one video. In contrast, a
cropped video could be processed in the same amount of time as the video length. In my
research, I could not easily find a method that could easily crop multiple videos at once,
especially since many of the videos did not have the same screen resolutions or camera
resolutions that made it difficult or impossible to define the areas that needed to be
cropped out. Thus, the preprocessing for each video needed to be manual as there was
not a regular shape to crop the videos. To crop the videos, I used iMovie on an iMac from
2009, which had an Intel i5 processor from that time period. The time to crop and output
the videos from iMovie took 5-10 minutes each, which increased the total time to output
the facial emotion recognition for one recording.
Once the videos are cropped, the videos can be analyzed with a Python script
using the fer library. The Python script I wrote is very similar to the “video-example.py,”
but it includes some code to write the data tables created during the analysis as a CSV
file. The implementation of the facial emotion recognizer was not changed. Once fer
completed its video analysis process, it outputs a CSV file that includes all the emotion
predictions for each frame and a video composed of all the processed frames from a
recording to show the emotion predictions through the duration of the recording.
19
CHAPTER 5
RESULTS AND DISCUSSION
Each video was processed by running a Python script that uses the fer library for
facial emotion recognition. The videos were processed on a computer with an Intel Core
i9-10850k CPU and 16.0 GB RAM @ 3600MHz. Unfortunately, there were problems with
running fer on GPU mode for faster performance. Thus, the runtime analysis for this study
should be taken with a grain of salt as the runtimes will drastically change when the videos
are processed using a GPU instead of a CPU.
In all, there were 39 videos to process for this experiment. Of those 39 videos, 37
videos were able to be processed properly to output a CSV file with the emotions for most
of the frames in the video. The output of the other two videos could output a CSV file, but
the majority of the frames were not processed and the video composed of the processed
frames showed a fragmented video that was missing most of the original recording. Since
there were thousands of frames processed through all the videos, it was an almost
impossible task to make a note of every frame that contained a non-neutral emotion and
determine the time frames with emotions that were not reported in the human-created data
tags. A more feasible comparison is identifying whether fer was able to find the data tag
to showcase its accuracy. For this study, a data tag was ‘found’ by fer if it could be used
to identify at least one non-neutral emotion at any frame within the range of time in the
reported timestamp from a data tag. Also, emotions were matched if fer could find any
frame within the timestamp range with the same emotion as the one reported in a data tag
for that timestamp. Finally, sentiments were matched approximately by generalizing facial
expressions to certain sentiment scores (i.e., the facial expression for the sad emotion
was linked to a negative sentiment). Specifically, I chose to associate the facial
20
expressions for angry, disgust, fear, and sad with negative sentiment scores; neutral and
surprise with neutral sentiment scores (0); and happy with positive sentiment scores.
Next, this analysis will discuss the accuracy of fer for mock usability recordings in
three ways. First, I provide an overview of the accuracy of fer without considering the
modality used to create the data tags. Then, I discuss the difference in accuracy for the
three modalities the participants used to create the data tags: visual, audio, or both. Lastly,
I discuss how well fer could match the emotion in the data tags for the visual and both
modalities and how often it could match the emotion in the data tags for those modalities
with a prediction confidence of above 0.50. The final part of this section will discuss the
average processing time compared with the average length of the mock usability
recordings.
5.1 Metrics Used to Analyze Results
In the analysis of the results, two metrics were used: precision, and recall. These
metrics are used to describe the statistics drawn from the total output of fer and summarize
information about the true positive, false positive, and false negatives found in this study.
For this study, ‘positives’ are the non-neutral emotions that fer outputs within timestamps
in data tags for the mock usability recordings, while ‘negatives’ are when fer outputs only
neutral predictions within a timeframe. A ‘true positive’ refers to an output that was able to
‘find’ a timestamp, match an emotion, or match a sentiment from a data tag. ‘False
positives’ are emotions in the output that were not present in the data tags. ‘False
negatives’ are when fer only showed neutral emotions through a timestamp in the data
tag, since there should have been a non-neutral response but fer could not detect one.
‘True negatives’ could not be measured, as the method to find ‘true positives’ used an
estimation that looked to see if the emotion in the data tag was ever present in at least
one frame that was analyzed by fer. Thus, a true negative could not be measured as true
21
positives did not count individual emotions in frames and referred to only what was in the
data tags given, so there was not a good method to determine what would be a true
negative around the true positives from the timestamps.
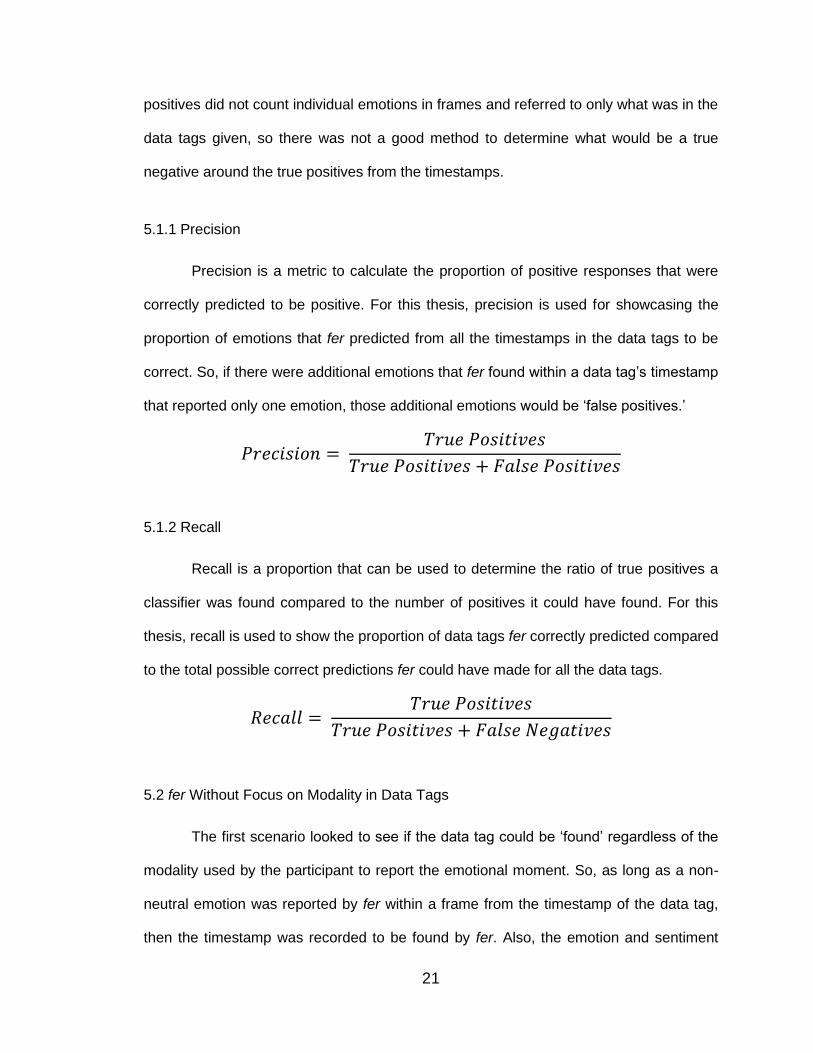
5.1.1 Precision
Precision is a metric to calculate the proportion of positive responses that were
correctly predicted to be positive. For this thesis, precision is used for showcasing the
proportion of emotions that fer predicted from all the timestamps in the data tags to be
correct. So, if there were additional emotions that fer found within a data tag’s timestamp
that reported only one emotion, those additional emotions would be ‘false positives.’
𝑃𝑟𝑒𝑐𝑖𝑠𝑖𝑜𝑛 = 𝑇𝑟𝑢𝑒 𝑃𝑜𝑠𝑖𝑡𝑖𝑣𝑒𝑠
𝑇𝑟𝑢𝑒 𝑃𝑜𝑠𝑖𝑡𝑖𝑣𝑒𝑠 + 𝐹𝑎𝑙𝑠𝑒 𝑃𝑜𝑠𝑖𝑡𝑖𝑣𝑒𝑠
5.1.2 Recall
Recall is a proportion that can be used to determine the ratio of true positives a
classifier was found compared to the number of positives it could have found. For this
thesis, recall is used to show the proportion of data tags fer correctly predicted compared
to the total possible correct predictions fer could have made for all the data tags.
𝑅𝑒𝑐𝑎𝑙𝑙 = 𝑇𝑟𝑢𝑒 𝑃𝑜𝑠𝑖𝑡𝑖𝑣𝑒𝑠
𝑇𝑟𝑢𝑒 𝑃𝑜𝑠𝑖𝑡𝑖𝑣𝑒𝑠 + 𝐹𝑎𝑙𝑠𝑒 𝑁𝑒𝑔𝑎𝑡𝑖𝑣𝑒𝑠
5.2 fer Without Focus on Modality in Data Tags
The first scenario looked to see if the data tag could be ‘found’ regardless of the
modality used by the participant to report the emotional moment. So, as long as a non-
neutral emotion was reported by fer within a frame from the timestamp of the data tag,
then the timestamp was recorded to be found by fer. Also, the emotion and sentiment
22
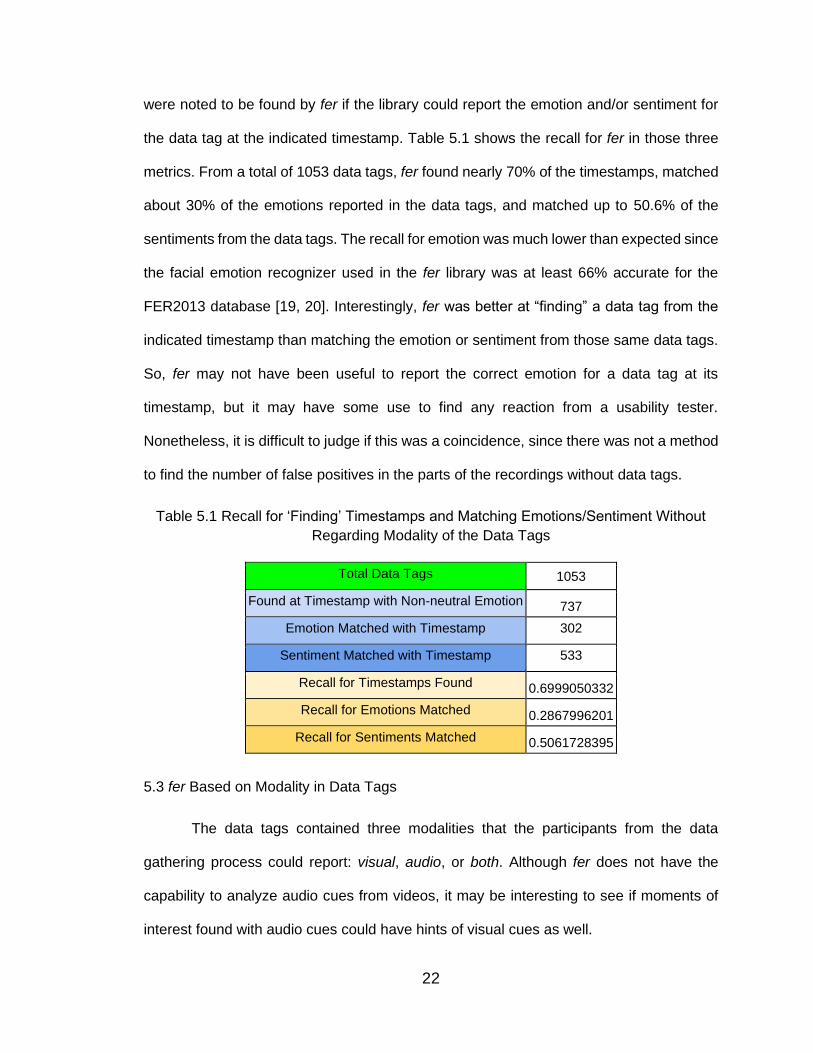
were noted to be found by fer if the library could report the emotion and/or sentiment for
the data tag at the indicated timestamp. Table 5.1 shows the recall for fer in those three
metrics. From a total of 1053 data tags, fer found nearly 70% of the timestamps, matched
about 30% of the emotions reported in the data tags, and matched up to 50.6% of the
sentiments from the data tags. The recall for emotion was much lower than expected since
the facial emotion recognizer used in the fer library was at least 66% accurate for the
FER2013 database [19, 20]. Interestingly, fer was better at “finding” a data tag from the
indicated timestamp than matching the emotion or sentiment from those same data tags.
So, fer may not have been useful to report the correct emotion for a data tag at its
timestamp, but it may have some use to find any reaction from a usability tester.
Nonetheless, it is difficult to judge if this was a coincidence, since there was not a method
to find the number of false positives in the parts of the recordings without data tags.
Table 5.1 Recall for ‘Finding’ Timestamps and Matching Emotions/Sentiment Without
Regarding Modality of the Data Tags
Total Data Tags 1053
Found at Timestamp with Non-neutral Emotion 737
Emotion Matched with Timestamp 302
Sentiment Matched with Timestamp 533
Recall for Timestamps Found 0.6999050332
Recall for Emotions Matched 0.2867996201
Recall for Sentiments Matched 0.5061728395
5.3 fer Based on Modality in Data Tags
The data tags contained three modalities that the participants from the data
gathering process could report: visual, audio, or both. Although fer does not have the
capability to analyze audio cues from videos, it may be interesting to see if moments of
interest found with audio cues could have hints of visual cues as well.
23
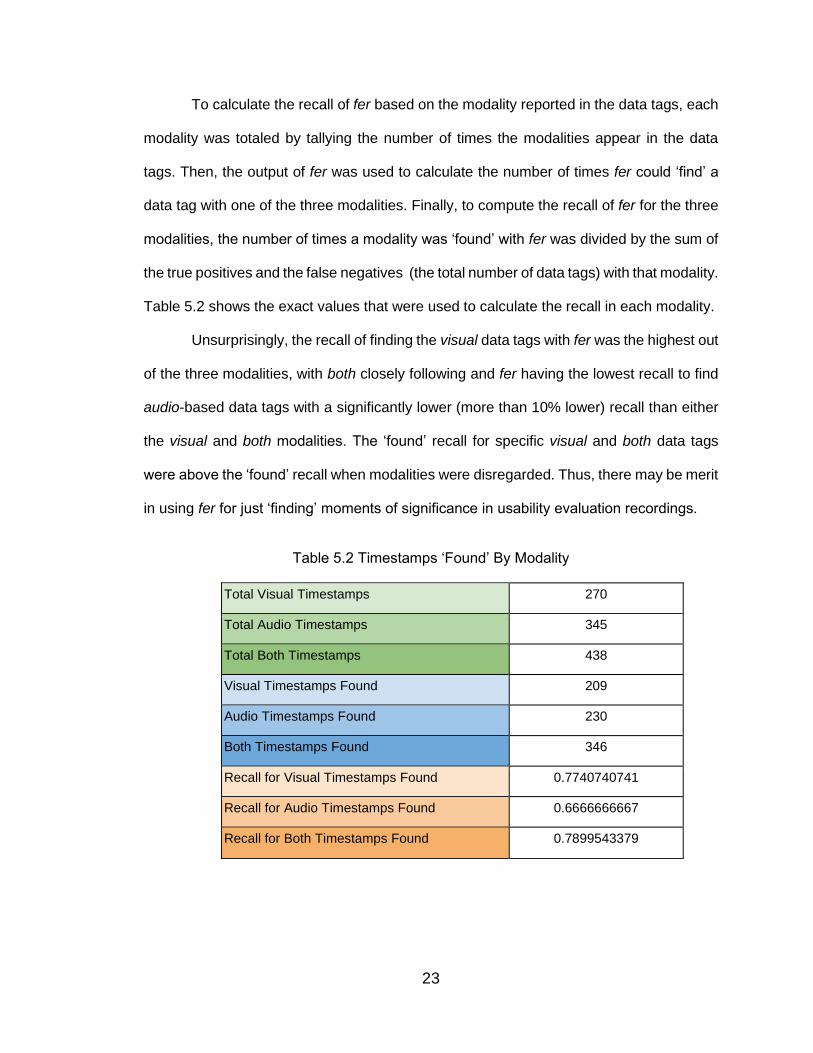
To calculate the recall of fer based on the modality reported in the data tags, each
modality was totaled by tallying the number of times the modalities appear in the data
tags. Then, the output of fer was used to calculate the number of times fer could ‘find’ a
data tag with one of the three modalities. Finally, to compute the recall of fer for the three
modalities, the number of times a modality was ‘found’ with fer was divided by the sum of
the true positives and the false negatives (the total number of data tags) with that modality.
Table 5.2 shows the exact values that were used to calculate the recall in each modality.
Unsurprisingly, the recall of finding the visual data tags with fer was the highest out
of the three modalities, with both closely following and fer having the lowest recall to find
audio-based data tags with a significantly lower (more than 10% lower) recall than either
the visual and both modalities. The ‘found’ recall for specific visual and both data tags
were above the ‘found’ recall when modalities were disregarded. Thus, there may be merit
in using fer for just ‘finding’ moments of significance in usability evaluation recordings.
Table 5.2 Timestamps ‘Found’ By Modality
Total Visual Timestamps 270
Total Audio Timestamps 345
Total Both Timestamps 438
Visual Timestamps Found 209
Audio Timestamps Found 230
Both Timestamps Found 346
Recall for Visual Timestamps Found 0.7740740741
Recall for Audio Timestamps Found 0.6666666667
Recall for Both Timestamps Found 0.7899543379
24
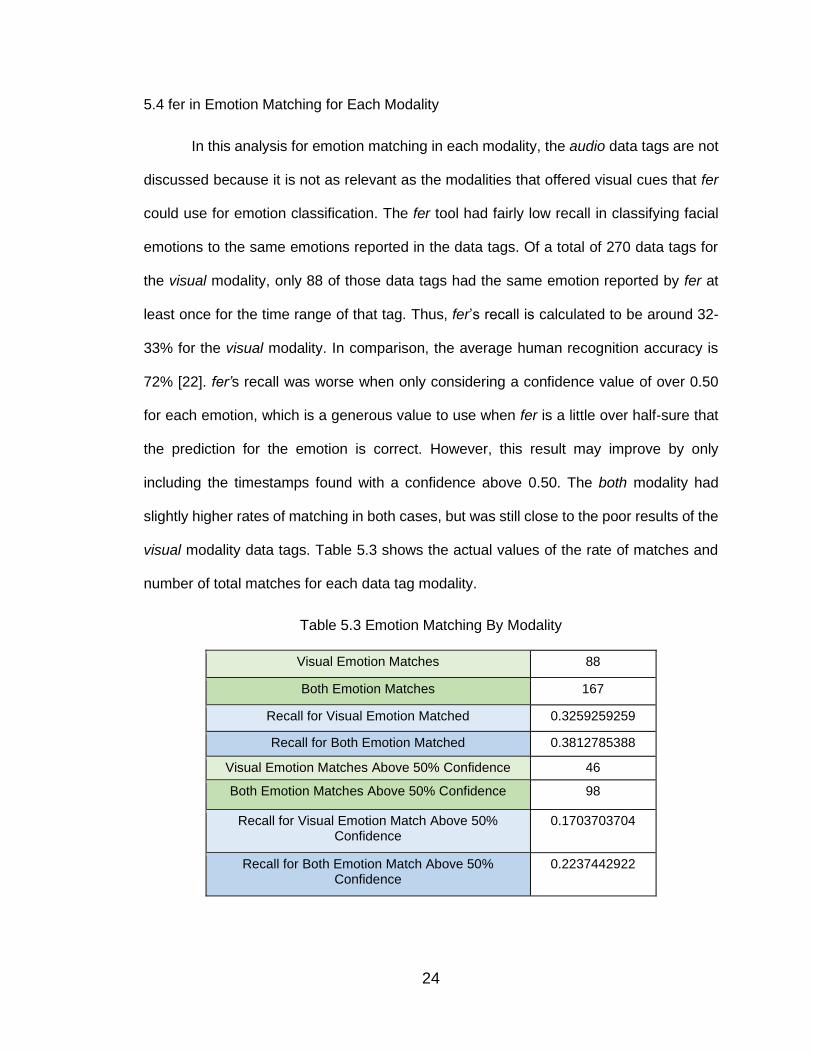
5.4 fer in Emotion Matching for Each Modality
In this analysis for emotion matching in each modality, the audio data tags are not
discussed because it is not as relevant as the modalities that offered visual cues that fer
could use for emotion classification. The fer tool had fairly low recall in classifying facial
emotions to the same emotions reported in the data tags. Of a total of 270 data tags for
the visual modality, only 88 of those data tags had the same emotion reported by fer at
least once for the time range of that tag. Thus, fer’s recall is calculated to be around 32-
33% for the visual modality. In comparison, the average human recognition accuracy is
72% [22]. fer’s recall was worse when only considering a confidence value of over 0.50
for each emotion, which is a generous value to use when fer is a little over half-sure that
the prediction for the emotion is correct. However, this result may improve by only
including the timestamps found with a confidence above 0.50. The both modality had
slightly higher rates of matching in both cases, but was still close to the poor results of the
visual modality data tags. Table 5.3 shows the actual values of the rate of matches and
number of total matches for each data tag modality.
Table 5.3 Emotion Matching By Modality
Visual Emotion Matches 88
Both Emotion Matches 167
Recall for Visual Emotion Matched 0.3259259259
Recall for Both Emotion Matched 0.3812785388
Visual Emotion Matches Above 50% Confidence 46
Both Emotion Matches Above 50% Confidence 98
Recall for Visual Emotion Match Above 50% Confidence
0.1703703704
Recall for Both Emotion Match Above 50% Confidence
0.2237442922
25
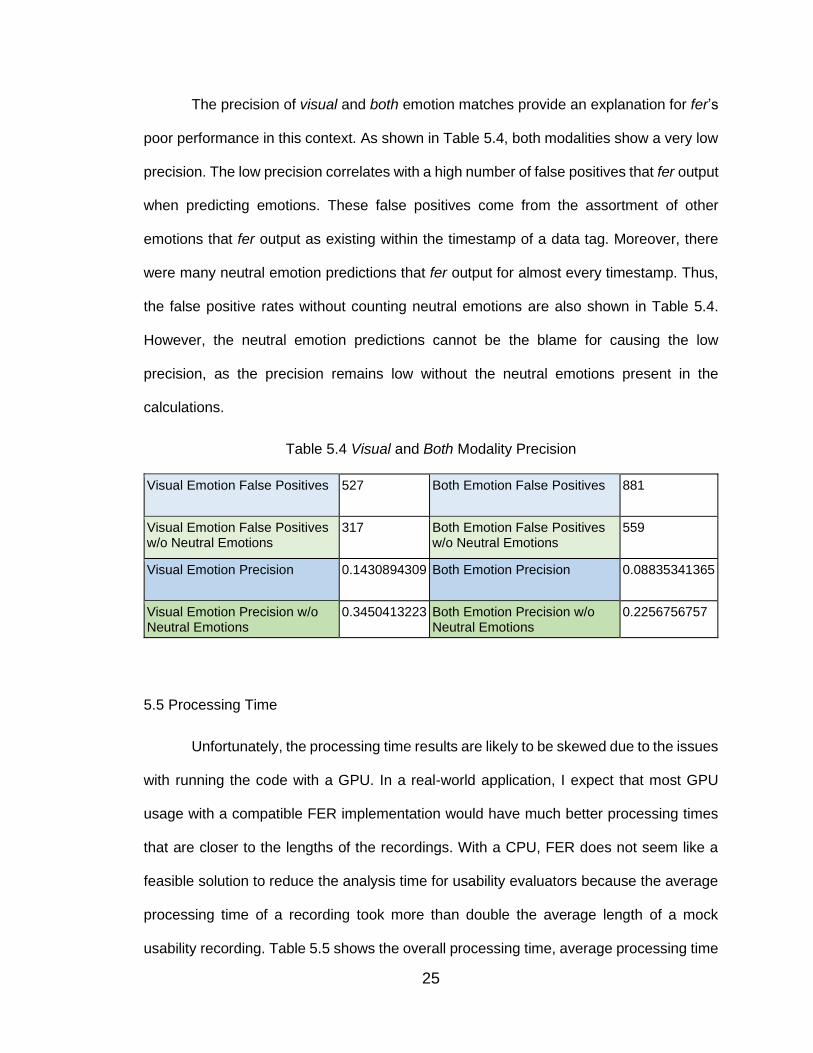
The precision of visual and both emotion matches provide an explanation for fer’s
poor performance in this context. As shown in Table 5.4, both modalities show a very low
precision. The low precision correlates with a high number of false positives that fer output
when predicting emotions. These false positives come from the assortment of other
emotions that fer output as existing within the timestamp of a data tag. Moreover, there
were many neutral emotion predictions that fer output for almost every timestamp. Thus,
the false positive rates without counting neutral emotions are also shown in Table 5.4.
However, the neutral emotion predictions cannot be the blame for causing the low
precision, as the precision remains low without the neutral emotions present in the
calculations.
Table 5.4 Visual and Both Modality Precision
Visual Emotion False Positives 527 Both Emotion False Positives 881
Visual Emotion False Positives w/o Neutral Emotions
317 Both Emotion False Positives w/o Neutral Emotions
559
Visual Emotion Precision 0.1430894309 Both Emotion Precision 0.08835341365
Visual Emotion Precision w/o Neutral Emotions
0.3450413223 Both Emotion Precision w/o Neutral Emotions
0.2256756757
5.5 Processing Time
Unfortunately, the processing time results are likely to be skewed due to the issues
with running the code with a GPU. In a real-world application, I expect that most GPU
usage with a compatible FER implementation would have much better processing times
that are closer to the lengths of the recordings. With a CPU, FER does not seem like a
feasible solution to reduce the analysis time for usability evaluators because the average
processing time of a recording took more than double the average length of a mock
usability recording. Table 5.5 shows the overall processing time, average processing time
26
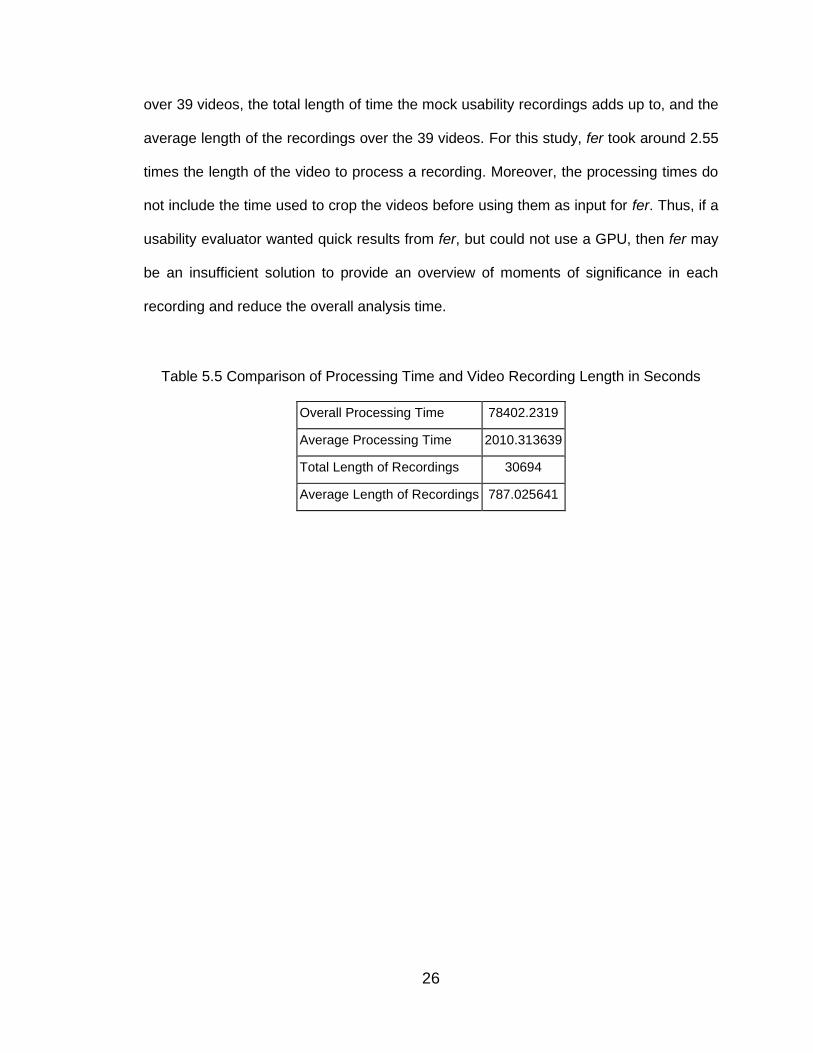
over 39 videos, the total length of time the mock usability recordings adds up to, and the
average length of the recordings over the 39 videos. For this study, fer took around 2.55
times the length of the video to process a recording. Moreover, the processing times do
not include the time used to crop the videos before using them as input for fer. Thus, if a
usability evaluator wanted quick results from fer, but could not use a GPU, then fer may
be an insufficient solution to provide an overview of moments of significance in each
recording and reduce the overall analysis time.
Table 5.5 Comparison of Processing Time and Video Recording Length in Seconds
Overall Processing Time 78402.2319
Average Processing Time 2010.313639
Total Length of Recordings 30694
Average Length of Recordings 787.025641
27
Chapter 6
LIMITATIONS AND FUTURE WORK
6.1 Limitations
There were some limitations that restricted the scope of this thesis research. First,
the facial emotion recognizer was not as accurate in finding emotions as possible. Perhaps
there would have been more success in this study if the facial emotion recognition model
was more accurate to have a better chance at representing the data tags created by the
human participants. Another weakness in this study is the use of “amateur” usability test
recordings. Although the data gathering process created recordings of participants who
completed usability tasks with the Think-Aloud protocol, the recordings we created may
not be representative of usability evaluations conducted by professionals. Finally, there
were problems with receiving permission by the Cal Poly Institutional Review Board (IRB)
to conduct the data gathering process, which delayed the experiment portion of the study
as there were no other mock usability evaluation recordings with data tags that could be
used to verify the results of fer.
6.2 Future Work
The facial emotion recognizer used in this study was only 66% accurate [18] on
predicting the correct emotion on the FER2013 emotion classification dataset prepared by
Pierre-Luc Carrier and Aaron Courville [9]. The team that won the competition had an
accuracy of around 71%, which is a noticeable increase from the facial emotion recognizer
used in the Kaggle Competition [9]. Due to limited time and lack of experience with creating
deep learning models for facial emotion recognition, this study used a pre-trained facial
emotion recognizer that could be implemented quickly and cheaply. However, this
approach led to using a facial emotion recognition model that was less than state-of-the-
28
art to recognize emotion accuracy. Thus, one avenue for future work would be to conduct
a similar experiment but with a facial emotion recognizer that is more accurate or a method
that uses time as a factor by analyzing multiple subsequent frames to identify emotions
and emotion transitions throughout a video. A similar study with either of these methods
would be interesting to see if there can be a significant improvement in accurately
identifying emotions in usability testing. If a future study with these methods show similar
results, there would at least be more evidence that facial emotion recognition is not useful
to find moments of interest in usability evaluations.
Another weakness in this study that can be improved in a future study is the
growing pushback against the idea of universal basic emotions, which many facial emotion
recognizers (including fer) use as the basis of reasoning to choose which facial
expressions for emotion recognition [10, 11]. Opponents of universal basic emotions are
not new, but these concerns about the legitimacy of universal basic emotions and the
plausibility of facial emotion recognition were not brought to my attention until the
experiments were completed. In a future study, it would be interesting to see a deep
learning model that could identify moments of interest for usability evaluators rather than
trying to apply a facial emotion recognizer to usability evaluation recordings. For this
proposed study, usability evaluators would create data tags to identify moments of interest
in usability task recordings for a deep learning model to train on. Then, the study could
observe if a deep learning model can be used to identify moments of interest from the
usability testing recordings.
29
Chapter 7
CONCLUSION
This thesis analyzed the efficacy of using a facial emotion recognition (FER)
Python library for parsing moments of significance that could be given to a usability
evaluator to analyze, rather than having to look through an entire recording. The FER
used in this study was fer by Justin Shenk [20]. fer was fairly simple to set up, but was
only able to output the emotions identified in the data tags for recordings at an accuracy
of less than 30% for any modality and less than 20% for data tags that were made with
only visual cues. Thus for this thesis, fer was not effective for showing the correct
emotions a usability tester feels at moments of interest in a usability evaluation through
their facial expressions. Moreover, due to problems with setting fer to process videos
using the GPU, fer in CPU mode cannot be recommended for quick overviews of the
emotions a usability tester felt through a usability evaluation since it takes an average
2.55 times the length of the recording to finish processing. Also, unlike the FER2013
dataset that the facial emotion recognizer in fer used to benchmark accuracy, the
usability recordings did not always have a static close-up of the usability testers’ faces.
Thus, fer may not be the best implementation to recognize facial emotions for usability
evaluations where the faces of the participants will move around and be at different
distances from the camera. Nonetheless, this study can only judge the fer Python library
and cannot make a sweeping statement about the effectiveness of FER in usability
evaluations. Further research will be required to determine if other FER implementations
would have the same results as the ones in this thesis.
Although fer was ineffective in its accuracy to match emotions from the human-
created data tags, fer was much more effective at ‘finding’ a non-neutral emotion at the
moments of significance indicated by the data tag timestamps. If this study was focused

30
on using fer to simply identify any non-neutral emotion at a given timestamp, fer would
be much more successful. With a recall of nearly 75% to find a non-neutral emotion
using only visual cues in the mock usability recordings, it may be more feasible to create
a model that could output a list of significant moments in usability recordings for usability
experts to view for analysis.
In future work, I would be most interested to see if it would be feasible to develop
a deep learning model that could identify moments of significance in usability recordings
without relying on emotion recognition.
31
REFERENCES
[1] A. Perrin and S. Atske, “About three-in-ten U.S. adults say they are ‘almost
constantly’ online,” Pew Research Center, 26 March 2021,
https://www.pewresearch.org/fact-tank/2021/03/26/about-three-in-ten-u-s-adults-
say-they-are-almost-constantly-online/ [Accessed April 1, 2021].
[2] Adobe State of Content Report. Adobe Systems. Oct. 2015.
https://blogs.adobe.com/creative/files/2015/12/Adobe-State-of-Content-
Report.pdf. [Accessed 4 Jan 2021].
[3] J. Nielsen. Usability 101: Introduction to Usability. Nielsen Norman Group.
https://www.nngroup.com/articles/usability-101-introduction-to-usability/. 3 Jan.
2012.
[4] J. Nielsen. Time Budgets for Usability Sessions. Nielsen Norman Group.
https://www.nngroup.com/articles/time-budgets-for-usability-sessions/. 11 Sep.
2005.
[5] S. Baker, F. Au, G. Dobbie and I. Warren, "Automated Usability Testing Using
HUI Analyzer," 19th Australian Conference on Software Engineering (aswec
2008), Perth, WA, 2008, pp. 579-588. doi: 10.1109/ASWEC.2008.4483248.
[6] M. Y. Ivory and M. A Hearst. 2001. The state of the art in automating usability
evaluation of user interfaces. ACM Comput. Surv. 33, 4 (December 2001), 470–
516. doi: 10.1145/503112.503114.
[7] A.M. El-Halees, 2014. Software Usability Evaluation Using Opinion Mining. JSW,
9(2), pp.343-349. https://www.semanticscholar.org/paper/Software-Usability-
Evaluation -Using-Opinion-Mining-El-
Halees/9d489177667ba9774fc4888fb399272560c7fc2b?p2df [Accessed 10 April
2021].
32
[8] ISO, “Ergonomics of human-system interaction — Part 11: Usability: Definitions
and concepts,” ISO 9241-11:2018, (March 2018),
https://www.iso.org/standard/63500.html [Accessed 20 April 2021].
[9] Kaggle, “Challenges in Representation Learning: Facial Expression Recognition
Challenge,” Kaggle, (April 2013), https://www.kaggle.com/c/challenges-in-
representat ion-learning-facial-expression-recognition-
challenge/overview/description [Accessed 10 May 2021].
[10] M. Gendron, D. Roberson, J. M. van der Vyver, & L. F. Barrett. Perceptions of
emotion from facial expressions are not culturally universal: Evidence from a
remote culture. Emotion, 14(2), 251–262. 2014. doi: 10.1037/a0036052.
[11] R. Reisenzein, M. Studtmann, G. Horstmann. Coherence between Emotion and
Facial Expression: Evidence from Laboratory Experiments. Emotion Review,
5(1), 16-23. 2013. doi:10.1177/1754073912457228.
[12] F. S. Hirt, I. Moser, E. Werlen, C. Imhof, and P. Bergamin. 2018. “A comparison
of students' emotional self-reports with automated facial emotion recognition in a
reading situation.” In Proceedings of the Sixth International Conference on
Technological Ecosystems for Enhancing Multiculturality (TEEM'18). Association
for Computing Machinery, New York, NY, USA, 320–327. DOI:
10.1145/3284179.3284230.
[13] A. Landowska and J. Miler, "Limitations of emotion recognition in software user
experience evaluation context," 2016 Federated Conference on Computer
Science and Information Systems (FedCSIS), 2016, pp. 1631-1640. DOI:
10.15439/2016F535.
[14] P. Ekman, “Universal Facial Expressions of Emotion,” in California Mental Health
Research Digest, vol. 8, no. 4, pp. 151–158, Autumn 1970.
33
https://www.paulekman.com/ wp-content/uploads/2013/07/Universal-Facial-
Expressions-of-Emotions1.pdf. [Accessed 19 Feb. 2021].
[15] R. Borromeo and M. Toyama. 2015. “Automatic vs. Crowdsourced Sentiment
Analysis.” In Proceedings of the 19th International Database Engineering &
Applications Symposium (IDEAS '15). Association for Computing Machinery,
New York, NY, USA, 90–95. DOI: 10.1145/2790755.2790761
[16] J. O. Johanssen, J. P. Bernius and B. Bruegge, "Toward Usability Problem
Identification Based on User Emotions Derived from Facial Expressions," 2019
IEEE/ACM 4th International Workshop on Emotion Awareness in Software
Engineering (SEmotion), 2019, pp. 1-7, doi: 10.1109/SEmotion.2019.00008.
[17] K. Van Damme, “A Performance Survey of Sentiment Analysis Methods for
Automating Usability Evaluations,” Master’s Thesis, California Polytechnic State
University, San Luis Obispo, 2021.
[18] O. Arriaga, M. Valdenegro and P. Plöger, “Real-time Convolutional Neural
Networks for Emotion and Gender Classification,” 2017, arXiv: 1710.07557.
[19] I. de Paz Centeno, “mtcnn,” GitHub, 4 Jan. 2018. https://github.com/ipazc/mtcnn/
[Accessed 20 Dec. 2020].
[20] J. Shenk, “FER,” GitHub, Nov. 2020. https://github.com/justinshenk/fer [Accessed
20 Dec. 2020].
[21] S. Saha, “A Comprehensive Guide to Convolutional Neural Networks — the ELI5
way,” 15 Dec. 2018, https://towardsdatascience.com/a-comprehensive-guide-to-
convolutional-neural-networks-the-eli5-way-3bd2b1164a53 [Accessed 3 Mar.
2021].
[22] D. Dupre, E. G. Krumhuber, D. Kuster, G. J. McKeown. “A performance
comparison of eight commercially available automatic classifiers for facial affect
recognition,” PLoS ONE, 24 Apr. 2020. DOI: 10.1371/journal.pone.0231968.

34
[23] R. Jääskeläinen, “Think-aloud protocol.” Handbook of translation studies, 1,
pp.371-374, 2010.