
Applying Cybernetic Technology to Diagnose Human Pulmonary Sounds
10
EDUCATION & TRAINING Applying Cybernetic Technology to Diagnose Human Pulmonary Sounds Mei-Yung Chen & Cheng-Han Chou Received: 7 January 2014 /Accepted: 13 May 2014 /Published online: 31 May 2014 # Springer Science+Business Media New York 2014 Abstract Chest auscultation is a crucial and efficient method for diagnosing lung disease; however, it is a subjective process that relies on physician experience and the ability to differen- tiate between various sound patterns. Because the physiolog- ical signals composed of heart sounds and pulmonary sounds (PSs) are greater than 120 Hz and the human ear is not sensitive to low frequencies, successfully making diagnostic classifications is difficult. To solve this problem, we construct- ed various PS recognition systems for classifying six PS classes: vesicular breath sounds, bronchial breath sounds, tracheal breath sounds, crackles, wheezes, and stridor sounds. First, we used a piezoelectric microphone and data acquisition card to acquire PS signals and perform signal preprocessing. A wavelet transform was used for feature extraction, and the PS signals were decomposed into frequency subbands. Using a statistical method, we extracted 17 features that were used as the input vectors of a neural network. We proposed a 2-stage classifier combined with a back-propagation (BP) neural net- work and learning vector quantization (LVQ) neural network, which improves classification accuracy by using a haploid neural network. The receiver operating characteristic (ROC) curve verifies the high performance level of the neural net- work. To expand traditional auscultation methods, we con- structed various PS diagnostic systems that can correctly classify the six common PSs. The proposed device overcomes the lack of human sensitivity to low-frequency sounds and various PS waves, characteristic values, and a spectral analy- sis charts are provided to elucidate the design of the human- machine interface. Keywords Pulmonary sounds (PSs) . Artificial neural network (ANN) . Wavelet transform . 2-stage classifier . Receiver operating characteristic curve Introduction Chest auscultation is a noninvasive, diagnostic method for detecting chest diseases; however, the conventional ausculta- tion method employs a stethoscope is both limited and incon- venient because it cannot provide frequency information re- garding pulmonary sounds (PS). The doctor must possess specialized knowledge and experience to differentiate PSs. Furthermore, human hearing cannot be used to record PS information. Developing a computerized system for use in respiratory sound analysis is a research goal in biomedical engineering. A method for analyzing computerized respiratory sound has been suggested [1]. Polat and Guler [2] proposed a comput- erized analysis system involving a condenser microphone in a stethoscope; an amplifier and filter first processed the signals, followed by a sound card and computer. Finally, the author used DasyLAB software, which enabled saving data and analyzing PS, to analyze the signals. PS signals are nonstationary and difficult to analyze, but can be understood using spectral analysis and parametric modeling. Signals processing have been widely applied to respiratory sound analysis [3–9]. Hadjileontiadis and Panas [5] investigated higher-order statistics in the AR modeling of lung sounds, and attempted to determine the source and trans- mission characteristics of lung sounds. These investigations were efficient, even in the presence of additive symmetric noise. Homs-Corbera et al [8] used spectrograms that provid- ed a graphical time-frequency representation of the location of the wheeze. The Hilbert Huang Transform (HHT) has also been a popular time-frequency analysis method, consisting of This article is part of the Topical Collection on Education & Training M.<Y. Chen (*) : C.<H. Chou National Taiwan Normal University, 162 Heping E. Road Sec. 1, Taipei, Taiwan e-mail: [email protected] J Med Syst (2014) 38:58 DOI 10.1007/s10916-014-0058-5
Transcript of Applying Cybernetic Technology to Diagnose Human Pulmonary Sounds
EDUCATION & TRAINING
Applying Cybernetic Technology to Diagnose HumanPulmonary Sounds
Mei-Yung Chen & Cheng-Han Chou
Received: 7 January 2014 /Accepted: 13 May 2014 /Published online: 31 May 2014# Springer Science+Business Media New York 2014
Abstract Chest auscultation is a crucial and efficient methodfor diagnosing lung disease; however, it is a subjective processthat relies on physician experience and the ability to differen-tiate between various sound patterns. Because the physiolog-ical signals composed of heart sounds and pulmonary sounds(PSs) are greater than 120 Hz and the human ear is notsensitive to low frequencies, successfully making diagnosticclassifications is difficult. To solve this problem, we construct-ed various PS recognition systems for classifying six PSclasses: vesicular breath sounds, bronchial breath sounds,tracheal breath sounds, crackles, wheezes, and stridor sounds.First, we used a piezoelectric microphone and data acquisitioncard to acquire PS signals and perform signal preprocessing.A wavelet transform was used for feature extraction, and thePS signals were decomposed into frequency subbands. Usinga statistical method, we extracted 17 features that were used asthe input vectors of a neural network. We proposed a 2-stageclassifier combined with a back-propagation (BP) neural net-work and learning vector quantization (LVQ) neural network,which improves classification accuracy by using a haploidneural network. The receiver operating characteristic (ROC)curve verifies the high performance level of the neural net-work. To expand traditional auscultation methods, we con-structed various PS diagnostic systems that can correctlyclassify the six common PSs. The proposed device overcomesthe lack of human sensitivity to low-frequency sounds andvarious PS waves, characteristic values, and a spectral analy-sis charts are provided to elucidate the design of the human-machine interface.
Keywords Pulmonary sounds (PSs) . Artificial neuralnetwork (ANN) .Wavelet transform . 2-stage classifier .
Receiver operating characteristic curve
Introduction
Chest auscultation is a noninvasive, diagnostic method fordetecting chest diseases; however, the conventional ausculta-tion method employs a stethoscope is both limited and incon-venient because it cannot provide frequency information re-garding pulmonary sounds (PS). The doctor must possessspecialized knowledge and experience to differentiate PSs.Furthermore, human hearing cannot be used to record PSinformation.
Developing a computerized system for use in respiratorysound analysis is a research goal in biomedical engineering. Amethod for analyzing computerized respiratory sound hasbeen suggested [1]. Polat and Guler [2] proposed a comput-erized analysis system involving a condenser microphone in astethoscope; an amplifier and filter first processed the signals,followed by a sound card and computer. Finally, the authorused DasyLAB software, which enabled saving data andanalyzing PS, to analyze the signals.
PS signals are nonstationary and difficult to analyze, butcan be understood using spectral analysis and parametricmodeling. Signals processing have been widely applied torespiratory sound analysis [3–9]. Hadjileontiadis and Panas[5] investigated higher-order statistics in the AR modeling oflung sounds, and attempted to determine the source and trans-mission characteristics of lung sounds. These investigationswere efficient, even in the presence of additive symmetricnoise. Homs-Corbera et al [8] used spectrograms that provid-ed a graphical time-frequency representation of the location ofthe wheeze. The Hilbert Huang Transform (HHT) has alsobeen a popular time-frequency analysis method, consisting of
This article is part of the Topical Collection on Education & Training
M.<Y. Chen (*) : C.<H. ChouNational Taiwan Normal University, 162 Heping E. Road Sec. 1,Taipei, Taiwane-mail: [email protected]
J Med Syst (2014) 38:58DOI 10.1007/s10916-014-0058-5
two parts: empirical mode decomposition and Hilbert spectralanalysis. These modes can be used to assess nonstationary andnonlinear signals and determine internal information signalssuch as the time domain, frequency domain, and energyvariation. Therefore, the HHT is commonly employed in thestudy of lung sounds.
Numerous algorithms may be used to classify variousdiseases using computers [10–17]. Kahya et al [10] comparedthe k-nearest neighbor and artificial neural network (ANN)algorithms. The features were formed using autoregressivecoefficients, wavelet coefficients, and crackle parameters.Dokur [12] proposed an incremental supervised neural net-work. The feature extraction method provides a coarse repre-sentation of the spectrum of respiratory sound signals. Wecompared the performance levels of the three neural networks,multilayer perceptron, grow and learn network, and a novelincremental supervised neural network (ISNN). The experi-mental results indicated that the weights used in the ISNNcould adequately represent the distribution of classes, even innoisy environments. Guler et al. combined multi neural net-work (MLP) and genetic algorithm. Authors used geneticalgorithm searching for optimal structure and training param-eters of neural network. It is an effective way to reduce theprocessing load and time [13].
System architecture and analysis methods
Before recording the PS, we used surgical tape to hold thecontact piezoelectric microphone and prevent friction noise.Clay was positioned between skin and the contact piezoelec-tric microphone. The raw signals obtained by the microphonewere digitized using a 24-bit sound card. The respiratorysounds were analyzed in three stages: signal processing, fea-ture extraction, and classification. The system structure isshown in Fig. 1.
Pulmonary sounds
What is the mechanism of PS generation? The alveolus per-forms air exchange in the lung. When we breathe, the lungsproduce expansion and contraction motions. This mechanisminduces sound energy by air current vibration in the respira-tory track. PS are divided into two major categories: normaland adventitious sounds. Figure 2 shows six waveforms of thePS in this study.
Vesicular breath sounds (VBS): VBS are detected throughthe chest wall. The term is based on the false idea thatnormal breath sounds originate in the vesicles.Bronchial breath sounds (BBS): This term has been usedto imply two distinct meanings: 1) normal breath soundsdetected at the upper anterior chest wall that have
approximately similar intensities during inspiration andexpiration; and 2) abnormal breath sounds detected at theposterior chest wall, exhibiting increased frequency com-ponents and an increased intensity compared with normalbreath sounds at the same location [15].Tracheal breath sounds (TBS): The spectrum of TBSnotably differs from that of the normal PS. Rather thanshowing a low-frequency peak, the spectrum appears as aplateau extending from less than 100 Hz to approximately700 Hz where the first of two spectral peaks appear [15].Crackle sounds (CS): CS are discontinuous adventitiousPS, and are explosive and transient. Their duration is lessthan 20 ms. The main frequency of crackles is between100 and 2,000 Hz.Wheeze sounds (WS): WS are continual adventitious PS,which are superimposed on normal breath sounds. Themain frequency of wheezes is greater than 100 Hz andduration time is more than 100 ms [18].Stridor sounds (SS): SS are loud wheezes, which are theconsequence of a morphologic or dynamic obstruction inthe larynx. Stridors typically occur during extrathoracicinspiration or intrathoracic expiration, unless the obstruc-tion is fixed, in which case the stridor may appear in bothrespiration phases. The stridor is typically characterizedby a prominent peak at approximately 1,000 Hz in itsfrequency spectrum.
Analysis using discrete wavelet transform
Wavelet transform
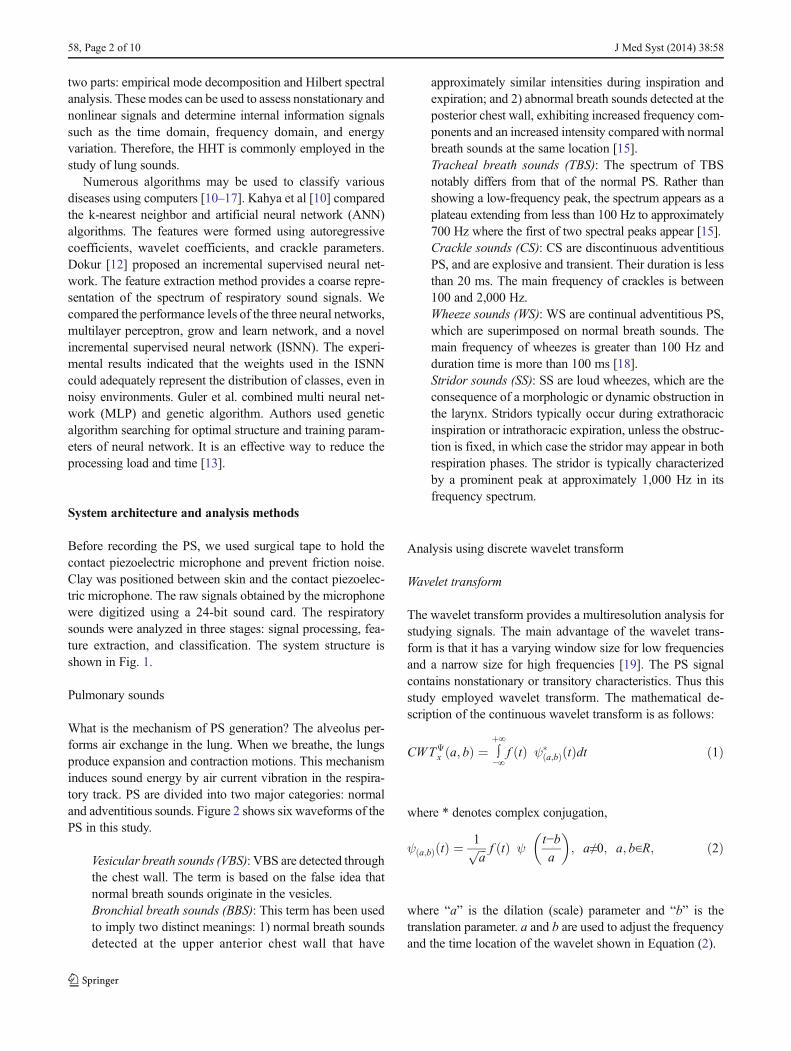
The wavelet transform provides a multiresolution analysis forstudying signals. The main advantage of the wavelet trans-form is that it has a varying window size for low frequenciesand a narrow size for high frequencies [19]. The PS signalcontains nonstationary or transitory characteristics. Thus thisstudy employed wavelet transform. The mathematical de-scription of the continuous wavelet transform is as follows:
CWTΨx a; bð Þ ¼ ∫
þ∞
−∞f tð Þ ψ�
a;bð Þ tð Þdt ð1Þ
where * denotes complex conjugation,
ψ a;bð Þ tð Þ ¼1ffiffiffia
p f tð Þ ψt−ba
� �; a≠0; a; b∈R; ð2Þ
where “a” is the dilation (scale) parameter and “b” is thetranslation parameter. a and b are used to adjust the frequencyand the time location of the wavelet shown in Equation (2).
58, Page 2 of 10 J Med Syst (2014) 38:58

Multiresolution decomposition of PS signals
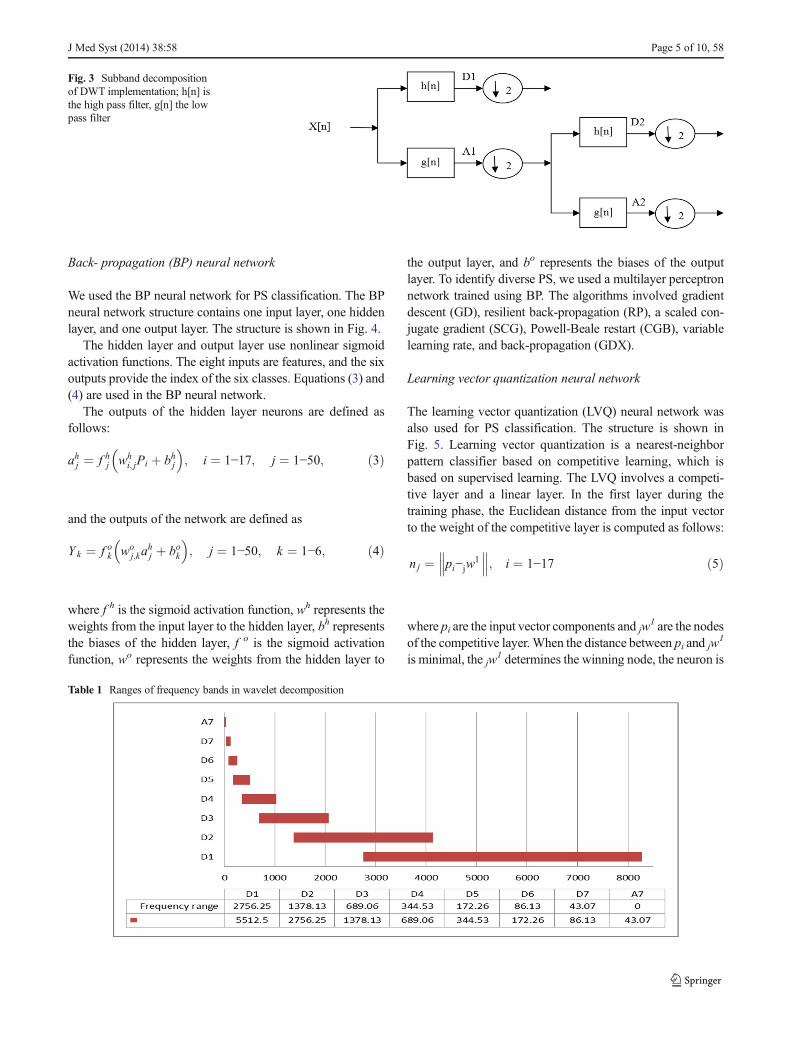
The decomposition of the PS signal into various frequencybands is attained using consecutive high-pass and low-passfiltering of the time domain signal [20]. Figure 3 schematical-ly shows the decomposition process of a signal X[n].
The down-sampled outputs of the first high-pass and low-pass filters provide the detail: D1 and A7 (the approximation).h[.] is a high-pass filter and g[.] is a low-pass filter. The signalof this structure can be decomposed into the details D1–D7and the approximation A3. Table 1 shows the ranges ofvarious frequency bands.
Feature extraction
The extracted wavelet coefficients provide a compact repre-sentation that shows the energy distribution of the signal intime and frequency domains. The eigenvalues were calculatedusing three statistical methods. The features used to representPS signals are as follows:
& The standard deviation of the coefficients in eachsubband.
& The mean of the absolute value of the coefficients in eachsubband.
& The ratio of the mean values of the neighboring subbands.
We standardized PS signals to ensure that the values rangedbetween 0 and 1. Every PS signal can be shown byeigenvalues.
Artificial neural network for classification
An ANN is a mathematical model loosely based onbiological neural networks [21]. The model consists of
an interconnected group of artificial neurons, and infor-mation is processed using a connectionist approach tocomputation. Such networks are adaptive in that theychange structure based on external or internal informa-tion during the learning phase. The ANN has fiveprimary advantages:
& It is fault-tolerant and robust.& Its highly parallel and regular ANN structure makes it
particularly suitable for use in pattern classification.& It works well in nonlinear situations.& It can learn based on the training data.& The weights representing a solution are determined using
iterative training.
The classification scheme for 1-of-C coding is readilyused for classifying the signal into a C output category.Because six output classes are used, the ANN structurehas six outputs. Each output produces a code to repre-sent a class. The outputs are represented by six basisvectors, which can be represented using the followingmatrix:
Each column of the matrix represents one type of PS (bothabnormal and normal sounds). The first column representsVBS, the second column represents BBS, the third column
Fig. 1 The basic block diagramof the pulmonary sound detectedsystem
J Med Syst (2014) 38:58 Page 3 of 10, 58

represents TBS, the fourth column represents CS, the fifthcolumn representsWS, and the sixth column represents SS. In
this study, we used BP and learning vector quantization neuralnetworks as the subsystem.
Fig. 2 The six differentpulmonary sound types (from topto bottom): a vesicular breathsounds, b bronchial breathsounds, c tracheal breath sounds,d crackles, e wheezes, f stridorsounds
58, Page 4 of 10 J Med Syst (2014) 38:58
Back- propagation (BP) neural network
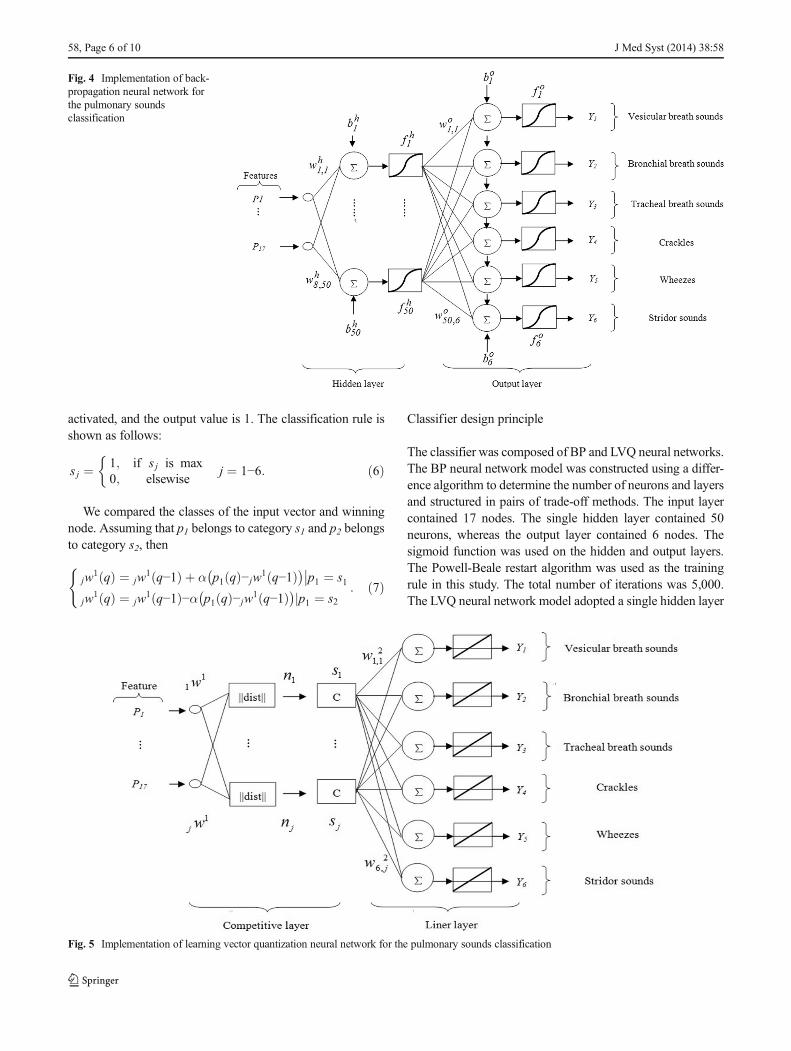
We used the BP neural network for PS classification. The BPneural network structure contains one input layer, one hiddenlayer, and one output layer. The structure is shown in Fig. 4.
The hidden layer and output layer use nonlinear sigmoidactivation functions. The eight inputs are features, and the sixoutputs provide the index of the six classes. Equations (3) and(4) are used in the BP neural network.
The outputs of the hidden layer neurons are defined asfollows:
ahj ¼ f hj whi; jPi þ bhj
� �; i ¼ 1−17; j ¼ 1−50; ð3Þ
and the outputs of the network are defined as
Yk ¼ f ok woj;ka
hj þ bok
� �; j ¼ 1−50; k ¼ 1−6; ð4Þ
where f h is the sigmoid activation function, wh represents theweights from the input layer to the hidden layer, bh representsthe biases of the hidden layer, f o is the sigmoid activationfunction, wo represents the weights from the hidden layer to
the output layer, and bo represents the biases of the outputlayer. To identify diverse PS, we used a multilayer perceptronnetwork trained using BP. The algorithms involved gradientdescent (GD), resilient back-propagation (RP), a scaled con-jugate gradient (SCG), Powell-Beale restart (CGB), variablelearning rate, and back-propagation (GDX).
Learning vector quantization neural network
The learning vector quantization (LVQ) neural network wasalso used for PS classification. The structure is shown inFig. 5. Learning vector quantization is a nearest-neighborpattern classifier based on competitive learning, which isbased on supervised learning. The LVQ involves a competi-tive layer and a linear layer. In the first layer during thetraining phase, the Euclidean distance from the input vectorto the weight of the competitive layer is computed as follows:
nj ¼ pi−jw1
��� ���; i ¼ 1−17 ð5Þ
where pi are the input vector components and jw1 are the nodes
of the competitive layer. When the distance between pi and jw1
is minimal, the jw1 determines the winning node, the neuron is
Fig. 3 Subband decompositionof DWT implementation; h[n] isthe high pass filter, g[n] the lowpass filter
Table 1 Ranges of frequency bands in wavelet decomposition
J Med Syst (2014) 38:58 Page 5 of 10, 58
activated, and the output value is 1. The classification rule isshown as follows:
s j ¼ 1; if s j is max0; elsewise
�j ¼ 1−6: ð6Þ
We compared the classes of the input vector and winningnode. Assuming that p1 belongs to category s1 and p2 belongsto category s2, then
jw1 qð Þ ¼ jw
1 q−1ð Þ þ α p1 qð Þ−jw1 q−1ð Þ
p1 ¼ s1��
jw1 qð Þ ¼ jw
1 q−1ð Þ−α p1 qð Þ−jw1 q−1ð Þ
p1 ¼ s2j
(: ð7Þ
Classifier design principle
The classifier was composed of BP and LVQ neural networks.The BP neural network model was constructed using a differ-ence algorithm to determine the number of neurons and layersand structured in pairs of trade-off methods. The input layercontained 17 nodes. The single hidden layer contained 50neurons, whereas the output layer contained 6 nodes. Thesigmoid function was used on the hidden and output layers.The Powell-Beale restart algorithm was used as the trainingrule in this study. The total number of iterations was 5,000.The LVQ neural network model adopted a single hidden layer
Fig. 4 Implementation of back-propagation neural network forthe pulmonary soundsclassification
Fig. 5 Implementation of learning vector quantization neural network for the pulmonary sounds classification
58, Page 6 of 10 J Med Syst (2014) 38:58
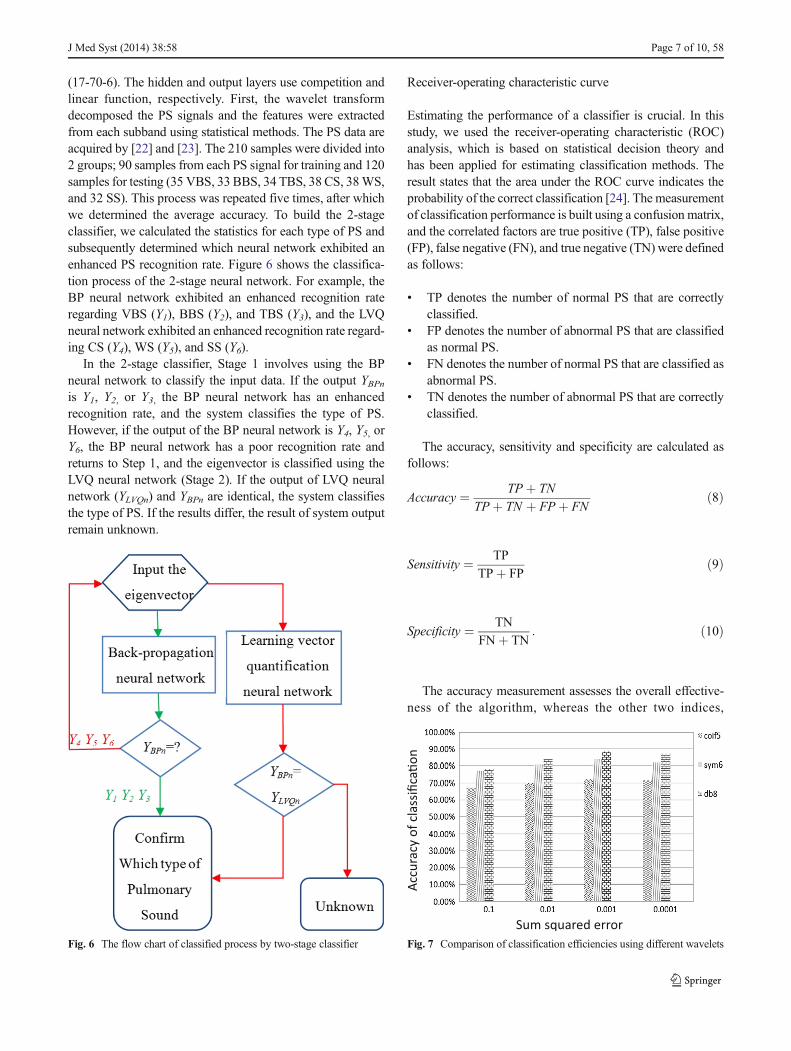
(17-70-6). The hidden and output layers use competition andlinear function, respectively. First, the wavelet transformdecomposed the PS signals and the features were extractedfrom each subband using statistical methods. The PS data areacquired by [22] and [23]. The 210 samples were divided into2 groups; 90 samples from each PS signal for training and 120samples for testing (35 VBS, 33 BBS, 34 TBS, 38 CS, 38WS,and 32 SS). This process was repeated five times, after whichwe determined the average accuracy. To build the 2-stageclassifier, we calculated the statistics for each type of PS andsubsequently determined which neural network exhibited anenhanced PS recognition rate. Figure 6 shows the classifica-tion process of the 2-stage neural network. For example, theBP neural network exhibited an enhanced recognition rateregarding VBS (Y1), BBS (Y2), and TBS (Y3), and the LVQneural network exhibited an enhanced recognition rate regard-ing CS (Y4), WS (Y5), and SS (Y6).
In the 2-stage classifier, Stage 1 involves using the BPneural network to classify the input data. If the output YBPnis Y1, Y2, or Y3, the BP neural network has an enhancedrecognition rate, and the system classifies the type of PS.However, if the output of the BP neural network is Y4, Y5, orY6, the BP neural network has a poor recognition rate andreturns to Step 1, and the eigenvector is classified using theLVQ neural network (Stage 2). If the output of LVQ neuralnetwork (YLVQn) and YBPn are identical, the system classifiesthe type of PS. If the results differ, the result of system outputremain unknown.
Receiver-operating characteristic curve
Estimating the performance of a classifier is crucial. In thisstudy, we used the receiver-operating characteristic (ROC)analysis, which is based on statistical decision theory andhas been applied for estimating classification methods. Theresult states that the area under the ROC curve indicates theprobability of the correct classification [24]. The measurementof classification performance is built using a confusion matrix,and the correlated factors are true positive (TP), false positive(FP), false negative (FN), and true negative (TN) were definedas follows:
& TP denotes the number of normal PS that are correctlyclassified.
& FP denotes the number of abnormal PS that are classifiedas normal PS.
& FN denotes the number of normal PS that are classified asabnormal PS.
& TN denotes the number of abnormal PS that are correctlyclassified.
The accuracy, sensitivity and specificity are calculated asfollows:
Accuracy ¼ TP þ TN
TP þ TN þ FP þ FNð8Þ
Sensitivity ¼ TP
TPþ FPð9Þ
Specificity ¼ TN
FNþ TN: ð10Þ
The accuracy measurement assesses the overall effective-ness of the algorithm, whereas the other two indices,
Fig. 6 The flow chart of classified process by two-stage classifier Fig. 7 Comparison of classification efficiencies using different wavelets
J Med Syst (2014) 38:58 Page 7 of 10, 58

sensitivity and specificity, estimate the classifier performanceregarding various classes [19, 25, 26].
Experimental results
Best wavelet basis is crucial for signal analysis. To analyzePS, we considered 14 wavelet bases: Daubechies 4 (db4),Daubechies 5 (db5), Daubechies 6 (db6), Daubechies 7(db7), Daubechies 8 (db8), Coiflet 2 (coif2), Coiflet 3(coif3), Coiflet 4 (coif4), Coiflet 5 (coif5), Symlet 4 (sym4),Symlet 5 (sym5), Symlet 6 (sym6), Symlet 7 (sym7), andSymlet 8 (sym8). To investigate the performance of thesebases regarding classification efficiency, we used the ANN
structure. Figure 7 shows the comparison results of eachwavelet basis, indicating that the db8 wavelet exhibited great-er efficiency compared with the other bases; thus, the db8wavelet was used in this study.
We constructed the neural network to classify six catego-ries: VBS, BBS, TBS, CS, WS, and SS. The testing and testsets differ within each class. The sampling frequency of thedata was 11,025 Hz. The BP network input layer had 17inputs, equal to the eigenvector size, and the number of outputnodes was fixed at 6, equal to the number of PS categories.
The number of neurons in the hidden layer andtraining algorithm was determined using simulation.We investigated the six training algorithms consistingof GD, RP, SCG, CGB, variable learning rate, andGDX. The conventional BP algorithm (gradient decent)was excessively slow. To determine which training al-gorithm was most rapid, we used the time required toconverge to the same tolerance as the indicator fortraining speed. Figure 8 shows a performance compari-son of the training algorithm, in which the CGB algo-rithm is the fastest for this work. The SCG and RPalgorithms performed well, and were nearly as fast asCGB, but the CGB algorithm demonstrated more gentleconvergence than did the SCG and RP algorithms.Hence, we chose the CGB algorithm for training theBP neural network.
Training had the potential to cause overfitting in thisstudy. The level of neural-network performance typicallyimproves after adding neurons to the hidden layer. Neu-ral networks trained using a backprop do not “memo-rize” the training data, which is why they work welleven with training data that includes some (but notsubstantial) random noise. In this study, the number ofneurons in the hidden layer was decided using trial anderror: 50 for the BP neural network, and 70 for theLVQ neural network. The optimal BP and LVQ neuralnetwork structures were determined after several trials.
Fig. 8 Comparison of theperformance of the trainingalgorithm for this work
Table 2 Classification performance by neural network
VBS BBS TBS CS WS SS
Form a: classification performance by BP neural network with 17-50-6nodes
VBS 18 2
BBS 1 18 1
TBS 20
CS 3 17
WS 20
SS 20
Form b: classification performance by LVQ neural network with 17-70-6nodes
VBS 20
BBS 19 1
TBS 1 18 1
CS 2 18
WS 1 18 1
SS 1 2 17
58, Page 8 of 10 J Med Syst (2014) 38:58

The classification accuracy of the BP and LVQ neuralnetworks were 94.16 % and 93.33 %, respectively.
Table 2 presents the classification accuracy obtained usingthe neural network to analyze PS. The optimal results for TBS,WS, and SS were obtained using the BP neural network andCGB algorithm. Regarding the VBS, BBS, and CS, the opti-mal results were obtained using the LVQ neural network.Hence, the two neural networks were combined to form a 2-stage classifier. To investigate the performance of this classi-fier, we used the ROC analysis. Figure 9 shows the results.
Conclusion
Traditional auscultation exhibits numerous limits and incon-veniences, and cannot provide frequency information regard-ing PS. A doctor must have specialized knowledge and expe-rience to differentiate various PS. Therefore, we proposed acomputerized system for use in PS analysis.
We decomposed PS into six frequency bands by usingwavelet transform and evaluated the effectiveness of 14 wave-let bases in analyzing PS signals. The simulation resultsindicated that the db8 wavelet yielded the optimal efficiency.We constructed a classifier that could six types of sounds:VBS, BBS, TBS, CS, WS, and SS. We used a 2-stage classi-fier composed of BP and LVQ neural networks to improve theclassification accuracy by using a haploid neural network. Theclassification accuracy of the proposed 2-stage classifier was95 %.
The results can be summarized as follows:
& The 2-stage classifier demonstrates high classification ac-curacy for identifying PS.
& The CGB algorithm demonstrates enhanced convergencecompared with the conventional BP algorithm for trainingthe BP neural network.
& The db8 wavelet exhibited enhanced classification effi-ciency compared with other common wavelets.
& Constructing a computerized system for analyzing respi-ratory sounds improves the limits of traditionalauscultation.
& The proposed system could be used to facilitate diagnos-ing pulmonary diseases.
Conflict of interest The authors declare that they have no conflicts ofinterest.
References
1. Earis, J. E., and Cheetham, B. M. G., Current methods used forcomputerized respiratory sound analysis. Eur. Respir. Rev. 10:586–590, 2000.
2. Polat, H., and Guler, I., A simple computer-based measurement andanalysis system of pulmonary auscultation sounds. J Med. Syst. 28:665–667, 2004.
3. Guler, E., Sankur, B., Kahya, Y., and Raudys, S., Two-stage classi-fication of respiratory sound patterns. J. Comput. Biol. Med. 35:67–83, 2005.
4. Pittner, S., and Kamarthi, S. V., Feature extraction from waveletcoefficients for pattern recognition tasks. IEEE Trans. Pattern Anal.Mach. Intell. 21:83–88, 1999.
5. Hadjileontiadis, L. J., and Panas, S. M., Autoregressive modeling oflung sounds using higher-order statistics: Estimation of source andtransmission. IEEE Signal Processing Workshop on Higher-OrderStatistics, pp. 4–8, 1997.
6. Hadjileontiadis, L. J., Wavelet-based enhancement of lung and bowelsounds using fractal dimension thresholding-Part I: Methodology.IEEE Trans. Biomed. Eng. 52:1143–1148, 2005.
7. Hadjileontiadis, L. J., Wavelet-based enhancement of lung and bowelsounds using fractal dimension thresholding-Part II: Applicationresults. IEEE Trans. Biomed. Eng. 52:1050–1064, 2005.
8. Homs-Corbera, A., Fiz, J. A., Morera, J., and Jane, R., Time-frequency detection and analysis of wheezes during forced exhala-tion. IEEE Trans. Biomed. Eng. 51:182–186, 2004.
9. Bahoura, M., and Pelletier, C., Respiratory sounds classificationusing cepstral analysis and Gaussian mixture models. IEEE Trans.Electr. Comput. Eng. 3:1309–1312, 2004.
10. Kahya, Y. P., Yeginer, M., and Bilgic, B. Classifying respiratorysounds with different feature sets. IEEE Conferences on 28thEngineering in Medicine and Biology Society, 2856–2859, 2006.
11. Sezgin, M. C., Dokur, Z., Olmez, T., and Korurek, M., Classificationof respiratory sounds by using an artificial neural network. 23rdAnnual International Conference on Engineering in Medicine andBiology Society :697–699, 2001.
12. Dokur, Z., Respiratory sound classification by using an incrementalsupervised neural network. Springer-Verlag London Limited, 309–319, 2008.
Fig. 9 The ROC curve for BPand LVQ
J Med Syst (2014) 38:58 Page 9 of 10, 58

13. Guler, I., Polat, H., and Ergun, U., Combining neural network andgenetic algorithm for prediction of lung sounds. J. Med. Syst. 29:217–231, 2005.
14. Waitman, R. L., Clarkson, P. K., Barwise, A. J., and King, H. P.,Representation and classification of breath sounds recorded in anintensive care set. J. Clin. Monit. Comput. 16:95–105, 2000.
15. Feng, J., Krishnan, S., and Sattar, F., Adventitious sounds identifica-tion and extraction using temporal-spectral dominance-based fea-tures. IEEE Trans. Biomed. Eng. 58:3078–3087, 2011.
16. Er, O., Temurtas, F., and Tanrıkulu, A., Tuberculosis disease diagno-sis using artificial neural networks. J. Med. Syst. 34:299–302, 2010.
17. Sovijarvi, A. R. A., and Malmberg, L. P., Characteristics of breathsounds and adventitious respiratory sounds. Eur. Respir. Rev. 10:591–596, 2000.
18. Taplidou, S. A., and Hadjileontiadis, L. J., Analysis of wheezes usingwavelet higher order spectral features. IEEE Trans. Biomed. Eng. 57:1596–1610, 2010.
19. Wang, W., and Jianu, O. A., A smart sensing unit for vibrationmeasurement and monitoring. IEEE/ASME Trans. Mechatron. 15:70–78, 2010.
20. Lin, Y. D., Tsai, C. D., Huang, H. H., Chiou, D. C., and Wu, C. P.,Preamplifier with a second-order high-pass filtering characteristic.IEEE Trans. Biomed. Eng. 46:609–612, 1999.
21. Hwee, C. L., and Shirinzadeh, B., Neural network motion trackingcontrol of piezo-actuated flexure-based mechanisms for micro-/nanomanipulation. IEEE/ASME Trans. Mechatron. 14:517–527,2009.
22. Stethographics, http://www.stethographics.com. Accessed: 2010-Feb.
23. Steven, L., Understanding lung sounds, 3rd edition. Saunders,Philadelphia, 2002.
24. Horng, M. H., Performance evaluation of multiple classification ofthe ultrasonic supraspinatus images by using ML, RBFNN and SVMclassifiers. J. Expert Syst. Appl. 37:4146–4155, 2010.
25. Sezer, E., Isik, H., and Saracoglu, E., Employment and comparison ofdifferent artificial neural networks for epilepsy diagnosis from EEGsignals. J. Med. Syst. 36:347–362, 2012.
26. Kocer, S., and Canal, M. R., Classifying epilepsy diseases usingartificial neural networks and genetic algorithm. J. Med. Syst. 35:489–498, 2011.
58, Page 10 of 10 J Med Syst (2014) 38:58


