Applications 1.4 - Standard Deviation and Scattergraphs · · 2017-02-275 7 11 7 7 7 8 7 9 6 8 6...
12
N5 National 5 Portfolio Applications 1.4 - Standard Deviation and Scattergraphs Section A - Revision This section will help you revise previous learning which is required in this topic. R1 I can calculate the mean, mode and median of a sample of data 1. The following list of numbers represents the number of goals scored by Manchester United in the 2010/11 Champions League. 0 1 1 3 1 1 0 2 1 2 2 4 1 (a) What was the mean number of goals scored? (answer to 2 d.p’s) (b) What was the modal number of goals scored? (c) What was the median number of goals scored? 2. Twenty five S5/S6 pupils at Calderglen sit their first unit assessment and obtain the following percentages: 55 62 73 72 81 34 89 36 45 31 94 57 68 44 72 35 97 53 78 31 35 50 68 39 74 (a) Calculate the mean percentage obtained. (b) What was the median percentage obtained?
Transcript of Applications 1.4 - Standard Deviation and Scattergraphs · · 2017-02-275 7 11 7 7 7 8 7 9 6 8 6...

N5 National 5 Portfolio
Applications 1.4 - Standard Deviation and Scattergraphs
Section A - Revision
This section will help you revise previous learning which is required in this topic.
R1 I can calculate the mean, mode and median of a sample of data
1. The following list of numbers represents the number of goals scored by
Manchester United in the 2010/11 Champions League.
0 1 1 3 1 1 0
2 1 2 2 4 1
(a) What was the mean number of goals scored? (answer to 2 d.p’s)
(b) What was the modal number of goals scored?
(c) What was the median number of goals scored?
2. Twenty five S5/S6 pupils at Calderglen sit their first unit assessment and
obtain the following percentages:
55 62 73 72 81
34 89 36 45 31
94 57 68 44 72
35 97 53 78 31
35 50 68 39 74
(a) Calculate the mean percentage obtained.
(b) What was the median percentage obtained?

Standard Deviation and Scattergraphs
Calderglen High School - Mathematics Department
2
Section B - Assessment Standard Section
This section will help you practise for your Assessment Standard Test for Standard
deviation and Scatter Graphs. (Applications 1.4)
1. (a) During his lunch hour, Luke records the number of birds that visit his
bird-table.
The numbers recorded last week were:
28 32 14 19 18 26 31.
Find the mean and standard deviation for this data.
(b) Over the same period, Luke’s friend, Erin also recorded the number of
birds visiting her bird-table.
Erin’s recording have a mean of 25 and a standard deviation of 5.
Make two valid comparisons between the friends’ recordings.
2. (a) Fiona checks out the price of a litre of milk in several shops.
The prices in pence are:
49 44 41 52 47 43.
Find the mean and standard deviation of these milk prices.
(b) Fiona also checks out the price of a kilogram of sugar in the same shops
and finds that the standard deviation of the prices is 2·6.
Make one valid comparison between the two sets of prices.

Standard Deviation and Scattergraphs
Calderglen High School - Mathematics Department
3
3. The results for a group of students who sat tests in mathematics and physics
are shown below.
These marks are shown on the scattergraph below.
A line of best fit has been drawn.
(a) Find the gradient of the line of best fit.
(b) Hence, find the equation of the line of best fit.
(c) Another pupil scored 76% in the mathematics test but was absent from
the physics test.
Use your answer to part (b) to predict his physics mark.
(10, 25)
(30, 35)

Standard Deviation and Scattergraphs
Calderglen High School - Mathematics Department
4
4. The temperature, in degrees Celsius, at mid-day in a seaside town and the
sales, in pounds, of umbrellas are shown in the scattergraph below.
A line of best fit has been drawn.
(a) Find the gradient of the line of best fit.
(b) Hence, find the equation of the line of best fit in terms of T and S.
(c) Use your answer to part (b) to predict the sales for a day when the
temperature is 30 degrees Celsius.
(5, 110)
(15, 70)

Standard Deviation and Scattergraphs
Calderglen High School - Mathematics Department
5
Section C – Operational Skills Section
This section provides problems with the operational skills associated with Trig
Equations and Graphs.
O1 I can calculate the interquartile range of a sample
1. A teacher recorded the marks, out of ten, of a group of pupils for a spelling
test.
5 5 6 6 6 6 6 7 7 7 7 7 7 8
8 8 8 8 8 8 8 8 8 8 9 9 9 9
9 9 9 9 9 10 10
Find the median and the interquartile range for this data.
2. The pupils in a primary class recorded their shoe size as shown below.
8 7 6 5 6
5 7 11 7 7
7 8 7 9 6
8 6 5 9 7
Find the median and the interquartile range for this data.
3. Sandi takes the bus to work each day.
Over a two week period, she records the number of minutes the bus is late
each day. The results are shown.
5 6 15 0 6
11 2 9 8 7
Find the median and the interquartile range for this data.

Standard Deviation and Scattergraphs
Calderglen High School - Mathematics Department
6
O2 I can calculate the standard deviation of a sample.
1. The heights, in centimetres, of seven netball players are given below.
173 176 168 166 170 180 171
For this sample, calculate the mean and standard deviation.
2. A machine is used to put drawing pins into boxes.
A sample of 8 boxes is taken and the number of drawing pins in each is
counted.
The results are shown
102 102 101 98 99 101 103 102
For this sample, calculate the mean and standard deviation.
3. During his lunch break, Luke recorded the number of birds that visited his
bird-table.
The number recorded are given below.
28 32 14 19 18 26 31
For this sample, calculate the mean and standard deviation.
4. A rugby team scored the following points in a series of matches.
13 7 0 9 7 8 5
For this sample, calculate the mean and standard deviation.
5. (a) Show that the standard deviation of 1, 1, 1, 2 and 5 is equal to √3.
(b) Write down the standard deviation of 101, 101, 101, 102 and 105.

Standard Deviation and Scattergraphs
Calderglen High School - Mathematics Department
7
O3 I can a find the equation of the line of best fit drawn on to a scattergraph.
1. A quiz has a sports round and a film round. The scores for each team taking
part are plotted on the scattergraph shown and a line of best fit is drawn.
Find the equation of this line of best fit.
2. The results for a group of students who sat tests in mathematics and physics
are shown on the scattergraph.
Find the equation of
the line of best fit.
y
x
sport
score
film score
33
21
0 9 15

Standard Deviation and Scattergraphs
Calderglen High School - Mathematics Department
8
3. McGregor’s Burgers sells fast food.
The graph shows the relationship between the amount of fat, F grams, and the number of calories, C, in some of their sandwiches.
A line of best fit has been drawn.
Point A represents a sandwich which has 5 grams of fat and 200 calories.
Point B represents a sandwich which has 25 grams of fat and 500 calories.
(a) Find the equation of the line of best fit in terms of C and F.
(b) A Super Deluxe sandwich contains 40 grams of fat.
Use your answer to part (a) to estimate the number of calories this
sandwich contains.
Show your working.
C
F
Calories
Fat 0
A
B

Standard Deviation and Scattergraphs
Calderglen High School - Mathematics Department
9
Section D - Reasoning Skills Section
This section provides problems with Standard Deviation and Scattergraphs.
1. The marks of a group of students in their October test are listed below.
41 56 68 59 43 37
70 58 61 47 75 66
(a) For this sample, calculate the median and interquartile range.
The teacher arranges extra homework before the next test in December. In
this test, the median is 67 and the interquartile range is 14.
(b) Make two appropriate comments comparing the marks in the October
and December tests.
2. A ten pin bowling team recorded the following six scores in a match
134 102 127 98 104 131
(a) For this sample, calculate the mean and the standard deviation.
In their second match the scores have a mean of 116 and a standard
deviation of 12 ∙ 2.
(b) Which of the following statements is/are true
(1) The totals of the scores in both matches are the same.
(2) The total of the scores is greater in the first match.
(3) The total of the scores is greater in the second match.
(4) In the first match the scores were more spread out.
(5) In the second match the scores were more spread out.
3. Tom looked at the cost of 10 different flights to New York. He calculated
the mean cost was £360 and the standard deviation was £74.
A tax of £12 is added to each flight.
Write down the new mean and standard deviation.
Standard Deviation and Scattergraphs
Calderglen High School - Mathematics Department
10
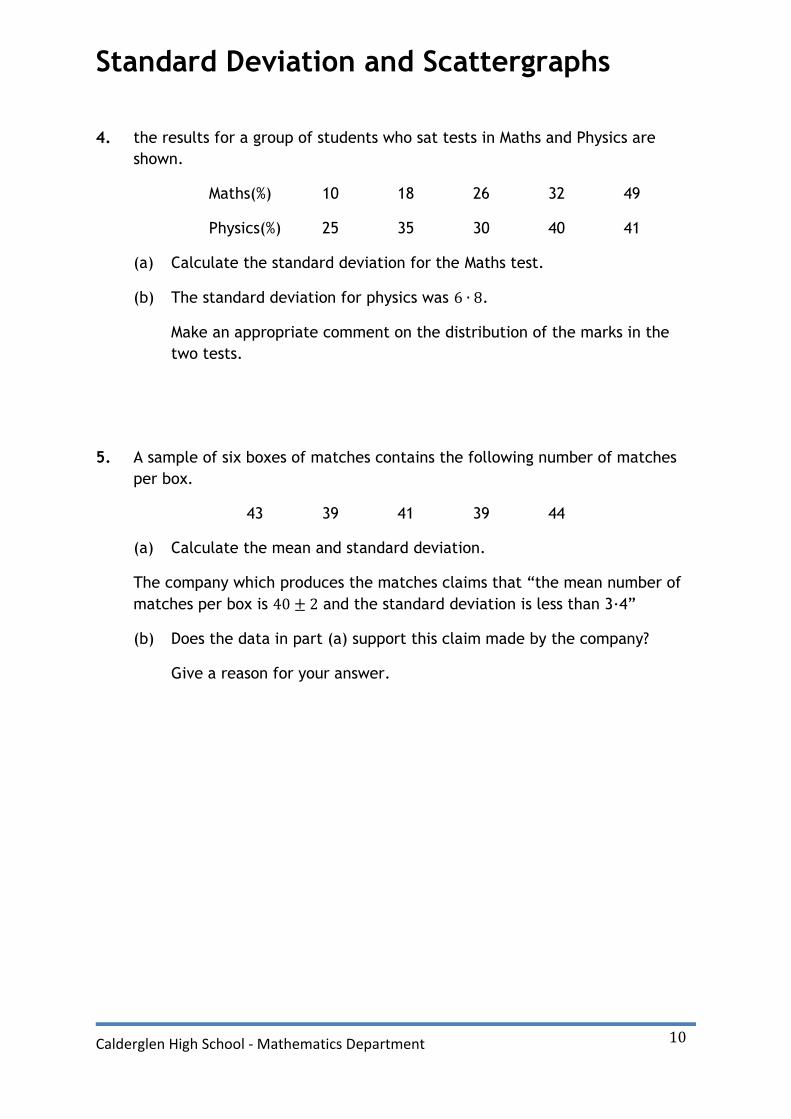
4. the results for a group of students who sat tests in Maths and Physics are
shown.
Maths(%) 10 18 26 32 49
Physics(%) 25 35 30 40 41
(a) Calculate the standard deviation for the Maths test.
(b) The standard deviation for physics was 6 ∙ 8.
Make an appropriate comment on the distribution of the marks in the
two tests.
5. A sample of six boxes of matches contains the following number of matches
per box.
43 39 41 39 44
(a) Calculate the mean and standard deviation.
The company which produces the matches claims that “the mean number of
matches per box is 40 ± 2 and the standard deviation is less than 3∙4”
(b) Does the data in part (a) support this claim made by the company?
Give a reason for your answer.

Standard Deviation and Scattergraphs
Calderglen High School - Mathematics Department
11
Answers
Section A – Revision
(1) (a) 1∙46 (b) 1 (c) 1
(2) (a) 59∙82% (b) 57%
Section B - Practice Assessment Standard Questions
(1) (a) mean = 24 s = 7
(b) On average, more birds visit Erin.
Number of birds visiting Luke varies more.
(2) (a) mean = 46 s= 4·1
(b) Less variation in price of sugar than there is in milk.
(3) (a) 𝑚 = 1
2 (b) 𝑦 =
1
2𝑥 + 20 (c) 58%
(4) (a) 𝑚 = −4 (b) 𝑆 = −4𝑇 + 130 (c) £10.
Section C – Operational Skills
O1
(1) Median = 8, Interquartile Range = 2.
(2) Median = 7, Interquartile Range = 2.
(3) Median = 6∙5, Interquartile Range = 4.
O2
(1) Mean = 172, Standard deviation = 4∙8.
(2) Mean = 101, Standard deviation = 1∙7.
(3) Mean = 24, Standard deviation = 6∙7.
(4) Mean = 7, Standard deviation = 4∙0.
(5) (a) Proof (b) √𝟑

Standard Deviation and Scattergraphs
Calderglen High School - Mathematics Department
12
O3
(1) 𝑦 = 2𝑥 + 3 (2) 𝑦 =1
2𝑥 + 20
(3) (a) 𝐶 = 15𝐹 + 125 (b) 725 Calories
Section D - Reasoning Skills Section
(1) (a) mean = 58∙5, Interquartile Range = 22.
(b) After the extra homework, the median has increased from 58∙5 to 67 so
on average the students are doing better. The interquartile range has
decreased from 22 to 14 so the marks are now less spread out.
(2) (a) mean = 116, Standard deviation = 16∙3.
(b) (1) and (4)
(3) mean = £372, Standard deviation = £74.
(4) (a) Standard deviation = 14∙8
(b) The standard deviation for the Physics test is smaller than for Maths. So
the Physics marks are less variable (or more consistent).
(5) (a) Mean = 41∙2 and Standard deviation = 2∙3
(b) Yes it does as 38 ≤ 41∙2 ≤ 42 and 2∙3 < 3∙4