S1 Edexcel Solution Bank - Chapter 3pmt.physicsandmathstutor.com/download/Maths/A-level... · b...
40
Solutionbank S1 Edexcel AS and A Level Modular Mathematics Representation and summary of data – measures of dispersion Exercise A, Question 1 © Pearson Education Ltd 2008 Question: 15 students do a mathematics test. Their marks are shown opposite. a Find the value of the median. b Find Q 1 and Q 3 . c Work out the interquartile range. 7 4 9 7 6 10 12 11 3 8 5 9 8 7 3 Solution: a 3,3,4,5,6,7,7,7,8,8,9,9,10,11,12 Median: therefore 8 th value is needed. Median = 7 b therefore the 4 th value is needed Q 1 = 5 therefore the 12 th value is needed Q 3 = 9 c IQR = 9 - 5 = 4 15 2 = 7.5 Q 1 : 15 4 = 3.75 Q 3 :3 × 15 4 = 11.25 Page 1 of 1 Heinemann Solutionbank: Statistics 1 S1 3/21/2013 file://C:\Users\Buba\kaz\ouba\s1_3_a_1.html PhysicsAndMathsTutor.com
Transcript of S1 Edexcel Solution Bank - Chapter 3pmt.physicsandmathstutor.com/download/Maths/A-level... · b...

Solutionbank S1 Edexcel AS and A Level Modular Mathematics Representation and summary of data – measures of dispersion Exercise A, Question 1
© Pearson Education Ltd 2008
Question:
15 students do a mathematics test. Their marks are shown opposite.
a Find the value of the median.
b Find Q1 and Q3.
c Work out the interquartile range.
7 4 9 7 610 12 11 3 85 9 8 7 3
Solution:
a 3,3,4,5,6,7,7,7,8,8,9,9,10,11,12
Median: therefore 8th value is needed. Median = 7
b therefore the 4th value is needed Q1 = 5
therefore the 12th value is needed Q3 = 9
c IQR = 9 − 5 = 4
15
2= 7.5
Q1 :15
4= 3.75
Q3 : 3 × 15
4= 11.25
Page 1 of 1Heinemann Solutionbank: Statistics 1 S1
3/21/2013file://C:\Users\Buba\kaz\ouba\s1_3_a_1.html
PhysicsAndMathsTutor.com

Solutionbank S1 Edexcel AS and A Level Modular Mathematics Representation and summary of data – measures of dispersion Exercise A, Question 2
© Pearson Education Ltd 2008
Question:
A group of workers were asked to write down their weekly wage. The wages were:
a Work out the range for these wages.
b Find Q1 and Q3.
c Work out the interquartile range.
£550 £400 £260 £320 £500 £450 £460 £480 £510 £490 £505
Solution:
a Range = £550 − £260 = £290
b
therefore the 3rd value is needed Q1 = 400
therefore the 9th value is needed Q3 = 505
c IQR = 505 − 400 = 105
260 320 400 450 460 480 490 500 505 510 550
Q1 :11
4= 2.75
Q3 : 3 × 11
4= 8.25
Page 1 of 1Heinemann Solutionbank: Statistics 1 S1
3/21/2013file://C:\Users\Buba\kaz\ouba\s1_3_a_2.html
PhysicsAndMathsTutor.com

Solutionbank S1 Edexcel AS and A Level Modular Mathematics Representation and summary of data – measures of dispersion Exercise A, Question 3
© Pearson Education Ltd 2008
Question:
A superstore records the number of hours overtime worked by their employees in one particular week. The results are shown in the table.
a Fill in the cumulative frequency column and work out how many employees the superstore had in that week.
b Find Q1 and Q3.
c Work out the interquartile range.
Number of hours Frequency Cumulative frequency
0 25
1 10
2 20
3 10
4 25
5 10
Solution:
a
Superstore had 100 employees
b therefore the average of the 25th and 26th values is Q1 = 0.5
therefore the average of the 75th and 76th values is Q3 = 4
c IQR = 4 − 0.5 = 3.5
CF = 25 35 55 65 90 100
Q1 :100
4= 25
Q3 : 3 × 100
4= 75
Page 1 of 1Heinemann Solutionbank: Statistics 1 S1
3/21/2013file://C:\Users\Buba\kaz\ouba\s1_3_a_3.html
PhysicsAndMathsTutor.com

Solutionbank S1 Edexcel AS and A Level Modular Mathematics Representation and summary of data – measures of dispersion Exercise A, Question 4
© Pearson Education Ltd 2008
Question:
A moth trap was set every night for five weeks. The number of moths caught in the trap was recorded. The results are shown in the table.
Find the interquartile range.
Number of moths Frequency
7 2
8 5
9 9
10 14
11 5
Solution:
therefore the 9th value is needed Q1 = 9
therefore the 27th value is needed Q3 = 10
IQR = 10 − 9 = 1
CF = 2 7 16 30 35
Q1 :35
4= 8.75
Q3 : 3 × 35
4= 26.25
Page 1 of 1Heinemann Solutionbank: Statistics 1 S1
3/21/2013file://C:\Users\Buba\kaz\ouba\s1_3_a_4.html
PhysicsAndMathsTutor.com
Solutionbank S1 Edexcel AS and A Level Modular Mathematics Representation and summary of data – measures of dispersion Exercise A, Question 5
© Pearson Education Ltd 2008
Question:
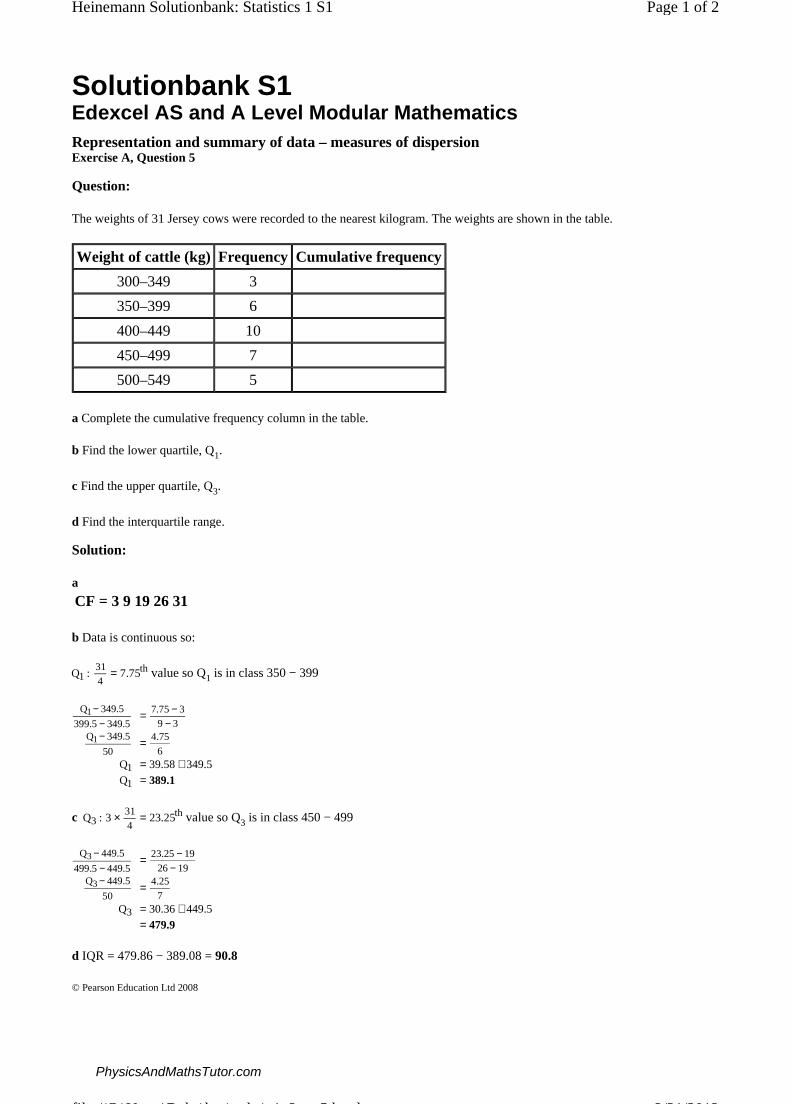
The weights of 31 Jersey cows were recorded to the nearest kilogram. The weights are shown in the table.
a Complete the cumulative frequency column in the table.
b Find the lower quartile, Q1.
c Find the upper quartile, Q3.
d Find the interquartile range.
Weight of cattle (kg) Frequency Cumulative frequency
300–349 3
350–399 6
400–449 10
450–499 7
500–549 5
Solution:
a
b Data is continuous so:
value so Q1 is in class 350 − 399
c value so Q3 is in class 450 − 499
d IQR = 479.86 − 389.08 = 90.8
CF = 3 9 19 26 31
Q1 :314
= 7.75th
Q1− 349.5
399.5− 349.5= 7.75− 3
9 − 3Q1− 349.5
50= 4.75
6Q1 = 39.58+ 349.5Q1 = 389.1
Q3 : 3 × 314
= 23.25th
Q3− 449.5
499.5− 449.5= 23.25− 19
26− 19Q3− 449.5
50= 4.25
7Q3 = 30.36+ 449.5
= 479.9
Page 1 of 2Heinemann Solutionbank: Statistics 1 S1
3/21/2013file://C:\Users\Buba\kaz\ouba\s1_3_a_5.html
PhysicsAndMathsTutor.com

Page 2 of 2Heinemann Solutionbank: Statistics 1 S1
3/21/2013file://C:\Users\Buba\kaz\ouba\s1_3_a_5.html
PhysicsAndMathsTutor.com

Solutionbank S1 Edexcel AS and A Level Modular Mathematics Representation and summary of data – measures of dispersion Exercise A, Question 6
© Pearson Education Ltd 2008
Question:
The number of visitors to a hospital in a week was recorded. The results are shown in the table.
Giving your answers to the nearest whole number find:
a the lower quartile Q1, b the upper quartile Q3, c the interquartile range.
Number of visitors Frequency
500–1000 10
1000–1500 25
1500–2000 15
2000–2500 5
2500–3000 5
Solution:
Data is continuous so
a
value so Q1 is in class 1000 − 1500
b value so Q3 is in class 1500 − 2000
c IQR = 1833 − 1100 = 733
CF = 10 35 50 55 60
Q1 :60
4= 15th
Q1− 1000
1500− 1000= 15− 10
35− 10Q1− 1000 = 100
Q1 = 1100
Q3 : 3 × 60
4= 45th
Q3− 1500
2000− 1500= 45− 35
50− 35Q3− 1500 = 333.33
Q3 = 1833
Page 1 of 1Heinemann Solutionbank: Statistics 1 S1
3/21/2013file://C:\Users\Buba\kaz\ouba\s1_3_a_6.html
PhysicsAndMathsTutor.com
Solutionbank S1 Edexcel AS and A Level Modular Mathematics Representation and summary of data – measures of dispersion Exercise A, Question 7
© Pearson Education Ltd 2008
Question:
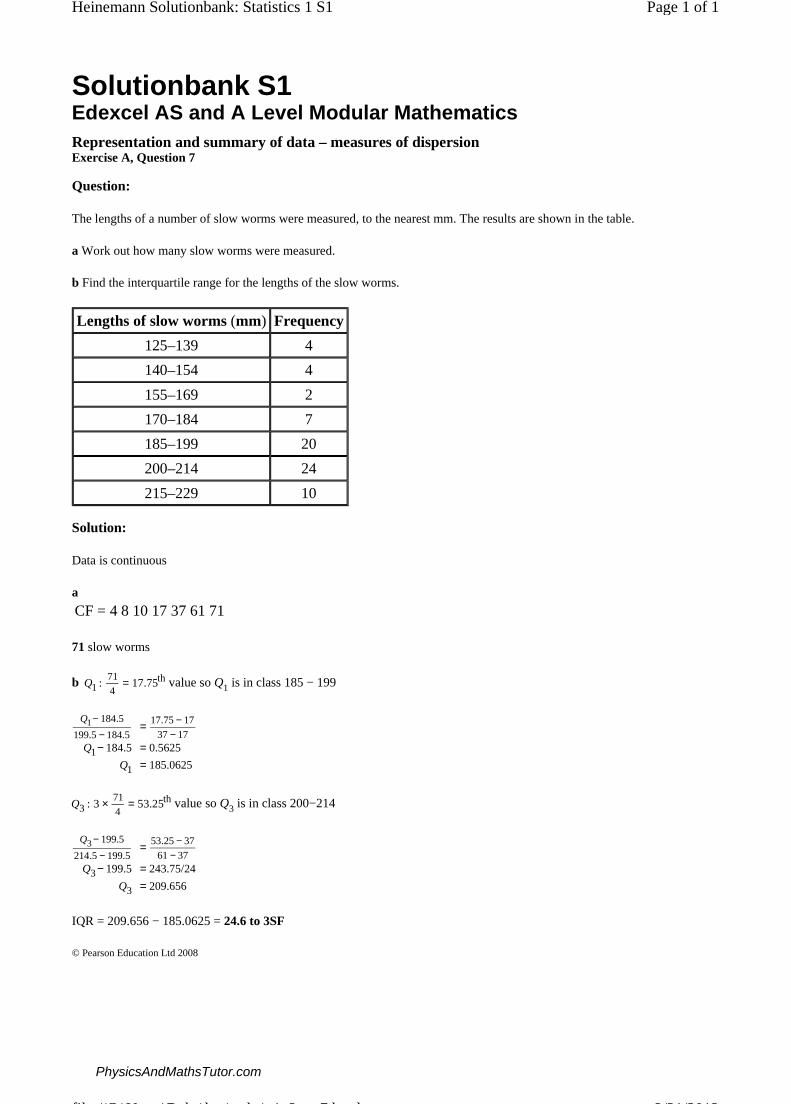
The lengths of a number of slow worms were measured, to the nearest mm. The results are shown in the table.
a Work out how many slow worms were measured.
b Find the interquartile range for the lengths of the slow worms.
Lengths of slow worms (mm) Frequency
125–139 4
140–154 4
155–169 2
170–184 7
185–199 20
200–214 24
215–229 10
Solution:
Data is continuous
a
71 slow worms
b value so Q1 is in class 185 − 199
value so Q3 is in class 200−214
IQR = 209.656 − 185.0625 = 24.6 to 3SF
CF = 4 8 10 17 37 61 71
Q1 :714
= 17.75th
Q1− 184.5
199.5− 184.5= 17.75− 17
37− 17Q1− 184.5 = 0.5625
Q1 = 185.0625
Q3 : 3 × 714
= 53.25th
Q3− 199.5
214.5− 199.5= 53.25− 37
61− 37Q3− 199.5 = 243.75/24
Q3 = 209.656
Page 1 of 1Heinemann Solutionbank: Statistics 1 S1
3/21/2013file://C:\Users\Buba\kaz\ouba\s1_3_a_7.html
PhysicsAndMathsTutor.com

Solutionbank S1 Edexcel AS and A Level Modular Mathematics Representation and summary of data – measures of dispersion Exercise B, Question 1
© Pearson Education Ltd 2008
Question:
A gardener counted the peas in a number of pea pods. The results are shown in the table.
a Complete the cumulative frequency column.
b Calculate the 80th percentile.
c Calculate the 40th percentile
d Calculate the 65th percentile.
Number of peas Frequency Cumulative frequency
6 8
7 12
8 36
9 18
10 15
11 10
Solution:
a CF 8, 20, 56, 74, 89, 99
b therefore 80th term needed P80 = 10
c therefore 40th term needed P40 = 8
d therefore 65th term needed P65 = 9
80th :80
100× 99 = 79.2
40th :40
100× 99 = 39.6
65th :65
100× 99 = 64.35
Page 1 of 1Heinemann Solutionbank: Statistics 1 S1
3/21/2013file://C:\Users\Buba\kaz\ouba\s1_3_b_1.html
PhysicsAndMathsTutor.com

Solutionbank S1 Edexcel AS and A Level Modular Mathematics Representation and summary of data – measures of dispersion Exercise B, Question 2
© Pearson Education Ltd 2008
Question:
A shopkeeper goes to a clothes fair. He records the costs of jeans. The costs are shown in the table.
a Complete the cumulative frequency table.
b Calculate P20.
c Calculate P80.
d Calculate the 20% to 80% interpercentile range.
Cost of jeans (£’s)Frequency Cumulative frequency
10–15 11
16–20 35
21–25 34
26–30 16
31–35 10
36–40 5
Solution:
a CF 11, 46, 80, 96, 106, 111
b
c
d 20% to 80% interpercentile = 28.25 − 17.1 = 11.15
20th :20
100× 111 = 22.2
P20− 15.5
20.5− 15.5= 22.2− 11
46− 11P20 = 17.1
80th :80100
× 111 = 88.8
P80− 25.5
30.5− 25.5= 88.8− 80
96− 80P80 = 28.25
Page 1 of 1Heinemann Solutionbank: Statistics 1 S1
3/21/2013file://C:\Users\Buba\kaz\ouba\s1_3_b_2.html
PhysicsAndMathsTutor.com
Solutionbank S1 Edexcel AS and A Level Modular Mathematics Representation and summary of data – measures of dispersion Exercise B, Question 3
© Pearson Education Ltd 2008
Question:
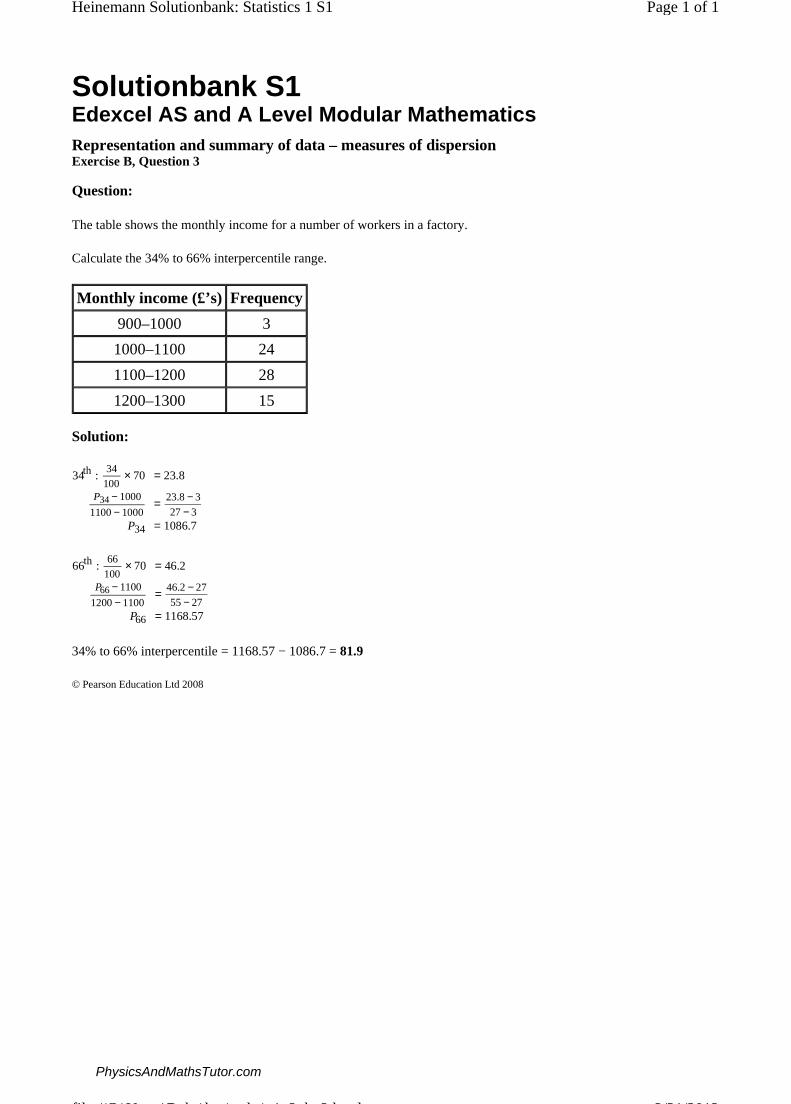
The table shows the monthly income for a number of workers in a factory.
Calculate the 34% to 66% interpercentile range.
Monthly income (£’s) Frequency
900–1000 3
1000–1100 24
1100–1200 28
1200–1300 15
Solution:
34% to 66% interpercentile = 1168.57 − 1086.7 = 81.9
34th :34
100× 70 = 23.8
P34− 1000
1100− 1000= 23.8− 3
27− 3P34 = 1086.7
66th :66
100× 70 = 46.2
P66− 1100
1200− 1100= 46.2− 27
55 − 27P66 = 1168.57
Page 1 of 1Heinemann Solutionbank: Statistics 1 S1
3/21/2013file://C:\Users\Buba\kaz\ouba\s1_3_b_3.html
PhysicsAndMathsTutor.com

Solutionbank S1 Edexcel AS and A Level Modular Mathematics Representation and summary of data – measures of dispersion Exercise B, Question 4
© Pearson Education Ltd 2008
Question:
A train travelled from Lancaster to Preston. The times, to the nearest minute, it took for the journey were recorded over a certain period. The times are shown in the table.
Calculate the 5% to 95% interpercentile range.
Time for journey (minutes) 15–16 17–18 19–20 21–22
Frequency 5 10 35 10
Solution:
5% to 95% interpercentile = 21.9 − 15.7 = 6.2
5th :5
100× 60 = 3
P5− 14.5
16.5− 14.5= 3 − 0
5 − 0P5 = 15.7
95th :95
100× 60 = 57
P95− 20.5
22.5− 20.5= 57− 50
60− 50P95 = 21.9
Page 1 of 1Heinemann Solutionbank: Statistics 1 S1
3/21/2013file://C:\Users\Buba\kaz\ouba\s1_3_b_4.html
PhysicsAndMathsTutor.com

Solutionbank S1 Edexcel AS and A Level Modular Mathematics Representation and summary of data – measures of dispersion Exercise B, Question 5
© Pearson Education Ltd 2008
Question:
A roadside assistance firm kept a record over a week of the amount of time, in minutes, people were kept waiting for assistance in a particular part of the country. The time taken was from the time the phone call was received to the arrival of the breakdown mechanic. The times are shown below.
a Work out the number of people who called for assistance.
b Calculate the 30th percentile.
c Calculate the 65th percentile.
Time Waiting (minutes) 20–30 30–40 40–50 50–60 60–70
Frequency 6 10 18 13 2
Solution:
a CF 6, 16, 34, 47, 49
b
c
30th :30
100× 49 = 14.7
P30− 30
40− 30= 14.7− 6
16 − 6P30 = 38.7
65th :65
100× 49 = 31.85
P80− 40
50− 40= 31.85− 16
34− 16P65 = 48.8
Page 1 of 1Heinemann Solutionbank: Statistics 1 S1
3/21/2013file://C:\Users\Buba\kaz\ouba\s1_3_b_5.html
PhysicsAndMathsTutor.com

Solutionbank S1 Edexcel AS and A Level Modular Mathematics Representation and summary of data – measures of dispersion Exercise C, Question 1
© Pearson Education Ltd 2008
Question:
Given that for a variable x:
Σx = 24 Σx2 = 78 n = 8
Find:
a The mean. b The variance σ2. c The standard deviation σ.
Solution:
a
b
c
Mean = 24
8= 3
Variance = 78
8− 32 = 0.75
Standard deviation= 0.75 = 0.866
Page 1 of 1Heinemann Solutionbank: Statistics 1 S1
3/21/2013file://C:\Users\Buba\kaz\ouba\s1_3_c_1.html
PhysicsAndMathsTutor.com
Solutionbank S1 Edexcel AS and A Level Modular Mathematics Representation and summary of data – measures of dispersion Exercise C, Question 2
© Pearson Education Ltd 2008
Question:
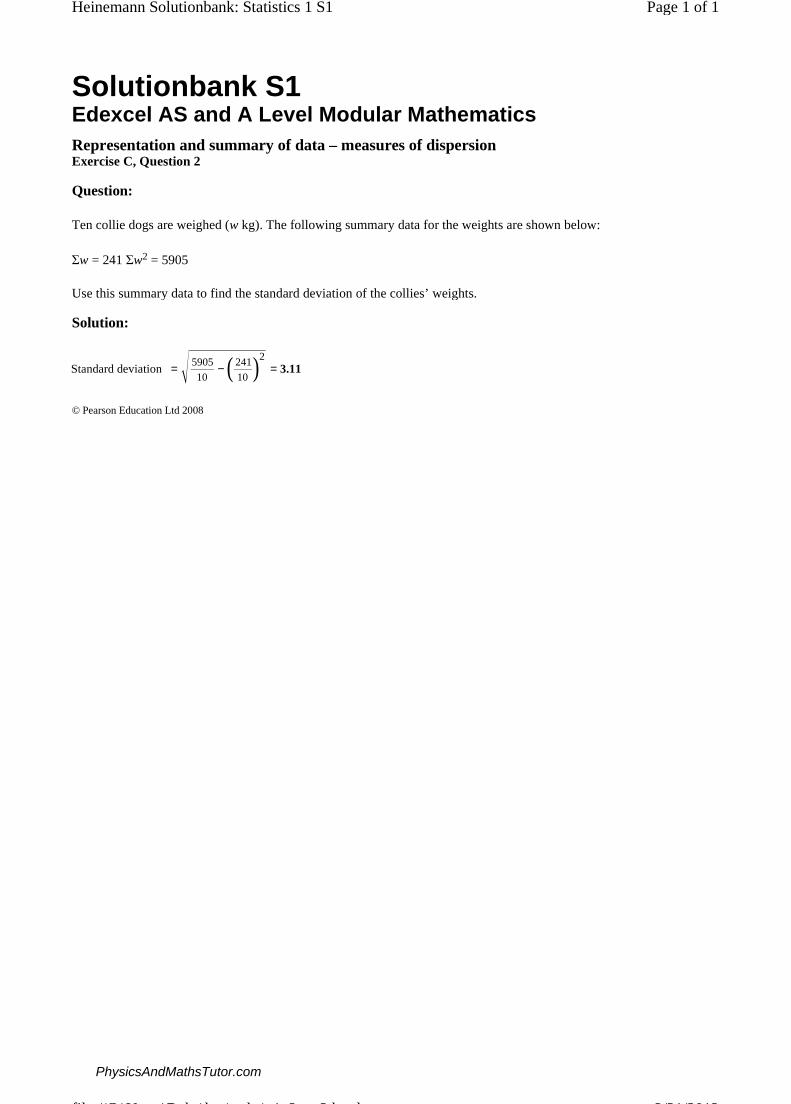
Ten collie dogs are weighed (w kg). The following summary data for the weights are shown below:
Σw = 241 Σw2 = 5905
Use this summary data to find the standard deviation of the collies’ weights.
Solution:
Standard deviation= 5905
10− ( 241
10 )2
= 3.11
Page 1 of 1Heinemann Solutionbank: Statistics 1 S1
3/21/2013file://C:\Users\Buba\kaz\ouba\s1_3_c_2.html
PhysicsAndMathsTutor.com
Solutionbank S1 Edexcel AS and A Level Modular Mathematics Representation and summary of data – measures of dispersion Exercise C, Question 3
© Pearson Education Ltd 2008
Question:
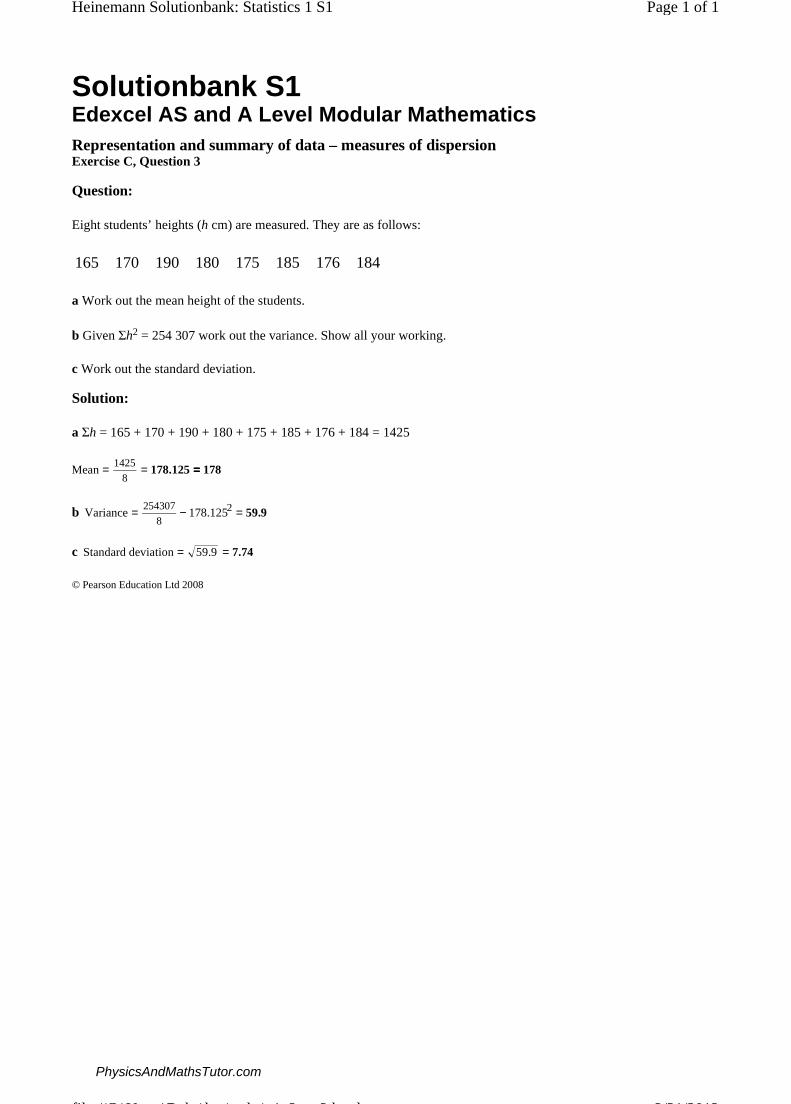
Eight students’ heights (h cm) are measured. They are as follows:
a Work out the mean height of the students.
b Given Σh2 = 254 307 work out the variance. Show all your working.
c Work out the standard deviation.
165 170 190 180 175 185 176 184
Solution:
a Σh = 165 + 170 + 190 + 180 + 175 + 185 + 176 + 184 = 1425
b
c
Mean= 1425
8= 178.125==== 178
Variance= 254307
8− 178.1252 = 59.9
Standard deviation= 59.9 = 7.74
Page 1 of 1Heinemann Solutionbank: Statistics 1 S1
3/21/2013file://C:\Users\Buba\kaz\ouba\s1_3_c_3.html
PhysicsAndMathsTutor.com

Solutionbank S1 Edexcel AS and A Level Modular Mathematics Representation and summary of data – measures of dispersion Exercise C, Question 4
© Pearson Education Ltd 2008
Question:
For a set of 10 numbers:
Σx = 50 Σx2 = 310
For a set of 15 numbers:
Σx = 86 Σx2 = 568
Find the mean and the standard deviation of the combined set of 25 numbers.
Solution:
Σx = 50 + 86 = 136
Σx2 = 310 + 568 = 878
Mean= 136
25= 5.44
Standard deviation= 878
25− (136
25 )2
= 2.35
Page 1 of 1Heinemann Solutionbank: Statistics 1 S1
3/21/2013file://C:\Users\Buba\kaz\ouba\s1_3_c_4.html
PhysicsAndMathsTutor.com

Solutionbank S1 Edexcel AS and A Level Modular Mathematics Representation and summary of data – measures of dispersion Exercise C, Question 5
© Pearson Education Ltd 2008
Question:
The number of members (m) in six scout groups was recorded. The summary statistics for these data are:
Σm = 150 Σm2 = 3846
a Work out the mean number of members in a scout group.
b Work out the standard deviation of the number of members in the scout groups.
Solution:
a
b
Mean= 150
6= 25
Standard deviation= 3846
6− (150
6 )2
= 4
Page 1 of 1Heinemann Solutionbank: Statistics 1 S1
3/21/2013file://C:\Users\Buba\kaz\ouba\s1_3_c_5.html
PhysicsAndMathsTutor.com

Solutionbank S1 Edexcel AS and A Level Modular Mathematics Representation and summary of data – measures of dispersion Exercise C, Question 6
© Pearson Education Ltd 2008
Question:
There are two routes for a worker to get to his office. Both the routes involve hold ups due to traffic lights. He records the time it takes over a series of six journeys for each route. The results are shown in the table.
a Work out the mean time taken for each route.
b Calculate the variance and the standard deviation of each of the two routes.
c Using your answers to a and b suggest which route you would recommend. State your reason clearly.
Route 1 15 15 11 17 14 12
Route 2 11 14 17 15 16 11
Solution:
a Route 1:
Route 2:
b Route 1:
Route 2:
c Route 1 as although the means are the same the standard deviation is less meaning the times are more consistent and the journey is less likely to take longer than expected.
Mean= 84
6= 14
Mean= 84
6= 14
Standard deviation= 1200
6− (84
6 )2
= 2
Standard deviation= 1208
6− (84
6 )2
= 2.31
Page 1 of 1Heinemann Solutionbank: Statistics 1 S1
3/21/2013file://C:\Users\Buba\kaz\ouba\s1_3_c_6.html
PhysicsAndMathsTutor.com
Solutionbank S1 Edexcel AS and A Level Modular Mathematics Representation and summary of data – measures of dispersion Exercise D, Question 1
© Pearson Education Ltd 2008
Question:
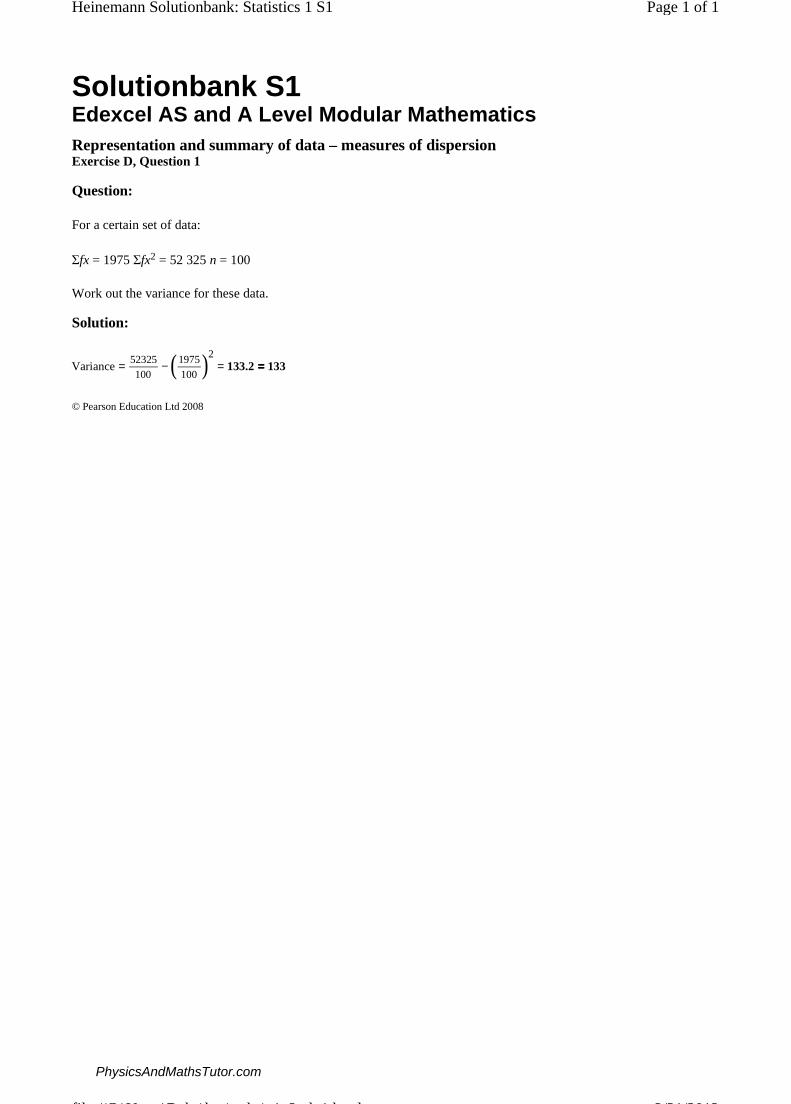
For a certain set of data:
Σfx = 1975 Σfx2 = 52 325 n = 100
Work out the variance for these data.
Solution:
Variance= 52325100
− (1975100 )
2= 133.2==== 133
Page 1 of 1Heinemann Solutionbank: Statistics 1 S1
3/21/2013file://C:\Users\Buba\kaz\ouba\s1_3_d_1.html
PhysicsAndMathsTutor.com

Solutionbank S1 Edexcel AS and A Level Modular Mathematics Representation and summary of data – measures of dispersion Exercise D, Question 2
© Pearson Education Ltd 2008
Question:
For a certain set of data
Σfx = 264 Σfx2 = 6456 n = 12
Work out the standard deviation for these data.
Solution:
Standard deviation= 6456
12− (264
12 )2
= 7.35
Page 1 of 1Heinemann Solutionbank: Statistics 1 S1
3/21/2013file://C:\Users\Buba\kaz\ouba\s1_3_d_2.html
PhysicsAndMathsTutor.com

Solutionbank S1 Edexcel AS and A Level Modular Mathematics Representation and summary of data – measures of dispersion Exercise D, Question 3
© Pearson Education Ltd 2008
Question:
Nahab asks the students in his year group how much pocket money they get per week. The results, rounded to the nearest pound, are shown in the table.
a Complete the table.
b Using the formula work out the variance for these data.
c Work out the standard deviation for these data.
Number of £’s (x) Number of students f fx fx2
8 14
9 8
10 28
11 15
12 20
Totals
Σfx2
Σf− Σfx
Σf
2
Solution:
a fx: 112, 72, 280, 165, 240, total 869
fx2: 896, 648, 2800, 1815, 2880, total 9039
total f: 85
b
c
Variance= 903985
− (86985 )
2= 1.82
Standard deviation= 1.82 = 1.35
Page 1 of 1Heinemann Solutionbank: Statistics 1 S1
3/21/2013file://C:\Users\Buba\kaz\ouba\s1_3_d_3.html
PhysicsAndMathsTutor.com
Solutionbank S1 Edexcel AS and A Level Modular Mathematics Representation and summary of data – measures of dispersion Exercise D, Question 4
© Pearson Education Ltd 2008
Question:
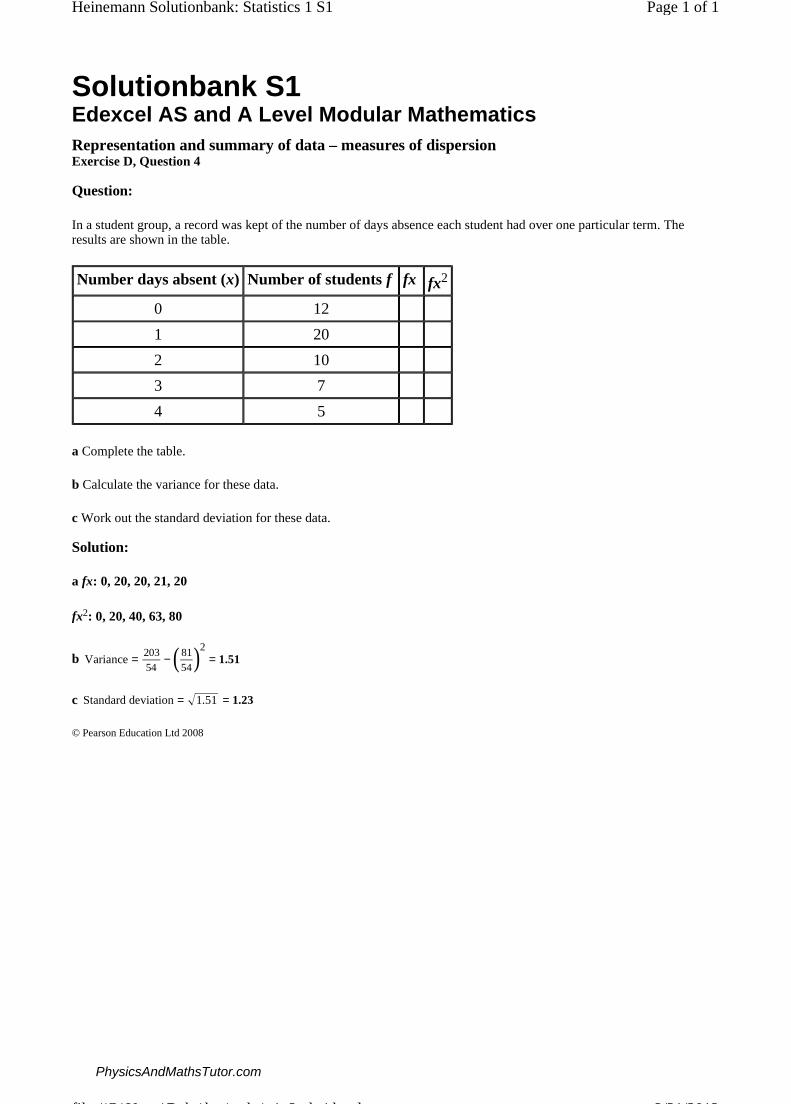
In a student group, a record was kept of the number of days absence each student had over one particular term. The results are shown in the table.
a Complete the table.
b Calculate the variance for these data.
c Work out the standard deviation for these data.
Number days absent (x) Number of students f fx fx2
0 12
1 20
2 10
3 7
4 5
Solution:
a fx: 0, 20, 20, 21, 20
fx2: 0, 20, 40, 63, 80
b
c
Variance= 20354
− ( 8154)
2= 1.51
Standard deviation= 1.51 = 1.23
Page 1 of 1Heinemann Solutionbank: Statistics 1 S1
3/21/2013file://C:\Users\Buba\kaz\ouba\s1_3_d_4.html
PhysicsAndMathsTutor.com
Solutionbank S1 Edexcel AS and A Level Modular Mathematics Representation and summary of data – measures of dispersion Exercise D, Question 5
© Pearson Education Ltd 2008
Question:
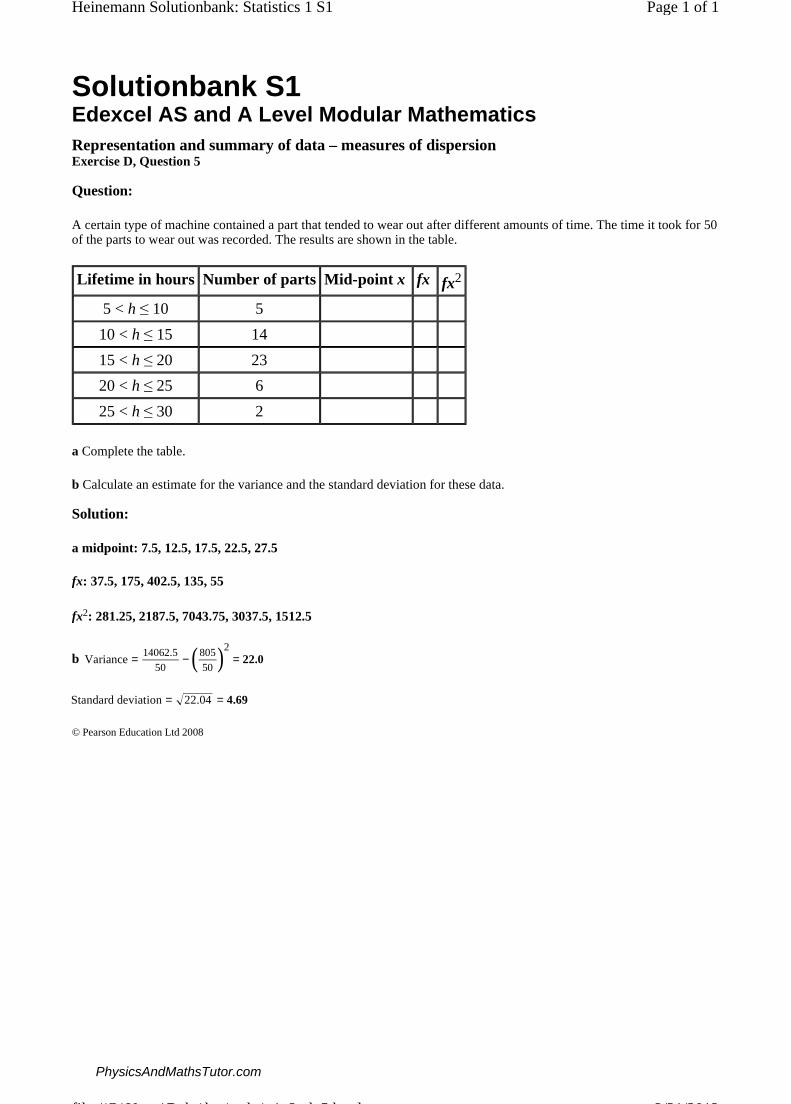
A certain type of machine contained a part that tended to wear out after different amounts of time. The time it took for 50 of the parts to wear out was recorded. The results are shown in the table.
a Complete the table.
b Calculate an estimate for the variance and the standard deviation for these data.
Lifetime in hours Number of parts Mid-point x fx fx2
5 < h ≤ 10 5
10 < h ≤ 15 14
15 < h ≤ 20 23
20 < h ≤ 25 6
25 < h ≤ 30 2
Solution:
a midpoint: 7.5, 12.5, 17.5, 22.5, 27.5
fx: 37.5, 175, 402.5, 135, 55
fx2: 281.25, 2187.5, 7043.75, 3037.5, 1512.5
b
Variance= 14062.550
− (80550 )
2= 22.0
Standard deviation= 22.04 = 4.69
Page 1 of 1Heinemann Solutionbank: Statistics 1 S1
3/21/2013file://C:\Users\Buba\kaz\ouba\s1_3_d_5.html
PhysicsAndMathsTutor.com
Solutionbank S1 Edexcel AS and A Level Modular Mathematics Representation and summary of data – measures of dispersion Exercise D, Question 6
© Pearson Education Ltd 2008
Question:
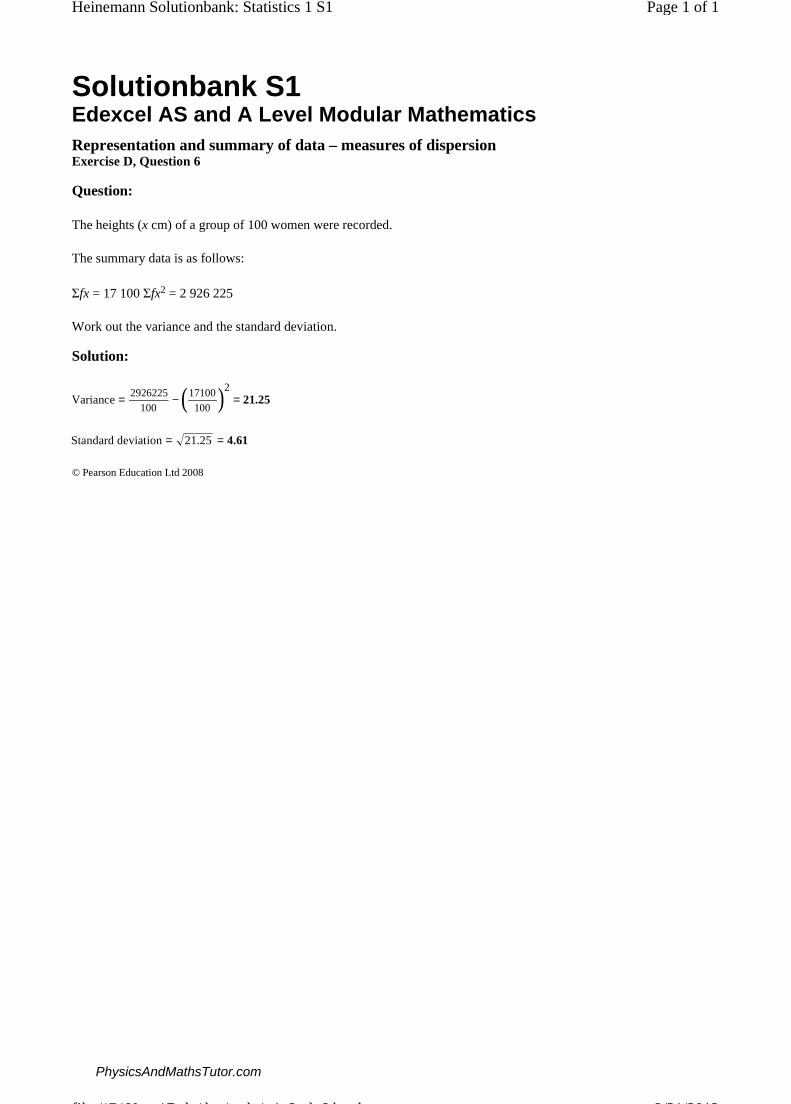
The heights (x cm) of a group of 100 women were recorded.
The summary data is as follows:
Σfx = 17 100 Σfx2 = 2 926 225
Work out the variance and the standard deviation.
Solution:
Variance= 2926225100
− (17100100 )
2= 21.25
Standard deviation= 21.25 = 4.61
Page 1 of 1Heinemann Solutionbank: Statistics 1 S1
3/21/2013file://C:\Users\Buba\kaz\ouba\s1_3_d_6.html
PhysicsAndMathsTutor.com
Solutionbank S1 Edexcel AS and A Level Modular Mathematics Representation and summary of data – measures of dispersion Exercise E, Question 1
© Pearson Education Ltd 2008
Question:
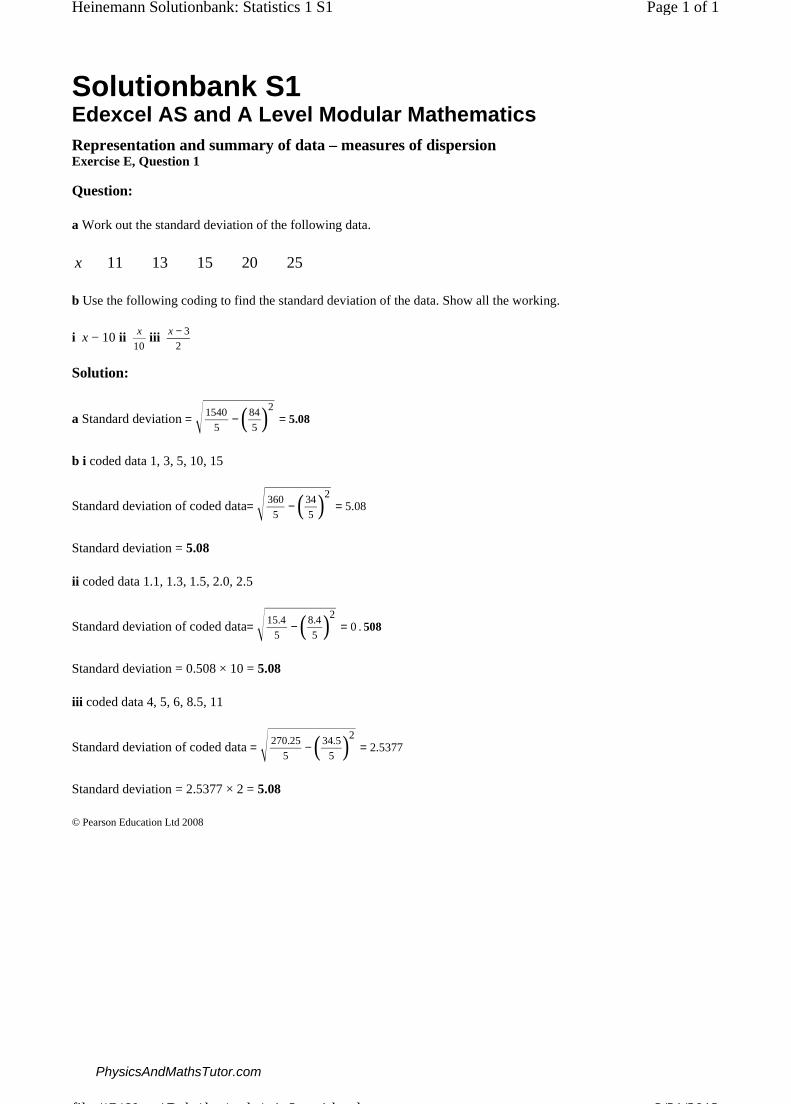
a Work out the standard deviation of the following data.
b Use the following coding to find the standard deviation of the data. Show all the working.
i x − 10 ii iii
x 11 13 15 20 25
x
10
x − 3
2
Solution:
a Standard deviation
b i coded data 1, 3, 5, 10, 15
Standard deviation of coded data
Standard deviation = 5.08
ii coded data 1.1, 1.3, 1.5, 2.0, 2.5
Standard deviation of coded data
Standard deviation = 0.508 × 10 = 5.08
iii coded data 4, 5, 6, 8.5, 11
Standard deviation of coded data
Standard deviation = 2.5377 × 2 = 5.08
= 1540
5− (84
5 )2
= 5.08
= 360
5− (34
5 )2
= 5.08
= 15.4
5− (8.4
5 )2
= 0. 508
= 270.25
5− ( 34.5
5 )2
= 2.5377
Page 1 of 1Heinemann Solutionbank: Statistics 1 S1
3/21/2013file://C:\Users\Buba\kaz\ouba\s1_3_e_1.html
PhysicsAndMathsTutor.com

Solutionbank S1 Edexcel AS and A Level Modular Mathematics Representation and summary of data – measures of dispersion Exercise E, Question 2
© Pearson Education Ltd 2008
Question:
Use the following codings to find the standard deviation of the following weights, w.
i
ii w − 200
iii
w 210 260 310 360 410
w
10
w − 10
200
Solution:
i coded data 21, 26, 31, 36, 41
Standard deviation of coded data
Standard deviation = 7.07 × 10 = 70.7
ii coded data 10, 60, 110, 160, 210
Standard deviation of coded data
Standard deviation = 70.7
iii coded data 1, 1.25, 1.5, 1.75, 2
Standard deviation of coded data
Standard deviation = 0.354 × 200 = 70.7
= 5055
5− (155
5 )2
= 7.07
= 85500
5− (550
5 )2
= 70.7
= 11.875
5− ( 7.5
5 )2
= 0.354
Page 1 of 1Heinemann Solutionbank: Statistics 1 S1
3/21/2013file://C:\Users\Buba\kaz\ouba\s1_3_e_2.html
PhysicsAndMathsTutor.com

Solutionbank S1 Edexcel AS and A Level Modular Mathematics Representation and summary of data – measures of dispersion Exercise E, Question 3
© Pearson Education Ltd 2008
Question:
a The coding gives a standard deviation of 0.01 for y. Work out the standard deviation for x.
b The coding produced a standard deviation for y of 0.045. What is the standard deviation of h?
c The coding y = x − 14 produced a standard deviation for y of 2.37. What is the standard deviation of x?
d The coding produced a standard deviation for y of 0.65. What is the standard deviation of s?
y = x − 50
28
y = h
15
y = s − 5
10
Solution:
a Standard deviation = 0.01 × 28 = 0.28
b Standard deviation = 0.045 × 15 = 0.675
c Standard deviation = 2.37
d Standard deviation = 0.65 × 10 = 6.5
Page 1 of 1Heinemann Solutionbank: Statistics 1 S1
3/21/2013file://C:\Users\Buba\kaz\ouba\s1_3_e_3.html
PhysicsAndMathsTutor.com

Solutionbank S1 Edexcel AS and A Level Modular Mathematics Representation and summary of data – measures of dispersion Exercise E, Question 4
© Pearson Education Ltd 2008
Question:
The coding y = x − 40 gives a standard deviation for y of 2.34. Write down the standard deviation of x.
Solution:
Standard deviation = 2.34
Page 1 of 1Heinemann Solutionbank: Statistics 1 S1
3/21/2013file://C:\Users\Buba\kaz\ouba\s1_3_e_4.html
PhysicsAndMathsTutor.com

Solutionbank S1 Edexcel AS and A Level Modular Mathematics Representation and summary of data – measures of dispersion Exercise E, Question 5
© Pearson Education Ltd 2008
Question:
The lifetime, x, in hours, of 70 light bulbs is shown in the table.
Using the coding estimate the standard deviation of the actual lifetime in hours of a light bulb.
Lifetime in hours Number of light bulbs
20–22 3
22–24 12
24–26 40
26–28 10
28–30 5
total 70
y = x − 1
20
Solution:
Standard deviation of coded data
Standard deviation = 0.0878 × 20 = 1.76
Lifetime in hoursNumber of lightbulbsMidpoint y = x − 120
fy fy2
20 – 22 3 21 1 3 3
22 – 24 12 23 1.1 13.2 14.52
24 – 26 40 25 1.2 48 57.6
26 – 28 10 27 1.3 13 16.9
28 – 30 5 29 1.4 7 9.8
total 70 84.2 101.82
= 101.82
70− (84.2
70 )2
= 0.0878
Page 1 of 1Heinemann Solutionbank: Statistics 1 S1
3/21/2013file://C:\Users\Buba\kaz\ouba\s1_3_e_5.html
PhysicsAndMathsTutor.com
Solutionbank S1 Edexcel AS and A Level Modular Mathematics Representation and summary of data – measures of dispersion Exercise E, Question 6
© Pearson Education Ltd 2008
Question:
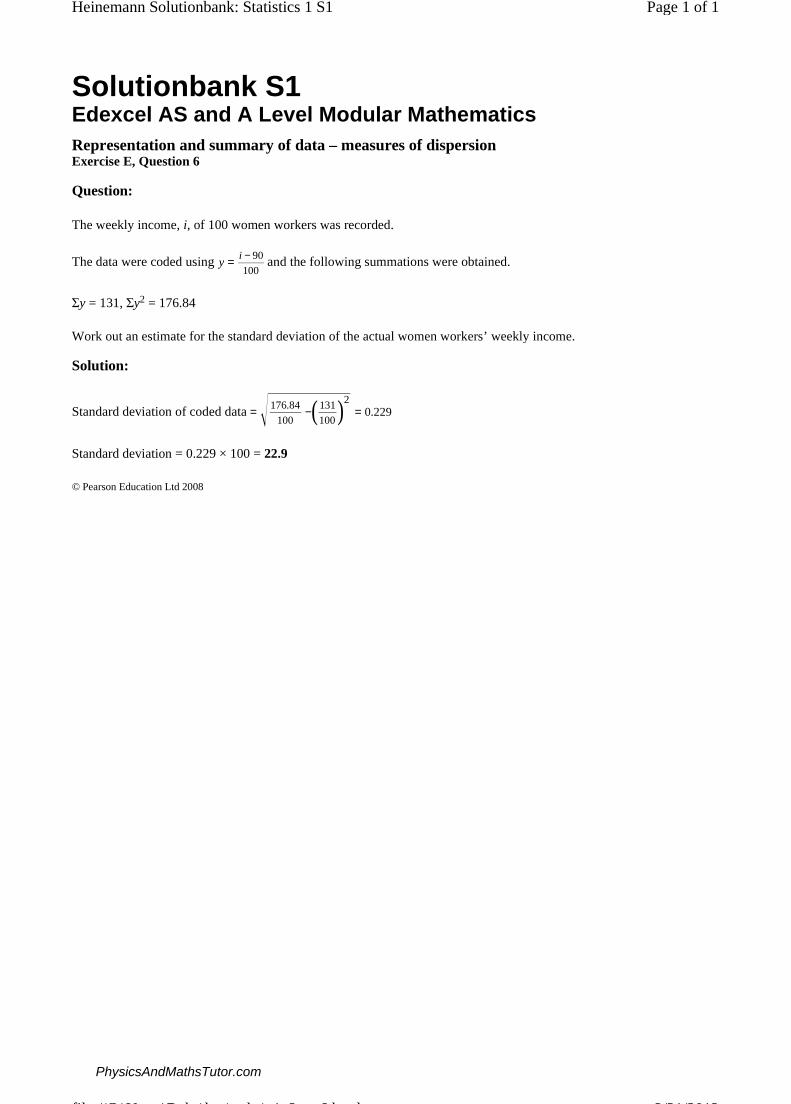
The weekly income, i, of 100 women workers was recorded.
The data were coded using and the following summations were obtained.
Σy = 131, Σy2 = 176.84
Work out an estimate for the standard deviation of the actual women workers’ weekly income.
y = i − 90
100
Solution:
Standard deviation of coded data
Standard deviation = 0.229 × 100 = 22.9
= 176.84
100−(131
100)2
= 0.229
Page 1 of 1Heinemann Solutionbank: Statistics 1 S1
3/21/2013file://C:\Users\Buba\kaz\ouba\s1_3_e_6.html
PhysicsAndMathsTutor.com
Solutionbank S1 Edexcel AS and A Level Modular Mathematics Representation and summary of data – measures of dispersion Exercise E, Question 7
© Pearson Education Ltd 2008
Question:
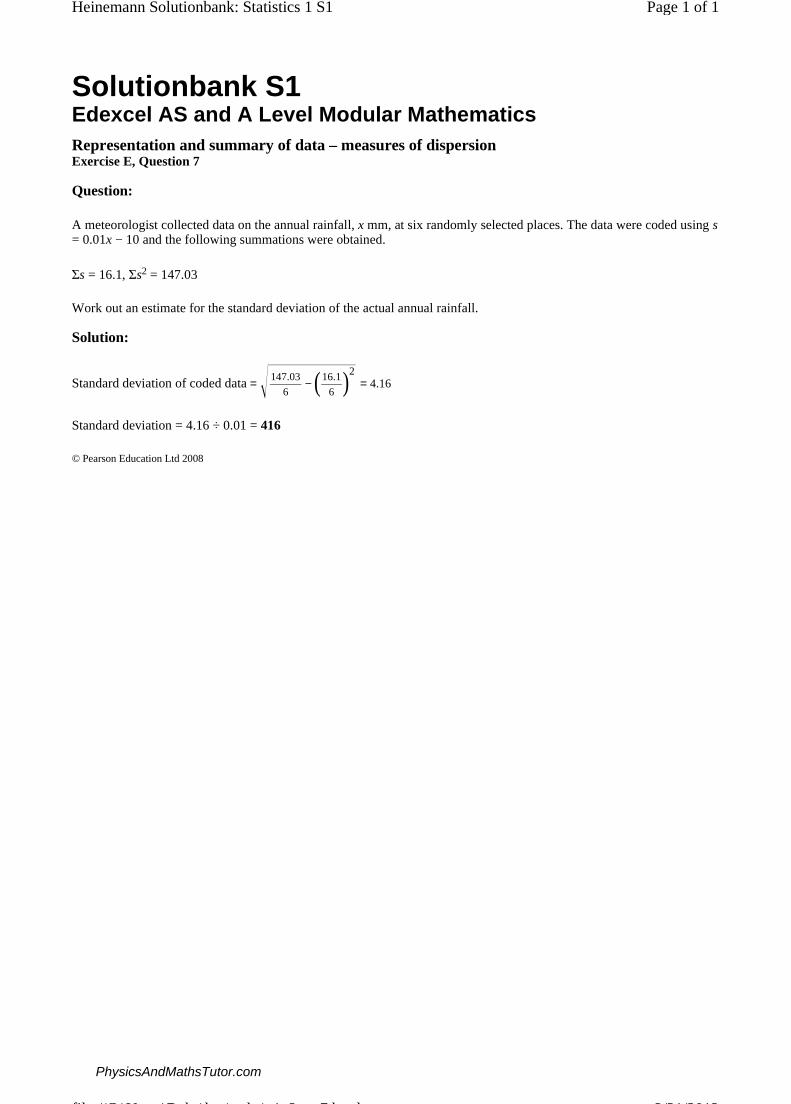
A meteorologist collected data on the annual rainfall, x mm, at six randomly selected places. The data were coded using s = 0.01x − 10 and the following summations were obtained.
Σs = 16.1, Σs2 = 147.03
Work out an estimate for the standard deviation of the actual annual rainfall.
Solution:
Standard deviation of coded data
Standard deviation = 4.16 ÷ 0.01 = 416
= 147.03
6− (16.1
6 )2
= 4.16
Page 1 of 1Heinemann Solutionbank: Statistics 1 S1
3/21/2013file://C:\Users\Buba\kaz\ouba\s1_3_e_7.html
PhysicsAndMathsTutor.com
Solutionbank S1 Edexcel AS and A Level Modular Mathematics Representation and summary of data – measures of dispersion Exercise F, Question 1
© Pearson Education Ltd 2008
Question:
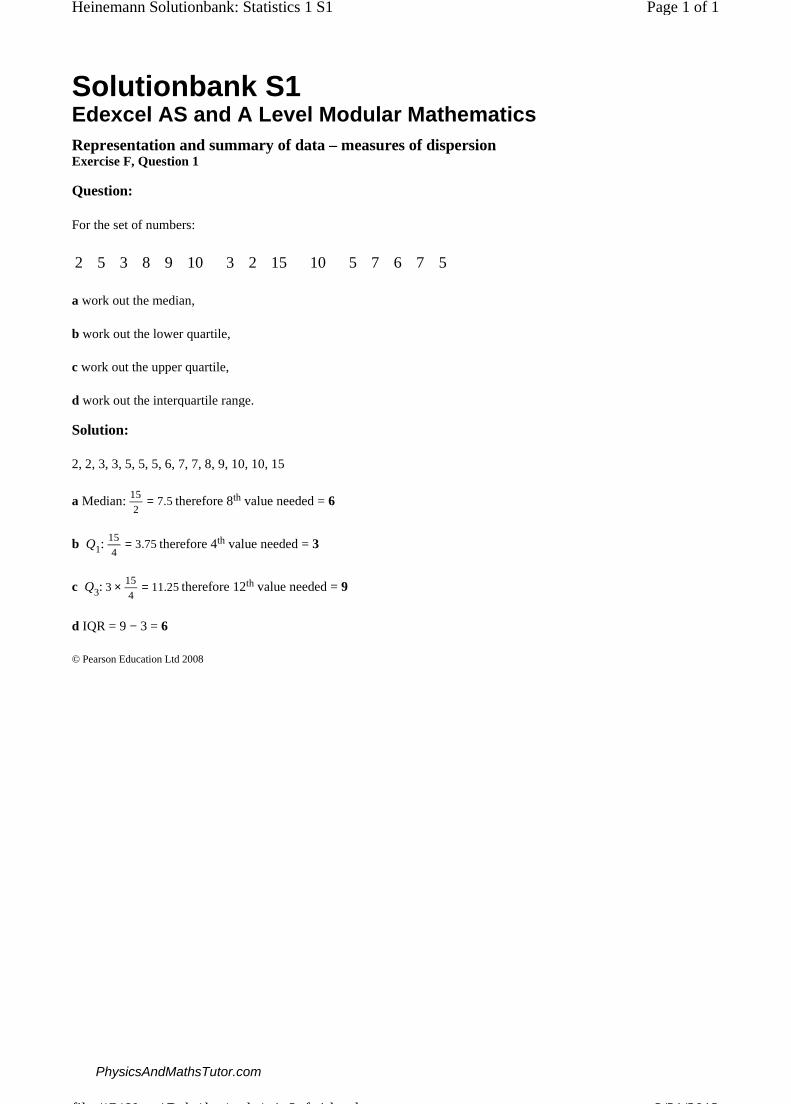
For the set of numbers:
a work out the median,
b work out the lower quartile,
c work out the upper quartile,
d work out the interquartile range.
2 5 3 8 9 10 3 2 15 10 5 7 6 7 5
Solution:
2, 2, 3, 3, 5, 5, 5, 6, 7, 7, 8, 9, 10, 10, 15
a Median: therefore 8th value needed = 6
b Q1: therefore 4th value needed = 3
c Q3: therefore 12th value needed = 9
d IQR = 9 − 3 = 6
15
2= 7.5
15
4= 3.75
3 × 15
4= 11.25
Page 1 of 1Heinemann Solutionbank: Statistics 1 S1
3/21/2013file://C:\Users\Buba\kaz\ouba\s1_3_f_1.html
PhysicsAndMathsTutor.com
Solutionbank S1 Edexcel AS and A Level Modular Mathematics Representation and summary of data – measures of dispersion Exercise F, Question 2
© Pearson Education Ltd 2008
Question:
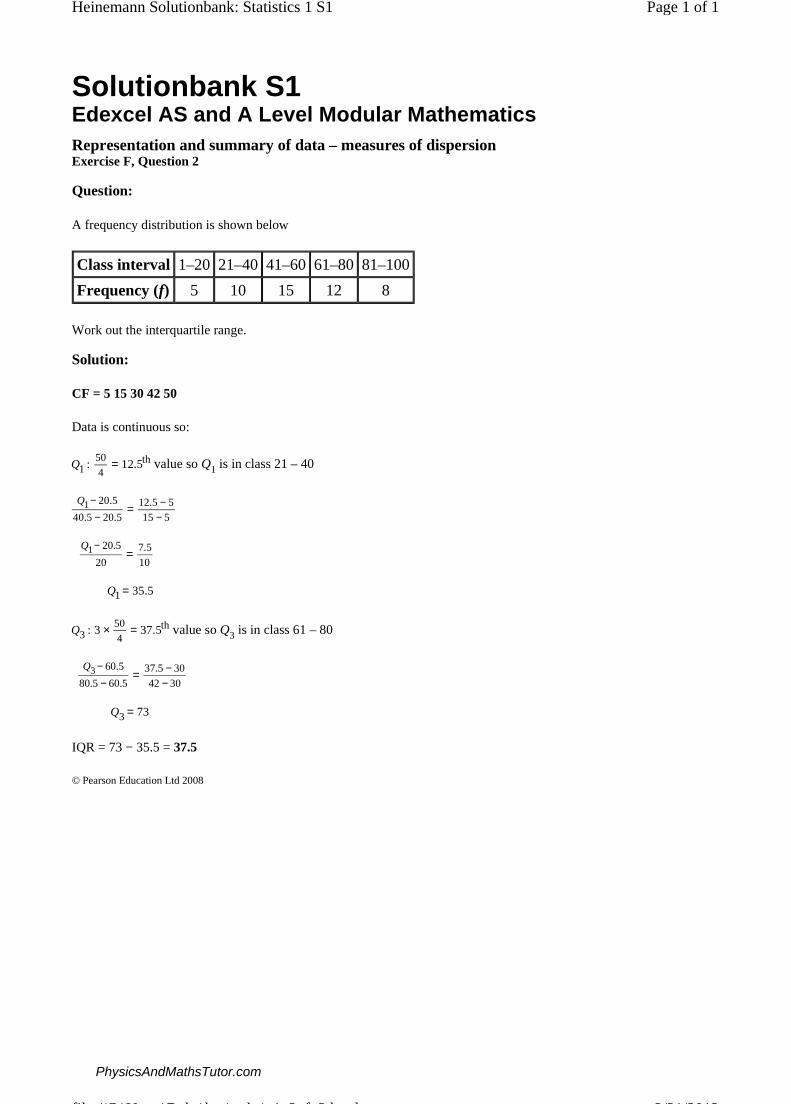
A frequency distribution is shown below
Work out the interquartile range.
Class interval 1–20 21–40 41–60 61–80 81–100
Frequency (f) 5 10 15 12 8
Solution:
CF = 5 15 30 42 50
Data is continuous so:
value so Q1 is in class 21 – 40
value so Q3 is in class 61 – 80
IQR = 73 − 35.5 = 37.5
Q1 :50
4= 12.5th
Q1− 20.5
40.5− 20.5= 12.5− 5
15 − 5
Q1− 20.5
20= 7.5
10
Q1= 35.5
Q3 : 3 × 50
4= 37.5th
Q3− 60.5
80.5− 60.5= 37.5− 30
42− 30
Q3 = 73
Page 1 of 1Heinemann Solutionbank: Statistics 1 S1
3/21/2013file://C:\Users\Buba\kaz\ouba\s1_3_f_2.html
PhysicsAndMathsTutor.com

Solutionbank S1 Edexcel AS and A Level Modular Mathematics Representation and summary of data – measures of dispersion Exercise F, Question 3
© Pearson Education Ltd 2008
Question:
A frequency distribution is shown below.
a Work out the value of the 30th percentile.
b Work out the value of the 70th percentile.
c Calculate the 30% to 70% interpercentile range.
Class interval 1–10 11–20 21–30 31–40 41–50
Frequency (f) 10 20 30 24 16
Solution:
a 30th :
b 70th :
c 30% to 70% interpercentile = 34.7 − 20.5 = 14.2
30
100× 100= 30
P30 = 20.5
70
100× 100= 70
P70− 30.5
40.5− 30.5= 70− 60
84− 60
P66 = 34.7
Page 1 of 1Heinemann Solutionbank: Statistics 1 S1
3/21/2013file://C:\Users\Buba\kaz\ouba\s1_3_f_3.html
PhysicsAndMathsTutor.com

Solutionbank S1 Edexcel AS and A Level Modular Mathematics Representation and summary of data – measures of dispersion Exercise F, Question 4
© Pearson Education Ltd 2008
Question:
The heights (h) of 10 mountains were recorded to the nearest 10 m and are shown in the table below.
Use the coding to find the standard deviation of the heights.
h 1010 1030 1050 1000 1020 1030 1030 1040 1020 1000
y = h − 1000
10
Solution:
coded data 10, 10.2, 10.4, 9.9 10.1, 10.2, 10.2, 10.3, 10.1, 9.9
Standard deviation of coded data
Standard deviation = 0.155 × 100 = 15.5
= 1026.41
10− (101.3
10 )2
= 0.155
Page 1 of 1Heinemann Solutionbank: Statistics 1 S1
3/21/2013file://C:\Users\Buba\kaz\ouba\s1_3_f_4.html
PhysicsAndMathsTutor.com

Solutionbank S1 Edexcel AS and A Level Modular Mathematics Representation and summary of data – measures of dispersion Exercise F, Question 5
© Pearson Education Ltd 2008
Question:
The times it took a random sample of runners to complete a race are summarised in the table.
a Work out the lower quartile.
b Work out the upper quartile.
c Work out the interquartile range.
The mid-point of each class was represented by x and its corresponding frequency by f giving:
Σfx = 3740 Σfx2 = 183 040
d Estimate the variance and standard deviation for these data.
Time taken (t minutes) Frequency
20–29 5
30–39 10
40–49 36
50–59 20
60–69 9
Solution:
a Data is continuous so: value so Q1 is in class 40 – 49
b value so Q3 is in class 50 – 59
c IQR = 54 − 40.9 = 13.1
d
CF = 5 15 51 71 80
Q1 :804
= 20th
Q1− 39.5
49.5− 39.5= 20− 15
51− 15Q1 = 40.9
Q3 : 3 × 804
= 60th
Q3− 49.5
59.5− 49.5= 60− 51
71− 51Q3 = 54
Variance= 183040
80− (3740
80 )2
= 102.4375 ==== 102
Standard deviation= 102.4375= 10.1
Page 1 of 2Heinemann Solutionbank: Statistics 1 S1
3/21/2013file://C:\Users\Buba\kaz\ouba\s1_3_f_5.html
PhysicsAndMathsTutor.com

Page 2 of 2Heinemann Solutionbank: Statistics 1 S1
3/21/2013file://C:\Users\Buba\kaz\ouba\s1_3_f_5.html
PhysicsAndMathsTutor.com

Solutionbank S1 Edexcel AS and A Level Modular Mathematics Representation and summary of data – measures of dispersion Exercise F, Question 6
© Pearson Education Ltd 2008
Question:
20 birds were caught for ringing.
Their wing spans (x) were measured to the nearest centimetre.
The following summary data was worked out:
Σx = 316 Σx2 = 5078
a Work out the mean and the standard deviation of the wing spans of the 20 birds. One more bird was caught. It had a wing span of 13 centimetres
b Without doing any further working say how you think this extra wing span will affect the mean wing span.
Solution:
a
b It will decrease the mean wing span since 13 < 15.8
Mean= 316
20= 15.8
Standard deviation= 5078
20− (316
20 )2
= 2.06
Page 1 of 1Heinemann Solutionbank: Statistics 1 S1
3/21/2013file://C:\Users\Buba\kaz\ouba\s1_3_f_6.html
PhysicsAndMathsTutor.com
Solutionbank S1 Edexcel AS and A Level Modular Mathematics Representation and summary of data – measures of dispersion Exercise F, Question 7
© Pearson Education Ltd 2008
Question:
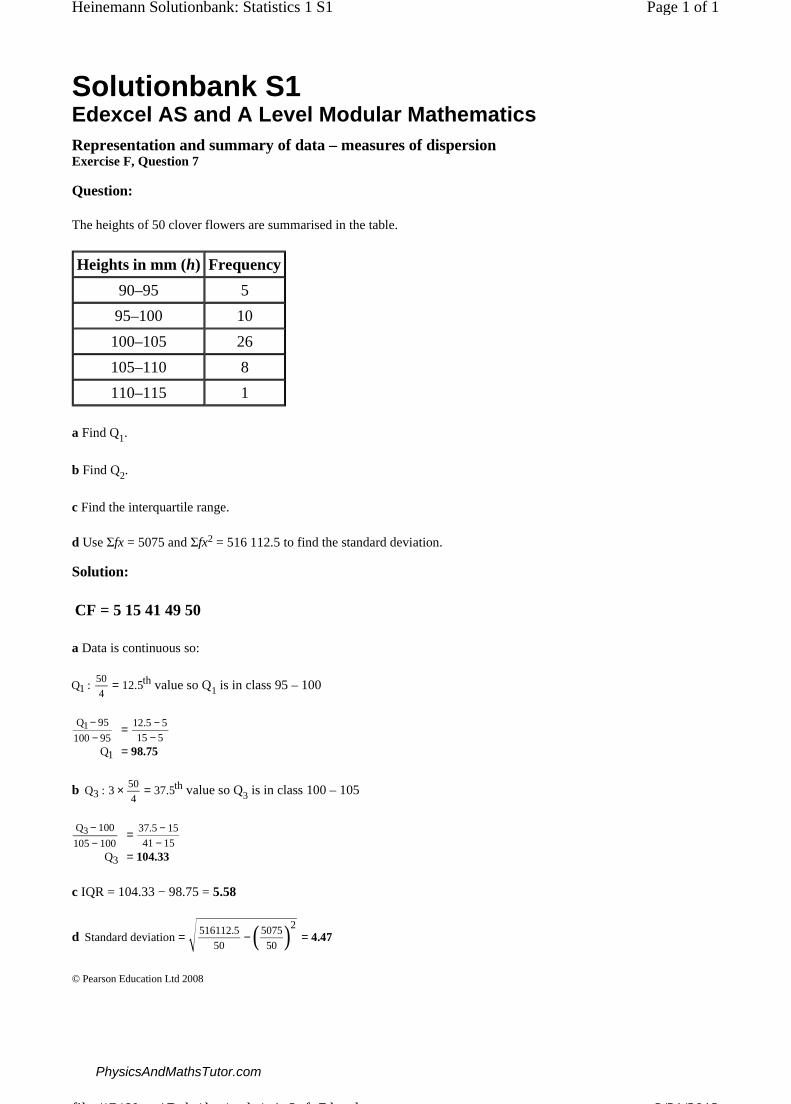
The heights of 50 clover flowers are summarised in the table.
a Find Q1.
b Find Q2.
c Find the interquartile range.
d Use Σfx = 5075 and Σfx2 = 516 112.5 to find the standard deviation.
Heights in mm (h) Frequency
90–95 5
95–100 10
100–105 26
105–110 8
110–115 1
Solution:
a Data is continuous so:
value so Q1 is in class 95 – 100
b value so Q3 is in class 100 – 105
c IQR = 104.33 − 98.75 = 5.58
d
CF = 5 15 41 49 50
Q1 :50
4= 12.5th
Q1− 95
100− 95= 12.5− 5
15 − 5Q1 = 98.75
Q3 : 3 × 504
= 37.5th
Q3 − 100
105− 100= 37.5− 15
41− 15Q3 = 104.33
Standard deviation= 516112.5
50− (5075
50 )2
= 4.47
Page 1 of 1Heinemann Solutionbank: Statistics 1 S1
3/21/2013file://C:\Users\Buba\kaz\ouba\s1_3_f_7.html
PhysicsAndMathsTutor.com