Application of Green Strategies and Competitive Advantage ...
62
APPLICATION OF GREEN STRATEGIES AND COMPETITIVE ADVANTAGE OF TOTAL SOLUTION LOGISTICS SERVICE PROVIDERS IN MOMBASA, KENYA BY VIOLET ACHIENG’ ONYANGO A RESEARCH PROJECT SUBMITTED IN PARTIAL FULFILLMENT OF THE REQUIREMENTS FOR THE AWARD OF THE DEGREE OF MASTER OF BUSINESS ADMINISTRATION, SCHOOL OF BUSINESS, UNIVERSITY OF NAIROBI NOVEMBER, 2016
Transcript of Application of Green Strategies and Competitive Advantage ...

APPLICATION OF GREEN STRATEGIES AND COMPETITIVE
ADVANTAGE OF TOTAL SOLUTION LOGISTICS SERVICE PROVIDERS
IN MOMBASA, KENYA
BY
VIOLET ACHIENG’ ONYANGO
A RESEARCH PROJECT SUBMITTED IN PARTIAL FULFILLMENT OF
THE REQUIREMENTS FOR THE AWARD OF THE DEGREE OF MASTER
OF BUSINESS ADMINISTRATION, SCHOOL OF BUSINESS, UNIVERSITY
OF NAIROBI
NOVEMBER, 2016

II
DECLARATION
This research project is my original work and has not been presented for a degree award
in any other University.
Signed……………................ Date………………………………….
Violet Achieng’ Onyango
D61/61400/2013
This research project has been submitted for examination with my approval as the
University supervisor.
Signed ………………….……….. Date…….…………………………….
Dr. Jackson Maalu
Lecturer, School of Business
University of Nairobi

III
DEDICATION
This research project is dedicated to my parents Mr. Tom Bonyo and Mrs. Teresa
Onyango who have been my source of inspiration and unconditional love throughout
my life. They have instilled in me, discipline with which I face life today, and to them,
this is an achievement they desired for me. Special dedication to the love of my life,
Daniel, for his patience, love and understanding as I burnt the midnight oil to make this
possible as a result, making his life unbearable. To my children, them that complete
me; Aggrey, Abel and Queen. The thought of them and my desire to inspire them,
motored me to embark on this journey. Special Thanks to my study mates and lecturers
at the University of Nairobi for the support and team spirit they displayed. I learnt a lot
from them and I must say that, they have made a significant contribution towards my
betterment and educational maturity.

IV
ACKNOWLEDGEMENTS
I sincerely would like to acknowledge Dr. Jackson Maalu for his supervision as well as
contribution to the completion of this research paper, his guidance, constant
encouragement as well as the knowledge base that equipped me to carry out this study.
I am inspired by his motivational lectures that have changed my concept of strategic
management I am especially grateful to my husband for his constant inspiration which
kept me going, his moral and financial support that aided in conclusion of this study.

V
ABSTRACT
Green strategies have emerged as a key approach for logistics firms seeking to become
environmentally sustainable and globally competitive. As a developing country, Kenya
has to balance both its business operations and environmental performance. This
study’s objective was to determine the connection between competitive advantage and
adoption of green strategies by total solution logistics service providers in Mombasa,
Kenya. A descriptive research design was adopted for this study which targeted a
population of logistics firms operating in Mombasa County listed by Federation of East
African Freight Forwarders Association, FEAFFA and Kenya International Freight and
warehousing Association, KIFWA. A census survey on all the 63 listed total logistics
service providers was carried out. The data was collected using questionnaires. The
results obtained indicated that adoption of green strategies are at implementation stage
and that most logistics firms were considering adoption. The study also established that
the major apparent benefits of adopting green strategies are; reduction of environmental
degradation, reduction of business costs and enhanced customer base. The study
findings indicates that more established and sizeable firms were the most likely
adopters of green strategies compared to their smaller counterparts. The most adopted
green strategies were pollution prevention and clean technology whereas product
stewardship and sustainability vision strategies were neglected. The study recommends
that the management in logistics firms should focus and allocate more resources
towards pollution prevention and clean technology strategies as these results in greater
savings and thus higher firm performance. They should also strive at achieving
sustainability as this will improve productivity in the logistics industry, environment
performance and reduce waste to attain cost savings. Finally, the logistics firms should
act fast on implementation of green strategies since there are prospective paybacks
which may result in business growth and good publicity.
VI
TABLE OF CONTENTS
DECLARATION ...................................................................................... ii
DEDICATION ......................................................................................... iii
ACKNOWLEDGEMENTS .................................................................... iv
ABSTRACT ............................................................................................... v
LIST OF TABLES ................................................................................... ix
LIST OF ABBREVIATIONS AND ACCRONYMS ............................. x
CHAPTER ONE: INTRODUCTION ..................................................... 1
1.1 Background of the study ............................................................................................ 1
1.1.1 Concept of green strategies ................................................................................ 2
1.1.2 Competitive advantage ....................................................................................... 3
1.1.3 Logistics firms in Kenya .................................................................................... 5
1.2 Research problem ....................................................................................................... 5
1.3 Research Objectives ................................................................................................... 7
1.4 Value of the Study ..................................................................................................... 7
CHAPTER TWO: LITERATURE REVIEW ....................................... 8
2.1 Introduction ................................................................................................................ 8
2.2 Theoretical foundations of the study .......................................................................... 8
2.2.1 Resource based view theory ...................................................................................... 8
2.2.2 Population ecology theory ........................................................................................ 9
2.2.3 Institutional theory of the firm ................................................................................ 11
2.3 Green strategies ........................................................................................................ 11
2.3.1 Pollution prevention ......................................................................................... 12
2.3.2 Product stewardship ......................................................................................... 12
2.3.3 Clean technology ............................................................................................. 13
2.3.4 Sustainability vision ......................................................................................... 13
2.4 Empirical literature on green strategies and competitive advantage ........................ 13
2.5 Summary of literature review .................................................................................. 15
CHAPTER THREE: RESEARCH METHODOLOGY ..................... 16
3.1 Introduction .............................................................................................................. 16
3.2 Research design ....................................................................................................... 16

VII
3.3 Population of the study ............................................................................................ 16
3.4 Data Collection ........................................................................................................ 16
3.5 Data analysis ............................................................................................................ 17
CHAPTER FOUR: DATA ANALYSIS, RESULTS AND
DISCUSSION .......................................................................................... 19
4.1 Introduction .................................................................................................................... 19
4.2 Profile of respondent firms ...................................................................................... 19
4.2.1 Age of the firm ................................................................................................. 19
4.2.2 Ownership structure ......................................................................................... 20
4.2.3 Workforce capacity .......................................................................................... 20
4.2.4 Monthly financial turnover .............................................................................. 21
4.2.5 Existence of environmental Management Department .................................... 22
4.2.6 Registration with Environmental Management Body ...................................... 23
4.2.7 Environmental Certification ............................................................................. 23
4.3. Green strategies ............................................................................................................. 24
4.3.1 Pollution prevention ................................................................................................ 24
4.3.2 Product stewardship ................................................................................................ 26
4.3.3 Adoption of clean technology ................................................................................. 27
4.3.4 Sustainability vision ................................................................................................ 29
4.4. Relationship between green strategies and competitive advantage .............................. 30
4.4.1 Organization competitive advantage ....................................................................... 30
4.4.2 Green strategies and Competitive advantage .......................................................... 31
4.5 Discussion of findings.................................................................................................... 34
CHAPTER FIVE: SUMMARY, CONCLUSIONS AND
RECOMMENDATIONS ....................................................................... 36
5.1 Introduction .................................................................................................................... 36
5.2 Summary ........................................................................................................................ 36
5.3. Conclusions ................................................................................................................... 37
5.4 Recommendations .......................................................................................................... 37
5.5 Recommendations for Further Research ........................................................................ 38
REFERENCES ....................................................................................... 39
APPENDICES ......................................................................................... 44

VIII
Appendix 1: Research questionnaire ................................................................................... 44
Appendix 2: List of total solution logistics firms in Mombasa ............................................ 49
Appendix 3: Timeline for research activities ....................................................................... 50
IX
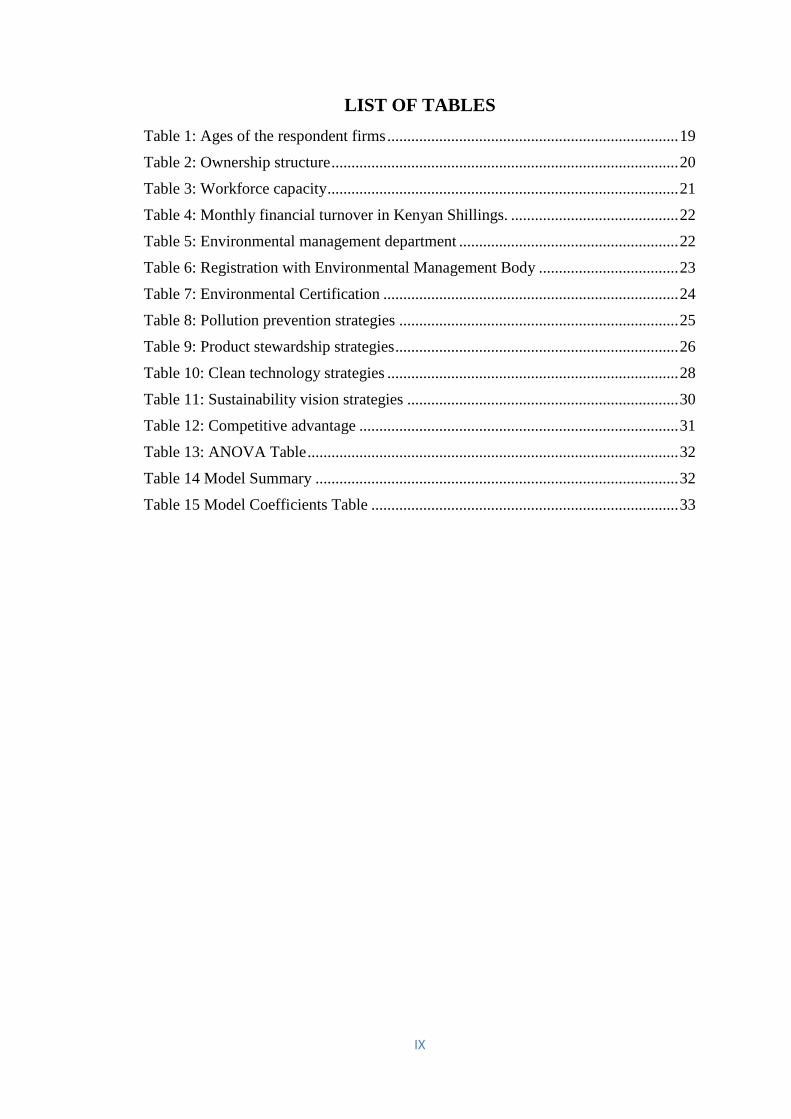
LIST OF TABLES
Table 1: Ages of the respondent firms ......................................................................... 19
Table 2: Ownership structure ....................................................................................... 20
Table 3: Workforce capacity ........................................................................................ 21
Table 4: Monthly financial turnover in Kenyan Shillings. .......................................... 22
Table 5: Environmental management department ....................................................... 22
Table 6: Registration with Environmental Management Body ................................... 23
Table 7: Environmental Certification .......................................................................... 24
Table 8: Pollution prevention strategies ...................................................................... 25
Table 9: Product stewardship strategies ....................................................................... 26
Table 10: Clean technology strategies ......................................................................... 28
Table 11: Sustainability vision strategies .................................................................... 30
Table 12: Competitive advantage ................................................................................ 31
Table 13: ANOVA Table ............................................................................................. 32
Table 14 Model Summary ........................................................................................... 32
Table 15 Model Coefficients Table ............................................................................. 33

X
LIST OF ABBREVIATIONS AND ACCRONYMS
LSPs : Logistics Service providers
TSLSPs : Total Solution Logistics Service providers
KIFWA : Kenya International Freight and Warehousing Association
KTA : The Kenya Transporters Association
FEAFFA : Federation of East Africa Freight Forwarders Association
KISM : Kenya institute of Supplies Management
NEMA : National Environmental Management Authority
RBV : Resource Based view
SARA : Superfund Amendments and Reauthorization Act
TRI : Toxic release Inventory
DFE : Design for Environment
SPSS : Statistical Package for Social Sciences

1
CHAPTER ONE: INTRODUCTION
1.1 Background of the study
A green strategy complements the business, operations and asset strategies that are
already well understood and often well-pronounced by the organization. It basically
aids a business make resolutions that have a positive influence on the environment. The
ideologies that form the basis of a green strategy should lead a business to make
decisions based on solid business logic and make good business sense. They are
therefore, sets of policies aimed at fostering common culture of awareness and actions
that facilitate decision and transformation initiatives to improve the environment and
geared towards achieving attractive value propositions that are cost effective. Its
mission is to develop and implement approaches to sustainability. Businesses that
nurture a green culture today are often noticeable to stakeholders as unique. However,
at other times the differences in a green culture are subtly small (Olson, 2008). Green
strategies are said to improve corporate image and shows that the organization cares. A
survey by Thornton (2014) found a nobler reason for greening amongst companies;
they believe that it is their responsibility to do so. Among the eco-work that companies
are undertaking are: improving energy efficiency, creating products and services that
are more sustainable, and calculating their carbon footprint. Another development is
the increase in companies reporting on sustainability (Jone, 2014).
This study will be anchored on resource based view, population ecology and
institutional theories. Firm's resources can be defined as those tangible and intangible
assets which are semi permanently tied to the firm (Caves, 1980). Some of such
resources are brand names, technological know-how, and engagement of skilled
personnel, trade acquaintances, machinery, efficient processes and capital. Resource
based view theory provides valuable understanding of the competitive advantage that
arises when an organization escalates its level of environmental commitment.
Organizational/Population ecology employs insights from biology, economics and
sociology, and uses statistical analysis to understand the conditions under which
organizations emerge, grow, and die. From an institutional perspective, businesses
function within a social context of norms, values and assumptions about what
constitutes appropriate behaviour. Institutional theorists affirm that the institutional

2
environment can intensely impact the growth of organization’s formal structures, often
more severely compared to market forces. Rowan, Meyer and Brian (1977), argued
that, often, acceptance of these "institutional myths" are simply ceremonious in order
for the firm to attain or retain acceptability in the institutional environment. The
implementation and prominent show of institutionally-acceptable "trappings of
acceptability" aids in reserving an atmosphere of organizational action based on "good
faith". Legitimacy in the institutional environment helps ensure organizational
continued existence.
Logistics plays a key role in backing-up organizations as they endeavor for more
efficient management systems (Cozollino, 2012). The logistics industry in Kenya has
been advancing since the 1950s due to nationalization and globalization trends in recent
decades. Logistics service providers (LSPs) in Mombasa are registered with Kenya
international freight and warehousing Association (KIFWA) (http://www.kifwa.co.ke),
the sole representative of all Freight Forwarding Practitioners in Kenya, The Kenya
Transporters Association (KTA), Federation of East Africa Freight Forwarders
Association (FEAFFA) and Kenya institute of Supplies Management (KISM).
According to FEAFFA and KTA, there are about 592 logistics firms operating in
Mombasa, out of which, 63 are total solutions logistics service providers (TSLSPs)
whose value proposition to their clientele include most of above mentioned services in
one window. These specialists have the capability to handle customs clearance,
warehousing and haulage of goods to the customer’s door step. This study will focus
on this category of LSPs.
1.1.1 Concept of green strategies
Green strategies have recently gained increasing relevance. Businesses are expected to
take responsibility for their input towards the deteriorating environmental state
(Dimitriades, 2007). The idea of “green business” arose towards the end of the 20th
century in the wake of the snowballing public disquiet about the sustainability of
economic progress. This, was stirred up by the rising consciousness of conservational
matters such as the fast-tracking exhaustion of natural resources and the decline in the
quality of the environmental. The roots of the contemporary “green movements” can
be tracked down to the mid of 1960s and it took over 20 years for firms to acclimatize
to the “greening” leanings and implement them into their ideologies and strategies,
inventing the term green business (Jacobson & Petrie, 2012) Nevertheless, to date, the

3
element of the green business model is somewhat baffling as demonstrated by the
variation of its definitions found from different sources. Moreover, green strategies are
yet to be completely incorporated and applied by business entities around the globe,
with noticeable differences of business penetration by the “green” ideas in different
countries. This is due to several reasons, one of them being the fact that the “greening
of business” is still fundamentally viewed as an increase or revenue loss, extra burden
in terms of cost and the others being related to the national facts in terms of cultural,
political, and economic dynamics. For companies seeking to create a competitive
advantage in the global marketplace, sustainability has become the tune, thus the need
for green strategies (Čekanavičius, Bazytė & Dičmonaitė, 2014).
Certain issues must be considered in order to cultivate strategies that are both good for
the environment and good for businesses. It is imperative to determine whether or not,
the aspects of the business are efficient and are being protective of the environment.
Green stewardship and energy exhaustion ought to be considered new business
indicators, as part of the general strategy to improve business efficiency. The
organization also needs to retain a public goodwill through setting meaningful and
attainable aims, with transparency in reporting progress and take a leadership position
in driving energy conservation and environmental stewardship through the value chain
and across the industry. When experiencing social and regulatory pressures, ‘green’
firms preferably responds with energy conservation initiatives that proactively address
energy and climate challenges and are verifiable. These matters can seem complex
when considered individually and possibly overwhelming when observed as an
interrelated group. They call for a structure that helps identify and prioritize
environmental efforts by demonstrating how problems and opportunities can be broken
down into distinct areas before segmenting them into manageable tasks. These projects
can be joined to form a cross-organizational program managing energy, cost and
environmental issues (Johnson, 2009).
1.1.2 Competitive advantage
A competitive advantage is an edge over other players gained by offering clients a
greater value, through reduced prices or by offering superior benefits and service that
validates premium prices. Porter recommended four "generic" business strategies that
could be implemented in order to achieve competitive advantage. The approaches relate

4
to the extent to which the range of a business' activities are narrow versus broad and the
to what extent a business differentiates its products (Riley, 2015)
Adaptation and obtaining of competitive advantages in the current business framework
calls for firms to device processes of efficiency improvement (Wright, 1994).
Capability to integrate activities to key effect in the three areas of marketplace, their
operations and their culture is a vibrant factor in the success of world class
organizations. Continued competitive advantage emanates from the holistic
management of all three areas (Smith, 1995). The “hypercompetitive environment’
within which businesses are operate at present, demands that firms look for means to
continually progress their competitive advantage if they are to stay successful
(Mathews, 2006).
Pearce and Robinson (2007) on their part define competition as the state within a market
setup where firms work and set policies to obtain advantage or greater success over
rivals. Mintzberg and Lampel (1999) stated that the core of strategy formulation is
dealing with competition. This is realizable by exploiting superior resources and
capabilities. Attaining and sustaining a competitive advantage is essential to strategy.
In the resource-based view of the firm, ‘competitive advantage lies "upstream" of the
product markets and rests on the firm's distinctive and difficult to-imitate resources
(Afuah, 2002). Thompson (2007) argued that a firm’s strategy is its management’s
action plan for running the business and directing operations.
The making of a strategy signifies a managerial obligation to chase a pre-defined set of
actions in developing the business, competing successfully, appealing to customers,
carrying out operations, and revamping the company’s financial and market
performance. Therefore, a firm’s strategy looks at how the management plans to
develop the business, how it will form a loyal set of clientele and beat their rivals, how
every functional area of the business will be run and how performance will be boosted.
A strategy succeeds better when it is established on business tactics and competitive
steps intended to (1) appeal to buyers in a way that sets the company apart from
competitors and (2) carve out its own market position. Imitating practices by successful
companies in the industry and trying to mimic their market position seldom works. In
companies with a wide range of operations, it’s far more precise to view strategy as a
collective or team effort involving managers and sometimes, key employees, down

5
through the whole organizational pyramid. Setting a strategic vision and mission,
developing objectives, and creating a strategy are basic tasks which set the firm’s
direction. In synergy, they constitute a strategic plan for handling the industry and
competitive conditions, the anticipated actions of industry actors, and the challenges
and issues viewed as obstacles to the company’s triumph (Thompson, 2007).
1.1.3 Logistics firms in Kenya
Logistics is one of the most crucial developments in the supply chain industry and
implies the organization and control over freight movements. Logistics management
has an impact on the firm’s performance and service delivery (Sheikh and Rana, 2012).
The logistics function affects significantly the performance and competitive advantage
through cost reduction and fast adaptation to the rapidly changing global economic
trends.
Logistics firms in Kenya comprises of air and sea freight forwarding firms, shipping
companies, container freight stations and haulage/ transport among others. Firms
offering total solutions logistics provide most of these services in one window thus
adding value to the customer’s supply chain. LSPs in Mombasa constitute an important
element of the service sector in Kenya, both in their involvement to the country’s
employment and income generation and the part they play in external trade. Such
include ensuring the right product variety and quantity are conveyed in a timely manner
(Murage, 2011). Modern logistics firms operate in environments characterized by
escalating fuel prices, environmental degradation from waste produced by their
machinery, green movement lobby groups that advocate for mandatory participation in
environmental initiatives and government regulations enforced via National
Environmental Management Authority (NEMA) and the county governments.
1.2 Research problem
In today’s life, green strategies have become more relevant (Khan, 2014). Green firm’s
functions are guided by values that solve and seldom cause, environmental and social
harms. Such businesses apply principles and policies that progress the superiority of
life for their customers, employees and the community. These strategies are instituted
as a means to conserve natural resources, reduce the production of greenhouse gases
and cut costs to business owners (Szuchnicki, 2009). Importantly, instituting green
strategies is not necessarily something that can be visible to customers. Responsiveness
6
to the global environmental concerns such as carbon emissions, global warming, toxic
matter usage, and resource shortage has intensified over the past times. Strategists and
activists are supporting going green initiatives, and many organizations all over the
world have responded to this call by applying green strategies (Xie, 2012).
Logistics industry is part of the transport industry that contributes to the economic
development of the country. Application of green strategies is the norm in most
industries globally and locally hence the logistics firms have not been left behind in
aiming to achieve competitive advantage (Rodrigue, 2013). Application of green
strategies such as; Promoting sustainability to a core business strategy, entrenching
green ideologies in innovation efforts, putting green principles into consideration while
making major decisions and assimilating sustainability into corporate and brand
marketing and messaging (Kauffeld, 2009) permits firms to continue to excel and
develop a deeper shade of green, thus becoming more competitive in the market.
Several studies have been done on green practices and strategies, Masoumik, Abdul-
Rashid and Olugu (2014) undertook a study on ‘gaining competitive advantage through
strategic green supply chain management in Malaysia’. The study found out that
initiating new strategies that lead to technological development, creation of new
products, and new markets can be regarded as a key instrument for establishing
Competitive advantage. Environmentally cognizant policies not only enable the firms
to moderate their total costs and risks, but also help in growing their revenue and
intangible values, such as brand reputation and trust. Mwaengo (2013) carried out a
study on green supply chain management strategies and environmental performance in
Bamburi Cement limited where he examined the magnitude of GSCM practice at
Bamburi Cement limited. This study was centred on the manufacturing industry and its
impact on the environmental performance. Omonge (2012) studied green supply chain
management strategies and competitiveness of commercial banks in Kenya. The study
sought to establish the role played by GSCM strategies on an organizational
competitiveness among commercial banks in Kenya. From the previous discussion, it
is apparent that many studies have been done on green strategies and their influence on
performances leaving a gap on the study of the relationship between green strategies
and the competitive advantage of the firm. Therefore this study will focus on green
strategies such as an organization’s extent of investment in R&D to support greening
of products and services to achieve competitive advantage of logistics firms and seek

7
to answer the following research question: Does application of green strategies
influence competitive advantage of firms offering total solutions logistics in Mombasa?
1.3 Research Objectives
The research objectives of this study are to:
1. Establish the extent of green strategies adoption by total solutions logistics service
providers in Mombasa, Kenya
2. Determine the relationship between application of green strategies and competitive
advantage of total solutions logistics service providers in Mombasa, Kenya.
1.4 Value of the Study
Green strategies is one of the main initiatives in industries and the world’s economy.
The study will therefore, be important to various stakeholders, specifically, the logistics
industry players and largely contribute to the theoretical view on the adoption and
benefits of green strategies in the logistics industry.
The outcomes of this research will be important to policy makers and help them
formulate policies that can navigate the industry to put in place proper infrastructure
that may empower the industry towards sustainability.
The academic society will find the report vital in helping them recognise the value of
green strategies in the logistics sector. As a result, it will open up research opportunities
in areas that are inadequately covered in the study.

8
CHAPTER TWO: LITERATURE REVIEW
2.1 Introduction
This chapter takes into account the theoretical and empirical literature from past studies
on the subject of green strategies and sustainability. A critical review of the theories,
green strategies, firms’ competitive advantage and empirical review shall be
undertaken.
2.2 Theoretical foundations of the study
Scholars have reported an upward trend on institution of green strategies in businesses
for sustainability with different theories being anchored in these studies. Many of these
theories have been exploited to give a better understanding of greening to the
academicians and to help practitioners successfully manage the process. These theories
are; the resource based view, its subset, the natural resource based view theory and the
Institution theory of the firm.
2.2.1 Resource based view theory
The RBV model explains that the identifying and possessing internal strategic resources
contributes to a firm’s ability to build and maintain a competitive advantage and
advance performance (Madhani, 2010). Resource based view theory sees the firm as a
package of resources (Penrose, 1959), according to its philosophies, an organization
must obtain an efficient set and flow of the right kind of resources from its environment
in order to survive and develop its performance. A resource is considered strategic if it
meets certain conditions - valuable, non-substitutable, rare or specific, and unique in
order to contribute to the improvement of the performance of the firm (Crook, Ketchen
Jr, Combs & Todd, 2008). Value refers to the extent to which the resources are aligned
with the external environment to take advantage of opportunities and minimize threats.
Non-substitutability is the extent to which competitors are incapable of creating
comparable resources. Uniqueness is the extent to which competitors cannot acquire or
replicate the resources, or can only do so at a significant cost disadvantage (Hoskisson,
Hitt, Wan, & Yiu, 1999). According to RBV model, firms try to identify strategic
means that will most likely make the firm more competitive then employ these
resources to exploit their value (Sirmon, Hitt & Ireland, 2007). Resources must also be
efficiently managed and exploited given the changing external conditions an
organization faces in competitive business environment (Lippman & Rumelt, 2003).

9
The identification and explanation of the benefits of implementing green strategies and
environmental initiatives in the logistics industry can be explained using the resource
based view theory of the firm.
It appears inevitable in future that businesses and markets will be controlled by, and
dependent upon the environment. Strategy and competitive advantage will likely be
entrenched in capabilities that enable environmentally sustainable economic activity –
a natural resource based view of the firm (Hart, 1995). The context of this theory is
composed of; Pollution prevention; product stewardship, Clean Technology and
sustainability vision and development.
In the recent past, firms have faced tremendous pressure to minimize or eliminate
pollution from their operations. An example is, the Superfund Amendments and
Reauthorization Act (SARA) that was passed in the United States, in 1986, requiring
that companies reveal their emission levels through the Toxic release Inventory (TRI).
This led the management in most affected industries like pulp and paper, petro
chemicals, Automotive and electronics to profoundly rethink their approach to
pollution abatement (Smart, 1992). According to Smart (1992) Pollution abatement
could be made possible two folds; Control and Prevention. This model will be used to
demonstrate the long term as well as short term benefits of adopting a deeper shade of
greenness in organizations.
2.2.2 Population ecology theory
Population ecology of organizations make use of intuitions from biology, economics
and sociology, and employs statistical analysis to try to comprehend the conditions
under which organizations emerge, grow, and die ( Sytse & Schreuder, 2013).
Population ecology scans the environment in which an organization plays and a process
like natural selection occurs (Hannan & Freeman, 1977). This theory looks at firm
mortality, organizational formation, growth and transformation. The model covers a
number of more specific fragments including: Inertia and change, resource partitioning,
niche width and density dependence (Hannan & Freeman , 1989).
Inertia and change theory maintains that organizations that are dependable and
accountable are those that are favored by selection. A negative by-product, of the need

10
for dependability and accountability is a high level of inertia and an opposition to
change. An important prediction of organizational ecology is that the process of change
itself is so disruptive that it will result in a higher mortality rate. Models about inertia
and change are essential to the research program of organizational ecology, which seeks
a better understanding of the larger changes in the organizational scene. Given the
constraints on firm-level adaptation, some of these changes emanate from the entry and
selective replacement of firms. Therefore, organizational ecology has spent huge effort
on understanding the formation and death rates of organizations ( Sytse & Schreuder,
2013).
Niche model differentiates generally between two types of organizations: generalists
and specialists. Specialist organizations maximize their utilization of the environment
and accept the risk of undergoing a change in that environment. Generalist
organizations, on the other hand, accept lower levels of exploitation in return for
superior security (Hannan & Freeman 1977). Niche theory shows that specialization is
generally preferred in stable or certain environments. However, the key contribution of
the niche concept is probably the finding that generalism is not always optimum in
uncertain environments” (Hannan & Freeman 1977). The exception is shaped by
environments which “place very diverse strains on the organization, and the duration
of environmental states is short, compared to the life of the organization” (Hannan &
Freeman 1977).Hence, the niche theory clarifies the differences in industrial structure
in different industries and how they are shaped by relevant environments.
Organizational ecology also predicts that the rates of founding and mortality are reliant
on the density of the market. As expressed by Hannan and Freeman (1977), the two
central mechanisms here are legitimation and competition. Legitimation generally
upsurges at a decreasing rate, with the number of firms, so does competition, at an
increasing rate. The outcome is that legitimation procedures will carry the day at low
numbers of firms, while competition at high numbers
This theory will be instrumental in identifying the extent to which firms that do not
adapt to current environmental and greening demands are likely to die or survive.

11
2.2.3 Institutional theory of the firm
Institutional theory studies how external forces impact a company (Hirsch, 1975). The
theory submits that establishments function within a social system and their conducts
are not limited to dyadic relationships. It suggests that a robust appealing force behind
a business’s behavior is socially based and is entrenched within institutions and unified
organizational networks (Lacobucci & Hopkins, 1992).
Isomorphic drivers within institutional theory are namely, coercive, normative, and
mimetic (Powell, DiMaggio & Walter, 1983). Coercive isomorphic drivers arise from
stimuli employed by those in authority including state agencies (Rivera & De, 2004).
Normative isomorphic drivers cause firms to adapt in order to be considered legitimate
in terms of the firm’s activities particularly in relation to environmental management
strategies (Ball & Craig, 2010). Mimetic isomorphic drivers, on the other hand, happen
when organizations copy the activities of successful competitors, in an effort to imitate
the route of their success (Aerts, Cormier & Magnan, 2006).
The concept describes how a firm handles issues of greening as a result of external
pressures (Zandbergen, Jennings & Paul, 1995). Businesses yield to institutional
pressures to uphold their social legitimacy, as well as seeking economic productivity.
The prescribed guidelines of environmental organizations relate to environmental
regulations, performance standards and various prescribed administrative guidelines
that organizations must stick to throughout adoption of green strategies. This model
will be instrumental in showing how the logistics industry is under pressure from
different institutions to become environmentally friendly. This includes customer
demand, increasing environmental regulations by such institutions as NEMA,
managerial concerns with ethics and customer satisfaction.
2.3 Green strategies
Awareness and importance of green strategies and sustainable supply chains have been
budding over time with the theme now becoming mainstream. A display of this is the
increasing presence of environmental performance as a core organizational capability.
Being green is not easy but, driven by imminent rules, consumer pressure, and decrees
from corporations, more businesses are working towards greening and sustainability
efforts (Partridge, 2008). Some studies have looked at environmental concerns, often

12
probing consumer views on green strategies (Clark, Kotchen, & Moore, 2003).
Outlined below are the green strategies commonly adopted by firms.
2.3.1 Pollution prevention
Pollution control involves doing away with waste after they have been formed while
pollution prevention centers on decreasing or getting rid of wastes before they are
created (Ahuja, Hart & Gautam, 1996). As put across by the Canadian Council of
Ministers of the Environment, Pollution control is the addition of practices, procedures,
materials, products or energy to waste streams to diminish the risk posed by pollutants
and waste before their release to the environment. By regulating the release of
pollutants and waste into the environment, pollution control makes a significant
contribution to environmental protection. Pollution prevention policies depend on
endless enhancement efforts to reduce waste and energy use. This revolution is
motivated by a fascinating logic; Pollution prevention pays. Emerging global standards
for environmental management systems, for instance, ISO 14,000, have formed strong
incentives for businesses to cultivate such competences. In the past decade, firms have
pursued to avoid colliding with nature’s economy and the burden of linked costs
through greening and pollution prevention strategies (Ahuja, Hart & Gautam, 1996).
2.3.2 Product stewardship
The product Stewardship Society defines Product stewardship as ‘Handling the health,
safety, and environmental facets of raw materials, midway, and consumer products
through their life cycle and across the value chain responsibly, in order to avert or
minimize undesirable impacts and maximize value’. This may be realized, in part, by
reshaping products to use less damaging substances, to be more durable and eco-
friendly. The highest accountability lies with whoever has the most capacity to affect
the full life cycle environmental influences of the product, which, in most cases, is the
producer of the product, though all parties within the chain of commerce have roles.
Product stewardship focuses on curtailing not only pollution but also all environmental
impacts related to the full life cycle of a product. As corporations move towards zero
emissions, reducing materials and production of wastes need essential changes in
fundamental product and process strategy (Hart & Ahuja, 1996). Design for
Environment (DFE), a tool for creating products that are easier to recover, reuse or
recycle is becoming increasingly important. DFE captures a broad scope of external
viewpoints by including technical staff, environmental specialists, end customers and

13
even external agents in the process. By reducing materials and energy consumption,
DFE can be highly gainful. Appropriately effected product stewardship offers the
possibilities of revenue growth through product differentiation.
2.3.3 Clean technology
Firms with focus on the future can initiate a proposal for and capitalize on tomorrow’s
technologies. The prevailing technology base in most businesses are not ecologically
sustainable. For example, while they have made significant development over the past
years in pollution prevention and product stewardship, the chemical industry is still
limited by its dependence on the chlorine molecule. As long as the industry depends on
its past experiences in chlorine chemistry, it will have problems making progress to
environmental protection (Hart & Ahuja, 1996).
2.3.4 Sustainability vision
According to (Hart & Ahuja, 1996), pollution prevention, product stewardship and
clean technology all drive organizations towards business sustainability. However,
without a structure to give bearing to those undertakings, their effect will go to waste.
A vision for sustainability is like a plot to the future, guiding how products and services
need to progress and what new capabilities will be essential to reach there. Oddly,
chemical companies, look upon only a few years ago as the worst environmental
adversaries, are among the few to have dared an attempt to ensure sustainable
environment earnestly. It can be reasoned that a communal vision related to sustainable
growth applies to the three green strategies. It symbolizes a commitment to a common
direction not a rigid plan or blueprint for action (Senge, 1990).
2.4 Empirical literature on green strategies and competitive advantage
Evidence through a study by (Hart & Ahuja, 1996) can be used to support either the
view that green strategies such as pollution prevention are a cost liability on firms and
unfavorable to a firm’s pursuit to achieve competitive advantage, or that reduction of
emissions escalates productivity and saves money, giving firms a cost advantage. In an
effort to resolve this inconsistency, the correlation between emissions reduction and
firm performance was scrutinized empirically for sample of businesses drawn from the
Standard and Poor’s 500 list of corporations. Although this population is evidently
biased towards the largest of firms, this was not believed to be a problem for this study
as there was plenty of evidence that environmental performance and emissions levels

14
varied substantially among the largest organizations .The results of this study suggested
that it does undeniably pay to be green and that efforts to prevent pollution and reduce
emissions dropped to the ‘bottom line’ within one to two years of launch and that those
firms with the highest emission levels stood the most to benefit. Operational
performance was considerably stimulated in the subsequent year, while it took about
two years before financial performance was affected. These were general findings
founded on a sample drawn from a broad range of industries; the results may be even
major for particular industries where emissions and effluents are salient, like the
transport and logistics industries.
In ‘Greening the Service profit Chain’, Kassinis and Soteriou (2003) explored the
nature of the relationship between environmental management practices and
performance in the context of services. Precisely, they investigated whether the use of
environmental practices by a service firm is clearly related to performance through the
arbitrating influence of enhanced customer satisfaction and loyalty. They deduced that
environmental strategies and practices can be incorporated within the service profit
chain and may power customer satisfaction, loyalty, and subsequently performance of
a company.
‘An analysis of consumer reactions to green strategies’ by Borin, Lindsey-Mullikin and
Krishnan (2013) had a primary objective of examining customer opinions of different
green strategies, specifically to whether firms should employ their resources in
developing new green products, should focus their efforts on recycled or refurbished
products or should participate in green processes throughout the business of the
organization. Results showed that green strategies have a great influence on consumer
purchase behaviour regardless of the exact type of green strategy. Green Strategies,
therefore, was found to matter to eco-customers and industry intelligences indicated
that this group is rising rapidly.
However, an analysis of Swiss products by Wustenhagen (1998) noted that many
businesses offering green products inevitably price them above conventional ones and
consider them a distinct industry but most consumers are unwilling to pay premiums
for green products.

15
2.5 Summary of literature review
According to Byrne, Ryan and Heavey (2013), it is becoming progressively obvious
that there has been a shift from the traditional “does it pay to be green” to a more
welcoming attitude towards “being an important subscription”. What is not as clear is
the level of environmental services being offered by sellers and the real demand levels
by buyers of logistic services. The general logistics studies concentrated on the growth
and production of the logistic industry while more current studies have taken logistical
proliferation as a given and have begun to place more focus on the component of
environmentally sustainable logistics (Tseng,Yue & Taylor, 2005).
For sustainable business to have a future, it must have a demand and supply. Logistic
providers must be keen on supplying more ecologically friendly services and buyers of
these services must be willing to pay for them, if certainly they are more costly in terms
of user performance dynamics – e.g. cost, time, quality etc (Byrne, Ryan & Heavey,
2013). The literature has also revealed that at a high level both buyers and suppliers can
see value obtainable through commitment to green strategies. However, a problem that
has not been addressed in the literature is the degree to which the parties involved have
internalized green strategies in their businesses.
To address this gap, this study has been deliberated for logistics service providers
(LSP), to assess attitudes to and knowledge of green strategies as well as analyse their
preparedness to implement green strategies, if that has not been done already.

16
CHAPTER THREE: RESEARCH METHODOLOGY
3.1 Introduction
This chapter presents the research methodology that was used to carry out this research.
It embodies; the research design, population, the research instruments, data collection
procedures and data analysis techniques.
3.2 Research design
The Research adopted a descriptive survey. The main purpose of descriptive research
is the description and reporting of research findings on the state of affairs as they exist.
(Kombo & Tromp, 2006).
According to Orodho (2003), descriptive survey is a method of information collection
through interviews or administration of a questionnaires to a sample of individuals.
Descriptive research gathers data to answer questions about the current status of the
subject under study (Mugenda & Mugenda, 2003). This study sought to use the
descriptive survey because of the need to collect information from respondents on their
opinion and knowledge relating to green strategies and competitive advantage of total
solution logistics service providers.
3.3 Population of the study
The population of the study was logistics firms in Mombasa with the target population
being total solution logistics service providers (TSLSPs) based in Mombasa, Kenya.
According to FEAFFA’s directory, there exists about 63 TSLSPs in Mombasa. The
study was a census survey, founded on the reasonable and manageable size of the
population. Due to the fact that the entire population is located within Mombasa,
accessibility and timeliness of data collection was anticipated.
3.4 Data Collection
This study made use of primary data which was collected by use of questionnaires. The
questionnaires were administered using the drop and pick later method and consisted
of three sections divided into demographics, Green strategies adopted by firms and
levels of competitive advantage a firm enjoys as a result of their green initiatives. The
target of the questionnaire were the chief executive officers or the head of Health,
Safety, Security and Environment (HSSE) functions of the organizations since they are
more likely to have access to all the information needed for the research.

17
3.5 Data analysis
This involved, first, systematically recording the data. According to Kombo & Tromp,
(2006), raw data collected, should be processed before they can be analyzed. This
involved Identification and correction of errors in the data, coding of the data and
storing them in a suitable form. After data collection, the questionnaires were edited
and coded for completeness and precision to eliminate errors. Failure to do this would
reflect adversely on the study findings. The data was eventually stored electronically to
minimize its volume and for ease of distribution.
The data analysis entailed calculating the mean, standard deviation and performing
regression analysis on the research variables. The descriptive technique was used to
analyze the data generated from part II of the questionnaire to meet objective one. The
regression model was used to link the independent variables to the dependent variable
on data generated from part II of the questionnaire for objective two.
The mean was calculated from scores obtained from the likert scale data in the
questionnaire. Standard deviation was calculated to show how application of green
strategies by TSLSPs deviate from the calculated mean.
Level of competitive advantage in the firms was measured by calculating actual
percentage mean of the data obtained from the indicators. These indicators were;
Customer base compared to competitors, Profitability, Customer satisfaction and
loyalty, Relative market share, Corporate/ brand image, Public and government
goodwill. The results were interpreted and presented using tables that enabled
description of the study findings. Statistical Package for Social Sciences (SPSS)
software was utilized.
The regression equation took the form:
Y=β0 + β1X1 + β2X2 + β3X3 + β4X4 + ε
Where:
Y= Competitive advantage
X1= Pollution prevention
X2= Product stewardship
X3= Clean technology
X4= Focus on sustainability
β0 = constant.
Β1 = Coefficient of pollution prevention variable

18
β2 = Coefficient of product stewardship variable
β3 = Coefficient of clean technology variable
β4 = Coefficient of focus on sustainability variable
ε = Error term
19
CHAPTER FOUR: DATA ANALYSIS, RESULTS AND
DISCUSSION
4.1 Introduction
This chapter introduces the analysis of the data collected and interpreted on the
application of green strategies and competitive advantage of total solution logistics
service providers in Mombasa, Kenya. Out of a total of 63 questionnaires issued, 48
responded which was a 76% response rate which is considered to be adequate to
constitute a basis for valid conclusion.
4.2 Profile of respondent firms
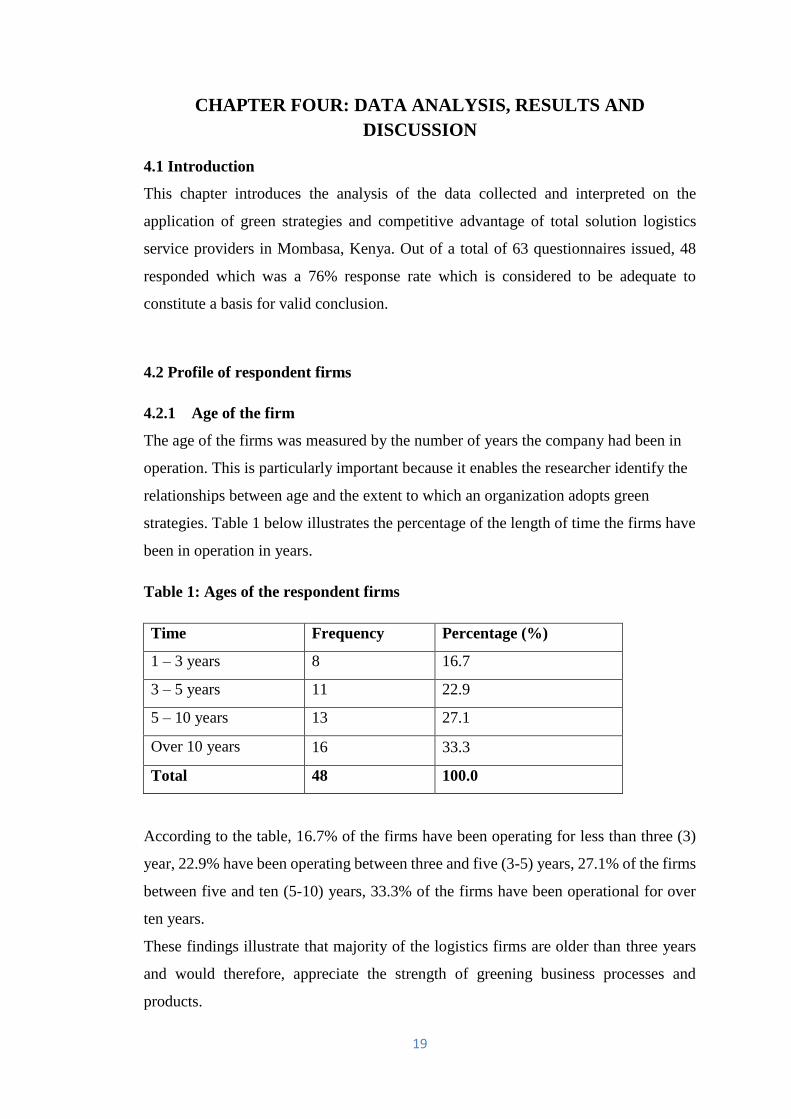
4.2.1 Age of the firm
The age of the firms was measured by the number of years the company had been in
operation. This is particularly important because it enables the researcher identify the
relationships between age and the extent to which an organization adopts green
strategies. Table 1 below illustrates the percentage of the length of time the firms have
been in operation in years.
Table 1: Ages of the respondent firms
Time Frequency Percentage (%)
1 – 3 years 8 16.7
3 – 5 years 11 22.9
5 – 10 years 13 27.1
Over 10 years 16 33.3
Total 48 100.0
According to the table, 16.7% of the firms have been operating for less than three (3)
year, 22.9% have been operating between three and five (3-5) years, 27.1% of the firms
between five and ten (5-10) years, 33.3% of the firms have been operational for over
ten years.
These findings illustrate that majority of the logistics firms are older than three years
and would therefore, appreciate the strength of greening business processes and
products.

20
4.2.2 Ownership structure
The ownership structure describes the form of shareholding arrangements the firm is in
as well as their geographical coverage. This was measured by whether the organizations
were sole proprietorships, partnerships or limited corporations and whether the
shareholders were local individuals or foreign investors. This was instrumental in
determining how the ownership structures affected the adoption of green strategies and
commitment to sustainability.
Table 2: Ownership structure
Ownership structure Frequency Percentage (%)
Locally owned sole proprietorship 8 16.7
Locally-owned partnership/corporation 15 31.3
Global/international ownership 18 37.5
Local and global partnership 7 14.6
Parastatal organization 0 0.0
Total 48 100.0
Table 2 illustrates, in percentages, how the ownership structures of the organizations
look like. According to the table, 16.7% of the firms were locally owned sole
proprietorship, 31.3 % were locally owned partnerships and corporations while 37.5%
were global organizations. 17.6% consisted of a hybrid of local and global
partnerships.
These findings illustrate that majority of the total solution logistics firms were global
organizations. This implies that the firms have a global mindset and would recognize
the criticality of the global greening demands due to pressure from global
environmental management organizations.
4.2.3 Workforce capacity
Workforce capacity brings out the size and level of automation of the organization
through the number of employees the organization has. This aspect enabled the
researcher to measure the extent to which the firms are labor or capital intensive.

21
Table 3: Workforce capacity
Number of employees Frequency Percentage (%)
1 – 10 employees 5 10.4
10 - 50 employees 19 39.6
50 – 100 employees 10 20.8
Over 100 employees 14 29.2
Total
48 100
Table 3 illustrates the percentage of the human resources employed to handle different
tasks. From the findings, 10.4% of the organizations had less than ten (10) employees,
39.6% of the firms had between ten and fifty (10-50) employees, 20.8% had between
fifty to one hundred (50-100) employees while 29.2% of the respondent firms had more
than one hundred employees.
This research findings show that majority of the total solution logistics service
providing firms had between ten and one hundred employees. This implies that majority
of the logistics firms’ tasks were more capital than labor intensive. This would mean
that many logistics machinery were automated and needed little manpower. Adoption
of green strategies is therefore, crucial in order to reduce negative environmental effect
of logistics firms operations for such big organizations.
4.2.4 Monthly financial turnover
Financial performance indicates the overall health and capabilities of an organization
and defines the extent to which they can invest in business strategies. The researcher
sought this information in an attempt to establish the relationship between the financial
performance and adoption of green strategies.
Table 4 illustrates the monthly financial turnover of the organizations in Kenyan
shillings of total solution logistics service providers in Mombasa. From the findings,
37.5% of the respondent firms realized a financial turnover of between 1 million and
10 million shillings, 25% managed a turnover of between 10 million and 50 million
Kenya shillings while 22.9% of the organizations realized financial turnover ranging
between 50 million and 100 million Kenyan shillings. 14.6% garner an impressive 100
million and above, in Kenya shillings.

22
Table 4: Monthly financial turnover in Kenyan Shillings.
Financial turnover in Kshs. Frequency Percentage (%)
1 million -10 million 18 37.5
10 million – 50 million 12 25
50 million – 100 million 11 22.9
Over 100 million 7 14.6
Total 48 100
This goes to show that majority of the firms earn a top line revenue of 10 million and
above, equipping them with financial muscles to keep track of and manage the impact
of their businesses on the environment and in essence, are capable of adopting green
strategies.
4.2.5 Existence of environmental Management Department
Evidence as to whether or not and to what extent an organization has a greening goals
and objectives can be derived from the presence or absence of a functional area within
the organization managing the greening activities. The researcher sought to establish
the percentage of total solution logistics firms with established environment
management departments.
Table 5: Environmental management department
Environmental Management function Frequency Percentage (%)
Yes 32 66.7
No 16 33.3
Total 48 100
Table 5 illustrates the percentage of total solution logistics firms in Mombasa that had
an established environmental management department that actively conducted its duties
to ensure environmental standards were met. The responses indicated that 66.7% of the
firms had an environmental department while 33.3% did not. This is a clear indicator
that majority of the firms surveyed were aware of the importance of adopting green

23
strategies and had a department dedicated to ensuring compliance with environmental
management demands.
4.2.6 Registration with Environmental Management Body
Collaboration and co-operation with environment management bodies clearly
indicates that a company has some level of commitment to support environment
protection.
Table 6 shows the percentage of the logistics firms in Mombasa County that were
registered with an environmental management body. The table illustrates that 83.3%
were registered while 16.7% were not.
Table 6: Registration with Environmental Management Body
Registration with environmental
bodies Frequency
Percentage (%)
Yes 40 83.3
No 8 16.7
Total 48 100
These findings indicate that majority of total solution logistics firms in Mombasa were
registered to at least one environmental management body. This implies that external
pressures such as government legislation, customers’ demands and increased
environmental awareness among firms has played a key role in ensuring that these firms
adopt greening policies.
4.2.7 Environmental Certification
Environmental certification is a form of environmental regulation set by certification
service organizations that firms voluntarily choose to comply with. This indicates a
firm’s commitment and initiatives in support of environment protection.
Table 7 illustrates the percentage of total solution logistics service providers in
Mombasa that have received environmental certification that aims at recognizing their
efforts in conserving the environment and adopting green strategies. 31.3% of the firms

24
had attained at least one level of environmental certification while 68.8% had not
attained any certification.
Table 7: Environmental Certification
Environmental certification Frequency Percentage (%)
Yes 15 31.3
No 33 68.8
Total 48 100
The findings demonstrate that as much as the logistics firms adopt green strategies,
majority are yet to invest considerably on management of the environment in order to
achieve certification levels.
4.3. Green strategies
4.3.1 Pollution prevention
This section highlights the extent to which total solution logistics service providers in
Mombasa have adopted strategies that promote pollution prevention in their business
operations. To measure the extent to which these strategies were adopted, a 5- point
Likert scale was utilized with: 1 signifying No extent at all, 2- small extent, 3 moderate
extent, 4-large extent and 5- very large extent
The results on Table 8 indicates that the most adopted pollution prevention strategy is
where the organization complies with the environmental demands of the local authority
with a mean score of 3.604. This implies that logistics firms are keen to follow
environmental regulations set in their areas of operation to avoid incurring penalties
and other related costs. The second popular strategy is whether the organizations
collaborate with stakeholders to ensure provision of services that do not compromise
the environment which registered a mean score of 3.416, followed by whether the
suppliers to the organization have to show compliance with particular regulations that
protect the environment scoring a mean of 3.270. Whether the organizations sources
their products and services from ISO certified suppliers and whether they carry out tests
on its inputs such as fuels to ensure they are environmentally safe tied rank with means

25
of 3.166 each. Whether the organization gives feedback to suppliers on supplies that
are not environmentally friendly ranked last with a mean of 3.125.
Table 8: Pollution prevention strategies
I. Pollution prevention
Statement Mean Std. Dev Rankin
g
1
The organizations collaborate with stakeholders
to ensure provision of services that do not
compromise the environment. 3.417 1.146
2
2
The suppliers to the organization have to show
compliance with particular regulations that
protect the environment. 3.271 1.162
3
3 The organization sources its products and
services from ISO certified suppliers 3.167 1.277 4
4 The organization gives feedback to suppliers on
supplies that are not environmentally friendly. 3.125 1.282 6
5 The organization carries tests on its inputs such
as fuels to ensure they are environmentally safe. 3.1667 1.260 5
6 The organization complies with the
environmental demands of the local authority 3.604 0.984 1
Average mean 3.292
Compliance with the local environment management authority is evidently important
to retain business licenses and permits to operate while collaborating with stakeholders
to ensure protection of the environment helps the organization set clear objectives and
assign responsibilities to the stakeholders. The least adopted pollution prevention
strategy, giving of feedback to suppliers on supplies that are not environmentally
friendly, implies that that most organizations are not keen on following up with
suppliers to give feedback on the quality levels of their supplies. The total average mean
of 3.291 indicates that majority of total solution logistics service providers have adopted
some, if not most of the pollution prevention strategies.

26
4.3.2 Product stewardship
This section highlights the extent to which total solution logistics service providers in
Mombasa have adopted product stewardship in their businesses. To measure the extent
to which these practices were adopted, a 5- point Likert scale was utilized with: 1
signifying No extent at all, 2- small extent, 3- moderate extent, 4-large extent and 5-
very large extent.
Table 9: Product stewardship strategies
II. Product stewardship
Statement Mean Std. Dev. Ranking
1
The organization has invested in activities that
ensure any waste after delivery is returned for
recycling and reuse 3.313 1.274
1
2 The organization consumes waste and scrap
internally 2.583 1.334 8
3 The organization creates market for waste
products it cannot consume internally. 2.979 1.120 3
4
The organization has a waste handling policy
e.g. waste sorting, increased use of recycled
materials, and reducing waste amounts 2.604 1.364
7
5
The organization shares its environmental
management techniques with other firms in the
industry 2.667 1.226
5
6 The organization has a collection point for
goods meant for recycling e.g pallets 2.625 1.178 6
7
There is departmental collaboration,
communication and cooperation in product
stewardship. 3.146 1.185
2
8
The Organization provides its customers with
information and training regarding product
stewardship. 2.938 1.311
4
Average mean 2.857

27
From indications on Table 9, whether the organizations have invested in activities that
ensure any waste after delivery is returned for recycling and reuse scored a mean of
3.3125, ranking the most adopted Product stewardship strategy. Existence of
departmental collaboration, communication and cooperation in product stewardship in
the organization came second with mean of 3.146, meaning that, organizations that
adopted product stewardship strategies, were keen on organization-wide collaboration
to ensure success of the plan. Mean scores for organizations that created market for
waste products they could not consume internally were at 2.979, making it the third
best strategies in this category, followed by organizations that provide their customers
with information and training regarding product stewardship, at a mean of 2.937.
Whether the organizations shared their environmental management techniques with
other firms in the industry reaped a mean of 2.667, making it fifth in popularity.
Organizations with collection points for goods meant for recycling was at a mean of
2.625, while those that have waste handling policies and reduction of waste amounts
came second last with a mean of 2.604. The least popular strategy for product
stewardship was internal consumption of wastes and scraps by the organizations with a
mean of 2.583.
This indicates that majority of the firms do not reuse waste product they produce and
are likely to concentrate on deriving more benefits by reducing the amount of waste
they produce. External pressure from stakeholders to adopt green strategies is also a
key factor for total solution logistics firms if they are to operate competitively with
other firms. This enables an organization reduce costs by saving on materials and
gaining good reputation that enables the firm operate efficiently and effectively. The
result also shows that logistics firms heavily outsource recycling activities as they do
not want to invest in the activity, or they want to avoid the risks that come about with
using recycled materials in their businesses.
4.3.3 Adoption of clean technology
This section highlights the extent to which total solution logistics service providers in
Mombasa have adopted clean technology in their business processes. To measure the
extent to which these practices were adopted, a 5- point Likert scale was utilized with:
1 signifying No extent at all, 2- small extent, 3-moderate extent, 4-large extent and 5-
very large extent.

28
Table 10: Clean technology strategies
III. Clean technology
Statement Mean Std. dev. Ranking
1
The organization has invested in activities that
ensure products are delivered using a green
distribution system 3.188 1.249
3
2
The organization engages in energy
conservation, fuel recovery and uses energy
efficient equipment 3.563 1.128
1
3
The organization has included Clean
Technology in its strategic planning process and
gets commitment from senior managers 2.917 1.318
5
4
The organization engages in information
gathering on trends in clean technology to assess
their business process performance. 2.896 1.259
7
5
The organization has a policy that ensures
equipment producing harmful emissions are
serviced or written off 3.208 1.129
2
6 The organization adopts new technology that
promotes greening 3.167 1.226 4
7 The organization trains its employees on Clean
Technology principles 2.896 1.242 6
Average mean 3.119
Table 10 shows the results as follows; firms that engage in energy conservation, fuel
recovery and uses energy efficient equipment had a mean score of 3.5625, followed by
those that have a policy that ensures equipment producing harmful emissions are
serviced or written off with a mean score of 3.208. Whether the organizations have
invested in activities that ensure products are delivered using a green distribution
system gained third position with a score of 3.186. The fourth in popularity went to
whether the organizations adopted new technology that promote greening, at a mean of
3.167. Standing number five was whether the organizations have included Clean

29
Technology in their strategic planning process and acquired commitment from senior
managers, with a mean of 2.916. The last place saw a tie between whether the
organizations trained their employees on clean technology principles and whether they
engaged in information gathering on trends in clean technology to assess their business
process performance. They both managed a mean of 2.896
The results suggest that the organizations gives priority to energy saving and efficiency
as a means of adoption of clean technology strategy. As much as firms would be
interested in adopting green strategies, financial constraints restrict their level of
investments. This is because implementing new green strategies may mean purchasing
new and reliable machinery which are usually expensive and out of reach to many
logistics firms in Mombasa.
4.3.4 Sustainability vision
This section highlights the extent to which total solution logistics service providers in
Mombasa have a vision for sustainability in the plan and business processes. To
measure the extent to which these practices were adopted, a 5- point Likert scale was
utilized with: 1 signifying No extent at all, 2- small extent, 3-moderate extent, 4-large
extent and 5- very large extent
Results around whether the organizations invested in Research and development to
ensure sustainability in its processes and products emerged priority, scoring a mean of
(3.2083333). This goes without saying that total solution logistics providers have
invested in research and development functions of their organizations to ensure
sustainability of business processes and green strategies. Coming second was whether
the organizations have set clear sustainability goals and objectives at a mean of (3.125).
Evidently, most of the organizations may not have adopted some of the strategies by
the time of data collection but have clear goals and objectives about green strategies
and sustainability. This is in itself, a commitment to adopt green strategies. Whether all
stakeholders are aware and supportive of the organization’s journey towards greening
became third with a mean score of (3.125), indicating importance of sensitization and
engagement to implementation of green strategies. Registered fourth was the
organization’s involvement in sustainability campaigns which managed a score of
(2.9583333) and lastly, whether there are consequence management measures in place

30
to be applied in case a stakeholder/supplier frustrated the organization’s sustainability
efforts (2.75).
Table 11: Sustainability vision strategies
IV. Sustainability vision
Statement Mean Std. dev. Ranking
1
The organization has invested in Research and
development to ensure sustainability in its
processes and products 3.208 1.254
1
2 The organization has set clear sustainability goals
and objectives 3.125 1.299 2
3 All stakeholders are aware and supportive of the
organization’s journey towards greening. 3.125 1.248 3
4
There are consequence management measures in
place to be applied in case a stakeholder/supplier
frustrates the organization’s sustainability efforts 2.75 1.329
5
5 The organization is involved in sustainability
campaigns either locally, globally or both. 2.958 1.237 4
Average mean 3.033
The last two indicate that even though the firms adopt green strategies, the level of
weights and commitment accorded their implementation are still inadequate. Total
logistics solution firms in Mombasa are clearly less futuristic when it comes to greening
their businesses.
4.4. Relationship between green strategies and competitive advantage
4.4.1 Organization competitive advantage
This section highlights the level to which total solution logistics service providers in
Mombasa consider themselves to have competitive advantage relative to other
competing firms. To measure the extent to which an organizations has competitive
advantage over others, a 5- point Likert scale was utilized with: 1 signifying No extent
at all, 2- small extent, 3-moderate extent, 4-large extent and 5- very large extent.

31
Table 12: Competitive advantage
Competitive advantage
Statement Mean Std.
deviation Ranking
1 Customer base compared to competitors 3.125 1.231 3
2 Profitability 2.625 1.248 6
3 Customer satisfaction and loyalty 2.917 1.164 4
4 Relative market share 2.854 1.321 5
5 Corporate/ brand image 3.292 1.129 2
6 Public and government goodwill 3.458 1.071 1
Average mean 3.045
Table 12 shows the results. Firms that supposedly realized a positive public and
government goodwill scored a mean (3.458) and improved corporate brand image
(3.291). On whether an upward trend in customer base compared to competitors was
evident, a mean of (3.125) was scored, while the least competitive advantage indicators,
customer satisfaction and loyalty scored a mean of (2.917), relative market share and
profitability were at (2.854) and (2.625), respectively.
This implies that logistics firms have shifted their focus from the traditional model of
pursuing profits to a model that aims at increasing market share by targeting to gain
good corporate image. Environmentally safe services appeal to a wider customer base
hence logistics companies aim at adopting green strategies to achieve a wider market
share. Most of the firms in Mombasa are yet to fully invest in green strategies to enable
maximum ROI.
4.4.2 Green strategies and Competitive advantage
A relationship between green strategies and competitive advantage had to be
investigated and established whether it existed. The data was analyzed through a
regression analysis to come up with the below deductions.
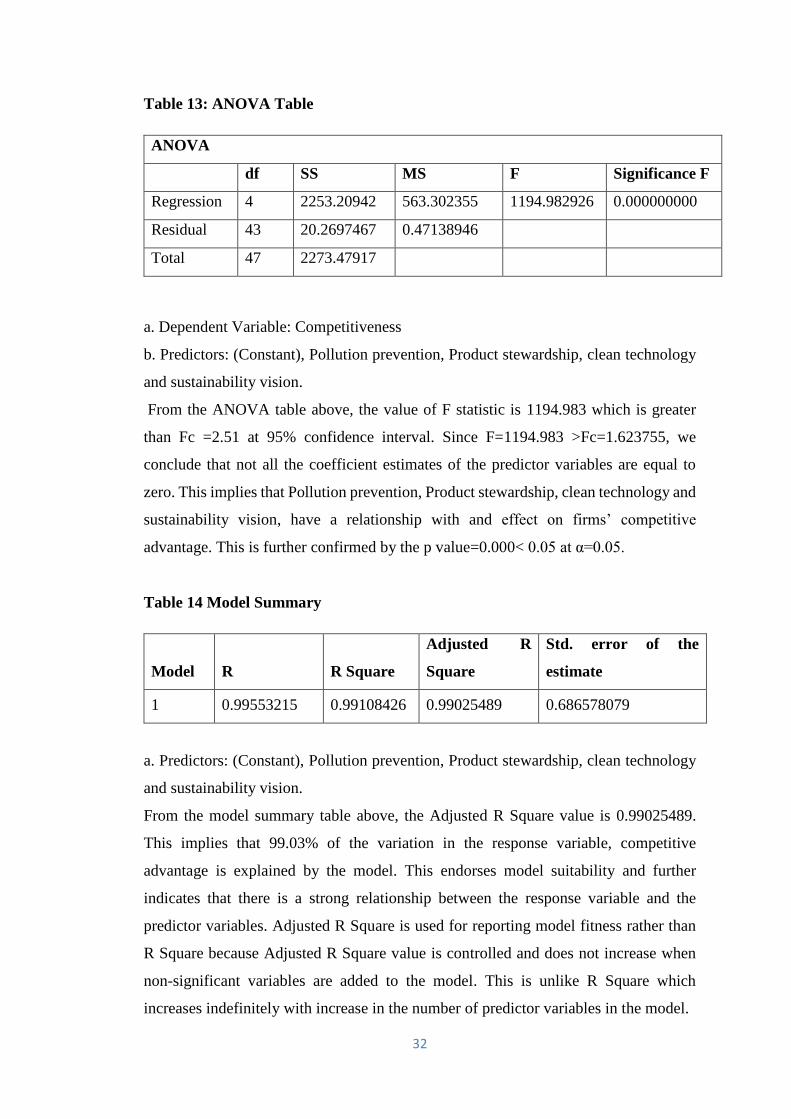
32
Table 13: ANOVA Table
ANOVA
df SS MS F Significance F
Regression 4 2253.20942 563.302355 1194.982926 0.000000000
Residual 43 20.2697467 0.47138946
Total 47 2273.47917
a. Dependent Variable: Competitiveness
b. Predictors: (Constant), Pollution prevention, Product stewardship, clean technology
and sustainability vision.
From the ANOVA table above, the value of F statistic is 1194.983 which is greater
than Fc =2.51 at 95% confidence interval. Since F=1194.983 >Fc=1.623755, we
conclude that not all the coefficient estimates of the predictor variables are equal to
zero. This implies that Pollution prevention, Product stewardship, clean technology and
sustainability vision, have a relationship with and effect on firms’ competitive
advantage. This is further confirmed by the p value=0.000< 0.05 at α=0.05.
Table 14 Model Summary
Model R R Square
Adjusted R
Square
Std. error of the
estimate
1 0.99553215 0.99108426 0.99025489 0.686578079
a. Predictors: (Constant), Pollution prevention, Product stewardship, clean technology
and sustainability vision.
From the model summary table above, the Adjusted R Square value is 0.99025489.
This implies that 99.03% of the variation in the response variable, competitive
advantage is explained by the model. This endorses model suitability and further
indicates that there is a strong relationship between the response variable and the
predictor variables. Adjusted R Square is used for reporting model fitness rather than
R Square because Adjusted R Square value is controlled and does not increase when
non-significant variables are added to the model. This is unlike R Square which
increases indefinitely with increase in the number of predictor variables in the model.

33
A relationship between green strategies and competitive advantage was established. A
multiple linear regression model was run and the results obtained were analyzed and
interpreted.
Table 15 Model Coefficients Table
MODEL
Unstandardized
Coefficient t Stat P-value
B
Standard
Error
Constant 1.74869819 0.441802843 3.958096282 0.000278702
X1 -0.0417367 0.107463901 -0.38837896 0.699651921
X2 0.38148839 0.07694681 4.957819463 0.000011621*
X3 0.01735214 0.123186501 0.140860723 0.888637792
X4 0.54388886 0.16113328 3.375397428 0.001572018*
5% level of significance*
From the table above, we obtained coefficients’ estimates of the model as shown below
β0 = 1.74869819
β1 = -0.0417367
β2= 0.38148839
β3= 0.01735214
β4 = 0.54388886
We fit the above coefficient estimates in our model and obtain the model equation
Y=1.74869819 - 0.0417367X1 + 0.38148839X2 + 0.01735214X3 + 0.54388886X4
Where:
Y = Competitive advantage X1 = Pollution prevention X2 = Product stewardship
X3 = Clean technology X4 = Sustainability vision
From Table 15, product stewardship and Sustainability vision were found to be
statistically significant predictor variables at α=0.05 level of significance with p-values
0.00001 and 0.00157 respectively. While pollution prevention and clean technology p-

34
values of 0.6997 and 0.8886 respectively were found not to have a statistically
significant relationship with competitive advantage in the model at α=0.05 level of
significance. However, all the predictor variables except for pollution prevention had a
positive relationship with the response variable implying that adoption of the green
strategies led the firms to gain competitive advantage. From the model equation, each
of the predictor variables has a relationship with the response variable and is interpreted
as below:
Pollution prevention regression coefficient is -0.0417 implying that holding all other
predictor variables constant, an increase in pollution prevention activities resulted in a
shrinkage of the firm’s competitive advantage by 0.0417. Product stewardship
regression coefficient is 0.3815 implying that holding all other predictor variables
constant, a unit rise in product stewardship activities resulted into a gain in the firm’s
competitive advantage by 0.3815. Clean technology regression coefficient is 0.0174
implying that holding all other predictor variables constant, a unit growth clean
technology resulted in an growth in the firm’s competitive advantage by 0.0174.
Sustainability vision regression coefficient is 0.5439 implying that holding all other
predictor variables constant, a unit increase in sustainability commitment resulted in a
positive trend in the firm’s competitive advantage by 0.5439.
From the analysis, it was found out that two of the predictor variables were statistically
significant. However, apart from pollution prevention, all the other variables had
positive relationship with firm’s competitive advantage.
4.5 Discussion of findings
From the research results, it is evident that organizations that are globally owned, large
in size and have many years of operations are more conscious of their impact on the
environment and are therefore, more likely to show commitment to the protection of
the environment. These organizations consists of those that find it necessary to invest
in research and development to help gather information and recommend strategies to
adopt. Such firms are more likely to win the confidence of their customers, the public
and the government.
While trying to achieve the first objective of the study which was to establish the extent
of green strategies adoption by total solution logistics service providers in Mombasa, it

35
became evident that, of the four independent variables analyzed, pollution prevention
and clean technology strategies were the most adopted strategies by total logistics
solution service providers in Mombasa. This means that the firms were keen on keeping
up with regulations of the environmental authority in Kenya, NEMA, to keep off legal
or political challenges that may arise as a result and for legitimization and acceptance
as suggested in institutional and population ecology theories. Clean technology is also
a means of enabling maintenance of equipment, thus longer life, lower depreciation and
lowered costs. Most firms today focus on minimizing costs and maximizing revenues
and will therefore, easily adopt such strategies that facilitate the optimization. Product
stewardship and sustainability vision strategies were adopted by a smaller population
of the total solution logistics firms who are probably well established in terms of
financial turnover, global or international experience and the size of the organization.
This was a clear show that logistics firms are still at infancy stages of commitment and
adoption of green strategies.
As seen in previous studies, environmentally cognizant policies enable firms to
moderate their total costs as well as gain competitive advantage such as growth in
revenue, brand reputation and trust, among others. Similarly, this study established that
competitive advantage is more likely to be gained by firms that adopted green strategies
but in the context of total solution logistics firms, those that adopted clean technology
stood to gain more advantage compared to those that adopted other green strategies.
This can be attributed to the eventual benefits of energy efficiency and lesser emission
processes which results to significantly reduced costs and improved efficiency of
equipment. Generally speaking, objective two of the study was achieved by establishing
that a positive relationship exists between adoption of green strategies and Competitive
advantage of total solution logistics service providers in Mombasa.

36
CHAPTER FIVE: SUMMARY, CONCLUSIONS AND
RECOMMENDATIONS
5.1 Introduction
In this chapter, findings from this study are summarized and conclusions provided. The
research also presents recommendations on areas that were found to have gaps. Lastly,
the researcher suggests on areas that need further research on this topic.
5.2 Summary
The aim of this study was to establish the relationship between competitive advantage
and adoption of green strategies by total solution logistics service providers in
Mombasa County, Kenya. The survey also sought to determine apparent benefits of
adopting green strategies by these firms. This section draws conclusions from the
research findings in this study.
Research results demonstrates that the majority of the businesses: had been in operation
for over 10 years (33.3%), 37.5% of the firms were globally owned, 37.5 % earned a
topline revenue of between one million and ten million Kenyan shillings and had
between 10-50 employees (39.6%). 83.3% of the firms were registered with an
environmental management body and 66.7% of the firms had established an
environmental department, with only 31.3% having acquired environmental
certification. All of the firms surveyed had adopted at least one of the green strategies.
This shows that these firms had capacity and the will power to manage the environment.
The study also showed that the most popularly adopted green strategies was pollution
prevention mostly featuring compliance with environmental management demands of
the local authority, in this case, NEMA. Engagement in energy conservation, fuel
recovery and uses energy efficient equipment was also popular followed closely by
investments in Research and development to ensure sustainability in business process
and existence of policy that ensured equipment producing harmful emissions were
serviced or written off
The least adopted strategies were consumption of waste and scrap internally where, in
most cases, the firms had no use for the scrap and wastes. Most organizations did not
have a collection point for goods meant for recycling and recognized no need for this

37
arrangement. Consequence management measures was least of the firm’s worries and
was amongst the least scored. The perception by the logistics firms are that local
environmental certification do not add value to their business and are unnecessarily
expensive hence the reason most firms did not pursue accreditation.
5.3. Conclusions
The study determines that concern for environment and organizational sustainability
are increasing and that respondents are aware of the impacts of green strategies but are
not perfectly familiar with how the impact trickles down to affect their competitive
advantage, hence reluctance in adoption. This conclusion agrees with previous studies
done before expounding on how green strategies are positively correlated with
competitive advantage, in the long term. As stated earlier, being green is not easy but,
motivated by forthcoming regulations, consumer pressure, and directives from
corporations, more companies are working towards greening and sustainability efforts
(Partridge, 2008).
The study also concludes that most total solution logistics service providers in
Mombasa are still at the infant phase of adopting green strategies and some of the firms
had subscribed to the environmental bodies. A significant number of these firms were
subject to environmental management audits but most firms have been left to run their
businesses independently without close monitoring on their operational efficiency.
The study concludes that most logistics firms are running on a model that aims at
keeping business running costs at the minimal level hence the low adoption of green
strategies. Perceived benefits of green strategies are outweighed by the monetary
investment of plant and machinery to support the cause. The need to curtail costs was
also found to be a common inspiration force for adoption of green strategies (Ahuja,
Hart & Gautam, 1996).
5.4 Recommendations
Founded on the conclusion drawn, the researcher made the following deductions: There
is need to increase awareness on green strategies on the enhancement of overall
performance in the logistics industry in Mombasa, this will help reduce the
environmental degradation associated with logistics firms and the Kenya ports
authority. There is also need to adopt various green policies through government

38
legislations. Environmental bodies should sensitize the players on importance of
compliance with environmental regulations and should invest more on monitoring
procedures to seal gaps that exists in the industry with regard to greening. The
government should also increase more environmental regulators in the logistics
industry and make the process less expensive and less tedious. Firms also need to ensure
they utilize recycled items when procuring their inputs as opposed to using cheaper
imports which degrade the environment. Finally, logistics firms in Mombasa should
consider adopting greening policies fully so as to make them competitive amid
emerging technology and trends.
5.5 Recommendations for Further Research
The results of this study can be applied to propose several directions for imminent
research. A field study can center on investigating demands by customers and whether
there is any preference in demand of services from companies that adopt green
strategies in comparison to those that do not have any indication of adopting green
strategies. Additionally, senior managers need to develop greening skills and
knowledge in order to effectively manage a green organization. They need to focus on
improving the environment in order to improve organizational performance. The
researcher also recommends further research on the costs related to greening and the
return on investment of adopting green strategies. Greening is a new concept that needs
new policies to assist firms to have a harmonized structure that enables uniformity in
operations.
5.6 Limitations of the Study
This research was limited by the element of some of the respondents deeming the
information required as confidential. It was therefore, difficult to convince them that
the highest level of confidentiality would be maintained and as a result, some questions
were left unanswered. Importantly, the study was limited to a specific category of
logistics service providers in a specific geographical area. Additional studies should be
done More study should be extended to other categories of players in the industry across
different geographical regions. Lastly, time and resources were limited to the
researcher. The drop and pick later method of questionnaire administration proved to
be time consuming and the data collectors were forced to record the responses together
with the respondents.

39
REFERENCES
Aerts, W., Cormier, D., & Magnan, M. (2006). Intra-industry imitation in corporate
environmental reporting: an international perspective. Journal of accounting and public
policy, 25 (3), 299-331.
Afuah, A. (2002). Mapping technological capabilities into product markets and competitive
advantage: the case of cholesterol drugs. Strategic Management Journal.
Hart Stuart and Ahuja Gautam. (1996). Does it pay to be green? An Empirical Examination of
the relationship between emission reduction and Firm performance. Business Stratem
and the Environment, Vol. 5, 30-37.
Caves, C. M. (1980). Quantum-Mechanical Radiation-Pressure Fluctuations in an
Interferometer.
Čekanavičius Linas, Bazytė Rugilė, Dičmonaitė Agnė . (2014). Green business: challenges and
practices. Ekonomika 2014 Vol. 93(1), 75.
Clark, C. F., Kotchen, M. J., & Moore, M. R. (2003). Internal and external influences on pro-
environmental behavior: participation in a green electricity program. Journal of
Environmental Psychology, 23, 237-246.
Cozollino, A. (2012). Humanitarian Logistics, Cross sector cooperation in disaster relief
management. Roma.
Craig, A. B. (2010). Using neo-institutionalism to advance social and environmental
accounting. Critical Perspectives on Accounting, 283–293.
Crook T. Russel, Ketchen Jr David J., Combs James G. & Todd Samuel Y. . (2008). Strategic
resources and performance: a meta-analysStrategic Management Journal, 1141–1154.
Dacin, T. J. (1997). The Company and the Product: Corporate Associations and Consumer
Product Responses. Journal of Marketing Vol. 61, No. 1, 68-84 .
Dimitriades, Z. S. (2007). Business Ethics and Corporate Social Responsibility in the e-
Economy: A Commentary. Electronic journal of business.

40
D'Souza, C. T. (2006). An empirical study on the influence of environmental labels on
consumers, Corporate communications. an international journal, vol. 11, no. 2, 162-
173.
Johnson, Ellen. (2009). Improving business through smart energy and environment policy.
New York: IBM Corporation.
Kassinis George & Soteriou Andreas. (2003). Greening the Service Profit Chain : The impact
of environmental management systems. Nicosia.
Hart, S. L. (1995). A Natural-Resource-Based View of the Firm . The Academy of Management
Review, 986-1014.
Hirsch, P. M. (1975). Organizational Effectiveness and the Institutional Environment.
Administrative Science Quarterly, 1975.
Hopkins, D. L. (1992). Modeling Dyadic Interactions and Networks in Marketing. Journal of
Marketing Research, Vol. XXIX, 5-17 .
Hoskisson R. E., Hitt, M. A., Wan, W. P. & Yiu, D. (1999). Theory and research in strategic
management: Swings of a pendulum. Strategic Management Journal, 25 (3),, 417-456.
Jone, J. (2014, October 24). Incorporating ‘Green’ Into Your Business Practices.
D'Cruz, Joseph R.. (1992). New Compacts for Canadian Competitiveness. Toronto: Diane
Publishing Company.
Kauffeld Rich, M. A. (2009, December). Green Is a Strategy. Retrieved from
strategy+business: http://www.strategy-business.com/article/00013?gko=e5d36
Khan, E. R. (2014). Green Marketing& its Impact on Society: Emerging Challenges &
Opportunities. International Journal of Management and International Business
Studies, 263-270.
Kombo, K.K & Tromp, D. (2006). Proposal and Thesis writing, An introduction. Nairobi:
Paulines Publications Africa.
Mintzberg, Henry & Lampel Joseph (1999). Reflecting on the Strategy Process. 21-30: Sloan
Management Review.

41
Rivera, Leon Jorge & De Leon, Peter (2004). Is Greener Whiter? Voluntary Environmental
Performance of Western Ski Areas. Policy Studies Journal, 417–437.
Madhani, P. M. (2010, March). Resource Based View of Competitive Advantage: An overview.
Retrieved from Research gate: https://www.researchgate.net
Mathews, P. (2006). The role of mentoring in promoting organizational competitiveness.
Competitiveness Review: An International Business Journal, Vol. 16 Iss: 2, 158 - 169.
Laroche, Michel J. B.-F. (2001). Targeting consumers who are willing to pay more for
environmentally friendly products. Journal of Consumer Marketing, VOL. 18 NO. 6, 503-520.
Mugenda, O. M. (2003). Research methods: Quantitative and qualitative approaches. Nairobi:
African Centre for Technology Studies.
Murage, J. (2011). Green supply chain initiatives and challenges by manufacturing.
Unpublished MBA Project. University of Nairobi.
Mwaengo, T. K. (2013, 10). Green supply chain management practices and environmental
performance in Bamburi cement limited. Unpublished Research Paper, University of
Nairobi. Nairobi, Kenya.
NorthWest Products Stewardship Council . (n.d.). Retrieved from NorthWest Products
Stewardship Council : http://productstewardship.net
Olson, E. (2008). Creating an enterprise-level ‘‘green’’. Journal of Business strategy.
Omonge, W. O. (2012, 11). Green supply chain management practices and competitiveness of
Commercial Banks in Kenya. Unpublished Research Paper. Nairobi, Kenya:
University of Nairobi.
Orodho, A. J. (2003). Essential of Educational and social Sciences Research Method. Nairobi:
Masola Publishers.
Orodho, A.J and Kombo, D.K. (2002). Research Methods. Nairobi: Kenyatta University,
Institutev of Open Learning.
Partridge, Amy. Roach. (2008, January). Sustainability: Green is the New Black.
Penrose, E. T. (1959). The Theory of the Growth of the Firm. New York: John Wiley.

42
Petrie, S. J. (2012). Favor Trading in Public Good Provision. Interdisplinary centre for
Economics science.
Powell, Paul J. DiMaggio and Walter W. (1983). The Iron Cage Revisited: Institutional
Isomorphism and Collective Rationality in Organizational Fields. American
Sociological Review, 147-160.
Prakash, A. (2002). Green Marketing, Public Policies and Managerial Strategies. Business
Strategy and the Environment, 285–297.
Riley, J. (2015). Tutor2u. Retrieved from Tutor2u Web site: http://www.tutor2u.net
Robinson, J. P. (2007). Strategic Management: Strategy Formulation, Implementation and
Control, 10th Edition. Chicago: R. D. Irwin, Inc.
Rodrigue, J.-P. (2013). The Geography of Transport Systems. Retrieved from
https://people.hofstra.edu/geotrans/eng/ch8en/appl8en/ch8a4en.html
Rowan, J. W. (1977). Institutionalized Organizations: Formal Structure as Myth and
Ceremony. American Journal of Sociology, 340-363.
Rumelt, S. A. (2003). A bargaining perspective on resource advantage. Strategic Management,
1069–1086 .
Masoumik, Maryam S. H.-R. (2014). Gaining Competitive Advantage through Strategic Green
Supply Chain Management. International article for supply chain management.
Sirmon, D. G., Hitt, M. A., & Ireland, R. D. (2007). Managing firm resources in dynamic
environments to create value: Looking inside the black box. Academy of Management
Review, 32(1), 273–292.
Smart, B. (1992). Beyond compliance - A new industry view of the environment. Washington
DC: World Resource Inst.
Smith, S. (1995). World‐class competitiveness, Managing Service Quality. An International
Journal, 36 - 42.
Society, P. S. (2014). Core Competencies for the Product Stewardship Proffessional.
Stanton, D. (2015, April 21). GFK. Retrieved from GFK Website: http://www.gfk.com

43
Stephan, R. W. (1996). Paradigms of competitiveness. An International Business Journal, 8 -
13.
Szuchnicki, A. L. (2009). Examining the influence of restaurant green practices on customer
return intention. Thesis. Digital Scholarship@UNLV.
Thompson Arthur, S. I. (2007). Crafting and Executing Strategy: The Quest for Competitive
Advantage: Concepts and Cases. McGraw-Hill Companies,Incorporated.
Walter W. Powell and Paul J. DiMaggio. (1991). The New Institutionalism in Organizational
Analysis. University of Chicago press.
Wright, M. F. (1994). The Persuasion Knowledge Model: How People Cope with Persuasion
Attempts. Journal of Consumer Research, 1-31.
Xie, Y. A. (2012). Greening community pharmaceutical supply chain in UK: a cross boundary
approach. Supply Chain Management: An International Journal, 40-53.
Zandbergen, P. Devereaux Jennings and Paul A. (1995). Ecologically Sustainable
Organizations: An Institutional Approach. The Academy of Management Review, 1015-
1052.

44
APPENDICES
Appendix 1: Research questionnaire
Introduction
This questionnaire has been designed for the sole purpose of collecting data on the
application of green strategies by total solution logistics service providers Mombasa,
Kenya. The data collected will be treated with a very high degree of confidentiality and
it is meant for academic purpose only.
Green strategies are policies crafted and adopted by organizations as their commitments
environmental responsibility.
Please fill the blank spaces and tick appropriate choices/boxes
PART I: General information about the firm.
1. For how long has your organization been in operation?
a) 1 – 3 years
b) 3 – 5 years
c) 5 – 10 years
d) Over 10 years
2. Describe the ownership structure of your organization;
a) Locally owned sole proprietorship
b) Locally owned partnership/corporation
c) Global/international ownership
d) Local and global partnership
e) Parastatal organization
3. What is your current work force capacity?
a) 1 – 10 employees
b) 11- 50 employees
c) 50 – 100 employees
d) Over 100 employees
4. Select the range of your organization’s monthly financial turnover in Kenyan
Shillings.
a) 100,000 – 1 million
b) 1million – 10 million

45
c) 10 million – 100 million
d) Over 100 million
5. Which services does your company offer?
a) Freight forwarding
b) Warehousing
c) Transportation
d) Repackaging & Reworking
e) Logistics consultation
6. Does your organization have an environmental management function/
Department?
Yes [ ] No [ ]
7. Does your organization have any green strategy policies in place?
Yes [ ] No [ ]
8. Is your organization registered with any environmental management bodies?
Yes [ ] No [ ]
If yes, kindly state the environmental management bodies you are registered with.
………………………………………………………………………………………
………………………………………………………………………………………
………………………………………………………………………………………
9. Does your organization have any environmental certification?
Yes [ ] No [ ]
If yes, kindly state which certification your organization possesses?
……………………………………………………………………………………..
……………………………………………………………………………………...
………………………………………………………………………………………
PART II: Green strategies.
Please indicate the extent to which your firm has adopted the following Green
strategies.
[1] No extent at all [2] Small [3] Moderate [4] Large [5]Very large extent

46
I. Pollution prevention
Statement 1 2 3 4 5
1. The organizations collaborate with stakeholders to
ensure provision of services that do not compromise
the environment.
2. The suppliers to the organization have to show
compliance with particular regulations that protect the
environment.
3. The organization sources its products and services
from ISO certified suppliers
4. The organization gives feedback to suppliers on
supplies that are not environmentally friendly.
5. The organization carries tests on its inputs such as
fuels to ensure they are environmentally safe.
6. The organization complies with the environmental
demands of the local authority
II. Product stewardship
Statement 1 2 3 4 5
1. The organization has invested in activities that ensure
any waste after delivery is returned for recycling and
reuse
2. The organization consumes waste and scrap internally
3. The organization creates market for waste products it
cannot consume internally.
4. The organization has a waste policy as to waste
sorting, increased use of recycled materials, and
reducing waste amounts
5. The organization shares its environmental
management techniques with other firms in the
industry
6. The organization has a collection point for goods
meant for recycling e.g pallets

47
7. There is departmental collaboration, communication
and cooperation in product stewardship.
8. The Organization provides its customers with
information and training regarding product
stewardship.
.
III. Clean technology
Statement 1 2 3 4 5
1. The organization has invested in activities that ensure
products are delivered using a green distribution
system
2. The organization engages in energy conservation, fuel
recovery and uses energy efficient equipment
3. The organization has included Clean Technology in
its strategic planning process and gets commitment
from senior managers
4. The organization engages in information gathering on
trends in clean technology to assess their business
process performance.
5. The organization has a policy that ensures equipment
producing harmful emissions are serviced or written
off
6. The organization adopts new technology that
promotes greening
7. The organization trains its employees on Clean
Technology principles

48
IV. Sustainability vision
Statement 1 2 3 4 5
1. The organization has invested in Research and
development to ensure sustainability in its processes
and products
2. The organization has set clear sustainability goals and
objectives
3. All stakeholders are aware and supportive of the
organization’s journey towards greening.
4. There are consequence management measures in
place to be applied in case a stakeholder/supplier
frustrates the organization’s sustainability efforts
5. The organization is involved in sustainability
campaigns either locally, globally or both.
PART III – The organization’s competitive advantage
Please indicate the extent to which your firm indicates a gain of competitive
advantage.
[1] No extent at all [2] Small [3] Moderate [4] Large [5] Very large extent
Competitive advantage
Statement 1 2 3 4 5
1. Customer base compared to competitors
2. Profitability
3. Customer satisfaction and loyalty
4. Relative market share
5. Corporate/ brand image
6. Public and government goodwill

49
Appendix 2: List of total solution logistics firms in Mombasa
1 Acceler Global Logistics 33 Kate Freight
2 Access Shipping Agency 34 Kenfreight (E.A) Ltd
3 Aeromarine 35 Kuehne + Nagel
4 Ainushamshi 36 Logistics 365
5 Alpha Logistics Ltd 37 Mackenzie Maritime (E.A) LTD
6 Aramex Kenya Ltd 38 Mara Shabba Logistics
7 Ataco Freight 39 Mbaraki Port Warehouses
8 Bahari Forwarders Ltd 40 Mitchell Cotts Freight (K) Ltd
9 Blue Anchor Shipping 41 Mombasa Times Ltd
10 Bollore Logistics 42 Muranga Forwarders Ltd
11 Bonfide Logistics 43 Mutiple Solutions
12 DSV Air & Sea Ltd 44 Najmi Clearing & Forwarding
13 Damco Logistics 45 Panal Freighters
14 DAP Logistics 46 Pentagon Freighters
15 DB Schenker Ltd 47 Ponderosa Logistics
16 Deccan Freight 48 Principal Forwarders Ltd
17 DHL Global Forwarding 49 Rais Shipping
18 Dodwel East Africa 50 Rapid Kate Services
19 East African Rail Handlers Ltd 51 Reliable Freight Services
20 East Global Logistics 52 Seabase Solutions
21 Logwin Air & Sea 53 Siginon Group
22 Eri Kenya Ltd 54 Spedag Interfreight
23 Export Consolidation Ltd 55 Speedex Logistics Ltd
24 Express Shipping & Logistics 56 Swift Royal Conveyors Ltd
25 Freight Forwarders 57 Threeways Shipping Ltd
26 Freightwell Express Ltd 58 Seedcol Logistics
27 Gate way Marine Services 59 Transoceanic Projects
28 Genuine Freight 60 Ufanisi Freighters
29 Habo Agencies 61 Unigroup
30 Indus Logistics Ltd 62 United Warehouses Ltd
31 Intraspeed Arcpo 63 Yalfa Cargo
32 Jihan Freighters
Source: Federation of East African Freight Forwarders Association’s Directory.

50
Appendix 3: Timeline for research activities
Item
Timeline
Jul. Aug. Sept Oct.
Proposal Development
Data Collection
Data Analysis
Report compilation

51
Appendix 4: Project budget
ITEM DESCRIPTION UNIT COST(Kshs) TOTAL (Kshs)
Instrument Pre-test 2 days @8,000 8,000
Primary data collection 5 days@ 1000/ 2 people 10,000
Data Analysis 5 days@6000 30,000
Report writing &
presentation
7days@ 3000 21,000
Stationery 8000 8,000
Total 77,000

1
Violet A. Onyango,
P.O. Box 81511-80100,
Mombasa.
September, 2016
Dear Respondent,
RE: RESEARCH QUESTIONNAIRE
This questionnaire (attached) is designed to gather information on the ‘Application of green
strategies and competitive advantage of total solution logistics service providers in
Mombasa.
This study is being carried out for a management project paper as a requirement in partial
fulfillment of the Master of Business Administration, University of Nairobi
Please note that this is strictly an academic exercise towards the attainment of the above
purpose. You are hereby assured that the information will be treated with the strictest
confidence.
Your co-operation will be highly appreciated.
Thank you for your anticipated kind response.
Yours Sincerely,
Violet A. Onyango