Application of GIS in the Housing Sector - Incremental … · 2016-10-03 · Application of GIS in...
44
Application of GIS in the Housing Sector Presented by: Zimasa Biyana – GIS Specialist (Spatial Information & Analysis) 27 September 2016
Transcript of Application of GIS in the Housing Sector - Incremental … · 2016-10-03 · Application of GIS in...

Application of GIS in the Housing Sector
Presented by:
Zimasa Biyana – GIS Specialist (Spatial Information & Analysis)
27 September 2016

Content
• Mandate
• GIS & BI
• How GIS & BI use Geographic Information Systems (GIS) to influence decision-making
• Operational decision-making
• Strategic decision-making
• Political decision-making
• Conclusion
• Contact details
2

Mandate
The Housing Development Agency (HDA) is a national public development agency established by an Act of Parliament (Act No. 23, 2008 ), accountable through its board to the Minister of Human Settlements.
The Housing Development Agency (HDA) is a national public development agency that makes well-located land and buildings available for the development of housing and human settlements. In doing so, supporting the creation of sustainable communities.
We carry out our activities in partnership with a range of stakeholders including national, provincial and local government and municipalities, as well as with communities, developers and other affected parties.
3

Mandate
The Act No. 23, 2008 HOUSING DEVELOPMENT AGENCY ACT, 2008, stipulates that the functions of Agency in paragraph 7.2 (d)
• The Agency must (d) introduce and manage a land inventory and information system;
• This implies:
– That we implement systems and procedures that would make data available for decision making on land acquisition and release for human settlement development
– An appropriate mechanisms to do this is through a Geographic Information System (GIS) where alpha-numeric and spatial information can be integrated.
4

Land Information Services
• GIS & BI focus on – making data and information available on land and landed properties.
– the creating and integration of content
– emphasizes information accuracy
– how to share information and data
• It primarily uses geographic information and supporting systems (in particular, GIS) to provide geospatial intelligence to the business operations of the HDA and stakeholders.
5

Political
Strategic - Spatial Targeting
- Land Assembly
- Strategic Integrated Programmes
Operational - Tools (LaPsis/NaHSLI)
- GIS support to Planners
We use GIS to influence decision-making at a:
GIS
6
Data Sources
• StatsSA
• DRDLR – NGI
• Deeds
• DAFF
• SANBI
• DHS
• CGS
• Municipalities (COJ, CoCT,)
• AgriGIS
• GTI
• Quantec
• Eighty20
Government Private
7

Operational decision-making
8

Land and Spatial Information System
• LaPsis is a spatial geographic information system:
• Online, web based GIS viewer
• Access to various spatial layered data sets
• Interactive viewing – overlaid entities to create framework for informed decision making
• Is a reference source to verify information
• Capability to view aerial and satellite
images of land and landed property
• Provides a mapped view of properties
across South Africa 9

Search for a property
10

Manual search for a property
11

Supporting Strategic Interventions
12

An Approach to Spatial Targeting in Human Settlement Development
by Johan Minnie & Hadley Remas March 2013 13

Background and approach
• In recent years the quantum of Grant funding for Human Settlements purposes has progressively increased, yet number of housing units delivered has reduced;
• Thus,
– where in South Africa should the available funds be directed to invest in human settlements and
– where in South Africa can the greatest impact be achieved with the available funds in relation to human settlement development and investment “potential”?
• We have used a Geographic Information System (GIS), to help us define the ‘where’ questions;
14

Methodology
• Spatially quantify the national programmes and priority projects
• Spatially quantify socio-economic variables
• Determining investment potential
• Determine an indicator that could focus investment
15

16

17

Investment in Human Settlements
• Housing Projects
• Planned number of housing units
18
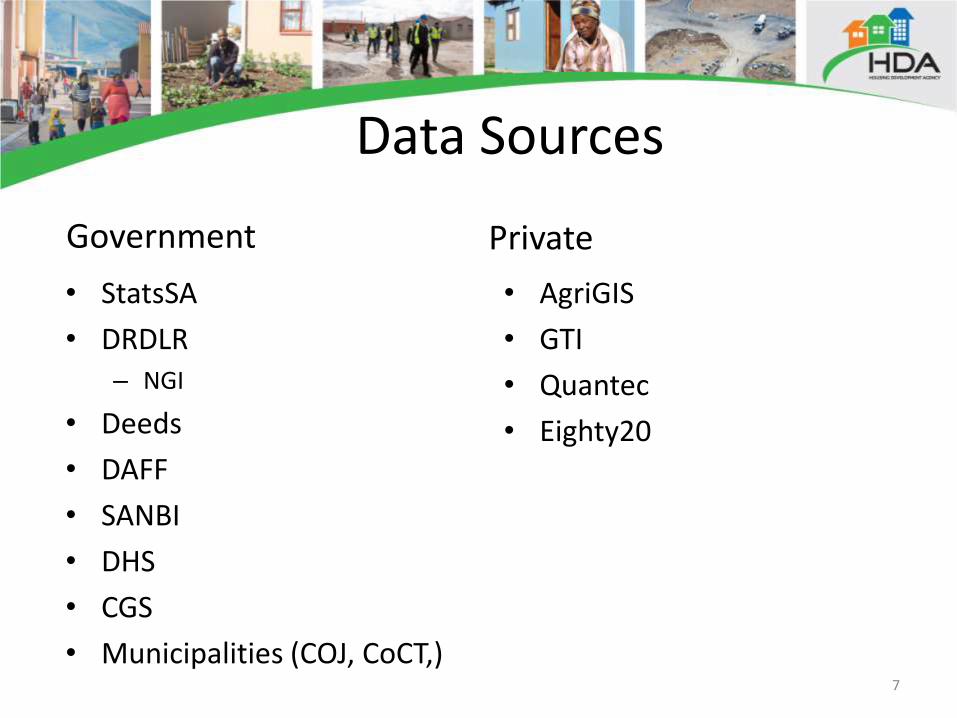
Spatially quantify socio-economic factors
Population Growth
Growth in Employment
In-Migration
Housing Need
Total GVA
Growth in GVA (1995-2011) 19

Determine investment potential
• Municipalities were ranked according the socio-economic variables from highest to lowest.
• The average rank was used to determine investment potential, i.e., municipalities with the highest average rank, had the highest investment potential.
20

No. Municipality Mun. Cat.
Prov In
Migration No. Municipality
Mun. Cat
Prov
In Migration
1 Thabazimbi B3 LIM 24.88 26 Tlokwe C.C. B1 NW 10.24
2 Musina B3 LIM 22.22 27 Lesedi B3 GT 10.18
3 Westonaria B2 GT 18.55 28 Saldanha Bay B2 WC 10.15
4 Madibeng B1 NW 16.80 29 Witzenberg B3 WC 10.07
5 Bitou B3 WC 15.69 30 Govan Mbeki B1 MP 9.93
6 Rustenburg B1 NW 14.76 31 Greater Kokstad B2 KZN 9.42
7 Overstrand B2 WC 14.22 32 Metsimaholo B2 FS 9.25
8 Merafong City B2 GT 14.16 33 Randfontein B2 GT 8.96
9 City of Tshwane A GT 13.17 34 Dipaleseng B3 MP 8.93
10 Mookgopong B3 LIM 13.06 35 George B1 WC 8.36
11 City of Johannesburg A GT 12.69 36 Modimolle B3 LIM 8.14
12 Knysna B2 WC 12.56 37 City of Cape Town A WC 7.85
13 Mossel Bay B2 WC 12.45 38 City of Matlosana B1 NW 7.78
14 Kai !Garib B3 NC 11.82 39 Stellenbosch B1 WC 7.45
15 Gamagara B3 NC 11.63 40 Thembelihle B3 NC 7.41
16 Steve Tshwete B1 MP 11.17 41 Lekwa-Teemane B3 NW 7.12
17 Thaba Chweu B3 MP 10.99 42 Umjindi B3 MP 7.01
18 Emalahleni B1 MP 10.97 43 uMngeni B2 KZN 6.96
19 Lephalale B3 LIM 10.92 44 Phokwane B3 NC 6.96
20 Midvaal B2 GT 10.88 45 Tsantsabane B3 NC 6.90
21 Ekurhuleni A GT 10.87 46 Cape Agulhas B3 WC 6.83
22 Bela-Bela B3 LIM 10.79 47 Kouga B3 EC 6.82
23 KhΓi-Ma B3 NC 10.76 48 Kgatelopele B3 NC 6.74
24 Mogale City B1 GT 10.68 49 Emakhazeni B2 MP 6.67
25 Victor Khanye B3 MP 10.45 50 Hibiscus Coast B2 KZN 6.65
No Municipality Mun Cat
Pop Growth
Total Pop
Pop Density No Municipality
Mun Cat
Pop Growth Total Pop
Pop Density
1 Gamagara B3 5.84% 41 617 15.89 21 Bergrivier B3 2.85% 61 897 14.04
2 Musina B3 5.53% 68 359 9.02 22 Ga-Segonyana B3 2.85% 93 651 20.85
3 Bitou B3 5.22% 49 162 49.57 23 Govan Mbeki B1 2.84% 294 538 99.68
4 Steve Tshwete B1 4.76% 229 831 57.80 24 Knysna B2 2.77% 68 659 61.92
5 Swartland B3 4.56% 113 762 30.69 25 Ventersdorp B3 2.75% 56 702 15.06
6 Midvaal B2 3.94% 95 301 55.33 26 Stellenbosch B1 2.71% 155 733 187.39
7 Overstrand B2 3.80% 80 432 47.10 27 Witzenberg B3 2.64% 115 946 10.78
8 Emalahleni B1 3.58% 119 460 34.65 28 Thabazimbi B3 2.63% 85 234 7.62
9 Rustenburg B1 3.50% 549 575 160.54 29 George B1 2.59% 193 672 37.31
10 Saldanha Bay B2 3.45% 99 193 49.22 30 Tsantsabane B3 2.59% 35 093 1.91
11 Kgetlengrivier B3 3.36% 51 049 12.85 31 Umjindi B3 2.58% 67 156 38.48
12 Lesedi B3 3.26% 99 520 67.04 32 City of Cape Town A 2.57%
3 740 026 1 529.69
13 Umtshezi B3 3.25% 83 153 42.16 33 Drakenstein B1 2.56% 251 262 163.41
14 Kouga B3 3.22% 98 558 36.92 34 Metsimaholo B2 2.51% 149 108 86.84
15 KwaDukuza B2 3.20% 231 187 314.56 35 Ekurhuleni A 2.47% 3 178
470 1 609.10
16 City of Johannesburg A 3.18%
4 434 827 2 695.97 36 Bela-Bela B3 2.44% 66 500 19.52
17 Madibeng B2 3.17% 477 381 124.34 37 Swellendam B3 2.39% 35 916 9.37
18 City of Tshwane A 3.10% 2 921
488 463.89 38 Tlokwe City Council B1 2.38% 162 762 60.88
19 Lephalale B3 3.06% 115 767 8.40 39 Endumeni B3 2.38% 64 862 40.28
20 Victor Khanye B3 2.92% 75 452 48.13 40 Kgatelopele B3 2.37% 18 687 7.54
Rank of Population Growth per LM Rank of In-Migration rate per LM
No. Municipality Munic
Category Prov Total No. Municipality
Munic Category
Prov Total
1 City of Johannesburg A GP 262 983 21 Moses Kotane B4 NW 15 618
2 City of Cape Town A WC 228 403 22 Mnquma B4 EC 15 091
3 Ekurhuleni A GP 227 458 23 King S.D. B2 EC 14 819
4 City of Tshwane A GP 173 564 24 Mbhashe B4 EC 13 746
5 Ethekwini A KZN 172 425 25 Nyandeni B4 EC 12 960
6 LM of Madibeng B1 NW 64 776 26 Maluti a Phofung B3 FS 12 870
7 Rustenburg B1 NW 61 424 27 Greater Tubatse B4 LIM 11 334
8 Buffalo City A EC 54 454 28 Sol Plaatjie B1 NC 10 954
9 Nelson Mandela Bay A EC 40 886 29 KwaDukuza B2 KZN 10 809
10 Mangaung A FS 35 658 30 Ngquza Hill B4 EC 10 656
11 Emfuleni B1 GP 31 801 31 Stellenbosch B1 WC 10 620
12 Mogale City B1 GP 30 759 32 Steve Tshwete B1 MP 10 270
13 Matjhabeng B1 FS 26 186 33 Matatiele B3 EC 9 946
14 Emalahleni B1 MP 25 373 34 Mbombela B1 MP 9 892
15 The Msunduzi B1 KZN 24 241 35 Tlokwe City Council B1 NW 9 786
16 Govan Mbeki B1 MP 24 067 36 Umzimvubu B4 EC 9 688
17 City of Matlosana B1 NW 20 060 37 Mafikeng B2 NW 9 648
18 Polokwane B1 LIM 17 593 38 Mhlontlo B4 EC 9 503
19 Merafong City B2 GP 16 735 39 Setsoto B3 FS 9 403
20 Westonaria B2 GP 16 376 40 Breede Valley B2 WC 9 168
Rank of Housing Need per LM
No. Municipality Mun. Cat. Prov
GVA (R billions) No. Municipality
Mun. Cat. Prov
GVA (R billions)
1 City of Johannesburg A GT 232.074 26 Greater Tubatse B4 LIM 8.969
2 City of Cape Town A WC 185.682 27 Sol Plaatjie B1 NC 8.561
3 City of Tshwane A GT 161.327 28 Mafikeng B2 NW 8.459
4 Ekurhuleni A GT 149.190 29 Makhado B4 LIM 8.157
5 eThekwini A KZN 146.538 30 King Sab. Dali. B2 EC 7.920
6 Nelson Mandela Bay A EC 41.636 31 Moses Kotane B4 NW 7.720
7 Mangaung A FS 30.031 32 Newcastle B1 KZN 7.285
8 Buffalo City A EC 27.518 33 Maluti a Phofung B3 FS 6.791
9 Rustenburg B1 NW 26.620 34 Hibiscus Coast B2 KZN 6.589
10 The Msunduzi B1 KZN 22.702 35 Mogalakwena B2 LIM 6.545
11 Emalahleni B1 MP 21.571 36 Metsimaholo B2 FS 6.296
12 Emfuleni B1 GT 21.539 37 Merafong City B2 GT 6.283
13 Mbombela B1 MP 17.305 38 Ba-Phalaborwa B3 LIM 6.080
14 Polokwane B1 LIM 17.149 39 Potchefstroom B1 NW 6.078
15 Mogale City B1 GT 16.259 40 Nkomazi B4 MP 5.854
16 Govan Mbeki B1 MP 15.134 41 George B1 WC 5.841
17 Madibeng B1 NW 14.317 42 Greater Tzaneen B4 LIM 5.677
18 uMhlathuze B1 KZN 13.969 43 Emnambithi-Ladysmith B2 KZN 5.624
19 Matjhabeng B1 FS 12.886 44 Randfontein B2 GT 5.617
20 City of Matlosana B1 NW 11.487 45 Moqhaka B2 FS 5.458
21 Stellenbosch B1 WC 9.614 46 KwaDukuza B2 KZN 5.181
22 Thulamela B4 LIM 9.532 47 Mossel Bay B2 WC 4.920
23 Steve Tshwete B1 MP 9.507 48 Bushbuckridge B4 MP 4.727
24 Drakenstein B1 WC 9.025 49 Ditsobotla B3 NW 4.460
25 Thabazimbi B3 LIM 8.983 50 Thaba Chweu B3 MP 4.448
Rank of 2011 Total GVA per LM
No. Municipality Munic
category Prov
GVA Growth No. Municipality
Munic category
Province
Growth in GVA
1995-2011 1995-2011
1 Okhahlamba B4 KZN 22.47 21 Modimolle B3 LIM 10.24
2 Ingwe B4 KZN 20.33 22 The Big 5 False Bay
B3 KZN 10.22
3 Bitou B3 WC 19.28 23 UMuziwabantu B3 KZN 10.09
4 Ngquza Hill B4 EC 17.88 24 Mbizana B4 EC 9.7
5 Matatiele B3 EC 16.7 25 Jozini B4 KZN 9.66
6 Mookgopong B3 LIM 15.86 26 Indaka B4 KZN 9.53
7 Elundini B4 EC 14.53 27 Mhlontlo B4 EC 9.48
8 Mtubatuba B3 KZN 13.46 28 Umzimkhulu B4 KZN 9.43
9 Thaba Chweu B3 MP 13.03 29 Msinga B4 KZN 9.39
10 Umzimvubu B4 EC 12.38 30 Ga-Segonyana B3 NC 9.39
11 Greater Tubatse B4 LIM 12.14 31 Merafong City B2 GT 9.12
12 Overstrand B2 WC 11.96 32 Mantsopa B3 FS 9.07
13 Ntabankulu B4 EC 11.88 33 Nongoma B4 KZN 8.98
14 Mossel Bay B2 WC 11.73 34 Elias Motsoaledi B4 LIM 8.93
15 Impendle B4 KZN 11.05 35 Emadlangeni B3 KZN 8.82
16 Umtshezi B3 KZN 10.79 36 Mutale B4 LIM 8.52
17 Umhlabuyalingana B4 KZN 10.67 37 Gamagara B3 NC 8.36
18 Kou-Kamma B3 EC 10.65 38 Mnquma B4 EC 8.32
19 Kouga B3 EC 10.51 39 Greater Kokstad B2 KZN 8.24
20 Sundays River Valley
B3 EC 10.27 40 Knysna B2 WC 8.18
Rank of Growth in GVA per LM
No Municipality Mun Cat.
Growth in Employment
p.a. (2001-2011)
No. Municipality Mun. Cat.
Growth in Employmen
t p.a. (2001-2011)
1 Matatiele B3 34.4 21 Emalahleni EC B4 7.12
2 Gamagara B3 17.24 22 Jozini B4 7.01
3 Greater Tubatse B4 15.82 23 Tsantsabane B3 6.97
4 Langeberg B3 14.56 24 Umhlabuyalingana B4 6.9
5 Mtubatuba B3 13.88 25 Emalahleni B1 6.87
6 Nqutu B4 11.52 26 Polokwane B1 6.6
7 Steve Tshwete B1 10.62 27 Umzimkhulu B4 6.52
8 Joe Morolong B4 10.21 28 Victor Khanye B3 6.51
9 Ga-Segonyana B3 9.6 29 Bushbuckridge B4 6.49
10 Mbizana B4 9.28 30 Govan Mbeki B1 6.34
11 Fetakgomo B4 8.87 31 Richtersveld B3 6.34
12 Nyandeni B4 8.49 32 Ngqushwa B4 6.3
13 Mbhashe B4 8.32 33 Senqu B4 6.13
14 Makhuduthamaga B4 8.17 34 Elias Motsoaledi B4 5.96
15 Thembisile B4 8.05 35 Bitou B3 5.89
16 Nongoma B4 7.97 36 Witzenberg B3 5.84
17 Ingwe B4 7.86 37 Sundays River Valley B3 5.83
18 Madibeng B1 7.38 38 Musina B3 5.8
19 Engcobo B4 7.15 39 Ntabankulu B4 5.79
20 Msinga B4 7.15 40 City of Johannesburg A 5.63
Rank of Growth in % of people employed per LM
Ranking of Socio-Economic Investment Drivers
21

The average rank of socio-economic factors and national programmes or priority initiatives per Local Municipality was used to determine investment potential :
22

MUNICNAMEMunic.
Cat.Prov
No. of
Nat.
Prog.
Housing
Need
Growth
in
empl.
Pop
Growth
In-
migration
2011
Total
GVA
GVA
Growth
(1995-
2011)
Avg.
Rank
Overall
rank
City of Johannesburg A GP 2 1 40 16 11 1 69 20.0 1
Emalahleni B1 MP 7 14 21 8 18 11 111 27.1 2
City of Tshwane A GP 5 4 41 18 9 3 113 27.6 3
Ekurhuleni A GP 7 3 62 35 21 4 98 32.9 4
Greater Tubatse B4 LIM 2 27 3 47 115 26 11 33.0 5
Rustenburg B1 NW 7 7 59 9 6 9 135 33.1 6
Steve Tshwete B1 MP 12 32 7 4 16 23 165 37.0 7
City of Cape Town A WC 12 2 91 32 37 2 100 39.4 8
Gamagara B3 NC 22 141 2 1 15 77 37 42.1 9
Govan Mbeki B1 MP 12 16 30 23 30 16 193 45.7 10
Mogale City B1 GP 22 12 101 55 24 15 94 46.1 11
Kouga B3 EC 50 64 55 14 47 79 19 46.9 12
Polokwane B1 LIM 7 18 26 52 86 14 127 47.1 13
Mbombela B1 MP 22 34 48 53 66 13 97 47.6 14
George B1 WC 50 49 54 29 35 41 82 48.6 15
KwaDukuza B2 KZN 22 29 46 15 58 46 139 50.7 16
Musina B3 LIM 22 119 38 2 2 87 86 50.9 17
Tlokwe City Council B1 NW 22 35 85 39 26 39 120 52.3 18
Ga-Segonyana B3 NC 22 115 9 22 88 108 30 56.3 19
Bitou B3 WC 122 98 35 3 5 130 3 56.6 20
Stellenbosch B1 WC 122 31 115 26 39 21 56 58.6 21
Mangaung A FS 7 10 99 80 65 7 143 58.7 22
Matatiele B3 EC 50 33 1 141 121 64 5 59.3 23
Saldanha Bay B2 WC 50 82 92 10 28 65 90 59.6 24
Elias Motsoaledi B4 LIM 22 104 34 93 80 53 34 60.0 25
Thembisile B4 MP 22 44 15 60 72 54 155 60.3 26
Thaba Chweu B3 MP 122 57 120 61 17 50 9 62.3 27
Mossel Bay B2 WC 50 114 160 44 13 47 14 63.1 28
Hibiscus Coast B2 KZN 50 61 71 74 50 34 110 64.3 29
Knysna B2 WC 122 74 94 24 12 93 40 65.6 30Top 20 in category
Other Municipalities
Sol Plaatjie (34th ) Ethekwini (37th) Thabazimbi (38th) KSD (42nd) Msunduzi (52nd) Buffalo City (54th) Madibeng (55th) Nelson Mandela Bay (57th) Lephalale (59th) Bela-Bela (64th) Swartland (82nd) Westonaria (93rd)
Lowest Ranked
Baviaans B3 EC Nama Khoi B3 NC Ntambanana B4 KZN Blue Crane Route B3 EC Kannaland B3 WC Mthonjaneni B3 KZN Vulamehlo B4 KZN Tswelopele B3 FS Naledi B3 NW Mier B3 NC
23
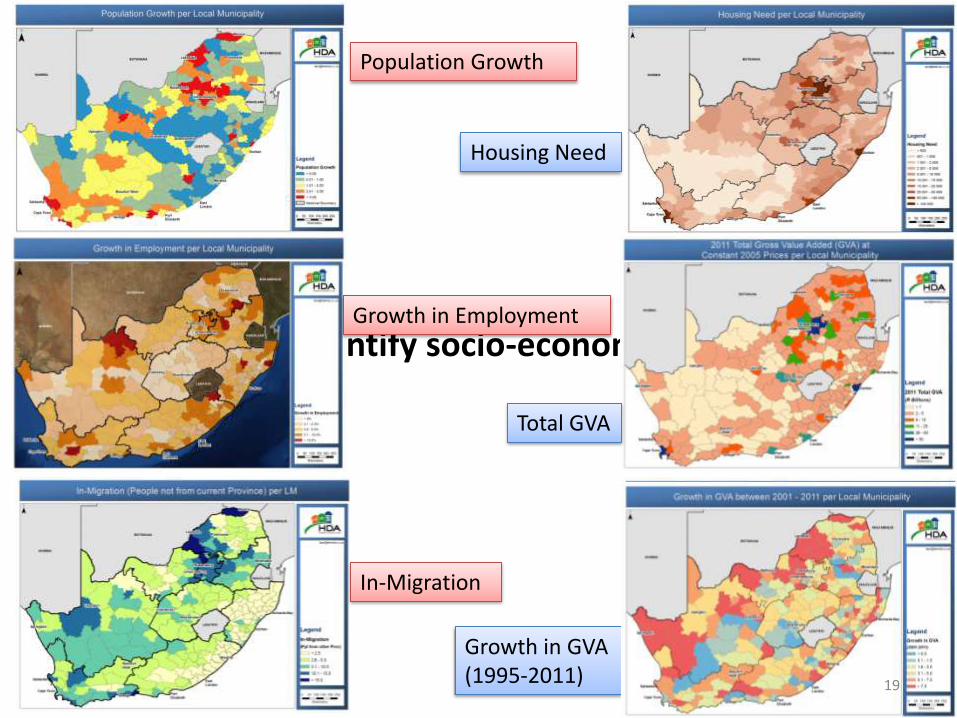
• Areas with the highest Investment Potential is concentrated around Gauteng metros and its surrounding municipalities.
• The “Energy Mecca” in South Africa, i.e., Emalahleni, Steve Tshwete and Govan Mbeki, have high investment potential.
• Regional centres, mining areas and industrial ports are also of high importance
24

‹#›

26

27

28

Supporting Political Interventions
29

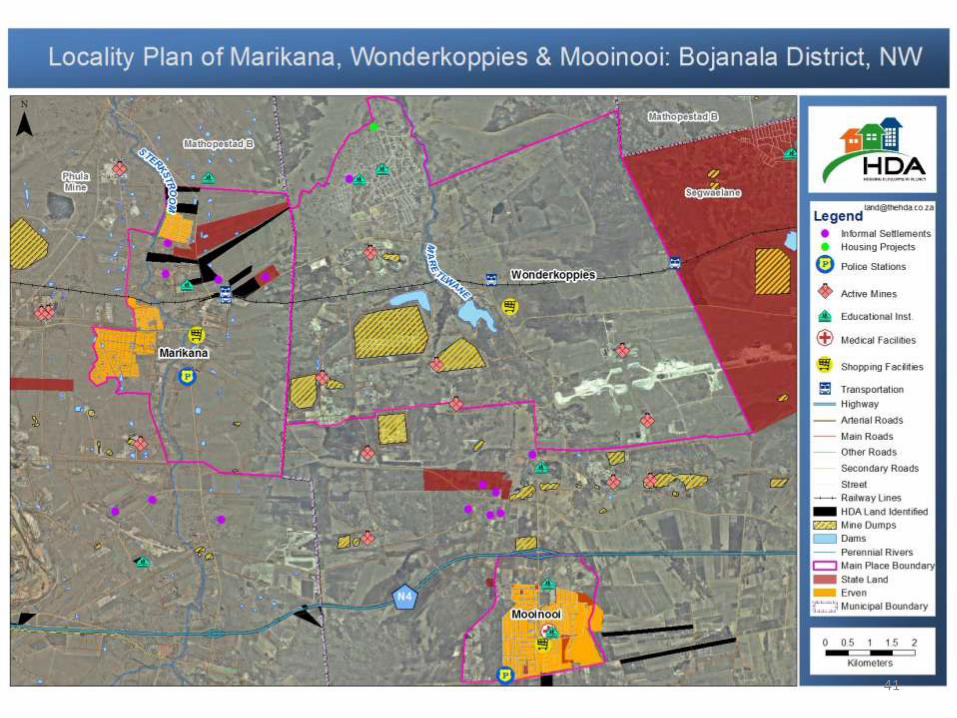
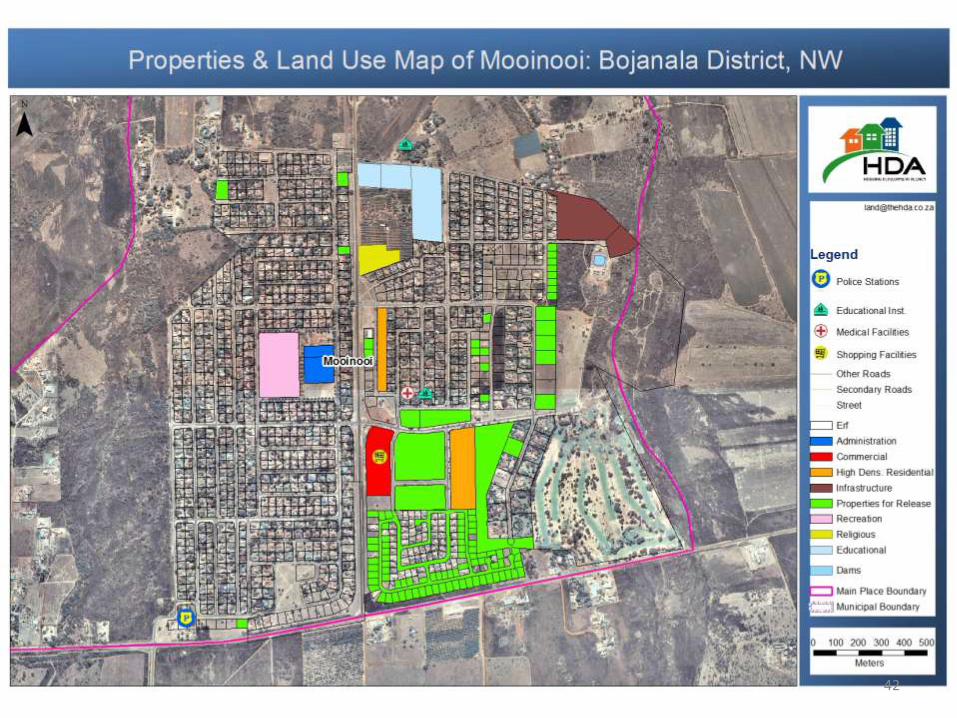
Community Based Spatial Analysis
Marikana, Wonderkoppies and Mooinooi: Bojanala District Municipality, North West
30
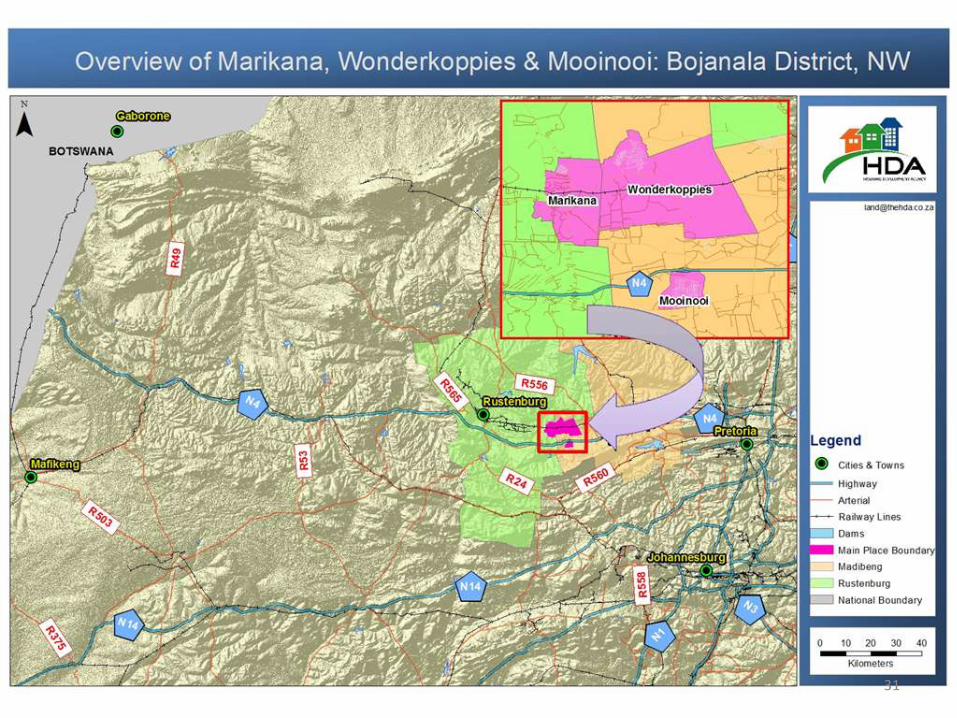
31

32

33

34

35

36

37

38

39

40
41
42

Conclusion
• Geographic Information Systems (GIS) helps you to integrate spatial and non-spatial information.
• We are using a GIS to support decisions in a proactive and reactive manner
– Proactive: for planning purposes, and project implementation
– Reactive: using historical information in guiding policies, resources and strategy
• Through up-to-date data, software, report templates and skilled personnel, the HDA has setup a functional information system that allows specialists & non-specialists, the ability to make decisions using spatial information intelligently. 43

Contact details • The HDA
: 011 544 1000 : www.thehda.co.za
• Land Information Services (LIS)
: [email protected] : www.lapsis.co.za
Johan Minnie (Senior Manager: Land Information Services)
Hadley Remas (Manager: Land Geospatial Services) : [email protected]
44