APPENDIX E-EMBRAER/NTSB COMPUTER … · APPENDIX E-EMBRAER/NTSB COMPUTER SIMULATION AND...
24
APPENDIX E-EMBRAER/NTSB COMPUTER SIMULATION AND ENGINEERING/FLIGHT SIMULATOR DATA EMB-120 COMAlR FLIGHT 3272 ACCIDENT EMBRAER PRELIMINARY ANALYSIS OF THE EFFECTS OF SOME AERODYNAMIC COEFFICIENTS MODIFICATION TO TRY TO REPRODUCE THE DFDR READlNGS 1) Introduction: In order to try to reproduce the DFDR readings, the aircraft flight conditions just prior to the upset (DFDR time 05:54:22) was taken as a reference to calculate the changes to the basic aerodynamic coefficients of the EMB- 120. The EMB-1 20 Aerodynamic Data Bank Version 3C (Ref. 01) was used as the source of aero data. This Data Bank is the same that is used on the EMBRAER EMB-I20 simulator and also on the off-line simulation program in the IBM mainframe computer. The simulator is approved according to FAA AC-120/40 requirements for a Level B standard, but all Flight Dynamics tests were matched with flight test results for a Level C standard. It is important to take in consideration the following assumptions and limitations of this analysis: 1. The flight conditions just prior to the upset was considered a “steady state condition”, meaning that all angular rates were considered small and the dynamic aerodynamic derivatives could be considered negligible. 2. The Power Effects (Specially the propeller slipstream effect) in the EMB-120 is very strong and for this preliminary analysis was not fully considered when calculating some aerodynamic coefficients. 3. The ice effects on the aerodynamic coefficients were taken from wind tunnel test results and only some Reynolds Number corrections were applied. 4. The flight simulation (6 DOF) is valid only up to the pusher firing angle of attack (approx. 12.5 deg). Above this angle the aerodynamic data and the effects of any asymmetric flow separation are not valid or not considered. 5. For this first preliminary flight simulation, only some aerodynamic parameters were modified and for this reason some special assumptions were made due to lack of time. All assumptions, however, were considered not relevant to this preliminary analysis. 2) Steady State calculations: The following values were taken from the DFDR reading at time 05:54:22 and from some unofficial information. Weight (W) = 10800 Kg C.G. = 30% (Assumed) Airspeed (VC) = 146 Kcas Altitude (HP) = 4000 ft Roll angle (PHI) = -38 deg Pitch angle (Theta) = + 4 deg Wheel pos. (WP) = 19.5 deg Pedal pos. = - 5.0 deg Column pos. = + 5 deg Vertical acceleration (NZ) = 1.3 g
Transcript of APPENDIX E-EMBRAER/NTSB COMPUTER … · APPENDIX E-EMBRAER/NTSB COMPUTER SIMULATION AND...
APPENDIX E-EMBRAER/NTSB COMPUTER SIMULATION ANDENGINEERING/FLIGHT SIMULATOR DATA
EMB-120 COMAlR FLIGHT 3272 ACCIDENT
EMBRAER PRELIMINARY ANALYSIS OF THE EFFECTS OF SOMEAERODYNAMIC COEFFICIENTS MODIFICATION TO TRY TO REPRODUCE THE
DFDR READlNGS
1) Introduction:
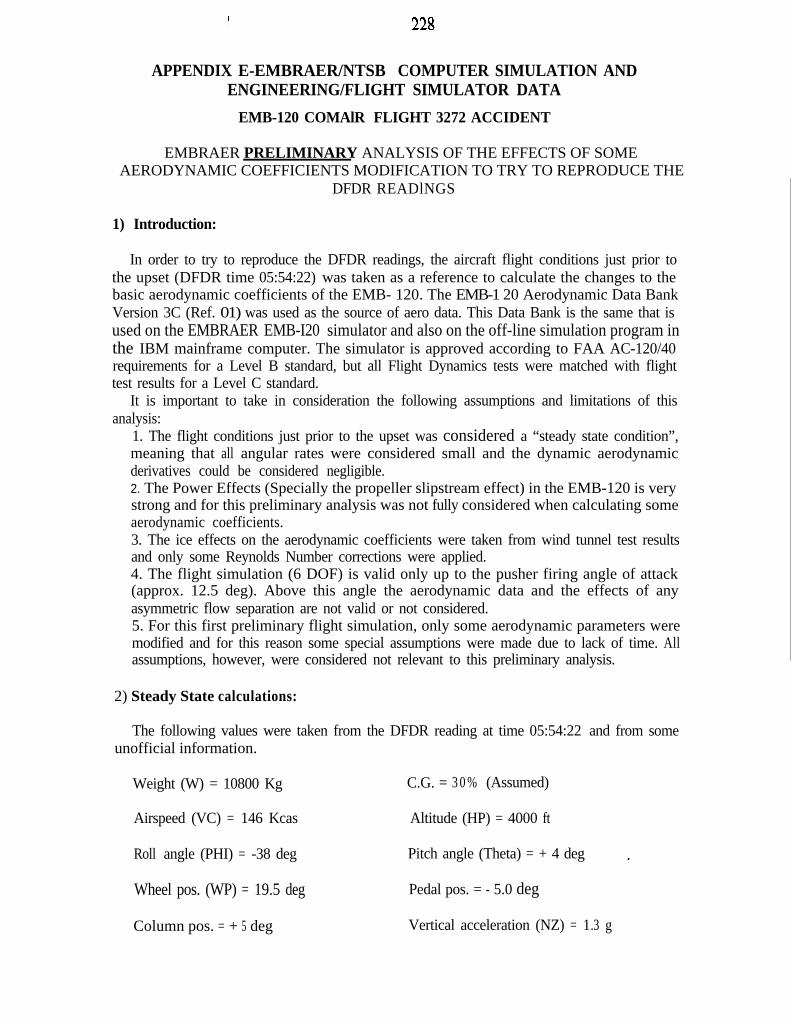
In order to try to reproduce the DFDR readings, the aircraft flight conditions just prior tothe upset (DFDR time 05:54:22) was taken as a reference to calculate the changes to thebasic aerodynamic coefficients of the EMB- 120. The EMB-1 20 Aerodynamic Data BankVersion 3C (Ref. 01) was used as the source of aero data. This Data Bank is the same that isused on the EMBRAER EMB-I20 simulator and also on the off-line simulation program inthe IBM mainframe computer. The simulator is approved according to FAA AC-120/40requirements for a Level B standard, but all Flight Dynamics tests were matched with flighttest results for a Level C standard.
It is important to take in consideration the following assumptions and limitations of thisanalysis:
1. The flight conditions just prior to the upset was considered a “steady state condition”,meaning that all angular rates were considered small and the dynamic aerodynamicderivatives could be considered negligible.2. The Power Effects (Specially the propeller slipstream effect) in the EMB-120 is verystrong and for this preliminary analysis was not fully considered when calculating someaerodynamic coefficients.3. The ice effects on the aerodynamic coefficients were taken from wind tunnel test resultsand only some Reynolds Number corrections were applied.4. The flight simulation (6 DOF) is valid only up to the pusher firing angle of attack(approx. 12.5 deg). Above this angle the aerodynamic data and the effects of anyasymmetric flow separation are not valid or not considered.5. For this first preliminary flight simulation, only some aerodynamic parameters weremodified and for this reason some special assumptions were made due to lack of time. Allassumptions, however, were considered not relevant to this preliminary analysis.
2) Steady State calculations:
The following values were taken from the DFDR reading at time 05:54:22 and from someunofficial information.
Weight (W) = 10800 Kg C.G. = 3 0 % (Assumed)
Airspeed (VC) = 146 Kcas Altitude (HP) = 4000 ft
Roll angle (PHI) = -38 deg Pitch angle (Theta) = + 4 deg
Wheel pos. (WP) = 19.5 deg Pedal pos. = - 5.0 deg
Column pos. = + 5 deg Vertical acceleration (NZ) = 1.3 g
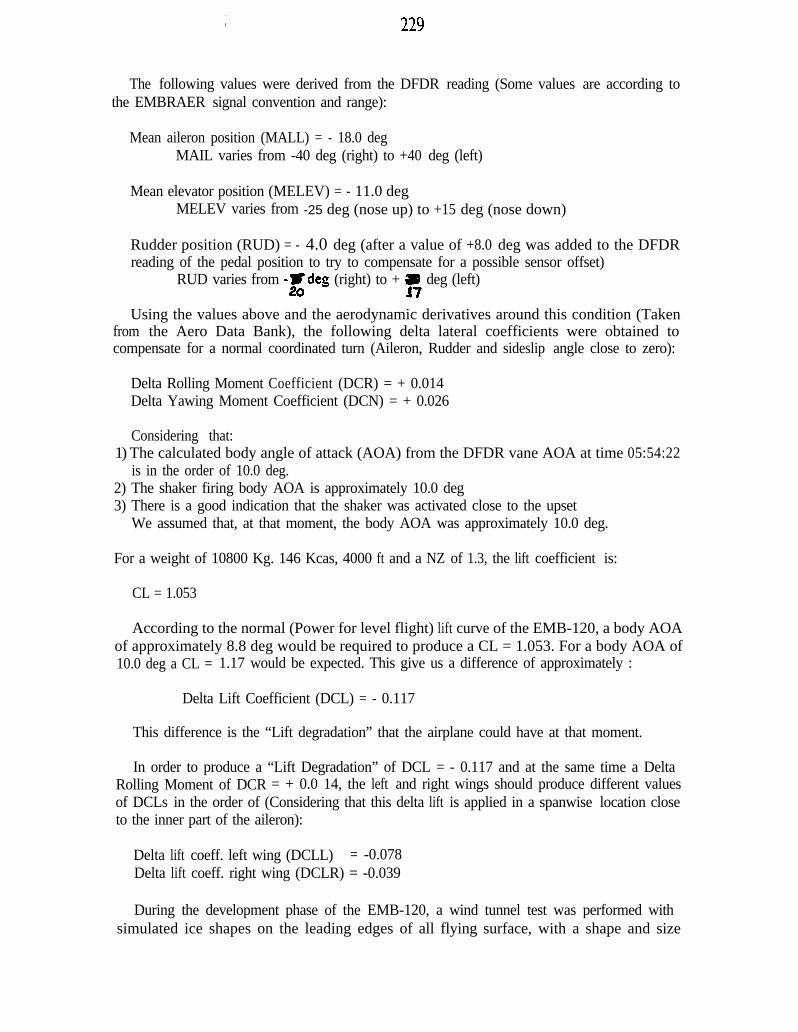
The following values were derived from the DFDR reading (Some values are according tothe EMBRAER signal convention and range):
Mean aileron position (MALL) = - 18.0 degMAIL varies from -40 deg (right) to +40 deg (left)
Mean elevator position (MELEV) = - 11.0 degMELEV varies from -25 deg (nose up) to +15 deg (nose down)
Rudder position (RUD) = - 4.0 deg (after a value of +8.0 deg was added to the DFDRreading of the pedal position to try to compensate for a possible sensor offset)
RUD varies from -2Tdeg (right) to + X deg (left)
Using the values above and the aerodynamic derivatives around this condition (Takenfrom the Aero Data Bank), the following delta lateral coefficients were obtained tocompensate for a normal coordinated turn (Aileron, Rudder and sideslip angle close to zero):
Delta Rolling Moment Coefficient (DCR) = + 0.014Delta Yawing Moment Coefficient (DCN) = + 0.026
Considering that:1) The calculated body angle of attack (AOA) from the DFDR vane AOA at time 05:54:22
is in the order of 10.0 deg.2) The shaker firing body AOA is approximately 10.0 deg3) There is a good indication that the shaker was activated close to the upset
We assumed that, at that moment, the body AOA was approximately 10.0 deg.
For a weight of 10800 Kg. 146 Kcas, 4000 ft and a NZ of 1.3, the lift coefficient is:
CL = 1.053
According to the normal (Power for level flight) lift curve of the EMB-120, a body AOAof approximately 8.8 deg would be required to produce a CL = 1.053. For a body AOA of10.0 deg a CL = 1.17 would be expected. This give us a difference of approximately :
Delta Lift Coefficient (DCL) = - 0.117
This difference is the “Lift degradation” that the airplane could have at that moment.
In order to produce a “Lift Degradation” of DCL = - 0.117 and at the same time a DeltaRolling Moment of DCR = + 0.0 14, the left and right wings should produce different valuesof DCLs in the order of (Considering that this delta lift is applied in a spanwise location closeto the inner part of the aileron):
Delta lift coeff. left wing (DCLL) = -0.078Delta lift coeff. right wing (DCLR) = -0.039
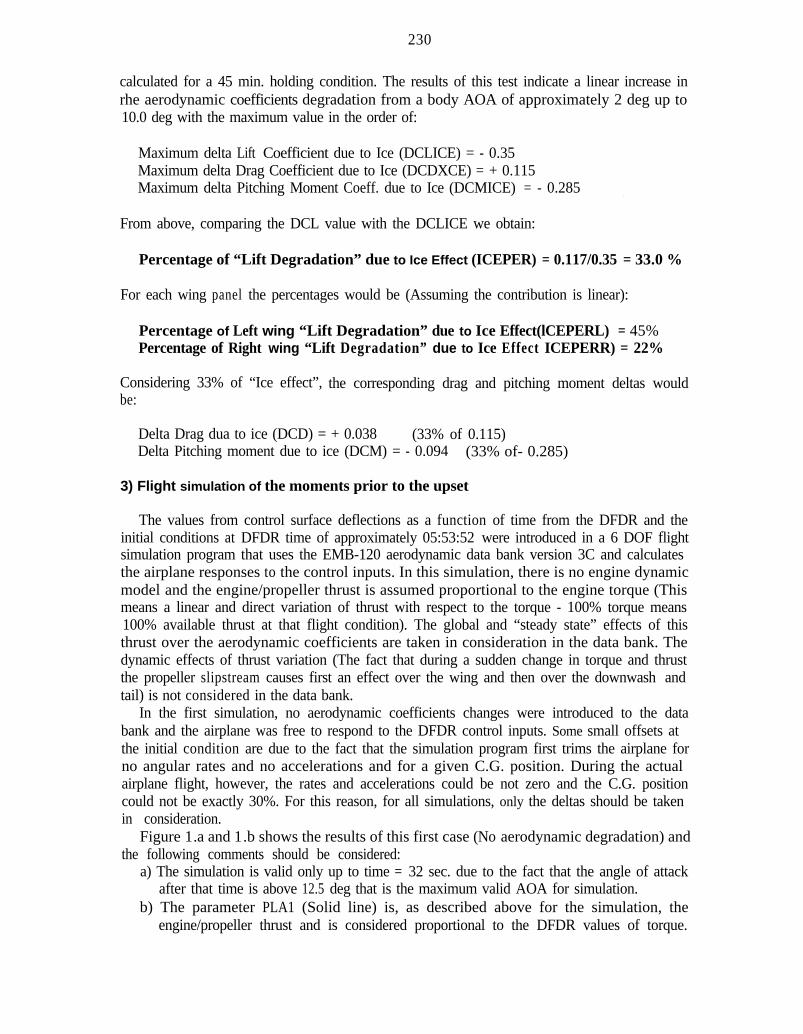
During the development phase of the EMB-120, a wind tunnel test was performed withsimulated ice shapes on the leading edges of all flying surface, with a shape and size
230
calculated for a 45 min. holding condition. The results of this test indicate a linear increase inrhe aerodynamic coefficients degradation from a body AOA of approximately 2 deg up to10.0 deg with the maximum value in the order of:
Maximum delta Lift Coefficient due to Ice (DCLICE) = - 0.35Maximum delta Drag Coefficient due to Ice (DCDXCE) = + 0.115Maximum delta Pitching Moment Coeff. due to Ice (DCMICE) = - 0.285
From above, comparing the DCL value with the DCLICE we obtain:
Percentage of “Lift Degradation” due to Ice Effect (ICEPER) = 0.117/0.35 = 33.0 %
For each wing panel the percentages would be (Assuming the contribution is linear):
Percentage of Left wing “Lift Degradation” due to Ice Effect(lCEPERL) = 45%Percentage of Right wing “Lift Degradation” due to Ice Effect ICEPERR) = 22%
Considering 33% of “Ice effect”, the corresponding drag and pitching moment deltas wouldbe:
Delta Drag dua to ice (DCD) = + 0.038 (33% of 0.115)Delta Pitching moment due to ice (DCM) = - 0.094 (33% of- 0.285)
3) Flight simulation of the moments prior to the upset
The values from control surface deflections as a function of time from the DFDR and theinitial conditions at DFDR time of approximately 05:53:52 were introduced in a 6 DOF flightsimulation program that uses the EMB-120 aerodynamic data bank version 3C and calculatesthe airplane responses to the control inputs. In this simulation, there is no engine dynamicmodel and the engine/propeller thrust is assumed proportional to the engine torque (Thismeans a linear and direct variation of thrust with respect to the torque - 100% torque means100% available thrust at that flight condition). The global and “steady state” effects of thisthrust over the aerodynamic coefficients are taken in consideration in the data bank. Thedynamic effects of thrust variation (The fact that during a sudden change in torque and thrustthe propeller slipstream causes first an effect over the wing and then over the downwash andtail) is not considered in the data bank.
In the first simulation, no aerodynamic coefficients changes were introduced to the databank and the airplane was free to respond to the DFDR control inputs. Some small offsets atthe initial condition are due to the fact that the simulation program first trims the airplane forno angular rates and no accelerations and for a given C.G. position. During the actualairplane flight, however, the rates and accelerations could be not zero and the C.G. positioncould not be exactly 30%. For this reason, for all simulations, only the deltas should be takenin consideration.
Figure 1.a and 1 .b shows the results of this first case (No aerodynamic degradation) andthe following comments should be considered:
a) The simulation is valid only up to time = 32 sec. due to the fact that the angle of attackafter that time is above 12.5 deg that is the maximum valid AOA for simulation.
b) The parameter PLA1 (Solid line) is, as described above for the simulation, theengine/propeller thrust and is considered proportional to the DFDR values of torque.
231
The small difference was calculated to adjust the scaling of torque and thrust. Thedashed line representing the flight condition is the actual DFDR measured torque.
In the second simulation, the following values were first introduced to the aerodynamic.coefficients (Values from the steady state analysis):
DCL=-0.12 DCD = + 0.038 DCM = - 0.094DCR = + 0.014 DCN = + 0.026
These values were a function of the body AOA and a linear variation was assumed from+l deg (Zero change in the coeffcients) to +10 deg (Maximum values - from above)
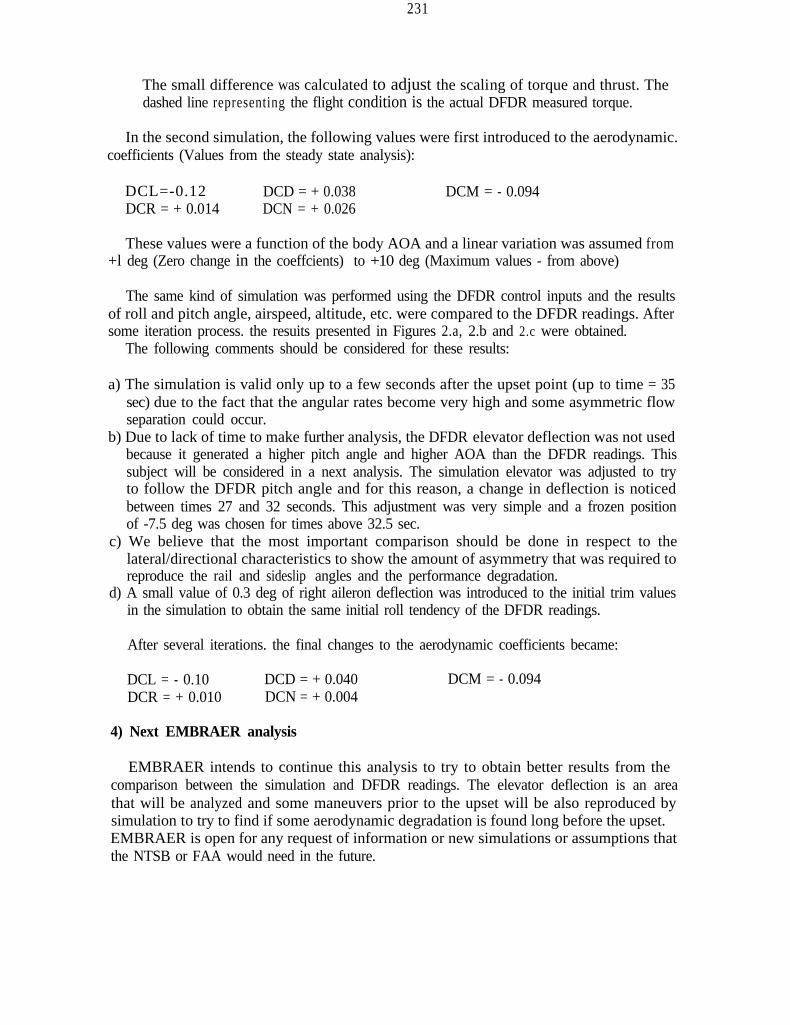
The same kind of simulation was performed using the DFDR control inputs and the resultsof roll and pitch angle, airspeed, altitude, etc. were compared to the DFDR readings. Aftersome iteration process. the resuits presented in Figures 2.a, 2.b and 2.c were obtained.
The following comments should be considered for these results:
a) The simulation is valid only up to a few seconds after the upset point (up to time = 35sec) due to the fact that the angular rates become very high and some asymmetric flowseparation could occur.
b) Due to lack of time to make further analysis, the DFDR elevator deflection was not usedbecause it generated a higher pitch angle and higher AOA than the DFDR readings. Thissubject will be considered in a next analysis. The simulation elevator was adjusted to tryto follow the DFDR pitch angle and for this reason, a change in deflection is noticedbetween times 27 and 32 seconds. This adjustment was very simple and a frozen positionof -7.5 deg was chosen for times above 32.5 sec.
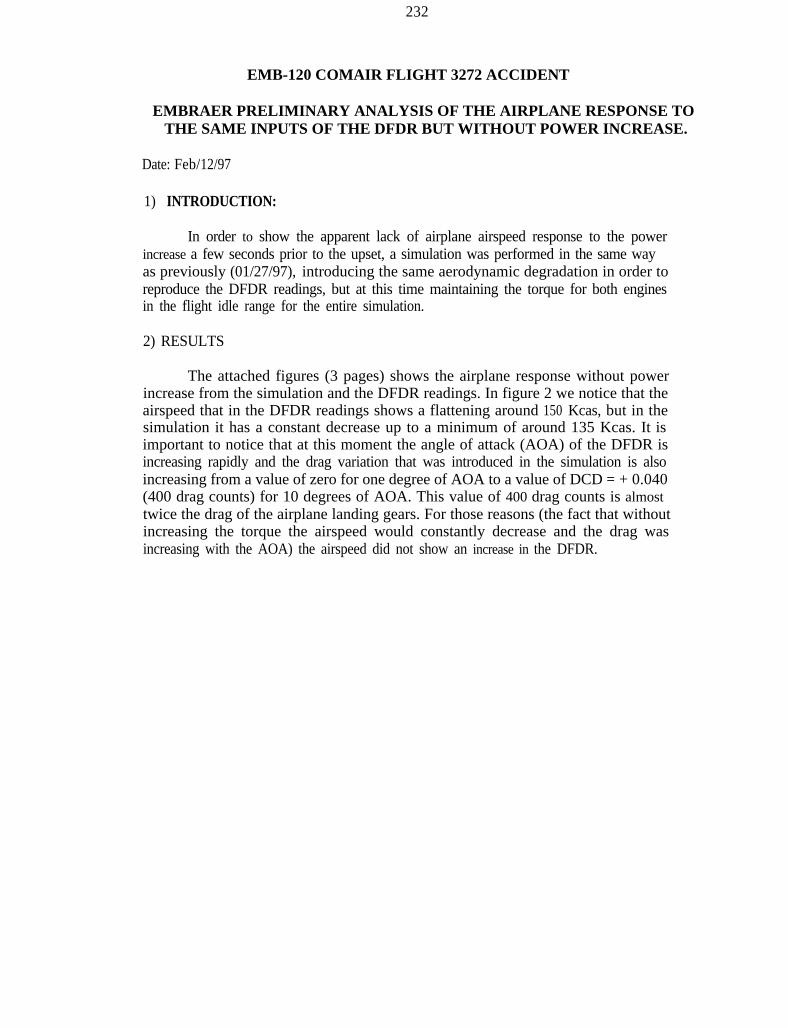
c) We believe that the most important comparison should be done in respect to thelateral/directional characteristics to show the amount of asymmetry that was required toreproduce the rail and sideslip angles and the performance degradation.
d) A small value of 0.3 deg of right aileron deflection was introduced to the initial trim valuesin the simulation to obtain the same initial roll tendency of the DFDR readings.
After several iterations. the final changes to the aerodynamic coefficients became:
DCL = - 0.10 DCD = + 0.040 DCM = - 0.094DCR = + 0.010 DCN = + 0.004
4) Next EMBRAER analysis
EMBRAER intends to continue this analysis to try to obtain better results from thecomparison between the simulation and DFDR readings. The elevator deflection is an areathat will be analyzed and some maneuvers prior to the upset will be also reproduced bysimulation to try to find if some aerodynamic degradation is found long before the upset.EMBRAER is open for any request of information or new simulations or assumptions thatthe NTSB or FAA would need in the future.
232
EMB-120 COMAIR FLIGHT 3272 ACCIDENT
EMBRAER PRELIMINARY ANALYSIS OF THE AIRPLANE RESPONSE TOTHE SAME INPUTS OF THE DFDR BUT WITHOUT POWER INCREASE.
Date: Feb/12/97
1) INTRODUCTION:
In order to show the apparent lack of airplane airspeed response to the powerincrease a few seconds prior to the upset, a simulation was performed in the same wayas previously (01/27/97), introducing the same aerodynamic degradation in order toreproduce the DFDR readings, but at this time maintaining the torque for both enginesin the flight idle range for the entire simulation.
2) RESULTS
The attached figures (3 pages) shows the airplane response without powerincrease from the simulation and the DFDR readings. In figure 2 we notice that theairspeed that in the DFDR readings shows a flattening around 150 Kcas, but in thesimulation it has a constant decrease up to a minimum of around 135 Kcas. It isimportant to notice that at this moment the angle of attack (AOA) of the DFDR isincreasing rapidly and the drag variation that was introduced in the simulation is alsoincreasing from a value of zero for one degree of AOA to a value of DCD = + 0.040(400 drag counts) for 10 degrees of AOA. This value of 400 drag counts is almosttwice the drag of the airplane landing gears. For those reasons (the fact that withoutincreasing the torque the airspeed would constantly decrease and the drag wasincreasing with the AOA) the airspeed did not show an increase in the DFDR.
236
EMR-120 COMAIR FLIGHT 3272 ACCIDENT
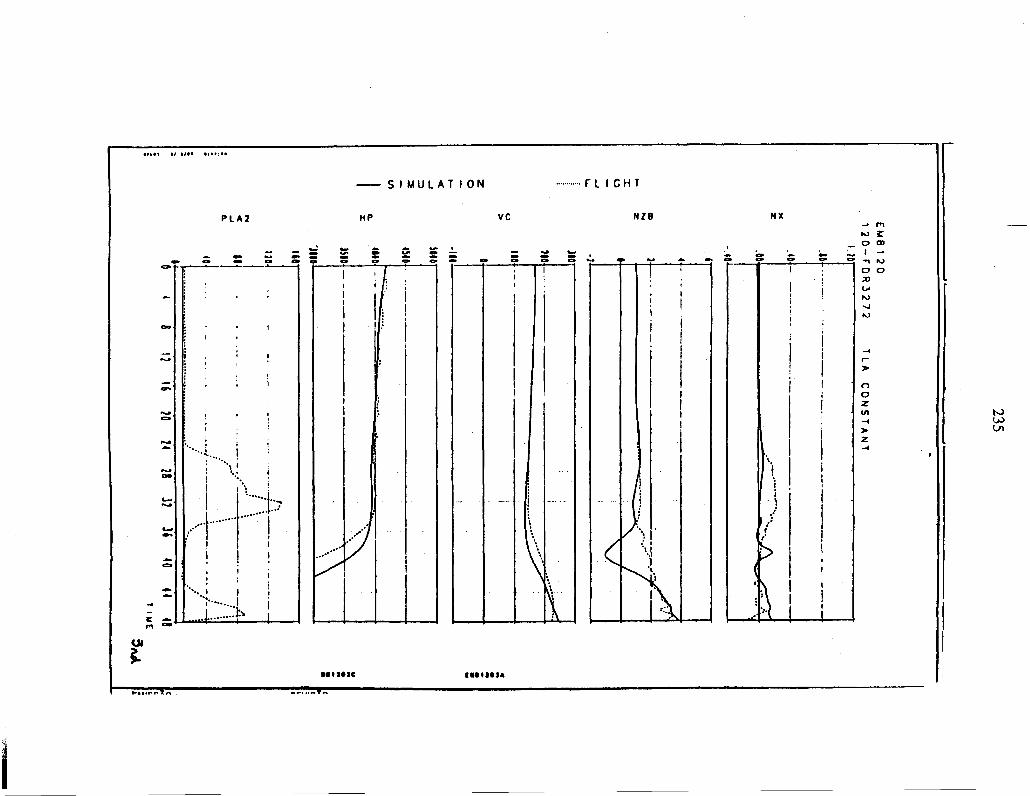
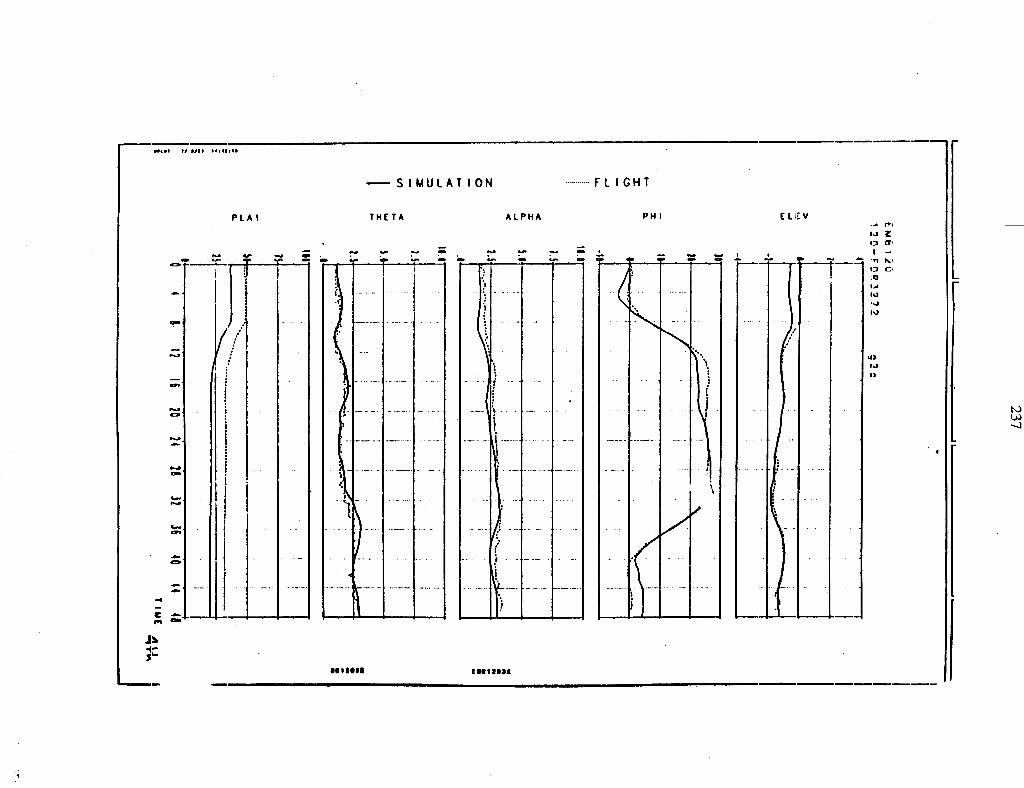
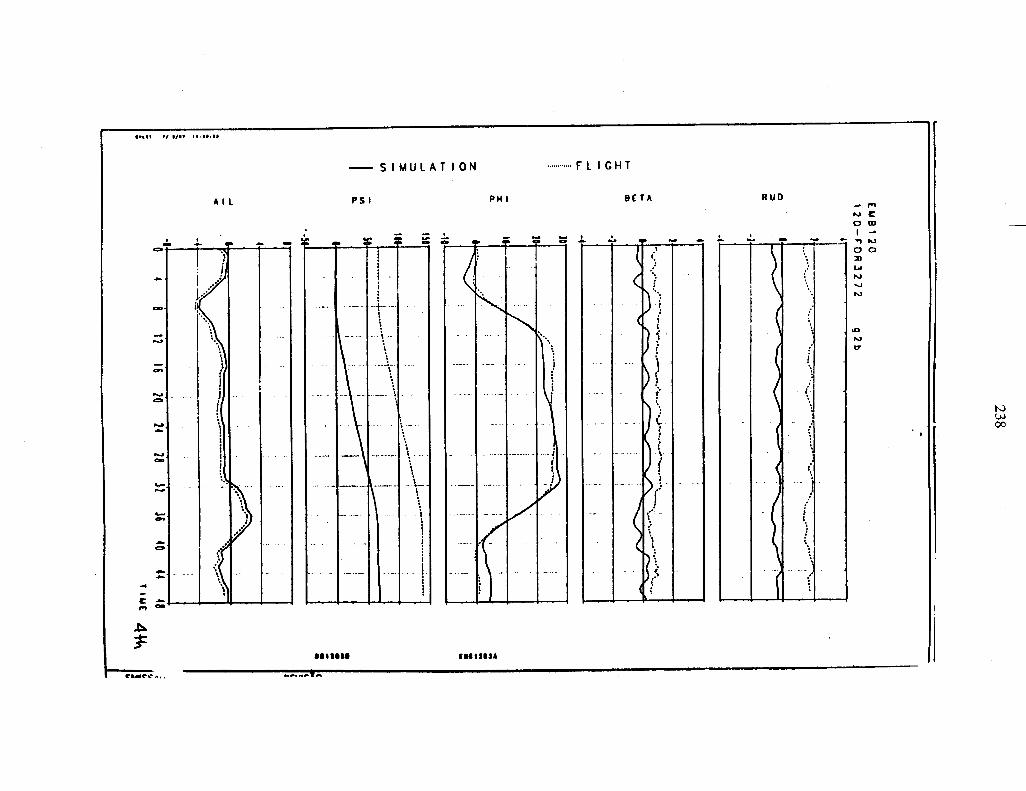
EMBRAER PRELIMINARY COMPARISON OF THE SIMULATION AND THEDFDR READINGS FOR A PREVIOUS DFDR TIME AIRPLANE MANEUVER.
Date: Feb/l3/97
1) INTRODUCTION:
In order to compare the aerodynamic data bank of the EMB-120 simulationresponses to the DFDR readings for a previous time during the 3272 flight, a right turnat 7000 ft was chosen as a good reference point. The turn happened at DFDR timefrom approximately 05:49:55 to 05:50:45. During this simulation, no aerodynamicdegradation was introduced in the aerodynamic data bank.
2) RESULTS
The attached figures (3 pages) shows the comparison of the DFDR readingswith the simulation for the same control inputs for the ailerons and rudder. For theelevator, due to the fact that the simulation pitch response is sensitive to small elevatorsinputs, a simulated autopilot was used to follow the pitch from the DFDR and theobtained elevator deflection in presented in figure 1 with the elevator from the DFDR.We notice that the two values are very similar and only a small trim difference (around0.8 deg) was obtained.
The obtained simulation roll angles have some small differences at thebeginning and the end of the turn, but the average value is very close to the DFDR. Itis important to notice that the simulation does not take in consideration several effectslike atmosphere disturbances, control cable elasticity, airplane flexibility among others.The accuracy of the DFDR readings and calibration must also be taken inconsideration.
We notice, however, that the general response of the simulation is very closeto the DFDR readings, suggesting that the aerodynamic data bank is representative ofthe airplane and, at that moment, no aerodynamic degradation was evident.
239
EMB-120 COMAIR FLIGHT 3272 ACClDENT
EMBRAER PRELIMINARY ANALYSIS OF THE AILERON HINGE MOMENT,AILERON FLOATING ANGLE, AUTOPILOT SERVO TORQUE AND ROLL
RATE CAPABILITY.
Date: Feb/07/97
1) INTRODUCTION:
An analysis of the aileron behavior duringcalculate the following characteristics/parameters:
the upset wassperformed in order to
1. The maximum roll rate for full aileron deflection at the moment of the upset.2. The roll rate breakdown just after the upset in terms of aileron, lift asymmetry and
power increase.3. The aileron floating angle just after the autopilot disengagement.4. The autopilot servo torque just prior to the upset.
The following limitations and assumptions shall bevalues:
observed for the calculated
1. The Aerodynamic Data Bank does not cover all non linearities in the aero and hingemoments coefficients for extreme control surface deflections that would generatestrong flow separation.
2. The presented values for the aerodynamic coefficients were taken from a routinethat trims the airplane in a specific flight condition using the Aerodynamic DataBank and calculates the derivatives of the aero coeffs around this trimmedcondition.
3. All dynamic flow separation that could occur on the airplane is not considered in thesimulation.
4. The control cable stiffness is not considered in this analysis. but could reduce theaileron deflection in as much as 17% at the conditions prior to the upset (We mustnotice that the DFDR reads wheel position and not aileron deflection)
2) DFDR / AIRCRAFT DATA
The following values were taken from the DFDR reading at time 05:54:22 andfrom some unofficial information:
Weight (W) = 10800 Kg C.G. = 3 0 % (Assumed)
Airspeed (CAS) = 146 Kcas Altitude (HP) = 4000 ft
Roll angle (PHI) = -38 deg Pitch angle (Theta) = + 4 deg
Wheel pos. (WP) = 19.5 deg Pedal pos. = - 5.0 deg
Column pos = + 5 deg Vertical acceleration (NZ) = 1.3 g
2 4 0
DFAIL = (DCHAOA / DCHAIL) * DLAOA
DFAIL = 9 5 deg
The total aileron floating angle (TDFAIL) is the sum of the left and rightfloating angles:
TDFAIL = 19 deg (To the left)
This value is the same that was obtained from the DFDR after the upset andcould explain the reason why the aileron, after the autopilot disconnection, not onlyreturned to neutral but passed from neutral and floated to the left.
6) AUTOPILOT SERVO TORQUE
The value of the calculated aileron autopilot servo torque just prior to the upsetis presented below to make a comparison with the maximum torque the system couldgenerate before the servo clutch slips. The clutch slipping torque is 150 lbs*in.
The aileron servo torque (ASTQ) in lbs*in is given as a function of the pilotwheel force (PWF) by
ASTQ = PWF / 0.288 With PWF in lb.
The pilot wheel force is given by:
PWF = (DCHAIL * MAIL * CAS * CAS * SAIL * CAIL * GAIL) / 60.37
With MAIL (just before the upset -18 deg) in radians and CAS (146 Kcas) inkts PFW is in Kgf.
PWF = 19.7 Kgf = 43.4 lb.
The servo torque would be:
ASTQ = 151 lbs*in
The value above is the same as the maximum torque the servo clutch can holdand this means that the aileron servo clutch could had slipped just before the upset andcould let the aileron move in the neutral position direction before the autopilot wasdisengaged due to the fact that the static friction coefficient of the clutch is higher thanthe dynamic and, if the same torque is still applied, a slip movement is expected.
241
EMB-120 COMAIR FLIGHT 3272 ACCIDENTEMBRAER PERFORMANCE GROUP AERODYNAMIC ANALYSIS
EMBRAER ANALYSIS ABOUT THE DETERMINATION OF WHEN THEAERODYNAMIC DEGRADATION (DRAG) STARTED ON COMAIR
FLIGHT 3272(SIXTH ANALYSIS).
1) Introduction:
In a previous preliminary analysis performed by Embraer, acalculation about when the aerodynamic degradation on Comair 3272started showed that an increase in drag was noticed after the airplane left7000 ft during its descent to 4000 ft. This degradation increased during thedescent to a maximum value at the upset at 4000 ft. The purpose of theSixth Analysis was to develop more precise conclusions as to when theaerodynamic degradation started, and to what degree.
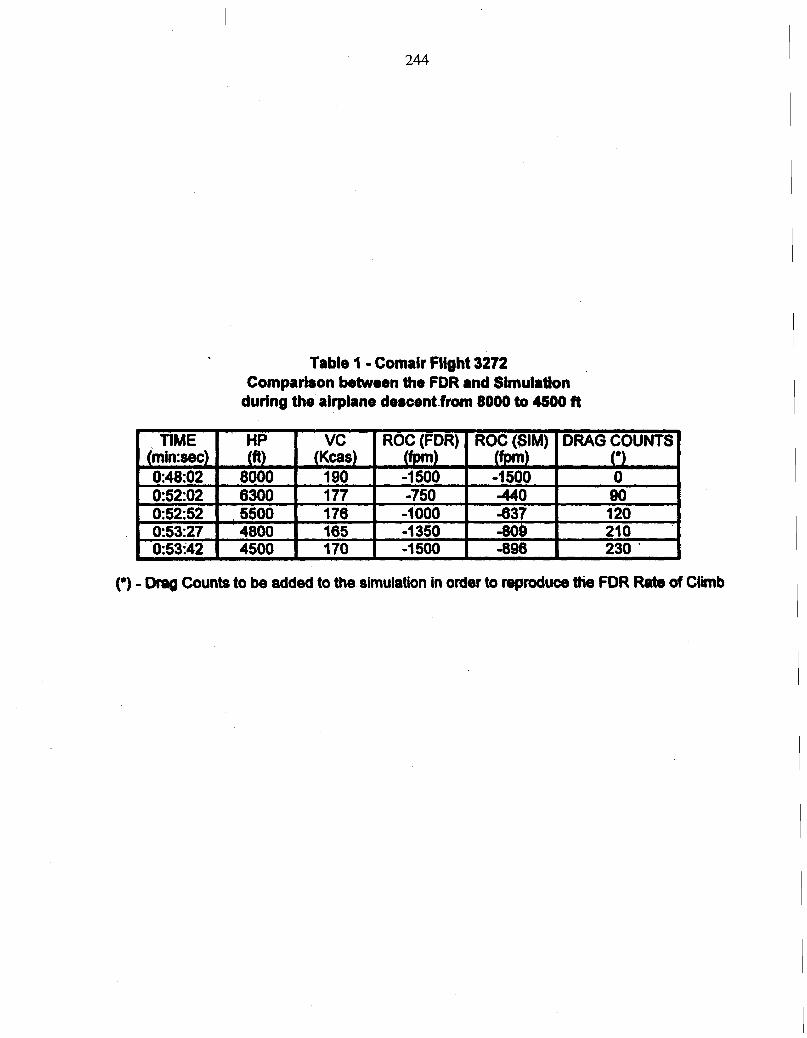
It was difficult to perform this analysis because, in the DFDR, theairspeed, engine torque and rate of descent were constantly changing,making it difficult to find a stable condition that could be compared to aknown performance condition. Only five points with stable conditions werefound: one at 8000 ft (where no degradation was found), one at 6300 ft, oneat 5500 ft., one at 4800 ft. and the last) one at 4500 ft.(see Table 1). Thebasic overall question was whether the degradation started during the leveloff at 7000 ft or after the airplane had initiated its descent to 4000 ft. Inorder to answer this question, a dynamic analysis using the EMB-120simulator was performed.
2) Simulator dynamic analysis to reproduce the DFDR at 7000 ft.
During the entire period of level flight at 7000 ft. the airplane waschanging airspeed, engine torque and heading. A point with the wings levelfollowed by a right turn with airspeed and power change was chosen toverify the aerodynamic degradation just after the level off at 7000 ft.Figures 1, 2 and 3 shows the DFDR readings for the airspeed, engine torqueand bank angle at that point.
The EMB-120 simulator was used to reproduce this flight condition,first without any aerodynamic degradation and then with different values ofincreased drag. The autopilot was set to altitude hold (7000 ft.) and headingmodes and the power was manually adjusted according to the DFDR valuesand timing. The heading bug was also commanded in such a way that thebank angle reproduced the DFDR.
242
EMB-120 COMAIR FLIGHT 3272 ACCIDENTEMBRAER PERFORMANCE GROUP AERODYNAMIC ANALYSIS
The resulting airspeed variation without the aerodynamic degradationwas less than what is observed in the DFDR (see Figure 4 - No dragincrease). Drag simulating an aerodynamic degradation was then introducedand when a value of 80 Drag Counts was added, the obtained airspeedprofile with time matched the DFDR very closely (see Figure 4 - 80 DragCounts)
3)Analysis of the stabilized points:
As described in the introduction, 5 points where the airplane was in astable condition were used to calculate the performance degradation in termsof drag increase. Table 1 presents the results of this analysis and Figure 5presents the combination of the dynamic analysis with the steady stateconditions. The value of the drag increase for the last point on Figure 5 (upset)does not include the induced drag due to the increase in angle of attack, i.e.,only the additional degradation drag is considered.
4) Conclusions:
The analysis shows that the aerodynamic degradation started nearDFDR time 48:00 and lasted for about 6 minutes. The increase in drag isnot linear with time or altitude and a small variation is noticed during theperiod of time from 50:00 to 52:00. After that, the rate of increase in drag ispronounced, particularly between 52:50 and 53:30.

245
l-OBJECTIVE: .
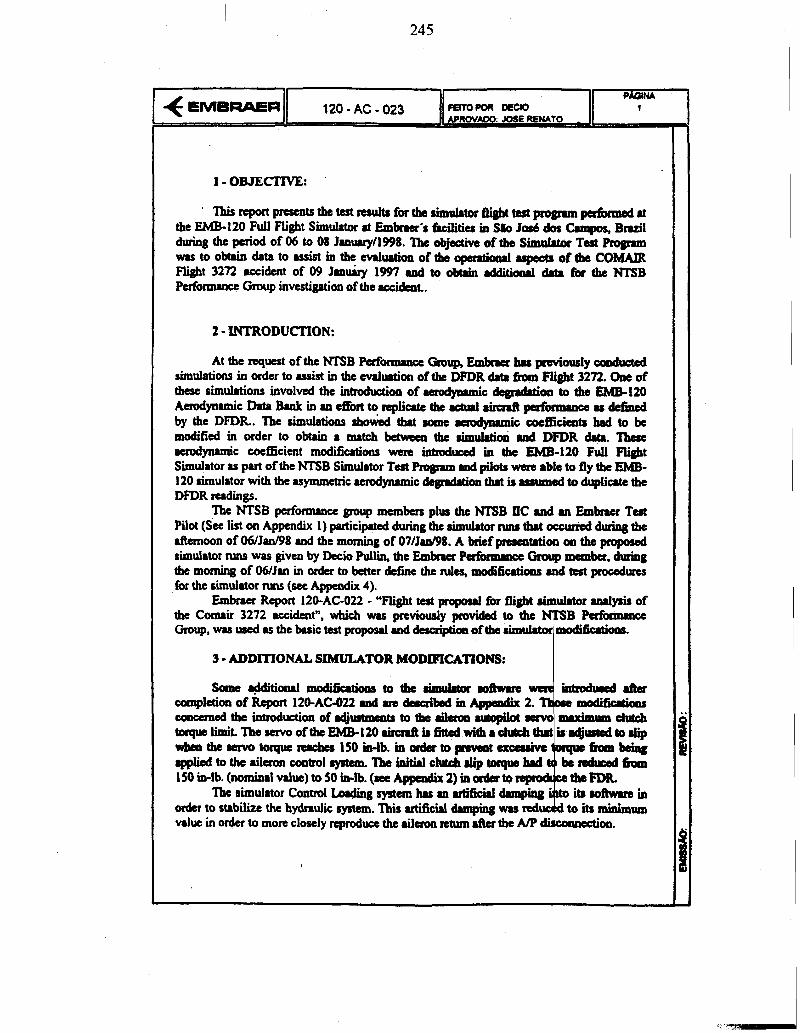
’ Thirnportpresentsthcleot~~~forthss~~~rflisbt1#tpoognmperfomrsdrt the EMB-320 Full Flight Shbtor rt Emkm’s ficilities in S&o Jod dos Campos, Bxazil during the period of06 to 08 Jmuarylt998. ‘he objective of the Simulator Test Pmgmm wrstoobbindatrto~istinthcmluuionofthe~~upsoCIoftbeCOMAIR Flight 3272 a&dent of 09 Jam&y 1997 and to obtain additiocwl data fioa the NTSB Peffofmancc Group investigation of tbe 8ccidenL
2 - XNTRODUCMON:
At the request of the NTSB Perfomance Gm~-luspccviouslyco8ducted sirnutations in order to assist in the evaluation of th DPDR data hm Flight 3272. One of these simulations involved the introduction of rcrodyrumic degmhtion to the EMB-120 Aerodynunic~~Bankiamefforttorcplicrtethe~~pertbnnrnccudcdnsd by the DFDR. The simulations slmvkd that some wodymmic aMkkats had to be modified in order to obtain a mat& behweaa the simhtiaa and DFDR data. There aerod~c coefficient rnodifiatians were hmhced in the EMB-120 Full Flight Simulator IS part of the NT’SB Simuhtor Test Progmm and pilots were able to fly the EMB- 120 simuhtor with the asymmetric l em@umic dc@ation that is assumed to duplicate the DFDRreadings.
‘Ibe NTSB performance group members plus the ?+lTSB IfC and an Embmer Test Pilot (See list on Appendix 1) participated during the simuhtor runs that occmed d&g the dtemoon of 06/J&98 and tbe moming of 07haI98. A brief premtation on the pmposed simulator runs was given by Dccio Pullii the Edx8cr Pcrfkmxm orwp-bw=q tbc morning of 06&n in odcr to better define the ruler, dfid~ 8nd test procedures for the simulator mns (see Appcndii 4).
Embracr Report 120-AC-022 - Tligbt test propod fix flight siamhtor uutyris of
3 - ADDITIONAL SIMULATOR MODIFICATIONS:
I
246
f
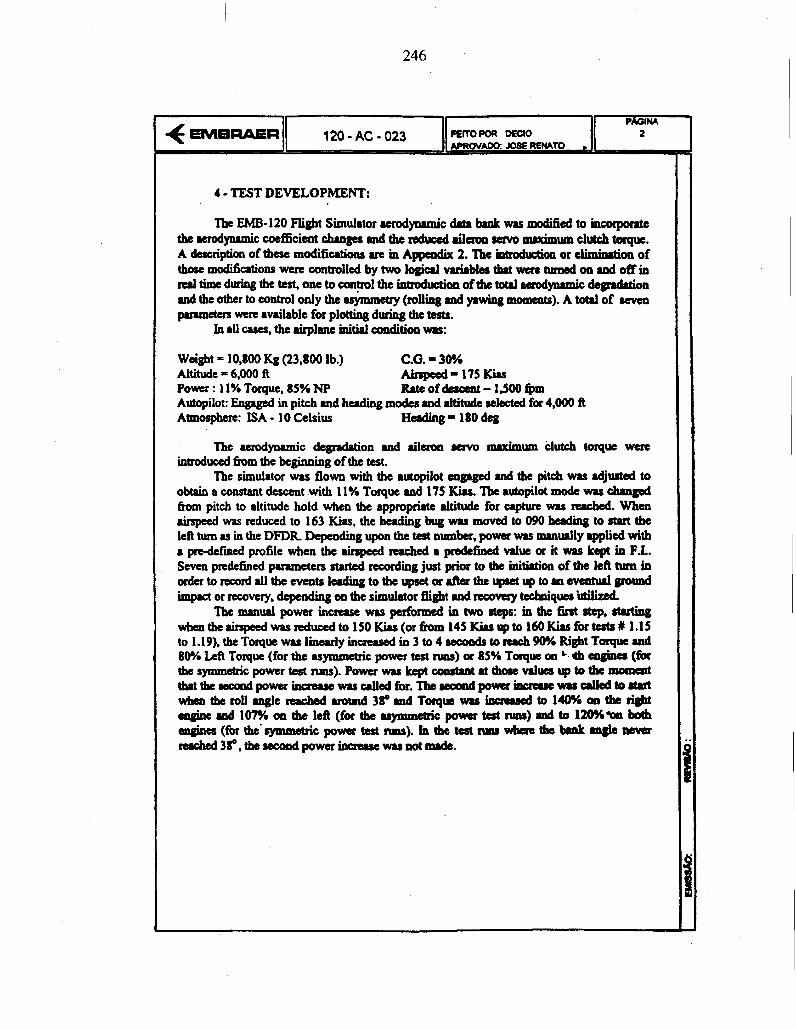
4 - TEST DEVELOPMENT: .
T2Ye EMB-120 Flight Simulator 8erodynamic &8 bank w8s modified to incoIpoz8te the modymmic coefficient ckges 8nd the raked &won sewo auximum clutch torque. Adeocriptionofthesemodi6~ti~ueiaAppeadix2.Tbcintrodudioaorelim;nrt;lmof those modifications were controlled by two logical variables that were tuned on and off in red time during the test, one to con*1 the intrwkctiosl of the total aerodynamic -on and the other to control only the asymmetry (rolling and yawing moma&). A ti of seven parameters were available for plotting during the tests.
ill ru uses, the airplane initial condition wms:
Weight = 10,800 Kg (23,800 lb.) C.G. - 30% Altitude - 6,ooo ft Aimpeed- 175 Ki8s Power : 11% Toque, 8% NP R&.eofdesMt-IJOOfpm Autopilot: Engaged in pitch and heading modes and altitude selected fw 4,000 A Atu~~sphcre: ISA - IO Celsius Heading - 180 deg
The urodyMmic degmdation and ailcmn sew0 CMximum htch torque were introduced bpm the heginniig ofthe test.
The simulator was flown with the rutopilot engaged and the pitch was 8djusted to obtain a constant descent .with 11% Torque md 175 iGas. l’be autopilot mode wan changed &om pitch to altitude hold when the appropriate altitude for capture was rewhai. When rirspeedwasreducedto163Ki~,thehu~gbug~movedto090herdingto~the left turn u in the DFDR Depending upon the test number, power was manually applied with aprr-detinedp~filewhentherircipeed~r~~vrrlueoritwrokeptinF~. Seven predekd panmeters started recordiig just prior to the initiation of the left turn in ~rto~rlltheewwtgltrdingtothe~orrffertheupretuptom~gFo~ impact or recovery, depending on the simulator tight 8nd recovery techniques ‘btiik&
247
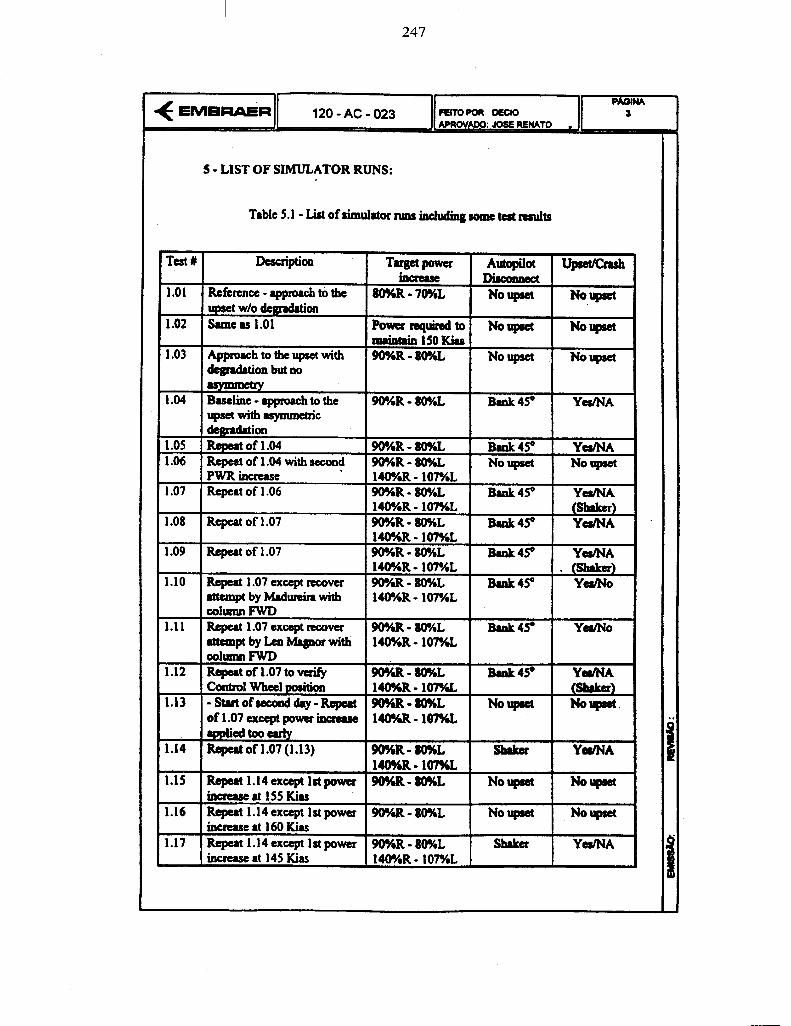
S - LIST OF SIMULATOR RUNS:
Table 5.1- List of sinwlator nms including some test mm&s
14O%R - 107%L
248
1
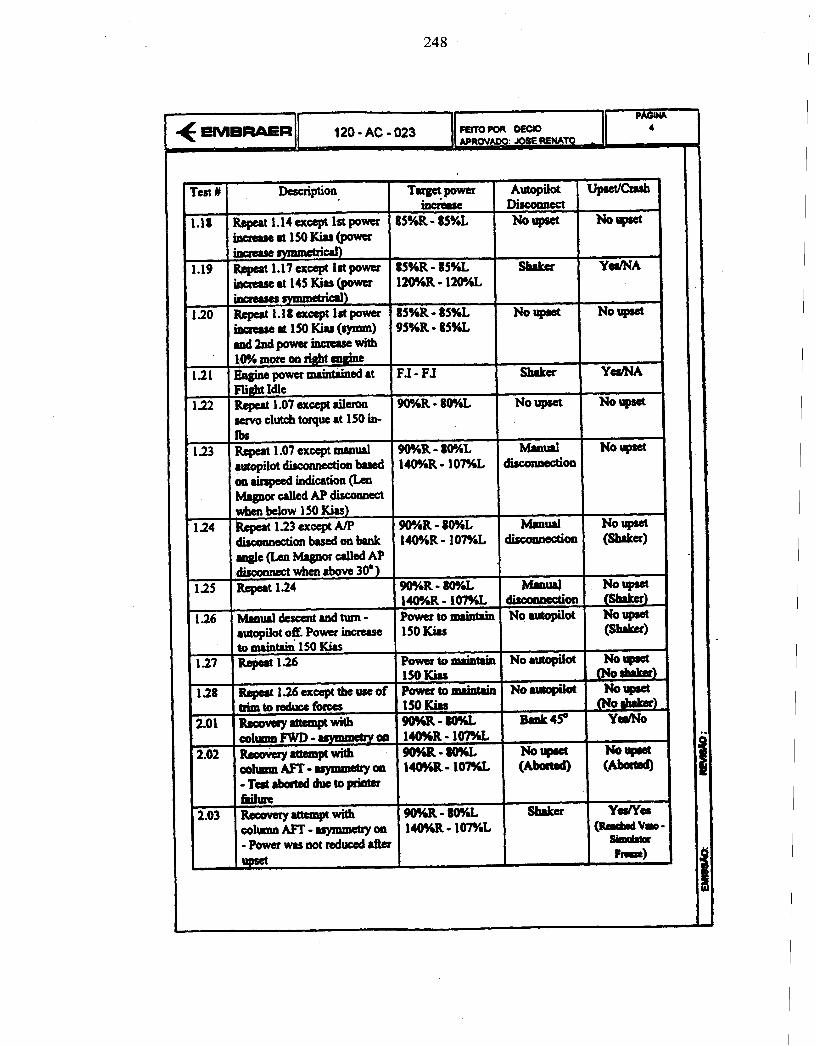
Testfur Description Autopilot UpM08Sh
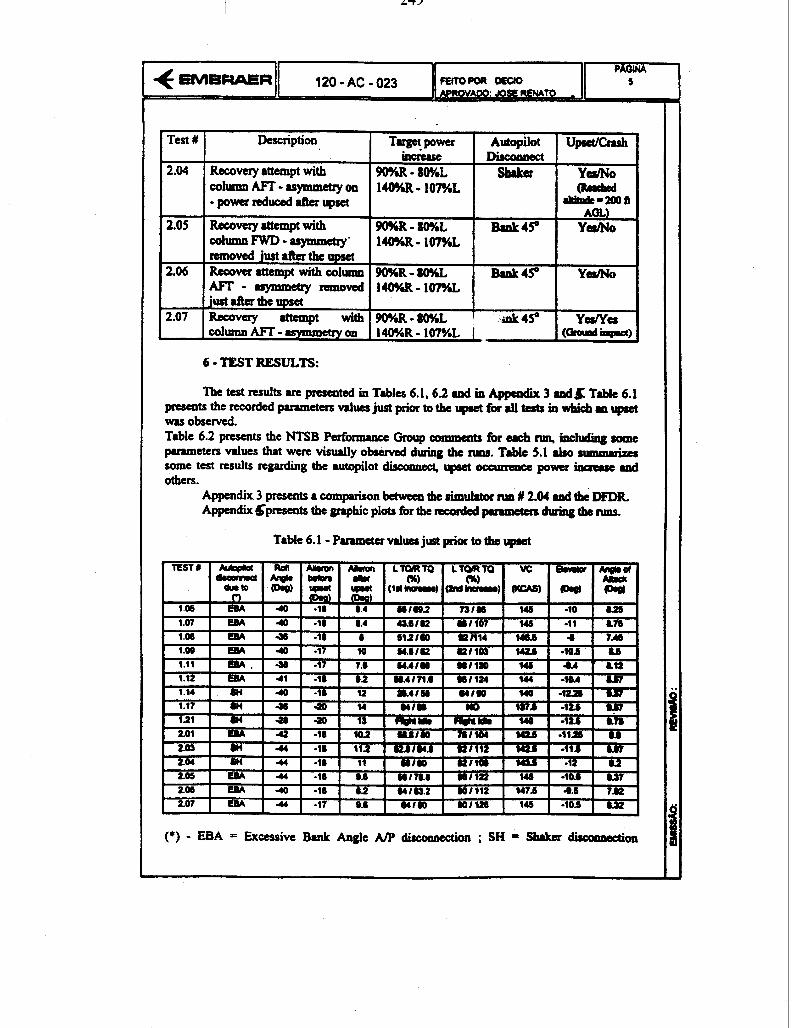
2.04 Recovery attempt with 90966 - 8O%L SbkCZ YesNo ~mn~-rsymmetryon 14O%R-107%L -powcrruiuuclaftcrupwt abMe=mit
1 2.05 Recovery attempt with 9O%R - 8O%L B8akIso YAzko
columnFwD-8symmetcy’ MO%R- 107%L ruqwcd justafkrthcupset
2.06 I&over &tempt with column 9O%R - 8O%L Bank450 YdhJo AFr - uymmetry removed 14wiR-1079&L just rfbr the upset
2.07 Remmy attcmja with 4W%R-809bL ! mk 4s” YUNU COIpllUlAFT-UyUlKD~On 14O%R- 107%L I ~~~~
6 - TEST RESULTS:
The test results UC presented in Tables 6.1.6.2 and in Appmdix 3 aad& Table 6.1 ~b~~~~~~~~~~~j~~~~~~f~~~~~~~~
Table 6.2 presents the NTSB Performance Group commmts fbr each run, in&ding tome parameters values that were visually obsemd during tk rum. Table 5.1 also summmks some test results regarding the 8utopilot diswnnw upt OcmlTmu power i#nfxuw 8Dd olilers.
Appendix 3 presents a ccmparkn between the simuirb~r nm f 2.04 end the DFDR- Appendix gpresatts tbe graphic plots fbr the readed pmmetasduringtbenms.
Table 6.10 Parameter v&m just prior to the upset TEST I r \ 1.05
1.or
1.W
1.08
1.11
1.12
1.14
1.17
1.21
201
20s
204 1
205
200
2.07
(+) - EBA = Excessive Bank Angle A/p dirconnectioJI ; SH = Sh&cr W~lr
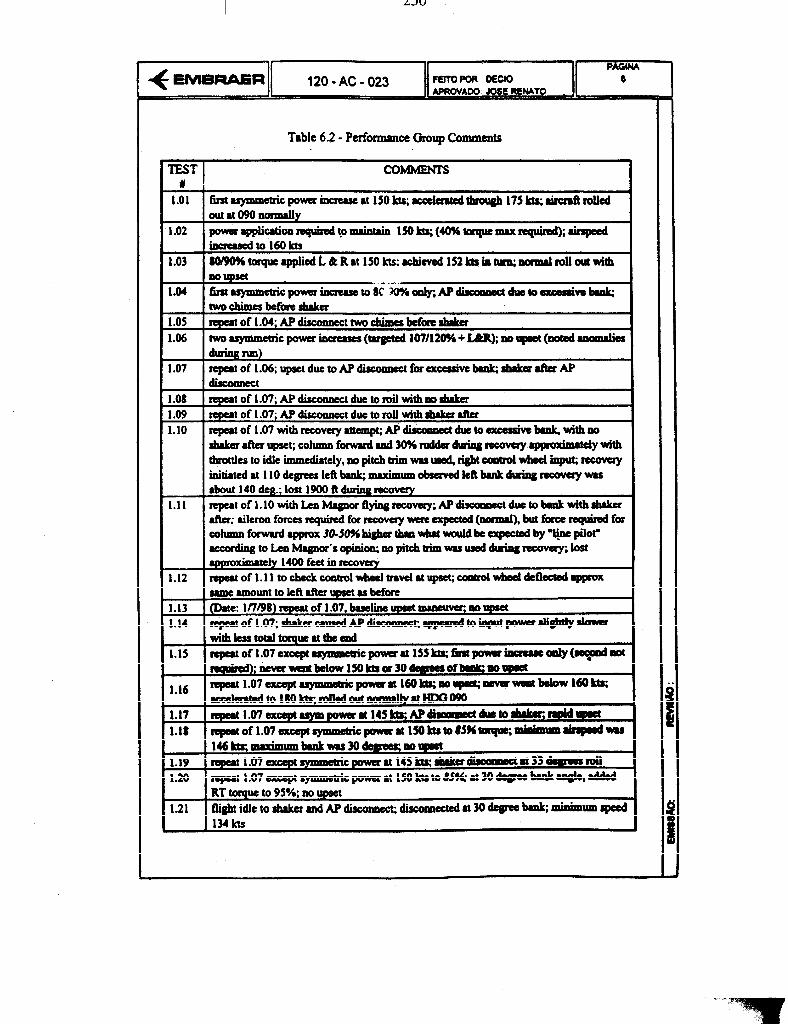
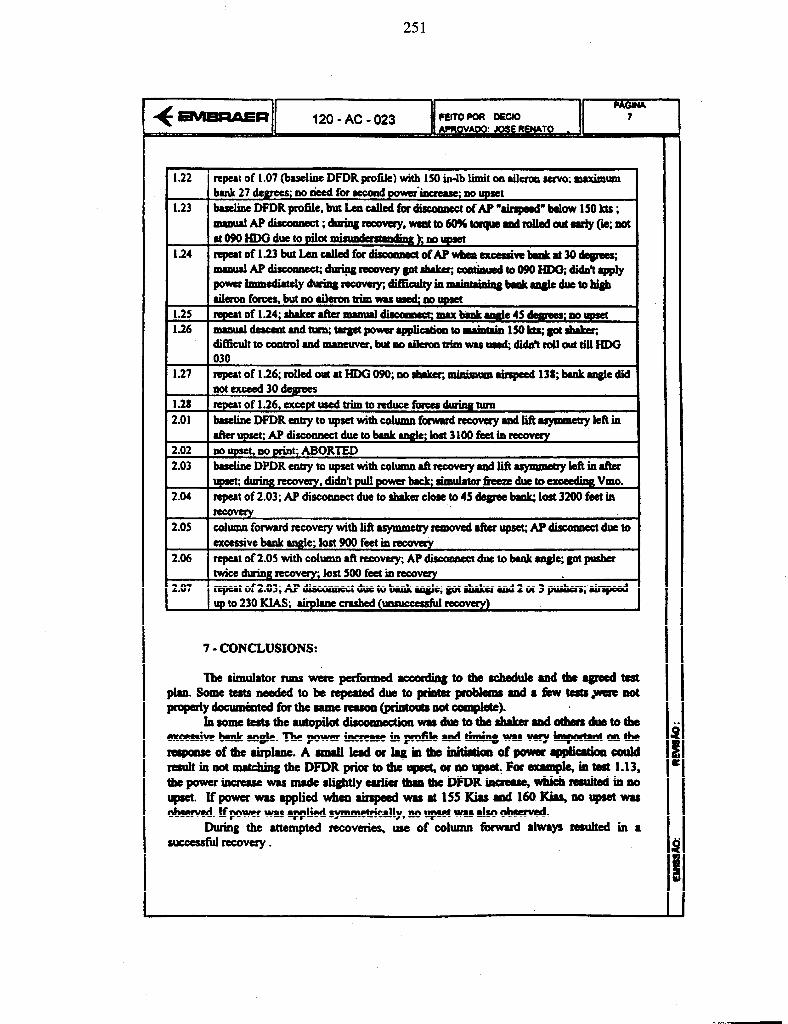
Table 6.2 - Performance Group Comments
251
c
2.05 cdumnf~rccoverywithLiA~e~rarrovedrftctupset;AP~tbue~ cx$tssive bulk angle; lost 900 feet in lecuvuy
2.06 rqjut of 2.05 with column aft recovay; AP dhonnca due to bank angle; got juber tw$ce durinjq recoveqq lost 500 feet in recovuy
2.07 qc8tof2.03;APdiscQnncc tductoti&e;gotW8fbd2or3&;~ up,to23OKIAS; 8iIpl8ncmshed(~recovay)
7 - CONCLUSIONS:
Thcsimulatornmswcrcpufibmcdaccmdhgtotberchadule&ndtbc8grucdte%t
L
L