Appendix C – Air Quality and Dust Management Plan€¦ · Pollutant Inventory Emission Estimation...
31
GHD | Report for Arafura Resources Limited - Nolans Project, 43/22301 Appendix C – Air Quality and Dust Management Plan
Transcript of Appendix C – Air Quality and Dust Management Plan€¦ · Pollutant Inventory Emission Estimation...

GHD | Report for Arafura Resources Limited - Nolans Project, 43/22301
Appendix C – Air Quality and Dust Management Plan

Arafura Resources Limited Nolans Project
Air Quality and Dust Management Plan
March 2016
GHD | Report for Arafura Resources Limited - Nolans Project, 43/22301 | i
Document Status
Version Author Reviewer Approved by Date Status
Amendments Section Details
Audit Summary Date Auditor Details
ii | GHD | Report for Arafura Resources Limited - Nolans Project, 43/22301
Table of contents 1. Introduction ............................................................................................................................... 1
1.1 Purpose .......................................................................................................................... 1 1.2 Objective ......................................................................................................................... 1 1.3 Legislation and Guidelines ............................................................................................... 1 1.4 Previous Investigations .................................................................................................... 2
2. Existing Conditions .................................................................................................................... 3 2.1 Climate ............................................................................................................................ 3 2.2 Sensitive Receptors......................................................................................................... 6 2.3 Potential Dust and Pollutant Impacts ............................................................................... 6 2.4 Ongoing Dust Monitoring ................................................................................................. 9
3. Air and Dust Management ....................................................................................................... 11 3.1 Key Activities, Risks and Impacts .................................................................................. 11 3.2 Objective ....................................................................................................................... 12 3.3 Mitigation Measures ...................................................................................................... 12 3.4 Trigger, Action and Response Plan................................................................................ 14
4. Previous Period Performance .................................................................................................. 16
5. References ............................................................................................................................. 17
Table index Table 1-1 Summary of Air Quality Investigations ............................................................................. 2
Table 2-1 Climate Summary from 1987 to 2015 (Source: BOM, Territory Grape Farm Station No. 015643) ........................................................................................................ 3
Table 2-2 Sensitive Receptor Locations .......................................................................................... 6
Table 2-3 Potential Air Pollutants and Dust Sources ........................................................................ 7
Table 2-4 Operations (Worst-case) Predicted Particle Concentrations at Receptors (GHD, 2016) .............................................................................................................................. 8
Table 2-5 Predicted CO, NO2 and SO2 Concentrations at Receptors ............................................... 8
Table 2-6 Dust Deposition Gauges .................................................................................................. 9
Table 3-1 Key Activities, Risks and Impacts .................................................................................. 11
Table 3-2 Air and Dust Objectives ................................................................................................. 12
Table 3-3 Mitigation Measures ...................................................................................................... 12
Table 3-4 Trigger, Action and Response Plan................................................................................ 14
Figure index

GHD | Report for Arafura Resources Limited - Nolans Project, 43/22301 | iii
Figure 2-1 Annual and Seasonal Wind Roses (Source: BOM, Territory Grape Farm Station No. 015643) .................................................................................................................... 4
Figure 2-2 Annual Wind Roses (Source: Arafura Resources, Nolans AWS) ..................................... 5
Figure 2-3 Dust Deposition Gauge Locations – Mine Site .............................................................. 10
Appendices Appendix A – Risk Matrix
GHD | Report for Arafura Resources Limited - Nolans Project, 43/22301 | 1
1. Introduction 1.1 Purpose
The Nolans Project involves several key activities with the potential to impact on air quality. Arafura Resources Limited (Arafura Resources) will manage Air quality and Dust emissions in accordance with the Air Quality and Dust Management Plan (AQDMP).
The purpose of the AQDMP is to provide a framework for environmental management. The Plan has been developed in accordance with NT EPA requirements and references Commonwealth air quality legislation.
The impacts of dust emissions fall under two categories, namely health and amenity as follows:
Potential health impacts are attributable to the concentration of respirable particles in ambient air. Respirable particles of dust (PM10) would have maximum impact under light winds and stable atmospheric conditions. These conditions most frequently occur overnight and very early in the morning. Greater amounts of dust can be generated from exposed surfaces under strong wind conditions which are associated with a neutral atmospheric stability.
Presence of Total Suspended Particles (TSP), greater than 35 micron, is likely to affect amenity by way of reducing visibility (whilst in the air column) and by soiling of materials via dust deposition. Amenity impacts are most noticeable in high wind conditions, when larger particles may be entrained into the air column from erodible surfaces and transported a significant distance before being deposited and soiling surfaces. Mitigation of amenity related dust impacts would in turn act to reduce health impacts due to dust emissions.
1.2 Objective
The AQDMP has been established to minimise the health risk or loss of amenity due to emission of dust or pollutants from the Mine, Sulphuric Acid Plant or Power Station to the environment. The AQDMP has been designed to achieve this objective through the following process:
Characterising and ranking potential impacts of major dust and air quality emission sources assisted by modelling of dust and air quality;
Implementation of a dust prevention strategy including dust, mitigation measures and monitoring of dust impact; and
Annual performance reviews against monitoring results to determine if additional mitigation measures are required.
1.3 Legislation and Guidelines
The AQDMP has been developed with reference to several industry standards and guidelines in relation to dust and pollutants. A summary of legislation and guidelines are provided below:
National Environment Protection (Ambient Air Quality) Measure (Air NEPM);
National Environment Protection (Air Toxics) Measure (Air Toxics NEPM);
National Greenhouse and Energy Reporting Act 2007 (NGER Act);
WA Environmental Protection Authority (EPA) criteria for total suspended particulates (TSP);
Victoria Mining and Extractive Industries Protocol for Environmental Management (PEM) criteria for PM2.5 and PM10;
2 | GHD | Report for Arafura Resources Limited - Nolans Project, 43/22301
Victorian Environment Protection Authority (Vic EPA) Design Criterion for PM10, CO, NO2 and SO2;
Victorian State Environment Protection Policy (Air Quality Management) - EPA Victoria;
National Standards for Air Quality - Australian Government, Department of the Environment and Heritage, 2005;
Department of Sustainability, Environment, Water, Population and Communities, National Pollutant Inventory Emission Estimation Technique Manual for Mining Version 3.1 (January 2012);
Department of Infrastructure 2013/2014 Standard Specification for Environmental Management; and
EPA Victoria, Best Practice Environmental Management – Environmental Guidelines for Major Construction Sites.
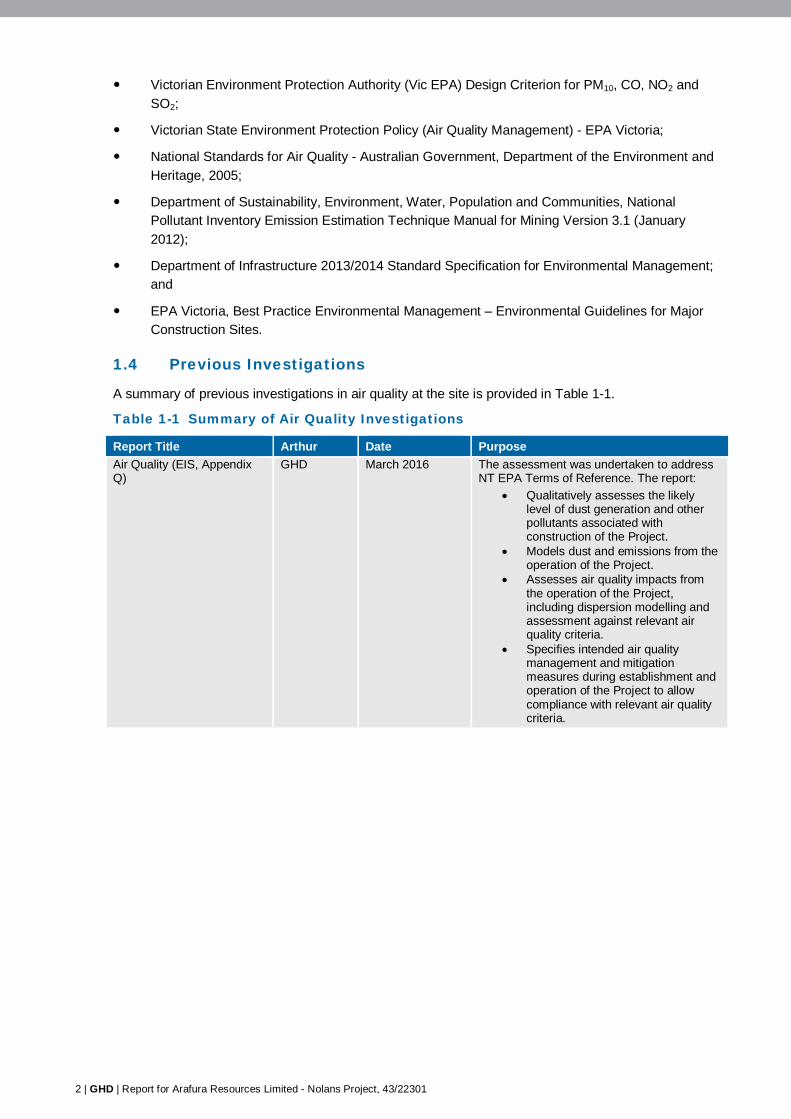
1.4 Previous Investigations
A summary of previous investigations in air quality at the site is provided in Table 1-1.
Table 1-1 Summary of Air Quality Investigations
Report Title Arthur Date Purpose Air Quality (EIS, Appendix Q)
GHD March 2016 The assessment was undertaken to address NT EPA Terms of Reference. The report:
Qualitatively assesses the likely level of dust generation and other pollutants associated with construction of the Project.
Models dust and emissions from the operation of the Project.
Assesses air quality impacts from the operation of the Project, including dispersion modelling and assessment against relevant air quality criteria.
Specifies intended air quality management and mitigation measures during establishment and operation of the Project to allow compliance with relevant air quality criteria.

GHD | Report for Arafura Resources Limited - Nolans Project, 43/22301 | 3
2. Existing Conditions 2.1 Climate
The Bureau of Meteorology (BOM) Territory Grape Farm Station is situated approximately 40 km north east of the Mine Site (BOM Site No. 015643).
The Station has collected temperature and rainfall from 1987 to 2015. The data indicates the climate of the region is arid to semi-arid in nature with a mean annual rainfall of approximately 310 mm. This corresponds to a Desert or Grassland (hot persistently dry) climate classification. Rainfall generally falls over 30 days across the year predominately between October and March. However, rainfall in the region is highly variable.
The average annual mean minimum and maximum temperature range from 5.1 to 21.9ºC and 22.5 to 36.3ºC respectively. The higher temperatures are generally experienced from October to March (corresponding with higher rainfall in the region – suggesting that most rainfall is from convectively driven weather systems with storms).
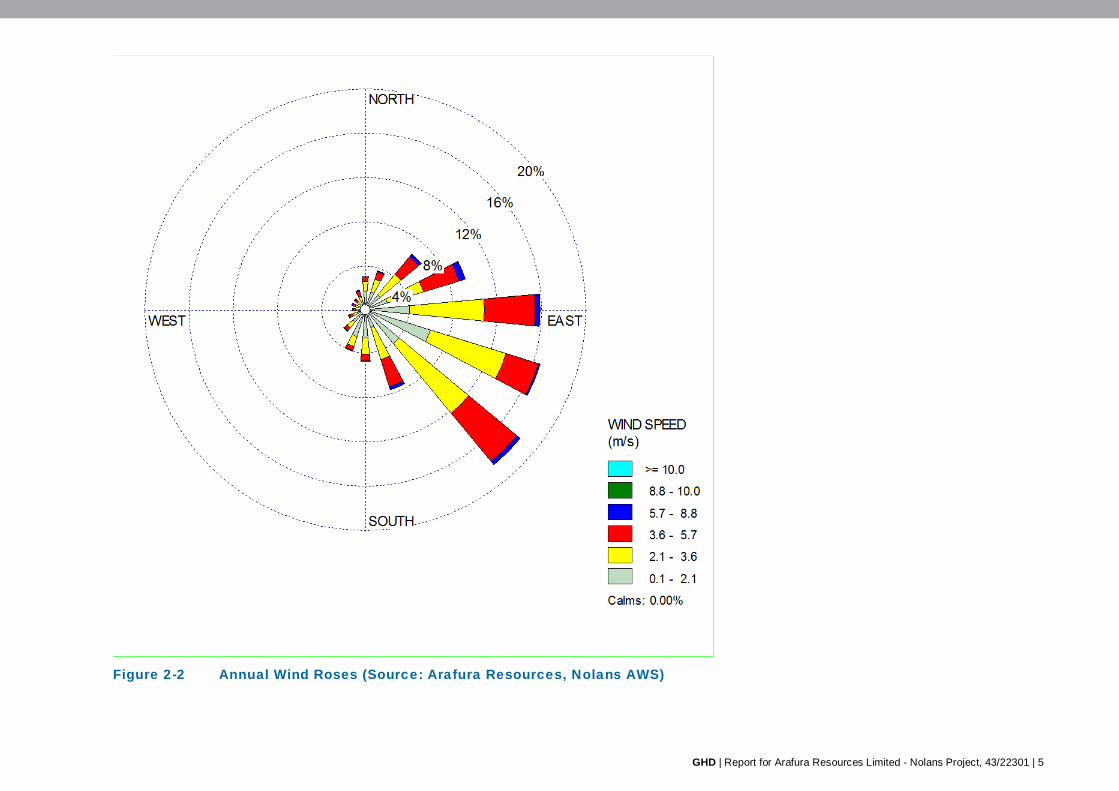
The winds at the Territory Grape Farm Station are predominant south easterly wind direction throughout the year. The average monthly wind speeds range from 2.50 to 3.17 m/s with an annual average of 2.86 m/s. An on-site Automatic Weather Station provides site-specific wind data for the Project. Average annual wind speeds have been measured at 2.77 m/s at the Site.
A summary of climate data is provided in Table 2-1 and wind rose are provided in Figure 2-1 and Figure 2-2.
Table 2-1 Climate Summary from 1987 to 2015 (Source: BOM, Territory Grape Farm Station No. 015643)
Jan Feb Mar Apr May Jun Jul Aug Sep Oct Nov Dec Average Temperature Mean Max (ºC) 37.3 36.2 34.3 30.4 25.5 22.2 22.5 25.3 30.4 33.3 35.6 36.3 30.8
Mean Min (ºC) 21.9 21.7 19.5 14.5 9.5 6.2 5.1 7.0 11.9 15.6 18.8 21.1 14.4
Rainfall Mean (mm) 62.4 65.8 21.0 18.0 22.5 8.6 4.7 4.6 10.0 14.7 30.9 50.5 312
Decile 5 (median) (mm)
44.2 33.8 10.2 3.0 1.0 1.6 0.0 0.0 1.6 7.1 19.1 40.7 298
Mean No. Days ( 1 mm)
4.3 4.7 2.1 1.5 2.2 1.2 0.7 0.8 1.0 2.7 3.9 4.9 30

4 | GHD | Report for Arafura Resources Limited - Nolans Project, 43/22301
Spring (September – November) Summer (December – February)
Autumn (March – May) Winter (June – August) Annual
Figure 2-1 Annual and Seasonal Wind Roses (Source: BOM, Territory Grape Farm Station No. 015643)
GHD | Report for Arafura Resources Limited - Nolans Project, 43/22301 | 5
Figure 2-2 Annual Wind Roses (Source: Arafura Resources, Nolans AWS)

6 | GHD | Report for Arafura Resources Limited - Nolans Project, 43/22301
2.2 Sensitive Receptors
The Nolans Project Area lies within the Burt Plain bioregion. Land use immediately adjacent is pastoral activities. Existing infrastructure includes the Stuart Highway, the Amadeus Gas Pipeline, pastoral station tracks and wells for stock watering.
The nearest non-mining sensitive receptor is Aileron Roadhouse approximately 12 km to the east of the mine site. The access road is westward off the Sturt highway approximately 10 km to the west of the Alyuen community.
A number of sensitive receptors were identified in the wider region as listed in Table 2-2 .
Table 2-2 Sensitive Receptor Locations
Name Coordinates Distance from Mine (km) Easting Northing
Nolans Bore 319070 7501720 0 Accommodation Camp 322800 7493100 9.4 Annas ReservoirA 309200 7500600 10 Aileron Roadhouse 330000 7494900 12 Alyuen 330600 7492000 15 Pinehill Station 299500 7523300 29 Laramba 269200 7506400 50 Napperby 268900 7509000 50 Conniston 241600 7559800 97 Alice Springs 386000 7378600 135 Note: A Potential ad-hoc camping location.
2.3 Potential Dust and Pollutant Impacts
An assessment potential impact from dust and key pollutants from the Project were assessed as part of the EIS (EIS, Appendix Q). The assessment included the adjacent area to the Mine Site boundary and to the nearest sensitive receptors.
A United States Environmental Protection Agency (US EPA) approved CALPUFF dispersion model (version 5.8.4) was used to predicted particle concentrations at a grid around the Project and inclusive of the nearest sensitive receptor locations.
The dust model utilised on-site meteorological data obtained from Arafura Resources and activities input replicating worst-case total emissions for each of the seven pit and associated infrastructure stages.
2.3.1 Assessment Guideline Values
Dust
The dust assessment guideline values were adopted from the following references with the most conservative value utilised for the assessment:
National Environment Protection (Ambient Air Quality) Measure (Air NEPM);
Approved Methods for the Modelling and Assessment of Air Pollutants in New South Wales (NSW Approved Methods);
Victorian State Environment Protection Policy (Air Quality Management) - EPA Victoria; and
Victoria Mining and Extractive Industries Protocol for Environmental Management (PEM) criteria for PM2.5 and PM10.
The levels are provided within the assessment in Table 2-4.
GHD | Report for Arafura Resources Limited - Nolans Project, 43/22301 | 7
Pollutants
The pollutant guideline values for assessing stack emissions from the power station were adopted from the following reference with the most conservative value utilised for the assessment:
National Environment Protection (Ambient Air Quality) Measure (Air NEPM);
National Environment Protection (Air Toxics) Measure (Air Toxics NEPM); and
Victorian State Environment Protection Policy (Air Quality Management) - EPA Victoria.
The levels are provided within the assessment in Table 2-5.
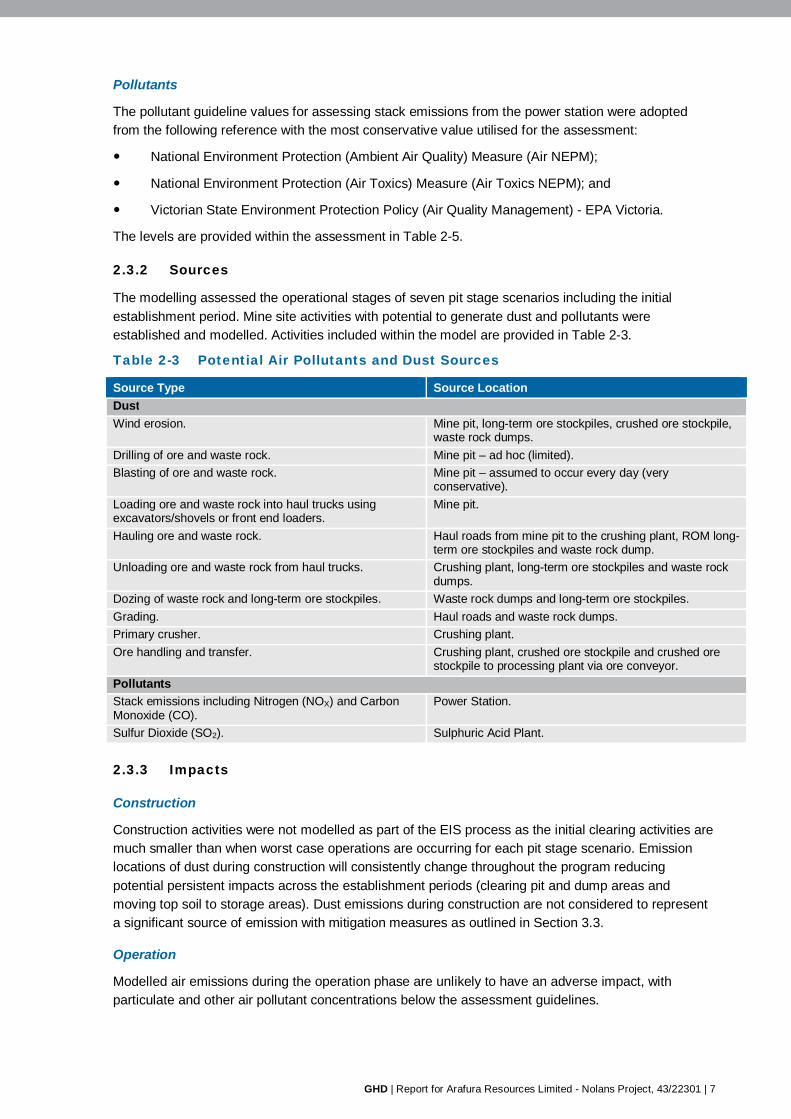
2.3.2 Sources
The modelling assessed the operational stages of seven pit stage scenarios including the initial establishment period. Mine site activities with potential to generate dust and pollutants were established and modelled. Activities included within the model are provided in Table 2-3.
Table 2-3 Potential Air Pollutants and Dust Sources
Source Type Source Location Dust Wind erosion. Mine pit, long-term ore stockpiles, crushed ore stockpile,
waste rock dumps. Drilling of ore and waste rock. Mine pit – ad hoc (limited). Blasting of ore and waste rock. Mine pit – assumed to occur every day (very
conservative). Loading ore and waste rock into haul trucks using excavators/shovels or front end loaders.
Mine pit.
Hauling ore and waste rock. Haul roads from mine pit to the crushing plant, ROM long-term ore stockpiles and waste rock dump.
Unloading ore and waste rock from haul trucks. Crushing plant, long-term ore stockpiles and waste rock dumps.
Dozing of waste rock and long-term ore stockpiles. Waste rock dumps and long-term ore stockpiles. Grading. Haul roads and waste rock dumps. Primary crusher. Crushing plant. Ore handling and transfer. Crushing plant, crushed ore stockpile and crushed ore
stockpile to processing plant via ore conveyor. Pollutants Stack emissions including Nitrogen (NOX) and Carbon Monoxide (CO).
Power Station.
Sulfur Dioxide (SO2). Sulphuric Acid Plant.
2.3.3 Impacts
Construction
Construction activities were not modelled as part of the EIS process as the initial clearing activities are much smaller than when worst case operations are occurring for each pit stage scenario. Emission locations of dust during construction will consistently change throughout the program reducing potential persistent impacts across the establishment periods (clearing pit and dump areas and moving top soil to storage areas). Dust emissions during construction are not considered to represent a significant source of emission with mitigation measures as outlined in Section 3.3.
Operation
Modelled air emissions during the operation phase are unlikely to have an adverse impact, with particulate and other air pollutant concentrations below the assessment guidelines.

8 | GHD | Report for Arafura Resources Limited - Nolans Project, 43/22301
The predicted concentrations for CO, NO2 and SO2 at sensitive receptor locations are below the adopted assessment criteria. Impact contours for CO, NO2 and SO2 barely extend beyond the Project boundary.
A summary of predicted dust and pollutant impacts at sensitive receptors is provided in Table 2-4 and Table 2-5 respectively.
Table 2-4 Operations (Worst-case) Predicted Particle Concentrations at Receptors (GHD, 2016)
Receptor PM10 TSP Dust deposition Averaging period 24-hour Annual Monthly
Rank Highest Max Rolling 12-month average
Guideline 60 µg/m3 90 µg/m3 2.0 g/m2/month (increment) Source VIC Mining PEM NSW Approved Methods NSW Approved Methods
Nolans Bore – on-site 842 (3) 401 (2) 6.6 (2) Accommodation Village <19.8 (6) <16 (5) <0.06 (2) Annas Reservoir <46.3 (4) <27.8 (5) <0.49 (2) Aileron Roadhouse <6.5 (6) <5 (4) <0.02 (2) Alyuen <6.5 (6) <5 (4) <0.02 (2) Pinehill Station <10.5 (2) <6.7 (5) <0.18 (2) Laramba BDL BDL BDL Napperby BDL BDL BDL Conniston BDL BDL BDL Alice Springs BDL BDL BDL Note: PM10: Particulate Matter < 10 µm.
TSP: Total Suspended Particulates. BDL – Below Detection Limit (outside modelled grid). ‘<’ sign indicates beyond the model grid limits. Bracket number indicates worst-case stage.
Table 2-5 Predicted CO, NO2 and SO2 Concentrations at Receptors
Receptor CO NO2 1 SO2
Averaging period 1-hour 1-hour Annual 1-hour
Rank 99.9%ile 99.9%ile Max- 99.9%ile
Guideline 29,000 µg/m3 190 µg/m3 62 µg/m3 450 µg/m3
Source EPP (VIC EPA) EPP (VIC EPA) NSW Approved Methods Air Toxics NEPM
Nolans Bore – on-site 14 3 < 1 132
Accommodation Village 7 2 < 1 105
Annas Reservoir <9 < 1 < 1 <75
Aileron Roadhouse 11 2 < 1 <126
Alyuen 4 1 < 1 <65
Pinehill Station <4 < 1 < 1 <59
Laramba BDL BDL BDL BDL
Napperby BDL BDL BDL BDL
Conniston BDL BDL BDL BDL
Alice Springs BDL BDL BDL BDL Note: 1 Taken as 30% of NOx results.
BDL – Below Detection Limit – well outside modelled grid ‘<’ sign indicates beyond the model grid limits

GHD | Report for Arafura Resources Limited - Nolans Project, 43/22301 | 9
2.4 Ongoing Dust Monitoring
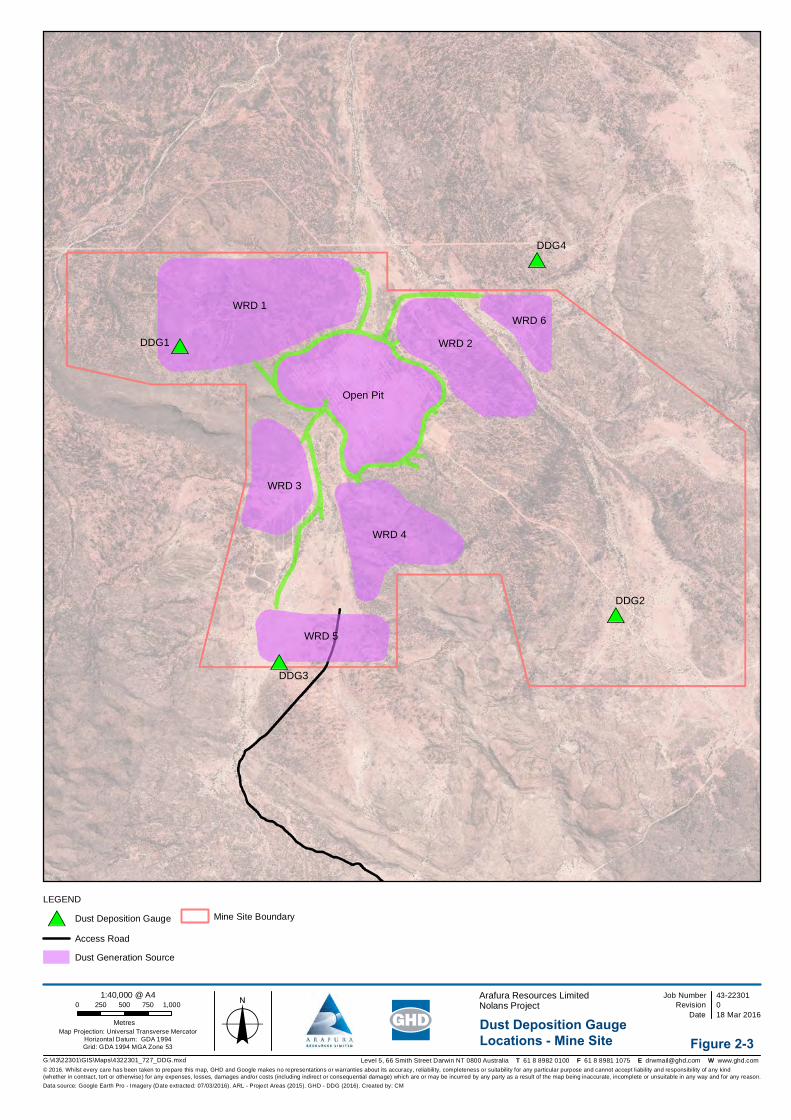
A series of dust deposition gauges are present across the Mine Site that were utilised for the EIS assessment (EIS Appendix Q). The locations bound the Mine Site upwind (DDG2), adjacent (DDG2 and DDG3) and downwind (DDG1) with a fifth location to be installed at the nearest sensitive receptor (the Accommodation Village).
Dust deposition monitoring will be undertaken through the construction and operational phases. Samples will be analysed by an independent NATA Accredited Laboratory. A summary of the gauge locations and sample frequencies are provided in Table 2-6. Gauges DDG1 to DDG4 are illustrated in Figure 2-3.
Table 2-6 Dust Deposition Gauges
ID Details Sampling Frequency DDG1 Downwind, currently situated to the southwest of Waste Rock
Dump (WRD) 1. Monthly
DDG2 Upwind, situated southeast of the Mine Site. DDG3 Adjacent, situated south of WRD 5. DDG4 Adjacent, situated north of WRD 6. DDG5 Accommodation Village (northeast boundary). Note: DDG1 to be relocated outside of WRD 1 footprint prior to construction.
The onsite meteorological monitoring station will be utilised throughout the construction and operations phase to determine local wind conditions at the time of any high dust event.
#*
#*
#*
#*
WRD 6
WRD 2
WRD 1
WRD 3
WRD 4
WRD 5
Open Pit
DDG1
DDG2
DDG3
DDG4
G:\43\22301\GIS\Maps\4322301_727_DDG.mxd
0 250 500 750 1,000
Metres
LEGEND
© 2016. Whilst every care has been taken to prepare this map, GHD and Google makes no representations or warranties about its accuracy, reliability, completeness or suitability for any particular purpose and cannot accept liability and responsibility of any kind (whether in contract, tort or otherwise) for any expenses, losses, damages and/or costs (including indirect or consequential damage) which are or may be incurred by any party as a result of the map being inaccurate, incomplete or unsuitable in any way and for any reason.
Job NumberRevision 0
43-22301
Date 18 Mar 2016oArafura Resources LimitedNolans Project
Data source: Google Earth Pro - Imagery (Date extracted: 07/03/2016). ARL - Project Areas (2015). GHD - DDG (2016). Created by: CM
Level 5, 66 Smith Street Darwin NT 0800 Australia T 61 8 8982 0100 F 61 8 8981 1075 E [email protected] W www.ghd.com
Map Projection: Universal Transverse MercatorHorizontal Datum: GDA 1994Grid: GDA 1994 MGA Zone 53
1:40,000 @ A4
#* Dust Deposition Gauge
Access Road
Dust Generation Source
Mine Site Boundary
Figure 2-3Dust Deposition Gauge Locations - Mine Site

GHD | Report for Arafura Resources Limited - Nolans Project, 43/22301 | 11
3. Air and Dust Management Air and dust management refers to previous monitoring and modelling carried out across the Project as detailed in Section 2. Management of air and dust is structured as follows:
Key Activities, Risks and Impacts: A summary of the key activities being undertaken during the management period. The potential environmental impacts and residual risk levels are identified for each environmental aspect.
Objective: The guiding environmental management objective(s) and activities that apply to the element.
Mitigation Measures: The procedures to be employed to ensure that the relevant objectives are met.
Responsibility: Nominates the responsible position for implementing actions and monitoring.
Trigger, Action, Response Plan (TARP): The actions to be implemented in the case of non-compliance. This includes strategies of remediation and the person(s) responsible for the actions.
3.1 Key Activities, Risks and Impacts
The key activities and potential environmental impact have been identified for air and dust are listed in Table 3-1. The risk matrix is provided in Appendix A.
Table 3-1 Key Activities, Risks and Impacts
Activity Potential Environmental Impact Residual Risk Level
Con
sequ
ence
Like
lihoo
d
Ris
k
Site establishment (including vegetation clearing and soil compaction) results in altered environment character and modification to ecological processes from construction of Project.
Dispersion of particulate matter in the air resulting in reduced air quality at nearby sensitive receptors or beyond the Project boundary with impacts to human health, in particular PM10. Impacts from other particulate sizes (TSP) from dust fallout and deposition, including to flora and amenity at sensitive receptors.
Minor Unlikely Low
Haulage and transport of material within the Project area, along haul roads within the mine site, and along access tracks; and general site movements over unsealed surfaces resulting in generation and dispersion of particulate or dust (TSP).
Dispersion of particulate matter (predominantly TSP, with some PM10) in the air resulting in reduced air quality at the Project boundary and/or at nearby sensitive receptors, with impacts to human health.
Moderate Possible Medium
Wind erosion mobilising dust from exposed surfaces, such as pits, waste dumps, tailings storage facility, residue storage facility, laydown areas, stockpiles, roads and sites of vegetation clearing.
Dispersion of particulate matter in the air (TSP and PM10), excluding radioactive material, resulting in reduced air quality at nearby sensitive receptors with impacts to human health. Impacts from dust fallout and deposition, including to flora, and amenity at sensitive receptors.
Minor Possible Medium

12 | GHD | Report for Arafura Resources Limited - Nolans Project, 43/22301
Activity Potential Environmental Impact Residual Risk Level
Con
sequ
ence
Like
lihoo
d
Ris
k
Drilling, blasting, excavation and materials handling at the mine site during operations results in dispersion of particulates and dust.
Dispersion of particulate matter (excluding radioactive material) in the air from activity contained to the mine pit over typically limited time frames, resulting in reduced air quality at nearby sensitive receptors at or beyond the Project boundary with impacts to human health.
Minor Unlikely Low
Operation of concentrator (comminution and beneficiation circuits) at the Mine Site, resulting in dispersion of particulate, gas or dust.
Dispersion of particulate matter (TSP and PM10) in the air resulting in reduced air quality beyond the Project boundary or at nearby sensitive receptors with impacts to human health.
Minor Rare Low
Operation of RE processing units, sulfuric acid plant and gas fired generators at the Processing Site results in dispersion of emissions.
Emission of fine particles and gaseous pollutants from the processing site, including SOx, NOx, CO, fluoride compounds and sulfuric acid. Dispersion resulting in reduced air quality at nearby sensitive receptors (> 5 km) with impacts to human health.
Minor Rare Low
Vehicle emissions and heavy equipment emissions results in impacts to air quality.
Emissions of CO, NOx, SOx, Particles and Volatile Organic Compounds (VOC) released from combustion sources including earthmoving equipment, haul trucks and site vehicles. Dispersion resulting in reduced air quality beyond the Project boundary or at nearby sensitive receptors with impacts to human health.
Minor Rare Low
Operation of the gas fired power station.
Emissions from the stack potentially impacting the workforce and/or sensitive receptors.
Minor Unlikely Low
3.2 Objective
The air and dust management objectives have been established and are detailed in Table 3-2.
Table 3-2 Air and Dust Objectives
Objective Target Indicator Minimise dust impacts at the Project. No reports of dust impacts from the
Project at sensitive receptors. Number of incidents of dust deposition at selected sensitive receptor sites.
Minimise air pollutant impacts at the Project.
No reports of pollutant impacts from the Project at sensitive receptors.
Number of pollutant impacts/complaints at selected sensitive receptor sites.
Utilise best practice for the management of the Power Station and Acid Plant with SCADA monitoring of stack emissions.
Number of stack emissions outside of design specification.
3.3 Mitigation Measures
Mitigation measures have been developed to minimise potential impacts associated to air quality and dust emissions. The mitigation measures, timing and responsibilities are provided in Table 3-3.
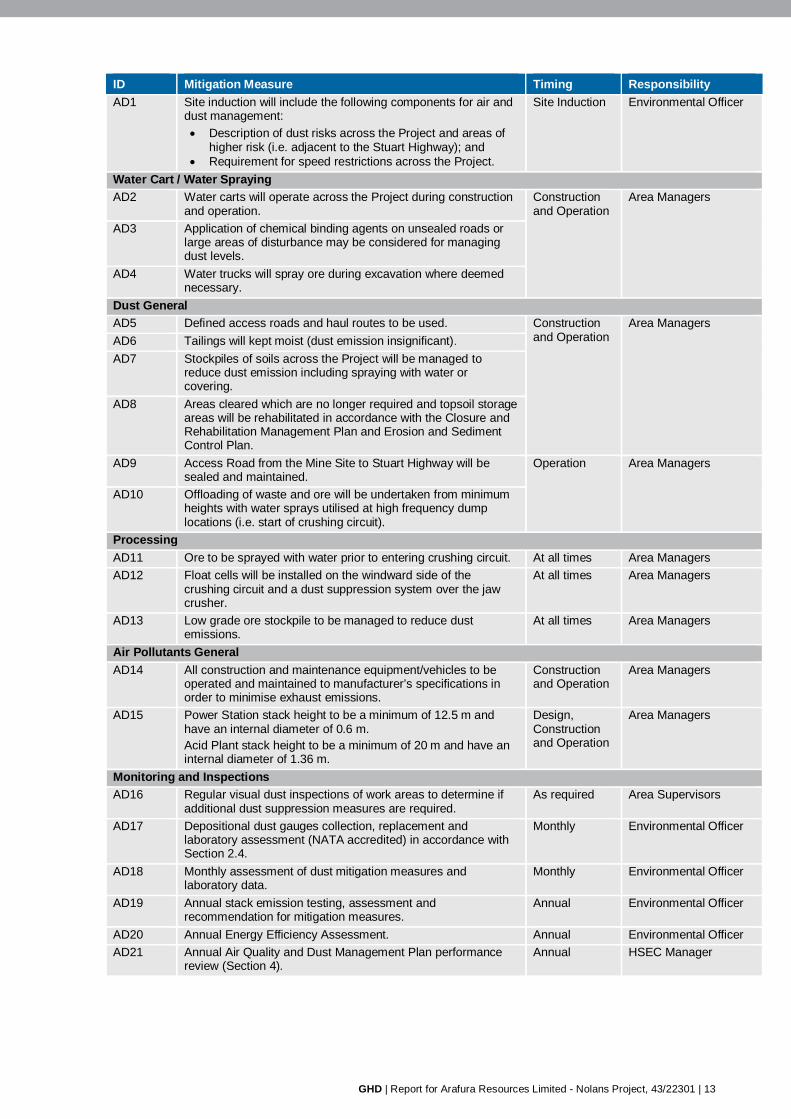
Table 3-3 Mitigation Measures
ID Mitigation Measure Timing Responsibility Site Induction
GHD | Report for Arafura Resources Limited - Nolans Project, 43/22301 | 13
ID Mitigation Measure Timing Responsibility AD1 Site induction will include the following components for air and
dust management: Description of dust risks across the Project and areas of
higher risk (i.e. adjacent to the Stuart Highway); and Requirement for speed restrictions across the Project.
Site Induction Environmental Officer
Water Cart / Water Spraying AD2 Water carts will operate across the Project during construction
and operation. Construction and Operation
Area Managers
AD3 Application of chemical binding agents on unsealed roads or large areas of disturbance may be considered for managing dust levels.
AD4 Water trucks will spray ore during excavation where deemed necessary.
Dust General AD5 Defined access roads and haul routes to be used. Construction
and Operation Area Managers
AD6 Tailings will kept moist (dust emission insignificant). AD7 Stockpiles of soils across the Project will be managed to
reduce dust emission including spraying with water or covering.
AD8 Areas cleared which are no longer required and topsoil storage areas will be rehabilitated in accordance with the Closure and Rehabilitation Management Plan and Erosion and Sediment Control Plan.
AD9 Access Road from the Mine Site to Stuart Highway will be sealed and maintained.
Operation Area Managers
AD10 Offloading of waste and ore will be undertaken from minimum heights with water sprays utilised at high frequency dump locations (i.e. start of crushing circuit).
Processing AD11 Ore to be sprayed with water prior to entering crushing circuit. At all times Area Managers AD12 Float cells will be installed on the windward side of the
crushing circuit and a dust suppression system over the jaw crusher.
At all times Area Managers
AD13 Low grade ore stockpile to be managed to reduce dust emissions.
At all times Area Managers
Air Pollutants General AD14 All construction and maintenance equipment/vehicles to be
operated and maintained to manufacturer’s specifications in order to minimise exhaust emissions.
Construction and Operation
Area Managers
AD15 Power Station stack height to be a minimum of 12.5 m and have an internal diameter of 0.6 m. Acid Plant stack height to be a minimum of 20 m and have an internal diameter of 1.36 m.
Design, Construction and Operation
Area Managers
Monitoring and Inspections AD16 Regular visual dust inspections of work areas to determine if
additional dust suppression measures are required. As required Area Supervisors
AD17 Depositional dust gauges collection, replacement and laboratory assessment (NATA accredited) in accordance with Section 2.4.
Monthly Environmental Officer
AD18 Monthly assessment of dust mitigation measures and laboratory data.
Monthly Environmental Officer
AD19 Annual stack emission testing, assessment and recommendation for mitigation measures.
Annual Environmental Officer
AD20 Annual Energy Efficiency Assessment. Annual Environmental Officer AD21 Annual Air Quality and Dust Management Plan performance
review (Section 4). Annual HSEC Manager

14 | GHD | Report for Arafura Resources Limited - Nolans Project, 43/22301
3.4 Trigger, Action and Response Plan
The Trigger, Action and Response Plan (TARP) provides an outline of remedial actions and responses to the situation. The TARP is outlined in Table 3-4.
Table 3-4 Trigger, Action and Response Plan
Responsibility Situation Standard Level 1 Level 2
Activities and associated dust emissions are contained within Project area.
Trigger: Dust complaint received but not validated.
Trigger: Dust complaint received and confirmed as valid.
Site Personnel Comply with site inductions and mitigation measures outlined in Table 3-3. Environmental Officer and Area Supervisors
Regular visual inspections across Project to determine if additional measures are required.
Monthly inspection and reporting of all dust control measures.
Undertake an investigation of the complaint including an assessment of operations, weather conditions and visual observation of impact.
Record as the Complaints Form (within Appendix A of the Environmental Management Plan).
Undertake an investigation of the complaint including an assessment of operations, weather conditions and visual observation of impact.
Review efficiency of dust mitigation measures and detail additional mitigation measures and associated monitoring at sensitive receptors (including complainant location where appropriate).
Construction Manager and Area Manager
Review reports and determine if additional measures are to be implemented.
Provide feedback to complainant.
Review and implement additional dust mitigation measures provided by the HSEC Manager.
Provide feedback to complainant.
Activities and associated dust emissions are contained within Project area.
Trigger: Monthly Dust Deposition Gauge (DDG) exceeds 4 g/m2/month OR one or more incremental monthly values (DDG value less background – the minimum of the monthly DDG) exceeds 2 g/m2/month.
Trigger: Rolling 12-month Dust Deposition Gauge (DDG) exceeds 4 g/m2/month OR one or incremental values (DDG value less background – the minimum of the monthly DDG) exceeds 2 g/m2/month.
Environmental Officer
Regular visual inspections across Project to determine if additional measures are required.
Monthly reporting of all dust deposition gauge monitoring.
Undertake an investigation of the exceedance including an assessment of operations and prevailing weather conditions.
Undertake an investigation of the exceedance including an assessment of operations and prevailing weather conditions.
Review efficiency of dust mitigation measures and detail additional mitigation measures to be considered.
Area Manager Review reports and determine if additional measures are to be implemented.
Provide feedback to HSEC Manager.
Review and implement additional dust mitigation measures provided by the HSEC Manager.
Annual stack emission test within operational limits.
Trigger: Stack emission tests indicate concentrations exceed design criteria by 20%
Trigger: Stack emission tests indicate concentrations exceed design criteria by 50%
Environmental Officer
Schedule and manage subcontractor to undertake annual testing of the power station stacks. Stack sampling is to comply with the
Assess subcontractors report and recommendations. Evaluate the viability of mitigation measures and produce
summary report for HSEC and Area Manager.

GHD | Report for Arafura Resources Limited - Nolans Project, 43/22301 | 15
Victorian EPA Guideline “A Guide to the Sampling and Analysis of Air Emissions and Air Quality”.
Area Manager - Review summary report of emissions failure and potential mitigation measures.
Determine in consultation with the subcontractor and HSEC Manager what remedial works will be undertaken.

16 | GHD | Report for Arafura Resources Limited - Nolans Project, 43/22301
4. Previous Period Performance No previous period performance data is available for review.

GHD | Report for Arafura Resources Limited - Nolans Project, 43/22301 | 17
5. References EPA Vic, 1996. Best Practice Environmental Management - Environmental Guidelines for Major Construction Sites. Melbourne, February 1996.
GHD, 2015. Air Quality Technical Report (Document No. G:\43\22301\WP\36700.docx).
Bureau of Meteorology (BOM), 2015. Climate Statistics for Australian Locations - Monthly Climate Statistics – All Years of Record – Territory Grape Farm. http://www.bom.gov.au/climate/averages/tables/cw_015643.shtml. Accessed 5 May 2015.

GHD | Report for Arafura Resources Limited - Nolans Project, 43/22301
Appendices

GHD | Report for Arafura Resources Limited - Nolans Project, 43/22301
Appendix A – Risk Matrix An environmental risk assessment was undertaken for the Nolans Project and associated construction, operation and closure. The risk assessment identified the risk source (hazard and event), receptors and potential impact. The consequence and likelihood were determined using the descriptions identified in Table A1 and Table A2 respectively. The risk matrix is provided in Table A3.
GHD | Report for Arafura Resources Limited - Nolans Project, 43/22301
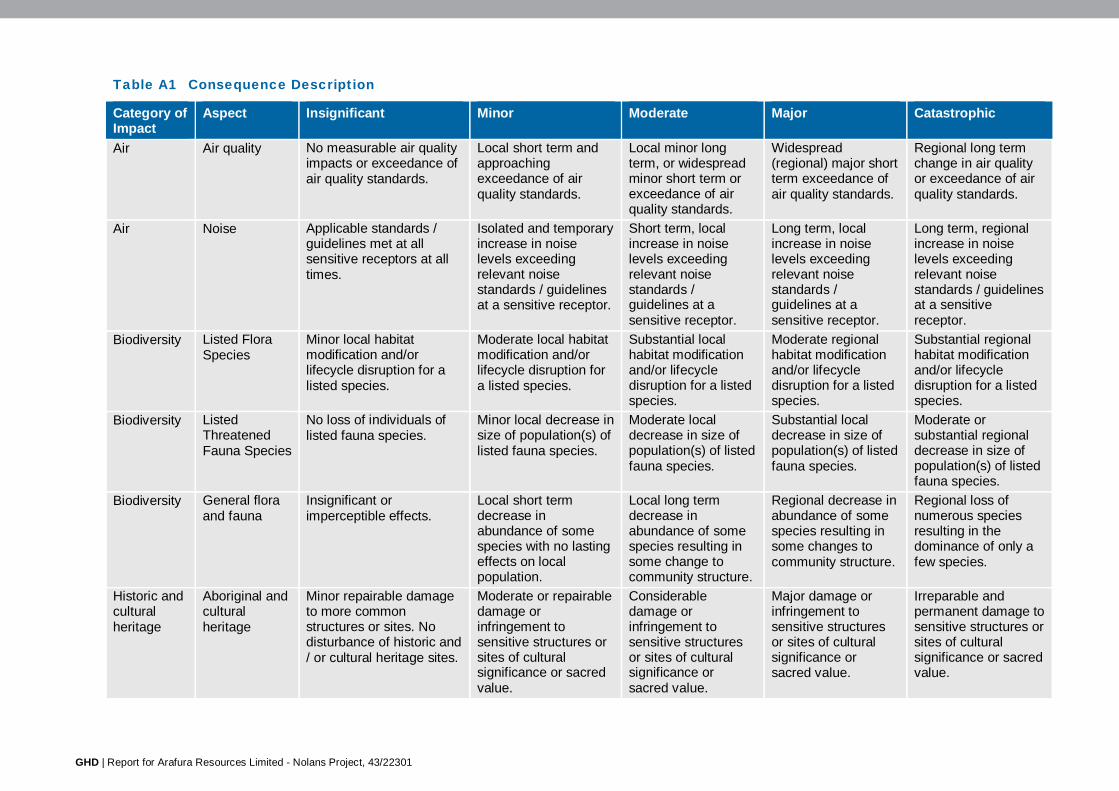
Table A1 Consequence Description
Category of Impact
Aspect Insignificant Minor Moderate Major Catastrophic
Air Air quality No measurable air quality impacts or exceedance of air quality standards.
Local short term and approaching exceedance of air quality standards.
Local minor long term, or widespread minor short term or exceedance of air quality standards.
Widespread (regional) major short term exceedance of air quality standards.
Regional long term change in air quality or exceedance of air quality standards.
Air Noise Applicable standards / guidelines met at all sensitive receptors at all times.
Isolated and temporary increase in noise levels exceeding relevant noise standards / guidelines at a sensitive receptor.
Short term, local increase in noise levels exceeding relevant noise standards / guidelines at a sensitive receptor.
Long term, local increase in noise levels exceeding relevant noise standards / guidelines at a sensitive receptor.
Long term, regional increase in noise levels exceeding relevant noise standards / guidelines at a sensitive receptor.
Biodiversity Listed Flora Species
Minor local habitat modification and/or lifecycle disruption for a listed species.
Moderate local habitat modification and/or lifecycle disruption for a listed species.
Substantial local habitat modification and/or lifecycle disruption for a listed species.
Moderate regional habitat modification and/or lifecycle disruption for a listed species.
Substantial regional habitat modification and/or lifecycle disruption for a listed species.
Biodiversity Listed Threatened Fauna Species
No loss of individuals of listed fauna species.
Minor local decrease in size of population(s) of listed fauna species.
Moderate local decrease in size of population(s) of listed fauna species.
Substantial local decrease in size of population(s) of listed fauna species.
Moderate or substantial regional decrease in size of population(s) of listed fauna species.
Biodiversity General flora and fauna
Insignificant or imperceptible effects.
Local short term decrease in abundance of some species with no lasting effects on local population.
Local long term decrease in abundance of some species resulting in some change to community structure.
Regional decrease in abundance of some species resulting in some changes to community structure.
Regional loss of numerous species resulting in the dominance of only a few species.
Historic and cultural heritage
Aboriginal and cultural heritage
Minor repairable damage to more common structures or sites. No disturbance of historic and / or cultural heritage sites.
Moderate or repairable damage or infringement to sensitive structures or sites of cultural significance or sacred value.
Considerable damage or infringement to sensitive structures or sites of cultural significance or sacred value.
Major damage or infringement to sensitive structures or sites of cultural significance or sacred value.
Irreparable and permanent damage to sensitive structures or sites of cultural significance or sacred value.

GHD | Report for Arafura Resources Limited - Nolans Project, 43/22301
Category of Impact
Aspect Insignificant Minor Moderate Major Catastrophic
Human health and safety
Safety Low level short term subjective inconvenience or symptoms. Typically a first aid and no medical treatment.
Reversible / minor injuries requiring medical treatment, but does not lead to restricted duties. Typically a medical treatment.
Reversible injury or moderate irreversible damage or impairment to one or more persons. Typically a lost time injury.
Single fatality and/or severe irreversible damage or severe impairment to one or more persons.
Multiple fatalities or permanent damage to multiple people.
Human health and safety
Health Reversible health effects of little concern, requiring first aid treatment at most.
Reversible health effects of concern that would typically result in medical treatment.
Severe, reversible health effects of concern that would typically result in a lost time illness.
Single fatality or irreversible health effects or disabling illness.
Multiple fatalities or serious disabling illness to multiple people.
Radiation Occupational exposure
<1 mSv/y Measurable increase in radiation dose with outcomes below public dose limit.
<5 mSv/y Measurable increase in radiation dose with outcomes remaining below dose constraints.
>5 mSv/y and <20 mSv/y Measurable increase in radiation dose with outcomes between dose constraint and dose limit (averaged over five years).
>20 mSv/y and <50 mSv/y Measurable increase in radiation dose with outcomes between dose limit (averaged over five years) and maximum annual dose.
>50 mSv/y Measurable increase in radiation dose with outcomes greater than the maximum annual dose.
Radiation Public exposure
No change from background. Dose not discernible above natural background.
<0.3 mSv/y Measurable increase in radiation dose with outcomes below public dose constraint.
>0.3 mSv/y and <1 mSv/y Measurable increase in radiation dose with outcomes between dose constraint and dose limit (averaged over five years) for public.
>1 mSv/y and <5 mSv/y Measurable increase in radiation dose with outcomes between dose limit (averaged over five years) and maximum annual dose for public.
>5 mSv/y Measurable increase in radiation dose with outcomes greater than the maximum annual dose for public.
Radiation Environmental impact
ERICA RQ < 0.1 ERICA RQ >0.1 and <1.0
ERICA RQ >1.0 plus justification
ERICA RQ >1.0 and no justification
ERICA RQ > 10.0

22 | GHD | Report for Arafura Resources Limited - Nolans Project, 43/22301
Category of Impact
Aspect Insignificant Minor Moderate Major Catastrophic
Socio-economic
Community Local, small-scale, easily reversible change on social characteristics or values of the communities of interest or communities can easily adapt or cope with change.
Short-term recoverable changes to social characteristics and values of the communities of interest or community has substantial capacity to adapt and cope with change.
Medium-term recoverable changes to social characteristics and values of the communities of interest or community has some capacity to adapt and cope with change.
Long-term recoverable changes to social characteristics and values of the communities of interest or community has limited capacity to adapt and cope with change.
Irreversible changes to social characteristics and values of the communities of interest or community has no capacity to adapt and cope with change.
Socio-economic
Visual and landscape
Almost imperceptible or no visual change from sensitive receptors or places of cultural and natural value. No loss of / or change to features or characteristics of the landscape.
Minor visual change from sensitive receptors or places of cultural and natural value. Minor loss or alteration to key landscape characteristics, or introduction of elements that may be visible but not uncharacteristic.
Moderate visual change from sensitive receptors and places of cultural and natural value. Discernible changes in the landscape due to partial loss or change to characteristics of the landscape.
Significant visual change from sensitive receptors and places of cultural and natural value. Discernible change which is out of scale with the landscape, at odds with landform and will leave an adverse impact.
Catastrophic visual change from sensitive receptors and places of cultural and natural value. A substantial change to the landscape due to total loss of elements or characteristics, causing the landscape to be permanently changed and its quality diminished.
Transport Traffic and transport operations and conditions
Negligible adverse impact on traffic and transport conditions. No perceptible deterioration of road integrity.
Detectable adverse changes in traffic and transport condition (decrease in Level of Service) at one or two locations at any one point in time during the construction period or at a single location during operations. Seasonal, local deterioration of road integrity.
Detectable adverse change in traffic and transport conditions (decrease in Level of Service) at multiple locations. Short term, local deterioration of road integrity.
Traffic and transport congestion and delays exceed acceptable levels at multiple locations. Short term, regional deterioration of road integrity.
Traffic and transport congestion and delays severely restrict the safe operation and efficiency of the transport network. Long term, regional deterioration of road integrity.
GHD | Report for Arafura Resources Limited - Nolans Project, 43/22301
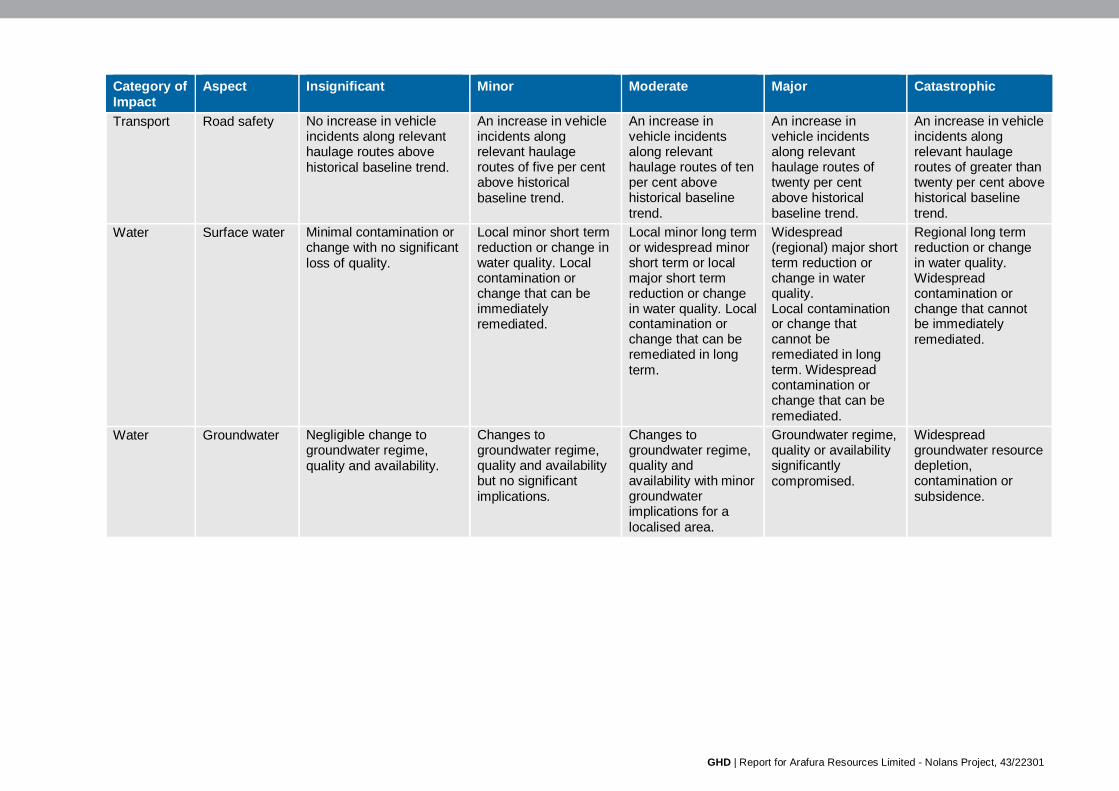
Category of Impact
Aspect Insignificant Minor Moderate Major Catastrophic
Transport Road safety No increase in vehicle incidents along relevant haulage routes above historical baseline trend.
An increase in vehicle incidents along relevant haulage routes of five per cent above historical baseline trend.
An increase in vehicle incidents along relevant haulage routes of ten per cent above historical baseline trend.
An increase in vehicle incidents along relevant haulage routes of twenty per cent above historical baseline trend.
An increase in vehicle incidents along relevant haulage routes of greater than twenty per cent above historical baseline trend.
Water Surface water Minimal contamination or change with no significant loss of quality.
Local minor short term reduction or change in water quality. Local contamination or change that can be immediately remediated.
Local minor long term or widespread minor short term or local major short term reduction or change in water quality. Local contamination or change that can be remediated in long term.
Widespread (regional) major short term reduction or change in water quality. Local contamination or change that cannot be remediated in long term. Widespread contamination or change that can be remediated.
Regional long term reduction or change in water quality. Widespread contamination or change that cannot be immediately remediated.
Water Groundwater Negligible change to groundwater regime, quality and availability.
Changes to groundwater regime, quality and availability but no significant implications.
Changes to groundwater regime, quality and availability with minor groundwater implications for a localised area.
Groundwater regime, quality or availability significantly compromised.
Widespread groundwater resource depletion, contamination or subsidence.

GHD | Report for Arafura Resources Limited - Nolans Project, 43/22301
Table A2 Likelihood Description
Likelihood Rare Unlikely Moderate Likely Almost Certain Description The event may
occur only in exceptional circumstances. This event is not expected to occur except under exceptional circumstances (up to once every 100 projects of this nature).
The event could occur but is improbable. This event could occur up to once every 10-100 projects of this nature.
The event could occur but not expected. This event could occur up to once every 10 projects of this nature.
The event will probably occur in most circumstances. This event could occur up to once during a project of this nature.
The event is expected to occur in most circumstances. This event could occur at least once during a project of this nature.
Chance of Occurring (%) 0 - 1% 2 - 10% 11 - 50% 51 - 90% > 91%
Table A3 Risk Matrix
Consequence
Insignificant Minor Moderate Major Catastrophic
Like
lihoo
d
Almost Certain Medium High High Extreme Extreme
Likely Medium Medium High High Extreme
Possible Low Medium Medium High High
Unlikely Low Low Medium Medium High
Rare Low Low Low Medium Medium
GHD
Level 5, 66 Smith Street Darwin NT 0800 GPO Box 351 Darwin NT 0801 T: (08) 8982 0100 F: (08) 8981 1075 E: [email protected]
© GHD 2016
This document is and shall remain the property of GHD. The document may only be used for the purpose for which it was commissioned and in accordance with the Terms of Engagement for the commission. Unauthorised use of this document in any form whatsoever is prohibited. G:\43\22301\WP\36870.docx
Document Status
Revision Author Reviewer Approved for Issue Name Signature Name Signature Date
Rev.0 B Cook A Koscielski N Conroy N Conroy 30/03/16

www.ghd.com