APPENDIX 2 Hazard Study (SMEC), Geotehcnical Hazards (SMEC) · 2014-07-25 · Shoalhaven Coastal...
55
APPENDIX 2 Hazard Study (SMEC), Geotehcnical Hazards (SMEC)
Transcript of APPENDIX 2 Hazard Study (SMEC), Geotehcnical Hazards (SMEC) · 2014-07-25 · Shoalhaven Coastal...
APPENDIX 2
Hazard Study (SMEC), Geotehcnical Hazards (SMEC)

Shoalhaven Coastal Zone Management Plan: Coastal Hazard Study Summary Report July 2009 1
Document / Report Control Form
Project Name: Shoalhaven Coastal Zone Management Plan
Project number: 3001209
Report for: Shoalhaven City Council
PREPARATION, REVIEW AND AUTHORISATION
Revision # Date Prepared by Reviewed by Approved for Issue by
1 19/12/07 C. Adamantidis A. Deen A. Deen
2 12/05/09 C. Adamantidis
M. Glatz
C. Adamantidis A. Deen
3 20/07/09 C. Adamantidis
M. Glatz
C. Adamantidis A. Deen
Issue Register
Distribution List Date Issued Number of Copies
Shoalhaven City Council
SMEC staff:
Associates:
Sydney Office Library:
Proposal Project File:
Company details
SMEC Australia
Level 6, 76 Berry Street
NORTH SYDNEY NSW 2060
Tel: +61 2 9925 5555
Fax: +61 2 9925 5566
Email: [email protected]
www.smec.com.au
The information within this document is and shall remain the property of SMEC Australia.
Shoalhaven Coastal Zone Management Plan: Coastal Hazard Study Summary Report July 2009
Shoalhaven Coastal Hazard Study – Summary Report
FOREWORD
Shoalhaven City Council is preparing a Coastal Zone Management Plan guided by the NSW Government Coastal Policy 1997. This report summarises a series of reports that document technical studies undertaken for this project.
This report has been prepared and issued by SMEC Australia to Shoalhaven City Council (the Client). Information published in this report is available for general release only by permission of SMEC Australia and the Client.
REFERENCE
Adamantidis, C.A., A.F. Nielsen and M. Glatz (2009). “Shoalhaven Coastal Hazard Study – Summary Report”, Report No. 3001209-019 prepared by SMEC Australia for Shoalhaven City Council, May 2009.
Shoalhaven Coastal Zone Management Plan: Coastal Hazard Study Summary Report July 2009
Shoalhaven Coastal Hazard Study – Summary Report
Table of Contents
1 Introduction ...................................... ......................................................... 7
1.1 Beach Descriptions .................................................................................................... 8
2 Coastal Processes ................................. ................................................. 11
2.1 Introduction .............................................................................................................. 11
2.2 Short Term Coastal Erosion .................................................................................... 11
2.3 Longer Term Beach Changes and Shoreline Recession ........................................ 12
2.4 Coastal Inundation ................................................................................................... 14
2.5 Hydrodynamic Forcing ............................................................................................. 14
3 Coastal Hazard Assessment ......................... ......................................... 17
3.1 Introduction .............................................................................................................. 17
3.2 Short Term Beach Fluctuations ............................................................................... 17
3.3 Long Term Recession .............................................................................................. 19
3.4 Inundation ................................................................................................................ 20
3.5 Wind-driven Dune Instability Hazard ....................................................................... 22
4 Hazard Mapping and Risk Assessment ................ ................................ 23
4.1 Hazard Mapping ...................................................................................................... 23
4.2 Risk Assessment ..................................................................................................... 23
5 Summary, Conclusions and Recommendations........... ....................... 29
5.1 Summary and Conclusions ...................................................................................... 29
5.2 Recommendations ................................................................................................... 29
6 References ........................................ ...................................................... 33
Shoalhaven Coastal Zone Management Plan: Coastal Hazard Study Summary Report July 2009 2
List of Figures
1.1 Collers Beach
1.2 Mollymook Beach
1.3 Narrawallee Beach
1.4 Collingwood Beach
1.5 Callala Beach
1.6 Currarong Beach
1.7 North Warrain Beach
1.8 Culburra Beach
1.9 Shoalhaven Heads
2.1 Beach definition sketch
2.2 Beach storm erosion/accretion cycle
2.3 Sediment budget schema (NSW Government, 1990)
2.4 Long term erosion schema
2.5 Projected sea level rise between 2000 and 2100
2.6 Change in extreme monthly wind speeds for NSW coast
2.7 Significant wave height exceedance for NSW coast
2.8 Storm wave height duration recurrence
2.9 Combined storm time series at Port Kembla, May-June 1974, March 1978 and May 1978 storm events
2.10 Storm history at central and south coasts of NSW, 1945 – 2000
2.11 Components of elevated water levels on the coast
2.12 Sydney ocean level recurrence
3.1 Dune stability schema
3.2 Determination of equivalent storm erosion volume for 1974 storm event
3.3 Concept of shoreline recession due to sea level rise
Shoalhaven Coastal Zone Management Plan: Coastal Hazard Study Summary Report July 2009
List of Tables
3.1 Design Storm erosion demand at various beaches in the Shoalhaven
3.2 Design Creek Entrance Instability Hazard at various beaches in the Shoalhaven
3.3 Measured long term rate of beach change at various beaches in the Shoalhaven
3.4 Predicted Future Beach Erosion and Recession due to Sea Level Rise at the beaches of the Shoalhaven
3.5 Wave Runup levels for Shoalhaven beaches, 0.1% AEP storm event
Shoalhaven Coastal Zone Management Plan: Coastal Hazard Study Summary Report July 2009
Glossary
Accretion The accumulation of (beach) sediment, deposited by natural fluid flow processes.
ACES A computer program, developed by the US Army Corps of Engineers, that is used to determine, among other things, levels of wave runup on natural beaches.
Aeolian Adjective referring to wind-borne processes.
Astronomical tide The tidal levels and character which would result from gravitational effects, e.g. of the Earth, Sun and Moon, without any atmospheric influences.
Backshore (1) The upper part of the active beach above the normal reach of the tides (high water), but affected by large waves occurring during a high.
(2) The accretion or erosion zone, located landward of ordinary high tide, which is normally wetted only by storm tides.
Bar An offshore ridge or mound of sand, gravel, or other unconsolidated material which is submerged (at least at high tide), especially at the mouth of a river or estuary, or lying parallel to, and a short distance from, the beach.
Bathymetry The measurement of depths of water in oceans, seas and lakes; also the information derived from such measurements.
Beach profile A cross-section taken perpendicular to a given beach contour; the profile may include the face of a dune or sea wall, extend over the backshore, across the foreshore, and seaward underwater into the nearshore zone.
Berm A nearly horizontal plateau on the beach face or backshore.
Breaker zone The zone within which waves approaching the coastline commence breaking, typically in water depths of around 2 m to 3 m in fair weather and around 5 m to 10 m during storms
Breaking depth The still-water depth at the point where the wave breaks.
Chart datum The plane or level to which soundings, tidal levels or water depths are referenced, usually low water datum.
Coastal processes Collective term covering the action of natural forces on the shoreline, and the nearshore seabed.
Datum Any position or element in relation to which others are determined, as datum point, datum line, datum plane.
Deep water In regard to waves, where depth is greater than one-half the wave length. Deep-water conditions are said to exist when the surf waves are not affected by conditions on the bottom, typically in water depths of around 60 m to 100 m.
Dunes Accumulations of wind-blown sand on the backshore, usually in the form of small hills or ridges, stabilised by vegetation or control structures.
Dynamic equilibrium
Short term morphological changes that do not affect the morphology over a long period.
Ebb tide A non-technical term used for falling tide or ebb current. The portion of the tidal cycle between high water and the following low water.
Elevation The distance of a point above a specified surface of constant potential; the distance is measured along the direction of gravity between the point and the surface.
Erosion On a beach, the carrying away of beach material by wave action, tidal currents or by deflation.
Flood tide A non-technical term used for rising tide or flood current. In technical language, flood refers to current. The portion of the tidal cycle between low water and the following high water.
Geomorphology That branch of physical geography that deals with the form of the Earth, the general configuration of its surface, the distribution of the land, water, etc.
High water (HW) Maximum height reached by a rising tide. The height may be solely due to the periodic tidal forces or it may have superimposed upon it the effects of prevailing meteorological conditions. Nontechnically, also called the high tide.
ICOLL An acronym for Intermittently Closed or Open Lake or Lagoon
Shoalhaven Coastal Zone Management Plan: Coastal Hazard Study Summary Report July 2009
Inshore (1) The region where waves are transformed by interaction with the sea bed.
(2) In beach terminology, the zone of variable width extending from the low water line through the breaker zone.
Inshore current Any current inside the surf zone.
Inter-tidal The zone between the high and low water marks.
Littoral (1) Of, or pertaining to, a shore, especially a seashore.
(2) Living on, or occurring on, the shore.
Littoral currents A current running parallel to the beach, generally caused by waves striking the shore at an angle.
Littoral drift The material moved parallel to the shoreline in the nearshore zone by waves and currents.
Littoral transport The movement of littoral drift in the littoral zone by waves and currents. Includes movement both parallel (long shore drift) and perpendicular (cross-shore transport) to the shore.
Longshore Parallel and close to the coastline.
Longshore drift Movement of sediments approximately parallel to the coastline.
Low water (LW) The minimum height reached by each falling tide. Non-technically, also called low tide.
Mean high water (MHW)
The average elevation of all high waters recorded at a particular point or station over a considerable period of time, usually 19 years. For shorter periods of observation, corrections are applied to eliminate known variations and reduce the result to the equivalent of a mean 19-year value. All high water heights are included in the average where the type of tide is either semidiurnal or mixed. Only the higher high water heights are included in the average where the type of tide is diurnal. So determined, mean high water in the latter case is the same as mean higher high water.
Mean high water springs (MHWS)
The average height of the high water occurring at the time of spring tides.
Mean low water (MLW)
The average height of the low waters over a 19-year period. For shorter periods of observation, corrections are applied to eliminate known variations and reduce the result to the equivalent of a mean 19-year value.
Mean low water springs (MLWS)
The average height of the low waters occurring at the time of the spring tides.
Mean sea level The average height of the surface of the sea for all stages of the tide over a 19-year period, usually determined from hourly height readings.
Morphology The form of a river/estuary/lake/seabed and its change with time.
Nearshore In beach terminology, an indefinite zone extending seaward from the shoreline well beyond the breaker zone.
Nearshore circulation
The ocean circulation pattern composed of the nearshore currents and the coastal currents.
Nearshore current The current system caused by wave action in and near the breaker zone, and which consists of four parts: the shoreward mass transport of water; longshore currents; rip currents; and the longshore movement of the expanding heads of rip currents.
Refraction The process by which the direction of a wave moving in shallow water at an angle to the bottom contours is changed. The part of the wave moving shoreward in shallower water travels more slowly than that portion in deeper water, causing the wave to turn or bend to become parallel to the contours.
Rip current A strong current flowing seaward from the shore. It is the return of water piled up against the shore as a result of incoming waves. A rip current consists of three parts: the feeder current flowing parallel to the shore inside the breakers; the neck, where the feeder currents converge and flow through the breakers in a narrow band or "rip"; and the head, where the current widens and slackens outside the breaker line.
Runup The rush of water up a structure or beach on the breaking of a wave. The amount of run-up is the vertical height above still water level that the rush of water reaches. It includes wave setup.

Shoalhaven Coastal Zone Management Plan: Coastal Hazard Study Summary Report July 2009
SBEACH A computer program, developed by the US Army Corps of Engineers, that is used to determine, among other things, wave transformation across the surf zone, beach and dune erosion and levels of wave runup on natural beaches.
Setup Wave setup is the elevation of the nearshore still water level resulting from breaking waves and may be perceived as the conversion of the wave’s kinetic energy to potential energy.
Shoal (1) (noun) A detached area of any material except rock or coral. The depths over it are a danger to surface navigation.
(2) (verb) To become shallow gradually.
Shore That strip of ground bordering any body of water which is alternately exposed, or covered by tides and/or waves. A shore of unconsolidated material is usually called a beach.
Shoreface The narrow zone seaward from the low tide shoreline permanently covered by water, over which the beach sands and GRAVELS actively oscillate with changing wave conditions.
Shoreline The intersection of a specified plane of water with the shore.
Significant wave A statistical term relating to the one-third highest waves of a given wave group and defined by the average of their heights and periods.
Significant wave height
Average height of the highest one-third of the waves for a stated interval of time.
Spring tide A tide that occurs at or near the time of new or full moon, and which rises highest and falls lowest from the mean sea level (MSL).
Storm surge A rise or piling-up of water against shore, produced by strong winds blowing onshore. A storm surge is most severe when it occurs in conjunction with a high tide.
Sub-aerial beach That part of the beach which is uncovered by water (e.g. at low tide sometimes referred to as drying beach).
Surf zone The nearshore zone along which the waves become breakers as they approach the shore.
Swell Waves that have traveled a long distance from their generating area and have been sorted out by travel into long waves of the same approximate period.
Tide The periodic rising and falling of the water that results from gravitational attraction of the moon and sun acting upon the rotating earth. Although the accompanying horizontal movement of the water resulting from the same cause is also sometimes called the tide, it is preferable to designate the latter as tidal current, reserving the name tide for the vertical movement.
Shoalhaven Coastal Zone Management Plan: Coastal Hazard Study Summary Report July 2009 7
1 Introduction
The Shoalhaven City coastline extends some 165 km south from Shoalhaven Heads to North Durras. The coastline is subject to a high energy wave climate and, in some areas, the coastal processes threaten foreshore assets and the recreational amenity of the beaches. Council has undertaken a preliminary coastal hazard assessment using conservative parameters to identify the urban areas that warrant a more detailed assessment. Among these, Council identified the following beaches as warranting more detailed studies:
• Collers Beach
• Mollymook Beach
• Narrawallee Beach
• Collingwood Beach
• Callala Beach
• Currarong
• Warrain Beach
• Culburra Beach
• Shoalhaven Heads
Several areas have also been identified as requiring geotechnical assessment – these are the subject of a separate report.
The location of urban development on the frontal dune at some of these areas and its proximity to the beachfront has raised questions as to the degree of coastal hazard risk. Currently at most beaches within the Shoalhaven individual development applications have been dealt with on a case by case basis. This has led to a piecemeal approach to the assessment and management of coastal hazards.
This report summarises the detailed coastal hazard assessments undertaken for the above beaches, which have been undertaken using photogrammetric data analysis and analytical assessments. It describes the coastal processes affecting the beaches and the impact of these processes on the areas where property is at risk. The assessments quantify the observed long-term beach changes, as well as estimating the beach recession that may be caused by sea-level rise as a result of climate change. The risk to property is defined in terms of the present day risk, the risk by 2025, the risk by 2050 and the risk by 2100.
In addition to this summary report, detailed hazard study reports have been produced for each location.
A brief description of each beach and some of the particular issues of concern at these beaches is provided below.
Shoalhaven Coastal Zone Management Plan: Coastal Hazard Study Summary Report July 2009
1.1 Beach Descriptions
1.1.1 Collers Beach
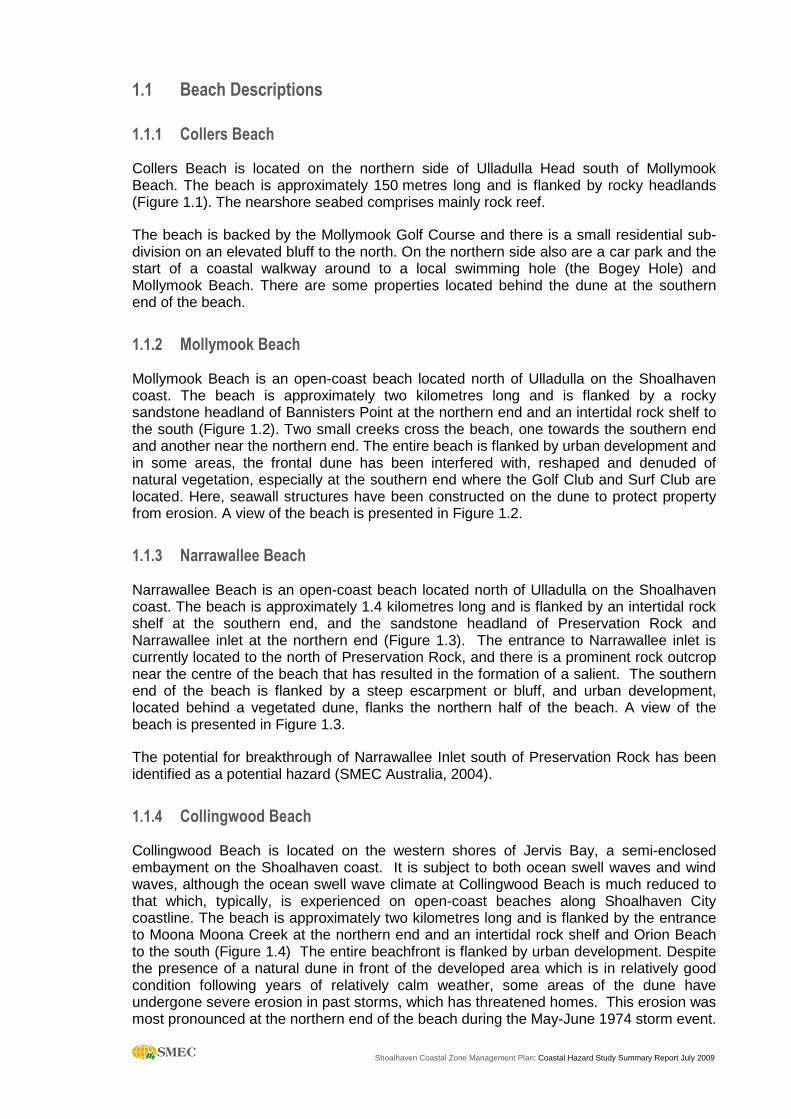
Collers Beach is located on the northern side of Ulladulla Head south of Mollymook Beach. The beach is approximately 150 metres long and is flanked by rocky headlands (Figure 1.1). The nearshore seabed comprises mainly rock reef.
The beach is backed by the Mollymook Golf Course and there is a small residential sub-division on an elevated bluff to the north. On the northern side also are a car park and the start of a coastal walkway around to a local swimming hole (the Bogey Hole) and Mollymook Beach. There are some properties located behind the dune at the southern end of the beach.
1.1.2 Mollymook Beach
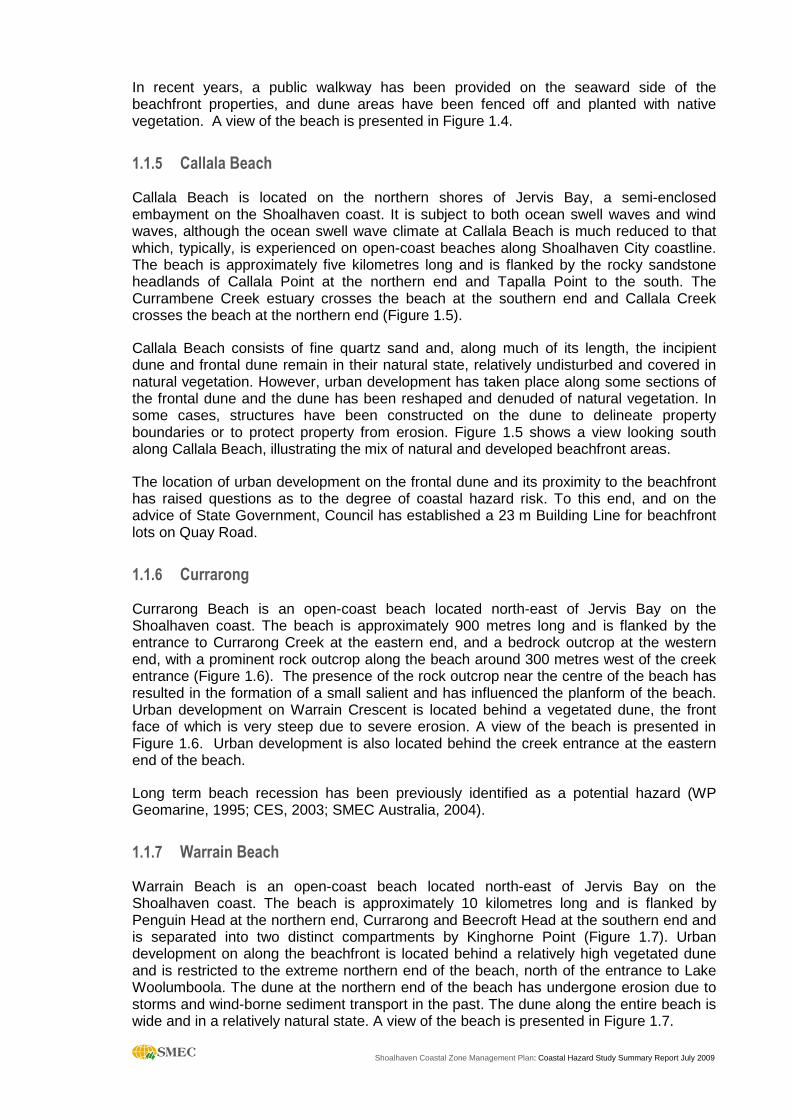
Mollymook Beach is an open-coast beach located north of Ulladulla on the Shoalhaven coast. The beach is approximately two kilometres long and is flanked by a rocky sandstone headland of Bannisters Point at the northern end and an intertidal rock shelf to the south (Figure 1.2). Two small creeks cross the beach, one towards the southern end and another near the northern end. The entire beach is flanked by urban development and in some areas, the frontal dune has been interfered with, reshaped and denuded of natural vegetation, especially at the southern end where the Golf Club and Surf Club are located. Here, seawall structures have been constructed on the dune to protect property from erosion. A view of the beach is presented in Figure 1.2.
1.1.3 Narrawallee Beach
Narrawallee Beach is an open-coast beach located north of Ulladulla on the Shoalhaven coast. The beach is approximately 1.4 kilometres long and is flanked by an intertidal rock shelf at the southern end, and the sandstone headland of Preservation Rock and Narrawallee inlet at the northern end (Figure 1.3). The entrance to Narrawallee inlet is currently located to the north of Preservation Rock, and there is a prominent rock outcrop near the centre of the beach that has resulted in the formation of a salient. The southern end of the beach is flanked by a steep escarpment or bluff, and urban development, located behind a vegetated dune, flanks the northern half of the beach. A view of the beach is presented in Figure 1.3.
The potential for breakthrough of Narrawallee Inlet south of Preservation Rock has been identified as a potential hazard (SMEC Australia, 2004).
1.1.4 Collingwood Beach
Collingwood Beach is located on the western shores of Jervis Bay, a semi-enclosed embayment on the Shoalhaven coast. It is subject to both ocean swell waves and wind waves, although the ocean swell wave climate at Collingwood Beach is much reduced to that which, typically, is experienced on open-coast beaches along Shoalhaven City coastline. The beach is approximately two kilometres long and is flanked by the entrance to Moona Moona Creek at the northern end and an intertidal rock shelf and Orion Beach to the south (Figure 1.4) The entire beachfront is flanked by urban development. Despite the presence of a natural dune in front of the developed area which is in relatively good condition following years of relatively calm weather, some areas of the dune have undergone severe erosion in past storms, which has threatened homes. This erosion was most pronounced at the northern end of the beach during the May-June 1974 storm event.
Shoalhaven Coastal Zone Management Plan: Coastal Hazard Study Summary Report July 2009
In recent years, a public walkway has been provided on the seaward side of the beachfront properties, and dune areas have been fenced off and planted with native vegetation. A view of the beach is presented in Figure 1.4.
1.1.5 Callala Beach
Callala Beach is located on the northern shores of Jervis Bay, a semi-enclosed embayment on the Shoalhaven coast. It is subject to both ocean swell waves and wind waves, although the ocean swell wave climate at Callala Beach is much reduced to that which, typically, is experienced on open-coast beaches along Shoalhaven City coastline. The beach is approximately five kilometres long and is flanked by the rocky sandstone headlands of Callala Point at the northern end and Tapalla Point to the south. The Currambene Creek estuary crosses the beach at the southern end and Callala Creek crosses the beach at the northern end (Figure 1.5).
Callala Beach consists of fine quartz sand and, along much of its length, the incipient dune and frontal dune remain in their natural state, relatively undisturbed and covered in natural vegetation. However, urban development has taken place along some sections of the frontal dune and the dune has been reshaped and denuded of natural vegetation. In some cases, structures have been constructed on the dune to delineate property boundaries or to protect property from erosion. Figure 1.5 shows a view looking south along Callala Beach, illustrating the mix of natural and developed beachfront areas.
The location of urban development on the frontal dune and its proximity to the beachfront has raised questions as to the degree of coastal hazard risk. To this end, and on the advice of State Government, Council has established a 23 m Building Line for beachfront lots on Quay Road.
1.1.6 Currarong
Currarong Beach is an open-coast beach located north-east of Jervis Bay on the Shoalhaven coast. The beach is approximately 900 metres long and is flanked by the entrance to Currarong Creek at the eastern end, and a bedrock outcrop at the western end, with a prominent rock outcrop along the beach around 300 metres west of the creek entrance (Figure 1.6). The presence of the rock outcrop near the centre of the beach has resulted in the formation of a small salient and has influenced the planform of the beach. Urban development on Warrain Crescent is located behind a vegetated dune, the front face of which is very steep due to severe erosion. A view of the beach is presented in Figure 1.6. Urban development is also located behind the creek entrance at the eastern end of the beach.
Long term beach recession has been previously identified as a potential hazard (WP Geomarine, 1995; CES, 2003; SMEC Australia, 2004).
1.1.7 Warrain Beach
Warrain Beach is an open-coast beach located north-east of Jervis Bay on the Shoalhaven coast. The beach is approximately 10 kilometres long and is flanked by Penguin Head at the northern end, Currarong and Beecroft Head at the southern end and is separated into two distinct compartments by Kinghorne Point (Figure 1.7). Urban development on along the beachfront is located behind a relatively high vegetated dune and is restricted to the extreme northern end of the beach, north of the entrance to Lake Woolumboola. The dune at the northern end of the beach has undergone erosion due to storms and wind-borne sediment transport in the past. The dune along the entire beach is wide and in a relatively natural state. A view of the beach is presented in Figure 1.7.
Shoalhaven Coastal Zone Management Plan: Coastal Hazard Study Summary Report July 2009
1.1.8 Culburra
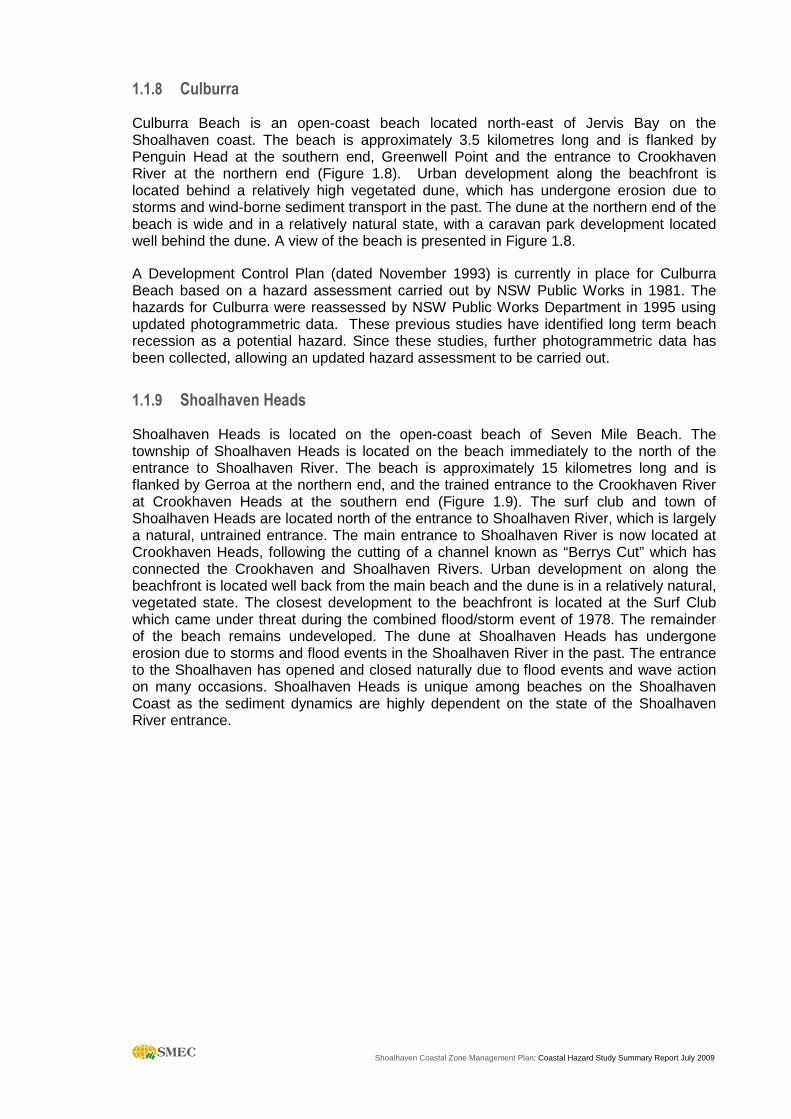
Culburra Beach is an open-coast beach located north-east of Jervis Bay on the Shoalhaven coast. The beach is approximately 3.5 kilometres long and is flanked by Penguin Head at the southern end, Greenwell Point and the entrance to Crookhaven River at the northern end (Figure 1.8). Urban development along the beachfront is located behind a relatively high vegetated dune, which has undergone erosion due to storms and wind-borne sediment transport in the past. The dune at the northern end of the beach is wide and in a relatively natural state, with a caravan park development located well behind the dune. A view of the beach is presented in Figure 1.8.
A Development Control Plan (dated November 1993) is currently in place for Culburra Beach based on a hazard assessment carried out by NSW Public Works in 1981. The hazards for Culburra were reassessed by NSW Public Works Department in 1995 using updated photogrammetric data. These previous studies have identified long term beach recession as a potential hazard. Since these studies, further photogrammetric data has been collected, allowing an updated hazard assessment to be carried out.
1.1.9 Shoalhaven Heads
Shoalhaven Heads is located on the open-coast beach of Seven Mile Beach. The township of Shoalhaven Heads is located on the beach immediately to the north of the entrance to Shoalhaven River. The beach is approximately 15 kilometres long and is flanked by Gerroa at the northern end, and the trained entrance to the Crookhaven River at Crookhaven Heads at the southern end (Figure 1.9). The surf club and town of Shoalhaven Heads are located north of the entrance to Shoalhaven River, which is largely a natural, untrained entrance. The main entrance to Shoalhaven River is now located at Crookhaven Heads, following the cutting of a channel known as “Berrys Cut” which has connected the Crookhaven and Shoalhaven Rivers. Urban development on along the beachfront is located well back from the main beach and the dune is in a relatively natural, vegetated state. The closest development to the beachfront is located at the Surf Club which came under threat during the combined flood/storm event of 1978. The remainder of the beach remains undeveloped. The dune at Shoalhaven Heads has undergone erosion due to storms and flood events in the Shoalhaven River in the past. The entrance to the Shoalhaven has opened and closed naturally due to flood events and wave action on many occasions. Shoalhaven Heads is unique among beaches on the Shoalhaven Coast as the sediment dynamics are highly dependent on the state of the Shoalhaven River entrance.
Shoalhaven Coastal Zone Management Plan: Coastal Hazard Study Summary Report July 2009 11
2 Coastal Processes
2.1 Introduction
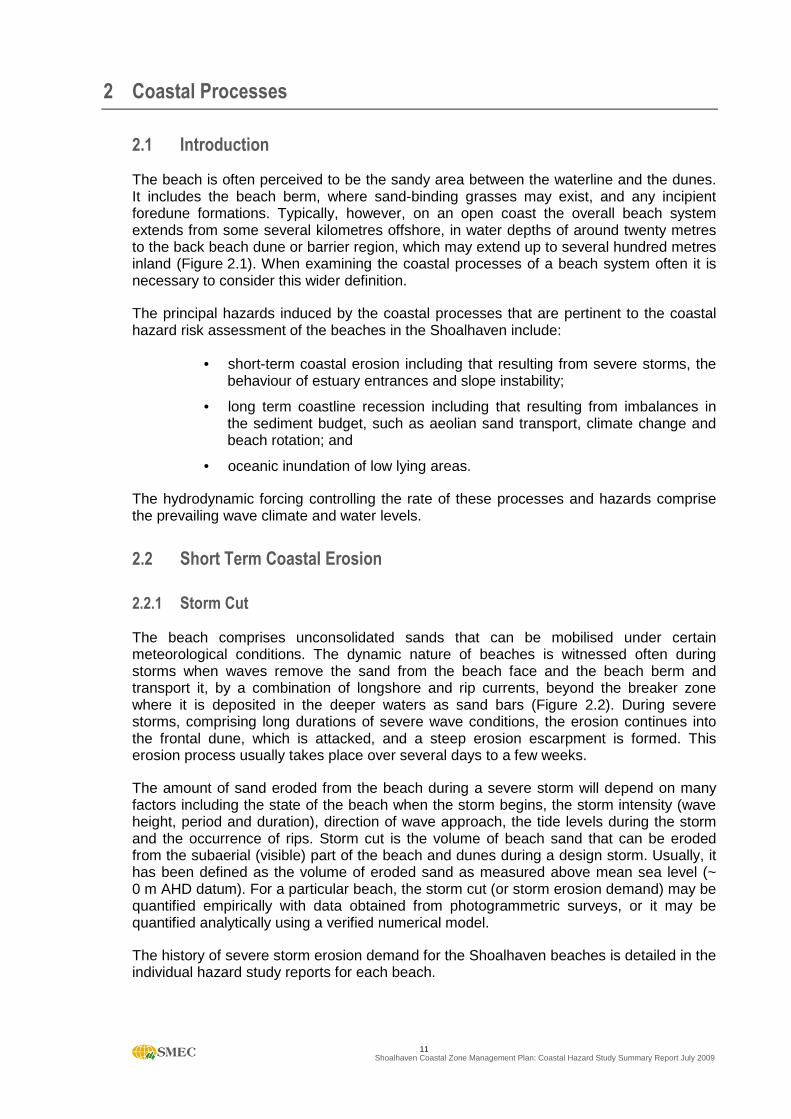
The beach is often perceived to be the sandy area between the waterline and the dunes. It includes the beach berm, where sand-binding grasses may exist, and any incipient foredune formations. Typically, however, on an open coast the overall beach system extends from some several kilometres offshore, in water depths of around twenty metres to the back beach dune or barrier region, which may extend up to several hundred metres inland (Figure 2.1). When examining the coastal processes of a beach system often it is necessary to consider this wider definition.
The principal hazards induced by the coastal processes that are pertinent to the coastal hazard risk assessment of the beaches in the Shoalhaven include:
• short-term coastal erosion including that resulting from severe storms, the behaviour of estuary entrances and slope instability;
• long term coastline recession including that resulting from imbalances in the sediment budget, such as aeolian sand transport, climate change and beach rotation; and
• oceanic inundation of low lying areas.
The hydrodynamic forcing controlling the rate of these processes and hazards comprise the prevailing wave climate and water levels.
2.2 Short Term Coastal Erosion
2.2.1 Storm Cut
The beach comprises unconsolidated sands that can be mobilised under certain meteorological conditions. The dynamic nature of beaches is witnessed often during storms when waves remove the sand from the beach face and the beach berm and transport it, by a combination of longshore and rip currents, beyond the breaker zone where it is deposited in the deeper waters as sand bars (Figure 2.2). During severe storms, comprising long durations of severe wave conditions, the erosion continues into the frontal dune, which is attacked, and a steep erosion escarpment is formed. This erosion process usually takes place over several days to a few weeks.
The amount of sand eroded from the beach during a severe storm will depend on many factors including the state of the beach when the storm begins, the storm intensity (wave height, period and duration), direction of wave approach, the tide levels during the storm and the occurrence of rips. Storm cut is the volume of beach sand that can be eroded from the subaerial (visible) part of the beach and dunes during a design storm. Usually, it has been defined as the volume of eroded sand as measured above mean sea level (~ 0 m AHD datum). For a particular beach, the storm cut (or storm erosion demand) may be quantified empirically with data obtained from photogrammetric surveys, or it may be quantified analytically using a verified numerical model.
The history of severe storm erosion demand for the Shoalhaven beaches is detailed in the individual hazard study reports for each beach.
Shoalhaven Coastal Zone Management Plan: Coastal Hazard Study Summary Report July 2009
2.2.2 Slope Instability
Following storm cut the dune face dries out and may slump. This results from the dune sediments losing their apparent cohesive properties that come from the negative pore pressures induced by the water in the soil mass. This subsequent slumping of the dune face causes further dune recession.
Dune slumping is treated as a slope instability hazard and can be quantified with stability computations, which can serve as a guide to determining safe setback distances on frontal dunes that are prone to wave attack and slumping during storms.
2.2.3 Behaviour of Estuary Entrances
Various coastal hazards can be created by both trained and natural estuary entrances. Natural entrances tend to migrate along the beach in response to freshwater flooding and coastal storm effects (NSW Government, 1990).
This phenomenon has been seen at some of the beaches in the Shoalhaven. For example, at Mollymook, the creek entrance location migrated in response to the severe coastal storms of May 1974, and the estuary entrance towards the southern end of the beach experienced entrance breakthrough following the severe storms of May 1974. As a result, the entrance which formerly took a more northerly course has since been filled by longshore drift, and a dune has formed at the former location of the creek entrance. This dune has been stable, and has been accreting ever since the 1974 storm.
However, a major flood or future storm event could cause breakthrough at unexpected locations. This could lead to the destruction of the dune that has formed to the north of the creek entrance, and render the development behind this existing dune vulnerable to future storms by reducing the available sand store. An extreme case of this phenomenon was observed when breakthrough and wave runup on a spit of the North Arm of the Brunswick River virtually destroyed the village of Sheltering Palms (NSW Government, 1990).
The hazard due to creek entrance instability has been quantified in detail in the hazard study reports undertaken for each beach.
2.3 Longer Term Beach Changes and Shoreline Recession
Following storms, ocean swell replaces the sand from the offshore bars onto the beach face where onshore winds move it back onto the frontal dune. This beach building phase, typically, may span many months to several years. Following the build-up of the beach berm and the incipient foredunes, and the re-growth of the sand trapping grasses, it can appear that the beach has fully recovered and beach erosion has been offset by beach building (Figure 2.2).
However, in some instances, not all of the sand removed from the berm and dunes is replaced during the beach building phase. Sand can be lost to sinks, resulting in longer term ongoing recession of the shoreline. Further, over decadal time scales, changes in wave climate can result in beach rotation.
2.3.1 Sediment Budget Deficit
Once the sand has been transported offshore into the surf zone, it may be moved alongshore under the action of the waves and currents and out of the beach compartment. Some of the sand that is transported directly offshore during storms may become trapped in offshore reefs, thereby preventing its return to the beach. Other direct losses of material
Shoalhaven Coastal Zone Management Plan: Coastal Hazard Study Summary Report July 2009
from the beach may include the inland transport of sand under the action of onshore winds; this mechanism being called aeolian sand transport. Over the longer term, should the amount of sand taken out of the compartment by alongshore processes exceed that moved into the compartment from adjacent beaches or other sources, then there will be a direct and permanent loss of material from the beach and a deficit in the sediment budget for the beach (Figure 2.3). This will result in an increasing potential for dune erosion during storms and long term beach recession (Figure 2.4).
Obvious process that may lead to a deficit in the sediment budget of a beach include wind blown sand off the beach (aeolian sand transport causing transgressive dune migration), mining the beach for heavy minerals and beach sand extraction operations. Other processes, which are not so obvious because they occur underwater, include the deposition of littoral drift into estuaries and the transport of quantities of littoral drift alongshore and out of a beach compartment, which may be larger than any inputs.
The quantification of sediment budgets for coastal compartments is exceedingly difficult. The usual practice is to identify the processes and to quantify the resulting beach recession using photogrammetric techniques. Long term rates of shoreline recession have been quantified for the Shoalhaven beaches using photogrammetric techniques. This quantification is detailed in the individual hazard study reports for each beach.
2.3.2 Beach Rotation
Studies of embayed beaches on the NSW coast have identified a sensitivity of shoreline alignment to wave direction (Short et al., 2000). This has been linked to the Southern Oscillation Index (SOI; Ranasinghe et al., 2004; Goodwin, 2005), which is a number calculated from the monthly or seasonal fluctuations in the air pressure difference between Tahiti and Darwin.
Sustained negative values of the SOI usually are accompanied by sustained warming of the central and eastern tropical Pacific Ocean, a decrease in the strength of the Pacific Trade Winds and a reduction in rainfall over eastern and northern Australia. This is called an El Niño episode. During these episodes, a more benign easterly wave condition is expected on the NSW coast.
Positive values of the SOI are associated with stronger Pacific trade winds and warmer sea temperatures to the north of Australia, popularly known as a La Niña episode. Waters in the central and eastern tropical Pacific Ocean become cooler during this time. Together, these give an increased probability that eastern and northern Australia will be wetter than normal and, during these episodes, severe storms may be expected on the Australian Eastern seaboard.
The extent of beach rotation is quantified in the individual hazard study reports for each beach.
2.3.3 Enhanced Greenhouse Effect
Another factor that may affect the long-term trends on beaches is a rise in sea level resulting from the Greenhouse Effect. A rising sea level may result in beach recession on a natural beach and an increased potential for dune erosion on a developed beach where the dune line may be being held against erosion by a seawall.
In the longer term, there may be global changes resulting from a postulated warming of the earth due to the accumulation in the atmosphere of certain gases, in particular carbon dioxide, resulting from the burning of fossil fuels (the Greenhouse Effect). The current consensus of scientific opinion is that such changes could result in global warming of 1.5°

Shoalhaven Coastal Zone Management Plan: Coastal Hazard Study Summary Report July 2009
to 4.5°C over the next 100 years. Such a warming could lead to a number of changes in climate, weather and sea levels. These, in turn, could cause significant changes to coastal alignments and erosion.
Global warming may produce also a worldwide sea level rise caused by the thermal expansion of the ocean waters and the melting of some ice caps. According to the U.S. National Research Council, global mean sea level is projected to rise by 0.1 m to 0.9 m by 2100 (Figure 2.5.a). Mid-range scenarios postulate sea level rises by around 0.15 m by 2050 and 0.48 m by 2100 (IPCC, 2001).
The IPCC were unable to exclude larger values and there is emerging evidence in the current measurements and observations, suggesting the IPCC’s 2007 report may have underestimated the future rate of sea level rise. Therefore, the NSW Government through the Draft Sea Level Rise Policy Statement have set the NSW Sea Level Rise Planning benchmark at the upper bound levels of a 40 cm increase above 1990 levels by 2050 and 90 cm by 2100 (Figure 2.5.b).
There are no predictions for any increase in winter storm wind speeds and, hence, wave heights for this part of the NSW coast as a result of climate change (Figure 2.6). Foreshore recession resulting from a Greenhouse-induced sea level rise has been assessed at all the beaches using the Bruun Rule.
2.4 Coastal Inundation
An increase in water level at the shoreline results from the breaking action of waves causing what is termed wave setup and wave runup. Wave setup may be perceived as the conversion of part of the wave's kinetic energy into potential energy. The amount of wave setup will depend on many factors including, among other things, the type, size and periods of the waves, the nearshore bathymetry and the slope of the beach and foreshore. Typically, wave setup on an open-coast beach during severe storms can be around 1 m to 2 m.
The energy of a wave is dissipated finally as the water runs up the beach or shoreline. Wave run-up is the vertical distance the wave will reach above the level of the tide and storm surge and can be several metres. Wave run-up at any particular site is very much a function of the wave height and period, the foreshore profile and slope, surface roughness and other shoreline features on which the breaking waves impinge.
Should dune levels be low or the foreshore not protected by dunes, flooding and damage to structures can result from the coincidence of elevated ocean water levels and wave runup.
An assessment of coastal inundation for the beaches of the Shoalhaven has been carried out and details are provided in the individual hazard study reports for each beach.
2.5 Hydrodynamic Forcing
2.5.1 Introduction
Critical to a coastline hazard risk assessment is the definition and quantification of the waves and water levels that shape the beaches.
Shoalhaven Coastal Zone Management Plan: Coastal Hazard Study Summary Report July 2009
2.5.2 Wave Climate and Storms
The Shoalhaven coastline experiences a high wave energy coastline. The offshore swell wave climate (wave height, period and direction occurrences) has been recorded by the NSW Government Manly Hydraulics Laboratory with Waverider buoys located at Sydney, Port Kembla and Batemans Bay for many years. The Waverider buoy located at Sydney has measured also wave direction since 1992.
Summary wave statistics are available from the Manly Hydraulics Laboratory (e.g., as published in Lord and Kulmar, 2000). The wave data show that the predominant swell wave direction is south-southeast (SSE) with over 70% of swell wave occurrences directed from the SSE quadrant. The average deep water significant wave height, as measured at Port Kembla, is around 1.5 m (Figure 2.7) and the average wave period is around 9 s. Analysis of storms recorded at Port Kembla has provided wave height/duration data for various annual recurrence intervals, which are presented in Figure 2.8.
The storms of May-June 1974 caused widespread damage to coastal structures and beaches along the central coast of New South Wales (Foster et al., 1975). These storms were associated with an intense low pressure cell adjacent to the coast south of Sydney. A Waverider buoy in deep water offshore of Port Kembla recorded a wave height history for the event, which extended from 25 May to mid June 1974. Figure 2.9 illustrates the significant wave height time series for the May and June 1974 event as measured at the Port Kembla Waverider buoy. As these storms occurred within a short timeframe of each other, they have been combined and considered as a single storm event. Over this time, the significant offshore wave height reached a peak of 6.4 m 24 hours into the storm, with a second peak of Hs = 6.8 m reached 60 hours into the storm. Figure 2.9 also illustrates the significant wave height time series of the March 1978 and May-June 1978 storm events, for comparison.
It is noted that the May 1974 storm event was coincident with spring tides, with a maximum storm surge measured at Fort Denison of 0.59 m, and a maximum water level of 1.48 m on AHD (Kulmar and Nalty, 1997).
Such storms, which occur along the NSW coastline at irregular intervals, are responsible for episodic events of sand transport and erosion, which are evident when examining photogrammetric data. It is important, therefore, to document the history of storms along the Shoalhaven coastline to ascertain whether the observed beach changes can be related to the specific occurrence of such storms. The aim is to delineate which observed changes are caused by episodic events, such as large coastal storms, and which changes have underlying causes that may be due to long-term cycles, natural fluctuations or are caused by anthropogenic influences.
This study draws upon storm histories developed from synoptic charts, as well as historical data from the NSW Government Waverider buoys, to determine the dates and severity of the extreme storm events that have occurred over the period of the photogrammetry. The individual hazard study reports for each beach provide detail on the analysis of these storms and estimates of the relevant storm parameters.
Figure 2.10 documents the extreme storm events that occurred between 1945 and 2000, with the estimated significant wave heights for these events. This storm event history was compiled from a number of different sources (Blain Bremmer and Williams 1985, Department of Commerce Manly Hydraulics Laboratory 2006, Lawson and Treloar 1986).
Shoalhaven Coastal Zone Management Plan: Coastal Hazard Study Summary Report July 2009
2.5.3 Extreme Water Levels
During storms, the ocean water level and that at the shoreline is elevated above the normal tide level. While these higher levels are infrequent and last only for short periods, they may exacerbate any storm damage on the foreshore. Elevated water levels allow larger waves to cross the offshore sand bars and reefs and break at higher levels on the beach. Further, they may cause flooding of low lying areas and increase tail water control levels for river flood discharges.
The components of these elevated water levels comprise the astronomical tide, barometric water level setup, wind setup, wave setup and runup (Figure 2.11). All of the components do not act or occur necessarily independently of each other but their coincidence and degree of inter-dependence, generally, is not well understood.
The tides of the NSW coast are semidiurnal with a diurnal inequality. This means that there are two high tides and two low tides each day and there is a once-daily inequality in the tidal range. The mean tidal range is around one meter and the tidal period is around 12.5 hours. Tides vary according to the phases of the moon. The higher spring tides occur near and around the time of new or full moon and rise highest and fall lowest from the mean sea level. The average spring tidal range is 1.3 meters and the maximum range reaches two meters. Neap tides occur near the time of the first and third quarters of the moon and have an average range of around 0.8 meters.
Storm surge is the increase in water level above that of the normal tide that results from the low barometric pressures, which are associated with severe storms and cause sea level to rise, and strong onshore winds that pile water up against the coast. Measured values of storm surge at Sydney include 0.59 m for the extreme storm event of 25−26 May 1974 and 0.54 m for the extreme storm event of 31 May − 2 June 1978, which were computed to have recurrence intervals of 77 and 39 years respectively (Haradasa et al., 1991). Both of these extreme events were coincident with spring high tides with the water level in the 1974 event reaching the maximum recorded at Fort Denison of 1.5 m AHD.
Return periods for ocean water levels comprising tidal stage and storm surge for Sydney, which are representative of the study region, are presented in Figure 2.12.
Shoalhaven Coastal Zone Management Plan: Coastal Hazard Study Summary Report July 2009 17
3 Coastal Hazard Assessment
3.1 Introduction
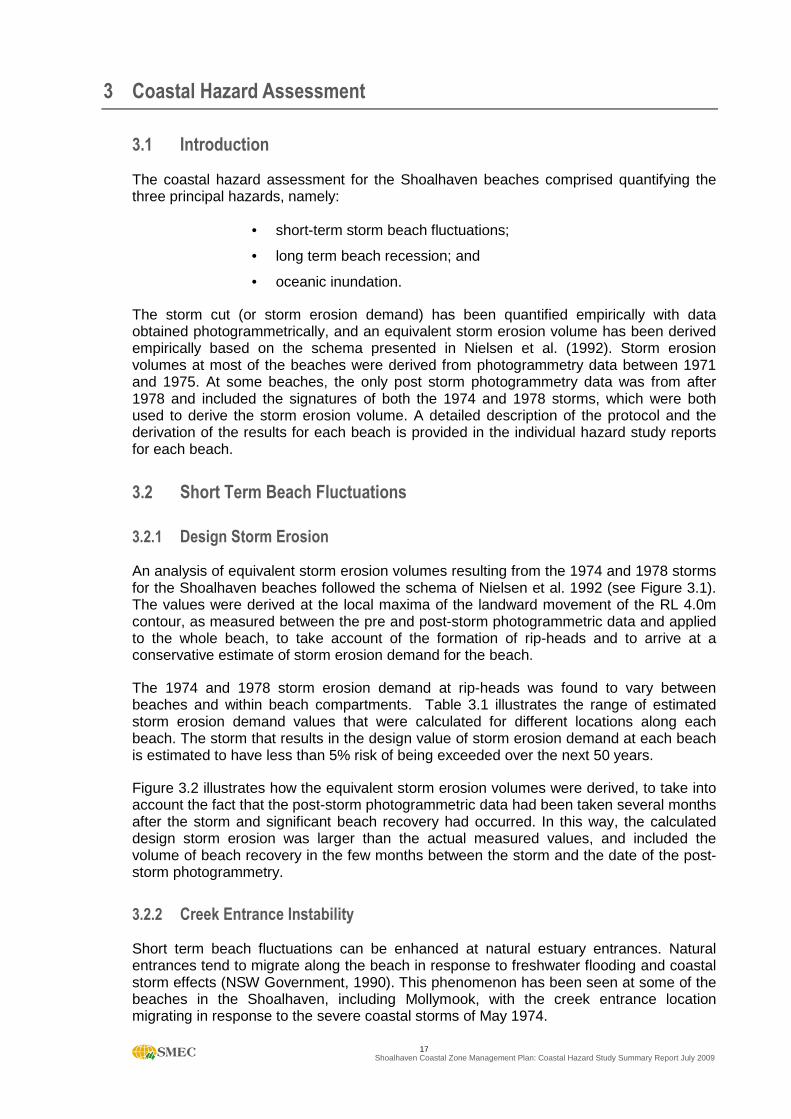
The coastal hazard assessment for the Shoalhaven beaches comprised quantifying the three principal hazards, namely:
• short-term storm beach fluctuations;
• long term beach recession; and
• oceanic inundation.
The storm cut (or storm erosion demand) has been quantified empirically with data obtained photogrammetrically, and an equivalent storm erosion volume has been derived empirically based on the schema presented in Nielsen et al. (1992). Storm erosion volumes at most of the beaches were derived from photogrammetry data between 1971 and 1975. At some beaches, the only post storm photogrammetry data was from after 1978 and included the signatures of both the 1974 and 1978 storms, which were both used to derive the storm erosion volume. A detailed description of the protocol and the derivation of the results for each beach is provided in the individual hazard study reports for each beach.
3.2 Short Term Beach Fluctuations
3.2.1 Design Storm Erosion
An analysis of equivalent storm erosion volumes resulting from the 1974 and 1978 storms for the Shoalhaven beaches followed the schema of Nielsen et al. 1992 (see Figure 3.1). The values were derived at the local maxima of the landward movement of the RL 4.0m contour, as measured between the pre and post-storm photogrammetric data and applied to the whole beach, to take account of the formation of rip-heads and to arrive at a conservative estimate of storm erosion demand for the beach.
The 1974 and 1978 storm erosion demand at rip-heads was found to vary between beaches and within beach compartments. Table 3.1 illustrates the range of estimated storm erosion demand values that were calculated for different locations along each beach. The storm that results in the design value of storm erosion demand at each beach is estimated to have less than 5% risk of being exceeded over the next 50 years.
Figure 3.2 illustrates how the equivalent storm erosion volumes were derived, to take into account the fact that the post-storm photogrammetric data had been taken several months after the storm and significant beach recovery had occurred. In this way, the calculated design storm erosion was larger than the actual measured values, and included the volume of beach recovery in the few months between the storm and the date of the post-storm photogrammetry.
3.2.2 Creek Entrance Instability
Short term beach fluctuations can be enhanced at natural estuary entrances. Natural entrances tend to migrate along the beach in response to freshwater flooding and coastal storm effects (NSW Government, 1990). This phenomenon has been seen at some of the beaches in the Shoalhaven, including Mollymook, with the creek entrance location migrating in response to the severe coastal storms of May 1974.
Shoalhaven Coastal Zone Management Plan: Coastal Hazard Study Summary Report July 2009
A major flood or future storm event could cause breakthrough at unexpected locations. This could lead to the destruction of dunes that have formed in the vicinity of the creek entrances, and render any development behind such dunes vulnerable to future storms by reducing the available sand store. An extreme case of this phenomenon was observed when breakthrough and wave runup on a spit of the North Arm of the Brunswick River virtually destroyed the village of Sheltering Palms (NSW Government, 1990).
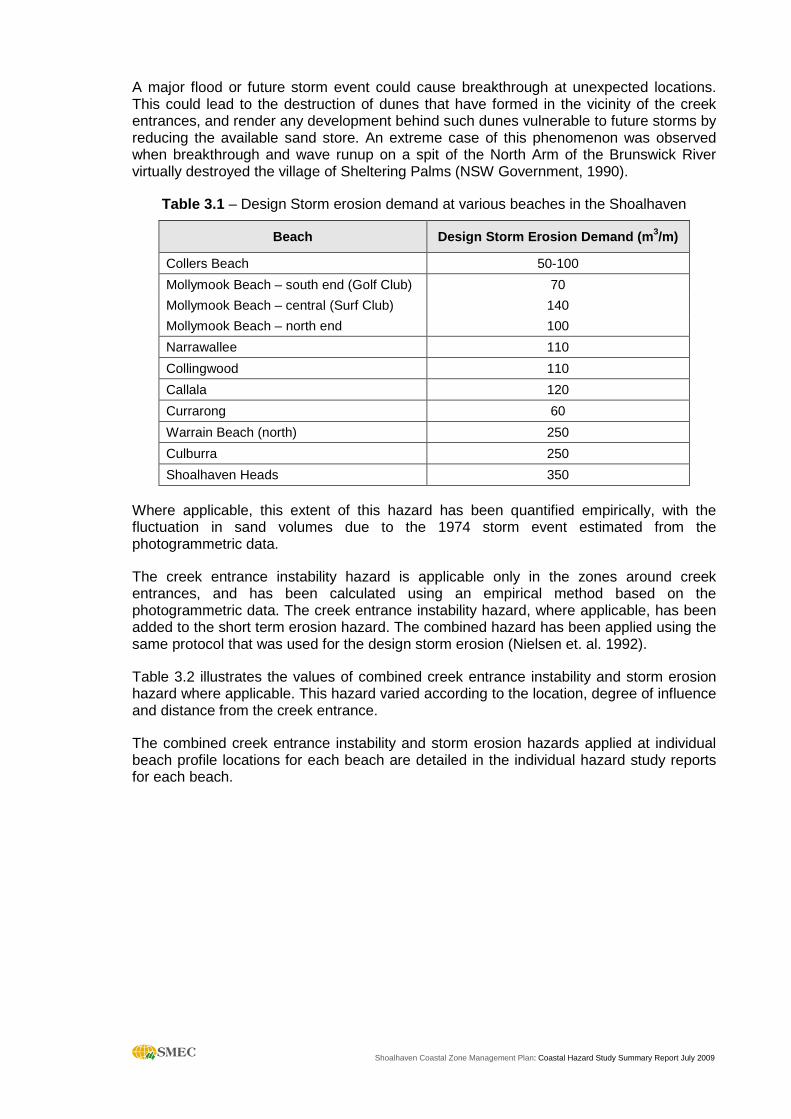
Table 3.1 – Design Storm erosion demand at various beaches in the Shoalhaven
Beach Design Storm Erosion Demand (m 3/m)
Collers Beach 50-100
Mollymook Beach – south end (Golf Club) 70
Mollymook Beach – central (Surf Club) 140
Mollymook Beach – north end 100
Narrawallee 110
Collingwood 110
Callala 120
Currarong 60
Warrain Beach (north) 250
Culburra 250
Shoalhaven Heads 350
Where applicable, this extent of this hazard has been quantified empirically, with the fluctuation in sand volumes due to the 1974 storm event estimated from the photogrammetric data.
The creek entrance instability hazard is applicable only in the zones around creek entrances, and has been calculated using an empirical method based on the photogrammetric data. The creek entrance instability hazard, where applicable, has been added to the short term erosion hazard. The combined hazard has been applied using the same protocol that was used for the design storm erosion (Nielsen et. al. 1992).
Table 3.2 illustrates the values of combined creek entrance instability and storm erosion hazard where applicable. This hazard varied according to the location, degree of influence and distance from the creek entrance.
The combined creek entrance instability and storm erosion hazards applied at individual beach profile locations for each beach are detailed in the individual hazard study reports for each beach.
Shoalhaven Coastal Zone Management Plan: Coastal Hazard Study Summary Report July 2009
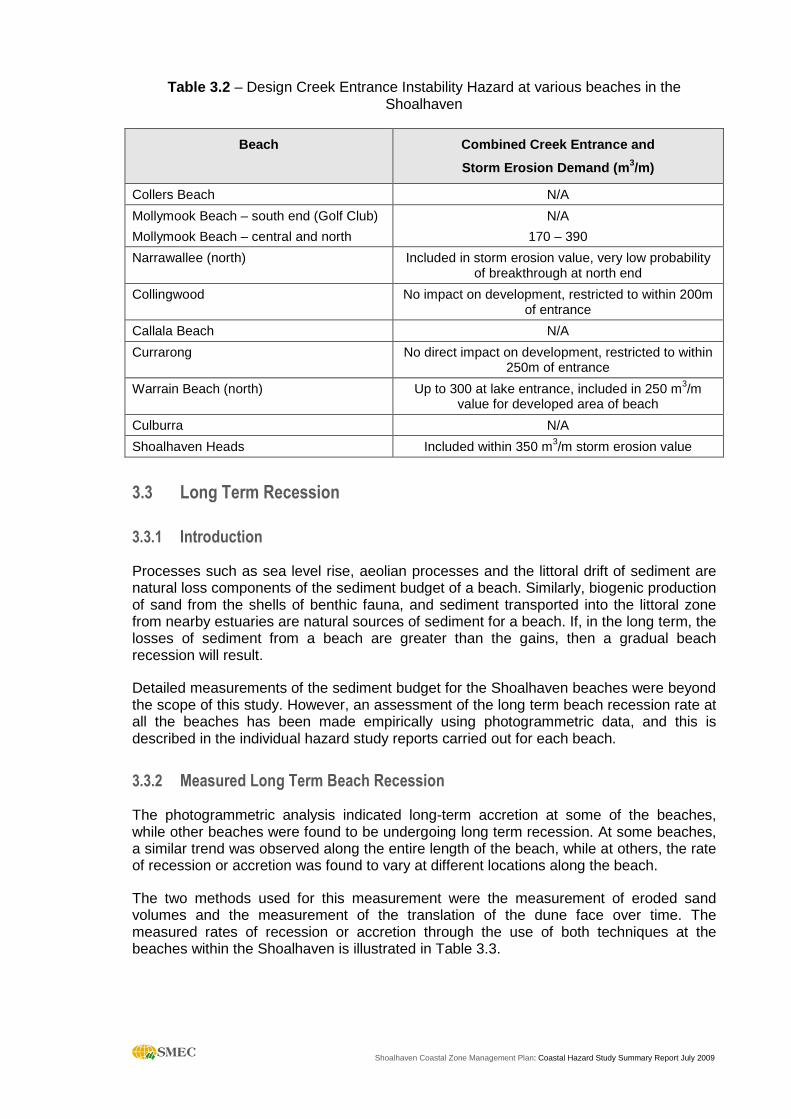
Table 3.2 – Design Creek Entrance Instability Hazard at various beaches in the Shoalhaven
Beach Combined Creek Entrance and
Storm Erosion Demand (m 3/m)
Collers Beach N/A
Mollymook Beach – south end (Golf Club) N/A
Mollymook Beach – central and north 170 – 390
Narrawallee (north) Included in storm erosion value, very low probability of breakthrough at north end
Collingwood No impact on development, restricted to within 200m of entrance
Callala Beach N/A
Currarong No direct impact on development, restricted to within 250m of entrance
Warrain Beach (north) Up to 300 at lake entrance, included in 250 m3/m value for developed area of beach
Culburra N/A
Shoalhaven Heads Included within 350 m3/m storm erosion value
3.3 Long Term Recession
3.3.1 Introduction
Processes such as sea level rise, aeolian processes and the littoral drift of sediment are natural loss components of the sediment budget of a beach. Similarly, biogenic production of sand from the shells of benthic fauna, and sediment transported into the littoral zone from nearby estuaries are natural sources of sediment for a beach. If, in the long term, the losses of sediment from a beach are greater than the gains, then a gradual beach recession will result.
Detailed measurements of the sediment budget for the Shoalhaven beaches were beyond the scope of this study. However, an assessment of the long term beach recession rate at all the beaches has been made empirically using photogrammetric data, and this is described in the individual hazard study reports carried out for each beach.
3.3.2 Measured Long Term Beach Recession
The photogrammetric analysis indicated long-term accretion at some of the beaches, while other beaches were found to be undergoing long term recession. At some beaches, a similar trend was observed along the entire length of the beach, while at others, the rate of recession or accretion was found to vary at different locations along the beach.
The two methods used for this measurement were the measurement of eroded sand volumes and the measurement of the translation of the dune face over time. The measured rates of recession or accretion through the use of both techniques at the beaches within the Shoalhaven is illustrated in Table 3.3.
Shoalhaven Coastal Zone Management Plan: Coastal Hazard Study Summary Report July 2009
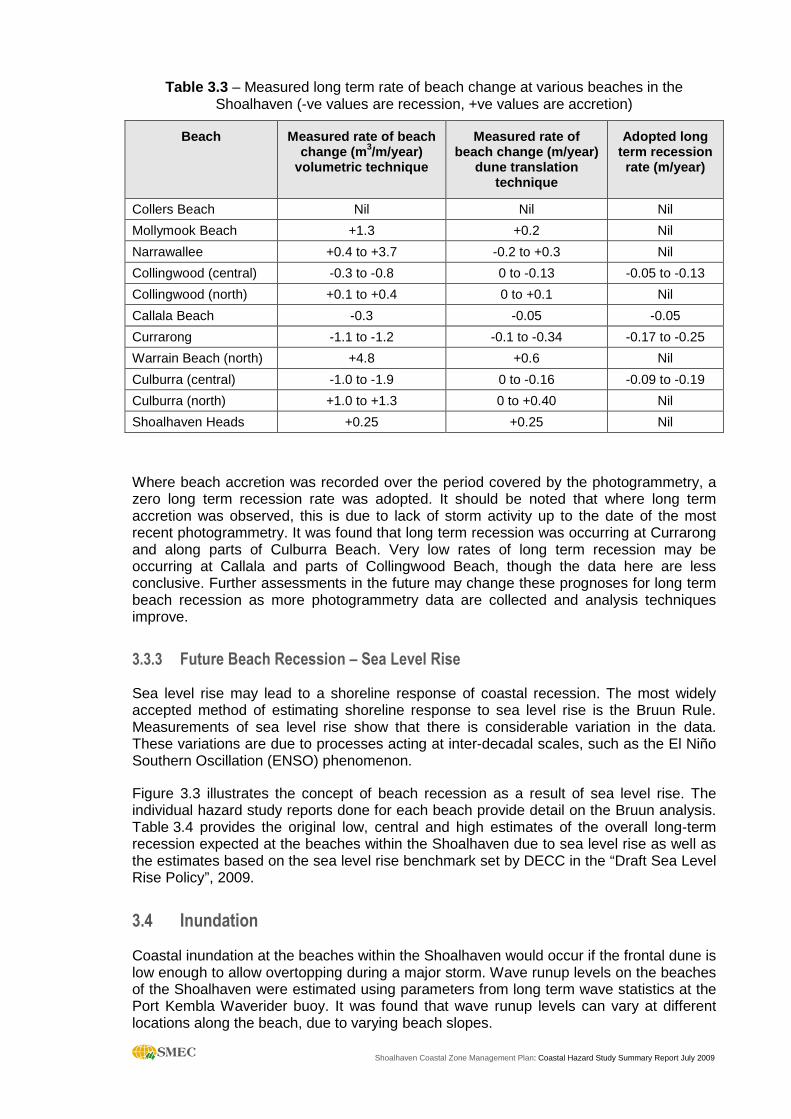
Table 3.3 – Measured long term rate of beach change at various beaches in the Shoalhaven (-ve values are recession, +ve values are accretion)
Beach Measured rate of beach change (m 3/m/year)
volumetric technique
Measured rate of beach change (m/year)
dune translation technique
Adopted long term recession rate (m/year)
Collers Beach Nil Nil Nil
Mollymook Beach +1.3 +0.2 Nil
Narrawallee +0.4 to +3.7 -0.2 to +0.3 Nil
Collingwood (central) -0.3 to -0.8 0 to -0.13 -0.05 to -0.13
Collingwood (north) +0.1 to +0.4 0 to +0.1 Nil
Callala Beach -0.3 -0.05 -0.05
Currarong -1.1 to -1.2 -0.1 to -0.34 -0.17 to -0.25
Warrain Beach (north) +4.8 +0.6 Nil
Culburra (central) -1.0 to -1.9 0 to -0.16 -0.09 to -0.19
Culburra (north) +1.0 to +1.3 0 to +0.40 Nil
Shoalhaven Heads +0.25 +0.25 Nil
Where beach accretion was recorded over the period covered by the photogrammetry, a zero long term recession rate was adopted. It should be noted that where long term accretion was observed, this is due to lack of storm activity up to the date of the most recent photogrammetry. It was found that long term recession was occurring at Currarong and along parts of Culburra Beach. Very low rates of long term recession may be occurring at Callala and parts of Collingwood Beach, though the data here are less conclusive. Further assessments in the future may change these prognoses for long term beach recession as more photogrammetry data are collected and analysis techniques improve.
3.3.3 Future Beach Recession – Sea Level Rise
Sea level rise may lead to a shoreline response of coastal recession. The most widely accepted method of estimating shoreline response to sea level rise is the Bruun Rule. Measurements of sea level rise show that there is considerable variation in the data. These variations are due to processes acting at inter-decadal scales, such as the El Niño Southern Oscillation (ENSO) phenomenon.
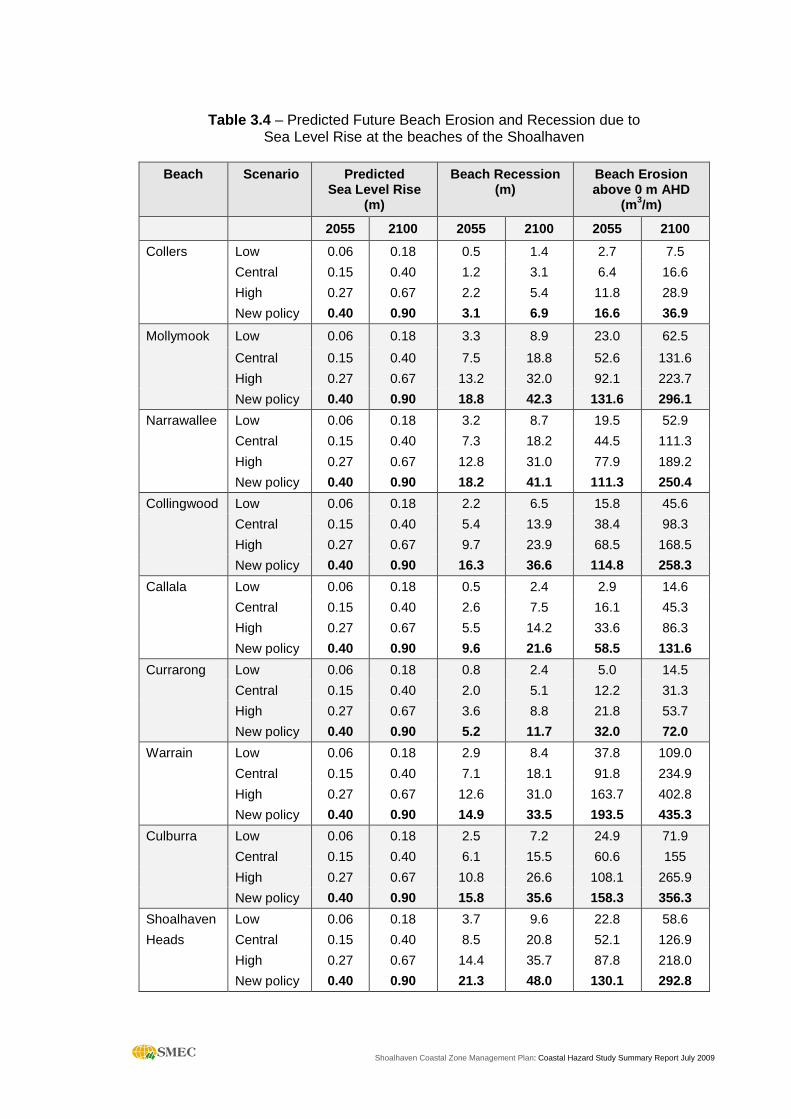
Figure 3.3 illustrates the concept of beach recession as a result of sea level rise. The individual hazard study reports done for each beach provide detail on the Bruun analysis. Table 3.4 provides the original low, central and high estimates of the overall long-term recession expected at the beaches within the Shoalhaven due to sea level rise as well as the estimates based on the sea level rise benchmark set by DECC in the “Draft Sea Level Rise Policy”, 2009.
3.4 Inundation
Coastal inundation at the beaches within the Shoalhaven would occur if the frontal dune is low enough to allow overtopping during a major storm. Wave runup levels on the beaches of the Shoalhaven were estimated using parameters from long term wave statistics at the Port Kembla Waverider buoy. It was found that wave runup levels can vary at different locations along the beach, due to varying beach slopes.
Shoalhaven Coastal Zone Management Plan: Coastal Hazard Study Summary Report July 2009
Table 3.4 – Predicted Future Beach Erosion and Recession due to Sea Level Rise at the beaches of the Shoalhaven
Beach Scenario Predicted
Sea Level Rise (m)
Beach Recession (m)
Beach Erosion above 0 m AHD
(m3/m)
2055 2100 2055 2100 2055 2100
Collers Low 0.06 0.18 0.5 1.4 2.7 7.5
Central 0.15 0.40 1.2 3.1 6.4 16.6
High 0.27 0.67 2.2 5.4 11.8 28.9
New policy 0.40 0.90 3.1 6.9 16.6 36.9
Mollymook Low 0.06 0.18 3.3 8.9 23.0 62.5
Central 0.15 0.40 7.5 18.8 52.6 131.6
High 0.27 0.67 13.2 32.0 92.1 223.7
New policy 0.40 0.90 18.8 42.3 131.6 296.1
Narrawallee Low 0.06 0.18 3.2 8.7 19.5 52.9
Central 0.15 0.40 7.3 18.2 44.5 111.3
High 0.27 0.67 12.8 31.0 77.9 189.2
New policy 0.40 0.90 18.2 41.1 111.3 250.4
Collingwood Low 0.06 0.18 2.2 6.5 15.8 45.6
Central 0.15 0.40 5.4 13.9 38.4 98.3
High 0.27 0.67 9.7 23.9 68.5 168.5
New policy 0.40 0.90 16.3 36.6 114.8 258.3
Callala Low 0.06 0.18 0.5 2.4 2.9 14.6
Central 0.15 0.40 2.6 7.5 16.1 45.3
High 0.27 0.67 5.5 14.2 33.6 86.3
New policy 0.40 0.90 9.6 21.6 58.5 131.6
Currarong Low 0.06 0.18 0.8 2.4 5.0 14.5
Central 0.15 0.40 2.0 5.1 12.2 31.3
High 0.27 0.67 3.6 8.8 21.8 53.7
New policy 0.40 0.90 5.2 11.7 32.0 72.0
Warrain Low 0.06 0.18 2.9 8.4 37.8 109.0
Central 0.15 0.40 7.1 18.1 91.8 234.9
High 0.27 0.67 12.6 31.0 163.7 402.8
New policy 0.40 0.90 14.9 33.5 193.5 435.3
Culburra Low 0.06 0.18 2.5 7.2 24.9 71.9
Central 0.15 0.40 6.1 15.5 60.6 155
High 0.27 0.67 10.8 26.6 108.1 265.9
New policy 0.40 0.90 15.8 35.6 158.3 356.3
Shoalhaven Low 0.06 0.18 3.7 9.6 22.8 58.6
Heads Central 0.15 0.40 8.5 20.8 52.1 126.9
High 0.27 0.67 14.4 35.7 87.8 218.0
New policy 0.40 0.90 21.3 48.0 130.1 292.8
Shoalhaven Coastal Zone Management Plan: Coastal Hazard Study Summary Report July 2009
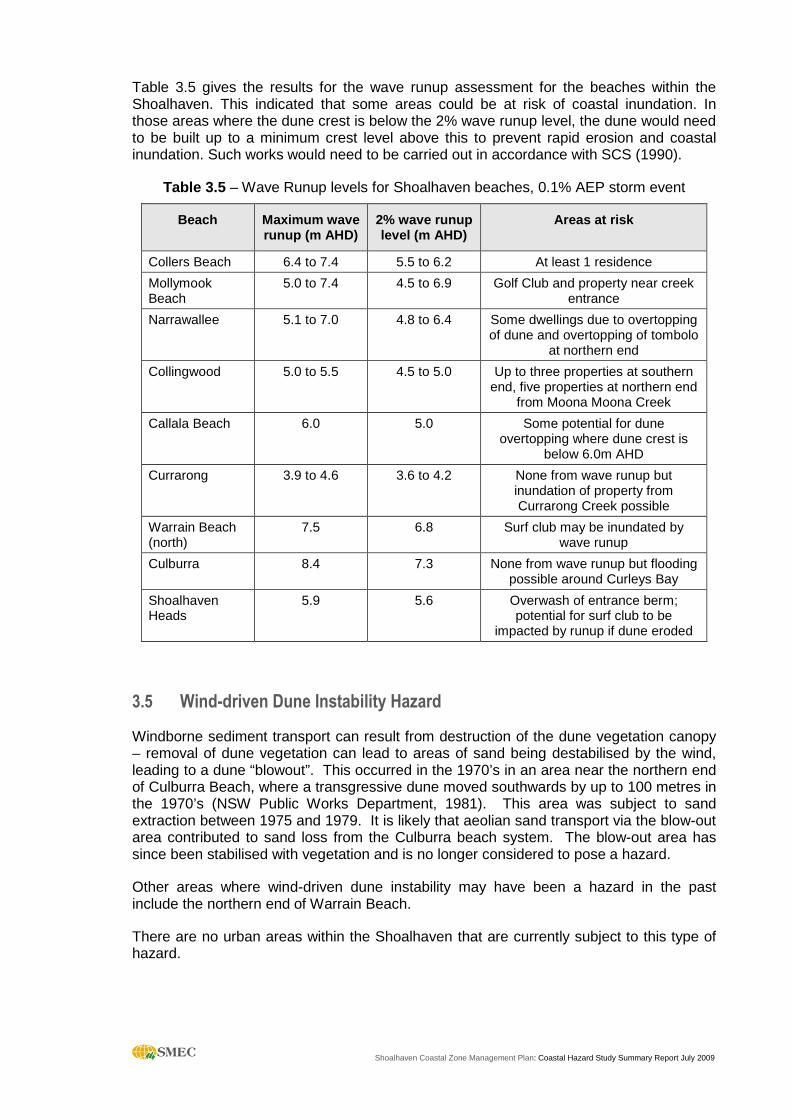
Table 3.5 gives the results for the wave runup assessment for the beaches within the Shoalhaven. This indicated that some areas could be at risk of coastal inundation. In those areas where the dune crest is below the 2% wave runup level, the dune would need to be built up to a minimum crest level above this to prevent rapid erosion and coastal inundation. Such works would need to be carried out in accordance with SCS (1990).
Table 3.5 – Wave Runup levels for Shoalhaven beaches, 0.1% AEP storm event
Beach Maximum wave runup (m AHD)
2% wave runup level (m AHD)
Areas at risk
Collers Beach 6.4 to 7.4 5.5 to 6.2 At least 1 residence
Mollymook Beach
5.0 to 7.4 4.5 to 6.9 Golf Club and property near creek entrance
Narrawallee 5.1 to 7.0 4.8 to 6.4 Some dwellings due to overtopping of dune and overtopping of tombolo
at northern end
Collingwood 5.0 to 5.5 4.5 to 5.0 Up to three properties at southern end, five properties at northern end
from Moona Moona Creek
Callala Beach 6.0 5.0 Some potential for dune overtopping where dune crest is
below 6.0m AHD
Currarong 3.9 to 4.6 3.6 to 4.2 None from wave runup but inundation of property from Currarong Creek possible
Warrain Beach (north)
7.5 6.8 Surf club may be inundated by wave runup
Culburra 8.4 7.3 None from wave runup but flooding possible around Curleys Bay
Shoalhaven Heads
5.9 5.6 Overwash of entrance berm; potential for surf club to be
impacted by runup if dune eroded
3.5 Wind-driven Dune Instability Hazard
Windborne sediment transport can result from destruction of the dune vegetation canopy – removal of dune vegetation can lead to areas of sand being destabilised by the wind, leading to a dune “blowout”. This occurred in the 1970’s in an area near the northern end of Culburra Beach, where a transgressive dune moved southwards by up to 100 metres in the 1970’s (NSW Public Works Department, 1981). This area was subject to sand extraction between 1975 and 1979. It is likely that aeolian sand transport via the blow-out area contributed to sand loss from the Culburra beach system. The blow-out area has since been stabilised with vegetation and is no longer considered to pose a hazard.
Other areas where wind-driven dune instability may have been a hazard in the past include the northern end of Warrain Beach.
There are no urban areas within the Shoalhaven that are currently subject to this type of hazard.
Shoalhaven Coastal Zone Management Plan: Coastal Hazard Study Summary Report July 2009 23
4 Hazard Mapping and Risk Assessment
4.1 Hazard Mapping
The derivation of the dune erosion hazard for the present day, 2050 and 2100 planning periods is presented in detail in the individual hazard study reports for each beach. For each planning period, the erosion hazard has been defined as:
• a line delineating the limit of wave impact and dune slumping (Zone of Wave Impact and Slope Adjustment); and
• a line delineating the limit of the area behind the dune face where the capacity of the sand to support building foundations is reduced because of the sloping dune escarpment (Zone of Reduced Foundation Capacity).
For the present day planning period, these lines were derived by applying the design storm erosion demand from Tables 3.1 and 3.2. For the 2050 and 2100 planning periods, these lines have been derived by translating the present day hazard lines landward by the amount of long term beach recession expected, both due to underlying measured long term recession (Table 3.3) and additional recession due to sea level rise, using the sea level rise benchmarks for planning purposes from the NSW “Draft Sea Level Rise Policy Statement” (Table 3.4).
Hazard mapping for the present day, 2050 and 2100 planning periods is presented in the individual hazard study reports carried out for each beach.
Hazard mapping illustrating the recommended zones for coastal planning purposes has been carried out for all the beaches – this mapping illustrates the 2050 and 2100 landward limits of the Zone of Reduced Foundation Capacity for each beach as well as areas that may be subject to other hazards such as coastal inundation due to wave runup.
Hazard mapping illustrating the 2025 landward limits of the Zone of Reduced Foundation Capacity has also been included, for comparison purposes. The “2025” landward limits of the Zone of Reduced Foundation Capacity assumes 0.15 m of sea level rise by 2025. This estimate is approximately equivalent to the “central estimate” for sea level rise by 2055 from Table 3.4. The previous Draft of the Coastal Hazard Study used this central estimate to estimate the location of the hazard lines – for this reason, the “2025” hazard lines are equivalent to the “50 year” hazard lines as presented in the previous Hazard Study report.
4.2 Risk Assessment
A risk assessment for the present day, 2050 planning period and 2100 planning period has been carried out for the beaches in the Shoalhaven area using the updated sea level rise benchmarks. This risk assessment was carried out with reference to the hazard mapping done for each of the three planning periods. The results of this risk assessment are summarised below for each beach.
4.2.1 Collers Beach
A hazard risk assessment for Collers Beach has indicated that for an immediate planning period there is no development or infrastructure at direct threat from coastal erosion. However, for the 2050 planning period using the updated sea level rise benchmarks, the house located at 13 Shipton Crescent will lie within the Zone of Reduced Foundation
Shoalhaven Coastal Zone Management Plan: Coastal Hazard Study Summary Report July 2009
Capacity. The house is located at a low elevation behind the dune and is currently at risk of wave inundation.
The coastal walkway is at risk of wave erosion and design details for a rock rubble revetment have been presented in the Coastal Hazard Study report for Collers Beach.
4.2.2 Mollymook Beach
At present, two of the beachfront residences on Mitchell Parade were shown to be at threat from storm erosion. This threat is due in part to the instability of the entrance of Mollymook Creek. Parts of the Golf Club building and some areas of Mitchell Parade, Beach Road, Golf Street and Ocean Street are at immediate threat from storm erosion.
Some existing buildings lie within the present-day Zone of Reduced Foundation Capacity and several buildings (including the Surf Club) lie very close to the landward edge of the Zone of Wave Impact and Slope Adjustment. It is noted that the areas in front of the Surf Club and Golf Club are protected by seawalls, though the degree of protection offered by these seawalls needs to be evaluated.
For the 2050 planning period, 12 properties and 8 lots on Mitchell Parade have a portion extending into the Zone of Wave Impact and Slope Adjustment as well as the Surf Club, the Golf Club, one building on Golf Avenue, and there is a greater length of roadway of Golf Avenue, Ocean Street, Mitchell Parade and Beach Road at risk. Some 12 existing buildings along Mitchell Parade lie partially within the Zone of Reduced Foundation Capacity for the 2050 planning period as well as 2 buildings on Golf Avenue. Parts of the roadway of Mitchell Parade are at threat from storm erosion within the 2050 planning period. The presence of underlying bedrock landward of Mitchell Parade at the central part of the beach and landward of Beach Road at the northern end of the beach protects the existing buildings from reduced foundation capacity.
For the 2100 planning period, the Surf Club, the Golf Club, 3 buildings and an additional lot lie partially within the Zone of Wave Impact and Slope Adjustment at the intersection of Ocean Street and Golf Avenue. One building and one additional lot lie within the Zone of Reduced Foundation Capacity at this intersection. Some 28 dwellings and 5 lots are within the 2100 Zone of Wave Impact and Slope Adjustment along Mitchell Parade and one dwelling and one lot may be affected by reduced foundation capacity.
There is Council-owned sewer infrastructure, including a pipeline and pumping station, located seaward of the 2050 Zone of Wave Impact and Slope Adjustment which may be at risk from storm erosion by 2050. Some areas of sewer infrastructure exist seaward of the Golf Club and are located in the present-day Zone of Wave Impact and Slope Adjustment.
Wave runup analysis for the design storm has indicated that runup levels would pose an inundation hazard to some ten properties north of Mollymook Creek entrance and the Golf Club, where the dune height is less than 5.5m above AHD. This hazard can be minimised by maintaining a minimum dune height of 5.5m above AHD.
4.2.3 Narrawallee Beach
At present and for the 2050 planning period, there is no public or private property at threat from coastal erosion, and no significant assets lie within the present-day Zone of Reduced Foundation Capacity.
For the 2100 planning period, no property is at risk from wave impact or reduced foundation capacity. However, a portion of the roadway at Matron Porter Drive lies within the Zone of Wave Impact and Slope Adjustment. The line delineating the landward limit of
Shoalhaven Coastal Zone Management Plan: Coastal Hazard Study Summary Report July 2009
the Zone of Reduced Foundation Capacity infringes onto a portion of the roadside reserve of Matron Porter Drive as well as onto the seaward portion of 8 lots along this road, and most of the beachfront reserve north of Parkinson Street is within the Zone of Wave Impact or Zone of Reduced Foundation Capacity within the 2100 planning period.
There is no Council-owned sewer or water infrastructure at Narrawallee Beach at risk from coastal erosion within the 2100 planning period.
The risk of breach of the tombolo at the northern end was found to be very low, and it was found that it would take at least two storms of 0.1% AEP occurring in one year to cause the tombolo to breach. This risk can be minimised by keeping the dune height above the significant wave runup level of 6.0m AHD.
Wave runup analysis for the design storm has indicated that runup levels could pose an inundation hazard to parts of the beachfront reserve and some properties along Matron Porter Drive where the dune height is low, despite the ample setback of properties in this area.
4.2.4 Collingwood Beach
For the 2050 planning period, it was found that, based on the hazard parameters adopted, there may be several properties and infrastructure (including some 35 dwellings and portions of over 45 lots which partially extend into the 2050 Zone of Slope Adjustment) that may come under risk from beach recession. Infrastructure that may be impacted by 2050 includes some public pathways and the roadway at Illfracombe Avenue. Some 30 additional dwellings and around 10 additional lots lie partially within the Zone of Reduced Foundation Capacity.
For the 2100 planning period around 100 dwellings have portions within the Zone of Slope Adjustment, including all lots with immediate beach frontage. A further 2 dwellings and 3 lots lie partially within the Zone of Reduced Foundation Capacity, as well as part of the roadway of Elizabeth Drive.
There are areas along Collingwood Beach (specifically, the sewer line along the beachfront reserve between Argyle Street and Berry Street and the water supply line along Illfracombe Avenue) where Council-owned sewer and water supply infrastructure is located within the Zone of Wave Impact and Slope Adjustment within the 2050 planning period, indicating that this infrastructure would be under threat from coastal erosion by 2050. For the 2100 planning period, one additional water supply line lies within the Zone of Wave Impact and Slope Adjustment along Elizabeth Drive between Montague Street and Bayswater Street.
Creek entrance instability hazard is relevant for a zone up to 100 metres south from the existing creek entrance location, this zone being outside the existing urban developed area.
Wave runup analysis for the design storm has indicated that runup levels would pose an inundation hazard to some ten properties at the northern end of the beach near Moona Moona Creek entrance, where the dune height is less than 5.0m above AHD. This could lead to overwash of the dune area into Moona Moona Creek. Some three dwellings are located below the 5.0 m AHD contour at the southern end of the beach. This hazard can be minimised by maintaining a minimum dune height of 5.0 m above AHD.
Shoalhaven Coastal Zone Management Plan: Coastal Hazard Study Summary Report July 2009
4.2.5 Callala Beach
At present, none of the beachfront residences were shown to be at threat from storm erosion. However, parts of some existing buildings lie within the present-day Zone of Reduced Foundation Capacity, and several buildings lie very close to the landward edge of the Zone of Wave Impact and Slope Adjustment.
For the 2050 planning period, it was found that, based on the hazard parameters adopted, there are approximately 60 dwellings and an additional 18 lots along Quay Road with a portion extending into the Zone of Wave Impact and Slope Adjustment, with 7 additional dwellings, one lot and part of the pavement of Greenway Road lying partially within the Zone of Reduced Foundation Capacity. The 2050 Zone of Wave Impact and Slope Adjustment corresponds approximately to Council’s existing 23 m Building Line.
For the 2100 planning period, some 70 properties and 13 additional lots along Quay Road as well as the roadway of Greenway Road lie partially within the Zone of Wave Impact and Slope Adjustment, with 3 additional dwellings are subject to reduced foundation capacity. At the northern end of Callala Beach, the landward limit of the Zone of Reduced Foundation Capacity traverses the seaward boundaries of properties along Greenway Road.
There is no Council sewer or water infrastructure at Callala that is under threat from coastal erosion within the 2050 planning period.
Wave runup analysis for the design storm has indicated that runup levels would, at their maximum, reach the top of the dune face. This does not pose any hazard to property as little or no overtopping of the dune would be expected during the design storm, provided the dune height is maintained at a minimum level of 6.0m above AHD.
4.2.6 Currarong Beach
At present, there is no public or private property at threat from coastal erosion. However, much of the coastal dune reserve seaward of Warrain Crescent is under immediate risk of coastal erosion, and there is potential for this erosion to break through into the Currarong Creek estuary. Parts of the roadway of Warrain Crescent east of Cambewarra Road lie within the present-day Zone of Reduced Foundation Capacity.
For the 2050 planning period, the seaward portions of 5 lots and parts of the roadway of Warrain Crescent lie within the Zone of Wave Impact and Slope Adjustment, and there are seven dwellings and 4 additional lots that lie partly within the Zone of Reduced Foundation Capacity. The dune system in front of the Currarong Creek bend will be undermined and creek breakthrough at this point would be almost inevitable during floods if the current rates of long term erosion continue. This will need to be managed – possibly by periodically dredging sand from the creek and placing it back on the dune as beach nourishment.
For the 2100 planning period, the houses on Warrain Crescent east of Cambewarra Road have a portion extending into the Zone of Wave Impact and Slope Adjustment. In addition, portions of some lots west of Cambewarra Road and a longer portion of the roadway of Warrain Crescent extend partly into the Zone of Wave Impact and Slope Adjustment. Some 10 dwellings and 11 lots may be affected by reduced foundation capacity. Most of the lots along Warrain Crescent are partly affected by reduced foundation capacity.
There is water supply infrastructure on the seaward side of the lots on Warrain Crescent east of Cambewarra Road that is located within the Zone of Wave Impact and Slope
Shoalhaven Coastal Zone Management Plan: Coastal Hazard Study Summary Report July 2009
Adjustment for the 2050 planning period, indicating that this infrastructure would be under threat from coastal erosion by 2050.
Wave runup analysis for the design storm has indicated that runup levels would not pose an inundation hazard to beachfront development along Warrain Crescent. However, areas of foreshore along Currarong Creek lie below 2.0m AHD and these areas may be under threat from coastal inundation.
4.2.7 Warrain Beach
For the 2050 planning period, part of the Surf Club building and 5 lots extend into the Zone of Slope Adjustment, and 4 additional lots at the extreme northern and southern ends of the beach lie partially within the Zone of Reduced Foundation Capacity. The presence of underlying bedrock at the northern end of the beach protects the existing buildings from reduced foundation capacity.
For the 2100 planning period, the Surf Club building extends within the Zone of Slope Adjustment. Two dwellings lie very close to the landward limit of the Zone of Slope Adjustment. Approximately 12 lots extend within the Zone of Reduced Foundation Capacity, with 5 dwellings affected.
Some sewer infrastructure at the end of Farrant Avenue will be under direct threat from coastal erosion at North Warrain Beach by 2100.
Wave runup analysis for the design storm has indicated that runup levels would not pose an inundation hazard to beachfront development along Warrain Beach. However, the Surf Club may be within the zone impacted by inundation from wave runup.
Near the foreshore of Lake Woolumboola, there may be an inundation risk to properties with floor levels below 2 m AHD. This risk will increase with time with forecast sea level rise due to climate change.
4.2.8 Culburra Beach
At present, there is no public or private property at threat from coastal erosion. However, much of the coastal dune reserve is under immediate risk of coastal erosion. Coastal dune vegetation and fencing would need to be maintained to prevent loss of dune stability and prevent dune blowouts which have occurred in the past. Parts of the roadway of Allerton Avenue and two dwellings on Marina Lane lie partially seaward of the edge of the Zone of Reduced Foundation Capacity. The risk may be increasing with time as parts of the beach are undergoing long term recession.
For the 2050 planning period, it was found that part of the roadway of Allerton Avenue extends into the Zone of Slope Adjustment as well as 2 dwellings and 9 lots. Some 30 existing buildings and 50 additional lots lie partially within the Zone of Reduced Foundation Capacity.
For the 2100 planning period, parts of the roadway of Allerton Avenue and Haven Street, 3 buildings between the Strand and Fern Way, 2 dwellings at the end of Mia Way, all houses along the coast at the end of Glenholm and along the Marina, almost all houses along Marina Lane extend within the Zone of Slope Adjustment as well as around 50 additional lots along the coast. Approximately 40 additional dwellings and 50 additional lots may be affected by reduced foundation capacity. Almost all lots fronting the coast would be affected by either by reduced foundation capacity or wave impact and slope adjustment.
Shoalhaven Coastal Zone Management Plan: Coastal Hazard Study Summary Report July 2009
Some wastewater infrastructure may be at direct threat from coastal erosion within the 2050 planning period at Allerton Avenue and an additional threat in Marina Lane will occur by 2100.
Wave runup analysis for the design storm has indicated that runup levels would not pose an inundation hazard to beachfront development along Culburra Beach.
4.2.9 Shoalhaven Heads
The assessment of coastal hazards has concluded that no private dwelling is at immediate risk of storm damage. However, the Surf Club building lies within the Zone of Wave Impact and Slope Adjustment, and has come under threat previously (for example, in the 1978 storm event).
For the 2050 planning period, the Surf Club building and adjacent car park extend into the Zone of Slope Adjustment. For the 2100 planning period, the Surf Club building extends within the Zone of Slope Adjustment and properties at the end of McIntosh Street and the fairways of the golf course lie at the landward edge of the Zone of Reduced Foundation Capacity.
There is no sewer or water supply infrastructure at Shoalhaven Heads under direct threat from coastal erosion within the 2050 year planning period, except for that which services for the Surf Club.
Wave runup analysis for the design storm has indicated that runup levels would not pose an inundation hazard to beachfront development at Shoalhaven Heads.
Shoalhaven Coastal Zone Management Plan: Coastal Hazard Study Summary Report July 2009
5 Summary, Conclusions and Recommendations
5.1 Summary and Conclusions
Detailed technical studies using an updated empirical database have allowed for the quantification of the coastal hazards at the beaches of the Shoalhaven. The assessment has been made on the basis of detailed photogrammetric survey data.
As recommended by AS4997-2005 “Guidelines for the design of maritime structures” (AS, 2005), a storm event having a 5% probability of being exceeded over a 50 year period was adopted for the risk analysis. From the analysis of wave statistics at Port Kembla, it was found that the May-June 1974 storm event had such a probability of exceedance and, as the signature of these storms could be seen in the photogrammetric data at many of the beaches, it was adopted as the design storm event.
The prognosis for a future sea level rise, as a result of global warming, could induce a rate of long term recession. The NSW Government through the Draft Sea Level Rise Policy Statement have set the NSW Sea Level Rise Planning benchmark at levels of a 40 cm increase above 1990 levels by 2050 and 90 cm by 2100. This benchmark has been used to derive an updated assessment of future beach recession caused by sea level rise at all the beaches.
5.2 Recommendations
The recommendations given below are based on the results of the Hazard Studies at each location. General recommendations intended for all of the beaches are presented, as are specific recommendations for each beach. The recommendations take account of Council’s existing planning policies at each beach. At locations where Council’s existing policies are consistent with the degree of coastal hazard determined in this study, existing policy frameworks are maintained as closely as possible.
Recommended hazard zones for coastal planning purposes are shown in the accompanying hazard maps for all the beaches. This mapping illustrates the 2050 and 2100 landward limits of the Zone of Wave Impact and Slope Adjustment, as well as the landward limit of the Zone of Reduced Foundation Capacity for each beach. In addition, the maps indicate areas that may be subject to other hazards such as coastal inundation due to wave runup.
5.2.1 General Recommendations
For the beaches in the Shoalhaven that have been included in this assessment where coastal hazards have been identified, it is recommended that:
• Council not approve applications for development forward of the 2025 limit of the Zone of Reduced Foundation Capacity.
• Council require that new development, located within the 2100 Zone of Reduced Foundation Capacity, be on pier foundations designed to transfer the building loads into the Stable Foundation Zone for the 2100 planning period, and that Council develop an appropriate standard pier specification as a Consent Condition for new development.
Shoalhaven Coastal Zone Management Plan: Coastal Hazard Study Summary Report July 2009
• Council include the 2025, 2050 and 2100 limits of the Zone of Reduced Foundation Capacity and Stable Foundation Zone on the Section 149 Certificates to inform residents of the potential coastal hazard risk at each site.
• The quantification of the erosion hazard be re-assessed every 10 years, based on the continuing collection of empirical data and on the more advanced analysis techniques that will become available in the future.
• Where sewer or water infrastructure is under direct threat from coastal erosion within the 2050 planning period, consideration be given to relocating that infrastructure.
5.2.2 Specific Recommendations
The following recommendations apply to specific beach areas within the Shoalhaven.
Collers Beach
It is recommended that Council annotate the inundation risk to the beachfront developments on the Section 149 Certificates to inform residents and future purchasers of the potential coastal hazard risk at each site.
Mollymook Beach
It is recommended that all the general recommendations specified in section 5.2.1 for beaches in the Shoalhaven be applied to Mollymook Beach.
It is recommended also that the design of the revetment by NSW Public Works Department (1992) to protect the infrastructure at the southern end of the beach and, specifically, the Golf Club, be reviewed and the revetment maintained/reconstructed if required.
It is further recommended that a buried gabion wall be constructed on the northern side of the creek entrance, at beach berm level, to train the entrance to its present location and prevent fluctuation of the entrance location. Stabilising the creek entrance would reduce the hazard for the properties immediately to the north, and facilitate the natural build up of a dune at that location to further protect the buildings from storm erosion, wave runup and coastal inundation.
It is further recommended that dune crest levels are maintained to a minimum of 5.5 m AHD and Council develop a standard Dune Management Code as a Consent Condition for new development.
Narrawallee Beach
There are currently no coastal engineering constraints that would apply to any existing development or new development within existing developed lots along Narrawallee Beach. It is recommended that Council maintain the existing beachfront reserve area along Matron Porter Drive as a buffer against future storm erosion, and that no development take place seaward of Matron Porter Drive.
Shoalhaven Coastal Zone Management Plan: Coastal Hazard Study Summary Report July 2009
It is further recommended that dune crest levels are maintained to a minimum of 6.0 m AHD, especially at the northern end of the beach where there may be potential for breakthrough of the tombolo into Narrawallee Inlet.
Collingwood Beach
It is recommended that all the general recommendations specified in section 5.2.1 for beaches in the Shoalhaven be applied to Collingwood Beach.
It is recommended also that dune crest levels are maintained to a minimum of 5.0 m AHD and Council develop a standard Dune Management Code as a Consent Condition for new development.
Callala Beach
For Callala Beach, it is recommended that:
• Council maintain the 23 m Building Line for future new residential development proposals.
• Council not approve applications for development forward of the 23 m Building Line for Callala Beach.
• Council require that new development, located within the 2100 Zone of Reduced Foundation Capacity, be on pier foundations designed to transfer the building loads into the Stable Foundation Zone for a 100 year planning period, and that Council develop an appropriate standard pier specification as a Consent Condition for new development.
• Dune crest levels are maintained to a minimum of 6.0m AHD and Council develop a standard Dune Management Code as a Consent Condition for new development.
• Council include the 2050 limit of the Zone of Slope Adjustment and 2100 limits of the Stable Foundation Zone on the Section 149 Certificates to inform residents of the potential coastal hazard risk at each site.
Currarong
It is recommended that all the general recommendations specified in section 5.2.1 for beaches in the Shoalhaven be applied to Currarong Beach.
There are no coastal engineering constraints within the 2050 planning period that would preclude building landward of the Stable Foundation Zone line shown on the Recommended Zones for Coastal Planning Map for Currarong. However, there may be access issues for the properties on Warrain Crescent that are landward of the Stable Foundation Zone, as the roadway could be undermined by 2050.
It is recommended that the beach in front of the bend at Currarong Creek be maintained, to prevent breakthrough of the creek at this location and possible realignment of the planform of the beach. This may involve periodic placement of sand from within the creek entrance back onto the dune.
Shoalhaven Coastal Zone Management Plan: Coastal Hazard Study Summary Report July 2009
Warrain Beach
It is recommended that all the general recommendations specified in section 5.2.1 for beaches in the Shoalhaven be applied to Warrain Beach.
It is recommended that the dune vegetation and fencing be maintained, to maintain stability of the dune and possible losses of sand from the littoral system that would contribute to long term recession of Warrain Beach, especially near the entrance to Lake Woolumboola.
Culburra Beach
It is recommended that all the general recommendations specified in section 5.2.1 for beaches in the Shoalhaven be applied to Culburra Beach.
In addition, it is recommended that:
• The dune vegetation and fencing be maintained, to maintain stability of the dune and possible losses of sand from the littoral system that would contribute to long term recession of Culburra Beach.
• Council update the DCP for Culburra to inform residents of the potential coastal hazard risk at each site.
Shoalhaven Heads
It is recommended that all the general recommendations specified in section 5.2.1 for beaches in the Shoalhaven be applied to the beach at Shoalhaven Heads.
In addition, it is recommended that:
• The dune vegetation and fencing be maintained, to maintain stability of the dune and possible losses of sand from the littoral system that would contribute to long term recession of the beach at Shoalhaven Heads during times of flood in the Shoalhaven River.
• Council considers the implications for dune erosion at Shoalhaven Heads when developing/implementing the Shoalhaven River entrance opening strategy.
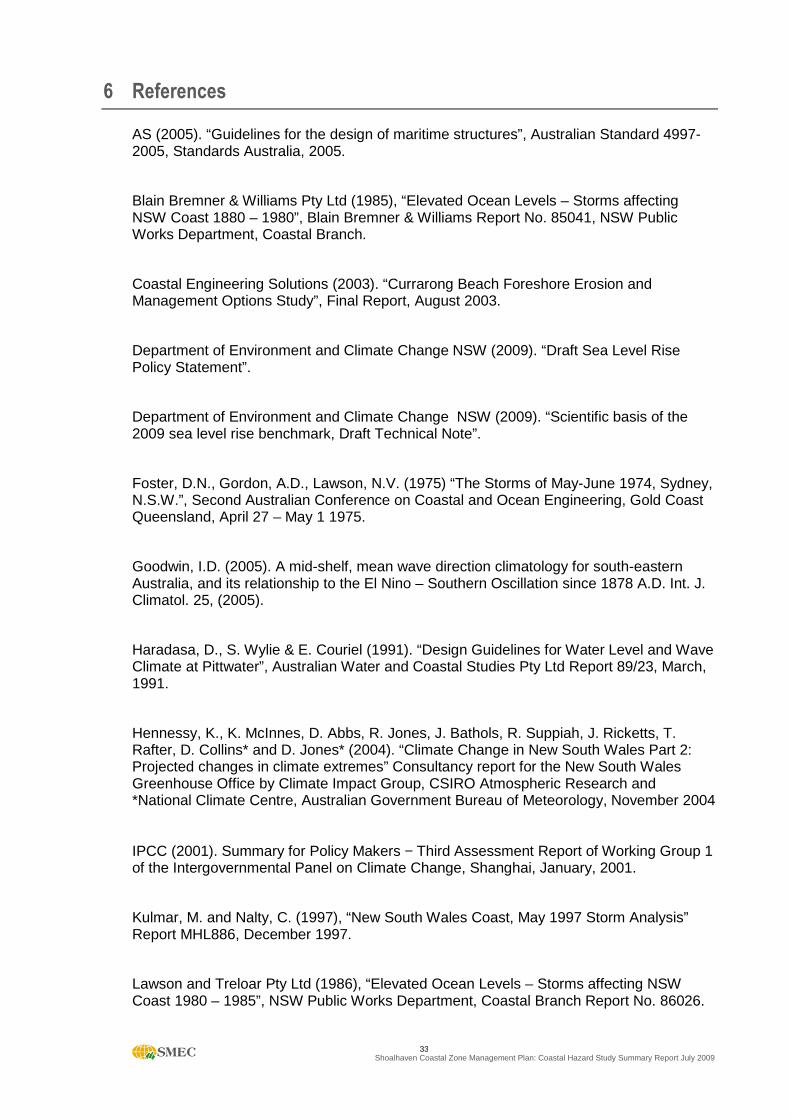
Shoalhaven Coastal Zone Management Plan: Coastal Hazard Study Summary Report July 2009 33
6 References
AS (2005). “Guidelines for the design of maritime structures”, Australian Standard 4997-2005, Standards Australia, 2005.
Blain Bremner & Williams Pty Ltd (1985), “Elevated Ocean Levels – Storms affecting NSW Coast 1880 – 1980”, Blain Bremner & Williams Report No. 85041, NSW Public Works Department, Coastal Branch.
Coastal Engineering Solutions (2003). “Currarong Beach Foreshore Erosion and Management Options Study”, Final Report, August 2003.
Department of Environment and Climate Change NSW (2009). “Draft Sea Level Rise Policy Statement”.
Department of Environment and Climate Change NSW (2009). “Scientific basis of the 2009 sea level rise benchmark, Draft Technical Note”.
Foster, D.N., Gordon, A.D., Lawson, N.V. (1975) “The Storms of May-June 1974, Sydney, N.S.W.”, Second Australian Conference on Coastal and Ocean Engineering, Gold Coast Queensland, April 27 – May 1 1975.
Goodwin, I.D. (2005). A mid-shelf, mean wave direction climatology for south-eastern Australia, and its relationship to the El Nino – Southern Oscillation since 1878 A.D. Int. J. Climatol. 25, (2005).
Haradasa, D., S. Wylie & E. Couriel (1991). “Design Guidelines for Water Level and Wave Climate at Pittwater”, Australian Water and Coastal Studies Pty Ltd Report 89/23, March, 1991.
Hennessy, K., K. McInnes, D. Abbs, R. Jones, J. Bathols, R. Suppiah, J. Ricketts, T. Rafter, D. Collins* and D. Jones* (2004). “Climate Change in New South Wales Part 2: Projected changes in climate extremes” Consultancy report for the New South Wales Greenhouse Office by Climate Impact Group, CSIRO Atmospheric Research and *National Climate Centre, Australian Government Bureau of Meteorology, November 2004
IPCC (2001). Summary for Policy Makers − Third Assessment Report of Working Group 1 of the Intergovernmental Panel on Climate Change, Shanghai, January, 2001.
Kulmar, M. and Nalty, C. (1997), “New South Wales Coast, May 1997 Storm Analysis” Report MHL886, December 1997.
Lawson and Treloar Pty Ltd (1986), “Elevated Ocean Levels – Storms affecting NSW Coast 1980 – 1985”, NSW Public Works Department, Coastal Branch Report No. 86026.
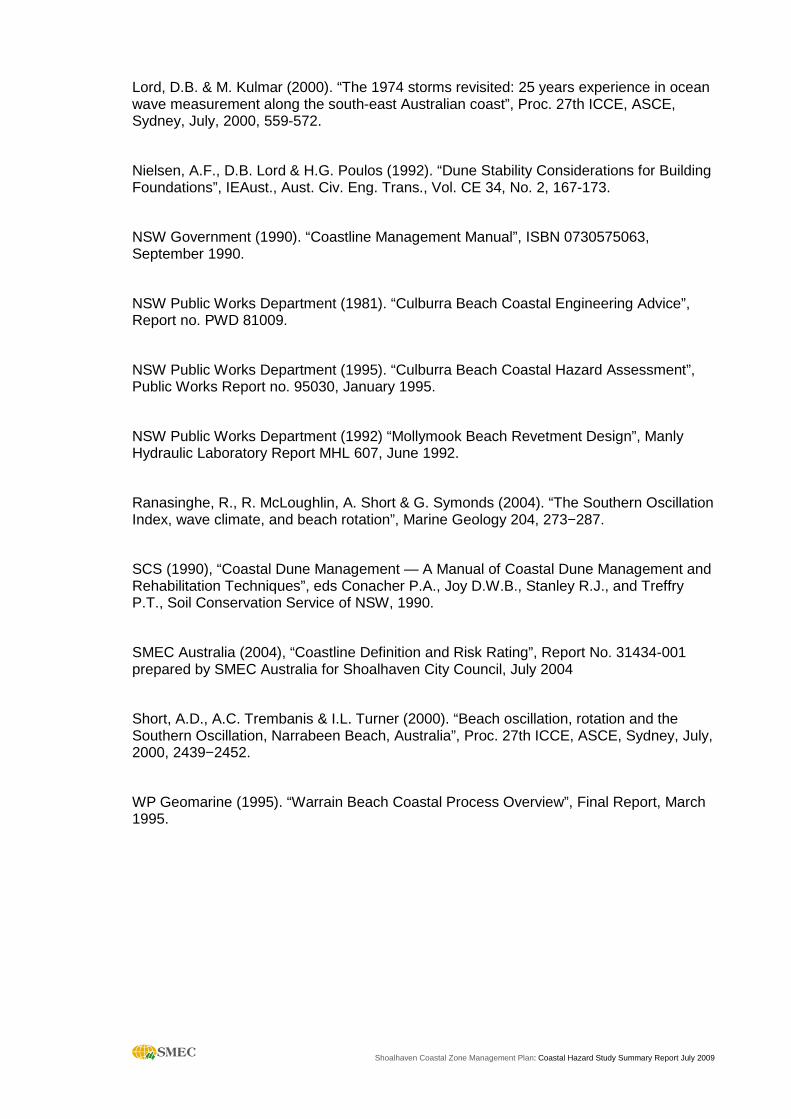
Shoalhaven Coastal Zone Management Plan: Coastal Hazard Study Summary Report July 2009
Lord, D.B. & M. Kulmar (2000). “The 1974 storms revisited: 25 years experience in ocean wave measurement along the south-east Australian coast”, Proc. 27th ICCE, ASCE, Sydney, July, 2000, 559-572.
Nielsen, A.F., D.B. Lord & H.G. Poulos (1992). “Dune Stability Considerations for Building Foundations”, IEAust., Aust. Civ. Eng. Trans., Vol. CE 34, No. 2, 167-173.
NSW Government (1990). “Coastline Management Manual”, ISBN 0730575063, September 1990.
NSW Public Works Department (1981). “Culburra Beach Coastal Engineering Advice”, Report no. PWD 81009.
NSW Public Works Department (1995). “Culburra Beach Coastal Hazard Assessment”, Public Works Report no. 95030, January 1995.
NSW Public Works Department (1992) “Mollymook Beach Revetment Design”, Manly Hydraulic Laboratory Report MHL 607, June 1992.
Ranasinghe, R., R. McLoughlin, A. Short & G. Symonds (2004). “The Southern Oscillation Index, wave climate, and beach rotation”, Marine Geology 204, 273−287.
SCS (1990), “Coastal Dune Management — A Manual of Coastal Dune Management and Rehabilitation Techniques”, eds Conacher P.A., Joy D.W.B., Stanley R.J., and Treffry P.T., Soil Conservation Service of NSW, 1990.
SMEC Australia (2004), “Coastline Definition and Risk Rating”, Report No. 31434-001 prepared by SMEC Australia for Shoalhaven City Council, July 2004
Short, A.D., A.C. Trembanis & I.L. Turner (2000). “Beach oscillation, rotation and the Southern Oscillation, Narrabeen Beach, Australia”, Proc. 27th ICCE, ASCE, Sydney, July, 2000, 2439−2452.
WP Geomarine (1995). “Warrain Beach Coastal Process Overview”, Final Report, March 1995.
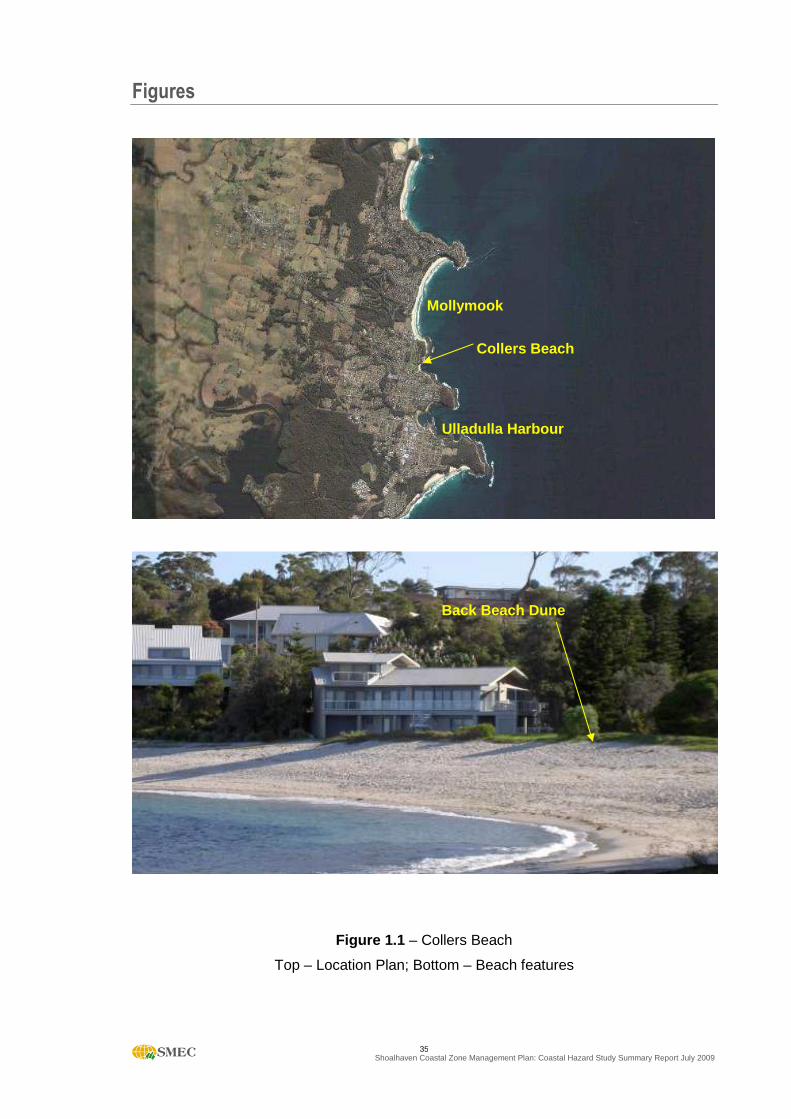
Shoalhaven Coastal Zone Management Plan: Coastal Hazard Study Summary Report July 2009 35
Figures
Figure 1.1 – Collers Beach
Top – Location Plan; Bottom – Beach features
Collers Beach
Ulladulla Harbour
Mollymook
Back Beach Dune
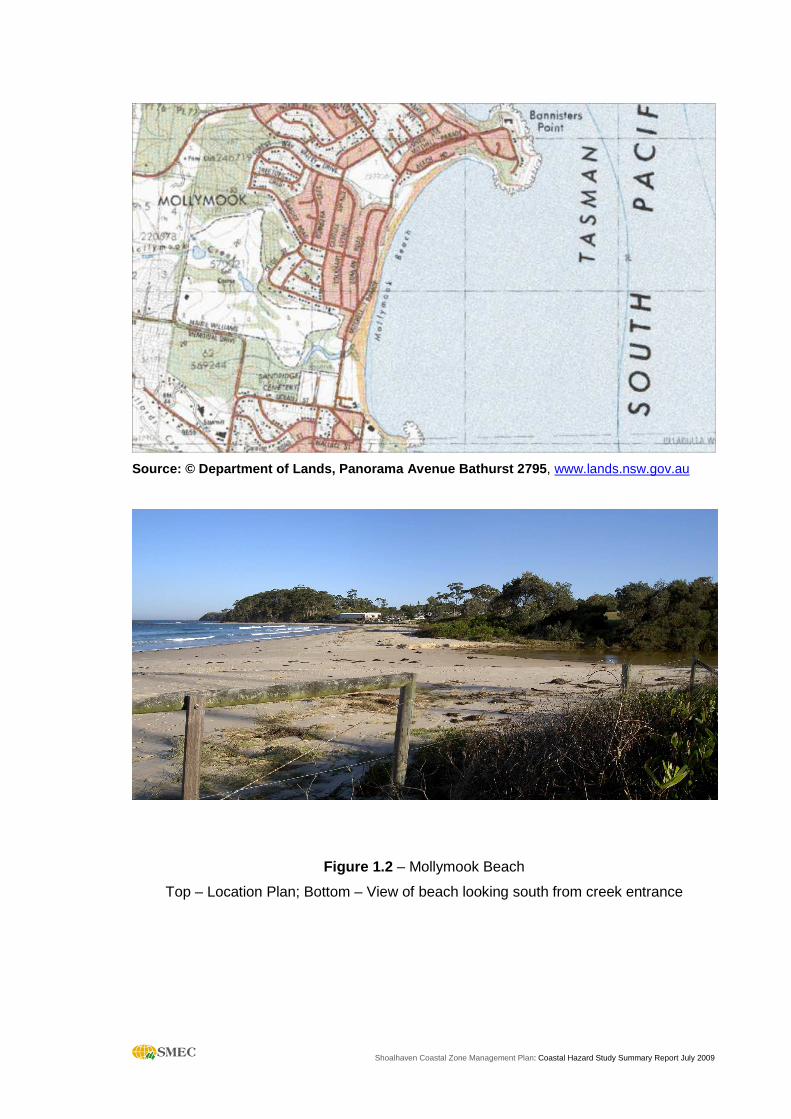
Shoalhaven Coastal Zone Management Plan: Coastal Hazard Study Summary Report July 2009
Source: © Department of Lands, Panorama Avenue Bath urst 2795 , www.lands.nsw.gov.au
Figure 1.2 – Mollymook Beach
Top – Location Plan; Bottom – View of beach looking south from creek entrance

Shoalhaven Coastal Zone Management Plan: Coastal Hazard Study Summary Report July 2009
Source: © Department of Lands, Panorama Avenue Bath urst 2795 , www.lands.nsw.gov.au
Figure 1.3 – Narrawallee Beach
Top – Location Plan; Bottom – View of beach looking south
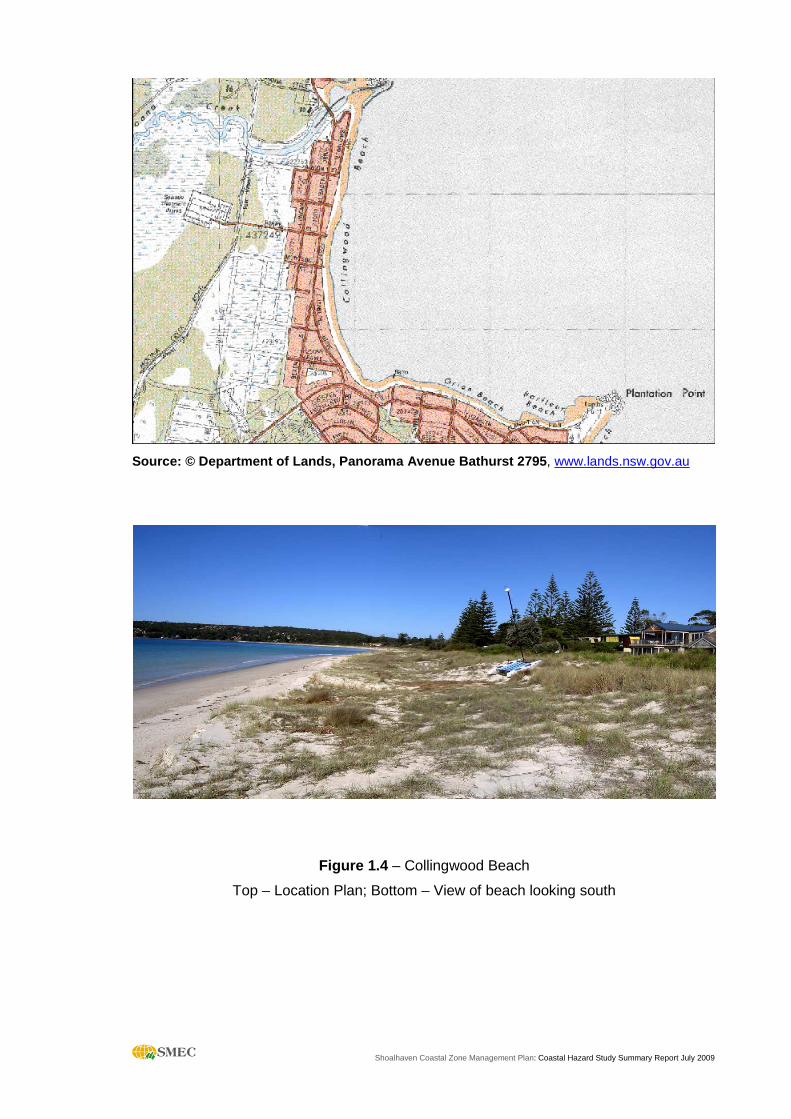
Shoalhaven Coastal Zone Management Plan: Coastal Hazard Study Summary Report July 2009
Source: © Department of Lands, Panorama Avenue Bath urst 2795 , www.lands.nsw.gov.au
Figure 1.4 – Collingwood Beach
Top – Location Plan; Bottom – View of beach looking south
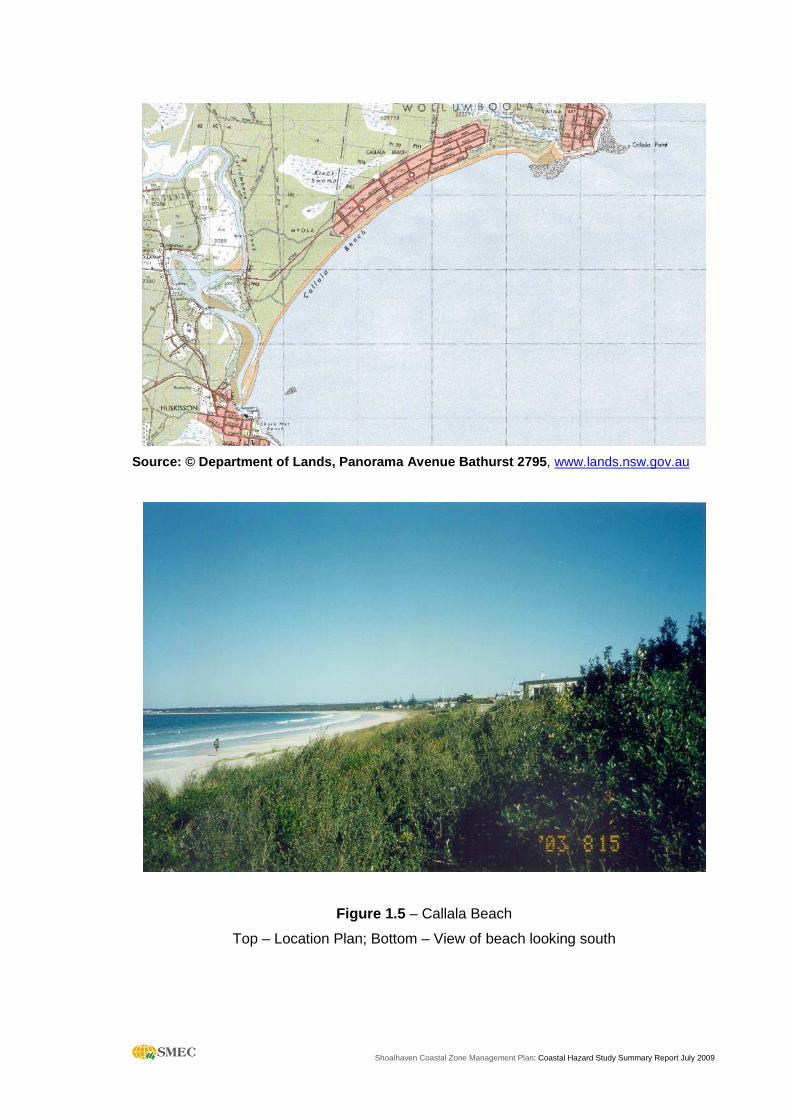
Shoalhaven Coastal Zone Management Plan: Coastal Hazard Study Summary Report July 2009
Source: © Department of Lands, Panorama Avenue Bath urst 2795 , www.lands.nsw.gov.au
Figure 1.5 – Callala Beach
Top – Location Plan; Bottom – View of beach looking south
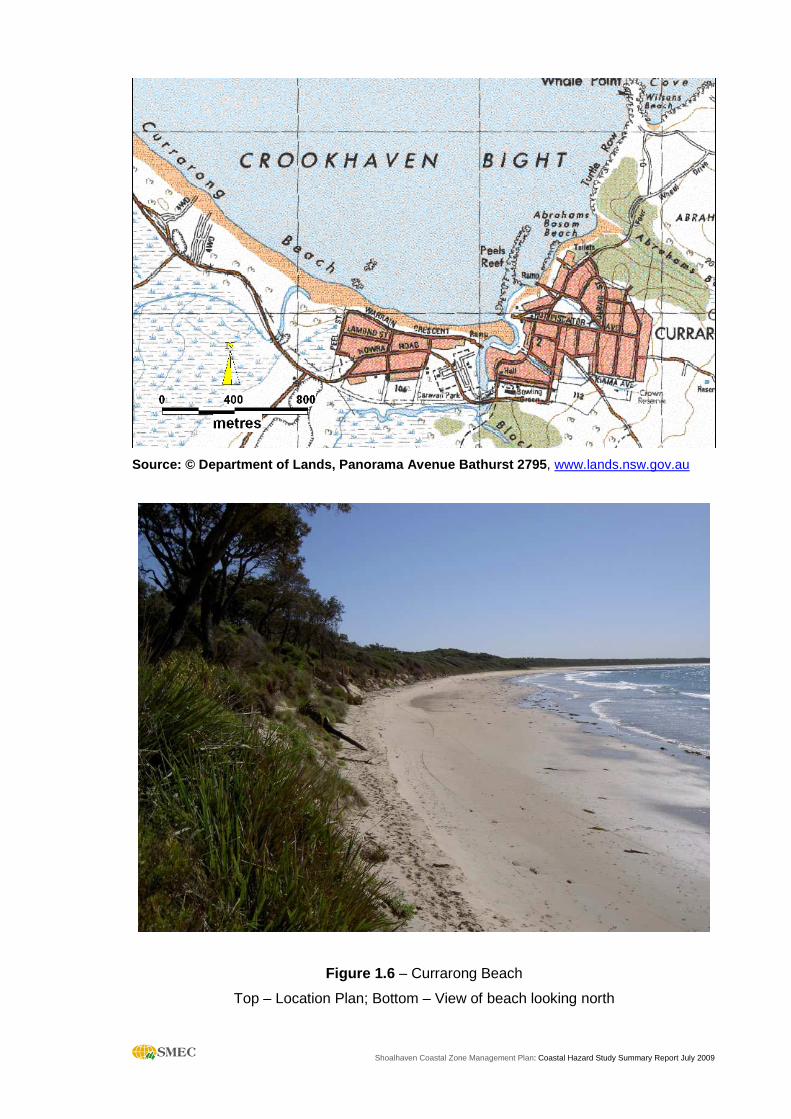
Shoalhaven Coastal Zone Management Plan: Coastal Hazard Study Summary Report July 2009
Source: © Department of Lands, Panorama Avenue Bath urst 2795 , www.lands.nsw.gov.au
Figure 1.6 – Currarong Beach
Top – Location Plan; Bottom – View of beach looking north
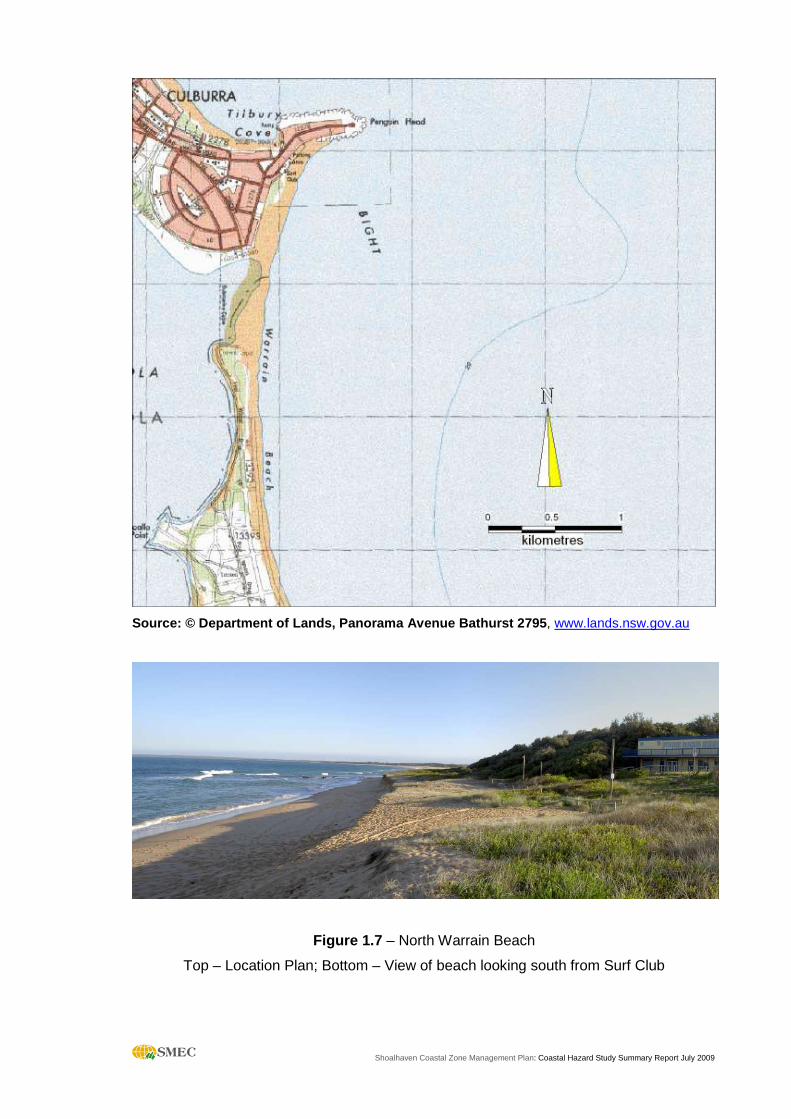
Shoalhaven Coastal Zone Management Plan: Coastal Hazard Study Summary Report July 2009
Source: © Department of Lands, Panorama Avenue Bath urst 2795 , www.lands.nsw.gov.au
Figure 1.7 – North Warrain Beach
Top – Location Plan; Bottom – View of beach looking south from Surf Club
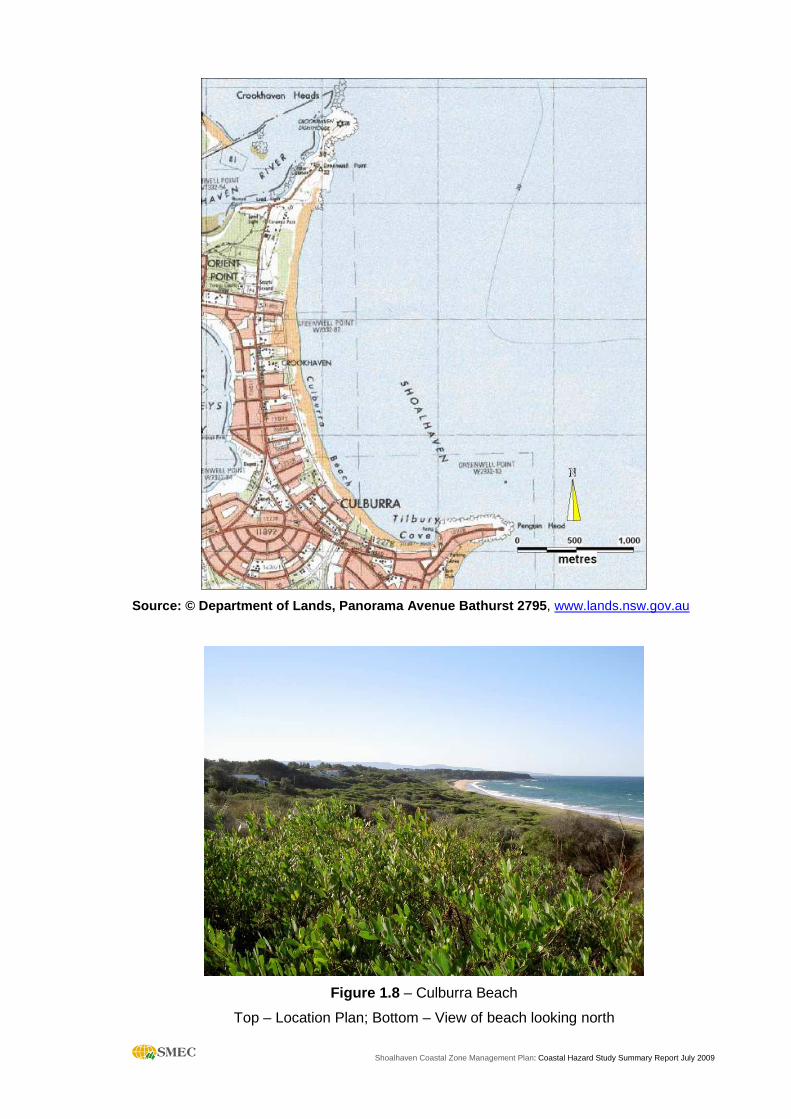
Shoalhaven Coastal Zone Management Plan: Coastal Hazard Study Summary Report July 2009
Source: © Department of Lands, Panorama Avenue Bath urst 2795 , www.lands.nsw.gov.au
Figure 1.8 – Culburra Beach
Top – Location Plan; Bottom – View of beach looking north
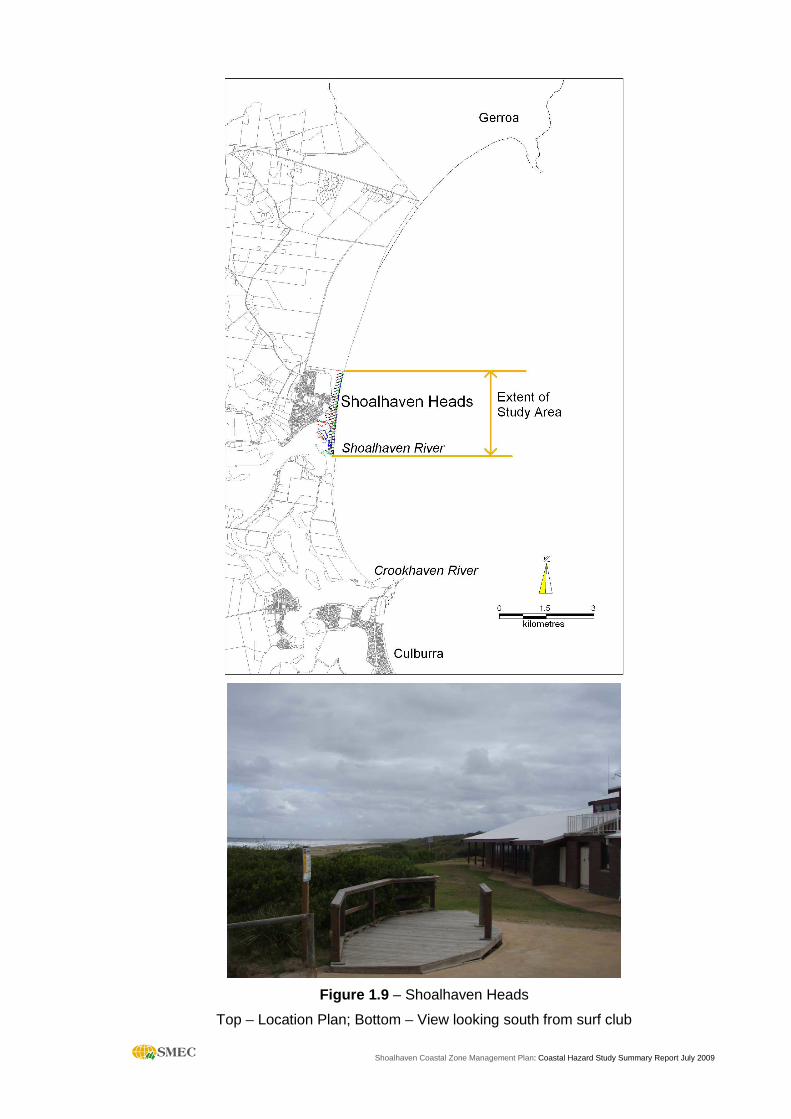
Shoalhaven Coastal Zone Management Plan: Coastal Hazard Study Summary Report July 2009
Figure 1.9 – Shoalhaven Heads
Top – Location Plan; Bottom – View looking south from surf club
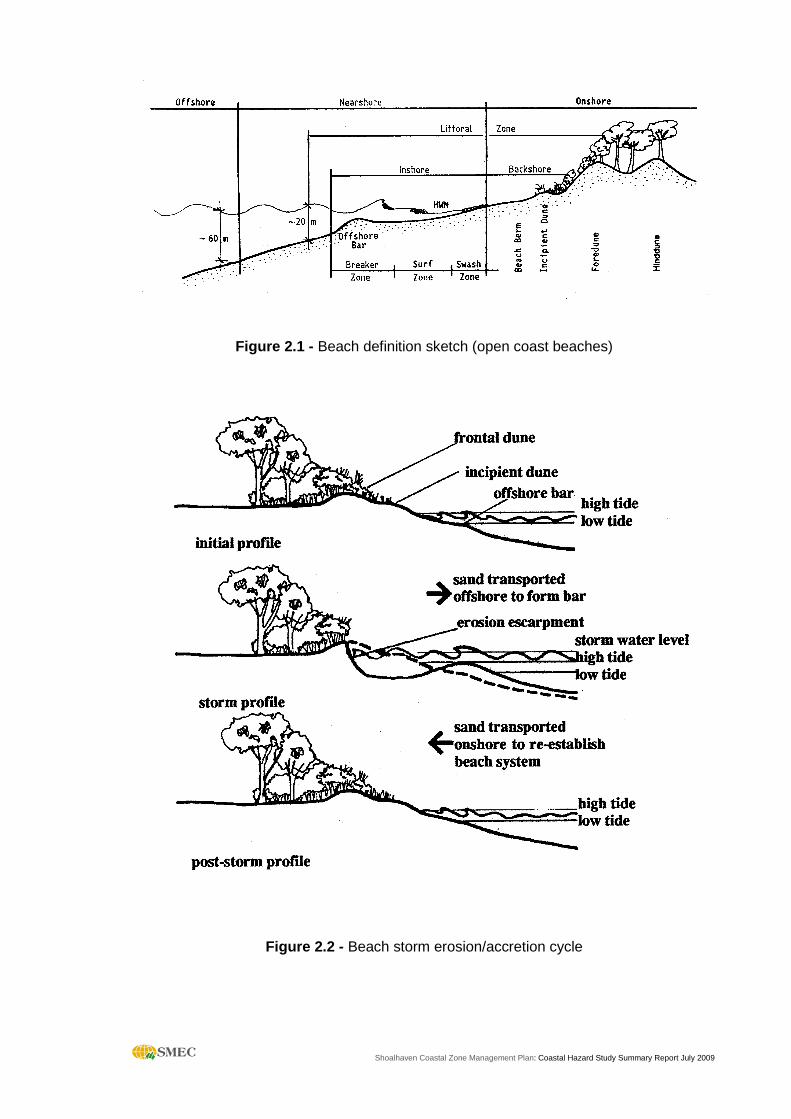
Shoalhaven Coastal Zone Management Plan: Coastal Hazard Study Summary Report July 2009
Figure 2.1 - Beach definition sketch (open coast beaches)
Figure 2.2 - Beach storm erosion/accretion cycle

Shoalhaven Coastal Zone Management Plan: Coastal Hazard Study Summary Report July 2009
Figure 2.3 - Sediment budget schema (NSW Government, 1990)
Figure 2.4 - Long term erosion schema
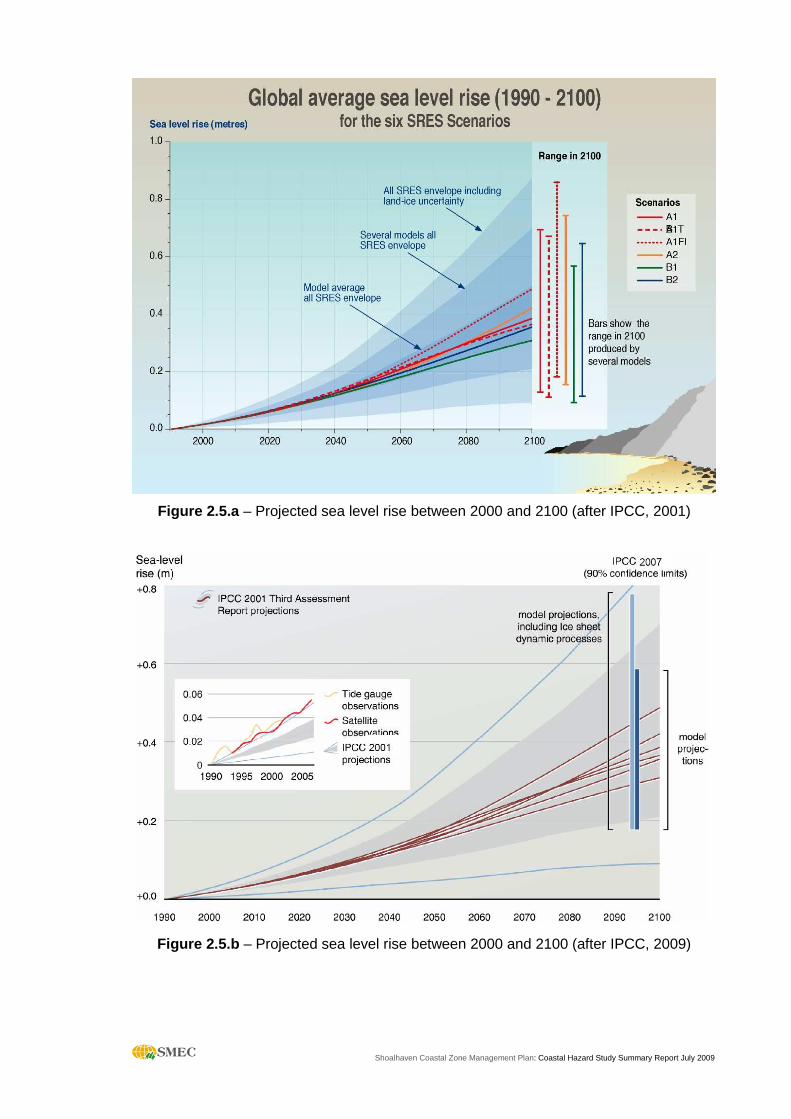
Shoalhaven Coastal Zone Management Plan: Coastal Hazard Study Summary Report July 2009
Figure 2.5.a – Projected sea level rise between 2000 and 2100 (after IPCC, 2001)
Figure 2.5.b – Projected sea level rise between 2000 and 2100 (after IPCC, 2009)
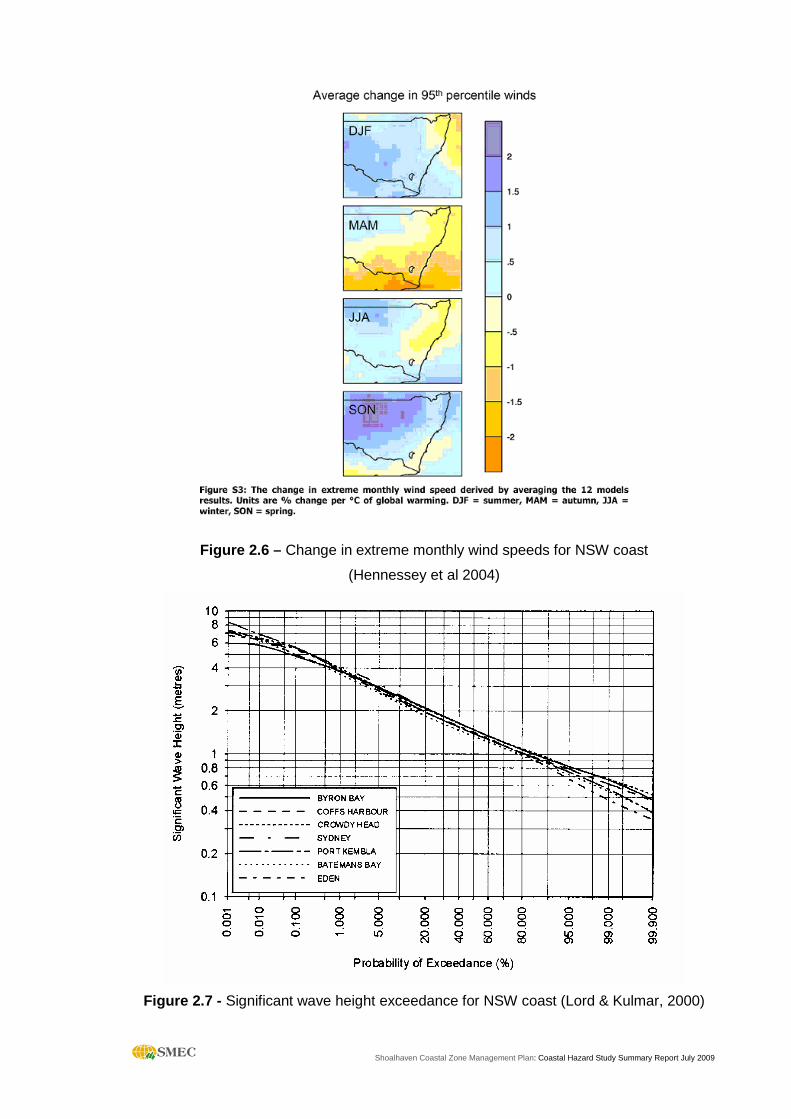
Shoalhaven Coastal Zone Management Plan: Coastal Hazard Study Summary Report July 2009
Figure 2.6 – Change in extreme monthly wind speeds for NSW coast
(Hennessey et al 2004)
Figure 2.7 - Significant wave height exceedance for NSW coast (Lord & Kulmar, 2000)
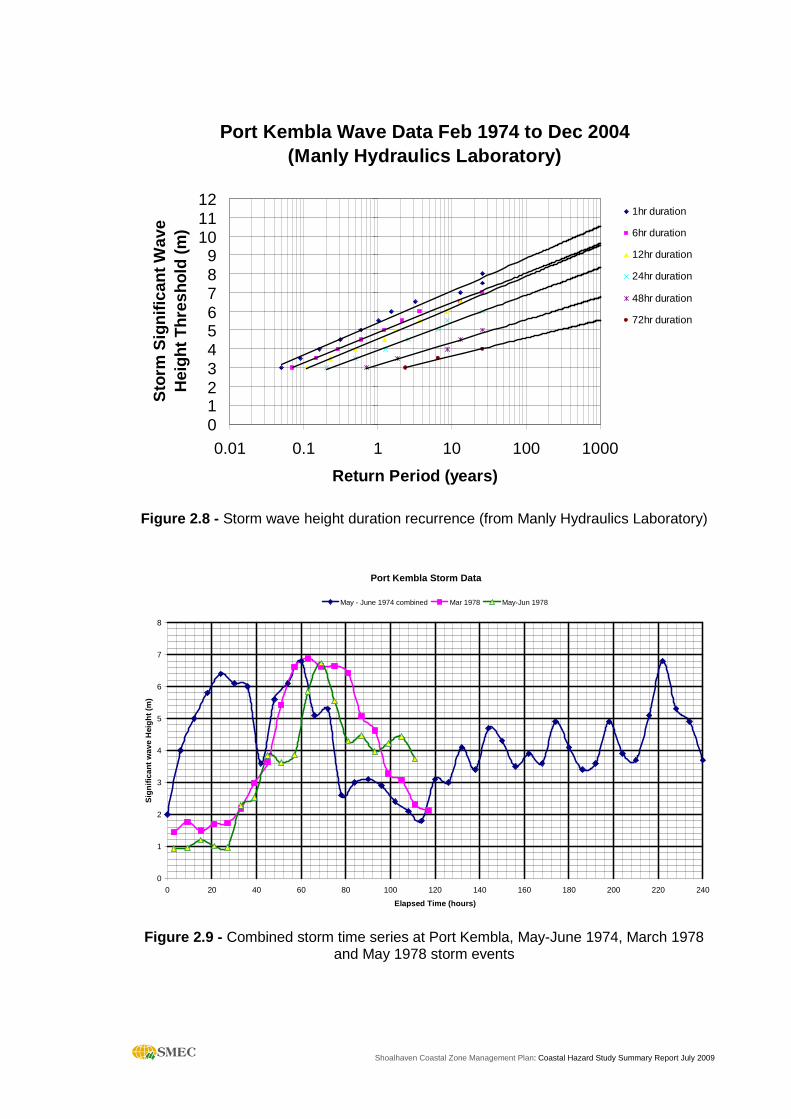
Shoalhaven Coastal Zone Management Plan: Coastal Hazard Study Summary Report July 2009
Port Kembla Wave Data Feb 1974 to Dec 2004 (Manly Hydraulics Laboratory)
0123456789
101112
0.01 0.1 1 10 100 1000
Return Period (years)
Sto
rm S
igni
fican
t Wav
e H
eigh
t Thr
esho
ld (
m)
1hr duration
6hr duration
12hr duration
24hr duration
48hr duration
72hr duration
Figure 2.8 - Storm wave height duration recurrence (from Manly Hydraulics Laboratory)
Port Kembla Storm Data
0
1
2
3
4
5
6
7
8
0 20 40 60 80 100 120 140 160 180 200 220 240
Elapsed Time (hours)
Sig
nific
ant w
ave
Hei
ght (
m)
May - June 1974 combined Mar 1978 May-Jun 1978
Figure 2.9 - Combined storm time series at Port Kembla, May-June 1974, March 1978 and May 1978 storm events
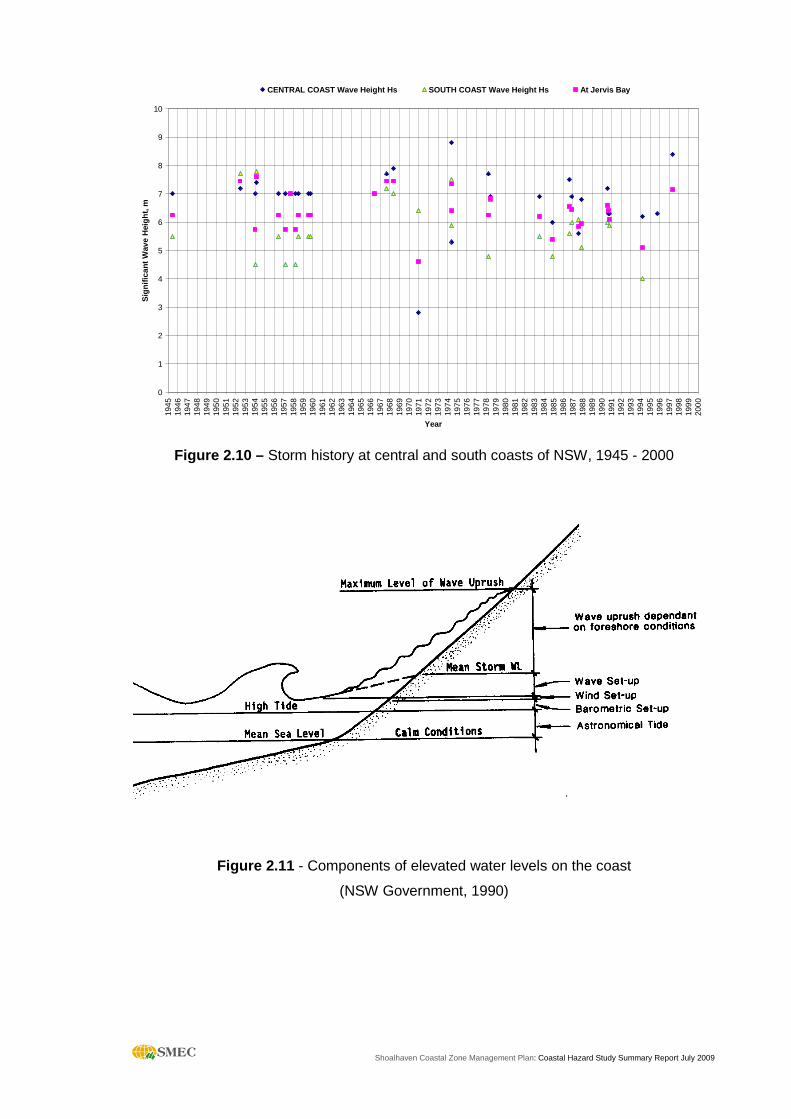
Shoalhaven Coastal Zone Management Plan: Coastal Hazard Study Summary Report July 2009
0
1
2
3
4
5
6
7
8
9
10
1945
1946
1947
1948
1949
1950
1951
1952
1953
1954
1955
1956
1957
1958
1959
1960
1961
1962
1963
1964
1965
1966
1967
1968
1969
1970
1971
1972
1973
1974
1975
1976
1977
1978
1979
1980
1981
1982
1983
1984
1985
1986
1987
1988
1989
1990
1991
1992
1993
1994
1995
1996
1997
1998
1999
2000
Year
Sig
nific
ant W
ave
Hei
ght,
m
CENTRAL COAST Wave Height Hs SOUTH COAST Wave Height Hs At Jervis Bay
Figure 2.10 – Storm history at central and south coasts of NSW, 1945 - 2000
Figure 2.11 - Components of elevated water levels on the coast
(NSW Government, 1990)
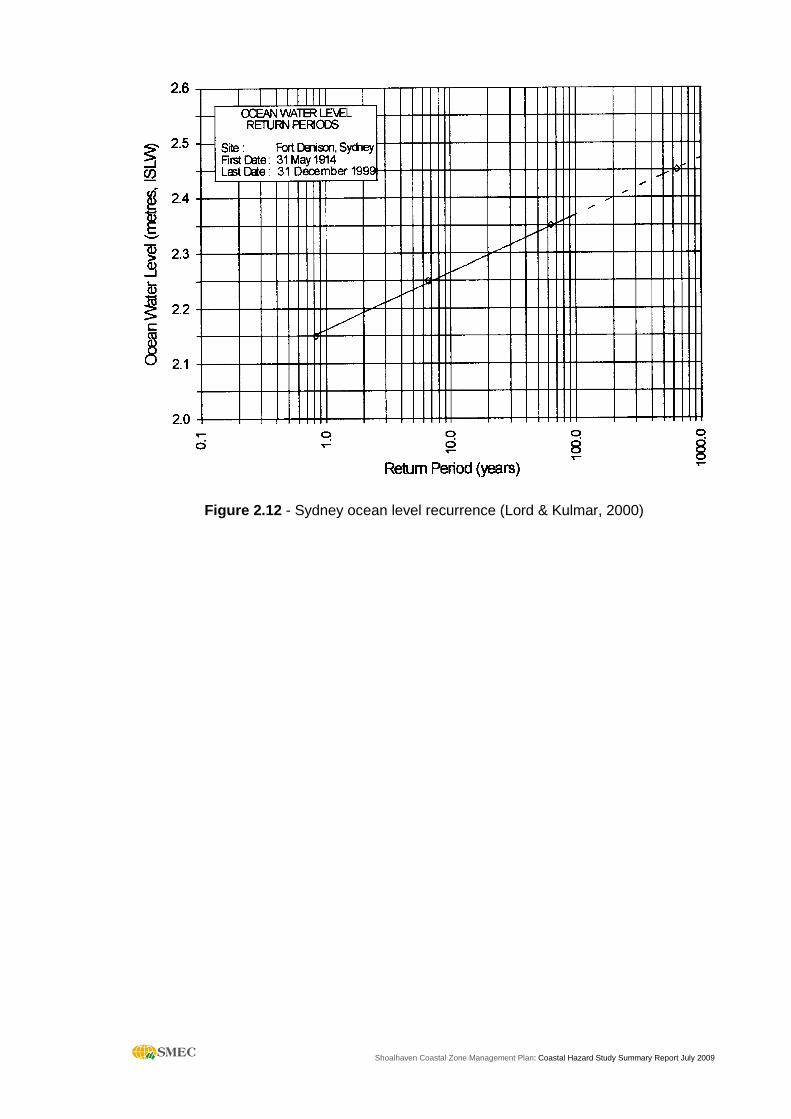
Shoalhaven Coastal Zone Management Plan: Coastal Hazard Study Summary Report July 2009
Figure 2.12 - Sydney ocean level recurrence (Lord & Kulmar, 2000)

Shoalhaven Coastal Zone Management Plan: Coastal Hazard Study Summary Report July 2009
Figure 3.1 - Dune stability schema (after Nielsen et al., 1992)
Equivalent Storm Erosion Demand
0
1
2
3
4
5
6
7
100 110 120 130 140 150 160 170 180
Chainage (m)
Leve
l (m
AH
D)
1971 pre-storm profile
1975 post-storm profile
φ = 35° Measured Volume Change
Assumed recovered sand volume
1V:10H 1V:10H
Figure 3.2 – Determination of equivalent storm erosion volume for 1974 storm event
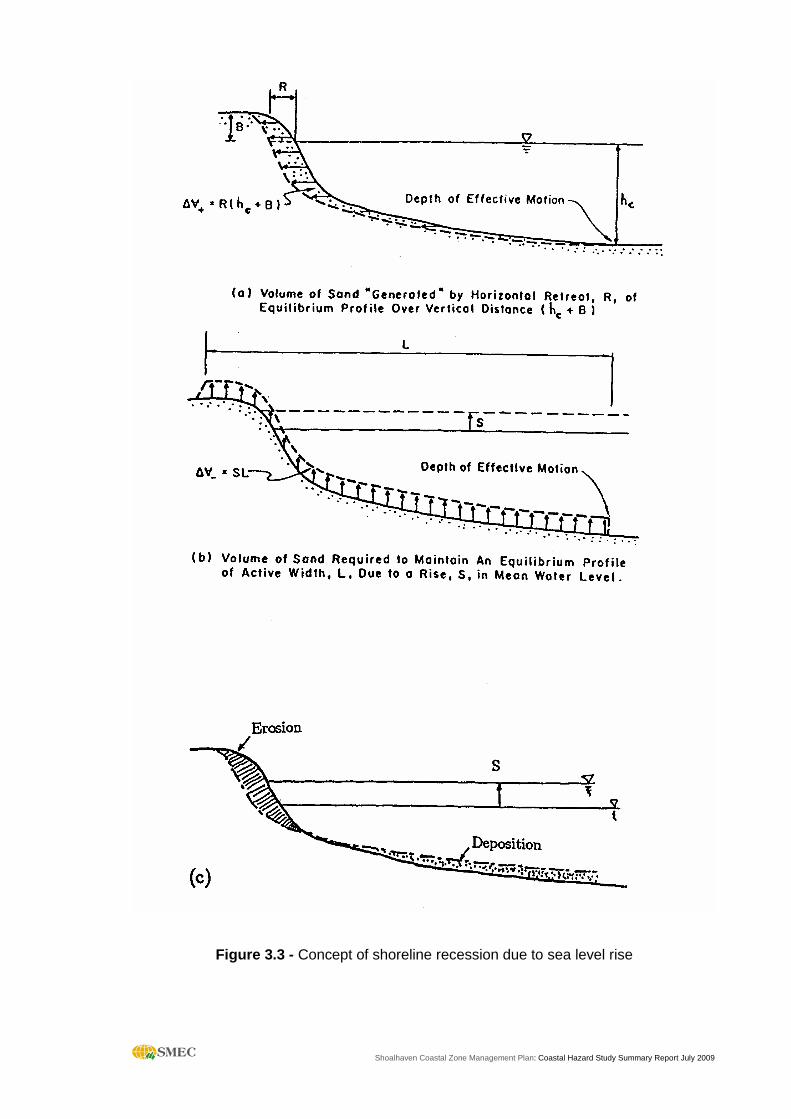
Shoalhaven Coastal Zone Management Plan: Coastal Hazard Study Summary Report July 2009
Figure 3.3 - Concept of shoreline recession due to sea level rise