
Appendix 13: PSS/E ANALYSES AND RESULTSero-ks.org/GIS/Volume6_PSSE_Study_final.pdf · Appendix 13:...
183
Appendix 13: PSS/E ANALYSES AND RESULTS Prepared By: SECI Interconnection Study Task Group (ISTG) March, 2005
Transcript of Appendix 13: PSS/E ANALYSES AND RESULTSero-ks.org/GIS/Volume6_PSSE_Study_final.pdf · Appendix 13:...

Appendix 13:
PSS/E ANALYSES AND RESULTS
Prepared By: SECI Interconnection Study Task Group (ISTG)
March, 2005
ii
GENERATION INVESTMENT STUDY
Transmission network checking
Draft Report
March, 2005
carried out by
ELECTRICITY COORDINATING CENTER, Ltd
11040 BELGRADE - VOJVODE STEPE 412, SERBIA AND MONTENEGRO
and
ENERGY INSTITUTE ”HRVOJE POŽAR“ - ZAGREB
ZAGREB – SAVSKA CESTA 163, CROATIA
Authors: Project leaders: Mr. Miroslav Vuković – EKC, Belgrade Mr. Davor Bajs – Energy Institute Hrvoje Požar, Zagreb Project coordinators: Mr. Trajce Čerepnalkovski – ESM, Skopje Mr. Kliment Naumoski – ESM, Skopje Ms. Marija Stefkova - Secretary Participants on project: Mr. Predrag Mikša – EKC, Belgrade Mr. Dobrijević Djordje – EKC, Belgrade Mr. Nijaz Dizdarevic – Energy Institute Hrvoje Požar, Zagreb Mr. Goran Majstrovic – Energy Institute Hrvoje Požar, Zagreb

iii
____________________________________________________________________________
Complete GIS Report
Table of contents
Volume 1 – Executive Summary 1 EXECUTIVE SUMMARY 7 Volume 2 – Main Report - Electricity Demand Forecast 2 ELECTRICITY DEMAND FORECAST 29
2.1 Objectives 29 2.2 What Are We Forecasting? 31 2.3 Background 33 2.4 Approach 40 2.5 Assumptions And Data Sources 44 2.6 Forecasting Model 48 2.7 Results And Validation 51
Volume 3 - Main Report - Generation & Transmission Study 3 GENERATION AND TRANSMISSION STUDY 75
3.1 Introduction 75 3.2 Computer Models 76 3.3 WASP And GTMax Runs 84 3.4 Candidate Plant 87 3.5 Fuel Costs 94 3.6 Fuel Costs – Utility Data 108 3.7 Fuel Costs – Reconciliation, Forecast Study Prices 111 3.8 Base Case Assumptions 116 3.9 Scenario A, B and C Results 121 3.10 Conclusions 163 3.11 Recommendations 172
4 REFERENCES 174 Volume 4 – Electricity Demand Forecast Appendices Appendix 1: Review of econometric studies into the relationship between GDP per capita and electricity demand Appendix 2: Details of the econometric analysis of the relationship between GDP per capita and net electricity consumption Appendix 3: Basis for long term GDP per capita growth forecasts Appendix 4: Load shape adjustments Appendix 5: Findings from ECA methodology review Appendix 6: Country electricity demand forecasts Volume 5 – Generation & Transmission Study Appendices Appendix 7: Country data profiles Appendix 8: Specific candidate plant and rehabilitation Appendix 9: Screening curve analysis and cost of rehabilitation Appendix 10: Hydro sensitivity analysis Appendix 11: GTMax Analyses and Results Appendix 12: Scenario A, B & C results Volume 6 – PSSE Appendix Appendix 13: PSSE Appendix
____________________________________________________________________________________
iv
CONTENTS:
ABBREVIATIONS vii
1. INTRODUCTION 1.1
2. STARTING CONDITIONS 2.1 2.1. Description of PSS/E Model 2.2
2.2. Prerequisites and Assumptions 2.4
2.3. Technical Specification of New Transmission Lines Candidates and Substations 2.7 Costs of the New Interconnection Overhead Lines 2.10 Costs of New Substations in 2010 and 2015 2.12
2.4. Remarks on PSS/E Transmission System Model and GTMax Model Harmonization 2.14 Load Demand 2.14 Network Topology 2.14 Production distribution 2.19 Exchange programs-desired interchange 2.38
3. ANALYSED GENERATION, DEMAND AND EXCHANGE SCENARIOS 3.1 3.1. Year 2010 Scenarios 3.2
3.2. Year 2015 Scenarios 3.6
4. LOAD FLOW AND CONTINGENCY ANALYSIS – REFERENCE CASES 4.1 Introduction 4.2
4.1 Scenario 2010 – average hydrology – topology 2010 4.2 4.1.1 Lines Loadings 4.2 4.1.2. Voltage Profile in the Region 4.7 4.1.3. Security (n-1) Analysis 4.8
4.2 Scenario 2010 – dry hydrology – topology 2010 4.11 4.2.1. Lines Loadings 4.11 4.2.2. Voltage Profile in the Region 4.14 4.2.3. Security (n-1) Analysis 4.14
4.3 Scenario 2010 – wet hydrology – topology 2010 4.16 4.3.1. Lines Loadings 4.16 4.3.2. Voltage Profile in the Region 4.20 4.3.3. Security (n-1) Analysis 4.21
4.4 Scenario 2015 - average hydrology – topology 2010 4.24 4.4.1. Lines Loadings 4.24 4.4.2. Voltage Profile in the Region 4.27 4.4.3. Security (n-1) Analysis 4.28
4.5 Scenario 2015 - average hydrology – topology 2015 4.31 4.5.1. Lines Loadings 4.31 4.5.2. Voltage Profile in the Region 4.34 4.5.3. Security (n-1) Analysis 4.35 4.5.4. Summary of Impacts - 2015 topology versus 2010 topology 4.36
v
4.6 Scenario 2015 - dry hydrology – topology 2010 4.38 4.6.1. Lines Loadings 4.38 4.6.2. Voltage Profile in the Region 4.41 4.6.3. Security (n-1) Analysis 4.42
4.7 Scenario 2015 - dry hydrology – topology 2015 4.44 4.7.1. Lines Loadings 4.44 4.7.2. Voltage Profile in the Region 4.47 4.7.3. Security (n-1) Analysis 4.48 4.7.4. Summary of Impacts - 2015 topology versus 2010 topology 4.50
4.8 Scenario 2015 - wet hydrology – topology 2010 4.51 4.8.1. Lines Loadings 4.51 4.8.2. Voltage Profile in the Region 4.56 4.8.3. Security (n-1) Analysis 4.57
4.9 Scenario 2015 - wet hydrology – topology 2015 4.61 4.9.1. Lines Loadings 4.61 4.9.2. Voltage Profile in the Region 4.66 4.9.3. Security (n-1) Analysis 4.67 4.9.4. Summary of Impacts - 2015 topology versus 2010 topology 4.69
5. LOAD FLOW AND CONTINGENCY ANALYSIS – SENSITIVITY CASES 5.1 Introduction 5.2
5.1 Scenario 2010 – average hydrology import/export – topology 2010 5.2 5.1.1 Lines Loadings 5.2 5.1.2. Voltage Profile in the Region 5.8 5.1.3. Security (n-1) Analysis 5.9
5.2 Scenario 2010 – average hydrology high load – topology 2010 5.11 5.2.1. Lines Loadings 5.11 5.2.2. Voltage Profile in the Region 5.15 5.2.3. Security (n-1) Analysis 5.15
5.3 Scenario 2015 – average hydrology import/export – topology 2010 5.18
5.4 Scenario 2015 – average hydrology import/export – topology 2015 5.20 5.4.1. Lines Loadings 5.20 5.4.2. Voltage Profile in the Region 5.25 5.4.3. Security (n-1) Analysis 5.26 5.4.4. Summary of Impacts - 2015 topology versus 2010 topology 5.27
5.5 Scenario 2015 – average hydrology high load – topology 2010 5.28 5.5.1. Lines Loadings 5.28 5.5.2. Voltage Profile in the Region 5.32 5.5.3. Security (n-1) Analysis 5.33
5.6 Scenario 2015 – average hydrology high load – topology 2015 5.36 5.6.1. Lines Loadings 5.36 5.6.2. Voltage Profile in the Region 5.40 5.6.3. Security (n-1) Analysis 5.40 5.6.4. Summary of Impacts - 2015 topology versus 2010 topology 5.42
6. ANALYSES SUMMARY AND RECOMMENDATIONS 6.1 6.1 Reference cases 6.2
6.1.1. Analyses comparison 6.2 6.1.2. Overview on possible solutions for system relief 6.5

vi
6.2 Sensitivity cases 6.7 6.2.1. Analyses comparison 6.7
Import/export sensitivity scenarios 6.7 High load growth rate 6.8
6.2.2. Overview on possible solutions for system relief 6.11
6.3 List of priorities 6.12
LITERATURE 7.1

vii
ABBREVIATIONS
Country codes
Country Name country
code nodes
country code ISO
AUT Österreich O AT ALB Shqiperia A AL BUL Bulgarija V BG BiH Bosna i Hercegovina W BA SUI Schweiz S CH GER Deutschland D DE GRE Hellas G GR HUN Magyarorszag M HU CRO Hrvatska H HR ITA Italia I IT MKD FYR Makedonija Y MK ROM Romania R RO SLO Slovenija L SI TUR Türkiye T TR UKR Ukraina U UA SCG Srbija i Crna Gora J CS -- Fictitious border node X --
Other abbreviations AC Alternating current DC Direct current CCGT Combined Cycle Gas Turbine CHP Combined Heat and Power HPP Hydro-power plant NPP Nuclear power plant TPP Thermal power plant FACTS Flexible AC transmission systems GDP Gross domestic product MW/Mvar Megawatt/Megavar HV High voltage NTC Net Transfer Capacity SEE South Eastern European Countries SECI South East European Cooperation Initiative RTSM Regional transmission system model TRM Transmission Reliability Margin TSO Transmission System Operator TR Transformer HL High voltage line OHL Overhead high voltage line PSS/E Power System Simulator for Engineering Abbreviations of Electric power utilities and Transmission system operators: EPCG Electric power utility of Montenegro EPS Electric power utility of Serbia HTSO Hellenic transmission system operator CENTREL Association of transmission system operators of Czech, Hungary, Poland, and Slovakia UCTE Union for the Coordination of Transmission of Electricity

1.1
1 INTRODUCTION The main objective of the Generation Investment Study is to assist the EC, IFIs and donors in identifying an indicative priority list of investments in power generation and related electricity infrastructure from the regional perspective and in line with the objectives of SEE REM. The study would determine what the optimal timing, size and location would be of future generating capacity in the region over the next 15 years (2005 – 2020). It will also identify priority investments in main transmission interconnections between the countries and sub-regions to help optimize investment requirements in power generation over the study horizon. The expansion of the generation system will be optimized over a 15 year horizon (2005 – 2020) for three scenarios (isolated operation of each power system, regional operation of power systems, market conditions) using the WASP and GTMax models. The third scenario includes power system constraints, such as the capacity of the interconnections, and other constraints such as the maximum amount of import capacity and energy each country will be willing to depend upon. For the analysis of the third scenario the study team used, in addition to the WASP model, the Generation and Transmission Maximization Model (GTMax). GTMax was used to perform modeling of the electricity grid operated under the SEE REM conditions. It took into account the transfer capabilities of the interconnection lines among the utility systems. For more detailed view on regional transmission network operation under market conditions SECI Regional Transmission System Model in PSS/E was used. Input data concerning demand and production for several scenarios analyzed in GTMax was used in PSS/E Regional Transmission System Model (PSS/E RTSM) in order to check feasibility of such demand/production scenarios from transmission network prospective. PSS/E RTSM was created by SECI (South East Europe Cooperative Initiative) Project Group on the Regional Transmission System Planning, sponsored by USAID. With a participation of all power system utilities in South-East Europe, the Project Group finalized PSS/E RTSM for year 2005 and 2010, suitable for load flow, short-circuit and dynamic analysis. The following countries/companies were involved in PSS/E RTSM creation: Albania – KESH; Bosnia and Herzegovina – ZEKC, EPBiH, EPRS, EPHZHB; Bulgaria – NEK; Croatia – HEP, EIHP; Macedonia – ESM; Greece – PPC/HSTO; Hungary – MVM; Romania – Transelectrica; Serbia and Montenegro – EPS, EKC, EPCG; Slovenia – ELES; Turkey – TEAS. Two models were created for each time horizon: winter maximum demand and summer minimum demand models for 2005 and 2010. Analysis on PSS/E RTSM should provide insight to transmission network adequacy and determine what transmission reinforcements or additions priorities are eventually required to meet GTMax 2010 and 2015 generation dispatch under normal and (n-1) operating conditions. Total of 14 GTMax scenarios were analyzed on PSS/E RTSM: Scenario 2010 - topology 2010
- average hydrology - dry hydrology - wet hydrology Scenario 2015 - average hydrology - topology 2010 - topology 2015 - dry hydrology - topology 2010 - topology 2015

1.2
- wet hydrology - topology 2010 - topology 2015 Scenario 2010
– average hydrology import/export – topology 2010 high load – topology 2010
Scenario 2015 – average hydrology import/export – topology 2010
– topology 2015 high load – topology 2010
– topology 2015 PSS/E RTSM was adjusted according to GTMax model concerning network topology, demand, production and exchange data. SEE Region was observed as self sufficient without any additional exchanges with UCTE. For each GTMax scenario steady-state load flows were calculated and contingency analyses (n-1) were performed. Security criterion based on voltage profile and lines congestions (thermal loadings) were checked for each analyzed scenario. Special attention was directed on existing and planned interconnection lines between different SEE power systems (countries). Possible network bottlenecks were identified and some solutions for transmission system relief were described. The role of new interconnection lines candidates in bottlenecks removal was evaluated. Following chapters describe PSS/E RTSM, analyzed GTMax production, demand and exchange scenarios, results of load flow and contingency analyses. List of important regional transmission system infrastructure projects from a viewpoint of support given to analyzed GTMax dispatch scenarios is presented at the end of this report.

2.1
2. STARTING CONDITIONS

2.2
2.1. Description of PSS/E Model
For all calculations performed in this part of the study, professional software package PSS/E™ (Power System Simulator for Engineering) is used. The Power System Simulator for Engineering (PSS/E) model is a system of computer programs and structured data files designed to handle the basic functions of power system performance simulation work, namely:
• Data handling, updating, and manipulation • Power Flow • Optimal Power Flow • Fault Analysis • Dynamic Simulations + Extended Term dynamic Simulations • Open network Access and Price calculation • Equivalent Construction
Since its introduction in 1976, the PSS/E tool has become the most comprehensive, technically advanced, and widely used commercial program of its type. It is widely recognized as the most fully featured, time-tested and best performing commercial product available in the market. The program employs the latest technology and numerical algorithms to efficiently solve networks large and small.
PSS/E is comprised of the following modules: PSS/E Power Flow: This module is basic PSS/E program module and it is powerful and easy-to-use for basic power flow network analysis (Figure 2.1.1). Besides analysis tool this module is also used for Data handling, updating, and manipulation.
Figure 2.1.1 – PSS/E model Graphical interface
PSS/E Optimal Power Flow (PSS/E OPF): PSS/E Optimal Power Flow (PSS/E OPF) is a powerful and easy-to-use network analysis tool that goes beyond traditional load flow analysis to fully optimize and refine a transmission system. This task is achieved with the integration of PSS/E OPF into the PSS/E load flow program. PSS/E OPF improves the efficiency and throughput of power system performance studies by adding intelligence to the load flow solution process.

2.3
Whereas the conventional load flow relies on an engineer to systematically investigate a variety of solutions before arriving at a satisfactory solution, PSS/E OPF directly changes controls to quickly determine the best solution. From virtually any reasonable starting point, you are assured that a unique and globally optimal solution will be attained; one that simultaneously satisfies system limits and minimizes costs or maximizes performance.
PSS/E Balanced or Unbalanced Fault Analysis: The PSS/E Fault Analysis (short circuit) program is fully integrated with the power flow program. The system model includes exact treatment of transformer phase shift, and the actual voltage profile from the solved power flow case. PSS/E Dynamic Simulation: PSS/E offers users uncompromising dynamic simulation capabilities. It models system disturbances such as faults, generator tripping, motor starting and loss of field. The program contains an extensive library of generator, exciter, governor, and stabilizer models as well as relay model including underfrequency, distance and overcurrent relays to accurately simulate disturbances.
The organization of PSS/E is illustrated in the following figure Figure 2.1.2:
Figure 2.1.2 – Organization of PSS/E model modules
Current version of this software package and version used for calculations is version 30.2.

2.4
2.2. Prerequisites and Assumptions
For more detailed view on regional transmission network operation under market realistic conditions SECI Regional Transmission System Model (RTSM) in PSS/E is used. Figure 2.1.1 shows which countries and their transmission systems were modeled.
Figure 2.2.1 - SECI Regional Transmission System Model – countries modeled
High voltage transmission network of 750 kV, 400kV, 220kV, 150kV (Greece and Turkey), and 110 kV voltage levels is implemented in the model. Also, all new substations and lines that are expected to be operational till 2010 (according to the long term development plans) are modeled too. All generation units that are connected to the transmission voltage level are modeled as they are in reality (with step-up transformers). Model is designed for load-flow calculations and analysis, but with adequate data input (already developed and tested) it can be used for other type of analysis too:
• Short-circuit calculations • Dynamics (transient stability assessment)
Figure 2.2.2 shows the main characteristics of the SECI Regional Transmission System Model. With adequate changes and appropriate data input this model is used for all calculations and analyses in this project.
ELEMENT TYPE # W S # W S # W S # W S # W S # W S # W S # W SBUSES 97 97 97 635 602 586 236 230 231 247 247 245 47 45 47 993 889 749 117 117 117 1067 1006 963PLANTS 14 12 14 112 81 65 38 36 36 59 59 59 8 8 8 100 84 56 22 22 22 132 183 139MACHINES 30 23 13 144 84 49 42 27 10 62 52 32 23 22 12 107 86 54 22 20 3 132 182 87LOADS 72 72 72 644 606 590 137 131 131 162 147 147 32 32 33 415 379 267 78 76 73 831 711 679LINES 107 107 107 747 711 709 278 260 261 325 308 308 249 202 202 1051 901 789 145 138 138 1295 1135 1135
400 4 40 13 21 114 96 10 47220 21 56 39 28 135 3 114150110 82 651 226 276 933 132 1134
66 830 14
TRANSFORMERS 50 44 39 170 129 110 72 66 65 95 93 93 12 12 12 260 236 208 32 32 32 293 203 158STEP UP 23 102 38 60 0 94 22 144
NETWORK 27 68 34 35 12 166* 10 149
ELEMENT TYPE # W S # W S # W S # W S # W S # W S # W S # W S # W SBUSES 190 190 190 417 408 368 43 39 35 460 447 403 3 3 3 88 88 88 2 2 2 4182 3963 3721PLANTS 57 48 44 69 63 25 11 7 3 80 70 28 3 3 3 34 32 30 2 2 2 661 640 506MACHINES 63 54 23 77 71 25 11 7 3 88 78 28 3 3 3 34 31 25 2 2 2 752 664 341LOADS 111 111 111 251 249 240 19 19 19 270 268 259 0 0 0 72 72 71 0 0 0 2824 2605 2433LINES 232 231 231 0 502 471 468 50 48 48 552 519 516 5 5 5 156 149 151 2 2 2 5144 4668 4554
400 14 41 5 46 46 451 0 0220 9 64 11 75 110 590 0 0150 0 0 0110 209 397 34 431 4074 0 0
66 8 0 030 14 0 0
TRANSFORMERS 75 75 75 0 139 129 92 21 17 13 160 146 105 0 0 0 19 19 19 0 0 0 1238 1055 916STEP UP 57 72 11 83 0 623 0 0
NETWORK 18 67 10 77 19 615 0 0
# total number of elementsW number of elements with status in in Winter maximum modelS number of elements with status in in Summer minimum model* - equivalent lines included
HUNGARY GREECE FYRMAREA ALBANIA BULGARIA BIH ROMANIA10 20 30 40 45 50 60 70
CROATIA
SLOVENIA TURKEY SERBIA MONTENEGROMODEL
SCG UKRAIN UCTE-WEST CENTRELAREA REGIONAL75 80 90 91 90 65 55 95
Figure 2.2.2 – SECI Regional Transmission System Model – model characteristics
2.5
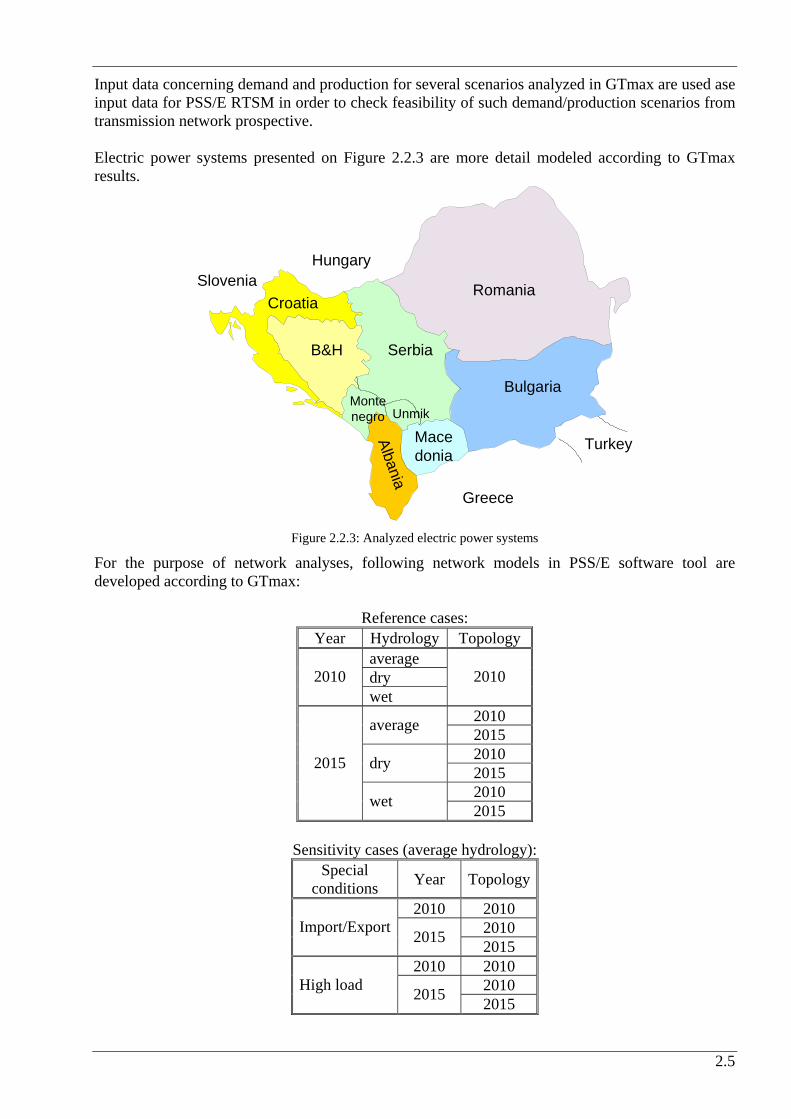
Input data concerning demand and production for several scenarios analyzed in GTmax are used ase input data for PSS/E RTSM in order to check feasibility of such demand/production scenarios from transmission network prospective. Electric power systems presented on Figure 2.2.3 are more detail modeled according to GTmax results.
Figure 2.2.3: Analyzed electric power systems
For the purpose of network analyses, following network models in PSS/E software tool are developed according to GTmax:
Reference cases: Year Hydrology Topology
average dry 2010 wet
2010
2010 average 2015 2010 dry 2015 2010
2015
wet 2015
Sensitivity cases (average hydrology): Special
conditions Year Topology
2010 2010 2010 Import/Export 2015 2015
2010 2010 2010 High load 2015 2015
CroatiaRomania
Bulgaria
Serbia
Macedonia
B&H
Albania
Turkey
Montenegro Unmik
Greece
HungarySlovenia

2.6
For all these models, expected topology and load distribution in corresponding system substations are modeled. In Regional Transmission Network Model for the years 2010 and 2015 the most recent information including new planed lines generator units with step-up transformers, transformers, compensators, phase shift transformers, shunts, etc are included. Generator units are connected at generator voltage level.
In the models, whole 110 kV and above network is included. Each interconnection line has assigned an X node which is placed on border of each country (not at middle of tie line). The model for year 2015 is obtained by increasing production and consumption in each electric power system according to results from GTmax calculation and respect to new planed lines and substations. Voltage levels, with the upper and lower limits used in the study, are presented in the Table 2.2.1 These limits are used in load-flow calculations as in contingency analysis.
Table 2.2.1: Defined limits for voltage levels
Defined voltage levels
750 kV 400 kV 220 kV 150 kV 110 kV Generator
min max min max min max min max min max min max
kV 712 787 380 420 198 242 135 165 99 121
p.u. 0,95 1,05 0,95 1,05 0,90 1,10 0,90 1,10 0,90 1,10 0,95 1,05
These limits are according to the operational and planning standards used in the monitored region, and they are used for full topology and "n-1" analyses. Although, in emergency conditions for some voltage levels wider voltage limits are allowed, these are not taken into consideration. The system adequacy is checked for operating conditions using “n-1” contingency criterion. List of contingencies includes:
• all interconnection lines; • all 400 and 220 kV lines, except lines which outage cause “island” operation (in case of
parallel lines and double circuit lines, outage of one line-circuit is considered); • all transformers 400/x kV (in case of parallel transformers, outage of one transformer is
considered). Current thermal limits are used as rated limits for lines and transformers. These limits are established based on a temperature to which conductor is heated by current above which either the conductor material would start being softened or the clearance from conductor to ground would drop beyond permitted limits. For these analyses is used that conductor current must not reach limits imposed by thermal limit defined for conductors material and cross-section according to standard the IEC (50) 466: 1995 – International Electro technical Vocabulary - Chapter 466: Overhead Lines. For transformers, rated installed MVA power is used as thermal limit. Every branch with current above its thermal limit is treated as overloaded. All system states in which voltage level is outside permitted limits or branches are loaded beyond thermal limit (overloaded), by full topology or "n-1" contingency analyses, are treated as "insecure states" and referenced as such in this study.

2.7
2.3. Technical Specification of New Transmission Lines Candidates and Substations
Interconnection lines between analyzed electric power systems are presented on the Figure 2.3.1 and Table 2.3.1.
THESSALONIKI
KARDIA
BLAGOEVGRAD
ELBASAN
MacedoniaVAU DEJES
PODGORICA
KOSOVO B
FIERZE
PRIZREN
MOSTAR KONJSKO
VISEGRAD VARDISTE
SKOPJE
MEDJURIC S.MITROVICA
ERNESTINOVOTUMBRI MELINE
MRACLIN SUBOTICA
ARAD
DJERDAP PORTILE de FIER
SOFIA
NIS
Bulgaria
TANTARENI ISALNITA
KOZLODUY VARNA DOBRUJA
ISACCEA
VULKANESTI
PIVDENNOUKRAINSKAAES West-
Ukraina
Romania
HungaryAustria
Slovenia
Croatia Bosnia Hercegovina
SARAJEVO 220
Greece
MARITSA 3
BABAESKI
-Serbia
HEVIZ
ZERJAVINEC
Albania
UCTE
CENTREL
Moldavia
DJAKOVO GRADACAC
PERUCICA
KRSKO
UGLJEVIKPRIJEDOR (Jajce)
Slovakia
SANDORFALVA
ZAKUCAC
TUZLA
TREBINJE
220 kV line (22) 400 kV line (33) 750 kV line (3)
only border lines - status 2005 year
DUBROVO
Italy
MONTENEGRO
PIVA
Turkey
Interconnected network of SE
countries
RAMA
PLAT
ZEMLAK
LAGAD
HAMITABAT
Figure 2.3.1: Interconnection lines in Southeast Europe in 2005 year
Planned interconnection lines in Southeastern Europe for years 2010 and 2015 are given in Figure 2.3.2 and Table 2.3.2 and Table 2.3.3. All of these planned interconnection lines are included in PSS/E models for target years respectively, depending of years of commissioning. Basic technical data of new interconnection transmission lines candidates which are analyzed in 2015 year as variants only, are shown in Table 2.3.4. It should be noted that new interconnection transmission lines candidates, which are shown as doted lines, are analyzed in 2015 year as variants only.

2.8
Table 2.3.1: List of interconnection lines in Southeast Europe in 2005 year
Interconnection line Interconnected Voltage Conductors Transfer countries level Type Size Number Capacity
(kV) (mm2) per phase (MVA) I to border border to II totalVarna - Isaccea* BG - RO 750 ACSR 300 5 2390 150 85 235Albertirsa - Zapadoukrainska HU - UA 750 ACSR 400 5 5360 268 254 522Isaccea - Pivdenoukrainska* RO - UA 750 ACSR 400 5 5360 5 395 400God - Levice HU - SK 400 ACSR 500/350 2/3 1440 88 36 124Gyor - Gabcikovo HU - SK 400 ACSR 500/450 2/3 1440 29 15 44Zemlak - Kardia AL - GR 400 ACSR 500 2 1309 21 80 101Mostar4 - Konjsko BA - HR 400 ACSR 490 2 1318 41 69 110Ugljevik - Ernestinovo BA - HR 400 ACSR 490 2 1318 39 53 92Blagoevgrad - Lagad (Thesaloniki) BG - GR 400 ACSR 500 2 1309 72 102 174Dobruja - Isaccea BG - RO 400 ACSR 400 3 1715 81 150 231Maritsa Istok - Hamitabat BG - TR 400 ACSR 400 3 1715 59 90 149Isaccea - Vulcanesti* RO - MOLD 400 ACSR 400 3 1715 5 54 59Kozlodui - Tintareni (double) BG - RO 400 ACSR 500/300 2/3 2490 14 102 116Sofia - Nis BG - SER 400 ACSR 500 2 1330 37 86 123Maritsa Istok - Babeski BG - TR 400 ACSR 500 2 1309 50 77 127Zerjavinec - Heviz (double) HR - HU 400 ACSR 490 2 1318 99 69 168Dubrovo - Thessaloniki MK - GR 400 ACSR 490 2 1330 55 60 115Skopje - Kosovo B MK - SER 400 ACSR 490 2 1330 36 68 104Arachtos - Galatina HVDC GR - IT 400 HVDC 500 / / 0Gyor - Wien Sud (double) HU - AT 400 ACSR 500 2 2563 59 63 122Podgorica - Trebinje MN - BA 400 ACSR 490 2 1330 60 21 81Arad - Sandorfalva RO - HU 400 ACSR 450/500 2 1212 5 52 57Portile de Fier - Djerdap RO - SER 400 ACSR 967 2 1330 1 2 3Rosiori - Mukachevo RO - UA 400 ACSR 450 2 1212 39 36 75S. Mitrovica - Ernestinovo SER - HR 400 ACSR 490 2 1330 41 52 93Subotica - Sandorfalva SER - HU 400 ACSR 490 2 1330 27 21 48Maribor - Keinchtal (double) SI - AT 400 ACSR 490 2 1330 26 37 63Divaca - Meline SI - HR 400 ACSR 490 2 1318 41 26 66Krsko - Tumbri (double) SI - HR 400 ACSR 490 2 1318 16 32 48Divaca - Redipuglia SI - IT 400 ACSR 490 2 1330 39 10 49Mukachevo - Sajoszeged UA - HU 400 ACSR 400 2 1386 8 142 150V.Dejes - Podgorica AL - MN 220 ACSR 360 1 301 47 21 68Fierze - Prizren AL - SER 220 ACSR 360 1 301 26 45 71Gradacac - Djakovo BA - HR 220 ACSR 360 1 300 19 27 46Prijedor - Mraclin BA - HR 220 ACSR 360 1 300 66 66Mostar4 - Zakucac BA - HR 220 ACSR 360 1 300 49 50 99Prijedor2 - Medjuric BA - HR 220 ACSR 360 1 300 34 32 66TE Tuzla - Djakovo BA - HR 220 ACSR 360 1 300 65 27 92Trebinje - HE Dubrovnik BA - HR 220 ACSR 240 2 491 7 5 12Trebinje - HE Dubrovnik BA - HR 220 ACSR 240 2 491 7 5 12Trebinje - HE Perucica BA - MN 220 ACSR 360 1 301 20 42 63Sarajevo20 - HE Piva** BA - MN 220 ACSR 490 2/1 366 61 23 84Visegrad - Pozega BA - SER 220 ACSR 360 1 301 18 51 69Zerjavinec - Cirkovce HR - SI 220 ACSR 360 1 300 19 51 70Skopje - Kosovo A MK - SER 220 ACSR 360 1 301 18 65 82Skopje - Kosovo A MK - SER 220 ACSR 360 1 301 18 65 82Gyor - Wien Sud HU - AT 220 ACSR 360 1 305 59 63 122Gyor - Neusiedl HU - AT 220 ACSR 360 1 305 55 27 82Podlog - Obersielach SI - AT 220 ACSR 490 1 366 46 20 65Divaca - Pehlin SI - HR 220 ACSR 490 1 350 47 6 53Divaca - Padriciano SI - IT 220 ACSR 490 1 366 10 2 11Mukachevo - Kisvarda UA - HU 220 ACSR 400 1 308 54 10 64Mukachevo - Tiszalok UA - HU 220 ACSR 400 1 308 97 35 132*not in model**built as 400kV line Sarajevo20 - B.Bijela and 220kV B.Bijela - Piva, but operated as 220kV Sarajevo20 - Piva
lengthkm

2.9
UCTE
CENTREL
Macedonia
Bulgaria
Romania Hungary
Slovenia
Croatia Bosnia Hercegovina
Greece
Albania
MONTENEGRO
Serbia
Turkey
VAU DEJES
PODGORICA KOSOVO B
SKOPJE
S.MITROVICA
MARITSA 3
BABAESKI
UGLJEVIK
planned border lines only (status 2010 and 2015 year)
Interconnected network of SE
countries
ZEMLAK
PECS
FILIPI
KERHOS BITOLA
FLORINA
STIP
C.MOGILA
NADAB
VRANJE
KASHAR
ERNESTINOVO SOMBOR
PLJEVLJA
VISEGRAD
BANJA LUKA
TUMBRI
220 kV line400 kV line750 kV line
2015 2010 candidates
Figure 2.3.2: Planned interconnection lines in Southeast Europe in years 2010 and 2015
Table 2.3.2: List of interconnection lines in Southeast Europe, planned to come into operation in year 2010
Interconnection line Interconnected Voltage Conductors Transfer countries level Type Size Number Capacity
(kV) (mm2) per phase (MVA) I to border border to II totalUgljevik - S. Mitrovica BA - SER 400 ACSR 490 2 1330 49 29 79Kashar - Podgorica AL - MN 400 ACSR 490 2 1330 115 30 145Maritsa Istok - Filipi BG - GR 400 ACSR 400 3 1715 133 110 243C. Mogila - Stip BG - MK 400 ACSR 490 2 1330 80 70 150Ernestinovo - Pecs (double) HR - HU 400 ACSR 490/500 2 1330 44 41 85Bekescaba - Nadab (Oradea) HU - RO 400 ACSR 490 2 1178 31 87 118Florina - Bitola GR - MK 400 ACSR 490 2 1330 20 18 38(Filipi) - Kehros - Babaeski GR - TR 400 ACSR 400 3 1715 50 50 100
lengthkm
Table 2.3.3: List of interconnection lines in Southeast Europe, planned to come into operation in year 2015
Interconnection line Interconnected Voltage Conductors Transfer countries level Type Size Number Capacity
(kV) (mm2) per phase (MVA) I to border border to II totalZemlak - Bitola AL - MK 400 ACSR 490 2 1330 25 60 85Kashar (V. Dejes) - Kosovo B AL - SER 400 ACSR 490 2 1330 135 80 215Skopje - Vranje - (Leskovac) - (Nis) MK - SER 400 ACSR 490 2 1330 55 137 192
lengthkm
Table 2.3.4: New transmission lines candidates
Interconnection line Interconnected Voltage Conductors Transfer countries level Type Size Number Capacity
(kV) (mm2) per phase (MVA) I to border border to II totalVisegrad - Pljevlja BA - MN 400 ACSR 490 2 1330 30 30 60Tumbri - Banja Luka HR - BA 400 ACSR 490 2 1330 50 150 200Pecs - Sombor HU - SER 400 ACSR 490 2 1330 20 60 80
lengthkm

2.10
All interconnection lines candidates that are investigated in the analyses are shown as dotted lines in Figure 2.3.2. Table 2.3.5 shows typical electrical parameters of different types of lines. These parameters are used for both the planned lines and interconnection lines candidates in the Study.
Table 2.3.5: Electrical parameters for OHL per phase and kilometer
*Type of conductor A - B* C
ACSR ACSR CARDINAL ACSR Positive sequence
2x490 mm2 1x490 mm2 3x400 mm2 360 mm2
Series resistance r [Ω/km per phase] 0.0294 0.058 0.0207 0.08
Series reactance x [Ω/km per phase] 0.341 0.427 0.2824 0.436
Charging susceptance b [µS/km per phase] 3.371 2.67 4.056 2.6
Rated current [A] 1920 960 2292 790
* In Turkey and Greece, Canadian-American standards are used Costs of the New Interconnection Overhead Lines Electricity towers, and the wires and conductors that they support, are the major way of transmitting electricity. They are generally a lattice steel structure with a number of cross arms. The type, size, height and spacing of towers are determined by geographical, operational, safety and environmental considerations. A typical overhead line route will involve three types of tower:
− suspension (used for straight lines), − deviation (where the route changes direction), − terminal (where the lines connect with substations or underground cables).
A suspension tower is typically between 40 to 60 meters in height with a phase to phase spacing of between 7 and 25 meters, depending on the type of tower. The two principal types are the “pine” which narrows at the top and the Y shaped “delta”. The width of the tower right of way will depend on the level of power to be transmitted but typically range between 30 and 50 meters for 400 kV. For 400 kV, towers are usually spaced around 350 to 450 meters apart and provide ground clearance of at least seven meters in all weather conditions. Higher clearances usually apply if the route crosses motorways or high-pressure water hoses and minimum clearance for trees and public street lighting also apply. Towers for 400 kV are typically made from steel. In the absence of a defined methodology to calculate capital charges and costs, and in order to evaluate investments, unit price method is implemented in following review. Given unit price related to construction costs take into consideration configuration of terrain (flat land, medium mountain, high mountain). In Table 2.3.6 and Table 2.3.7 average estimated prices for each new element that is expected to be in operation in 2010 and 2015 year are presented. Total investment values for lines construction and corresponding elements till 2010 year is presented in Table 2.3.6 in EUROS. The investments cover total length of transmission lines and construction of 400 kV transmission line bays in appropriate substations. Total investment costs of transmission line bays include costs of following elements:
− construction of 400 kV transmission line itself − transmission line bays (400 kV)
o Breakers o Disconnectors with blades ground o Disconnectors without blades

2.11
o Current Measuring Transformers o Voltage Measuring Transformers o Lightning Arrester
These total price values of lines do not take into consideration lease of land.
Table 2.3.6: Total investment sum of interconnection lines in Southeast Europe, planned in year 2010
Unit Total Unit Number Totalprice price price of bays price
km Euro/km Euro Euro EuroUgljevik - S. Mitrovica BA - SER 79 200,000 15,720,000 650,000 2 1,300,000 2005/06Kashar (V. Dejes) - Podgorica AL - MN 145 235,000 34,075,000 650,000 2 1,300,000 2006/07Maritsa Istok - Filipi BG - GR 243 235,000 57,105,000 650,000 2 1,300,000 2007/08C. Mogila - Stip BG - MK 150 220,000 33,000,000 650,000 2 1,300,000 2006/07Ernestinovo - Pecs (double) HR - HU 85 240,000 20,400,000 650,000 2 1,300,000 2007/08Bekescaba - Nadab (Oradea) HU - RO 118 250,000 29,500,000 650,000 2 1,300,000 2008Florina - Bitola GR - MK 38 235,000 8,930,000 650,000 2 1,300,000 2006/07(Filipi) - Kehros - Babaeski GR - TR 100 240,000 24,000,000 650,000 2 1,300,000 2007/08
Year ofcommisionningInterconnection line Interconnected
countries Length Total price
Euro
Lines TL Bays Lines & Bays
21,700,00030,800,00010,230,00025,300,000
17,020,00035,375,00058,405,00034,300,000
Comments:
Interconnection line 400 kV Ugljevik (BA) – S.Mitrovica (CS). This tie line should increase system stability, security and transmission capacity between west and east region and between Bosnia and Serbia and Montenegro. It is under construction (part in Bosnia is finished) and should be completed by the end of this year.
Interconnection line 400 kV Podgorica (CS) – Kashar (V.Dejes) (AL) This new tie line should increase system stability, security and transmission capacity between west and east (CS–AL–GR). Feasibility Study was made two years ago. Participation for construction of this line will be proportional to the length of the line from the border (27 km in Montenegro and 115 km in Albania). It should be completed by the year 2006/7. Estimated investment cost is about 35,375 M€.
Interconnection line 400 kV Maritsa Istok (BG) – Filipi (GR). Feasibility Study was made 3 two years ago. Participation for construction of this line will be proportional to the length of the line from the border (133 km in Bulgaria and 110 km in Greece). To be completed by the year 2007/8. Estimated investment cost is about 58,5 M€ and investor is unknown yet.
Interconnection line 400 kV C. Mogila (BG) – Stip (MK) Feasibility Study was made 2-3 two years ago. This new tie line should increase system stability, reliability, security and transmission capacity between north and south as well as between Bulgaria and Macedonia. Participation for construction of this line will be proportional to the length of the line from the border (80 km in Bulgaria and 70 km in Greece). It should completed by the year 2006/7. Estimated investment cost is about 35 M€. Investor is unknown yet.
Interconnection line 400 kV Ernestinovo (HR) – Pecs (HU) (double line) This tie line should increase system stability, security and transmission capacity between north and south regions and between Croatia and Hungary. It is included development plans of HEP (Electric Company of Croatia) and MVM (Electric Company of Hungary). It should be completed by the year 2007/8. Estimated investment cost is about 21.7 M€. Investor is unknown yet.
Interconnection line 400 kV Bekescsaba (HU) – Nadab (Oradea) (RO) Construction Agreement between MVM and Transelectrica is under signing procedure. It should be completed by the year 2008.
2.12
Interconnection line 400 kV Florina (GR) – Bitola (MK) Feasibility Study was made 3 two years ago. This line should increase system security and transmission capacity between north and south (MK–GR). Participation for construction of this line will be proportional to the length of the line from the border (20 km in Greece and 18 km in Macedonia). It should be completed by the year 2006/7. Estimated investment cost is about 10 M€. Investor is unknown yet.
Interconnection line 400 kV Filipi (Kehros) (GR) – Babaeski (TR) Feasibility Study was made 2-3 two years ago. Participation for construction of this line will be proportional to the length of the line from the border (190 km in Greece and 70 km in Turkey). It should be completed by the year 2007/8. Estimated investment cost is about 25 M€. Investor is unknown yet.
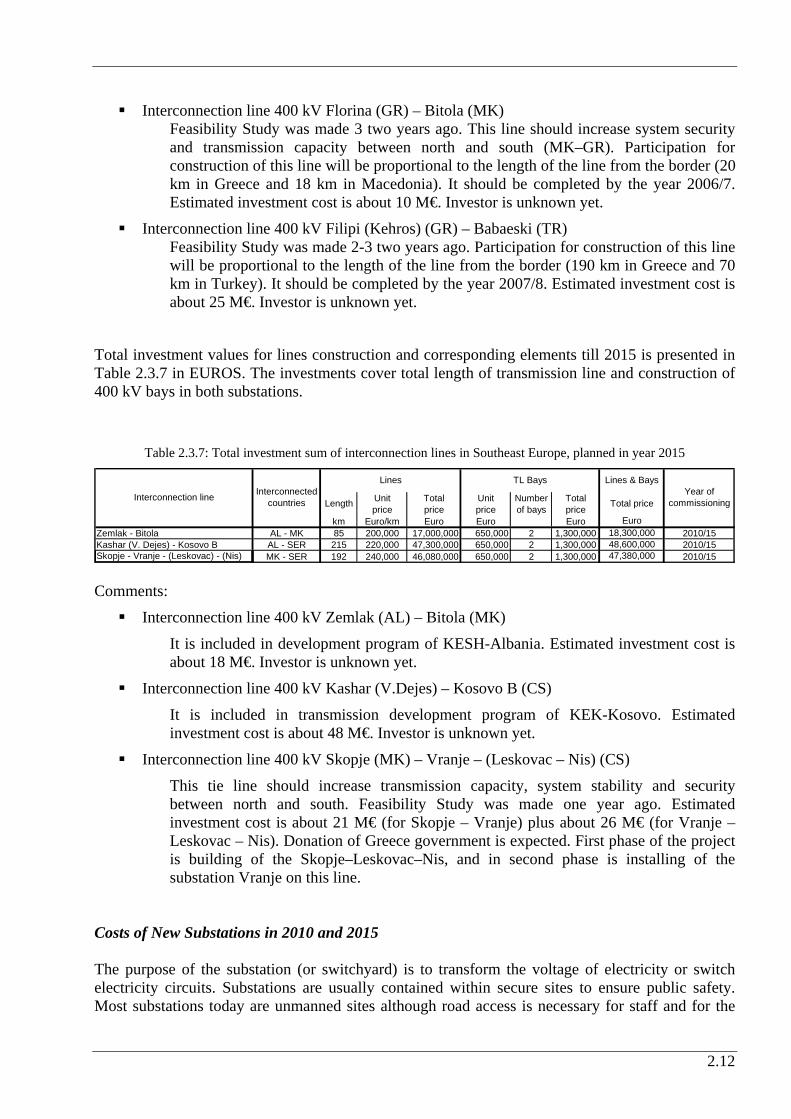
Total investment values for lines construction and corresponding elements till 2015 is presented in Table 2.3.7 in EUROS. The investments cover total length of transmission line and construction of 400 kV bays in both substations.
Table 2.3.7: Total investment sum of interconnection lines in Southeast Europe, planned in year 2015
Unit Total Unit Number Totalprice price price of bays price
km Euro/km Euro Euro EuroZemlak - Bitola AL - MK 85 200,000 17,000,000 650,000 2 1,300,000 2010/15Kashar (V. Dejes) - Kosovo B AL - SER 215 220,000 47,300,000 650,000 2 1,300,000 2010/15Skopje - Vranje - (Leskovac) - (Nis) MK - SER 192 240,000 46,080,000 650,000 2 1,300,000 2010/15
18,300,00048,600,00047,380,000
Year ofcommissioning
Euro
Lines & BaysInterconnected
countriesInterconnection line Length Total price
Lines TL Bays
Comments:
Interconnection line 400 kV Zemlak (AL) – Bitola (MK)
It is included in development program of KESH-Albania. Estimated investment cost is about 18 M€. Investor is unknown yet.
Interconnection line 400 kV Kashar (V.Dejes) – Kosovo B (CS)
It is included in transmission development program of KEK-Kosovo. Estimated investment cost is about 48 M€. Investor is unknown yet.
Interconnection line 400 kV Skopje (MK) – Vranje – (Leskovac – Nis) (CS)
This tie line should increase transmission capacity, system stability and security between north and south. Feasibility Study was made one year ago. Estimated investment cost is about 21 M€ (for Skopje – Vranje) plus about 26 M€ (for Vranje – Leskovac – Nis). Donation of Greece government is expected. First phase of the project is building of the Skopje–Leskovac–Nis, and in second phase is installing of the substation Vranje on this line.
Costs of New Substations in 2010 and 2015 The purpose of the substation (or switchyard) is to transform the voltage of electricity or switch electricity circuits. Substations are usually contained within secure sites to ensure public safety. Most substations today are unmanned sites although road access is necessary for staff and for the

2.13
transport of equipment, maintenance or repair. Table 2.3.8 and Table 2.3.9 present total investment costs that include costs of following elements:
− transformer unit − transformer bays (400 kV, 220 kV, 110 kV)
o Breakers o Disconnectors without blades o Current Measuring Transformers o Voltage Measuring Transformers o Lightning Arrester
Also these tables show investment cost for all linked lines between existed transmission lines and new substations.
Table 2.3.8: new SS which will be in operation till 2010 year
2010Voltage Newlevels transformerskV/kV MVA
Albania 1 Kashar 400/220 2x400 4,100,0002 Sofia South 220/110 1x250 new transformer only 1,830,000 3 Maritsa East 1 400/220 1x630 phase-shifter 3,600,000 4 Pleven 220/110 1x200 new transformer only 1,730,000
7,160,000 Croatia 5 Ernestinovo 400/110 1x300 new transformer only 2,730,000 Macedonia 6 Stip 400/110 1x300 3,430,000
7 Nadab 400 no transformer 1,400,000 8 Oradea 400/110 1x300 new transformer only 2,730,000
4,130,000 9 S. Mitrovica 400/220 1x400 3,150,000 10 Beograd 20 400/110 1x300 new transformer only 2,730,000 11 Kolubara B 400/110 2x300 5,930,000
11,810,000 UNMIK 12 Pec 400/110 1x300 4,130,000 *position in geographical map (Figure 2.4.2)
Total
Name ofsubstation
Total costin EurosRemarksCountry
Serbia
Position*
Total
Total
Bulgaria
Romania
Table 2.3.9: new SS which will be in operation till 2015 year
2015Voltage Newlevels transformerskV/kV MVA
Albania 13 V. Dejes 400/200 1x400 3,150,000 14 Brasov 400/110 1x300 new transformer only 2,730,000 15 Suceava 220/110 1x200 new transformer only 1,730,000
4,460,000 16 Nis 400/110 1x300 new transformer only 2,730,000 17 Vranje 400/110 1x300 4,130,000
6,860,000 *position in geographical map (Figure 2.4.4)
Name ofsubstation
Total costin EurosCountry RemarksPosition*
Total
Total
Romania
Serbia

2.14
2.4. Remarks on PSS/E Transmission System Model and GTmax Model Harmonization
To investigate regional market conditions in region, GTmax software tool is used. Unlike PSS/E, with this software tool you can not analyze network conditions. Only in rough congestion analyses is possible. In order to check, whether production distribution, that is result of GTmax analyses is feasible from transmission system capabilities point of view, results from GTmax analyses has been used as input for PSS/E regional models, and then full security analysis of thus gained models has been performed. Load-demand GTmax load-demand level is distributed only in few GTmax network buses, unlike PSS/E model where load distribution corresponds to the real system conditions (substation by substation). Also, GTmax load-demand level includes transmission network losses, unlike PSS/E model where these losses are calculated separately. In other words, it was not possible to achieve full load-demand correspondence between GTmax and PSS/E model.
In order to achieve at least partial correspondence between GTmax load-demand and PSS/E load (on system by system level), existing load distribution in PSS/E model is scaled so level of PSS/E load increased for transmission network losses corresponds to GTmax load-demand level. Also, for some systems, production of units installed on voltage levels lower than 110 kV is included in load-demand level (load-demand is reduced for this amount). This was done system by system. Network topology In order for PSS/E network models to correspond to GTmax model, first step was to adjust network topology of both PSS/E and GTmax models. Topology of GTmax models for 2010 and 2015 are shown on Figure 2.4.1 and Figure 2.4.3 and corresponding real network topologies of regional network shown on Figure 2.4.2 and Figure 2.4.4.
As it can be seen, the internal system topologies are quite rough, unlike topology of system interconnections (tie lines), which are almost identical (that was one of prerequisites of GTmax model).
Transmission system model for 2015 was gained using existing model for 2010. All new interconnection lines that are predicted to be in operation in GTmax's model are also included in PSS/E model. Also, all internal network reinforcements that are in long term plans of regional TSOs are modeled too.

2.15
Skopje
Sofia
Plovdiv
Blagoevgrad Maritsa
TURKEY
Varna
GREECE
Dubrovo
Bitola
V. Dejes
Kosovo BRibarevina
PljevljaTrebinje
Mostar
Split
Sarajevo
TuzlaB. LukaRijeka
Zagreb
SLOVENIA
Osijek
B. Basta
Belgrade
CENTREL
Arad
Djerdap
Nis
Tantareni
Kozlodui
Sibiu
Croatia
B&H
Montenegro
Albania
Serbia
Bulgaria
Macedonia
Romania
Tirana/Elbasan
Podgorica
Isaccea
Gutinas
BucharestPortilede Fier
ChervenaMogila Vetren
1330 -><- 1330
1930 ->
<- 1830
1330 ->
<- 1330
1330 -><- 1330
1350 -><- 1330
1330-><- 1680
660 ->
<- 660 300 ->
<- 300
1300
-><-
1300
300 -><- 280
800 -><- 17501500 - ><- 1300
1500 -><-1300
310 ->
<- 300
1350 -><- 1350
1350
->
<- 1350
1350 ->
<- 1350
1630 ->
<- 1630
Legend:Thermal / Overcurrent
Protection Limits in MW
Winter -><- Winter
2700 ->
<- 2700
2700 ->
<- 2700
1350
-><-
1350
1220 ->
<- 1220
1065
-><-
1065 3100 ->
<- 31001220 -><- 1220
1330 -><- 1330
Rosiori
UKRAINE330 -><- 330
1220
-><-
1330
2700
-><-
2700
1330 -><- 1330
690 ->
<- 690
1350 -><- 1350
1200
1200
1200
1250 -><- 1250
1250 -><-1250
300 -><- 300
1330 ->
<- 1330
1250 ->
<- 1250
900 -
><-
800
Figure 2.4.1: GTmax network topology in year 2010

2.16
Figure 2.4.2: Real network topology in year 2010

2.17
Skopje
Sofia
Plovdiv
Blagoevgrad Maritsa
TURKEY
Varna
GREECE
Dubrovo
Bitola
V. Dejes
Kosovo BRibarevina
PljevljaTrebinje
Mostar
Split
Sarajevo
TuzlaB. LukaRijeka
Zagreb
SLOVENIA
Osijek
B. Basta
Belgrade
CENTREL
Arad
Djerdap
Nis
Tantareni
Kozlodui
Sibiu
Croatia
B&H
Montenegro
Albania
Serbia
Bulgaria
Macedonia
Romania
Tirana/Elbasan
Podgorica
Isaccea
Gutinas
BucharestPortilede Fier
ChervenaMogila Vetren
1330 -><- 1330
1930 ->
<- 1830
1330 ->
<- 1330
1330 -><- 1330
1350 -><- 1330
1330-><- 1680
660 ->
<- 660 300 ->
<- 300
1300
-><-
1300
300 -><- 280
800 -><- 1750
1500 - ><- 1300
1500 -><-1300
310 ->
<- 300
1350 -><- 1350
1350
->
<- 1350
1350 ->
<- 1350
1630 ->
<- 1630
Legend:Thermal / Overcurrent
Protection Limits in MW
Winter -><- Winter
2700 ->
<- 2700
2700 ->
<- 2700
1350
-><-
1350
1220 ->
<- 1220
1065
-><-
1065 3100 ->
<- 31001220 -><- 1220
1330 -><- 1330
Rosiori
UKRAINE330 -><- 330
1220
-><-
1330
2700
-><-
2700
1330 -><- 1330
690 ->
<- 690
1350 -><- 1350
1200
1200
1200
1250 -><- 1250
1250 -><-1250
300 -><- 300
1330 ->
<- 13301250 ->
<- 1250
900 -
><-
800
Figure 2.4.3: GTmax network topology in year 2015

2.18
Figure 2.4.4: Real network topology in year 2015

2.19
Production distribution In PSS/E model, all production units connected to 110 kV or higher voltage network are modeled as they are in reality, generation units plus corresponding step-up transformers. Some of the production units or plants connected to the network lower than 110 kV are modeled as negative load in corresponding buses, but most of them are included in corresponding loads in system substations. Also, in GTmax models, most of the production units are modeled as whole plants, so in order to achieve full compliance with PSS/E model, it was necessary to distribute this production on the real units themselves, as they are in PSS/E model. In following figures and tables production distribution from GTmax to PSS/E model was shown, jurisdiction by jurisdiction, but also how these units are connected to the GTmax network model, and appropriate network representation in PSS/E model.
Albania GTmax PSS/E Remarks
Powerplant Bus# Bus Name ID Fier 1 10021 AFIER 9 11.000 1
10022 AFIERV9 6.3000 4 Balsh 10022 AFIERV9 6.3000 5 10052 AULEZ 9 6.3000 1 10052 AULEZ 9 6.3000 2 10052 AULEZ 9 6.3000 3 10052 AULEZ 9 6.3000 4 10053 ASHKP19 6.3000 1
Ulez+Shkopet
10054 ASHKP29 6.3000 1 10490 ABISTRIG 6.3000 G1 10490 ABISTRIG 6.3000 G2 10490 ABISTRIG 6.3000 G3 Bistrica
10490 ABISTRIG 6.3000 G4 10501 AFIERZ91 13.800 1 10502 AFIERZ92 13.800 2 10503 AFIERZ93 13.800 3 Fierza
10504 AFIERZ94 13.800 4 10511 AKOMAN91 13.800 1 10512 AKOMAN92 13.800 2 10513 AKOMAN93 13.800 3 Komani
10514 AKOMAN94 13.800 4 10521 AVDEJA91 10.500 1 10522 AVDEJA92 10.500 2 10523 AVDEJA93 10.500 3 10524 AVDEJA94 10.500 4
Vau Dejes
10525 AVDEJA95 10.500 5 10551 ABABICG1 13.800 1 10552 ABABICG2 13.800 2 10553 ABABICG3 13.800 3 Vlore
10554 ABABICG4 13.800 4
Figure 2.4.5 – GTmax model - Albania

2.20
Figure 2.4.6 – PSS/E model - Albania
2.21
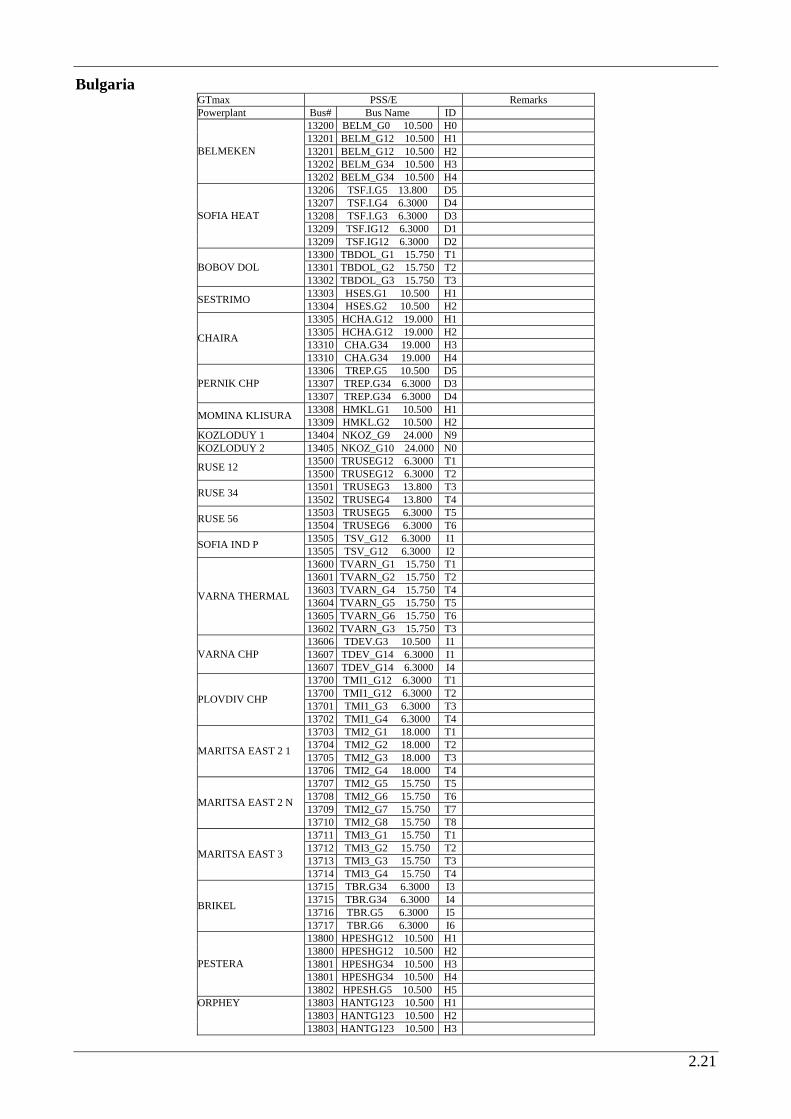
Bulgaria GTmax PSS/E Remarks Powerplant Bus# Bus Name ID
13200 BELM_G0 10.500 H0 13201 BELM_G12 10.500 H1 13201 BELM_G12 10.500 H2 13202 BELM_G34 10.500 H3
BELMEKEN
13202 BELM_G34 10.500 H4 13206 TSF.I.G5 13.800 D5 13207 TSF.I.G4 6.3000 D4 13208 TSF.I.G3 6.3000 D3 13209 TSF.IG12 6.3000 D1
SOFIA HEAT
13209 TSF.IG12 6.3000 D2 13300 TBDOL_G1 15.750 T1 13301 TBDOL_G2 15.750 T2 BOBOV DOL 13302 TBDOL_G3 15.750 T3 13303 HSES.G1 10.500 H1 SESTRIMO 13304 HSES.G2 10.500 H2 13305 HCHA.G12 19.000 H1 13305 HCHA.G12 19.000 H2 13310 CHA.G34 19.000 H3 CHAIRA
13310 CHA.G34 19.000 H4 13306 TREP.G5 10.500 D5 13307 TREP.G34 6.3000 D3 PERNIK CHP 13307 TREP.G34 6.3000 D4 13308 HMKL.G1 10.500 H1 MOMINA KLISURA 13309 HMKL.G2 10.500 H2
KOZLODUY 1 13404 NKOZ_G9 24.000 N9 KOZLODUY 2 13405 NKOZ_G10 24.000 N0
13500 TRUSEG12 6.3000 T1 RUSE 12 13500 TRUSEG12 6.3000 T2 13501 TRUSEG3 13.800 T3 RUSE 34 13502 TRUSEG4 13.800 T4 13503 TRUSEG5 6.3000 T5 RUSE 56 13504 TRUSEG6 6.3000 T6 13505 TSV_G12 6.3000 I1 SOFIA IND P 13505 TSV_G12 6.3000 I2 13600 TVARN_G1 15.750 T1 13601 TVARN_G2 15.750 T2 13603 TVARN_G4 15.750 T4 13604 TVARN_G5 15.750 T5 13605 TVARN_G6 15.750 T6
VARNA THERMAL
13602 TVARN_G3 15.750 T3 13606 TDEV.G3 10.500 I1 13607 TDEV_G14 6.3000 I1 VARNA CHP 13607 TDEV_G14 6.3000 I4 13700 TMI1_G12 6.3000 T1 13700 TMI1_G12 6.3000 T2 13701 TMI1_G3 6.3000 T3 PLOVDIV CHP
13702 TMI1_G4 6.3000 T4 13703 TMI2_G1 18.000 T1 13704 TMI2_G2 18.000 T2 13705 TMI2_G3 18.000 T3 MARITSA EAST 2 1
13706 TMI2_G4 18.000 T4 13707 TMI2_G5 15.750 T5 13708 TMI2_G6 15.750 T6 13709 TMI2_G7 15.750 T7 MARITSA EAST 2 N
13710 TMI2_G8 15.750 T8 13711 TMI3_G1 15.750 T1 13712 TMI3_G2 15.750 T2 13713 TMI3_G3 15.750 T3 MARITSA EAST 3
13714 TMI3_G4 15.750 T4 13715 TBR.G34 6.3000 I3 13715 TBR.G34 6.3000 I4 13716 TBR.G5 6.3000 I5 BRIKEL
13717 TBR.G6 6.3000 I6 13800 HPESHG12 10.500 H1 13800 HPESHG12 10.500 H2 13801 HPESHG34 10.500 H3 13801 HPESHG34 10.500 H4
PESTERA
13802 HPESH.G5 10.500 H5 13803 HANTG123 10.500 H1 13803 HANTG123 10.500 H2
ORPHEY
13803 HANTG123 10.500 H3

2.22
13804 HANT.G4 10.500 H4 13805 HBATG123 10.500 H1 13805 HBATG123 10.500 H2 13805 HBATG123 10.500 H3 BATAK
13806 HBAT_G4 10.500 H4 13807 HKRI.G1 10.500 H1 KRICHIM 13808 HKRI.G2 10.500 H2 13809 DEVIN.G1 10.500 H1 DEVIN 13810 DEVIN.G2 10.500 H2 13811 HTESH.G 10.500 H1 TESHEL 13811 HTESH.G 10.500 H2
MARITSA 3 13812 TMAR3.G3 13.800 T3 13813 HALEKOG3 10.500 H3 13814 HALEKOG2 10.500 H2 ALEKO 13815 HALEKOG1 10.500 H1 13819 HKAR.G12 10.500 H1 13819 HKAR.G12 10.500 H2 13820 HKAR.G34 10.500 H3 KARDJALY
13820 HKAR.G34 10.500 H4 13821 HST.KG12 10.500 H1 13821 HST.KG12 10.500 H2 13822 HST.KG34 10.500 H3 STUDEN KLADENEC
13822 HST.KG34 10.500 H4 13823 HIW.G123 10.500 H1 13823 HIW.G123 10.500 H2 IVAILOVGRAD 13823 HIW.G123 10.500 H3 13906 TMI1_G5 15.750 T5 13907 TMI1_G6 15.750 T6 MARITSA EAST 1 13908 TMI1_G7 15.750 T7
LUKOIL - - - included in total consumption BUL SMALL HYDRO - - - included in total consumption
Figure 2.4.7 – GTmax model – Bulgaria

2.23
Figure 2.4.8 – PSS/E model - Bulgaria

2.24
BIH GTmax PSS/E Remarks Powerplant Bus# Bus Name ID UGLJEVIK 14001 TE UGLJE 20.000 1 GACKO 14002 GACKO 20.000 1
14003 HE VISE 15.750 1 14003 HE VISE 15.750 2 VISEGRAD 14003 HE VISE 15.750 3 14004 HE TREB 14.400 1 14004 HE TREB 14.400 2 TREBINJE HYDRO 14004 HE TREB 14.400 3 14006 BOCACG1 10.500 1 BOCAC 14007 BOCACG2 10.500 2 16001 GRAB-G1 10.500 1 GRABOVICA 16002 GRAB-G2 10.500 2 16003 SAL-G1 13.800 1 16004 SAL-G2 13.800 2 SALAKOVAC 16005 SAL-G3 13.800 3
KAKANJ 7 16006 KAK-G7 15.750 7 TUZLA 4 16007 TUZ-G4 15.750 4 TUZLA 5 16008 TUZ-G5 15.750 5 TUZLA 6 16009 TUZ-G6 15.750 6
16011 JAB-G1 6.3000 1 16012 JAB-G2 6.3000 2 16013 JAB-G3 6.3000 3 16014 JAB-G4 6.3000 4 16015 JAB-G5 6.3000 5
JABLANICA
16016 JAB-G6 6.3000 6 KAKANJ 5 16025 KAK-G5 13.800 5 KAKANJ 6 16026 KAK-G6 13.800 6 TUZLA 3 16033 TUZ-G3 10.500 3
18001 RAMA G1 15.650 1 RAMA 18002 RAMA G2 15.650 2 18003 MOST-G1 10.500 1 18004 MOST-G2 10.500 2 MOSTAR HYDRO 18005 MOST-G3 10.500 3 18006 CAPL-G1 15.700 1 CAPLJINA 18007 CAPL-G2 15.700 2 18008 JAJ1-G1 10.500 1 JAJCE 1 18009 JAJ1-G2 10.500 2 18010 JAJ2-G1 6.3000 1 18011 JAJ2-G2 6.3000 2 JAJCE 2 18012 JAJ2-G3 6.3000 3 18015 MLINI-G1 10.500 1 PEC MLINI 18016 MLINI-G2 10.500 2
DUBROVNIK G-2 - - - included in Croatian production M.BLATO - - - included in total consumption
Figure 2.4.9 – GTmax model - BIH

2.25
Figure 2.4.10 – PSS/E model - BIH

2.26
Croatia GTmax PSS/E Remarks Powerplant Bus# Bus Name ID ZAGREB EL TO A 20301 EL-TOG1 10.500 1 ZAGREB EL TO H 20302 EL-TOG2 10.500 2
20304 HECAKOG1 6.3000 1 CAKOVEC 20305 HECAKOG2 6.3000 2 DUBROVNIK G-1 20306 HEDUBRG1 6.3000 1 DUBROVNIK G-2 20307 HEDUBRG2 6.3000 2
20308 HEGOJAG1 10.500 1 20309 HEGOJAG2 10.500 2 GOJAK 20310 HEGOJAG3 10.500 3 20313 HEORLOG1 10.500 1 20314 HEORLOG2 10.500 2 ORLOVAC 20315 HEORLOG3 10.000 3 20316 HEPERUG1 10.500 1 PERUCA 20317 HEPERUG2 10.500 2 20318 HERIJEG1 10.500 1 RIJEKA HPP 20319 HERIJEG2 10.500 2 20320 HESENJG1 10.500 1 20321 HESENJG2 10.500 2 SENJ 20322 HESENJG3 10.500 1
SKLOPE 20323 HESKLOG1 10.500 1 20324 HEVINOG1 10.500 1 20325 HEVINOG2 10.500 2 VINODOL 20326 HEVINOG3 10.500 3 20327 HEZAKUG1 16.000 1 20328 HEZAKUG2 16.000 2 20329 HEZAKUG3 16.000 3 ZAKUCAC
20330 HEZAKUG4 16.000 4 20331 JERTOVG1 10.500 1 20332 JERTOVG2 10.500 2 20333 JERTOVG3 11.000 3 JERTOVEC
20334 JERTOVG4 11.000 4 20335 KRALJEVG 3.7000 1 20335 KRALJEVG 3.7000 2 20335 KRALJEVG 3.7000 3 KRALJEVAC
20335 KRALJEVG 3.7000 4 OSIJEK A 20336 TE-TOOG1 10.500 1
20340 HEVARAG1 10.500 1 VARAZDIN 20341 HEVARAG2 10.500 2 20342 HEDUBRG1 14.400 1 DUBRAVA 20343 HEDUBRG2 14.400 1 20344 RHEOBRG1 15.750 1 VELEBIT 20345 RHEOBRG2 15.750 2
PLOMIN 1 20346 TEPLOMG1 13.800 1 PLOMIN 2 20347 TEPLOMG2 13.800 1 RIJEKA THERMAL 20348 TERIJEG1 20.000 1 SISAK 20350 TESISAG2 15.750 1 ZAGREB TE TO A 20351 TE-TOG1 10.500 1
20352 TE-TOG2 10.500 2 20354 TE-TOG4 10.500 4 ZAGREB ELTO K 20355 TE-TOG5 10.500 5
ZAGREB TE TO C 20353 TE-TOG3 12.500 3 20360 HEDJALG1 10.500 1 DJALE 20361 HEDJALG2 10.500 2 20430 KTEOSGT 15.750 1 CC 480 2 20431 KTEOSST 10.500 1 20420 KTESISGT 15.750 1 CC 480 20421 KTESISST 10.500 1
GOLUBIC - - - included in total consumption MILJACKA - - - included in total consumption OSIJEK B - - - will not exist in 2010 OZALJ 1 - - - included in total consumption OZALJ 2 - - - included in total consumption

2.27
Figure 2.4.11 – GTmax model - Croatia
Figure 2.4.12 – PSS/E model - Croatia

2.28
Macedonia GTmax PSS/E Remarks Powerplant Bus# Bus Name ID BITOLA 1 26301 BT 2 100 15.750 1 BITOLA 2 26302 BT 2 400 15.750 1 BITOLA 3 26303 BT 2 400 15.750 2 OSLOMEJ 26311 OSLOMEJ 13.800 1 NEGOTINO 26321 TPP NEGO 15.750 1
26331 VRUTOK 12.000 1 26332 VRUTOK 12.000 2 26333 VRUTOK 12.000 3 VRUTOK
26334 VRUTOK 12.000 4 26341 GLOBOCIC 10.500 1 GLOBOCICA 26342 GLOBOCIC 10.500 2 26351 SPILJE 10.500 1 26352 SPILJE 10.500 2 SPILJE 26353 SPILJE 10.500 3 26361 TIKVES 10.500 1 26362 TIKVES 10.500 2 26363 TIKVES 10.500 3 TIKVES
26364 TIKVES 10.500 4 26371 KOZJAK 10.500 1 KOZJAK+MAT 26401 MATKA 2 10.500 1
RAVEN - - - included in total consumption VRBEN - - - included in total consumption
Figure 2.4.13 – GTmax model - Macedonia

2.29
Figure 2.4.14 – PSS/E model - Macedonia

2.30
Montenegro GTmax PSS/E Remarks Powerplant Bus# Bus Name ID PLJEVLJA THERMAL 36511 JTPLJEG1 15.750 G1
36521 JHPERUG1 10.500 G1 36522 JHPERUG2 10.500 G2 36523 JHPERUG3 10.500 G3 36524 JHPERUG4 10.500 G4 36525 JHPERUG5 10.500 G5 36526 JHPERUG6 10.500 G6
PERUCICA
36527 JHPERUG7 10.500 G7 SMALL HPPS - - - included in total consumption
Figure 2.4.15 – GTmax model - Montenegro
Figure 2.4.16 – PSS/E model - Montenegro
2.31
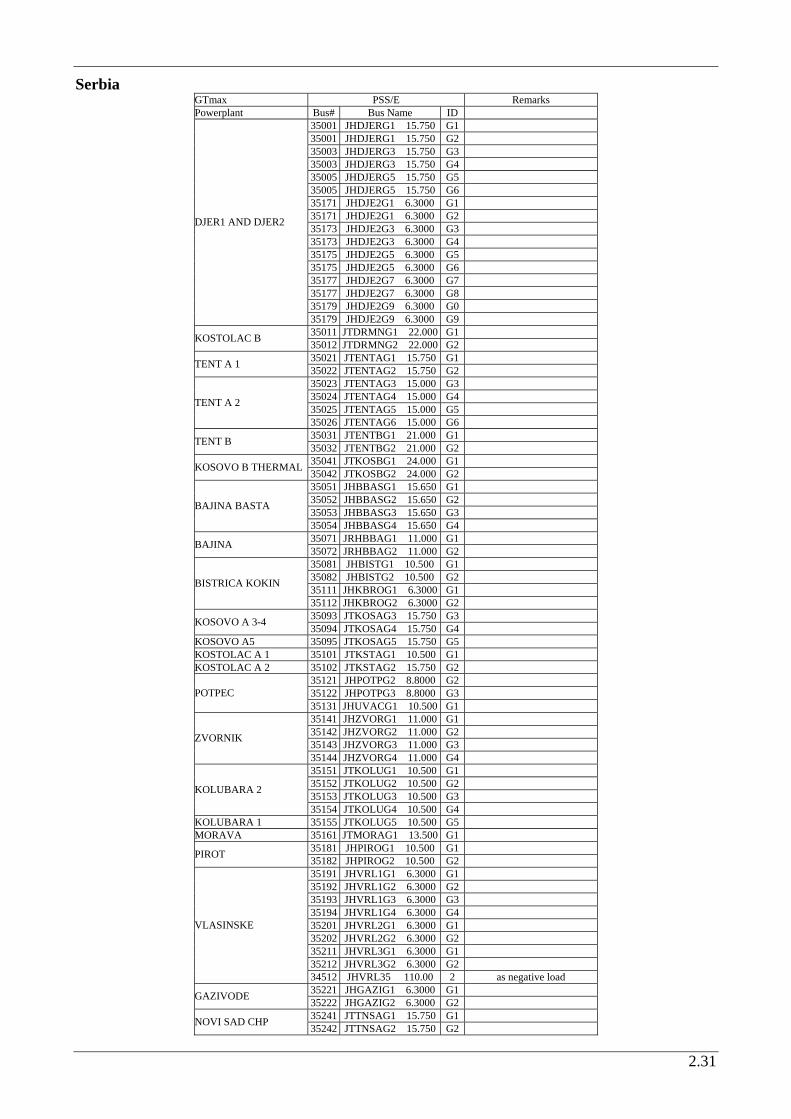
Serbia GTmax PSS/E Remarks Powerplant Bus# Bus Name ID
35001 JHDJERG1 15.750 G1 35001 JHDJERG1 15.750 G2 35003 JHDJERG3 15.750 G3 35003 JHDJERG3 15.750 G4 35005 JHDJERG5 15.750 G5 35005 JHDJERG5 15.750 G6 35171 JHDJE2G1 6.3000 G1 35171 JHDJE2G1 6.3000 G2 35173 JHDJE2G3 6.3000 G3 35173 JHDJE2G3 6.3000 G4 35175 JHDJE2G5 6.3000 G5 35175 JHDJE2G5 6.3000 G6 35177 JHDJE2G7 6.3000 G7 35177 JHDJE2G7 6.3000 G8 35179 JHDJE2G9 6.3000 G0
DJER1 AND DJER2
35179 JHDJE2G9 6.3000 G9 35011 JTDRMNG1 22.000 G1 KOSTOLAC B 35012 JTDRMNG2 22.000 G2 35021 JTENTAG1 15.750 G1 TENT A 1 35022 JTENTAG2 15.750 G2 35023 JTENTAG3 15.000 G3 35024 JTENTAG4 15.000 G4 35025 JTENTAG5 15.000 G5 TENT A 2
35026 JTENTAG6 15.000 G6 35031 JTENTBG1 21.000 G1 TENT B 35032 JTENTBG2 21.000 G2 35041 JTKOSBG1 24.000 G1 KOSOVO B THERMAL 35042 JTKOSBG2 24.000 G2 35051 JHBBASG1 15.650 G1 35052 JHBBASG2 15.650 G2 35053 JHBBASG3 15.650 G3 BAJINA BASTA
35054 JHBBASG4 15.650 G4 35071 JRHBBAG1 11.000 G1 BAJINA 35072 JRHBBAG2 11.000 G2 35081 JHBISTG1 10.500 G1 35082 JHBISTG2 10.500 G2 35111 JHKBROG1 6.3000 G1 BISTRICA KOKIN
35112 JHKBROG2 6.3000 G2 35093 JTKOSAG3 15.750 G3 KOSOVO A 3-4 35094 JTKOSAG4 15.750 G4
KOSOVO A5 35095 JTKOSAG5 15.750 G5 KOSTOLAC A 1 35101 JTKSTAG1 10.500 G1 KOSTOLAC A 2 35102 JTKSTAG2 15.750 G2
35121 JHPOTPG2 8.8000 G2 35122 JHPOTPG3 8.8000 G3 POTPEC 35131 JHUVACG1 10.500 G1 35141 JHZVORG1 11.000 G1 35142 JHZVORG2 11.000 G2 35143 JHZVORG3 11.000 G3 ZVORNIK
35144 JHZVORG4 11.000 G4 35151 JTKOLUG1 10.500 G1 35152 JTKOLUG2 10.500 G2 35153 JTKOLUG3 10.500 G3 KOLUBARA 2
35154 JTKOLUG4 10.500 G4 KOLUBARA 1 35155 JTKOLUG5 10.500 G5 MORAVA 35161 JTMORAG1 13.500 G1
35181 JHPIROG1 10.500 G1 PIROT 35182 JHPIROG2 10.500 G2 35191 JHVRL1G1 6.3000 G1 35192 JHVRL1G2 6.3000 G2 35193 JHVRL1G3 6.3000 G3 35194 JHVRL1G4 6.3000 G4 35201 JHVRL2G1 6.3000 G1 35202 JHVRL2G2 6.3000 G2 35211 JHVRL3G1 6.3000 G1 35212 JHVRL3G2 6.3000 G2
VLASINSKE
34512 JHVRL35 110.00 2 as negative load 35221 JHGAZIG1 6.3000 G1 GAZIVODE 35222 JHGAZIG2 6.3000 G2 35241 JTTNSAG1 15.750 G1 NOVI SAD CHP 35242 JTTNSAG2 15.750 G2

2.32
ZRENJANIN CHP 35251 JTTZREG1 15.750 G1 35271 JTKOLBG1 22.000 G1 KOLUBARA B 35272 JTKOLBG2 22.000 G2
KOSOVO 2X450 34070 JTKOSB1 400.00 C1 KOSOVO C 2X450 34070 JTKOSB1 400.00 C2
36501 JHPIVAG1 15.750 G1 36502 JHPIVAG2 15.750 G2 PIVA 36503 JHPIVAG3 15.750 G3
Figure 2.4.17 – GTmax model - Serbia
Figure 2.4.18 – GTmax model – Serbia UNMIK

2.33
UNMIK
Figure 2.4.19 – PSS/E model – Serbia and UNMIK

2.34
Romania GTmax PSS/E Remarks Powerplant Bus# Bus Name ID
29110 TURCENI1 24.000 1 29112 TURCENI3 24.000 1 TURCENI 1 29113 TURCENI4 24.000 1 29114 TURCENI5 24.000 1 29115 TURCENI 24.000 1 29116 TURCENI6 24.000 1 TURCENI 2
29117 TURCENI7 24.000 1 29119 ROVIN 5 24.000 1 29120 ROVIN 6 24.000 1 29121 ROVIN 3 24.000 1 29238 ROVIN 4 24.000 1
ROVINARI
29455 ROVIN 7 24.000 1 29125 AREFU 1 10.500 1 29126 AREFU 2 10.500 1 29127 AREFU 3 10.500 1 RIURENI
29128 AREFU 4 10.500 1 29136 BUC.S 5 13.800 1 29137 BUC.S 6 13.800 1 29138 BUC.S 3 10.500 1 29139 BUC.S 1 10.500 1 29317 BUC.S 2 10.500 1
BUCURESTI SUD
29318 BUC.S 4 10.500 1 29140 STUPA I1 10.500 1 29141 STUPA I2 10.500 1 29142 STUPAII6 10.500 1 29143 STUPAII5 10.500 1 29144 STUPA I3 10.500 1
GOVORA THERMAL
29145 STUPA I4 10.500 1 29147 GROZAV 2 10.500 1 GROZAVESTI CHP 29148 GROZAV 1 10.500 1 29149 PROGRS 1 10.500 1 29150 PROGRS4 10.500 1 29151 PROGRS3 10.500 1 PROGRESU CHP
29152 PROGRS 2 10.500 1 29154 BUC.V 2 13.800 1 BUCURESTI VEST 29155 BUC.V 1 13.800 1 29162 RETEZAT1 15.750 1 RETEZAT 29163 RETEZAT2 15.750 1 29164 MARISEL1 15.750 1 29165 MARISEL2 15.750 1 MARISELU 29166 MARISEL3 15.750 1 29167 MINTIA 1 15.750 1 29168 MINTIA 2 15.750 1 DEVA 1 29169 MINTIA 5 15.750 1 29170 GALCEAG1 15.750 1 GILCEAG 29171 GALCEAG2 15.750 1 29172 SUGAG 1 15.750 1 SUGAG 29173 SUGAG 2 15.750 1 29174 ORAD I 4 10.500 1 29175 ORAD II1 10.500 1 29176 ORAD II2 10.500 1 29177 ORAD I 6 10.500 1 29178 ORAD I 5 10.500 1
ORADEA
29179 ORAD II3 10.500 1 ARAD CHP 29181 ARAD 1 10.500 1
29183 RUIENI 1 10.500 1 RUIENI 29248 RUIENI 2 10.500 1 29184 ISALNIT7 24.000 1 ISALNITA 2 29185 ISALNIT8 24.000 1 29189 P.D.F 1 15.750 1 29190 P.D.F 2 15.750 1 29191 P.D.F 3 15.750 1 29192 P.D.F 4 15.750 1 29193 P.D.F 5 15.750 1
PORTILE 1
29250 P.D.F.6 15.750 1 29194 GRUIA12 6.3000 1 29195 GRUIA34 6.3000 1 29199 GRUIA56 6.3000 1 PORTILE 2
29196 GRUIA78 6.3000 1 29197 DROBETA2 10.500 1 DROBETA 29251 DROBETA4 10.500 1

2.35
29252 DROBETA3 10.500 1 29253 DROBETA1 10.500 1 29198 CRAI II2 15.750 1 CRAIOVA 29200 CRAI II1 15.750 1 29201 BORZEST7 15.750 1 BORZESTI 29202 BORZEST8 15.750 1 29203 BORZE I6 10.500 1 29205 BORZE I4 10.500 1 BORZESTI CHP 29206 BORZE I5 10.500 1 29207 STEJARU5 10.500 1 29208 STEJARU6 10.500 1 STEJARU 29209 STEJARU 10.500 1 29210 SUCEAVA1 10.500 1 SUCEAVA 29211 SUCEAVA2 10.500 1
BACAU THERMAL 29212 BACAU 1 10.500 1 29214 FAI II 1 10.500 1 IASI II 29215 FAI II 2 10.500 1 29216 FAI I 4 10.500 1 IASI I 29217 FAI I 3 10.500 1
CERNAVODA 29218 CERNAV.1 24.000 1 BRAILA 1 29219 BRAILA 1 15.750 1 BRAILA 2 29220 BRAILA 2 15.750 1 29221 BARBOSI5 10.500 1 29224 BARBOSI3 10.500 1
29225 SMARDAN6 10.500 1 GALATI CHP 29310 SMARDAN4 10.500 1 29226 PALAS 1 10.500 1 PALAS CHP 29227 PALAS 2 10.500 1 29232 LOTRU 1 15.750 1 29233 LOTRU 2 15.750 1 LOTRU CIUNGET 29234 LOTRU 3 15.750 1 29235 BRASOV 1 10.500 1 BRASOV THERMAL 29236 BRASOV 2 10.500 1 29237 PITEST 4 10.500 1 PITESTI 29305 PITEST 5 10.500 1 29239 BRAZI 5 10.500 1 29267 BRAZI 7 10.500 1 29268 BRAZI 6 10.500 1 BRAZI CHP
29266 BRAZI 10 10.500 1 29259 MINTIA 4 15.750 1 29260 MINTIA 3 15.750 1 DEVA 2 29262 MINTIA 6 15.750 1 29269 PAROSEN1 10.500 1 29270 PAROSEN2 10.500 1 29271 PAROSEN3 10.500 1 PAROSENI
29263 PAROS 4 18.000 1 BRAILA 3 29299 BRAILA 3 15.750 1
29301 DOICEST8 15.750 1 DOICESTI 29302 DOICEST7 15.750 1 CERNAVODA 2 29332 CERNAV.2 24.000 1 CERNAVODA 3 29470 CERNAV.3 24.000 1 ARCESTI 28639 ARCESTI 110.00 1 as negative load BABENI 28678 BABENI 110.00 1 as negative load BACAU 28147 BACAU S 110.00 2 as negative load BERESTI 28320 VERNEST 110.00 2 as negative load BRADISOR 28564 BRADISO 110.00 1 as negative load CALBUCET - - - included in total consumption CALIMANESTI OLT - - - included in total consumption CALIMANESTI SIRE - - - included in total consumption CORNETU - - - included in total consumption DAESTI 28574 DAIESTI 110.00 1 as negative load DOICESTI - - - included in total consumption DRAGANESTI 28752 CHE DRAG 110.00 1 as negative load DRAGASANI 28674 CHE DRG 110.00 1 as negative load FRUNZARU 28624 FRUNZ. 110.00 1 as negative load GALBENI - - - included in total consumption GUIRGIU - - - included in total consumption GOVORA - - - included in total consumption IONESTI 28676 IONESTI 110.00 1 as negative load IPOTESTI - - - included in total consumption IZBICENI 29261 IZBICEN 110.00 1 as negative load LUDUS - - - included in total consumption MOTRU - - - included in total consumption MUNTENI I 28849 MUNTEAN 110.00 1 as negative load NEHOUI - - - included in total consumption

2.36
OTHER AUTOPRODUC - - - included in total consumption RACACIUNI - - - included in total consumption REMETI 28850 REMETI 110.00 1 as negative load RIMNICU VILCEA 28597 VILCEL A 110.00 2 as negative load RUSANESTI - - - included in total consumption SASCIORI - - - included in total consumption SLATINA HYDRO - - - included in total consumption STREJESTI 28645 STRAJ 110.00 1 as negative load TARNITA - - - included in total consumption TISMANA - - - included in total consumption TOTAL UNDER 25 - - - included in total consumption TOTAL UNDER 25 2 - - - included in total consumption TOTAL UNDER 25 3 - - - included in total consumption TOTAL UNDER 25 4 - - - included in total consumption TOTAL UNDER 25 5 - - - included in total consumption TURNU 28844 TURNU 110.00 1 as negative load VADURI 28102 VADURI 110.00 1 as negative load VIDRARU - - - included in total consumption ZAVIDENI 28675 ZAVID 110.00 1 as negative load
Figure 2.4.20 – GTmax model – Romania

2.37
Figure 2.4.21 – PSS/E model - Romania

2.38
All these production facilities are analyzed as they will be built till 2010. Besides in sensitivity analyses for average hydrology high load scenarios in 2010 and 2015, additional production capacities are analyzed. In following tables is shown in what way these units are modeled. BIH
GTmax PSS/E Remarks Powerplant Bus# Bus Name ID
14010 HEBBG1 15.750 G1 14011 HEBBG2 15.750 G2 14012 HEBBG3 15.750 G3 14015 HESRBG 6.3000 G3 14015 HESRBG 6.3000 G2
BUKBSRB
14015 HESRBG 6.3000 G1 GLAVATICEVO included in total consumption
Bulgaria GTmax PSS/E Remarks Powerplant Bus# Bus Name ID BELENE 12450 CAREVEC 400.00 1
Montenegro GTmax PSS/E Remarks Powerplant Bus# Bus Name ID KOMARNICA 36140 JNIKGR51 110.00 1 ANDRIJEVO I ZLAT 36998 JHANDR21 220.00 1 KOSTANICA 36999 JHKOST11 400.00 1
Serbia (UNMIK) GTmax PSS/E Remarks Powerplant Bus# Bus Name ID KOSOVO 3X274 34070 JTKOSB1 400.00 C1 KOSOVO C 5X450 34070 JTKOSB1 400.00 C2 ZHUR 36999 JPRIZ22 220.00 1
Exchange programs-desired interchange Because of different modeling approach of production and intersystem exchanges between GTmax and PSS/E, there are some peculiarities that need to be implemented in PSS/E model. This causes differences between exchange programs in GTmax and PSS/E. So, NPP Krsko is installed in system of Slovenia, but 50 % it is owned by Croatia. In GTmax this is modeled simply as Croatian power plant that has half power installed. But in PSS/E model, this plant is modeled as it is, in system of Slovenia, so Croatian part of energy produced is modeled as export from Slovenia to Croatia. Similar situation is with HPP Dubrovnik in Croatia, which is owned by Bosnia and Herzegovina. In case of HPP Piva, there is long term contract between Serbia and Montenegro, by which this plant operates as plant owned by Serbia in exchange for 105 MW exchange.
In order to achieve correspondence between exchange programs in GTmax and PSS/E model, following assumptions are made: Albania: PSS/E program = GTmax program Bulgaria: PSS/E program = GTmax program BIH: PSS/E program = GTmax program – production (DUBROVNIK G-2) Croatia: PSS/E program = GTmax program + production (DUBROVNIK G-2) – 50% production (KRSKO) Macedonia: PSS/E program = GTmax program Romania: PSS/E program = GTmax program Serbia: PSS/E program = GTmax program (Serbia) + GTmax program (UNMIK) – production (PIVA) Montenegro: PSS/E program = GTmax program + production (PIVA) In sensitivity cases analyses, new generation facilities are modeled. One of them is HPP Buk Bijela and HPP Srbinje in Bosnia and Herzegovina. 1/3 of the energy produced by this plants is owned by Montenegro, so in these cases (2015 average hydrology high load scenarios) exchange program of BIH and Montenegro is calculated as: BIH: PSS/E program = GTmax program – production (DUBROVNIK G-2)+ 1/3production(BUKBSRB) Montenegro: PSS/E program = GTmax program + production (PIVA)-1/3production(BUKBSRB)

3.1
3 ANALYZED GENERATION, DEMAND AND EXCHANGE SCENARIOS

3.2
This chapter shortly describes analyzed generation, demand and exchange scenarios in WASP and GTMax and explains how they are modeled in PSS/E. Total number of 10 scenarios were analyzed from transmission network prospective. WASP Scenario B results, were discussed and it was decided that WASP Scenario B “Case 1A” would be used as the Reference Case for GTmax Scenario C, and for PSS/E analyses as Reference cases. These Reference Cases include medium demand forecast, most likely fuel price forecast for all fuels and life extension and rehabilitation program as scheduled by the utilities. Within the extensive GTMax analyses in 2010 and 2015, the distribution of the new generation units to specific jurisdictions has been done. The specific (named) new generation units have defined sites and their distribution throughout the region have been done according to defined sites. Distribution of non-specific new generation units has been solved by taking into account the power balance for each jurisdiction or their specific needs. On the basis of the WASP results for the Reference Case and defined distribution of specific and non-specific new generation units, detailed GTMax simulation of the weekly operation of the regional power system have been done in average, dry and wet hydrology conditions. The generation of each power plant in peak hour of 2010 and 2015 in average, dry and wet hydrology conditions have been obtained as one of the GTMax results and have been used as input data for transmission network analyses done using PSS/E software package. Five scenarios were related to year 2010, and other five scenarios were related to year 2015. Three scenarios for each year represent base cases and other two extra situations characterized by high demand and power imports. 3.1. Year 2010 Scenarios Following tables 3.1.1-3.1.5 include generation and demand data dependent on analyzed hydrological situations, load level and power imports, related to year 2010. For each country one row represents GTMax data (white rows) and one row (shaded ones) equivalent data in PSS/E model according to explanations from Chapter 2. Differences in demand, hydro power plants and thermal power plants production are caused by plants connected to voltage levels below 110 kV which are not included into PSS/E model, so their overall production is included reducing demand, hydro and thermal production. This is the most obvious in Romanian power system characterized by large number of small hydro power plants connected to low voltage levels so Romanian balance in PSS/E model is quite different than on GTMax model. Total power system balances (production minus demand) are different in GTMax and PSS/E models for Bosnia and Herzegovina (HPP Dubrovnik production is included into Croatian balance on PSS/E model), Croatia (HPP Dubrovnik is included, NPP Krsko in Slovenia is excluded from the balance), Montenegro (HPP Piva is included), and Serbia and UNMIK (HPP Piva is excluded from their balance). WASP results for the Reference Case show that, for the period 2005-2010, the following new capacity would be added to the regional power system: • Cernavoda nuclear unit #2 • Kolubara lignite unit #1, and • One 500-MW Kosovo lignite plant and these were included in the PSS/E model for 2010.

3.3
For 2010 year, additional scenarios are analyzed as Sensitivity cases. One of them is the High Load Forecast with new generation facilities implemented: HPP Zhur connected to the UNMIK node and there are also one 300 MW and one 500 MW combined cycle plant in Croatia and additional 500 MW unit connected to UNMIK node. This High Demand Forecast Case includes high demand forecast, most likely fuel price forecast for all fuels and life extension and rehabilitation program as scheduled by the utilities. On the basis of the WASP results for the High Demand Forecast Case and defined distribution of specific and non-specific new generation units, detailed GTMax simulation of the weekly operation of the regional power system have been done in average hydrology condition. The generations of each power plant in peak hour of 2010 and 2015 in average hydrology condition have been obtained as one of the GTMax results and have been used as input data for transmission network analyses done using PSS/E software package. As second Sensitivity case, additional energy exchanges in the region are analyzed. This Import/Export Case includes medium demand forecast, most likely fuel price forecast for all fuels, life extension and rehabilitation program as scheduled by the utilities and net import of 1,500MW into the region. Following additional exchanges are simulated: - Import 750 MW from UCTE. - Import 500 MW from Turkey. - Export 500 MW to Greece. - Import 750 MW from Ukraine. On the basis of the WASP results for the Import/Export Case and defined distribution of specific and non-specific new generation units, detailed GTMax simulation of the weekly operation of the regional power system have been done in average hydrology condition. The generations of each power plant in peak hour of 2010 and 2015 in average hydrology condition have been obtained as one of the GTMax results and have been used as input data for transmission network analyses done using PSS/E software package. After comparison of the GTMax results for this case with the results for Base Case it can be seen that there is no new TPPs connected to UNMIK node or Mladost node in 2010 (without new TPPs on Kosovo and without Kolubara B units).

3.4
Table 3.1.1: Demand, Generation and Exchanges in SE Europe for base case - average hydrological scenario in
2010
Country Demand (MW)
HPP Generation (MW)*
TPP and NPP Generation (MW)
Total Generation (MW)
Surplus(+)/Deficit(-)
1338 757 140 897 -441 Albania 1338 757 140 897 -441 2077 1591 826 2417 341 Bosnia and
Herzegovina 2029 1439 826 2265 236 6193 554 6426 6980 787 Bulgaria 6113 474 6426 6900 787 3217 1018 749 1767 -1450 Croatia 3186 1092 411 1503 -1683 1229 232 730 962 -268 Macedonia 1218 220 730 950 -268 687 228 0 228 -459 Montenegro 687 540 0 540 -147 7797 2996 5730 8726 930 Romania 7022 2256 5696 7952 930 7112 2582 5090 7672 560 Sebia and
UNMIK 7112 2270 5090 7360 248 29649 9958 19691 29649 0 Region Total 28705 9048 19319 28367 -338**
* pumped storage HPP’s included ** half of NPP Krsko (Slovenia) production (scheduled for Croatian power system) Table 3.1.2: Demand, Generation and Exchanges in SE Europe for base case - dry hydrological scenario in 2010
Country Demand
(MW) HPP Generation
(MW)* TPP and NPP
Generation (MW) Total Generation
(MW) Surplus(+)/Deficit(-)
1338 753 200 953 -384 Albania 1338 753 200 953 -384 2077 1636 1338 2974 898 Bosnia and
Herzegovina 2050 1504 1338 2843 793 6193 373 6426 6799 606 Bulgaria 6103 283 6426 6709 606 3217 924 1632 2555 -661 Croatia 3189 1001 1294 2295 -894 1229 296 730 1026 -203 Macedonia 1224 290 730 1020 -203 687 179 0 179 -508 Montenegro 687 467 0 467 -220 7797 1820 5776 7596 -200 Romania 7128 1185 5742 6927 -200 7112 2476 5090 7566 454 Sebia and
UNMIK 7112 2188 5090 7278 166 29649 8457 21192 29649 0 Region Total 28830 7672 20820 28492 -338*
* pumped storage HPP’s included ** half of NPP Krsko (Slovenia) production (scheduled for Croatian power system)

3.5
Table 3.1.3: Demand, Generation and Exchanges in SE Europe for base case - wet hydrological scenario in 2010
Country Demand
(MW) HPP Generation
(MW)* TPP and NPP
Generation (MW) Total Generation
(MW) Surplus(+)/Deficit(-)
1338 759 140 899 -439 Albania 1338 759 140 899 -439 2077 1630 570 2200 124 Bosnia and
Herzegovina 2019 1468 570 2038 19 6193 686 6346 7032 839 Bulgaria 6103 596 6346 6942 839 3217 1249 749 1998 -1219 Croatia 3187 1324 411 1735 -1452 1229 367 730 1097 -132 Macedonia 1214 352 730 1082 -132 687 244 0 244 -443 Montenegro 687 586 0 586 -101 7797 3744 4684 8428 632 Romania 6706 2653 4684 7337 632 7112 2662 5090 7751 639 Sebia and
UNMIK 7112 2319 5090 7409 297 29649 11341 18309 29649 0 Region Total 28366 10057 17971 28028 -338**
* pumped storage HPP’s included ** half of NPP Krsko (Slovenia) production (scheduled for Croatian power system)
Table 3.1.4: Demand, Generation and Exchanges in SE Europe for sensitivity case – high load – average hydrological scenario in 2010
Country Demand
(MW) HPP Generation
(MW)* TPP and NPP
Generation (MW) Total Generation
(MW) Surplus(+)/Deficit(-)
1414 790 140 930 -484 Albania 1414 790 140 930 -484 2114 1693 667 2360 246 Bosnia and
Herzegovina 2061 1535 667 2202 141 6492 518 6832 7350 858 Bulgaria 6425 450 6832 7282 858 3371 1001 1507 2508 -863 Croatia 3350 1085 1169 2254 -1096 1262 271 730 1001 -261 Macedonia 1252 261 730 991 -261 704 228 0 228 -476 Montenegro 704 540 0 540 -163 8320 3237 5026 8263 -57 Romania 7533 2484 4992 7476 -57 7346 2774 5608 8382 1036 Sebia and
UNMIK 7346 2462 5608 8070 724 31022 10512 20510 31022 0 Region Total 30085 9379 20138 29747 -338**
* pumped storage HPP’s included ** half of NPP Krsko (Slovenia) production (scheduled for Croatian power system)

3.6
Table 3.1.5: Demand, Generation and Exchanges in SE Europe for sensitivity case – power import – average
hydrological scenario in 2010
Country Demand (MW)
HPP Generation (MW)*
TPP and NPP Generation (MW)
Total Generation (MW)
Surplus(+)/Deficit(-)
1338 757 140 897 -440 Albania 1338 757 140 897 -440 2077 1734 826 2560 484 Bosnia and
Herzegovina 2019 1572 826 2398 379 6193 561 6346 6907 714 Bulgaria 6113 481 6346 6827 714 3217 1218 749 1967 -1250 Croatia 3188 1294 411 1705 -1483 1229 266 730 996 -233 Macedonia 1199 235 730 965 -233 687 228 0 228 -459 Montenegro 687 540 0 540 -147 7797 2936 4756 7692 -105 Romania 6977 2150 4722 6872 -105 7112 2582 4320 6902 -210 Sebia and
UNMIK 7112 2270 4320 6590 -522 29649 10282 17867 28149 -1500 Region Total 28633 8788 17495 26795 -1838**
* pumped storage HPP’s included ** 1500 MW of import plus half of NPP Krsko (Slovenia) production (scheduled for Croatian power system) 3.2. Year 2015 Scenarios Following tables 3.2.1-3.2.5 include generation and demand data dependent on analyzed hydrological situations, load level and power imports, related to year 2015, using the same assumptions explained in previous subchapter. WASP results for the Reference Case show that, for the period 2011-2015, the following new capacity would be added to the regional power system: • Cernavoda nuclear unit #3 • Kolubara lignite unit #2 • One 300-MW and two 500-MW Kosovo lignite plants • Two 100-MW CHP plants, and • Two 300-MW and one 500-MW combined cycle plants On the basis of this kind of analyses the following distribution of new non-specific generation units have been arranged: - two 100 MW CHP units have been placed in Romania - two 300 MW and one 500 MW combined cycle units have been placed in Croatia all these are included in PSS/E model for 2015. Like for 2010, and for 2015 year, additional scenarios are analyzed as Sensitivity cases. One of them is the High Load Forecast with new generation facilities implemented: - HPP Buk Bijela with HPP Srbinje in B&H. Within the results from GTMax it can be seen that this hydro system is partially connected to Sarajevo node in B&H and partially to Montenegro node, due to the partial ownership of this hydro system. - HPP Glavaticevo connected to Mostar node in B&H. - HPP Dabar connected to Trebinje node in B&H. - HPP Komarnica connected to Montenegro node.

3.7
- HPP Kostanica connected to Montenegro node. - HPP Andrijevo and Zlatica connected to Montenegro node. - NPP Belene nuclear plant connected to Varna node in Bulgaria, - one 100 MW CHP unit connected to Mladost node in Serbia, - one 500 MW combined cycle plant connected to node Zagreb in Croatia - and additional two 300 MW and two 500 MW units connected to UNMIK node. After comparison of the GTMax results for Export/Import Case (exchanges in/from/to SE Europe are the same as in 2010) with the results for Base Case in 2015 it can be seen that there is no Chernavoda Unit 3, no CHP unit connected to SIBIU node, no second 300 MW unit connected to Zagreb node, only one 500 MW unit connected to UNMIK node, but instead of one now there are two 300 MW units connected to UNMIK node. As second Sensitivity case for 2015, additional energy exchanges in the region are analyzed. This was called Import/Export Case, and following additional exchanges are simulated (same as for 2010): - Import 750 MW from UCTE. - Import 500 MW from Turkey. - Export 500 MW to Greece. - Import 750 MW from Ukraine. Table 3.2.1: Demand, Generation and Exchanges in SE Europe for base case - average hydrological scenario in
2015
Country Demand (MW)
HPP Generation (MW)*
TPP and NPP Generation (MW)
Total Generation (MW)
Surplus(+)/Deficit(-)
1614 978 140 1118 -496 Albania 1614 978 140 1118 -496 2410 1648 826 2474 64 Bosnia and
Herzegovina 2358 1491 826 2317 -41 6688 533 6854 7387 699 Bulgaria 6619 465 6854 7319 699 3752 986 1595 2581 -1171 Croatia 3721 1060 1257 2317 -1404 1438 379 720 1099 -340 Macedonia 1427 367 720 1087 -340 694 230 191 421 -273 Montenegro 694 542 191 733 39 9056 3424 5680 9104 48 Romania 7973 2547 5474 8021 48 7499 2584 6383 8967 1468 Sebia and
UNMIK 7499 2272 6383 8655 1156 33151 10762 22389 33151 0 Region Total 31906 9722 21845 31568 -338**
* pumped storage HPP’s included ** half of NPP Krsko (Slovenia) production (scheduled for Croatian power system)
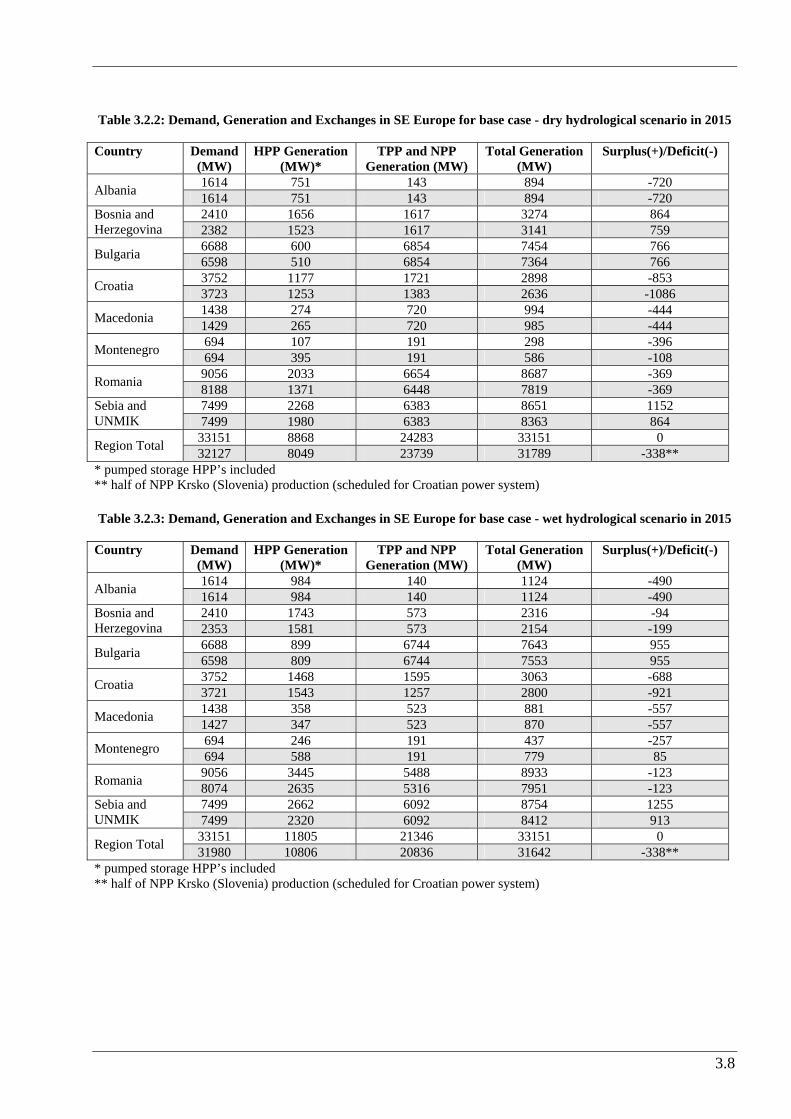
3.8
Table 3.2.2: Demand, Generation and Exchanges in SE Europe for base case - dry hydrological scenario in 2015
Country Demand
(MW) HPP Generation
(MW)* TPP and NPP
Generation (MW) Total Generation
(MW) Surplus(+)/Deficit(-)
1614 751 143 894 -720 Albania 1614 751 143 894 -720 2410 1656 1617 3274 864 Bosnia and
Herzegovina 2382 1523 1617 3141 759 6688 600 6854 7454 766 Bulgaria 6598 510 6854 7364 766 3752 1177 1721 2898 -853 Croatia 3723 1253 1383 2636 -1086 1438 274 720 994 -444 Macedonia 1429 265 720 985 -444 694 107 191 298 -396 Montenegro 694 395 191 586 -108 9056 2033 6654 8687 -369 Romania 8188 1371 6448 7819 -369 7499 2268 6383 8651 1152 Sebia and
UNMIK 7499 1980 6383 8363 864 33151 8868 24283 33151 0 Region Total 32127 8049 23739 31789 -338**
* pumped storage HPP’s included ** half of NPP Krsko (Slovenia) production (scheduled for Croatian power system) Table 3.2.3: Demand, Generation and Exchanges in SE Europe for base case - wet hydrological scenario in 2015
Country Demand
(MW) HPP Generation
(MW)* TPP and NPP
Generation (MW) Total Generation
(MW) Surplus(+)/Deficit(-)
1614 984 140 1124 -490 Albania 1614 984 140 1124 -490 2410 1743 573 2316 -94 Bosnia and
Herzegovina 2353 1581 573 2154 -199 6688 899 6744 7643 955 Bulgaria 6598 809 6744 7553 955 3752 1468 1595 3063 -688 Croatia 3721 1543 1257 2800 -921 1438 358 523 881 -557 Macedonia 1427 347 523 870 -557 694 246 191 437 -257 Montenegro 694 588 191 779 85 9056 3445 5488 8933 -123 Romania 8074 2635 5316 7951 -123 7499 2662 6092 8754 1255 Sebia and
UNMIK 7499 2320 6092 8412 913 33151 11805 21346 33151 0 Region Total 31980 10806 20836 31642 -338**
* pumped storage HPP’s included ** half of NPP Krsko (Slovenia) production (scheduled for Croatian power system)

3.9
Table 3.2.4: Demand, Generation and Exchanges in SE Europe for sensitivity case – high load – average
hydrological scenario in 2015
Country Demand (MW)
HPP Generation (MW)*
TPP and NPP Generation (MW)
Total Generation (MW)
Surplus(+)/Deficit(-)
1781 758 140 898 -883 Albania 1781 758 140 898 -883 2503 1989 630 2619 116 Bosnia and
Herzegovina 2433 1814 630 2444 11 7327 552 7674 8226 899 Bulgaria 7259 484 7674 8158 899 4067 1007 1845 2852 -1215 Croatia 4040 1085 1507 2592 -1448 1516 179 720 899 -617 Macedonia 1513 176 720 896 -617 736 922 191 1113 377 Montenegro 736 1234 191 1425 689
10232 3584 5608 9192 -1040 Romania 9175 2698 5436 8135 -1040 8025 2472 7917 10389 2364 Sebia and
UNMIK 8025 2160 7917 10077 2052 36188 11463 24725 36188 0 Region Total 34962 10408 24215 34624 -338**
* pumped storage HPP’s included ** half of NPP Krsko (Slovenia) production (scheduled for Croatian power system)
Table 3.2.5: Demand, Generation and Exchanges in SE Europe for sensitivity case – power import – average hydrological scenario in 2015
Country Demand
(MW) HPP Generation
(MW)* TPP and NPP
Generation (MW) Total Generation
(MW) Surplus(+)/Deficit(-)
1614 886 140 1026 -588 Albania 1614 886 140 1026 -588 2410 1720 826 2546 136 Bosnia and
Herzegovina 2364 1568 826 2395 31 6688 840 6854 7694 1006 Bulgaria 6578 730 6854 7584 1006 3752 1133 1307 2440 -1312 Croatia 3721 1207 969 2176 -1545 1438 379 720 1099 -340 Macedonia 1417 357 720 1077 -340 694 230 191 421 -273 Montenegro 694 542 191 733 39 9056 3030 5054 8084 -972 Romania 8161 2256 4934 7190 -972 7499 2584 5757 8341 842 Sebia and
UNMIK 7499 2272 5757 8029 530 33151 10802 20849 31651 -1500 Region Total 32048 9819 20391 30210 -1838**
* pumped storage HPP’s included ** import of 1500 MW plus half of NPP Krsko (Slovenia) production (scheduled for Croatian power system)

4.1
4 LOAD FLOW AND CONTINGENCY ANALYSIS – REFERENCE CASES

4.2
Introduction In this chapter load-flow and security (n-1) analysis for reference cases defined in Chapter 2 is described. The analyzed network models are:
Year Hydrology Topology average dry 2010 wet
2010
2010 average 2015 2010 dry 2015 2010
2015
wet 2015 The load-flow analysis includes line loading and voltage profile analysis, analysis of losses and also analysis of power flows through interconnection lines. The system reliability and adequacy is checked using “n-1” contingency criterion. List of contingencies includes:
• all interconnection lines; • all 400 and 220 kV lines in analyzed region, except lines which outage cause “island”
operation (in case of parallel and double circuit lines, outage of one line is considered); • all transformers 400/x kV in analyzed region (in case of parallel transformers, outage of one
transformer is considered). Current thermal limits are used as rated limits of lines and transformers, as described in Chapter 2. Voltage limits are defined in Chapter 2, also. Every branch with current above its thermal limit is treated as overloaded. States with overloaded branches and/or voltages below or above defined voltage limits are treated as "insecure".
4.1 Scenario 2010 – average hydrology – 2010 topology This part of the Study presents results of static load flow and voltage profile analyses that are conducted for complete network topology and (n-1) contingencies in the scenario which is denoted as Scenario 2010 average hydrology.
4.1.1 Line loadings Area totals and power exchanges for the 2010-base case-average hydrology scenario are shown in Figure 4.1.1 and Table 4.1.1. Power flows along regional interconnection lines and system balances are shown in Figure 4.1.2. Power flows along interconnection lines are also given in Table 4.1.2, while Figure 4.1.3 shows histogram of tie lines loadings.

4.3
AUT
ALB
BIH
BUL
CRO
GRE
ITA
HUN
MKD
MNT
ROM
SRB
SVK
SLO
TUR
UKR
108
330
333
309
94
36 6
32
530
272
1810
413
175
376
133
40
60
272
250
91
450
127
541
2 4
2 50
67 4
0 2 4
Figure 4.1.1 - Area exchanges in analyzed electric power systems for 2010-base case-average hydrology scenario
Table 4.1.1 - Area totals in analyzed electric power systems for 2010-base case-average hydrology scenario Country Generation
(MW) Load (MW)
Bus Shunt (Mvar)
Line Shunt (Mvar)
Losses (MW)
Net Interchange (MW)
Albania 896.7 1287.3 0 0 50.4 -441.0 Bulgaria 6900.4 5977.3 0 14.4 121.6 787.0 Bosnia and Herzegovina 2266.1 1971.3 0 0 58.6 236.2 Croatia 1502.9 3136.7 0 0 49.0 -1682.8 Macedonia 950.3 1198.2 0 0 20.1 -268.0 Romania 7939.9 6728.3 0 80.0 201.2 930.4 Serbia and UNMIK 7355.9 6873.1 0 13.6 220.8 248.4 Montenegro 539.8 669.2 0.6 1.6 15.5 -147.0 TOTAL - SE EUROPE 28351.9 27841.4 0.6 109.5 737.1 -336.7

4.4
Figure 4.1.2 - Power flows along interconnection lines in the region for 2010 - base case - average hydrology scenario
PEHLIN 233.7
MELINA 407.3
TUMBRI 404.2
MEDURIC 226.6MRACLIN 227.2
DAKOVO 225.8
KONJSKO
408.4
HE ZAKUC
233.3
ZERJAVIN 406.7
ZERJAVIN 230.4
AZEMLA1
398.2
AKASHA1 386.0
AVDEJA2227.4AFIERZ2228.4
OWIEN 1
405.6
OWIEN 2
234.3
MGYOR 4
403.5
MGYOR 2
229.0
ONEUSI2
233.5
OKAINA1402.6
LMARIB1403.9
OOBERS2238.7
IRDPV111
401.4
LDIVAC1
403.0
IPDRV121
231.3
LDIVAC2
230.8
LKRSKO1 403.2
PRIJED2 226.0
GRADACAC 228.5
TE TUZL 233.7
JSMIT21
403.2
VISEGRA232.4
JVARDI22230.5
SA 20232.2
JHPIVA21236.1
RP TREB404.1
JHPERU21
229.6
JPODG211
397.2
MO-4
408.6
MHEVI 4 409.5
RP TREB
233.1
JPODG121228.5
JPRIZ22223.0 JTKOSA2226.9JTKOSB1406.9
407.3
BITOLA 2 416.4
AHS_FLWR417.6
DUBROVO 412.4
QES/H K 413.2
BLAGOEV414.5
STIP 1
412.4
C_MOGILA
413.8
JNIS2 1395.7
SOFIA_W4411.9
KARDIA K416.8
GABICK1400.0
MGOD 4 407.8
LEVIC 1400.0
MSAJO 4410.0
UMUKACH
412.0
ROSIORI 410.3
MKISV 2226.3
UMUKACH2
224.4
MTLOK 2
230.5
MSAFA 4 404.1
JSUBO31 398.8
ARAD
402.9
TANTAREN 415.6
AEC_400 415.8
JHDJE11
404.2
LPODLO2229.9
FILIPPOI
415.6
SK 1 223.3
LCIRKO2 228.9
P.D.FIE
404.3
UGLJEVIK 405.1
ISACCEA 414.3
DOBRUD4 421.3
JSOMB31396.6
MPECS 4 409.8
UZUKRA01772.5
MAISA 7715.1
NADAB404.4
MBEKO 4406.3
SK 4 408.3
JLESK21386.9
ERNESTIN
407.8
MO-4
234.8
MI_3_4_1 420.4
JVRAN310.000
LAGAD K 414.1
KARACQOU419.1KARACQOU419.1
K-KEXRU417.94BABAESK415.7
4HAMITAX
415.6
MSAJI 4408.2
AVDEJA1 395.4
417112
411135
24.7
20.6
10.0
37.27
.0
15.3
43.17.5
69.621.6
105
68.4
278
68.1
27639.2
198
98.7
199
40.8
53.261.0
14716.6
14814.3
34.118.8
33.926.7
18.676.9
18.7120
53.059.2
7.0
5.8
10.3
45.8
6.9
29.4
6.8
18.7
6.9
29.4
6.8
18.7
26.0
21.7
63.7
48.1 6
8.7
33.2
68.8
28.2
25041.6
25042.3
130
42.5
129
6.1
130
42.5
374138
377108
35.421.0
35.627.8
16657.2
16752.9
90.73.1
24713.0
24959.7
32.0
135
32.1
110
90.9
59.7
29146.9
51.7
28.5
51.5
19.5
58.3
18.7 104
36.9
334103
176
53.8
176
53.8
106
42.7
106
42.7
66.692.0
32.629.0
163
36.3
166
41.0
199
97.3
200
143
251
116
250
94.1
63.7
25.6
278
68.1
10.629.3
10.77.7
15941.5
15962.7
28.049.0
28.045.4
58.4
53.4
58.4
22.2
58.4
22.2
58.4
53.4
346803
350299
28163.8
28274.5
129
6.1
175
38.0
176
48.7
31.9
49.4
15.014.5
14.928.6
42.723.2
69.5104
105
12.4
33271.3
77.4
46.8
77.4
46.8
77.5
2.3
77.5
2.3
12514.3
51.4
20.8
51.2
12.5 58.0
23.4
103
39.6
176
29.3
176
29.3
45.2
25.4
44.916.6
105
62.5 1
05
62.56
6.7
68.2
32.7
19.3
2900.6
12816.2
241
38.9
31.8
45.9
239
76.0
23.722.6
11.011.9
241
38.9
12.77.2
11.0
68.8
12.6
95.9
23.771.6
25050.0
11.068.8
10.980.1
26.0
28.6
24.6
48.5
27.7
128
27.3
167
ROM
BUL
HUN
UKRUCTE
CENTREL
CRO
BIH
SCG
ALB
GRE
MKD
TUR
SLO
CRGSRB
101.4 MW
-147.0 MW248.4 MW
-268.0 MW
787.0 MW
-441.0 MW
236.2 MW
221.6 MW
-1682.8 MW
-1249.4 MW
-0.1 MW
450.0 MW
930.0 MW
215.0 MW
0.0 MW
450.0 MW
SHAW POWERTECHNOLOGIESINC.R KV: 110 , 220 , 400
BUS -VOLTAGE(KV)
EQUIPMENT -MW/MVARBRANCH -MW/MVAR
GIS REGIONAL MODEL - AVERAGE HYDRO2010

4.5
Table 4.1.2 - Power flows along regional interconnection lines for 2010 - base case-average hydrology scenario
Power Flow Interconnection line MW
Mvar
% of thermal rating
OHL 400 kV Zemlak (ALB) Kardia (GRE) -410.7 -135.0 32 OHL 220 kV Fierze (ALB) Prizren (SER) -10.0 37.2 15 OHL 220 kV V.Dejes (ALB) Podgorica (MON) 7.0 -15.3 6 OHL 400 kV V.Dejes (ALB) Podgorica (MON) -24.6 -48.5 4 OHL 400 kV Ugljevik (B&H) Ernestinovo (CRO) 105.4 -68.4 10 OHL 400 kV Mostar (B&H) Konjsko (CRO) 291.3 -46.9 22 OHL 400 kV Ugljevik (B&H) S. Mitrovica (SER) -276.4 39.2 21 OHL 400 kV Trebinje (B&H) Podgorica (MON) -18.6 76.9 9 OHL 220 kV Trebinje (B&H) Plat (CRO) -104.8 40.0 36 OHL 220 kV Prijedor (B&H) Mraclin (CRO) 51.7 -28.5 18 OHL 220 kV Prijedor (B&H) Medjuric (CRO) 51.5 -19.5 17 OHL 220 kV Gradacac (B&H) Djakovo (CRO) 58.3 18.7 21 OHL 220 kV Tuzla (B&H) Djakovo (CRO) 103.9 36.9 36 OHL 220 kV Mostar (B&H) Zakucac (CRO) 127.6 -16.2 33 OHL 220 kV Visegrad (B&H) Vardiste (SER) -53.0 59.2 26 OHL 220 kV Sarajevo 20 (B&H) Piva (MON) -147.1 -16.6 38 OHL 220 kV Trebinje (B&H) Perucica (MON) 34.1 18.8 14 OHL 400 kV Blagoevgrad (BUL) Thessaloniki (GRE) 31.9 -49.4 8 OHL 400 kV M.East 3 (BUL) Filippi (GRE) 240.9 -38.9 35 OHL 400 kV M.East 3 (BUL) Babaeski (TUR) 11.0 -11.9 5 OHL 400 kV M.East 3 (BUL) Hamitabat (TUR) 12.7 -7.2 5 OHL 400 kV C.Mogila (BUL) Stip (MCD) 175.7 -48.7 25 OHL 400 kV Dobrudja (BUL) Isaccea (ROM) 199.5 -40.8 15 OHL 2x400 kV ckt.1 Kozloduy (BUL) Tantarena (ROM) -129.5 -6.1 10 OHL 2x400 kV ckt.2 Kozloduy (BUL) Tantarena (ROM) -129.5 -6.1 10 OHL 400 kV Sofia West (BUL) Nis (SER) 377.1 108.2 55 OHL 2x400 kV ckt.1 Zerjavinec (CRO) Heviz (HUN) -105.4 -62.5 9 OHL 2x400 kV ckt.2 Zerjavinec (CRO) Heviz (HUN) -105.4 -62.5 9 OHL 2x400 kV ckt.1 Ernestinovo (CRO) Pecs (HUN) -77.4 -46.8 7 OHL 2x400 kV ckt.2 Ernestinovo (CRO) Pecs (HUN) -77.4 -46.8 7 OHL 2x400 kV ckt.1 Tumbri (CRO) Krsko (SLO) -176.0 29.3 16 OHL 2x400 kV ckt.2 Tumbri (CRO) Krsko (SLO) -176.0 29.3 16 OHL 400 kV Melina (CRO) Divaca (SLO) 66.8 53.5 10 OHL 400 kV Ernestinovo (CRO) S.Mitrovica (SER) -332.1 71.3 25 OHL 220 kV Zerjavinec (CRO) Cirkovce (SLO) -44.9 16.6 16 OHL 220 kV Pehlin (CRO) Divaca (SLO) 32.7 19.3 13 OHL 400 kV Dubrovo (MCD) Thessaloniki (GRE) -68.7 -33.2 6 OHL 400 kV Bitola (MCD) Florina (GRE) -63.7 -48.1 6 OHL 400 kV Skopje (MCD) Kosovo B (UNMIK) 26.0 -21.7 3 OHL 2x220 kV ckt.1 Skopje (MCD) Kosovo A (UNMIK) 6.9 -29.4 9 OHL 2x220 kV ckt.2 Skopje (MCD) Kosovo A (UNMIK) 6.9 -29.4 9 OHL 400 kV Arad (ROM) Sandorfalva (HUN) 248.6 -59.7 21 OHL 400 kV - Nadab (ROM) Bekescaba (HUN) 281.9 -74.5 24 OHL 400 kV Rosiori (ROM) Mukacevo (UKR) 90.9 -59.7 9 OHL 400 kV Portile De Fier (ROM) Djerdap (SER) 249.7 41.6 19 OHL 400 kV Subotica (SER) Sandorfalva (HUN) -32.0 -135.1 10 OHL 400 kV Ribarevine (MON) Kosovo B (UNMIK) -296.0 -15.0 22 OHL 220 kV Pljevlja (MON) Bajina Basta (SER) -46.0 10.7 17 OHL 220 kV Pljevlja (MON) Pozega (SER) 34.9 35.3 19

4.6
Figure 4.1.3 shows that the tie lines in the region are mostly loaded less than 25% of their thermal limits for the analyzed hydrological base case scenario in year 2010. Among total number of forty nine 400 kV and 220 kV interconnection lines in the region only seven are loaded between 25% and 50% of their thermal ratings. Only one line (OHL 400 kV Sofia – Nis between Bulgaria and Serbia) is loaded more than 50% of its thermal rating, which is set at lower value (692.8 MVA) on the Bulgarian side compared to the line rating on the Serbian side (1330.2 MVA).
05
101520
253035
4045
x<25 25<x<50 50<x<75 75<x<100 x>100
Bin
Freq
uenc
y
Figure 4.1.3 - Histogram of interconnection lines loadings for 2010-base case-average hydrology scenario ("Frequency"
denotes number of lines and "Bin" denotes loading range in % of thermal limit) Table 4.1.3 lists all network elements loaded over 80% of their thermal limits. As it can be seen from this output list, most of the elements loaded over 80% are transformers in some substations and internal 110 kV and 220 kV lines. Thus, certain internal network reinforcements are necessary to sustain given load-demand level and production pattern. Two 220/110 kV transformers in the Fierze substation in Albania are slightly overloaded in this scenario, while the third transformer in the same substation is loaded near permitted values. It is expected that the transformers in that substation will be replaced with larger transformer units. There are two 110 kV internal lines in Romania which are loaded over 80% of their thermal limits, but none of them is overloaded. These lines are related to the Bojuren and Domnesti nodes. Two 220 kV lines and thirteen 110 kV lines in the Serbian power system are highly loaded when all branches are available in the analyzed scenario. Highly loaded 220 kV lines are connected to the Obrenovac substation, while 110 kV lines are located mostly in the area of Belgrade. Four 110 kV lines are overloaded, ranging between 108% Ithermal and 118% Ithermal. Power systems of Bulgaria, Bosnia and Herzegovina, Croatia, Macedonia and Montenegro do not have or have very few highly loaded branches in 110 kV networks. Figure 4.1.4 shows histogram of 400 kV and 220 kV regional internal lines and 400/x kV and 220/x kV transformers loadings. 47% of observed branches are loaded below 25% of their thermal ratings, 34% are loaded between 25% and 50%, 16% are loaded between 50% and 75% and only 2% of observed branches are loaded between 75% and 100% of their thermal ratings. Two branches (transformers 220/110 kV Fierze in Albania, 102% - 106% Sn) are overloaded if all branches are in operation for the analyzed scenario.

4.7
Table 4.1.3 - Network elements loaded over 80% of thermal limits for 2010-base case-average hydrology scenario
AREA ELEMENT LOADINGMVA
RATINGMVA PERCENT
Transformers TR 220/110 kV AFIER 2-AFIER 5 ckt.1 116.8 120.0 93.7 TR 220/110 kV AFIER 2-AFIER 5 ckt.2 95.7 90.0 106.4 ALB TR 220/110 kV AFIER 2-AFIER 5 ckt.3 91.4 90.0 101.5
BIH TR 400/110 kV UGLJEV 1 254.8 300 84.9 TR 400/220 kV MINTIA-MINTIA B 385.7 400.0 96.4 ROM TR 220/110 kV FUNDENI-FUNDE2B 173.1 200.0 86.6
0
50
100
150
200
250
300
350
400
x<25 25<x<50 50<x<75 75<x<100 x>100
Bin
Freq
uenc
y
Figure 4.1.4 - Histogram of 400 kV and 220 kV regional lines loadings for 2010-base case-average hydrology scenario
("Frequency" denotes number of lines and "Bin" denotes loading range in % of thermal limit)
4.1.2 Voltage Profile in the Region Voltage profile in the region within this scenario which is defined by given generation and demand pattern is seen as satisfactory despite several appearances of certain bus voltage deviations. The deviations are shown in Table 4.1.4, which includes only 400 kV and 220 kV network buses.
Table 4.1.4 - Bus voltage deviations for 2010-base case-average hydrology scenario, complete network Voltages Country Node pu kV
ALBANIA - - - BOSNIA AND HERZEGOVINA - - -
400 kV VARNA4 1.054 421.4 400 kV BURGAS 1.051 420.5 400 kV MARITSA EAST2 1.055 422.1 400 kV TECMIG5 1.051 420.5 400 kV TECMIG7 1.051 420.5 400 kV DOBRUD4 1.053 421.3 400 kV MARITSA EAST 3_4_1 1.051 420.5 400 kV TECMIG6 1.051 420.5 220 kV SESTRIMO 1.104 242.8 220 kV BPC_220 1.102 242.5 220 kV MIZIA2 1.101 242.1 220 kV AEC_220 1.103 242.6
BULGARIA
220 kV TECVARNA 1.104 242.9 CROATIA - - - MACEDONIA - - - MONTENEGRO - - - ROMANIA - - - SERBIA AND UNMIK - - -

4.8
Bus voltage magnitudes below permitted limits are not found in the analyzed scenario. Bus voltage magnitudes that are found above permitted limits (110% Vnominal in 110 kV and 220 kV networks and 105% Vnominal in 400 kV network) are detected only in Bulgaria. There are eight 400 kV buses and five 220 kV buses with voltages slightly above permitted limits. Figure 4.1.5 shows histogram of voltages in monitored 400 kV and 220 kV substations.
0
20
40
60
80
100
120
x<0.
9
0.9<
x<0.
95
0.95
<x<0
.975
0.97
5<x<
1
1<x<
1.02
5
1.02
5<x<
1.05
1.05
<x<1
.1
x>1.
1
Bin
Freq
uenc
y
Figure 4.1.5 - Histogram of voltages in monitored substations for 2010-base case-average hydrology scenario
("Frequency" denotes number of busses and "Bin" denotes voltage range in p.u.) It should be emphasized that these results represent only a situation when additional devices (transformer automatic tap changers, switched shunts, etc.) are not used for voltage regulation. Impacts of such devices, which exist in many points of the SEE regional transmission network, need more comprehensive and thorough analysis.
4.1.3 Security (n-1) analysis Results of security (n-1) analysis for the 2010-base case-average hydrology scenario are presented in Table 4.1.5 and Table 4.1.6. Insecure states for given generation and demand pattern are detected mostly in the power systems of Romania and Serbia, although there is one contingency in Albania which leads to insecure state. The most critical branch in the analyzed load/generation scenario is the transformer 400/220 kV in the Mintia B substation in Romania. It is due to a high level of generation in DEVA 1 power plant (850 MW), which is connected to 220 kV busbars in that substation. Noted transformer becomes overloaded if one among eleven 400 kV and 220 kV lines or 400/220 kV transformers in the Romanian or Serbian power system goes out of operation. Secure operating conditions can be achieved if the generation level in DEVA 1 (Mintia) power plant is significantly lowered. Other way to achieve more secure operation with the same level of production in DEVA 1 power plant is to change network topology (connect generators in DEVA 1 to the second busbars or to connect two busbar systems in Mintia substation). Loss of 400/220 kV transformer in the Mintia B substation can jeopardize system security due to possible overloading of two 220 kV lines in Romania. Loss of one 400 kV line in Romania (Mintia-Arad) is critical because the 400 kV line Mintia-Sibiu can be overloaded. Single outages of 400/110 kV transformers in the stations Brasov

4.9
and Dirste in Romania are also found critical, since the second transformer 400/110 kV in the Brasov substation is permanently out of operation in the model. Loss of OHL 220 kV in the Belgrade area can cause overloading of the parallel line. Loss of one 400/110 kV transformer in the Nis substation is critical due to possible overloading of the other parallel one. Loss of 220 kV line between the Rashbul and Tirana substations can cause overloading of 220 kV line between the Elbasan and Fier substations in Albania. The heaviest line overloading (147% Ithermal) in the analyzed scenario is related to a 220 kV line in Romania around the Mintia substation. The heaviest transformer overloading (137% Sn) is related to the transformer 400/110 kV in the Dirste substation (Romania) when the transformer 400/110 kV in the Brasov substation is outaged (the parallel one is permanently out of operation in the model). Figure 4.1.6 shows geographical positions of critical elements in the analyzed scenario. A green color reveals 220 kV elements (line 220 kV or transformer 220/x kV), while a red one reveals 400 kV elements (line 400 kV or transformer 400/x kV). According to the obtained and presented results, it may be concluded that a re-dispatching of generation in the Romanian power system, especially of the DEVA 1 power plant (to decrease its generation level from the initially assumed 850 MW in this scenario), as well as certain reinforcements in the internal networks of Romania, Albania and Serbia are necessary shall this generation/load pattern be made more secure. Re-dispatching of Romanian power plants may be avoided if network topology is changed, especially in Mintia substation. None of the identified congestions is located at the border lines.
Table 4.1.5 - Lines overloadings for 2010–base case-average hydrology scenario, single outages Loadings Outage Overloaded line(s) MVA % Country
OHL 220 kV AKASHA2-ARRAZH2 OHL 220 kV AELBS12-AFIER 2 253.1 113.2 ALBANIA OHL 400 kV MINTIA-ARAD OHL 400 kV MINTIA-SIBIU 408.2 106.5 TR 400/220 kV MINTIA B OHL 220 kV PESTIS-MINTIA A 431.1 147.3 TR 400/220 kV MINTIA B OHL 220 kV PESTIS-MINTIA B 351.4 119.3
ROMANIA
OHL 220 kV JBGD172-JBGD8 22 ckt.1 OHL 220 kV JBGD172-JBGD8 22 ckt.2 434.8 122.2 SERBIA
Table 4.1.6 - Transformers overloadings for 2010–base case-average hydrology scenario, single outages Loadings Outage Overloaded branch(es) MVA % Country
OHL 400 kV TANTAREN-SIBIU TR 400/220 kV MINTIA B 412.1 103.0 OHL 220 kV HAJD OT-MINTIA B TR 400/220 kV MINTIA B 404.4 101.1 OHL 220 kV PESTIS-MINTIA A TR 400/220 kV MINTIA B 511.2 127.8 OHL 220 kV MINTIA A-TIMIS TR 400/220 kV MINTIA B 412.3 103.1 OHL 220 kV MINTIA B-AL.JL TR 400/220 kV MINTIA B 474.8 118.7 OHL 220 kV CLUJ FL-AL.JL TR 400/220 kV MINTIA B 496.0 124.0 TR 400/220 kV MINTIA A TR 400/220 kV MINTIA B 530.8 132.7 TR 400/220 kV MINTIA B TR 400/220 kV MINTIA A 459.5 114.9 TR 400/220 kV ARAD TR 400/220 kV MINTIA B 401.2 100.3 TR 400/220 kV BUC.S ckt.1 TR 400/220 kV BUC.S ckt.2 410.2 102.5 400/110 kV BRASOV 400/110 kV DIRSTE 341.3 136.5 400/110 kV DIRSTE 400/110 kV BRASOV 337.5 135.0
ROMANIA
400/110 kV NIS ckt.1 400/110 kV NIS ckt.2 312.3 104.1 SERBIA

4.10
AUT
ALB
BIH
BUL
CRO
GRE
HUN
MKD
MNG
ROM
SRB
SVK
SLO
TUR
400 kV line or 400/x kV transformer220 kV line or 220/x kV transformer
critical elements
Figure 4.1.6 - Geographical positions of the critical elements for 2010-base case-average hydrology scenario
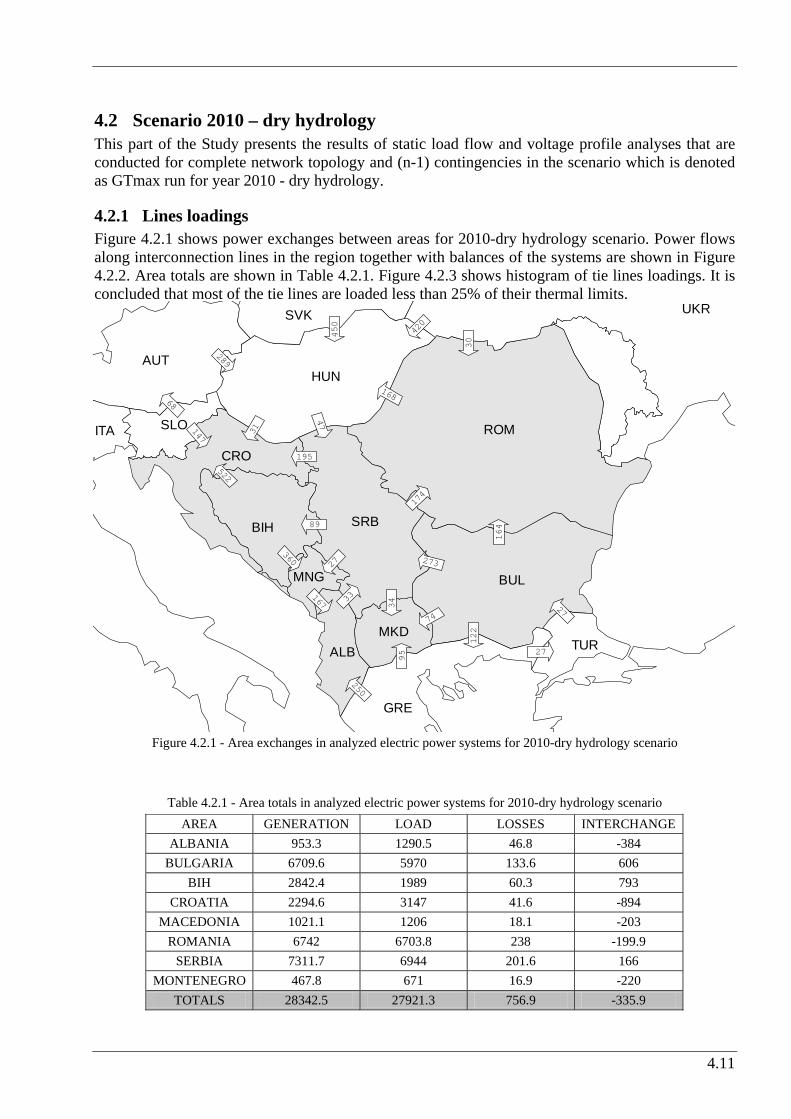
4.11
4.2 Scenario 2010 – dry hydrology This part of the Study presents the results of static load flow and voltage profile analyses that are conducted for complete network topology and (n-1) contingencies in the scenario which is denoted as GTmax run for year 2010 - dry hydrology.
4.2.1 Lines loadings Figure 4.2.1 shows power exchanges between areas for 2010-dry hydrology scenario. Power flows along interconnection lines in the region together with balances of the systems are shown in Figure 4.2.2. Area totals are shown in Table 4.2.1. Figure 4.2.3 shows histogram of tie lines loadings. It is concluded that most of the tie lines are loaded less than 25% of their thermal limits.
AUT
ALB
BIH
BUL
CRO
GRE
ITA
HUN
MKD
MNG
ROM
SRB
SVK
SLO
TUR
UKR
360
89
195
147
68
31
47
168
27
167 33
250
74
273
95
34
164
122
174
30
450
289
420
27
27
522
Figure 4.2.1 - Area exchanges in analyzed electric power systems for 2010-dry hydrology scenario
Table 4.2.1 - Area totals in analyzed electric power systems for 2010-dry hydrology scenario AREA GENERATION LOAD LOSSES INTERCHANGE
ALBANIA 953.3 1290.5 46.8 -384 BULGARIA 6709.6 5970 133.6 606
BIH 2842.4 1989 60.3 793 CROATIA 2294.6 3147 41.6 -894
MACEDONIA 1021.1 1206 18.1 -203 ROMANIA 6742 6703.8 238 -199.9
SERBIA 7311.7 6944 201.6 166 MONTENEGRO 467.8 671 16.9 -220
TOTALS 28342.5 27921.3 756.9 -335.9

4.12
Figure 4.2.2 - Power flows along interconnection lines in the region with balances of the systems for 2015-dry hydrology scenario – 2010 topology
PEHLIN 229.2
MELINA 402.1
TUMBRI 401.0
MEDURIC 219.6MRACLIN 222.3
DAKOVO 222.5
KONJSKO
402.2
HE ZAKUC
231.4
ZERJAVIN 403.4
ZERJAVIN 226.9
AZEMLA1
381.4
AKASHA1 358.9
AVDEJA2210.7AFIERZ2208.0
OWIEN 1
405.4
OWIEN 2
234.2
MGYOR 4
403.3
MGYOR 2
228.9
ONEUSI2
233.5
OKAINA1401.5
LMARIB1402.4
OOBERS2238.7
IRDPV111
400.9
LDIVAC1
400.9
IPDRV121
230.3
LDIVAC2
229.3
LKRSKO1 401.0
PRIJED2 220.1
GRADACAC 225.5
TE TUZL 231.7
JSMIT21
400.9
VISEGRA231.4
JVARDI22229.6
SA 20230.5
JHPIVA21236.0
RP TREB396.9
JHPERU21
221.1
JPODG211
384.0
MO-4
404.6
MHEVI 4 408.3
RP TREB
228.9
JPODG121219.0
JPRIZ22214.1 JTKOSA2227.0JTKOSB1412.4
407.5
BITOLA 2 414.2
AHS_FLWR416.1
DUBROVO 410.7
QES/H K 412.2
BLAGOEV413.3
STIP 1
410.5
C_MOGILA
412.8
JNIS2 1396.5
SOFIA_W4411.0
KARDIA K414.9
GABICK1400.0
MGOD 4 407.6
LEVIC 1400.0
MSAJO 4410.0
UMUKACH
412.0
ROSIORI 402.1
MKISV 2226.3
UMUKACH2
224.4
MTLOK 2
230.5
MSAFA 4 402.4
JSUBO31 396.0
ARAD
401.5
TANTAREN 413.7
AEC_400 414.7
JHDJE11
405.9
LPODLO2228.9
FILIPPOI
415.5
SK 1 222.9
LCIRKO2 227.1
P.D.FIE
406.0
UGLJEVIK 400.9
ISACCEA 405.4
DOBRUD4 417.1
JSOMB31393.4
MPECS 4 408.2
UZUKRA01772.5
MAISA 7714.8
NADAB402.2
MBEKO 4404.6
SK 4 407.7
JLESK210.000
ERNESTIN
404.5
MO-4
232.4
MI_3_4_1 419.3
JVRAN310.000
LAGAD K 413.3
KARACQOU418.1KARACQOU418.1
K-KEXRU417.84BABAESK415.5
4HAMITAX
415.4
MSAJI 4408.1
AVDEJA1 373.2
364257
357271
205
165
81.9
28.57
2.8
50.8
52.75.8
10624.2
153
81.4
54.0
24.0
53.916.2
212
121
214
9.837.3
54.0
13829.5
13926.3
10343.5
10245.0
148147
147181
37.251.9
73.7
47.1
82.8
25.1
18.6
27.5
18.7
17.0
18.6
27.5
18.7
17.0
345
48.8
18.1
72.1
5.0
48.0
5.0
14.0
69.571.5
69.572.5
76.1
35.8
76.1
14.0
76.1
35.8
228145
23092.4
35.520.9
35.627.7
39.071.8
39.147.0
37.170.5
38.016.6
38.043.0
30.7
165
30.5
141
36.8
131
31924.0
34.9
34.3
4.9
1.1
60.2
22.7 112
46.0
20885.1
156
26.9
156
26.9
35.4
21.9
35.4
21.9
97.730.7
10.72.6154
45.7
156
49.2
199
94.6
200
140
251
113
250
90.4
18.1
49.7
54.0
24.0
10.629.2
10.87.6
18024.1
1803.3
11.477.1
11.473.6
39.5
41.8
39.5
10.5
39.5
10.5
39.5
41.8
346804
350297
64.752.7
64.871.6
76.1
14.0
47.9
59.8
48.0
34.0
35.3
45.4
23.012.7
22.926.6
52.220.7
105101
153
29.5
20740.3
71.8
85.8
71.8
85.8
71.7
37.8 71.7
37.8
12718.2
34.7
26.6
4.9
6.8 59.9
27.1
110
47.0
1562.0
1562.0
6.5
4.2
6.55.7
35.3
85.2 3
5.3
85.29
7.8
7.2
10.7
7.6
31716.4
13019.2
179
45.5
35.4
49.4
178
77.2
19.821.7
8.516.9
179
45.5
11.313.8
8.5
63.7
11.3
89.1
19.870.7
25050.0
8.563.7
8.575.0
347
20.0
204
180
204
180
202
204
ROM
BUL
HUN
UKRUCTE
CENTREL
CRO
BIH
SCG
ALB
GRE
MKD
TUR
SLO
CRGSRB
756.2 MW
-107.7 MW864.0 MW
-444.0 MW
766.0 MW
-720.0 MW
758.8 MW
223.5 MW
-1086.4 MW
-1250.0 MW
0.2 MW
450.0 MW
-369.2 MW
215.0 MW
0.0 MW
450.0 MW
SHAW POWERTECHNOLOGIESINC.R KV: 110 , 220 , 400
BUS -VOLTAGE(KV)
EQUIPMENT -MW/MVARBRANCH -MW/MVAR
GIS REGIONAL MODEL - DRY HYDRO2010 TOPOLOGY 2010

4.13
Histogram
0
5
10
15
20
25
30
35
40
45
50
25 50 75 100 More
Bin
Fr
eq
ue
nc
y
Figure 4.2.3 - Histogram of interconnection lines loadings for 2010-dry hydrology scenario ("Frequency" denotes
number of lines and "Bin" denotes loading range in % of thermal limit) Following Table 4.2.2 shows all network elements loaded over 80% of their thermal limits. As it can be seen only transformers 220/110 kV in substation Fier in Albania are highly loaded. Also, transformer 220/110 kV in substation Fundeni in Romania is loaded over 80 % of its thermal limit. Figure 4.2.4 shows histogram of branch loadings in the system. As for the conclusion regarding thermal loadings in this scenario it can be said that almost all of the network elements are loaded less then 75% of their thermal limits, but there are some elements highly loaded. The elements loaded over 80% are transformers 220/110 kV in substation Fier and transformer 220/110 kV in substation Fundeni in Romania, so some internal network reinforcements are necessary to sustain this load-demand level and production pattern. It is expected that transformers in Fierza substation will be replaced with more powerful transformer units.
Table 4.2.2 - Network elements loaded over 80% of their thermal limits for 2010-dry hydrology scenario BRANCH LOADINGS ABOVE 80.0 % OF RATING:
AREA ELEMENT LOADINGMVA
RATINGMVA PERCENT
Transformers TR 220/110 kV AFIER 1 106.8 120 89 TR 220/110 kV AFIER 2 87.5 90 97.2 ALB TR 220/110 kV AFIER 3 83.5 90 92.8
ROM TR 220/110 kV FUNDE2 1 168.1 200 84.1
Histogram
0
50
100
150
200
250
300
350
400
x<25 25<x<50 50<x<75 75<x<100 x>100
Bin
Fr
eq
ue
nc
y
Figure 4.2.4 - Histogram of branch loadings for 2010-dry hydrology scenario ("Frequency" denotes number of branches
and "Bin" denotes loading range in % of thermal limit)

4.14
4.2.2 Voltage Profile in the Region Figure 4.2.5 shows histogram of voltages in monitored substations. Voltages in almost all monitored substations are found within permitted limits.
Histogram
0
20
40
60
80
100
120
140
x<0.9
0.9<x<0.95
0.95<x<0.975
0.975<x<1
1<x<1.025
1.025<x<1.05
1.05<x<1.1
x>1.1
Bin
Fr
eq
ue
nc
y
Figure 4.2.5 - Histogram of voltages in monitored substations for 2010-dry hydrology scenario ("Frequency" denotes
number of busses and "Bin" denotes voltage range in p.u.) In the rest of the monitored network the voltage profile is satisfying and that most of the substations have magnitudes in range 0.975-1.05 p.u.
4.2.3 Security (n-1) analysis Results of security (n-1) analysis for 2010-dry hydrology scenario are presented in Table 4.2.3. Figure 4.2.6 shows the geographical position of the critical elements in monitored systems. It can be concluded that all identified insecure states are located in internal networks that belong to monitored power systems of Romania and Serbia. In the most critical cases in Romanian system, the critical elements are transformers 400/110 kV in substations Dirste and Brasov. The most critical elements in Serbian system are lines 220 kV Beograd 8 – Beograd 17 and Obrenovac – Beograd 3. Some of the overloadings identified can be relieved by certain dispatch actions (splitting busbars, changing lower voltage network topology in order to redistribute load-demand or change of generation units engagement), like in the case of most severe overloading in Romanian network happens on transformer 400/110 kV Dirste when transformer 400/110 kV in Brasov is outaged, but this is a consequence of the fact that second transformer unit 400/110 kV in Brasov is out of

4.15
operation. Switching on of this transformer clears this critical outage. The similar situation is with outage of the 400 kV line Obrenovac-Beograd 3 in Serbia. Splitting off the 220 kV busbars in substation Beograd 3 relieves this overloading, but voltage profile in Serbian network remains critical, so additional dispatching actions are necessary too. All in all, certain reinforcement of internal network is necessary (more about this in chapter 6) in order to make this regime more secure. None of the identified congestions is located at border lines.
Table 4.2.3 - Network overloadings for 2010-dry hydrology scenario, single outages
Area contingency Area
overloadings /
out of limits voltages #
limit /
Unom
Flow /
Voltage
rate /
volt.dev.1 2 3 4 5 6 7 8
CS OHL 220kV JBGD172 -JBGD8 22 1 CS HL 220kV JBGD172-JBGD8 22 2 365.8MVA 440.8MVA 123.1%CS OHL 400kV JBGD8 1 -JOBREN11 1 CS HL 220kV JBGD3 21-JOBREN2 1 301MVA 340.1MVA 115.4%RO TR 400/110 BRASOV 1 RO TR 400/110kV/kV DIRSTE 1 250MVA 333.3MVA 133.3%RO TR 400/110 DIRSTE 1 RO TR 400/110kV/kV BRASOV 1 250MVA 329.9MVA 132.0%CS TR 400/110 JNIS2 1 CS TR 400/110kV/kV JNIS2 1 2 300MVA 338.2MVA 112.7%RO TR 400/220 BUC.S 1 RO TR 400/220kV/kV BUC.S 2 400MVA 403.8MVA 101.0%
RO TR 400/220kV/kV MINTIA 1 400MVA 419.5MVA 104.9%RO TR 400/220 MINTIA 1 RO HL 220kV PESTIS-MINTIA A 1 277.4MVA 313.9MVA 105.5%
RO TR 400/220 MINTIA 1 RO TR 400/220kV/kV MINTIA 1 400MVA 433MVA 108.3%
AUT
ALB
BIH
BUL
CRO
GRE
HUN
MKD
MNG
ROM
SRB
SVK
SLO
TUR
400 kV line or 400/x kV transformer220 kV line or 220/x kV transformer
critical elements
Figure 4.2.6 – Geographical position of critical elements for 2010-dry hydrology scenario

4.16
4.3 Scenario 2010 – wet hydrology This part of the Study presents results of static load flow and voltage profile analyses that are conducted for complete network topology and (n-1) contingencies in the scenario which is denoted as Scenario 2010 – wet hydrology.
4.3.1 Line loadings Area totals and power exchanges for the 2010-base case-wet hydrology scenario are shown in Figure 4.3.1 and Table 4.3.1. Power flows along regional interconnection lines and system balances are shown in Figure 4.3.2. Power flows along interconnection lines are also given in Table 4.3.2, while Figure 4.3.3 shows histogram of tie lines loadings.
AUT
ALB
BIH
BUL
CRO
GRE
ITA
HUN
MKD
MNT
ROM
SRB
SVK
SLO
TUR
UKR
129
357
356
286
71
30 6
35
372
251
214
414
151
414
99
118
12
247
175
97
450
151
547
1 6
2 50
50 5
0 1 6
Figure 4.3.1 - Area exchanges in analyzed electric power systems for 2010-base case-wet hydrology scenario
Table 4.3.1 - Area totals in analyzed electric power systems for 2010-base case-wet hydrology scenario
Country Generation (MW)
Load (MW)
Bus Shunt (Mvar)
Line Shunt (Mvar)
Losses (MW)
Net Interchange (MW)
Albania 898.6 1287.3 0 0 50.3 -439.0 Bulgaria 6940.4 5966.2 0 14.3 120.9 839.0 Bosnia and Herzegovina 2037.1 1961.1 0 0 57.0 19.0 Croatia 1735.4 3136.7 0 0 50.7 -1452.0 Macedonia 1081.8 1194.0 0 0 19.8 -132.0 Romania 7342.4 6423.7 0 79.9 206.6 632.2 Serbia and UNMIK 7406.2 6875.1 0 13.6 220.4 297.1 Montenegro 586.3 669.2 0.6 1.6 15.9 -101.0 TOTAL - SE EUROPE 28028.1 27513.3 0.6 109.4 741.5 -336.7

4.17
Figure 4.3.2 - Power flows along interconnection lines in the region for 2010 - base case - wet hydrology scenario
PEHLIN 233.8
MELINA 407.4
TUMBRI 404.2
MEDURIC 226.3MRACLIN 226.9
DAKOVO 224.3
KONJSKO
410.6
HE ZAKUC
236.9
ZERJAVIN 406.6
ZERJAVIN 230.2
AZEMLA1
398.3
AKASHA1 386.2
AVDEJA2227.5AFIERZ2228.6
OWIEN 1
405.6
OWIEN 2
234.3
MGYOR 4
403.5
MGYOR 2
229.0
ONEUSI2
233.5
OKAINA1402.6
LMARIB1403.9
OOBERS2238.7
IRDPV111
401.5
LDIVAC1
403.1
IPDRV121
231.4
LDIVAC2
230.8
LKRSKO1 403.2
PRIJED2 225.5
GRADACAC 226.6
TE TUZL 231.3
JSMIT21
402.4
VISEGRA231.7
JVARDI22230.0
SA 20231.3
JHPIVA21235.8
RP TREB404.6
JHPERU21
229.9
JPODG211
397.6
MO-4
409.2
MHEVI 4 409.5
RP TREB
233.3
JPODG121228.8
JPRIZ22223.3 JTKOSA2227.3JTKOSB1407.4
408.1
BITOLA 2 416.6
AHS_FLWR417.8
DUBROVO 412.8
QES/H K 413.3
BLAGOEV414.8
STIP 1
412.9
C_MOGILA
414.2
JNIS2 1396.4
SOFIA_W4412.3
KARDIA K416.9
GABICK1400.0
MGOD 4 407.9
LEVIC 1400.0
MSAJO 4410.0
UMUKACH
412.0
ROSIORI 410.7
MKISV 2226.3
UMUKACH2
224.4
MTLOK 2
230.5
MSAFA 4 404.5
JSUBO31 398.7
ARAD
403.9
TANTAREN 415.7
AEC_400 416.1
JHDJE11
404.9
LPODLO2229.9
FILIPPOI
415.7
SK 1 224.2
LCIRKO2 228.8
P.D.FIE
405.0
UGLJEVIK 403.7
ISACCEA 415.7
DOBRUD4 421.8
JSOMB31396.5
MPECS 4 409.4
UZUKRA01772.5
MAISA 7715.3
NADAB405.5
MBEKO 4407.0
SK 4 409.0
JLESK21387.6
ERNESTIN
407.0
MO-4
235.2
MI_3_4_1 420.6
JVRAN310.000
LAGAD K 414.2
KARACQOU419.1KARACQOU419.1
K-KEXRU417.94BABAESK415.7
4HAMITAX
415.6
MSAJI 4408.2
AVDEJA1 395.7
418111
412134
23.8
22.4
4.0
35.12
.9
15.6
46.46.9
87.222.9
127
76.7
277
58.9
27630.1
172
97.1
173
47.0
80.460.4
16916.2
17118.1
35.318.0
35.225.9
19.978.3
20.0122
80.159.3
2.9
6.1
4.2
43.8
28.5
29.7
28.3
19.6
28.5
29.7
28.3
19.6
60.8
21.7
39.5
45.9 5
9.4
31.2
59.4
30.5
17537.1
17538.0
80.3
40.5
80.2
9.6
80.3
40.5
411128
415105
35.521.0
35.627.8
17356.4
17453.0
97.16.6
1556.9
15548.5
35.2
151
35.1
126
97.3
56.0
22361.5
59.9
31.8
57.6
21.3
49.6
15.5 92.6
32.0
357104
179
53.2
179
53.2
93.6
40.7
93.6
40.7
10090.4
40.328.2
162
36.5
164
41.0
199
98.7
200
144
251
117
250
94.8
39.5
23.2
277
58.9
10.629.3
10.87.7
16942.5
16863.5
30.449.0
30.445.4
53.3
52.8
53.2
21.6
53.2
21.6
53.3
52.8
346802
350300
21749.0
21763.5
80.2
9.6
150
40.6
151
48.6
17.8
47.0
17.813.9
17.627.9
46.022.3
87.1103
126
22.2
35575.5
59.3
55.0
59.3
55.0
59.3
5.7
59.3
5.7
55.513.7
59.4
24.6
57.2
14.8 49.4
20.5
91.5
36.0
179
28.8
179
28.8
44.1
24.2
43.815.4
93.3
65.4 9
3.3
65.41
00
67.1
40.4
18.7
2227.0
56.025.6
230
38.5
17.7
48.7
229
78.1
15.921.8
7.511.0
230
38.5
8.46.1
7.5
69.8 8.397.1
15.970.9
2500.0
7.569.8
7.581.2
60.7
28.3
23.7
50.4
24.5
129
24.1
168
ROM
BUL
HUN
UKRUCTE
CENTREL
CRO
BIH
SCG
ALB
GRE
MKD
TUR
SLO
CRGSRB
196.1 MW
-101.0 MW297.1 MW
-132.0 MW
839.0 MW
-439.0 MW
19.0 MW
221.7 MW
-1452.0 MW
-1249.7 MW
-0.1 MW
450.0 MW
631.9 MW
215.0 MW
0.0 MW
450.0 MW
SHAW POWERTECHNOLOGIESINC.R KV: 110 , 220 , 400
BUS -VOLTAGE(KV)
EQUIPMENT -MW/MVARBRANCH -MW/MVAR
GIS REGIONAL MODEL - WET HYDRO2010 TOPOLOGY 2010
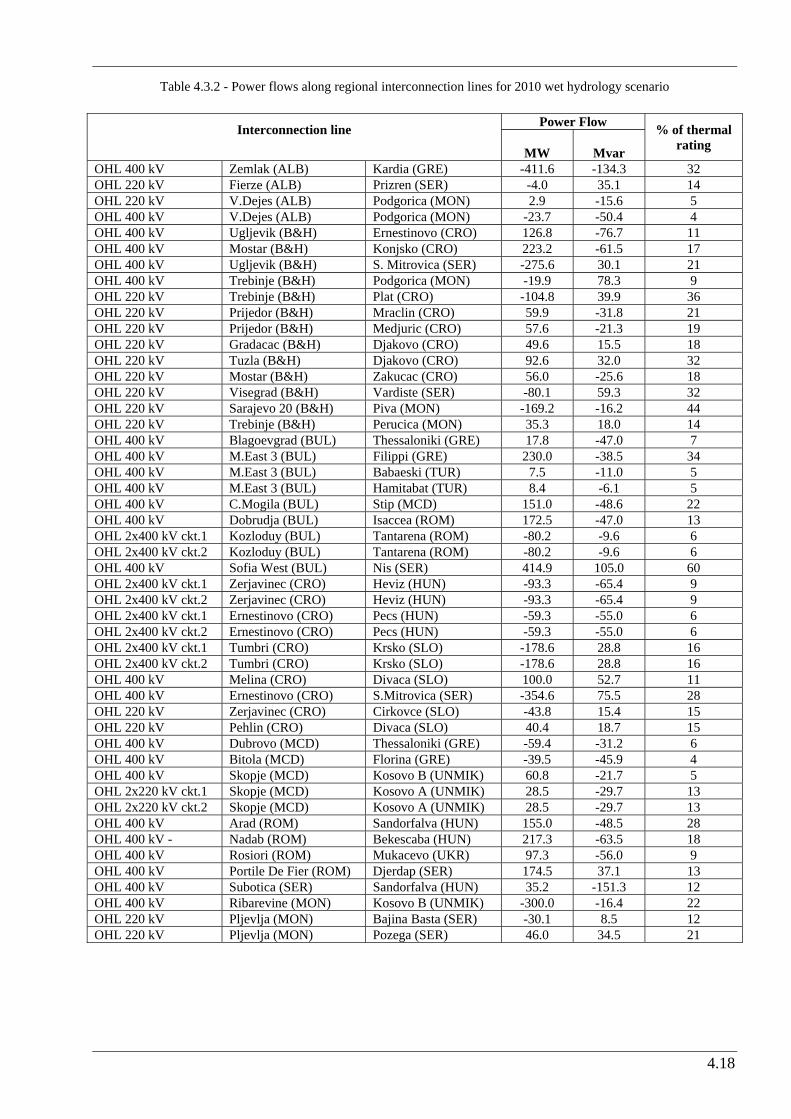
4.18
Table 4.3.2 - Power flows along regional interconnection lines for 2010 wet hydrology scenario
Power Flow Interconnection line MW
Mvar
% of thermal rating
OHL 400 kV Zemlak (ALB) Kardia (GRE) -411.6 -134.3 32 OHL 220 kV Fierze (ALB) Prizren (SER) -4.0 35.1 14 OHL 220 kV V.Dejes (ALB) Podgorica (MON) 2.9 -15.6 5 OHL 400 kV V.Dejes (ALB) Podgorica (MON) -23.7 -50.4 4 OHL 400 kV Ugljevik (B&H) Ernestinovo (CRO) 126.8 -76.7 11 OHL 400 kV Mostar (B&H) Konjsko (CRO) 223.2 -61.5 17 OHL 400 kV Ugljevik (B&H) S. Mitrovica (SER) -275.6 30.1 21 OHL 400 kV Trebinje (B&H) Podgorica (MON) -19.9 78.3 9 OHL 220 kV Trebinje (B&H) Plat (CRO) -104.8 39.9 36 OHL 220 kV Prijedor (B&H) Mraclin (CRO) 59.9 -31.8 21 OHL 220 kV Prijedor (B&H) Medjuric (CRO) 57.6 -21.3 19 OHL 220 kV Gradacac (B&H) Djakovo (CRO) 49.6 15.5 18 OHL 220 kV Tuzla (B&H) Djakovo (CRO) 92.6 32.0 32 OHL 220 kV Mostar (B&H) Zakucac (CRO) 56.0 -25.6 18 OHL 220 kV Visegrad (B&H) Vardiste (SER) -80.1 59.3 32 OHL 220 kV Sarajevo 20 (B&H) Piva (MON) -169.2 -16.2 44 OHL 220 kV Trebinje (B&H) Perucica (MON) 35.3 18.0 14 OHL 400 kV Blagoevgrad (BUL) Thessaloniki (GRE) 17.8 -47.0 7 OHL 400 kV M.East 3 (BUL) Filippi (GRE) 230.0 -38.5 34 OHL 400 kV M.East 3 (BUL) Babaeski (TUR) 7.5 -11.0 5 OHL 400 kV M.East 3 (BUL) Hamitabat (TUR) 8.4 -6.1 5 OHL 400 kV C.Mogila (BUL) Stip (MCD) 151.0 -48.6 22 OHL 400 kV Dobrudja (BUL) Isaccea (ROM) 172.5 -47.0 13 OHL 2x400 kV ckt.1 Kozloduy (BUL) Tantarena (ROM) -80.2 -9.6 6 OHL 2x400 kV ckt.2 Kozloduy (BUL) Tantarena (ROM) -80.2 -9.6 6 OHL 400 kV Sofia West (BUL) Nis (SER) 414.9 105.0 60 OHL 2x400 kV ckt.1 Zerjavinec (CRO) Heviz (HUN) -93.3 -65.4 9 OHL 2x400 kV ckt.2 Zerjavinec (CRO) Heviz (HUN) -93.3 -65.4 9 OHL 2x400 kV ckt.1 Ernestinovo (CRO) Pecs (HUN) -59.3 -55.0 6 OHL 2x400 kV ckt.2 Ernestinovo (CRO) Pecs (HUN) -59.3 -55.0 6 OHL 2x400 kV ckt.1 Tumbri (CRO) Krsko (SLO) -178.6 28.8 16 OHL 2x400 kV ckt.2 Tumbri (CRO) Krsko (SLO) -178.6 28.8 16 OHL 400 kV Melina (CRO) Divaca (SLO) 100.0 52.7 11 OHL 400 kV Ernestinovo (CRO) S.Mitrovica (SER) -354.6 75.5 28 OHL 220 kV Zerjavinec (CRO) Cirkovce (SLO) -43.8 15.4 15 OHL 220 kV Pehlin (CRO) Divaca (SLO) 40.4 18.7 15 OHL 400 kV Dubrovo (MCD) Thessaloniki (GRE) -59.4 -31.2 6 OHL 400 kV Bitola (MCD) Florina (GRE) -39.5 -45.9 4 OHL 400 kV Skopje (MCD) Kosovo B (UNMIK) 60.8 -21.7 5 OHL 2x220 kV ckt.1 Skopje (MCD) Kosovo A (UNMIK) 28.5 -29.7 13 OHL 2x220 kV ckt.2 Skopje (MCD) Kosovo A (UNMIK) 28.5 -29.7 13 OHL 400 kV Arad (ROM) Sandorfalva (HUN) 155.0 -48.5 28 OHL 400 kV - Nadab (ROM) Bekescaba (HUN) 217.3 -63.5 18 OHL 400 kV Rosiori (ROM) Mukacevo (UKR) 97.3 -56.0 9 OHL 400 kV Portile De Fier (ROM) Djerdap (SER) 174.5 37.1 13 OHL 400 kV Subotica (SER) Sandorfalva (HUN) 35.2 -151.3 12 OHL 400 kV Ribarevine (MON) Kosovo B (UNMIK) -300.0 -16.4 22 OHL 220 kV Pljevlja (MON) Bajina Basta (SER) -30.1 8.5 12 OHL 220 kV Pljevlja (MON) Pozega (SER) 46.0 34.5 21

4.19
Figure 4.3.3 shows that the tie lines in the region are mostly loaded less than 25% of their thermal limits for the analyzed hydrological base case scenario in year 2010. Among total number of forty nine 400 kV and 220 kV interconnection lines in the region only eight are loaded between 25% and 50% of their thermal ratings. Only one line (OHL 400 kV Sofia – Nis between Bulgaria and Serbia) is loaded more than 50% of its thermal rating, which is set at lower value (692.8 MVA) on the Bulgarian side compared to the line rating on the Serbian side (1330.2 MVA).
05
101520
253035
4045
x<25 25<x<50 50<x<75 75<x<100 x>100
Bin
Freq
uenc
y
Figure 4.3.3 - Histogram of interconnection lines loadings for 2010-base case-wet hydrology scenario ("Frequency" denotes number of lines and "Bin" denotes loading range in % of thermal limit)
Table 4.3.3 lists all network elements loaded over 80% of their thermal limits. As it can be seen from this output list, most of the elements loaded over 80% are transformers in some substations and internal 110 kV and 220 kV lines. Thus, certain internal network reinforcements are necessary to sustain given load-demand level and production pattern. Two 220/110 kV transformers in the Fierze substation in Albania are slightly overloaded in this scenario, while the third transformer in the same substation is loaded near permitted values. There are three 220 kV and two 110 kV internal lines in Romania which are loaded over 80% of their thermal limits, but none of them is overloaded. These lines are related to the Lotru, Sibiu, Parosen, Bojuren and Domnesti nodes. Transformer 220/110 kV in the Fundeni substation is highly loaded in this scenario. Two 220 kV lines and twelve 110 kV lines in the Serbian power system are highly loaded when all branches are available in the analyzed scenario. Highly loaded 220 kV lines are connected to the Obrenovac substation, while 110 kV lines are located mostly in the area of Belgrade. Four 110 kV lines are overloaded, ranging between 108% Ithermal and 117% Ithermal. Power systems of Bulgaria, Bosnia and Herzegovina and Croatia have several highly loaded branches in 110 kV networks. High loading of 110 kV line Komolac-Plat is caused by radial connection of one unit in the HPP Dubrovnik to the grid. High loading of 110 kV lines between the Resnik, Zitnjak and TETO substations in the Zagreb area are caused by disconnection of generating units in the TETO power plant in analyzed scenario. These combined heat and electricity generating units are normally put into the operation during winter high load period, because their main purpose is to produce heat for consumers in the Croatian capitol Zagreb.

4.20
Figure 4.3.4 shows histogram of 400 kV and 220 kV regional internal lines and 400/x kV and 220/x kV transformers loadings. 46% of observed branches are loaded below 25% of their thermal ratings, 35% are loaded between 25% and 50%, 16% are loaded between 50% and 75% and only 2% of observed branches are loaded between 75% and 100% of their thermal ratings. Two branches (transformers 220/110 kV Fierze in Albania, 101% - 106% Sn) are overloaded if all branches are in operation for the analyzed scenario.
Table 4.3.3 - Network elements loaded over 80% of thermal limits for 2010-base case-wet hydrology scenario
AREA ELEMENT LOADINGMVA
RATINGMVA PERCENT
Lines OHL 220 kV LOTRU-SIBIU ckt.1 276.0 277.4 99.5 OHL 220 kV LOTRU-SIBIU ckt.2 276.0 277.4 99.5 ROM OHL 220 kV TG.JIU-PAROSEN 181.6 208.1 87.3
Transformers TR 220/110 kV AFIER 2-AFIER 5 ckt.1 116.5 120.0 97.1 TR 220/110 kV AFIER 2-AFIER 5 ckt.2 95.5 90.0 106.1 ALB TR 220/110 kV AFIER 2-AFIER 5 ckt.3 91.1 90.0 101.3
ROM TR 220/110 kV FUNDENI-FUNDE2B 168.7 200.0 84.4
0
50
100
150
200
250
300
350
400
x<25 25<x<50 50<x<75 75<x<100 x>100
Bin
Freq
uenc
y
Figure 4.3.4 - Histogram of 400 kV and 220 kV regional lines loadings for 2010-base case-wet hydrology scenario
("Frequency" denotes number of lines and "Bin" denotes loading range in % of thermal limit)
4.3.2 Voltage Profile in the Region Voltage profile in the region within this scenario which is defined by given generation and demand pattern is seen as satisfactory despite several appearances of certain bus voltage deviations which are shown in Table 4.3.4. Presented table includes only 400 kV and 220 kV network buses. Bus voltage magnitudes below permitted limits are not found in the analyzed scenario. Bus voltage magnitudes that are found above permitted limits (110% Vnominal in 110 kV and 220 kV networks and 105% Vnominal in 400 kV network) are detected only in Bulgaria. There are nine 400 kV buses and four 220 kV buses with voltages slightly above permitted limits. Figure 4.2.5 shows histogram of voltages in monitored 400 kV and 220 kV substations.

4.21
Table 4.3.4 - Bus voltage deviations for 2010-base case-wet hydrology scenario, complete network
Voltages Country Node pu kV ALBANIA - - - BOSNIA AND HERZEGOVINA - - -
400 kV VARNA4 1.057 421.9 400 kV BURGAS 1.052 420.8 400 kV MARITSA EAST2 1.056 422.2 400 kV TECMIG5 1.052 420.6 400 kV TECMIG7 1.051 420.6 400 kV DOBRUD4 1.055 421.8 400 kV MARITSA EAST 3_4_1 1.051 420.6 400 kV MARITSA EAST 1.051 420.6 400 kV TECMIG6 1.052 420.6 220 kV BPC_220 1.103 242.6 220 kV MIZIA2 1.101 242.3 220 kV AEC_220 1.103 242.7
BULGARIA
220 kV TECVARNA 1.104 243.0 CROATIA - - - MACEDONIA - - - MONTENEGRO - - - ROMANIA - - - SERBIA AND UNMIK - - -
0
20
40
60
80
100
120
x<0.
9
0.9<
x<0.
95
0.95
<x<0
.975
0.97
5<x<
1
1<x<
1.02
5
1.02
5<x<
1.05
1.05
<x<1
.1
x>1.
1
Bin
Freq
uenc
y
Figure 4.3.5 - Histogram of voltages in monitored substations for 2010-base case-wet hydrology scenario ("Frequency"
denotes number of busses and "Bin" denotes voltage range in p.u.)
4.3.3 Security (n-1) analysis Results of security (n-1) analysis for the 2010-base case-wet hydrology scenario are presented in Table 4.3.5 and Table 4.3.6. Insecure states for given generation and demand pattern are detected in the power systems of Romania and Serbia, although there is one contingency in Albania which leads to insecure state. The most critical branches in the analyzed load/generation scenario are those ones connected to the Sibiu substation 400/220 kV in Romania. Double circuit line 220 kV Lotru-Sibiu is loaded near

4.22
upper limit (99% Ithermal) when all branches are available. It becomes overloaded if one circuit goes out of operation. Line 400 kV Mintia-Sibiu is overloaded when 400 kV line Sibiu-Iernut goes out of operation. Transformer 400/220 kV in Sibiu is overloaded if the parallel one is unavailable. Reasons for these overloadings are found in a rather high level of hydro generation in the LOTRU CIUNGET power station in this scenario (478 MW). More secure operation could be achieved by decreasing a generation level in this hydro power plant. Double circuit 220 kV lines around the Resita substation (Portile de Fier-Resita and Timisoara-Resita) are overloaded if one circuit goes out of operation, due to high generation in the PORTILE 1 hydro power plant (796 MW). Secure operation could be achieved by decreasing a generation level in this power plant. OHL 220 kV Targa Jiu-Paroseni is overloaded if one of the 400 kV lines Mintia-Sibiu, Tantareni-Sibiu in Romania or Djerdap-Kostolac B in Serbia goes out of operation. Higher engagement of the TPP Paroseni resolves these overloads. Single outages of 400/110 kV transformers in the stations Brasov and Dirste in Romania are also recognized as critical, since the second transformer 400/110 kV in the Brasov substation is permanently out of operation in the model. Loss of OHL 220 kV in the Belgrade area can cause overloading of the parallel line. Loss of one 400/110 kV transformer in the Nis substation is critical due to possible overloading of the other parallel one. Loss of 220 kV line between the Rrashbul and Tirana substations can cause overloading of 220 kV line between the Elbassan and Fier substations in Albania. The heaviest line overloading (124% Ithermal) in the analyzed scenario is related to a 400 kV line in Romania around the Sibiu substation (Mintia-Sibiu). The heaviest transformer overloading (137% Sn) is related to the transformer 400/110 kV in the Dirste substation (Romania) when the transformer 400/110 kV in the Brasov substation is outaged (the parallel one is permanently out of operation in the model). Figure 4.3.6 shows geographical positions of critical elements in the analyzed scenario. A green color reveals 220 kV elements (line 220 kV or transformer 220/x kV), while a red one reveals 400 kV elements (line 400 kV or transformer 400/x kV). According to the obtained and presented results, it may be concluded that a re-dispatching of generation in the Romanian power system, especially of the HPP LOTRU CIUNGET and HPP PORTILE 1 (to decrease their generation level in this scenario from the initially assumed 478 MW and 796 MW respectively) and TPP PAROSENI (to increase its generation level in this scenario from the initially assumed 120 MW), as well as certain reinforcements in the internal networks of Romania, Albania and Serbia are necessary shall this generation/load pattern be made more secure. None of the identified congestions is located at the border lines.

4.23
Table 4.3.5 - Lines overloadings for 2010–base case-wet hydrology scenario, single outages
Loadings Outage Overloaded line(s) MVA % Country
OHL 220 kV AKASHA2-ARRAZH2 OHL 220 kV AELBS12-AFIER 2 251.4 111.9 ALBANIA OHL 400 kV MINTIA-SIBIU OHL 220 kV TG.JIU-PAROSEN 242.7 111.7 OHL 400 kV TANTAREN-SIBIU OHL 220 kV TG.JIU-PAROSEN 227.1 104.5 OHL 400 kV SIBIU-IERNUT OHL 400 kV MINTIA-SIBIU 477.3 124.3 OHL 220 kV P.D.F.A-RESITA ckt.1 OHL 220 kV P.D.F.A-RESITA ckt.2 315.5 108.4 OHL 220 kV RESITA-TIMIS ckt.1 OHL 220 kV RESITA-TIMIS ckt.2 315.9 112.8
ROMANIA
OHL 220 kV JBGD172-JBGD8 22 ckt.1 OHL 220 kV JBGD172-JBGD8 22 ckt.2 434.4 122.2 SERBIA
Table 4.3.6 - Transformers overloadings for 2010–base case-wet hydrology scenario, single outages Loadings Outage Overloaded branch(es) MVA % Country
TR 400/220 kV SIBIU ckt.1 TR 400/220 kV SIBIU ckt.2 527.3 131.8 400/110 kV BRASOV 400/110 kV DIRSTE 332.7 133.1 400/110 kV DIRSTE 400/110 kV BRASOV 329.7 131.9
ROMANIA
400/110 kV NIS ckt.1 400/110 kV NIS ckt.2 313.1 104.4 SERBIA
AUT
ALB
BIH
BUL
CRO
GRE
HUN
MKD
MNG
ROM
SRB
SVK
SLO
TUR
400 kV line or 400/x kV transformer220 kV line or 220/x kV transformer
critical elements
Figure 4.3.6 - Geographical positions of the critical elements for 2010-base case-wet hydrology scenario

4.24
4.4 Scenario 2015 – average hydrology – 2010 topology This part of the Study presents results of static load flow and voltage profile analyses that are conducted for complete network topology and (n-1) contingencies in the scenario which is denoted as GTmax run for year 2015 - average hydrology and expected network topology for 2010.
4.4.1 Lines loadings Figure 4.4.1 shows power exchanges between areas for 2015-average hydrology scenario. Power flows along interconnection lines in the region together with balances of the systems are shown in Figure 4.4.2. Area totals are shown in Table 4.4.1. Figure 4.4.3 shows histogram of tie lines loadings. It is concluded that most of the tie lines are loaded less than 25% of their thermal limits.
AUT
ALB
BIH
BUL
CRO
GRE
ITA
HUN
MKD
MNG
ROM
SRB
SVK
SLO
TUR
UKR
390
372
311
316
101
56
129
133
381
30 53
413
54
253
6293
236
167
130
21
450
124
471
10
10
721
Figure 4.4.1 - Area exchanges in analyzed electric power systems for 2015-average hydrology scenario – 2010 topology
Table 4.4.1 - Area totals in analyzed electric power systems for 2015-average hydrology scenario – 2010 topology AREA GENERATION LOAD LOSSES INTERCHANGE ALB 1116.1 1531 81.2 -496 BUL 7332.7 6483 150.7 699 BIH 2316.6 2279 78.7 -41.1 CRO 2316.3 3657 63.4 -1404.1 MKD 1087 1407 20 -340 ROM 7712.8 7317.4 347.4 47.9 SRB 8687.6 7263 268.7 1156 CRG 735 671 25 39
TOTALS 31304.1 30608.4 1035.1 -339.3
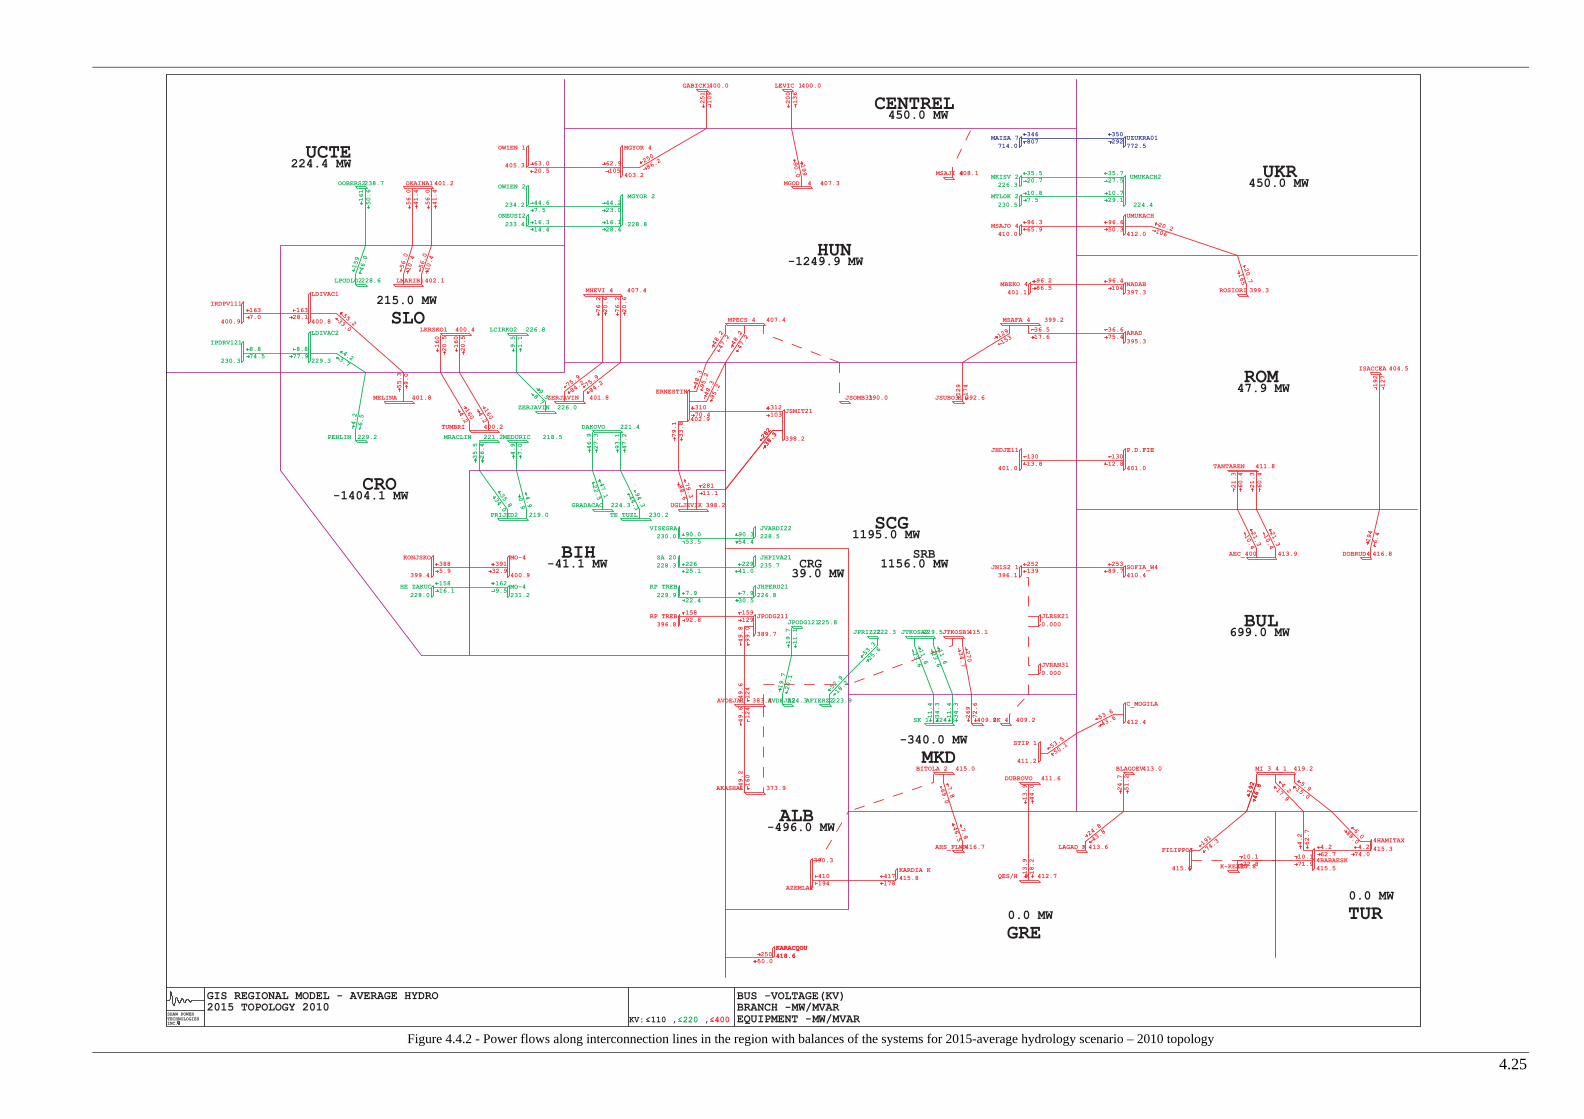
4.25
Figure 4.4.2 - Power flows along interconnection lines in the region with balances of the systems for 2015-average hydrology scenario – 2010 topology
GIS REGIONAL MODEL - AVERAGE HYDRO2015 TOPOLOGY 2010
PEHLIN 229.2
MELINA 401.8
TUMBRI 400.2
MEDURIC 218.5MRACLIN 221.2
DAKOVO 221.4
KONJSKO
399.4
HE ZAKUC
228.0
ZERJAVIN 401.8
ZERJAVIN 226.0
AZEMLA1
390.3
AKASHA1 373.9
AVDEJA2224.3AFIERZ2223.9
OWIEN 1
405.3
OWIEN 2
234.2
MGYOR 4
403.2
MGYOR 2
228.8
ONEUSI2
233.4
OKAINA1401.2
LMARIB1402.1
OOBERS2238.7
IRDPV111
400.9
LDIVAC1
400.8
IPDRV121
230.3
LDIVAC2
229.3
LKRSKO1 400.4
PRIJED2 219.0
GRADACAC 224.3
TE TUZL 230.2
JSMIT21
398.2
VISEGRA230.0
JVARDI22228.5
SA 20228.3
JHPIVA21235.7
RP TREB396.8
JHPERU21
226.8
JPODG211
389.7
MO-4
400.9
MHEVI 4 407.4
RP TREB
229.9
JPODG121225.8
JPRIZ22222.3 JTKOSA2229.5JTKOSB1415.1
409.2
BITOLA 2 415.0
AHS_FLWR416.7
DUBROVO 411.6
QES/H K 412.7
BLAGOEV413.0
STIP 1
411.2
C_MOGILA
412.4
JNIS2 1396.1
SOFIA_W4410.4
KARDIA K415.8
GABICK1400.0
MGOD 4 407.3
LEVIC 1400.0
MSAJO 4410.0
UMUKACH
412.0
ROSIORI 399.3
MKISV 2226.3
UMUKACH2
224.4
MTLOK 2
230.5
MSAFA 4 399.2
JSUBO31 392.6
ARAD
395.3
TANTAREN 411.8
AEC_400 413.9
JHDJE11
401.0
LPODLO2228.6
FILIPPOI
415.6
SK 1 224.6
LCIRKO2 226.8
P.D.FIE
401.0
UGLJEVIK 398.2
ISACCEA 404.5
DOBRUD4 416.8
JSOMB31390.0
MPECS 4 407.4
UZUKRA01772.5
MAISA 7714.0
NADAB397.3
MBEKO 4401.1
SK 4 409.2
JLESK210.000
ERNESTIN
402.9
MO-4
231.2
MI_3_4_1 419.2
JVRAN310.000
LAGAD K 413.6
KARACQOU418.6KARACQOU418.6
K-KEXRU417.84BABAESK415.5
4HAMITAX
415.3
MSAJI 4408.1
AVDEJA1 383.4
417178
410194
49.8
99.0
52.9
18.21
9.7
20.1
44.67.5
63.020.5
79.3
88.6
282
38.3
28111.1
192
127
194
6.490.3
54.4
22625.1
22941.0
7.922.4
7.930.5
15892.8
159129
90.053.5
19.7
11.1
53.3
25.6
11.4
34.3
11.6
23.6
11.4
34.3
11.6
23.6
269
72.6
7.8
69.0 1
3.9
44.0
13.9
18.2
13012.8
13013.8
21.3
60.4
21.3
10.4
21.3
60.4
252139
25389.7
35.520.7
35.727.5
96.365.9
96.650.3
20.2106
36.517.6
36.675.4
129
174
129
153
20.7
165
39132.9
35.8
34.0
4.9
0.9
47.1
22.5 94.3
44.3
312103
160
20.5
160
20.5
76.2
20.6
76.2
20.6
55.233.0
4.23.7
159
46.0
161
50.6
199
90.0
200
136
251
109
250
86.2
7.8
46.5
282
38.3
10.729.1
10.87.5
16328.1
1637.0
8.877.9
8.874.5
56.0
41.4
56.0
10.4
56.0
10.4
56.0
41.4
346807
350292
96.286.5
96.4104
21.3
10.4
53.5
50.1
53.6
43.6
24.7
51.2
16.314.4
16.128.4
44.223.0
62.9105
79.1
33.8
31070.4
48.3
95.2
48.3
95.2
48.2
47.2 48.2
47.2
15816.1
35.5
26.4
4.9
7.0 46.9
27.3
93.1
47.2
1604.2
1604.2
9.5
1.1
9.58.7
75.9
84.2 7
5.9
84.25
5.3
9.0
4.2
6.5
3885.9
1629.5
192
46.8
24.8
43.8
191
74.3
10.122.8
4.217.9
192
46.8
5.915.0
4.2
62.7 6.088.0
10.171.9
25050.0
4.262.7
4.274.0
270
34.7
49.6
124
49.6
124
49.2
160
ROM
BUL
HUN
UKRUCTE
CENTREL
CRO
BIH
SCG
ALB
GRE
MKD
TUR
SLO
CRGSRB
1195.0 MW
39.0 MW1156.0 MW
-340.0 MW
699.0 MW
-496.0 MW
-41.1 MW
224.4 MW
-1404.1 MW
-1249.9 MW
0.0 MW
450.0 MW
47.9 MW
215.0 MW
0.0 MW
450.0 MW
SHAW POWERTECHNOLOGIESINC.R KV: 110 , 220 , 400
BUS -VOLTAGE(KV)
EQUIPMENT -MW/MVARBRANCH -MW/MVAR

4.26
Histogram
0
5
10
15
20
25
30
35
40
45
x<25 25<x<50 50<x<75 75<x<100 x>100
Bin
Fr
eq
ue
nc
y
Figure 4.4.3 - Histogram of interconnection lines loadings for 2015-average hydrology scenario – 2010 topology
("Frequency" denotes number of lines and "Bin" denotes loading range in % of thermal limit) Following Table 4.4.2 lists all network elements loaded over 80% of their thermal limits. As it can be seen some lines 220 kV voltage level in Albania, Romania and Serbia are loaded over 80%. Also, most of the elements loaded over 80% are transformers in some substations, again, in Albania, Bosnia & Herzegovina, Romania and Serbia. Figure 4.4.4 shows histogram of branch loadings in the system. As for the conclusion regarding thermal loadings in this scenario it can be said that most of the network elements are loaded between 25-75% of their thermal limits, but there are some elements highly loaded. Most of the elements loaded over 80% are transformers in some substations, so some internal network reinforcements are necessary to sustain this load-demand level and production pattern. There are some elements that are overloaded (220 kV lines Targu Jiu – Paroseni and Urechesti-Targu Jiu in Romania, and 220/110 kV transformers in Fier substation in Albania. This leads to conclusion that transmission network is not able to sustain this load-demand level and this production pattern and certain network reinforcement are necessary. It should be pointed out that higher engagement of TPP Paroseni resolves this overloads of the 220 kV lines Targu Jiu – Paroseni and Urechesti-Targu Jiu and decreases the load of the 400/220 transformer in Urechesti substation. Also, it is expected that transformers in Fier substation will be replaced with more powerful transformer units.

4.27
Table 4.4.2 - Network elements loaded over 80% of their thermal limits for 2015-average hydrology scenario – 2010 topology
BRANCH LOADINGS ABOVE 80.0 % OF RATING:
AREA ELEMENT LOADINGMVA
RATINGMVA PERCENT
Lines ALB HL 220kV AKASHA2-ARRAZH2 1 250.1 270 92.6
HL 220kV P.D.F.A-CETATE1 1 205.2 208.1 98.6 HL 220kV P.D.F.A-RESITA 1 236.2 277.4 85.2 HL 220kV P.D.F.A-RESITA 2 236.2 277.4 85.2 HL 220kV P.D.F.II-CETATE1 1 267.7 277.4 96.5 HL 220kV TG.JIU-PAROSEN 1 278.2 208.1 133.7
ROM
HL 220kV URECHESI-TG.JIU 1 278.2 277.4 100.3 SRB HL 220kV JBGD3 21-JOBREN2 1 261 301 86.7
Transformers TR 220/110 kV AELBS1 1 78 90 86.6 TR 220/110 kV AELBS1 2 78 90 86.6 TR 220/110 kV AELBS1 3 83.8 90 93.1 TR 220/110 kV AFIER 1 138.2 120 115.2 TR 220/110 kV AFIER 2 113.3 90 125.9 TR 220/110 kV AFIER 3 108.1 90 120.2 TR 220/110 kV AFIERZ 1 51.9 60 86.5 TR 220/110 kV AFIERZ 2 51.9 60 86.5 TR 220/110 kV AKASHA 1 84.1 100 84.1
ALB
TR 220/110 kV AKASHA 2 84.1 100 84.1 BIH TR 400/110 kV UGLJEV 1 254.8 300 84.9
TR 220/110 kV FUNDE2 1 193.3 200 96.7 TR 220/110 kV FUNDEN 1 162.9 200 81.4 TR 400/220 kV IERNUT 1 320.4 400 80.1
ROM
TR 400/220 kV URECHE 1 395.4 400 98.9 TR 220/110 kV JBGD3 1 166.7 200 83.4 TR 220/110 kV JBGD3 2 125.6 150 83.7 TR 220/110 kV JTKOSA 2 130.7 150 87.1 TR 220/110 kV JTKOSA 3 133 150 88.7 TR 220/110 kV JZREN2 2 123.6 150 82.4 TR 400/220 kV JTKOSB 2 325.8 400 81.4
SRB
TR 400/220 kV JTKOSB 3 325.8 400 81.4
Histogram
0
50
100
150
200
250
300
350
x<25 25<x<50 50<x<75 75<x<100 x>100
Bin
Fr
eq
ue
nc
y
Figure 4.4.4 - Histogram of branch loadings for 2015-average hydrology scenario – 2010 network topology
("Frequency" denotes number of lines and "Bin" denotes loading range in % of thermal limit)
4.4.2 Voltage Profile in the Region Figure 4.4.5 shows histogram of voltages in monitored substations. Voltages in almost all monitored substations are found within permitted limits. Only in substation Elbasan and Kashar, where voltages are around 373 kV, but this can be resolved with changing of the setting of the tap changing transformers in these substations.

4.28
Histogram
0
10
20
30
40
50
60
70
80
90
100
x<0.9
0.9<x<0.95
0.95<x<0.975
0.975<x<1
1<x<1.025
1.025<x<1.05
1.05<x<1.1
x>1.1
Bin
Fr
eq
ue
nc
y
Figure 4.4.5 - Histogram of voltages in monitored substations for 2015-average hydrology scenario – 2010 network
topology ("Frequency" denotes number of busses and "Bin" denotes voltage range in p.u.) In the rest of the monitored network the voltage profile is satisfying and that most of the substations have magnitudes in range 0.975-1.05 p.u.
4.4.3 Security (n-1) analysis Results of security (n-1) analysis for 2015-dry hydrology scenario and expected topology for 2010 are presented in Table 4.4.3. Figure 4.4.6 shows the geographical position of the critical elements in monitored systems. It can be concluded that all identified insecure situations are located in internal networks that belong to monitored power systems of Albania, Croatia, Romania and Serbia. In most critical case in Romanian system, the critical elements are 220 kV lines Targu Jiu – Paroseni and Urechesti-Targu Jiu and 400/220 kV transformer in Urechesti substation, but these elements are overloaded by full topology too, which is the main reason why they appear as critical by most outages analyzed. As it has been stated before, this can be resolved by higher engagement of the TPP Paroseni. Some of the overloadings identified can be relieved by changing internal network topology (splitting busbars, changing lower voltage network topology in order to redistribute load-demand or change of generation units engagement), like in the case of most severe overloading in Romanian network happens on transformer 400/110 kV Dirste when transformer 400/110 kV in Brasov is outaged, but this is a consequence of the fact that second transformer unit 400/110 kV in Brasov is out of operation. Switching on of this transformer clears this critical outage. The similar situation is with outage of the 400 kV line Obrenovac-Beograd 8 in Serbia. Splitting of the busbars in 220 kV Beograd 3 in substation relieves this overloading, but voltage profile in Serbian network remains critical, so additional dispatching actions are necessary too. Losing the 400 kV line Kosovo B-Pec or one transformer unit in substation Kosovo B causes overloading of the transformer units in this substation. This is consequence of the low level of

4.29
production in 220 kV network in Kosovo region, due to decommissioning of the generation units in TPP Kosovo A. All in all, certain reinforcement of internal network is necessary in order to make this regime more secure (more about this in chapter 6). None of the identified congestions is located at border lines.
Table 4.4.3 - Network overloadings for 2015-average hydrology scenario, single outages – 2010 network topology
Area contingency Area
overloadings /
out of limits voltages #
limit /
Unom
Flow /
Voltage
rate /
volt.dev.1 2 3 4 5 6 7 8
BASE CASE RO HL 220kV TG.JIU-PAROSEN 1 208.1MVA 282.6MVA 133.7%RO OHL 220kV P.D.F.A -CALAFAT 1 RO HL 220kV P.D.F.A-CETATE1 1 208.1MVA 259.4MVA 126.5%
RO TR 400/220kV/kV URECHESI 1 400MVA 417.6MVA 104.4%RO HL 220kV URECHESI-TG.JIU 1 277.4MVA 299MVA 106.6%RO HL 220kV P.D.F.A-RESITA 2 277.4MVA 337.8MVA 128.0%
RO OHL 220kV P.D.F.A -RESITA 1
RO HL 220kV TG.JIU-PAROSEN 1 208.1MVA 299MVA 142.1%RO HL 220kV URECHESI-TG.JIU 1 277.4MVA 292.7MVA 104.1%RO HL 220kV RESITA-TIMIS 2 277.4MVA 348.7MVA 129.1%RO OHL 220kV RESITA -TIMIS 1 RO HL 220kV TG.JIU-PAROSEN 1 208.1MVA 292.7MVA 138.8%RO TR 400/220kV/kV URECHESI 1 400MVA 416.1MVA 104.0%RO HL 220kV URECHESI-TG.JIU 1 277.4MVA 293.8MVA 105.4%RO OHL 220kV PESTIS -MINTIA A 1 RO HL 220kV TG.JIU-PAROSEN 1 208.1MVA 287.2MVA 140.6%RO TR 400/220kV/kV URECHESI 1 400MVA 412.9MVA 103.2%RO HL 220kV URECHESI-TG.JIU 1 277.4MVA 293.3MVA 104.7%RO OHL 220kV CLUJ FL -MARISEL 1 RO HL 220kV TG.JIU-PAROSEN 1 208.1MVA 293.3MVA 139.6%RO TR 400/220kV/kV URECHESI 1 400MVA 424.3MVA 106.1%RO HL 220kV URECHESI-TG.JIU 1 277.4MVA 306MVA 109.7%RO OHL 220kV AL.JL -GILCEAG 1 RO HL 220kV TG.JIU-PAROSEN 1 208.1MVA 299.7MVA 146.3%
RO OHL 400kV TANTAREN-SLATINA 1 RO TR 400/220kV/kV URECHESI 1 400MVA 442.8MVA 110.7%RO TR 400/220kV/kV URECHESI 1 400MVA 420.4MVA 105.1%RO HL 220kV URECHESI-TG.JIU 1 277.4MVA 296.5MVA 106.2%RO OHL 400kV TANTAREN-BRADU 1 RO HL 220kV TG.JIU-PAROSEN 1 208.1MVA 296.5MVA 141.6%RO TR 400/220kV/kV URECHESI 1 400MVA 443.9MVA 111.0%RO HL 220kV URECHESI-TG.JIU 1 277.4MVA 327.5MVA 117.9%RO OHL 400kV TANTAREN-SIBIU 1 RO HL 220kV TG.JIU-PAROSEN 1 208.1MVA 327.5MVA 157.2%RO TR 400/220kV/kV URECHESI 1 400MVA 444MVA 111.0%RO HL 220kV URECHESI-TG.JIU 1 277.4MVA 299MVA 106.8%RO OHL 400kV URECHESI-DOMNESTI 1 RO HL 220kV TG.JIU-PAROSEN 1 208.1MVA 299MVA 142.3%RO TR 400/220kV/kV URECHESI 1 400MVA 443.2MVA 110.8%RO HL 220kV URECHESI-TG.JIU 1 277.4MVA 330.1MVA 118.7%RO OHL 400kV MINTIA -SIBIU 1 RO HL 220kV TG.JIU-PAROSEN 1 208.1MVA 322.6MVA 158.2%
RO OHL 400kV P.D.FIE -SLATINA 1 RO TR 400/220kV/kV URECHESI 1 400MVA 428.1MVA 107.0%RO TR 400/220kV/kV URECHESI 1 400MVA 413.5MVA 103.4%RO HL 220kV URECHESI-TG.JIU 1 277.4MVA 295MVA 105.0%RO HL 220kV TG.JIU-PAROSEN 1 208.1MVA 295MVA 140.0%
RO OHL 400kV DOMNESTI-BRAZI 1
RO HL 220kV BUC.S-B-FUNDENI 1 320MVA 331.2MVA 102.7%RO OHL 400kV SUCEAVA -GADALIN 1 RO HL 220kV TG.JIU-PAROSEN 1 208.1MVA 282MVA 136.7%
RO TR 400/220kV/kV URECHESI 1 400MVA 413.5MVA 103.4%RO HL 220kV URECHESI-TG.JIU 1 277.4MVA 298.1MVA 106.7%RO OHL 400kV SMIRDAN -GUTINAS 1 RO HL 220kV TG.JIU-PAROSEN 1 208.1MVA 298.1MVA 142.2%
RO OHL 400kV GADALIN -ROSIORI 1 RO HL 220kV TG.JIU-PAROSEN 1 208.1MVA 280.1MVA 135.6%CS OHL 220kV JBGD172 -JBGD8 22 1 CS HL 220kV JBGD172-JBGD8 22 2 365.8MVA 462.8MVA 133.3%CS OHL 400kV JBGD8 1 -JOBREN11 1 CS HL 220kV JBGD3 21-JOBREN2 1 301MVA 429.3MVA 155.8%
RO TR 400/220kV/kV URECHESI 1 400MVA 436.7MVA 109.2%RO HL 220kV URECHESI-TG.JIU 1 277.4MVA 316.6MVA 113.9%RO HL 220kV TG.JIU-PAROSEN 1 208.1MVA 316.6MVA 151.8%
CS OHL 400kV JHDJE11 -JTDRMN1 1
CS HL 220kV JBGD3 21-JOBREN2 1 301MVA 319.6MVA 109.6%RO TR 400/220kV/kV URECHESI 1 400MVA 422.5MVA 105.6%RO HL 220kV URECHESI-TG.JIU 1 277.4MVA 303.6MVA 108.6%CS OHL 400kV JNSAD31 -JSUBO31 1 RO HL 220kV TG.JIU-PAROSEN 1 208.1MVA 303.6MVA 144.7%RO HL 220kV URECHESI-TG.JIU 1 277.4MVA 294.1MVA 104.9%RO HL 220kV TG.JIU-PAROSEN 1 208.1MVA 294.1MVA 139.8%CS TR 400/220kV/kV JTKOSB1 1 400MVA 419.7MVA 104.9%CS TR 400/220kV/kV JTKOSB1 2 400MVA 438.6MVA 109.6%
CS OHL 400kV JTKOSB1 -JPEC 1 A
CS TR 400/220kV/kV JTKOSB1 3 400MVA 438.6MVA 109.6%RO TR 400/110 BRASOV 1 RO TR 400/110kV/kV DIRSTE 1 250MVA 385.8MVA 154.3%RO TR 400/110 CLUJ E 1 RO HL 220kV TG.JIU-PAROSEN 1 208.1MVA 282.5MVA 137.1%RO TR 400/110 DIRSTE 1 RO TR 400/110kV/kV BRASOV 1 250MVA 380MVA 152.0%CS TR 400/110 JNIS2 1 CS TR 400/110kV/kV JNIS2 1 2 300MVA 332.5MVA 110.8%RO TR 400/220 BUC.S 1 RO TR 400/220kV/kV BUC.S 2 400MVA 483MVA 120.8%
RO HL 400kV GADALIN-CLUJ E 1 238.3MVA 238.1MVA 102.9%RO HL 220kV TG.JIU-PAROSEN 1 208.1MVA 282.5MVA 137.4%RO TR 400/220 IERNUT 1 RO HL 220kV STEJARU-GHEORGH 1 208.1MVA 211.8MVA 121.7%CS TR 400/220kV/kV JTKOSB1 2 400MVA 457.2MVA 114.3%CS TR 400/220 JTKOSB 1 CS TR 400/220kV/kV JTKOSB1 3 400MVA 457.2MVA 114.3%
RO TR 400/220 SLATINA 1 RO TR 400/220kV/kV URECHESI 1 400MVA 424.9MVA 106.2%
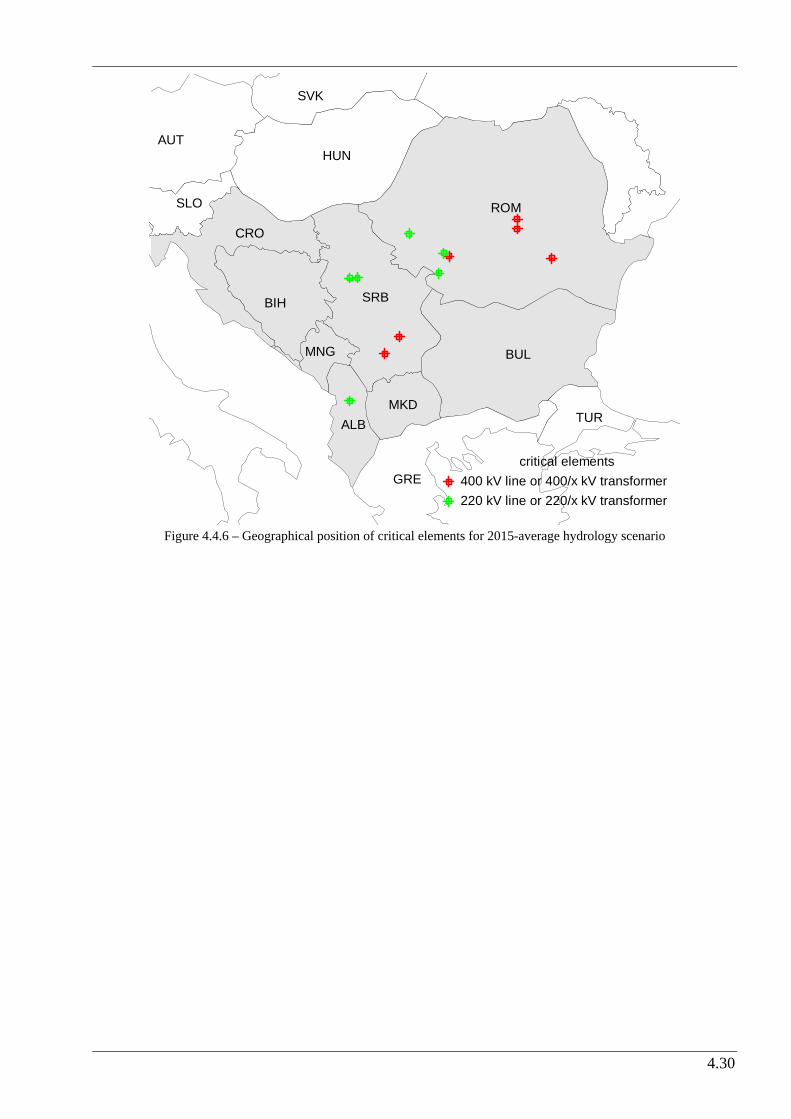
4.30
AUT
ALB
BIH
BUL
CRO
GRE
HUN
MKD
MNG
ROM
SRB
SVK
SLO
TUR
400 kV line or 400/x kV transformer220 kV line or 220/x kV transformer
critical elements
Figure 4.4.6 – Geographical position of critical elements for 2015-average hydrology scenario

4.31
4.5 Scenario 2015 – average hydrology – topology 2015 This part of the Study presents results of static load flow and voltage profile analyses that are conducted for complete network topology and (n-1) contingencies in the scenario which is denoted as GTmax run for year 2015 - average hydrology and expected network topology for 2015.
4.5.1 Lines loadings Figure 4.5.1 shows power exchanges between areas for 2015-average hydrology scenario. Power flows along interconnection lines in the region together with balances of the systems are shown in Figure 4.5.2. Area totals are shown in Table 4.5.1. Figure 4.5.3 shows histogram of tie lines loadings. It is concluded that most of the tie lines are loaded less than 25% of their thermal limits.
AUT
ALB
BIH
BUL
CRO
GRE
ITA
HUN
MKD
MNG
ROM
SRB
SVK
SLO
TUR
UKR
476
336
301
304
89
28
126
106
161
276 382
112
98
247
298
220
193
169
123
11
450
135
461
8
8
771
277
Figure 4.5.1 - Area exchanges in analyzed electric power systems for 2015-average hydrology scenario
Table 4.5.1 - Area totals in analyzed electric power systems for 2015-average hydrology scenario
AREA GENERATION LOAD LOSSES INTERCHANGE ALB 1118.1 1541 73.1 -496 BUL 7332.9 6483 150.9 699 BIH 2317.2 2279 79.2 -41 CRO 2317 3657 64 -1404 MKD 1088.4 1407 21.4 -340 ROM 7708.6 7317.4 343.1 48.1 SRB 8689.4 7279 254.4 1156 CRG 735.2 676 20.3 39
TOTALS 31306.8 30639.4 1006.4 -338.9 As it can be seen, new elements that are expected to be build till 2015 cause totally different distribution of power flows in the southern part of the region (Albania, FYR of Macedonia, Serbia, and Montenegro).

4.32
Figure 4.5.2 - Power flows along interconnection lines in the region with balances of the systems for 2015-average hydrology scenario
GIS REGIONAL MODEL - AVERAGE HYDRO2015 TOPOLOGY 2015
PEHLIN 229.3
MELINA 402.1
TUMBRI 400.3
MEDURIC 218.7MRACLIN 221.4
DAKOVO 221.7
KONJSKO
401.0
HE ZAKUC
228.8
ZERJAVIN 402.1
ZERJAVIN 226.2
AZEMLA1
408.7
AKASHA1 395.2
AVDEJA2228.4AFIERZ2229.2
OWIEN 1
405.3
OWIEN 2
234.2
MGYOR 4
403.2
MGYOR 2
228.8
ONEUSI2
233.4
OKAINA1401.3
LMARIB1402.2
OOBERS2238.7
IRDPV111
400.9
LDIVAC1
400.9
IPDRV121
230.3
LDIVAC2
229.3
LKRSKO1 400.5
PRIJED2 219.3
GRADACAC 224.6
TE TUZL 230.5
JSMIT21
399.0
VISEGRA230.9
JVARDI22229.6
SA 20229.5
JHPIVA21237.3
RP TREB403.9
JHPERU21
230.3
JPODG211
401.5
MO-4
403.6
MHEVI 4 407.5
RP TREB
232.4
JPODG121229.9
JPRIZ22226.6 JTKOSA2232.4JTKOSB1419.0
410.5
BITOLA 2 414.5
AHS_FLWR417.3
DUBROVO 412.0
QES/H K 413.5
BLAGOEV413.9
STIP 1
411.7
C_MOGILA
413.3
JNIS2 1402.0
SOFIA_W4411.5
KARDIA K417.8
GABICK1400.0
MGOD 4 407.3
LEVIC 1400.0
MSAJO 4410.0
UMUKACH
412.0
ROSIORI 400.0
MKISV 2226.3
UMUKACH2
224.4
MTLOK 2
230.5
MSAFA 4 399.7
JSUBO31 393.2
ARAD
396.1
TANTAREN 412.3
AEC_400 414.4
JHDJE11
402.1
LPODLO2228.7
FILIPPOI
415.7
SK 1 226.3
LCIRKO2 226.8
P.D.FIE
402.0
UGLJEVIK 399.1
ISACCEA 404.9
DOBRUD4 417.1
JSOMB31390.6
MPECS 4 407.6
UZUKRA01772.5
MAISA 7714.1
NADAB397.9
MBEKO 4401.6
SK 4 409.9
JLESK21403.8
ERNESTIN
403.3
MO-4
232.3
MI_3_4_1 419.4
JVRAN31406.8
LAGAD K 414.3
KARACQOU419.6KARACQOU419.6
K-KEXRU417.94BABAESK415.6
4HAMITAX
415.4
MSAJI 4408.1
AVDEJA1 402.6
11336.8
112106
223
6.4
16.3
11.45
3.0
26.1
46.27.1
71.321.1
89.9
84.1
255
38.9
2549.1
184
128
185
7.281.3
50.1
22229.1
22543.7
22.017.3
22.125.6
22535.2
22671.4
81.048.8
52.7
18.2
16.2
21.0
20.7
39.9
20.9
29.4
20.7
39.9
20.9
29.4
293
105
242
82.0 5
6.5
42.4
56.6
19.3
12311.9
12310.9
4.1
61.9
4.1
11.7
4.1
61.9
24697.1
24843.0
35.520.7
35.727.5
87.266.9
87.449.9
11.198.7
23.712.9
23.871.1
127
172
126
150
11.5
158
40921.2
40.8
33.7
7.6
0.8
49.6
22.3 97.5
44.3
30198.1
160
21.9
160
21.9
68.9
20.8
68.9
20.8
63.835.4
6.54.2
158
45.9
160
50.3
199
90.7
200
137
251
109
250
87.0
242
63.8
255
38.9
10.729.2
10.87.5
16625.0
1664.0
9.877.0
9.773.6
52.9
41.6
52.9
10.5
52.9
10.5
52.9
41.6
346806
350293
82.081.1
82.298.9
4.1
11.7
114
10.8
94.3
51.194.4
71.9
98.1
48.8
98.4
43.3
25.9
50.2
17.614.1
17.528.1
45.722.6
71.2104
89.7
29.3
29963.9
54.7
92.7
54.7
92.7
54.6
44.6 54.6
44.6
16215.4
40.5
26.3
7.6
7.1 49.4
27.1
96.2
46.9
1602.8
1602.8
9.1
1.4
9.18.4
68.7
84.6 6
8.7
84.66
3.9
11.4
6.5
6.0
4063.5
1667.9
195
47.1
26.0
45.1
13.9
68.4
14.0
30.1
114
56.1
194
73.7
8.123.1
3.317.1
195
47.1
4.814.1
3.3
63.4 4.889.0
8.072.1
25050.0
3.363.4
3.374.8
278
42.8
277
79.7
294
69.2
398
97.8397
110
223
16.1
75.0
91.9
74.7
133
75.0
91.8
74.7
133
ROM
BUL
HUN
UKRUCTE
CENTREL
CRO
BIH
SCG
ALB
GRE
MKD
TUR
SLO
CRGSRB
1195.0 MW
39.0 MW1156.0 MW
-340.0 MW
699.0 MW
-496.0 MW
-41.0 MW
224.0 MW
-1404.0 MW
-1249.9 MW
-0.1 MW
450.0 MW
48.0 MW
215.0 MW
0.0 MW
450.0 MW
SHAW POWERTECHNOLOGIESINC.R KV: 110 , 220 , 400
BUS -VOLTAGE(KV)
EQUIPMENT -MW/MVARBRANCH -MW/MVAR

4.33
Histogram
0
5
10
15
20
25
30
35
40
45
x<25 25<x<50 50<x<75 75<x<100 x>100
Bin
Fr
eq
ue
nc
y
Figure 4.5.3 - Histogram of interconnection lines loadings for 2015-average hydrology scenario ("Frequency" denotes
number of lines and "Bin" denotes loading range in % of thermal limit) Following PSS/E output (Table 4.5.2) lists all network elements loaded over 80% of their thermal limits. Figure 4.5.4 shows histogram of branch loadings in the system.
Table 4.5.2 - Network elements loaded over 80% of their thermal limits for 2015-average hydrology scenario BRANCH LOADINGS ABOVE 80.0 % OF RATING:
AREA ELEMENT LOADINGMVA
RATINGMVA PERCENT
Lines ALB HL 220kV AKASHA2-ARRAZH2 1 237.7 270 88
HL 220kV P.D.F.A-CETATE1 1 205 208.1 98.5 HL 220kV P.D.F.A-RESITA 1 232.2 277.4 83.7 HL 220kV P.D.F.A-RESITA 2 232.2 277.4 83.7 HL 220kV P.D.F.II-CETATE1 1 267.5 277.4 96.4 HL 220kV TG.JIU-PAROSEN 1 272.6 208.1 131
ROM
HL 220kV URECHESI-TG.JIU 1 272.6 277.4 98.3 SRB HL 220kV JBGD3 21-JOBREN2 1 261.8 301 87
Transformers TR 220/110 kV AELBS1 1 74.3 90 82.5 TR 220/110 kV AELBS1 2 74.3 90 82.5 TR 220/110 kV AELBS1 3 79.8 90 88.7 TR 220/110 kV AFIER 1 134.9 120 112.5 TR 220/110 kV AFIER 2 110.6 90 122.9 TR 220/110 kV AFIER 3 105.6 90 117.3 TR 220/110 kV AFIERZ 1 50.3 60 83.8 TR 220/110 kV AFIERZ 2 50.3 60 83.8 TR 220/110 kV AKASHA 1 82.1 100 82.1
ALB
TR 220/110 kV AKASHA 2 82.1 100 82.1 TR 220/110 kV FUNDE2 1 193 200 96.5 TR 220/110 kV FUNDEN 1 162.6 200 81.3 ROM TR 400/220 kV URECHE 1 390.9 400 97.7 TR 220/110 kV JBGD3 1 166.6 200 83.3 TR 220/110 kV JBGD3 2 125.8 150 83.9 SRB TR 220/110 kV JZREN2 2 123.5 150 82.3
BIH TR 400/110 kV UGLJEV 1 252.5 300 84.2

4.34
Histogram
0
50
100
150
200
250
300
350
x<25 25<x<50 50<x<75 75<x<100 x>100
Bin
Fr
eq
ue
nc
y
Figure 4.5.4 - Histogram of branch loadings for 2015-average hydrology scenario ("Frequency" denotes number of lines
and "Bin" denotes loading range in % of thermal limit) As it can be seen from these outputs, most of the network elements are loaded between 25-75% of their thermal limits and most of the elements loaded over 80% are transformers in some substations, so some internal network reinforcements are necessary to sustain this load-demand level and production pattern. Also, planned network reinforcements compared to network topology 2010, reduce load of some elements in southern part of Serbia.
4.5.2 Voltage Profile in the Region Figure 4.5.5 shows histogram of voltages in monitored substations. Voltages in all monitored substations are found within permitted limits. It is concluded that voltage profile is satisfying and that most of the substations have magnitudes in range 1-1.05 p.u.
Histogram
0
20
40
60
80
100
120
x<0.9
0.9<x<0.95
0.95<x<0.975
0.975<x<1
1<x<1.025
1.025<x<1.05
1.05<x<1.1
x>1.1
Bin
Fr
eq
ue
nc
y
Figure 4.5.5 - Histogram of voltages in monitored substations for 2015-average hydrology scenario ("Frequency"
denotes number of busses and "Bin" denotes voltage range in p.u.)

4.35
4.5.3 Security (n-1) analysis Results of security (n-1) analysis for 2015-average hydrology scenario are presented in Table 4.5.3 and Figure 4.5.6. Like for expected topology 2010 (previous chapter), it can be concluded that all identified insecure situations are located in internal networks that belong to monitored power systems of Albania, Croatia, Romania and Serbia. Also, the planned network reinforcements till 2015 resolve some of the noticed critical contingencies, especially in southern part of Serbia. The rest of the conclusions are the same as for the analyzed topology 2010, and that is that certain level of network reinforcement is necessary to make this regime more secure.
AUT
ALB
BIH
BUL
CRO
GRE
HUN
MKD
MNG
ROM
SRB
SVK
SLO
TUR
400 kV line or 400/x kV transformer220 kV line or 220/x kV transformer
critical elements
Figure 4.5.6 – Geographical position of critical elements for 2015-average hydrology scenario

4.36
Table 4.5.3 - Network overloadings for 2015-average hydrology scenario, single outages
Area contingency Area
overloadings /
out of limits voltages #
limit /
Unom
Flow /
Voltage
rate /
volt.dev.1 2 3 4 5 6 7 8
BASE CASE RO HL 220kV TG.JIU-PAROSEN 1 208.1MVA 277.6MVA 131.0%AL OHL 220kV AELBS12 -AFIER 2 1 AL HL 220kV AKASHA2-ARRAZH2 1 270MVA 364.3MVA 142.6%BA OHL 400kV VISEGRA -HE VG 1 BA HL 220kV RP KAKAN-KAKANJ5 1 316MVA 338.8MVA 103.8%RO OHL 220kV P.D.F.A -CALAFAT 1 RO HL 220kV P.D.F.A-CETATE1 1 208.1MVA 259.1MVA 125.9%
RO TR 400/220kV/kV URECHESI 1 400MVA 413.4MVA 103.3%RO HL 220kV URECHESI-TG.JIU 1 277.4MVA 293.7MVA 104.4%RO HL 220kV P.D.F.A-RESITA 2 277.4MVA 333.5MVA 125.7%
RO OHL 220kV P.D.F.A -RESITA 1
RO HL 220kV TG.JIU-PAROSEN 1 208.1MVA 293.7MVA 139.2%RO OHL 220kV RESITA -TIMIS 1 RO HL 220kV RESITA-TIMIS 2 277.4MVA 343.7MVA 126.7%RO OHL 220kV CRAIOV B-ISALNI A 1 RO TR 400/220kV/kV URECHESI 1 400MVA 412.5MVA 103.1%
RO TR 400/220kV/kV URECHESI 1 400MVA 412.7MVA 103.2%RO HL 220kV URECHESI-TG.JIU 1 277.4MVA 289.3MVA 103.5%RO OHL 220kV PESTIS -MINTIA A 1 RO HL 220kV TG.JIU-PAROSEN 1 208.1MVA 283MVA 138.1%
RO OHL 220kV CLUJ FL -AL.JL 1 RO HL 220kV TG.JIU-PAROSEN 1 208.1MVA 264.9MVA 124.7%RO TR 400/220kV/kV URECHESI 1 400MVA 420.3MVA 105.1%RO HL 220kV URECHESI-TG.JIU 1 277.4MVA 301MVA 107.6%RO OHL 220kV AL.JL -GILCEAG 1 RO HL 220kV TG.JIU-PAROSEN 1 208.1MVA 294.9MVA 143.5%
RO OHL 400kV TANTAREN-SLATINA 1 RO TR 400/220kV/kV URECHESI 1 400MVA 437.9MVA 109.5%RO TR 400/220kV/kV URECHESI 1 400MVA 416.1MVA 104.0%RO HL 220kV URECHESI-TG.JIU 1 277.4MVA 291.3MVA 104.0%RO OHL 400kV TANTAREN-BRADU 1 RO HL 220kV TG.JIU-PAROSEN 1 208.1MVA 291.3MVA 138.6%RO TR 400/220kV/kV URECHESI 1 400MVA 438.7MVA 109.7%RO HL 220kV URECHESI-TG.JIU 1 277.4MVA 321.3MVA 115.3%RO OHL 400kV TANTAREN-SIBIU 1 RO HL 220kV TG.JIU-PAROSEN 1 208.1MVA 321.3MVA 153.7%RO TR 400/220kV/kV URECHESI 1 400MVA 439.9MVA 110.0%RO HL 220kV URECHESI-TG.JIU 1 277.4MVA 294MVA 104.7%RO OHL 400kV URECHESI-DOMNESTI 1 RO HL 220kV TG.JIU-PAROSEN 1 208.1MVA 294MVA 139.5%RO TR 400/220kV/kV URECHESI 1 400MVA 437.6MVA 109.4%RO HL 220kV URECHESI-TG.JIU 1 277.4MVA 323.1MVA 115.8%RO OHL 400kV MINTIA -SIBIU 1 RO HL 220kV TG.JIU-PAROSEN 1 208.1MVA 316MVA 154.4%
RO OHL 400kV P.D.FIE -SLATINA 1 RO TR 400/220kV/kV URECHESI 1 400MVA 424.6MVA 106.2%RO OHL 400kV SUCEAVA -GADALIN 1 RO HL 220kV TG.JIU-PAROSEN 1 208.1MVA 276.9MVA 133.8%
RO TR 400/220kV/kV URECHESI 1 400MVA 409.4MVA 102.4%RO HL 220kV URECHESI-TG.JIU 1 277.4MVA 292.8MVA 104.5%RO OHL 400kV SMIRDAN -GUTINAS 1 RO HL 220kV TG.JIU-PAROSEN 1 208.1MVA 292.8MVA 139.3%
RO OHL 400kV SIBIU -IERNUT 1 RO HL 220kV TG.JIU-PAROSEN 1 208.1MVA 277.6MVA 134.5%RO OHL 400kV GADALIN -CLUJ E 1 RO HL 220kV TG.JIU-PAROSEN 1 208.1MVA 277.8MVA 134.5%CS OHL 220kV JBGD172 -JBGD8 22 1 CS HL 220kV JBGD172-JBGD8 22 2 365.8MVA 463.6MVA 133.1%CS OHL 400kV JBGD8 1 -JOBREN11 1 CS HL 220kV JBGD3 21-JOBREN2 1 301MVA 432.1MVA 156.1%
RO TR 400/220kV/kV URECHESI 1 400MVA 414.3MVA 103.6%RO HL 220kV URECHESI-TG.JIU 1 277.4MVA 291.3MVA 103.8%CS OHL 400kV JBOR 21 -JHDJE11 1 RO HL 220kV TG.JIU-PAROSEN 1 208.1MVA 291.3MVA 138.4%RO TR 400/220kV/kV URECHESI 1 400MVA 430.1MVA 107.5%RO HL 220kV URECHESI-TG.JIU 1 277.4MVA 309.2MVA 110.8%RO HL 220kV TG.JIU-PAROSEN 1 208.1MVA 309.2MVA 147.7%
CS OHL 400kV JHDJE11 -JTDRMN1 1
CS HL 220kV JBGD3 21-JOBREN2 1 301MVA 319.4MVA 109.2%RO TR 400/220kV/kV URECHESI 1 400MVA 418.4MVA 104.6%RO HL 220kV URECHESI-TG.JIU 1 277.4MVA 298.5MVA 106.4%CS OHL 400kV JNSAD31 -JSUBO31 1 RO HL 220kV TG.JIU-PAROSEN 1 208.1MVA 298.5MVA 141.9%
RO TR 400/110 BRASOV 1 RO TR 400/110kV/kV DIRSTE 1 250MVA 385.1MVA 154.1%RO TR 400/110 CLUJ E 1 RO HL 220kV TG.JIU-PAROSEN 1 208.1MVA 277.8MVA 134.4%RO TR 400/110 DIRSTE 1 RO TR 400/110kV/kV BRASOV 1 250MVA 379.5MVA 151.8%RO TR 400/220 BUC.S 1 RO TR 400/220kV/kV BUC.S 2 400MVA 482.6MVA 120.6%
RO HL 220kV TG.JIU-PAROSEN 1 208.1MVA 277.8MVA 134.6%RO TR 400/220 IERNUT 1 RO HL 220kV STEJARU-GHEORGH 1 208.1MVA 210.4MVA 120.3%CS HL 220kV JBGD3 21-JOBREN2 1 301MVA 314.5MVA 108.5%CS TR 400/220 JBGD8 1 CS HL 220kV JBGD3 22-JBGD8 22 2 365.8MVA 372MVA 107.5%
RO TR 400/220 SLATINA 1 RO TR 400/220kV/kV URECHESI 1 400MVA 421MVA 105.2%
4.5.4 Summary of Impacts - 2015 topology versus 2010 topology Compared to the expected topology 2010, analyzed in previous chapter, it can be seen that the network losses are smaller as a consequence of building of new elements for 2015 network topology, especially in the cases of Albania, Serbia and Montenegro. Overall reduction of loses is around 30 MW. Also, planned network reinforcements compared to network topology 2010, reduce load of some elements in southern part of Serbia.

4.37
Compared to the 2010 topology, voltage profile is somewhat better, especially in southern and central part of Serbia, as well as in Albania. Realization of the planed investments till 2015 has impact on secure operation of the network. Some of the insecure states identified with 2010 topology are relieved and do not exist with expected 2015 network topology. Also, level of overloadings due to outages is decreased. All in all overall network performance is better, especially in the region where new planed investments are to be realized (Albania, southern Serbia and Montenegro).

4.38
4.6 Scenario 2015 – dry hydrology – 2010 topology This part of the Study presents the results of static load flow and voltage profile analyses that are conducted for complete network topology and (n-1) contingencies in the scenario which is denoted as GTmax run for year 2015 - dry hydrology and expected network topology for 2010.
4.6.1 Lines loadings Figure 4.6.1 shows power exchanges between areas for 2015-dry hydrology scenario. Power flows along interconnection lines in the region together with balances of the systems are shown in Figure 4.6.2. Area totals are shown in Table 4.6.1. Figure 4.6.3 shows histogram of tie lines loadings. It is concluded that most of the tie lines are loaded less than 25% of their thermal limits.
AUT
ALB
BIH
BUL
CRO
GRE
ITA
HUN
MKD
MNG
ROM
SRB
SVK
SLO
TUR
UKR
156
91
207
258
43
73
31
103
230
278 82
360
48
229
13
383
366
143
70
37
450
181
413
20
20
694
Figure 4.6.1 - Area exchanges in analyzed electric power systems for 2015-dry hydrology scenario – topology 2010
Table 4.6.1 - Area totals in analyzed electric power systems for 2015-dry hydrology scenario – topology 2010
AREA GENERATION LOAD LOSSES INTERCHANGE ALBANIA 894.7 1521.9 92.7 -720
BULGARIA 7363.9 6450 147.9 766 BIH 3140.9 2304 78.2 758.8
CROATIA 2636.7 3665 58.2 -1086.4 MACEDONIA 985.1 1410 19.1 -444
ROMANIA 7724.6 7798.4 295.5 -369.2 SERBIA 8397.9 7296 237.9 864
MONTENEGRO 586.3 672 22.1 -107.7 TOTALS 31730.1 31117.3 951.6 -338.5
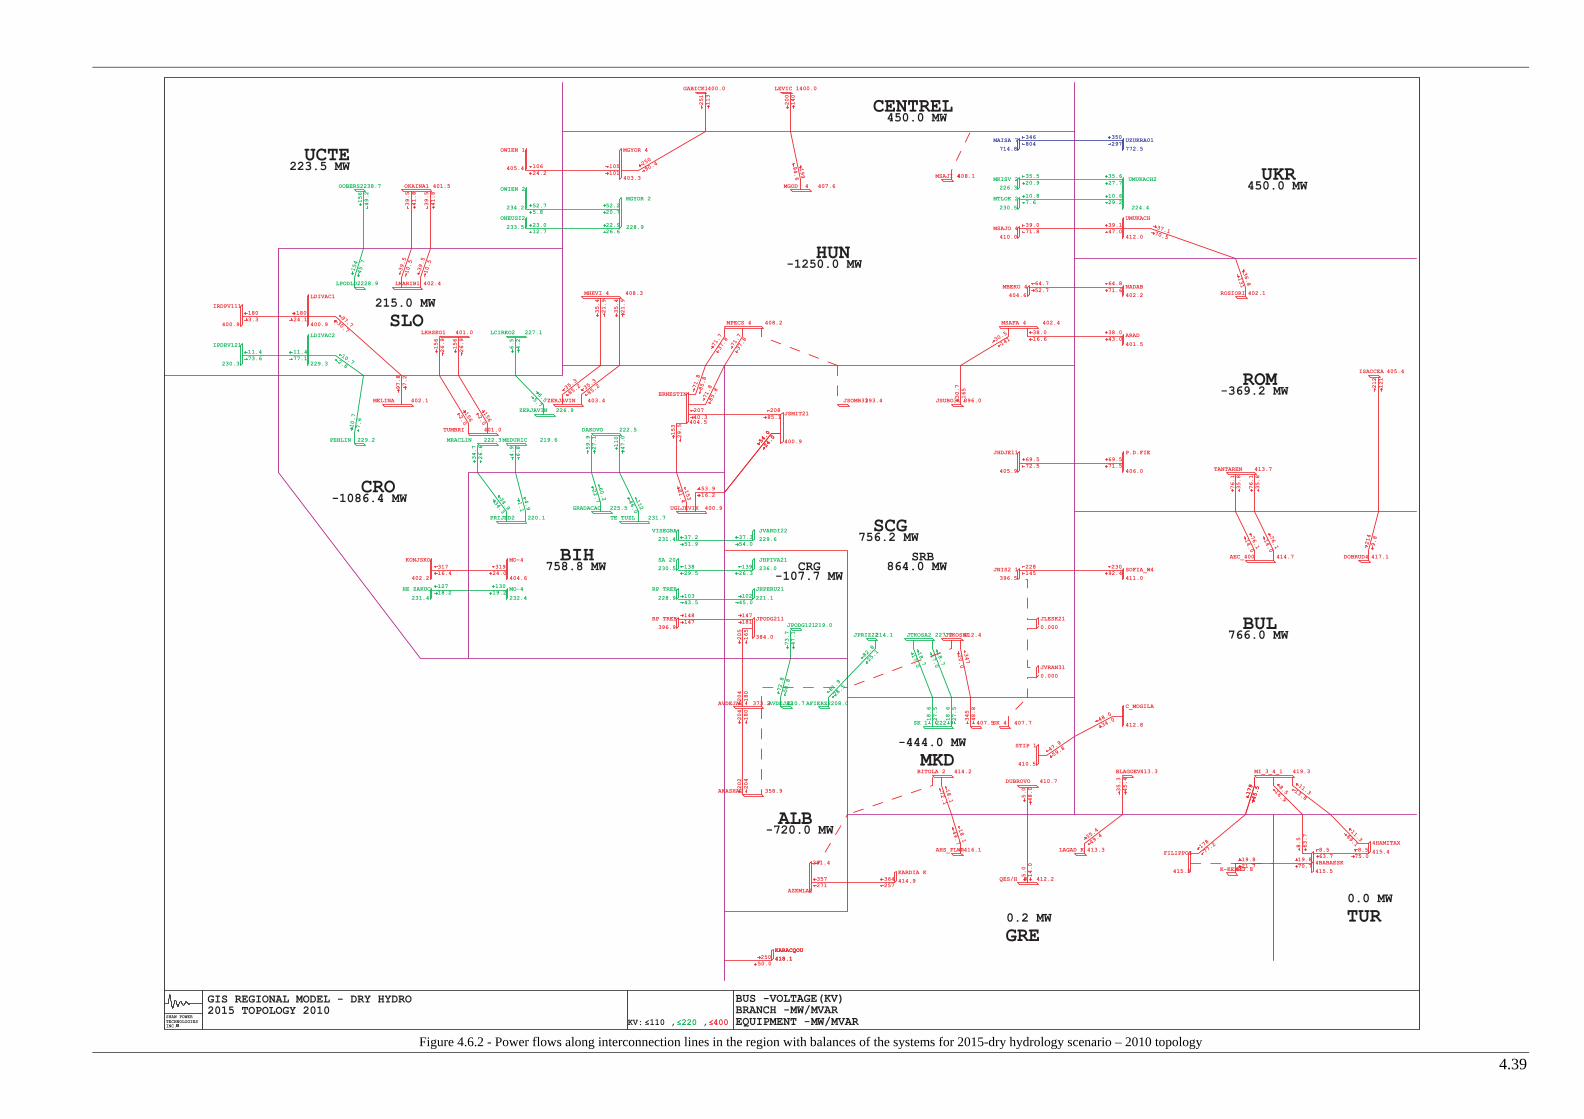
4.39
Figure 4.6.2 - Power flows along interconnection lines in the region with balances of the systems for 2015-dry hydrology scenario – 2010 topology
PEHLIN 229.2
MELINA 402.1
TUMBRI 401.0
MEDURIC 219.6MRACLIN 222.3
DAKOVO 222.5
KONJSKO
402.2
HE ZAKUC
231.4
ZERJAVIN 403.4
ZERJAVIN 226.9
AZEMLA1
381.4
AKASHA1 358.9
AVDEJA2210.7 AFIERZ2208.0
OWIEN 1
405.4
OWIEN 2
234.2
MGYOR 4
403.3
MGYOR 2
228.9
ONEUSI2
233.5
OKAINA1 401.5
LMARIB1 402.4
OOBERS2238.7
IRDPV111
400.9
LDIVAC1
400.9
IPDRV121
230.3
LDIVAC2
229.3
LKRSKO1 401.0
PRIJED2 220.1
GRADACAC 225.5
TE TUZL 231.7
JSMIT21
400.9
VISEGRA
231.4
JVARDI22
229.6
SA 20
230.5
JHPIVA21
236.0
RP TREB
396.9
JHPERU21
221.1
JPODG211
384.0
MO-4
404.6
MHEVI 4 408.3
RP TREB
228.9
JPODG121219.0
JPRIZ22214.1 JTKOSA2 227.0JTKOSB1412.4
407.5
BITOLA 2 414.2
AHS_FLWR416.1
DUBROVO 410.7
QES/H K 412.2
BLAGOEV413.3
STIP 1
410.5
C_MOGILA
412.8
JNIS2 1
396.5
SOFIA_W4
411.0
KARDIA K
414.9
GABICK1400.0
MGOD 4 407.6
LEVIC 1400.0
MSAJO 4
410.0
UMUKACH
412.0
ROSIORI 402.1
MKISV 2
226.3
UMUKACH2
224.4
MTLOK 2
230.5
MSAFA 4 402.4
JSUBO31 396.0
ARAD
401.5
TANTAREN 413.7
AEC_400 414.7
JHDJE11
405.9
LPODLO2228.9
FILIPPOI
415.5
SK 1 222.9
LCIRKO2 227.1
P.D.FIE
406.0
UGLJEVIK 400.9
ISACCEA 405.4
DOBRUD4 417.1
JSOMB31393.4
MPECS 4 408.2
UZUKRA01
772.5
MAISA 7
714.8
NADAB
402.2
MBEKO 4
404.6
SK 4 407.7
JLESK21
0.000
ERNESTIN
404.5
MO-4
232.4
MI_3_4_1 419.3
JVRAN31
0.000
LAGAD K 413.3
KARACQOU
418.1
KARACQOU
418.1
K-KEXRU417.84BABAESK
415.5
4HAMITAX
415.4
MSAJI 4408.1
AVDEJA1 373.2
364257
357271
205
165
81.9
28.57
2.8
50.8
52.75.8
10624.2
153
81.4
54.0
24.0
53.916.2
212
121
214
9.837.3
54.0
13829.5
13926.3
10343.5
10245.0
148147
147181
37.251.9
73.7
47.1
82.8
25.1
18.6
27.5
18.7
17.0
18.6
27.5
18.7
17.0
345
48.8
18.1
72.1
5.0
48.0
5.0
14.0
69.571.5
69.572.5
76.1
35.8
76.1
14.0
76.1
35.8
228145
23092.4
35.520.9
35.627.7
39.071.8
39.147.0
37.170.5
38.016.6
38.043.0
30.7
165
30.5
141
36.8
131
31924.0
34.9
34.3
4.9
1.1
60.2
22.7 112
46.0
20885.1
156
26.9
156
26.9
35.4
21.9
35.4
21.9
97.730.7
10.72.6
154
45.7
156
49.2
199
94.6
200
140
251
113
250
90.4
18.1
49.7
54.0
24.0
10.629.2
10.87.6
18024.1
1803.3
11.477.1
11.473.6
39.5
41.8
39.5
10.5
39.5
10.5
39.5
41.8
346804
350297
64.752.7
64.871.6
76.1
14.0
47.9
59.8
48.0
34.0
35.3
45.4
23.012.7
22.926.6
52.220.7
105101
153
29.5
20740.3
71.8
85.8
71.8
85.8
71.7
37.8 71.7
37.8
12718.2
34.7
26.6
4.9
6.8 59.9
27.1
110
47.0
1562.0
1562.0
6.5
4.2
6.55.7
35.3
85.2 35
.3
85.29
7.8
7.2
10.7
7.6
31716.4
13019.2
179
45.5
35.4
49.4
178
77.2
19.821.7
8.516.9
179
45.5
11.313.8
8.5
63.7
11.389.1
19.870.7
25050.0
8.563.7
8.575.0
347
20.0
204
180
204
180
202
204
ROM
BUL
HUN
UKRUCTE
CENTREL
CRO
BIH
SCG
ALB
GRE
MKD
TUR
SLO
CRGSRB
756.2 MW
-107.7 MW864.0 MW
-444.0 MW
766.0 MW
-720.0 MW
758.8 MW
223.5 MW
-1086.4 MW
-1250.0 MW
0.2 MW
450.0 MW
-369.2 MW
215.0 MW
0.0 MW
450.0 MW
SHAW POWERTECHNOLOGIESINC.R KV: 110 , 220 , 400
BUS -VOLTAGE(KV)
EQUIPMENT -MW/MVARBRANCH -MW/MVAR
GIS REGIONAL MODEL - DRY HYDRO2015 TOPOLOGY 2010
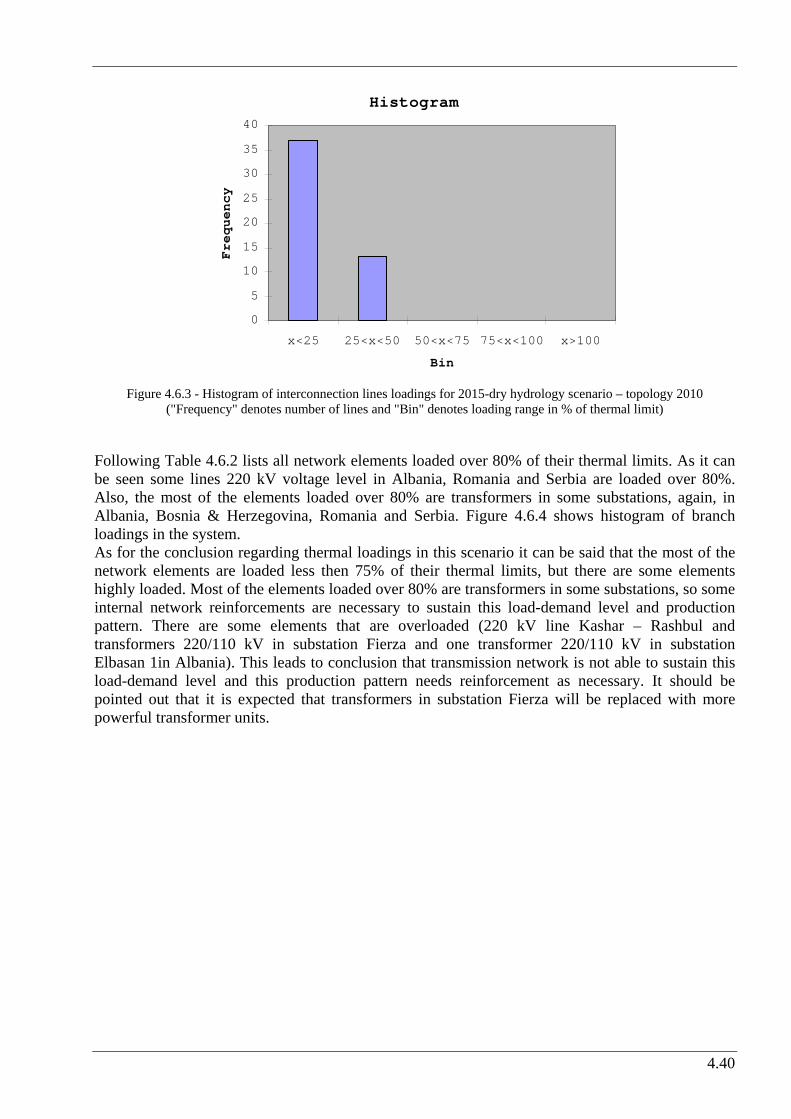
4.40
Histogram
0
5
10
15
20
25
30
35
40
x<25 25<x<50 50<x<75 75<x<100 x>100
Bin
Fr
eq
ue
nc
y
Figure 4.6.3 - Histogram of interconnection lines loadings for 2015-dry hydrology scenario – topology 2010
("Frequency" denotes number of lines and "Bin" denotes loading range in % of thermal limit) Following Table 4.6.2 lists all network elements loaded over 80% of their thermal limits. As it can be seen some lines 220 kV voltage level in Albania, Romania and Serbia are loaded over 80%. Also, the most of the elements loaded over 80% are transformers in some substations, again, in Albania, Bosnia & Herzegovina, Romania and Serbia. Figure 4.6.4 shows histogram of branch loadings in the system. As for the conclusion regarding thermal loadings in this scenario it can be said that the most of the network elements are loaded less then 75% of their thermal limits, but there are some elements highly loaded. Most of the elements loaded over 80% are transformers in some substations, so some internal network reinforcements are necessary to sustain this load-demand level and production pattern. There are some elements that are overloaded (220 kV line Kashar – Rashbul and transformers 220/110 kV in substation Fierza and one transformer 220/110 kV in substation Elbasan 1in Albania). This leads to conclusion that transmission network is not able to sustain this load-demand level and this production pattern needs reinforcement as necessary. It should be pointed out that it is expected that transformers in substation Fierza will be replaced with more powerful transformer units.

4.41
Table 4.6.2 - Network elements loaded over 80% of their thermal limits for 2015-dry hydrology scenario – 2010 topology
BRANCH LOADINGS ABOVE 80.0 % OF RATING:
AREA ELEMENT LOADINGMVA
RATINGMVA PERCENT
Lines ALB HL 220kV AKASHA2-ARRAZH2 1 275.3 270 102 ROM HL 220kV BUC.S-B-FUNDENI 1 261.2 320 81.6 SRB HL 220kV JBGD3 21-JOBREN2 1 293.6 301 97.5
Transformers TR 220/110 kV AELBS1 1 84.7 90 94.1 TR 220/110 kV AELBS1 2 84.7 90 94.1 TR 220/110 kV AELBS1 3 91 90 101.1 TR 220/110 kV AFIER 1 146.8 120 122.3 TR 220/110 kV AFIER 2 120.3 90 133.7 TR 220/110 kV AFIER 3 114.8 90 127.6 TR 220/110 kV AFIERZ 1 59 60 98.3 TR 220/110 kV AFIERZ 2 59 60 98.3 TR 220/110 kV AKASHA 1 90.8 100 90.8 TR 220/110 kV AKASHA 2 90.8 100 90.8 TR 220/110 kV ARRAZH 1 84.7 100 84.7 TR 220/110 kV ARRAZH 2 84.7 100 84.7
ALB
TR 220/110 kV ATIRAN 3 98.2 120 81.9 BIH TR 400/110 kV UGLJEV 1 242.4 300 80.8
TR 220/110 kV FUNDE2 1 199.9 200 99.9 TR 220/110 kV FUNDEN 1 168.5 200 84.2 ROM TR 400/220 kV IERNUT 1 325.2 400 81.3 TR 220/110 kV JBGD3 1 171.1 200 85.6 TR 220/110 kV JBGD3 2 129.8 150 86.5 TR 220/110 kV JPRIS4 1 121.6 150 81.1 TR 220/110 kV JPRIS4 2 121.6 150 81.1 TR 220/110 kV JTKOSA 2 133.3 150 88.9 TR 220/110 kV JTKOSA 3 135.7 150 90.5 TR 400/220 kV JTKOSB 1 323.1 400 80.8 TR 400/220 kV JTKOSB 2 337.6 400 84.4
SRB
TR 400/220 kV JTKOSB 3 337.6 400 84.4
Histogram
0
50
100
150
200
250
300
350
x<25 25<x<50 50<x<75 75<x<100 x>100
Bin
Fr
eq
ue
nc
y
Figure 4.6.4 - Histogram of branch loadings for 2015-dry hydrology scenario – 2010 network topology ("Frequency"
denotes number of lines and "Bin" denotes loading range in % of thermal limit)
4.6.2 Voltage Profile in the Region Figure 4.6.5 shows histogram of voltages in monitored substations. Voltages in almost all monitored substations are found within permitted limits. Only in substations Elbasan and Kashar voltages are below limits (around 359 kV), but this can be resolved with changing of the setting of the tap changing transformers in these substations. Also, as a consequence of high imports, voltages in network of Albania are very near low limits.
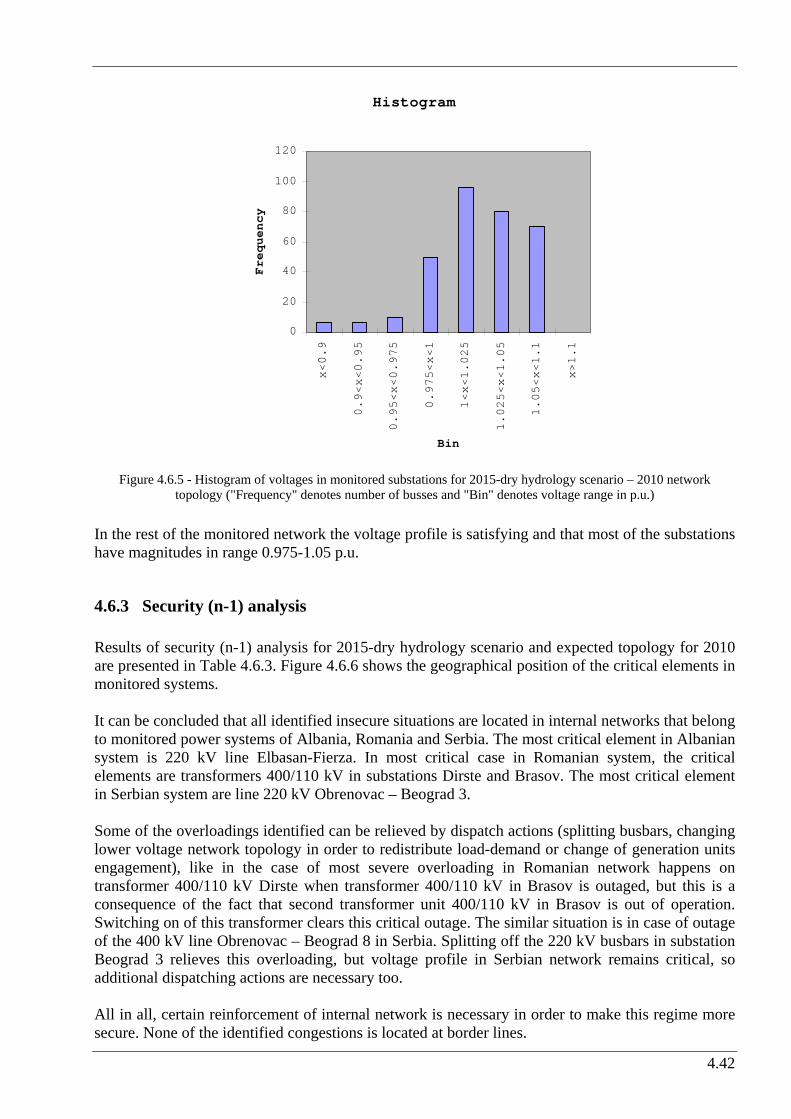
4.42
Histogram
0
20
40
60
80
100
120
x<0.9
0.9<x<0.95
0.95<x<0.975
0.975<x<1
1<x<1.025
1.025<x<1.05
1.05<x<1.1
x>1.1
Bin
Fr
eq
ue
nc
y
Figure 4.6.5 - Histogram of voltages in monitored substations for 2015-dry hydrology scenario – 2010 network
topology ("Frequency" denotes number of busses and "Bin" denotes voltage range in p.u.) In the rest of the monitored network the voltage profile is satisfying and that most of the substations have magnitudes in range 0.975-1.05 p.u.
4.6.3 Security (n-1) analysis Results of security (n-1) analysis for 2015-dry hydrology scenario and expected topology for 2010 are presented in Table 4.6.3. Figure 4.6.6 shows the geographical position of the critical elements in monitored systems. It can be concluded that all identified insecure situations are located in internal networks that belong to monitored power systems of Albania, Romania and Serbia. The most critical element in Albanian system is 220 kV line Elbasan-Fierza. In most critical case in Romanian system, the critical elements are transformers 400/110 kV in substations Dirste and Brasov. The most critical element in Serbian system are line 220 kV Obrenovac – Beograd 3. Some of the overloadings identified can be relieved by dispatch actions (splitting busbars, changing lower voltage network topology in order to redistribute load-demand or change of generation units engagement), like in the case of most severe overloading in Romanian network happens on transformer 400/110 kV Dirste when transformer 400/110 kV in Brasov is outaged, but this is a consequence of the fact that second transformer unit 400/110 kV in Brasov is out of operation. Switching on of this transformer clears this critical outage. The similar situation is in case of outage of the 400 kV line Obrenovac – Beograd 8 in Serbia. Splitting off the 220 kV busbars in substation Beograd 3 relieves this overloading, but voltage profile in Serbian network remains critical, so additional dispatching actions are necessary too. All in all, certain reinforcement of internal network is necessary in order to make this regime more secure. None of the identified congestions is located at border lines.

4.43
Table 4.6.3 - Network overloadings for 2015-dry hydrology scenario, single outages – 2010 network topology
Area contingency Area
overloadings /
out of limits voltages #
limit /
Unom
Flow /
Voltage
rate /
volt.dev.1 2 3 4 5 6 7 8
BASE CASE AL HL 220kV AKASHA2-ARRAZH2 1 270MVA 242.3MVA 102.0%AL OHL 220kV AFIERZ2 -ABURRE2 1 AL HL 220kV AKASHA2-ARRAZH2 1 270MVA 261.1MVA 126.2%AL OHL 220kV ATIRAN2 -AKASHA2 1 AL HL 220kV AKASHA2-ARRAZH2 1 270MVA 254.3MVA 106.6%AL OHL 220kV AELBS12 -AFIER 2 1 AL HL 220kV AKASHA2-ARRAZH2 1 270MVA 361.1MVA 180.3%AL OHL 220kV AFIER 2 -ARRAZH2 1 AL HL 220kV AELBS12-AFIER 2 1 270MVA 194.4MVA 104.8%RO OHL 220kV FUNDENI -BUC.S-B 1 RO HL 220kV BUC.S-B-FUNDENI 1 320MVA 342.8MVA 106.8%CS OHL 220kV JBBAST2 -JBGD3 21 1 CS HL 220kV JBGD3 21-JOBREN2 1 301MVA 327.8MVA 111.5%CS OHL 220kV JBGD172 -JBGD8 22 1 CS HL 220kV JBGD172-JBGD8 22 2 365.8MVA 466.5MVA 133.2%CS OHL 220kV JBGD3 22-JBGD8 21 1 CS HL 220kV JBGD3 21-JOBREN2 1 301MVA 312.8MVA 106.4%CS OHL 220kV JGLOGO2 -JPRIZ22 1 AL HL 220kV AKASHA2-ARRAZH2 1 270MVA 231.3MVA 128.2%CS OHL 220kV JHIP 2 -JPANC22 1 CS HL 220kV JBGD3 21-JOBREN2 1 301MVA 304.5MVA 103.4%CS OHL 220kV JNSAD32 -JOBREN2 1 CS HL 220kV JBGD3 21-JOBREN2 1 301MVA 311.5MVA 105.2%CS OHL 220kV JNSAD32 -JZREN22 1 CS HL 220kV JBGD3 21-JOBREN2 1 301MVA 312.6MVA 106.1%CS OHL 220kV JOBREN2 -JSABA32 1 CS HL 220kV JBGD3 21-JOBREN2 1 301MVA 314.3MVA 106.6%
CS HL 220kV JBGD3 21-JOBREN2 1 301MVA 511.9MVA 184.1%CS OHL 400kV JBGD8 1 -JOBREN11 1 CS HL 220kV JBGD3 22-JBGD8 22 2 365.8MVA 354.7MVA 106.4%
CS OHL 400kV JBGD8 1 -JBGD201 A CS HL 220kV JBGD3 21-JOBREN2 1 301MVA 306.4MVA 103.9%CS OHL 400kV JHDJE11 -JTDRMN1 1 CS HL 220kV JBGD3 21-JOBREN2 1 301MVA 324.4MVA 110.4%CS OHL 400kV JKRAG21 -JTKOLB1 A CS HL 220kV JBGD3 21-JOBREN2 1 301MVA 306.5MVA 103.9%CS OHL 400kV JPANC21 -JTDRMN1 1 CS HL 220kV JBGD3 21-JOBREN2 1 301MVA 314.9MVA 107.7%
CS TR 400/220kV/kV JTKOSB1 1 400MVA 413.9MVA 103.5%CS TR 400/220kV/kV JTKOSB1 2 400MVA 432.5MVA 108.1%CS OHL 400kV JTKOSB1 -JPEC 1 A CS TR 400/220kV/kV JTKOSB1 3 400MVA 432.5MVA 108.1%
RO TR 400/110 BRASOV 1 RO TR 400/110kV/kV DIRSTE 1 250MVA 401MVA 160.4%RO TR 400/110 DIRSTE 1 RO TR 400/110kV/kV BRASOV 1 250MVA 394.4MVA 157.7%CS TR 400/110 JNIS2 1 CS TR 400/110kV/kV JNIS2 1 2 300MVA 363.8MVA 121.3%
AL TR 400/220kV/kV AELBS22 2 300MVA 307.5MVA 102.5%AL TR 400/220 AELBS2 1 AL HL 220kV AKASHA2-ARRAZH2 1 270MVA 259.2MVA 132.1%
RO TR 400/220 BRAZI 1 RO HL 220kV BUC.S-B-FUNDENI 1 320MVA 346.4MVA 109.9%RO TR 400/220 BUC.S 1 RO TR 400/220kV/kV BUC.S 2 400MVA 506.1MVA 126.5%RO TR 400/220 IERNUT 1 RO HL 220kV STEJARU-GHEORGH 1 208.1MVA 191.8MVA 108.6%
CS HL 220kV JBGD3 21-JOBREN2 1 301MVA 342.9MVA 117.8%CS TR 400/220 JBGD8 1 CS HL 220kV JBGD3 22-JBGD8 22 2 365.8MVA 385.9MVA 110.9%
CS TR 400/220 JBGD8 2 CS HL 220kV JBGD3 21-JOBREN2 1 301MVA 320.8MVA 109.4%CS TR 400/220 JNIS2 1 CS TR 400/110kV/kV JNIS2 1 1 300MVA 303.3MVA 101.1%CS TR 400/220 JPANC2 1 CS HL 220kV JBGD3 21-JOBREN2 1 301MVA 300.3MVA 101.8%
CS TR 400/220kV/kV JTKOSB1 2 400MVA 471.5MVA 117.9%CS TR 400/220 JTKOSB 1 CS TR 400/220kV/kV JTKOSB1 3 400MVA 471.5MVA 117.9%
RO TR 400/220 MINTIA 1 RO HL 220kV PESTIS-MINTIA A 1 277.4MVA 324.3MVA 111.1%RO TR 400/220 ROSIORI 1 RO TR 400/220kV/kV IERNUT 1 400MVA 425.1MVA 106.3%
AUT
ALB
BIH
BUL
CRO
GRE
HUN
MKD
MNG
ROM
SRB
SVK
SLO
TUR
400 kV line or 400/x kV transformer220 kV line or 220/x kV transformer
critical elements
Figure 4.6.6 – Geographical position of critical elements for 2015-dry hydrology scenario – topology 2010

4.44
4.7 Scenario 2015 – dry hydrology – topology 2015 This part of the Study presents the results of static load flow and voltage profile analyses that are conducted for complete network topology and (n-1) contingencies in the scenario which is denoted as GTmax run for year 2015 - dry hydrology and expected network topology for 2015.
4.7.1 Lines loadings Figure 4.7.1 shows power exchanges between areas for 2015-dry hydrology scenario. Power flows along interconnection lines in the region together with balances of the systems are shown in Figure 4.7.2. Area totals are shown in Table 4.7.1. Figure 4.7.3 shows histogram of tie lines loadings. It is concluded that most of the tie lines are loaded less than 25% of their thermal limits.
AUT
ALB
BIH
BUL
CRO
GRE
ITA
HUN
MKD
MNG
ROM
SRB
SVK
SLO
TUR
UKR
89
63
199
248
33
94
29
81
52
33 359
86
90
221
291
304
328
145
78
44
450
190
406
18
18
733
241
Figure 4.7.1 - Area exchanges in analyzed electric power systems for 2015-dry hydrology scenario
As it can be seen, new elements that are expected to be build till 2015 cause totally different distribution of power flows in the southern part of the region (Albania, FYR of Macedonia, Serbia and Montenegro). Compared to the expected topology 2010, analyzed in previous chapter, it can be seen that the network losses are decreased as a consequence of building of new elements for 2015 network topology, especially in the cases of Albania, Serbia and Montenegro. Overall reduction of loses is around 40 MW.

4.45
Figure 4.7.2 - Power flows along interconnection lines in the region with balances of the systems for 2015-dry hydrology scenario
PEHLIN 229.3
MELINA 402.3
TUMBRI 401.1
MEDURIC 219.9MRACLIN 222.5
DAKOVO 222.8
KONJSKO
404.1
HE ZAKUC
232.3
ZERJAVIN 403.6
ZERJAVIN 227.0
AZEMLA1
408.2
AKASHA1 393.7
AVDEJA2226.7 AFIERZ2224.6
OWIEN 1
405.4
OWIEN 2
234.2
MGYOR 4
403.3
MGYOR 2
229.0
ONEUSI2
233.5
OKAINA1 401.6
LMARIB1 402.5
OOBERS2238.7
IRDPV111
401.0
LDIVAC1
401.0
IPDRV121
230.3
LDIVAC2
229.4
LKRSKO1 401.1
PRIJED2 220.5
GRADACAC 225.8
TE TUZL 232.1
JSMIT21
401.7
VISEGRA
232.6
JVARDI22
231.1
SA 20
232.1
JHPIVA21
238.3
RP TREB
407.8
JHPERU21
229.7
JPODG211
402.7
MO-4
408.1
MHEVI 4 408.4
RP TREB
233.6
JPODG121229.3
JPRIZ22224.5 JTKOSA2 232.1JTKOSB1419.1
410.6
BITOLA 2 414.4
AHS_FLWR417.3
DUBROVO 412.0
QES/H K 413.6
BLAGOEV414.5
STIP 1
411.9
C_MOGILA
414.0
JNIS2 1
403.5
SOFIA_W4
412.5
KARDIA K
417.8
GABICK1400.0
MGOD 4 407.7
LEVIC 1400.0
MSAJO 4
410.0
UMUKACH
412.0
ROSIORI 402.4
MKISV 2
226.3
UMUKACH2
224.4
MTLOK 2
230.5
MSAFA 4 402.7
JSUBO31 396.4
ARAD
402.0
TANTAREN 414.3
AEC_400 415.4
JHDJE11
407.7
LPODLO2228.9
FILIPPOI
415.8
SK 1 226.2
LCIRKO2 227.2
P.D.FIE
407.8
UGLJEVIK 401.8
ISACCEA 405.7
DOBRUD4 417.4
JSOMB31393.8
MPECS 4 408.4
UZUKRA01
772.5
MAISA 7
714.8
NADAB
402.6
MBEKO 4
404.9
SK 4 410.0
JLESK21
405.0
ERNESTIN
404.9
MO-4
234.1
MI_3_4_1 419.5
JVRAN31
407.4
LAGAD K 414.4
KARACQOU
419.6
KARACQOU
419.6
K-KEXRU417.94BABAESK
415.6
4HAMITAX
415.4
MSAJI 4408.1
AVDEJA1 402.0
86.643.8
86.1114
9.2
0.1
15.5
1.12
4.2
21.2
54.05.6
11224.7
162
76.5
32.8
25.0
32.715.6
205
122
206
9.930.5
47.2
13535.7
13631.7
86.414.2
85.719.1
10442.5
10486.1
30.544.9
24.3
12.1
15.6
8.3
28.0
37.4
28.3
27.1
28.0
37.4
28.3
27.1
372
93.9
230
84.4 6
0.5
42.2
60.5
19.4
77.654.8
77.655.8
61.0
38.2
61.0
12.0
61.0
38.2
22096.1
22138.3
35.520.9
35.627.7
31.872.5
31.946.5
44.366.7
27.619.3
27.640.6
29.4
162
29.2
138
44.0
128
3337.2
39.0
33.4
7.1
0.7
62.2
22.8 114
46.2
19980.8
156
28.1
156
28.1
29.6
22.0
29.6
22.0
10532.9
12.63.1
153
45.6
155
48.9
199
95.0
200
141
251
113
250
90.8
231
65.8
32.8
25.0
10.629.2
10.87.6
18321.4
1820.7
12.276.3
12.272.8
37.0
41.9
37.0
10.7
37.0
10.7
37.0
41.9
346804
350297
53.249.4
53.368.5
61.0
12.0
124
3.2
79.8
39.8
79.8
61.1
90.0
54.7
90.2
38.1
36.1
45.0
24.112.5
23.926.3
53.420.3
112100
161
24.8
19835.1
76.8
83.2
76.8
83.2
76.7
35.1 76.7
35.1
13114.5
38.7
25.7
7.1
7.3 61.8
27.1
112
46.9
1563.2
1563.2
6.2
4.6
6.25.3
29.5
85.3 29
.5
85.3
105
9.5
12.6
7.1
33032.3
13315.1
182
46.2
36.1
50.3
26.5
58.8
26.6
20.2
124
48.3
181
76.3
17.822.1
7.615.8
182
46.2
10.212.6
7.6
64.8
10.290.5
17.771.1
25050.0
7.664.8
7.676.1
242
51.3
241
90.9
374
67.8
343
109342127
9.2
29.1
143
101
143
139
143
100
143
139
ROM
BUL
HUN
UKRUCTE
CENTREL
CRO
BIH
SCG
ALB
GRE
MKD
TUR
SLO
CRGSRB
756.0 MW
-108.0 MW864.0 MW
-444.0 MW
766.0 MW
-720.0 MW
759.0 MW
222.8 MW
-1085.9 MW
-1250.0 MW
-0.1 MW
450.0 MW
-368.9 MW
215.0 MW
0.0 MW
450.0 MW
SHAW POWERTECHNOLOGIESINC.R KV: 110 , 220 , 400
BUS -VOLTAGE(KV)
EQUIPMENT -MW/MVARBRANCH -MW/MVAR
GIS REGIONAL MODEL - DRY HYDRO2015 TOPOLOGY 2015

4.46
Table 4.7.1 - Area totals in analyzed electric power systems for 2015-dry hydrology scenario AREA GENERATION LOAD LOSSES INTERCHANGE
ALBANIA 893.6 1542 71.6 -720 BULGARIA 7363.9 6450 147.8 766
BIH 3141.2 2305 77.1 759 CROATIA 2637.7 3665 58.7 -1085.9
MACEDONIA 985.2 1409 20.2 -444 ROMANIA 7722.9 7798.4 293.5 -368.9
SERBIA 8396.3 7308 224.3 864 MONTENEGRO 586.3 678 16.4 -108
TOTALS 31727.1 31155.4 909.6 -337.8
Histogram
0
5
10
15
20
25
30
35
40
45
x<25 25<x<50 50<x<75 75<x<100 x>100
Bin
Fr
eq
ue
nc
y
Figure 4.7.3 - Histogram of interconnection lines loadings for 2015-dry hydrology scenario ("Frequency" denotes
number of lines and "Bin" denotes loading range in % of thermal limit) Following Table 4.7.2 lists all network elements loaded over 80% of their thermal limits. Figure 4.7.4 shows histogram of branch loadings in the system.
Table 4.7.2 - Network elements loaded over 80% of their thermal limits for 2015-dry hydrology scenario BRANCH LOADINGS ABOVE 80.0 % OF RATING:
AREA ELEMENT LOADINGMVA
RATINGMVA PERCENT
Lines ALB HL 220kV AKASHA2-ARRAZH2 1 242.7 270 89.9 ROM HL 220kV BUC.S-B-FUNDENI 1 260.6 320 81.4 SRB HL 220kV JBGD3 21-JOBREN2 1 294.6 301 97.9
Transformers TR 220/110 kV AELBS1 1 75.4 90 83.8 TR 220/110 kV AELBS1 2 75.4 90 83.8 TR 220/110 kV AELBS1 3 81 90 90 TR 220/110 kV AFIER 1 136.9 120 114.1 TR 220/110 kV AFIER 2 112.2 90 124.7 TR 220/110 kV AFIER 3 107.1 90 119 TR 220/110 kV AFIERZ 1 52.1 60 86.9 TR 220/110 kV AFIERZ 2 52.1 60 86.9 TR 220/110 kV AKASHA 1 83.5 100 83.5
ALB
TR 220/110 kV AKASHA 2 83.5 100 83.5 BIH TR 400/110 kV UGLJEV 1 240.7 300 80.2
TR 220/110 kV FUNDE2 1 199.6 200 99.8 TR 220/110 kV FUNDEN 1 168.2 200 84.1 ROM TR 400/220 kV IERNUT 1 324.2 400 81.1 TR 220/110 kV JBGD3 1 170.9 200 85.5 SRB TR 220/110 kV JBGD3 2 130 150 86.6

4.47
Histogram
0
50
100
150
200
250
300
350
x<25 25<x<50 50<x<75 75<x<100 x>100
Bin
Fr
eq
ue
nc
y
Figure 4.7.4 - Histogram of branch loadings for 2015-dry hydrology scenario ("Frequency" denotes number of lines and
"Bin" denotes loading range in % of thermal limit) As it can be seen from these outputs, most of the network elements are loaded less then 75% of their thermal limits and most of the elements loaded over 80% are transformers in some substations, so some internal network reinforcements are necessary to sustain this load-demand level and production pattern. There are some elements that are overloaded (transformers 220/110 kV in substation Fierza in Albania). This leads to conclusion that transmission network is not able to sustain this load-demand level and this production pattern needs reinforcement as necessary. It should be pointed out that it is expected that transformers in substation Fierza will be replaced with more powerful transformer units. Also, planned network reinforcements compared to network topology 2010, reduce loading of some elements in southern part of Serbia.
4.7.2 Voltage Profile in the Region Figure 4.7.5 shows histogram of voltages in monitored substations. Voltages in all monitored substations are found within permitted limits. It is concluded that voltage profile is satisfying and that most of the substations have magnitudes in range 1-1.05 p.u. Compared to the 2010 topology, voltage profile is somewhat better, especially in southern and central part of Serbia, as well as in Albania.

4.48
Histogram
0
10
20
30
40
50
60
70
80
90
100
x<0.9
0.9<x<0.95
0.95<x<0.975
0.975<x<1
1<x<1.025
1.025<x<1.05
1.05<x<1.1
x>1.1
Bin
Fr
eq
ue
nc
y
Figure 4.7.5 - Histogram of voltages in monitored substations for 2015-dry hydrology scenario ("Frequency" denotes
number of busses and "Bin" denotes voltage range in p.u.)
4.7.3 Security (n-1) analysis Results of security (n-1) analysis for 2015-dry hydrology scenario are presented in Table 4.7.3. Figure 4.7.6 shows the geographical position of the critical elements in monitored systems. Like for expected topology 2010 (previous chapter), it can be concluded that all identified insecure situations are located in internal networks that belong to monitored power systems of Albania, Romania and Serbia. Also, the planned network reinforcements till 2015 resolve some of the noticed critical contingencies, especially in southern part of Serbia. The rest of the conclusions are the same as in case of the analyzed topology 2010, and that is that certain level of network reinforcement is necessary to make this regime more secure.

4.49
AUT
ALB
BIH
BUL
CRO
GRE
HUN
MKD
MNG
ROM
SRB
SVK
SLO
TUR
400 kV line or 400/x kV transformer220 kV line or 220/x kV transformer
critical elements
Figure 4.7.6 – Geographical position of critical elements for 2015-dry hydrology scenario

4.50
Table 4.7.3 - Network overloadings for 2015-dry hydrology scenario, single outages
Area contingency Area
overloadings /
out of limits voltages #
limit /
Unom
Flow /
Voltage
rate /
volt.dev.1 2 3 4 5 6 7 8
AL OHL 220kV AELBS12 -AFIER 2 1 AL HL 220kV AKASHA2-ARRAZH2 1 270MVA 376.7MVA 151.9%RO OHL 220kV FUNDENI -BUC.S-B 1 RO HL 220kV BUC.S-B-FUNDENI 1 320MVA 342.5MVA 106.6%RO OHL 220kV STEJARU -GHEORGH 1 RO TR 400/220kV/kV IERNUT 1 400MVA 406.2MVA 101.5%RO OHL 400kV DOMNESTI-BRAZI 1 RO HL 220kV BUC.S-B-FUNDENI 1 320MVA 330.3MVA 102.0%CS OHL 220kV JBBAST2 -JBGD3 21 1 CS HL 220kV JBGD3 21-JOBREN2 1 301MVA 331MVA 112.3%CS OHL 220kV JBGD172 -JBGD8 22 1 CS HL 220kV JBGD172-JBGD8 22 2 365.8MVA 467.1MVA 133.0%CS OHL 220kV JBGD3 22-JBGD8 21 1 CS HL 220kV JBGD3 21-JOBREN2 1 301MVA 314MVA 106.6%CS OHL 220kV JHIP 2 -JPANC22 1 CS HL 220kV JBGD3 21-JOBREN2 1 301MVA 305.8MVA 103.6%CS OHL 220kV JNSAD32 -JOBREN2 1 CS HL 220kV JBGD3 21-JOBREN2 1 301MVA 313.5MVA 105.6%CS OHL 220kV JNSAD32 -JZREN22 1 CS HL 220kV JBGD3 21-JOBREN2 1 301MVA 314.5MVA 106.5%CS OHL 220kV JOBREN2 -JVALJ32 1 CS HL 220kV JBGD3 21-JOBREN2 1 301MVA 301.6MVA 101.5%
CS HL 220kV JBGD3 21-JOBREN2 1 301MVA 514.9MVA 184.3%CS OHL 400kV JBGD8 1 -JOBREN11 1 CS HL 220kV JBGD3 22-JBGD8 22 2 365.8MVA 359.3MVA 107.2%
CS OHL 400kV JBGD8 1 -JBGD201 A CS HL 220kV JBGD3 21-JOBREN2 1 301MVA 308.3MVA 104.2%CS OHL 400kV JHDJE11 -JTDRMN1 1 CS HL 220kV JBGD3 21-JOBREN2 1 301MVA 324.2MVA 110.1%CS OHL 400kV JKRAG21 -JTKOLB1 A CS HL 220kV JBGD3 21-JOBREN2 1 301MVA 307.8MVA 104.0%CS OHL 400kV JPANC21 -JTDRMN1 1 CS HL 220kV JBGD3 21-JOBREN2 1 301MVA 316MVA 107.8%AL TR 400/110 AZEMLA 1 AL HL 220kV AKASHA2-ARRAZH2 1 270MVA 263.6MVA 108.6%RO TR 400/110 BRASOV 1 RO TR 400/110kV/kV DIRSTE 1 250MVA 401.1MVA 160.4%RO TR 400/110 DIRSTE 1 RO TR 400/110kV/kV BRASOV 1 250MVA 394.7MVA 157.9%RO TR 400/220 BRAZI 1 RO HL 220kV BUC.S-B-FUNDENI 1 320MVA 346.3MVA 109.8%RO TR 400/220 BUC.S 1 RO TR 400/220kV/kV BUC.S 2 400MVA 506MVA 126.5%RO TR 400/220 IERNUT 1 RO HL 220kV STEJARU-GHEORGH 1 208.1MVA 190.9MVA 107.9%
CS HL 220kV JBGD3 21-JOBREN2 1 301MVA 344.1MVA 117.9%CS TR 400/220 JBGD8 1 CS HL 220kV JBGD3 22-JBGD8 22 2 365.8MVA 388.2MVA 111.3%
CS TR 400/220 JBGD8 2 CS HL 220kV JBGD3 21-JOBREN2 1 301MVA 322MVA 109.5%CS TR 400/220 JPANC2 1 CS HL 220kV JBGD3 21-JOBREN2 1 301MVA 301.9MVA 102.0%RO TR 400/220 MINTIA 1 RO HL 220kV PESTIS-MINTIA A 1 277.4MVA 325.2MVA 111.3%RO TR 400/220 ROSIORI 1 RO TR 400/220kV/kV IERNUT 1 400MVA 425.1MVA 106.3%
4.7.4 Summary of Impacts - 2015 topology versus 2010 topology Compared to the expected topology 2010, analyzed in previous chapter, it can be seen that the network losses are reduced as a consequence of building of new elements for 2015 network topology, especially in the cases of Albania, Serbia and Montenegro. Overall reduction of losses is around 40 MW. Also, planned network reinforcements compared to network topology 2010, reduce load of some elements in southern part of Serbia. Compared to the 2010 topology, voltage profile is somewhat better, especially in southern and central part of Serbia, as well as in Albania. Realization of the planed investments till 2015 has impact on secure operation of the network. Some of the insecure states identified with 2010 topology are relieved and do not exist with expected 2015 network topology. Also, levels of overloadings due to outages are decreased. All in all overall network performance is better, especially in the region where new planed investments are to be realized (Albania, southern Serbia and Montenegro).

4.51
4.8 Scenario 2015 – wet hydrology – 2010 topology This part of the Study presents results of static load flow and voltage profile analyses that are conducted for complete network topology and (n-1) contingencies in the scenario which is denoted as Scenario 2015 wet hydrology and expected network topology for 2010.
4.8.1 Line loadings Area totals and power exchanges for the 2015-base case-wet hydrology-topology 2010 scenario are shown in Figure 4.8.1 and Table 4.8.1. Power flows along regional interconnection lines and system balances are shown in Figure 4.8.2. Power flows along interconnection lines are also given in Table 4.8.2, while Figure 4.8.3 shows histogram of tie lines loadings.
AUT
ALB
BIH
BUL
CRO
GRE
ITA
HUN
MKD
MNT
ROM
SRB
SVK
SLO
TUR
UKR
261
320
256
269
54
15
86
99
265
8931
370
109
280
109
368
366
201
133
11
450
169
461
1
2 50
38 1
0 1
Figure 4.8.1 - Area exchanges in analyzed electric power systems for 2015-base case-wet hydrology-2010 topology scenario

4.52
Table 4.8.1 - Area totals in analyzed electric power systems for 2015-base case-wet hydrology-topology 2010 scenario
Country Generation (MW)
Load (MW)
Bus Shunt (Mvar)
Line Shunt (Mvar)
Losses (MW)
Net Interchange (MW)
Albania 1124.5 1528.9 0 0 85.8 -490.1 Bulgaria 7553.2 6446.1 0 14.7 137.4 955.0 Bosnia and Herzegovina 2154.2 2278.6 0 0 74.8 -199.3 Croatia 2799.9 3660.4 0 0 60.9 -921.3 Macedonia 869.5 1407.6 0 0 18.9 -557.0 Romania 7953.9 7704.0 0 74.3 298.9 -123.3 Serbia and UNMIK 8413.1 7209.2 0 12.7 278.4 912.7 Montenegro 778.7 669.8 0.5 1.7 21.6 85.0 TOTAL - SE EUROPE 31646.9 30904.6 0.5 103.4 976.6 -338.3 Figure 4.8.3 shows that the tie lines in the region are mostly loaded less than 25% of their thermal limits for the analyzed hydrological base case scenario in year 2015, examined on network topology in 2010. Among total number of forty nine 400 kV and 220 kV interconnection lines in the region only eight are loaded between 25% and 50% of their thermal ratings. Only one line (OHL 400 kV Sarajevo 20 – Piva between Bosnia and Herzegovina and Montenegro) is loaded more than 50% of its thermal rating. Table 4.8.3 lists all network elements, observing only lines 400 kV and 220 kV and transformers 400/x kV and 220/x kV, that are loaded over 80% of their thermal limits. Most of the elements loaded over 80% are transformers in some substations and internal 110 kV and 220 kV lines. Thus, certain internal network reinforcements are necessary to sustain given load-demand level and generation pattern. All three 220/110 kV transformers in the Fierze substation in Albania are overloaded in this scenario. There are eight 220/110 kV transformers in Albania which are highly loaded. Line 220 kV from Tirana to Rashbull is loaded near its limit. There are fourteen 110 kV lines in Albania loaded over 80% of their thermal rating and five of them are overloaded (the largest overloading is noticed for the 110 kV line Fierze-F.arrez). Power systems of Bulgaria and Bosnia and Herzegovina have several highly loaded branches in the 110 kV networks. Highly loaded high voltage branches are 220 kV line M.East-St.Zagora in Bulgaria and transformer 400/110 kV in TPP Ugljevik in Bosnia and Herzegovina. Line 110 kV Orasje-Zupanja between Croatia and Bosnia and Herzegovina is overloaded too (135 % Ithermal). There are ten 220 kV and four 110 kV internal lines in Romania which are loaded over 80% of their thermal limits, whereas four of them are overloaded. These lines are related to the Lotru, Sibiu, Tg.Jiu and Parosen nodes. Transformer 400/220 kV in the Urechesti substation is slightly overloaded in this scenario. Three 220 kV lines and nineteen 110 kV lines in the Serbian power system are highly loaded or overloaded when all branches are available in the analyzed scenario. Highly loaded 220 kV lines are connected to the Obrenovac substation, while 110 kV lines are located mostly in the areas of Belgrade, Bor, Kragujevac, Sombor and Novi Sad. One 220 kV line and nine 110 kV lines are overloaded, ranging between 104% Ithermal and 129% Ithermal.

4.53
Figure 4.8.2 - Power flows along interconnection lines in the region for 2015 - base case - wet hydrology scenario – topology 2010
PEHLIN 229.9
MELINA 403.0
TUMBRI 401.4
MEDURIC 219.6MRACLIN 222.9
DAKOVO 218.6
KONJSKO
403.8
HE ZAKUC
234.0
ZERJAVIN 403.8
ZERJAVIN 227.3
AZEMLA1
386.0
AKASHA1 366.9
AVDEJA2215.4AFIERZ2217.7
OWIEN 1
405.4
OWIEN 2
234.2
MGYOR 4
403.3
MGYOR 2
228.9
ONEUSI2
233.5
OKAINA1401.7
LMARIB1402.6
OOBERS2238.7
IRDPV111
401.0
LDIVAC1
401.3
IPDRV121
230.5
LDIVAC2
229.5
LKRSKO1 401.3
PRIJED2 219.5
GRADACAC 221.0
TE TUZL 226.4
JSMIT21
396.2
VISEGRA227.6
JVARDI22225.8
SA 20226.4
JHPIVA21232.9
RP TREB394.6
JHPERU21
224.0
JPODG211
385.2
MO-4
401.4
MHEVI 4 408.4
RP TREB
228.9
JPODG121221.7
JPRIZ22215.1 JTKOSA2221.8JTKOSB1400.0
401.1
BITOLA 2 412.5
AHS_FLWR415.4
DUBROVO 408.0
QES/H K 411.6
BLAGOEV411.6
STIP 1
407.9
C_MOGILA
410.7
JNIS2 1388.0
SOFIA_W4408.6
KARDIA K415.0
GABICK1400.0
MGOD 4 407.3
LEVIC 1400.0
MSAJO 4410.0
UMUKACH
412.0
ROSIORI 399.8
MKISV 2226.3
UMUKACH2
224.4
MTLOK 2
230.5
MSAFA 4 398.4
JSUBO31 391.4
ARAD
394.4
TANTAREN 409.3
AEC_400 412.6
JHDJE11
397.4
LPODLO2229.0
FILIPPOI
415.3
SK 1 219.0
LCIRKO2 227.4
P.D.FIE
397.6
UGLJEVIK 395.7
ISACCEA 402.9
DOBRUD4 415.8
JSOMB31388.7
MPECS 4 406.7
UZUKRA01772.5
MAISA 7713.9
NADAB396.6
MBEKO 4400.5
SK 4 402.6
JLESK21375.6
ERNESTIN
401.3
MO-4
231.5
MI_3_4_1 419.1
JVRAN310.000
LAGAD K 412.7
KARACQOU418.1KARACQOU418.1
K-KEXRU417.84BABAESK415.5
4HAMITAX
415.3
MSAJI 4408.1
AVDEJA1 379.3
373212
367232
84.0
87.7
31.4
20.34
.9
51.1
50.76.3
97.823.2
63.7
97.5
234
27.8
2333.0
211
127
212
2.286.9
64.9
21819.6
22134.2
18.932.5
18.740.0
75.8116
76.1154
86.564.2
5.1
43.6
31.5
28.2
17.8
19.2
17.9
8.9
17.8
19.2
17.9
8.9
332
30.0
49.8
104
30.8
66.0
30.9
5.0
13346.1
13347.0
77.2
76.6
77.4
28.0
77.2
76.6
278191
281152
35.520.6
35.727.4
87.067.0
87.249.9
10.9100
23.217.9
23.275.7
86.1
180
85.8
158
11.4
159
23871.8
34.0
44.9
10.4
6.6
47.7
16.5 95.1
36.9
257105
165
30.5
165
30.5
52.9
26.2
52.9
26.2
10340.7
20.45.9
156
44.1
158
48.0
199
89.9
200
136
251
112
250
89.7
49.9
82.0
234
27.8
10.729.1
10.87.5
17813.2
1777.7
15.173.3
15.169.8
44.7
43.7
44.7
12.5
44.7
12.5
44.7
43.7
346807
350292
75.286.0
75.4104
77.4
28.0
108
57.7
109
32.4
3.7
57.1
21.313.2
21.227.1
50.221.4
97.7102
63.5
43.1
25567.3
45.5
107
45.5
107
45.3
59.5 45.3
59.5
54.518.8
33.6
37.5
10.4
1.3 47.5
21.2
93.9
39.7
1655.8
1655.8
13.4
7.0
13.42.8
52.8
80.6 5
2.8
80.61
03
17.3
20.4
4.2
23721.7
55.130.1
205
46.2
3.7
37.5
204
73.1
0.823.3
0.019.0
205
46.2
0.716.3
0.0
61.5 0.886.7
0.772.3
25050.0
0.061.5
0.172.9
333
57.1
83.7
111
92.2
163
91.5
195
ROM
BUL
HUN
UKRUCTE
CENTREL
CRO
BIH
SCG
ALB
GRE
MKD
TUR
SLO
CRGSRB
997.8 MW
85.0 MW912.7 MW
-557.0 MW
955.0 MW
-490.1 MW
-199.3 MW
223.3 MW
-921.3 MW
-1250.0 MW
0.0 MW
450.0 MW
-123.4 MW
215.0 MW
0.0 MW
450.0 MW
SHAW POWERTECHNOLOGIESINC.R KV: 110 , 220 , 400
BUS -VOLTAGE(KV)
EQUIPMENT -MW/MVARBRANCH -MW/MVAR
GIS REGIONAL MODEL - WET HYDRO2015 TOPOLOGY 2010

4.54
Table 4.8.2 - Power flows along regional interconnection lines for 2015 - base case-wet hydrology scenario-topology 2010
Power Flow Interconnection line
MW
Mvar
% of thermal rating
OHL 400 kV Zemlak (ALB) Kardia (GRE) -367.1 -231.6 33 OHL 220 kV Fierze (ALB) Prizren (SER) -31.4 20.3 14 OHL 220 kV V.Dejes (ALB) Podgorica (MON) -4.9 -51.1 19 OHL 400 kV V.Dejes (ALB) Podgorica (MON) -83.7 -111.5 11 OHL 400 kV Ugljevik (B&H) Ernestinovo (CRO) 63.7 -97.5 9 OHL 400 kV Mostar (B&H) Konjsko (CRO) 237.9 -71.8 19 OHL 400 kV Ugljevik (B&H) S. Mitrovica (SER) -232.7 -3.0 18 OHL 400 kV Trebinje (B&H) Podgorica (MON) -75.8 115.9 13 OHL 220 kV Trebinje (B&H) Plat (CRO) -104.8 40.5 37 OHL 220 kV Prijedor (B&H) Mraclin (CRO) 34.0 -44.9 18 OHL 220 kV Prijedor (B&H) Medjuric (CRO) 10.4 -6.6 4 OHL 220 kV Gradacac (B&H) Djakovo (CRO) 47.7 16.5 18 OHL 220 kV Tuzla (B&H) Djakovo (CRO) 95.1 36.9 35 OHL 220 kV Mostar (B&H) Zakucac (CRO) 55.1 -30.1 18 OHL 220 kV Visegrad (B&H) Vardiste (SER) -86.5 64.2 35 OHL 220 kV Sarajevo 20 (B&H) Piva (MON) -217.9 -19.6 58 OHL 220 kV Trebinje (B&H) Perucica (MON) 18.9 32.5 14 OHL 400 kV Blagoevgrad (BUL) Thessaloniki (GRE) -3.7 -57.1 8 OHL 400 kV M.East 3 (BUL) Filippi (GRE) 205.4 -46.2 30 OHL 400 kV M.East 3 (BUL) Babaeski (TUR) 0.0 -19.0 5 OHL 400 kV M.East 3 (BUL) Hamitabat (TUR) -0.7 -16.3 5 OHL 400 kV C.Mogila (BUL) Stip (MCD) 108.7 -32.4 16 OHL 400 kV Dobrudja (BUL) Isaccea (ROM) 212.0 -2.2 15 OHL 2x400 kV ckt.1 Kozloduy (BUL) Tantarena (ROM) 77.4 28.0 8 OHL 2x400 kV ckt.2 Kozloduy (BUL) Tantarena (ROM) 77.4 28.0 8 OHL 400 kV Sofia West (BUL) Nis (SER) 280.6 151.6 45 OHL 2x400 kV ckt.1 Zerjavinec (CRO) Heviz (HUN) -52.8 -80.6 7 OHL 2x400 kV ckt.2 Zerjavinec (CRO) Heviz (HUN) -52.8 -80.6 7 OHL 2x400 kV ckt.1 Ernestinovo (CRO) Pecs (HUN) 45.5 -106.9 9 OHL 2x400 kV ckt.2 Ernestinovo (CRO) Pecs (HUN) 45.5 -106.9 9 OHL 2x400 kV ckt.1 Tumbri (CRO) Krsko (SLO) -165.2 5.8 14 OHL 2x400 kV ckt.2 Tumbri (CRO) Krsko (SLO) -165.2 5.8 14 OHL 400 kV Melina (CRO) Divaca (SLO) 103.3 3.0 10 OHL 400 kV Ernestinovo (CRO) S.Mitrovica (SER) -255.3 67.3 21 OHL 220 kV Zerjavinec (CRO) Cirkovce (SLO) -13.4 -2.8 5 OHL 220 kV Pehlin (CRO) Divaca (SLO) 20.4 -4.2 6 OHL 400 kV Dubrovo (MCD) Thessaloniki (GRE) -30.8 -66.0 5 OHL 400 kV Bitola (MCD) Florina (GRE) -49.8 -103.8 8 OHL 400 kV Skopje (MCD) Kosovo B (UNMIK) -331.6 30.0 25 OHL 2x220 kV ckt.1 Skopje (MCD) Kosovo A (UNMIK) -17.8 -19.2 8 OHL 2x220 kV ckt.2 Skopje (MCD) Kosovo A (UNMIK) -17.8 -19.2 8 OHL 400 kV Arad (ROM) Sandorfalva (HUN) 23.2 -75.7 7 OHL 400 kV - Nadab (ROM) Bekescaba (HUN) 75.4 -103.7 11 OHL 400 kV Rosiori (ROM) Mukacevo (UKR) 11.4 -159.3 14 OHL 400 kV Portile De Fier (ROM) Djerdap (SER) 133.0 46.1 11 OHL 400 kV Subotica (SER) Sandorfalva (HUN) 86.1 -180.5 16 OHL 400 kV Ribarevine (MON) Kosovo B (UNMIK) -452.0 4.3 35 OHL 220 kV Pljevlja (MON) Bajina Basta (SER) 40.2 5.4 14 OHL 220 kV Pljevlja (MON) Pozega (SER) 105.0 42.5 38
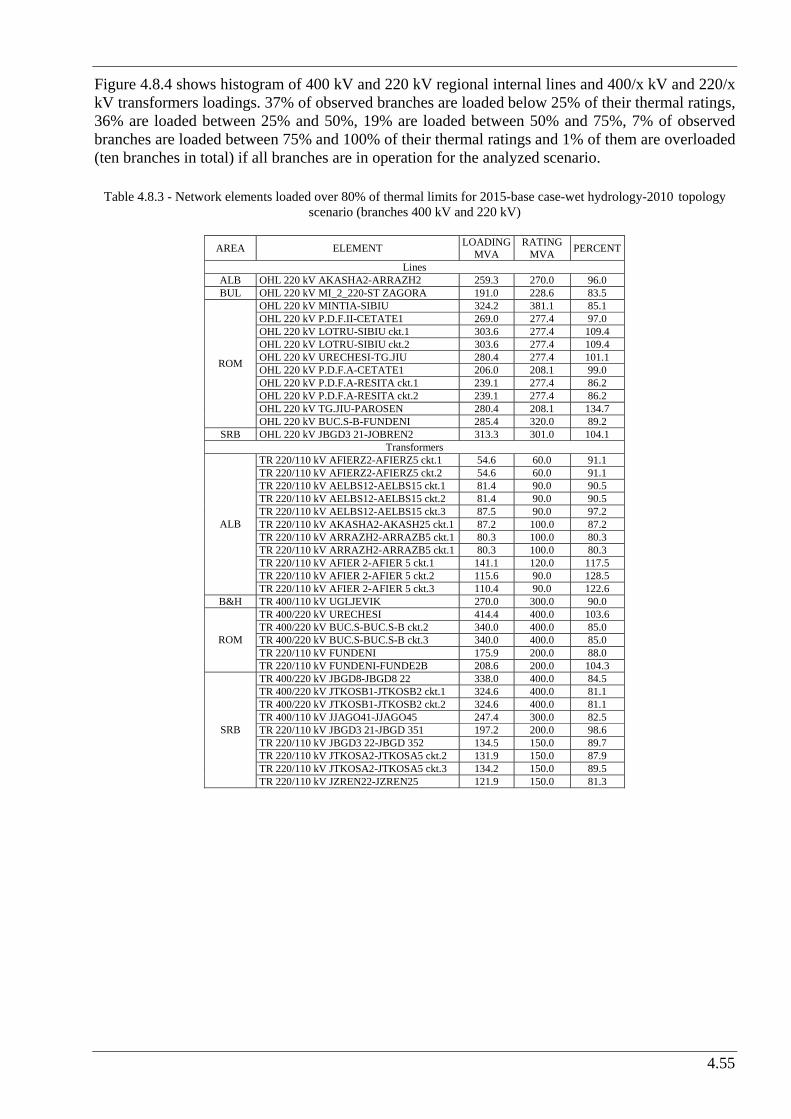
4.55
Figure 4.8.4 shows histogram of 400 kV and 220 kV regional internal lines and 400/x kV and 220/x kV transformers loadings. 37% of observed branches are loaded below 25% of their thermal ratings, 36% are loaded between 25% and 50%, 19% are loaded between 50% and 75%, 7% of observed branches are loaded between 75% and 100% of their thermal ratings and 1% of them are overloaded (ten branches in total) if all branches are in operation for the analyzed scenario.
Table 4.8.3 - Network elements loaded over 80% of thermal limits for 2015-base case-wet hydrology-2010 topology scenario (branches 400 kV and 220 kV)
AREA ELEMENT LOADINGMVA
RATING MVA PERCENT
Lines ALB OHL 220 kV AKASHA2-ARRAZH2 259.3 270.0 96.0 BUL OHL 220 kV MI_2_220-ST ZAGORA 191.0 228.6 83.5
OHL 220 kV MINTIA-SIBIU 324.2 381.1 85.1 OHL 220 kV P.D.F.II-CETATE1 269.0 277.4 97.0 OHL 220 kV LOTRU-SIBIU ckt.1 303.6 277.4 109.4 OHL 220 kV LOTRU-SIBIU ckt.2 303.6 277.4 109.4 OHL 220 kV URECHESI-TG.JIU 280.4 277.4 101.1 OHL 220 kV P.D.F.A-CETATE1 206.0 208.1 99.0 OHL 220 kV P.D.F.A-RESITA ckt.1 239.1 277.4 86.2 OHL 220 kV P.D.F.A-RESITA ckt.2 239.1 277.4 86.2 OHL 220 kV TG.JIU-PAROSEN 280.4 208.1 134.7
ROM
OHL 220 kV BUC.S-B-FUNDENI 285.4 320.0 89.2 SRB OHL 220 kV JBGD3 21-JOBREN2 313.3 301.0 104.1
Transformers TR 220/110 kV AFIERZ2-AFIERZ5 ckt.1 54.6 60.0 91.1 TR 220/110 kV AFIERZ2-AFIERZ5 ckt.2 54.6 60.0 91.1 TR 220/110 kV AELBS12-AELBS15 ckt.1 81.4 90.0 90.5 TR 220/110 kV AELBS12-AELBS15 ckt.2 81.4 90.0 90.5 TR 220/110 kV AELBS12-AELBS15 ckt.3 87.5 90.0 97.2 TR 220/110 kV AKASHA2-AKASH25 ckt.1 87.2 100.0 87.2 TR 220/110 kV ARRAZH2-ARRAZB5 ckt.1 80.3 100.0 80.3 TR 220/110 kV ARRAZH2-ARRAZB5 ckt.1 80.3 100.0 80.3 TR 220/110 kV AFIER 2-AFIER 5 ckt.1 141.1 120.0 117.5 TR 220/110 kV AFIER 2-AFIER 5 ckt.2 115.6 90.0 128.5
ALB
TR 220/110 kV AFIER 2-AFIER 5 ckt.3 110.4 90.0 122.6 B&H TR 400/110 kV UGLJEVIK 270.0 300.0 90.0
TR 400/220 kV URECHESI 414.4 400.0 103.6 TR 400/220 kV BUC.S-BUC.S-B ckt.2 340.0 400.0 85.0 TR 400/220 kV BUC.S-BUC.S-B ckt.3 340.0 400.0 85.0 TR 220/110 kV FUNDENI 175.9 200.0 88.0
ROM
TR 220/110 kV FUNDENI-FUNDE2B 208.6 200.0 104.3 TR 400/220 kV JBGD8-JBGD8 22 338.0 400.0 84.5 TR 400/220 kV JTKOSB1-JTKOSB2 ckt.1 324.6 400.0 81.1 TR 400/220 kV JTKOSB1-JTKOSB2 ckt.2 324.6 400.0 81.1 TR 400/110 kV JJAGO41-JJAGO45 247.4 300.0 82.5 TR 220/110 kV JBGD3 21-JBGD 351 197.2 200.0 98.6 TR 220/110 kV JBGD3 22-JBGD 352 134.5 150.0 89.7 TR 220/110 kV JTKOSA2-JTKOSA5 ckt.2 131.9 150.0 87.9 TR 220/110 kV JTKOSA2-JTKOSA5 ckt.3 134.2 150.0 89.5
SRB
TR 220/110 kV JZREN22-JZREN25 121.9 150.0 81.3

4.56
05
101520
253035
4045
x<25 25<x<50 50<x<75 75<x<100 x>100
Bin
Freq
uenc
y
Figure 4.8.3 - Histogram of interconnection lines loadings for 2015-base case-wet hydrology-2010 topology scenario
("Frequency" denotes number of lines and "Bin" denotes loading range in % of thermal limit)
0
50
100
150
200
250
300
x<25 25<x<50 50<x<75 75<x<100 x>100
Bin
Freq
uenc
y
Figure 4.8.4 - Histogram of 400 kV and 220 kV regional lines loadings for 2015-base case-wet hydrology-2010 topology scenario ("Frequency" denotes number of lines and "Bin" denotes loading range in % of thermal limit)
4.8.2 Voltage Profile in the Region Voltage profile in the region within this scenario which is defined by given generation and demand pattern is seen as satisfactory despite several appearances of certain bus voltage deviations. The deviations are shown in Table 4.8.4, which includes only 400 kV and 220 kV network buses. Bus voltage magnitudes which are found below permitted limits (90% Vnominal in 220 kV network and 95% Vnominal in 400 kV network) are detected in Albania (three 400 kV and two 220 kV nodes) and Serbia (three 400 kV nodes). Bus voltage magnitudes that are found above permitted limits (110% Vnominal in 110 kV and 220 kV networks and 105% Vnominal in 400 kV network) are detected only in Bulgaria in one node. Figure 4.8.5 shows histogram of bus voltage magnitudes in monitored 400 kV and 220 kV substations.

4.57
Table 4.8.4 - Bus voltage deviations for 2015-base case-wet hydrology-2010 topology scenario, complete network
Voltages Country Node pu kV
400 kV AELBS21 0.917 366.7 400 kV AVDEJA1 0.948 379.3 400 kV AKASHA1 0.917 366.9 220 kV AFIER 2 0.856 188.3
ALBANIA
220 kV ABABIC2 0.868 191.0 BOSNIA AND HERZEGOVINA - - - BULGARIA 400 kV MARITSA EAST2 1.051 420.3 CROATIA - - - MACEDONIA - - - MONTENEGRO - - - ROMANIA - - -
400 kV JBGD201 0.947 378.9 400 kV JPANC21 0.944 377.5
SERBIA AND UNMIK
400 kV JLESK21 0.939 375.6
0102030405060708090
x<0.
9
0.9<
x<0.
95
0.95
<x<0
.975
0.97
5<x<
1
1<x<
1.02
5
1.02
5<x<
1.05
1.05
<x<1
.1
x>1.
1
Bin
Freq
uenc
y
Figure 4.8.5 - Histogram of voltages in monitored substations for 2015-base case-wet hydrology-2010 topology
scenario ("Frequency" denotes number of busses and "Bin" denotes voltage range in p.u.) It should be emphasized that these results represent only a situation when additional devices (transformer automatic tap changers, switched shunts, etc.) are not used for voltage regulation. Impacts of such devices, which exist in many points of the SEE regional transmission network, need more comprehensive and thorough analysis.
4.8.3 Security (n-1) analysis Results of security (n-1) analysis for the 2015-base case-wet hydrology-2010 topology scenario are presented in Table 4.8.5 and Table 4.8.6. Critical contingencies which are included there are related only to the branches which are not overloaded in the base case when all branches are available.
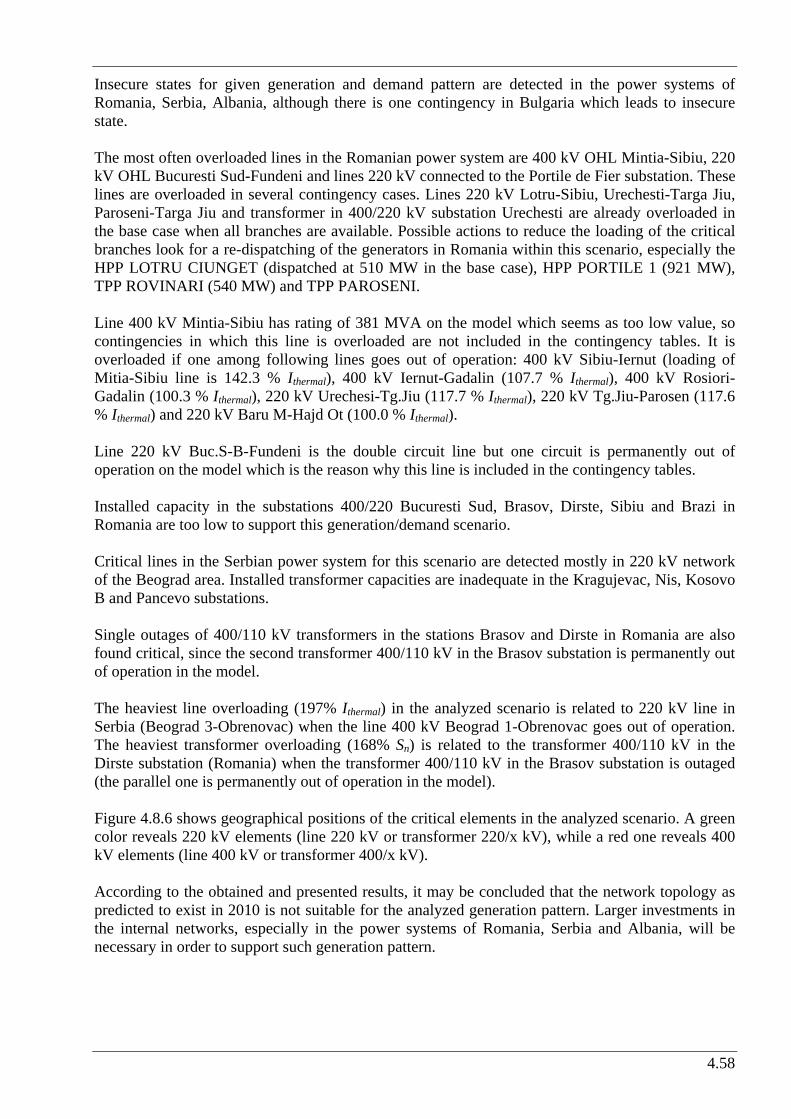
4.58
Insecure states for given generation and demand pattern are detected in the power systems of Romania, Serbia, Albania, although there is one contingency in Bulgaria which leads to insecure state. The most often overloaded lines in the Romanian power system are 400 kV OHL Mintia-Sibiu, 220 kV OHL Bucuresti Sud-Fundeni and lines 220 kV connected to the Portile de Fier substation. These lines are overloaded in several contingency cases. Lines 220 kV Lotru-Sibiu, Urechesti-Targa Jiu, Paroseni-Targa Jiu and transformer in 400/220 kV substation Urechesti are already overloaded in the base case when all branches are available. Possible actions to reduce the loading of the critical branches look for a re-dispatching of the generators in Romania within this scenario, especially the HPP LOTRU CIUNGET (dispatched at 510 MW in the base case), HPP PORTILE 1 (921 MW), TPP ROVINARI (540 MW) and TPP PAROSENI. Line 400 kV Mintia-Sibiu has rating of 381 MVA on the model which seems as too low value, so contingencies in which this line is overloaded are not included in the contingency tables. It is overloaded if one among following lines goes out of operation: 400 kV Sibiu-Iernut (loading of Mitia-Sibiu line is 142.3 % Ithermal), 400 kV Iernut-Gadalin (107.7 % Ithermal), 400 kV Rosiori-Gadalin (100.3 % Ithermal), 220 kV Urechesi-Tg.Jiu (117.7 % Ithermal), 220 kV Tg.Jiu-Parosen (117.6 % Ithermal) and 220 kV Baru M-Hajd Ot (100.0 % Ithermal). Line 220 kV Buc.S-B-Fundeni is the double circuit line but one circuit is permanently out of operation on the model which is the reason why this line is included in the contingency tables. Installed capacity in the substations 400/220 Bucuresti Sud, Brasov, Dirste, Sibiu and Brazi in Romania are too low to support this generation/demand scenario. Critical lines in the Serbian power system for this scenario are detected mostly in 220 kV network of the Beograd area. Installed transformer capacities are inadequate in the Kragujevac, Nis, Kosovo B and Pancevo substations. Single outages of 400/110 kV transformers in the stations Brasov and Dirste in Romania are also found critical, since the second transformer 400/110 kV in the Brasov substation is permanently out of operation in the model. The heaviest line overloading (197% Ithermal) in the analyzed scenario is related to 220 kV line in Serbia (Beograd 3-Obrenovac) when the line 400 kV Beograd 1-Obrenovac goes out of operation. The heaviest transformer overloading (168% Sn) is related to the transformer 400/110 kV in the Dirste substation (Romania) when the transformer 400/110 kV in the Brasov substation is outaged (the parallel one is permanently out of operation in the model). Figure 4.8.6 shows geographical positions of the critical elements in the analyzed scenario. A green color reveals 220 kV elements (line 220 kV or transformer 220/x kV), while a red one reveals 400 kV elements (line 400 kV or transformer 400/x kV). According to the obtained and presented results, it may be concluded that the network topology as predicted to exist in 2010 is not suitable for the analyzed generation pattern. Larger investments in the internal networks, especially in the power systems of Romania, Serbia and Albania, will be necessary in order to support such generation pattern.

4.59
Table 4.8.5 - Lines overloadings for 2015–base case-wet hydrology-2010 topology scenario, single outages
Loadings Outage Overloaded line(s) MVA % Country
TR 400/220 kV URECHESI 418.5 104.6 OHL 220 kV LOTRU-SIBIU ckts. 1 & 2 311.4 109.4 OHL 220 kV URECHESI-TG.JIU 282.1 101.1 OHL 220 kV TG.JIU-PAROSEN 282.1 134.7
ROMANIA
Base case
OHL 220 kV JBGD3 21-JOBREN2 299.7 104.1 SERBIA OHL 220 kV AFIERZ2-ABURRE2 OHL 220 kV AKASHA2-ARRAZH2 256.7 112.9 TR 400/220 kV AELBS21-AELBS22 OHL 220 kV AKASHA2-ARRAZH2 253.7 109.1
ALBANIA
OHL 400 kV RP TREB-JPODG221 OHL 220 kV AKASHA2-ARRAZH2 242.9 105.4 B&H/MONT
/ALB OHL 220 kV G_ORIAH-MI_2_220 OHL 220 kV MI_2_220_ST.ZAGORA 255.4 105.1 BULGARIA OHL 400 kV TANTAREN-BRADU OHL 220 kV BUC.S-B-FUNDENI 329.5 108.3 OHL 400 kV DOMNESTI-BUC.S OHL 220 kV BUC.S-B-FUNDENI 321.8 102.7 OHL 400 kV DOMNESTI-BRAZI OHL 220 kV BUC.S-B-FUNDENI 355.5 114.6 OHL 220 kV P.D.F.A-CALAFAT OHL 220 kV P.D.F.A-CETATE1 259.9 128.7 OHL 220 kV P.D.F.A-RESITA ckt.1 OHL 220 kV P.D.F.A-RESITA ckt.2 338.8 129.6 OHL 220 kV RESITA-TIMIS ckt.1 OHL 220 kV RESITA-TIMIS ckt.2 342.8 128.2 OHL 220 kV FUNDENI- BUC.S-B OHL 220 kV BUC.S-B-FUNDENI 368.3 118.1 TR 400/220 kV BRAZI OHL 220 kV BUC.S-B-FUNDENI 369.7 122.0
ROMANIA
OHL 400 kV JHDJE11-JTDRMN1 OHL 220 kV P.D.F.A-RESITA ckt.1&2 266.6 102.0 SER/ROM OHL 400 kV JTKOSB1-JPEC 1 OHL 220 kV AKASHA2-ARRAZH2 243.2 107.0 SER/ALB OHL 220 kV JBGD172-JBGD8 22 ckt.1 OHL 220 kV JBGD172-JBGD8 22 ckt.2 475.9 140.2 TR 400/220 kV JBGD8 OHL 220 kV JBGD3 22-JBGD8 22 364.7 108.4
SERBIA
Table 4.8.6 - Transformers overloadings for 2015–base case-wet hydrology-2010 topology scenario, single outages
Loadings Outage Overloaded branch(es) MVA % Country
TR 400/220 kV BUC.S-BUC.S-B ckt.1 TR 400/220 kV BUC.S-BUC.S-B ckt.2 536.5 134.1 400/110 kV BRASOV TR 400/110 kV DIRSTE 420.0 168.0 400/110 kV DIRSTE TR 400/110 kV BRASOV 410.8 164.3 TR 400/220 kV SIBIU ckt.1 TR 400/220 kV SIBIU ckt.2 573.0 143.3
TR 400/220 kV BUC.S ckt.1 413.3 103.3 TR 400/220 kV BRAZI TR 400/220 kV BUC.S ckt.2 413.3 103.3
ROMANIA
TR 400/110 kV JKRAG ckt.1 TR 400/110 kV JKRAG ckt.2 316.5 105.5 TR 400/110 kV NIS ckt.1 TR 400/110 kV NIS ckt.2 340.4 113.5 OHL 220 kV JBGD3 22-JBGD8 22 TR 400/220 kV JBGD8 1-JBGD8 22 412.1 103.0 TR 400/110 kV JPANC ckt.1 TR 400/110 kV JPANC ckt.2 334.0 111.3 TR 400/110 kV JTKOSB ckt.1 TR 400/110 kV JTKOSB ckt.2 439.3 109.8
SERBIA

4.60
AUT
ALB
BIH
BUL
CRO
GRE
HUN
MKD
MNG
ROM
SRB
SVK
SLO
TUR
400 kV line or 400/x kV transformer220 kV line or 220/x kV transformer
critical elements
Figure 4.8.6 - Geographical positions of the critical elements for 2015-base case-wet hydrology-topology 2010 scenario
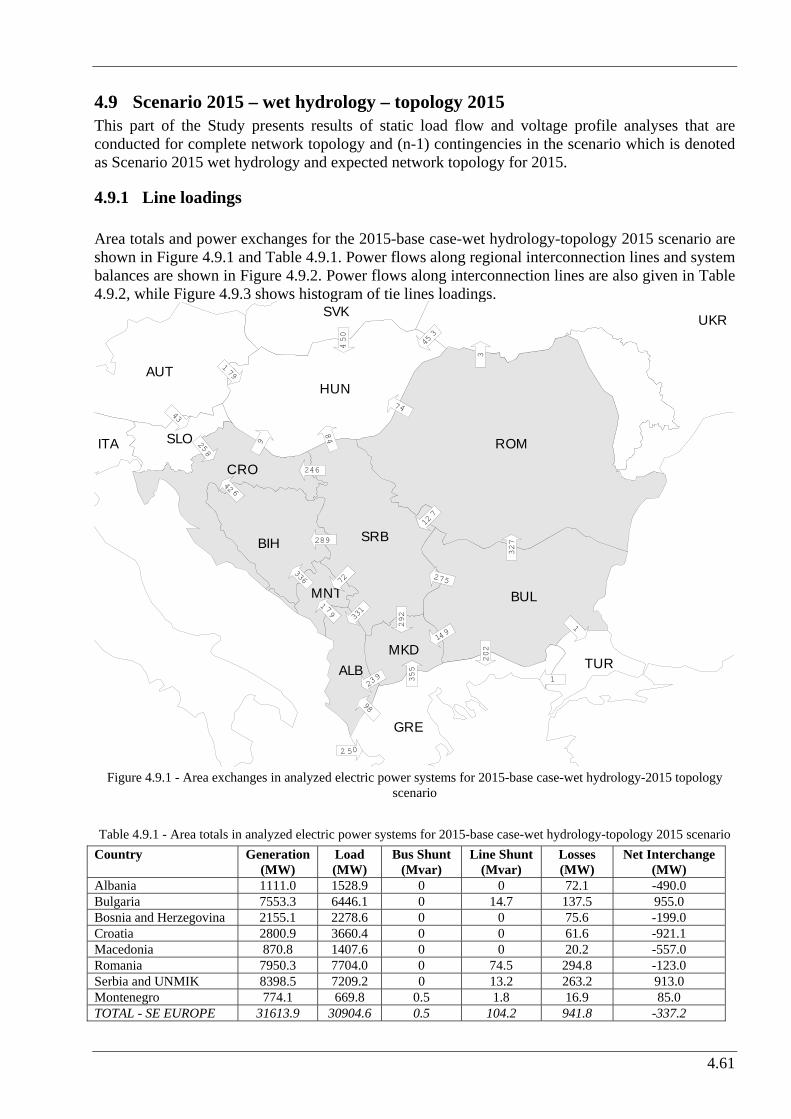
4.61
4.9 Scenario 2015 – wet hydrology – topology 2015 This part of the Study presents results of static load flow and voltage profile analyses that are conducted for complete network topology and (n-1) contingencies in the scenario which is denoted as Scenario 2015 wet hydrology and expected network topology for 2015.
4.9.1 Line loadings Area totals and power exchanges for the 2015-base case-wet hydrology-topology 2015 scenario are shown in Figure 4.9.1 and Table 4.9.1. Power flows along regional interconnection lines and system balances are shown in Figure 4.9.2. Power flows along interconnection lines are also given in Table 4.9.2, while Figure 4.9.3 shows histogram of tie lines loadings.
AUT
ALB
BIH
BUL
CRO
GRE
ITA
HUN
MKD
MNT
ROM
SRB
SVK
SLO
TUR
UKR
336
289
246
258
43
9
84
74
72
1 79
331
98
149
275
355
292
327
202
127
3
450
179
453
1
2 50
42 6
239 1
Figure 4.9.1 - Area exchanges in analyzed electric power systems for 2015-base case-wet hydrology-2015 topology
scenario Table 4.9.1 - Area totals in analyzed electric power systems for 2015-base case-wet hydrology-topology 2015 scenario
Country Generation (MW)
Load (MW)
Bus Shunt (Mvar)
Line Shunt (Mvar)
Losses (MW)
Net Interchange (MW)
Albania 1111.0 1528.9 0 0 72.1 -490.0 Bulgaria 7553.3 6446.1 0 14.7 137.5 955.0 Bosnia and Herzegovina 2155.1 2278.6 0 0 75.6 -199.0 Croatia 2800.9 3660.4 0 0 61.6 -921.1 Macedonia 870.8 1407.6 0 0 20.2 -557.0 Romania 7950.3 7704.0 0 74.5 294.8 -123.0 Serbia and UNMIK 8398.5 7209.2 0 13.2 263.2 913.0 Montenegro 774.1 669.8 0.5 1.8 16.9 85.0 TOTAL - SE EUROPE 31613.9 30904.6 0.5 104.2 941.8 -337.2

4.62
New elements that are expected to be built till 2015 cause significantly different distribution of power flows in the southern part of the region (Albania, FYR of Macedonia, Serbia, Montenegro). Compared to the expected topology 2010, analyzed in the previous chapter, it can be seen that the network losses are smaller as a consequence of building the new elements in the 2015 network topology, especially in the cases of Albania, Serbia and Montenegro. Overall reduction of losses is about 35 MW. Figure 4.9.3 shows that the tie lines in the region are mostly loaded less than 25% of their thermal limits for the analyzed hydrological base case scenario in year 2015, examined on the planned network topology for that year. Among total number of fifty two 400 kV and 220 kV interconnection lines in the region only eight are loaded between 25% and 50% of their thermal ratings. Only one line (OHL 400 kV Sarajevo 20 – Piva between Bosnia and Herzegovina and Montenegro) is loaded more than 50% of its thermal rating. Table 4.9.4 lists all network elements, observing only lines 400 kV and 220 kV and transformers 400/x kV and 220/x kV, that are loaded over 80% of their thermal limits. Most of the elements loaded over 80% are transformers in some substations and internal 110 kV and 220 kV lines. Thus, certain internal network reinforcements are necessary to sustain given load-demand level and generation pattern. Being compared to the same generation pattern, but with the 2010 network topology, the loading relief of some branches and transformers in the southern Serbia and Albania may be noticed. Figure 4.9.4 shows histogram of 400 kV and 220 kV regional internal lines and 400/x kV and 220/x kV transformers loadings. 38% of observed branches are loaded below 25% of their thermal ratings, 36% are loaded between 25% and 50%, 20% are loaded between 50% and 75%, 5% of observed branches are loaded between 75% and 100% of their thermal ratings and 1% of them are overloaded (nine branches in total) if all branches are in operation for the analyzed scenario. Being compared to the same generation pattern on the 2010 network topology, it is noticed that there are no significant changes in the total number of branches and the ranges of internal lines loading. Only one internal branch is loaded below permitted limit in the case of building new interconnection lines as predicted to exist in 2015.

4.63
Figure 4.9.2 - Power flows along interconnection lines in the region for 2015 - base case - wet hydrology scenario – topology 2015
PEHLIN 230.0
MELINA 403.1
TUMBRI 401.5
MEDURIC 219.8MRACLIN 223.0
DAKOVO 218.9
KONJSKO
405.0
HE ZAKUC
234.4
ZERJAVIN 404.0
ZERJAVIN 227.4
AZEMLA1
405.5
AKASHA1 388.8
AVDEJA2225.8AFIERZ2227.9
OWIEN 1
405.4
OWIEN 2
234.2
MGYOR 4
403.3
MGYOR 2
228.9
ONEUSI2
233.5
OKAINA1401.7
LMARIB1402.7
OOBERS2238.7
IRDPV111
401.0
LDIVAC1
401.4
IPDRV121
230.5
LDIVAC2
229.6
LKRSKO1 401.3
PRIJED2 219.8
GRADACAC 221.4
TE TUZL 226.9
JSMIT21
397.0
VISEGRA228.6
JVARDI22226.9
SA 20227.8
JHPIVA21235.1
RP TREB401.0
JHPERU21
228.7
JPODG211
395.3
MO-4
403.9
MHEVI 4 408.5
RP TREB
231.5
JPODG121227.6
JPRIZ22220.6 JTKOSA2223.4JTKOSB1400.0
400.1
BITOLA 2 411.3
AHS_FLWR415.6
DUBROVO 407.4
QES/H K 412.2
BLAGOEV412.1
STIP 1
407.6
C_MOGILA
411.3
JNIS2 1393.0
SOFIA_W4409.5
KARDIA K416.9
GABICK1400.0
MGOD 4 407.3
LEVIC 1400.0
MSAJO 4410.0
UMUKACH
412.0
ROSIORI 400.3
MKISV 2226.3
UMUKACH2
224.4
MTLOK 2
230.5
MSAFA 4 398.8
JSUBO31 392.0
ARAD
395.0
TANTAREN 409.7
AEC_400 413.0
JHDJE11
398.4
LPODLO2229.1
FILIPPOI
415.4
SK 1 219.6
LCIRKO2 227.4
P.D.FIE
398.5
UGLJEVIK 396.6
ISACCEA 403.2
DOBRUD4 416.0
JSOMB31389.3
MPECS 4 406.9
UZUKRA01772.5
MAISA 7714.0
NADAB397.1
MBEKO 4400.9
SK 4 401.3
JLESK21393.6
ERNESTIN
401.9
MO-4
232.5
MI_3_4_1 419.2
JVRAN31397.4
LAGAD K 413.2
KARACQOU419.1KARACQOU419.1
K-KEXRU417.84BABAESK415.5
4HAMITAX
415.3
MSAJI 4408.1
AVDEJA1 394.9
98.860.5
98.1128
150
14.8
31.1
43.92
8.8
24.9
52.06.1
10523.7
73.5
94.0
209
28.3
2084.4
203
128
204
2.980.3
60.3
21626.6
21940.1
5.418.5
5.426.9
13370.9
133111
80.059.3
28.6
16.2
30.7
51.5
26.7
23.2
26.8
13.2
26.7
23.2
26.8
13.2
352
20.1
259
131
95.3
71.9
95.5
12.8
12723.2
12724.2
61.8
78.0
61.9
29.0
61.8
78.0
274156
276111
35.520.7
35.727.5
78.867.8
79.049.4
2.794.4
11.714.8
11.872.8
84.4
177
84.1
154
3.1
154
25359.1
38.7
44.5
12.9
6.5
50.0
16.5 98.1
37.1
247102
165
31.5
165
31.5
46.5
26.3
46.5
26.3
11141.7
22.46.0
155
44.1
157
47.7
199
90.4
200
136
251
113
250
90.3
260
114
209
28.3
10.729.1
10.87.5
18111.5
1819.3
16.072.9
15.969.4
41.9
43.7
41.8
12.5
41.8
12.5
41.9
43.7
346807
350293
62.682.0
62.7100
61.9
29.0
114
21.5
132
20.0
132
39.2
149
60.9
149
26.3
5.1
56.8
22.412.9
22.326.8
51.521.0
105101
73.3
39.5
24662.2
51.2
103
51.2
103
51.0
55.6 51.0
55.6
58.416.0
38.3
37.2
12.9
1.4 49.8
21.1
96.8
39.5
1656.8
1656.8
12.9
7.3
12.92.6
46.3
80.8 4
6.3
80.81
11
18.4
22.4
4.0
2529.9
58.927.2
208
46.3
5.2
38.0
21.7
79.9
21.8
43.6
113
64.6
207
72.7
1.023.5
0.818.5
208
46.3
0.215.6
0.7
62.1 0.287.4
1.072.5
25050.0
0.762.1
0.773.4
240
45.4
239
84.4
354
44.5
362
11.8361
26.5
151
39.6
91.7
67.5
91.5
108
91.7
67.4
91.5
108
ROM
BUL
HUN
UKRUCTE
CENTREL
CRO
BIH
SCG
ALB
GRE
MKD
TUR
SLO
CRGSRB
998.0 MW
85.0 MW913.0 MW
-557.0 MW
955.0 MW
-490.0 MW
-199.0 MW
222.3 MW
-921.1 MW
-1249.9 MW
-0.1 MW
450.0 MW
-123.1 MW
215.0 MW
0.0 MW
450.0 MW
SHAW POWERTECHNOLOGIESINC.R KV: 110 , 220 , 400
BUS -VOLTAGE(KV)
EQUIPMENT -MW/MVARBRANCH -MW/MVAR
GIS REGIONAL MODEL - WET HYDRO2015 TOPOLOGY 2015

4.64
Table 4.9.2 - Power flows along regional interconnection lines for 2015 - base case-wet hydrology scenario-topology 2015
Power Flow Interconnection line
MW
Mvar
% of thermal rating
OHL 400 kV Zemlak (ALB) Kardia (GRE) -98.1 -128.3 12 OHL 220 kV Fierze (ALB) Prizren (SER) 31.1 43.9 20 OHL 220 kV V.Dejes (ALB) Podgorica (MON) 28.8 -24.9 13 OHL 400 kV V.Dejes (ALB) Podgorica (MON) 150.5 -39.6 12 OHL 400 kV Ugljevik (B&H) Ernestinovo (CRO) 73.5 -94.0 9 OHL 400 kV Mostar (B&H) Konjsko (CRO) 253.5 -59.1 19 OHL 400 kV Ugljevik (B&H) S. Mitrovica (SER) -208.1 -4.4 16 OHL 400 kV Trebinje (B&H) Podgorica (MON) -133.1 70.9 13 OHL 220 kV Trebinje (B&H) Plat (CRO) -104.8 40.2 36 OHL 220 kV Prijedor (B&H) Mraclin (CRO) 38.7 -44.5 19 OHL 220 kV Prijedor (B&H) Medjuric (CRO) 12.9 -6.5 5 OHL 220 kV Gradacac (B&H) Djakovo (CRO) 50.0 16.5 18 OHL 220 kV Tuzla (B&H) Djakovo (CRO) 98.1 37.1 35 OHL 220 kV Mostar (B&H) Zakucac (CRO) 58.9 -27.2 19 OHL 220 kV Visegrad (B&H) Vardiste (SER) -80.0 59.3 32 OHL 220 kV Sarajevo 20 (B&H) Piva (MON) -215.8 -26.6 57 OHL 220 kV Trebinje (B&H) Perucica (MON) 5.4 18.5 9 OHL 400 kV Blagoevgrad (BUL) Thessaloniki (GRE) -5.1 -56.8 8 OHL 400 kV M.East 3 (BUL) Filippi (GRE) 208.0 -46.3 30 OHL 400 kV M.East 3 (BUL) Babaeski (TUR) 1.0 -18.5 5 OHL 400 kV M.East 3 (BUL) Hamitabat (TUR) 0.0 -15.6 5 OHL 400 kV C.Mogila (BUL) Stip (MCD) 149.4 -26.3 21 OHL 400 kV Dobrudja (BUL) Isaccea (ROM) 204.0 -2.9 15 OHL 2x400 kV ckt.1 Kozloduy (BUL) Tantarena (ROM) 61.9 29.0 7 OHL 2x400 kV ckt.2 Kozloduy (BUL) Tantarena (ROM) 61.9 29.0 7 OHL 400 kV Sofia West (BUL) Nis (SER) 276.1 111.2 42 OHL 2x400 kV ckt.1 Zerjavinec (CRO) Heviz (HUN) -46.3 -80.8 7 OHL 2x400 kV ckt.2 Zerjavinec (CRO) Heviz (HUN) -46.3 -80.8 7 OHL 2x400 kV ckt.1 Ernestinovo (CRO) Pecs (HUN) 51.2 -103.2 9 OHL 2x400 kV ckt.2 Ernestinovo (CRO) Pecs (HUN) 51.2 -103.2 9 OHL 2x400 kV ckt.1 Tumbri (CRO) Krsko (SLO) -165.2 6.8 14 OHL 2x400 kV ckt.2 Tumbri (CRO) Krsko (SLO) -165.2 6.8 14 OHL 400 kV Melina (CRO) Divaca (SLO) 111.0 4.3 10 OHL 400 kV Ernestinovo (CRO) S.Mitrovica (SER) -245.7 62.2 20 OHL 220 kV Zerjavinec (CRO) Cirkovce (SLO) -12.9 -2.6 4 OHL 220 kV Pehlin (CRO) Divaca (SLO) 22.4 -4.0 7 OHL 400 kV Dubrovo (MCD) Thessaloniki (GRE) -95.3 -71.9 8 OHL 400 kV Bitola (MCD) Florina (GRE) -259.0 -130.7 24 OHL 400 kV Skopje (MCD) Kosovo B (UNMIK) -351.8 20.1 27 OHL 2x220 kV ckt.1 Skopje (MCD) Kosovo A (UNMIK) -26.7 -23.2 11 OHL 2x220 kV ckt.2 Skopje (MCD) Kosovo A (UNMIK) -26.7 -23.2 11 OHL 400 kV Arad (ROM) Sandorfalva (HUN) 11.8 -72.8 6 OHL 400 kV - Nadab (ROM) Bekescaba (HUN) 62.7 -100.0 10 OHL 400 kV Rosiori (ROM) Mukacevo (UKR) 3.1 -154.0 13 OHL 400 kV Portile De Fier (ROM) Djerdap (SER) 126.8 23.2 10 OHL 400 kV Subotica (SER) Sandorfalva (HUN) 84.4 -176.8 16 OHL 400 kV Ribarevine (MON) Kosovo B (UNMIK) -281.4 26.7 22 OHL 220 kV Pljevlja (MON) Bajina Basta (SER) 49.2 11.1 17 OHL 220 kV Pljevlja (MON) Pozega (SER) 113.7 45.4 38 OHL 400 kV* Skopje 4 (MCD) Vranje (SER) 113.6 21.5 10 OHL 400 kV* Zemlak (ALB) Bitola (MCD) 239.8 45.4 19 OHL 400 kV* V.Dejes (ALB) Kosovo B (UNMIK) -360.9 -26.5 27 * new lines planned till 2015

4.65
Table 4.9.3 - Network elements loaded over 80% of thermal limits for 2015-base case-wet hydrology-2015 topology scenario (branches 400 kV and 220 kV)
AREA ELEMENT LOADINGMVA
RATING MVA PERCENT
Lines ALB OHL 220 kV AKASHA2-ARRAZH2 237.0 270.0 87.8 BUL OHL 220 kV MI_2_220-ST ZAGORA 190.4 228.6 83.3
OHL 220 kV MINTIA-SIBIU 313.4 381.1 82.2 OHL 220 kV P.D.F.II-CETATE1 268.4 277.4 96.8 OHL 220 kV LOTRU-SIBIU ckt.1 303.4 277.4 109.4 OHL 220 kV LOTRU-SIBIU ckt.2 303.4 277.4 109.4 OHL 220 kV URECHESI-TG.JIU 275.4 277.4 99.3 OHL 220 kV P.D.F.A-CETATE1 205.6 208.1 98.8 OHL 220 kV P.D.F.A-RESITA ckt.1 235.6 277.4 84.9 OHL 220 kV P.D.F.A-RESITA ckt.2 235.6 277.4 84.9 OHL 220 kV TG.JIU-PAROSEN 275.4 208.1 132.3
ROM
OHL 220 kV BUC.S-B-FUNDENI 284.6 320.0 88.9 SRB OHL 220 kV JBGD3 21-JOBREN2 312.6 301.0 103.8
Transformers TR 220/110 kV AFIERZ2-AFIERZ5 ckt.1 50.2 60.0 83.7 TR 220/110 kV AFIERZ2-AFIERZ5 ckt.2 50.2 60.0 83.7 TR 220/110 kV AELBS12-AELBS15 ckt.1 74.8 90.0 83.2 TR 220/110 kV AELBS12-AELBS15 ckt.2 74.8 90.0 83.2 TR 220/110 kV AELBS12-AELBS15 ckt.3 80.4 90.0 89.3 TR 220/110 kV AKASHA2-AKASH25 ckt.1 82.3 100.0 82.3 TR 220/110 kV AKASHA2-AKASH25 ckt.2 82.3 100.0 82.3 TR 220/110 kV AFIER 2-AFIER 5 ckt.1 134.5 120.0 112.1 TR 220/110 kV AFIER 2-AFIER 5 ckt.2 110.3 90.0 122.5
ALB
TR 220/110 kV AFIER 2-AFIER 5 ckt.3 105.2 90.0 116.9 B&H TR 400/110 kV UGLJEVIK 267.6 300.0 89.2
TR 400/220 kV URECHESI 410.3 400.0 102.6 TR 400/220 kV BUC.S-BUC.S-B ckt.1 339.3 400.0 84.8 TR 400/220 kV BUC.S-BUC.S-B ckt.2 339.3 400.0 84.8 TR 220/110 kV FUNDENI 175.7 200.0 87.8
ROM
TR 220/110 kV FUNDENI-FUNDE2B 208.3 200.0 104.1 TR 400/220 kV JBGD8-JBGD8 22 334.9 400.0 83.7 TR 220/110 kV JBGD3 21-JBGD 351 196.6 200.0 98.3 TR 220/110 kV JBGD3 22-JBGD 352 134.4 150.0 89.6 SRB
TR 220/110 kV JZREN22-JZREN25 121.5 150.0 81.0
05
101520253035404550
x<25 25<x<50 50<x<75 75<x<100 x>100
Bin
Freq
uenc
y
Figure 4.9.3 - Histogram of interconnection lines loadings for 2015-base case-wet hydrology-2015 topology scenario
("Frequency" denotes number of lines and "Bin" denotes loading range in % of thermal limit)

4.66
0
50
100
150
200
250
300
x<25 25<x<50 50<x<75 75<x<100 x>100
Bin
Freq
uenc
y
Figure 4.9.4 - Histogram of 400 kV and 220 kV regional lines loadings for 2015-base case-wet hydrology-2015 topology scenario ("Frequency" denotes number of lines and "Bin" denotes loading range in % of thermal limit)
4.9.2 Voltage Profile in the Region Voltage profile in the region within this scenario which is defined by given generation and demand pattern is seen as satisfactory despite several appearances of certain bus voltage deviations. The deviations are shown in Figure 4.9.5, which includes only 400 kV and 220 kV network buses.
Table 4.9.4 - Bus voltage deviations for 2015-base case-wet hydrology-2015 topology scenario, complete network Voltages Country Node pu kV
ALBANIA - - - BOSNIA AND HERZEGOVINA - - - BULGARIA 400 kV MARITSA EAST2 1.051 420.4 CROATIA - - - MACEDONIA - - - MONTENEGRO - - - ROMANIA - - - SERBIA AND UNMIK 400 kV JPANC21 0.947 378.8 Bus voltage magnitudes which are found below permitted limits (90% Vnominal in 220 kV network and 95% Vnominal in 400 kV network) are detected only in Serbia (one 400 kV node). Bus voltage magnitudes that are found above permitted limits (110% Vnominal in 110 kV and 220 kV networks and 105% Vnominal in 400 kV network) are detected only in Bulgaria in one node. Figure 4.3.11 shows a histogram of voltages in monitored 400 kV and 220 kV substations. Being compared to the same generation pattern on the 2010 network topology, it is noticed that there are significant voltage profile improvements, especially in the power systems of Albania and Serbia.

4.67
0102030405060708090
x<0.
9
0.9<
x<0.
95
0.95
<x<0
.975
0.97
5<x<
1
1<x<
1.02
5
1.02
5<x<
1.05
1.05
<x<1
.1
x>1.
1
Bin
Freq
uenc
y
Figure 4.9.5 - Histogram of voltages in monitored substations for 2015-base case-wet hydrology-2015 topology
scenario ("Frequency" denotes number of busses and "Bin" denotes voltage range in p.u.)
4.9.3 Security (n-1) analysis Results of security (n-1) analysis for the 2015-base case-wet hydrology-2015 topology scenario are presented in Table 4.9.5 and Table 4.9.6. Critical contingencies which are included there are related only to the branches which are not overloaded in the base case when all branches are available. Insecure states for given generation and demand pattern are detected in the power systems of Romania, Serbia, Albania, although there is one contingency in Bulgaria and Bosnia and Herzegovina each which leads to insecure state. Being compared to the same generation and demand scenario on the 2010 network topology, it is concluded that there are several new contingency cases in the power system of Albania and one new contingency case in the power systems of Romania and Bosnia and Herzegovina (marked with red color in Table 4.9.5 and Table 4.9.6). At the same time, several contingency cases do not appear any more (marked in blue color in Table 4.9.5 and Table 4.9.6). These contingency cases are related to the power systems of Albania, Serbia and Romania, although it is noticed that the influence of the new investments is less significant in the power system of Romania than it is in Albania and southern Serbia. There are no contingency cases in the 2015 network topology which are related to the interconnection lines. The same conclusion is valid for the 2010 network topology and analyzed generation/demand scenario. Figure 4.9.6 shows geographical positions of the critical elements in the analyzed scenario. A green color reveals 220 kV elements (line 220 kV or transformer 220/x kV), while a red one reveals 400 kV elements (line 400 kV or transformer 400/x kV). According to the obtained and presented results, it may be concluded that the network topology as predicted to exist in 2015 is not suitable for the analyzed generation pattern. Larger investments in the internal networks, especially in power systems of Romania, Serbia and Albania, are necessary shall such generation pattern be supported.

4.68
Table 4.9.5 - Lines overloadings for 2015–base case-wet hydrology-2015 topology scenario, single outages
Loadings Outage Overloaded line(s) MVA % Country
TR 400/220 kV URECHESI 414.9 103.7 OHL 220 kV LOTRU-SIBIU ckt. 1 & 2 311.3 109.4 OHL 220 kV URECHESI-TG.JIU OHL 220 kV TG.JIU-PAROSEN 277.5 132.3
ROMANIA
Base case
OHL 220 kV JBGD3 21-JOBREN2 299.9 103.8 SERBIA OHL 400 kV AELBS21-AZEMLA1 OHL 220 kV AKASHA2-ARRAZH2 242.5 100.5 OHL 220 kV AELBS12-AFIER 2 OHL 220 kV AKASHA2-ARRAZH2 359.7 143.7 TR 400/110 kV AZEMLA1-AZEMLK5 OHL 220 kV AKASHA2-ARRAZH2 254.1 102.6 OHL 220 kV AFIERZ2-ABURRE2 OHL 220 kV AKASHA2-ARRAZH2 TR 400/220 kV AELBS21-AELBS22 OHL 220 kV AKASHA2-ARRAZH2
ALBANIA
OHL 400 kV RP TREB-JPODG221 OHL 220 kV AKASHA2-ARRAZH2 B&H/MONT
/ALB OHL 220 kV G_ORIAH-MI_2_220 OHL 220 kV MI_2_220_ST.ZAGORA 254.6 104.7 BULGARIA OHL 400 kV TANTAREN-BRADU OHL 220 kV BUC.S-B-FUNDENI 328.6 107.7 OHL 400 kV DOMNESTI-BUC.S OHL 220 kV BUC.S-B-FUNDENI 321.0 102.3 OHL 400 kV DOMNESTI-BRAZI OHL 220 kV BUC.S-B-FUNDENI 354.5 114.1 OHL 220 kV P.D.F.A-CALAFAT OHL 220 kV P.D.F.A-CETATE1 259.6 128.2 OHL 220 kV P.D.F.A-RESITA ckt.1 OHL 220 kV P.D.F.A-RESITA ckt.2 335.1 127.6 OHL 220 kV RESITA-TIMIS ckt.1 OHL 220 kV RESITA-TIMIS ckt.2 338.3 126.1 OHL 220 kV FUNDENI- BUC.S-B OHL 220 kV BUC.S-B-FUNDENI 367.8 117.8 TR 400/220 kV BRAZI OHL 220 kV BUC.S-B-FUNDENI 369.5 121.8
ROMANIA
OHL 400 kV JHDJE11-JTDRMN1 OHL 220 kV P.D.F.A-RESITA ckt.1&2 SER/ROM OHL 400 kV JTKOSB1-JPEC 1 OHL 220 kV AKASHA2-ARRAZH2 SER/ALB OHL 220 kV JBGD172-JBGD8 22 ckt.1 OHL 220 kV JBGD172-JBGD8 22 ckt.2 475.6 139.6 TR 400/220 kV JBGD8 OHL 220 kV JBGD3 22-JBGD8 22 366.1 108.4
SERBIA
Table 4.9.6 - Transformers overloadings for 2015–base case-wet hydrology-2015 topology scenario, single outages Loadings Outage Overloaded branch(es) MVA % Country
OHL 400 kV BLUKA 6-TS TUZL TR 400/110 kV UGLJEVIK 311.0 103.7 B&H OHL 220 kV BUC.S-B-FUNDENI TR 400/220 kV BRAZI 414.2 103.6 TR 400/220 kV BUC.S-BUC.S-B ckt.1 TR 400/220 kV BUC.S-BUC.S-B ckt.2 535.9 134.0 TR 400/110 kV BRASOV TR 400/110 kV DIRSTE 419.2 167.7 TR 400/110 kV DIRSTE TR 400/110 kV BRASOV 410.2 164.1 TR 400/220 kV SIBIU ckt.1 TR 400/220 kV SIBIU ckt.2 571.7 142.9
TR 400/220 kV BUC.S ckt.1 413.1 103.3 TR 400/220 kV BRAZI TR 400/220 kV BUC.S ckt.2 413.1 103.3
ROMANIA
TR 400/110 kV JKRAG ckt.1 TR 400/110 kV JKRAG ckt.2 314.4 104.8 TR 400/110 kV NIS ckt.1 TR 400/110 kV NIS ckt.2 OHL 220 kV JBGD3 22-JBGD8 22 TR 400/220 kV JBGD8 1-JBGD8 22 411.2 102.8 TR 400/110 kV JPANC ckt.1 TR 400/110 kV JPANC ckt.2 332.5 110.8 TR 400/110 kV JTKOSB ckt.1 TR 400/110 kV JTKOSB ckt.2
SERBIA

4.69
AUT
ALB
BIH
BUL
CRO
GRE
HUN
MKD
MNG
ROM
SRB
SVK
SLO
TUR
400 kV line or 400/x kV transformer220 kV line or 220/x kV transformer
critical elements
Figure 4.9.6 - Geographical positions of the critical elements for 2015-base case-wet hydrology-topology 2015 scenario
4.9.4 Summary of Impacts - 2015 topology versus 2010 topology Compared to the expected topology 2010, analyzed in previous chapter, it can be seen that the network losses are smaller as a consequence of building the new elements for 2015 network topology, especially in the cases of Albania, Serbia and Montenegro. Overall reduction of losses is around 35 MW. Comparing to the same generation pattern on the 2010 network topology, it is noticed that there are no significant changes in the total number of branches and the ranges of internal lines loading. Being compared to the same generation pattern on the 2010 network topology, it is noticed that there are significant voltage profile improvements, especially in the power systems of Albania and Serbia. Being compared to the same generation and demand scenario on the 2010 network topology, it is concluded that there are several new contingency cases in the power system of Albania and one new contingency case in the power systems of Romania and Bosnia and Herzegovina. At the same time, several contingency cases do not appear any more. These contingency cases are related to the power systems of Albania, Serbia and Romania, although it is noticed that the influence of the new investments is less significant in the power system of Romania than it is in Albania and southern Serbia. Planned new investments in 2015 make overall network performance better, especially in the region where new planed investments are to be realized (Albania, southern Serbia and Montenegro), but do
4.70
not solve all contingences which are happening for analyzed generation and demand scenario. Further internal network reinforcements, especially in the power systems of Romania, Albania and Serbia, will be necessary in order to allow such generation dispatch with significant level of network operation security.

5.1
5 LOAD FLOW AND CONTINGENCY ANALYSIS – SENSITIVITY CASES

5.2
Introduction In this chapter load-flow and security (n-1) analysis for sensitivity cases defined in Chapter 2 is described. The analyzed network models are:
Special conditions Year Topology
2010 2010 2010 Import/Export 2015 2015
2010 2010 2010 High load 2015 2015
The load-flow analysis includes line loading and voltage profile analysis, analysis of losses and also analysis of power flows through interconnection lines. The system reliability and adequacy is checked using “n-1” contingency criterion. List of contingencies includes:
• all interconnection lines; • all 400 and 220 kV lines in analyzed region, except lines which outage cause “island”
operation (in case of parallel and double circuit lines, outage of one line is considered); • all transformers 400/x kV in analyzed region (in case of parallel transformers, outage of one
transformer is considered). Current thermal limits are used as rated limits of lines and transformers, as described in Chapter 2. Voltage limits are defined in Chapter 2, also. Every branch with current above its thermal limit is treated as overloaded. States with overloaded branches and/or voltages below or above defined voltage limits are treated as "insecure".
5.1 Scenario 2010 – average hydrology – import/export - 2010 topology This part of the Study presents results of static load flow and voltage profile analyses that are conducted for complete network topology and (n-1) contingencies in the scenario which is denoted as Scenario 2010 – sensitivity case – average hydrology – import 1500 MW. Concerning the import/export case, the simulated regime means the following: Import 750 MW from UCTE Import 500 MW from Turkey Export 500 MW to Greece Import 750 MW from Ukraine
5.1.1 Line loadings Area totals and power exchanges for the 2010-sensitivity case-average hydrology-import 1500 MW scenario are shown in Figure 5.1.1 and Table 5.1.1. Power flows along regional interconnection lines and system balances are shown in Figure 5.1.2. Power flows along interconnection lines are also given in Table 5.1.2, while Figure 5.1.3 shows histogram of tie lines loadings.
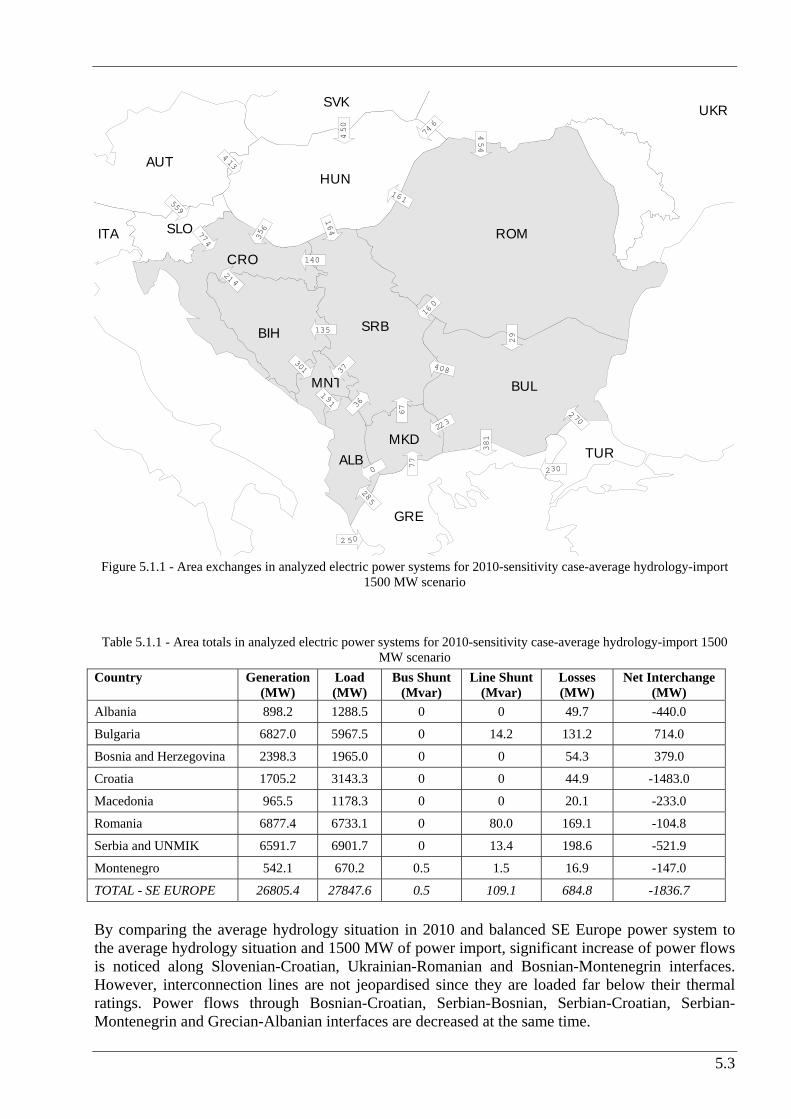
5.3
AUT
ALB
BIH
BUL
CRO
GRE
ITA
HUN
MKD
MNT
ROM
SRB
SVK
SLO
TUR
UKR
301
135
140
774
559
35 6
164
161
37
1 91 36
285
223
408
77
67
29
381
160
454
450
413
746
2 70
2 50
21 4
0 230
Figure 5.1.1 - Area exchanges in analyzed electric power systems for 2010-sensitivity case-average hydrology-import
1500 MW scenario
Table 5.1.1 - Area totals in analyzed electric power systems for 2010-sensitivity case-average hydrology-import 1500 MW scenario
Country Generation (MW)
Load (MW)
Bus Shunt (Mvar)
Line Shunt (Mvar)
Losses (MW)
Net Interchange (MW)
Albania 898.2 1288.5 0 0 49.7 -440.0
Bulgaria 6827.0 5967.5 0 14.2 131.2 714.0
Bosnia and Herzegovina 2398.3 1965.0 0 0 54.3 379.0
Croatia 1705.2 3143.3 0 0 44.9 -1483.0
Macedonia 965.5 1178.3 0 0 20.1 -233.0
Romania 6877.4 6733.1 0 80.0 169.1 -104.8
Serbia and UNMIK 6591.7 6901.7 0 13.4 198.6 -521.9
Montenegro 542.1 670.2 0.5 1.5 16.9 -147.0
TOTAL - SE EUROPE 26805.4 27847.6 0.5 109.1 684.8 -1836.7 By comparing the average hydrology situation in 2010 and balanced SE Europe power system to the average hydrology situation and 1500 MW of power import, significant increase of power flows is noticed along Slovenian-Croatian, Ukrainian-Romanian and Bosnian-Montenegrin interfaces. However, interconnection lines are not jeopardised since they are loaded far below their thermal ratings. Power flows through Bosnian-Croatian, Serbian-Bosnian, Serbian-Croatian, Serbian-Montenegrin and Grecian-Albanian interfaces are decreased at the same time.
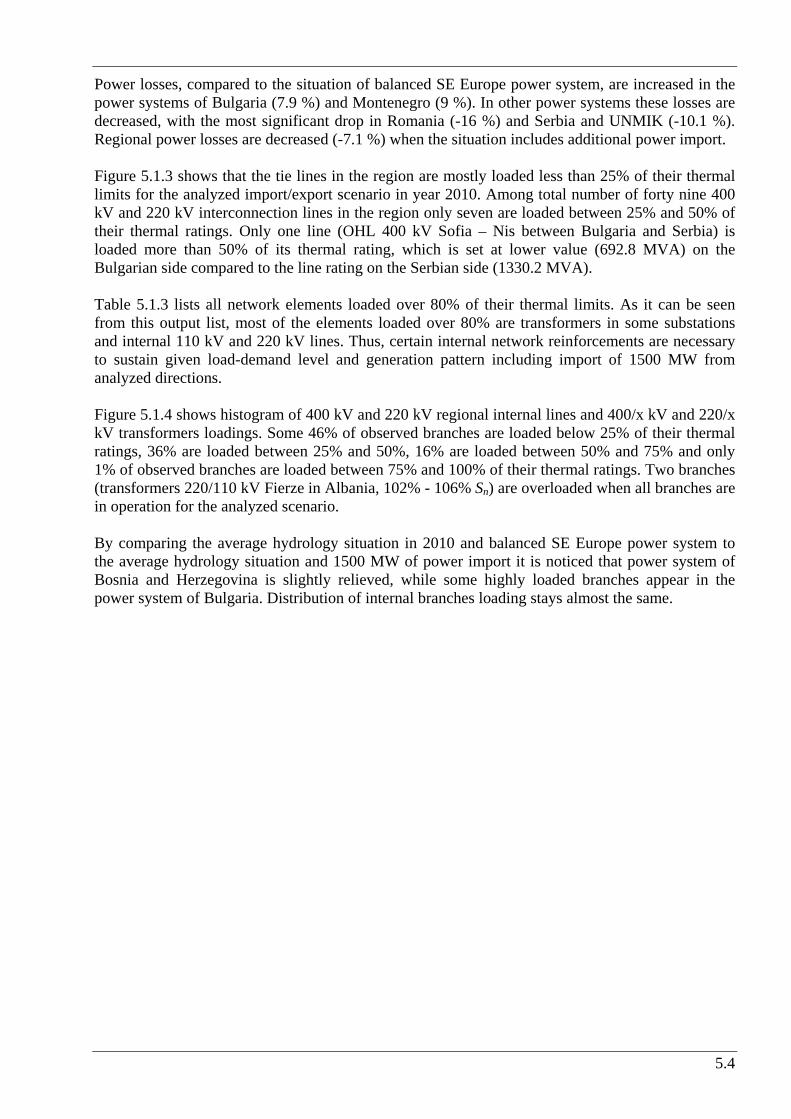
5.4
Power losses, compared to the situation of balanced SE Europe power system, are increased in the power systems of Bulgaria (7.9 %) and Montenegro (9 %). In other power systems these losses are decreased, with the most significant drop in Romania (-16 %) and Serbia and UNMIK (-10.1 %). Regional power losses are decreased (-7.1 %) when the situation includes additional power import. Figure 5.1.3 shows that the tie lines in the region are mostly loaded less than 25% of their thermal limits for the analyzed import/export scenario in year 2010. Among total number of forty nine 400 kV and 220 kV interconnection lines in the region only seven are loaded between 25% and 50% of their thermal ratings. Only one line (OHL 400 kV Sofia – Nis between Bulgaria and Serbia) is loaded more than 50% of its thermal rating, which is set at lower value (692.8 MVA) on the Bulgarian side compared to the line rating on the Serbian side (1330.2 MVA). Table 5.1.3 lists all network elements loaded over 80% of their thermal limits. As it can be seen from this output list, most of the elements loaded over 80% are transformers in some substations and internal 110 kV and 220 kV lines. Thus, certain internal network reinforcements are necessary to sustain given load-demand level and generation pattern including import of 1500 MW from analyzed directions. Figure 5.1.4 shows histogram of 400 kV and 220 kV regional internal lines and 400/x kV and 220/x kV transformers loadings. Some 46% of observed branches are loaded below 25% of their thermal ratings, 36% are loaded between 25% and 50%, 16% are loaded between 50% and 75% and only 1% of observed branches are loaded between 75% and 100% of their thermal ratings. Two branches (transformers 220/110 kV Fierze in Albania, 102% - 106% Sn) are overloaded when all branches are in operation for the analyzed scenario. By comparing the average hydrology situation in 2010 and balanced SE Europe power system to the average hydrology situation and 1500 MW of power import it is noticed that power system of Bosnia and Herzegovina is slightly relieved, while some highly loaded branches appear in the power system of Bulgaria. Distribution of internal branches loading stays almost the same.

5.5
Figure 5.1.2 - Power flows along interconnection lines in the region for 2010-sensitivity case-average hydrology-import 1500 MW scenario
PEHLIN 233.9
MELINA 407.5
TUMBRI 404.4
MEDURIC 227.0MRACLIN 227.4
DAKOVO 226.3
KONJSKO
410.6
HE ZAKUC
234.6
ZERJAVIN 407.3
ZERJAVIN 230.5
AZEMLA1
397.4
AKASHA1 384.3
AVDEJA2226.4AFIERZ2226.7
OWIEN 1
405.0
OWIEN 2
233.5
MGYOR 4
403.4
MGYOR 2
228.6
ONEUSI2
232.8
OKAINA1402.6
LMARIB1403.9
OOBERS2238.7
IRDPV111
401.2
LDIVAC1
403.0
IPDRV121
231.4
LDIVAC2
230.8
LKRSKO1 403.3
PRIJED2 226.5
GRADACAC 228.8
TE TUZL 233.9
JSMIT21
404.9
VISEGRA233.0
JVARDI22230.9
SA 20232.7
JHPIVA21235.2
RP TREB402.9
JHPERU21
228.3
JPODG211
394.7
MO-4
409.6
MHEVI 4 410.2
RP TREB
232.3
JPODG121227.1
JPRIZ22219.0 JTKOSA2221.4JTKOSB1395.7
401.3
BITOLA 2 414.1
AHS_FLWR415.8
DUBROVO 409.4
QES/H K 411.0
BLAGOEV412.9
STIP 1
409.6
C_MOGILA
412.4
JNIS2 1392.5
SOFIA_W4410.7
KARDIA K414.7
GABICK1400.0
MGOD 4 408.2
LEVIC 1400.0
MSAJO 4410.0
UMUKACH
412.0
ROSIORI 410.4
MKISV 2226.3
UMUKACH2
224.4
MTLOK 2
230.5
MSAFA 4 406.1
JSUBO31 400.6
ARAD
407.0
TANTAREN 416.2
AEC_400 415.6
JHDJE11
407.5
LPODLO2229.7
FILIPPOI
414.6
SK 1 219.1
LCIRKO2 228.8
P.D.FIE
407.7
UGLJEVIK 406.6
ISACCEA 414.5
DOBRUD4 420.7
JSOMB31398.4
MPECS 4 410.3
UZUKRA01772.5
MAISA 7716.0
NADAB407.8
MBEKO 4408.6
SK 4 403.3
JLESK21382.6
ERNESTIN
409.0
MO-4
235.1
MI_3_4_1 419.2
JVRAN310.000
LAGAD K 412.1
KARACQOU416.3KARACQOU416.3
K-KEXRU417.24BABAESK414.4
4HAMITAX
414.2
MSAJI 4408.2
AVDEJA1 393.2
287102
284148
145
2.6
36.1
45.94
6.0
1.3
80.60.8
28838.6
40.3
60.6
121
57.1
12117.9
197
93.9
199
45.6
14.161.3
73.617.7
73.96.1
10413.4
10316.4
21878.7
217113
14.059.1
46.2
7.0
35.7
53.1
7.6
20.7
7.6
10.2
7.6
20.7
7.6
10.2
51.2
43.6
10.1
65.6 6
6.3
42.2
66.4
18.5
16053.1
15954.1
114
25.5
113
23.8
114
25.5
405149
410128
35.821.3
35.928.1
37022.4
37450.7
45739.8
73.033.3
73.126.9
163
128
164
105
452
22.0
81.450.3
14.2
17.2
40.5
16.3
58.9
17.9 105
35.8
14089.2
271
62.8
271
62.8
51.3
38.6
51.3
38.6
87.2111
10.536.3
213
24.7
217
40.6
199
102
200
148
251
113
250
91.2
10.1
43.2
121
57.1
10.929.3
11.17.7
10272.0
10293.9
30.139.1
30.135.4
106
56.2
106
25.7
106
25.7
106
56.2
346800
350304
87.420.0
87.539.4
113
23.8
222
42.3
224
38.2
67.7
48.6
46.07.2
45.619.9
79.412.2
28775.9
40.2
2.1
13938.6
127
31.1
127
31.1
127
16.7 127
16.7
60.72.5
14.1
8.2
40.3
8.7 58.6
22.6
103
38.6
271
42.5
271
42.5
96.1
34.1
95.029.5
51.1
69.8 5
1.1
69.88
7.0
87.9
10.5
26.3
81.314.2
61.214.0
315
40.0
67.5
44.8
312
61.3
23054.4
1204.2315
40.0
1499.3
120
80.3 150106
23196.8
25050.0
12080.3
12090.9
51.1
90.5
145
27.5
131
108
130
145
ROM
BUL
HUN
UKRUCTE
CENTREL
CRO
BIH
SCG
ALB
GRE
MKD
TUR
SLO
CRGSRB
-668.9 MW
-147.0 MW-521.9 MW
-233.0 MW
714.0 MW
-440.0 MW
379.0 MW
971.8 MW
-1483.0 MW
-1250.0 MW
-500.1 MW
1200.0 MW
-104.9 MW
215.0 MW
500.0 MW
450.0 MW
SHAW POWERTECHNOLOGIESINC.R
2010 SENSITIVITY CASE - IMPORT 1500 MWKV: 110 , 220 , 400
BUS -VOLTAGE(KV)
EQUIPMENT -MW/MVARBRANCH -MW/MVAR
GIS REGIONAL MODEL - AVERAGE HYDRO

5.6
Table 5.1.2 - Power flows along regional interconnection lines for 2010-sensitivity case-average hydrology-import 1500 MW scenario
Power Flow
Interconnection line MW
Mvar
% of thermal rating
OHL 400 kV Zemlak (ALB) Kardia (GRE) -283.7 -148.0 24 OHL 220 kV Fierze (ALB) Prizren (SER) 36.1 45.9 21 OHL 220 kV V.Dejes (ALB) Podgorica (MON) -46.0 -1.3 16 OHL 400 kV V.Dejes (ALB) Podgorica (MON) -144.6 -27.5 11 OHL 400 kV Ugljevik (B&H) Ernestinovo (CRO) 40.3 -60.6 6 OHL 400 kV Mostar (B&H) Konjsko (CRO) 81.4 -50.3 7 OHL 400 kV Ugljevik (B&H) S. Mitrovica (SER) -120.9 17.9 10 OHL 400 kV Trebinje (B&H) Podgorica (MON) 218.2 78.7 19 OHL 220 kV Trebinje (B&H) Plat (CRO) -104.8 40.1 36 OHL 220 kV Prijedor (B&H) Mraclin (CRO) 38397 -17.2 7 OHL 220 kV Prijedor (B&H) Medjuric (CRO) 40.5 -16.3 13 OHL 220 kV Gradacac (B&H) Djakovo (CRO) 58.9 17.9 21 OHL 220 kV Tuzla (B&H) Djakovo (CRO) 104.6 35.8 36 OHL 220 kV Mostar (B&H) Zakucac (CRO) 61.2 -14.0 19 OHL 220 kV Visegrad (B&H) Vardiste (SER) -14.0 59.1 20 OHL 220 kV Sarajevo 20 (B&H) Piva (MON) -73.6 -17.7 19 OHL 220 kV Trebinje (B&H) Perucica (MON) 103.7 13.4 33 OHL 400 kV Blagoevgrad (BUL) Thessaloniki (GRE) 67.7 -48.6 12 OHL 400 kV M.East 3 (BUL) Filippi (GRE) 314.9 -40.0 44 OHL 400 kV M.East 3 (BUL) Babaeski (TUR) -119.9 4.2 11 OHL 400 kV M.East 3 (BUL) Hamitabat (TUR) -149.5 9.3 10 OHL 400 kV C.Mogila (BUL) Stip (MCD) 223.5 -38.2 32 OHL 400 kV Dobrudja (BUL) Isaccea (ROM) 198.6 -45.6 15 OHL 2x400 kV ckt.1 Kozloduy (BUL) Tantarena (ROM) -113.5 -23.8 9 OHL 2x400 kV ckt.2 Kozloduy (BUL) Tantarena (ROM) -113.5 -23.8 9 OHL 400 kV Sofia West (BUL) Nis (SER) 409.7 128.1 60 OHL 2x400 kV ckt.1 Zerjavinec (CRO) Heviz (HUN) -51.1 -69.8 6 OHL 2x400 kV ckt.2 Zerjavinec (CRO) Heviz (HUN) -51.1 -69.8 6 OHL 2x400 kV ckt.1 Ernestinovo (CRO) Pecs (HUN) -126.8 -31.1 10 OHL 2x400 kV ckt.2 Ernestinovo (CRO) Pecs (HUN) -126.8 -31.1 10 OHL 2x400 kV ckt.1 Tumbri (CRO) Krsko (SLO) -270.6 42.5 24 OHL 2x400 kV ckt.2 Tumbri (CRO) Krsko (SLO) -270.6 42.5 24 OHL 400 kV Melina (CRO) Divaca (SLO) -87.0 73.5 12 OHL 400 kV Ernestinovo (CRO) S.Mitrovica (SER) -139.2 38.6 12 OHL 220 kV Zerjavinec (CRO) Cirkovce (SLO) -95.0 29.5 32 OHL 220 kV Pehlin (CRO) Divaca (SLO) -10.5 26.3 11 OHL 400 kV Dubrovo (MCD) Thessaloniki (GRE) -66.3 -42.2 6 OHL 400 kV Bitola (MCD) Florina (GRE) -10.1 -65.6 5 OHL 400 kV Skopje (MCD) Kosovo B (UNMIK) 51.2 43.6 8 OHL 2x220 kV ckt.1 Skopje (MCD) Kosovo A (UNMIK) 7.6 -20.7 7 OHL 2x220 kV ckt.2 Skopje (MCD) Kosovo A (UNMIK) 7.6 -20.7 7 OHL 400 kV Arad (ROM) Sandorfalva (HUN) 73.1 -26.9 14 OHL 400 kV - Nadab (ROM) Bekescaba (HUN) 87.5 -39.4 8 OHL 400 kV Rosiori (ROM) Mukacevo (UKR) -452.1 22.0 38 OHL 400 kV Portile De Fier (ROM) Djerdap (SER) 159.5 53.1 12 OHL 400 kV Subotica (SER) Sandorfalva (HUN) -163.4 -127.7 17 OHL 400 kV Ribarevine (MON) Kosovo B (UNMIK) -38.0 12.2 5 OHL 220 kV Pljevlja (MON) Bajina Basta (SER) -73.1 5.8 24 OHL 220 kV Pljevlja (MON) Pozega (SER) 30.9 31.4 17

5.7
05
101520
253035
4045
x<25 25<x<50 50<x<75 75<x<100 x>100
Bin
Freq
uenc
y
Figure 5.1.3 - Histogram of interconnection lines loadings for 2010-sensitivity case-average hydrology-import
1500 MW scenario ("Frequency" denotes number of lines and "Bin" denotes loading range in % of thermal limit) Table 5.1.3 - Network elements loaded over 80% of thermal limits for 2010-sensitivity case-average hydrology-import
1500 MW scenario
AREA ELEMENT LOADINGMVA
RATINGMVA PERCENT
Lines ALB OHL 110 kV AFIERZ5-AFARRZ5 61.7 68.0 90.7 BUL OHL 220 kV M.EAST-ST.ZAGORA 188.8 228.6 82.6
Transformers TR 220/110 kV AFIER 2-AFIER 5 ckt.1 117.1 120.0 97.6 TR 220/110 kV AFIER 2-AFIER 5 ckt.2 96.0 90.0 106.6 ALB TR 220/110 kV AFIER 2-AFIER 5 ckt.3 91.6 90.0 101.8
ROM TR 220/110 kV FUNDENI-FUNDE2B 173.9 200.0 86.9
0
50
100
150
200
250
300
350
400
x<25 25<x<50 50<x<75 75<x<100 x>100
Bin
Freq
uenc
y
Figure 5.1.4 - Histogram of 400 kV and 220 kV regional lines loadings for 2010-sensitivity case-average hydrology-import 1500 MW scenario ("Frequency" denotes number of lines and "Bin" denotes loading range in % of thermal
limit)

5.8
5.1.2 Voltage Profile in the Region Voltage profile in the region within this scenario which is defined by given generation pattern and power import is seen as satisfactory despite several appearances of certain bus voltage deviations. The deviations are shown in Table 5.1.4, which includes only 400 kV and 220 kV network buses. Table 5.1.4 - Bus voltage deviations for 2010-sensitivity case-average hydrology-import 1500 MW scenario, complete
network Voltages Country Node
pu kV ALBANIA - - - BOSNIA AND HERZEGOVINA - - -
400 kV VARNA4 1.052 420.8 400 kV MARITSA EAST2 1.053 421.0 400 kV DOBRUD4 1.052 420.7 220 kV SESTRIMO 1.104 242.8 220 kV BPC_220 1.101 242.2 220 kV AEC_220 1.102 242.4
BULGARIA 220 kV TECVARNA 1.103 242.7 CROATIA - - - MACEDONIA - - - MONTENEGRO - - - ROMANIA - - - SERBIA AND UNMIK - - - Bus voltage magnitudes which are found below permitted limits (90% Vnominal in 220 kV network and 95% Vnominal in 400 kV network) are not detected in the analyzed scenario. Bus voltage magnitudes that are found above permitted limits (110% Vnominal in 110 kV and 220 kV networks and 105% Vnominal in 400 kV network) are detected only in Bulgaria, where tree 400 kV buses and four 220 kV buses have the magnitudes slightly above permitted limits. Figure 5.1.5 shows histogram of voltages in monitored 400 kV and 220 kV substations.
0
20
40
60
80
100
120
x<0.
9
0.9<
x<0.
95
0.95
<x<0
.975
0.97
5<x<
1
1<x<
1.02
5
1.02
5<x<
1.05
1.05
<x<1
.1
x>1.
1
Bin
Freq
uenc
y
Figure 5.1.5 - Histogram of voltages in monitored substations for 2010-sensitivity case-average hydrology-import
1500 MW scenario ("Frequency" denotes number of busses and "Bin" denotes voltage range in p.u.)

5.9
It should be emphasized that these results represent only a situation when additional devices (transformer automatic tap changers, switchable shunts, etc.) are not used for voltage regulation. Impacts of such devices, which exist in many points of the SEE regional transmission network, need more comprehensive and thorough analysis.
5.1.3 Security (n-1) analysis Results of security (n-1) analysis for the 2010-sensitivity case-average hydrology-import 1500 MW scenario are presented in Tables 5.1.5 - 5.1.6. Insecure system situations for given generation pattern and power import are detected in the power systems of Albania, Bulgaria, Romania and Serbia. Loss of 220 kV line between the Rrashbul and Tirana substations can cause overloading of 220 kV line between the Elbassan and Fier substations in Albania. The opposite case is also found critical. Loss of 400 kV line in Bulgaria, M.East 2-Bourgas can cause overloading of 400 kV line Plovdiv-M. East 3. Loss of 220 kV line M. East 2-G.Oryahovitsa can cause overloading of 220 kV line M. East 2-St. Zagora. Single outages of 400/110 kV transformers in the stations Brasov and Dirste in Romania are also found critical, since in the model the second transformer 400/110 kV in the Brasov substation is permanently switched out of operation. Loss of OHL 220 kV in the Belgrade area can cause overloading of the parallel line. Loss of 220 kV line between pumped storage power plant Bajina Basta and SS Pozega is also found critical. Loss of one 400/110 kV transformer in the Nis substation is critical due to possible overloading of the other parallel one but this problem could be solved by dispatcher intervention. Figure 5.1.6 shows geographical positions of critical elements in the analyzed scenario. A green colour reveals 220 kV elements (line 220 kV or transformer 220/x kV), while a red one reveals 400 kV elements (line 400 kV or transformer 400/x kV). According to the obtained and presented results, it may be concluded that certain reinforcements in the internal networks of Romania, Bulgaria, Albania and Serbia are necessary shall this generation pattern and 1500 MW of power import be made more secure. None of the identified congestions is located at the border lines. By comparing the average hydrology situation in 2010 and balanced SE Europe power system to the average hydrology situation and 1500 MW of power import, it may be noticed that some critical contingencies in the Romanian power system disappear, especially those connected with Mintia substation, while some new contingencies appear in the power system of Bulgaria (lines around Maritsa East substation). This is due to different dispatching conditions of DEVA 1 power plant in Romania (disconnected in import/export scenario, dispatched with 850 MW in the base case) and power import through Turkish-Bulgarian interface that goes through Maritsa East 3 substation.

5.10
Table 5.1.5 - Lines overloadings for 2010-sensitivity case-average hydrology-import 1500 MW scenario, single outages
Loadings Outage Overloaded line(s) MVA %
Country
OHL 220 kV AKASHA2-ARRAZH2 OHL 220 kV AELBS12-AFIER 2 254.8 116.3 OHL 220 kV AELBS12-AFIER 2 OHL 220 kV AKASHA2-ARRAZH2 263.3 100.6
ALBANIA
OHL 400 kV BURGAS-MI_2_400 OHL 400 kV PLOVDIV4-MI_400 762.3 107.4 OHL 220 kV G_ORIAH-MI_2_220 OHL 220 kV MI_2_220-ST.ZAGORA 255.0 104.2
BULGARIA
OHL 220 kV JBGD172-JBGD8 22 ckt.1 OHL 220 kV JBGD172-JBGD8 22 ckt.2 438.3 122.9 OHL 220 kV JBBAST2-JPOZEG2 OHL 220 kV JPOZEG2-JVARDI22 294.0 100.0
SERBIA
Table 5.1.6 - Transformers overloadings for 2010-sensitivity case-average hydrology-import 1500 MW scenario, single
outages Loadings Outage Overloaded branch(es) MVA %
Country
TR 400/220 kV BUC.S ckt.1 TR 400/220 kV BUC.S ckt.2 407.4 101.9 400/110 kV BRASOV 400/110 kV DIRSTE 343.9 137.5 400/110 kV DIRSTE 400/110 kV BRASOV 340.6 136.2
ROMANIA
400/110 kV NIS ckt.1 400/110 kV NIS ckt.2 304.8 101.6 SERBIA
AUT
ALB
BIH
BUL
CRO
GRE
HUN
MKD
MNG
ROM
SRB
SVK
SLO
TUR
400 kV line or 400/x kV transformer220 kV line or 220/x kV transformer
critical elements
Figure 5.1.6 - Geographical positions of the critical elements for 2010-sensitivity case-average hydrology-import 1500
MW scenario
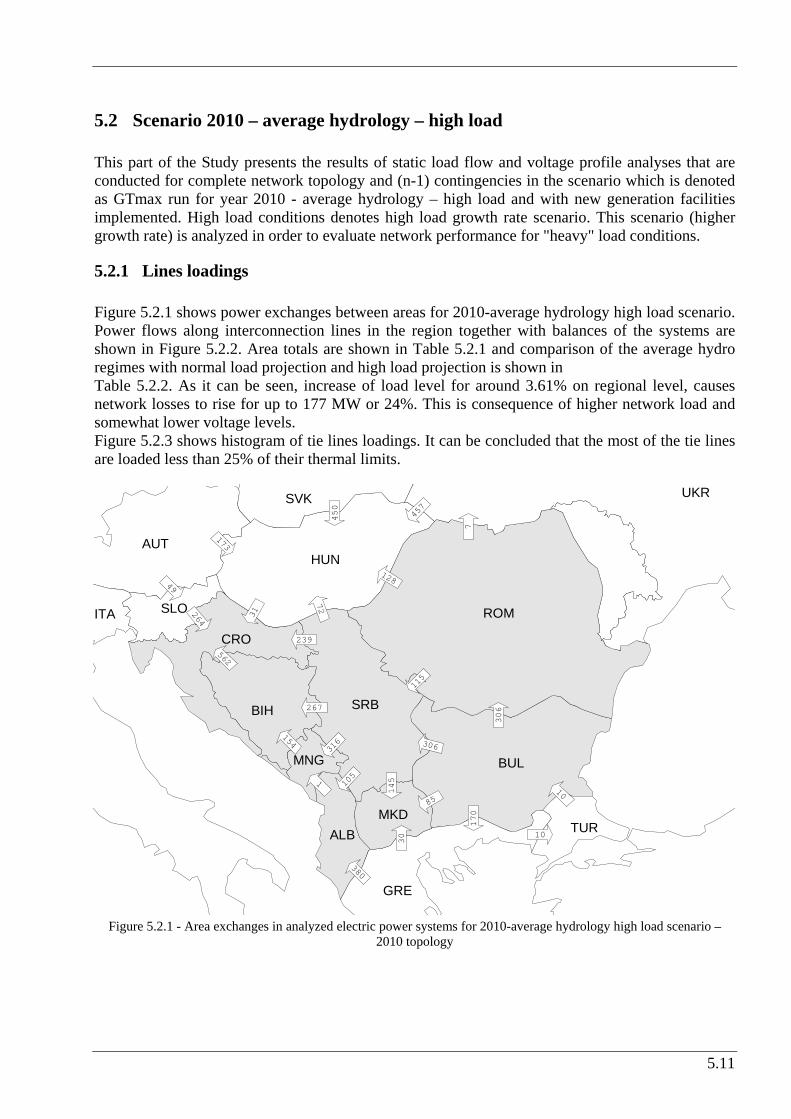
5.11
5.2 Scenario 2010 – average hydrology – high load This part of the Study presents the results of static load flow and voltage profile analyses that are conducted for complete network topology and (n-1) contingencies in the scenario which is denoted as GTmax run for year 2010 - average hydrology – high load and with new generation facilities implemented. High load conditions denotes high load growth rate scenario. This scenario (higher growth rate) is analyzed in order to evaluate network performance for "heavy" load conditions.
5.2.1 Lines loadings Figure 5.2.1 shows power exchanges between areas for 2010-average hydrology high load scenario. Power flows along interconnection lines in the region together with balances of the systems are shown in Figure 5.2.2. Area totals are shown in Table 5.2.1 and comparison of the average hydro regimes with normal load projection and high load projection is shown in Table 5.2.2. As it can be seen, increase of load level for around 3.61% on regional level, causes network losses to rise for up to 177 MW or 24%. This is consequence of higher network load and somewhat lower voltage levels. Figure 5.2.3 shows histogram of tie lines loadings. It can be concluded that the most of the tie lines are loaded less than 25% of their thermal limits.
AUT
ALB
BIH
BUL
CRO
GRE
ITA
HUN
MKD
MNG
ROM
SRB
SVK
SLO
TUR
UKR154
267
239
264
49
31
72
128
316
1 105
380
85
306
30
145
306
170
115
7
450
173
457
10
10
562
Figure 5.2.1 - Area exchanges in analyzed electric power systems for 2010-average hydrology high load scenario –
2010 topology
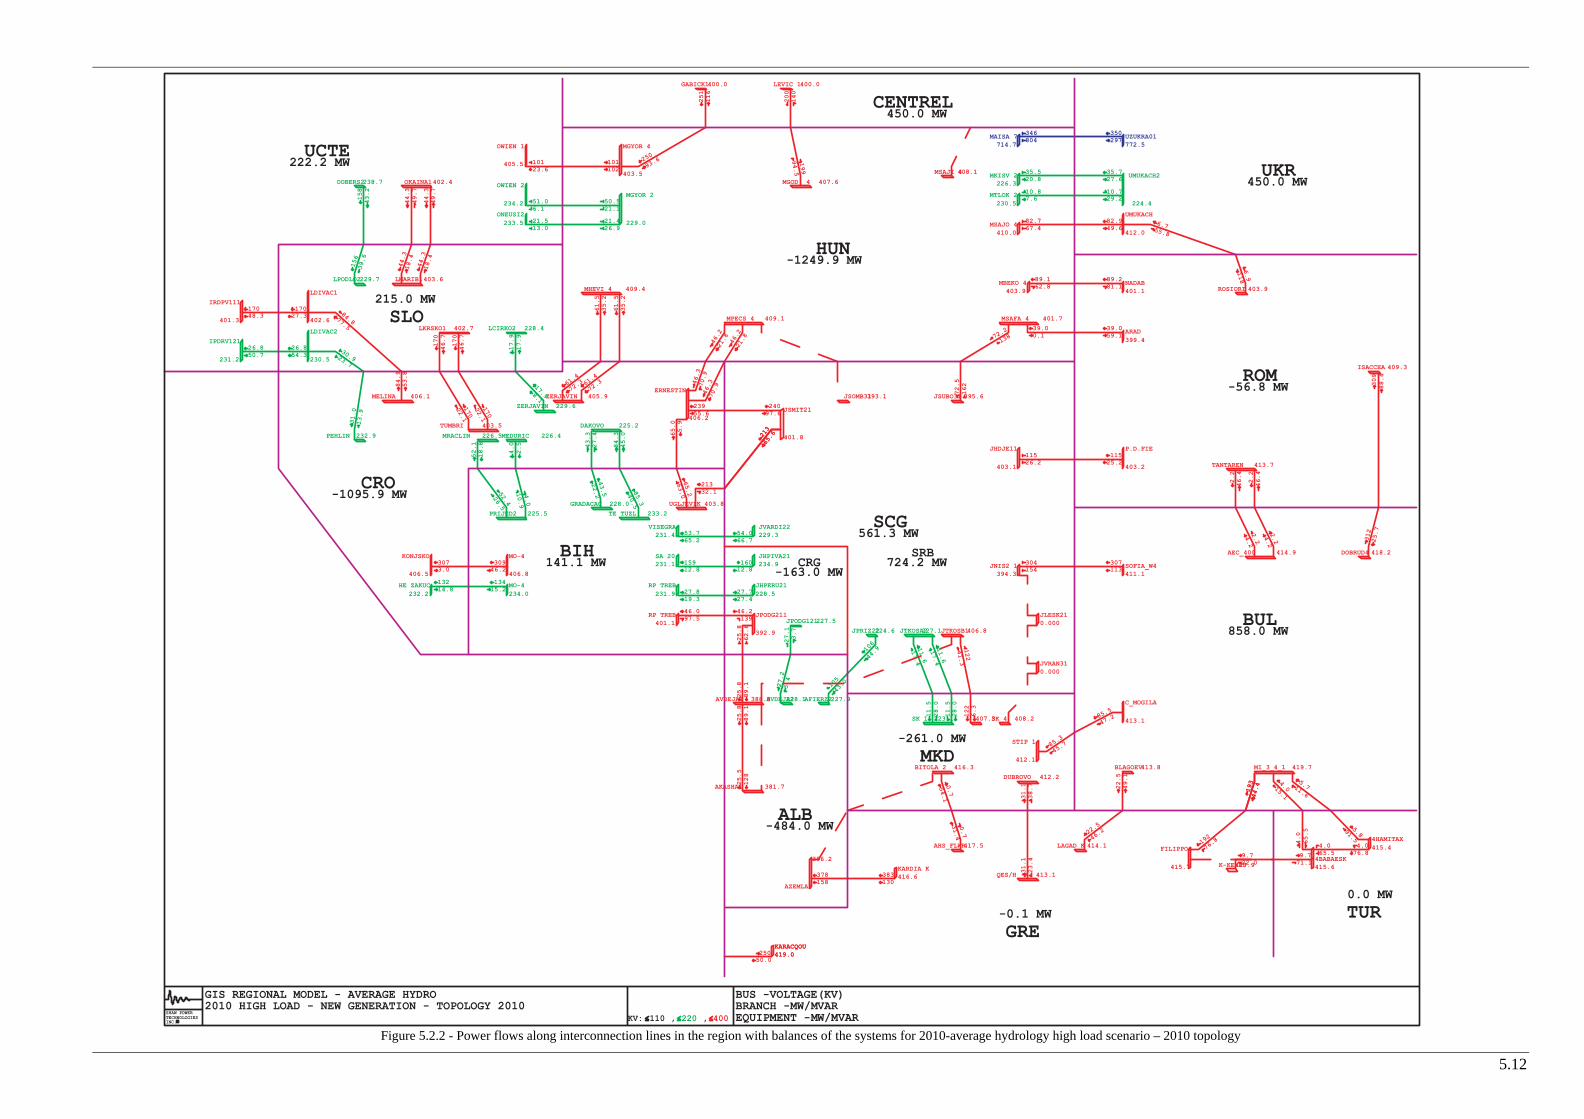
5.12
Figure 5.2.2 - Power flows along interconnection lines in the region with balances of the systems for 2010-average hydrology high load scenario – 2010 topology
PEHLIN 232.9
MELINA 406.1
TUMBRI 403.5
MEDURIC 226.4MRACLIN 226.5
DAKOVO 225.2
KONJSKO
406.5
HE ZAKUC
232.2
ZERJAVIN 405.9
ZERJAVIN 229.6
AZEMLA1
396.2
AKASHA1 381.7
AVDEJA2228.1AFIERZ2227.9
OWIEN 1
405.5
OWIEN 2
234.2
MGYOR 4
403.5
MGYOR 2
229.0
ONEUSI2
233.5
OKAINA1402.4
LMARIB1403.6
OOBERS2238.7
IRDPV111
401.3
LDIVAC1
402.6
IPDRV121
231.2
LDIVAC2
230.5
LKRSKO1 402.7
PRIJED2 225.5
GRADACAC 228.0
TE TUZL 233.2
JSMIT21
401.8
VISEGRA231.4
JVARDI22229.3
SA 20231.1
JHPIVA21234.9
RP TREB401.1
JHPERU21
228.5
JPODG211
392.9
MO-4
406.8
MHEVI 4 409.4
RP TREB
231.9
JPODG121227.5
JPRIZ22224.6 JTKOSA2227.1JTKOSB1406.8
407.3
BITOLA 2 416.3
AHS_FLWR417.5
DUBROVO 412.2
QES/H K 413.1
BLAGOEV413.8
STIP 1
412.1
C_MOGILA
413.1
JNIS2 1394.3
SOFIA_W4411.1
KARDIA K416.6
GABICK1400.0
MGOD 4 407.6
LEVIC 1400.0
MSAJO 4410.0
UMUKACH
412.0
ROSIORI 403.9
MKISV 2226.3
UMUKACH2
224.4
MTLOK 2
230.5
MSAFA 4 401.7
JSUBO31 395.6
ARAD
399.4
TANTAREN 413.7
AEC_400 414.9
JHDJE11
403.1
LPODLO2229.7
FILIPPOI
415.7
SK 1 223.1
LCIRKO2 228.4
P.D.FIE
403.2
UGLJEVIK 403.8
ISACCEA 409.3
DOBRUD4 418.2
JSOMB31393.1
MPECS 4 409.1
UZUKRA01772.5
MAISA 7714.7
NADAB401.1
MBEKO 4403.9
SK 4 408.2
JLESK210.000
ERNESTIN
406.2
MO-4
234.0
MI_3_4_1 419.7
JVRAN310.000
LAGAD K 414.1
KARACQOU419.0KARACQOU419.0
K-KEXRU417.94BABAESK415.6
4HAMITAX
415.4
MSAJI 4408.1
AVDEJA1 388.8
383130
378158
25.8
62.6
105
43.02
7.2
5.4
51.06.1
10123.6
65.2
63.0
213
65.6
21332.1
309
88.4
312
25.7
54.066.7
15912.8
16012.8
27.819.3
27.727.4
46.097.5
46.2139
53.765.2
27.1
3.7
106
44.9
11.5
28.0
11.6
17.4
11.5
28.0
11.6
17.4
122
6.3
0.7
54.1 3
1.1
38.7
31.1
23.4
11525.2
11526.2
2.2
46.4
2.2
4.2
2.2
46.4
304154
307113
35.520.8
35.727.6
82.767.4
82.949.6
6.755.8
39.00.1
39.059.1
72.5
162
72.2
138
6.9
118
30946.2
52.4
26.5
4.0
10.9
43.5
22.2 85.3
40.5
24097.6
170
46.7
170
46.7
61.5
35.2
61.5
35.2
84.877.5
30.923.7
156
39.6
158
43.2
199
94.5
200
140
251
116
250
93.6
0.7
31.4
213
65.6
10.729.2
10.87.6
17027.3
17048.3
26.854.3
26.850.7
44.3
49.7
44.3
18.4
44.3
18.4
44.3
49.7
346804
350297
89.162.8
89.281.1
2.2
4.2
85.3
45.7
85.5
47.2
22.5
49.1
21.513.0
21.426.9
50.521.1
101102
65.0
5.9
23955.6
46.3
70.9
46.3
70.9
46.2
21.8 46.2
21.8
13214.8
52.1
18.8
4.0
2.5 43.3
27.4
84.3
45.0
170
22.1
170
22.1
17.9
17.9
17.98.1
61.4
72.3 6
1.4
72.38
4.9
53.8
31.0
13.9
3073.0
13415.2
193
44.4
22.5
46.2
192
76.8
9.722.0
4.015.1
193
44.4
5.711.6
4.0
65.5 5.891.5
9.771.1
25050.0
4.065.5
4.076.8
122
41.3
25.8
89.1
25.8
89.1
25.5
128
ROM
BUL
HUN
UKRUCTE
CENTREL
CRO
BIH
SCG
ALB
GRE
MKD
TUR
SLO
CRGSRB
561.3 MW
-163.0 MW724.2 MW
-261.0 MW
858.0 MW
-484.0 MW
141.1 MW
222.2 MW
-1095.9 MW
-1249.9 MW
-0.1 MW
450.0 MW
-56.8 MW
215.0 MW
0.0 MW
450.0 MW
SHAW POWERTECHNOLOGIESINC.R
GIS REGIONAL MODEL - AVERAGE HYDRO2010 HIGH LOAD - NEW GENERATION - TOPOLOGY 2010
KV: 110 , 220 , 400
BUS -VOLTAGE(KV)
EQUIPMENT -MW/MVARBRANCH -MW/MVAR

5.13
Table 5.2.1 - Area totals in analyzed electric power systems for 2010- average hydrology high load scenario – 2010 topology
AREA GENERATION LOAD LOSSES INTERCHANGE ALBANIA 931.7 1358 57.7 -484
BULGARIA 7282.5 6278 146.5 858 BIH 2202.8 2004 57.8 141.1
CROATIA 2254.6 3295 55.4 -1095.9 MACEDONIA 991.1 1234 18.1 -261
ROMANIA 7113.3 6859.4 310.6 -56.7 SERBIA 8103.8 7131 248.6 724.2
MONTENEGRO 542.3 686 19.2 -163 TOTALS 29422.1 28845.4 913.9 -337.3
Table 5.2.2 – Comparison of Area totals in analyzed electric power systems for 2010- average hydrology versus average
hydrology high load scenario – 2010 topology LOAD LOSSES
AREA normal load high load normal
load high load
ALBANIA 1287.3 1358 5.49% 50.4 57.7 14.48% BULGARIA 5977.3 6278 5.03% 121.6 146.5 20.48%
BIH 1971.3 2004 1.66% 58.6 57.8 -1.37% CROATIA 3136.7 3295 5.05% 49 55.4 13.06%
MACEDONIA 1198.2 1234 2.99% 20.1 18.1 -9.95% ROMANIA 6728.3 6859.4 1.95% 201.2 310.6 54.37%
SERBIA 6873.1 7131 3.75% 220.8 248.6 12.59% MONTENEGRO 669.2 686 2.51% 15.5 19.2 23.87%
TOTALS 27841.4 28845.4 3.61% 737.1 913.9 23.99%
Histogram
0
5
10
15
20
25
30
35
40
45
x<25 25<x<50 50<x<75 75<x<100 x>100
Bin
Fr
eq
ue
nc
y
Figure 5.2.3 - Histogram of interconnection lines loadings for 2010- average hydrology high load scenario – 2010 topology ("Frequency" denotes number of lines and "Bin" denotes loading range in % of thermal limit)
Table 5.2.3 shows all network elements loaded over 80% of their thermal limits. As it can be seen some lines 220 kV voltage level in Albania, Romania and Serbia are loaded over 80%. Also, most of the elements loaded over 80% are transformers in some substations, again, in Albania, Romania and Serbia. Figure 5.2.4 shows histogram of branch loadings in the system.

5.14
As for the conclusion regarding thermal loadings in this scenario it can be said that most of the network elements are loaded up to 75% of their thermal limits, but there are some elements highly loaded, even overloaded. It can be concluded that overall load of the system is higher than by normal load projection. Higher load-demand level causes that increase of load of the elements which supply large consumption areas are is higher than increase of load-demand level. This goes especially for transformer units over which large consumption areas are connected to high voltage network. Also, most of the elements loaded over 80% are transformers in some substations, and loading of these elements is higher than in case of normal load projection. There are some elements that are overloaded (220 kV lines Targu Jiu – Paroseni and Urechesti-Targu Jiu in Romania, and 220/110 kV transformers in Fier substation in Albania), and this load is higher than in case of normal load projection. Like in previous scenarios analyzed, higher engagement of TPP Paroseni resolves this overloads of the 220 kV lines Targu Jiu – Paroseni and Urechesti-Targu Jiu and decreases the load of the 400/220 transformer in Urechesti substation. Also, it is expected that transformers in Fierza substation will be replaced with more powerful transformer units. Table 5.2.3 - Network elements loaded over 80% of their thermal limits for 2010-average hydrology high load scenario
– 2010 topology BRANCH LOADINGS ABOVE 80.0 % OF RATING:
AREA ELEMENT LOADINGMVA
RATINGMVA PERCENT
Lines HL 220kV P.D.F.A-RESITA 1 226.8 277.4 81.7 HL 220kV P.D.F.A-RESITA 2 226.8 277.4 81.7 HL 220kV TG.JIU-PAROSEN 1 277.8 208.1 133.5
ROM
HL 220kV URECHESI-TG.JIU 1 277.8 277.4 100.1 Transformers
TR 220/110 kV AFIER 1 122.2 120 101.8 TR 220/110 kV AFIER 2 100.1 90 111.3 ALB TR 220/110 kV AFIER 3 95.6 90 106.2 TR 400/220 kV URECHE 1 344.4 400 86.1
ROM TR 220/110 kV FUNDE2 1 178.6 200 89.3 TR 220/110 kV JTKOSA 2 131.5 150 87.7 TR 220/110 kV JTKOSA 3 133.9 150 89.3 TR 220/110 kV JZREN2 2 120.2 150 80.1
SRB
TR 400/220 kV JBGD8 1 326.3 400 81.6
Histogram
0
50
100
150
200
250
300
350
x<25 25<x<50 50<x<75 75<x<100 x>100
Bin
Fr
eq
ue
nc
y
Figure 5.2.4 - Histogram of branch loadings for 2010- average hydrology high load scenario – 2010 topology
("Frequency" denotes number of lines and "Bin" denotes loading range in % of thermal limit)

5.15
5.2.2 Voltage Profile in the Region Figure 5.2.5 shows histogram of voltages in monitored substations. Voltages in almost all monitored substations are found within permitted limits. Voltage profile in network of Albania is somewhat near low limits, but this can be resolved by changing of the setting of the tap changing transformers in some substations. Also, voltage levels are somewhat lower comparing to normal load projection scenario. Higher load of network elements, which is consequence of the higher demand level, causes voltage drops along network elements to be higher.
Histogram
0
20
40
60
80
100
120x<0.9
0.9<x<0.95
0.95<x<0.975
0.975<x<1
1<x<1.025
1.025<x<1.05
1.05<x<1.1
x>1.1
Bin
Fr
eq
ue
nc
y
Figure 5.2.5 - Histogram of voltages in monitored substations for 2010- average hydrology high load scenario –
2010 topology ("Frequency" denotes number of busses and "Bin" denotes voltage range in p.u.)
5.2.3 Security (n-1) analysis Results of security (n-1) analysis for 2010-average hydrology high load scenario and expected topology for 2010 are presented in Table 5.2.4. Figure 5.2.6 shows the geographical position of the critical elements in monitored systems. It can be concluded that all identified insecure situations are located in internal networks that belong to monitored power systems of Albania, Romania and Serbia. In most critical case in Romanian system, the critical elements are 220 kV lines Targu Jiu – Paroseni and Urechesti-Targu Jiu and 400/220 kV transformer in Urechesti substation, but these elements are overloaded in case of full topology also, which is the main reason why they appear as critical by most outages analyzed. As it has been stated before, this can be resolved by higher engagement of the TPP Paroseni. Compared to the normal load projection (chapter 4.1) it can be concluded that the critical elements are almost the same. The only difference is overload of the 400/110 kV transformer unit in SS Pancevo. This is cosequence of higher load of these transformers in full network topology compared to the normal demand scenario.

5.16
Like by normal demand scenario (chapter 4.1), some of the overloadings identified can be relieved by certain dispatch actions (splitting busbars, changing lower voltage network topology in order to redistribute load-demand or change of generation units engagement). All in all, certain reinforcement of internal network is necessary in order to make this regime more secure. Especially, taking into consideration that higher demand causes higher load of transformer units in whole monitored region.
Table 5.2.4 - Network overloadings for 2010- average hydrology high load scenario , single outages – 2010 topology
Area contingency Area
overloadings /
out of limits voltages #
limit /
Unom
Flow /
Voltage
rate /
volt.dev.1 2 3 4 5 6 7 8
BASE CASE RO HL 220kV TG.JIU-PAROSEN 1 208.1MVA 285.6MVA 133.5%AL OHL 220kV AELBS12 -AFIER 2 1 AL HL 220kV AKASHA2-ARRAZH2 1 270MVA 289.9MVA 112.2%
RO HL 220kV URECHESI-TG.JIU 1 277.4MVA 301.5MVA 106.1%RO HL 220kV P.D.F.A-RESITA 2 277.4MVA 331.5MVA 122.8%RO OHL 220kV P.D.F.A -RESITA 1 RO HL 220kV TG.JIU-PAROSEN 1 208.1MVA 301.5MVA 141.4%RO HL 220kV URECHESI-TG.JIU 1 277.4MVA 295.7MVA 103.9%RO HL 220kV RESITA-TIMIS 2 277.4MVA 348.7MVA 127.0%RO OHL 220kV RESITA -TIMIS 1 RO HL 220kV TG.JIU-PAROSEN 1 208.1MVA 295.7MVA 138.5%RO HL 220kV URECHESI-TG.JIU 1 277.4MVA 296.3MVA 104.8%RO OHL 220kV PESTIS -MINTIA A 1 RO HL 220kV TG.JIU-PAROSEN 1 208.1MVA 290.4MVA 139.7%
RO OHL 220kV CLUJ FL -AL.JL 1 RO HL 220kV TG.JIU-PAROSEN 1 208.1MVA 271MVA 126.4%RO HL 220kV URECHESI-TG.JIU 1 277.4MVA 308.8MVA 109.1%RO OHL 220kV AL.JL -GILCEAG 1 RO HL 220kV TG.JIU-PAROSEN 1 208.1MVA 308.8MVA 145.4%
RO OHL 400kV TANTAREN-URECHESI 1 RO HL 220kV URECHESI-TG.JIU 1 277.4MVA 292.5MVA 102.6%RO HL 220kV URECHESI-TG.JIU 1 277.4MVA 300.1MVA 105.9%RO OHL 400kV TANTAREN-BRADU 1 RO HL 220kV TG.JIU-PAROSEN 1 208.1MVA 300.1MVA 141.1%RO HL 220kV URECHESI-TG.JIU 1 277.4MVA 331.1MVA 117.3%RO OHL 400kV TANTAREN-SIBIU 1 RO HL 220kV TG.JIU-PAROSEN 1 208.1MVA 331.1MVA 156.4%
RO OHL 400kV URECHESI-P.D.FIE 1 RO HL 220kV TG.JIU-PAROSEN 1 208.1MVA 268.7MVA 124.5%RO TR 400/220kV/kV URECHESI 1 400MVA 400.6MVA 100.1%RO HL 220kV URECHESI-TG.JIU 1 277.4MVA 305.6MVA 107.7%RO OHL 400kV URECHESI-DOMNESTI 1 RO HL 220kV TG.JIU-PAROSEN 1 208.1MVA 305.6MVA 143.6%
RO OHL 400kV MINTIA -ARAD 1 RO HL 220kV TG.JIU-PAROSEN 1 208.1MVA 263.1MVA 123.1%RO HL 220kV URECHESI-TG.JIU 1 277.4MVA 326.2MVA 115.5%RO OHL 400kV MINTIA -SIBIU 1 RO HL 220kV TG.JIU-PAROSEN 1 208.1MVA 326.2MVA 153.9%RO HL 220kV URECHESI-TG.JIU 1 277.4MVA 296.2MVA 104.0%RO OHL 400kV DOMNESTI-BRAZI 1 RO HL 220kV TG.JIU-PAROSEN 1 208.1MVA 296.2MVA 138.7%RO HL 220kV URECHESI-TG.JIU 1 277.4MVA 296.9MVA 104.5%RO OHL 400kV SMIRDAN -GUTINAS 1 RO HL 220kV TG.JIU-PAROSEN 1 208.1MVA 296.9MVA 139.3%RO HL 220kV URECHESI-TG.JIU 1 277.4MVA 296.3MVA 104.3%RO OHL 400kV BRASOV -BRADU 1 RO HL 220kV TG.JIU-PAROSEN 1 208.1MVA 296.3MVA 139.0%
CS OHL 220kV JBGD172 -JBGD8 22 1 CS HL 220kV JBGD172-JBGD8 22 2 365.8MVA 453.5MVA 129.0%RO HL 220kV URECHESI-TG.JIU 1 277.4MVA 300.9MVA 106.1%CS OHL 400kV JBOR 21 -JHDJE11 1 RO HL 220kV TG.JIU-PAROSEN 1 208.1MVA 300.9MVA 141.4%RO HL 220kV URECHESI-TG.JIU 1 277.4MVA 315.8MVA 111.9%CS OHL 400kV JHDJE11 -JTDRMN1 1 RO HL 220kV TG.JIU-PAROSEN 1 208.1MVA 315.8MVA 149.1%RO HL 220kV URECHESI-TG.JIU 1 277.4MVA 304.1MVA 107.2%CS OHL 400kV JNSAD31 -JSUBO31 1 RO HL 220kV TG.JIU-PAROSEN 1 208.1MVA 304.1MVA 142.8%
RO TR 400/110 BRASOV 1 RO TR 400/110kV/kV DIRSTE 1 250MVA 353.9MVA 141.6%RO TR 400/110 DIRSTE 1 RO TR 400/110kV/kV BRASOV 1 250MVA 350MVA 140.0%CS TR 400/110 JNIS2 1 CS TR 400/110kV/kV JNIS2 1 2 300MVA 323.1MVA 107.7%CS TR 400/110 JPANC2 1 CS TR 400/110kV/kV JPANC21 2 300MVA 318.8MVA 106.3%

5.17
AUT
ALB
BIH
BUL
CRO
GRE
HUN
MKD
MNG
ROM
SRB
SVK
SLO
TUR
400 kV line or 400/x kV transformer220 kV line or 220/x kV transformer
critical elements
Figure 5.2.6 – geographical position of critical elements for 2010- average hydrology high load scenario –
2010 topology

5.18
5.3 Scenario 2015 – average hydrology – import/export – 2010 topology This part of the Study presents results of static load flow and voltage profile analyses that are conducted for complete network topology and (n-1) contingencies in the scenario which is denoted as Scenario 2015 – sensitivity case – average hydrology – import 1500 MW – topology 2010. Concerning the import/export case, the simulated regime means the following:
Import 750 MW from UCTE Import 500 MW from Turkey Export 500 MW to Greece Import 750 MW from Ukraine
Calculations on the model characterized by the 2010 network topology, appropriate GTMax generation dispatch, predicted load level in 2015 and power import/export as explained above, could not lead to a convergent load flow solution due to reactive power problems. Lack of reactive power in the analyzed situation is visible especially in the power system of Albania. If the power plants reactive limits are ignored in the model, a convergent solution is found and the following can be concluded:
There is a permanent lack of reactive power for analyzed generation dispatch, load level and power import/export in the power system of Albania. Generators in power plants Balsh, Fierza and Vau Dejes exceed their Var limits in order to keep nominal voltages. This proves the necessity to install compensation devices or new power plants in the Albanian power system, or to construct new interconnection lines to make network connections stronger.
Generators in Bulgarian power system, which are dispatched in the analyzed scenario
and whose reactive power limits are exceeded, are operated mostly in the under-excitation area below their minimum Var limits. This means that there is a sufficient reactive power reserve, but problems with high voltages may be expected especially in lower bus loading conditions (nights, summer).
Reactive power problems in the analyzed situation are not detected in the power systems
of Bosnia and Herzegovina, Croatia and Macedonia.
In the power system of Romania, the generator Var limits are occasionally exceeded in both directions (some generators work in the over-excitation area and some in the under-excitation one) in order to achieve scheduled (mostly nominal) voltages in the analyzed situation. The Var limits are not significantly exceeded when observing all dispatched generators in Romania.
Certain lack of reactive power is visibly present in the power system of Serbia and
UNMIK. Ten power plants are operated slightly above their maximum Var limits.
Smaller lack of reactive power also exists in the power system of Montenegro that is affected by the poor voltage profile in Albania.

5.19
To provide deeper insight into the voltage problems which are obviously present in the analyzed export/import scenario in 2015, but on the network topology predicted to exist in 2010, it is necessary to conduct more comprehensive and thorough analysis. It is assumed that the utilisation of existing devices such as transformer automatic tap changers and switchable shunts, or the generation re-dispatch may mitigate these voltage problems without a need to construct new lines. If new interconnection lines predicted to exist in 2015 are included in the model, Vranje (Serbia) – Skopje 4 (Macedonia), Zemlak (Albania) – Bitola 2 (Macedonia), and V. Dejes (Albania) – Kosovo B (UNMIK), a convergent solution is found. Power flow solution is explained in the following Chapter. A convergent solution for the 2010 network topology is found when only 400 kV line V.Dejes (Albania) – Kosovo B (UNMIK) is included in the model, but without satisfactory network voltage profile. Two 400 kV nodes in Albania (Elbassan and Tirana) and five 400 kV nodes in Romania (Domnesti, Dirste, Brazi, Brasov, Bradu) have small voltage values (between 374 kV and 379 kV). Two 220 kV nodes in Albania (Fier and Babic) have also small voltage values (193 kV and 196 kV respectively). Sixty two 110 kV nodes, mostly in Albania, have low voltages, ranging between 80 kV and 99 kV. Convergent solution on network topology in 2010 is found also if only 400 kV line Zemlak (Albania) – Bitola (Macedonia) is included on the model, but voltage profile in the network is unsatisfactory again. Two 400 kV nodes in Albania (Elbassan and Tirana) and five 400 kV nodes in Romania (Domnesti, Dirste, Brazi, Brasov, Bradu) have small voltage values (between 373 kV and 379 kV). Two 220 kV nodes in Albania (Fier and Babic) have small voltage values also (192 kV and 195 kV respectively). Seventy five 110 kV nodes, mostly in Albania, have low voltages, ranging between 78 kV and 99 kV. To conclude, the analyzed scenario which is characterized by large power import in 2015, but on the 2010 network topology, can not be supported from a transmission network viewpoint due to voltage problems. Their existence is the most obvious in the power system of Albania due to scarce reactive power sources. To mitigate such problems it is necessary to construct at least one new 400 kV interconnection line between Albania and UNMIK or Macedonia.

5.20
5.4 Scenario 2015 – average hydrology – import/export – 2015 topology This part of the Study presents results of static load flow and voltage profile analyses that are conducted for complete network topology and (n-1) contingencies in the scenario which is denoted as Scenario 2015 – sensitivity case – average hydrology – import 1500 MW – topology 2015.
5.4.1 Lines loadings Area totals and power exchanges for the 2015-sensitivity case-average hydrology-import 1500 MW-topology 2015 scenario are shown in Figure 5.4.1. Power flows along interconnection lines in the region together with balances of the systems are shown in Figure 5.4.2. Area totals are shown in Table 5.4.1. Table 5.4.2 shows power flows along regional interconnection lines for 2015-sensitivity case-average hydrology-import 1500 MW-topology 2015 scenario
AUT
ALB
BIH
BUL
CRO
GRE
ITA
HUN
MKD
MNT
ROM
SRB
SVK
SLO
TUR
UKR
88
245
175
829
614
17 8
1
62
20
28264
65
217
336
217
162
390
352
0
520
450
361
680
2 88
2 50
36 3
287 212
Figure 5.4.1 - Area exchanges in analyzed electric power systems for 2010-sensitivity case-average hydrology-import
1500 MW-topology 2015 scenario

5.21
Table 5.4.1 - Area totals in analyzed electric power systems for 2015-sensitivity case-average hydrology-import 1500 MW-topology 2015 scenario
Country Generation (MW)
Load (MW)
Bus Shunt (Mvar)
Line Shunt (Mvar)
Losses (MW)
Net Interchange (MW)
Albania 1027.5 1544.0 0 0 71.5 -588.0
Bulgaria 7582.2 6418.9 0 14.6 142.7 1006.0
Bosnia and Herzegovina 2394.9 2293.8 0 0 70.1 31.0
Croatia 2173.9 3660.1 0 0 58.8 -1545.0
Macedonia 1076.3 1393.7 0 0 22.5 -340.0
Romania 7187.7 7831.2 0 74.6 253.9 -972.0
Serbia and UNMIK 8029.8 7270.7 0 14.1 215.1 530.0
Montenegro 731.9 675.0 0.6 1.8 15.6 39.0
TOTAL - SE EUROPE 30204.2 31087.4 0.6 105.0 850.3 -1839.0 By comparing the average hydrology situation in 2015 and balanced SE Europe power system to the average hydrology situation and 1500 MW of power import, a significant increase of the power flows is noticed along the Slovenian-Croatian and Ukrainian-Romanian interfaces. However, the interconnection lines are not jeopardized since their loading levels fall far below their thermal ratings. In the same time, power flows through other interfaces between countries in the SE Europe are mostly decreased. Power losses, in comparison to the situation of balanced SE Europe power system, are increased only in the power system of Macedonia (5%). In other power systems power losses are decreased, the most significantly in the power systems of Romania (-26%) and Montenegro (-23%). Power losses are decreased (-16%) in the region when analyzing the additional power import. Figure 5.4.3 shows that all tie lines in the region are loaded less than 50% of their thermal limits for the analyzed import/export scenario in year 2015. Among total number of fifty two 400 kV and 220 kV interconnection lines in the region only ten are loaded between 25% and 50% of their thermal ratings. Other tie lines are loaded less than 25% of their thermal ratings. Table 5.4.3 lists all network elements loaded over 80% of their thermal limits. As it can be seen from this output list, most of the elements loaded over 80% are transformers in some substations and internal 110 kV and 220 kV lines. 110 kV lines which are loaded over 80% Ithermal are not shown in the table. Certain internal network reinforcements are necessary to sustain given load-demand level and production pattern including import of 1500 MW from analyzed directions. Figure 5.4.4 shows histogram of 400 kV and 220 kV regional internal lines and 400/x kV and 220/x kV transformers loadings. Some 40% of observed branches are loaded below 25% of their thermal ratings, 36% are loaded between 25% and 50%, 20% are loaded between 50% and 75% and 5% of observed branches are loaded between 75% and 100% of their thermal ratings. Four branches (transformers 220/110 kV Fierze in Albania, 102% - 106% Sn and 220/110 kV transformer in Fundeni substation in Romania) are overloaded when all branches are in operation. By comparing the average hydrology situation in 2015 and balanced SE Europe power system to the average hydrology situation and 1500 MW of power import, it is noticed that power system of Romania becomes slightly relieved while some highly loaded branches are present in the power systems of Albania, Serbia and Bulgaria. Distribution of internal branches loading is slightly changed because a number of branches loaded between 25% and 75% of their thermal ratings is increased compared to the situation characterized by balanced SE Europe power system.

5.22
Figure 5.4.2 - Power flows along interconnection lines in the region for 2015-sensitivity case-average hydrology-import 1500 MW-topology 2015 scenario
PEHLIN 229.8
MELINA 402.4
TUMBRI 399.8
MEDURIC 218.6MRACLIN 220.8
DAKOVO 221.8
KONJSKO
404.4
HE ZAKUC
231.0
ZERJAVIN 401.3
ZERJAVIN 225.7
AZEMLA1
406.4
AKASHA1 392.6
AVDEJA2227.7AFIERZ2227.9
OWIEN 1
404.4
OWIEN 2
233.3
MGYOR 4
402.9
MGYOR 2
228.4
ONEUSI2
232.6
OKAINA1399.7
LMARIB1400.9
OOBERS2236.5
IRDPV111
400.6
LDIVAC1
400.8
IPDRV121
230.3
LDIVAC2
229.3
LKRSKO1 399.9
PRIJED2 219.6
GRADACAC 224.7
TE TUZL 230.8
JSMIT21
400.5
VISEGRA232.5
JVARDI22231.2
SA 20230.8
JHPIVA21237.3
RP TREB404.3
JHPERU21
229.9
JPODG211
399.6
MO-4
405.9
MHEVI 4 407.2
RP TREB
232.6
JPODG121229.2
JPRIZ22222.9 JTKOSA2227.3JTKOSB1408.0
404.5
BITOLA 2 412.0
AHS_FLWR415.3
DUBROVO 408.8
QES/H K 411.2
BLAGOEV412.2
STIP 1
408.7
C_MOGILA
411.6
JNIS2 1398.3
SOFIA_W4410.0
KARDIA K415.4
GABICK1400.0
MGOD 4 407.6
LEVIC 1400.0
MSAJO 4410.0
UMUKACH
412.0
ROSIORI 400.5
MKISV 2226.3
UMUKACH2
224.4
MTLOK 2
230.5
MSAFA 4 401.6
JSUBO31 395.8
ARAD
399.3
TANTAREN 410.2
AEC_400 413.2
JHDJE11
402.1
LPODLO2227.8
FILIPPOI
414.6
SK 1 222.5
LCIRKO2 226.3
P.D.FIE
402.0
UGLJEVIK 400.3
ISACCEA 401.3
DOBRUD4 413.8
JSOMB31393.2
MPECS 4 407.7
UZUKRA01772.5
MAISA 7714.7
NADAB400.5
MBEKO 4403.5
SK 4 404.8
JLESK21398.6
ERNESTIN
403.5
MO-4
233.2
MI_3_4_1 418.0
JVRAN31401.8
LAGAD K 412.2
KARACQOU416.7KARACQOU416.7
K-KEXRU417.24BABAESK414.3
4HAMITAX
414.0
MSAJI 4408.2
AVDEJA1 399.4
59.040.8
58.6111
33.3
4.6
17.1
29.09
.7
15.2
74.51.5
24438.8
13.8
63.5
204
31.1
2042.8
391
88.3
396
3.928.9
41.1
15634.2
15834.1
42.011.2
41.819.0
0.643.1
0.787.8
28.838.7
9.8
5.6
16.9
37.8
11.1
32.8
11.3
22.3
11.1
32.8
11.3
22.3
217
47.0
184
102
61.0
50.9
61.1
9.8
2.132.3
2.131.2
28.5
76.6
28.5
27.1
28.5
76.6
302107
30562.6
35.821.0
35.927.7
31832.6
32152.6
51066.5
18.64.7
18.654.7
32.8
147
33.0
122
504
68.9
22830.6
16.0
20.2
5.9
3.2
52.0
22.8 101
45.3
14974.3
265
31.6
265
31.6
77.9
17.8
77.9
17.8
10760.1
37.514.2
214
21.9
218
38.7
199
94.3
200
140
251
102
250
79.7
184
82.5
204
31.1
10.929.2
11.07.6
1083.4
10825.4
49.967.1
49.963.7
121
55.0
121
25.3
121
25.3
121
55.0
346805
350296
6.058.5
6.177.6
28.5
27.1
61.9
14.2
181
14.1
181
32.7
196
47.0
197
36.0
50.5
53.9
41.08.1
40.721.1
73.513.7
24378.8
13.8
6.5
14825.3
25.5
84.1
25.5
84.1
25.5
35.4 25.5
35.4
1126.7
16.0
11.8
5.9
11.1 51.8
27.5
99.5
47.5
265
11.5
265
11.5
75.5
13.0
74.86.5
77.7
86.8 7
7.7
86.81
07
36.9
37.4
4.6
22721.9
11310.9
291
48.8
50.4
39.9
32.8
74.4
32.7
37.2
61.8
59.9
289
56.7
21455.6
1271.6291
48.8
1581.9
128
73.9 15997.7
21498.8
25050.0
12873.9
12884.4
280
39.7
279
75.7
218
5.8
290
47.0289
68.7
33.3
23.9
111
78.7
111
119
111
78.7
111
119
ROM
BUL
HUN
UKRUCTE
CENTREL
CRO
BIH
SCG
ALB
GRE
MKD
TUR
SLO
CRGSRB
569.0 MW
39.0 MW530.0 MW
-340.0 MW
1006.0 MW
-588.0 MW
31.0 MW
974.2 MW
-1545.0 MW
-1250.0 MW
-500.2 MW
1200.0 MW
-972.0 MW
215.0 MW
500.0 MW
450.0 MW
SHAW POWERTECHNOLOGIESINC.R KV: 110 , 220 , 400
BUS -VOLTAGE(KV)
EQUIPMENT -MW/MVARBRANCH -MW/MVAR2015 SENSITIVITY CASE - IMPORT 1500 MW - TOPOLOGY 2015
GIS REGIONAL MODEL - AVERAGE HYDRO

5.23
Table 5.4.2 - Power flows along regional interconnection lines for 2015-sensitivity case-average hydrology-import 1500 MW-topology 2015 scenario
Power Flow Interconnection line MW Mvar % of thermal
rating OHL 400 kV Zemlak (ALB) Kardia (GRE) -58.6 -110.9 9 OHL 220 kV Fierze (ALB) Prizren (SER) 17.1 29.0 14 OHL 220 kV V.Dejes (ALB) Podgorica (MON) -9.7 -15.2 6 OHL 400 kV V.Dejes (ALB) Podgorica (MON) 33.3 -23.9 3 OHL 400 kV Ugljevik (B&H) Ernestinovo (CRO) -13.8 -63.5 5 OHL 400 kV Mostar (B&H) Konjsko (CRO) 228.5 -30.6 17 OHL 400 kV Ugljevik (B&H) S. Mitrovica (SER) -203.8 -2.8 16 OHL 400 kV Trebinje (B&H) Podgorica (MON) -0.6 43.1 7 OHL 220 kV Trebinje (B&H) Plat (CRO) -104.8 40.0 36 OHL 220 kV Prijedor (B&H) Mraclin (CRO) 16.0 -20.2 8 OHL 220 kV Prijedor (B&H) Medjuric (CRO) 5.9 3.2 4 OHL 220 kV Gradacac (B&H) Djakovo (CRO) 52.0 22.8 20 OHL 220 kV Tuzla (B&H) Djakovo (CRO) 100.8 45.3 37 OHL 220 kV Mostar (B&H) Zakucac (CRO) 113.4 -10.9 36 OHL 220 kV Visegrad (B&H) Vardiste (SER) -28.8 38.7 16 OHL 220 kV Sarajevo 20 (B&H) Piva (MON) -156.5 -34.2 41 OHL 220 kV Trebinje (B&H) Perucica (MON) 42.0 11.2 15 OHL 400 kV Blagoevgrad (BUL) Thessaloniki (GRE) 50.5 -53.9 10 OHL 400 kV M.East 3 (BUL) Filippi (GRE) 290.6 -48.8 41 OHL 400 kV M.East 3 (BUL) Babaeski (TUR) -127.3 -1.6 12 OHL 400 kV M.East 3 (BUL) Hamitabat (TUR) -158.4 1.9 10 OHL 400 kV C.Mogila (BUL) Stip (MCD) 197.4 -36.0 28 OHL 400 kV Dobrudja (BUL) Isaccea (ROM) 396.1 3.9 29
OHL 2x400 kV ckt.1 Kozloduy (BUL) Tantarena (ROM) 28.5 27.1 6 OHL 2x400 kV ckt.2 Kozloduy (BUL) Tantarena (ROM) 28.5 27.1 6
OHL 400 kV Sofia West (BUL) Nis (SER) 304.5 62.6 44 OHL 2x400 kV ckt.1 Zerjavinec (CRO) Heviz (HUN) -77.7 -86.8 9 OHL 2x400 kV ckt.2 Zerjavinec (CRO) Heviz (HUN) -77.7 -86.8 9 OHL 2x400 kV ckt.1 Ernestinovo (CRO) Pecs (HUN) -25.5 -84.1 7 OHL 2x400 kV ckt.2 Ernestinovo (CRO) Pecs (HUN) -25.5 -84.1 7 OHL 2x400 kV ckt.1 Tumbri (CRO) Krsko (SLO) -264.6 11.5 23 OHL 2x400 kV ckt.2 Tumbri (CRO) Krsko (SLO) -264.6 11.5 23
OHL 400 kV Melina (CRO) Divaca (SLO) -106.6 22.8 11 OHL 400 kV Ernestinovo (CRO) S.Mitrovica (SER) -148.4 25.3 12 OHL 220 kV Zerjavinec (CRO) Cirkovce (SLO) -74.8 6.5 25 OHL 220 kV Pehlin (CRO) Divaca (SLO) -37.4 4.6 12 OHL 400 kV Dubrovo (MCD) Thessaloniki (GRE) -61.0 -50.9 5 OHL 400 kV Bitola (MCD) Florina (GRE) -183.9 -101.9 17 OHL 400 kV Skopje (MCD) Kosovo B (UNMIK) -216.8 -47.0 16
OHL 2x220 kV ckt.1 Skopje (MCD) Kosovo A (UNMIK) -11.1 -32.8 11 OHL 2x220 kV ckt.2 Skopje (MCD) Kosovo A (UNMIK) -11.1 -32.8 11
OHL 400 kV Arad (ROM) Sandorfalva (HUN) -18.6 -54.7 5 OHL 400 kV - Nadab (ROM) Bekescaba (HUN) 6.1 -77.6 6 OHL 400 kV Rosiori (ROM) Mukacevo (UKR) -503.9 -68.9 43 OHL 400 kV Portile De Fier (ROM) Djerdap (SER) -2.1 -32.3 2 OHL 400 kV Subotica (SER) Sandorfalva (HUN) -32.8 -147.1 11 OHL 400 kV Ribarevine (MON) Kosovo B (UNMIK) -148.4 -17.0 11 OHL 220 kV Pljevlja (MON) Bajina Basta (SER) -11.3 9.6 9 OHL 220 kV Pljevlja (MON) Pozega (SER) 75.9 40.3 29 OHL 400 kV* Skopje 4 (MCD) Vranje (SER) 61.9 14.2 6 OHL 400 kV* Zemlak (ALB) Bitola (MCD) -279.2 -75.7 21 OHL 400 kV* V.Dejes (ALB) Kosovo B (UNMIK) -289.3 -68.7 22
* new lines planned till 2015

5.24
05
101520
253035
4045
x<25 25<x<50 50<x<75 75<x<100 x>100
Bin
Freq
uenc
y
Figure 5.4.3 - Histogram of interconnection lines loadings for 2015-sensitivity case-average hydrology-import 1500 MW-topology 2015 scenario ("Frequency" denotes number of lines and "Bin" denotes loading range in % of thermal
limit) Table 5.4.3 - Network elements loaded over 80% of thermal limits for 2015-sensitivity case-average hydrology-import
1500 MW-topology 2015 scenario
AREA ELEMENT LOADINGMVA
RATING MVA PERCENT
Lines ALB OHL 220 kV AKASHA2-ARRAZH2 235.7 270.0 87.3
OHL 220 kV MI_2_220-ST ZAGORA 191.0 228.6 83.5 BUL OHL 400 kV PLOVDIV4-MI_400 605.2 692.8 87.4 OHL 220 kV BRADU-TIRGOVI 246.9 302.6 81.6 OHL 220 kV P.D.F.A-CETATE1 204.3 208.1 98.2 ROM OHL 220 kV BUC.S-B-FUNDENI 266.0 320.0 83.1
SRB OHL 220 kV JBGD3 21-JOBREN2 277.4 301.0 92.2 Transformers
TR 220/110 kV AFIERZ2-AFIERZ5 ckt.1 50.9 60.0 84.8 TR 220/110 kV AFIERZ2-AFIERZ5 ckt.2 50.9 60.0 84.8 TR 220/110 kV ABURRE2-ABURRL5 ckt. 1 49.1 40.0 81.8 TR 220/110 kV ABURRE2-ABURRL5 ckt. 2 49.1 40.0 81.8 TR 220/110 kV ABURRE2-ABURRL5 ckt. 3 49.1 40.0 81.8 TR 220/110 kV AELBS12-AELBS15 ckt.1 74.0 90.0 82.2 TR 220/110 kV AELBS12-AELBS15 ckt.2 74.0 90.0 82.2 TR 220/110 kV AELBS12-AELBS15 ckt.3 79.5 90.0 88.3 TR 220/110 kV AKASHA2-AKASH25 ckt.1 82.9 100.0 82.9 TR 220/110 kV AKASHA2-AKASH25 ckt.2 82.9 100.0 82.9 TR 220/110 kV AFIER 2-AFIER 5 ckt.1 130.7 120.0 108.9 TR 220/110 kV AFIER 2-AFIER 5 ckt.2 107.1 90.0 119.0
ALB
TR 220/110 kV AFIER 2-AFIER 5 ckt.3 102.2 90.0 113.6 B&H TR 400/110 kV UGLJEVIK 256.3 300.0 85.4
TR 400/110 kV BRASOV 202.5 250.0 81.0 TR 220/110 kV FUNDENI 181.0 200.0 90.5 ROM TR 220/110 kV FUNDENI-FUNDE2B 214.4 200.0 107.2 TR 220/110 kV JBGD3 21-JBGD 351 169.4 200.0 84.7 TR 220/110 kV JBGD3 22-JBGD 352 126.8 150.0 84.5 SRB TR 220/110 kV JZREN22-JZREN25 121.5 150.0 81.0

5.25
0
50
100
150
200
250
300
350
x<25 25<x<50 50<x<75 75<x<100 x>100
Bin
Freq
uenc
y
Figure 5.4.4 - Histogram of 400 kV and 220 kV regional branches loadings for 2015-sensitivity case-average
hydrology-import 1500 MW-topology 2015 scenario ("Frequency" denotes number of lines and "Bin" denotes loading range in % of thermal limit)
5.4.2 Voltage Profile in the Region Voltage profile in the region within this scenario which is defined by given generation pattern and power import is seen as satisfactory because there are no voltages outside permitted limits. Figure 5.4.5 shows histogram of voltages in monitored 400 kV and 220 kV substations.
0102030405060708090
100
x<0.
9
0.9<
x<0.
95
0.95
<x<0
.975
0.97
5<x<
1
1<x<
1.02
5
1.02
5<x<
1.05
1.05
<x<1
.1
x>1.
1
Bin
Freq
uenc
y
Figure 5.4.5 - Histogram of voltages in monitored substations for 2015-sensitivity case-average hydrology-import
1500 MW-topology 2015 scenario ("Frequency" denotes number of busses and "Bin" denotes voltage range in p.u.)
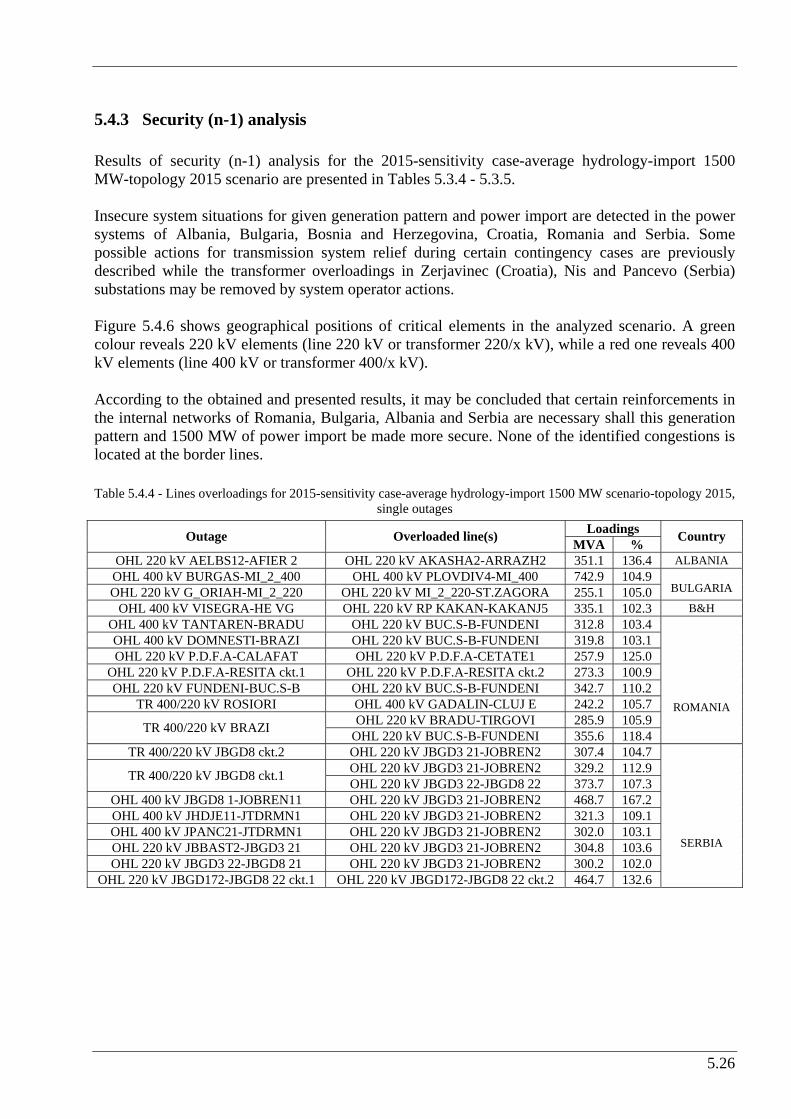
5.26
5.4.3 Security (n-1) analysis Results of security (n-1) analysis for the 2015-sensitivity case-average hydrology-import 1500 MW-topology 2015 scenario are presented in Tables 5.3.4 - 5.3.5. Insecure system situations for given generation pattern and power import are detected in the power systems of Albania, Bulgaria, Bosnia and Herzegovina, Croatia, Romania and Serbia. Some possible actions for transmission system relief during certain contingency cases are previously described while the transformer overloadings in Zerjavinec (Croatia), Nis and Pancevo (Serbia) substations may be removed by system operator actions. Figure 5.4.6 shows geographical positions of critical elements in the analyzed scenario. A green colour reveals 220 kV elements (line 220 kV or transformer 220/x kV), while a red one reveals 400 kV elements (line 400 kV or transformer 400/x kV). According to the obtained and presented results, it may be concluded that certain reinforcements in the internal networks of Romania, Bulgaria, Albania and Serbia are necessary shall this generation pattern and 1500 MW of power import be made more secure. None of the identified congestions is located at the border lines. Table 5.4.4 - Lines overloadings for 2015-sensitivity case-average hydrology-import 1500 MW scenario-topology 2015,
single outages Loadings Outage Overloaded line(s) MVA % Country
OHL 220 kV AELBS12-AFIER 2 OHL 220 kV AKASHA2-ARRAZH2 351.1 136.4 ALBANIA OHL 400 kV BURGAS-MI_2_400 OHL 400 kV PLOVDIV4-MI_400 742.9 104.9 OHL 220 kV G_ORIAH-MI_2_220 OHL 220 kV MI_2_220-ST.ZAGORA 255.1 105.0 BULGARIA
OHL 400 kV VISEGRA-HE VG OHL 220 kV RP KAKAN-KAKANJ5 335.1 102.3 B&H OHL 400 kV TANTAREN-BRADU OHL 220 kV BUC.S-B-FUNDENI 312.8 103.4 OHL 400 kV DOMNESTI-BRAZI OHL 220 kV BUC.S-B-FUNDENI 319.8 103.1 OHL 220 kV P.D.F.A-CALAFAT OHL 220 kV P.D.F.A-CETATE1 257.9 125.0
OHL 220 kV P.D.F.A-RESITA ckt.1 OHL 220 kV P.D.F.A-RESITA ckt.2 273.3 100.9 OHL 220 kV FUNDENI-BUC.S-B OHL 220 kV BUC.S-B-FUNDENI 342.7 110.2
TR 400/220 kV ROSIORI OHL 400 kV GADALIN-CLUJ E 242.2 105.7 OHL 220 kV BRADU-TIRGOVI 285.9 105.9 TR 400/220 kV BRAZI OHL 220 kV BUC.S-B-FUNDENI 355.6 118.4
ROMANIA
TR 400/220 kV JBGD8 ckt.2 OHL 220 kV JBGD3 21-JOBREN2 307.4 104.7 OHL 220 kV JBGD3 21-JOBREN2 329.2 112.9 TR 400/220 kV JBGD8 ckt.1 OHL 220 kV JBGD3 22-JBGD8 22 373.7 107.3
OHL 400 kV JBGD8 1-JOBREN11 OHL 220 kV JBGD3 21-JOBREN2 468.7 167.2 OHL 400 kV JHDJE11-JTDRMN1 OHL 220 kV JBGD3 21-JOBREN2 321.3 109.1 OHL 400 kV JPANC21-JTDRMN1 OHL 220 kV JBGD3 21-JOBREN2 302.0 103.1 OHL 220 kV JBBAST2-JBGD3 21 OHL 220 kV JBGD3 21-JOBREN2 304.8 103.6 OHL 220 kV JBGD3 22-JBGD8 21 OHL 220 kV JBGD3 21-JOBREN2 300.2 102.0
OHL 220 kV JBGD172-JBGD8 22 ckt.1 OHL 220 kV JBGD172-JBGD8 22 ckt.2 464.7 132.6
SERBIA

5.27
Table 5.4.5 - Transformer overloadings for 2015-sensitivity case-average hydrology-import 1500 MW scenario-
topology 2015, single outages Loadings Outage Overloaded branch(es) MVA % Country
OHL 400 kV BLUKA 6-TS TUZL TR 400/110 kV UGLJEVIK 302.7 100.9 B&H TR 400/110 kV ZERJAVIN ckt.1 TR 400/110 kV ZERJAVIN ckt.2 300.8 100.3 CROATIA OHL 400 kV BRASOV-DIRSTE TR 400/110 kV BRASOV 253.8 101.5
OHL 220 kV BUC.S-B-FUNDENI TR 400/220 kV BRAZI 418.6 104.6 TR 400/220 kV BUC.S ckt.1 TR 400/220 kV BUC.S ckt.2 505.1 126.3
TR 400/110 kV BRASOV TR 400/110 kV DIRSTE 434.5 173.8 TR 400/110 kV DIRSTE TR 400/110 kV BRASOV 423.8 169.5
ROMANIA
TR 400/110 kV NIS ckt.1 TR 400/110 kV NIS ckt.2 304.8 101.6 TR 400/110 kV PANCEVO ckt.1 TR 400/110 kV PANCEVO ckt.2 305.8 101.9
SERBIA
AUT
ALB
BIH
BUL
CRO
GRE
HUN
MKD
MNG
ROM
SRB
SVK
SLO
TUR
400 kV line or 400/x kV transformer220 kV line or 220/x kV transformer
critical elements
Figure 5.4.6 – Geographical positions of the critical elements for 2015-sensitivity case-average hydrology-import
1500 MW-topology 2015 scenario
5.4.4 Summary of Impacts - 2015 topology versus 2010 topology Compared to the expected topology 2010, analyzed in previous chapter, it can be seen that planned investments make analyzed generation, demand and power import scenario feasible. This scenario could not be solved on 2010 topology because lack of reactive power support especially in the power system of Albania. Construction of at least one new interconnection line from Albania (V.Dejes or Zemlak) to UNMIK (Kosovo B) or Macedonia (Bitola) makes this scenario feasible but voltage profile in Albania, Montenegro and Serbia is poor. If all planned new lines are in operation voltage profile is satisfactory but some internal reinforcements will be necessary to make this generation pattern and power import more secure.

5.28
5.5 Scenario 2015 – average hydrology – high load – 2010 topology This part of the Study presents the results of static load flow and voltage profile analyses that are conducted for complete network topology and (n-1) contingencies in the scenario which is denoted as GTmax run for year 2015 - average hydrology high load and expected network topology for 2010 with new generation facilities implemented.
5.5.1 Lines loadings Figure 5.5.1 shows power exchanges between areas for 2015-average hydrology high load scenario and 2010 topology. Power flows along interconnection lines in the region together with balances of the systems are shown in Figure 5.5.2. Area totals are shown in Table 5.5.1 and comparison of the average hydro regimes with normal load projection and high load projection is shown in Table 5.5.2. Difference of load-demand level for these two regimes for 2015 is around 8.11% on regional level. As a consequence of this high load level, network losses are increased by 262 MW or 25%. Further differences are explained in detail in following chapter.
AUT
ALB
BIH
BUL
CRO
GRE
ITA
HUN
MKD
MNG
ROM
SRB
SVK
SLO
TUR
UKR
615
249
318
275
60
123
180
62
315
287 207
389
63
109
169
849
883
30
43
52
450
161
398
59
59
978
Figure 5.5.1 - Area exchanges in analyzed electric power systems for 2015-average hydrology high load scenario –
topology 2010 Figure 5.5.3 shows histogram of tie lines loadings. It is concluded that most of the tie lines are loaded less than 50% of their thermal limits, but there are some that are loaded up to 75% of their thermal limit like the 220 kV line from Pizren (Serbia-UNMIK)-Fierza (Albania).
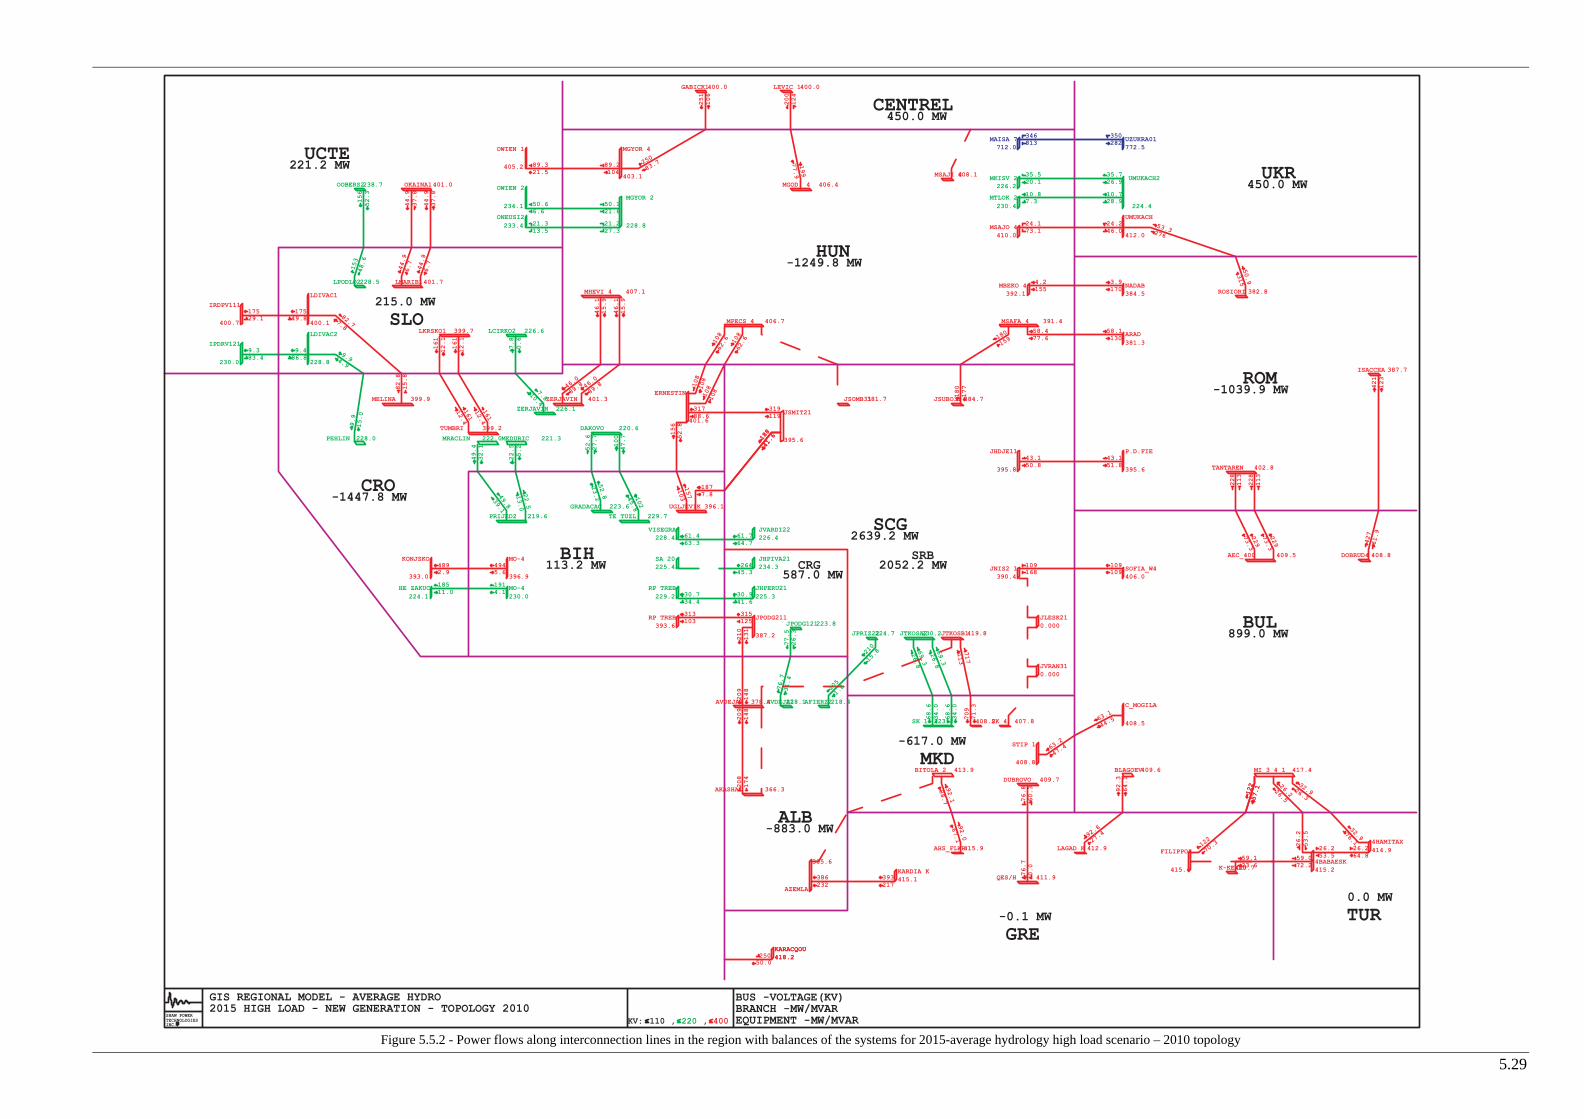
5.29
Figure 5.5.2 - Power flows along interconnection lines in the region with balances of the systems for 2015-average hydrology high load scenario – 2010 topology
PEHLIN 228.0
MELINA 399.9
TUMBRI 399.2
MEDURIC 221.3MRACLIN 222.0
DAKOVO 220.6
KONJSKO
393.0
HE ZAKUC
224.1
ZERJAVIN 401.3
ZERJAVIN 226.1
AZEMLA1
385.6
AKASHA1 366.3
AVDEJA2218.1AFIERZ2218.4
OWIEN 1
405.2
OWIEN 2
234.1
MGYOR 4
403.1
MGYOR 2
228.8
ONEUSI2
233.4
OKAINA1401.0
LMARIB1401.7
OOBERS2238.7
IRDPV111
400.7
LDIVAC1
400.1
IPDRV121
230.0
LDIVAC2
228.8
LKRSKO1 399.7
PRIJED2 219.6
GRADACAC 223.6
TE TUZL 229.7
JSMIT21
395.6
VISEGRA228.4
JVARDI22226.4
SA 20225.4
JHPIVA21234.3
RP TREB393.6
JHPERU21
225.3
JPODG211
387.2
MO-4
396.9
MHEVI 4 407.1
RP TREB
229.2
JPODG121223.8
JPRIZ22224.7 JTKOSA2230.2JTKOSB1419.8
408.2
BITOLA 2 413.9
AHS_FLWR415.9
DUBROVO 409.7
QES/H K 411.9
BLAGOEV409.6
STIP 1
408.8
C_MOGILA
408.5
JNIS2 1390.4
SOFIA_W4406.0
KARDIA K415.1
GABICK1400.0
MGOD 4 406.4
LEVIC 1400.0
MSAJO 4410.0
UMUKACH
412.0
ROSIORI 382.8
MKISV 2226.2
UMUKACH2
224.4
MTLOK 2
230.4
MSAFA 4 391.4
JSUBO31 384.7
ARAD
381.3
TANTAREN 402.8
AEC_400 409.5
JHDJE11
395.8
LPODLO2228.5
FILIPPOI
415.4
SK 1 223.2
LCIRKO2 226.6
P.D.FIE
395.6
UGLJEVIK 396.1
ISACCEA 387.7
DOBRUD4 408.8
JSOMB31381.7
MPECS 4 406.7
UZUKRA01772.5
MAISA 7712.0
NADAB384.5
MBEKO 4392.1
SK 4 407.8
JLESK210.000
ERNESTIN
401.6
MO-4
230.0
MI_3_4_1 417.4
JVRAN310.000
LAGAD K 412.9
KARACQOU418.2KARACQOU418.2
K-KEXRU417.74BABAESK415.2
4HAMITAX
414.9
MSAJI 4408.1
AVDEJA1 378.4
393217
386232
210
131
205
1.87
6.7
31.4
50.66.6
89.321.5
157
103
188
41.6
1877.8
421
123
427
61.9
61.764.7
26445.3
30.734.4
30.941.6
313103
315125
61.463.3
77.5
26.3
210
15.8
68.6
34.0
69.3
26.8
68.6
34.0
69.3
26.8
709
71.3
92.1
88.7 7
6.8
60.3
76.7
0.0
43.151.8
43.150.8
228
113
229
73.3
228
113
109168
109109
35.520.1
35.726.9
24.173.1
24.246.0
53.3276
58.477.6
58.1130
180
177
180
159
50.9
315
4945.6
49.8
39.1
22.5
13.0
52.8
23.2 102
45.8
319119
161
12.1
161
12.1
46.1
15.9
46.1
15.9
82.77.8
9.94.9
153
48.6
156
52.3
199
77.9
200
124
251
106
250
83.7
92.0
67.1
188
41.6
10.728.9
10.87.3
17549.8
17529.1
9.486.8
9.383.4
44.9
37.8
44.9
6.7
44.9
6.7
44.9
37.8
346813
350282
4.2155
3.9170
229
73.3
63.2
47.4
63.1
44.5
92.3
64.1
21.313.5
21.227.3
50.121.6
89.2104
156
52.8
31788.6
108
108
108
108
108
62.6 108
62.6
18511.0
49.4
32.1
22.5
5.2 52.6
27.7
100
47.7
161
12.4
161
12.4
7.8
0.6
7.810.4
46.0
89.8 4
6.0
89.88
2.8
15.8
9.9
15.0
4892.9
1914.1
122
57.1
92.6
27.4
122
70.3
59.123.6
26.226.5
122
57.1
32.926.3
26.2
53.5
32.9
76.1
59.072.2
25050.0
26.253.5
26.264.8
717
113
209
148
209
148
208
174
ROM
BUL
HUN
UKRUCTE
CENTREL
CRO
BIH
SCG
ALB
GRE
MKD
TUR
SLO
CRGSRB
2639.2 MW
587.0 MW2052.2 MW
-617.0 MW
899.0 MW
-883.0 MW
113.2 MW
221.2 MW
-1447.8 MW
-1249.8 MW
-0.1 MW
450.0 MW
-1039.9 MW
215.0 MW
0.0 MW
450.0 MW
SHAW POWERTECHNOLOGIESINC.R KV: 110 , 220 , 400
BUS -VOLTAGE(KV)
EQUIPMENT -MW/MVARBRANCH -MW/MVAR
GIS REGIONAL MODEL - AVERAGE HYDRO2015 HIGH LOAD - NEW GENERATION - TOPOLOGY 2010

5.30
Table 5.5.1 - Area totals in analyzed electric power systems for 2015-average hydrology high load scenario – 2010 topology
AREA GENERATION LOAD LOSSES INTERCHANGE ALBANIA 896.1 1680 99 -883
BULGARIA 8157.8 7083 175.8 899 BIH 2479.4 2274 92.2 113.2
CROATIA 2591 3959 79.8 -1447.8 MACEDONIA 895 1489 23 -617
ROMANIA 7684.5 8269.8 454.5 -1039.8 SERBIA 10024.2 7635 337 2052.2
MONTENEGRO 1324.6 702 35.6 587 TOTALS 34052.6 33091.8 1296.9 -336.2
Table 5.5.2 - Comparison of Area totals in analyzed electric power systems for 2015- average hydrology versus average
hydrology high load scenario – 2010 topology LOAD LOSSES
AREA normal load high load normal
load high load
ALBANIA 1531 1680 9.73% 81.2 99 21.92% BULGARIA 6483 7083 9.25% 150.7 175.8 16.66%
BIH 2279 2274 -0.22% 78.7 92.2 17.15% CROATIA 3657 3959 8.26% 63.4 79.8 25.87%
MACEDONIA 1407 1489 5.83% 20 23 15% ROMANIA 7317.4 8269.8 13.02% 347.4 454.5 30.83%
SERBIA 7263 7635 5.12% 268.7 337 25.42% MONTENEGRO 671 702 4.62% 25 35.6 42.4%
TOTALS 30608.4 33091.8 8.11% 1035.1 1296.9 25.29%
Histogram
0
5
10
15
20
25
30
35
x<25 25<x<50 50<x<75 75<x<100 x>100
Bin
Fr
eq
ue
nc
y
Figure 5.5.3 - Histogram of interconnection lines loadings for 2015- average hydrology high load scenario – topology
2010 ("Frequency" denotes number of lines and "Bin" denotes loading range in % of thermal limit) Following Table 5.5.3 lists all network elements loaded over 80% of their thermal limits. As it can be seen large number of lines 220 kV voltage level in Albania, Romania and Serbia are loaded over 80%. It can be concluded that overall load level of the transmission network increased, especially in parts of the network that supply major consumption areas (Tirana in Albania, Bucharest and Timisoara in Romania, Belgrade in Serbia and Pristina in Serbia-UNMIK). Most of the elements loaded over 80% are 220 kV lines in Romania, but also transformers in some substations that supply the major consumption areas.

5.31
There are some elements that are overloaded (220 kV lines Targu Jiu – Paroseni and Urechesti – Targu Jiu in Romania and 220/110 kV transformers in Fierza and Elbasan 1 substation in Albania, and 400/220 kV and 220/110 kV transformers in Kosovo B and Kosovo A substations in Serbia-UNMIK. This leads to conclusion that transmission network is not able to sustain this load-demand level and this production pattern. Table 5.5.3 - Network elements loaded over 80% of their thermal limits for 2015-average hydrology high load scenario
– 2010 topology BRANCH LOADINGS ABOVE 80.0 % OF RATING:
AREA ELEMENT LOADINGMVA
RATINGMVA PERCENT
Lines ALB HL 220kV AKASHA2-ARRAZH2 1 287.7 270 106.6
HL 220kV BRADU-TIRGOVI 1 285.4 302.6 94.3 HL 220kV BUC.S-B-FUNDENI 1 309.4 320 96.7 HL 220kV FILESTI-BARBOSI 1 248.3 277.4 89.5 HL 220kV L.SARAT-FILESTI 1 241 277.4 86.9 HL 220kV P.D.F.A-CETATE1 1 207.2 208.1 99.6 HL 220kV P.D.F.A-RESITA 1 266.9 277.4 96.2 HL 220kV P.D.F.A-RESITA 2 266.9 277.4 96.2 HL 220kV P.D.F.II-CETATE1 1 271.1 277.4 97.7 HL 220kV PAROSEN-BARU M 1 227.6 277.4 82 HL 220kV RESITA-TIMIS 1 229.6 277.4 82.8 HL 220kV RESITA-TIMIS 2 229.6 277.4 82.8
HL 220kV TG.JIU-PAROSEN 1 320.7 208.1 154.1 HL 220kV URECHESI-TG.JIU 1 320.4 277.4 115.5
ROM
HL 400kV GADALIN-CLUJ E 1 208.4 238.3 87.5 SRB HL 220kV JBGD3 21-JOBREN2 1 291 301 96.7
Transformers TR 220/110 kV ABURRE 1 49.5 60 82.5 TR 220/110 kV ABURRE 2 49.5 60 82.5 TR 220/110 kV ABURRE 3 49.5 60 82.5 TR 220/110 kV AELBS1 1 87.7 90 97.5 TR 220/110 kV AELBS1 2 87.7 90 97.5 TR 220/110 kV AELBS1 3 94.2 90 104.7 TR 220/110 kV AFIER 1 149 120 124.1 TR 220/110 kV AFIER 2 122.1 90 135.7 TR 220/110 kV AFIER 3 116.5 90 129.5 TR 220/110 kV AFIERZ 1 58 60 96.7 TR 220/110 kV AFIERZ 2 58 60 96.7 TR 220/110 kV AKASHA 1 93.4 100 93.4 TR 220/110 kV AKASHA 2 93.4 100 93.4 TR 220/110 kV ARRAZH 1 87.7 100 87.7 TR 220/110 kV ARRAZH 2 87.7 100 87.7 TR 220/110 kV ATIRAN 2 97.5 120 81.3
ALB
TR 220/110 kV ATIRAN 3 102.2 120 85.2 BIH TR 400/110 kV UGLJEV 1 258.8 300 86.3 CRO TR 220/110 kV TESISA 1 178.8 200 89.4
TR 220/110 kV BARBOS 1 167.1 200 83.6 TR 220/110 kV FUNDE2 1 240.8 200 120.4 TR 220/110 kV FUNDEN 1 203.9 200 101.9 TR 220/110 kV TIMIS 1 171.7 200 85.9 TR 400/110 kV BRASOV 1 231.5 250 92.6 TR 400/110 kV CLUJ E 1 208.4 250 83.4 TR 400/110 kV DIRSTE 1 221 250 88.4 TR 400/220 kV BUC.S 1 378.4 400 94.6 TR 400/220 kV BUC.S 2 378.4 400 94.6 TR 400/220 kV IERNUT 1 408.1 400 102
ROM
TR 400/220 kV URECHE 1 486.6 400 121.6 TR 220/110 kV JBGD3 1 174.9 200 87.5 TR 220/110 kV JBGD3 2 137.1 150 91.4 TR 220/110 kV JPRIS4 1 137 150 91.3 TR 220/110 kV JPRIS4 2 137 150 91.3 TR 220/110 kV JTKOSA 2 151.3 150 100.9 TR 220/110 kV JTKOSA 3 154 150 102.7 TR 220/110 kV JZREN2 2 133.8 150 89.2 TR 400/110 kV JJAGO4 A 245.8 300 81.9 TR 400/220 kV JBGD8 1 332.2 400 83
SRB
TR 400/220 kV JTKOSB 1 411.6 400 102.9
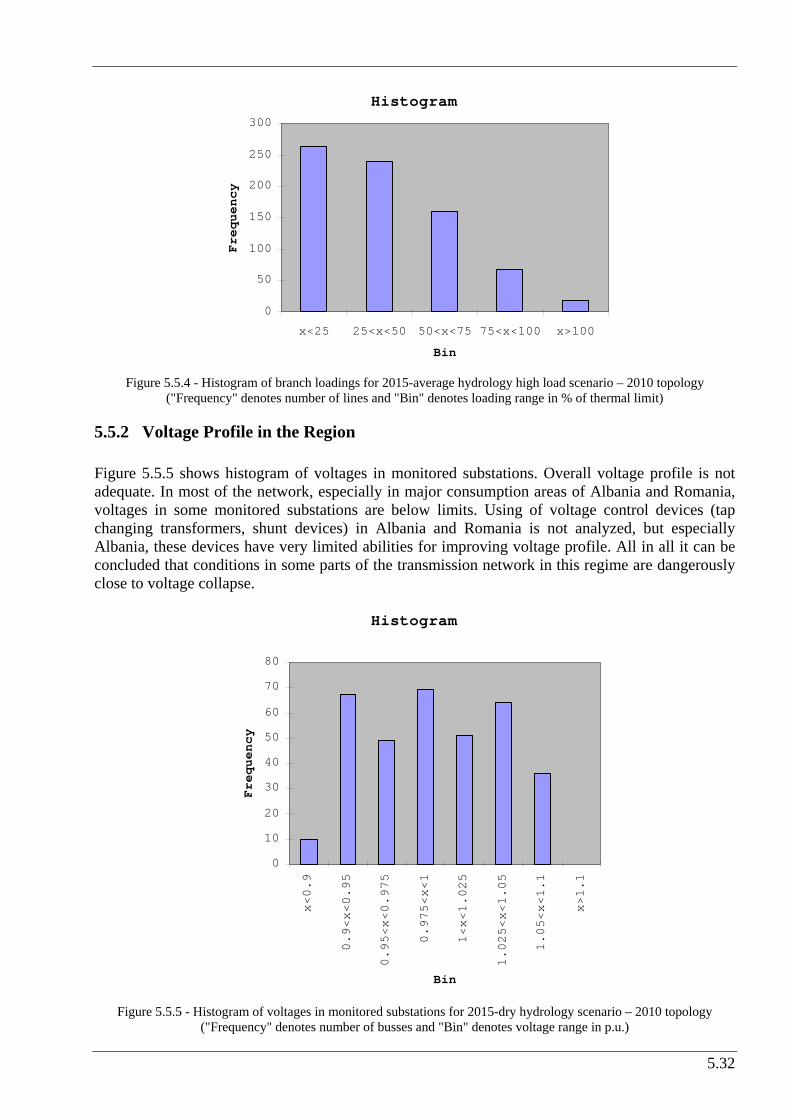
5.32
Histogram
0
50
100
150
200
250
300
x<25 25<x<50 50<x<75 75<x<100 x>100
Bin
Fr
eq
ue
nc
y
Figure 5.5.4 - Histogram of branch loadings for 2015-average hydrology high load scenario – 2010 topology
("Frequency" denotes number of lines and "Bin" denotes loading range in % of thermal limit)
5.5.2 Voltage Profile in the Region Figure 5.5.5 shows histogram of voltages in monitored substations. Overall voltage profile is not adequate. In most of the network, especially in major consumption areas of Albania and Romania, voltages in some monitored substations are below limits. Using of voltage control devices (tap changing transformers, shunt devices) in Albania and Romania is not analyzed, but especially Albania, these devices have very limited abilities for improving voltage profile. All in all it can be concluded that conditions in some parts of the transmission network in this regime are dangerously close to voltage collapse.
Histogram
0
10
20
30
40
50
60
70
80
x<0.9
0.9<x<0.95
0.95<x<0.975
0.975<x<1
1<x<1.025
1.025<x<1.05
1.05<x<1.1
x>1.1
Bin
Fr
eq
ue
nc
y
Figure 5.5.5 - Histogram of voltages in monitored substations for 2015-dry hydrology scenario – 2010 topology
("Frequency" denotes number of busses and "Bin" denotes voltage range in p.u.)

5.33
5.5.3 Security (n-1) analysis Results of security (n-1) analysis for 2015-average hydrology high load scenario and expected topology for 2010 are presented in Table 5.5.4. Figure 5.5.6 shows the geographical position of the critical elements in monitored systems. As it can be seen, by lot of investigated contingencies, insecure states are identified. Almost all elements that are loaded over 80% in base case (Table 5.5.3), represent critical elements in n-1 analyses. Furthermore, for lot of contingency cases (losing of major interconnection and internal lines) results could not be presented because of mathematical instability of the model. This indicates that all these cases are not feasible in reality, and that these contingencies can lead to voltage collapse and partial black outs in some parts of the monitored network.
Table 5.5.4 - Network overloadings for 2015-dry hydrology scenario , single outages – 2010 topology
Area contingency Area
overloadings /
out of limits voltages #
limit /
Unom
Flow /
Voltage
rate /
volt.dev. 1 2 3 4 5 6 7 8
AL HL 220kV AKASHA2-ARRAZH2 1 270MVA 263MVA 106.6%RO TR 400/220kV/kV URECHESI 1 400MVA 483.6MVA 120.9%RO HL 220kV LOTRU-SIBIU 1 277.4MVA 275.6MVA 102.1%RO HL 220kV LOTRU-SIBIU 2 277.4MVA 275.6MVA 102.1%RO HL 220kV URECHESI-TG.JIU 1 277.4MVA 307.7MVA 115.5%RO HL 220kV TG.JIU-PAROSEN 1 208.1MVA 298.9MVA 154.1%CS TR 400/220kV/kV JTKOSB1 1 400MVA 432MVA 108.0%CS TR 400/220kV/kV JTKOSB1 2 400MVA 451.4MVA 112.9%
BASE CASE
CS TR 400/220kV/kV JTKOSB1 3 400MVA 451.4MVA 112.9%AL OHL 220kV AVDEJA2 -ATIRAN2 1 AL HL 220kV AKASHA2-ARRAZH2 1 270MVA 275.2MVA 123.9%AL OHL 220kV ATIRAN2 -AKASHA2 1 AL HL 220kV AKASHA2-ARRAZH2 1 270MVA 274.6MVA 111.1%IN OHL 400kV KONJSKO -MO-4 1 HR HL 220kV XRA_ZA21-HE ZAKUC 1 297MVA 343.9MVA 115.1%IN OHL 400kV ISACCEA -DOBRUD4 1 RO TR 400/220kV/kV URECHESI 1 400MVA 506.7MVA 126.7%RO OHL 220kV STUPARE -BRADU 1 RO HL 220kV AREF-RIURENI 1 277.4MVA 252.6MVA 106.6%RO OHL 220kV URECHESI-SARDANE 1 RO TR 400/220kV/kV URECHESI 1 400MVA 455.2MVA 113.8%
RO HL 400kV MINTIA-SIBIU 1 381.1MVA 387.2MVA 116.9%RO HL 220kV P.D.F.A-RESITA 1 277.4MVA 269.1MVA 108.8%RO HL 220kV P.D.F.A-RESITA 2 277.4MVA 269.1MVA 108.8%
RO OHL 220kV URECHESI-TG.JIU 1
RO HL 220kV PESTIS-MINTIA A 1 277.4MVA 256.1MVA 105.5%RO OHL 220kV P.D.F.A -CALAFAT 1 RO HL 220kV P.D.F.A-CETATE1 1 208.1MVA 259.6MVA 129.9%
RO TR 400/220kV/kV URECHESI 1 400MVA 504MVA 126.0%RO HL 220kV URECHESI-TG.JIU 1 277.4MVA 325.7MVA 123.6%RO HL 220kV P.D.F.A-RESITA 2 277.4MVA 355.4MVA 145.4%
RO OHL 220kV P.D.F.A -RESITA 1
RO HL 220kV TG.JIU-PAROSEN 1 208.1MVA 315.2MVA 165.0%RO TR 400/220kV/kV URECHESI 1 400MVA 494.2MVA 123.6%RO HL 220kV URECHESI-TG.JIU 1 277.4MVA 317.8MVA 119.9%RO OHL 220kV RESITA -TIMIS 1 RO HL 220kV RESITA-TIMIS 2 277.4MVA 351.8MVA 136.8%
RO OHL 220kV CRAIOV A-TR. MAG 1 RO TR 400/220kV/kV URECHESI 1 400MVA 464.8MVA 116.2%RO OHL 220kV CRAIOV B-ISALNI A 1 RO TR 400/220kV/kV URECHESI 1 400MVA 499.6MVA 124.9%
RO HL 400kV MINTIA-SIBIU 1 381.1MVA 386.7MVA 117.0%RO HL 220kV P.D.F.A-RESITA 1 277.4MVA 269.1MVA 109.0%RO HL 220kV P.D.F.A-RESITA 2 277.4MVA 269.1MVA 109.0%
RO OHL 220kV TG.JIU -PAROSEN 1
RO HL 220kV PESTIS-MINTIA A 1 277.4MVA 257.2MVA 106.3%RO TR 400/220kV/kV URECHESI 1 400MVA 507.3MVA 126.8%RO HL 220kV URECHESI-TG.JIU 1 277.4MVA 326MVA 124.6%RO OHL 220kV PESTIS -MINTIA A 1 RO HL 220kV TG.JIU-PAROSEN 1 208.1MVA 313.5MVA 166.4%RO HL 400kV GADALIN-CLUJ E 1 238.3MVA 216.3MVA 101.8%RO HL 220kV URECHESI-TG.JIU 1 277.4MVA 296.3MVA 111.1%RO OHL 220kV MINTIA B-AL.JL 1 RO HL 220kV TG.JIU-PAROSEN 1 208.1MVA 288.2MVA 148.3%RO HL 220kV BRADU-TIRGOVI 1 302.6MVA 273.6MVA 108.2%RO OHL 220kV FUNDENI -BUC.S-B 1 RO HL 220kV BUC.S-B-FUNDENI 1 320MVA 389.3MVA 134.8%RO TR 400/220kV/kV URECHESI 1 400MVA 495.9MVA 124.0%RO OHL 220kV STEJARU -GHEORGH 1 RO TR 400/220kV/kV IERNUT 1 400MVA 487.2MVA 121.8%
RO OHL 220kV GHEORGH -FINTINE 1 RO TR 400/220kV/kV IERNUT 1 400MVA 412.5MVA 103.1%RO OHL 220kV CLUJ FL -MARISEL 1 RO TR 400/220kV/kV URECHESI 1 400MVA 497MVA 124.3%
RO TR 400/220kV/kV URECHESI 1 400MVA 471.7MVA 117.9%RO HL 220kV URECHESI-TG.JIU 1 277.4MVA 294.1MVA 110.1%RO OHL 220kV CLUJ FL -AL.JL 1 RO HL 220kV TG.JIU-PAROSEN 1 208.1MVA 286.3MVA 146.9%RO TR 400/220kV/kV URECHESI 1 400MVA 514.1MVA 128.5%RO HL 220kV URECHESI-TG.JIU 1 277.4MVA 333MVA 127.8%RO OHL 220kV AL.JL -GILCEAG 1 RO HL 220kV TG.JIU-PAROSEN 1 208.1MVA 320.8MVA 170.6%
RO OHL 220kV BRAZI A-TELEAJEN 1 RO HL 220kV BUC.S-B-FUNDENI 1 320MVA 307.4MVA 105.4%RO OHL 220kV TELEAJEN-STILPU 1 RO HL 220kV BUC.S-B-FUNDENI 1 320MVA 307.8MVA 105.6%RO OHL 400kV TANTAREN-URECHESI 1 RO TR 400/220kV/kV URECHESI 1 400MVA 467.2MVA 116.8%
RO TR 400/220kV/kV URECHESI 1 400MVA 559.7MVA 139.9%RO HL 220kV BRADU-TIRGOVI 1 302.6MVA 272.9MVA 104.1%RO HL 220kV URECHESI-TG.JIU 1 277.4MVA 292.5MVA 112.9%
RO OHL 400kV TANTAREN-SLATINA 1
RO HL 220kV TG.JIU-PAROSEN 1 208.1MVA 284.5MVA 150.6%

5.34
Area contingency Area
overloadings /
out of limits voltages #
limit /
Unom
Flow /
Voltage
rate /
volt.dev. 1 2 3 4 5 6 7 8
RO TR 400/220kV/kV URECHESI 1 400MVA 451.1MVA 112.8%RO HL 220kV URECHESI-TG.JIU 1 277.4MVA 290.7MVA 108.8%RO OHL 400kV URECHESI-P.D.FIE 1 RO HL 220kV TG.JIU-PAROSEN 1 208.1MVA 282.7MVA 145.2%RO TR 400/220kV/kV URECHESI 1 400MVA 551.6MVA 137.9%RO HL 220kV BRADU-TIRGOVI 1 302.6MVA 274.9MVA 106.9%RO HL 220kV URECHESI-TG.JIU 1 277.4MVA 329.2MVA 125.9%
RO OHL 400kV URECHESI-DOMNESTI 1
RO HL 220kV TG.JIU-PAROSEN 1 208.1MVA 318.2MVA 168.0%RO HL 220kV URECHESI-TG.JIU 1 277.4MVA 295.6MVA 113.4%RO OHL 400kV MINTIA -ARAD 1 RO HL 220kV TG.JIU-PAROSEN 1 208.1MVA 283.8MVA 151.7%RO TR 400/220kV/kV URECHESI 1 400MVA 527.9MVA 132.0%RO HL 220kV URECHESI-TG.JIU 1 277.4MVA 355.6MVA 135.8%RO HL 220kV P.D.F.A-RESITA 1 277.4MVA 262.9MVA 103.9%RO HL 220kV P.D.F.A-RESITA 2 277.4MVA 262.9MVA 103.9%
RO OHL 400kV MINTIA -SIBIU 1
RO HL 220kV TG.JIU-PAROSEN 1 208.1MVA 343.2MVA 181.2%RO OHL 400kV P.D.FIE -SLATINA 1 RO TR 400/220kV/kV URECHESI 1 400MVA 518.9MVA 129.7%RO OHL 400kV DOMNESTI-BUC.S 1 RO HL 220kV BUC.S-B-FUNDENI 1 320MVA 327.2MVA 110.4%
RO TR 400/220kV/kV URECHESI 1 400MVA 505.8MVA 126.4%RO TR 400/220kV/kV BUC.S 1 400MVA 436MVA 109.0%RO TR 400/220kV/kV BUC.S 2 400MVA 436MVA 109.0%RO HL 220kV URECHESI-TG.JIU 1 277.4MVA 323.6MVA 123.6%RO HL 220kV TG.JIU-PAROSEN 1 208.1MVA 312.2MVA 165.0%
RO OHL 400kV DOMNESTI-BRAZI 1
RO HL 220kV BUC.S-B-FUNDENI 1 320MVA 374.2MVA 131.0%RO OHL 400kV GR.IAL -L.SARAT 1 RO HL 220kV BUC.S-B-FUNDENI 1 320MVA 304.5MVA 103.3%RO OHL 400kV GR.IAL -CERNAV 1 RO HL 400kV GR.IAL-CERNAV 2 791.2MVA 775.9MVA 102.0%RO OHL 400kV GR.IAL -CERNAV 2 RO HL 400kV GR.IAL-CERNAV 1 791.2MVA 773.4MVA 101.6%RO OHL 400kV BACAU -ROMAN 1 RO TR 400/220kV/kV URECHESI 1 400MVA 493.8MVA 123.5%
RO TR 400/220kV/kV URECHESI 1 400MVA 498.6MVA 124.7%RO HL 220kV BRADU-TIRGOVI 1 302.6MVA 304.9MVA 114.7%RO HL 220kV URECHESI-TG.JIU 1 277.4MVA 319.2MVA 121.2%
RO OHL 400kV BRASOV -BRADU 1
RO HL 220kV TG.JIU-PAROSEN 1 208.1MVA 309MVA 161.7%RO HL 400kV MINTIA-SIBIU 1 381.1MVA 345.1MVA 102.9%RO OHL 400kV IERNUT -GADALIN 1 RO TR 400/220kV/kV IERNUT 1 400MVA 413.3MVA 103.3%
CS OHL 220kV JBBAST2 -JBGD3 21 1 CS HL 220kV JBGD3 21-JOBREN2 1 301MVA 314.9MVA 110.0%CS OHL 220kV JBGD172 -JBGD8 22 1 CS HL 220kV JBGD172-JBGD8 22 2 365.8MVA 488.5MVA 144.0%CS OHL 220kV JBGD3 22-JBGD8 21 1 CS HL 220kV JBGD3 21-JOBREN2 1 301MVA 308.5MVA 107.6%CS OHL 220kV JBGD3 22-JBGD8 22 2 CS TR 400/220kV/kV JBGD8 1 1 400MVA 425.8MVA 106.5%CS OHL 220kV JHIP 2 -JPANC22 1 CS HL 220kV JBGD3 21-JOBREN2 1 301MVA 296.7MVA 103.4%
CS TR 400/220kV/kV JTKOSB1 1 400MVA 443.8MVA 111.0%CS TR 400/220kV/kV JTKOSB1 2 400MVA 463.8MVA 115.9%CS OHL 220kV JLESK22 -JNIS 22 1 CS TR 400/220kV/kV JTKOSB1 3 400MVA 463.8MVA 115.9%
CS OHL 220kV JNSAD32 -JOBREN2 1 CS HL 220kV JBGD3 21-JOBREN2 1 301MVA 303.6MVA 105.2%CS OHL 220kV JNSAD32 -JZREN22 1 CS HL 220kV JBGD3 21-JOBREN2 1 301MVA 303.6MVA 106.0%CS OHL 220kV JOBREN2 -JVALJ32 1 CS HL 220kV JBGD3 21-JOBREN2 1 301MVA 291MVA 100.8%CS OHL 220kV JTKOSA2 -JTKOSB2 1 CS HL 220kV JTKOSA2-JTKOSB2 2 365.8MVA 453.9MVA 119.0%
CS HL 220kV JBGD3 21-JOBREN2 1 301MVA 490.7MVA 187.1%CS OHL 400kV JBGD8 1 -JOBREN11 1 CS HL 220kV JBGD3 22-JBGD8 22 2 365.8MVA 337MVA 108.2%
CS OHL 400kV JBGD8 1 -JBGD201 A CS HL 220kV JBGD3 21-JOBREN2 1 301MVA 298.4MVA 104.1%CS OHL 400kV JBOR 21 -JHDJE11 1 RO TR 400/220kV/kV URECHESI 1 400MVA 494.5MVA 123.6%
RO TR 400/220kV/kV URECHESI 1 400MVA 496.6MVA 124.1%RO HL 220kV URECHESI-TG.JIU 1 277.4MVA 319.6MVA 121.0%RO HL 220kV TG.JIU-PAROSEN 1 208.1MVA 309.6MVA 161.5%CS TR 400/220kV/kV JTKOSB1 1 400MVA 444.6MVA 111.1%CS TR 400/220kV/kV JTKOSB1 2 400MVA 464.6MVA 116.1%
CS OHL 400kV JNIS2 1 -JJAGO41 A
CS TR 400/220kV/kV JTKOSB1 3 400MVA 464.6MVA 116.1%RO TR 400/220kV/kV URECHESI 1 400MVA 511.8MVA 128.0%RO HL 220kV URECHESI-TG.JIU 1 277.4MVA 331.7MVA 126.7%RO HL 220kV P.D.F.A-RESITA 1 277.4MVA 266.3MVA 106.1%RO HL 220kV P.D.F.A-RESITA 2 277.4MVA 266.3MVA 106.1%
CS OHL 400kV JNSAD31 -JSUBO31 1
RO HL 220kV TG.JIU-PAROSEN 1 208.1MVA 320.3MVA 169.1%RO TR 400/220kV/kV URECHESI 1 400MVA 501MVA 125.3%RO HL 220kV URECHESI-TG.JIU 1 277.4MVA 323.4MVA 122.9%CS OHL 400kV JOBREN12-JTKOLB1 A RO HL 220kV TG.JIU-PAROSEN 1 208.1MVA 313MVA 164.0%
CS OHL 400kV JPANC21 -JTDRMN1 1 CS HL 220kV JBGD3 21-JOBREN2 1 301MVA 313MVA 110.1%RO TR 400/220kV/kV URECHESI 1 400MVA 497MVA 124.2%CS OHL 400kV JRPMLA1 -JSMIT21 1 RO HL 220kV URECHESI-TG.JIU 1 277.4MVA 318.6MVA 120.6%
BG TR 400/110 CAREVEC 1 BG TR 400/110kV/kV CAREVEC 2 275MVA 281.3MVA 102.3%CS TR 400/110 JBGD20 A CS HL 220kV JBGD3 21-JOBREN2 1 301MVA 289.5MVA 100.6%CS TR 400/110 JKRAG2 1 CS TR 400/110kV/kV JKRAG21 2 300MVA 314.1MVA 104.7%CS TR 400/110 JNIS2 1 CS TR 400/110kV/kV JNIS2 1 2 300MVA 353.3MVA 117.8%CS TR 400/110 JPANC2 1 CS TR 400/110kV/kV JPANC21 2 300MVA 327.4MVA 109.1%
CS TR 400/220kV/kV JTKOSB1 1 400MVA 472.2MVA 118.1%CS TR 400/220kV/kV JTKOSB1 2 400MVA 493.4MVA 123.4%CS TR 400/110 JPEC A CS TR 400/220kV/kV JTKOSB1 3 400MVA 493.4MVA 123.4%
BG TR 400/110 PLOVDIV 1 BG TR 400/110kV/kV PLOVDIV4 2 275MVA 284.4MVA 103.4%CS TR 400/220kV/kV JTKOSB1 1 400MVA 448.2MVA 112.0%CS TR 400/220kV/kV JTKOSB1 2 400MVA 468.3MVA 117.1%MK TR 400/110 SK 1 1 CS TR 400/220kV/kV JTKOSB1 3 400MVA 468.3MVA 117.1%
RO TR 400/110 SMIRDAN 1 RO HL 220kV L.SARAT-FILESTI 1 277.4MVA 302.2MVA 113.5%RO TR 400/220kV/kV BUC.S 1 400MVA 447MVA 111.8%RO TR 400/220kV/kV BUC.S 2 400MVA 447MVA 111.8%RO HL 220kV BRADU-TIRGOVI 1 302.6MVA 302.8MVA 123.3%
RO TR 400/220 BRAZI 1
RO HL 220kV FUNDENI-BUC.S-B 1 320MVA 290.1MVA 104.0%
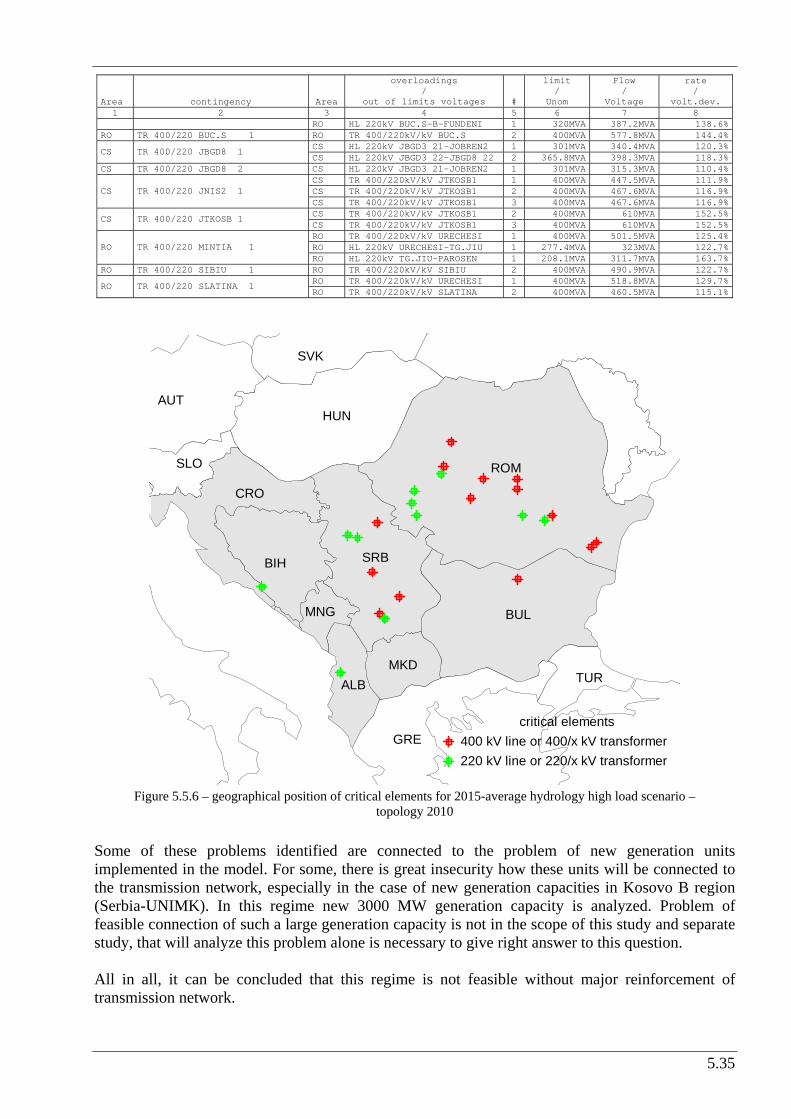
5.35
Area contingency Area
overloadings /
out of limits voltages #
limit /
Unom
Flow /
Voltage
rate /
volt.dev. 1 2 3 4 5 6 7 8
RO HL 220kV BUC.S-B-FUNDENI 1 320MVA 387.2MVA 138.6%RO TR 400/220 BUC.S 1 RO TR 400/220kV/kV BUC.S 2 400MVA 577.8MVA 144.4%
CS HL 220kV JBGD3 21-JOBREN2 1 301MVA 340.4MVA 120.3%CS TR 400/220 JBGD8 1 CS HL 220kV JBGD3 22-JBGD8 22 2 365.8MVA 398.3MVA 118.3%
CS TR 400/220 JBGD8 2 CS HL 220kV JBGD3 21-JOBREN2 1 301MVA 315.3MVA 110.4%CS TR 400/220kV/kV JTKOSB1 1 400MVA 447.5MVA 111.9%CS TR 400/220kV/kV JTKOSB1 2 400MVA 467.6MVA 116.9%CS TR 400/220 JNIS2 1 CS TR 400/220kV/kV JTKOSB1 3 400MVA 467.6MVA 116.9%CS TR 400/220kV/kV JTKOSB1 2 400MVA 610MVA 152.5%CS TR 400/220 JTKOSB 1 CS TR 400/220kV/kV JTKOSB1 3 400MVA 610MVA 152.5%RO TR 400/220kV/kV URECHESI 1 400MVA 501.5MVA 125.4%RO HL 220kV URECHESI-TG.JIU 1 277.4MVA 323MVA 122.7%RO TR 400/220 MINTIA 1 RO HL 220kV TG.JIU-PAROSEN 1 208.1MVA 311.7MVA 163.7%
RO TR 400/220 SIBIU 1 RO TR 400/220kV/kV SIBIU 2 400MVA 490.9MVA 122.7%RO TR 400/220kV/kV URECHESI 1 400MVA 518.8MVA 129.7%RO TR 400/220 SLATINA 1 RO TR 400/220kV/kV SLATINA 2 400MVA 460.5MVA 115.1%
AUT
ALB
BIH
BUL
CRO
GRE
HUN
MKD
MNG
ROM
SRB
SVK
SLO
TUR
400 kV line or 400/x kV transformer220 kV line or 220/x kV transformer
critical elements
Figure 5.5.6 – geographical position of critical elements for 2015-average hydrology high load scenario –
topology 2010 Some of these problems identified are connected to the problem of new generation units implemented in the model. For some, there is great insecurity how these units will be connected to the transmission network, especially in the case of new generation capacities in Kosovo B region (Serbia-UNIMK). In this regime new 3000 MW generation capacity is analyzed. Problem of feasible connection of such a large generation capacity is not in the scope of this study and separate study, that will analyze this problem alone is necessary to give right answer to this question. All in all, it can be concluded that this regime is not feasible without major reinforcement of transmission network.

5.36
5.6 Scenario 2015 – average hydrology – high load – topology 2015 This part of the Study presents the results of static load flow and voltage profile analyses that are conducted for complete network topology and (n-1) contingencies in the scenario which is denoted as GTmax run for year 2015 - average hydrology high load scenario and expected network topology for 2015 and new planned generation capacities implemented.
5.6.1 Lines loadings Figure 5.6.1 shows power exchanges between areas for 2015-average hydrology high load scenario. Power flows along interconnection lines in the region together with balances of the systems are shown in Figure 5.6.2. Area totals are shown in Table 5.6.1 and comparison of the average hydro regimes with normal load projection and high load projection is shown in Table 5.6.2. Difference of load-demand level for these two regimes is around 8.11% on regional level. As a consequence of this high load level, network losses are increased by 251 MW or 25%. Figure 5.6.3 shows histogram of tie lines loadings. It is concluded that most of the tie lines are loaded less than 50% of their thermal limits.
AUT
ALB
BIH
BUL
CRO
GRE
ITA
HUN
MKD
MNG
ROM
SRB
SVK
SLO
TUR
UKR
710
208
305264
49
151
175
89
32
91 681
57
7
95
170
691
835
32
55
61
450
173
389
56
56
1030
237
Figure 5.6.1 - Area exchanges in analyzed electric power systems for 2015-average hydrology high load scenario –
2015 topology As it can be seen, new elements that are expected to be build till 2015 cause totally different distribution of power flows in the southern part of the region (Albania, FYR of Macedonia, Serbia and Montenegro). Compared to the expected topology 2010, analyzed in previous chapter, it can be seen that the network losses are decreased as a consequence of building of new elements for 2015 network topology, especially in the cases of Albania, Serbia and Montenegro. Overall reduction of loses is around 39 MW.

5.37
Figure 5.6.2 - Power flows along interconnection lines in the region with balances of the systems for 2015-dry hydrology scenario
PEHLIN 228.0
MELINA 400.0
TUMBRI 399.2
MEDURIC 221.3MRACLIN 222.1
DAKOVO 220.7
KONJSKO
393.7
HE ZAKUC
224.5
ZERJAVIN 401.4
ZERJAVIN 226.1
AZEMLA1
404.2
AKASHA1 386.0
AVDEJA2222.7AFIERZ2223.7
OWIEN 1
405.2
OWIEN 2
234.1
MGYOR 4
403.1
MGYOR 2
228.8
ONEUSI2
233.4
OKAINA1401.0
LMARIB1401.8
OOBERS2238.7
IRDPV111
400.7
LDIVAC1
400.1
IPDRV121
230.0
LDIVAC2
228.9
LKRSKO1 399.8
PRIJED2 219.7
GRADACAC 223.7
TE TUZL 229.8
JSMIT21
396.2
VISEGRA229.3
JVARDI22227.4
SA 20226.0
JHPIVA21235.7
RP TREB398.3
JHPERU21
228.1
JPODG211
395.7
MO-4
398.4
MHEVI 4 407.2
RP TREB
230.9
JPODG121227.2
JPRIZ22228.7 JTKOSA2231.8JTKOSB1420.0
406.9
BITOLA 2 412.1
AHS_FLWR416.0
DUBROVO 408.9
QES/H K 412.4
BLAGOEV410.3
STIP 1
408.3
C_MOGILA
409.3
JNIS2 1396.5
SOFIA_W4407.1
KARDIA K416.9
GABICK1400.0
MGOD 4 406.4
LEVIC 1400.0
MSAJO 4410.0
UMUKACH
412.0
ROSIORI 383.9
MKISV 2226.2
UMUKACH2
224.4
MTLOK 2
230.4
MSAFA 4 392.0
JSUBO31 385.4
ARAD
382.4
TANTAREN 403.6
AEC_400 410.0
JHDJE11
397.0
LPODLO2228.5
FILIPPOI
415.5
SK 1 223.8
LCIRKO2 226.6
P.D.FIE
396.9
UGLJEVIK 396.7
ISACCEA 388.6
DOBRUD4 409.2
JSOMB31382.4
MPECS 4 406.9
UZUKRA01772.5
MAISA 7712.1
NADAB385.4
MBEKO 4392.7
SK 4 406.1
JLESK21397.2
ERNESTIN
401.9
MO-4
230.5
MI_3_4_1 417.5
JVRAN31401.5
LAGAD K 413.4
KARACQOU419.1KARACQOU419.1
K-KEXRU417.84BABAESK415.3
4HAMITAX
414.9
MSAJI 4408.1
AVDEJA1 395.0
56.877.2
56.2146
108
13.4
111
17.51
7.6
36.9
52.46.3
98.422.2
168
100
157
38.7
1573.0
411
123
417
57.5
50.859.8
25852.3
50.629.4
51.036.2
38661.2
38877.7
50.758.1
17.8
28.4
112
15.3
77.9
38.8
78.9
32.6
77.9
38.8
78.9
32.6
717
89.1
160
127 9
.8
67.4
9.9
5.9
55.475.2
55.474.2
209
112
210
70.6
209
112
95.1125
95.560.8
35.520.2
35.727.0
14.973.9
15.045.3
62.4264
71.070.9
70.7123
176
176
175
157
60.2
304
5133.1
55.2
39.4
19.5
13.2
55.6
22.9 105
45.7
306114
161
12.7
161
12.7
38.4
15.5
38.4
15.5
91.57.6
12.15.2
152
48.7
155
52.2
199
78.7
200
125
251
107
250
84.2
160
107
157
38.7
10.728.9
10.87.3
17849.1
17828.4
10.286.6
10.183.3
41.7
37.7
41.7
6.5
41.7
6.5
41.7
37.7
346813
350282
18.3148
18.0163
210
70.6
184
27.7
67.6
14.167.6
34.9
7.2
53.5
7.2
39.6
93.2
62.3
22.713.1
22.627.0
51.921.2
98.3103
167
50.7
30481.8
114
107
114
107
114
61.1 114
61.1
19011.2
54.7
32.8
19.6
5.4 55.3
27.4
104
47.2
161
11.8
161
11.8
8.1
0.6
8.110.4
38.2
90.5 3
8.2
90.59
1.6
15.9
12.1
15.2
5071.9
1955.2
126
57.1
93.5
29.4
94.9
81.9
95.1
46.2
183
68.0
126
70.1
56.423.7
25.025.8
126
57.1
31.425.4
25.0
54.2
31.4
77.0
56.472.3
25050.0
25.054.2
25.065.5
237
76.0
236
114
725
134
570
142566131
109
39.7
185
107
184
141
185
107
184
141
ROM
BUL
HUN
UKRUCTE
CENTREL
CRO
BIH
SCG
ALB
GRE
MKD
TUR
SLO
CRGSRB
2638.9 MW
587.0 MW2051.9 MW
-617.0 MW
899.0 MW
-883.0 MW
112.9 MW
222.4 MW
-1448.1 MW
-1249.9 MW
0.0 MW
450.0 MW
-1040.2 MW
215.0 MW
0.0 MW
450.0 MW
SHAW POWERTECHNOLOGIESINC.R KV: 110 , 220 , 400
BUS -VOLTAGE(KV)
EQUIPMENT -MW/MVARBRANCH -MW/MVAR
GIS REGIONAL MODEL - AVERAGE HYDRO2015 HIGH LOAD - NEW GENERATION - TOPOLOGY 2015

5.38
Table 5.6.1 - Area totals in analyzed electric power systems for 2015-average hydrology high load scenario – 2015 topology
AREA GENERATION LOAD LOSSES INTERCHANGE ALBANIA 897.7 1684 96.7 -883
BULGARIA 8157.4 7083 175.4 899 BIH 2479.7 2272 94.7 112.9
CROATIA 2592.1 3959 81.1 -1448.1 MACEDONIA 895.7 1489 23.7 -617
ROMANIA 7676.4 8269.8 446.7 -1040.1 SERBIA 10023.9 7660 311.9 2051.9
MONTENEGRO 1322.6 708 27.6 587 TOTALS 34045.5 33124.8 1257.8 -337.4
Table 5.6.2 - Comparison of Area totals in analyzed electric power systems for 2015- average hydrology versus average
hydrology high load scenario –2015 topology LOAD LOSSES
AREA normal load high load normal
load high load
ALBANIA 1541 1684 9.28% 73.1 96.7 32.28% BULGARIA 6483 7083 9.25% 150.9 175.4 16.24%
BIH 2279 2272 -0.31% 79.2 94.7 19.57% CROATIA 3657 3959 8.26% 64 81.1 26.72%
MACEDONIA 1407 1489 5.83% 21.4 23.7 10.75% ROMANIA 7317.4 8269.8 13.02% 343.1 446.7 30.2%
SERBIA 7279 7660 5.23% 254.4 311.9 22.6% MONTENEGRO 676 708 4.73% 20.3 27.6 35.96%
TOTALS 30639.4 33124.8 8.11% 1006.4 1257.8 24.98%
Histogram
0
5
10
15
20
25
30
35
40
x<25 25<x<50 50<x<75 75<x<100 x>100
Bin
Fr
eq
ue
nc
y
Figure 5.6.3 - Histogram of interconnection lines loadings for 2015-average hydrology high load scenario – 2015 topology ("Frequency" denotes number of lines and "Bin" denotes loading range in % of thermal limit)
Following Table 5.6.3 shows all network elements loaded over 80% of their thermal limits. Histogram of branch loadings in the system is shown in Figure 5.6.4. As it can be seen large number of lines 220 kV voltage level in Albania, Romania and Serbia are loaded over 80% for the reasons described in previous chapter in detail. It can be concluded that new expected network topology for 2015 compared to 2010 topology has small influence in overall load level of the transmission network. Almost the same elements are found critical as for topology 2010, especially in parts of the network that supply major consumption areas (Tirana in Albania, Bucharest and Timisoara in Romania, Belgrade in Serbia and Pristina in Serbia-UNMIK).

5.39
Table 5.6.3 - Network elements loaded over 80% of their thermal limits for 2015-average hydrology high load scenario – 2015 topology
BRANCH LOADINGS ABOVE 80.0 % OF RATING:
AREA ELEMENT LOADINGMVA
RATINGMVA PERCENT
Lines ALB HL 220kV AKASHA2-ARRAZH2 1 290.4 270 107.6
HL 220kV BRADU-TIRGOVI 1 283.9 302.6 93.8 HL 220kV BUC.S-B-FUNDENI 1 307.5 320 96.1 HL 220kV FILESTI-BARBOSI 1 245.8 277.4 88.6 HL 220kV L.SARAT-FILESTI 1 239 277.4 86.2 HL 220kV LOTRU-SIBIU 1 281.2 277.4 101.4 HL 220kV LOTRU-SIBIU 2 281.2 277.4 101.4
HL 220kV P.D.F.A-CETATE1 1 206.3 208.1 99.1 HL 220kV P.D.F.A-RESITA 1 262.1 277.4 94.5 HL 220kV P.D.F.A-RESITA 2 262.1 277.4 94.5
HL 220kV P.D.F.II-CETATE1 1 269.9 277.4 97.3 HL 220kV RESITA-TIMIS 1 225 277.4 81.1 HL 220kV RESITA-TIMIS 2 225 277.4 81.1
HL 220kV TG.JIU-PAROSEN 1 313.8 208.1 150.8
ROM
HL 220kV URECHESI-TG.JIU 1 313.5 277.4 113 SRB HL 220kV JBGD3 21-JOBREN2 1 292 301 97
Transformers TR 220/110 kV ABURRE 1 52.2 60 87 TR 220/110 kV ABURRE 2 52.2 60 87 TR 220/110 kV ABURRE 3 52.2 60 87 TR 220/110 kV AELBS1 1 87.8 90 97.6 TR 220/110 kV AELBS1 2 87.8 90 97.6 TR 220/110 kV AELBS1 3 94.4 90 104.8 TR 220/110 kV AFIER 1 151.7 120 126.4 TR 220/110 kV AFIER 2 124.4 90 138.2 TR 220/110 kV AFIER 3 118.7 90 131.9 TR 220/110 kV AFIERZ 1 59.9 60 99.8 TR 220/110 kV AFIERZ 2 59.9 60 99.8 TR 220/110 kV AKASHA 1 94.7 100 94.7 TR 220/110 kV AKASHA 2 94.7 100 94.7 TR 220/110 kV ARRAZH 1 87.5 100 87.5 TR 220/110 kV ARRAZH 2 87.5 100 87.5 TR 220/110 kV ATIRAN 2 96.4 120 80.3
ALB
TR 220/110 kV ATIRAN 3 100.6 120 83.9 TR 220/110 kV MO-4 3 124.4 150 83 BIH
TR 400/110 kV UGLJEV 1 256.1 300 85.4 CRO TR 220/110 kV TESISA 1 179.4 200 89.7
TR 220/110 kV BARBOS 1 166.6 200 83.3 TR 220/110 kV FUNDE2 1 239.8 200 119.9 TR 220/110 kV FUNDEN 1 203 200 101.5 TR 220/110 kV TIMIS 1 170.4 200 85.2 TR 400/110 kV BRASOV 1 230.2 250 92.1 TR 400/110 kV CLUJ E 1 206.4 250 82.6 TR 400/110 kV DIRSTE 1 219.6 250 87.8 TR 400/220 kV BUC.S 1 376.5 400 94.1 TR 400/220 kV BUC.S 2 376.5 400 94.1 TR 400/220 kV IERNUT 1 404.8 400 101.2
ROM
TR 400/220 kV URECHE 1 479.7 400 119.9 TR 220/110 kV JBGD3 1 174.8 200 87.4 TR 220/110 kV JBGD3 2 137.5 150 91.7 TR 220/110 kV JTKOSA 2 133.5 150 89 TR 220/110 kV JTKOSA 3 135.9 150 90.6 TR 220/110 kV JZREN2 2 133.8 150 89.2 TR 400/220 kV JBGD8 1 330.3 400 82.6 TR 400/220 kV JTKOSB 1 351.9 400 88 TR 400/220 kV JTKOSB 2 367.7 400 91.9
SRB
TR 400/220 kV JTKOSB 3 367.7 400 91.9 MNG TR 220/110 kV JTPLJE 1 102.4 125 82
Histogram
0
50
100
150
200
250
300
x<25 25<x<50 50<x<75 75<x<100 x>100
Bin
Fr
eq
ue
nc
y
Figure 5.6.4 - Histogram of branch loadings for 2015-average hydrology scenario – 2015 topology ("Frequency"
denotes number of lines and "Bin" denotes loading range in % of thermal limit)

5.40
This leads to conclusion that planned network reinforcements compared to network topology 2010, reduce loading of some elements in southern part of Serbia, and that in order for transmission network to sustain this load-demand level and this production pattern, additional network reinforcements are necessary, especially in increasing transformer capacity in substations that supply major consumption areas in Albania, Romania and Serbia.
5.6.2 Voltage Profile in the Region Figure 5.6.5 shows histogram of voltages in monitored substations. Like for the investigated topology 2010, overall voltage profile is not adequate, but comparing to 2010 topology voltage profile is much better in monitored parts of Albanian and Serbian network. In some parts of the network, especially in major consumption areas of Romania, voltages in some monitored substations are below allowed limits. Using of voltage control devices (tap changing transformers, shunt devices) can improve voltage profile in this region, but it can be concluded that conditions in some parts of the transmission network of Romania are dangerously close to voltage collapse. Since this is local problem, detailed analyses is necessary to analyze this situation.
Histogram
0
10
20
30
40
50
60
70
80
x<0.9
0.9<x<0.95
0.95<x<0.975
0.975<x<1
1<x<1.025
1.025<x<1.05
1.05<x<1.1
x>1.1
Bin
Fr
eq
ue
nc
y
Figure 5.6.5 - Histogram of voltages in monitored substations for 2015-average hydrology high load scenario –
2015 topology ("Frequency" denotes number of busses and "Bin" denotes voltage range in p.u.)
5.6.3 Security (n-1) analysis Results of security (n-1) analysis for 2015-average hydrology high load scenario and expected network topology for 2015 are presented in Table 5.6.4. Figure 5.6.6 shows the geographical position of the critical elements in monitored systems.

5.41
Like for expected topology 2010 (previous chapter), it can be concluded that all identified insecure situations are located in internal networks that belong to monitored power systems of Albania, Romania and Serbia. Also, the planned network reinforcements till 2015 resolve some of the noticed critical contingencies, especially in southern part of Serbia. Compared to the similar scenario with normal load projection, it can be concluded that higher load-demand projected and new production capacities modeled, increase the overload level of some critical elements. The rest of the conclusions are the same as in case of the analyzed normal load projection and expected topology 2015, and that is that certain level of network reinforcement is necessary to make this regime more secure.
AUT
ALB
BIH
BUL
CRO
GRE
HUN
MKD
MNG
ROM
SRB
SVK
SLO
TUR
400 kV line or 400/x kV transformer220 kV line or 220/x kV transformer
critical elements
Figure 5.6.6 – geographical position of critical elements for 2015-average hydrology high load scenario –
2015 topology
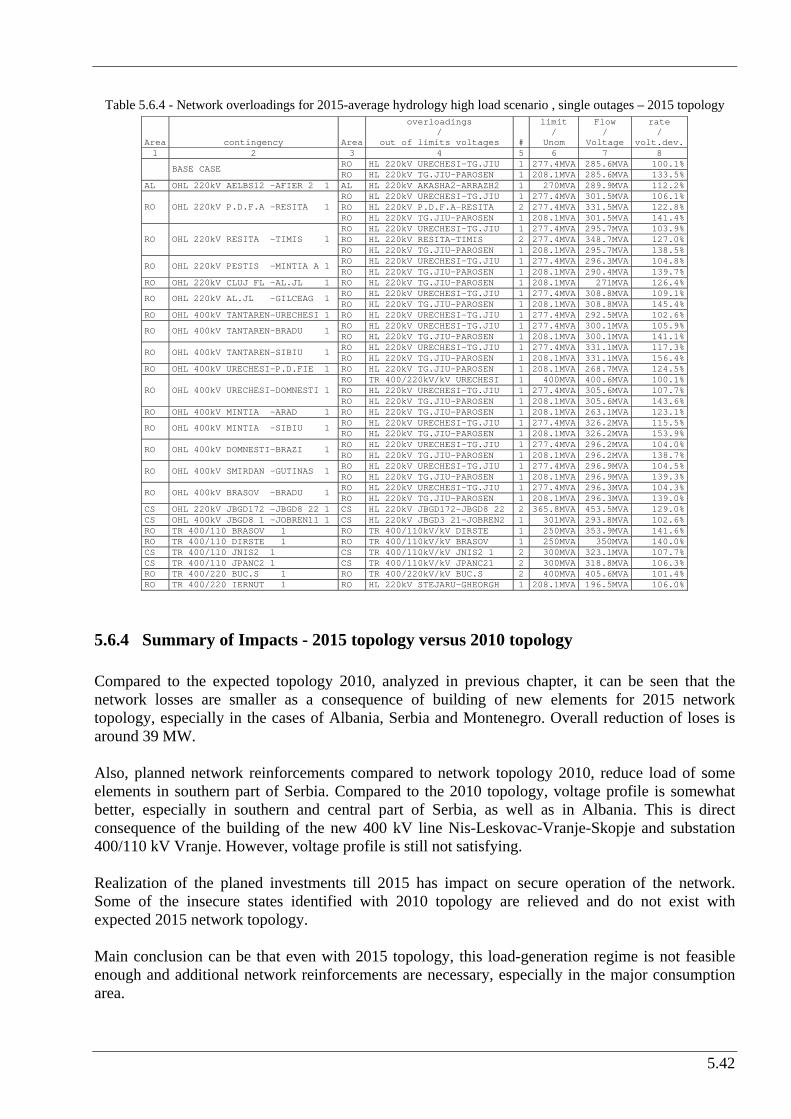
5.42
Table 5.6.4 - Network overloadings for 2015-average hydrology high load scenario , single outages – 2015 topology
Area contingency Area
overloadings /
out of limits voltages #
limit /
Unom
Flow /
Voltage
rate /
volt.dev.1 2 3 4 5 6 7 8
RO HL 220kV URECHESI-TG.JIU 1 277.4MVA 285.6MVA 100.1% BASE CASE RO HL 220kV TG.JIU-PAROSEN 1 208.1MVA 285.6MVA 133.5%
AL OHL 220kV AELBS12 -AFIER 2 1 AL HL 220kV AKASHA2-ARRAZH2 1 270MVA 289.9MVA 112.2%RO HL 220kV URECHESI-TG.JIU 1 277.4MVA 301.5MVA 106.1%RO HL 220kV P.D.F.A-RESITA 2 277.4MVA 331.5MVA 122.8%RO OHL 220kV P.D.F.A -RESITA 1 RO HL 220kV TG.JIU-PAROSEN 1 208.1MVA 301.5MVA 141.4%RO HL 220kV URECHESI-TG.JIU 1 277.4MVA 295.7MVA 103.9%RO HL 220kV RESITA-TIMIS 2 277.4MVA 348.7MVA 127.0%RO OHL 220kV RESITA -TIMIS 1 RO HL 220kV TG.JIU-PAROSEN 1 208.1MVA 295.7MVA 138.5%RO HL 220kV URECHESI-TG.JIU 1 277.4MVA 296.3MVA 104.8%RO OHL 220kV PESTIS -MINTIA A 1 RO HL 220kV TG.JIU-PAROSEN 1 208.1MVA 290.4MVA 139.7%
RO OHL 220kV CLUJ FL -AL.JL 1 RO HL 220kV TG.JIU-PAROSEN 1 208.1MVA 271MVA 126.4%RO HL 220kV URECHESI-TG.JIU 1 277.4MVA 308.8MVA 109.1%RO OHL 220kV AL.JL -GILCEAG 1 RO HL 220kV TG.JIU-PAROSEN 1 208.1MVA 308.8MVA 145.4%
RO OHL 400kV TANTAREN-URECHESI 1 RO HL 220kV URECHESI-TG.JIU 1 277.4MVA 292.5MVA 102.6%RO HL 220kV URECHESI-TG.JIU 1 277.4MVA 300.1MVA 105.9%RO OHL 400kV TANTAREN-BRADU 1 RO HL 220kV TG.JIU-PAROSEN 1 208.1MVA 300.1MVA 141.1%RO HL 220kV URECHESI-TG.JIU 1 277.4MVA 331.1MVA 117.3%RO OHL 400kV TANTAREN-SIBIU 1 RO HL 220kV TG.JIU-PAROSEN 1 208.1MVA 331.1MVA 156.4%
RO OHL 400kV URECHESI-P.D.FIE 1 RO HL 220kV TG.JIU-PAROSEN 1 208.1MVA 268.7MVA 124.5%RO TR 400/220kV/kV URECHESI 1 400MVA 400.6MVA 100.1%RO HL 220kV URECHESI-TG.JIU 1 277.4MVA 305.6MVA 107.7%RO OHL 400kV URECHESI-DOMNESTI 1 RO HL 220kV TG.JIU-PAROSEN 1 208.1MVA 305.6MVA 143.6%
RO OHL 400kV MINTIA -ARAD 1 RO HL 220kV TG.JIU-PAROSEN 1 208.1MVA 263.1MVA 123.1%RO HL 220kV URECHESI-TG.JIU 1 277.4MVA 326.2MVA 115.5%RO OHL 400kV MINTIA -SIBIU 1 RO HL 220kV TG.JIU-PAROSEN 1 208.1MVA 326.2MVA 153.9%RO HL 220kV URECHESI-TG.JIU 1 277.4MVA 296.2MVA 104.0%RO OHL 400kV DOMNESTI-BRAZI 1 RO HL 220kV TG.JIU-PAROSEN 1 208.1MVA 296.2MVA 138.7%RO HL 220kV URECHESI-TG.JIU 1 277.4MVA 296.9MVA 104.5%RO OHL 400kV SMIRDAN -GUTINAS 1 RO HL 220kV TG.JIU-PAROSEN 1 208.1MVA 296.9MVA 139.3%RO HL 220kV URECHESI-TG.JIU 1 277.4MVA 296.3MVA 104.3%RO OHL 400kV BRASOV -BRADU 1 RO HL 220kV TG.JIU-PAROSEN 1 208.1MVA 296.3MVA 139.0%
CS OHL 220kV JBGD172 -JBGD8 22 1 CS HL 220kV JBGD172-JBGD8 22 2 365.8MVA 453.5MVA 129.0%CS OHL 400kV JBGD8 1 -JOBREN11 1 CS HL 220kV JBGD3 21-JOBREN2 1 301MVA 293.8MVA 102.6%RO TR 400/110 BRASOV 1 RO TR 400/110kV/kV DIRSTE 1 250MVA 353.9MVA 141.6%RO TR 400/110 DIRSTE 1 RO TR 400/110kV/kV BRASOV 1 250MVA 350MVA 140.0%CS TR 400/110 JNIS2 1 CS TR 400/110kV/kV JNIS2 1 2 300MVA 323.1MVA 107.7%CS TR 400/110 JPANC2 1 CS TR 400/110kV/kV JPANC21 2 300MVA 318.8MVA 106.3%RO TR 400/220 BUC.S 1 RO TR 400/220kV/kV BUC.S 2 400MVA 405.6MVA 101.4%RO TR 400/220 IERNUT 1 RO HL 220kV STEJARU-GHEORGH 1 208.1MVA 196.5MVA 106.0%
5.6.4 Summary of Impacts - 2015 topology versus 2010 topology Compared to the expected topology 2010, analyzed in previous chapter, it can be seen that the network losses are smaller as a consequence of building of new elements for 2015 network topology, especially in the cases of Albania, Serbia and Montenegro. Overall reduction of loses is around 39 MW. Also, planned network reinforcements compared to network topology 2010, reduce load of some elements in southern part of Serbia. Compared to the 2010 topology, voltage profile is somewhat better, especially in southern and central part of Serbia, as well as in Albania. This is direct consequence of the building of the new 400 kV line Nis-Leskovac-Vranje-Skopje and substation 400/110 kV Vranje. However, voltage profile is still not satisfying. Realization of the planed investments till 2015 has impact on secure operation of the network. Some of the insecure states identified with 2010 topology are relieved and do not exist with expected 2015 network topology. Main conclusion can be that even with 2015 topology, this load-generation regime is not feasible enough and additional network reinforcements are necessary, especially in the major consumption area.
6.1
6 ANALYSES SUMMARY AND RECOMMENDATIONS

6.2
In this chapter, comparison of the all analyzed scenarios is presented. Main issues are impact of different generation patterns and planed network investments on system losses and system security. The authors tried to give main indicators how to resolve some insecure states identified, based on prerequisites and assumptions presented in Chapter 2 and only results of the analyses of scenarios. Deeper impacts of the proposed remedies are not analyzed whether they are or not in compliance with long term investments plans of the countries in the region.
6.1 Reference cases Reference cases consist of nine cases. Three different hydrology scenarios are analyzed (average, dry and wet) for years 2010 and 2015. Also, for each of these generation-load patterns in year 2015 two cases are analyzed (first for 2010 topology, i.e. without any new line or transformer planned for commissioning between 2010 and 2015 and second for expected topology in year 2015).
6.1.1 Analyses comparison Main focus of this subchapter is to analyze influence of different generation patterns and planed network investments on overall network performance and system losses. Table 6.1.1 shows overview of losses on regional level. It can be seen that new elements planned for commissioning between 2010 and 2015 influence reduction of losses in analyzed region, no matter of hydrology. This reduction of losses is between 30 and 40 MW.
Table 6.1.1: Peak Hour - Regional Losses (MW)
Year 2010 Year 2015 Topology Dry Average Wet Dry Average Wet
2010 756.9 737.1 741.5 951.6 1,035.1 976.6 2015 - - - 909.6 1,006.4 941.8
These changes are consequence of better voltage profile in analyzed region, especially in areas directly influenced by the new elements. For example, new interconnection line Nis-Leskovac-Vranje-Skopje greatly improves voltage profile in southern part of Serbia and new interconnection lines Podgorica – V.Dejes – Kashar – Elbasan and Kosovo B – V.Dejes – Kashar – Elbasan greatly improve voltage profile in Albania. Higher voltages and reduction of load of some elements that are highly influenced by the new elements, reduce power losses mainly in Albania, Southern Serbia, and in the region as whole. Table 6.1.2 shows overview of area summaries for analyzed reference cases. Comparing cases with different hydrology (for the same year and topology) it can be concluded following:
Since analyzed region is balanced, deficit of power produced by hydro power plants is compensated by greater power produced by thermal power plants. Different hydrology causes different generation and interchange patterns.
Because of different generation and interchange patterns, power flows are different and this cause different level of losses, but it is not possible to establish clear connection between these factors.
Level of intersystem interchanges is much higher than in present or history. It has to be stated that networks of single systems are developed mainly to cover their demand with their own production capacities, so this kind of power plant engagement and level of interchanges cause power flows and network status that are different from ones recorded. This goes especially Albanian and Serbian system.
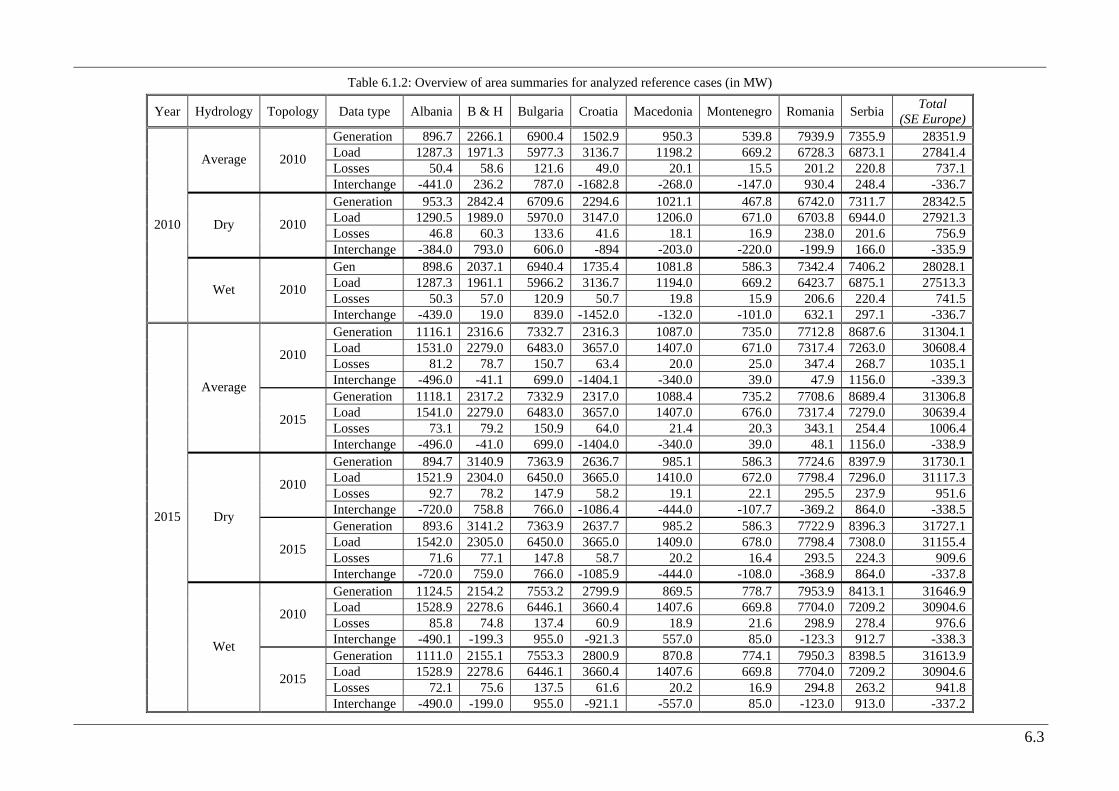
6.3
Table 6.1.2: Overview of area summaries for analyzed reference cases (in MW)
Year Hydrology Topology Data type Albania B & H Bulgaria Croatia Macedonia Montenegro Romania Serbia Total (SE Europe)
Generation 896.7 2266.1 6900.4 1502.9 950.3 539.8 7939.9 7355.9 28351.9Load 1287.3 1971.3 5977.3 3136.7 1198.2 669.2 6728.3 6873.1 27841.4Losses 50.4 58.6 121.6 49.0 20.1 15.5 201.2 220.8 737.1
Average 2010
Interchange -441.0 236.2 787.0 -1682.8 -268.0 -147.0 930.4 248.4 -336.7Generation 953.3 2842.4 6709.6 2294.6 1021.1 467.8 6742.0 7311.7 28342.5Load 1290.5 1989.0 5970.0 3147.0 1206.0 671.0 6703.8 6944.0 27921.3Losses 46.8 60.3 133.6 41.6 18.1 16.9 238.0 201.6 756.9
Dry 2010
Interchange -384.0 793.0 606.0 -894 -203.0 -220.0 -199.9 166.0 -335.9Gen 898.6 2037.1 6940.4 1735.4 1081.8 586.3 7342.4 7406.2 28028.1Load 1287.3 1961.1 5966.2 3136.7 1194.0 669.2 6423.7 6875.1 27513.3Losses 50.3 57.0 120.9 50.7 19.8 15.9 206.6 220.4 741.5
2010
Wet 2010
Interchange -439.0 19.0 839.0 -1452.0 -132.0 -101.0 632.1 297.1 -336.7Generation 1116.1 2316.6 7332.7 2316.3 1087.0 735.0 7712.8 8687.6 31304.1Load 1531.0 2279.0 6483.0 3657.0 1407.0 671.0 7317.4 7263.0 30608.4Losses 81.2 78.7 150.7 63.4 20.0 25.0 347.4 268.7 1035.1
2010
Interchange -496.0 -41.1 699.0 -1404.1 -340.0 39.0 47.9 1156.0 -339.3Generation 1118.1 2317.2 7332.9 2317.0 1088.4 735.2 7708.6 8689.4 31306.8Load 1541.0 2279.0 6483.0 3657.0 1407.0 676.0 7317.4 7279.0 30639.4Losses 73.1 79.2 150.9 64.0 21.4 20.3 343.1 254.4 1006.4
Average
2015
Interchange -496.0 -41.0 699.0 -1404.0 -340.0 39.0 48.1 1156.0 -338.9Generation 894.7 3140.9 7363.9 2636.7 985.1 586.3 7724.6 8397.9 31730.1Load 1521.9 2304.0 6450.0 3665.0 1410.0 672.0 7798.4 7296.0 31117.3Losses 92.7 78.2 147.9 58.2 19.1 22.1 295.5 237.9 951.6
2010
Interchange -720.0 758.8 766.0 -1086.4 -444.0 -107.7 -369.2 864.0 -338.5Generation 893.6 3141.2 7363.9 2637.7 985.2 586.3 7722.9 8396.3 31727.1Load 1542.0 2305.0 6450.0 3665.0 1409.0 678.0 7798.4 7308.0 31155.4Losses 71.6 77.1 147.8 58.7 20.2 16.4 293.5 224.3 909.6
Dry
2015
Interchange -720.0 759.0 766.0 -1085.9 -444.0 -108.0 -368.9 864.0 -337.8Generation 1124.5 2154.2 7553.2 2799.9 869.5 778.7 7953.9 8413.1 31646.9Load 1528.9 2278.6 6446.1 3660.4 1407.6 669.8 7704.0 7209.2 30904.6Losses 85.8 74.8 137.4 60.9 18.9 21.6 298.9 278.4 976.6
2010
Interchange -490.1 -199.3 955.0 -921.3 557.0 85.0 -123.3 912.7 -338.3Generation 1111.0 2155.1 7553.3 2800.9 870.8 774.1 7950.3 8398.5 31613.9Load 1528.9 2278.6 6446.1 3660.4 1407.6 669.8 7704.0 7209.2 30904.6Losses 72.1 75.6 137.5 61.6 20.2 16.9 294.8 263.2 941.8
2015
Wet
2015
Interchange -490.0 -199.0 955.0 -921.1 -557.0 85.0 -123.0 913.0 -337.2

6.4
Table 6.1.3: Overview of high loaded elements in analyzed reference cases LOAD LEVEL 2010 2015 HYDROLOGY average dry wet average dry wet TOPOLOGY 2010 2015 2010 2015 2010 2015
AREA ELEMENT RATINGMVA
LOADMVA % LOAD
MVA % LOADMVA % LOAD
MVA % LOADMVA % LOAD
MVA % LOADMVA % LOAD
MVA % LOADMVA %
Lines ALB OHL 220 kV AKASHA2-ARRAZH2 270 250 92.6 238 88 275 102 243 89.9 259 96 237 87.8 BUL OHL 220 kV MI_2_220-ST ZAGORA 228.6 191 83.5 190 83.3
OHL 220 kV MINTIA-SIBIU 381.1 268 96.5 268 96.4 324 85.1 313 82.2 OHL 220 kV P.D.F.II-CETATE1 277.4 205 98.6 205 98.5 269 97 268 96.8 OHL 220 kV P.D.F.A-CETATE1 208.1 236 85.2 232 83.7 206 99 206 98.8 OHL 220 kV P.D.F.A-RESITA ckt.1 277.4 236 85.2 232 83.7 239 86.2 236 84.9 OHL 220 kV P.D.F.A-RESITA ckt.2 277.4 239 86.2 236 84.9 OHL 220 kV LOTRU-SIBIU ckt.1 277.4 276 99.5 304 109 303 109 OHL 220 kV LOTRU-SIBIU ckt.2 277.4 276 99.5 304 109 303 109 OHL 220 kV URECHESI-TG.JIU 277.4 278 100 273 98.3 280 101 275 99.3 OHL 220 kV TG.JIU-PAROSEN 208.1 182 87.3 278 134 273 131 280 135 275 132
ROM
OHL 220 kV BUC.S-B-FUNDENI 320 261 81.6 261 81.4 285 89.2 285 88.9 SRB OHL 220 kV JBGD3 21-JOBREN2 301 261 86.7 262 87 294 97.5 295 97.9 313 104 313 104
Transformers TR 220/110 kV AFIERZ2-AFIERZ5 ckt.1 60 51.9 86.5 50.3 83.8 59 98.3 52.1 86.9 54.6 91.1 50.2 83.7 TR 220/110 kV AFIERZ2-AFIERZ5 ckt.2 60 51.9 86.5 50.3 83.8 59 98.3 52.1 86.9 54.6 91.1 50.2 83.7 TR 220/110 kV AELBS12-AELBS15 ckt.1 90 78 86.6 74.3 82.5 84.7 94.1 75.4 83.8 81.4 90.5 74.8 83.2 TR 220/110 kV AELBS12-AELBS15 ckt.2 90 78 86.6 74.3 82.5 84.7 94.1 75.4 83.8 81.4 90.5 74.8 83.2 TR 220/110 kV AELBS12-AELBS15 ckt.3 90 83.8 93.1 79.8 88.7 91 101 81 90 87.5 97.2 80.4 89.3 TR 220/110 kV AKASHA2-AKASH25 ckt.1 100 84.1 84.1 82.1 82.1 90.8 90.8 83.5 83.5 87.2 87.2 82.3 82.3 TR 220/110 kV AKASHA2-AKASH25 ckt.2 100 84.1 84.1 82.1 82.1 90.8 90.8 83.5 83.5 82.3 82.3 TR 220/110 kV AFIER 2-AFIER 5 ckt.1 120 117 93.7 107 89 117 97.1 138 115 135 113 147 122 137 114 141 118 135 112 TR 220/110 kV AFIER 2-AFIER 5 ckt.2 90 95.7 106 87.5 97.2 95.5 106 113 126 111 123 120 134 112 125 116 129 110 123 TR 220/110 kV AFIER 2-AFIER 5 ckt.3 90 91.4 102 83.5 92.8 91.1 101 108 120 106 117 115 128 107 119 110 123 105 117 TR 220/110 kV ARRAZH 1 100 84.7 84.7 80.3 80.3 TR 220/110 kV ARRAZH 2 100 84.7 84.7 80.3 80.3
ALB
TR 220/110 kV ATIRAN 3 120 98.2 81.9 B&H TR 400/110 kV UGLJEVIK 300 255 84.9 255 84.9 253 84.2 242 80.8 241 80.2 270 90 268 89.2
TR 400/220 kV URECHESI 400 395 98.9 391 97.7 414 104 410 103 TR 400/220 kV BUC.S-BUC.S-B ckt.1 400 340 85 339 84.8 TR 400/220 kV BUC.S-BUC.S-B ckt.2 400 340 85 339 84.8 TR 220/110 kV FUNDE2 1 200 173 86.6 168 84.1 169 84.4 193 96.7 193 96.5 200 99.9 200 99.8 209 104 208 104 TR 220/110 kV FUNDEN 1 200 163 81.4 163 81.3 169 84.2 168 84.1 176 88 176 87.8 TR 400/220 kV MINTIA-MINTIA B 400 386 96.4
ROM
TR 400/220 kV IERNUT 1 400 320 80.1 325 81.3 324 81.1 TR 400/220 kV JBGD8 1 400 338 84.5 335 83.7 TR 220/110 kV JBGD3 1 200 167 83.4 167 83.3 171 85.6 171 85.5 197 98.6 197 98.3 TR 220/110 kV JBGD3 2 150 126 83.7 126 83.9 130 86.5 130 86.6 135 89.7 134 89.6 TR 220/110 kV JZREN2 2 150 124 82.4 124 82.3 122 81.3 122 81 TR 220/110 kV JTKOSA 2 150 131 87.1 133 88.9 132 87.9 TR 220/110 kV JTKOSA 3 150 133 88.7 136 90.5 134 89.5 TR 400/220 kV JTKOSB 1 400 323 80.8 TR 400/220 kV JTKOSB 2 400 326 81.4 338 84.4 325 81.1 TR 400/220 kV JTKOSB 3 400 326 81.4 338 84.4 325 81.1 TR 220/110 kV JPRIS4 1 150 122 81.1 TR 220/110 kV JPRIS4 2 150 122 81.1
SRB
TR 400/110 kV JJAGO4 300 247 82.5

6.5
Table 6.1.3 shows summary for elements loaded over 80% of their thermal limits. In network planning practice, this is used as one of the main indicators which parts of the transmission network represent weak spots and what network reinforcements are necessary in sense of generation and supply, without taking into consideration the security aspects. Analysis of these results leads to conclusion that transmission network is capable of transferring power from generation facilities to major consumption areas, and network reinforcement is not necessary (without taking n-1 criterion into consideration). But, in some substations, there is not enough transformer capacity to supply demand from transmission network, since the load of these elements do not depend on generation pattern and level of system interchange, but only on load level in these substations. This is problem of local supply, and this should be studied as program of local not regional system development. Increase of transformer installed capacity is needed in substations 220/110 kV Fier, Elbasan, Fierza and Kashar in Albania, 400/110 kV Ugljevik in Bosnia and Herzegovina. Also, it should be noted that level of reactive power consumption in load flow model of Albania is very high comparing to the other systems and not realistic. This is one of the reasons why voltage profile in Albanian network is very close to voltage collapse in some investigated scenarios. Because of the problem with unrealistic reactive power demand new reactive power demand forecast is needed. Influence of voltage control equipment was not tested on regional level, and therefore it is not possible to give answer weather there is possibility to better voltage profile in certain regimes. Also, no light load regimes were analyzed, so there is no possibility to analyze effect of new reactive power control devices.
6.1.2 Overview on possible solutions for system relief In this subchapter, security aspects of network performance in analyzed scenarios are presented. As it has been concluded in Chapter 4, in all investigated scenarios, some elements are highly loaded even in case of full topology. Most of the elements loaded over 80% are transformers in some substations and also there are some overloaded elements (Table 6.1.3). Based on full topology and n-1 contingency analyses, some internal network reinforcements are necessary to sustain analyzed load-demand level and production pattern. In other words, optimum GTMax dispatch, according to analyzed generation and load scenarios, is not possible to achieve with desired level of network security. Internal network reinforcements are necessary in order to achieve such optimal dispatch. Most of the identified critical network elements in Romania can be relieved by dispatching actions (change of network topology or production units engagement). Re-dispatching actions, mostly in the power system of Romania (power plants DEVA 1, LOTRU CIUNGET, PORTILE 1, PAROSENI and ROVINARI) will be necessary to keep desired network security level according to the (n-1) criterion. Also, installing a new transformer unit 400/110 kV in Brasov is planned and helps resolving some critical states in Romanian network. Upgrading the Timisoara substation to 400 kV level and supplying this area from 400 kV network instead from 220 kV would resolve some problems in Romanian network. Reinforcement of local network in vicinity of Belgrade is necessary, but as it has been stated before, this is local development. Problem of supplying Belgrade area must be part of more complex and thorough analyses.

6.6
Central part of the 400 kV network in Serbia is heavy loaded due to large energy transits from Romania, Bulgaria and south of Serbia (Kosovo and Metohija) to Croatia and Hungary. Strengthening of the 400 kV corridor from Romania through Serbia to Croatia (East-West), by building 400 kV lines Romania (e.g. new proposed substation Timisoara)-(Vrsac)-Drmno and Belgrade-Obrenovac can relieve this problem. For all of this, more thorough analyses are needed and only adequate feasibility studies can give the proper answer to the question about the level and type of network reinforcements. Final conclusions concerning year 2010 are:
- expected network topology in year 2010 is sufficient for all investigated generation and load pattern for year 2010, except in South Serbia and Belgrade area;
- building of the 400 kV corridor Nis-Leskovac-Vranje-Skoplje before 2010 resolves all insecure states identified in network of southern Serbia for investigated regimes in 2010;
- network reinforcement in Belgrade area is necessary; - level of reactive power consumption in load flow model of Albania is very high
comparing to the other systems and not realistic and this causes some overloads due to low voltage profile in Albanian network;
- high loads and overloads of elements in Romania can be relieved by operational methods.
Expected network topology for 2015 generally improves network performance, especially in the cases of Albanian and Serbian network. But, additional network reinforcements are necessary, especially in increasing transformer capacities in mentioned substations, over which large consumption areas are supplied. In case of Romania, it is hard to say what reinforcements are necessary, since most of the identified insecure states can be relieved with production redispatch and network topology changes. New proposed lines (Visegrad – Pljevlja, Tumbri – Banja Luka and Pecs – Sombor) do not resolve any of the identified insecure states, since these lines are electrically far from these critical network elements, and therefore do not have significant influence. But, they do increase transfer capabilities of interconnected network. Final conclusions concerning year 2015 are:
- new lines commissioned to come into operation between 2010 and 2015 greatly reduce losses in analyzed region, regardless of hydrology;
- expected network topology in year 2015 is sufficient for all investigated generation and load pattern for year 2010, except in Belgrade area;
- building of the 400 kV corridor Nis-Leskovac-Vranje-Skoplje resolves all insecure states identified in network of southern Serbia for investigated regimes in 2015;
- network reinforcement in east-west corridor in Serbia is necessary (this includes Belgrade area also);
- level of reactive power consumption in load flow model of Albania is very high comparing to the other systems and not realistic and this causes some overloads due to low voltage profile in Albanian network;
- high loads and overloads of elements in Romania can be relieved by operational methods;
- proposed interconnection lines candidates do not resolve any of the identified problems.

6.7
6.2 Sensitivity cases Sensitivity cases consist of six scenarios. In all of these cases average hydrology is used. Two different scenarios are analyzed (first 1500 MW of import plus 500 MW of transit and second high load growth) for years 2010 and 2015. Also, for each of these scenarios in year 2015 two cases are analyzed (first for 2010 topology, i.e. without any new line or transformer planned for commissioning between 2010 and 2015 and second for expected topology in year 2015).
6.2.1 Analyses comparison Main focus of this subchapter is to analyze influence of high load growth rate and import/export regime on system losses and overall network performance. Table 6.2.1 shows overview of losses on regional level. It can be seen that new elements planned for commissioning between 2010 and 2015 influence reduction of losses in analyzed region, no matter of hydrology. This reduction of losses is between 30 and 40 MW.
Table 6.2.1: Peak Hour - Regional Losses (MW) under Average Hydrologic Conditions
Year 2010 Year 2015 Case 2010* 2010* 2015*
Reference Case 737.1 1,035.1 1,006.4 Imports/Exports 684.8 NA 850.3 High Load Forecast 913.9 1,296.9 1,257.8 *topogy
These changes are consequence of better voltage profile in analyzed region, especially in areas directly influenced by the new elements. For example, new interconnection line Nis-Leskovac-Vranje-Skopje greatly improves voltage profile in southern part of Serbia and new interconnection lines Podgorica – V.Dejes – Kashar – Elbasan and Kosovo B – V.Dejes – Kashar – Elbasan greatly improve voltage profile in Albania. Higher voltages and reduction of load of some elements that are highly influenced by the new elements, reduce power losses mainly in Albania, Southern Serbia, and in the region as whole. Table 6.2.2 shows overview of area summaries for analyzed reference cases and Table 6.2.3 shows overview of high loaded elements in analyzed sensitivity cases. Import/export sensitivity scenarios Concerning the import/export case, the simulated regime means the following:
Import 750 MW from UCTE Import 500 MW from Turkey Export 500 MW to Greece Import 750 MW from Ukraine
Large imports from analyzed directions cause significant increase of power flows along Slovenian-Croatian, Ukrainian-Romanian and Bosnian-Montenegrin interfaces in 2010, but interconnection lines are not jeopardised since they are loaded far below their thermal ratings.

6.8
Power losses on network topology in 2010, compared to the situation of balanced SE Europe power system, are increased in the power systems of Bulgaria (7.9 %) and Montenegro (9 %). In other power systems these losses are decreased, with the most significant drop in Romania (-16 %) and Serbia and UNMIK (-10.1 %). Regional power losses are decreased (-7.1 %) when the situation includes additional power import. It can be concluded that for this exchange scenario, power flows and voltage profile are such that transmission network is better utilized, and as a consequence losses are smaller. By comparing the average hydrology situation in 2010 and balanced SE Europe power system to the average hydrology situation and 1500 MW of power import, it may be noticed that some critical contingencies in the Romanian power system disappear, especially those connected with Mintia substation, while some new contingencies appear in the power system of Bulgaria (lines around Maritsa East substation). This is due to different dispatching conditions of DEVA 1 power plant in Romania (disconnected in import/export scenario, dispatched with 850 MW in the base case) and power import through Turkish-Bulgarian interface that goes through Maritsa East 3 substation. The analyzed scenario which is characterized by large power import in 2015, but on the 2010 network topology, can not be supported from a transmission network viewpoint due to voltage problems. Their existence is the most obvious in the power system of Albania due to scarce reactive power sources. To mitigate such problems it is necessary to construct at least one new 400 kV interconnection line between Albania and UNMIK or Macedonia. Large imports from analyzed directions in 2015 cause significant increase of the power flows along the Slovenian-Croatian and Ukrainian-Romanian interfaces. However, the interconnection lines are not jeopardized since their loading levels fall far below their thermal ratings. Power losses, in comparison to the situation of balanced SE Europe power system, are increased only in the power system of Macedonia (5%). In other power systems power losses are decreased, the most significantly in the power systems of Romania (-26%) and Montenegro (-23%). Power losses are decreased (-16%) in the region when analyzing the additional power import. Certain reinforcements in the internal networks of Romania, Bulgaria, Albania and Serbia till 2015 are necessary shall analyzed generation pattern and 1500 MW of power import be made more secure. None of the identified congestions is located at the border lines. High load growth rate Pessimistic (high) load growth rate is more close to load forecast made by electric power utilities in analyzed region. In case of high load growth rate power flows through lines and transformers are greater. This cause greater level of losses, increased number of elements loaded over 80 % and overloaded elements also and greatly decreased level of system security (Table 6.2.3). In case of year 2015 and 2010 topology it is not feasible to realize this generation-load pattern due to network constraints in Albania, but in Serbia and Romania also. As it has been concluded in Chapter 5, in all investigated scenarios, some elements are highly loaded even in case of full topology. Most of the elements loaded over 80% are transformers in some substations and also there are some overloaded elements (Table 6.2.3).

6.9
Table 6.2.2: Overview of area summaries for analyzed sensitivity cases (in MW)
Year Case Topology Data type Albania B & H Bulgaria Croatia Macedonia Montenegro Romania Serbia Total (SE Europe)
Generation 896.7 2266.1 6900.4 1502.9 950.3 539.8 7939.9 7355.9 28351.9 Load 1287.3 1971.3 5977.3 3136.7 1198.2 669.2 6728.3 6873.1 27841.4 Losses 50.4 58.6 121.6 49.0 20.1 15.5 201.2 220.8 737.1
Reference case Average hydrology 2010
Interchange -441.0 236.2 787.0 -1682.8 -268.0 -147.0 930.4 248.4 -336.7 Generation 898.2 2398.3 6827.0 1705.2 965.5 542.1 6877.4 6591.7 26805.4 Load 1288.5 1965.0 5967.5 3143.3 1178.3 670.2 6733.1 6901.7 27847.6 Losses 49.7 54.3 131.2 44.9 20.1 16.9 169.1 198.6 684.8
Import/export Average hydrology 2010
Interchange -440.0 379.0 714.0 -1483.0 -233.0 -147.0 -104.8 -521.9 -1836.7 Generation 931.7 2202.8 7282.5 2254.6 991.1 542.3 7113.3 8103.8 29422.1 Load 1358.0 2004 6278.0 3295.0 1234.0 686.0 6859.4 7131.0 28845.4 Losses 57.7 57.8 146.5 55.4 18.1 19.2 310.6 248.6 913.9
2010
High load Average hydrology 2010
Interchange -484.0 141.1 858.0 -1095.9 -261.0 -163 -56.7 724.2 -337.3 Generation 1116.1 2316.6 7332.7 2316.3 1087.0 735.0 7712.8 8687.6 31304.1 Load 1531.0 2279.0 6483.0 3657.0 1407.0 671.0 7317.4 7263.0 30608.4 Losses 81.2 78.7 150.7 63.4 20.0 25.0 347.4 268.7 1035.1
2010
Interchange -496.0 -41.1 699.0 -1404.1 -340.0 39.0 47.9 1156.0 -339.3 Generation 1118.1 2317.2 7332.9 2317.0 1088.4 735.2 7708.6 8689.4 31306.8 Load 1541.0 2279.0 6483.0 3657.0 1407.0 676.0 7317.4 7279.0 30639.4 Losses 73.1 79.2 150.9 64.0 21.4 20.3 343.1 254.4 1006.4
Reference case Average hydrology
2015
Interchange -496.0 -41.0 699.0 -1404.0 -340.0 39.0 48.1 1156.0 -338.9 Generation * * * * * * * * * Load * * * * * * * * * Losses * * * * * * * * *
2010
Interchange * * * * * * * * * Generation 1027.5 2394.9 7582.2 2173.9 1076.3 731.9 7187.7 8029.8 30204.2 Load 1544.0 2293.8 6418.9 3660.1 1393.7 675.0 7831.2 7270.7 31087.4 Losses 71.5 70.1 142.7 58.8 22.5 15.6 253.9 215.1 850.3
Import/export Average hydrology
2015
Interchange -588.0 31.0 1006.0 -1545.0 -340.0 39.0 -972.0 530.0 -1839.0 Generation 896.1 2479.4 8157.8 2591.0 895.0 1324.6 7684.5 10024.2 34052.6 Load 1680.0 2274.0 7083.0 3959.0 1489.0 702.0 8269.8 7635.0 33091.8 Losses 99.0 92.2 175.8 79.8 23.0 35.6 454.5 337.0 1296.9
2010
Interchange -883.0 113.2 899.0 -1447.8 -617.0 587.0 -1039.8 2052.2 -336.2 Generation 897.7 2479.7 8157.4 2592.1 895.7 1322.6 7676.4 10023.9 34045.5 Load 1684.0 2272.0 7083.0 3959.0 1489.0 708.0 8269.8 7660.0 33124.8 Losses 96.7 94.7 175.4 81.1 23.7 27.6 446.7 311.9 1257.8
2015
High load Average hydrology
2015
Interchange -883.0 112.9 899.0 -1448.1 -617.0 587.0 -1040.1 2051.9 -337.4 * convergent load flow solution was not found

6.10
Table 6.2.3: Overview of high loaded elements in analyzed sensitivity cases year 2010 2015 regime average imp/exp high load average imp/exp high load
topology 2010 2015 2010* 2015 2010 2015
AREA ELEMENT RATINGMVA
LOADMVA % LOAD
MVA % LOADMVA % LOAD
MVA % LOADMVA % LOAD
MVA % LOADMVA % LOAD
MVA % LOADMVA %
Lines ALB HL 220kV AKASHA2-ARRAZH2 1 270 250 92.6 238 88 236 87.3 288 107 290 108 BUL HL 220 kV M.EAST-ST.ZAGORA 228.6 189 82.6 191 83.5
HL 220kV BRADU-TIRGOVI 1 302.6 247 81.6 285 94.3 284 93.8HL 220kV BUC.S-B-FUNDENI 1 320 266 83.1 309 96.7 308 96.1HL 220kV FILESTI-BARBOSI 1 277.4 248 89.5 246 88.6HL 220kV L.SARAT-FILESTI 1 277.4 241 86.9 239 86.2HL 220kV LOTRU-SIBIU 1 277.4 281 101 HL 220kV LOTRU-SIBIU 2 277.4 281 101 HL 220kV P.D.F.A-CETATE1 1 208.1 205 98.6 205 98.5 204 98.2 207 99.6 206 99.1HL 220kV P.D.F.A-RESITA 1 277.4 227 81.7 236 85.2 232 83.7 267 96.2 262 94.5HL 220kV P.D.F.A-RESITA 2 277.4 227 81.7 267 96.2 262 94.5HL 220kV P.D.F.II-CETATE1 1 277.4 236 85.2 232 83.7 271 97.7 270 97.3HL 220kV PAROSEN-BARU M 1 277.4 228 82 HL 220kV RESITA-TIMIS 1 277.4 230 82.8 225 81.1HL 220kV RESITA-TIMIS 2 277.4 230 82.8 225 81.1HL 220kV TG.JIU-PAROSEN 1 208.1 278 134 278 134 273 131 321 154 314 151 HL 220kV URECHESI-TG.JIU 1 277.4 278 100 278 100 273 98.3 320 116 314 113
ROM
HL 220 kV MINTIA-SIBIU 381.1 268 96.5 268 96.4 SRB HL 220kV JBGD3 21-JOBREN2 1 301 261 86.7 262 87 277 92.2 291 96.7 292 97
Transformers TR 220/110 kV ABURRE 1 60 49.1 81.8 49.5 82.5 52.2 87 TR 220/110 kV ABURRE 2 60 49.1 81.8 49.5 82.5 52.2 87 TR 220/110 kV ABURRE 3 60 49.1 81.8 49.5 82.5 52.2 87 TR 220/110 kV AELBS1 1 90 78 86.6 74.3 82.5 74 82.2 87.7 97.5 87.8 97.6TR 220/110 kV AELBS1 2 90 78 86.6 74.3 82.5 74 82.2 87.7 97.5 87.8 97.6TR 220/110 kV AELBS1 3 90 117 97.6 122 102 83.8 93.1 79.8 88.7 79.5 88.3 94.2 105 94.4 105 TR 220/110 kV AFIER 1 120 117 93.7 96 107 100 111 138 115 135 113 131 109 149 124 152 126 TR 220/110 kV AFIER 2 90 95.7 106 91.6 102 95.6 106 113 126 111 123 107 119 122 136 124 138 TR 220/110 kV AFIER 3 90 91.4 102 108 120 106 117 102 114 117 130 119 132 TR 220/110 kV AFIERZ 1 60 51.9 86.5 50.3 83.8 50.9 84.8 58 96.7 59.9 99.8TR 220/110 kV AFIERZ 2 60 51.9 86.5 50.3 83.8 50.9 84.8 58 96.7 59.9 99.8TR 220/110 kV AKASHA 1 100 84.1 84.1 82.1 82.1 82.9 82.9 93.4 93.4 94.7 94.7TR 220/110 kV AKASHA 2 100 84.1 84.1 82.1 82.1 82.9 82.9 93.4 93.4 94.7 94.7TR 220/110 kV ARRAZH 1 100 87.7 87.7 87.5 87.5TR 220/110 kV ARRAZH 2 100 87.7 87.7 87.5 87.5TR 220/110 kV ATIRAN 2 120 97.5 81.3 96.4 80.3
ALB
TR 220/110 kV ATIRAN 3 120 102 85.2 101 83.9TR 220/110 kV MO-4 3 150 124 83 BIH TR 400/110 kV UGLJEV 1 300 255 84.9 255 84.9 253 84.2 256 85.4 259 86.3 256 85.4
CRO TR 220/110 kV TESISA 1 200 179 89.4 179 89.7TR 220/110 kV BARBOS 1 200 174 86.9 167 83.6 167 83.3TR 220/110 kV FUNDE2 1 200 173 86.6 179 89.3 193 96.7 193 96.5 214 107 241 120 240 120 TR 220/110 kV FUNDEN 1 200 163 81.4 163 81.3 181 90.5 204 102 203 102 TR 220/110 kV TIMIS 1 200 172 85.9 170 85.2TR 400/110 kV BRASOV 1 250 203 81 232 92.6 230 92.1TR 400/110 kV CLUJ E 1 250 208 83.4 206 82.6TR 400/110 kV DIRSTE 1 250 221 88.4 220 87.8TR 400/220 kV BUC.S 1 400 378 94.6 377 94.1TR 400/220 kV BUC.S 2 400 378 94.6 377 94.1TR 400/220 kV IERNUT 1 400 320 80.1 408 102 405 101 TR 400/220 kV URECHE 1 400 344 86.1 395 98.9 391 97.7 487 122 480 120
ROM
TR 400/220 kV MINTIA 400 386 96.4 TR 220/110 kV JBGD3 1 200 167 83.4 167 83.3 169 84.7 175 87.5 175 87.4TR 220/110 kV JBGD3 2 150 126 83.7 126 83.9 127 84.5 137 91.4 138 91.7TR 220/110 kV JPRIS4 1 150 137 91.3 TR 220/110 kV JPRIS4 2 150 137 91.3 TR 220/110 kV JTKOSA 2 150 132 87.7 131 87.1 151 101 134 89 TR 220/110 kV JTKOSA 3 150 134 89.3 133 88.7 154 103 136 90.6TR 220/110 kV JZREN2 2 150 120 80.1 124 82.4 124 82.3 122 81 134 89.2 134 89.2TR 400/110 kV JJAGO4 A 300 246 81.9 TR 400/220 kV JBGD8 1 400 326 81.6 332 83 330 82.6TR 400/220 kV JTKOSB 1 400 412 103 352 88 TR 400/220 kV JTKOSB 2 400 326 81.4 430 108 368 91.9
SRB
TR 400/220 kV JTKOSB 3 400 326 81.4 430 108 368 91.9MNG TR 220/110 kV JTPLJE 1 125 102 82
*convergent load flow solution was not found

6.11
As it has been said above, in some substations there is not enough transformer capacity to supply demand from transmission network, since the load of these elements do not depend on generation pattern and level of system interchange, but only on load level in these substations, particularly in this case. This is problem of local supply. It should be pointed out that load patterns (in all reference and sensitivity cases) have the greatest influence to identified problems.
6.2.2 Overview on possible solutions for system relief Security aspects of network performance in analyzed scenarios are presented in this subchapter. It has to be said, that new generation facilities in UNMIK area, are too large to be investigated as they were. Over 3000 MW of new production were connected to only one substation, Kosovo B. It is almost certain, that installing such large capacities demands different and more detailed solution, as well as large changes in internal network of UNMIK area, in order to supply this energy to consumers. Also, large changes in internal network of Serbia are necessary too, since installing of these 3000 MW causes great changes in energy flows in region, and therefore different supply routes in internal network. That is why, more detailed analysis is necessary in order to draw conclusions that will give right indices about eventual congestions and necessary network reinforcements. One of possible solutions is building of 400 kV ring (Kosovo B – Pristina 4 – Kosovo C) that will connect new production facilities with existing substations Kosovo B and new substation 400 kV Pristina 4. The other is to connect the all new plants to existing 400 kV substation Kosovo B radial through new 400 kV lines (as it was analyzed in this study). This solution is better from network point of view, but from generation point of view is less reliable and secure. More thorough analyses is needed and only adequate feasibility studies can give the proper answer to the question about the level and type of network reinforcements, especially in the case of the new generation facilities proposed. Concerning internal network reinforcements, same conclusions can be made as in previous chapter. Additional conclusions concerning year 2010 are:
- level of power losses for import/export scenario are significantly lower as consequence of better utilization of the transmission network. It should be pointed out that this scenario is more close to recorded system behavior, since Greece is one of the major regional importers
- level of load of high loaded and overloaded elements is greater, especially in case of high load scenario;
- building of the 400 kV corridor Nis-Leskovac-Vranje-Skoplje before 2010 resolves has much greater significance.
Additional conclusions concerning year 2015 are:
- expected network topology in year 2015 is not sufficient in case of high load scenario; - operational methods in network of Romania can relieve some of identified problems,
but in case of high load scenario network reinforcement should be analyzed also; - new production units in UNMIK area require detailed analysis related to connection of
these units to power system network.
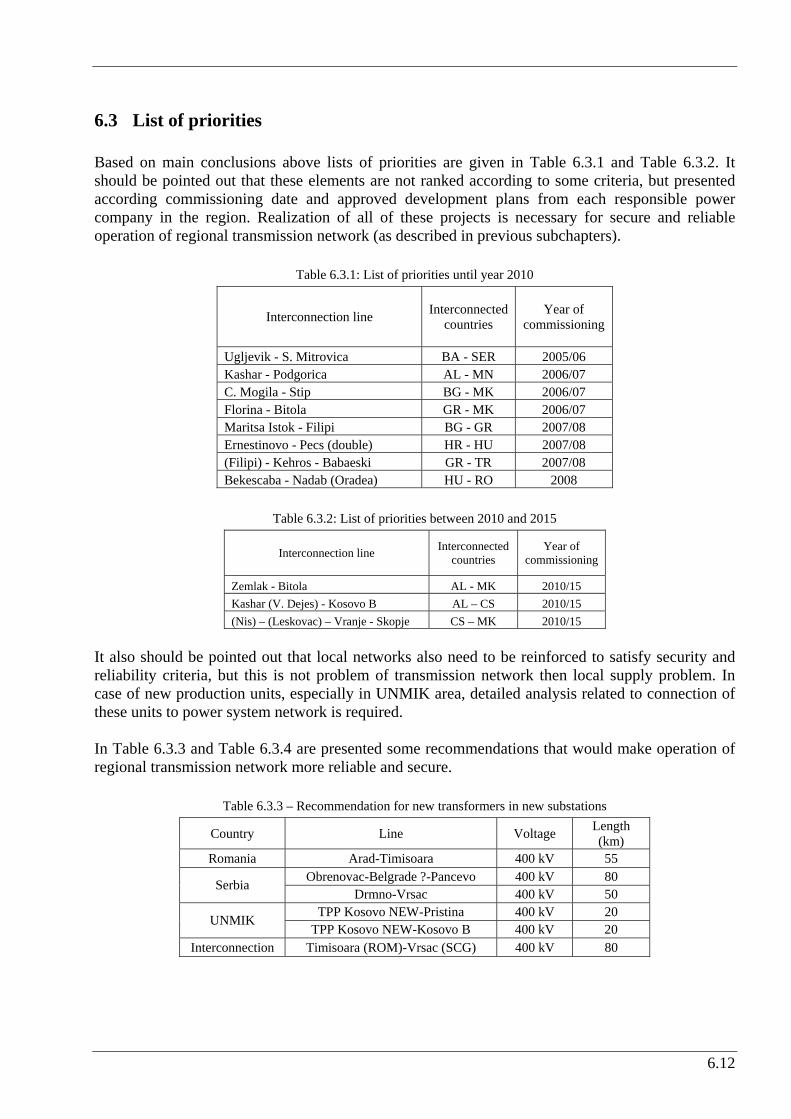
6.12
6.3 List of priorities Based on main conclusions above lists of priorities are given in Table 6.3.1 and Table 6.3.2. It should be pointed out that these elements are not ranked according to some criteria, but presented according commissioning date and approved development plans from each responsible power company in the region. Realization of all of these projects is necessary for secure and reliable operation of regional transmission network (as described in previous subchapters).
Table 6.3.1: List of priorities until year 2010
Interconnection line Interconnectedcountries
Year of commissioning
Ugljevik - S. Mitrovica BA - SER 2005/06 Kashar - Podgorica AL - MN 2006/07 C. Mogila - Stip BG - MK 2006/07 Florina - Bitola GR - MK 2006/07 Maritsa Istok - Filipi BG - GR 2007/08 Ernestinovo - Pecs (double) HR - HU 2007/08 (Filipi) - Kehros - Babaeski GR - TR 2007/08 Bekescaba - Nadab (Oradea) HU - RO 2008
Table 6.3.2: List of priorities between 2010 and 2015
Interconnection line Interconnectedcountries
Year of commissioning
Zemlak - Bitola AL - MK 2010/15 Kashar (V. Dejes) - Kosovo B AL – CS 2010/15 (Nis) – (Leskovac) – Vranje - Skopje CS – MK 2010/15
It also should be pointed out that local networks also need to be reinforced to satisfy security and reliability criteria, but this is not problem of transmission network then local supply problem. In case of new production units, especially in UNMIK area, detailed analysis related to connection of these units to power system network is required. In Table 6.3.3 and Table 6.3.4 are presented some recommendations that would make operation of regional transmission network more reliable and secure.
Table 6.3.3 – Recommendation for new transformers in new substations
Country Line Voltage Length (km)
Romania Arad-Timisoara 400 kV 55 Obrenovac-Belgrade ?-Pancevo 400 kV 80 Serbia
Drmno-Vrsac 400 kV 50 TPP Kosovo NEW-Pristina 400 kV 20 UNMIK
TPP Kosovo NEW-Kosovo B 400 kV 20 Interconnection Timisoara (ROM)-Vrsac (SCG) 400 kV 80

6.13
Table 6.3.4 – Recommendation for new transformers in new substations
Voltage New levels transformers Country Name of
substation kV/kV MVA
Romania Timisoara 400/110 2x300 Vrsac 400/110 2x300 Serbia
Beograd ? 400/110 2x300 UNMIK Pristina 400/110 2x300
It should be pointed out that these recommendations are not according to the long term development plans of power utilities in the region, but just ideas of authors that can resolve some of the identified problems in regional network. They should be taken into consideration in future studies and analyses. Without detailed analyses it is not possible to rank these recommendations.

7. LITERATURE
[1] Study, Development of the interconnection of the electric power systems of SECI member countries for better integration with European systems: Project of regional transmission network planning, Construction of the regional model, 2002, EKC,
[2] Study, Development of the interconnection of the electric power systems of SECI member countries for better integration with European systems: Project of regional transmission network planning, effects of the construction of new proposed interconnection lines in SECI countries, 2002, EKC, EIHP, NEK, ZEKC
[3] Project group on development of interconnection of electric power systems of Black sea region, Regional Transmission Planning Project Regional model construction for 2010. year, EKC
[4] Study, Audit of overcurrent protection relay settings on north-south transmission corridor, HTSO-Hellenic Transmission System Operator, EKC, 2004
[5] Report of UCTE Executive Team "North-South Re-Synchronization", Load-flow analyses, Technical committee UCTE, EKC, MVM, ZEKC, 2004
[6] Report of UCTE Executive Team "North-South Re-Synchronization", Load-flow analyses, Technical committee UCTE, EKC, MVM, ZEKC, 2004
[7] SECI project group on development of interconnection of electric power systems of SECI countries for better integration to the European system, Regional Transmission Planning Project, Regional model construction for 2005. year(updating and expanding existing Regional Transmission Network Model for the year 2005 ) and 2010. year, USAID, SECI
[8] Study, Technical and economical aspects of connection electric power systems between Serbia and Macedonia with new transmission line 400 kV Niš-(Leskovac-Vranje)-Skopje, Feasibility study, EPS-Serbia, EKC, 2003
[9] Study for new 400 kV interconnection lines between FYROM-Serbia and Albania-Montenegro, Transient Security Assessment, Total Transmission Capacities (TTC’s), European Commission, TREN Energy Directorate General, EKC, HTSO,EPS,ESM,KESH,EPCG, 2003
[10] The study of long-term development of 400 kV, 220 kV and 110 kV transmission networks in the area of the Republic of Serbia for the period until 2020, 1997, EINT
[11] Analysis of technical possibilities for the reconnection of the south-eastern with the western part of UCPTE Interconnection, Institute Nikola Tesla, Beograd, 1996
[12] Stability of the Synchronously Interconnected Operation of the Electricity Networks of UCTE/CENTREL, Bulgaria and Romania, Final Report 2000
[13] Research Project, Evaluation Of Transfer Capabilities In Balkan Interconnected Network, Technical Report, Joint Greek-Yugoslav Research,

General Secretariat for Research and Technology, Greece, EKC, HTSO-GREECE, NTUA-GREECE, 2004
[14] Study for new 400 kV interconnection lines between FYROM-Serbia and Albania-Montenegro Energy Directorate General, HSSO, EKC 2003
[15] Report of UCTE Executive Team "North-South Re-Synchronization": Load-flow analyses, Technical committee UCTE, MVM, ZEKC 2003
[16] Bosnia and Herzegovina and Republic of Macedonia Study on Gas and Electricity Interconnection in the Trans European Networks, 1997
[17] Feasibility Study, 400 kV Transmission line Elbasan-Podgorica, FICHTNER, July 2001
[18] Study, Upgrading of Transmission Lines 220 kV, ALSTOM 2001
[19] Feasibility Study, Rehabilitation of transmission network, DECON,BEA, EINT 2002
[20] Reconnection of the UCPTE Network and Parallel operation of the Bulgarian and Romanian networks with UCPTE - SUDEL ad hoc Group 1996
[21] Technical feasibility study of interconnection of the electric power systems of Bulgaria (NEK) and Romania (RENEL) with the interconnected power system of Greece (PPC), power systems under EKC coordination and Albania (KESH), for parallel and synchronous operation in compliance with UCPTE regulations and standards - PPC - RENEL - NEK - EKC - Nikola Tesla Institute 1995
[22] Technical feasibility study of upgrading at 400 kV of the existing 150 kV line Bitola - Amyndaio, PPC, NEK, EKC, 1998
[23] Technical feasibility study of a new interconnection tie-line at 400 kV between Greece and Bulgaria, PPC, NEK, EKC, 1998
[24] Technical feasibility study of Interconnection of the Balkan Countries (Albania, Bulgaria and Romania) to UCPTE - PHARE A 1994 and PHARE B 1996
[25] Project of the construction of 400 kV OHL Niš-Skopje, Elektroistok 2001
[26] 400 kV Interconnection Macedonia – Bulgaria, 400 kV Overhead Transmission Line and 400/110 kV Stip Substation, Environmental Impact Assessment (EIA)
[27] 400 kV Interconnection Macedonia – Bulgaria, 400 kV Overhead Transmission Line and 400/110 kV Stip Substation, Techno-Economical Aspects
[28] Elaboration “Perspectives of one part of 220 kV network, Phase I, EINT Beograd, 2003.
[29] Annual report of EKC for 1999, 2000, 2001, 2002 and 2003
[30] Annual report of the Electric Power Utility of Serbia, 2000, 2001, 2002, 2003
[31] Annual report of the Electric Power Utility of FYR of Macedonia, 2001, 2002, 2003,
[32] Annual report of the Transelectrica, 2001, 2002, 2003,
[33] Annual report of the NEK-Bulgaria, 2001, 2002, 2003,