Appendix A: Technical Analyses of General Aviation Airports - FAA
48
ASSET A1 Appendix A-1: Criteria Used to Categorize General Aviation Airports INTRODUCTION The 2,952 facilities (2,903 airports, 10 heliports, and 39 seaplane bases) largely serving general aviation in the Federal Aviation Administration’s (FAA) National Plan of Integrated Airport Systems (NPIAS) fulfill a broad range of aeronautical functions. These landing facilities, most of which are airports, are referred to in this report as general aviation airports. Congress, over time, has defined two classes of airports that serve mostly general aviation: those that also support limited commercial service and those that help relieve congestion at primary airports. A third definition “General Aviation Airports” was created in the FAA Modernization and Reform Act of 2012. These statutory definitions are shown in Table A-1. Table A-1: Statutory Definitions of General Aviation Airports Nonprimary commercial service airports (121) are publically owned airports with scheduled air carrier service and annual passenger boardings between 2,500 and 10,000. Reliever airports (268) are high activity general aviation airports that provide general aviation with alternatives to congested hubs (where their presence might cause additional delay). General aviation airports (2,563) are defined as public airports in a state that have at least 2,500 passenger boardings each year and is receiving scheduled passenger aircraft service. These definitions, however, are inadequate to properly describe the critical roles of these general aviation airports. For instance, some general aviation airports have significantly more operations than do some primary (more than 10,000 enplanements and scheduled service) commercial service airports, and although some general aviation airports do draw general aviation operations away from busy primary airports, many “reliever” airports primarily serve other aeronautical functions. The criteria for setting the categories for general aviation airports were refined throughout the process, incorporating the primary research that was conducted in creating the database for this work program and the results of extensive outreach. We also conducted tests for consistency to be sure that the criteria used did not disadvantage a particular type of airport or airports in a certain geographic area. The remainder of this appendix provides details on the creation of the four categories of general aviation airports.
Transcript of Appendix A: Technical Analyses of General Aviation Airports - FAA

ASSET A1
Appendix A-1: Criteria Used to Categorize General Aviation Airports
INTRODUCTION
The 2,952 facilities (2,903 airports, 10 heliports, and 39 seaplane bases) largely serving general
aviation in the Federal Aviation Administration’s (FAA) National Plan of Integrated Airport
Systems (NPIAS) fulfill a broad range of aeronautical functions. These landing facilities, most
of which are airports, are referred to in this report as general aviation airports. Congress, over
time, has defined two classes of airports that serve mostly general aviation: those that also
support limited commercial service and those that help relieve congestion at primary airports. A
third definition “General Aviation Airports” was created in the FAA Modernization and Reform
Act of 2012. These statutory definitions are shown in Table A-1.
Table A-1: Statutory Definitions of General Aviation Airports
Nonprimary commercial service airports (121) are publically owned airports with scheduled
air carrier service and annual passenger boardings between 2,500 and 10,000.
Reliever airports (268) are high activity general aviation airports that provide general aviation
with alternatives to congested hubs (where their presence might cause additional delay).
General aviation airports (2,563) are defined as public airports in a state that have at least
2,500 passenger boardings each year and is receiving scheduled passenger aircraft service.
These definitions, however, are inadequate to properly describe the critical roles of these general
aviation airports. For instance, some general aviation airports have significantly more operations
than do some primary (more than 10,000 enplanements and scheduled service) commercial
service airports, and although some general aviation airports do draw general aviation operations
away from busy primary airports, many “reliever” airports primarily serve other aeronautical
functions.
The criteria for setting the categories for general aviation airports were refined throughout the
process, incorporating the primary research that was conducted in creating the database for this
work program and the results of extensive outreach. We also conducted tests for consistency to
be sure that the criteria used did not disadvantage a particular type of airport or airports in a
certain geographic area. The remainder of this appendix provides details on the creation of the
four categories of general aviation airports.

A2 ASSET
THE ANALYSIS AND CRITERIA USED TO DEFINE THE SYSTEM
In cooperation with the greater aviation community, the FAA conducted a 19-month review of
2,952 landing facilities. An important objective was to develop a new way to define general
aviation airports, heliports, and seaplane bases using activity and other data in existing federal
databases. Furthermore, the analysis had to be repeatable every few years. Analysis based on
other local, statewide or site specific data will continue to be assessed as part of statewide system
planning, metropolitan system planning, and master planning for individual airports.
Coordination With Various Stakeholders
A significant effort was made to coordinate the study process and preliminary results with a
variety of stakeholders. The first aviation industry workshop was held on January 6-7, 2011, and
was sponsored by the Transportation Research Board (TRB). The TRB gathered together a
small group of individuals representing many different perspectives within the aviation industry.
As a result of the first workshop, the team began to consider how airports could be grouped
together. The FAA team developed written descriptions for potential new categories and began
identifying data related to each description. The data were tested to determine if they helped in
dividing airports into the new categories.
The challenge was determining what criteria could be used to describe these categories.
Furthermore, the data had to be easily accessible, reliable, and reproducible. This information
was discussed with other FAA organizations outside of the Office of Airports, as well as with
many of the stakeholders.
A second industry workshop was held on June 30, 2011. The proposed general aviation airport
categories, descriptions, and the criteria associated with them were unveiled. Many of the same
participants from the first workshop were at this second workshop along with organizations that
were unable to attend the first workshop. In addition, several Federal Agencies that provide
critical services that use airports were asked to participate. Three agencies were able to send
representatives: the U.S. Forest Service, U.S. Postal Service, and Essential Air Service.
Representatives from four other agencies were not able to attend: Federal Emergency
Management Agency, U.S. Customs and Border Protection, U.S. Department of Defense, and the
U.S. Marshals Service. These agencies did, however, provide valuable input.
Coordination with the study stakeholders continued throughout the study process through
teleconferences, webinars, and face-to-face meetings. The following is a partial list of industry
participants as well as others involved throughout the study:
Airlines for America
Aircraft Owners and Pilots Association
Airport Consultants Council
Airports Council International-North America
ASSET A3
Alliance for Aviation Across America
American Association of Airport Executives
Experimental Aircraft Association
General Aviation Airport Coalition
General Aviation Manufacturers Association
National Business Aviation Association
National Association of State Aviation Officials
National Air Transportation Association
Regional Airline Association
Alabama Department of Transportation
Missouri Department of Transportation
Oklahoma Aeronautics Commission
Wisconsin Department of Transportation
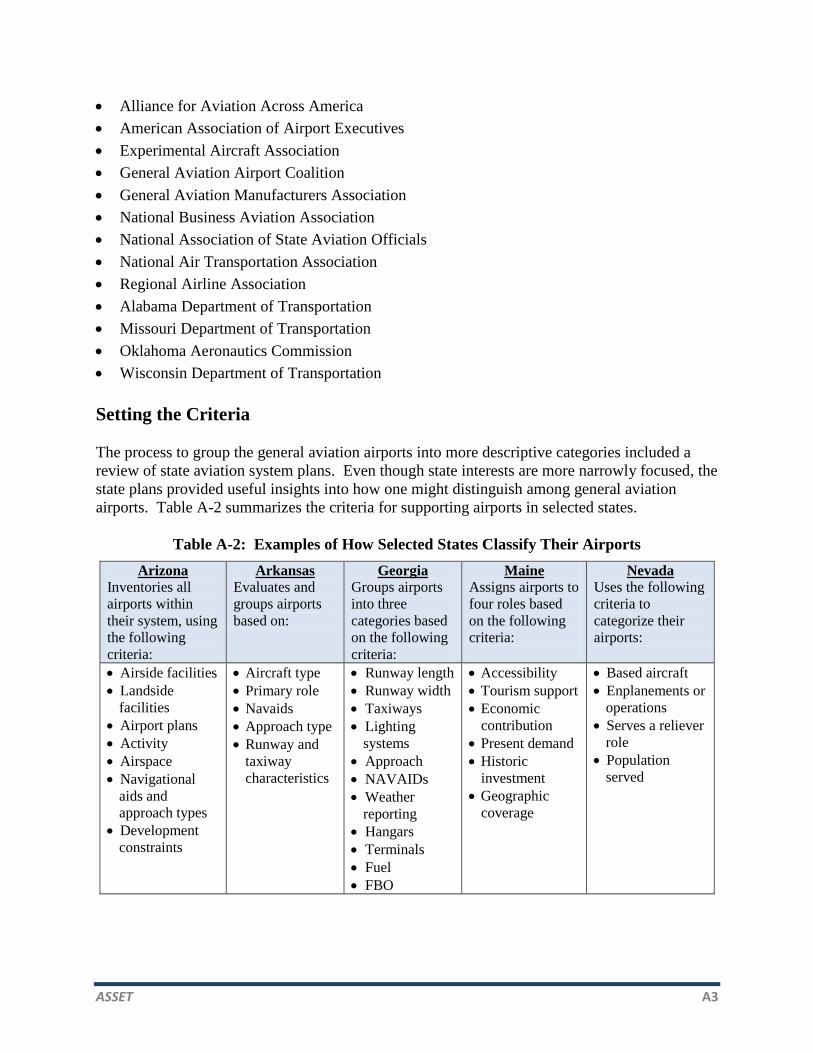
Setting the Criteria
The process to group the general aviation airports into more descriptive categories included a
review of state aviation system plans. Even though state interests are more narrowly focused, the
state plans provided useful insights into how one might distinguish among general aviation
airports. Table A-2 summarizes the criteria for supporting airports in selected states.
Table A-2: Examples of How Selected States Classify Their Airports
Arizona
Inventories all
airports within
their system, using
the following
criteria:
Arkansas
Evaluates and
groups airports
based on:
Georgia
Groups airports
into three
categories based
on the following
criteria:
Maine
Assigns airports to
four roles based
on the following
criteria:
Nevada
Uses the following
criteria to
categorize their
airports:
Airside facilities
Landside
facilities
Airport plans
Activity
Airspace
Navigational
aids and
approach types
Development
constraints
Aircraft type
Primary role
Navaids
Approach type
Runway and
taxiway
characteristics
Runway length
Runway width
Taxiways
Lighting
systems
Approach
NAVAIDs
Weather
reporting
Hangars
Terminals
Fuel
FBO
Accessibility
Tourism support
Economic
contribution
Present demand
Historic
investment
Geographic
coverage
Based aircraft
Enplanements or
operations
Serves a reliever
role
Population
served

A4 ASSET
Not surprisingly, the various states used different criteria to categorize their airports;
nevertheless, there were some similarities. The most common criteria used by the states were
runway length, runway approach, weather reporting, and lighting. Understandably, individual
states used different standards within each of these categories depending on the characteristics
unique to each state. For instance, airports located at higher elevations or in climates with high
temperatures typically required longer runway lengths. Similarly, airports located in areas prone
to low visibility required more precise runway approaches and better weather reporting and
lighting.
The FAA team found that the criteria were so diverse across the 50 states and four territories that
it was not possible to group the 2,952 general aviation airports using criteria based on state
aviation system plans. For instance, the length of runway is very important to the type and size
of aircraft using a specific airport, but it does not mean that there is a common minimum length
required to meet a specific aeronautical function. Moreover, other factors (such as the variability
of wind direction, climate, altitude, and surrounding terrain) affect runway length. Similarly, a
control tower is not necessarily needed for an airport to serve a specific aeronautical function.
The FAA team recognized that it was the level and types of activity, geographical indicators, and
other current uses as well as community services provided by Government agencies that
distinguished the airports. For example, runway length, approach, weather reporting, and
lighting are all related to the types and sophistication of the aircraft using the airport, and the
types and sophistication of aircraft that use an airport are related to aeronautical functions that an
airport supports. Several combinations of data elements were assessed, including levels of
activity, types of infrastructure, geographic location, and existing community services provided
by Government agencies and ownership. Tables A-3 through A-6 provide examples of the
criteria considered when establishing the new general aviation airport categories. The
description for each show whether the criterion was used to create the final categories.

ASSET A5
Table A-3: Types of Activity Indicators Considered in Grouping
General Aviation Airports
Activity Indicators Used in Final Categorization of General Aviation Airports.
IFR Flights
Yes, the number and type of aircraft operations is an important indicator
of an airport’s role. Flights operating under IFRs must file a flight plan
and include data such as the originating and terminating airport and type
of aircraft. There is no such requirement for aircraft operating under
visual flight rules (VFR). Therefore, the number of IFR operations not
only provides an estimate of activity, but is also indicative of the type
and sophistication of the aircraft using an airport.
Based Jets
Yes, the number of jets based at an airport provides important
information about an airport’s role and its economic connection to a
geographic area. Jets are generally used in connection with business
activity and are flown long distances. The number of based jets implies
a higher cost of travel and a greater need to use a particular airport
having appropriate infrastructure.
Based Aircraft Yes, based aircraft (including helicopters) is a measure of the size of the
airport and the activity it provides in support of a community or region.
Enplanements
Yes, the number of revenue passengers using an airport is an important
indicator of an airport’s role. Passengers buying tickets on a
commercial air carrier or chartering aircraft are choosing to use a
particular airport based on its location and commercial services offered.
Total Distance Flown
No, the total distance flown was calculated for IFR flights. However, the
total distance flown varied significantly based on the number of flights,
types of aircraft, and markets served. Three related criteria did
work: number of international flights, the number of interstate flights,
and the number of flights longer than 500 nautical miles.
IFR International
Flights
Yes, flights to international destinations are an important indicator of the
markets, or geographical area, served by a particular general aviation
airport, especially when combined with other criteria, such as the types
of based aircraft and the number of IFR flights.
IFR Interstate Flights Yes, interstate flights provide an important indicator of the market and
geographical area served by a particular general aviation airport.
IFR 500 Mile Radius
Flights
Yes, flights over 500 nautical miles from the originating airport
provided useful information about the geographical area served by a
general aviation airport.
Cargo Landed Weight
Yes, the tonnage of cargo handled is an important indicator of an
airport’s role. However, only a few general aviation airports recorded
landed cargo weight of any significance.

A6 ASSET
Table A-4: Airport Infrastructure Considered in Grouping General Aviation Airports
Airport
Infrastructure Used in Final Categorization of General Aviation Airports.
Jet Fuel
No, in most cases, but not always, the availability of jet fuel was related
to whether or not jet aircraft were based at an airport. Therefore, jet
aircraft based at a general aviation airport was seen as a more consistent
and better criterion.
Avgas
No, the availability of aviation gasoline was inconsistent throughout the
population of general aviation airports; therefore, it was not used to
categorize the airports.
Runway Length
No, although the length of a runway is very important to the type and
size of aircraft using a specific airport, it doesn’t mean that there is a
common minimum length required to meet a specific aeronautical
function. Therefore, this criterion was not used to categorize the
airports.
Instrument Approach
No, although instrument approaches are an important factor in accessing
an airport, the availability, need for, and precision of instrument
approaches varied considerably across the different general aviation
airports. The need for, and precision of, an instrument approach is more
directly related to local metrological conditions and frequency of use
rather than the aeronautical functions served by the airport. Therefore,
the level of IFR activity was seen as a more consistent criterion to help
categorize the general aviation airports than instrument approaches.
Airport Traffic
Control Tower
No, like runway length and instrument approaches, the availability of a
control tower is important and needed at some airports. However,
control towers are not required at most general aviation airports. The
need and justification for a control tower are related to the level of
activity and local airspace and safety concerns, not the aeronautical
function served by an airport. Therefore, the presence of a control tower
at an airport was not used to categorize the general aviation airports.

ASSET A7
Table A-5: Geographical Indicators Considered in Grouping General Aviation Airports
Geographical
Indicators Used in Final Categorization of General Aviation Airports.
Catchment Area
Income
No, a catchment area is defined by the population closest to an airport;
total income within that area is a function of the number of other NPIAS
airports nearby and may or may not reflect the kinds of aeronautical
activities taking place at an airport.
Catchment Area
Population
No, a catchment area is defined by the population closest to an airport;
total population within that area is a function of the number of other
NPIAS airports nearby and may or may not reflect the kinds of
aeronautical activities taking place at an airport.
Metropolitan or
Micropolitan
Statistical Area
Yes, the presence of an airport in a metropolitan area makes it more likely
that the airport supports business activity or is a reliever for a major
commercial airport.
Remote
Location/Access
Yes, some communities are not served by roads or have no year-round
transportation connection except by air. These airports typically serve
more remote areas and fulfill important societal needs, such as providing
access to aeromedical services and other communities.
Nearest NPIAS
Airport
Yes, when distances increase beyond 30 miles, it becomes more likely that
the airport will be used for access to a remote community
Table A-6: Ownership and Other Data Considered in Grouping
General Aviation Airports
Ownership and
Other Data Used in Final Categorization of General Aviation Airports.
Commercial
Service
Yes, because the availability of commercial service indicates a higher
level of demand and business activity. Also, current statutes require that
such airports be included in the NPIAS.
Part 139
Certification
No, because this certification is not typically required at general aviation
airports.
Public Interest
Supported by
Government
Agencies
Yes, many airports support the public interest by providing communities
with access to critical functions provided by Government agencies. For
example, fire fighting (U.S. Forest Service); law enforcement
(U.S. Marshals Service and U.S. Customs and Border Protection); freight
and mail service to remote areas (U.S. Postal Service); and scheduled air
service (Essential Air Service).
New or
Replacement
Airport
Yes, a new federally funded airport opened after January 1, 2001. Since
2000, aviation has dealt with the impacts of 9/11, record high fuel prices,
and a serious economic downturn. Airports that have opened during this
time may not have reached their projected activity levels.
Ownership
Yes, to be in the NPIAS and eligible for Federal funding, an airport must
be either a publically owned airport or a privately owned airport
designated as a reliever with 100 based aircraft.

A8 ASSET
The New Categories and the Final Criteria
Based on the analysis of the criteria and data shown in the figures above, four new general
aviation airport categories were developed: national, regional, local, and basic. Of the
2,952 general aviation airports studied, 2,455 were assigned to one of the four new categories.
We could not establish a clearly defined category for 497 airports. They have different types of
activity and characteristics and cannot readily be described. These 497 airports are currently not
classified and require further study.
The criteria used to create these new categories reflect the markets and aeronautical functions
served by the various general aviation airports in the NPIAS and currently eligible for Federal
funding. Figure A-1 shows the four new categories, provides a general description of each, and
lists examples of the aeronautical functions served by our nation’s general aviation airports. The
following pages provide a definition and the criteria for each new airport category developed.
Figure A-1: New General Aviation Airport Categories

ASSET A9
National Airports:
National airports support the national and state system by providing communities with access to
national and international markets. They accommodate a full range of aviation activity, including
large corporate jet and multi-engine aircraft operations, significant charter passenger services, or all-
cargo operations. They often work in conjunction with, and in support of, hub airports serving the
aviation needs of larger metropolitan areas. Some 84 general aviation airports meet the following
criteria and have been designated national airports:
1 The airport has at least 5,000 annual IFR operations, at least 11 based jets, at least 20 annual
international departures, or at least 1,000 annual interstate operations; or
2 The airport has at least 10,000 annual enplanements and at least one enplanement in the large air
carrier category; or
3 The airport has at least 500 million pounds of annual landed cargo weight.
Regional Airports:
Regional airports support regional economies by connecting communities to statewide and interstate
markets. These airports accommodate a full range of regional and local business activities, limited
scheduled passenger service, or cargo operations. They serve corporate jet and multi-engine aircraft,
as well as single-engine propeller aircraft. Some 467 general aviation airports meet the following
criteria and have been designated regional airports:
1 The airport is located in a metropolitan or micropolitan statistical area, has at least 10 annual
domestic IFR flights over 500 miles in radius, at least 1,000 annual IFR operations, at least one
based jet, or at least 100 based aircraft; or
2 The airport is located in a metropolitan or micropolitan statistical area, and the airport meets the
definition of commercial service.
Local Airports:
Local airports supplement communities by providing access to primarily intrastate and some interstate
markets. These airports accommodate small businesses, flight training, emergency service, charter
passenger service, cargo operations, and personal flying activities. They typically accommodate
smaller general aviation aircraft, mostly single-engine propeller and some multi-engine aircraft. Some
1,236 general aviation airports meet the following criteria and have been designated local airports:
1 The airport has at least 10 annual IFR operations and at least 15 based aircraft; or
2 The airport has at least 2,500 annual passenger enplanements.

A10 ASSET
Basic Airports:
Basic airports support general aviation activities such as emergency service, charter or critical
passenger service, cargo operations, flight training, and personal flying. These airports typically
accommodate mostly single-engine propeller aircraft. They may be located in, and provide service to,
remote areas of the United States with limited or no surface transportation options, and therefore may
be critical to the transportation of goods required for local day-to-day life. Some 668 general aviation
airports meet the following criteria and have been designated basic airports:
1 The airport has at least 10 based aircraft; or
2 Is a heliport with at least four based helicopters; or
3 The airport is a facility identified and used by either the U.S. Forest Service, U.S. Marshals
Service, U.S. Customs and Border Protection (designated, international, or landing rights),
U.S. Postal Service (air stops), or has Essential Air Service; or
4 The airport is a new or replacement airport activated after January 1, 2001; or
5 The airport is considered remote access (nearest NPIAS airport is at least 30 miles away) or is
identified in a state aviation system plan as remote access or equivalent; and
Must be publically owned or privately owned and designated as a reliever with a minimum of
90 based aircraft.
Data Sources
Data used to categorize the airports were obtained from the following sources:
MSA, U.S. Census Data: Source – American Community Survey Data; values generated
summer of 2011. The U.S. Census Bureau assigns the MSA designation of “metro” or “micro”
to counties in the United States if they find population clusters of more than 10,000. The
criterion includes both designations. The 2009 American Community Survey Data (U.S. Census
Bureau) was the source for the MSA designations. The airports’ MSA designations were
generated in the summer of 2011 using geographic information system software to find the
county for the airport and then pulling the county MSA designation, if it had one, for each
airport.
IFR Operations: Source – FAA’s Aircraft Situation Display to Industry (ASDI), 2009. The
study uses both arrival and departure IFR data from Calendar Year 2009 using data collated by
GCR and Associates, Inc., from the IFR flight plans in the ASDI data feed. Only flights that left
the ground are included in the counts. Flight plans that are cancelled after takeoff or never
closed are still counted as a departure.
Based Aircraft, Based Jets, Based Helicopters: Source – FAA’s National Flight Data Center
(NFDC) 5010 data, July 2010.
International Flights: Source – FAA’s/Enhanced Traffic Management System (ETMS) data
for Calendar Year 2009 (collated spring of 2011). The 2009 flight data that originated with the
FAA (ETMS) were analyzed by GRA, Incorporated1. An international flight occurs when either
the origin or destination is outside of the United States or its territories.
1 GRA, Incorporated provides strategic aviation advisory services and economic analysis.

ASSET A11
IFR Interstate Operations: Source – FAA’s Aircraft Situation Display to Industry (ASDI),
2009. This is a subset of the IFR operations discussed earlier and it includes both arrivals and
departures. A slight difference exists for this from the earlier IFR operations data in that a valid
arrival airport (“actual” arrival airport, not “planned” airport) is required to determine whether
the flight was out-of-state or not.
Enplanements and Enplanements by Large Air Carrier: Source – FAA’s System of Airports
Reporting (SOAR) for Calendar Year 2010. SOAR uses enplanement and cargo data extracted
from the Air Carrier Activity Information System, an FAA database that contains revenue
passenger boarding and all-cargo data.
Landed Cargo Weight: Source – FAA’s System of Airports Reporting (SOAR) for Calendar
Year 2010. These data come from SOAR’s list of airports that qualified for cargo entitlements in
Fiscal Year 2012 based on Calendar Year 2010 activity.
500-Mile Radius Domestic Flights: Source – FAA’s Aircraft Situation Display to Industry
(ASDI), 2009. The ASDI subsystem of the Traffic Flow Management System allows near real-
time air traffic data to be disseminated. This data is a subset of the IFR operations data. Both
departure and arrival data are included. Airport latitude and longitudes for all airports in the
NFDC data set in 2009 are used to calculate the distances between airports; therefore, only
flights between domestic airports are included in these data.
Commercial Service: Source – FAA’s System of Airports Reporting (SOAR) as of November
2011 based on Calendar Year 2010 passenger activity data.
Airports Used/Designated by U.S. Forest Service: Source – U.S. Forest Service – spring
2011.
Airports Used/Designated by U.S. Marshals Service: Source – U.S. Marshals Service – spring
2011.
Airports Used/Designated by U.S. Customs and Border Protection: Source – “Guide for
Private Flyers” – data classifies airports by designated, international, landing rights, or user fee.
The first three (designated, international, and landing rights) airports were used in this analysis.
Airports Served Under Essential Air Service: Source – U.S. Department of Transportation
(DOT) May 2011.
U.S. Postal Service (air stops): Source – U.S. Postal Service – spring 2011. An air stop is an
airport designated by the U.S. Post Office as a location where mail is delivered. It may only be a
runway and person that picks up that mail. There is no correlation between an air stop and the
location of a Post Office. These are mostly used for airports located in Alaska.
Remote Access: Collated fall of 2011. Includes the airports in Alaska’s State Aviation System
Plan role of “Off-Road” and selected airports from other states that also provide the only year-
round transportation access.

A12 ASSET
Nearest NPIAS Airport: Source – FAA/GCR2 October 2010. The statute mileages were
computed between all NPIAS airports, regardless of the service levels of either airport. Mileage
between airports is calculated using the NFDC’s airport reference point's latitude and longitude
for each airport.
How the Final Criteria Were Set for Each Category
The process used to establish which criteria to use was an iterative one. The FAA Team’s
objective was to create categories that reflect real differences among airports. This same
philosophy was applied to setting the levels for individual data elements.
For example, the criterion “based jets” was used to distinguish between National and Regional
airports. Why use “based jets” as a criterion for these two categories? Earlier in Table A-3, the
FAA Team argues that the presence of jets distinguished the types of commercial activity
supported by an airport, and also the types of infrastructure that may be required. Most based
jets are located at national or regional airports. Only 10 percent of the total fleet based at NPIAS
general aviation airports is at local, basic, or not classified airports. To be useful in
distinguishing national from regional airports, the average number of “based jets” in the national
category should be significantly higher than the number in the regional category. That threshold
was set at 11 based jets.
It would also be useful if the criterion distinguished a category from an adjacent category even if
that criterion was not used in the adjacent category. An example of this would be if the average
number of “based jets” was higher at regional airports than at local airports.
This approach was applied to the activity criteria used to create the categories. Some criteria that
had relatively sparse data (not many airports) were excluded, including cargo operations. We
also did not test the remote access or Federal service criteria, because these are minimum criteria
to be included in the four categories and either an airport qualified or it did not.
To conduct the test, the team calculated the average for each criterion for each category of
airport and also calculated the standard deviation for each criterion. So for example, in each
category, the FAA team calculated the average number of based aircraft and the standard
deviation of based aircraft within that category. The FAA team applied a standard t-test to
calculate the probability that the data for a criterion came from the same population when
comparing two categories. So, a very low probability means that the airports in one category are
different from those in another; i.e., for that criterion they came from different populations.
To visualize what this test does, consider Figure A-2, which is an illustration for data for a
criterion (e.g., Based Aircraft) for two airport categories. If the data for a criterion do not
overlap very much or not at all, then one can conclude that they are indeed different at least in
that dimension. The area in red illustrates a case where the overlap is very small and thus the
probability that the two categories came from the same population is small.
2 GCR Incorporated is an international professional services firm, partners with government and commercial clients
to deliver consulting services and technology solutions in aviation, disaster recovery, elections, nuclear power,
public safety, right-of-way, and urban planning.

ASSET A13
Figure A-2: Illustration for a Criterion (e.g., Based Aircraft) for Two Airport Categories
Table A-7 shows the activity measures that were used to separate one category from another.
Each criterion was tested separately using paired comparisons between categories. The FAA
Team found that the categories are different for all of the main activity criteria used to categorize
airports. Specifically, except for enplanements, the probability that airports in different
categories came from the same populations is less than 1 percent for the criteria shown in the
figure. For enplanements, the probabilities are still low, between 2 and 10 percent.
Table A-7: Summary of t-Tests Undertaken
Category Based
Jets
Based
Aircraft Enplanements
IFR
Flights
IFR Flights
>500 Miles
International
Flights
Interstate
Flights
National Less
than 1%
Less
than 1% 2%
Less
than 1%
Less than
1% Less than 1%
Less than
1%
Regional Less
than 1%
Less
than 1% 2%
Less
than 1%
Less than
1% Less than 1%
Less than
1%
Local Less
than 1%
Less
than 1% 10%
Less
than 1%
Less than
1% Less than 1%
Less than
1%
Basic Less
than 1%
A low probability means that the airports in one category are different from those in another; i.e., for
that criterion, they came from different populations of airports and therefore are a good criterion to
categorize the airports.
The results of these statistical tests allow us to conclude that the criteria were set appropriately;
i.e., that they make distinctions between airport categories that are statistically significant and
that the airports come from different populations.
The tests reported in Table A-7 are done one criterion at a time. When criteria are combined to
create the categories, the likelihood that airports in different categories come from different
populations increases. For example, among the criteria that distinguish national from regional
airports are “based jets” and IFR operations. Table A-7 shows that the likelihood that the two
categories came from the same population is less than 1 percent for each criterion separately.
Now, to illustrate why the categories are more likely to be from different populations when
considering more than one criterion at a time, suppose we assume that the two criteria are
independent of one another and that the probability that they came from same population is
1 percent for each criterion. Using this assumption, the joint probability that the two categories

A14 ASSET
came from the same population is 1% x 1% or 0.01%. Thus, by combining the criteria, the FAA
Team ensured that airports in each category really are different.3
Tests for Consistency
Another issue examined by the ASSET team related to the selective application of criteria across
categories. The same criteria were not used in each category. An airport was assigned to the
highest category (from national to not classified) for which it qualified. But, the Team wanted to
make sure that the application of the criteria was consistent and did not disadvantage one type of
airport from another.
The ASSET team therefore developed a statistical test reported later in Appendix A. The test
applied all of the criteria to each airport using a regression equation. The result was that each
airport was given an “estimated” category (from the regression), which was then compared to the
category assigned by the ASSET team using the criteria as described in key findings from the
New General Aviation Airport Categories, later in Appendix A-2. The ASSET team found that
the regression assigned the same category 97 percent of the time.
The ASSET team then looked at each of the “exceptions” – the airports where the regression
disagreed with the categories. The ASSET team reviewed the underlying data and made updates
in many cases. The data were retested and the ASSET team was able to conclude that each
airport was consistently allocated to a category. Furthermore, there was no apparent bias in the
allocation – that is, no group of airports seemed to be disadvantaged or advantaged by the final
criteria selected.
FINAL CATEGORIES
Appendix A also provides more details on the four new categories: national, regional, local, and
basic. There are relatively sharp distinctions in activity and the types of activity among the
categories. These distinctions will make it easier for the Federal Government, states, regions,
and other stakeholders to understand the future needs of these airports, while recognizing that the
mix of aeronautical functions at airports within categories varies.
Using the criteria described above, we were able to place 2,455 NPIAS locations in the four
clearly defined categories. We could not establish a clearly defined category for the remaining
497 NPIAS airports. These airports will need further review, and we will continue to work with
the aviation community to assess and potentially categorize these airports in the future.
3 The FAA recognizes that some criteria (e.g., based jets and IFR operations) may not be independent; still, tests of
the individual criteria suggest that adjacent categories came from different populations.

ASSET A15
Appendix A-2: Key Findings from New General Aviation
Airport Categories
The FAA’s new categories for general aviation airports make relatively sharp distinctions among
them, based primarily on activity measures. The following pages describe typical airports in
each category, including summary data and quick overviews of representative airports. The
current statutory designations (commercial service, reliever, general aviation) are reported by
new categories as well. Also reported are data on airport participation in the Airport
Improvement Program (AIP) and nonprimary entitlements (NPE).
The information on the characteristics that distinguish airports in different categories measures
the size and activity at airports. The data did not capture all of the rich detail of the many
aeronautical functions undertaken by airports in all of the categories.
Map of the General Aviation Airports in the Four Categories

A16 ASSET
ASSET A17
NATIONAL AIRPORTS
The 84 national airports are located in metropolitan areas near major business centers and
support flying throughout the nation and the world. National airports are currently located
within 31 states. They account for 13 percent of total flying at the studied general aviation
airports and 35 percent of all flights that filed flight plans at the airports in the four new
categories. These 84 airports support operations by the most sophisticated aircraft in the general
aviation fleet. The most prominent flying is by jet aircraft, including corporate and fractional
ownership operations, and air taxi services. These airports also provide pilots with an attractive
alternative to often busy primary commercial service airports. There are no heliport or seaplane
bases in this category.
A typical national airport has nonstop departures to foreign points, including flights to Asia,
Europe, or Central and South America.
All of the national airports supported air ambulance flights in 2009, meaning that at least one
departure was conducted to transfer a patient to another location.
66 airports are designated as reliever airports. Most, but not all of these airports divert
general aviation traffic away from major hub airports, preserving limited capacity for
commercial air traffic.
45 airports support critical community services provided by Government agencies (law
enforcement, U.S. Marshals Service, U.S. Postal Service, U.S. Customs and Border
Protection and/or U.S. Forest Services, and Essential Air Service).
None have scheduled commercial service, but 48 were used by large certificated air carriers
for charter flights.
Operators spend over $50 million per year flying at the average national airport, which
typically base over 200 aircraft and over 30 jets.
$1.2 billion of AIP funds was invested at national airports during the period 2001-2009.
Recognizing that not all airports received AIP funds every year, and therefore averages can
be imbalanced (or slanted), the $1.2 billion represents a simple annual average of $1,610,297
per airport, including $89,734 in NPE funds and $1,520,563 in discretionary funds.
Naturally, the size and nature of capital investments varied greatly among airports within the
category
Table A-8 provides an alignment of existing categories with the proposed national airports and
other notable characteristics:
None of the national airports are designated as commercial service (airports that enplane at
least 2,500, but fewer than 10,000, passengers)

A18 ASSET
Table A-8: Alignment of Existing Categories With National Airports
and Other Characteristics
Existing Category National Airports
Commercial Service Airport 0
Designated Reliever Airport 66
General Aviation Airport 18
Total 84
Other Characteristics (included in Total)
Seaplane Bases 0
Heliports 0
Federal Role EAS Airports 0
Federal Role U.S. Customs and Border Protection 42
Federal Role U.S. Forest Service 2
Federal Role U.S. Postal Service (air stops) 0
Federal Role U.S. Marshals Service 9
At Least One Federal Role 45
Table A-9 presents the criteria used to create all of the new general aviation categories and the
average value for each criterion for national airports. The colors represent alternative groups of
criteria that, when satisfied, qualify an airport to be in the national category. The yellow shaded
items represent a case where an airport needs to satisfy at least one of the criteria.
Criteria (light blue and yellow):
o 5,000 or more annual IFR operations (flights with a filed flight plan and usually under
active control by FAA air traffic controllers);
o 11 or more based jet aircraft at the airport; and
o 20 or more international IFR departures or at least 1,000 interstate IFR departures
Criteria (light green): At least 10,000 enplanements and at least one enplanement by a large
air carrier
Criteria (light orange): At least 500 million pounds of air cargo enplaned

ASSET A19
Table A-9: National Airports (84) Data for Criteria
Category Definitions National
Criteria Used
for National
Category
Average Annual IFR Departures Number of IFR departures reported in FAA ETMS data 19,165 5,000 or more
Average Based Jets Number of based jet aircraft reported in basedaircraft.com 41 11 or more
Average Annual Enplanements Revenue passengers that board a scheduled or unscheduled flight
at a landing facility (airport, heliport, seaplane base) 2,920
10,000 or
more
Number of Airports With Large Carrier
Enplanements
Revenue passengers that board a scheduled or unscheduled flight operated by a large certificated air carrier (defined in part 241 of
title 14 Code of Federal Regulations)
48 at least 1
Average Annual IFR Interstate Departures Number of IFR departures reported in FAA ETMS data 11,424 1,000 or more
Average Number of IFR International
Departures Number of IFR departures reported in FAA ETMS data 789 20 or more
Number of Airports With Cargo lbs. >500
Million/Year
Total annual landed weight in pounds of aircraft providing
scheduled or unscheduled cargo-only service at an airport 2 500M pounds
Average Based Aircraft Number of based aircraft reported in basedaircraft.com 274
Average Number of IFR Departures Over
500 Miles
Number of IFR departures reported in FAA ETMS flown over
500 miles 4,378
Number of Airports in Micro or Metro Areas
Number of airports in micro (core city) or metropolitan
(regional) statistical areas as identified by the U.S. Office of
Management and Budget
84
Commercial Service Airports that enplane more than 2,500 but less than 10,000
passengers 0
Number of Remote Airports Nearest NPIAS airport more than 30 miles or identified in state
plans as providing remote access 0
Number of Airports With Critical Community Services
Number of airports providing access to U.S. Forest Service,
U.S. Marshals Service, U.S. Customs and Border Protection,
U.S. Postal Service (air stop), or Essential Air Service
45
Number of Airports Activated After
1/1/2001 FAA records show airports opened after 1/1/2001 0
Number of Privately Owned Airports Number of airports held by private entities 0
Relievers Airports designated as relievers in the NPIAS 66
Number of Private Relievers With Less
Than 90 Based Aircraft
Airports designated as relievers in the NPIAS that are privately
owned and have fewer than 90 based aircraft 0
Number of Private Relievers With More
Than 90 Based Aircraft
Airports designated as relievers in the NPIAS that are privately
owned and have more than 90 based aircraft 0
Number of Private General Aviation Airports
A private airport in the NPIAS that is not primary, commercial service, or a reliever
0
Special Circumstance Airports With Prior
Agreements Airports entered into the NPIAS for special reasons 0
Most national airports qualified under the criteria of average based jets and average annual IFR
departures. The average national airport far exceeds the minimum requirement for each of these
criteria. Only a few airports qualify based on passenger enplanements, while Rickenbacker
International Airport in Ohio qualified based on the amount of air cargo enplaned.
Figure A-3 shows the location of the 84 national airports, which are concentrated in large urban
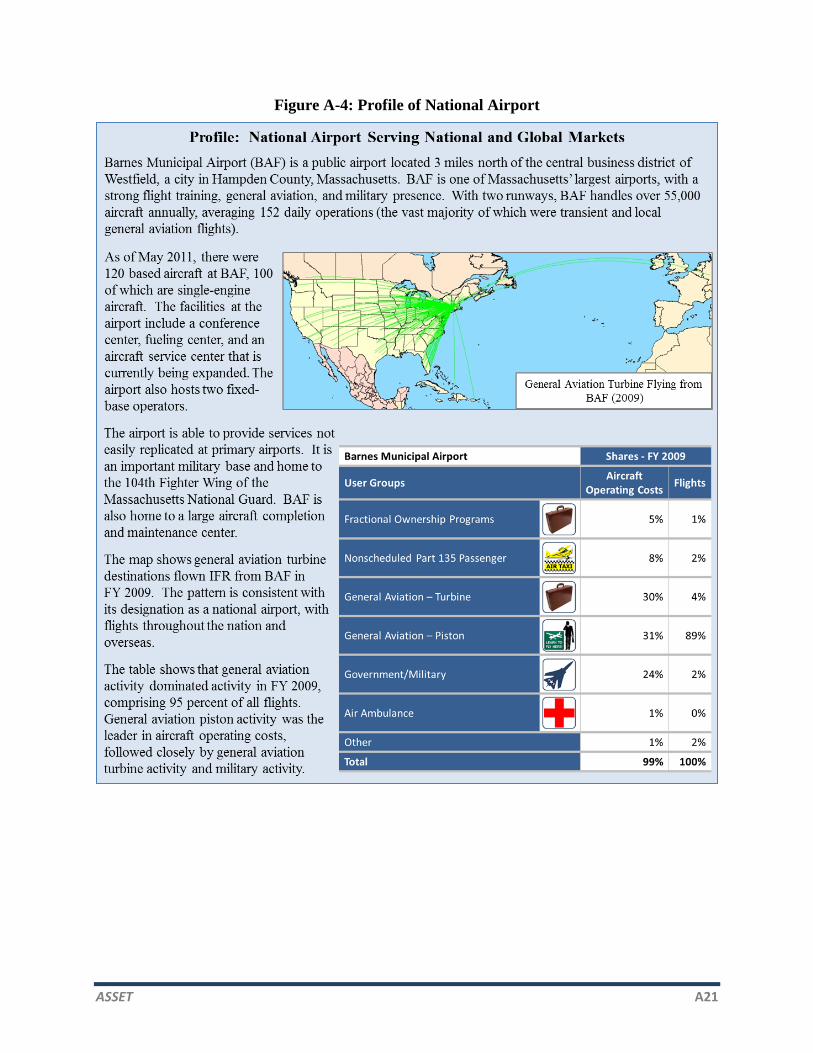
areas. Figure A-4 provides a summary of data describing, and profile of, one national
airport: Barnes Municipal Airport in Massachusetts.

A20 ASSET
Figure A-3: Location of National Airports
ASSET A21
Figure A-4: Profile of National Airport

A22 ASSET

ASSET A23
REGIONAL AIRPORTS
The 467 regional airports are located in metropolitan areas and serve relatively large populations.
These airports support interstate and some long distance (cross country) flying with more
sophisticated aircraft. Forty-nine states currently have regional airports with the exception of
Hawaii. They account for 37 percent of total flying at the studied general aviation airports and
42 percent of flying with flight plans. There is a substantial amount of charter (air taxi), jet
flying, and rotorcraft flights at regional airports. There are no heliport or seaplane bases in this
category.
459 regional airports supported air ambulance services in 2009.
108 fulfilled a critical community service provided by Government agencies (law
enforcement, U.S. Postal Service, U.S. Customs and Border Protection and/or U.S. Forest
Service, and Essential Air Service).
51 have limited scheduled air service that boarded more than 2,500, but less than 10,000,
passengers in 2010.
137 are designated as reliever airports.
90 were used by large certificated air carriers for charter flights.
56 receive scheduled air service through the Essential Air Service Program.
Operators spend over $10 million per year flying at the average regional airport.
The typical regional airport has more than 90 aircraft based at the airport with a few jets.
$2.4 billion of AIP funds was invested at the regional airports during the period 2001-2009.
Recognizing that not all airports received AIP funds every year, and therefore averages can
be imbalanced (or slanted), the $2.4 billion represents a simple annual average of $575,016
per airport, including $90,520 in NPE funds and $484,497 in discretionary funds. Naturally,
the size and nature of capital investments varied greatly among airports within the category
Table A-10 provides an alignment of existing categories with the proposed regional airports and
other notable characteristics:
The table also breaks out the Federal roles played by these airports; 56 are designated for
Essential Air Service; U.S. Customs and Border Protection operates at 43 at these airports;
the U.S. Forest Service designates 19 of these airports as fire fighting stations; there are no
U.S. Postal Service airports, and no airports are designated for operations by the
U.S. Marshals Service.

A24 ASSET
Table A-10: Alignment of Existing Categories With Regional Airports
and Other Characteristics
Existing Category Regional Airports
Commercial Service Airport 51
Designated Reliever Airport 137
General Aviation Airport 279
Total 467
Other Characteristics (Included in Total)
Seaplane Bases 0
Heliports 0
Federal Role Essential Air Service Airports 56
Federal Role U.S. Customs and Border Protection 43
Federal Role U.S. Forest Service 19
Federal Role U.S. Postal Service (air stops) 0
Federal Role U.S. Marshals Service 0
At Least One Federal Role 108
Table A-11 presents the criteria used to create all of the new general aviation categories and the
average value for each criterion for Regional airports. The colors represent alternative groups of
criteria that, when satisfied, qualify an airport to be in the Regional category. The yellow shaded
items represent a case where an airport needs to satisfy at least one of the criteria.
Criteria (light blue and yellow):
o Located in a micropolitan or MSA;
o 10 or more annual domestic IFR flights over 500 miles;
o 1,000 or more IFR departures; and
o One based jet or 100 or more based aircraft
Criteria (light green): Located in an MSA and designated as a commercial service airport
Most airports in the regional category qualified under average annual IFR departures, average
number of IFR departures over 500 miles, and number of airports in micro or metro (light blue).
Forty-five airports qualified because they are designated as Commercial Service and are located
in an MSA. There are 12 privately owned relievers with more than 90 based aircraft that also
qualify.

ASSET A25
Table A-11: Regional Airports (467) Data for Criteria
Category Definitions Regional
Criteria Used
for Regional
Category
Average Annual IFR Departures Number of IFR departures reported in FAA ETMS data 3,992 1,000 or
more
Average Based Jets Number of based jet aircraft reported in basedaircraft.com 3 one or more
Average Annual Enplanements Revenue passengers that board a scheduled or unscheduled flight
at a landing facility (airport, heliport, seaplane base) 1,006
Number of Airports With Large Carrier Enplanements
Revenue passengers that board a scheduled or unscheduled flight
operated by a large certificated air carrier (defined in part 241 of
title 14 Code of Federal Regulations)
90
Average Annual IFR Interstate Departures Number of IFR departures reported in FAA ETMS data 1,886
Average Number of IFR International Departures
Number of IFR departures reported in FAA ETMS data 39
Number of Airports With Cargo lbs. >500
Million/Year
Total annual landed weight in pounds of aircraft providing
scheduled or unscheduled cargo-only service at an airport 0
Average Based Aircraft Number of based aircraft reported in basedaircraft.com 105 100 or more
Average Number of IFR Departures Over 500 Miles
Number of IFR departures reported in FAA ETMS flown over 500 miles
465 10 or more Domestic
Number of Airports in Micro or Metro
Areas
Number of airports in micro (core city) or metropolitan
(regional) statistical areas as identified by the U.S. Office of Management and Budget
467 Micro or
Metro
Commercial Service Airports that enplane more than 2,500, but less than 10,000,
passengers 51 Yes
Number of Remote Airports Nearest NPIAS airport more than 30 miles or identified in state plans as providing remote access
3
Number of Airports With Critical
Community Services
Number of airports providing access to U.S. Forest Service, U.S. Marshals Service, U.S. Customs and Border Protection,
U.S. Postal Service (air stops), or Essential Air Service
108
Number of Airports Activated After 1/1/2001
FAA records show airports opened after 1/1/2001 1
Number of Privately Owned Airports Number of airports held by private entities 12
Relievers Airports designated as relievers in the NPIAS 137
Number of Private Relievers With Less
Than 90 Based Aircraft
Airports designated as relievers in the NPIAS that are privately
owned and have fewer than 90 based aircraft 0
Number of Private Relievers With More Than 90 Based Aircraft
Airports designated as relievers in the NPIAS that are privately owned and have more than 90 based aircraft
12
Number of Private General Aviation
Airports
A private airport in the NPIAS that is not primary, commercial
service, or a reliever 0
Special Circumstance Airports With Prior
Agreements Airports entered into the NPIAS for special reasons 0
Figure A-5 shows the locations of the 467 regional airports, all of which are located in MSAs.
Figure A-6 provides a profile and summary data describing one regional airport: Lebanon
Municipal Airport in western New Hampshire.

A26 ASSET
Figure A-5: Location of Regional Airports

ASSET A27
Figure A-6: Profile of Regional Airport

A28 ASSET

ASSET A29
LOCAL AIRPORTS
The 1,236 local airports are the backbone of our general aviation system with at least 1 local
airport in virtually every state. They are typically located near larger population centers, but not
necessarily in metropolitan or micropolitan areas. Local airports account for 42 percent of the
general aviation airports eligible for Federal funding, approximately 38 percent of the total flying
at the studied general aviation airports, and 17 percent of flying with flight plans; most of the
flying is by piston aircraft in support of business and personal needs. In addition, these airports
also typically accommodate flight training, emergency services, and charter passenger service.
The flying tends to be within a state or immediate region. There are no heliports, but there are
four seaplane bases in this category.
980 local airports supported air ambulance services.
121 of these airports have fulfilled a critical community service provided by Government
agencies (law enforcement, U.S. Postal Service, U.S. Customs and Border Protection and/or
U.S. Forest Service, U.S. Marshals Service, and Essential Air Service).
70 have scheduled air service that boarded more than 2,500, but less than 10,000, passengers
in 2010 with 68 in Alaska.
42 are designated as reliever airports.
30 were used by large certificated air carriers for charter flights.
The typical airport has 37 based aircraft.
Operators spend over $2.2 million per year flying at each of these airports.
$2.6 billion of AIP funds was invested at the local airports during the period 2001-2009.
Recognizing that not all airports received AIP funds every year, and therefore averages can
be imbalanced (or slanted), the $2.6 billion represents a simple annual average of $230,203
per airport, including $78,654 in NPE funds and $151,549 in discretionary funds. Naturally,
the size and nature of capital investments varied greatly among airports within the category.
Table A-12 provides an alignment of existing categories with the proposed local airports and
other notable characteristics:
The figure also breaks out the Federal roles played by these airports; 27 are designated for
Essential Air Service; U.S. Customs and Border Protection operates at 21 at these airports;
the U.S. Forest Service designates 36 of these airports as fire fighting stations; there are
44 U.S. Postal Service airports, and 2 airports are designated for operations by the
U.S. Marshals Service.

A30 ASSET
Table A-12: Alignment of Existing Categories With Local Airports
and Other Characteristics
Existing Category Local Airports
Commercial Service Airport 70
Designated Reliever Airport 42
General Aviation Airport 1,124
Total 1,236
Other Characteristics (included in Total)
Seaplane Bases 4
Heliports 0
Federal Role Essential Air Service Airports 27
Federal Role U.S. Customs and Border Protection 21
Federal Role U.S. Forest Service 36
Federal Role U.S. Postal Service (air stops) 44
Federal Role U.S. Marshals Service 2
At Least One Federal Role 121
Table A-13 presents the criteria used to create all of the new general aviation categories and the
average value for each criterion for Local airports. The colors represent alternative groups of
criteria that, when satisfied, qualify an airport to be in the Local category.
Criteria (light blue): 15 or more based aircraft and 10 or more IFR operations
Criteria (light green): 2,500 or more enplanements
Most airports in the Local category qualify under the light blue criteria. There are 64 airports
that qualify because they have 2,500 or more enplanements.

ASSET A31
Table A-13: Local Airports (1,236) Data for Criteria
Category Definitions Local
Criteria
Used
for Local
Category
Average Annual IFR Departures Number of IFR departures reported in FAA ETMS data 593 10 or more
Average Based Jets Number of based jet aircraft reported in basedaircraft.com 0
Average Annual Enplanements Revenue passengers that board a scheduled or unscheduled flight
at a landing facility (airport, heliport, seaplane base) 820
2,500 or
more
Number of Airports With Large Carrier
Enplanements
Revenue passengers that board a scheduled or unscheduled flight
operated by a large certificated air carrier (defined in part 241 of title 14 Code of Federal Regulations)
30
Average Annual IFR Interstate Departures Number of IFR departures reported in FAA ETMS data 268
Average Number of IFR International Departures
Number of IFR departures reported in FAA ETMS data 5
Number of Airports With Cargo lbs. >500
Million/Year
Total annual landed weight in pounds of aircraft providing
scheduled or unscheduled cargo-only service at an airport 0
Average Based Aircraft Number of based aircraft reported in basedaircraft.com 37 15 or more
Average Number of IFR Departures Over 500 Miles
Number of IFR departures reported in FAA ETMS flown over 500 miles
57
Number of Airports in Micro or Metro
Areas
Number of airports in micro (core city) or metropolitan (regional)
statistical areas as identified by the U.S. Office of Management and Budget
785
Commercial Service Airports that enplane more than 2,500, but less than 10,000, passengers
70
Number of Remote Airports Nearest NPIAS airport more than 30 miles or identified in state
plans as providing remote access 54
Number of Airports With Critical
Community services
Number of airports providing access to U.S. Forest Service, U.S. Marshals Service, U.S. Customs and Border Protection,
U.S. Postal Service (air stops), or Essential Air Service
121
Number of Airports Activated After
1/1/2001 FAA records show airports opened after 1/1/2001 12
Number of Privately Owned Airports Number of airports held by private entities 8
Relievers Airports designated as relievers in the NPIAS 42
Number of Private Relievers With Less Than 90 Based Aircraft
Airports designated as relievers in the NPIAS that are privately owned and have fewer than 90 based aircraft
0
Number of Private Relievers With More
Than 90 Based Aircraft
Airports designated as relievers in the NPIAS that are privately
owned and have more than 90 based aircraft 8
Number of Private General Aviation
Airports
A private airport in the NPIAS that is not primary, commercial
service, or a reliever 0
Special Circumstance Airports With Prior Agreements
Airports entered into NPIAS for special reasons 0
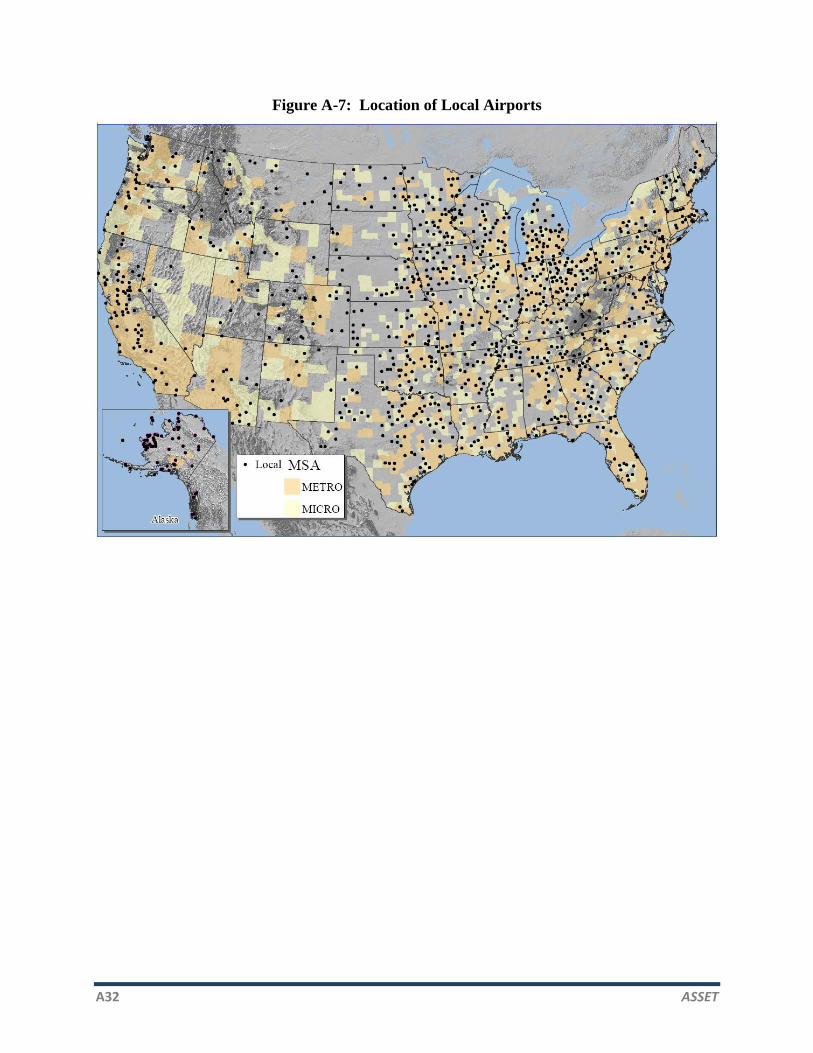
Figure A-7 shows the location of the 1,236 local airports. Although many of these airports are
located in MSAs, they are widely dispersed throughout the country. Figure A-8 provides a
summary of data about, and profile of, one Local airport: Neil Armstrong Airport in western
Ohio.
A32 ASSET
Figure A-7: Location of Local Airports

ASSET A33
Figure A-8: Profile of Local Airport

A34 ASSET

ASSET A35
BASIC AIRPORTS
The 668 basic airports are often able to fulfill their role with a single runway, helipads, or
seaplanes and limited infrastructure. Forty-three states have a basic airport. These airports fulfill
the principal role of a community airport: providing a means for private general aviation flying,
linking the community to the national airport system and making other unique contributions.
Basic airports account for approximately 7 percent of total flying at general aviation airports and
2 percent of flying with flight plans. Most of the flying is self-piloted, for business and personal
reasons, using propeller-driven aircraft. A fair amount of air charter (taxi) services is provided at
these airports. There are 3 heliports and 20 seaplane bases in this category.
269 basic airports supported air ambulance services in 2009.
107 airports provide access to remotely located populations.
119 support a critical community service provided by Government agencies (law
enforcement, the U.S. Postal Service, U.S. Customs and Border Protection and U.S. Forest
Service, U.S. Marshals Service, and Essential Air Service).
One is designated as a reliever airport.
19 were used by large certificated air carriers for charter flights.
The typical airport has 10 based aircraft.
Operators spend about $540,000 annually on flying at these airports.
$1.1 billion of AIP funds was invested at the basic airports during the period 2001-2009.
Recognizing that not all airports received AIP funds every year, and that simple averages can
present a skewed impression, the $1.1 billion represents a simple annual average of $182,384
per airport, including $68,039 in NPE funds and $114,345 in discretionary funds. Naturally,
the size and nature of capital investments varied greatly among airports within the category.
Table A-14 provides an alignment of existing categories with the proposed local airports and
other notable characteristics:
None of the basic airports are designated as commercial service (airports that enplane at least
2,500, but fewer than 10,000, passengers).

A36 ASSET
Table A-14: Alignment of Existing Categories With Basic Airports
and Other Characteristics
Category Basic Airports
Commercial Service Airport 0
Designated Reliever Airport 1
General Aviation Airport 667
Total 668
Other characteristics (Included in Total)
Seaplane Bases 20
Heliports 3
Federal Role Essential Air Service Airports 29
Federal Role U.S. Customs and Border Protection 18
Federal Role U.S. Forest Service 17
Federal Role U.S. Postal Service (air stops) 72
Federal Role U.S. Marshals Service 1
At Least One Federal Role 119
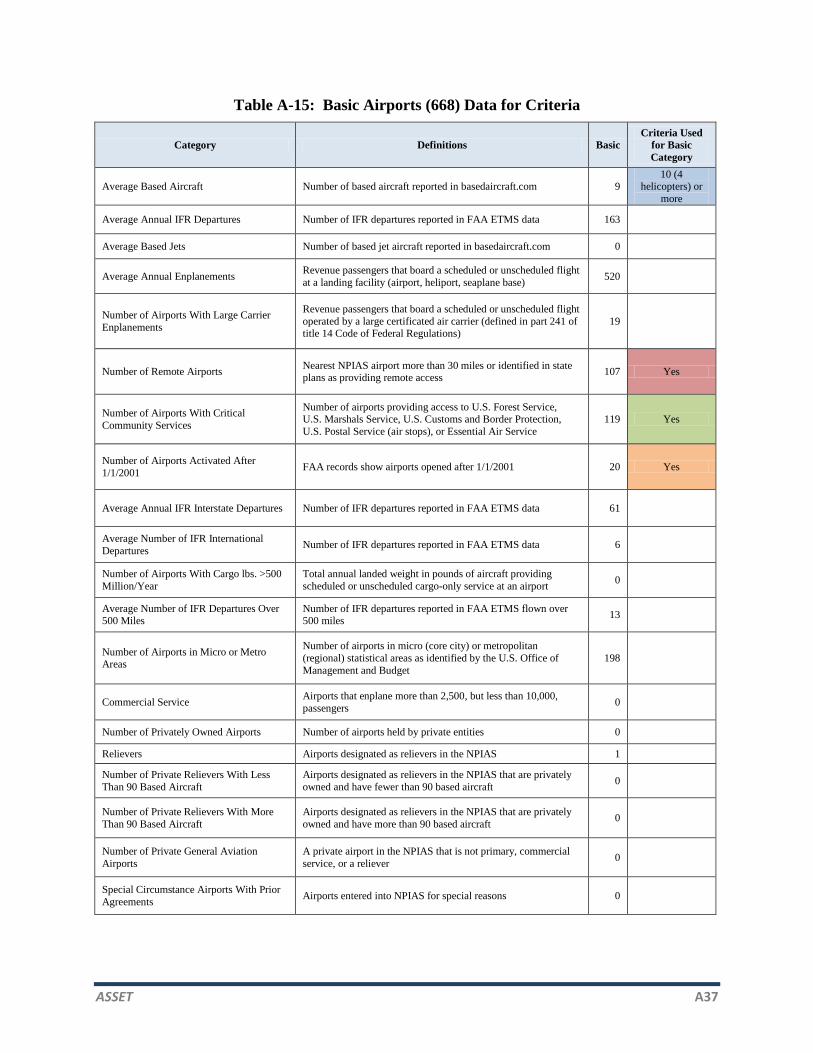
Table A-15 presents the criteria used to create all of the new general aviation categories and the
average value for each criterion for basic airports. The colors represent alternative groups of
criteria that, when satisfied, qualify an airport to be in the basic category.
Criteria (light blue): 10 or more based aircraft, or for heliports, 4 or more helicopters
Criteria (light green): Airports designated by a Federal agency as providing a Federal service
Criteria (light orange): An airport activated after January 1, 2001, which may still be
growing into its potential after the events of 9/11 and two very deep recessions
Criteria (light red): Airports providing remote access
The majority of airports qualify under the light blue criteria. Just over 100 qualify in each of the
light green or light red criteria; 20 airports qualify because of their recent activation.
ASSET A37
Table A-15: Basic Airports (668) Data for Criteria
Category Definitions Basic
Criteria Used
for Basic
Category
Average Based Aircraft Number of based aircraft reported in basedaircraft.com 9 10 (4
helicopters) or
more
Average Annual IFR Departures Number of IFR departures reported in FAA ETMS data 163
Average Based Jets Number of based jet aircraft reported in basedaircraft.com 0
Average Annual Enplanements Revenue passengers that board a scheduled or unscheduled flight
at a landing facility (airport, heliport, seaplane base) 520
Number of Airports With Large Carrier
Enplanements
Revenue passengers that board a scheduled or unscheduled flight
operated by a large certificated air carrier (defined in part 241 of title 14 Code of Federal Regulations)
19
Number of Remote Airports Nearest NPIAS airport more than 30 miles or identified in state plans as providing remote access
107 Yes
Number of Airports With Critical
Community Services
Number of airports providing access to U.S. Forest Service, U.S. Marshals Service, U.S. Customs and Border Protection,
U.S. Postal Service (air stops), or Essential Air Service
119 Yes
Number of Airports Activated After
1/1/2001 FAA records show airports opened after 1/1/2001 20 Yes
Average Annual IFR Interstate Departures Number of IFR departures reported in FAA ETMS data 61
Average Number of IFR International
Departures Number of IFR departures reported in FAA ETMS data 6
Number of Airports With Cargo lbs. >500
Million/Year
Total annual landed weight in pounds of aircraft providing
scheduled or unscheduled cargo-only service at an airport 0
Average Number of IFR Departures Over 500 Miles
Number of IFR departures reported in FAA ETMS flown over 500 miles
13
Number of Airports in Micro or Metro Areas
Number of airports in micro (core city) or metropolitan
(regional) statistical areas as identified by the U.S. Office of
Management and Budget
198
Commercial Service Airports that enplane more than 2,500, but less than 10,000,
passengers 0
Number of Privately Owned Airports Number of airports held by private entities 0
Relievers Airports designated as relievers in the NPIAS 1
Number of Private Relievers With Less
Than 90 Based Aircraft
Airports designated as relievers in the NPIAS that are privately
owned and have fewer than 90 based aircraft 0
Number of Private Relievers With More
Than 90 Based Aircraft
Airports designated as relievers in the NPIAS that are privately
owned and have more than 90 based aircraft 0
Number of Private General Aviation
Airports
A private airport in the NPIAS that is not primary, commercial
service, or a reliever 0
Special Circumstance Airports With Prior
Agreements Airports entered into NPIAS for special reasons 0

A38 ASSET
Figure A-9 shows the location of the 668 basic airports. Figures A-10 provides a summary of
data about and profiles of one basic airport: Taylor County Airport in central Wisconsin.
Figure A-9: Location of Basic Airports

ASSET A39
Figure A-10: Profile of Basic Airport
A40 ASSET
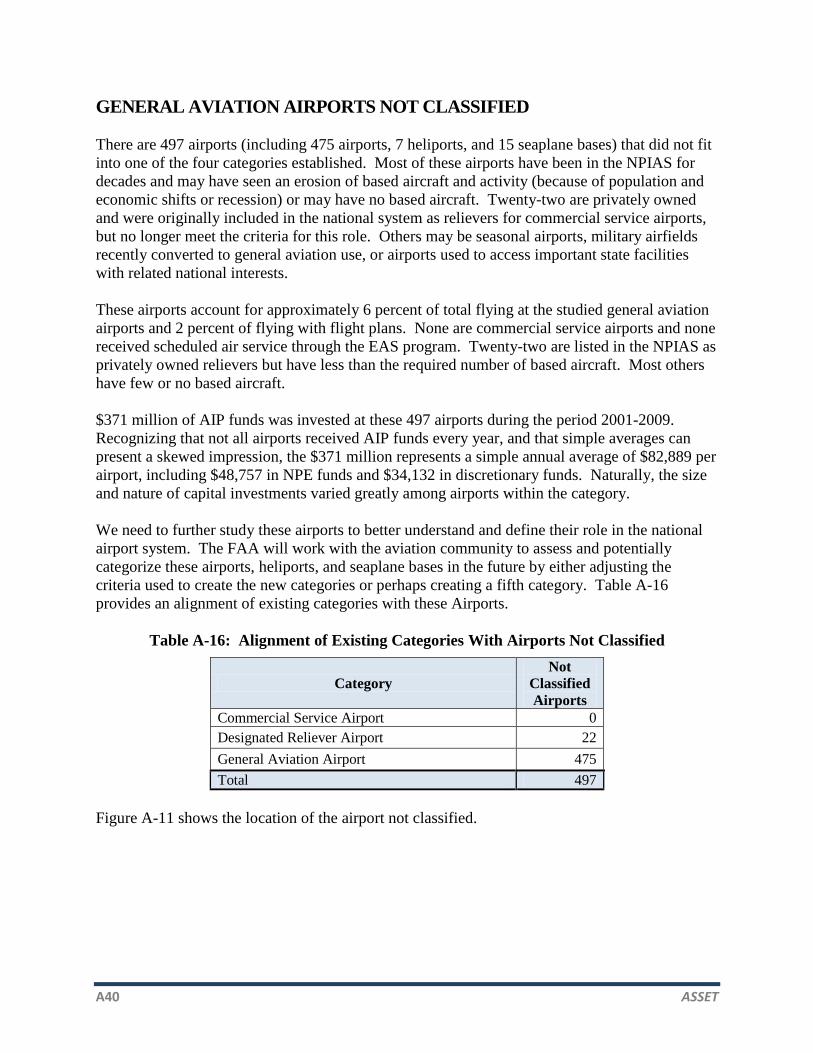
GENERAL AVIATION AIRPORTS NOT CLASSIFIED
There are 497 airports (including 475 airports, 7 heliports, and 15 seaplane bases) that did not fit
into one of the four categories established. Most of these airports have been in the NPIAS for
decades and may have seen an erosion of based aircraft and activity (because of population and
economic shifts or recession) or may have no based aircraft. Twenty-two are privately owned
and were originally included in the national system as relievers for commercial service airports,
but no longer meet the criteria for this role. Others may be seasonal airports, military airfields
recently converted to general aviation use, or airports used to access important state facilities
with related national interests.
These airports account for approximately 6 percent of total flying at the studied general aviation
airports and 2 percent of flying with flight plans. None are commercial service airports and none
received scheduled air service through the EAS program. Twenty-two are listed in the NPIAS as
privately owned relievers but have less than the required number of based aircraft. Most others
have few or no based aircraft.
$371 million of AIP funds was invested at these 497 airports during the period 2001-2009.
Recognizing that not all airports received AIP funds every year, and that simple averages can
present a skewed impression, the $371 million represents a simple annual average of $82,889 per
airport, including $48,757 in NPE funds and $34,132 in discretionary funds. Naturally, the size
and nature of capital investments varied greatly among airports within the category.
We need to further study these airports to better understand and define their role in the national
airport system. The FAA will work with the aviation community to assess and potentially
categorize these airports, heliports, and seaplane bases in the future by either adjusting the
criteria used to create the new categories or perhaps creating a fifth category. Table A-16
provides an alignment of existing categories with these Airports.
Table A-16: Alignment of Existing Categories With Airports Not Classified
Category
Not
Classified
Airports
Commercial Service Airport 0
Designated Reliever Airport 22
General Aviation Airport 475
Total 497
Figure A-11 shows the location of the airport not classified.

ASSET A41
Figure A-11: Location of Airports Not Classified
RELIEVER AND PRIVATELY OWNED AIRPORTS
In conducting the study, the FAA was also cognizant of the evolving role of relievers in the
national system and the role of selected privately owned airports that are part of the NPIAS. The
reliever concept was established in 1962 (1963 National Airport Plan) and stated that general
aviation reliever airports are a necessary part of the larger metropolitan area airport systems. In
the 1968 Amended National Airport Plan, a total of 147 general aviation airports were
designated as relievers for the air carrier airports serving the 22 large hub geographic areas. In
1992, DOT’s Office of the Inspector General examined the reliever program and, as a result, a
new reliever criterion was implemented in 2000. As part of the ASSET study, we examined the
reliever airports and how they function in the existing system. Many of the airports designated
as relievers serve their own function in the regional system that is unrelated to relieving
congestion. Therefore, we feel that the 50-year-old term, reliever, may no longer be relevant.
Currently, privately owned airports may be eligible to be included in the NPIAS if they are
designated by the FAA as a reliever. As part of this study, the FAA examined some of the issues
that privately owned airports have experienced. Those issues include how to ensure the long-
term viability and availability of the airport for the benefit of the community it serves, how the
airports are able to protect against encroachment of incompatible land uses or obstructions, and
steps the airports can take to foster a positive relationship with the community.

A42 ASSET
HOW NPIAS AIRPORTS WORK TOGETHER AS A SYSTEM
Figure A-12 is a map centered on Minneapolis-St. Paul International Wold-Chamberlain Airport
(MSP), the large hub airport in the Minneapolis St. Paul metropolitan region. The airports within
30 miles of the large hub are the NPIAS airports included in the Twin Cities Aviation System
Plan (2009). Not shown on the map, but included in the plan, are two seaplane bases that are not
in the NPIAS (Surfside and Wipline).
Figure A-12: Twin Cities Aviation Plan Airports in NPIAS
MSP is a large hub primary airport, meaning that it enplanes at least 1 percent of the total
passengers boarding commercial flights in the United States. All scheduled commercial
operations in the region operate from MSP. The region has a number of other airports that also
play important roles in the system:
National Airports: Anoka County-Blaine, Flying Cloud, and St. Paul Downtown Holman Field
airports have a strong corporate aviation base. All three airports are classified as national
airports using the new FAA categories for general aviation airports. Each primarily serves
business flying, with numerous jet operations and substantial IFR operations, both nationally and
internationally. St. Paul Downtown Holman Field has the largest component of corporate

ASSET A43
operations, which is reasonable given its proximity to the central business districts in each of the
Twin Cities. It is also the only airport with a runway longer than 5,000 feet, which is desirable
for heavier jet operations. All three national airports help to divert traffic from MSP and are
designated as relievers.
Regional and Local Airports: Airlake, Crystal, South St. Paul Municipal-Richard E. Fleming
Field, and Lake Elmo airports cater more to recreational and small business aviation needs. Each
airport provides valuable resources for the metropolitan community, encouraging growth in
commerce and jobs, providing green space and recreational opportunities, and boosting the area
economy. The first three in this group are classified as regional airports using the new FAA
categories, while Lake Elmo is a local airport. While these airports are designated as relievers
for MSP, this is not their primary role.
All of the airports in the Twin Cities plan are within a metropolitan statistical area. Anoka,
Flying Cloud, and St. Paul Downtown Holman Field all have enough based jet aircraft,
international departures, and interstate operations to qualify as national airports. Crystal, Air
Lake, and South St. Paul Municipal-Richard E. Fleming Field all have enough IFR flights, IFR
flights over 500 miles, and over 100 based aircraft to qualify as regional airports; none of these
airports has a based jet. Lake Elmo qualifies as a local airport, with more than enough IFR
flights and based aircraft; however, it does not have enough IFR flying to qualify as a regional
airport.
The new FAA categories reflect the roles of the seven general aviation airports in the Twin Cities
plan. Together these airports support the corporate, business, and recreational flying needs in the
metropolitan region, while providing general aviation capacity, some of which, in their absence,
would be provided at the region’s large hub airport.
Table A-17 provides the characteristics data of each individual airport discussed above and used
to categorize these airports into the new FAA categories.

A44 ASSET
Table A- 17: Twin City General Aviation Airports Data for Criteria
Category Definitions
Anoka
County-
Blaine Airport
(Janes
Field)
Flying Cloud
St. Paul
Downtown Holman
Field
Crystal Airlake
South St.
Paul Muni-
Richard
E Fleming
Field
Lake Elmo
New General Aviation Airport Category National National National Regional Regional Regional Local
Based Aircraft Number of based aircraft reported in
basedaircraft.com 386 370 86 207 137 237 196
Based Jets Number of based jet aircraft reported
in basedaircraft.com 13 17 35 0 0 0 0
Annual Enplanements
Revenue passengers that board a
scheduled or unscheduled flight at a landing facility (airport, heliport,
seaplane base)
87 245 150 6 6 6 0
Annual IFR
Departures
Number of IFR departures reported
in FAA ETMS data 12,503 15,847 21,470 2,576 1,459 1,536 846
Annual IFR
Interstate
Departures
Number of IFR departures reported in FAA ETMS data
8,457 9,179 15,229 1,193 812 904 458
Number of IFR
Departures
Over 500 Miles
Number of IFR departures reported
in FAA ETMS data 1,379 2,125 5,460 170 116 151 65
Number of IFR International
Departures
Number of IFR departures reported
in FAA ETMS data 66 127 471 18 3 20 1
Remote
Airport
Nearest NPIAS airport more than 30
miles or identified in state plans as providing remote access
No No No No No No No
Critical Community
Services
Number of airports providing access to U.S. Forest Service, U.S.
Marshals Service, U.S. Customs and
Border Protection, U.S. Postal
Service (air stops), or Essential Air
Service
No No
Yes: U.S.
Customs
and Border
Protection
No No No No
Relievers Airports designated as relievers in the NPIAS
Yes Yes Yes Yes Yes Yes Yes
Privately Owned
Number of airports held by private entities
No No No No No No No
Micro or Metropolitan
Areas
Number of airports in micro (core
city) or metropolitan (regional) statistical areas as identified by the
U.S. Office of Management and
Budget
Yes Yes Yes Yes Yes Yes Yes
Commercial
Service
Airports that enplane more than
2,500, but less than 10,000, passengers
No No No No No No No
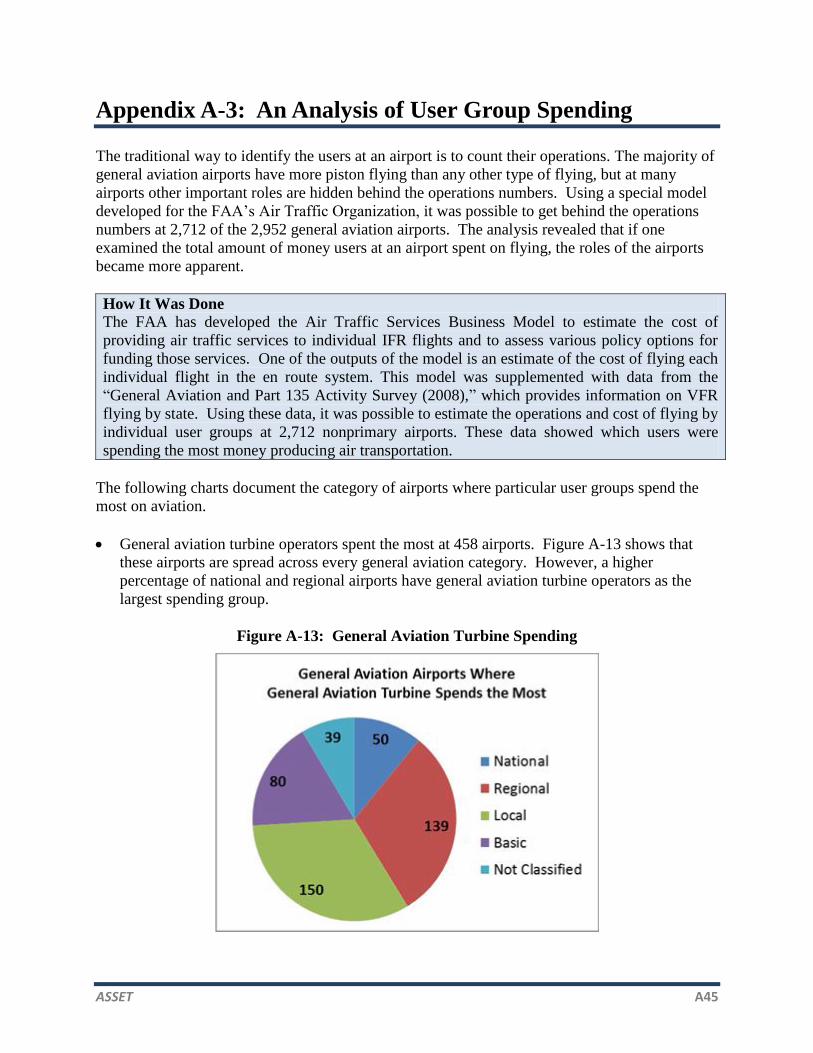
ASSET A45
Appendix A-3: An Analysis of User Group Spending
The traditional way to identify the users at an airport is to count their operations. The majority of
general aviation airports have more piston flying than any other type of flying, but at many
airports other important roles are hidden behind the operations numbers. Using a special model
developed for the FAA’s Air Traffic Organization, it was possible to get behind the operations
numbers at 2,712 of the 2,952 general aviation airports. The analysis revealed that if one
examined the total amount of money users at an airport spent on flying, the roles of the airports
became more apparent.
How It Was Done
The FAA has developed the Air Traffic Services Business Model to estimate the cost of
providing air traffic services to individual IFR flights and to assess various policy options for
funding those services. One of the outputs of the model is an estimate of the cost of flying each
individual flight in the en route system. This model was supplemented with data from the
“General Aviation and Part 135 Activity Survey (2008),” which provides information on VFR
flying by state. Using these data, it was possible to estimate the operations and cost of flying by
individual user groups at 2,712 nonprimary airports. These data showed which users were
spending the most money producing air transportation.
The following charts document the category of airports where particular user groups spend the
most on aviation.
General aviation turbine operators spent the most at 458 airports. Figure A-13 shows that
these airports are spread across every general aviation category. However, a higher
percentage of national and regional airports have general aviation turbine operators as the
largest spending group.
Figure A-13: General Aviation Turbine Spending
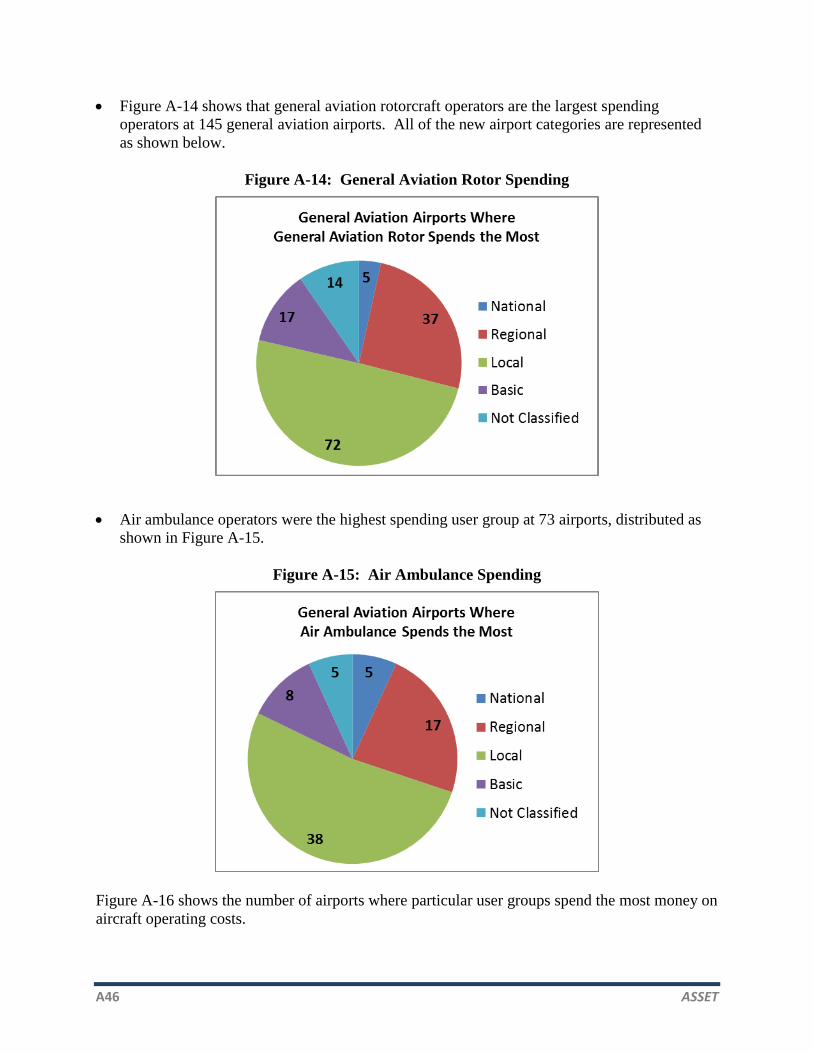
A46 ASSET
Figure A-14 shows that general aviation rotorcraft operators are the largest spending
operators at 145 general aviation airports. All of the new airport categories are represented
as shown below.
Figure A-14: General Aviation Rotor Spending
Air ambulance operators were the highest spending user group at 73 airports, distributed as
shown in Figure A-15.
Figure A-15: Air Ambulance Spending
Figure A-16 shows the number of airports where particular user groups spend the most money on
aircraft operating costs.

ASSET A47
Figure A-16: Largest User Group at General Aviation Airports:
Spending on Aviation Services
SOME OTHER INTERESTING FINDINGS
Estimating the amount of money aviation users paid to operate aircraft at each airport revealed
some other interesting findings:
Regardless of the size of a general aviation airport, an average of 6 to 13 percent
of user costs were paid by air ambulance services, supporting medical services
in the local community.
While turbine, fractional ownership programs, and part 135 charter operators
account for only a small share of operations at smaller airports, on average they
account for over 30 percent of spending on aviation services, usually supporting
local businesses in the community.

A48 ASSET
Appendix A-4: Regression Test for Consistency
In the ASSET report, category descriptions were created to reflect the different roles airports
play in their communities and in the national and international economies. A unique set of
criteria (from available data on airports) were used to assign airports to one of the categories.
The application of the criteria was an iterative process, to ensure that an airport’s assigned
category (national, regional, local, basic plus not classified, or 1 through 5) fit the description of
that category.
To complete the process, a statistical model was created to apply the criteria to each airport and
replicate the assigned category. There were two reasons for this final step:
Consistency: The statistical model applies all of the criteria to each airport and provides
weights (the coefficients of the regression equation) for each criterion. Applying the weights
to the criteria for each airport produces an estimated category, which can then be compared
to the assigned category. Any differences were investigated, and where it appeared that the
estimated category more closely corresponded to the role of the airport in its community or
the economy, the assigned category was changed.
Bias: The regression can be used to see if any particular type of airport was unfairly treated.
The model is a linear regression of the form:
Estimated Category = Intercept –ai x Criteriai + e,
Explaination of linear regression equation: where the intercept is category 5, every airport starts
out as not classified and moves toward a category 1 (national airport) as you subtract the product
of the weight (coefficients) times the criteria for that airport.
For example, an airport with over 5,000 IFR flights would subtract .75 from the intercept and
thus move closer to category 1. The ei term is the error in the regression equation and is used to
test its accuracy.
When we apply the statistical model to the population of airports (including privately owned
airports) and then take account of certain overriding factors that are not part of the model, we
find that it replicates the assigned categories for all airports in about 97 percent of the cases. The
remaining cases were examined individually for possible reallocation. The result was the final
assignment of airports to categories.
The analysis produced an exception report, showing the 87 airports (out of 2,952) that the model
misclassified. Each of these airports was reviewed individually before a final classification was
completed. The data were updated and classifications were retested. In some cases, all airports
appear to be in the correct categories and no airports seemed to experience bias.