Appendix 1 Regional Economic Prospects - World...
24
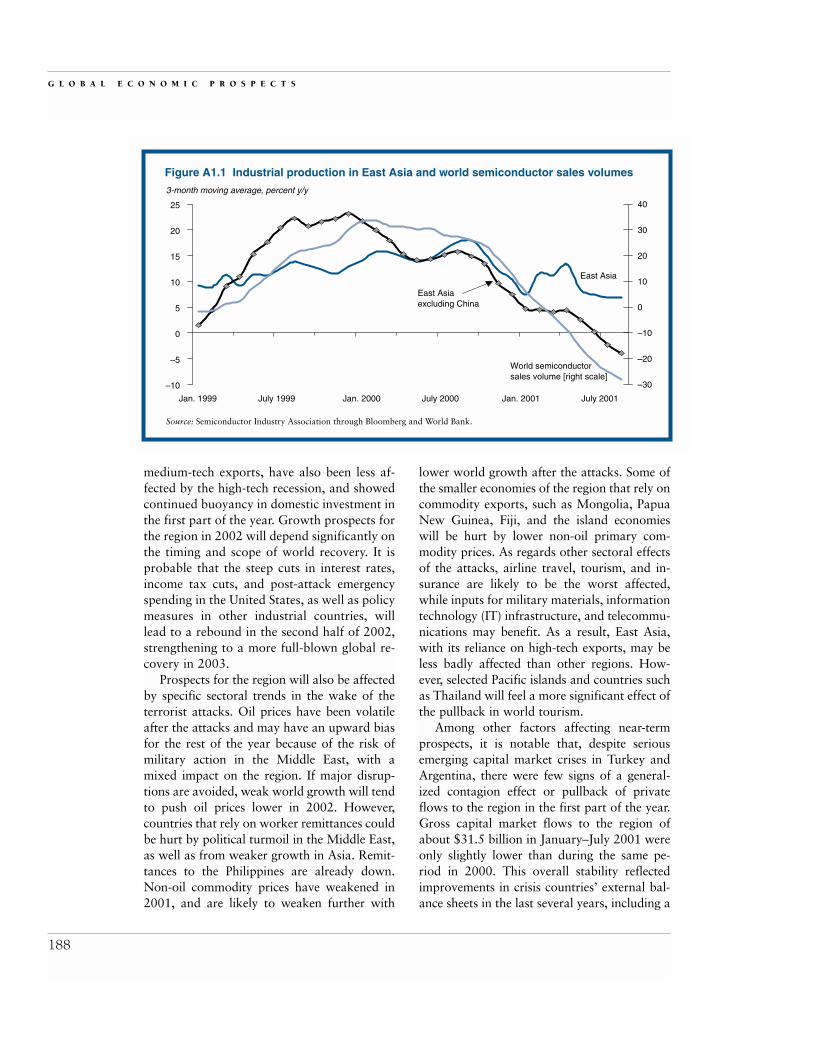
East Asia and Pacific Region Recent developments T HE YEAR 2001 WAS SHAPING UP AS A DIF- ficult year for East Asia and Pacific (EAP) even before the September 11 ter- rorist attacks on the United States. The unex- pectedly sharp cyclical downturn in the world economy during the year had centered on a recession in the global high-technology (high- tech) sector, resulting in a plunge in the exports of the many East Asian economies that have be- come important suppliers of components and finished products for world high-tech markets. East Asian exports were also especially hurt by the fact that the slowdown in global demand has been steepest in the region’s largest external markets, the United States and Japan, which to- gether buy almost 40 percent of regional ex- ports. By July or August economies with a high reliance on high-tech, such as the Republic of Korea, Malaysia, the Philippines, Singapore, and Taiwan (China), were seeing U.S. dollar ex- port declines of around 20–25 percent on year earlier levels. There was, nevertheless, some comfort in the fact that, apart from the Phil- ippines, the main impact of the high-tech re- cession was falling on high income or upper- middle-income countries with low poverty. In the wake of the terrorist attacks, the re- gion’s export downturn is likely to become broader based, as falling consumer confidence in the United States and around the world dampens demand for the region’s consumer and services exports. Overall, the global eco- nomic impacts of the terrorist attacks are likely to have pushed back the prospects for a recovery in world trade and in East Asian ex- ports by six to nine months. Near-term outlook Growth in the developing East Asia region is expected to fall to 4.6 percent in 2001 from 7.5 percent in 2000, and to recover only mildly to around 5 percent in 2002. These would be the region’s second weakest years for growth since 1990, bar only the near-zero- growth year of financial crisis, 1998. Most of the slowdown in growth is concentrated in the “Crisis 5” countries (that is, the five countries that were most affected by the financial crisis of 1997–98—Indonesia, Korea, Malaysia, the Philippines, and Thailand). Aggregate growth in this group is expected to slow to only 2–3 percent in 2001 from around 7 percent in 2000. Growth in 2001 will still reach around 7 percent in China, which contains two-thirds of the region’s poor (at the $2 a day poverty line). With a more diversified export basket than some other countries in the region, China’s export growth, while slowing sharply to an average 2 percent pace in June–August 2001, has at least avoided the huge 20–35 per- cent declines seen elsewhere. Growth has also been bolstered by a robust fiscal stimulus pack- age to offset the export slowdown. Other transition countries, such as Cam- bodia and Vietnam, which rely on low- or 187 Appendix 1 Regional Economic Prospects
Transcript of Appendix 1 Regional Economic Prospects - World...

East Asia and Pacific Region
Recent developments
THE YEAR 2001 WAS SHAPING UP AS A DIF-ficult year for East Asia and Pacific(EAP) even before the September 11 ter-
rorist attacks on the United States. The unex-pectedly sharp cyclical downturn in the worldeconomy during the year had centered on arecession in the global high-technology (high-tech) sector, resulting in a plunge in the exportsof the many East Asian economies that have be-come important suppliers of components andfinished products for world high-tech markets.East Asian exports were also especially hurt bythe fact that the slowdown in global demandhas been steepest in the region’s largest externalmarkets, the United States and Japan, which to-gether buy almost 40 percent of regional ex-ports. By July or August economies with a highreliance on high-tech, such as the Republic ofKorea, Malaysia, the Philippines, Singapore,and Taiwan (China), were seeing U.S. dollar ex-port declines of around 20–25 percent on yearearlier levels. There was, nevertheless, somecomfort in the fact that, apart from the Phil-ippines, the main impact of the high-tech re-cession was falling on high income or upper-middle-income countries with low poverty.
In the wake of the terrorist attacks, the re-gion’s export downturn is likely to becomebroader based, as falling consumer confidencein the United States and around the worlddampens demand for the region’s consumer
and services exports. Overall, the global eco-nomic impacts of the terrorist attacks arelikely to have pushed back the prospects for arecovery in world trade and in East Asian ex-ports by six to nine months.
Near-term outlook Growth in the developing East Asia region isexpected to fall to 4.6 percent in 2001 from7.5 percent in 2000, and to recover onlymildly to around 5 percent in 2002. Thesewould be the region’s second weakest yearsfor growth since 1990, bar only the near-zero-growth year of financial crisis, 1998. Most ofthe slowdown in growth is concentrated in the“Crisis 5” countries (that is, the five countriesthat were most affected by the financial crisisof 1997–98—Indonesia, Korea, Malaysia, thePhilippines, and Thailand). Aggregate growthin this group is expected to slow to only 2–3percent in 2001 from around 7 percent in2000. Growth in 2001 will still reach around7 percent in China, which contains two-thirdsof the region’s poor (at the $2 a day povertyline). With a more diversified export basketthan some other countries in the region,China’s export growth, while slowing sharplyto an average 2 percent pace in June–August2001, has at least avoided the huge 20–35 per-cent declines seen elsewhere. Growth has alsobeen bolstered by a robust fiscal stimulus pack-age to offset the export slowdown.
Other transition countries, such as Cam-bodia and Vietnam, which rely on low- or
187
Appendix 1Regional Economic Prospects
medium-tech exports, have also been less af-fected by the high-tech recession, and showedcontinued buoyancy in domestic investment inthe first part of the year. Growth prospects forthe region in 2002 will depend significantly onthe timing and scope of world recovery. It isprobable that the steep cuts in interest rates,income tax cuts, and post-attack emergencyspending in the United States, as well as policymeasures in other industrial countries, willlead to a rebound in the second half of 2002,strengthening to a more full-blown global re-covery in 2003.
Prospects for the region will also be affectedby specific sectoral trends in the wake of theterrorist attacks. Oil prices have been volatileafter the attacks and may have an upward biasfor the rest of the year because of the risk ofmilitary action in the Middle East, with amixed impact on the region. If major disrup-tions are avoided, weak world growth will tendto push oil prices lower in 2002. However,countries that rely on worker remittances couldbe hurt by political turmoil in the Middle East,as well as from weaker growth in Asia. Remit-tances to the Philippines are already down.Non-oil commodity prices have weakened in2001, and are likely to weaken further with
lower world growth after the attacks. Some ofthe smaller economies of the region that rely oncommodity exports, such as Mongolia, PapuaNew Guinea, Fiji, and the island economieswill be hurt by lower non-oil primary com-modity prices. As regards other sectoral effectsof the attacks, airline travel, tourism, and in-surance are likely to be the worst affected,while inputs for military materials, informationtechnology (IT) infrastructure, and telecommu-nications may benefit. As a result, East Asia,with its reliance on high-tech exports, may beless badly affected than other regions. How-ever, selected Pacific islands and countries suchas Thailand will feel a more significant effect ofthe pullback in world tourism.
Among other factors affecting near-termprospects, it is notable that, despite seriousemerging capital market crises in Turkey andArgentina, there were few signs of a general-ized contagion effect or pullback of privateflows to the region in the first part of the year.Gross capital market flows to the region ofabout $31.5 billion in January–July 2001 wereonly slightly lower than during the same pe-riod in 2000. This overall stability reflectedimprovements in crisis countries’ external bal-ance sheets in the last several years, including a
G L O B A L E C O N O M I C P R O S P E C T S
188
Figure A1.1 Industrial production in East Asia and world semiconductor sales volumes
Source: Semiconductor Industry Association through Bloomberg and World Bank.
3-month moving average, percent y/y
–10
Jan. 1999 July 1999 Jan. 2000 July 2000 Jan. 2001
East Asia
East Asiaexcluding China
World semiconductorsales volume [right scale]
July 2001
–5
0
5
10
15
20
25
–30
–20
–10
0
10
20
30
40

buildup of foreign reserves and reductions inshort-term debt. Exchange rates, while volatile,were not much different in early Septemberfrom the start of the year, while the majority ofequity markets had actually risen modestlyover this period. Capital market stresses wereconcentrated on the Philippines and Indonesia,reflecting political uncertainties earlier in theyear, as well as concerns about high publicdebt. After the Sept. 11 attacks, secondary mar-ket spreads for Indonesia and the Philippineswidened. Equity prices fell sharply in mostcountries in the region. To some extent, the re-gion will share in a more widespread investorpullback from emerging markets. Corporate re-structuring and privatization efforts may behampered by reduced foreign investor interest.
Among near-term policy responses to theslowdown, a number of countries have in-creased fiscal expenditures somewhat to helpsmooth the impact of the export shock, includ-ing China, Korea, Malaysia, and Thailand.Such expenditures can be especially helpfulwhen carefully targeted to address social pro-tection, infrastructure, or other particular sec-toral needs that may be warranted in a sharplyslowing economy. However, concerns aboutrelatively high or growing public debt—espe-cially when measured inclusive of contingent
liabilities—mean that in most countries higherspending can only be sustainable for a limitedtime. Indeed, very high public debt levels willessentially preclude greater fiscal stimulus inIndonesia and the Philippines. Given these con-straints, a temporary increase in spending—where possible—is best seen as a means of ad-dressing specific social or sectoral objectives,and as a complementary policy that allowscountries to continue to make progress on dif-ficult structural policies such as corporate re-structuring, even in the current weak economicclimate.
The impact of this year’s slowdown onpoverty will be mitigated by the fact that thesteepest declines in growth are in the high-income, newly industrialized economies (NIEs—including Hong Kong (China), Singapore, andTaiwan (China) and in the richer Crisis-5 coun-tries, which have relatively low poverty rates.Still, with less growth, this year’s downturn inEast Asia will stall the pace at which incomepoverty in the region falls, while the risk of a risein poverty has also increased. According to cal-culations by the Bank’s East Asia and Pacific Re-gion, the proportion of people living below the$2-a-day line may edge down from an estimated47 percent in 2000 to a forecast 46 percent in2001. Given continued robust growth in China
R E G I O N A L E C O N O M I C P R O S P E C T S
189
Table A1.1 East Asia and Pacific forecast summary(percent per year)
Baseline forecast
Growth rates/ratios 1991–2000 1999 2000 2001 2002 2003 2004–2010
Real GDP growth 7.2 7.0 7.5 4.6 4.9 6.8 6.2Consumption per capita 5.4 6.0 6.8 5.5 5.7 5.9 6.0GDP per capita 6.0 5.9 6.4 3.6 4.0 5.9 5.4
Population 1.2 1.1 1.0 0.9 0.9 0.9 0.8Inflationa 5.4 0.0 3.4 7.1 6.7 5.3 3.7Gross Domestic Investment/GDPb 34.1 29.0 30.0 30.4 30.7 30.7 33.7Central Gvt Budget Balance/GDP –1.0 –2.5 –2.2 –2.0 –2.4 –2.3 –3.1Export Volumec 13.0 7.7 23.7 0.4 6.2 11.3 7.3Current Account/GDP 0.5 4.3 3.3 1.4 0.0 0.5 –0.8Memorandum ItemsGDP growth: EAP excl. China 5.3 6.9 7.1 2.3 3.4 5.4 5.0
a. Local currency GDP deflator; median.b. Investment ratio measure in real terms.c. Goods and non-factor services.
Source: World Bank baseline forecast, October, 2001.
and other transition countries, which containthe large majority of the region’s poor, the mainsource of slower region-wide poverty reductionin 2001 is likely to be the sharp slowdown ingrowth in Indonesia, the Philippines, and Thai-land, which contain most of the rest of the re-gion’s poor.
In a longer-term perspective, it is notablethat the pace of poverty reduction in the re-gion has slowed dramatically, something that,persisting over time, cannot help but have deepsocial, political, and policy implications. Be-tween 1990 and 1996 the regional povertyrate at $2-a-day fell from 67 to 49 percent, butfrom 1996 to 2000 it fell only 2 percentagepoints more. The less numerically significantreason is the financial crisis and slow recoveryin Indonesia, the Philippines, and Thailand.The other is slower income growth in China’srural areas—where most of China’s poorlive—even as urban income growth has gonefrom strength to strength. Thus the drama ofEast Asian poverty reduction will largely de-pend on how countries address disparities inrural-urban and intra-regional growth, as wellas the structural and institutional improve-ments needed to bolster growth overall.
Long-term prospectsDespite these near-term weaknesses, the long-term prospects for East Asia remain broadlypositive. Average annual growth rates couldexceed 6 percent in the 2004–10 period. Mostof the countries in the region are committed tostrengthening the underlying determinants ofstrong and sustained growth—improvementsin education, enhancing the rule of law, pro-moting high domestic savings (including pru-dential fiscal policies), and openness to tradeand investment. As demonstrated over the lastthree decades, the region’s economies havebeen able to scale the technology ladder andsignificantly close the production and incomegap compared to the most industrialized na-tions. China’s entry into the World Trade Or-ganization (WTO) is a particularly notableevent that has positive trade and productivityimplications for the whole region.
The region is not without its vulnerabili-ties, as evidenced by the financial crisis of thelate 1990s and the economic slowdown thatstarted at the end of 2000. The financial crisisrevealed in stark terms the deficiencies of theregion’s banking and financial institutions,and the lack of sufficient regulatory oversightto compensate for those deficiencies. In the af-termath of the crisis, many of the countries inthe region have undertaken a significant over-haul of both the financial and the regulatoryinstitutions, but the legacy of the crisis persistsin many of the countries. Economic recoveryand current account surpluses have providedsome breathing room, but as the current slow-down indicates, the region’s authorities needto pursue financial reform, in particular toboost financial intermediation to ensure thatthe most productive investments get funded.
RisksA key issue for policymakers in the region is toposition their countries in order to be able totake full advantage of the global recoverywhen it arrives. Medium-term structural re-forms that strengthen the fundamental under-pinnings of development are likely to have amore significant impact on growth andpoverty reduction than possible short-termgains from fiscal stimulus. At the same time,this year’s largely unexpected global downturnhas shown the weakness in the strategy of sim-ply trying to “grow out” of the problems leftover from the financial crisis of 1997–98. In-deed, in the wake of the September 11 attacks,higher uncertainty and risk may become amore prevalent feature of international affairsfor some time. Structural reforms should thenalso help make the region’s economies morerobust in riding through a more uncertain andvolatile external environment. Among struc-tural issues facing the region, the importanceof renewed attention to corporate and finan-cial restructuring; trade reform; and institu-tional and governance reforms are worth par-ticular note. If the region is able to implementcontemplated reforms in these areas, it will im-prove the climate favoring new investment
G L O B A L E C O N O M I C P R O S P E C T S
190

(foreign and domestic) and technological prog-ress, opening the way to realizing its long-termpotential.
South Asia
Recent developments
Even before the events of September 11,increasing fiscal deficits and the globalslowdown adversely affected growth in
South Asia, one of the poorest regions. GDPgrowth fell from 4.9 percent in 2000 to 4.5percent in 2001. The energy import bill for theregion increased dramatically as oil pricesjumped in 2000. Higher fiscal deficits were therule, as central and regional governmentsstruggled unsuccessfully to meet revenue andexpenditure targets. This resulted in seriouseconomic problems in Pakistan where the IMFhas estimated that the financing gap in the2001–02 fiscal year will be over $3.4 billion.The external environment is another con-straint on growth, albeit with small effects,given the low level of trade integration of theregion. Export market growth fell from 13percent in 2000 to 2.4 percent in 2001.
The tragic events of September 11 havefocused attention on South Asia. Because themilitary response may affect neighboringAfghanistan, it presents special risks to thecountries of the region. In Pakistan, for exam-ple, freight rates to the subcontinent have al-ready been increased by 10 to 15 percent bymajor shipping lines.1 Importers in other coun-tries, fearing supply disruptions, have canceledorders for goods from Pakistan.2 Pakistan isalso struggling with a heavy external debt of$38 billion that absorbs more than 40 percentof Pakistan’s exports earnings. One possiblepositive outcome is that Pakistan may receiveadditional bilateral economic support thatwould improve its long-term prospects.
Fiscal positions in India and Pakistan havebeen highly expansionary in recent years, withfiscal deficits of 5.3 and 5.8 percent of GDP re-spectively in 2000. India’s fiscal deficit is 10.5percent when consolidated to include central
and regional governments. Monetary stance inIndia at present is expansionary, indicating,perhaps, higher inflation in the near future.Both countries have made some attempts to getfiscal positions under control; the deterioratingexternal position in Pakistan (higher oil prices,interest payments, and drought-affected ex-ports), however, combined with high publicdebt and low levels of foreign reserves, has re-sulted in a financing gap for the current ac-count that has required assistance from theIMF. Pakistan agreed to a program of debt sta-bilization and macroeconomic reform that in-cludes tax reforms; trade liberalization; reformand privatization of state-owned enterprises;and governance reforms.
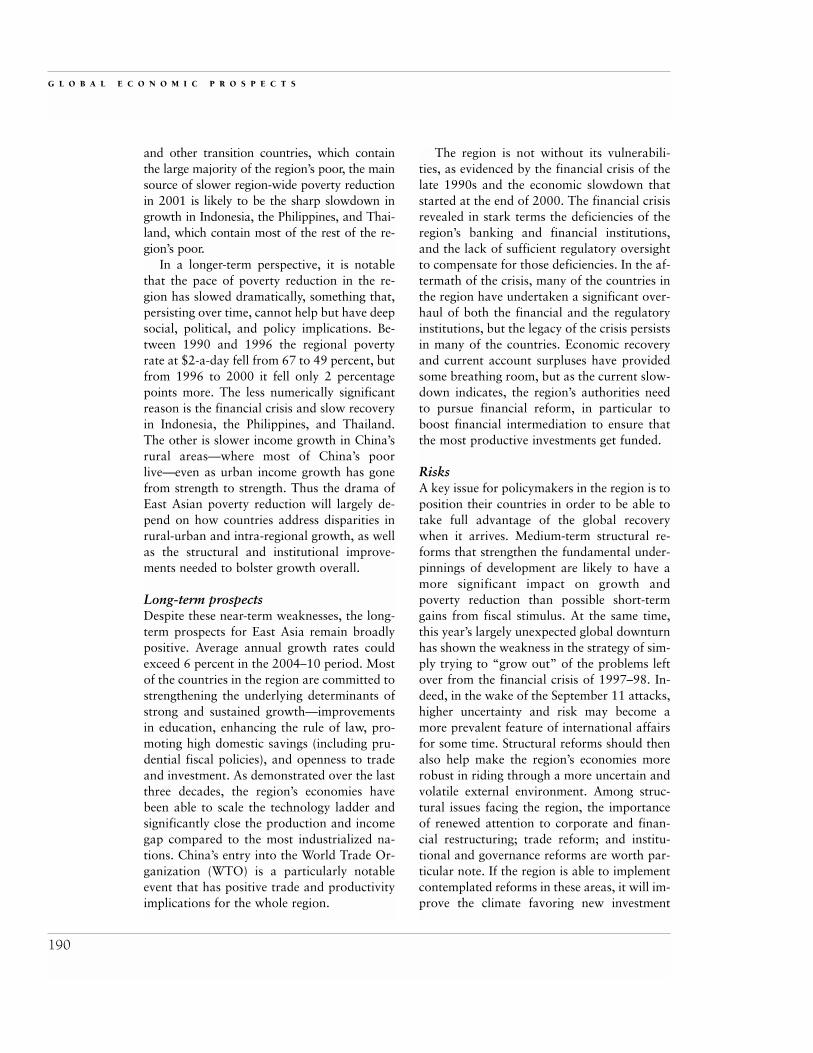
Weather conditions in late 2000 were highlyunfavorable for India, Pakistan, and Bangla-desh, with severe drought conditions in Pak-istan. Agricultural production accounting for25 percent of GDP was hit hard, exacerbatingthe slowdown in growth that was already ap-parent in early 2000. While agricultural pro-duction in the rest of the region improved in2001, India was cushioned by a large stockpileof grains and the abatement of flood conditionsin Bangladesh. There have been knock-on ef-fects to hydroelectric energy production andirrigated agriculture due to the low water lev-els of many reservoirs. As a result, the currentaccount deteriorated further, increasing thefinancing gap.
Weather conditions improved considerablyin the second half of this year throughout thesubcontinent. Normal, and in some cases ex-cessive, monsoon rain has filled water reser-voirs and water tables throughout the region.Agricultural production during the currentyear is expected to boost the overall economyenough to mitigate the negative external cir-cumstances.
Near-term outlookWith the deterioration in the external environ-ment, GDP growth in 2001 and 2002 in SouthAsia is likely to be 4.5 percent and 5.3 percent,respectively. Fiscal expansion had supportedgrowth in the region, but the need for some
R E G I O N A L E C O N O M I C P R O S P E C T S
191
eventual fiscal consolidation will reduce gov-ernments’ share of aggregate demand support-ing growth. The need to constrain fiscal ex-pansion is stronger in Pakistan, which hastargeted the fiscal deficit to GDP at 4.9 percentin 2001–02 with further improvements there-
after. The pressure of fiscal and externaldeficits, as well as high debt levels, will con-tinue to generate uncertainty and lower confi-dence and investment in the private sector. InIndia, although the pressures for fiscal balanceare strong, there remains strong opposition do-
G L O B A L E C O N O M I C P R O S P E C T S
192
Figure A1.2 Industrial production in South Asia
Source: IMF, International Financial Statistics.
(percentage)
–25
India Pakistan
Bangladesh
Jan.
199
7
April 1
997
July
1997
Oct. 1
997
Jan.
199
8
April 1
998
July
1998
Oct. 1
998
–15
–5
5
15
25
35
Jan.
199
9
April 1
999
July
1999
Oct. 1
999
Jan.
200
0
April 2
000
July
2000
Oct. 2
000
Jan.
200
1
April 2
001
July
2001
Table A1.2 South Asia forecast summary(percent per year)
Baseline forecast
Growth rates/ratios 1991–2000 1999 2000 2001 2002 2003 2004–2010
Real GDP growth 5.2 5.8 4.9 4.5 5.3 5.5 5.4Consumption per capita 2.6 6.1 1.6 3.6 3.0 3.0 3.0GDP per capita 3.3 3.9 3.0 2.8 3.6 3.8 4.0
Population 1.9 1.9 1.9 1.7 1.7 1.6 1.4Inflationa 8.1 4.6 5.8 6.1 7.3 7.3 6.5Gross Domestic Investment/GDPb 22.8 22.6 24.3 24.8 25.4 25.6 28.9Central Gvt Budget Balance/GDP –8.6 –4.0 –5.7 –4.8 –4.7 –4.5 –4.1Export Volumec 9.3 1.8 7.5 6.0 8.8 9.2 7.9Current Account/GDP –1.4 –0.8 –0.3 –0.1 –0.5 –0.6 –0.8Memorandum ItemsGDP growth: SAS excl. India 4.2 3.6 3.9 4.7 4.9 5.2 5.2
a. Local currency GDP deflator; median.b. Investment ratio measure in real terms.c. Goods and non-factor services.
Source: World Bank baseline forecast, October, 2001.

mestically to privatization and reform of stateenterprises. A feature of recent government ac-tion has been the rollback of cuts in subsidiesin food and fuel, which has proved unpopular.
The global downturn in growth in 2001–02will have some effects on the region, if morelimited than in other regions. As oil prices falland weather conditions improve, trade bal-ances will benefit. The downturn in exportmarket growth will be mirrored by falling im-port demand stemming from slower growthdomestically, improving current accounts. Mostcountries in the region are seeking to depreciatetheir currencies to shore up foreign reserves andpromote exports and increase competitiveness,which should have a positive effect on the tradebalance. Bangladesh may struggle slightly in itsclothing sector with the ending of a preferentialtrade agreement with the United States (whichaccounts for 30 percent of Bangladesh’s ex-ports) but by 2002 Bangladesh will receiveduty-free access to European markets for itsgarment exports. Consumer price inflation inthe region has been low, despite droughts andhigher oil prices. Most countries have subsidiesfor fuel and some foods, which cushions theimpact of imported inflation on consumerprices; the large stockpile of grains in Indiadampened the recent impacts of unfavorableweather conditions. The slowdown in demandwill continue to restrain price rises, and perhapsallow further declines in interest rates.
Long-term prospectsLong-term growth in South Asia should averageabout 5.4 percent, similar to the projections ofGEP 2001. This is similar to average growth inthe short-term, and reflects the lower contribu-tion of the public sector to GDP as governmentsattempt to balance their fiscal positions in theforecast period. Lower population growth in thenext decade will ensure that per capita growthwill be close to 4 percent per year. Potential out-put growth in the region is quite high, given theimprovement in human capital indicators in re-cent years, with higher literacy rates and schoolenrollments, and lower infant mortality rates.
Additionally, the high skill levels of Indianworkers with training in technology sectors, aboom area of growth, will ensure that the highlyproductive investment in these sectors will con-tinue in the long term. As scheduled privatiza-tion and reform of state-owned enterprises con-tinues, private investment will account for agreater share of domestic investment, with theconcomitant benefits flowing from higher pro-ductivity of private investment compared to thatof public investment. Additionally, privatizationwill encourage foreign investment and the asso-ciated spillovers to the domestic economies.Trade liberalization is also expected to continuewith the easing of tariff and nontariff barriersand import substitution policies, providinggreater opportunities for trade integration withthe global economy, particularly for the smallercountries within the region.
RisksBesides political risks in the short run, otherrisks to the forecast stem from the major chal-lenges that countries in the region face in theconsolidation of their fiscal positions and ex-ternal and domestic debt levels. Changes in theincidence of taxation will be necessary to de-crease the reliance on trade taxes and broadenthe tax base to stabilize revenue collectionsover time. More discipline will be required infiscal expenditures to ensure fiscal sustainabil-ity, while being careful to maintain expendi-tures that are essential for development pro-grams. Unproductive expenditures, particularlysubsidies, should be a particular target. Broad-ening the tax base away from trade is also apart of the trade liberalization strategy that willensure that exporters have access to cheaper in-puts and consequently become more competi-tive in global markets. Sustainable fiscal rev-enues and a responsible expenditure programwill be required in several countries, particu-larly Pakistan, to counter its existing severefinancial vulnerability. Countries with healthydebt levels should also act to ensure sustainablefiscal positions to prevent a decline into unsus-tainable debt levels.
R E G I O N A L E C O N O M I C P R O S P E C T S
193

Latin America and the Caribbean
Recent developments
Growth out-turns for most countries inthe region in 2001 were much worsethan anticipated in the spring of the
year. Adverse developments in the external en-vironment and in domestic conditions in somecountries were the primary reasons behind thesharp reduction in the region’s GDP growth,from 3.8 percent in 2000 to an estimated 0.9percent in 2001, about 2.8 percentage pointslower than anticipated in the spring. Thegrowth slowdown was most acute in the “BigThree” (Argentina, Brazil, and Mexico), reflect-ing the increasing impact of the global, and par-ticularly the U.S. slowdown; economic difficul-ties in Argentina; and the energy crisis in Brazil.Uncertainties linked to the electoral process inArgentina this year and in Bolivia, Brazil,Colombia, Costa Rica, and Ecuador next yearcontributed to falling investment rates in anumber of countries. Weaker growth in Ar-gentina and Brazil, along with a worsening ofthe external environment, contributed to a de-celeration of growth in other South Americancountries, while a collapse of commodity prices(especially for coffee and semiconductor prices)and a severe drought lowered growth rates inCentral America. In contrast, Ecuador and Repú-blica Bolivariana de Venezuela did better thanin 2000 due to relatively high oil prices.
Rapid deterioration in global activity con-tributed to a sharp decline in export revenues.Excluding Mexico, dollar exports from the re-gion grew by an average of about 8 percent(year over year or y/y) in the first half of theyear—down from over 15 percent in 2000.With the exception of Brazil (where dollar ex-ports grew by 11.5 percent y/y), most countrieshad exports growing below 4 percent. In Mex-ico, the decline was even more dramatic, froman average of 22.6 percent growth in 2000 tozero (0 percent) by June 2001. Moreover, capi-tal market commitments to the region weak-ened markedly (that is, they fell by 21 percent(y/y) in the first half of the year)—reflecting the deteriorating conditions in Argentina and
slower economic activity in the region as awhole—exerting downward pressure on mostregional currencies.
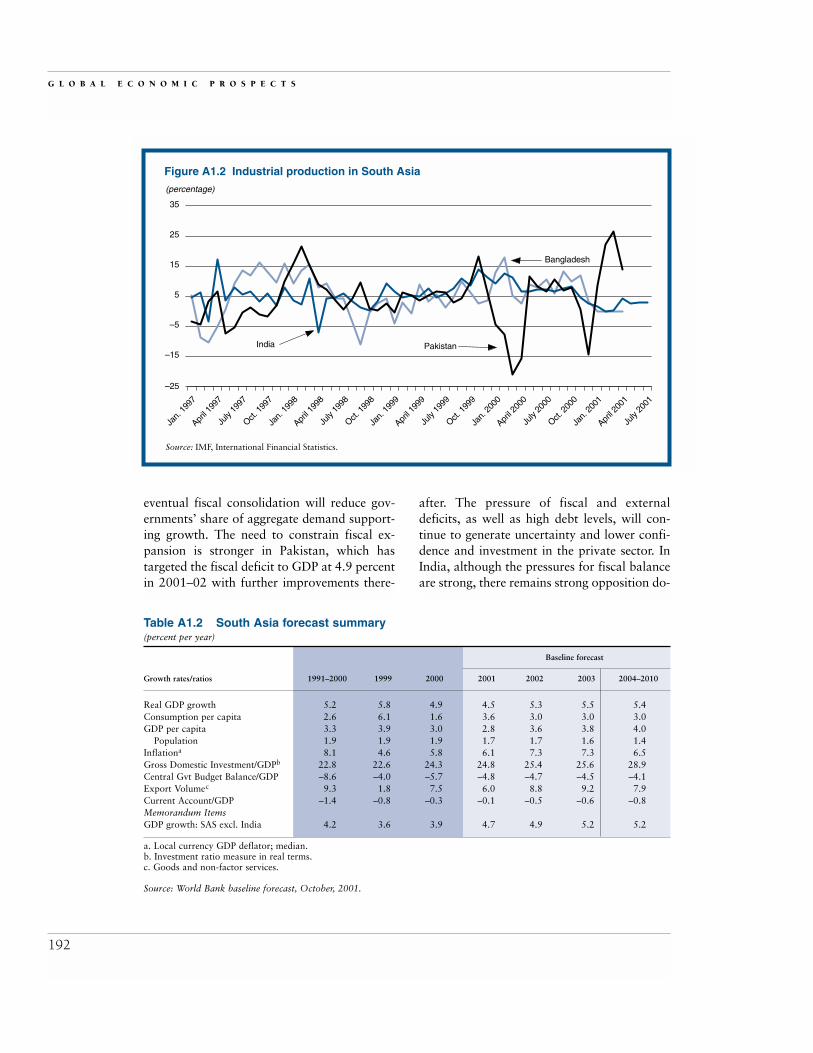
Large external financing requirements as ashare of GDP coupled with fiscal deficits andhigh public debt reduced the ability for counter-cyclical fiscal and monetary policies in somecountries. Despite falling U.S. interest rates,which reduce dollar debt-service payments—the depreciating exchange rates, slowing eco-nomic activity, and rising domestic interestrates (needed to maintain investor confidence)placed additional pressure on fiscal balances,limiting the scope for automatic stabilizers to function properly. Indeed, some countries,such as Brazil, had to tighten both fiscal andmonetary policies in an effort to offset thecombined negative effects of an energy crisis, alarge reduction in FDI inflows, and contagionfrom the Argentine crisis, which resulted in asharp reduction in capital market flows as sec-ondary market spreads rose and remained highin the wake of the September 11 terrorist at-tacks (figure A1.3). Although these policiestended to keep inflation under control, they re-sulted in a sharp growth deceleration and ex-acerbated the already high level of unemploy-ment throughout the region (16 percent inArgentina, for example).
In Argentina, recovery from the deep reces-sion in 1999 has proven elusive, with each up-turn in economic activity usurped by politicalstalemate on reforms, a weakening of fiscal ac-counts during the first half of the year, andvolatile capital flows—reflecting investor un-certainty about solvency of public debt. GDPgrowth has remained in negative territory sincethe third quarter of last year. The authoritiesundertook a number of initiatives to bolsterinvestor confidence—including a $29.5 billiondebt swap, a severe fiscal adjustment aimed at zero deficit, and a package of tax reformsaimed at improving competitiveness of Argen-tine firms.
Negative fallout from Argentina was mostacute in Brazil, and other Mercosur partners—slowing capital flows, especially FDI inflows;increasing yield spreads; and contributing to a
G L O B A L E C O N O M I C P R O S P E C T S
194
weakening of the real. Brazil’s drought-inducedenergy crisis and falloff in FDI, in conjunctionwith a depreciating currency, put upward pres-sure on inflation and set in motion tighter fis-cal and monetary policies. Targets for the pri-mary (before interest payments) fiscal surpluswere raised, and policy interest rates rose by325 basis points in the four months to August,contributing to a slowdown in growth. In con-trast, Mexico suffered little contagion from thecrisis in Argentina, with both the currency andequity markets rising strongly—reflecting thecontinuing positive impact of North AmericaFree Trade Agreement (NAFTA) membershipon FDI. Nonetheless, output growth con-tracted rapidly—in line with the sharp slow-down in U.S. activity, reaching zero (y/y) by thesecond quarter of 2001 after averaging nearly 7 percent in 2000.
Slowing economic activity in Argentina andBrazil along with falling copper prices affectedgrowth negatively in Chile, but with lesser ex-ternal financing concerns than in other coun-tries, the authorities were able to reduce inter-est rates. GDP growth slowed in 2001 but bymuch less than in many other countries. InPeru, political uncertainties in the run-up to
mid-year elections kept investment rates lowand restrained consumer spending, resulting ingrowth slowing to below 1 percent from over3 percent last year. Growth in Colombia alsoweakened compared with 2000, due to lowercoffee prices and lower-than-expected invest-ment caused by rising uncertainty (includingthe electoral cycle, legal infrastructure, and theguerrilla war). In contrast, growth in the oilexporters in the Andean region held up welldue to high, although declining, oil revenues.Growth in Venezuela was sustained by large-scale public expenditure, while growth inEcuador accelerated from the low or negativegrowth in 1998–2000 with the construction ofa new oil pipeline.
In Central America, growth in 2001 waslower by about 1.7 percentage points comparedwith 2000, due primarily to a weakening ofeconomic activity in Mexico and in the UnitedStates, a collapse of coffee prices, and a majordrought, which severely affected Honduras andNicaragua. The sharp fall in semiconductorprices hurt Costa Rica particularly hard assemiconductors account for nearly two-fifths oftheir exports, resulting in merchandise exportsdeclining by 21 percent (y/y) in the first half of
R E G I O N A L E C O N O M I C P R O S P E C T S
195
Figure A1.3 Secondary market spreads for selected LAC countries, 2000–2001
Source: JP Morgan’s EMBI Global indices through Bloomberg.
(basis points above U.S. Treasuries)
0
Jan. 2000 July 2000
Argentina
Brazil
Colombia
Mexico
Jan. 2001 July 2001
400
800
1,200
1,600
0
400
800
1,200
1,600

the year. Caribbean countries also saw a reduc-tion in growth rates due to declining tourismrevenues, especially in the latter part of the year.
Near-term outlookThe region’s growth prospects for 2002 havedimmed in light of a significant worsening ofthe external environment over the past sixmonths, and especially since the September 11terrorist attacks in the United States. The re-gion’s GDP is now expected to grow by 2.5percent in 2002—1.9 percentage points lowerthan the spring forecast—provided that thosecountries currently under financial stress areable to avoid debt-service defaults. The delay inthe U.S. recovery, weak global output and tradegrowth, a continuation of soft non-oil com-modity prices and falling oil prices, and thelikelihood of reduced capital flows to develop-ing countries underpin the moderate growth re-covery for next year. (As a consequence, thereis great uncertainty surrounding the forecastwith more negative or positive responses ofconsumers and investors possible.) In 2003,GDP is expected to grow by 4.5 percent, re-flecting the expected rapid growth momentum
in the United States, and world output in thelatter part of 2002 and into 2003.
Revisions to external conditions, as well as domestic considerations, will impact thegrowth prospects for countries differently. Theexpected delay in the U.S. recovery will havethe most significant trade impacts in Mexicoand the Central American and Caribbeancountries. For many of these countries, export-processing zone (maquilas) exports destinedmainly for the North American market are asignificant proportion of total exports (30 per-cent of net exports in Costa Rica and El Sal-vador, for example). Moreover, remittances arealso likely to decline at a time when many Cen-tral American countries are facing weak coffeeprices (after a four-year decline) and the effectsof a severe drought in 2001. Weakness in laborand equity markets in the United States and in-creased risk aversion to air travel will adverselyimpact tourism receipts—which are extremelyimportant for Caribbean countries. Prelimi-nary estimates indicate that loss of tourism rev-enues could reduce these countries’ GDP by1.5 to 5 percent with potentially damaging so-cial impact in light of high unemployment in
G L O B A L E C O N O M I C P R O S P E C T S
196
Table A1.3 Latin America and the Caribbean forecast summary(percent per year)
Baseline forecast
Growth rates/ratios 1991–2000 1999 2000 2001 2002 2003 2004–2010
Real GDP growth 3.3 0.1 3.8 0.9 2.5 4.5 3.9Consumption per capita 1.5 –1.7 2.2 1.0 1.6 2.0 2.5GDP per capita 1.6 –1.5 2.2 –0.7 1.0 3.0 2.6
Population 1.7 1.6 1.6 1.6 1.5 1.4 1.3Inflationa 12.6 5.8 6.9 7.9 6.3 6.0 5.0Gross Domestic Investment/GDPb 21.8 19.4 19.7 19.4 20.1 20.7 23.5Central Gvt Budget Balance/GDP –3.5 –4.4 –2.9 –3.2 –3.0 –2.5 –1.7Export Volumec 8.4 5.7 9.7 2.6 4.2 9.5 6.7Current Account/GDP –2.8 –3.1 –2.4 –2.8 –3.3 –3.2 –2.2Memorandum ItemsGDP growth: LAC excl. Brazil 3.8 –0.4 3.4 0.5 2.3 4.7 3.7
Central America 4.4 4.3 2.7 1.0 2.2 4.0 3.8Caribbean 3.4 5.7 5.5 1.4 3.0 4.2 4.0
a. Local currency GDP deflator; median.b. Investment ratio measure in real terms.c. Goods and non-factor services.
Source: World Bank baseline forecast, October, 2001.

the region. Argentina and Brazil are likely tobe more hurt from disturbances in capital mar-kets (if they were to be prolonged) than fromdirect trade impacts, due to weaker global ac-tivity. This reflects their high public and privatedebt and large current account deficits (nearly3 percent of GDP for Argentina, about 5 per-cent for Brazil). Although lower U.S. interestrates will help to alleviate debt-service pay-ments, risk perceptions have remained ele-vated—partly due to the view that debt re-structuring may be necessary, as occurred inEcuador in 1999—and have kept capital mar-ket flows subdued, reducing the ability of thesecountries to roll over debt. In Argentina, thesefactors are likely to keep the recovery modest.In Brazil, contagion from events in Argentina(despite a $15.58 billion IMF–led package) isreducing the room for countercyclical policies.In addition, presidential elections due next yearcould be another factor restraining a return of investor confidence and the acceleration ofgrowth.
As oil prices soften in 2002–03, the adjust-ment that oil exporters will have to undergowill be difficult and growth-restraining. Vene-zuela, for example, used buoyant oil revenuesto finance growth in 2001, resulting in the non-financial–public sector’s fiscal balance shiftingfrom a surplus of 2.9 percent in 2000 to adeficit of about 3.1 percent of GDP. In con-trast, Ecuador may avoid a contraction ingrowth in 2002, because oil revenues may re-main high with expanded output partially off-setting the expected decline in oil prices.Colombia’s prospects hinge increasingly on fis-cal deficit reduction and on progress in thepeace process, but growth prospects will re-main subdued with the expected weak oil andcoffee prices. In Peru, the new administrationwill face tension between containing the fiscaldeficit and reactivating growth quickly to re-duce the danger of popular discontent, whichcould lead to political and social instability.However, the combination of weak metalsprices, delayed FDI flows, and limited access tocapital markets could delay the economic re-bound. Bolivia, Paraguay, and Uruguay all have
strong trade ties to Argentina and Brazil, limit-ing their growth prospects to the fortunes ofthose countries.
Long-term prospectsPer capita GDP growth over the long term(2004–10) is projected to average 2.6 percent ayear, a full percentage point higher than whatthe region achieved in the 1990s. Key factorssupporting the cautious optimism for growth inthe 2000s compared with the 1990s include im-provements in: (a) human capital (health, edu-cation, and literacy indicators have all im-proved over the course of the 1990s, althoughmuch remains to be done in this area); (b)macroeconomic management leading to greaterdomestic macroeconomic stability (inflationrates have fallen over the 1990s, for example,although they are still more volatile than inother regions); (c) investment climate attractingFDI; and (d) progress on deepening trade inte-gration with the regional and global economies.
FDI as a share of region-wide GDP rosefrom less than 1 percent at the beginning of the1990s to nearly 4 percent in 2000, with a sig-nificant share going into telecommunications;this represents benefits to the economy that arelikely to accrue in the next decade. Regulationand supervision of financial sectors have beenstrengthened, and trade regimes have been lib-eralized, with trade doubling as a proportion ofGDP over the last 10 years. These develop-ments have contributed to a large rise in totalfactor productivity, from negative growth in the1980s to nearly 1 percent a year in the 1990s.In the 2004–10 period, TFP growth is expectedto remain in the 1 to 2 percent range, while im-provements in the investment climate—includ-ing strengthening the financial sectors throughbetter supervision and regulation—could con-tribute another 1 percentage point to regionalgrowth.
RisksThe region remains vulnerable in a number ofareas however. First, national saving rates re-main low in many countries, resulting in a per-sistent dependence on foreign savings (of about
R E G I O N A L E C O N O M I C P R O S P E C T S
197

3 percent of GDP)—typically from volatile pri-vate capital markets. These markets havedemonstrated their power in delivering severeexternal shocks to developing countries, andthe region has had to endure at least two suchepisodes in the 1990s (Mexico in 1995, andBrazil in 1999). The case of Argentina is stilldeveloping, and will obviously impact risk per-ceptions in the region for some time.
Second, the prevalence of large debt over-hangs (both in the public and the private sec-tors) in countries throughout the region re-quires rollover on a continuing basis. Althoughthe region’s debt-to-GNP ratio is in line withthe average of developing countries, the debt-to-exports ratio is very high. This exposes somecountries to exogenous shocks emanating fromglobal capital markets, which are at times inde-pendent of domestic considerations.
Third, trade integration is incomplete withratios of trade-to-GDP remaining low by inter-national standards (Chile, Mexico, and smalleconomies are exceptions), and diversificationof exports is still limited—many countries arestill commodity dependent.
Finally, the region still lags behind its po-tential in financial deepening (which couldhelp raise national saving rates), infrastruc-ture, and quality of institutions—areas which,if improved, can propel high and sustainablegrowth rates. Many countries in the regionhave made strides in addressing some of theseareas and, should investor sentiment towardemerging markets improve significantly, theregion could grow at a faster pace than in thecurrent forecast.
Europe and Central Asia
Recent developments
Real gross domestic product (GDP)growth for the Europe and Central Asia(ECA) region is projected to decelerate
markedly in 2001 to about 2.1 percent, downfrom 6.3 percent in 2000. This rapid slowdownis dominated by three main factors. First, inTurkey domestic demand collapsed due to high
interest rates and severe economic disruption inthe wake of the financial crisis, which erupted in late 2000 and early 2001. Second, there hasbeen a pronounced moderation of growth in theRussian Federation, Poland, and the former Yu-goslav Republic of Macedonia (FYR Macedo-nia). In the Russian Federation, the impetusbehind exceptionally strong growth of over 8percent in 2000 (generated from a combinationof high oil prices and import substitution, drivenby devaluation) is receding. In Poland high in-terest rates, aimed at containing inflation, havestymied demand. In FYR Macedonia, the mili-tary conflict with the Albanian rebels, whichbegan in March 2001, has clearly begun to takeits toll on the budget and on economic activity.Third, the slowdown in global demand in 2001,particularly in the European Union (EU), hashad a negative impact on growth in the ECA re-gion, in contrast to 2000 when external demandacted as a strong engine for growth.
Countervailing some of these negative pres-sures on regionwide growth, domestic demandhas strengthened in a number of countries (suchas the Czech Republic, Hungary, Romania, andthe Slovak Republic). Similarly, strong growthin domestic demand, particularly in private con-sumption, stimulated by an increased moneysupply through large hard currency inflows,among other factors, is providing a buffer to the slowdown in the Russian Federation. Withinthe Commonwealth of Independent States (CIS)subregion, strengthened domestic demand inthe Russian Federation in 2001 has translatedinto a significant firming of import demand andhas provided a boost to growth in a number ofcountries that export to the Russian Federation(for instance, Ukraine). In contrast, export sec-tors in a few countries with significant revenuesfrom Turkey, (for instance, Bulgaria and Geor-gia) are expected to be impacted by the plungein Turkish import demand.
For most countries in ECA, current accountdeficits are forecast to stay at 2000 levels or todeteriorate in 2001, although they should re-main manageable. In the few cases where thereare current account surpluses, they are ex-pected to narrow. In some countries the cur-
G L O B A L E C O N O M I C P R O S P E C T S
198

rent account deficits are already quite large orare growing rapidly relative to GDP (such as inPoland and Romania). For countries such asPoland, with an already high current accountdeficit, the EU slowdown will be felt more di-rectly, although the sharp deceleration in do-mestic demand there will reduce imports.While the Russian Federation is expected topost a large surplus again for 2001, it will besignificantly below the record $46 billion sur-plus in 2000. In Turkey the current account isexpected to post a sizeable surplus due to asharp contraction in imports and strengtheningexports stimulated by the massive devaluationof the Turkish lire subsequent to the abandon-ment of the crawling-peg regime in February2001.
Real foreign exchange rates throughout theregion remained on a broadly stable path overthe first half of 2001. The most notable excep-tion is the sharp devaluation of the Turkish lireof about 60 percent in nominal terms, or about30 percent in real terms, as of August 2001,year over year (y/y). The currencies of some
other countries (for instance, Hungary andPoland) subsequently came under considerabledownward pressure during July 2001, wheninternational investors became more bearishon emerging market instruments. In contrast,the Russian ruble has remained relatively firmand generally appreciated in real terms overthe year, bolstered, in particular, by a large cur-rent account surplus. Elsewhere in ECA, due inpart to fixed currency regimes and inflationdifferentials, the Bulgarian (currency board)and Baltic (pegged) currencies have continuedto appreciate.
Inflationary pressures in the ECA region onthe whole were relatively contained in 2001,with the general rate of increase either declin-ing somewhat or remaining flat. Turkey, withthe consumer price index running at about 55percent in 2001, is an important exception.Until domestic markets stabilize there, height-ened uncertainty will contribute to higher in-flationary pressures, as will the hefty increasein the cost of imports that will likely generatesignificant pass-through effects. Driven in most
R E G I O N A L E C O N O M I C P R O S P E C T S
199
Figure A1.4 Russian imports and partner exports in 1998–2001
Source: IMF.
(3-month moving average, y/y percent change (of US$ merchandise trade)
–175
Jan.
199
8
–125
–75
–25
25
75
125
Russia – Imports
Other CIS – Exports
CEECs (excl. Turkey) – Exports
Turkey – Exports
Feb. 1
998
Mar
ch 1
998
Apr. 1
998
May
199
8
June
199
8
July
1998
Aug. 1
998
Sept.
1998
Oct. 1
998
Nov. 1
998
Dec. 1
998
Jan.
199
9
Feb. 1
999
Mar
ch 1
999
Apr. 1
999
May
199
9
June
199
9
July
1999
Aug. 1
999
Sept.
1999
Oct. 1
999
Nov. 1
999
Dec. 1
999
Jan.
200
0
Feb. 2
000
Mar
ch 2
000
Apr. 2
000
May
200
0
June
200
0
Jan.
200
1
Feb. 2
001
Mar
ch 2
001
Apr. 2
001
May
200
1
June
200
1
July
2000
Aug. 2
000
Sept.
2000
Oct. 2
000
Nov. 2
000
Dec. 2
000
cases by an accommodating fiscal stance, in-flation remains at double-digit levels in a hand-ful of other ECA countries, for example in Be-larus, Romania, Tajikistan, and Uzbekistan. Forthe region’s oil-importing countries, the recentpass-through impact of higher energy prices hasbegun to diminish. In contrast, strengtheningdomestic demand in a number of ECA countriescould lead to higher inflationary pressures.
Near-term outlookThe severity and duration of the current slow-down in the EU, along with policy responses in the transition countries, will be importantfactors for near-term prospects. In the EU, arecovery is not expected until the second half of 2002, and much stronger external demandfrom the EU is not anticipated until 2003. Thisis especially significant for the Central andEastern European countries (CEECs), becausetheir economies have become well integratedwith the EU. Another important near-term as-sumption is that the combination of slowingworld energy demand and an accommodatingstance by the Organization for Petroleum Ex-porting Countries (OPEC) will likely translateinto lower nominal and real oil prices. For the
hydrocarbon exporters of the CIS, this scenarioimplies a further slowdown in growth in 2002.For the ECA region oil-importers, the declinein the energy bill is expected to partially offsetthe negative impacts of a less favorable externalenvironment. If indeed Turkey stabilizes andbegins to recover in 2002, which is an assump-tion underlying our forecast, it will lift aggre-gate growth for the region.
Throughout the region, access to foreign pri-vate capital (including foreign direct invest-ment, FDI) is expected to remain more difficultover the near-term, due to increased aversion to emerging markets by international inves-tors. Correspondingly, domestic and foreign in-vestment in the ECA economies is expected todecelerate through 2002, in part reflecting an-ticipated delays in privatization programs.Tourism, an important source of foreign cur-rency in a number of ECA countries (such asCroatia and Turkey), is also projected to slowmarkedly.
In sum, over the near term (2002–03),growth is expected to stabilize at close to 3.5percent for the region as a whole. At the sub-region level, we are forecasting a pattern ofdiverging growth becoming manifest in 2003.
G L O B A L E C O N O M I C P R O S P E C T S
200
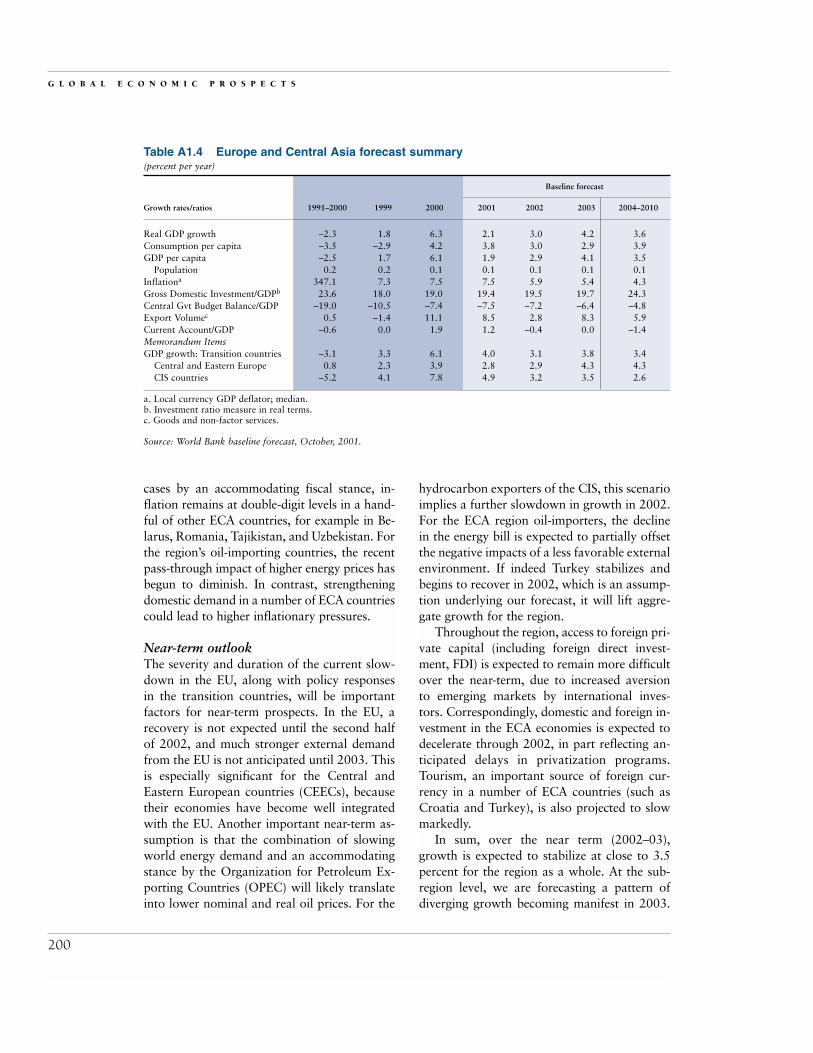
Table A1.4 Europe and Central Asia forecast summary(percent per year)
Baseline forecast
Growth rates/ratios 1991–2000 1999 2000 2001 2002 2003 2004–2010
Real GDP growth –2.3 1.8 6.3 2.1 3.0 4.2 3.6Consumption per capita –3.5 –2.9 4.2 3.8 3.0 2.9 3.9GDP per capita –2.5 1.7 6.1 1.9 2.9 4.1 3.5
Population 0.2 0.2 0.1 0.1 0.1 0.1 0.1Inflationa 347.1 7.3 7.5 7.5 5.9 5.4 4.3Gross Domestic Investment/GDPb 23.6 18.0 19.0 19.4 19.5 19.7 24.3Central Gvt Budget Balance/GDP –19.0 –10.5 –7.4 –7.5 –7.2 –6.4 –4.8Export Volumec 0.5 –1.4 11.1 8.5 2.8 8.3 5.9Current Account/GDP –0.6 0.0 1.9 1.2 –0.4 0.0 –1.4Memorandum ItemsGDP growth: Transition countries –3.1 3.3 6.1 4.0 3.1 3.8 3.4
Central and Eastern Europe 0.8 2.3 3.9 2.8 2.9 4.3 4.3CIS countries –5.2 4.1 7.8 4.9 3.2 3.5 2.6
a. Local currency GDP deflator; median.b. Investment ratio measure in real terms.c. Goods and non-factor services.
Source: World Bank baseline forecast, October, 2001.

For the CEECs, aside from anticipated strongerexternal demand in 2003, the EU accessionprocess is expected to stimulate a continuationof reforms and to further boost growth. In con-trast, CIS growth is expected to slow in 2002and to remain generally flat in 2003 as energyprices stabilize at lower levels, and the boostfrom high oil rents winds down in a policy en-vironment of gradual reforms. As a conse-quence, import demand from the Russia Feder-ation is expected to decline, which is in turnexpected to result in lower export volumes forthe smaller CIS countries.
Long-term prospectsOver the coming decade through 2010, GDPgrowth for the ECA region is forecast to aver-age close to 4 percent, in contrast with the 2.3percent region-wide average rate of contractionwitnessed during 1991–2000, the first decadeof transition. From a region-wide perspective,the main drivers of higher growth are an im-proved policy environment and a greater de-gree of macroeconomic stability leading tohigher investment and savings rates as a shareof GDP. Growth for the CEEC subregion is ex-pected to average above 4 percent during theperiod 2001–10, up significantly from close to1 percent posted during 1991–2000. Growth inthe CIS subregion is expected to average some-what below 3 percent, also a marked increasecompared to the sharp contraction of about 5percent annually registered during 1991–2000.
In the CEECs, during the second decade oftransition, a number of factors are contributingto the anticipation of stronger growth perfor-mance, including rising investment as a share ofGDP and continued restructuring of the capitalbase. Broad-based reforms and a well-educatedlabor force have been—and are expected to re-main—important factors contributing to fruit-ful returns on rising investment.
Almost all of the CEECs are EU accessioncandidates, and have significantly benefitedfrom the EU accession process, which has pro-vided an incentive to address underlying struc-tural and institutional impediments to growth.The EU accession process is expected to con-
tinue to boost FDI into the subregion, althoughas privatization programs wind down, this isexpected to diminish somewhat. These flowshave largely financed the subregion’s shortfallin domestic savings. Domestic savings rates areforecast to increase over the forecast horizon asFDI inflows moderate, but they are not ex-pected to increase sufficiently to close the gapover the forecast horizon. This potential imbal-ance between savings and investment exposesthe CEECs to the risk that investment demandwill be bridled by inadequate domestic savingsor by a sudden drop in foreign inflows. Never-theless, prospects are broadly positive as mostof the countries of the subregion have achieveda significant degree of stability and realignmentof institutions and markets over the last decadeand are on a path to continue the process. TheCEEC subregion growth forecast of just over 4percent over the long term, albeit not insignifi-cant, suggests only slow convergence with EUper capita income levels.
As with the CEECs, high educational attain-ment provides a strong positive contribution togrowth potential in the CIS. However, invest-ment in human capital in the region has de-clined substantially following the breakup of the Soviet Union and in the wake of the1997–98 crisis. Should a turnaround in the in-vestment in human capital not materialize, animportant positive dynamic of the subregion’sgrowth picture will deteriorate further. The re-cent surge in growth in the CIS subregion of hy-drocarbon exporters has created an importantopportunity to introduce reforms more actively.The Russian Federation is an example of wherethis process has begun, especially during 2001.However, there the implementation process isjust being initiated, and much remains uncer-tain. Significant institutional and structural im-pediments remain constraints to growth. Con-sequently for the CIS countries as a group—andin contrast to the CEECs—investment as ashare of GDP is expected to remain at relativelylow ratios, after having declined during the1990s. Also, considerable excess capacity re-mains, though much of it could be obsolete, soinvestment demand could kick in sooner if the
R E G I O N A L E C O N O M I C P R O S P E C T S
201

economy picks up. If good policy reforms areintroduced more aggressively, then the CIS econ-omies could shift to a higher growth path.
RisksOver the near- to medium-term, risks to theforecast are predominantly on the downside.Within the region the main risks include thepossibilities of a deepening of the crisis inTurkey or a sharper economic slowdown in theRussian Federation, or both. In either case,growth prospects in smaller economies of theregion would also decline. Another internal riskfactor is an escalation of political tensions andinstability in the Balkans. The September 11terrorist attacks have increased both externaland internal risks. With regard to the former,there is the possibility of greater risk aversion to emerging markets and capital flight. Regard-ing the latter, a risk of increased political uncer-tainty is an important factor, especially in thecountries of Central Asia, due to the heightenedconflict and instability in Afghanistan. Therecould also be an influx of refugees to the ECAcountries bordering Afghanistan, namely Tajik-istan, Turkmenistan, and Uzbekistan.
Other external risks are mainly associatedwith the EU, both in terms of its growthprospects and with public support for the ac-cession process. A stronger and more pro-tracted decline in external demand from the EUwould add pressure to external balances andlikely reduce growth outcomes, particularly inthe CEECs. An important aspect of an ex-tended slowdown in the EU is the timing—thatis, coinciding with important EU accession ne-gotiations—because it will likely reduce ma-neuverability for both candidate countries andexisting members. Correspondingly, supportfor the EU accession process (both within theexisting EU countries3 and within prospectivemember countries) has been diminishing. Thiscould become a higher risk over the near termbecause more difficult issues—such as the freemovement of labor and capital, agriculture,and the distribution of structural funds—arenow shifting to the front burner in enlargementnegotiations. Extensive delays in the EU acces-
sion process could slow the reform process andundermine long-term growth prospects withinthe CEECs.
Potential output could be increased if re-form programs in the CIS were to move for-ward more aggressively than anticipated. Inthe case of the Russian Federation, this wouldgenerate positive demand dynamics through-out the CIS and in Turkey. Depending on dy-namics both internal and external to the re-gion, there is the upside risk that the EUaccession process will regain stronger positivemomentum and proceed more smoothly andmore rapidly than currently envisioned. No-tably, the recent terrorist crisis could act as acatalyst to strengthen political resolve in boththe EU and applicant countries to move for-ward with the accession process. Turkey, theRussian Federation, and Central Asian coun-tries might also benefit from strengthened po-litical backing from the west and a possibleincrease in official assistance as a reward forsupporting U.S.–led strikes into Afghanistan.
Sub-Saharan Africa
Recent developments
Growth in Sub-Saharan Africa (SSA)slowed to 2.7 percent in 2001 from 3percent in 2000, interrupting a pro-
gressive recovery from the slowdown of thelate 1990s. With population growing at 2.4percent, the rise in per capita GDP was mini-mal. The slowdown was widespread through-out the region, in East, West, and SouthernAfrica, and in both oil and non-oil commodityexporters.
The primary cause was the slowdown indeveloped countries. In the face of weakerdemand from the United States and the EuroArea, merchandise exports managed just 3.4percent growth in volume terms compared to8.8 percent in 2000. Services exports, includingtourism, were also affected, growing by 3.6percent. Commodity prices remained wellbelow levels of the late 1990s, including thosethat rebounded from recent lows. Beverage
G L O B A L E C O N O M I C P R O S P E C T S
202

producers were particularly hard hit, with cof-fee prices down over 25 percent from 2000 andcocoa prices—although they were up around10 percent in 2001—only 75 percent of the av-erage for 1995–2000. While oil prices easedback from their peak of nearly $30 a barrel inmid-2000 they remained strong, and oil ex-porters outperformed the region as a whole,growing at an average of 3.6 percent for theyear, compared to 2.6 percent for non-oil ex-porters. Oil constitutes less than a third of SSAexports, however, and net energy exports areonly 5 percent of GDP. Thus on balance, recentworld commodity market trends represented amajor drag on growth and incomes.
Apart from the external environment, de-velopments within the region painted a mixedpicture. Better weather boosted agricultural pro-duction and household incomes in a number of countries in East and Southern Africa, in-cluding Ethiopia, Kenya, Mozambique, andTanzania. However, localized drought condi-tions persisted in these and many other coun-tries. In Southern Africa, food production fellby as much as 25 percent, due to both adverseweather conditions and civil disturbance.Overall, the Food and Agriculture Organiza-tion of the United Nations (FAO) estimates
that the need for food aid will be unchangedfrom last year at around 2.7 million tonnes(FAO 2001). Weather also contributed to a 12percent reduction in the cocoa crop in WestAfrica after the bumper harvest of 1999–2000,according to the International Cocoa Organi-zation (African Business, July/August 2001).
In the political sphere, some progress to-ward stability was achieved in the DemocraticRepublic of Congo, Guinea, and Sierra Leone,but peace seemed as elusive as ever in Angola,Liberia, and the Sudan, and Zimbabwe’s crisisintensified with the approach of elections inspring 2002. Countries in conflict or experi-encing severe governance problems4 recordedthe worst performances, growing at –0.4 per-cent in 2001. On the plus side, robust growthcontinued in a number of countries, includingEthiopia, Madagascar, Mozambique, andUganda, reflecting better policy and economicmanagement. Finally, 19 countries reached de-cision points under the enhanced Heavily In-debted Poor Countries Initiative, cutting debtservicing costs by a third, and relaxing balanceof payments and budgetary pressures.
In South Africa, the region’s largest econ-omy, a robust recovery in the second half of2000 dissipated in the first half of 2001 as in-
R E G I O N A L E C O N O M I C P R O S P E C T S
203
Figure A1.5 Real GDP growth of SSA oil and non-oil exporters
Source: Economic Policy and Prospects Group.
(percent)
0
2000 20022001 2003
0.5
1
1.5
2
2.5
3
3.5
4
4.5Oil Non-oil

adequate rains led to a disappointing maize har-vest. The impact spilled over from agricultureinto manufacturing and, on the demand side,into consumer spending, and growth slowed to2.4 percent. Both public and private investmentremained strong, as did productivity growth,although the investment rate at only 16 percentof GDP remains well below the level needed to support adequate employment growth. Therand came under strong selling pressure in thesecond half of the year as a result of ongoinguncertainty about emerging markets generallyand the situation in Zimbabwe specifically.
In Nigeria, the energy sector registeredstrong gains, thanks to both oil and natural gasrevenues and to keen investor interest, particu-larly in the offshore sector. However, it is in-creasingly evident that progress on reforms todate has had little impact on the non-oil econ-omy. A one-year, $1 billion standby credit fromthe IMF was extended from August to Octoberdespite the government’s failure to meet impor-tant conditionalities, but especially with the ap-proach of elections in late 2002, the future ofthe reform process is uncertain.
Near-term outlookWhile many idiosyncratic factors will bear onnear-term performance, the slowdown in indus-trial countries during 2001 and sluggish recov-ery in the first half of 2002 virtually guaranteea poor out-turn for the coming year. Weak de-mand will continue to depress export pricesand volumes. However, as recovery consoli-dates in OECD trade partners, demand for theregion’s exports will strengthen setting the stagefor stronger gains in 2003. For the region as awhole, merchandise exports are expected togrow by only 2.9 percent in 2002, while termsof trade fall by 6.2 percent, equivalent to 1.8percent of GDP. The subdued external perfor-mance will hold GDP growth to 2.7 percent fora second year, again leaving per capita incomesflat. Oil prices are expected to fall to $21 a bar-rel in 2002, implying steep terms-of-trade lossesfor oil exporters of 4.1 percent of GDP; theirreal growth will average 3.1 percent, down from3.6 percent in 2001. However, other commod-
ity prices should firm on average, even thoughnon-oil exporters’ terms of trade deteriorateslightly because of higher import prices. Themodest improvement in the external environ-ment will raise non-oil exporters’ growth to 2.7percent from 2.6 percent 2001. For the SSA re-gion as a whole in 2003, the forecast antici-pates a strong acceleration in export volumegrowth to 6.4 percent, pushing GDP growth to 3.9 percent. With decent rains, the actualoutcome might be even better. Nevertheless,terms-of-trade weakness is expected to persistthrough the forecast period, especially for oilexporters, as oil prices fall further to below $20a barrel.
Despite weak energy prices, substantial in-vestment in oil exporters promises to sustainreal growth in oil sectors in the medium term.Nigeria has struggled recently to meet OPECquotas, but plans to increase capacity signifi-cantly over the next few years and a second liq-uid natural gas train at Bonny Island will boostproduction by 50 percent beginning in 2002.Meanwhile, recent offshore discoveries couldsubstantially raise medium-term productionand exports for non-OPEC Angola and Equa-torial Guinea. Even in the near term, ex-ploration and development activity—includingthe Chad-Cameroon pipeline project—is help-ing to offset terms-of-trade losses, keeping realgrowth higher than otherwise would have beenthe case. For non-oil exporters, faster worldgrowth will tighten the supply demand balancein primary commodity markets allowing exportprices and terms of trade to strengthen. In ad-dition to the rebound in the world economygenerally, export prospects will also benefitfrom a number of specific trade initiatives, in-cluding the United States’ Africa Growth andOpportunities Act (AGOA), the EU’s “Any-thing but Arms” initiative, and the EU–SouthAfrica Free Trade Agreement. Early evidencefrom the first half of 2001 shows that 13 SSAcountries benefited from $3 billion of exportsunder AGOA preferences (USTR 2001). None-theless, SSA’s medium term performance willremain subdued as a result of inelastic exportdemands and a lack of diversification.
G L O B A L E C O N O M I C P R O S P E C T S
204

Long-term prospectsOver the long term, the expectation is for acontinuation of the trend toward better eco-nomic policies and management and a broadlyfavorable external environment. Internal mar-ket reforms, deregulation, and privatizationhave raised productivity and improved incen-tives, and encouraged nontraditional exportssuch as fish and horticulture at a time whenprospects for many traditional crops are poor.Notably a number of well-managed reformershave sustained high growth even through diffi-cult external conditions. In the baseline sce-nario, which assumes a continuation of currentproductivity trends, output growth averages3.7 percent from 2004–10. With populationgrowth falling to 2.2 percent, real per capitaincome growth will average 1.5 percent, reach-ing $640 in real (1995 dollars) terms by 2010.For many countries, export diversification andfavorable price trends will sustain performancewell above the regional average.
This performance will fall short of what isneeded to achieve the international develop-ment goals, and SSA will continue to lag behindother regions in the developing world. Low do-mestic savings combined with only modest pri-
vate foreign capital inflows will limit investmentrates to an average of below 19 percent of GDP.Although up from barely 17 percent currently,this is far from what is needed. As a result, cap-ital accumulation will contribute less than 1percent annually to growth—not even a quarterof the rate anticipated for East Asia. Low ratesof human capital investment and slow progresson rebuilding infrastructure will hold produc-tivity growth to around the same rate.
Despite the somewhat pessimistic outlook, ifthe forecast is accurate the coming decade willsee the region’s best sustained performancesince the 1960s. There are manifold reasons forSSA’s historically poor performance—disease,civil strife, poor governance, inauspicious cli-mate, low savings and investment, and fallingterms of trade. Some of these conditions areunlikely to change any time soon, but for oth-ers there are signs of real improvement. Politi-cal and economic reforms have gained pacesince the mid-1980s, and are contributing tohigher standards of governance and economicmanagement. Private sector growth and in-creasing regional integration are helping toboost efficiency and rationalize production.Greater openness and debt relief are relaxing
R E G I O N A L E C O N O M I C P R O S P E C T S
205
Table A1.5 Sub-Saharan Africa forecast summary(percent per year)
Baseline forecast
Growth rates/ratios 1991–2000 1999 2000 2001 2002 2003 2004–2010
Real GDP growth 2.2 2.5 3.0 2.7 2.7 3.9 3.7Consumption per capita –0.6 0.0 0.4 0.2 0.5 0.9 1.1GDP per capita –0.4 0.0 0.5 0.3 0.3 1.6 1.5
Population 2.6 2.4 2.5 2.4 2.4 2.3 2.2Inflationa 9.7 5.3 6.3 6.0 5.0 4.5 4.1Gross Domestic Investment/GDPb 17.4 17.1 17.2 17.5 17.6 17.8 18.4Central Gvt Budget Balance/GDP –7.4 –8.1 –2.2 –3.4 –3.3 –3.2 –2.8Export Volumec 4.3 3.0 7.0 3.4 2.4 7.6 6.3Current Account/GDP –2.1 –2.2 –1.5 –1.0 –2.4 –2.0 –1.8Memorandum ItemsGDP growth: SSA excl. South Africa 2.6 3.0 2.9 3.0 2.8 4.0 4.2
Oil exporters 2.7 2.6 3.8 3.6 3.1 3.4 3.6CFA countries 2.6 2.4 2.7 2.4 2.9 3.6 3.8
a. Local currency GDP deflator; median.b. Investment ratio measure in real terms.c. Goods and non-factor services.
Source: World Bank baseline forecast, October, 2001.
balance of payments constraints, easing importrestrictions, and over time encouraging moreforeign investment interest. But even as somecountries notch up high growth rates, overallperformance will continue to be constrained bythe devastating effects of HIV/AIDS, slow prog-ress on governance in some countries, and thelimited availability of resources to rehabilitateproductive capacity and infrastructure.
Middle East and North Africa
Recent Developments
Developments in the Middle East andNorth Africa were strongly positive in2000, with a rare convergence of si-
multaneous increases in oil prices and exportvolumes contributing to stronger-than-antici-pated growth of 3.9 percent. Growth in 2001will be lower at 3.4 percent, as declines inOPEC export quotas affect oil production andincreasingly weak growth in industrial coun-tries affects demand for goods and servicesfrom the region. Short-term prospects haveweakened considerably since September 11 inthe face of a slowdown in external demand,with economic recovery in Europe and theUnited States delayed into 2002.
The oil exporters have reaped the benefits ofhigher demand and disciplined adherence toOPEC quotas, boosting both export volumeand revenue growth in 2000, with GDP growthof over 4 percent in several countries. Exportvolume growth is weaker in 2001 becauseOPEC quotas were reduced throughout theyear in an effort to target supply around a priceof $25 a barrel, with growth falling to 3.1 per-cent. The boost in revenue has fostered incomegains and led to strong growth in domestic de-mand through stronger consumption and im-port growth. Current account surpluses rose to14.9 percent of GDP in 2000 and 8.4 percent in2001. Domestic interest rates fell, and therewas an increase in investment in the oil andnon-oil sectors, with several countries also ben-efiting from higher foreign investment. Oil ex-porters have had few problems refinancing lia-
bilities. Government revenues have also bene-fited from high oil prices. Many oil exportersachieved balanced budgets or surpluses in2000, and some of that momentum has con-tinued in 2001. Governments did spend morethan previously budgeted from their revenuewindfall but most were relatively restrained,given the expenditure profiles of earlier windfallgains. For example, the Saudi government re-ceived 58 percent more revenue than budgetedin 2000 but only spent approximately 10 per-cent more than planned, with much of the extraspending being used to pay domestic arrears.
The diversified economies grew 3.4 percentin 2000, lower than their historical average.Drought conditions in Morocco, Tunisia, andthe Levant contributed to lower production andagricultural exports, despite high export marketgrowth in 2000. Additionally, domestic condi-tion in the Arab Republic of Egypt deterioratedsignificantly as the budget and current accountdeficit increased, placing pressures on interestrates, exchange rates, and domestic investment.GDP growth in the diversified exporters willrise to 4.4 percent in 2001. Morocco, whichhad a partial recovery from drought this year,accounts for the increase in GDP growth. Addi-tionally, stronger oil prices and a relief fromdrought are behind increased growth in Syria. Aweaker external environment, particularly inEurope, has affected trade prospects with fall-ing growth expected in most countries as exportmarket growth fell from 13 percent in 2000 to 1.9 percent in 2001. Workers’ remittances,tourism, and services receipts will be similarlyaffected.
Near-term outlookLooking forward, GDP growth in the region isexpected to fall to 2.9 percent in 2002 and torecover to 3.6 in 2003. The sharper downturnin industrial countries and the delayed recoveryinto mid-2002 will reduce the external impetusto growth. Slower world demand growth willkeep oil prices at the lower end of the OPECprice band (around $21 a barrel) and produc-tion and income growth will be adversely af-fected. The diversified exporters face lower
G L O B A L E C O N O M I C P R O S P E C T S
206
trading partner–import growth, and adverseimpacts on tourism from lower external incomegrowth. Growth will probably fall in 2002 to4.2 percent, but will recover along with the oilexporters in 2003, if, as anticipated, Europeand other trading partners gather momentum.
The momentum of growth in the oil ex-porters will slow in 2001–02, as weaker globalgrowth affects energy demand and OPEC keepsa tight rein on oil production quotas. Produc-tion and export volumes in 2002 are expectedto be lower than 2001 levels, thus ensuring thatexport volumes and GDP growth will declinefrom 2000 and 2001 rates. As the oil price fallsto $21 a barrel in 2002, the terms-of-tradegains made over the last several years will de-cline, and current account surpluses, whichreached 14.9 percent of GDP in 2000, will fallto 1.7 percent of GDP in 2002. Similarly, gov-ernment balances will show some deterioration,both as oil revenues fall and governments im-plement new expenditures. The Islamic Repub-lic of Iran is locked into a balanced budget rule,and, with the conservative oil price assumptionsused for budget purposes, should retain fiscalbalances. Algeria is expected to increase fiscalexpenditures greatly in 2001–02, but the oil sta-
bilization fund will be used to finance deficitsand retire debt. However, if fiscal policy be-comes too expansionary, it will be difficult tomaintain the lower interest rates and inflationthat have been apparent recently.
The windfall gains have provided opportu-nities for several oil exporters, particularly theIslamic Republic of Iran and Algeria, to amor-tize external debt and retire domestic debt. Oilexporters in the Gulf have built up foreignreserves and had few problems maintainingtheir fixed exchange rates. The Islamic Repub-lic of Iran appears on-track to unify its ex-change rate regime in the 2002/03 fiscal year;as a result, it may face a dose of imported in-flationary pressures in the forecast period. Formost countries, however, inflationary pres-sures should remain low. Interest rates in oilexporters have been falling, along with rapidgrowth in liquidity; therefore, there will becontinued support to growth from domesticdemand as demand for oil softens.
Short-term prospects in diversified export-ers are mixed. Growth is expected to averagearound 4.3 percent in 2002–03. Morocco andthe Syrian Arab Republic are expected to re-cover from the debilitating droughts of recent
R E G I O N A L E C O N O M I C P R O S P E C T S
207
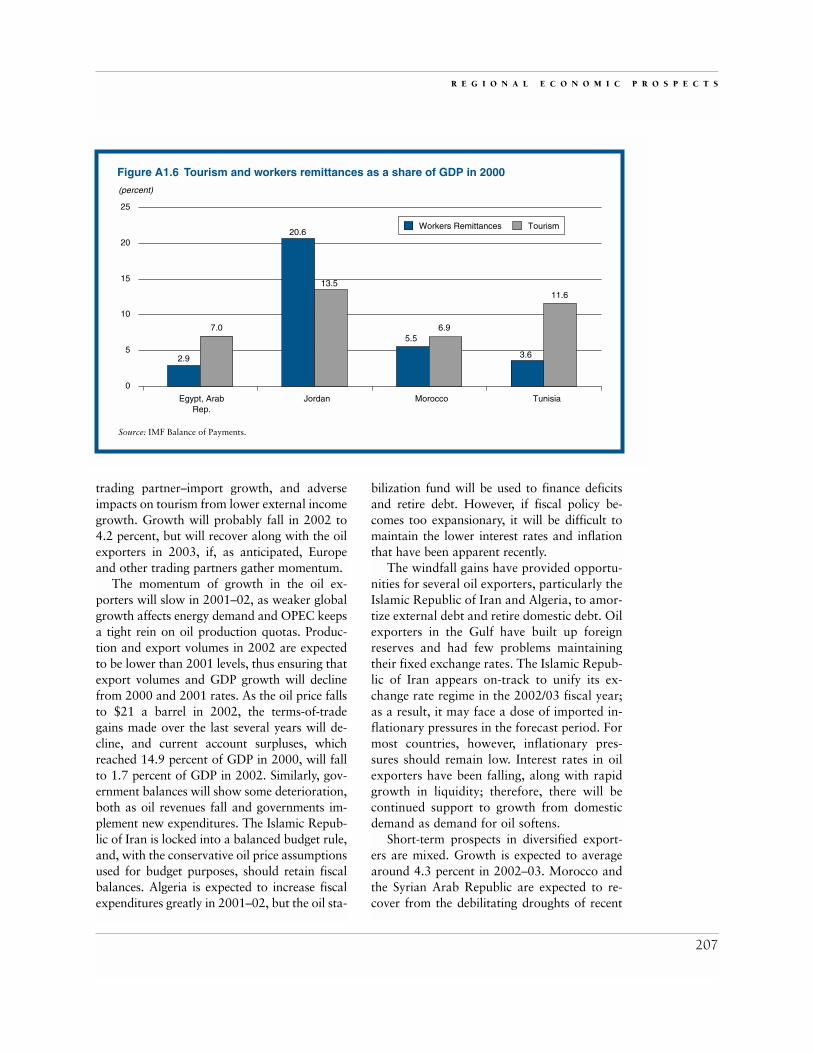
Figure A1.6 Tourism and workers remittances as a share of GDP in 2000
Source: IMF Balance of Payments.
(percent)
0
Egypt, ArabRep.
2.9
7.05.5
6.9
3.6
11.6
20.6
13.5
Jordan Morocco Tunisia
5
10
15
20
25
Workers Remittances Tourism

years, and agricultural production and exportswill provide support for growth in the nearterm. This will offset, to some extent, the ex-pected external slowdown in demand in 2001–02. The slower activity in the European econ-omy in 2001–02 will adversely affect all the di-versified exporters, with merchandise exportgrowth falling from 7 percent in 2000 to 1.9percent in 2001, before recovering to 4.9 per-cent in 2002. Jordan is enjoying a broad-basedincrease in activity, but deterioration in the ex-ternal environment (tourism, remittances, andcapital flows) could dampen growth next year.Current account deficits, which widened in re-cent years in drought-stricken countries, willremain higher than previously anticipated dueto lower export volume growth. Fiscal policy inthe drought-stricken countries has by necessitybeen somewhat expansionary to counter de-clines in agricultural incomes. Several countriesthat have signed EU Association Agreements(such as Morocco and Tunisia) have lowered or eliminated customs duties that were a sourceof revenue, placing upward pressures on fiscaldeficits. Consequently, the public sector willcontinue to play a large role in growth.
Tourism and workers’ remittances, two ofthe mainstays for diversified exporters, will
not fare well in the near term. The majority of tourists come from Europe and, with low-income growth in Europe into 2002, andconfidence eroded because of the events ofSeptember 11, tourism will suffer. Politicaluncertainty may also contribute to a decline intourism, particularly in the Levant and in Egypt.This can already be seen in Egypt, where afteran almost 15 percent rise in tourist arrivals in2000, arrivals fell by 8.1 percent in April 2001and 8.5 percent in May over the same period inthe previous year. Jordan’s tourism receipts fellby 3.6 percent in the first half of 2001 com-pared to a year ago. Tunisia and Morocco willsuffer less from the effects of the political in-stability in the Levant. Indeed, Tunisia shouldcontinue to experience some growth, and Mo-rocco is investing heavily in tourist infrastruc-ture. Remittances will remain stagnant or growvery slowly as growth slows in the near term inoil exporters, and as income growth is damp-ened in Western Europe, the main source of re-mittances for the region.
Long-term prospectsLong-term prospects in the Middle East andNorth Africa are less positive than in most otherdeveloping regions. Growth for the oil ex-
G L O B A L E C O N O M I C P R O S P E C T S
208
Table A1.6 Middle East and North Africa forecast summary(percent per year)
Baseline forecast
Growth rates/ratios 1991–2000 1999 2000 2001 2002 2003 2004–2010
Real GDP growth 3.2 2.2 3.9 3.4 2.9 3.6 3.3Consumption per capita 0.4 0.3 3.1 1.7 0.7 0.8 0.9GDP per capita 1.0 0.3 1.9 1.5 1.0 1.6 1.4
Population 2.2 1.9 2.0 1.9 1.9 1.9 1.9Inflationa 5.2 3.5 3.4 4.5 4.5 4.0 4.0Gross Domestic Investment/GDPb 22.7 22.4 23.4 23.9 24.2 24.3 25.4Central Gvt Budget Balance/GDP –1.6 –2.7 –2.5 –3.0 –2.9 –2.6 –2.2Export Volumec 5.8 13.1 6.2 3.0 4.0 5.7 4.6Current Account/GDP –1.9 –1.0 8.1 4.7 0.8 –0.9 –2.3Memorandum ItemsGDP growth: Oil exporters 2.6 1.8 3.3 2.6 2.3 3.3 2.7
Diversified exporters 4.0 3.3 3.4 4.4 4.2 4.3 4.3
a. Local currency GDP deflator; median.b. Investment ratio measure in real terms.c. Goods and non-factor services.
Source: World Bank baseline forecast, October, 2001.

porters in the long term is expected to average2.7 percent; in the diversified exporters growthis expected to average 4.3 percent. In each case,growth is only slightly higher than the averagefor the 1990s. Growth in 2004–10 for the re-gion is expected to average 3.3 percent, similarto the average of the 1990s and lower than theaverage of 3.5 percent for 2000–03. The rea-sons for the lack of acceleration of growth inthe forecast period include the real long-termdecline in oil and other commodity prices ex-pected in the next 10 years; the high level ofvulnerability of countries in the region to com-modity price and other external shocks; and thelow level of attractiveness of the region to for-eign investment outside commodity sectors.
The main external sources of growth and in-come in the region come from commodity ex-ports, tourism, and workers’ remittances. Eachof these sectors is highly vulnerable. In the long-term, energy prices are not expected to in-crease—in fact, the real crude oil price in 2010is projected to be approximately half its 2000level. On the supply side, it is expected that non-OPEC supply will grow in the next severalyears, indicating that OPEC production and ex-ports must decline in order to maintain pricesabove $20 a barrel, given expected demand con-ditions. Without further diversification in oil-exporting countries, many of which receive upto 95 percent of export revenues from hydro-carbons, the external impetus for growth seensince 2000 will diminish. The agricultural andmineral exports of the diversified exportersshould fare better as prices increase in the nextdecade, but the recovery will be slight, and willcome from the extremely low levels seen in re-cent years. In terms of agricultural exports, thescope for increasing penetration of markets islimited by the restrictions remaining on agricul-ture in the initial Association Agreements signedwith the EU by the Mediterranean countries.
Tourism receipts are an important source ofrevenue for many of the Mediterranean coun-tries but, as can be seen in the current context,they are highly vulnerable to issues concerning
political stability. Current events in Israel andthe West Bank and Gaza have affected tourism,not just in these areas but in the entire Levantand in Egypt. While countries such as Tunisiaand Morocco are making concerted efforts toimprove accommodations and service, they stillface fierce competition from other destinationsthat have lower levels of political conflict andbetter facilities and services. Remittances bynationals working in the Gulf countries and inEurope are also an important source of income,but remittances from the Gulf are not expectedto continue growing rapidly. The Gulf coun-tries have begun programs to increase the num-bers of their own nationals in their domesticworkforce, and this will certainly be at the ex-pense of non-nationals. With slower growthexpected in the oil exporters in the long term,remittances are also expected to decline or togrow very slowly.
Notes1. Dawn Internet Edition, Pakistan, September 20,
2001, http://www.dawn.com.2. The News International, Pakistan, September 20,
2001, http://www.jang.com.pk3. Support for eastward expansion of the EU has
waned markedly in existing member countries, whichwas highlighted most recently by Ireland’s June 2001“No” vote on the Treaty of Nice (which makes changesto the voting structure of the EU to accommodateexpansion).
4. Angola, Burundi, Côte d’Ivoire, Democratic Re-public of Congo, Guinea-Bissau, Kenya, Sierra Leone,and Zimbabwe. No reliable data are available forLiberia or Somalia.
ReferencesFAO (Food and Agriculture Organization of the United
Nations). 2001. “Food Supply Situation and CropProspects in Sub-Saharan Africa.” No. 2 (August).
USITC (United States International Trade Commis-sion). 2001. “Sub-Saharan Africa: Major U.S. Im-port Suppliers Under the Generalized System ofPreferences, and the African Growth and Oppor-tunity Act, Year-to-Date.” (http://reportweb.usitc.gov/africa/trade_data.html)
R E G I O N A L E C O N O M I C P R O S P E C T S
209


![PACE Supplemental Loan Agreement (Municipal Special · PDF file[Appendix C- PACE Supplemental Loan Agreement] PACE SUPPLEMENTAL LOAN AGREEMENT THIS PACE SUPPLEMENTAL LOAN AGREEMENT](https://static.fdocuments.us/doc/165x107/5aa6caf37f8b9ac8748ebd3b/pace-supplemental-loan-agreement-municipal-special-appendix-c-pace-supplemental.jpg)