APPENDIX 1 - ec. · PDF fileTable 5 East Anglia SPD allocations, ECUm, 1994 prices ... 4.0...
36
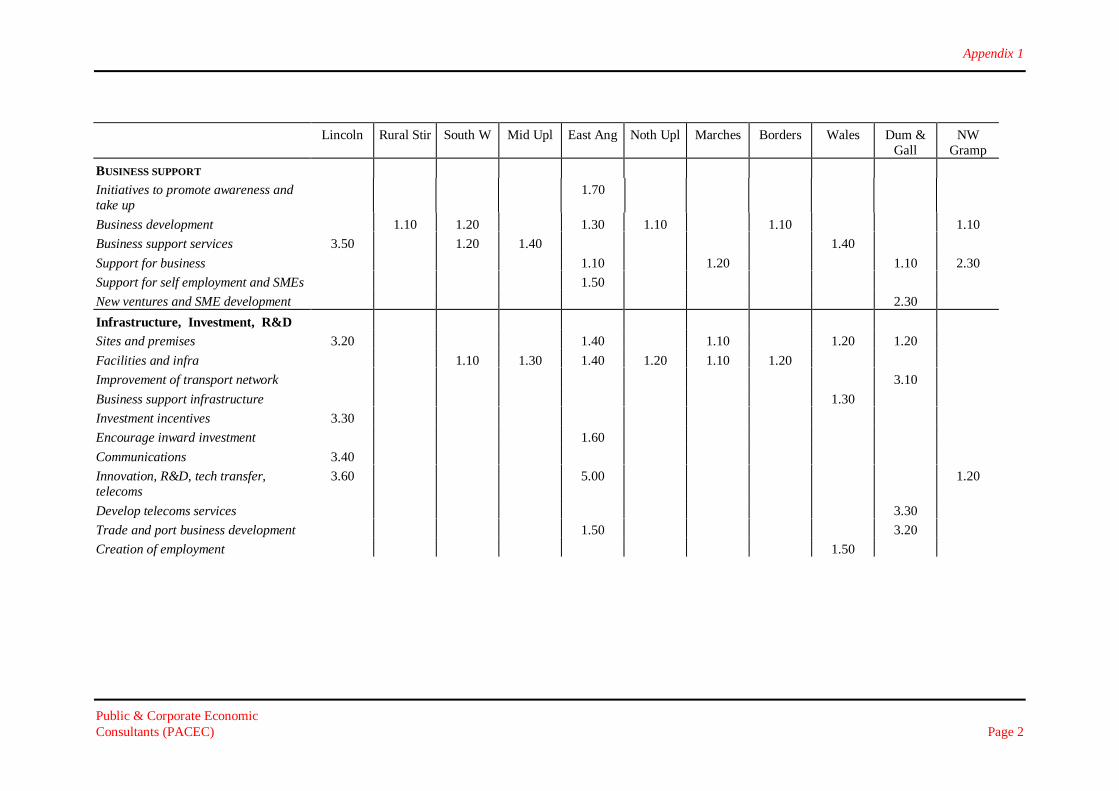
Public & Corporate Economic Consultants (PACEC) Page 1 APPENDIX 1 1. This appendix shows the method of deriving the measure groupings used throughout the report. 15 categories were derived (shown in bold below) from the measures used in each of the programmes. The categories listed within each of the main measure groupings (shown in italics) are the combined titles, where possible, for the programmes. The figures listed are the measure numbers referred to in the SPDs. The exception is East Anglia, where the SPD has called the first measure in priority one 5.2A (where 5.1 is the objective for priority one). This has been renamed 1.1 and 5.3B is called 1.2 etc. This permits a common number system for all of the programme areas.
Transcript of APPENDIX 1 - ec. · PDF fileTable 5 East Anglia SPD allocations, ECUm, 1994 prices ... 4.0...

Public & Corporate EconomicConsultants (PACEC) Page 1
APPENDIX 1
1. This appendix shows the method of deriving the measure groupingsused throughout the report. 15 categories were derived (shown in boldbelow) from the measures used in each of the programmes. The categorieslisted within each of the main measure groupings (shown in italics) are thecombined titles, where possible, for the programmes. The figures listed arethe measure numbers referred to in the SPDs. The exception is East Anglia,where the SPD has called the first measure in priority one 5.2A (where 5.1 isthe objective for priority one). This has been renamed 1.1 and 5.3B is called1.2 etc. This permits a common number system for all of the programmeareas.
Appendix 1
Public & Corporate EconomicConsultants (PACEC) Page 2
Lincoln Rural Stir South W Mid Upl East Ang Noth Upl Marches Borders Wales Dum &Gall
NWGramp
BUSINESS SUPPORT
Initiatives to promote awareness andtake up
1.70
Business development 1.10 1.20 1.30 1.10 1.10 1.10
Business support services 3.50 1.20 1.40 1.40
Support for business 1.10 1.20 1.10 2.30
Support for self employment and SMEs 1.50
New ventures and SME development 2.30
Infrastructure, Investment, R&DSites and premises 3.20 1.40 1.10 1.20 1.20
Facilities and infra 1.10 1.30 1.40 1.20 1.10 1.20
Improvement of transport network 3.10
Business support infrastructure 1.30
Investment incentives 3.30
Encourage inward investment 1.60
Communications 3.40
Innovation, R&D, tech transfer,telecoms
3.60 5.00 1.20
Develop telecoms services 3.30
Trade and port business development 1.50 3.20
Creation of employment 1.50

Appendix 1
Public & Corporate EconomicConsultants (PACEC) Page 3
Lincoln Rural Stir South W Mid Upl East Ang Noth Upl Marches Borders Wales Dum &Gall
NWGramp
Tourism Business SupportDeveloping / marketing 2.10 4.70 2.20 3.10 2.20
Farm tourism 2.20 2.30 2.40 2.30 2.40
Business support for tourism 2.20 2.20 4.50 1.30 1.30 1.30
Accommodation 4.80
Enhancement / development ofattractionsDevelopment of natural environmentattractions
1.20 4.30
Enhancement of attractions 2.10 4.20 2.10
Heritage, recreational and culturalactivities
4.10
Facilities and infrastructure fortourismFacilities and infrastructuredevelopment
1.10 2.10
Rail and inland waterway development 4.40
Business support / development inagricultureForest roads and related businessdevelopment
2.95 1.50
Marketing product development 1.20 2.30
Agriculture business support 1.10 4.10 1.10
Agriculture business development 1.30

Appendix 1
Public & Corporate EconomicConsultants (PACEC) Page 4
Lincoln Rural Stir South W Mid Upl East Ang Noth Upl Marches Borders Wales Dum &Gall
NWGramp
Diversification and development inagriculture
Diversification and development 1.20 3.1 1.1 2.10 1.30 2.10 1.40 1.40
Crop and product diversification 2.50 2.3
Woodland projects / diversification 2.70 2.1
Fisheries diversification 2.90
Infrastructure in agriculture
Productive use of physical assets 2.20
Improved training and facilities
Improving facilities / initiatives 4.20 1.40 3.30 2.20 2.20
Developing skills 4.10 3.10 3.10 2.10 2.10
Vocational guidance 3.20 1.40 2.20
Training within the local community 4.30 2.20 3.30 3.30
Training for business 3.70 1.30 1.30 1.50 1.20 1.50 1.30 3.20 1.60
Environment training 3.30 5.40 4.30
Tourism training 2.30 2.30 1.40 4.60 2.40 3.20 2.30
Agriculture training 1.50 3.20 2.60 4.30
Conservation and enhancement ofenviro
1.40 3.10 5.10 2.80 4.20 4.20 3.10 2.40 3.10

Appendix 1
Public & Corporate EconomicConsultants (PACEC) Page 5
Priorities and Measures Lincoln Rural Stir South W Mid Upl East Ang Noth Upl Marches Borders WalesDum &Gall
NWGramp
Environmental initiatives 5.30 4.10
Energy 5.20
Coastal development 2.20
River Tweed and environs 2.30
Priorities and Measures Lincoln Rural Stir South W Mid Upl East Ang Noth Upl Marches Borders WalesDum &Gall
NWGramp
Regeneration and enhancement oflocal communities
4.30 4.10 3.20 3.00
Isles of Scilly development 4.20
Improving facilities for localcommunities
2.10
Development of services andinfrastructure
3.20 3.40 3.10 3.20 2.50 3.20

Public & Corporate EconomicConsultants (PACEC) Page 6
APPENDIX 2
2. This appendix tabulates the SPD expenditure allocations individuallyby programme area. These tables were used to calculate the plannedexpenditure by measure grouping as shown in Tables 2.3 and 2.4 of the mainreport.
Table 1 Lincolnshire SPD allocations, ECUm, 1994 prices
Measure Allocation ERDF ESF EAGGF
1.0 Agriculture diversification anddevelopment
5.99
1.1 Agriculture business support measures 1.00
1.2 Agriculture marketing / productdevelopment
2.00 2.00
1.3 Business leadership, diversification skills 0.57 0.57
1.4 Environmental management 1.69 1.69
1.5 Building flexible, competent workforce 0.73 0.73
2.0 Tourism 10.32
2.1 Developing / marketing 7.00 7.00
2.2 Farm tourism 2.20 2.20
2.3 Building flexible competent workforce 1.12 1.12
3.0 Business development 32.21
3.1 Development of on farm workspace 1.76 1.76
3.2 Sites and premises 7.50 7.50
3.3 Increasing investor confidence 4.00 4.00
3.4 Improving communications 6.80 6.80
3.5 Improving business support services 5.50 5.50
3.6 Innovation, R&D, technology transfer 1.25 1.25
3.7 Building a flexible competent workforce 4.40 4.40
4.0 Human resources and communities 4.42
4.1 Developing the community workforce 1.50 1.50
4.2 Improving training and guidance facilities 1.92 1.92
4.3 Renewal and renovation schemes 1.00 1.00
5.0 Technical assistance 1.06 0.75 0.16 0.15
TOTAL 53.00 35.72 7.91 9.37
Source: SPD

Appendix 2
Public & Corporate EconomicConsultants (PACEC) Page 7
Table 2 Rural Stirling and Upland Tayside SPD allocations,ECUm, 1994 prices
Measure Allocation ERDF ESF EAGGF
1.0 Business support 11.67
1.1 Business development 8.54 8.54
1.2 Agriculture and forestry 1.00 1.00
1.3 Training and reskilling and enterprisesustainability
2.13 2.13
2.0 Tourism development 9.53
2.1 Enhancement of attractions 4.50 4.50
2.2 Business support 3.01 3.01
2.3 Training and skill development in tourism 2.02 2.02
3.0 Environment stewardship and ruraldevelopment
3.50
3.1 Conservation and enhancement of the 2.12 2.12
environment
3.2 Community development 0.62 0.62
3.3 Training 0.75 0.75
4.0 Technical assistance 0.30 0.20 0.10
TOTAL 25.00 16.87 5.00 3.12
Source: SPD

Appendix 2
Public & Corporate EconomicConsultants (PACEC) Page 8
Table 3 The South West SPD allocations, ECUm, 1994 prices
Measure Allocation ERDF ESF EAGGF
1.0 SME and business development 86.00
1.1 Facs and infra for business 45.00 45.00
1.2 Business support and development 25.00 25.00
1.3 Training 11.50 11.50
1.4 Recruitment, retention and enterprise 4.50 4.50
2.0 Tourism 47.90
2.1 Facs and infra 25.70 25.70
2.2 Tourism support and dev 10.00 10.00
2.3 Farm tourism 5.20 5.20
2.4 Tourism training 7.00 7.00
3.0 Agriculture 23.70
3.1 Development and diversification 18.00 18.00
3.2 Training in agric and horticulture skills 4.90 4.90
4.0 Community regeneration 28.30
4.1 Town and village regen and enhancement 25.30 25.30
4.2 Isles of Scilly 1.00 1.00
4.3 Training in rural communities 2.00 2.00
5.0 Environment 30.90
5.1 Protection and enhancement of the envt 11.50 11.50
5.2 Energy 4.00 4.00
5.3 Restoration and envt initiatives 13.00 13.00
5.4 Training for envt management 2.40 2.40
6.0 Technical assistance 5.40 1.10 2.90 1.40
TOTAL 219.00 145.10 32.80 41.10
Source: SPD

Appendix 2
Public & Corporate EconomicConsultants (PACEC) Page 9
Table 4 The Midlands Uplands SPD allocations, ECUm, 1994prices
Measure Allocation ERDF ESF EAGGF
1.0 Development and diversification of ruraleconomy
10.89
1.1 Agriculture dev and diversification 2.05 2.05
1.2 Developing the tourism industry 1.65 1.65
1.3 Dev econ infra and improving access toopps
4.35 4.35
1.4 Improving business support for SMEs 1.40 1.40
1.5 Building a flexible and competentworkforce
1.44 1.44
2.0 Influencing the role of community ineconomic development
0.87
2.1 Improving facilities avail to communities 0.55 0.55
2.2 Developing the community workforce 0.32 0.32
3.0 Technical assistance 0.24 0.15 0.04 0.05
TOTAL 12.00 8.10 1.80 2.10
Source: SPD

Appendix 2
Public & Corporate EconomicConsultants (PACEC) Page 10
Table 5 East Anglia SPD allocations, ECUm, 1994 prices
Measure Allocation ERDF ESF EAGGF
1.0 Business development 17.79
1.1 Support for businesses 3.95 3.95
1.2 Training support for businesses 2.10 2.10
1.3 Developing businesses 1.85 1.85
1.4 Provision of premises and infrastructure 6.90 6.90
1.5 Trade and port business development 1.27 1.27
1.6 Encourage inward investment 0.62 0.62
1.7 Initiatives to promote awareness and takeup
1.10 1.10
2.0 Agriculture and fisheries 14.50
2.1 On farm diversification assessment 2.80 2.80
2.2 Productive use of physical assets 1.71 1.71
2.3 Marketing 2.20 2.20
2.4 Farm tourism 1.00 1.00
2.5 Crop and product diversification 1.50 1.50
2.6 Skills for farm business and fishermen 1.20 1.20
2.7 Woodland projects 0.90 0.90
2.8 Environmental projects 1.50 1.50
2.9 Fisheries diversification 1.20 1.20
Programme facilitator 0.50 0.50
3.0 Human resource development 10.65
3.1 Skill training and retraining 1.90 1.90
3.2 Vocational guidance 1.50 1.50
3.3 Development of training deliverymechanisms
3.60 3.60
3.4 Community development resources 3.65 3.65
4.0 Tourism and cultural development 12.61
4.1 Heritage, recreational and culturalattractions
2.70 2.70
4.2 Settlement renewal 4.70 4.70
4.3 Natural environment attractions 1.45 1.45
4.4 Rail and inland waterway development 1.70 1.70
4.5 Advice to tourism businesses 0.31 0.35
4.6 Training 0.41 0.41
4.7 Tourism marketing and information 0.80 0.80
4.8 Tourist accommodation 0.50 0.50
5.0 Research and development 3.90 3.90

Appendix 2
Public & Corporate EconomicConsultants (PACEC) Page 11
6.0 Technical assistance 0.57 0.41 0.05 0.11
TOTAL 60.00 40.50 9.00 10.50
Source: SPD
Table 6 The Northern Uplands SPD allocations, ECUm, 1994prices
Measure Allocation ERDF ESF EAGGF
1.0 Economic development anddiversification
47.26
1.1 Advice and assistance to developbusinesses
15.39 15.39
1.2 Provision of productive and support infra 15.39 15.39
1.3 Dev of agricultural diversification 6.75 6.75
1.4 Training for business development 7.79 7.79
1.5 Support to increase self empl and dev ofSMEs
1.97 1.94
2.0 Tourism 20.24
2.1 Dev of new and improved infrastructure 11.65 11.65
2.2 Promotion and marketing of area 2.92 2.92
2.3 Development of agri-tourism 4.05 4.05
2.4 Vocational training for employees oftourism
1.62 1.62
3.0 Community development 15.91
3.1 Dev of community services andinfrastructure
8.10 8.10
3.2 Initiatives to sustain rural comm and econs 5.40 5.40
3.3 Vocational training 2.41 2.41
4.0 Environment enhancement andconservation
21.88
4.1 Improvements to the rural comm /countryside
9.72 9.72
4.2 Activities to protect / conserve enviro 10.13 10.13
4.3 Dev of skills to enhance and upgrade enviro 2.03 2.03
5.0 Technical assistance 2.71 1.62 0.41 0.68
TOTAL 108.00 64.80 16.20 27.00
Source: SPD

Appendix 2
Public & Corporate EconomicConsultants (PACEC) Page 12
Table 7 North and West Grampian SPD allocations, ECUm, 1994prices
Measure Allocation ERDF ESF EAGGF
1.0 Business support 28.15
1.1 Business development 14.00 14.00
1.2 Telecoms and technology transfer 3.00 3.00
1.3 Tourism 8.00 8.00
1.4 Agriculture and forestry sectors 3.15 3.15
2.0 Skills 7.05
2.1 Training/ skill enhancement 3.95 3.95
2.2 Self employment and business growth 2.00 2.00
2.3 Dev training / counselling infra 1.10 1.10
3.0 Environment and heritage 3.51
3.1 Enviro management and improvement 1.55 1.55
3.2 Heritage and community development 1.95 1.95
4.0 Technical assistance 0.30 0.20 0.10
TOTAL 39 28.25 6.05 4.70
Source: SPD

Appendix 2
Public & Corporate EconomicConsultants (PACEC) Page 13
Table 8 The Marches SPD allocations, ECUm, 1994 prices
Measure Allocation ERDF ESF EAGGF
1.0 Business development 20.10
1.1 Creation of non-agric employment 8.20 8.20
1.2 Support for existing and start up buss 6.00 6.00
1.3 Training for SMEs and competitiveness 5.90 5.90
2.0 Communities and countryside 6.20
2.1 Actions to increase econ dev and viability 4.10 4.10
2.2 Training for emp growth and SME dev 0.80 0.80
2.3 Develop potential in countryside 1.30 1.30
3.0 Tourism 6.60
3.1 Dev, improvement and marketing 5.20 5.20
3.2 Skill dev in tourism and related Industry 1.40 1.40
4.0 Farm related development 6.50
4.1 Agricultural facilitation 0.60 0.60
4.2 Farm diversification, dev and enviro care 5.40 5.40
4.3 Training in diversification skills 0.50 0.50
5.0 Technical assistance 0.60 0.40 0.20
TOTAL 40.00 23.90 8.80 7.30
Source: SPD

Appendix 2
Public & Corporate EconomicConsultants (PACEC) Page 14
Table 9 Rural Wales SPD allocations, ECUm, 1994 prices
Measure Allocation ERDF ESF EAGGF
1.0 Business development 103.42
1.1 Dev of ag and forestry 21.40 21.40
1.2 Dev of industrial sites and premises 23.11 23.11
1.3 Business support infrastructure 16.00 16.00
1.4 Business support services 23.11 23.11
1.5 Employ support schemes 4.80 4.80
1.6 Skills training 15.00 15.00
2.0 Tourism 53.68
2.1 Attractions and facilities 25.40 25.40
2.2 Information and marketing 10.88 10.88
2.3 Training for tourism 9.90 9.90
2.4 Agri-tourism 7.50 7.50
3.0 Countryside movement and communitydevelopment
26.00
3.1 Countryside enhancement 6.70 6.70
3.2 Rural services 16.00 16.00
3.3 Developing skills in rural communities 3.30 3.30
4.0 Technical assistance 0.90 0.60 0.30
TOTAL 184.00 115.09 33.30 35.60
Source: SPD

Appendix 2
Public & Corporate EconomicConsultants (PACEC) Page 15
Table 10 The Borders SPD allocations, ECUm, 1994 prices
Measure Allocation ERDF ESF EAGGF
1.0 Investing in business 17.50
1.1 Business development 7.30 7.30
1.2 Business infrastructure 7.70 7.70
1.3 Tourism development 2.50 2.50
2.0 Investing in integrated rural initiatives 6.20
2.1 Agric, forestry and associated communities 2.00 0.60 1.40
2.2 Coastal development 1.90 1.50 0.40
2.3 River Tweed and its environs 2.30 0.50 1.80
3.0 Investing in people 5.88
3.1 Investing in people 3.50 3.50
3.2 Creation and sustainability of empl and selfemp
2.30 2.30
4.0 Technical assistance 0.50 0.30 0.20
TOTAL 30.00 20.40 6.00 3.60
Source: SPD

Appendix 2
Public & Corporate EconomicConsultants (PACEC) Page 16
Table 11 Dumfries and Galloway SPD allocations, ECUm, 1994prices
Measure Allocation ERDF ESF EAGGF
1.0 Business development 25.70
1.1 Assistance for business 10.70 10.70
1.2 Provision of sires and premises 7.00 7.00
1.3 Development of tourism 3.50 3.50
1.4 Rural diversification programme 2.10 2.10
1.5 Forest roads 2.40 2.40
2.0 People, environment and communityaffairs
11.88
2.1 Skill dev to meet local labour market needs 4.38 4.38
2.2 Develop of training infra 1.80 1.80
2.3 New ventures and SME develop 2.30 2.30
2.4 Environmental development 1.80 1.80
2.5 Village dev and rural heritage 1.60 1.60
3.0 Communications 9.30
3.1 Improvement of transport network 4.10 4.10
3.2 Improvement of port and harbour facilities 3.70 3.70
3.3 Improve and wider use of telecoms 0.90 0.90
4.0 Technical assistance 0.72 0.60 0.12
TOTAL 47.60 33.90 6.80 6.30
Source: SPD

Public & Corporate EconomicConsultants (PACEC) Page 17
APPENDIX 3
Table 1 Actual expenditure by programme area and measure grouping, ECUm, 1994 prices
Lincolnshire RuralStirling &Tayside
SouthWest
MidlandsUplands
EastAnglia
NorthernUplands
North &West
Grampian
TheMarches
RuralWales
TheBorders
Dumfries &Galloway
Total
Business Support 3.97 1.99 17.51 1.08 4.18 11.43 8.44 1.23 13.36 3.50 1.89 68.59Infrastructure, investment, R&D 5.46 0.00 16.20 0.43 3.43 4.52 0.30 3.92 21.90 4.22 10.91 71.28Tourism business support 2.54 1.80 7.66 0.00 0.59 1.67 4.50 2.27 7.38 1.89 3.24 33.53Enhancement / development of attractions 0.00 3.14 0.00 0.68 3.77 0.00 0.00 0.00 12.39 0.00 0.00 19.97Facilities and infrastructure for tourism 0.00 0.00 11.14 0.00 0.04 5.31 0.00 0.00 0.00 0.00 0.00 16.48Business support/development inagriculture
0.72 0.00 0.00 0.00 0.67 0.00 0.00 0.13 8.89 0.00 2.12 12.53
Diversification and development inagriculture
0.00 0.21 3.08 0.34 1.25 1.27 0.14 1.90 0.00 0.28 0.00 8.45
Infrastructure 0.00 0.00 0.00 0.00 0.01 0.00 0.00 0.12 0.00 0.00 0.00 0.13Improved training and facilities 3.16 1.46 5.87 0.77 5.19 3.95 2.96 2.56 7.45 2.81 2.71 38.88Environment training 0.00 0.36 0.55 0.00 0.00 0.22 0.00 0.00 0.00 0.00 0.00 1.14Tourism training 0.31 0.88 1.17 0.00 0.09 0.45 0.00 0.00 4.35 0.00 0.00 7.25Agriculture training 0.07 0.00 0.24 0.00 0.35 0.00 0.00 0.09 0.00 0.00 0.00 0.74Conservation and enhancement 0.18 1.34 2.96 0.00 0.03 0.96 0.72 1.84 4.23 0.00 1.29 13.54Environmental initiatives 0.00 0.00 2.36 0.00 0.00 4.15 0.00 0.00 0.00 1.66 0.00 8.16Technical Assistance 0.05 0.00 0.00 0.00 0.00 0.07 0.00 0.03 0.00 0.00 0.00 11.75Regeneration and enhancement 0.21 0.22 9.05 0.27 0.36 2.69 1.78 0.00 8.48 0.00 1.37 24.43Total 16.66 11.41 77.78 3.56 19.96 36.68 18.83 14.08 88.42 14.35 23.52 325.25
Source: PACEC

Public & Corporate EconomicConsultants (PACEC) Page 18
APPENDIX 4
Table 1 Progress by indicator within the business support measure
Total progress % of target
Jobs created 3,365 16%
Jobs safeguarded 14,558 48%
Investment 1 1%
Business assisted 25,626 395%
SMEs assisted 893 20%
New businesses established 215 10%
Sites and premises 560 5%
New businesses supported 927 30%
Existing bus.support 4,308 143%
Companies exporting outside region 592 12%
Additional jobs assisted 782 78%
Total trainees 1,850
Business advice & market promotion 716
Financial support 74
Research & technical dev 51
Additional sales ECUm 1
Training facilities delivered 2 33%
Trainees accommodated 84
Jobs indirectly safeguarded 50
Counselling hours 8,666 72%
Visits to SMEs 1,356 24%
Assisted technical innovation 10 3%
New ventures offered training opportunities 1,962 98%
Additional inward investment enquires 40
No. receiving grant aid 681
Source: Interim reports

Appendix 4
Public & Corporate EconomicConsultants (PACEC) Page 19
Table 2 Progress by indicator within the infrastructure, investmentand R&D measure
Total progress % of target
Jobs created 4,429 2%
Jobs safeguarded 2,302 39%
Trainee hours(000s) 2,354
SMEs visited 44
SMEs assisted 280
No of firms in IT 5
Serviced land Ha 38 37%
New/improved workshops 100 25%
Sites with improved access 12 80%
People trained jobs 4,506 90%
Companies using new Bus Centres 1,000 100%
Businesses accommodated 25
Floorspace refurbished Msq 12,250 35%
Area business land created Ha 1
No. of constraints removed 1
Workshop units provided 1 4%
Workshop floor space provided 30 1%
Business/enterprise centres 1 25%
Bridges strengthened 17 28%
Additional enquires received from potential investors 150
Environmental enhancements 3
Enhancements to existing industrial / commercialcentres
36 50%
Businesses encouraged to improve appearance 36 50%
Telecommunication projects 2
R&D / innovation study 2
Promotional events raising awareness 1
New businesses supported 246 123%
New products / processes 17
Job opportunities 1 0%
Source: Interim reports

Appendix 4
Public & Corporate EconomicConsultants (PACEC) Page 20
Table 3 Progress by indicator within the tourism business supportmeasure
Total progress % of target
Jobs created 895 19%
Jobs safeguarded 2,560 37%
Investment 0 0%
Business assisted 1,326 57%
Businesses receiving grants 150 21%
Training places supported 103 41%
Businesses diversifying to tourism 45 36%
Attractions / accommodation established 81 90%
Businesses receiving advice on improved quality 35 18%
Private sector attractions assisted 6 100%
Public sector attractions assisted 3 13%
Minor harbours upgraded 1 33%
Visitor attractions assisted 2
TIC inquires 196,716
Value of visitor expenditure ECUm 11 114%
Leisure daytrips 104,927
Visitor trips 53,807
Tourism sector employment 232
Farm businesses participating in tourism marketingschemes
152 38%
New farm holiday products introduced 13 43%
Assistance for accommodation/other improvements 175 88%
Farm properties achieving higher grading 2 1%
Attractions-higher grading 6 23%
Annual visitor / bednights 919,276 5%
Annual visitors to 5b area 15,860 1%
Additional visitors 876,206
Promotion activities 11 37%
Companies achieving quality standards 50 21%
New farm attractions 13
Improved bedspaces 60
Diversified market appraisals 12
Source: Interim reports

Appendix 4
Public & Corporate EconomicConsultants (PACEC) Page 21
Table 4 Progress by indicator within the enhancement /development of tourist attractions measure
Total progress % of target
Jobs created 485 10%
Jobs safeguarded 855
Attractions upgraded 4 100%
New attractions 5 21%
TICs & interpretation centres 7 70%
Directional improvements 21 14%
Additional visitors 415,278 21%
Additional income 12,000 0%
Value of visitor spend 3,000,000
Regional routes for walking / cycling Km 1 2%
Visitor management schemes 1 10%
Town / village enhancement schemes 2 11%
Facilities attracting region audience 1 50%
Heritage centres provided 1 33%
Additional off-street parking spaces 20 10%
Source: Interim reports
Table 5 Progress by indicator within the facilities / infrastructurefor tourism measure
Total progress % of target
Waterway to be improved for tourism 1
Safeguarded jobs 209 8%
Resorts subject to improvements 13 130%
Visitor info facilities supported 20 100%
New / improved attractions supported 12 60%
Tourism leisure facilities supported 1 20%
Visitor / bednights 77,292 4%
Visitors to cultural / heritage attractions 298,763 24%
Visitors to leisure facilities 164 1%
Jobs created 377 29%
Source: Interim reports

Appendix 4
Public & Corporate EconomicConsultants (PACEC) Page 22
Table 6 Progress by indicator within the business support /development in agriculture measure
Total progress % of target
Jobs created 173 1%
Jobs safeguarded 1,276 14%
Roads upgraded 2 1%
Businesses assisted 56 11%
Marketing strategies prepared 1 20%
Business skills workshop 3 25%
Co-operative marketing initiatives 2
Diversification market appraisals 330
Training needs assessed 720
Businesses developed 92 1%
Business start-ups assisted 90
Additional farm income m 1
Individuals supported 90
Source: Interim reports

Appendix 4
Public & Corporate EconomicConsultants (PACEC) Page 23
Table 7 Progress by indicator within the diversification /development in agriculture measure
Total progress % of target
Businesses assisted 762 54%
Length of forestry road Km 1
Processing facilities provided 4 13%
Farms participating in group marketing schemes 536 715%
Improved non-tourist diversification ents 1 1%
Business planning studies 2 4%
Marketing groups assisted 2 20%
Jobs created 1,132 523%
Jobs safeguarded 171 1%
Businesses receiving consultancy advice 300 60%
Businesses diversified 201 80%
Consultancy support 216 72%
Diversification research projects 3 30%
Diversified land Ha 2,700 14%
Niche market opportunities 29 97%
Woodland owners involved 205 82%
Increased value added in woodland businesses £ 112,000
Broad leaf woodland under management 880
Source: Interim reports
Table 8 Progress by indicator within the infrastructure inagriculture measure
Total progress % of target
Buildings registered on database 859 172%
Source: Interim reports

Appendix 4
Public & Corporate EconomicConsultants (PACEC) Page 24
Table 9 Progress by indicator within the improving training andfacilities measure
Total progress % of target
Trainee hours(000) 2,343
Jobs created 364 23%
Jobs safeguarded 668 9%
Teleworking / resource bases provided 1 25%
College facilities developed 30 150%
Outreach facilities initiated 3 17%
Employees receiving training 4,432 106%
Unemployed receiving training 991 124%
NVQs attained 2,500 19%
Beneficiaries receiving voc guidance 15,092 76%
Businesses receiving guidance/support 1,746 55%
Bus. receiving training support 125 16%
Employees up-skilled/ re-skilled 1,811 14%
New flexible earning courses developed 11 275%
New training approaches developed 2 67%
Community based training projects 3 60%
Training infrastru projects supported 2
Trainees at new/expanded facilities 1,500
Trainees 5,972 659%
Education / Business Links 2,000
New ventures assisted 2,672
Communities given access to training 1 20%
Beneficiaries 1,708 34%
Beneficiaries trained 8,332 128%
Source: Interim reports
Table 10 Progress by indicator within the environment trainingmeasure
Total progress % of target
Businesses involved in training 60 60%
Trainees 216 50%
SVQ level 2 or equivalent 372 26%
Beneficiaries 510 26%
Source: Interim reports

Appendix 4
Public & Corporate EconomicConsultants (PACEC) Page 25
Table 11 Progress by indicator within the tourism training measure
Total progress % of target
Trainee hours(000) 1,318
Total trained 3,657 75%
NVQs or similar obtained 1,204 36%
Tourist businesses assisted 25 35%
Jobs created 248 33%
Jobs safeguarded 95 5%
Businesses involved in training initiatives 261 104%
Source: Interim reports
Table 12 Progress by indicator within the agriculture trainingmeasure
Total progress % of target
Total trainees 888 31%
NVQs attained 331 29%
Jobs maintained 259 4%
Employers involved in development of workforce 146 69%
Jobs created 19 19%
Source: Interim reports

Appendix 4
Public & Corporate EconomicConsultants (PACEC) Page 26
Table 13 Progress by indicator within the conservation andenhancement of the environment measure
Total progress % of target
Jobs created 16 16%
Jobs safeguarded 18
Businesses contacted 500 28%
New initiatives promoted 45 150%
Collaborative groups formed 25 100%
Bus.given advice and tech guidance 385 35%
Improvement projects 49 104%
Conservation enhancement projects 12 33%
New footpaths / bridleways / cycleways 31 156%
Land environmentally improved Ha 35
Plans for environmental planning 43 80%
Jobs created/safeguarded 1
Projects promoting environ management 2 25%
Farm conservation /land management plans 10 20%
New interpretation facilities 18 90%
Solway Firth strategy 1
Length of countryside way 51 26%
Length of coastline / estuary Km 86 6%
Waste / pollution appraisals undertaken 6 3%
Waste composting facilities supported 1 20%
Source: Interim reports
Table 14 Progress by indicator within the environmental initiativesmeasure
Total progress % of target
Businesses assisted 1
Conservation management projects 1
Visitor attraction facilities assisted 1
Environmental surveys / studies assisted 17
Derelict / contaminated land physically improvedHa
3 6%
Existing industrial land environmentally enhancedHa
32 160%
Source: Interim reports

Appendix 4
Public & Corporate EconomicConsultants (PACEC) Page 27
Table 15 Progress by indicator within the regeneration /enhancement of local communities measure
Total progress % of target
Jobs created 424 12%
Jobs safeguarded 318 4%
Investment 0 2%
Business assisted 168 88%
Community projects 37 9%
Village renewal schemes 2 6%
Community business 5 83%
Communities benefiting from new facilities 27 34%
New horticultural products developed 2 100%
Inter agency partnership groups created 3 25%
New businesses established 8 67%
Community development plans 3 25%
Source: Interim reports
Table 16 Progress by indicator - all measures
Total progress % of target
Jobs created 12,168 3%
Jobs safeguarded 23,958 26%
Businesses assisted 42,780 87%
Trainees 35,277 98%
Visitor attractions assisted 40 60%
Visitor trips 950,231 12%
Annual visitors 1,811,342 3%
Diversification projects 3 30%
Improvement projects 67
New country paths Km 31
Land improved Ha 35 49%
Community projects 69 19%
Source: Interim reports

Public & Corporate EconomicConsultants (PACEC) Page 28
APPENDIX 5
Table 1 Physical progress by programme and measure grouping, % of targetWales Dumfries
GallowayLincoln Rural
StirlingEast Anglia Northern
UplandsGrampia Total
Business support
Jobs created 61% 23% 5% 67% 4% 95% 31%
Jobs safeguard 174% 29% 66%
Business assist 412% 31% 20% 67% 10% 176%
Infra, invest, R&D
Jobs created 18% 16% 2% 7%
Jobs safeguard 7% 43% 27%
Jobs created/safeg 26% 26%
Trainees 327% 327%
Landserviced/refurb
1% 1%
Sitesestab/improved
4% 360% 66%
Tourism bus supp
Jobs Created 18% 5% 12% 14%
Jobs Safeguard 52% 113% 57%
Business Assist 111% 2% 24%
Attract. assist 31% 31%
Annual Visitors 104% 22% 39%
Dev of attract
Jobs Created 10% 10%
Attract. assist 88% 88%
Facilities/infra fortourism
Jobs Created 8% 8%
Jobs Safeguard 9% 9%

Appendix 5
Public & Corporate EconomicConsultants (PACEC) Page 29
Wales DumfriesGalloway
Lincoln RuralStirling
East Anglia NorthernUplands
Grampia Total
Ag bus sup
Jobs Created 1% 1%
Jobs Safeguard 14% 14%
Jobs created/safeg 60% 60%
Business Assist 61% 0% 0% 23%
Infra in ag
Buildings registered 87% 87%
Ag diversif
Diversif projects 0%
General training
Jobs Created 180% 108%
Business Assist 65% 1% 17%
Trainees 1000% 34% 19% 48% 47%
Environmenttraining
Business involved 60% 60%
Trainees 50% 50%
NVQ level II 126% 126%
Tourism training
Business assisted 35% 35%
Trainees 255% 45% 32% 26% 132%

Appendix 5
Public & Corporate EconomicConsultants (PACEC) Page 30
Wales DumfriesGalloway
Lincoln RuralStirling
East Anglia NorthernUplands
Grampia Total
Environmentenhancement
Jobs Created 16% 1% 6%
Jobs Safeguard 14% 14%
Business Assist 0% 35% 2%
Improvement proj 20% 61% 31%
Land improved 26% 156% 152%
Enviro initiatives
Jobs Created 0% 0%
Jobs Safeguard 0% 0%
Local communities
Jobs Created 2% 55% 3%
Jobs Safeguard 10% 10%
Business Assist 82% 67% 81%
Commu Project 6% 500% 20% 9% 25%
Source: PACEC / Interim reports* Percentage is calculated from the progress of those giving targets

Public & Corporate EconomicConsultants (PACEC) Page 31
APPENDIX 6
Table 1 Gross impact by programme and measure groupingWales Dumfries &
GallowayLincoln Rural
StirlingEast
AngliaNorthernUplands
Grampian Total
Business support
Jobs created 919 454 20 200 311 40 400 2344
Jobs safeguard 552 3484 1731 250 1 550 6568
Business assist 24962 3353 177 580 457 340 29869
Trainees 1850 84 1934
Infra, invest, R&D
Jobs created 245 6 3 60 314
Jobs safeguard 534 35 260 829
Jobs created/safeg 1793 5 1798
Business assist 324 324
Trainees 2947 2974
Landserviced/refurb Sqm
30 30
Sitesestab/improved
1 18 19
Tourism bus supp
Jobs created 218 18 140 376
Jobs safeguard 1739 340 2079
Jobs created/safeg 150 150
Business assist 12 87 300 24 423
Attract. assist 9
Addit annualvisitors
68415 45000 55000 168415

Appendix 6
Public & Corporate EconomicConsultants (PACEC) Page 32
Wales Dumfries &Galloway
Lincoln RuralStirling
EastAnglia
NorthernUplands
Grampian Total
Dev of attract
Jobs created 209 209
Jobs safeguard 398 398
Jobs created/safeg 150 150
Attract. assist 9 7 7
Addit visit. trips 100000 100000
Facilities/infra fortourism
Jobs created 82 82
Jobs safeguard 79 79
Ag bus sup
Jobs created 16 16
Jobs safeguard 723 723
Jobs created/safeg 180 180
Business Assist 182 182
Ag diversif
Diversif projects 1 1
Infra in agricul
Buildings registered 434 434
General training
Jobs created 180 19 199
Jobs safeguard 300 300
Business assist 260 6 266
Trainees 10870 1708 235 1662 2372 16847

Appendix 6
Public & Corporate EconomicConsultants (PACEC) Page 33
Wales Dumfries &Galloway
Lincoln RuralStirling
EastAnglia
NorthernUplands
Grampian Total
Environmenttraining
Business involved 60 60
Trainees 200 16 216
NVQ level II 63 63
Tourism training
Business assisted 25 25
Trainees 5095 401 400 102 463 6461
Ag training
Trainees 13 13
Environmentenhancement
Jobs created 16 2 18
Jobs safeguard 18 50 68
Jobs created/safeg 1 1
Business assist 25 25
Improvement proj 10 37 47
Land improved Sqm 82 381000 381082
Enviro initiatives
Jobs created 169 169
Jobs safeguard 2 2
Local communities
Jobs created 56 1 43 100
Jobs safeguard 186 186
Business assist 124 8 132
Commu project 2 30 2 1 5 39
Source: PACEC / Interim reports

Public & Corporate EconomicConsultants (PACEC) Page 34
APPENDIX 7
Table 1 Summary of synergies between structural funds andpriorities
Measuregrouping
LN ST SW MU EA NU NWG MA RW BD DG
B1 1 3 1 1 1,2 1 1 1 1 1 1
B2 1 - 1 1 1 1 1 1 1,2 1 1
T1 1,2 1 1,3 - 1,3 1,3 1 1,2 1,3 1 1
T2 - 1 - 1 1 - - - 1 - -
T3 - - 1 - 1 1 - - - - -
A1 3 - - - 3 - - 3 3 - 3
A2 - 3 3 3 3 3 3 1,3 - 1.3 3
A3 - - - - 1 - - - - - -
S1 1,2 2 2 2 1,2 2 2 2 2 2 1,2
S2 - 1,2 2 - - 2 - - - - -
S3 2 2 2 - 2 2 - 2 2 - -
S4 2 - 2 - 2 - - 2 - - -
E1 3 3 3 - 3 3 3 3 3 - 3
E2 - - 1,3 - - 1 - - - 1 -
C1 1 1 1,3 1 1 1,3 1 - 1 - 1
Source: SPDs

Appendix 7
Public & Corporate EconomicConsultants (PACEC) Page 35
Key to measure titles / fund codes used in Table 1
Measure grouping Code Fund Code
Business Support B1 ERDF 1
Infrastructure, investment, R&D B2 ESF 2
Tourism business support T1 EAGGF 3
Enhancement / development of attractions T2
Facilities and infrastructure for tourism T3
Business support/development in agriculture A1
Diversification and development in agriculture A2
Infrastructure A3
Improved training and facilities S1
Environment training S2
Tourism training S3
Agriculture training S4
Conservation and enhancement E1
Environmental initiatives E2
Regeneration and enhancement C1
Technical Assistance TA

Public & Corporate EconomicConsultants (PACEC) Page 1