Appendices to Draft UK Reference Period 3 Performance Plan ...publicapps.caa.co.uk/docs/33/CAP...
67
Consumer and Markets Group Appendices to Draft UK Reference Period 3 Performance Plan proposals For consultation CAP 1758A
-
Upload
phunghuong -
Category
Documents
-
view
214 -
download
0
Transcript of Appendices to Draft UK Reference Period 3 Performance Plan ...publicapps.caa.co.uk/docs/33/CAP...

Consumer and Markets Group
Appendices to Draft UK Reference Period 3
Performance Plan proposals
For consultation
CAP 1758A

Published by the Civil Aviation Authority, 2019
Civil Aviation Authority
Aviation House
Gatwick Airport South
West Sussex
RH6 0YR
You can copy and use this text but please ensure you always use the most up to date version and use it in
context so as not to be misleading, and credit the CAA
First published 2019
Enquiries regarding the content of this publication should be addressed to: [email protected]
The latest version of this document is available in electronic format at: www.caa.co.uk

CAP 1758A Contents
February 2019 Page 3
Contents
Contents 3
Appendix A: Abbreviations 4
Appendix B: Pensions 8
Appendix C: Financeability 15
Appendix D: Cost of capital 25
Appendix E: Service quality metrics – additional information 55
Appendix F: Costs reporting tables 62

CAP 1758A Appendix A: Abbreviations
February 2019 Page 4
Abbreviations
Abbreviations
3Di metric that incorporates flight path inefficiencies
ACP Airspace Change Proposals
ADS-B automatic dependent surveillance – broadcast system
AIS aeronautical information services
AMS Airspace Modernisation Strategy
ANS air navigation services
ANSL Air Navigation Solutions Ltd
ANSP air navigation services provider
ASEPS advanced surveillance enhanced procedural separation
ASBU Aviation System Block Upgrades
ATC air traffic control
ATCO air traffic control officer
ATS air traffic services
ATSA air traffic services assistant
ATFCM air traffic flow and capacity management
ATFM Air Traffic Flow Management
ATM Air Traffic Management
BAATL Birmingham Airport Air Traffic Ltd
C1 key performance indicator in the area of capacity - average minutes of
ATFM delay
C2 performance indicator in the area of capacity - average minutes of
ATFM delay attributable to NERL
C3 performance indicator in the area of capacity - delay impact score
C4 performance indicator in the area of capacity - daily excess delay score
CAAPS CAA Pension Fund
CAPM capital asset pricing model
CCWG Customer Consultation Working Group
CDO Continuous Descent Operation
CEPA Cambridge Economic Policy Associates
CNS Communication Navigation Surveillance

CAP 1758A Appendix A: Abbreviations
February 2019 Page 5
Abbreviations
CPI consumer price index
CSU chargeable service unit
DB defined benefit
DC defined contribution
DfT Department of Transport
DMO Delivery Monitoring and Oversight
DUC determined unit cost
EoSM Effectiveness of Safety Management
EU European Union
FAB Functional Airspace Block
FAS Future Airspace Strategy
FIR flight Information Region
FMARS future military area radar service
FTE full time equivalent
GAD Government Actuary’s Department
GANP Global Air Navigation Plan
GDP Gross Domestic Product
HAL Heathrow Airport Limited
IAG International Airlines Group
IBP Initial Business Plan
ICAO International Civil Aviation Organisation
IFR instrument flight rules
IR independent reviewer
KEA horizontal en route flight efficiency of the actual trajectory indicator
KEP horizontal en route flight efficiency of the last filed flight plan
KPA key performance area
KPI key performance indicator
LAMP London Airspace Management Programme
MOCCA Met Office Civil Contingencies Aircraft
LIBOR London Inter Bank Offered Rate
MOD Ministry of Defence
NATS National Air Traffic Services
NATSPG North Atlantic System Planning Group
NERL NATS (En Route) plc

CAP 1758A Appendix A: Abbreviations
February 2019 Page 6
Abbreviations
NM Network Manager
NOP Network Operations Plan
NPV net present value
NSA National Supervisory Authority
NSL NATS Services Ltd
OEF Oxford Economics forecast
OFF Opex Flexibility Fund
OTS organised track system
PBO Pensions Benefit Obligation
PBN Performance Based Navigation
PI Performance Indicator
PRB Performance Review Body
RAB Regulatory Asset Base
RBP Revised Business Plan
RFR risk free rate
RPS Regulatory Policy Statement
RP2 Reference Period 2
RP3 Reference Period 3
RP4 Reference Period 4
RORE return on regulated equity
RPI retail prices index
S&P Standard & Poor’s
SARG Safety and Airspace Regulation Group
SES Single European Sky
SESAR Single European Sky ATM Research
SIP Service and Investment Plan
SSP State Safety Programme
STATFOR (Eurocontrol's) Statistics and Forecasts Service
TANS terminal air navigation services
TMR total market return
TSU total service units

CAP 1758A Appendix A: Abbreviations
February 2019 Page 7
Abbreviations
UIR upper information region
UPR user preferred routes
VAAC Volcanic Ash Advisory Centre
WACC weighted average cost of capital
WAFS World Area Forecast System

CAP 1758A Appendix B: Pensions
February 2019 Page 8
Pensions
Introduction
B1 Pension costs (and in particular Defined Benefit or DB pension costs) represent
a significant portion of NERL's staff costs (around 25% in RP3) and are a
significant issue for all stakeholders.
B2 Pension costs include Defined Contribution, or DC, scheme employer
contributions, DB scheme contributions, contributions to repair the DB scheme
deficit and contributions to a pension cash alternative for members who opted
out of the DB scheme
B3 The benefits for existing members in the DB scheme are subject to strong legal
protections put in place at the time that NATS was transferred from 100%
Government ownership to a Public Private Partnership. The restriction on the
Scheme’s amendment power broadly prevents an amendment being made to
reduce or stop the future accrual of benefits in the Scheme for existing members
and limits the scope for reducing benefits.
NERL’s RP3 business plan
B4 For the DB scheme, NERL’s projected contributions represent NERL’s share of
the NATS group scheme and reflect the outcome of the trustees’ valuation as at
31 December 2017 (the 2017 valuation). UK legislation requires actuarial
valuations of pension schemes to be made on the basis of prudent assumptions
on a regular basis (usually every three years).
B5 The 2017 valuation reported a DB scheme deficit of £270 million at the end of
2017, a significant reduction in the £459m deficit reported following the 2015
valuation, driven by investment returns and demographic factors. This has
enabled NERL and the pension fund trustees to reduce the required deficit repair
payments per year. In NERL’s RP3 business plan, deficit repair payments are
forecast to end in 2023, with investment returns forecast to close the remaining
deficit by the recovery end date of 2026. However, the reduction in real interest
rates since the 2015 valuation increased the cost of future benefit accrual from
31.8% of pensionable pay at the 2015 valuation to 41.8% of pensionable pay.
B6 While there has been no change to benefits since RP2, NERL had previously
taken steps to manage scheme costs by:
▪ closing the scheme to new entrants with effect from 31 March 2009;
CAP 1758A Appendix B: Pensions
February 2019 Page 9
▪ increasing benefits accrued after 31 October 2013 with respect to the
Consumer Prices Index (CPI) rather than the Retail Prices Index (RPI). CPI is
expected to increase by less than RPI on average over the long term;
▪ capping general pensionable pay increases to a maximum of CPI + 0.25% a
year in the period 2013 to 2024; and
▪ requesting that trustees retain CPI as the basis of annual pay increase
assumptions for the calculation of future liabilities, rather than CPI + 0.25%
due to the trend in actual pay awards.
B7 NERL estimated that due to the 2013 changes in indexation and the pensionable
pay cap, NERL avoided cost increases in RP2 of around £200 million.
B8 NERL has also introduced a pension cash alternative in lieu of employer pension
contributions for staff opting out of the DB scheme. This pension cash alternative
has a cost of 28.5% of pensionable payroll, compared with 41.8% for DB scheme
members, which NERL estimates has saved around £10 million p.a. based on
opt-outs at the end of 2017.
B9 Over the longer-term, NERL has set out that it is targeting funding the DB
scheme on a long-term low-risk basis. If a surplus arises, NERL has stated that it
will work with trustees to strike an appropriate balance between the opportunity
to de-risk the scheme towards an appropriate long-term investment strategy and
reducing the projected level of future pension contributions.
B10 Since the closure of the DB scheme in April 2009, new employees are on a DC
scheme where NERL matches employee contributions on a 2:1 basis up to 18%
of pensionable pay. During RP3, NERL forecasts an average cost of the DC
scheme of 15% of pensionable pay based on actual costs incurred during RP2.
Government Actuary’s Department review
B11 To support these draft proposals, we commissioned GAD to review certain
aspects of NERL’s pension arrangements.1 This review focused on NERL’s DB
scheme benefits, investment strategy, funding valuation assumptions, projected
pension contributions, and governance and expenses. GAD also carried out a
high-level review of NERL’s DC scheme against other UK pension schemes.
B12 In its review, GAD found that the NATS pension scheme benefits are more
generous than those provided by typical UK private sector DB schemes, but
there is limited scope to change the benefits due to protections in place under
the scheme’s Trust Deed and Rules, the ‘Trust of a Promise’ document and the
‘Memorandum of Understanding’. GAD’s approximate calculations suggest that if
the NATS pension scheme benefits were to be more typical of UK schemes, all
1 Government Actuary’s Department, Analysis of pension costs for NATS (En Route) plc (September 2018).

CAP 1758A Appendix B: Pensions
February 2019 Page 10
else being equal the employer standard contribution rate could be around 30% of
pensionable pay instead of the 41.8% assessed at the 2017 funding valuation.
This would result in NERL’s pension contributions being around £12 million lower
per year during RP3 (in 2017 CPI prices).2
B13 On the 2017 valuation, GAD concluded that the assumptions are within a broadly
reasonable range compared to wider practice given the investment strategy and
assessed employer covenant strength. However, GAD said the CAA could
consider whether the current level of prudence is optimal and aligns with an
appropriate long-term strategy for the scheme.
B14 Looking to future valuations, GAD estimated that if neutral estimate investment
returns are achieved on the scheme assets then a surplus is expected to emerge
during 2022, though depending on scheme experience and market conditions, a
surplus may emerge earlier or later than this. In the event of a surplus at a future
valuation, GAD understood that priority might be given to de-risking the
investment strategy if the trustees are supportive of this approach. De-risking the
investment strategy should reduce the likelihood of materially higher deficit
recovery payments being required in the future, though in the short to medium
term it could lead to higher contributions and therefore costs to consumers if the
discount rate is reduced as a consequence of the de-risking.
B15 GAD highlighted the following areas which the CAA may wish to consider within
its assessment of pension costs:
▪ the extent to which benefits accrued before 31 October 2013 can be indexed
with respect to CPI instead of RPI;
▪ the application of any future surplus within the scheme, whether used to de-
risk the scheme or reduce future contributions;
▪ the mechanism for adjusting pension costs under the EU charging regulation
391/2013, which set out details of the pension cost pass-through;
▪ engaging with NERL on an appropriate long-term investment strategy;
▪ whether any actions can be taken in order to strengthen the trustees’
assessment of the long-term employer covenant;
▪ whether the level of prudence in the valuation assumptions strikes the right
balance between the interest of consumers and the long-term strategy of the
scheme;
▪ that the regulated proportion of 76% (and the underlying salary projections)
that informs the pension contribution projections in the initial business plan,

CAP 1758A Appendix B: Pensions
February 2019 Page 11
are correct and consistent with data and analysis supporting the wider price
control review; and
▪ whether the administrative costs incurred represent value for money.
B16 We set out its initial views on these points below.
B17 In its RP3 business plan, NERL states that at this time the trustees do not
believe it is appropriate to move away from RPI for past service indexation, but
that the trustees would confirm this decision or otherwise following the Supreme
Court’s judgement for another scheme where the lawfulness of a change in
indexation was being tested.
B18 We understand that this is a reference to the Supreme Court judgement in
Barnado’s (Appellant) v Buckinghamshire and others (Respondents), which was
subsequently published in November 2018.3 While we understand that the
Supreme Court judgement found that the scheme drafting did not empower the
trustees to select CPI as an alternative index to RPI for scheme benefits, the
case appears to highlight that cases are very much to be judged on their own
scheme drafting, rather than setting principles of general application. We note
that the wording in the NATS Scheme rules around indexation is different, so
from our initial review there does not appear to be a direct read-across to the
indexation of benefits before 31 October 2013 in the NATS Scheme.
B19 We understand that a switch to CPI for past pensionable service may benefit
customers through lower pension deficit payments, so is a potential area for
NERL to reduce pension costs further. We also recognise that it is the
responsibility of trustees and NERL to manage the NATS pension scheme
effectively, including considering the implications from decisions around
indexation for DB scheme members as well as customers. A stated above, we
understand from NERL’s RP3 business plan that trustees have not yet confirmed
their decision on indexation.
B20 Bearing this in mind, we have not sought to reflect any potential change in
indexation in these draft proposals for the RP3 pension costs. We will ask NERL
to provide further information on the trustees’ decision and evidence to
demonstrate that NERL has worked with trustees to take actions to manage and
mitigate the pension cost burden to customers, consistent with our guidance to
NERL on preparing its business plan for RP3.
B21 Based on the GAD report, we understand that there is a reasonable likelihood of
a surplus arising on the DB pension scheme during RP3. For example, the GAD
report concludes that if neutral estimate investment returns are achieved on the
3 The Supreme Court, Judgement on Barnardo’s (Appellant) v Buckinghamshire and others (Respondents),
Michaelman Term [2018] UKSC 55 (7 November 2018).

CAP 1758A Appendix B: Pensions
February 2019 Page 12
scheme assets then a surplus is expected to emerge during 2022. The likelihood
of a surplus will also rise if future valuations reflect discount rates more towards
the upper quartile or frontier of the Pension Regulator benchmarks in GAD’s
report, or if there is a change in the indexation of past service liabilities to CPI.
B22 We do not consider that NERL’s RP3 business plan provides sufficient
information on how the risk of trapped surplus and any associated high-cost de-
risking would be managed in a way that is in the interest of consumers. In
particular, GAD concluded that NERL and trustees appear to prefer to prioritise
further de-risking, though it is not clear whether this has been informed by
customer views given the potential implications for costs in the short, medium
and longer term. NERL should further consider and engage on its longer-term
strategy for pension costs to ensure the interests of consumers are appropriately
considered.
B23 To reduce the risk of consumers unnecessarily funding a trapped surplus, our
draft proposals remove the allowance for DB scheme deficit repair payments
from 2022, which is the first year when we would expect deficit payments to be
set based on the 2020 valuation. However, we understand that NERL will
continue to have strong protections around pass-through of DB pension costs
under the performance regulation. This means that any efficient DB deficit repair
payments that are required from 2022 due to observed financial market
conditions being worse than expected should be eligible for recovery.
B24 The performance regulation will retain the strong protections for the pension cost
pass-through in RP2. This allows NERL to recover unforeseen and significant
changes in pension costs resulting from unforeseen changes in national
pensions law, pensions accounting law or financial market conditions. Changes
in pension costs must be outside the control of NERL and NERL must have
taken reasonable measures to manage cost increases.
B25 We have reflected these strong protections in making our judgements on NERL’s
cost of capital for NERL for RP3.
B26 We understand that NERL engages proactively with trustees on the longer-term
strategy for pension costs. As set out above, we also consider that NERL should
consider and engage more proactively with consumers on the longer-term
strategy for pension costs, including the investment strategy, to ensure their
interests are appropriately considered. We will consider this in any future
assessment of the efficiency of pension costs.
B27 As part of its RP3 business plan, NERL proposed that we should provide a
Regulatory Policy Statement (RPS) on pension costs to help improve the
strength of the employer covenant and facilitate a lower pension cost for
customers. These matters are discussed further in chapter 5 of the main
document.

CAP 1758A Appendix B: Pensions
February 2019 Page 13
B28 Based on the GAD report, we understand that there may be opportunities for
future DB pension scheme valuations to be based on a moderated (but still
reasonable) level of prudence, which should properly reflect the strong regulatory
protections around pension costs in the performance regulation.
B29 Our draft proposals are intended to provide additional challenge to NERL to
identify ways to further mitigate DB pension costs ahead of the 2020 valuation,
including considering the appropriate level of prudence.
B30 We have reviewed staff costs and pension costs as part of these RP3 draft
proposals. We have not identified any concerns with NERL’s allocation of
pension costs.
B31 We recognise that management of the NATS Scheme and administration costs
are the responsibility of trustees. We would welcome further evidence to support
its administrative costs in response to GAD’s findings.
CAA’s draft proposals for pension costs in RP3
B32 As set out in chapter 5, we have proposed a reduction in the DB deficit repair
costs by £36 million over RP3, as well as a further reduction in ongoing DB and
DC pension costs by £12 million in RP3 as a result of wider assumptions on
operating costs efficiencies. There is also a minor change from our revised
assumptions for CPI inflation. Our projections of pension costs are summarised
in the table below.

CAP 1758A Appendix B: Pensions
February 2019 Page 14
Table B.1 – CAA’s draft proposal for en-route pension costs (£m, 2017 CPI prices)
2020 2021 2022 2023 2024 RP3 total
NERL’s RP3 business plan 89.2 88.5 87.3 85.3 65.6 415.8
Defined benefit pension 62.3 61.2 60.0 58.2 38.7 280.6
Defined contribution pension 10.9 12.1 13.1 13.8 14.8 64.7
Pension cash alternative 15.9 15.1 14.2 13.2 12.1 70.5
CAA’s draft proposals 88.1 86.7 67.0 64.3 62.1 368.2
Defined benefit pension 61.7 60.1 40.7 38.4 36.7 237.6
Defined contribution pension 10.8 11.8 12.6 13.2 14.0 62.4
Pension cash alternative 15.7 14.7 13.7 12.6 11.4 68.2
Difference -1.1 -1.8 -20.3 -21.0 -3.5 -47.6
Defined benefit pension -0.7 -1.1 -19.3 -19.8 -2.1 -42.9
Defined contribution pension -0.2 -0.3 -0.5 -0.6 -0.8 -2.4
Pension cash alternative -0.2 -0.4 -0.5 -0.6 -0.6 -2.3
Source: CAA analysis of NERL’s RP3 business plan

CAP 1758A Appendix C: Financeability
February 2019 Page 15
Financeability
Introduction
C1 The CAA has a statutory duty under Transport Act 2000 to ensure that NERL will
not find it unduly difficult to finance its licensed activities. NERL’s licence also
includes a requirement for NERL to use all reasonable endeavours to ensure
that it maintains at all times an investment grade issuer credit rating.
C2 In addition, NERL’s licence includes a gearing cap of 65%. That is, if gearing
exceeds 65% it would be prohibited from paying dividends or making any cash
payments to affiliates except if these satisfy specific criteria.
C3 Our business plan guidance asked NERL to provide evidence that its business
plan (including both in respect core and wider requirements) is financeable using
a broad interpretation of financeability that looks beyond simple credit metrics
and acknowledges the wider context of agencies’ rating assessments. In
particular, rating agency methods draw from a broad consideration of the
operating and risk environment a company operates and finances in, not just the
credit metrics.
C4 NERL and its existing bonds are rated by Moody’s and Standard & Poor’s (S&P)
credit rating agencies. In their latest credit reports, both Moody’s and S&P
assigned NERL a relatively strong investment grade rating of A2 and A+
respectively.4 This reflects NERL’s strong financial performance due to strong
and stable cash generation, relatively low debt level and traffic incentive that
limits downsides in revenue. It also includes one notch uplift due to likelihood of
extraordinary government support.
NERL’s RP3 business plan
C5 In its RP3 business plan, NERL set a target credit rating in the range of A2/A to
A3/A-. This is a strong investment grade credit rating that is consistent with
NERL’s current rating from Moody’s and is one notch below NERL’s current
credit rating from S&P. NERL considers that a higher target credit rating would
not be in the interest of customers (given the potential costs involved which it
4 Moody’s, NATS (En Route) plc Credit Opinion (November 2017); and S&P Global Ratings, NATS (En Route)
plc (December 2017).

CAP 1758A Appendix C: Financeability
February 2019 Page 16
would seek to recover from its customers) and that a lower credit rating would be
inconsistent with the gearing “target”5 and cap in NERL’s licence.
C6 Based on its interpretation of published guidance from Moody’s and S&P NERL
has suggested that for:
▪ Moody’s: an adjusted net debt / RAB ratio above 70% would indicate a
possible downgrade and a ratio below 60% would indicate a possible
upgrade; and
▪ S&P: a ratio of funds from operations (FFO) to S&P adjusted net debt of
below 18% would indicate a possible downgrade.
C7 NERL has also reviewed the RP3 business plan against other credit metrics
(adjusted interest cover and FFO to net interest payable), its own financial
covenants and return on regulatory equity (RORE).
C8 NERL has modelled upside and downside scenarios against a number of traffic,
cost, incentive and macroeconomic factors using Monte Carlo simulations, and
considered qualitative factors such as NERL’s licence, Brexit and NERL’s
regulatory framework. NERL assesses that its business plan is financeable.
CAA’s approach to assessing financeability
C9 We have assessed the financeability of these draft proposals in line with our
duties and NERL’s licence requirements. Our financeability assessment takes
account of our proposals for changes to the forecasts in NERL’s RP3 business
plan for operating costs, traffic, non-regulatory income and allowed return.
C10 We consider that NERL’s high-level approach to assessing financeability is
broadly appropriate, using a combination of quantitative factors and qualitative
factors. We have assessed financeability of these draft proposals for the same
credit metrics and financial covenants as NERL and has focused on the core
Moody’s and S&P metrics for downside stress testing. We have also considered
relevant qualitative factors around NERL’s operating and risk environment.
C11 We have assessed these draft proposals against NERL’s target credit rating
based on the notionally financed company, consistent with our views of efficient
financing arrangements and an efficient cost of capital. It is NERL’s
management’s responsibility to ensure that it maintains an investment grade
credit rating. NERL also has an important role in being efficient and responding
effectively to downside scenarios. Our stress tests are before any significant
mitigating actions by NERL’s management. This could involve strengthening its
5 We note, however, that it does not set a particular target level of gearing for NERL to meet and that its
financial structure is a matter for NERL’s management.

CAP 1758A Appendix C: Financeability
February 2019 Page 17
cash position by reducing dividends and/or taking other actions so that its long-
term business prospects would remain strong.
C12 To assess the financeability of the notional company in NERL’s financial model,
we made the following adjustments to the financing and inflation assumptions in
NERL’s business plan:
▪ to model the notional financing structure with a gearing around 60% during
RP3 and RP4 under our draft proposals, we set a special one-off dividend in
2019, used current levels of NERL’s dividends in RP3 and a lower level of
dividends in RP4 based on allowed cost of equity (5.13%);
▪ we set the costs of new debt during RP3 to be consistent with the cost of new
debt in our proposed WACC (0.1% in RPI-deflated terms, 3.1% in nominal
terms); and
▪ we updated the forecasts for CPI and RPI inflation during RP3 to reflect more
recent forecasts published by the International Monetary Fund (IMF), cross-
checked with forecasts published by HM Treasury and the Bank of England.
Approach to stress tests
C13 We have adopted a more focused approach to stress-testing rather than
repeating NERL’s Monte Carlo analysis.
C14 We identified two key business risk drivers: traffic and operating costs (excluding
pension costs). These reflect that the key demand driver for NERL is air traffic
and operating costs are the largest price control building block making up more
than 60% of determined costs. In addition, the regulatory framework provides
strong protection against other key external risk factors, such as pension cost
pass-through and that efficient capital expenditure is added to NERL’s RAB.
C15 We have modelled two stress tests for traffic and costs, based on a range of
historical and forecast information available from NERL and STATFOR. These
are summarised below, with further details on how these have been selected in
chapter 7 of the main document. We consider these represent plausible but
relatively unlikely downside scenarios, particularly given we assume they are
sustained over the whole of RP3.
▪ Stress test 1: 10% reduction in actual traffic compared to our central
assumption in all years of RP3.
▪ Stress test 2: 5% reduction in actual traffic and 2.5% increase in actual staff
and non-staff operating costs compared to our central assumption in all years
of RP3.
C16 For each of these stress tests, we reduced NERL’s forecasts of dividends in RP3
to be consistent with our assumptions for the cost of equity in the WACC (5.13%

CAP 1758A Appendix C: Financeability
February 2019 Page 18
in post-tax RPI-deflated terms). In practice we would expect NERL to be able to
take stronger mitigating actions, if necessary suspending dividends and making
offsetting efficiency gains.
CAA’s assessment of financeability
Quantitative factors
C17 In its credit analysis on NERL in November 2017, Moody’s stated that:
“downward pressure on the rating could develop if NERL’s financial profile were
to materially deteriorate, such that Moody’s adjusted Net Debt/RAB was to
increase above 70%”.6
C18 Figure C.1 below shows that adjusted Net Debt/RAB is expected to increase
substantially in RP3, particularly reflecting our assumption that NERL will be
raising a significant amount of debt during RP3. However, there remains
substantial headroom to the 70% threshold for a downgrade under our draft
proposals and stress tests, based on our dividend assumptions. Under the stress
tests, we have reduced NERL’s dividends based on the allowed cost of equity,
though in practice we might expect further significant management action in
response to worsening traffic, cost levels and/or other factors.
Figure C.1 – Assessment of adjusted net debt to RAB
Source: CAA analysis
6 Moody’s, NATS (En Route) plc Credit Opinion (November 2017).

CAP 1758A Appendix C: Financeability
February 2019 Page 19
C19 In its credit analysis for NERL in December 2017, S&P set out that it could lower
NERL’s rating if funds from operations (FFO) to debt falls below 18%.7 This ratio
has been estimated from our assumptions about NERL’s EBITDA relative to its
net debt, adjusted for pension deficits and lease costs.
C20 Figure C.2 indicates that FFO to adjusted net debt is expected to decline in RP3,
due to increases in debt and reductions in expected revenues, including from our
assumptions for a lower cost of capital and pension deficit payments. While there
is a decline in this ratio in our draft proposals, we note that there remains
reasonable headroom above the 18% threshold over RP3. Our stress tests, with
significantly lower outturn traffic and higher outturn costs than forecast during
RP3, do reach this threshold for a few quarters in 2023, before recovering during
the rest of RP3 and RP4. Therefore, the longer-term trend, even under the stress
tests, is for FFO to net debt to remain above 18%.
C21 As noted above in our downside stress tests, we have not modelled the further
mitigations available to NERL. We consider that these downside stress tests
would prompt significant management action to avoid the risk of a downgrade,
such as reducing dividends. We therefore consider it is unlikely that the FFO to
net debt would fall below 18% during RP3 for a sustained period.
Figure C.2 – Assessment of FFO to adjusted net debt
Source: CAA analysis
7 S&P Global Ratings, NATS (En Route) plc (December 2017).

CAP 1758A Appendix C: Financeability
February 2019 Page 20
C22 Table C.1 below shows the results under our draft proposals for the core metrics
above, as well as two other credit metrics presented in NERL’s RP3 business
plan based on previous Moody’s guidance (adjusted interest cover ratio and FFO
to net interest payable), as well as NERL’s financial covenants.
C23 On FFO to Net Interest Payable and Adjusted Interest Cover, NERL mentions
that Moody’s no longer publishes guidance on these thresholds, but that in
previous guidance these were, respectively, 5.5x and 2.2x for A2, and 4.5x and
1.8x for A3.8 These are similar ratios and it is unclear what weight, if any
investors and credit rating agencies will place on these ratios, particularly given
the headroom to Moody’s and S&P’s core ratios and the other qualitative factors
discussed below. On this basis, we consider in the round that the credit metrics
appear to be consistent with NERL maintaining a strong investment grade credit
rating.
C24 For NERL’s financial covenants, our draft proposals remain above the ‘trigger
levels’ during RP3. In the stress test where traffic is 10% lower than the baseline,
we note there is pressure towards the beginning of RP3. The cash position then
recovers as mechanisms such as traffic risk-sharing mitigate this risk with a 2-
year time lag. The overall trend appears reasonable, but there may be pressures
on operating cash flows early in RP3 if traffic is very significantly lower than
forecast in these years. We would expect NERL to be able to mitigate these
risks, at least to some extent, by taking significant management action, such as
reducing dividends, identifying cost reductions, and managing debt costs and
liquidity reserves. Given this is not a sustained issue during RP3 and the
potential mitigations available, we consider it highly unlikely that NERL would
breach the financial covenant trigger levels under the downside scenarios.
Table C.1 – Assessment of credit metrics under CAA’s draft proposals
Unit Threshold/
Trigger
2020 2021 2022 2023 2024
Cre
dit
metr
ics
Adj. Net Debt to RAB % <70% 46% 56% 60% 60% 61%
Adj. FFO to Net Debt % >18% 46% 39% 24% 22% 23%
Adj. FFO to Net interest Ratio Not in
guidance
10.3x 10.1x 7.2x 6.7x 6.8x
Adj. Interest Cover Ratio Not in
guidance
1.8x 2.8x 1.6x 1.3x 1.2x
Source: CAA analysis
Note: Annual values are an average of quarterly results
8 These ratios both measure the ability of NERL to repay its debt costs, though the Adjusted Interest Cover is
significantly lower than FFO to Net interest payable as it is assumed that FFO for the is reduced for regulatory
depreciation and depreciation of lease costs.

CAP 1758A Appendix C: Financeability
February 2019 Page 21
C25 Figure C.3 below shows the return on regulatory equity (RORE) under our
performance plan and stress tests. The RORE is a measure of the expected
return on the portion of the RAB financed by equity and gives an indication of
financeability from an equity perspective.
C26 In our draft proposals, RORE is in line with our allowed cost of equity of 5.13%
over RP3, with some variation between years. In our stress tests, RORE reduces
to close to zero or negative. This reflects the relatively high sensitivity of RORE
to the changes in regulatory returns from lower traffic and higher costs, given the
relatively small size of NERL’s RAB (and hence notional portion financed by
equity) to operating expenditure, compared with other regulated companies. It is
also consistent with a company making lower returns in more challenging times,
as returns in line with the cost of capital should be earned rather than
guaranteed. Given the focus on stress-testing for credit metrics, we have not
shown equivalent upside scenarios, though these could lead to RORE that is
significantly higher and potentially above 10% in real-RPI-deflated terms. We
also note that returns to equity holders are within management control and could
be improved through effective management of costs and performance against
financial incentives.
C27 An important factor in determining that equity is financeable is setting an allowed
weighted average cost of capital and cost of equity that provides appropriate
compensation for the risks faced by equity investors. The calculation of the
allowed cost of equity is discussed in Appendix D. We have considered a broad
range of evidence to estimate the appropriate cost of equity for RP3 from our
advisors, information submitted by NERL to support its business plan, and from a
review of recent regulatory precedent and other cross-checks.

CAP 1758A Appendix C: Financeability
February 2019 Page 22
C28 Based on this, we consider that our draft proposals appear to be financeable
from an equity perspective.
Figure C.3 – Return on regulatory equity (RORE)
Source: CAA analysis
Qualitative factors
C29 In addition to the quantitative factors from credit metrics and financial covenants,
we also considered a range of different qualitative risk factors that could affect
NERL’s financeability. We note that both Moody’s and S&P places significant
weight on qualitative factors, in addition to credit metrics, in assessing NERL’s
financeability. Both S&P and Moody’s assess NERL as having a strong position
underpinned by its monopoly position resulting in stable cash flow generation,
with a well-established and transparent regulatory regime. Both rating agencies
mention the uncertainty regarding the SES performance scheme framework
under Brexit.
C30 One of the key areas is the nature and stability of NERL’s regulatory framework
which is closely interlinked with SES performance framework. In its RP3
business plan, NERL considered that substantial changes to the regulatory
mechanisms such as pensions pass-through, could put pressure on its existing
credit rating.
C31 The majority of the risks highlighted by NERL have been addressed in these
draft proposals and/or are dealt with SES performance scheme. These
CAP 1758A Appendix C: Financeability
February 2019 Page 23
mitigations should enable NERL to maintain its current strong position on
business risks that supports its investment grade credit rating. In particular:
▪ the pensions cost pass-through mechanism will remain in RP3 under the
performance regulation;
▪ we have proposed that the traffic sharing mechanism will remain the same as
it was in RP2, consistent with the default mechanism under the performance
regulation. This mechanism provides significant downside protection to
revenue in the event of lower than expected traffic. We note that any
significant reduction in traffic arising from a hard Brexit may fall in RP2, when
NERL has an even stronger financial position than forecast in RP3. This is
supported by recent findings from S&P that NERL would likely maintain
strong liquidity under all no-deal Brexit stress tests;9 and
▪ the performance framework also provides strong protections against
unexpected changes in requirements requiring more efficient capital
expenditure, as well as other factors such as unexpected changes in inflation,
financing costs, taxation or other legal changes. Our approach and proposals
are based on the SES performance framework applying to the UK on the 1
January 2020. If no future EU-UK arrangements are put in place before the
end of 2019, the economic regulation of NERL will default to the Transport
Act. We note that under both the EU and domestic regulatory frameworks the
substantive requirements are similar – we expect to produce a price control
and service quality targets that go towards achieving the strategic outcomes
established in CAP 1511,10 and these need to be in place by 1 January 2020.
Overall assessment
C32 Based on our assessment of quantitative and qualitative factors above, we
consider in the round that our draft proposals are consistent with NERL
maintaining a solid investment grade credit rating and does not cause undue
financeability concerns even under our downside stress test scenarios.
C33 Although there may be a risk in some downside circumstances that NERL does
not maintain its current strong rating, we note that NERL should be able to
maintain an investment grade credit rating. In such adverse circumstances we
would expect significant management action by NERL beyond that we have
tested to maintain a strong financeable position for debt and equity holders. We
would expect that like any prudent business, NERL would consider potential
9 S&P Global Ratings, Countdown to Brexit: Just 100 days left to find a firm foundation for the transportation
infrastructure sector (December 2018).
10 CAP 1511 - Strategic outcomes for the economic regulation of NERL 2020-2024: discussion document (April
2017).

CAP 1758A Appendix C: Financeability
February 2019 Page 24
challenges it could face, and have plans about the interventions it could make to
respond to such challenges.

CAP 1758A Appendix D: Cost of capital
February 2019 Page 25
Cost of capital
Introduction
D1 In its RP3 business plan, NERL proposed a pre-tax weighted average cost of
capital (WACC) of 5.07%, deflated by the retail prices index (RPI) for the UK en
route and Oceanic price controls.11 This is made up of a vanilla WACC of 4.51%
and a tax uplift of 12.7%.12 NERL’s proposed vanilla WACC is higher than the we
set at RP2 (4.25%), but the pre-tax WACC is lower than at RP2 (5.86%) given
the reduction in the corporation tax uplift (37%).
D2 NERL commissioned NERA Economic Consulting to advise on the appropriate
WACC for RP3. NERA’s report sets out a low-high range and point estimate for
the vanilla WACC and was published alongside NERL’s RP3 business plan.13
NERL adopted NERA’s point estimate, which reflected the mid-point of the low-
high range.
D3 In this appendix, we set out our approach to estimating NERL’s pre-tax WACC
We have consulted a wide range of market, regulatory and academic sources to
inform these draft proposals, including the following:
▪ We commissioned Europe Economics to provide advice on areas of the
WACC specific to NERL – betas, gearing and cost of new debt. Europe
Economics’ report is published alongside these draft proposals.14
▪ We has also published a report from PwC, which updates its WACC analysis
published in December 2017 for CAA.15 PwC’s report is on WACC for
Heathrow Airport Limited for the next price control (H7), though we have
considered the recommendations on the market-wide factors – total market
return and risk-free rate – in determining NERL’s RP3 WACC. For the
avoidance of doubt, the draft proposals in this appendix are specific to NERL
11 This is consistent with the Regulatory Asset Base (RAB), which is inflated each year to current cost terms
using RPI.
12 The ‘vanilla’ WACC uses a pre-tax cost of debt and post-tax cost of equity. The pre-tax WACC includes a tax
uplift to the cost of equity, which provides a tax allowance for NERL. Other UK regulators typically use a vanilla
WACC to determine an allowed return on the regulatory asset base and then make a separate allowance for
corporation tax.
13 NERA, Updated Weighted Average Cost of Capital for NATS (En-Route) plc at RP3 (September 2018).
14 Europe Economics, Components of the Cost of Capital for NERL (December 2018).
15 PwC, Estimating the cost of capital for H7 – Response to stakeholder views (January 2019).

CAP 1758A Appendix D: Cost of capital
February 2019 Page 26
for RP3 and should not be read as a CAA position for H7. We set out further
details on the links between the WACC in RP3 and H7 in a separate working
paper.16
▪ We have also considered a report from Cambridge Economic Policy
Associates (CEPA) for the International Airlines Group (IAG).17 This report
and NERL’s response18 are published alongside these draft proposals.
▪ We have reviewed recent consultations and determinations from other UK
regulators – Ofwat, Ofcom and Ofgem – and the Competition and Markets
Authority (CMA).
▪ We reviewed recent academic reports, including the cost of equity study by
Professor Wright et al for the UK Regulators Network (we refer to this report
as the UKRN cost of equity report).19
D4 The rest of this appendix provides further details on the CAA’s approach to
estimating the cost of capital for NERL. This appendix is structured by topic as
follows:
▪ CAA’s overall approach to estimating the cost of capital;
▪ inflation;
▪ total market return;
▪ risk-free rate;
▪ gearing;
▪ overall cost of equity;
▪ cost and proportion of embedded debt;
▪ cost of new debt;
▪ overall cost of debt;
▪ tax uplift; and
▪ overall weighted average cost of capital.
16 Published at www.caa.co.uk/natslicence.
17 CEPA, Cost of capital for NATS (En-Route) plc (November 2018).
18 NERL, NERL response to CEPA’s ‘Cost of capital for NATS (En-Route) plc’ report for the International
Airlines Group (December 2018).
19 Professor Stephen Wright et al, Estimating the cost of capital for implementation of price controls by UK
Regulators, An update on Mason, Miles and Wright (2003) (March 2018).

CAP 1758A Appendix D: Cost of capital
February 2019 Page 27
D5 Unless otherwise stated, the figures in this appendix are presented in RPI-
deflated terms, consistent with indexation of the regulatory asset base (RAB).
The difference between the consumer prices index (CPI) and RPI forecasts
shown in this appendix, are used to express the allowed WACC components in
nominal and CPI-deflated terms for comparison where relevant.
CAA’s views on cost of capital for RP3
Overall approach
D6 Our business plan guidance for NERL set out that NERL should assume a cost
of capital that is “no more than the efficient level necessary to compensate NERL
for the business and regulatory risks it faces.”20
D7 In general, we consider that there is compelling evidence that the efficient level
of the cost of capital has reduced between the RP2 performance plan and these
RP3 draft proposals, even before considering the impact of corporate taxation.
This reduction in the estimated cost of capital since RP2 is supported by a
review of a range of historical and forward-looking market evidence for investors’
required rates of return. Other UK regulators have started to reflect this in their
recent proposals for the allowed WACC.
D8 By proposing an increase in the vanilla WACC between RP2 and RP3, we
consider that NERL’s proposals are inconsistent with the broad range of
evidence available and significantly overstates the efficient WACC necessary to
compensate NERL during RP3. We have therefore provided our own estimate of
the pre-tax WACC for these draft proposals.
D9 For these draft proposals, we have estimated the allowed WACC based on the
weighted average of the estimated cost of debt and equity finance, and using the
capital asset pricing model (CAPM) to estimate the cost of equity. These
approaches are commonly used across UK regulated sectors and are consistent
with recommendations in the UKRN cost of equity study and NERA’s advice to
NERL.
D10 In developing these draft proposals, we have also considered how the allowed
WACC compares with recent UK regulatory precedent and considered the
reasons for differences. We recognise that judgement is required in estimating
an efficient WACC and seek to balance the benefits to consumers from using a
lower allowed WACC with the significant downside risks for NERL’s financeability
and incentives to invest if the allowed WACC is set too low.
D11 We discuss below the approach and analysis that has informed our
considerations of the different components of the WACC. It is important to note
20 CAP 1625 - Guidance for NERL in preparing its business plan for Reference Period 3 (January 2018).
CAP 1758A Appendix D: Cost of capital
February 2019 Page 28
that while we have considered these individual elements, we have also made an
overall judgement about the appropriate WACC.
Inflation
D12 NERA, in its report for NERL, assumes an RPI forecast of 3.2% p.a. to estimate
the RPI-deflated WACC. Separately, NERL’s RP3 business plan includes an RPI
forecast that increases from 2.88% in 2020 to 3.54% p.a. by 2024, or about 3.3%
p.a. on average. Over the same period, CPI increases from 1.57% to 1.96%, or
about 1.8% p.a. on average.
D13 We have reviewed recent inflation forecasts published by the HM Treasury21, the
Office for Budget Responsibility (OBR)22, Bank of England23 and International
Monetary Fund (IMF)24.
D14 The inflation forecasts from these sources are broadly aligned and support an
inflation assumption for RP3 of 2.0% p.a. for CPI and 3.0% p.a. for RPI that we
use to estimate the WACC in RPI-deflated terms in these draft proposals. This is
similar to the inflation forecasts we use in the financial modelling. RPI forecasts
are typically higher than CPI (particularly due to the ‘formula effect’) and these
inflation forecasts are consistent with a wedge between RPI and CPI of 1.0%
p.a.,which matches the estimate of the long-run difference between RPI and CPI
estimated by the OBR in March 2015.25
Table D.1 – Inflation for estimating RP3 WACC
NERL business plan CAA draft
proposal
Notes
RPI inflation 3.2% p.a.
(from NERA report on cost of capital)
3.0% p.a. Reduced to reflect recent
external forecasts
CPI inflation Not in NERA report
(c.1.8% in financial model)
2.0% p.a. Reflects recent external
forecasts
Source: CAA analysis
Total market return
D15 We have used a ‘decompositional’ approach to estimate cost of equity under
CAPM, where the total market return (TMR) and risk-free rate (RFR) are
estimated separately to derive the equity risk premium (ERP). The TMR is an
estimate of the expected return by investors for the market as a whole. This
21 HM Treasury, Forecasts for the UK economy: a comparison of independent forecasts (November 2018).
22 Office for Budget Responsibility, Economic and fiscal outlook (October 2018).
23 Bank of England, Inflation Report (November 2018).
24 IMF, World Economic Outlook (October 2018).
25 Office for Budget Responsibility, Economic and fiscal outlook (March 2015).
CAP 1758A Appendix D: Cost of capital
February 2019 Page 29
approach to estimating TMR and RFR separately is broadly consistent with the
approaches adopted by NERL and other UK regulators, as the TMR is typically
shown to be more stable than the ERP.
D16 In its RP3 business plan, NERL proposes a TMR range of 6.5%-7.1% and a
point estimate of 6.8%, based on a report by NERA. NERA’s range is based on a
review of long-run historical estimates from Dimson, Marsh and Staunton26 for
different holding periods and averaging approaches, with the bottom end of the
range reduced by 0.3% reflecting the ONS’ estimate for the increase in the RPI
‘formula effect’ arising from the 2010 change to the method for collecting clothing
prices.
D17 The TMR has been subject to a wide-ranging debate during 2018, and a range of
new information has been published around estimates of TMR using different
historical and forward-looking methods. As different methods can lead to very
different estimates of TMR, we consider it is appropriate to consider the wide
range of evidence and cross-checks available in forming our judgement on the
appropriate TMR.
UKRN cost of equity study
D18 The cost of equity study by Professor Wright et al for the UK Regulators Network
(UKRN)27 recommends that the TMR is based on long-run historical averages
taking into account both UK and international evidence. Based on their analysis
of long-run historical returns in the UK and other markets, the authors propose a
TMR range of 6-7%. This is based on long-run historical geometric average
returns of not more than 5%, increased by 1-2% to account for serial correlation
of returns. The authors note that the case for an adjustment to geometric
average returns as large as 2% is weakened if regulators are setting returns on a
consistent basis at a relatively long (e.g. 10-year) horizon.
D19 We understand that the 6-7% range for the TMR in the UKRN cost of equity
study was estimated in real-CPI terms, using the long-run historical CPI series
estimated by the Bank of England.28 To obtain an equivalent estimate in RPI-
deflated terms, the TMR should be reduced for the RPI-CPI wedge estimated
above (1%) to 5-6% in RPI-deflated terms. This is consistent with the
approaches recently taken by other UK regulators.29
26 Credit Suisse, Global Investment Returns Yearbook 2017
27 Professor Stephen Wright et al, Estimating the cost of capital for implementation of price controls by UK
Regulators (March 2018).
28 Bank of England, A millennium of macroeconomic data for the UK, Research datasets (2018).
29 For example, Ofgem (RIIO-2 Sector Specific Methodology Annex: Finance, December 2018) confirmed with
study author Professor Wright that it is fair to interpret the TMR range of 6-7% in CPI-terms as 5-6% in RPI
CAP 1758A Appendix D: Cost of capital
February 2019 Page 30
Review of inflation measures in the UKRN cost of equity study
D20 The UKRN cost of equity study estimates long-run average historical returns
using a long-run measure of CPI published by the Bank of England. NERA, in its
advice to NERL, states that the CPI measure used by the UKRN report authors
is unreliable and that the historical real TMR should be estimated using RPI
inflation.
D21 We understand that the CPI series is published by the Bank of England as part
of a research dataset that does not have official or national statistics status. Our
understanding of the inputs to the CPI series used in the UKRN cost of equity
study are summarised below.
▪ from 1988, the CPI series is as published by ONS;
▪ from 1949 to 1988, the CPI series was calculated by the ONS, with the
removal of the “formula effect” difference between CPI and RPI;
▪ prior to 1949, the ‘original’ CPI series from the Bank of England is based on a
consumer expenditure deflator (CED) from the ONS30, while the same data is
also used for the long-run RPI series in the Bank of England dataset. As
shown in Figure D.1, there is only a limited difference between RPI and the
modelled CPI between 1949 to 1974, so it is not obvious that an adjustment
is needed when converting between RPI and CPI prior to this period. This
supports the Bank of England’s approach in using CED inflation data as a
proxy for both CPI and RPI inflation without any adjustment prior to 1949.31
terms; and Ofcom expressed the 6-7% TMR range as CPI-deflated (Business connectivity market review,
Annex 21 Cost of capital (November 2018)).
30 O’Donoghue et al, Consumer Price Inflation since 1750, Economic Trends (March 2004).
31 In addition, we note from Feinstein et al (1972) that the CED includes a measure of imputed rent payment by
owner-occupiers and excludes items . This is different to the owner-occupier’s costs included in RPI (e.g.
mortgage interest payments and depreciation), so CED appears to have a different coverage than RPI.

CAP 1758A Appendix D: Cost of capital
February 2019 Page 31
Figure D.1 – Comparison between CPI and RPI inflation rates from Bank of England Millennium dataset
Source: PwC, Estimating the cost of capital for H7 – Response to stakeholder views, January 2019
D22 PwC, in its update for the CAA on the cost of capital for the next Heathrow
Airport price control,32 has reviewed the CPI and RPI measures from the Bank of
England, concluding that the UKRN authors’ decision to deflate nominal returns
by the Bank of England long-run CPI series provides a suitable estimate of
historical average real returns. PwC found that the differences between RPI and
CPI diverged from the 1970s and the Bank of England inflation CPI measure
provides a long-term estimate to guide investor inflation expectations and real
returns.
D23 NERA, in its work for NERL, considers that the Bank of England CPI series is an
unreliable basis for deflating nominal returns and that the RPI series used by
DMS is more reliable. However, we do not agree on this point. The backcast CPI
series from the Bank of England appears to be calibrated to exclude the RPI
“formula effect” and other differences such as coverage, so should be a
reasonably consistent time series. In contrast, the structural change to RPI
(including both the intended increase to measured inflation and the
consequential increase in the formula effect) following the change in 2010 to the
ONS’ measurement of clothing prices means that caution is needed in using
historical RPI series as an accurate indicator of future RPI-deflated returns.
D24 Bearing the evidence above in mind, we consider that the CPI series from the
Bank of England, while not perfect in terms of providing a consistent time-series
32 PwC, Estimating the cost of capital for H7 – Response to stakeholder views (January 2019).

CAP 1758A Appendix D: Cost of capital
February 2019 Page 32
from a single underlying source, represents a reasonable basis for deflating
historical nominal returns.
Review of holding period and adjustment for serial correlation
D25 NERA, in its advice to NERL, has used the arithmetic average of long-run
historical returns to estimate the TMR. The arithmetic average will be an
unbiased indicator if returns follow a random walk. NERA also estimates average
historical returns using unbiased indictors from “Blume” and “Jacquier, Kane and
Marcus (JKM)”33, concluding that these estimates support the use of arithmetic
averages.
D26 The UKRN cost of equity report suggests that UK regulators estimate TMR
starting from the long-run geometric averages, adjusted upwards by 1-2%
depending on the extent to which regulators wish to take account of serial
correlation of returns, rather than calculating arithmetic averages directly. The
reports’ authors are concerned that arithmetic averages can generate spurious
differences, especially when returns are affected by exchange rate fluctuations.
D27 PwC, in its update for CAA, has examined the variance in returns, including
reviewing the UKRN cost of equity study from 2003 and performed additional
econometric analysis on the UK equities market. PwC concludes that there is
evidence of predictability of returns at longer horizons (e.g. 10 years), which
points to a smaller adjustment to the geometric mean for a longer-term holding
period. As shown in Figure D.2, PwC’s analysis would support an upward
adjustment to the geometric mean of around 0.4-1.3% for a 10-year holding
period, or 0.7-1.5% for a shorter 5-year holding period, towards the lower end of
the 1-2% range in the UKRN cost of equity report.
D28 For example, if a volatility adjustment of 1-1.5% was used, then the TMR range
in the UKRN cost of equity report would narrow to 5-5.5% in RPI-deflated terms.
Applying a volatility adjustment of 1-1.5% to the average historical UK CPI
returns in the UKRN cost of equity study gives an RPI-deflated TMR range of
5.2%-5.7%.
33 We understand that the Blume adjustment takes a weighted average of the arithmetic and geometric returns
and the JKM adjustment calculates the arithmetic mean as a function of the geometric return and variance of
returns.
CAP 1758A Appendix D: Cost of capital
February 2019 Page 33
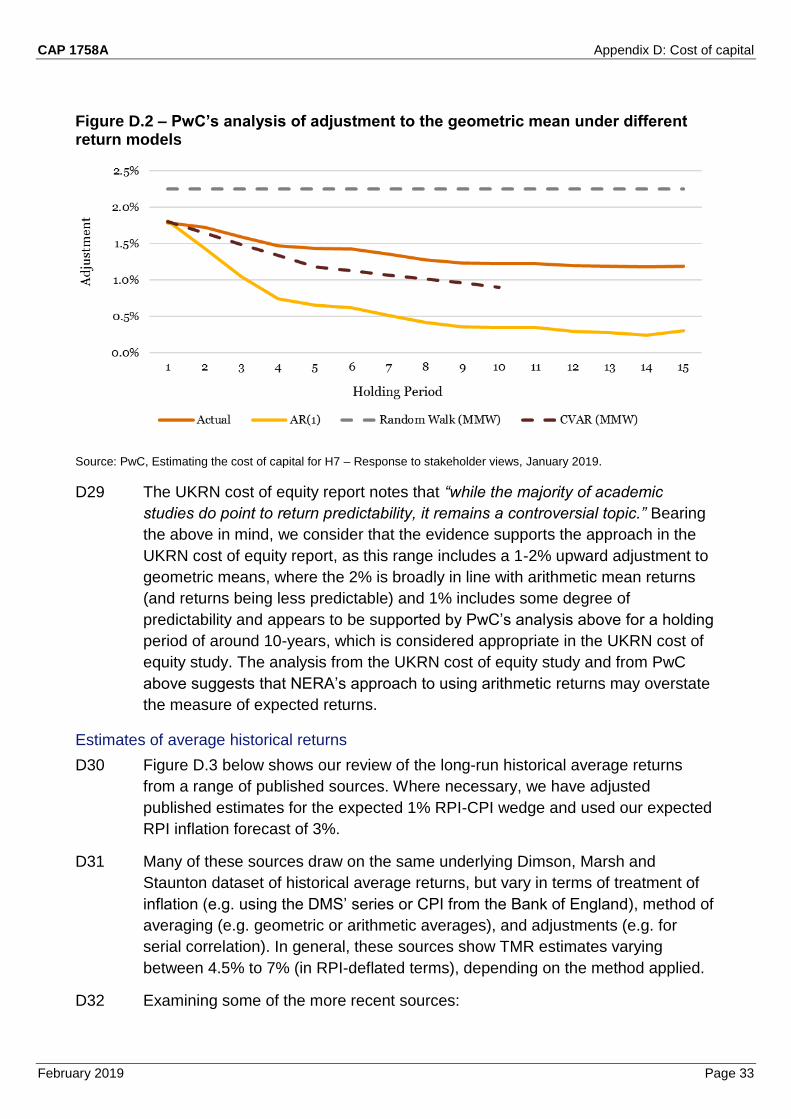
Figure D.2 – PwC’s analysis of adjustment to the geometric mean under different return models
Source: PwC, Estimating the cost of capital for H7 – Response to stakeholder views, January 2019.
D29 The UKRN cost of equity report notes that “while the majority of academic
studies do point to return predictability, it remains a controversial topic.” Bearing
the above in mind, we consider that the evidence supports the approach in the
UKRN cost of equity report, as this range includes a 1-2% upward adjustment to
geometric means, where the 2% is broadly in line with arithmetic mean returns
(and returns being less predictable) and 1% includes some degree of
predictability and appears to be supported by PwC’s analysis above for a holding
period of around 10-years, which is considered appropriate in the UKRN cost of
equity study. The analysis from the UKRN cost of equity study and from PwC
above suggests that NERA’s approach to using arithmetic returns may overstate
the measure of expected returns.
Estimates of average historical returns
D30 Figure D.3 below shows our review of the long-run historical average returns
from a range of published sources. Where necessary, we have adjusted
published estimates for the expected 1% RPI-CPI wedge and used our expected
RPI inflation forecast of 3%.
D31 Many of these sources draw on the same underlying Dimson, Marsh and
Staunton dataset of historical average returns, but vary in terms of treatment of
inflation (e.g. using the DMS’ series or CPI from the Bank of England), method of
averaging (e.g. geometric or arithmetic averages), and adjustments (e.g. for
serial correlation). In general, these sources show TMR estimates varying
between 4.5% to 7% (in RPI-deflated terms), depending on the method applied.
D32 Examining some of the more recent sources:

CAP 1758A Appendix D: Cost of capital
February 2019 Page 34
▪ PwC, in its work for the CAA, reviewed the long-run historical average returns
from Jorda et al.34 This provides an arithmetic average of historical TMR of
7.2% in CPI-deflated terms, or 6.2% in RPI-deflated terms (assuming a 1%
RPI-CPI wedge). However, PwC states that the Jorda study does not provide
a comparable expected TMR, e.g. adjusting for serial correlation. Taking into
account the new evidence available on long-run returns from the UKRN cost
of equity report and Jorda et al, PwC considers a range of 5-6% is
appropriate and that evidence of predictability at longer horizons supports a
point estimate towards the lower end of this range.
▪ CEPA, in its report for IAG, has estimated historical ex ante returns using the
historical average returns from DMS dataset, adjusted for one-off factors and
inflation. CEPA estimates a range of 5.5-6.0% on an arithmetic average basis
and 4.35-4.8% on a geometric average basis, in RPI-deflated terms. NERL
has responded that CEPA’s estimates are flawed as they do not apply the
established methodologies, misinterpret historical DMS data and do not use a
reliable measure of inflation.
▪ Both Ofgem and Ofcom, in recent consultations, consider that average
historical returns support a real TMR (in RPI-deflated terms) of 5-6%, in line
with the UKRN cost of equity study. Europe Economics, in its advice to
Ofcom, estimates a historical TMR of 6%, at the top of this range, based on
arithmetic average returns.
D33 We have considered NERA’s and NERL’s views on the average historical TMR.
However, based on our review of the further evidence above on the treatment of
inflation and predictability of returns, we consider that the historical average
returns in the UKRN cost of equity report provide a reasonable basis for
estimating average historical returns in CPI-deflated terms. The resulting range
of 5-6% in RPI-deflated terms, when taking into account the OBR’s forecast for
the future RPI-CPI wedge, is further supported by recent reviews from other UK
regulators (Ofcom and Ofgem) and a range of advisors (Europe Economics,
PwC and CEPA).
34 Jorda et al, Rate of return on everything, 1870-2015 (2017).

CAP 1758A Appendix D: Cost of capital
February 2019 Page 35
Figure D.3 – CAA review of recent analysis on average historical returns (in RPI-deflated terms)
Source: CAA analysis of range of published sources.
Forward-looking estimates of TMR
D34 A number of UK regulators and advisers have used forward-looking methods,
such as dividend-discount models (DDM) or dividend growth models (DGM) and
market-to-asset ratios, to inform or cross-check their estimates of TMR.
D35 As shown in Figure D.4, recent DDM/DGM analysis by Ofwat, Ofcom, Europe
Economics, CEPA and PwC suggest forward-looking estimates of TMR around
4.0-6.3% (in RPI-deflated terms).
D36 PwC has updated its multi-stage GDP-based DDM from its December 2017
report for CAA. Its updated estimates provide a TMR range of 5.3-6.2%, with the
upper end of the range driven by the current DDM estimate, which tends to be
more volatile. In its updated report, PwC considers that its proposed TMR of 5.1-
5.6%, based primarily on forward-looking methods, remains appropriate.
D37 NERA and Oxera have suggested that DDM based estimates form the Bank of
England suggest much higher estimates of the forward-looking TMR. However,
PwC concludes that the Bank of England models are focused on movements in
analyst expectations of equity returns rather than levels of returns, making them
unsuitable for informing views on the forward-looking TMR.
CAP 1758A Appendix D: Cost of capital
February 2019 Page 36
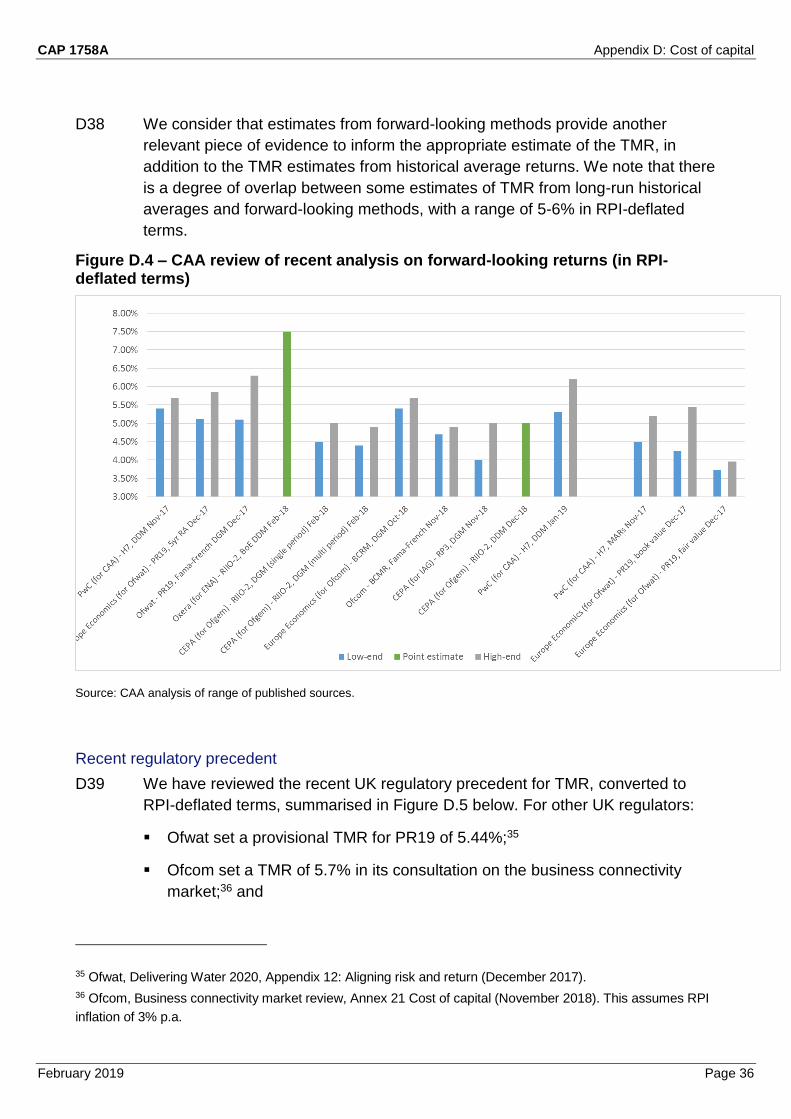
D38 We consider that estimates from forward-looking methods provide another
relevant piece of evidence to inform the appropriate estimate of the TMR, in
addition to the TMR estimates from historical average returns. We note that there
is a degree of overlap between some estimates of TMR from long-run historical
averages and forward-looking methods, with a range of 5-6% in RPI-deflated
terms.
Figure D.4 – CAA review of recent analysis on forward-looking returns (in RPI-deflated terms)
Source: CAA analysis of range of published sources.
Recent regulatory precedent
D39 We have reviewed the recent UK regulatory precedent for TMR, converted to
RPI-deflated terms, summarised in Figure D.5 below. For other UK regulators:
▪ Ofwat set a provisional TMR for PR19 of 5.44%;35
▪ Ofcom set a TMR of 5.7% in its consultation on the business connectivity
market;36 and
35 Ofwat, Delivering Water 2020, Appendix 12: Aligning risk and return (December 2017).
36 Ofcom, Business connectivity market review, Annex 21 Cost of capital (November 2018). This assumes RPI
inflation of 3% p.a.

CAP 1758A Appendix D: Cost of capital
February 2019 Page 37
▪ Ofgem is consulting on a TMR of 5.2-5.7% for RIIO-2.37
D40 In broad terms, this shows that TMR estimates from other UK regulators have
reduced significantly since previous price reviews. While the different UK
regulators seem to place different weight on forward-looking and historical
average return methods, there is a broad consistency in the estimated TMR to
be significantly below 6%, in RPI-deflated terms.
D41 Figure D.5 also shows TMR ranges published by a range of specialist advisors to
regulators and companies. This shows that NERA appears to be an outlier in
proposing an RPI-deflated TMR above 6.5%.
D42 Looking outside the UK, Europe Economics, in its work for Ofwat, reviewed
international regulatory precedent. Europe Economics concluded that this
supported a TMR range of 6.3-7.8% in real CPI terms, which would be around
5.3-6.8% in RPI-deflated terms.38 PwC also reviewed the airport charges
agreement for Charles de Gaulle Airport, concluding that this is consistent with a
TMR of 6.3% in RPI-deflated terms.39
37 Ofgem, RIIO-2 Sector Specific Methodology Annex: Finance (December 2018).
38 Europe Economics, PR19 – Initial Assessment of the Cost of Capital (December 2017).
39 PwC, Estimating the cost of capital for H7 – Response to stakeholder views (January 2019).

CAP 1758A Appendix D: Cost of capital
February 2019 Page 38
Figure D.5 – CAA review of regulatory precedent and advisor views on TMR (in RPI-deflated terms)
Source: CAA analysis of range of published sources.
Professional investor studies
D43 Ofgem has reviewed a range of market returns forecasts from asset managers
and financial organisations. This review found that investors should expect
returns over the medium to long-term of 6.6% (in nominal terms) on average, or
a range from 4.5% to 7.75%. In RPI-deflated terms with RPI of 3%, the range is
around 1.5-4.7% with an average of 3.6%.
D44 This relatively low level of expected returns compared with historical levels
seems to be a common trend among market analysts. In 2016 the think tank
McKinsey Global Institute concluded that “over the next 20 years, total returns
including dividends and capital appreciation could be considerably lower than
they were in the past three decades” and that “even if GDP growth rates were to
return to the trend rate of the past 50 years, other factors could dampen annual
returns over the coming decades by 150 to 400 basis points compared with
returns earned in the past 30 years”.40
40 McKinsey Global Institute, Diminishing returns: why investors may need to lower their expectations (May
2016).

CAP 1758A Appendix D: Cost of capital
February 2019 Page 39
D45 This suggests that, while historical evidence might support higher figures for
TMR of 5-6% in RPI-deflated terms, a review of market returns forecasts might
support even lower expectations for future returns.
Overall CAA view on TMR
D46 We have considered the broad range of evidence above on TMR, including
historical average returns, forward-looking returns, current market information
and regulatory precedent, to form its judgement on the appropriate TMR for the
RP3 WACC.
D47 We consider that the broad range of evidence supports a TMR range of 5.0% to
6.25% in RPI-deflated terms. The low end of the range is in line with the low-
end of TMR estimates based on average historical returns (from the UKRN cost
of equity report), forward-looking returns (from PwC’s report for CAA on H7 and
from other advisors) and from regulatory precedent (Ofwat, Ofcom and Ofgem).
The high end of the range is our estimate for RP2 and Q6 price controls,
consistent with the overall finding that expected returns have reduced since
previous price reviews. However, we note that most sources suggest a TMR of
no more than 6%.
D48 This range lies significantly below the range from NERA of 6.5-7.1%. This is
expected as we understand that NERA’s analysis does not put any weight on the
range from the UKRN cost of equity report or forward-looking approaches. As
shown above, however, NERA appears to be an outlier in terms of its proposed
range.
D49 For these draft proposals we have used a point estimate of 5.4% in RPI-
deflated terms to inform our overall WACC estimate, towards the lower end of
the 5-6.25% range above. We have chosen this point estimate based on analysis
of average historical returns (being near the mid-point of the range from the
UKRN cost of equity report), supported by estimates from forward-looking
methods and regulatory precedent – it is close to the mid-points of the ranges
from Ofgem for RIIO-2, Ofwat’s guidance for PR19 and PwC’s advice to CAA for
H7.
Risk-free rate
D50 The risk-free rate (RFR) is an input to the cost of equity under CAPM.
D51 For RP3, NERL has proposed an RPI-deflated RFR of 0.46%, just above the
mid-point in NERA’s range from -1.1% (based on UK 10-year government yields
in August 2018 and forward rates to mid-point of RP3) to 1.5% (based on long-
run historical market evidence adjusted for current market conditions).
D52 The UKRN cost of equity report considered potential justifications for not
adopting negative risk-free rate. In summary, they found that there is no
economic principle that rules out negative risk-free rate and recommended that:

CAP 1758A Appendix D: Cost of capital
February 2019 Page 40
“Regulators should use the (zero coupon) yield on inflation-indexed gilts at their
chosen horizon to derive an estimate of the risk-free rate at that horizon” even if
there are arguments that the market for risk-free debt may be distorted.
D53 Consistent with this, we have reviewed the evidence from index-linked gilts
(ILGs), as a proxy for the RFR in RPI-deflated terms. Based on market evidence
at the end of September 2018, we produced implied forward-gilt yields at
different given maturities for a period covering RP3 (2020-2024). The results are
set out in Figure D.6 below.
Figure D.6 – Forward rates for index-linked gilts over 5-year to 20-year horizons
Source: CAA analysis of gilt yields published by the Bank of England.
D54 By and large, the chart demonstrates that markets anticipate that yields on ILGs
will increase slightly from current market values over RP3, but that yields will
remain low and negative for an extended period. At the mid-point of RP3 (July
2022), we estimate a RFR of -1.4% based on 10-year ILGs. From our analysis,
this estimate only changes slightly based on different estimation methods (e.g.
cross-checking using spot values from the prior six months and using a 10-year
trailing average) or maturities (5, 15 and 20-year ILGs).
D55 We noted that nominal gilts would lead to a higher estimate for the RFR (closer
to -0.9%), though this was sensitive to the assumed level of inflation and would
be a departure from the approach recommended by the UKRN cost of equity
report.
CAP 1758A Appendix D: Cost of capital
February 2019 Page 41
D56 We have checked that the estimated RFR of -1.4% appears reasonable when
compared with other recent estimates:
▪ it is within the range proposed by PwC in its report for CAA on H7 (-1.5% to -
1.0%), based on spot market evidence and forward-looking evidence;
▪ it is within the range proposed by CEPA, in its report for IAG (-1.84% to -
1.34%), based on the current spot rate and 1-month trailing average of 10-
year ILGs;
▪ it is close to Ofgem’s recent consultation on RIIO-2 and Ofcom’s recent
business connectivity market review. Ofgem expects to move away from
setting the RFR on an ex-ante basis to using indexation based on average
20-year zero coupon gilt rate for October. Ofgem estimates a spot rate in
October 2018 of -1.68%, which would increase slightly based on current
implied forward-gilt curves. Ofcom in its consultation on wholesale local
access network has proposed to move away from using a zero RFR (in RPI-
deflated terms) to a negative RFR of -1.25%. This reflects Ofcom’s proposal
to place more weight on recent market evidence for 10-year index-linked gilts
and citing the recommendations in the UKRN cost of equity report iterating
the most recent market evidence; and
▪ while it is above Ofwat’s proposed RFR of -0.88% for PR19, we would expect
our proposal to be lower given the earlier timing of Ofwat’s publication (as
ILG forward curves generally flattened in 2018) and Ofwat has put more
weight on using nominal gilts deflated using RPI forecasts to derive the RFR.
D57 Based on the review of empirical evidence and regulatory precedent, we use a
RFR of -1.4% (in RPI-deflated terms) to inform our overall WACC estimate in
these draft proposals. An appropriate range appears to be from -1.5% to -0.9%
based on respectively, the high end of the PwC range and the alternative
approach to estimating the RFR based on nominal gilts deflated for RPI forecast.
Gearing
D58 In its RP3 business plan, NERL proposed a gearing level of 60% to calculate its
cost of capital, in line with the rate set by the CAA in RP2. In NERL’s RP3
business plan, actual gearing increases from around 30% in 2017 to around 60%
by 2024.
D59 NERA supports the use of a notional gearing approach as this helps ensure the
regulated company and their shareholders bear the risk of financing structure
and are incentivised to outperform. NERA notes that the final gearing
assumption should depend on the outcome of the financeability assessment,
which will show whether a notional gearing of 60% continues to allow NERL to
maintain a targeted investment-grade credit rating.

CAP 1758A Appendix D: Cost of capital
February 2019 Page 42
D60 Europe Economics, in its advice to CAA has also recommended starting from an
initial notional gearing of 60% for NERL, after considering trends in gearing in the
UK corporate sector and UK utilities. They also note this assumption could be
revised in light of the financeability analysis.
D61 We note that a notional gearing level of 60% appears broadly consistent with
wider UK regulatory precedent. For example, both Ofwat and Ofgem have
adopted notional gearing on 60% in recent PR19 and RIIO-2 publications.
D62 For these draft proposals, we have used a notional gearing assumption of
60%. As shown in chapter 7, our financeability testing for these draft proposals
indicates that this level still allows NERL to maintain its investment-grade credit
rating.
D63 We note that a notional gearing of 60% also provides reasonable headroom to
the gearing cap of 65% in NERL’s licence. However, we emphasise that 60%
gearing, also cited in the licence, should not be interpreted as a target level of
gearing set by the CAA and responsibility for maintaining an investment grade
credit rating sits firmly with NERL’s management.
Equity beta
D64 The TMR represents the returns required by investors on equities of average
risk. Under the CAPM framework, the equity beta measures the systematic risk
of a particular equity investment. The higher the equity beta, the larger the
required compensation equity investors require for bearing the additional
systematic risk. In general, UK regulators have estimated the equity beta based
on estimates of the underlying asset beta and debt betas, re-levered using the
notional level of gearing.
D65 In its RP3 business plan, NERL proposes an asset beta of 0.61, a debt beta of
0.05 and an equity beta of 1.45. This is the mid-point of NERA’s equity beta
range for NERL of 1.33 to 1.58. The lower bound of NERA’s asset beta is based
on the two-year asset beta of Aeroports de Paris (ADP), which NERA considered
provided a similar traffic risk to NERL, and the upper bound is based on the two-
year asset beta from a subset of international listed airports. NERA’s range is
significantly above the CAA’s allowance for RP2 (0.505 asset beta, 0.1 debt beta
and 1.1125 equity beta).
D66 We commissioned Europe Economics to advise us on appropriate betas for
NERL, including reviewing the analysis by NERA. The detailed findings are set
out in Europe Economics’ report.41 In summary, Europe Economics found that:
▪ NERL’s asset beta should be expected to be lower than for UK airports given
greater demand diversification and partial protection from demand risks. But,
41 Europe Economics, Components of the cost of capital for NERL (December 2018).

CAP 1758A Appendix D: Cost of capital
February 2019 Page 43
NERL’s asset beta should be no lower than that of UK utilities, as typical
utilities face no demand risks given their price controls are set using a
revenue cap. In addition, NERL’s betas should take account of its relatively
high operating leverage (i.e. the level of its fixed costs relative to its variable
costs);
▪ based on its review of the betas of UK utilities (as a lower bound for NERL’s
beta) and UK airports (as an upper bound of NERL’s beta), Europe
Economics estimates a “constraint range” for the asset beta of 0.46-0.54. The
lower bound of UK utilities reflects utilities with a share of non-regulated
revenues, so is above pure regulated utilities, reflecting the greater level of
risk faced by NERL;
▪ ENAV, the Italian ANSP, which is publicly listed, is a suitable comparator for
NERL. Europe Economics estimates an asset beta range of 0.29 to 0.54 from
the notional ‘en-route’ portion of ENAV, based mainly on the 2-year asset
betas relative to the Italian domestic and European markets, which it uses as
the “comparator range” for NERL. Figures D.7 and D.8 below shows Europe
Economics’ analysis of ENAV’s betas against domestic and European
indices;
▪ the asset beta for NERL should be consistent with both the comparator and
constraint ranges above. Europe Economics concludes that an appropriate
asset beta for NERL would lie above the mid-point of the comparator range at
0.46 or higher. This accounts for the finding that NERL has slightly higher
operational leverage than ENAV, as this would increase the mid-point of the
comparator range to around 0.46;
▪ an appropriate debt beta would be 0.19, based on its estimates of NERL’s
cost of debt. Europe Economics cites precedent from the Competition
Commission CAA Q5 review as supporting a debt beta in the range 0.09 to
0.19, as well as other recent UK regulatory precedent, to recommend an
overall range of 0.1-0.19;
▪ the evidence on asset and debt beta ranges support overall equity beta range
of 0.44 to 1.20 based on the comparator range only, or 0.87 to 1.20 based on
the overlap with the constraint ranges.

CAP 1758A Appendix D: Cost of capital
February 2019 Page 44
Figure D.7 – 1-year and 2-year unlevered betas for ENAV (vs domestic index)
Source: Europe Economics, Components of the cost of capital for NERL, December 2018
Figure D.8 – 1-year and 2-year unlevered betas for ENAV (vs European index)
Source: Europe Economics, Components of the cost of capital for NERL, December 2018
D67 NERA, in its report for NERL, estimates the beta for ENAV giving similar (and
slightly lower) estimates than from the Europe Economics report when measured
relative to the European market (in the range 0.52 to 0.66, compared with 0.54 to
0.71 estimated by Europe Economics).
D68 Europe Economics, in contrast, also places weight on the longer-term 2-year
betas and analysis of the betas against the domestic market index. Further to
this, Europe Economics does not find evidence that Italian betas are materially
0.52
0.34
0.71
0.54

CAP 1758A Appendix D: Cost of capital
February 2019 Page 45
suppressed, as concluded by NERA, and finds that the movement of NERL’s
beta is in line with other Italian utilities.
D69 CEPA, in its report for IAG, estimates an asset beta range for NERL of 0.43
(based on a weighted average of low estimates for airports and utility networks)
to 0.50 (based on high estimates for airports and networks and ENAV’s beta).
CEPA is concerned that the airport comparators selected by NERA could
overestimate NERL’s beta, based on weights applied to the comparators and
because this does not account for the potential additional systematic risk at
airports from non-aeronautical revenues.
D70 Based on the findings above, for these draft proposals we have used an asset
beta of 0.46 to inform our overall WACC estimate in these draft proposals. This
estimate is based on the estimate from Europe Economics, which is slightly
above the mid-point in Europe Economics’ estimate of ENAV’s asset beta and is
within the relevant bound from a selection of utility and airport comparators. We
consider this provides a reasonable estimate of ENAV’s asset beta by putting
weight on the estimated beta over a longer timeframe (2-years, rather than 1-
year) and considering movements against the domestic index. Also, while NERA
provides evidence that NERL’s beta should be higher than ENAV, CEPA
provides evidence to support the opposite. It is therefore not clear that an
adjustment to ENAV’s beta is needed in addition to the adjustment applied by
Europe Economics’ for NERL’s higher operating leverage. Europe Economics
has also put some weight on utility comparators, in addition to airports, as
relevant comparators to NERL as a regulated company, while recognising the
higher demand risks that NERL faces.
D71 We have sense-checked this 0.46 asset beta against recent regulatory
precedent, noting that this is significantly above the recent estimates from Ofwat
(0.37 in Ofwat’s PR19 guidance) and Ofgem (0.35-0.36 in Ofgem’s RIIO-2
methodology consultation). Moreover, the asset beta is slightly below the mid-
point of PwC’s estimated range for Heathrow Airport (0.42-0.52, based on 2-year
daily and 5-year monthly asset betas for ADP and Fraport, measured against
both local and European indices), so seems to be broadly consistent with Europe
Economics’ conclusion that NERL’s asset beta should be below that of UK
airports.
D72 For these draft proposals, we do not consider that additional adjustments are
required to reflect the performance regulation, which shows that NERL will
continue to have strong protections against elements of systematic risks from
traffic risk-sharing and pension cost pass-through.
D73 For these draft proposals, we use an asset beta within the range of 0.46 to
0.505. The lower end is from Europe Economics’ analysis, reflecting the asset
beta used in these proposals, while the upper end was the allowed asset beta at
RP2.
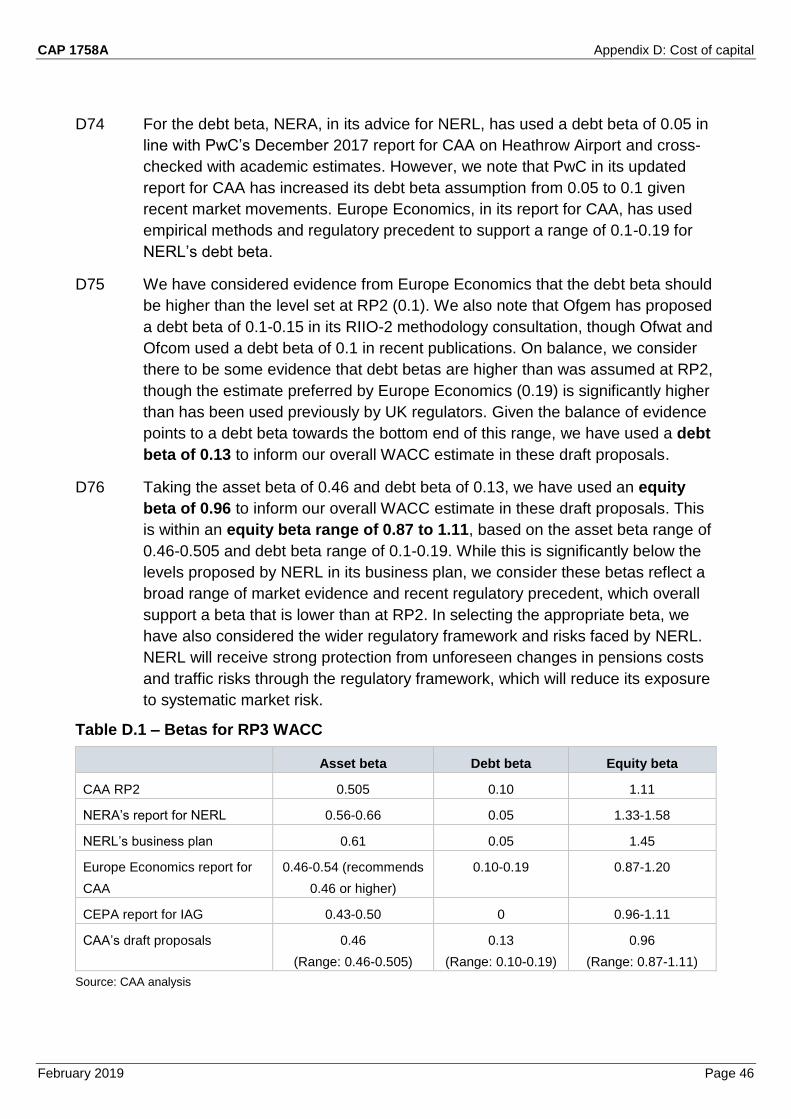
CAP 1758A Appendix D: Cost of capital
February 2019 Page 46
D74 For the debt beta, NERA, in its advice for NERL, has used a debt beta of 0.05 in
line with PwC’s December 2017 report for CAA on Heathrow Airport and cross-
checked with academic estimates. However, we note that PwC in its updated
report for CAA has increased its debt beta assumption from 0.05 to 0.1 given
recent market movements. Europe Economics, in its report for CAA, has used
empirical methods and regulatory precedent to support a range of 0.1-0.19 for
NERL’s debt beta.
D75 We have considered evidence from Europe Economics that the debt beta should
be higher than the level set at RP2 (0.1). We also note that Ofgem has proposed
a debt beta of 0.1-0.15 in its RIIO-2 methodology consultation, though Ofwat and
Ofcom used a debt beta of 0.1 in recent publications. On balance, we consider
there to be some evidence that debt betas are higher than was assumed at RP2,
though the estimate preferred by Europe Economics (0.19) is significantly higher
than has been used previously by UK regulators. Given the balance of evidence
points to a debt beta towards the bottom end of this range, we have used a debt
beta of 0.13 to inform our overall WACC estimate in these draft proposals.
D76 Taking the asset beta of 0.46 and debt beta of 0.13, we have used an equity
beta of 0.96 to inform our overall WACC estimate in these draft proposals. This
is within an equity beta range of 0.87 to 1.11, based on the asset beta range of
0.46-0.505 and debt beta range of 0.1-0.19. While this is significantly below the
levels proposed by NERL in its business plan, we consider these betas reflect a
broad range of market evidence and recent regulatory precedent, which overall
support a beta that is lower than at RP2. In selecting the appropriate beta, we
have also considered the wider regulatory framework and risks faced by NERL.
NERL will receive strong protection from unforeseen changes in pensions costs
and traffic risks through the regulatory framework, which will reduce its exposure
to systematic market risk.
Table D.1 – Betas for RP3 WACC
Asset beta Debt beta Equity beta
CAA RP2 0.505 0.10 1.11
NERA’s report for NERL 0.56-0.66 0.05 1.33-1.58
NERL’s business plan 0.61 0.05 1.45
Europe Economics report for
CAA
0.46-0.54 (recommends
0.46 or higher)
0.10-0.19 0.87-1.20
CEPA report for IAG 0.43-0.50 0 0.96-1.11
CAA’s draft proposals 0.46
(Range: 0.46-0.505)
0.13
(Range: 0.10-0.19)
0.96
(Range: 0.87-1.11)
Source: CAA analysis

CAP 1758A Appendix D: Cost of capital
February 2019 Page 47
Post-tax cost of equity
D77 NERL proposes a post-tax cost of equity of 9.65% (RPI-deflated), based on the
CAPM approach and its estimates for the TMR, RFR and equity beta.42 This is
the mid-point of the range estimated by NERA of 8.97% to 10.32% and is
significantly above the allowed cost of equity set at RP2 (6.87%).
D78 Based on our proposed range and point estimates above for the TMR, RFR and
equity beta and using the same CAPM approach, we use a range for the post-
tax cost of equity of 4.12% to 7.05%, with a point estimate of 5.13% (RPI-
deflated) to inform our overall WACC estimate in these draft proposals.43 Our
estimate is significantly below the estimate proposed by NERL due to lower
estimates for the RFR, TMR and equity beta.
D79 Our proposal is within the range estimated by CEPA for IAG (4.70% to 6.82%).
However, CEPA assumed a zero debt beta. Introducing a debt beta similar to our
proposed range would significantly reduce its cost of equity range.
D80 Our point estimate is higher than the post-tax cost of equity in recent publications
from Ofwat for PR19 (4.01%), Ofgem for RIIO-2 (2.96%) and Ofcom for
Openreach (4.42%) We would expect NERL to have a higher cost of equity as
NERL faces a portion of demand risk, unlike the regulated water and energy
companies.
D81 Ofgem, in its RIIO-2 methodology consultation provided a number of cross-
checks from investment managers and advisers, bids for offshore electricity
transmission assets and infrastructure fund discount rates. Ofgem concludes that
these checks support Ofgem’s CAPM cost of equity range of 4-5% in CPIH-
deflated terms, or 2.96-3.95% in RPI-terms. We consider that market-based
measures can provide useful cross-checks for the efficient cost of equity for
NERL, though recognise that the nature of risks faced by NERL, such as its
share of traffic risks, are likely to support a higher cost of equity for NERL for
RP3.
Table D.2 – Post-tax cost of equity for RP3 WACC
NERL business plan CAA draft proposal Notes
Post-tax cost of
equity (RPI-deflated)
9.65% 5.13% CAA has used lower estimates
for risk-free rate, beta and total
market return to calculate the
cost of equity using CAPM
Source: CAA analysis
42 The post-tax cost of equity is calculated as: RFR + Equity beta * (TMR – RFR).
43 The CAA’s draft proposed post-tax cost of equity of 5.13% (RPI-deflated), is calculated as: RFR (-1.4%) +
Equity beta (0.96) * [TMR (5.4%) – RFR (-1.4%)].

CAP 1758A Appendix D: Cost of capital
February 2019 Page 48
Cost and proportion of embedded debt
D82 NERL has proposed a cost of embedded debt of 2.13%, based on the nominal
yield at issuance of NERL’s existing bond (5.4%), deflated by NERA’s inflation
forecast of 3.2% (using the Fisher formula). NERL’s existing bond has a
declining balance and is due to mature in 2026.
D83 PwC reviewed the efficiency of the cost of the existing bond for CAA at RP2. As
PwC did not identify any issues, we used this as the basis of the cost of
embedded debt at RP2. We consider this approach remains appropriate for RP3.
D84 Using the same nominal cost of debt of 5.4%, we use a cost of embedded debt
of 2.3% in RPI-deflated terms to inform our overall WACC estimate in these draft
proposals, using the Fisher formula and our RPI forecast of 3.0% for RP3. This is
higher than NERL’s estimate given its higher forecast for RPI inflation over RP3
of 3.2%.
D85 We have reviewed the average proportions of embedded and new debt in RP3
from NERL’s RP3 business plan and concluded that NERL’s assumption of an
embedded debt proportion of 30% (70% new debt) appears reasonable. We
therefore use a proportion of embedded debt of 30% to inform our overall
WACC estimate in these draft proposals.
Table D.3 – Cost of embedded debt for RP3 WACC
NERL business plan CAA draft proposal Notes
Cost of embedded
debt (RPI-deflated)
2.13% 2.30% CAA has increased to reflect
our updated RPI forecast,
which is lower than used by
NERL
Proportion of
embedded debt
30% 30% No change to NERL’s
business plan
Source: CAA analysis
Cost of new debt
D86 In RP2, we set a cost of new debt of 1.75% (RPI-deflated). Since 2014, the costs
of debt for regulated UK utilities have fallen significantly, with much lower cost of
debt estimates being proposed by other UK regulators in recent publications.
D87 In its RP3 business plan, NERL proposed a cost of new debt of 0.42% (RPI-
deflated). This was based on estimates from its advisors NERA, starting from the
yield on its existing bond with adjustments for a longer maturity, expected
increases in rates to mid-RP3 and a notice period premium, reflecting that debt-
holders will expect a higher cost of holding debt beyond NERL’s 10-year rolling
notice period.
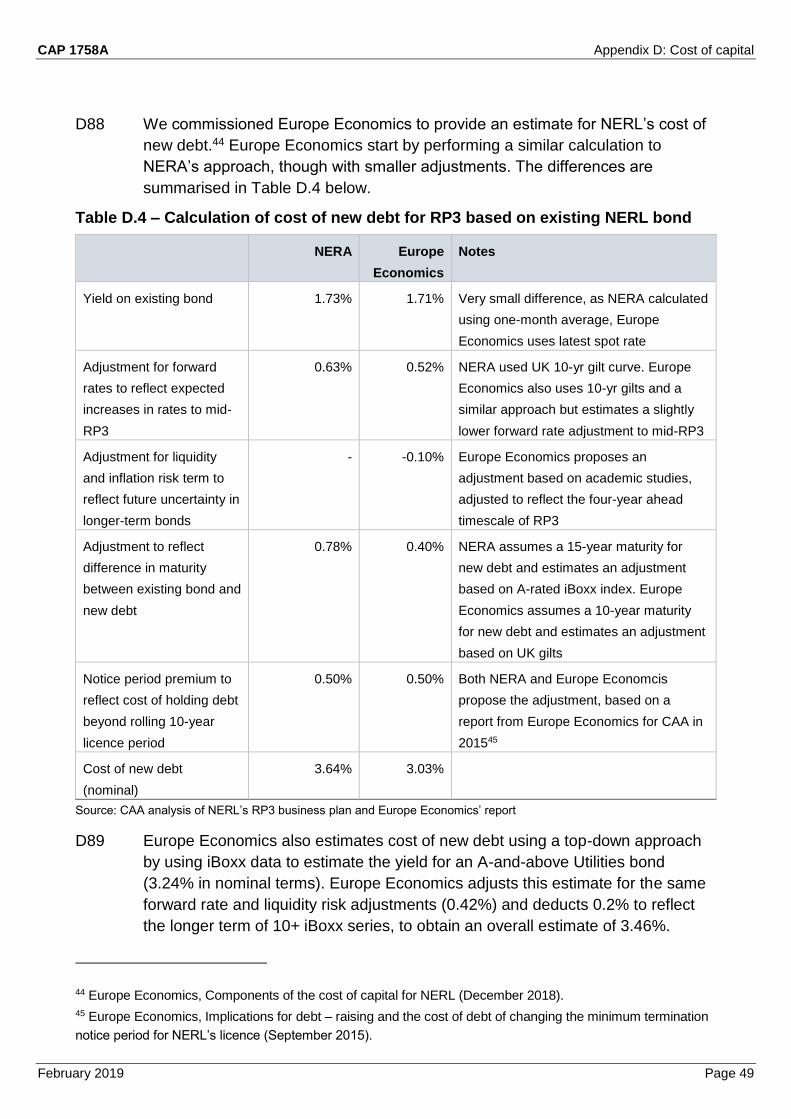
CAP 1758A Appendix D: Cost of capital
February 2019 Page 49
D88 We commissioned Europe Economics to provide an estimate for NERL’s cost of
new debt.44 Europe Economics start by performing a similar calculation to
NERA’s approach, though with smaller adjustments. The differences are
summarised in Table D.4 below.
Table D.4 – Calculation of cost of new debt for RP3 based on existing NERL bond
NERA Europe
Economics
Notes
Yield on existing bond 1.73% 1.71% Very small difference, as NERA calculated
using one-month average, Europe
Economics uses latest spot rate
Adjustment for forward
rates to reflect expected
increases in rates to mid-
RP3
0.63% 0.52% NERA used UK 10-yr gilt curve. Europe
Economics also uses 10-yr gilts and a
similar approach but estimates a slightly
lower forward rate adjustment to mid-RP3
Adjustment for liquidity
and inflation risk term to
reflect future uncertainty in
longer-term bonds
- -0.10% Europe Economics proposes an
adjustment based on academic studies,
adjusted to reflect the four-year ahead
timescale of RP3
Adjustment to reflect
difference in maturity
between existing bond and
new debt
0.78% 0.40% NERA assumes a 15-year maturity for
new debt and estimates an adjustment
based on A-rated iBoxx index. Europe
Economics assumes a 10-year maturity
for new debt and estimates an adjustment
based on UK gilts
Notice period premium to
reflect cost of holding debt
beyond rolling 10-year
licence period
0.50% 0.50% Both NERA and Europe Economcis
propose the adjustment, based on a
report from Europe Economics for CAA in
201545
Cost of new debt
(nominal)
3.64% 3.03%
Source: CAA analysis of NERL’s RP3 business plan and Europe Economics’ report
D89 Europe Economics also estimates cost of new debt using a top-down approach
by using iBoxx data to estimate the yield for an A-and-above Utilities bond
(3.24% in nominal terms). Europe Economics adjusts this estimate for the same
forward rate and liquidity risk adjustments (0.42%) and deducts 0.2% to reflect
the longer term of 10+ iBoxx series, to obtain an overall estimate of 3.46%.
44 Europe Economics, Components of the cost of capital for NERL (December 2018).
45 Europe Economics, Implications for debt – raising and the cost of debt of changing the minimum termination
notice period for NERL’s licence (September 2015).

CAP 1758A Appendix D: Cost of capital
February 2019 Page 50
Europe Economics recommends choosing the mid-point of its range from the
bottom-up (3.03%) and top-down approaches (3.46%), which would give an
estimate for cost of new debt of 3.25% (in nominal terms).
D90 We consider that Europe Economics’ analysis provides an appropriate starting
point for these draft proposals (though we also cross-check below against
NERA’s estimate given NERA has assumed a 15-year maturity for new debt,
while Europe Economics has assumed a 10-year maturity), but that two
adjustments are appropriate.
▪ There is not sufficiently compelling evidence at this stage to support the
upward adjustment for the notice period premium of 0.5%. We consider that
there is strong protection in the UK RAB-based regulatory framework that
should provide reasonable protection for debt holders under a rolling licence
period. Moreover, if the cost of raising bonds beyond the rolling licence period
was significantly higher in practice, then NERL may be able to mitigate some
of this increase (e.g. by issuing shorter-term bonds or considering other forms
of debt). We note that CEPA, in its report for IAG,46 also raised concerns
around Europe Economics’ analysis which suggests the impact of the notice
period on the cost of debt may be materially overstated.
▪ There is not sufficiently compelling evidence at this stage to support the
downward adjustment for liquidity and inflation risk term of 0.1%. We note
from Europe Economics’ report and further evidence from NERA that this
estimate can be highly variable and uncertain. This adjustment also appears
not to be used by other UK regulators in recent publications.
D91 Bearing the above in mind we have adjusted Europe Economics’ range to
remove the adjustments for liquidity and inflation risk, and the notice period
premium. This has a net reduction of 0.4% to Europe Economics’ estimate based
on the cost of NERL’s bond, reducing this from 3.03% to 2.63% (in nominal
terms). This has a net increase of 0.1% to Europe Economics’ notional estimate
based on iBoxx indices, from 3.46% to 3.56% (in nominal terms). Following
Europe Economics’ approach of taking the mid-point of these estimates give a
cost of new debt of 3.10% (in nominal terms).
D92 For these draft proposals, we use a real cost of new debt of 0.1% to inform our
overall WACC estimate in these draft proposals, based on the 3.10% in nominal
terms, deflated by our RPI forecast of 3.0% p.a. We use a cost of new debt
range of -0.4% to 0.5% based on the range of estimates above (2.63% to 3.56%
in nominal terms), deflated using RPI inflation assumption of 3%.
46 CEPA, Cost of capital for NATS (En-Route) plc (November 2018).

CAP 1758A Appendix D: Cost of capital
February 2019 Page 51
D93 We have cross-checked that the cost of new debt of 3.10% is close to NERA’s
estimate for the cost of new debt if you also remove the notice period premium of
0.5% for consistency (which reduces its estimate from 3.64% to 3.14%).
D94 CEPA, in its report for IAG recommended a cost of new debt from 2.20% (based
on nominal yield of NERL’s existing bond of 1.73% adjusted for forward rates but
not maturity) to 2.64% (based on adjustment for forward rates and maturity). We
consider that CEPA’s approach provides a useful cross-check though notes that
CEPA has not cross-checked this against the notional iBoxx index, so this range
may understate the cost of new debt.
D95 NERA proposes an additional transaction cost of 0.15% for new debt based on
the allowed cost at RP2. Europe Economics estimates a lower transaction cost
of 0.07% based on its analysis of issuance and liquidity costs for utility
companies.
D96 From a review of recent regulatory precedent, in general an allowance of 0.10%
is included for the cost of new debt (e.g. this is adopted by Ofwat in its guidance
for PR19, Ofcom in its consultation on the business connectivity market review
and in PwC’s advice to CAA on the next Heathrow Airport price control). For
these draft proposals, we include a transaction cost of 0.1% to inform our
overall WACC estimate in these draft proposals, which is between the estimates
from NERA and Europe Economics.
Table D.5 – Cost of new debt for RP3 WACC
NERL business plan CAA draft proposal Notes
Cost of new debt
(RPI-deflated)
0.42% 0.10% Reduced to reflect evidence from
Europe Economics and removed
notice period premium
Transaction cost 0.15% 0.10% Reduced to reflect evidence form
Europe Economics and regulatory
precedent
Source: CAA analysis
Cost of debt
D97 NERL proposed an overall cost of debt of 1.08% (in RPI-deflated terms),
consistent with the estimate by NERA.
D98 Our draft proposals use a cost of debt of 0.86%, with a range of 0.51% to
1.14% to inform our overall WACC estimate in these draft proposals. The cost of
debt of 0.86% is calculated as the weighted average of the cost of new debt
(0.1% cost * 70% proportion) and cost of embedded debt (2.3% * 30%
proportion), plus an allowance for transaction costs of new debt (0.1%). This is
lower than estimated by NERA as it reflects the lower cost of new debt, partially
offset by a higher cost of embedded debt (reflecting a lower RPI forecast).
CAP 1758A Appendix D: Cost of capital
February 2019 Page 52
D99 CEPA, in its report for IAG, estimated a cost of debt of 0.08% to 0.39%.
However, we consider this is likely to underestimate the efficient cost of new debt
for NERL and excludes any allowance for transaction costs.
Tax uplift
D100 NERL proposes to continue the RP2 approach of applying a pre-tax WACC, with
the tax uplift applied to the cost of equity based on the effective tax rate actually
paid, rather than a notional corporation tax rate. We consider this approach is
reasonable as it protects users by ensuring that they share in gains from NERL
minimising its tax costs.
D101 In its RP3 business plan, NERL included a tax uplift of 12.7% in the pre-tax
WACC. This is based on the current headline corporation tax rate of 19% but
also takes account of research and development tax credits and allowances for
airspace design capex in reducing NERL’s tax cost.
D102 As part of its RP3 business plan, NERL provided a model to estimate the
necessary tax uplift to meet NERL’s estimated tax cost. We have used this tax
model, as applied to these draft proposals, to estimate a lower tax uplift of
11.7%. We use this uplift in the draft proposals to inform our overall WACC
estimate in these draft proposals.
D103 We asked our advisers Grant Thornton, to review the tax calculation. Grant
Thornton has raised some questions around the assumptions used in the tax
calculation. We will work with NERL to resolve these ahead of the final
proposals.
Overall cost of capital
D104 We use the components above to estimate an overall vanilla WACC of 2.57%
(in RPI-deflated terms) and a pre-tax WACC of 2.84% (RPI-deflated) for these
draft proposals, with a range of 2.17% to 3.88%. This is significantly below
NERL’s proposed pre-tax WACC of 5.07%, particularly reflecting differences in
the cost of equity. This is set out in detail in Table D.6 below.
D105 We have reviewed the vanilla WACC with the recent regulatory precedent and
PwC’s report for CAA on Heathrow Airport’s next price control, in Table D.11.
This shows that our draft proposed WACC appears to be broadly in line with
recent UK regulatory precedent and so appears reasonable overall. While our
draft proposals typically include a higher cost of equity reflecting higher betas
(due to NERL facing demand risk, for example), this is partially offset by a lower
estimate for the cost of debt (particularly reflecting the relatively high proportion
of low-cost new debt that NERL expects to raise during RP3).
D106 In addition, our draft proposed vanilla WACC for RP2 is around 1.7% lower (in
RPI-deflated terms) than allowed at RP2. By comparison, this is around the mid-
point of the change between the allowed WACC at Q6 and PwC’s advice to the

CAP 1758A Appendix D: Cost of capital
February 2019 Page 53
CAA on H7 (-2.2% to -1.3%) and is within the range of the changes in Ofwat’s
vanilla WACC from PR14 to PR19 guidance (-1.3%) and Ofgem’s vanilla WACC
from RIIO-T1/GD1 to its RIIO-2 consultation (-2.2% to -2.8%).
Table D.10 – CAA’s draft prososals for NERL’s RP3 WACC (RPI-deflated)
CAA –
RP2
allowance
NERA –
low for
RP3
NERA –
high for
RP3
NERL –
business
plan
CAA -
Low for
RP3
CAA -
Central for
RP3
CAA -
High for
RP3
Gearing 60% 60% 60% 60% 60% 60% 60%
Cost of new
debt
1.75% 0.42% 0.42% 0.42% -0.40% 0.10% 0.50%
Cost of
embedded
debt
2.50% 2.13% 2.13% 2.13% 2.30% 2.30% 2.30%
Proportion of
new debt
20% 70% 70% 70% 70% 70% 70%
Issuance
costs
0.15% 0.15% 0.15% 0.15% 0.10% 0.10% 0.10%
Pre-tax cost
of debt
2.50% 1.08% 1.08% 1.08% 0.51% 0.86% 1.14%
Total market
return
6.25% 6.50% 7.10% 6.80% 5.00% 5.40% 6.25%
Risk-free
rate
0.75% -1.10% 1.50% 0.46% -1.50% -1.40% -0.90%
Asset beta 0.505 0.56 0.66 0.61 0.46 0.46 0.505
Equity beta 1.11 1.33 1.58 1.45 0.87 0.96 1.11
Debt beta 0.10 0.05 0.05 0.05 0.19 0.13 0.10
Post-tax
cost of
equity
6.87% 8.97% 10.32% 9.65% 4.12% 5.13% 7.05%
Vanilla
WACC
4.25% 4.24% 4.78% 4.51% 1.96% 2.57% 3.51%
Tax uplift 37% 12.7% 11.7%
Pre-tax
WACC
5.86% 5.07% 2.84%
Source: CAA analysis
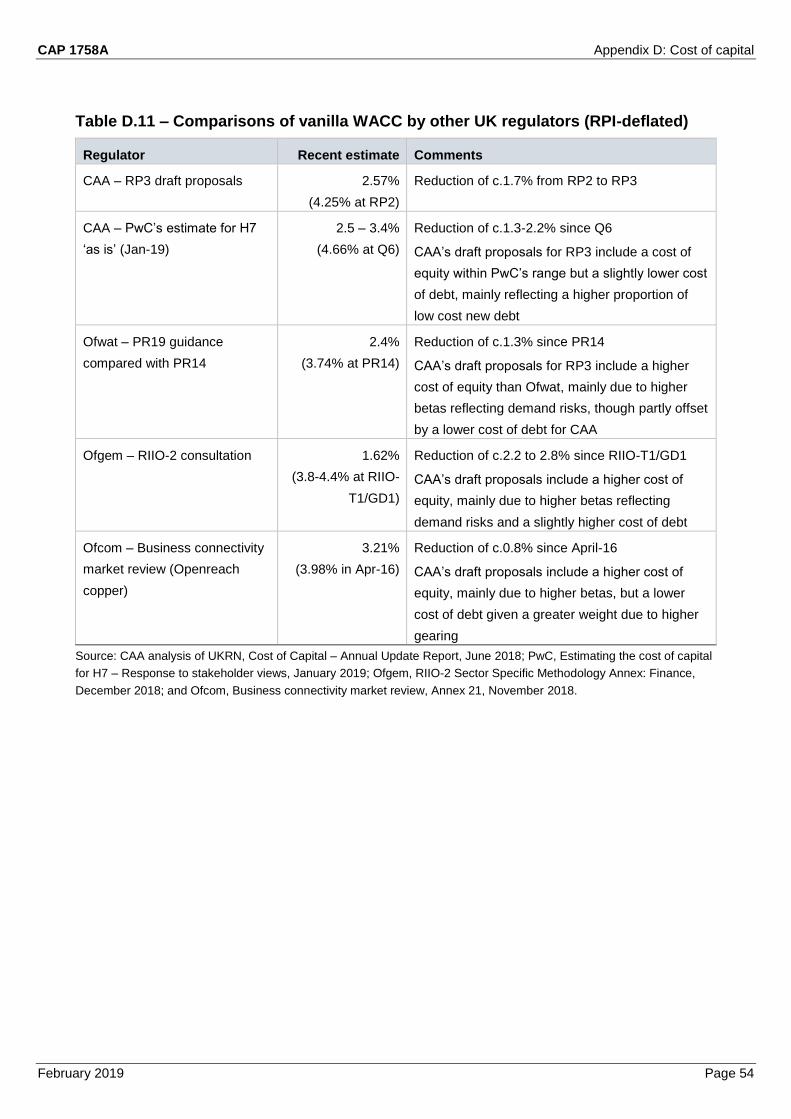
CAP 1758A Appendix D: Cost of capital
February 2019 Page 54
Table D.11 – Comparisons of vanilla WACC by other UK regulators (RPI-deflated)
Regulator Recent estimate Comments
CAA – RP3 draft proposals 2.57%
(4.25% at RP2)
Reduction of c.1.7% from RP2 to RP3
CAA – PwC’s estimate for H7
‘as is’ (Jan-19)
2.5 – 3.4%
(4.66% at Q6)
Reduction of c.1.3-2.2% since Q6
CAA’s draft proposals for RP3 include a cost of
equity within PwC’s range but a slightly lower cost
of debt, mainly reflecting a higher proportion of
low cost new debt
Ofwat – PR19 guidance
compared with PR14
2.4%
(3.74% at PR14)
Reduction of c.1.3% since PR14
CAA’s draft proposals for RP3 include a higher
cost of equity than Ofwat, mainly due to higher
betas reflecting demand risks, though partly offset
by a lower cost of debt for CAA
Ofgem – RIIO-2 consultation 1.62%
(3.8-4.4% at RIIO-
T1/GD1)
Reduction of c.2.2 to 2.8% since RIIO-T1/GD1
CAA’s draft proposals include a higher cost of
equity, mainly due to higher betas reflecting
demand risks and a slightly higher cost of debt
Ofcom – Business connectivity
market review (Openreach
copper)
3.21%
(3.98% in Apr-16)
Reduction of c.0.8% since April-16
CAA’s draft proposals include a higher cost of
equity, mainly due to higher betas, but a lower
cost of debt given a greater weight due to higher
gearing
Source: CAA analysis of UKRN, Cost of Capital – Annual Update Report, June 2018; PwC, Estimating the cost of capital
for H7 – Response to stakeholder views, January 2019; Ofgem, RIIO-2 Sector Specific Methodology Annex: Finance,
December 2018; and Ofcom, Business connectivity market review, Annex 21, November 2018.

CAP 1758A Appendix E: Service quality metrics – additional information
February 2019 Page 55
Service quality metrics – additional information
E1 The service quality metrics and incentives for the UK for RP3 are based on the
performance measures in place for RP2. This appendix provides further detail on
the calculation of the service quality metrics for the Environment and Capacity
KPAs.
Environment
3Di incentive scheme
E2 The 3Di incentive scheme is established on the basis of the targets discussed in
chapter 3. As in RP2, a deadband of ±5% is proposed for RP3 within which no
bonus or penalty is triggered. Beyond the deadband, the incentive will follow a
smooth sliding scale until +/-25% of the target at which point maximum financial
bonus or penalty will be reached.
E3 The incentive rate is calculated evenly for each 3Di unit within the range +5% to
+25% of the target (and correspondingly between -5% and -25% of the target).
For example, the incentive rate for 2020 is ±0.185% of NERL’s Determined
Costs for each 3Di unit beyond the deadband, up to a maximum of ±1% of
Determined Costs. Figure E.1 illustrates the incentive scheme for 3Di.
E4 As in RP2, the 3Di thresholds are not modulated for traffic.
Figure E.1: 3Di incentive scheme
Source: CAA

CAP 1758A Appendix E: Service quality metrics – additional information
February 2019 Page 56
Capacity - C2
C2 incentive scheme
E5 The C2 is an adjusted and modulated metric that is used for the purpose of the
mandatory incentive scheme in the capacity KPA. It is referred to as ‘pivot value’
in the performance regulation.
E6 As indicated in chapter 4, we intend to maintain this target at the levels targeted
currently in RP2, subject to annual modulation.
E7 The performance regulation requires a symmetric ‘deadband’ range be applied
around the C2 target, so that minor variations in ATFM delay do not lead to
bonuses or penalties.
E8 In RP2, under the previous performance regulation, we set an asymmetric
deadband of -20% to +10% of targeted value. For RP3 we propose that the
deadband is set at ±15%. This means that NERL will earn a bonus should its
performance in any year be more than 15% better than the targets set out in
chapter 4 (i.e. ATFM delay of 0.15 minutes/flight47 or lower). It would be subject
to a penalty should its performance in any year be more than 15% worse than
the targets set out in chapter 4 (i.e. ATFM delay of 0.21 minutes/flight or higher).
E9 As in RP2, maximum allowed bonuses or penalties would be reached if NERL’s
performance is outside the deadbands by an additional ±40%. The incentive will
follow a sliding scale as illustrated in Figure E.2 below.
Figure E.2: C2 deadband and incentives
Source: CAA
47 Rounded to two decimal places.

CAP 1758A Appendix E: Service quality metrics – additional information
February 2019 Page 57
Modulation of C2
E10 The performance regulation allows for modulation of the C2 pivot values, in so
far as:
▪ they shall be set annually by the NSA for the following year and be subject to
consultation with the concerned airspace users and ANSPs;
▪ they shall be based on the reference value for the relevant ANSP from the
November release of the Network Operations Plan in the year preceding the
application of the target; and
▪ the modulation mechanism shall be defined in the performance plan, apply
for each year of the Reference Period, and not be changed during the
Reference Period.
E11 We propose to apply a ‘trigger’ to ensure that modulation of the C2 value reflects
the expected positive relationship between traffic volume and delay.
E12 Upwards modulation would be triggered if both of the following conditions are
met:
a. in year n the actual traffic volume for the UK FIR as reported by the Network
Manager is more than 4% higher than the forecast set out for year n in the
final performance plan; and
b. the reference value for year n in the Network Manager’s November Network
Operations Plan in year n-1 is higher than the reference value for year n in
the Network Manager’s November 2019 Network Operations Plan.
E13 Downward modulation would be triggered if both of the following conditions are
met:
a. in year n the actual traffic volume for the UK FIR as reported by the Network
Manager is more than 4% lower than the forecast set out for year n in the
final performance plan; and
b. the reference value for year n in the Network Manager’s November Network
Operations Plan in year n-1 is lower than the reference value for year n in the
Network Manager’s November 2019 Network Operations Plan.
E14 If the conditions for upward or downward modulation apply, the C2 value will be
modulated by the ratio of:
a. the reference value for year n in the Network Manager’s November NOP in
year n-1; and
b. the reference value for year n in the Network Manager’s November 2019
NOP.

CAP 1758A Appendix E: Service quality metrics – additional information
February 2019 Page 58
E15 Table E.1 illustrates how modulation of C2 would work in a year in which the
conditions for upward or downward modulation applies.
Table E.1: Example of modulation of the KPI
Modulation upwards Modulation downwards
Difference between actual and forecast traffic > 4% < -4%
A UK target (codes C, R, S, T, M,
P only)
0.18 (delay minutes / flight) 0.18 (delay minutes / flight)
B Reference Value (Nov 2019) 0.23 (delay minutes / flight) 0.23 (delay minutes / flight)
C Reference Value (Nov yean n-1) 0.25 (delay minutes / flight) 0.21 (delay minutes / flight)
D = C / B Ratio of Reference Values 1.087 0.913
E = A x D Modulated UK target 0.196 (delay minutes /
flight)
0.164 (delay minutes /
flight)
Source: CAA
Capacity - C3
Calculation of C3
E16 The C3 metric is an impact score, which places greater weight on long delays
and delays in the morning and the evening peaks. The targeted levels of the C3
impact score are discussed in chapter 4. The annual impact score is calculated
by weighting ATFM delays in accordance with Table E.2.
Table E.2: Weights for impact score
Morning peak period Evening peak period Other times
Delay > 0 and <= 15 minutes 3 2 1
Delay > 15 and <= 30 minutes 6 3 2
Delay > 30 and <= 60 minutes 9 6 3
Delay > 60 minutes 18 9 6
Source: CAA
Notes: "Morning peak" means flights with an off-block estimated time between 0400 and 0800 UTC in Summer (April –
October inclusive) and between 0500 and 0900 UTC in Winter (January – March inclusive and November-December
inclusive). "Evening Peak" means flights with an off-block estimated time between 1500 and 1900 UTC in Summer (April
–October inclusive) and between 1600 and 2000 UTC in Winter (January-March inclusive and November-December
inclusive).
E17 The weights in Table E.2 were developed through consultation between NERL
and users for a previous control period (CP3) before the performance regulation
applied. It is noted that there is no consistent relationship between weights. For
example:
▪ For morning peak: 3 x 2 = 6 x 1.5 = 9 x 2 = 18
CAP 1758A Appendix E: Service quality metrics – additional information
February 2019 Page 59
▪ For evening peak: 2 x 1.5 = 3 x 2 = 6 x 1.5 = 9
▪ For delays of up to 15 minutes: 1 x 2 = 2 x 1.5 = 3
▪ For delays of between 15 and 30 minutes: 2 x 1.5 = 3 x 2 = 6
E18 Changing the weights to be consistent both across and down the table would
require recalculating the threshold beyond which NERL would earn a financial
bonus or penalty. At this stage it is not proposed to do so for RP3, although
stakeholder views on this are welcome.
C3 incentive scheme
E19 The thresholds beyond which NERL can earn a bonus or penalty for the C3
metric are determined with reference to C2. That is:
a. the (upper) threshold above which NERL is penalised be equal to the C3
score derived from the level of the C2 target of 0.18 minutes delay per flight;
and
b. to maintain consistency with RP2, the (lower) threshold below which NERL
would earn a reward be set at two-thirds of the upper threshold.48
E20 In RP2 a ratio of 2.2 was used to covert C2 value to C3 thresholds. However,
NERL’s performance so far in RP2 (including its projection for 2018) point to an
average ratio of 1.89. The CAA has used a ratio of 2.0 in its proposals.
E21 The rate at which NERL’s performance would affect any financial advantage or
disadvantage it earns has been set such that the maximum reward of 1% of
Determined Costs would be earned if the impact score is zero and the traffic is
as forecast for 2020.49 That rate is £0.168 in 2017 prices. The penalty rate is
equal to the reward rate (up to a cap of -1% of Determined Costs) – i.e. -£0.168
in 2017 prices. The bonus and penalty rate will be indexed to CPI during RP3.
E22 Figure E.3 illustrates the application of the incentive.
48 In RP2 the lower threshold was based on delay forecasts in NERL’s business plan.
49 The rate is fixed in real terms for every year of RP3 but is calibrated based on 2020 traffic.

CAP 1758A Appendix E: Service quality metrics – additional information
February 2019 Page 60
Figure E.3: C3 incentive scheme
Source: CAA
Modulation of C3
E23 We propose to retain the approach to modulating C3 for traffic volumes that was
used in RP2. If traffic is more than ±4% away from the level forecast for that
year, the thresholds will be adjusted. The thresholds will be modulated by the
change in traffic beyond the ±4% threshold, multiplied by an “elasticity factor” of
5.
E24 For example, if the traffic growth in a particular year is 7% higher than forecast,
the thresholds will be adjusted upwards by (7%-4%) x 5 = 15%. That is, in this
example, the lower threshold would increase from 14 to 16.1 and the upper
threshold would increase from 22 to 25.3.
Capacity - C4
Calculation of C4
E25 The C4 metric (Daily Excess Delay Score) is based on weighted delays
exceeding pre-determined thresholds on a daily basis. The targeted levels of C4
are discussed in chapter 4.

CAP 1758A Appendix E: Service quality metrics – additional information
February 2019 Page 61
E26 C4 is calculated by weighting ATFM delay in accordance with Table E.3. Delay
below the lower threshold is weighted as zero.
Table E.3: Weighting of delay to derive excess delay score - weightings
Season Daily delay thresholds (average delay per flight) Weighting
Winter Lower Threshold 40 seconds 1
Upper Threshold 80 seconds 2
Summer Lower Threshold 60 seconds 1
Upper Threshold 110 seconds 2
Source: CAA
Note: Summer is April –October inclusive. Winter is January – March inclusive and November-December inclusive.
C4 incentive scheme
E27 C4 is a penalty-only incentive scheme. For RP3 we are proposing to increase the
maximum penalty to 0.5% of determined costs. In order to retain a broadly
similar incentive rate to RP2, the maximum penalty would be incurred if traffic is
as forecast for 2020 and NERL’s C4 score is 20% higher than the threshold.
That rate is -£0.00327021 in 2017 prices. The penalty rate will be indexed to CPI
during RP3. Figure E.4 illustrates the C4 incentives.
E28 As in RP2, the C4 threshold is not modulated for traffic volume.
Figure E.4: C4 incentive scheme
Source: CAA

CAP 1758A Appendix F: Costs reporting tables
February 2019 Page 62
Costs reporting tables

United Kingdom
Currency : GBP £
All Entities
Cost details 2012 2013 2014 2015 2016 2017 2018 2019 2020 2021 2022 2023 2024
1. Detail by nature (in nominal terms)
1.1 Staff 273,294 266,644 250,904 261,862 274,115 265,678 302,280 314,594 337,301 335,989 334,494 337,737 331,370
of which, pension costs 0 0 0 0 0 0 65,324 63,760 80,418 80,680 63,307 61,841 60,785
1.2 Other operating costs 166,812 176,206 172,580 157,592 157,915 164,356 190,778 217,203 227,973 232,246 236,135 237,089 237,122
1.3 Depreciation 133,259 157,111 161,810 163,484 163,024 162,603 152,585 150,923 169,044 141,131 125,960 131,607 143,239
1.4 Cost of capital 68,586 68,484 67,470 59,072 54,881 51,587 47,418 49,174 24,508 27,551 29,579 29,773 29,670
1.5 Exceptional items 16,789 56,387 17,137 15,361 16,430 16,371 14,801 20,633 9,645 9,220 8,895 8,851 8,785
1.6 Total costs 658,741 724,833 669,901 657,371 666,365 660,596 707,863 752,528 768,472 746,136 735,063 745,057 750,186
Total % n/n-1 10.0% -7.6% -1.9% 1.4% -0.9% 7.2% 6.3% 2.1% -2.9% -1.5% 1.4% 0.7%
2. Detail by service (in nominal terms)
2.1 Air Traffic Management 475,867 529,274 483,033 477,941 482,523 475,439 614,341 656,974 666,318 642,596 628,859 633,672 636,689
2.2 Communication 44,566 48,322 44,027 43,483 43,940 43,293 0 0 0 0 0 0 0
2.3 Navigation 14,799 17,654 16,671 16,423 16,501 16,225 0 0 0 0 0 0 0
2.4 Surveillance 30,109 32,211 29,348 28,986 29,290 28,859 0 0 0 0 0 0 0
2.5 Search and rescue 0 0 0 0 0 0 0 0 0 0 0 0 0
2.6 Aeronautical Information 3,995 4,046 5,698 4,384 3,475 3,495 0 0 0 0 0 0 0
2.7 Meteorological services 29,130 28,718 28,213 28,438 27,852 26,446 26,900 26,700 30,938 30,194 31,632 35,186 35,390
2.8 Supervision costs 6,866 7,259 7,248 7,067 6,529 6,493 0 0 0 0 0 0 0
2.9 Other State costs 53,409 57,347 55,663 50,650 56,255 60,347 66,622 68,854 71,216 73,346 74,572 76,200 78,107
2.10 Total costs 658,741 724,833 669,901 657,371 666,365 660,596 707,863 752,528 768,472 746,136 735,063 745,057 750,186
Total % n/n-1 10.0% -7.6% -1.9% 1.4% -0.9% 7.2% 6.3% 2.1% -2.9% -1.5% 1.4% 0.7%
3. Complementary information (in nominal terms)
Average asset base
3.1 Net book val. fixed assets 939,762 927,485 865,540 878,999 888,721 908,862 808,781 838,734 864,294 971,586 1,043,109 1,049,951 1,046,315
3.2 Adjustments total assets 41,682 50,556 71,695 98,161 91,589 83,411 0 0 0 0 0 0 0
3.3 Net current assets 33,018 37,497 61,439 35,862 -39,076 -107,518 0 0 0 0 0 0 0
3.4 Total asset base 1,014,462 1,015,539 998,674 1,013,022 941,234 884,755 808,781 838,734 864,294 971,586 1,043,109 1,049,951 1,046,315
Cost of capital %
3.5 Cost of capital pre tax rate 6.76% 6.74% 6.76% 5.83% 5.83% 5.83% 5.86% 5.86% 2.84% 2.84% 2.84% 2.84% 2.84%
3.6 Return on equity
3.7 Average interest on debts
3.8 Share of financing through equity
Costs of common projects3.9 Common projects 0.0 0.0 0.0 8,958.0 10,651.5 11,884.7 0.0 0.0 0.0 0.0 0.0 0.0 0.0
Costs of new and existing investments 3.10 Depreciation 0 0 0 0 0 0 0 0 0 0 0 0 0
3.11 Cost of capital 0 0 0 0 0 0 0 0 0 0 0 0 0
3.12 Cost of leasing 0 0 0 0 0 0 0 0 0 0 0 0 0
Eurocontrol costs 3.13 Eurocontrol costs (Euro)
3.14 Exchange rate (if applicable)
3.15 Eurocontrol costs (national currency) 43,386 47,046 45,588 42,365 48,197 53,269 51,528 52,598 53,127 53,513 53,994 55,391 56,697
4. Total costs after deduction of costs for services to exempted flights (in nominal terms)
4.1 Costs for exempted VFR flights 0 0 0 0 0 0 0 0 0 0 0 0 0
4.2 Total determined/actual costs 658,741 724,833 669,901 657,371 666,365 660,596 707,863 752,528 768,472 746,136 735,063 745,057 750,186
5. Cost-efficiency KPI - Determined/Actual Unit Cost (in real terms)
5.1 Inflation % 2.80% 2.60% 1.50% 0.00% 0.70% 2.70% 2.51% 2.17% 2.00% 2.00% 2.00% 2.00% 2.00%
5.2 Inflation index (1) 92.9 95.3 96.7 96.7 97.4 100.0 102.5 104.7 106.8 109.0 111.1 113.4 115.6
5.3 Total costs real terms (2) 709,460 760,858 692,804 679,846 684,357 660,596 690,528 718,508 719,344 684,742 661,352 657,200 648,749
Total % n/n-1 7.2% -8.9% -1.9% 0.7% -3.5% 4.5% 4.1% 0.1% -4.8% -3.4% -0.6% -1.3%
5.4 Total Service Units 9,607.9 9,754.9 9,979.4 10,153.9 10,874.8 11,767.6 12,157.0 12,531.0 12,766.0 13,043.0 13,280.0 13,494.0 13,713.0
Total % n/n-1 1.5% 2.3% 1.7% 7.1% 8.2% 3.3% 3.1% 1.9% 2.2% 1.8% 1.6% 1.6%
5.5 Unit cost in real terms prices (3) 73.84 78.00 69.42 66.95 62.93 56.14 56.80 57.34 56.35 52.50 49.80 48.70 47.31
Total % n/n-1 5.6% -11.0% -3.6% -6.0% -10.8% 1.2% 0.9% -1.7% -6.8% -5.1% -2.2% -2.9%
Costs and asset base items in '000 - Service units in '000
(1) Inflation index - Base 100 in 2017, Forecast inflation 2018 and 2019 as per the Performance Plan.
(2) Determined costs (performance plan) and actual costs in real terms
(3) Determined unit costs (performance plan) and actual unit costs in real terms
Determined - Performance Plan - Reference Period 3Actual 2012-2017 Forecast 2018-2019
Table 1 - Total Costs and Unit Costs
CAP 1758A Appendix F: Cost reporting tables
February 2019 63

United Kingdom
Currency : GBP £
NERL
Cost details 2012 2013 2014 2015 2016 2017 2018 2019 2020 2021 2022 2023 2024
1. Detail by nature (in nominal terms)
1.1 Staff 255,644 249,567 234,499 244,548 257,304 249,520 275,380 287,894 306,363 305,795 302,862 302,551 295,980
of which, pension costs 65,324 63,760 80,418 80,680 63,307 61,841 60,785
1.2 Other operating costs 110,160 116,110 114,038 104,260 99,114 101,314 124,156 148,349 156,758 158,900 161,563 160,889 159,015
1.3 Depreciation 127,940 151,794 156,496 158,166 157,707 157,285 152,585 150,923 169,044 141,131 125,960 131,607 143,239
1.4 Cost of capital 68,159 68,119 67,166 56,740 52,610 49,376 47,418 49,174 24,508 27,551 29,579 29,773 29,670
1.5 Exceptional items 10,789 50,387 11,137 9,361 10,430 10,371 14,801 20,633 9,645 9,220 8,895 8,851 8,785
1.6 Total costs 572,693 635,978 583,336 573,075 577,165 567,867 614,341 656,974 666,318 642,596 628,859 633,672 636,689
Total % n/n-1 11.1% -8.3% -1.8% 0.7% -1.6% 8.2% 6.9% 1.4% -3.6% -2.1% 0.8% 0.5%
2. Detail by service (in nominal terms)
2.1 Air Traffic Management 464,435 518,179 472,117 466,289 471,184 464,250 614,341 656,974 666,318 642,596 628,859 633,672 636,689
2.2 Communication 44,566 48,322 44,027 43,483 43,940 43,293
2.3 Navigation 14,799 17,654 16,671 16,423 16,501 16,225
2.4 Surveillance 30,109 32,211 29,348 28,986 29,290 28,859
2.5 Search and rescue 0 0 0 0
2.6 Aeronautical Information 3,995 4,046 5,698 4,384 3,475 3,495
2.7 Meteorological services 0 0 0 0
2.8 Supervision costs 4,766 5,263 5,400 5,226 4,718 4,669
2.9 Other State costs 10,023 10,301 10,075 8,285 8,057 7,077
2.10 Total costs 572,693 635,978 583,336 573,075 577,165 567,867 614,341 656,974 666,318 642,596 628,859 633,672 636,689
Total % n/n-1 11.1% -8.3% -1.8% 0.7% -1.6% 8.2% 6.9% 1.4% -3.6% -2.1% 0.8% 0.5%
3. Complementary information (in nominal terms)
Average asset base
3.1 Net book val. fixed assets 930,600 919,625 858,982 834,238 845,262 866,705 808,781 838,734 864,294 971,586 1,043,109 1,049,951 1,046,315
3.2 Adjustments total assets 41,682 50,556 71,695 98,161 91,589 83,411
3.3 Net current assets 33,018 37,497 61,439 35,862 -39,076 -107,518
3.4 Total asset base 1,005,300 1,007,679 992,116 968,261 897,775 842,598 808,781 838,734 864,294 971,586 1,043,109 1,049,951 1,046,315
Cost of capital %
3.5 Cost of capital pre tax rate 6.78% 6.76% 6.77% 5.86% 5.86% 5.86% 5.86% 5.86% 2.84% 2.84% 2.84% 2.84% 2.84%
3.6 Return on equity 11.54% 11.54% 11.54% 10.90% 10.90% 10.90% 10.9% 10.9% 5.8% 5.8% 5.8% 5.8% 5.8%
3.7 Average interest on debts 3.58% 3.58% 3.58% 2.50% 2.50% 2.50% 2.50% 2.50% 0.86% 0.86% 0.86% 0.86% 0.86%
3.8 Share of financing through equity 40.20% 39.95% 40.08% 40.00% 40.00% 40.00% 40.0% 40.0% 40.0% 40.0% 40.0% 40.0% 40.0%
Costs of common projects3.9 Common projects 8,958.0 10,651.5 11,884.7
Costs of new and existing investments 3.10 Depreciation
3.11 Cost of capital
3.12 Cost of leasing
Eurocontrol costs 3.13 Eurocontrol costs (Euro)
3.14 Exchange rate (if applicable)
3.15 Eurocontrol costs (national currency)
4. Total costs after deduction of costs for services to exempted flights (in nominal terms)
4.1 Costs for exempted VFR flights4.2 Total determined/actual costs 572,693 635,978 583,336 573,075 577,165 567,867 614,341 656,974 666,318 642,596 628,859 633,672 636,689
5. Cost-efficiency KPI - Determined/Actual Unit Cost (in real terms)
5.1 Inflation % 2.80% 2.60% 1.50% 0.00% 0.70% 2.70% 2.51% 2.17% 2.00% 2.00% 2.00% 2.00% 2.00%
5.2 Inflation index (1) 92.9 95.3 96.7 96.7 97.4 100.0 102.5 104.7 106.8 109.0 111.1 113.4 115.6
5.3 Total costs real terms (2) 616,787 667,587 603,280 592,668 592,748 567,867 599,296 627,274 623,721 589,721 565,798 558,949 550,599
Total % n/n-1 8.2% -9.6% -1.8% 0.0% -4.2% 5.5% 4.7% -0.6% -5.5% -4.1% -1.2% -1.5%
5.4 Total Service Units 9,607.9 9,754.9 9,979.4 10,153.9 10,874.8 11,767.6 12,157.0 12,531.0 12,766.0 13,043.0 13,280.0 13,494.0 13,713.0
Total % n/n-1 1.5% 2.3% 1.7% 7.1% 8.2% 3.3% 3.1% 1.9% 2.2% 1.8% 1.6% 1.6%
5.5 Unit cost in real terms prices (3) 64.20 68.44 60.45 58.37 54.51 48.26 49.30 50.06 48.86 45.21 42.61 41.42 40.15
Total % n/n-1 6.6% -11.7% -3.4% -6.6% -11.5% 2.2% 1.5% -2.4% -7.5% -5.8% -2.8% -3.1%
Costs and asset base items in '000 - Service units in '000
(1) Inflation index - Base 100 in 2017
(2) Determined costs (performance plan) and actual costs in real terms
(3) Determined unit costs (performance plan) and actual unit costs in real terms
Determined - Performance Plan - Reference Period 3Forecast 2018-2019Actual 2012-2017
Table 1 - Total Costs and Unit Costs
CAP 1758A Appendix F: Cost reporting tables
February 2019 64

United Kingdom
Currency : GBP £
Met Office
Cost details 2012 2013 2014 2015 2016 2017 2018 2019 2020 2021 2022 2023 2024
1. Detail by nature (in nominal terms)
1.1 Staff 13,730 13,618 13,213 13,288 12,718 12,059 26,900 26,700 30,938 30,194 31,632 35,186 35,390
of which, pension costs
1.2 Other operating costs 11,400 11,100 11,000 9,062 9,046 8,299
1.3 Depreciation 4,000 4,000 4,000 4,000 4,000 4,000
1.4 Cost of capital 2,088 2,088 2,088
1.5 Exceptional items
1.6 Total costs 29,130 28,718 28,213 28,438 27,852 26,446 26,900 26,700 30,938 30,194 31,632 35,186 35,390
Total % n/n-1 -1.4% -1.8% 0.8% -2.1% -5.0% 1.7% -0.7% 15.9% -2.4% 4.8% 11.2% 0.6%
2. Detail by service (in nominal terms)
2.1 Air Traffic Management
2.2 Communication
2.3 Navigation
2.4 Surveillance
2.5 Search and rescue
2.6 Aeronautical Information
2.7 Meteorological services 29,130 28,718 28,213 28,438 27,852 26,446 26,900 26,700 30,938 30,194 31,632 35,186 35,390
2.8 Supervision costs
2.9 Other State costs
2.10 Total costs 29,130 28,718 28,213 28,438 27,852 26,446 26,900 26,700 30,938 30,194 31,632 35,186 35,390
Total % n/n-1 -1.4% -1.8% 0.8% -2.1% -5.0% 1.7% -0.7% 15.9% -2.4% 4.8% 11.2% 0.6%
3. Complementary information (in nominal terms)
Average asset base
3.1 Net book val. fixed assets 39,505 39,505 39,505 0 0 0 0 0 0 0
3.2 Adjustments total assets 0 0 0 0 0 0 0
3.3 Net current assets 0 0 0 0 0 0 0 0 0 0
3.4 Total asset base 0 0 0 39,505 39,505 39,505 0 0 0 0 0 0 0
Cost of capital %
3.5 Cost of capital pre tax rate 5.29% 5.29% 5.29% #DIV/0! #DIV/0! #DIV/0! #DIV/0! #DIV/0! #DIV/0! #DIV/0!
3.6 Return on equity 5.30% 5.30% 5.30%
3.7 Average interest on debts
3.8 Share of financing through equity 100.00% 100.00% 100.00% 100.00% 100.00% 100.00%
Costs of common projects3.9 Common projects
Costs of new and existing investments 3.10 Depreciation
3.11 Cost of capital
3.12 Cost of leasing
Eurocontrol costs 3.13 Eurocontrol costs (Euro)
3.14 Exchange rate (if applicable)
3.15 Eurocontrol costs (national currency)
4. Total costs after deduction of costs for services to exempted flights (in nominal terms)
4.1 Costs for exempted VFR flights4.2 Total determined/actual costs 29,130 28,718 28,213 28,438 27,852 26,446 26,900 26,700 30,938 30,194 31,632 35,186 35,390
5. Cost-efficiency KPI - Determined/Actual Unit Cost (in real terms)
5.1 Inflation % 2.80% 2.60% 1.50% 0.00% 0.70% 2.70% 2.51% 2.17% 2.00% 2.00% 2.00% 2.00% 2.00%
5.2 Inflation index (1) 92.9 95.3 96.7 96.7 97.4 100.0 102.5 104.7 106.8 109.0 111.1 113.4 115.6
5.3 Total costs real terms (2) 31,373 30,145 29,178 29,410 28,604 26,446 26,241 25,493 28,960 27,709 28,460 31,037 30,605
Total % n/n-1 -3.9% -3.2% 0.8% -2.7% -7.5% -0.8% -2.9% -4.3% 2.7% 9.1% -1.4%
5.4 Total Service Units 9,607.9 9,754.9 9,979.4 10,153.9 10,874.8 11,767.6 12,157.0 12,531.0 12,766.0 13,043.0 13,280.0 13,494.0 13,713.0
Total % n/n-1 1.5% 2.3% 1.7% 7.1% 8.2% 3.3% 3.1% 2.2% 1.8% 1.6% 1.6%
5.5 Unit cost in real terms prices (3) 3.27 3.09 2.92 2.90 2.63 2.25 2.16 2.03 2.27 2.12 2.14 2.30 2.23
Total % n/n-1
Costs and asset base items in '000 - Service units in '000
(1) Inflation index - Base 100 in N-3
(2) Determined costs (performance plan) and actual costs in real terms
(3) Determined unit costs (performance plan) and actual unit costs in real terms
Determined - Performance Plan - Reference Period 3Actual 2012-2017 Forecast 2018-2019
Table 1 - Total Costs and Unit Costs
CAP 1758A Appendix F: Cost reporting tables
February 2019 65

United Kingdom
Currency : GBP £
UK CAA + DfT Eurocontrol
Cost details 2012 2013 2014 2015 2016 2017 2018 2019 2020 2021 2022 2023 2024
1. Detail by nature (in nominal terms)
1.1 Staff 3,920 3,459 3,192 4,026 4,093 4,099
of which, pension costs
1.2 Other operating costs 45,252 48,996 47,542 44,270 49,755 54,743 66,622 68,854 71,216 73,346 74,572 76,200 78,107
1.3 Depreciation 1,319 1,317 1,314 1,318 1,317 1,318
1.4 Cost of capital 427 365 304 244 183 123
1.5 Exceptional items 6,000 6,000 6,000 6,000 6,000 6,000
1.6 Total costs 56,918 60,137 58,352 55,858 61,348 66,283 66,622 68,854 71,216 73,346 74,572 76,200 78,107
Total % n/n-1 5.7% -3.0% -4.3% 9.8% 8.0% 0.5% 3.4% 3.4% 3.0% 1.7% 2.2% 2.5%
2. Detail by service (in nominal terms)
2.1 Air Traffic Management 11,432 11,095 10,916 11,652 11,339 11,189
2.2 Communication
2.3 Navigation
2.4 Surveillance
2.5 Search and rescue
2.6 Aeronautical Information
2.7 Meteorological services
2.8 Supervision costs 2,100 1,996 1,848 1,841 1,811 1,824
2.9 Other State costs 43,386 47,046 45,588 42,365 48,198 53,270 66,622 68,854 71,216 73,346 74,572 76,200 78,107
2.10 Total costs 56,918 60,137 58,352 55,858 61,348 66,283 66,622 68,854 71,216 73,346 74,572 76,200 78,107
Total % n/n-1 5.7% -3.0% -4.3% 9.8% 8.0% 0.5% 3.4% 3.4% 3.0% 1.7% 2.2% 2.5%
3. Complementary information (in nominal terms)
Average asset base
3.1 Net book val. fixed assets 9,162 7,860 6,558 5,256 3,954 2,652
3.2 Adjustments total assets
3.3 Net current assets
3.4 Total asset base 9,162 7,860 6,558 5,256 3,954 2,652 0 0 0 0 0 0 0
Cost of capital %
3.5 Cost of capital pre tax rate 4.66% 4.64% 4.64% 4.64% 4.64% 4.64% #DIV/0! #DIV/0! #DIV/0! #DIV/0! #DIV/0! #DIV/0! #DIV/0!
3.6 Return on equity 4.80% 4.80% 4.80% 4.80% 4.80% 4.80%
3.7 Average interest on debts 4.30% 4.30% 4.30% 4.30% 4.30% 4.30%
3.8 Share of financing through equity 72.00% 69.00% 67.00% 68.00% 68.00% 68.00%
Costs of common projects3.9 Common projects
Costs of new and existing investments 3.10 Depreciation
3.11 Cost of capital
3.12 Cost of leasing
Eurocontrol costs 3.13 Eurocontrol costs (Euro) 53,481.3 55,411.6 56,546.0 58,338.0 58,852.0 60,816.0 57,855 59,056 59,650 60,083 60,623 62,192 63,659
3.14 Exchange rate (if applicable) 0.811235 0.849020 0.806208 0.726200 0.818959 0.875911 0.890647 0.890647 0.890647 0.890647 0.890647 0.890647 0.890647
3.15 Eurocontrol costs (national currency) 43,386 47,046 45,588 42,365 48,197 53,269 51,528 52,598 53,127 53,513 53,994 55,391 56,697
4. Total costs after deduction of costs for services to exempted flights (in nominal terms)
4.1 Costs for exempted VFR flights4.2 Total determined/actual costs 56,918 60,137 58,352 55,858 61,348 66,283 66,622 68,854 71,216 73,346 74,572 76,200 78,107
5. Cost-efficiency KPI - Determined/Actual Unit Cost (in real terms)
5.1 Inflation % 2.80% 2.60% 1.50% 0.00% 0.70% 2.70% 2.51% 2.17% 2.00% 2.00% 2.00% 2.00% 2.00%
5.2 Inflation index (1) 92.9 95.3 96.7 96.7 97.4 100.0 102.5 104.7 106.8 109.0 111.1 113.4 115.6
5.3 Total costs real terms (2) 61,300 63,126 60,347 57,768 63,004 66,283 64,991 65,741 66,663 67,311 67,094 67,214 67,546
Total % n/n-1 3.0% -4.4% -4.3% 9.1% 5.2% -1.9% 1.2% 1.0% -0.3% 0.2% 0.5%
5.4 Total Service Units 9,607.9 9,754.9 9,979.4 10,153.9 10,874.8 11,767.6 12,157.0 12,531.0 12,766.0 13,043.0 13,280.0 13,494.0 13,713.0
Total % n/n-1 1.5% 2.3% 1.7% 7.1% 8.2% 3.3% 3.1% 2.2% 1.8% 1.6% 1.6%
5.5 Unit cost in real terms prices (3) 6.38 6.47 6.05 5.69 5.79 5.63 5.35 5.25 5.22 5.16 5.05 4.98 4.93
Total % n/n-1 1.4% -6.6% -5.9% 1.8% -2.8% -5.1% -1.9% -0.5% -1.2% -2.1% -1.4% -1.1%
Costs and asset base items in '000 - Service units in '000
(1) Inflation index - Base 100 in N-3
(2) Determined costs (performance plan) and actual costs in real terms
(3) Determined unit costs (performance plan) and actual unit costs in real terms
Determined - Performance Plan - Reference Period 3Actual 2012-2017 Forecast 2018-2019
Table 1 - Total Costs and Unit Costs
CAP 1758A Appendix F: Cost reporting tables
February 201966

En route charging zone
United Kingdom 2012 A 2013 A 2014 A 2015 A 2016 A 2017 A 2018 F 2019 F 2020 D 2021 D 2022 D 2023 D 2024 D2014A-
2024D
2017A-
2024D
2019B-
2024D
Total en route costs in nominal terms (in national
currency)658,740,665 724,832,527 669,901,156 657,371,102 666,364,998 660,595,764 707,862,786 752,528,345 768,471,749 746,136,391 735,062,563 745,057,322 750,185,840 1.1% 1.8% -0.1%
YoY variation 10.0% -7.6% -1.9% 1.4% -0.9% 7.2% 6.3% 2.1% -2.9% -1.5% 1.4% 0.7%
Inflation index (Base = 100 in 2017) 93 95 97 97 97 100 103 105 107 109 111 113 116 1.8% 2.1% 2.0%
YoY variation 2.6% 1.5% 0.0% 0.7% 2.7% 2.5% 2.2% 2.0% 2.0% 2.0% 2.0% 2.0%
Total en route costs in real terms (in national
currency at 2017 prices)709,459,799 760,858,033 692,804,406 679,845,962 684,356,853 660,595,764 690,528,041 718,508,164 719,343,924 684,741,616 661,351,944 657,200,439 648,749,220 -0.7% -0.3% -2.0%
YoY variation 7.2% -8.9% -1.9% 0.7% -3.5% 4.5% 4.1% 0.1% -4.8% -3.4% -0.6% -1.3%
Total en route Service Units (TSU) 9,607,878 9,754,933 9,979,403 10,153,900 10,874,798 11,767,621 12,157,000 12,531,000 12,766,000 13,043,000 13,280,000 13,494,000 13,713,000 3.2% 2.2% 1.8%
YoY variation 1.5% 2.3% 1.7% 7.1% 8.2% 3.3% 3.1% 1.9% 2.2% 1.8% 1.6% 1.6%
Real en route unit costs (in national currency at
2017 prices)73.84 78.00 69.42 66.95 62.93 56.14 56.80 57.34 56.35 52.50 49.80 48.70 47.31 -3.8% -2.4% -3.8%
YoY variation 5.6% -11.0% -3.6% -6.0% -10.8% 1.2% 0.9% -1.7% -6.8% -5.1% -2.2% -2.9%
Real en route unit costs (in EUR2017) 1 84.30 89.05 79.26 76.44 71.85 64.09 64.85 65.46 64.33 59.94 56.86 55.60 54.01 -3.8% -2.4% -3.8%
YoY variation 5.6% -11.0% -3.6% -6.0% -10.8% 1.2% 0.9% -1.7% -6.8% -5.1% -2.2% -2.9%
1 Average exchange rate 2017 (1 EUR=) 0.875911
Data for the graph 2014 A 2015 A 2016 A 2017 A 2018 F 2019 F 2020 D 2021 D 2022 D 2023 D 2024 D
Real en-route costs (2014=100) 100 98.1295668 98.7806727 95.3509761 99.6714274 103.710103 103.830737 98.8362097 95.4601238 94.8608919 93.6410355
TSUs (2014=100) 100 101.748572 108.972431 117.919088 121.820915 125.568634 127.923484 130.699201 133.074093 135.21851 137.41303
Real en-route unit cost (national currency) 69.42 66.95 62.93 56.14 56.80 57.34 56.35 52.50 49.80 48.70 47.31
Cost efficiency KPI #1: Determined unit cost (DUC) for en route ANS
RP3 Performance Plan (determined 2020-2024)Historical data (actual 2012-2017) Average pct variation p.a.Forecast 2018-2019
69.42
66.95
62.93
56.14 56.80 57.3456.35
52.50
49.8048.70
47.31
40.00
45.00
50.00
55.00
60.00
65.00
70.00
75.00
50
60
70
80
90
100
110
120
130
140
150
2014 A 2015 A 2016 A 2017 A 2018 F 2019 F 2020 D 2021 D 2022 D 2023 D 2024 D
United Kingdom
Real en-route unit cost (national currency)Real en-route costs (2014=100)TSUs (2014=100)
CAP 1758A Appendix F: Cost reporting tables
February 2019 67