APAR - Initial Coverage
17
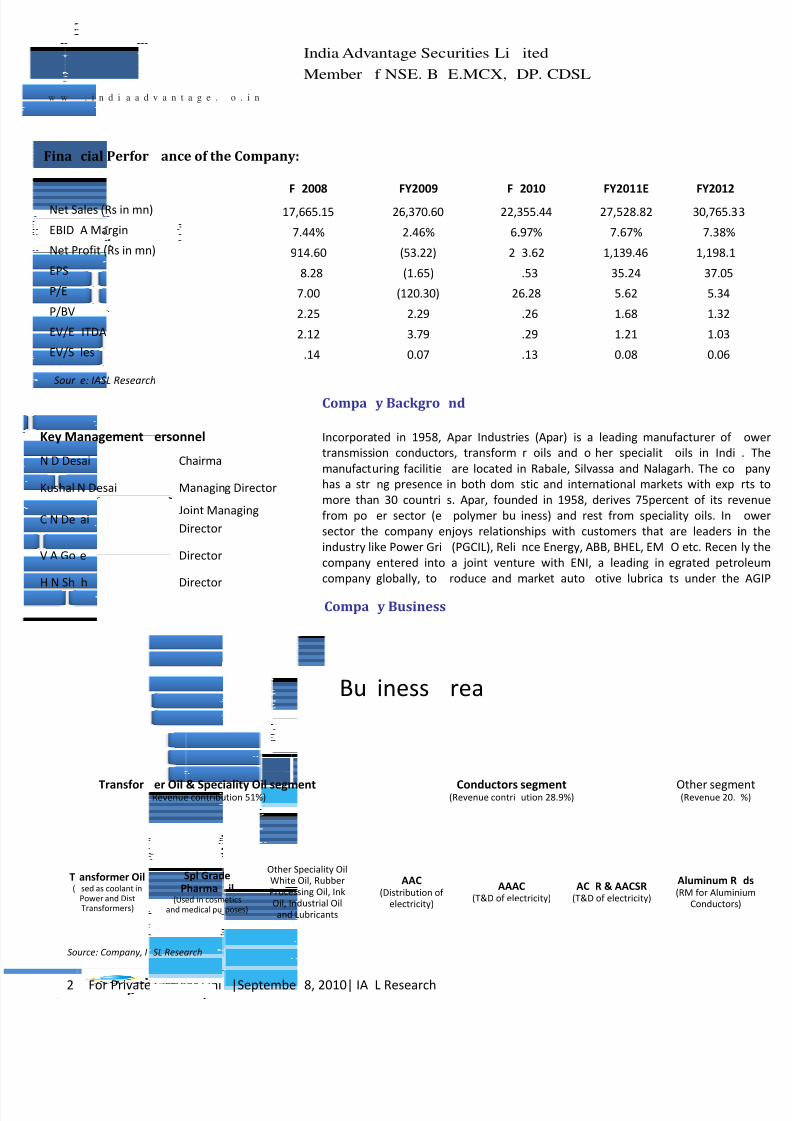
India Advantage Securities Limited Member of NSE. BSE.MCX, DP . CDSL 1 For Private Circular Only |September 8, 2010| IASL Research w w w . i n d i a a d v a n t a g e . c o . i n Company Overview Apar Industries Ltd. headquartered in Mumbai, India with production facilities spread across Rabale (Maharashtra), Silvassa (Union Territory of Dadra Nahar Haveli) and Nalagarth (Himachal Pradesh). Apar’s Conductor Division started in 1958 with the technical know–how from Alcan (Canada) and Properzi (Italy) is the largest producers of POWERLINE Aluminium and Alloy Conductors, in Asia, with strategic partnership and supply relationships with the top EPC Contractors in the World. The aluminium conductor division manufactures all types of bare overhead aluminium conductors and GS earth wires. Investment Rationale • Largest manufacturer of transformer oil with ~50% market share. Dominant presence in the power transformer segment with long‐term relationships with all major transformer manufacturers. • Huge capex expected in power sector, which will boost ancillary industries • Government of India (GOI) has plans to increase its power generation capacity from the current 156 GW to 220 GW by 2012. • The order book as of 1st April for FY11 is ` 10832.4 mn in confirmed orders and ` 2865 mn in the pipeline. Approximately 75 percent of these orders (confirmed and pipeline) will be executed in FY11. • PGCIL Plans Capital Expenditure of ` 5500mn During XI Plan • The total fund requirement for the development in T&D sector is estimated at ` 4270 bn in 11th five year plan which will create huge opportunities of revenue generations for companies like Apar. • Apar Industries Ltd. will be a key beneficiary of the capital expenditure occurring in the Indian transmission sector. The company has presence in transmission conductors and transformer oils. • In transmission conductors, Apar is the largest exporter and second largest player in domestic market with 23 percent market share. Recent capacity expansion at Nalgarh to further strengthen company’s position. Key Risk/Concerns o Foreign Exchange o Highly volatile raw material prices o Delay in order inflow Outlook & Valuations We expect 18% revenue CAGR over FY10‐12E for Apar Industries ltd. It’s a dominant player in all its businesses namely Power Conductors and Specialty Oil. The Company has guided for a volume growth of 30percent in Conductors and 15percent for transformer & specialty oil based on the growth in the Power sector and in the EHV segment (in transmission) in particular wherein the company has a clear leadership position with approvals from major transformer OEM’s and Utilities like Power Grid Corporation Ltd. We recommend the stock to ACCUMULATE with a target price of `243 per share. Initiating Coverage Key Data Sector Capital Goods BSE Code 532259 BSE Group B Bloomberg Code APR IN Reuters Code APAR.BO Market Cap (INR mn) 64025 52 WK High / Low 284/135 Total Volume (BSE) 13149 Total Volume (NSE) 19285 Face Value (INR) 10.00 Beta‐Sensex 0.69 Beta ‐ Nifty 0.73 Recommendation Accumulate CMP `198 Target `243 Potential Upside 20‐25% Share Holding Pattern (%) Promoters 62.15 Foreign Institution 2.99 Institutions 14.84 Non Promoter Corp. Hold. 12.29 Public & Others 7.74 Tushar Das Analyst +91 3301 8475 [email protected] Source: IASL Research 0 50 100 150 200 250 06/09/2 007 06/09/2008 06/09/2009 06/09/2010 Apar Ind BSE_SENSEX Sensex and Stock Movement APAR Industries Limited
Transcript of APAR - Initial Coverage
8/6/2019 APAR - Initial Coverage
http://slidepdf.com/reader/full/apar-initial-coverage 1/16
India Advantage Securities Limited
Member of NSE. BSE.MCX, DP. CDSL
1 For Private Circular Only |September 8, 2010| IASL Research
w w w . i n d i a a d v a n t a g e . c o . i n
Company Overview
Apar Industries Ltd. headquartered in Mumbai, India with production facilities
across Rabale (Maharashtra), Silvassa (Union Territory of Dadra Nahar Havel
Nalagarth (Himachal Pradesh). Apar’s Conductor Division started in 1958 with the tec
know–how from Alcan (Canada) and Properzi (Italy) is the largest producers of POWE
Aluminium and Alloy Conductors, in Asia, with strategic partnership and
relationships with the top EPC Contractors in the World. The aluminium conductor d
manufactures all types of bare overhead aluminium conductors and GS earth wires.
Investment Rationale
• Largest manufacturer of transformer oil with ~50% market share. Dom
presence in the power transformer segment with long‐term relationships w
major transformer manufacturers.
• Huge capex expected in power sector, which will boost ancillary industries
• Government of India (GOI) has plans to increase its power generation ca
from the current 156 GW to 220 GW by 2012.
• The order book as of 1st April for FY11 is ` 10832.4 mn in confirmed orde
` 2865 mn in the pipeline. Approximately 75 percent of these orders (con
and pipeline) will be executed in FY11.
• PGCIL Plans Capital Expenditure of ` 5500mn During XI Plan
• The total fund requirement for the development in T&D sector is estima
` 4270 bn in 11th five year plan which will create huge opportunities of re
generations for companies like Apar.
• Apar Industries Ltd. will be a key beneficiary of the capital expenditure occ
in the Indian transmission sector. The company has presence in transm
conductors and transformer oils.
• In transmission conductors, Apar is the largest exporter and second largest
in domestic market with 23 percent market share. Recent capacity expans
Nalgarh to further strengthen company’s position.
Key Risk/Concerns
o Foreign Exchange
o Highly volatile raw material prices
o Delay in order inflow
Outlook & Valuations
We expect 18% revenue CAGR over FY10‐12E for Apar Industries ltd. It’s a dominant
in all its businesses namely Power Conductors and Specialty Oil. The Company has g
for a volume growth of 30percent in Conductors and 15percent for transformer & sp
oil based on the growth in the Power sector and in the EHV segment (in transmiss
particular wherein the company has a clear leadership position with approvals from
transformer OEM’s and Utilities like Power Grid Corporation Ltd. We recommend the
to ACCUMULATE with a target price of `243 per share.
Initiating Coverage
Key Data
ector Capital Goods
BSE Code 532259
BSE Group B
Bloomberg Code APR IN
Reuters Code APAR.BO
Market Cap (INR mn) 64025
52 WK High / Low 284/135
Total Volume (BSE) 13149
Total Volume (NSE) 19285
ace Value (INR) 10.00
Beta‐Sensex 0.69
Beta ‐ Nifty 0.73
Recommendation Accumulate
CMP `198 Target `243
Potential Upside 20‐25%
Share Holding Pattern (%)
Promoters 62.15
Foreign Institution 2.99
nstitutions 14.84
Non Promoter Corp. Hold. 12.29
Public & Others 7.74
Tushar Das
Analyst
+91 3301 8475
Source: IASL Research
09/ 2007 06/09/2008 06/09/2009 06/09/2010
Apar Ind BSE_SENSEX
Sensex and Stock Movement
APAR Industries Limited
8/6/2019 APAR - Initial Coverage
http://slidepdf.com/reader/full/apar-initial-coverage 2/162
w w
Fina
Key M
N D De
Kushal
C N De
V A Go
H N Sh
Sour
T(
Net S
EBID
Net P
EPS
P/E
P/BV
EV/E
EV/S
So
For Private
. i n d i a a d
cial Perfor
anagement
sai
N Desai
ai
e
h
e: IASL Researc
Transfor(
ansformer Oil sed as coolant in
Power and Dist
Transformers)
ales (Rs in mn
A Margin
rofit (Rs in mn
ITDA
les
urce: Company, I Circular Onl
v a n t a g e .
ance of th
ersonnel
Chairma
Managin
Joint Ma
Director
Director
Director
h
er Oil & SpecRevenue contribu
Spl GradPharma
(Used in cosmand medical pu
)
)
SL Research
|Septembe
o . i n
e Company:
g Director
naging
iality Oil segmtion 51%)
e
il etics
poses)
Other SWhite
ProcesOil, In
and L
F
17,
7
9
India Adv
Member
8, 2010| IA
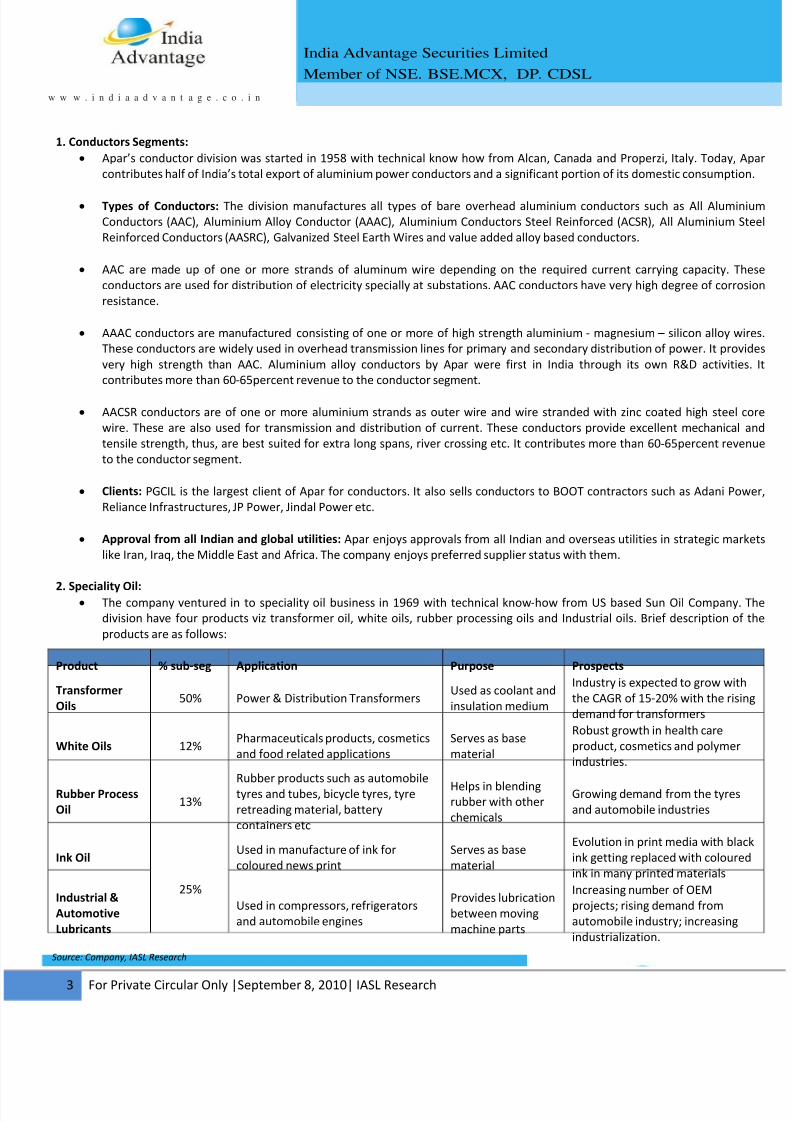
Compa
Incorpora
transmiss
manufact
has a str
more tha
from po
sector th
industry l
company
company
Compa
Bu
ent
peciality Oil
Oil, Rubber
sing Oil, Ink
dustrial Oil
ubricants
2008
665.15
.44%
14.60
8.28
7.00
2.25
2.12
.14
antage Sec
f NSE. B
L Research
y Backgro
ted in 1958,
ion conducto
uring facilitie
ng presence
n 30 countri
er sector (e
e company e
ike Power Gri
entered into
globally, to
y Business
iness
AAC
(Distribution of electricity)
FY2009
26,370.60
2.46%
(53.22)
(1.65)
(120.30)
2.29
3.79
0.07
urities Li
E.MCX,
nd
Apar Industri
rs, transform
are located
in both dom
s. Apar, foun
polymer bu
njoys relation
(PGCIL), Reli
a joint vent
roduce and
rea
Conductors (Revenue contri
AAA(T&D of ele
F
22,
6.
2
2
ited
DP. CDSL
es (Apar) is a
r oils and o
in Rabale, Silv
stic and inter
ded in 1958,
iness) and re
ships with cu
nce Energy, A
ure with ENI,
market auto
segment ution 28.9%)
Cctricity)
AC(T&D
2010
355.44
.97%
3.62
.53
6.28
.26
.29
.13
leading man
her specialit
assa and Nala
national mark
derives 75per
st from speci
stomers that
BB, BHEL, EM
a leading in
otive lubrica
R & AACSR
of electricity)
FY2011E
27,528.82
7.67%
1,139.46
35.24
5.62
1.68
1.21
0.08
ufacturer of
oils in Indi
garh. The co
ets with exp
cent of its re
ality oils. In
are leaders i
O etc. Recen
egrated petr
ts under the
Other segm(Revenue 20.
Aluminum R(RM for Alumin
Conductors
FY2012
30,765.3
7.38%
1,198.1
37.05
5.34
1.32
1.03
0.06
v
i
o
e
)
3
8/6/2019 APAR - Initial Coverage
http://slidepdf.com/reader/full/apar-initial-coverage 3/16
India Advantage Securities Limited
Member of NSE. BSE.MCX, DP. CDSL
3 For Private Circular Only |September 8, 2010| IASL Research
w w w . i n d i a a d v a n t a g e . c o . i n
1. Conductors Segments:
• Apar’s conductor division was started in 1958 with technical know how from Alcan, Canada and Properzi, Italy. Today,
contributes half of India’s total export of aluminium power conductors and a significant portion of its domestic consumptio
• Types of Conductors: The division manufactures all types of bare overhead aluminium conductors such as All Alumin
Conductors (AAC), Aluminium Alloy Conductor (AAAC), Aluminium Conductors Steel Reinforced (ACSR), All Aluminium S
Reinforced Conductors (AASRC), Galvanized Steel Earth Wires and value added alloy based conductors.
• AAC are made up of one or more strands of aluminum wire depending on the required current carrying capacity. T
conductors are used for distribution of electricity specially at substations. AAC conductors have very high degree of corro
resistance.
• AAAC conductors are manufactured consisting of one or more of high strength aluminium ‐ magnesium – silicon alloy w
These conductors are widely used in overhead transmission lines for primary and secondary distribution of power. It prov
very high strength than AAC. Aluminium alloy conductors by Apar were first in India through its own R&D activitie
contributes more than 60‐65percent revenue to the conductor segment.
• AACSR conductors are of one or more aluminium strands as outer wire and wire stranded with zinc coated high steel
wire. These are also used for transmission and distribution of current. These conductors provide excellent mechanical
tensile strength, thus, are best suited for extra long spans, river crossing etc. It contributes more than 60‐65percent reve
to the conductor segment.
• Clients: PGCIL is the largest client of Apar for conductors. It also sells conductors to BOOT contractors such as Adani Po
Reliance Infrastructures, JP Power, Jindal Power etc.
• Approval from all Indian and global utilities: Apar enjoys approvals from all Indian and overseas utilities in strategic mar
like Iran, Iraq, the Middle East and Africa. The company enjoys preferred supplier status with them.
2. Speciality Oil: • The company ventured in to speciality oil business in 1969 with technical know‐how from US based Sun Oil Company.
division have four products viz transformer oil, white oils, rubber processing oils and Industrial oils. Brief description of
products are as follows:
Product % sub‐seg Application Purpose Prospects
Transformer
Oils
50% Power & Distribution Transformers
Used as coolant and
insulation medium
Industry is expected to grow wit
the CAGR of 15‐20% with the ris
demand for transformers
White Oils 12%
Pharmaceuticals products, cosmetics
and food related applications
Serves as base
material
Robust growth in health care
product, cosmetics and polymer
industries.
Rubber Process
Oil 13%
Rubber products such as automobile
tyres and tubes, bicycle tyres, tyre
retreading material, battery
containers etc
Helps in blending
rubber with other
chemicals
Growing demand from the tyres
and automobile industries
Ink Oil
25%
Used in manufacture of ink for
coloured news print
Serves as base
material
Evolution in print media with bla
ink getting replaced with coloure
ink in many printed materials
Industrial &
Automotive
Lubricants
Used in compressors, refrigerators
and automobile engines
Provides lubrication
between moving
machine parts
Increasing number of OEM
projects; rising demand from
automobile industry; increasing
industrialization.
Source: Company, IASL Research
8/6/2019 APAR - Initial Coverage
http://slidepdf.com/reader/full/apar-initial-coverage 4/164
w w
Co
A
SOL
Apa
cont
UNI
Apa
such
con
man
clien
Unif
mon
Unif
FY1
orga
So
For Private
. i n d i a a d
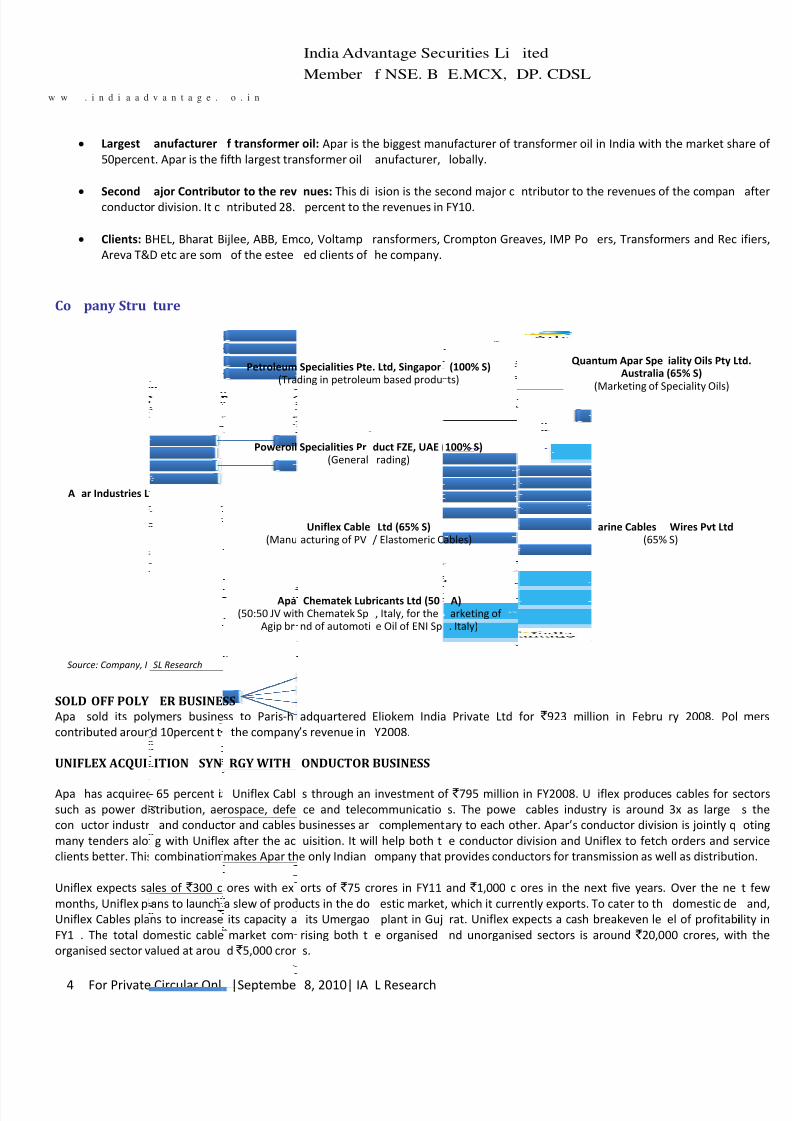
• Largest
50percen
• Second
conducto
• Clients: B
Areva T&
pany Stru
ar Industries L
D OFF POLY
sold its pol
ributed aroun
FLEX ACQUI
has acquired
as power di
uctor industr
y tenders alo
ts better. This
lex expects sa
ths, Uniflex pl
lex Cables pla
. The total d
nised sector v
urce: Company, I
Circular Onl
v a n t a g e .
anufacturer
t. Apar is the f
ajor
Contribur division. It c
HEL, Bharat B
D etc are som
ture
d.
ER BUSINE
ymers busine
d 10percent t
ITION SYN
65 percent i
stribution, ae
and conduct
g with Unifle
combination
les of ` 300 c
ans to launch
ns to increase
omestic cable
alued at arou
SL Research
|Septembe
o . i n
f transformer
ifth largest tra
tor
to
the
revntributed 28.
ijlee, ABB, Em
of the estee
Petroleum
(Tra
Poweroil
(Manu
Apa(50:50 JV wit
Agip br
SS
ss to Paris‐h
the company
RGY WITH
Uniflex Cabl
rospace, defe
or and cables
x after the ac
makes Apar th
ores with ex
a slew of prod
its capacity a
market com
d ` 5,000 cror
India Adv
Member
8, 2010| IA
oil: Apar is th
nsformer oil
nues:
This
di percent to th
co, Voltamp
ed clients of
Specialities Pteding in petroleu
Specialities Pr(General
Uniflex Cableacturing of PV
Chematek Lubh Chematek Spnd of automoti
adquartered
’s revenue in
ONDUCTOR
s through an
ce and telec
businesses ar
uisition. It wi
e only Indian
orts of ` 75 c
ucts in the do
its Umergao
rising both t
s.
antage Sec
f NSE. B
L Research
e biggest man
anufacturer,
ision
is
the
see revenues in
ransformers,
he company.
. Ltd, Singaporm based produ
duct FZE, UAE (rading)
Ltd (65% S) / Elastomeric C
ricants Ltd (50, Italy, for the
e Oil of ENI Sp
Eliokem India
Y2008.
BUSINESS
investment o
ommunicatio
complement
ll help both t
ompany that
rores in FY11
estic market
plant in Guj
e organised
urities Li
E.MCX,
ufacturer of t
lobally.
cond
major
cFY10.
Crompton Gre
(100% S) ts)
100% S)
ables)
A) arketing of . Italy)
Private Ltd
f ` 795 million
s. The powe
ary to each ot
e conductor
provides cond
and ` 1,000 c
, which it curr
rat. Uniflex e
nd unorganis
ited
DP. CDSL
ransformer oil
ntributor
to
t
aves, IMP Po
Qua
for ` 923 mill
in FY2008. U
cables indus
her. Apar’s co
division and U
uctors for tran
ores in the n
ently exports.
xpects a cash
ed sectors is
in India with
he
revenues
o
ers, Transfor
ntum Apar SpeAustralia
(Marketing of S
arine Cables
(65%
ion in Febru
iflex produce
try is around
nductor divisi
niflex to fetch
smission as w
ext five years.
To cater to th
breakeven le
around ` 20,0
the market sh
f
the
compan
mers and Rec
iality Oils Pty L(65% S) peciality Oils)
Wires Pvt Ltd
S)
ry 2008. Pol
s cables for s
3x as large
on is jointly q
orders and s
ell as distribut
Over the ne
domestic de
el of profitabi
00 crores, wit
a
t
e
e
i
i

8/6/2019 APAR - Initial Coverage
http://slidepdf.com/reader/full/apar-initial-coverage 5/165
w w
For Private
. i n d i a a d
Circular Onl
v a n t a g e .
|Septembe
o . i n
India Adv
Member
8, 2010| IA
evenue Co
par has two
onductor
segniflex Cables.
Apar derive
half of India
of its domes
Segment PrConductors
Transformer
Power/Tele
Total
reak – Up o
Source: Compa
Sourc
antage Sec
f NSE. B
L Research
mposition
main busin
ment.
Power
Cond
43
28 per cent
’s total export
tic consumpti
duct
s & Speciality
om Cables
Consolidat
y, IASL Research
e: Company, IASL
urities Li
E.MCX,
ss segments:
nd
telecom
c
ctors
%
f its total rev
of aluminium
n.
Oils
d Gross Rev
Research
ited
DP. CDSL
Transformer
bles
business
enue from th
power condu
Domesti
7
6
7
7
nue in FY10
and specialit
is
operated
th
Power
Teleco
Cable
8%
export mark
ctors and a si
c Market
%
%
%
%
y oils segme
rough
its
subs
&
m
s
Transformer
Oil &
peciality Oils
49%
t. Apar contri
nificant prop
Export Mark
25%
31%
22%
28%
i
8/6/2019 APAR - Initial Coverage
http://slidepdf.com/reader/full/apar-initial-coverage 6/16
India Advantage Securities Limited
Member of NSE. BSE.MCX, DP. CDSL
6 For Private Circular Only |September 8, 2010| IASL Research
w w w . i n d i a a d v a n t a g e . c o . i n
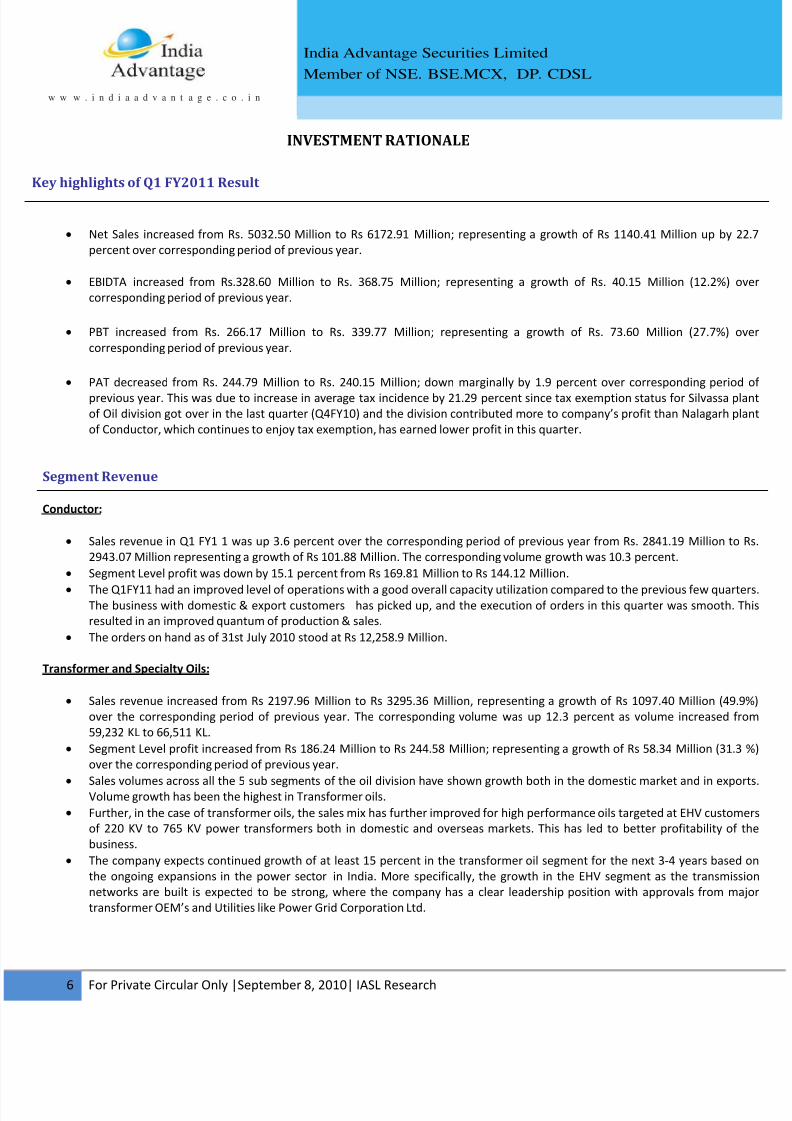
Key highlights of Q1 FY2011 Result
• Net Sales increased from Rs. 5032.50 Million to Rs 6172.91 Million; representing a growth of Rs 1140.41 Million up by 2
percent over corresponding period of previous year.
• EBIDTA increased from Rs.328.60 Million to Rs. 368.75 Million; representing a growth of Rs. 40.15 Million (12.2%) o
corresponding period of previous year.
• PBT increased from Rs. 266.17 Million to Rs. 339.77 Million; representing a growth of Rs. 73.60 Million (27.7%) o
corresponding period of previous year.
• PAT decreased from Rs. 244.79 Million to Rs. 240.15 Million; down marginally by 1.9 percent over corresponding period
previous year. This was due to increase in average tax incidence by 21.29 percent since tax exemption status for Silvassa pl
of Oil division got over in the last quarter (Q4FY10) and the division contributed more to company’s profit than Nalagarh pl
of Conductor, which continues to enjoy tax exemption, has earned lower profit in this quarter.
Segment Revenue
Conductor:
• Sales revenue in Q1 FY1 1 was up 3.6 percent over the corresponding period of previous year from Rs. 2841.19 Million to
2943.07 Million representing a growth of Rs 101.88 Million. The corresponding volume growth was 10.3 percent.
• Segment Level profit was down by 15.1 percent from Rs 169.81 Million to Rs 144.12 Million.
• The Q1FY11 had an improved level of operations with a good overall capacity utilization compared to the previous few quartThe business with domestic & export customers has picked up, and the execution of orders in this quarter was smooth. T
resulted in an improved quantum of production & sales.
• The orders on hand as of 31st July 2010 stood at Rs 12,258.9 Million.
Transformer and Specialty Oils:
• Sales revenue increased from Rs 2197.96 Million to Rs 3295.36 Million, representing a growth of Rs 1097.40 Million (49.9
over the corresponding period of previous year. The corresponding volume was up 12.3 percent as volume increased fr
59,232 KL to 66,511 KL.
• Segment Level profit increased from Rs 186.24 Million to Rs 244.58 Million; representing a growth of Rs 58.34 Million (31.3
over the corresponding period of previous year.
• Sales
volumes
across
all
the
5
sub
segments
of
the
oil
division
have
shown
growth
both
in
the
domestic
market
and
in
expoVolume growth has been the highest in Transformer oils.
• Further, in the case of transformer oils, the sales mix has further improved for high performance oils targeted at EHV custom
of 220 KV to 765 KV power transformers both in domestic and overseas markets. This has led to better profitability of
business.
• The company expects continued growth of at least 15 percent in the transformer oil segment for the next 3‐4 years based
the ongoing expansions in the power sector in India. More specifically, the growth in the EHV segment as the transmiss
networks are built is expected to be strong, where the company has a clear leadership position with approvals from ma
transformer OEM’s and Utilities like Power Grid Corporation Ltd.
INVESTMENT RATIONALE
8/6/2019 APAR - Initial Coverage
http://slidepdf.com/reader/full/apar-initial-coverage 7/16
India Advantage Securities Limited
Member of NSE. BSE.MCX, DP. CDSL
7 For Private Circular Only |September 8, 2010| IASL Research
w w w . i n d i a a d v a n t a g e . c o . i n
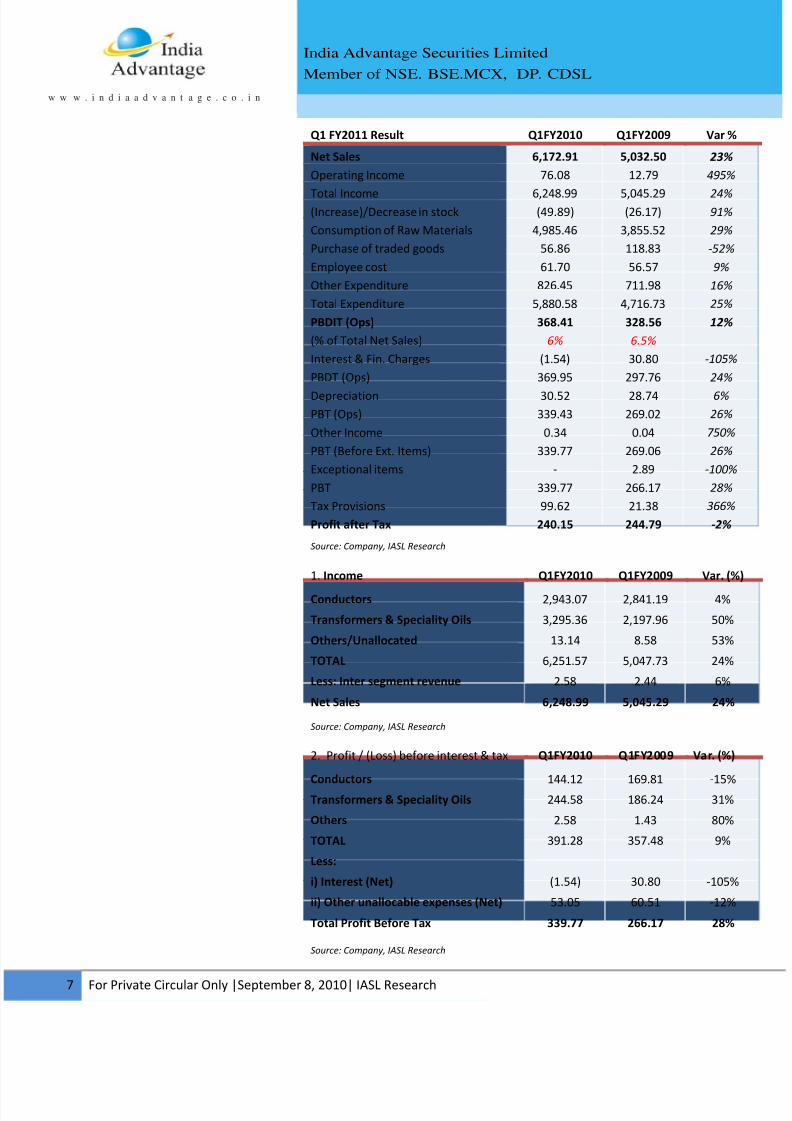
Q1 FY2011 Result Q1FY2010 Q1FY2009 Var %
Net Sales 6,172.91 5,032.50 23%
Operating Income 76.08 12.79 495%
Total Income 6,248.99 5,045.29 24%(Increase)/Decrease in stock (49.89) (26.17) 91%
Consumption of Raw Materials 4,985.46 3,855.52 29%
Purchase of traded goods 56.86 118.83 ‐52%
Employee cost 61.70 56.57 9%
Other Expenditure 826.45 711.98 16%
Total Expenditure 5,880.58 4,716.73 25%
PBDIT (Ops) 368.41 328.56 12%
(% of Total Net Sales) 6% 6.5%
Interest & Fin. Charges (1.54) 30.80 ‐105%
PBDT (Ops) 369.95 297.76 24%
Depreciation 30.52 28.74 6%
PBT (Ops) 339.43 269.02 26%
Other Income 0.34 0.04 750%
PBT (Before Ext. Items) 339.77 269.06 26%
Exceptional items ‐ 2.89 ‐100%
PBT 339.77 266.17 28%
Tax Provisions 99.62 21.38 366%
Profit after Tax 240.15 244.79 ‐2%
1. Income Q1FY2010 Q1FY2009 Var. (%
Conductors 2,943.07 2,841.19 4%
Transformers & Speciality Oils 3,295.36 2,197.96 50%
Others/Unallocated 13.14 8.58 53%
TOTAL 6,251.57 5,047.73 24%
Less: Inter segment revenue 2.58 2.44 6%
Net Sales 6,248.99 5,045.29 24%
2. Profit / (Loss) before interest & tax Q1FY2010 Q1FY2009 Var. (%)
Conductors 144.12 169.81 ‐15%
Transformers & Speciality Oils 244.58 186.24 31%
Others 2.58 1.43 80%
TOTAL 391.28 357.48 9%
Less:
i) Interest (Net) (1.54) 30.80 ‐105%
ii) Other unallocable expenses (Net) 53.05 60.51 ‐12%
Total Profit Before Tax 339.77 266.17 28%
Source: Company, IASL Research
Source: Company, IASL Research
Source: Company, IASL Research
8/6/2019 APAR - Initial Coverage
http://slidepdf.com/reader/full/apar-initial-coverage 8/16
India Advantage Securities Limited
Member of NSE. BSE.MCX, DP. CDSL
8 For Private Circular Only |September 8, 2010| IASL Research
w w w . i n d i a a d v a n t a g e . c o . i n
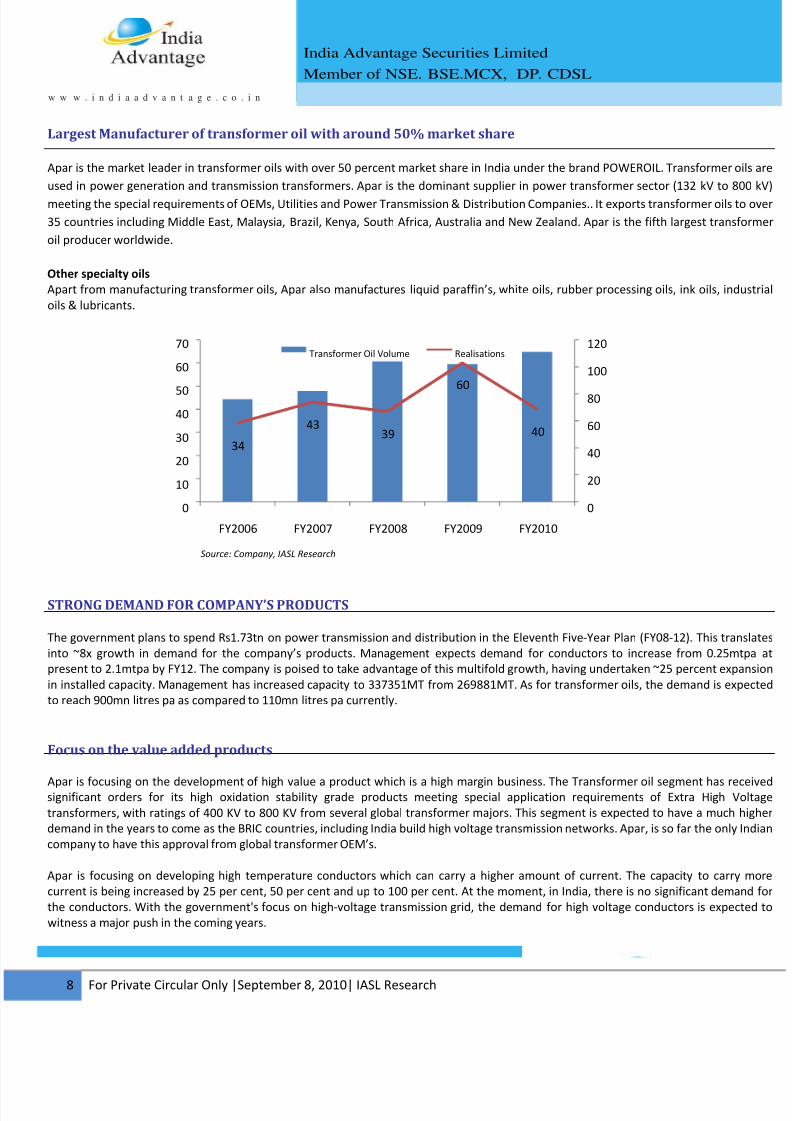
1 Largest Manufacturer of transformer oil with around 50% market share
Apar is the market leader in transformer oils with over 50 percent market share in India under the brand POWEROIL. Transformer o
used in power generation and transmission transformers. Apar is the dominant supplier in power transformer sector (132 kV to 80
meeting the special requirements of OEMs, Utilities and Power Transmission & Distribution Companies.. It exports transformer oils to
35 countries including Middle East, Malaysia, Brazil, Kenya, South Africa, Australia and New Zealand. Apar is the fifth largest transf
oil producer worldwide.
Other specialty oils
Apart from manufacturing transformer oils, Apar also manufactures liquid paraffin’s, white oils, rubber processing oils, ink oils, ind
oils & lubricants.
STRONG DEMAND FOR COMPANY’S PRODUCTS
The government plans to spend Rs1.73tn on power transmission and distribution in the Eleventh Five‐Year Plan (FY08‐12). This tran
into ~8x growth in demand for the company’s products. Management expects demand for conductors to increase from 0.25mt
present to 2.1mtpa by FY12. The company is poised to take advantage of this multifold growth, having undertaken ~25 percent expa
in installed capacity. Management has increased capacity to 337351MT from 269881MT. As for transformer oils, the demand is exp
to reach 900mn litres pa as compared to 110mn litres pa currently.
Focus on the value added products
Apar
is
focusing
on
the
development
of
high
value
a
product
which
is
a
high
margin
business.
The
Transformer
oil
segment
has
recsignificant orders for its high oxidation stability grade products meeting special application requirements of Extra High V
transformers, with ratings of 400 KV to 800 KV from several global transformer majors. This segment is expected to have a much h
demand in the years to come as the BRIC countries, including India build high voltage transmission networks. Apar, is so far the only
company to have this approval from global transformer OEM’s.
Apar is focusing on developing high temperature conductors which can carry a higher amount of current. The capacity to carry
current is being increased by 25 per cent, 50 per cent and up to 100 per cent. At the moment, in India, there is no significant dema
the conductors. With the government's focus on high‐voltage transmission grid, the demand for high voltage conductors is expec
witness a major push in the coming years.
34
4339
60
40
0
20
40
60
80
100
120
0
10
20
30
40
50
60
70
FY2006 FY2007 FY2008 FY2009 FY2010
Transformer Oil Volume Realisations
Source: Company, IASL Research
8/6/2019 APAR - Initial Coverage
http://slidepdf.com/reader/full/apar-initial-coverage 9/169
w w
T
`91
`5
Rs 3con
Source: S
For Private
. i n d i a a d
Tra
ower Co
bn
`50 bn
5 billion opuctor busine
As per the 11
terlite Technolog
Circular Onl
v a n t a g e .
smission
Line
nductor I
`1400 bn
15 bn
ortunity for ss
th 5 year pla
Annual Report 2
|Septembe
o . i n
Gen
Transmiss
nsulator T
`4109
`45 bn
the
09, IASL Researc
India Adv
Member
8, 2010| IA
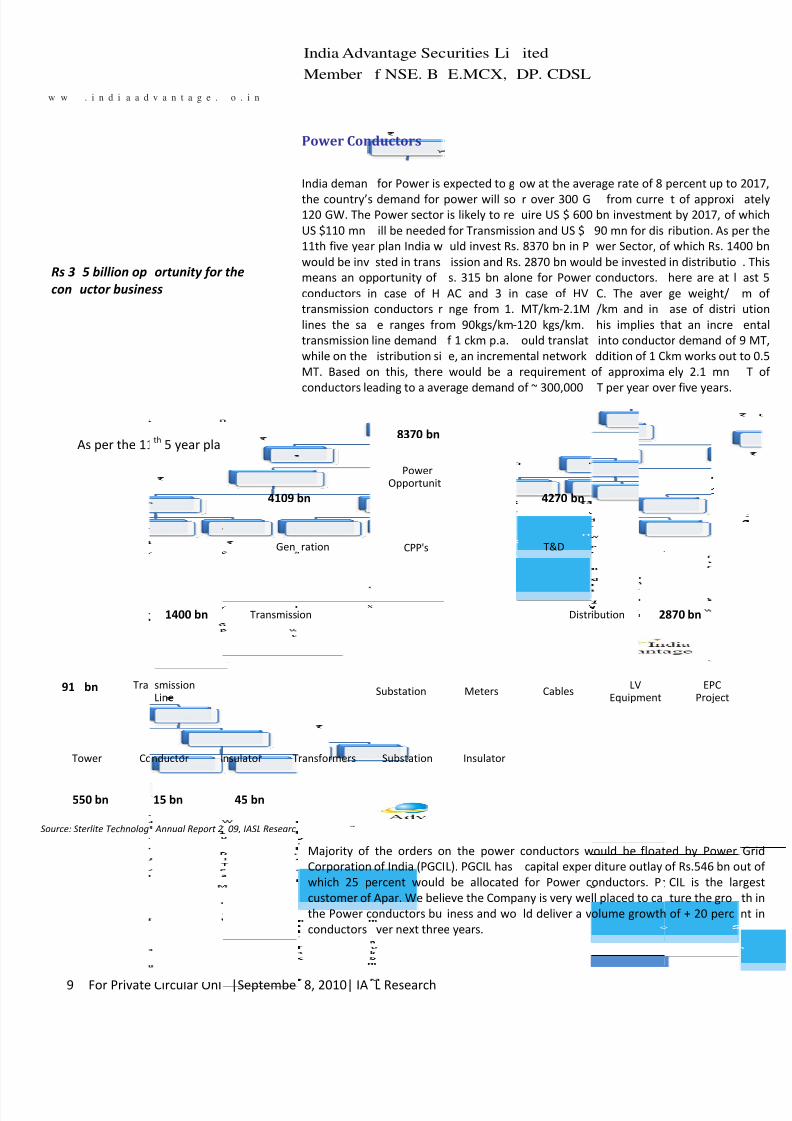
Power Con
India deman
the country’s120 GW. The
US $110 mn
11th five yea
would be inv
means an op
conductors i
transmission
lines the sa
transmission
while on the
MT. Based o
conductors
le
ration
ion
ransformers
Majority of
Corporation
which 25 p
customer of
the Power c
conductors
bn
antage Sec
f NSE. B
L Research
ductors
for Power is
demand for
Power sector
ill be needed
r plan India w
sted in trans
portunity of
n case of H
conductors r
e ranges fro
line demand
istribution si
n this, there
ading
to
a
ave
Power
Opportunit
CPP's
Substation
Substation
the orders o
of India (PGCI
ercent would
Apar. We beli
onductors bu
ver next thre
`8370 bn
urities Li
E.MCX,
expected to g
power will sois likely to re
for Transmiss
uld invest Rs.
ission and Rs
s. 315 bn alo
AC and 3 in
nge from 1.
m 90kgs/km‐
f 1 ckm p.a.
e, an increme
would be a
rage
demand
Insulator
Meters
n the power
L). PGCIL has
be allocated
eve the Comp
iness and wo
e years.
ited
DP. CDSL
ow at the ave
r over 300 Guire US $ 600
ion and US $
8370 bn in P
. 2870 bn wou
ne for Power
case of HV
MT/km‐2.1M
120 kgs/km.
ould translat
ntal network
requirement
of
~
300,000
T&D
Distr
Cables
conductors w
capital expen
for Power c
any is very we
ld deliver a v
`4270 bn
rage rate of 8
from curre bn investmen
90 mn for dis
wer Sector, o
ld be invested
conductors.
C. The aver
/km and in
his implies t
into conduct
ddition of 1 C
of approxima
T
per
year
ov
ibution
LV
Equipment
ould be float
diture outlay
onductors. P
ll placed to ca
olume growth
`2
percent up to
t of approxit by 2017, of
ribution. As p
f which Rs. 14
in distributio
here are at l
ge weight/
ase of distri
hat an incre
or demand of
km works out
ely 2.1 mn
er
five
years.
EPC
Project
ed by Power
of Rs.546 bn o
CIL is the la
ture the gro
of + 20 perc
870 bn
w
e
9
t
r
8/6/2019 APAR - Initial Coverage
http://slidepdf.com/reader/full/apar-initial-coverage 10/16
India Advantage Securities Limited
Member of NSE. BSE.MCX, DP. CDSL
10 For Private Circular Only |September 8, 2010| IASL Research
w w w . i n d i a a d v a n t a g e . c o . i n
Global presence – accessing opportunities overseas
• Apar contributes half of India’s total export of aluminium power conductor
company exports across more than 30 countries.
• The Company enjoys approvals from all Indian and overseas utilities in str
markets like Iran, Iraq, the Middle East and Africa.
• It has approvals from major global EPC contractors who build projects
Middle East, South East Asia and Africa. The company enjoys preferred su
status with them.
• Apar also export its speciality oil through joint ventures in Australia, South
and Turkey.
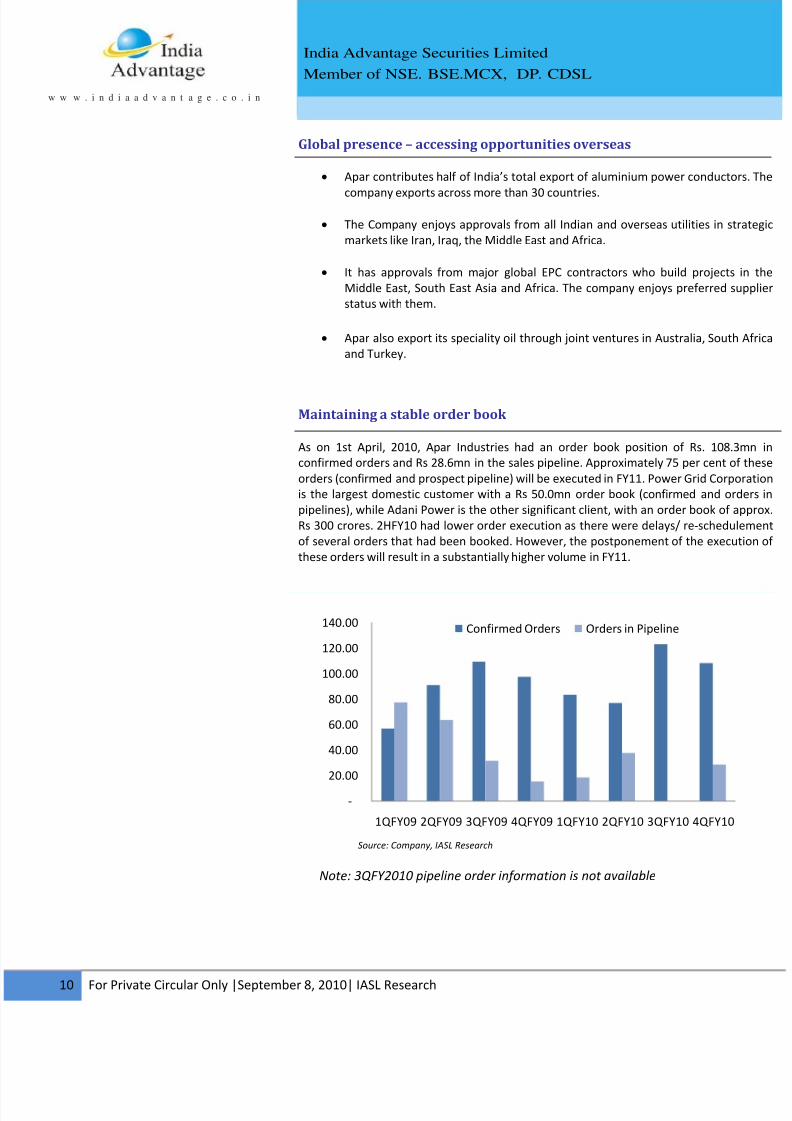
Maintaining a stable order book
As on 1st April, 2010, Apar Industries had an order book position of Rs. 108.3
confirmed orders and Rs 28.6mn in the sales pipeline. Approximately 75 per cent of
orders (confirmed and prospect pipeline) will be executed in FY11. Power Grid Corpo
is the largest domestic customer with a Rs 50.0mn order book (confirmed and ord
pipelines), while Adani Power is the other significant client, with an order book of a
Rs 300 crores. 2HFY10 had lower order execution as there were delays/ re‐schedule
of several orders that had been booked. However, the postponement of the execut
these orders will result in a substantially higher volume in FY11.
‐
20.00
40.00
60.00
80.00
100.00
120.00
140.00
1QFY09 2QFY09 3QFY09 4QFY09 1QFY10 2QFY10 3QFY10 4QFY10
Confirmed Orders Orders in Pipeline
Note: 3QFY2010 pipeline order information is not available
Source: Company, IASL Research
8/6/2019 APAR - Initial Coverage
http://slidepdf.com/reader/full/apar-initial-coverage 11/16
India Advantage Securities Limited
Member of NSE. BSE.MCX, DP. CDSL
11 For Private Circular Only |September 8, 2010| IASL Research
w w w . i n d i a a d v a n t a g e . c o . i n
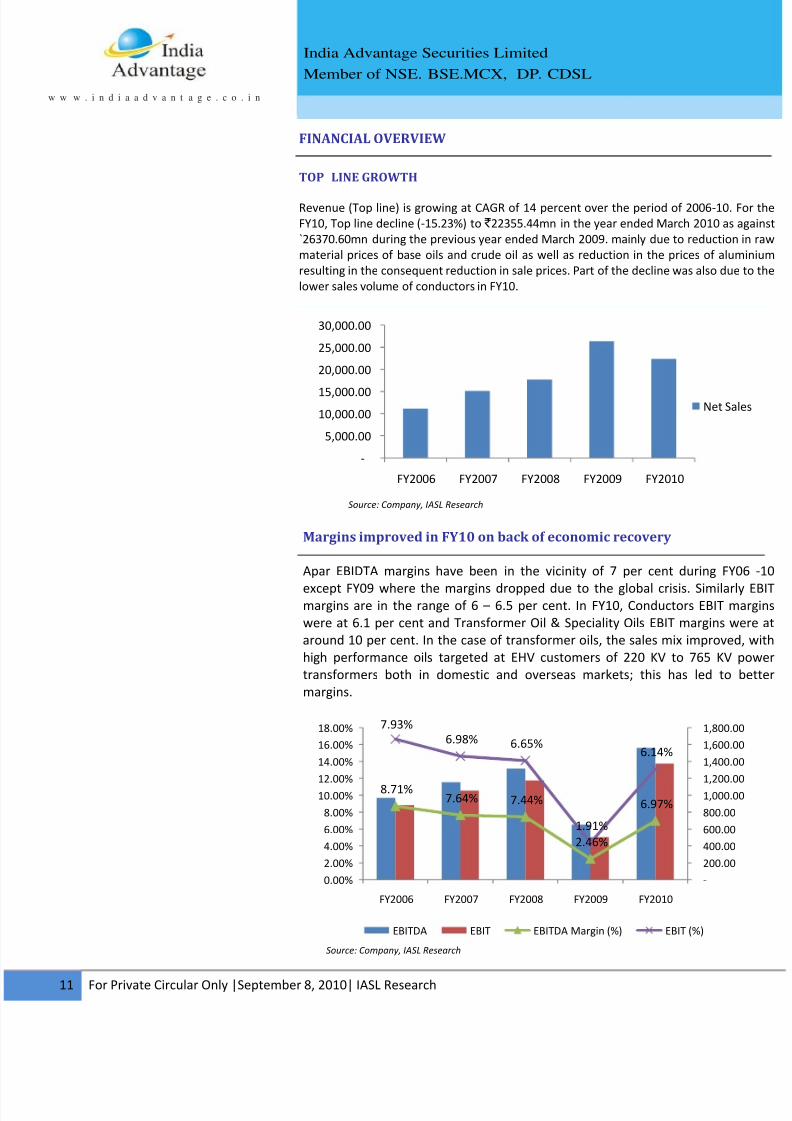
TOP LINE GROWTH
Revenue (Top line) is growing at CAGR of 14 percent over the period of 2006‐10. F
FY10, Top line decline (‐15.23%) to ` 22355.44mn in the year ended March 2010 as a
`26370.60mn during the previous year ended March 2009. mainly due to reduction
material prices of base oils and crude oil as well as reduction in the prices of alum
resulting in the consequent reduction in sale prices. Part of the decline was also due
lower sales volume of conductors in FY10.
Margins improved in FY10 on back of economic recovery
Apar EBIDTA margins have been in the vicinity of 7 per cent during FY0
except FY09 where the margins dropped due to the global crisis. Similarlymargins are in the range of 6 – 6.5 per cent. In FY10, Conductors EBIT m
were at 6.1 per cent and Transformer Oil & Speciality Oils EBIT margins we
around 10 per cent. In the case of transformer oils, the sales mix improved
high performance oils targeted at EHV customers of 220 KV to 765 KV p
transformers both in domestic and overseas markets; this has led to b
margins.
FINANCIAL OVERVIEW
‐
5,000.00
10,000.00
15,000.00
20,000.00
25,000.00
30,000.00
FY2006 FY2007 FY2008 FY2009 FY2010
Net Sal
8.71%7.64% 7.44%
2.46%
6.97%
7.93%
6.98% 6.65%
1.91%
6.14%
‐
200.00
400.00
600.00
800.00
1,000.00
1,200.00
1,400.00
1,600.00
1,800.00
0.00%
2.00%
4.00%
6.00%
8.00%
10.00%
12.00%
14.00%
16.00%
18.00%
FY2006 FY2007 FY2008 FY2009 FY2010
EBITDA EBIT EBITDA Margin (%) EBIT (%)
Source: Company, IASL Research
Source: Company, IASL Research
8/6/2019 APAR - Initial Coverage
http://slidepdf.com/reader/full/apar-initial-coverage 12/16
India Advantage Securities Limited
Member of NSE. BSE.MCX, DP. CDSL
12 For Private Circular Only |September 8, 2010| IASL Research
w w w . i n d i a a d v a n t a g e . c o . i n
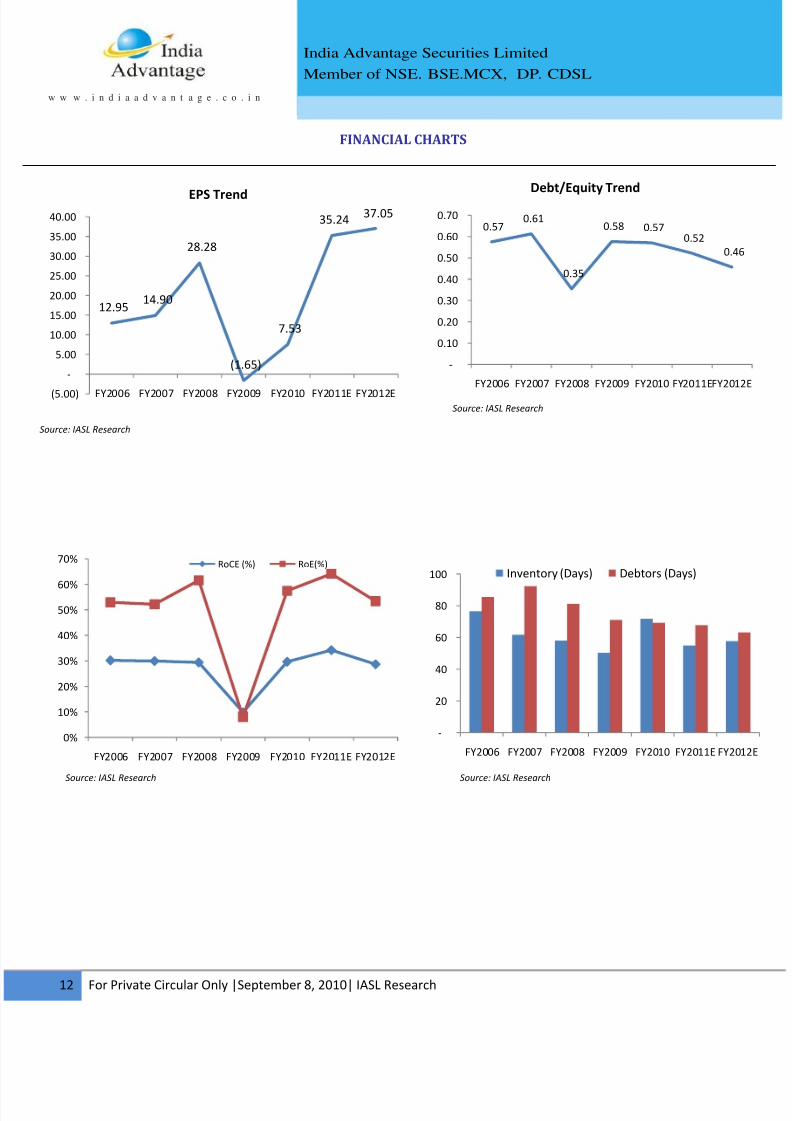
0.57
0.61
0.35
0.58 0.57
0.52
0.46
‐
0.10
0.20
0.30
0.40
0.50
0.60
0.70
FY2006 FY2007 FY2008 FY2009 FY2010 FY2011EFY201
12.95
14.90
28.28
(1.65)
7.53
35.24
37.05
(5.00)
‐
5.00
10.00
15.00
20.00
25.00
30.00
35.00
40.00
FY2006 FY2007 FY2008 FY2009 FY2010 FY2011E FY2012E
0%
10%
20%
30%
40%
50%
60%
70%
FY2006 FY2007 FY2008 FY2009 FY2010 FY2011E FY2012E
RoCE (%) RoE(%)
FINANCIAL CHARTS
EPS Trend
Debt/Equity Trend
‐
20
40
60
80
100
FY2006 FY2007 FY2008 FY2009 FY2010 FY2011E FY20
Inventory (Days) Debtors (Days)
Source: IASL Research
Source: IASL Research
Source: IASL Research
Source: IASL Research
8/6/2019 APAR - Initial Coverage
http://slidepdf.com/reader/full/apar-initial-coverage 13/16
India Advantage Securities Limited
Member of NSE. BSE.MCX, DP. CDSL
13 For Private Circular Only |September 8, 2010| IASL Research
w w w . i n d i a a d v a n t a g e . c o . i n
VALUATIONS
We expect 18% revenue CAGR over FY10‐12E for Apar Industries ltd. Apar Industri
the dominant player in all its businesses namely Power Conductors and Specialty Oil.
Company has guided for a volume growth of 30 percent in Conductors and 15 per
for transformer & specialty oil based on the growth in the Power sector and in the
segment (in transmission) in particular wherein the company has a clear leader
position with approvals from major transformer OEM’s and Utilities like Power
Corporation Ltd. We recommend the stock to ACCUMULATE with a target price of `per share.
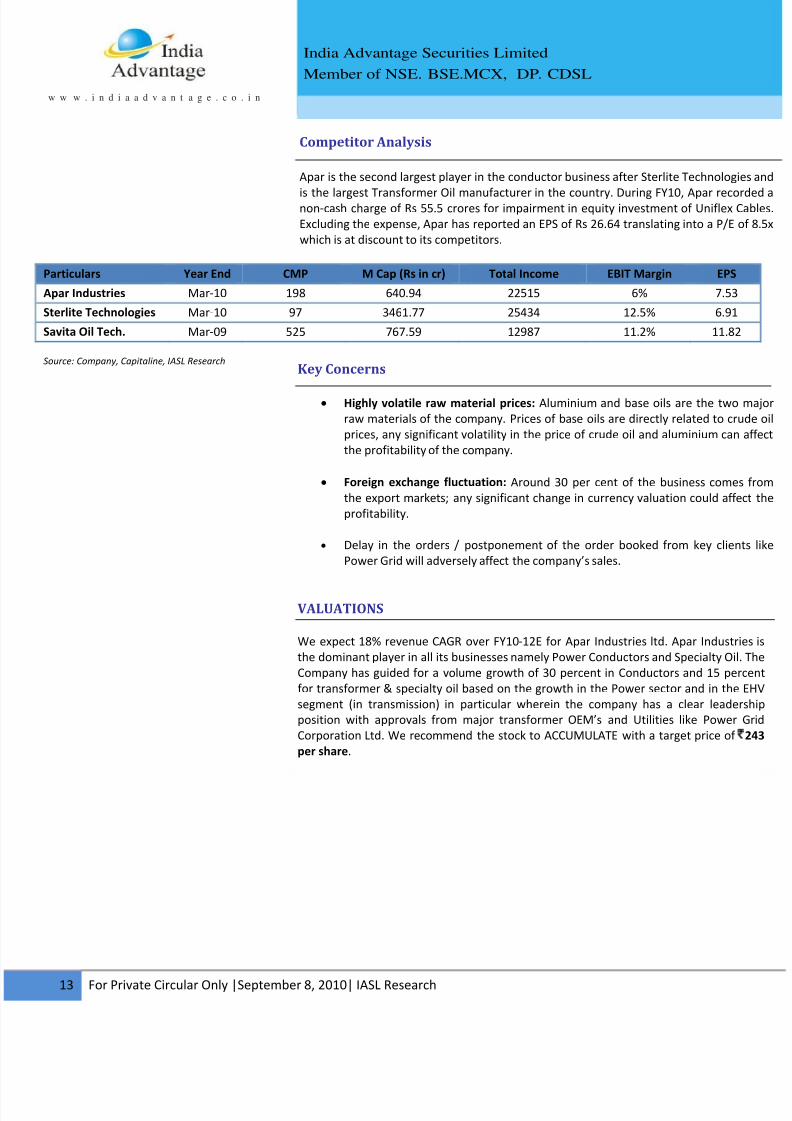
Competitor Analysis
Apar is the second largest player in the conductor business after Sterlite Technologi
is the largest Transformer Oil manufacturer in the country. During FY10, Apar reconon‐cash charge of Rs 55.5 crores for impairment in equity investment of Uniflex C
Excluding the expense, Apar has reported an EPS of Rs 26.64 translating into a P/E o
which is at discount to its competitors.
Particulars Year End CMP M Cap (Rs in cr) Total Income EBIT Margin EPS
Apar Industries Mar‐10 198 640.94 22515 6% 7.53
Sterlite Technologies Mar‐10 97 3461.77 25434 12.5% 6.91
Savita Oil Tech. Mar‐09 525 767.59 12987 11.2% 11.82
Key Concerns
• Highly volatile raw material prices: Aluminium and base oils are the two
raw materials of the company. Prices of base oils are directly related to cru
prices, any significant volatility in the price of crude oil and aluminium can
the profitability of the company.
• Foreign exchange fluctuation: Around 30 per cent of the business comes
the export markets; any significant change in currency valuation could affe
profitability.
• Delay in the orders / postponement of the order booked from key clien
Power Grid will adversely affect the company’s sales.
Source: Company, Capitaline, IASL Research
8/6/2019 APAR - Initial Coverage
http://slidepdf.com/reader/full/apar-initial-coverage 14/16
India Advantage Securities Limited
Member of NSE. BSE.MCX, DP. CDSL
14 For Private Circular Only |September 8, 2010| IASL Research
w w w . i n d i a a d v a n t a g e . c o . i n
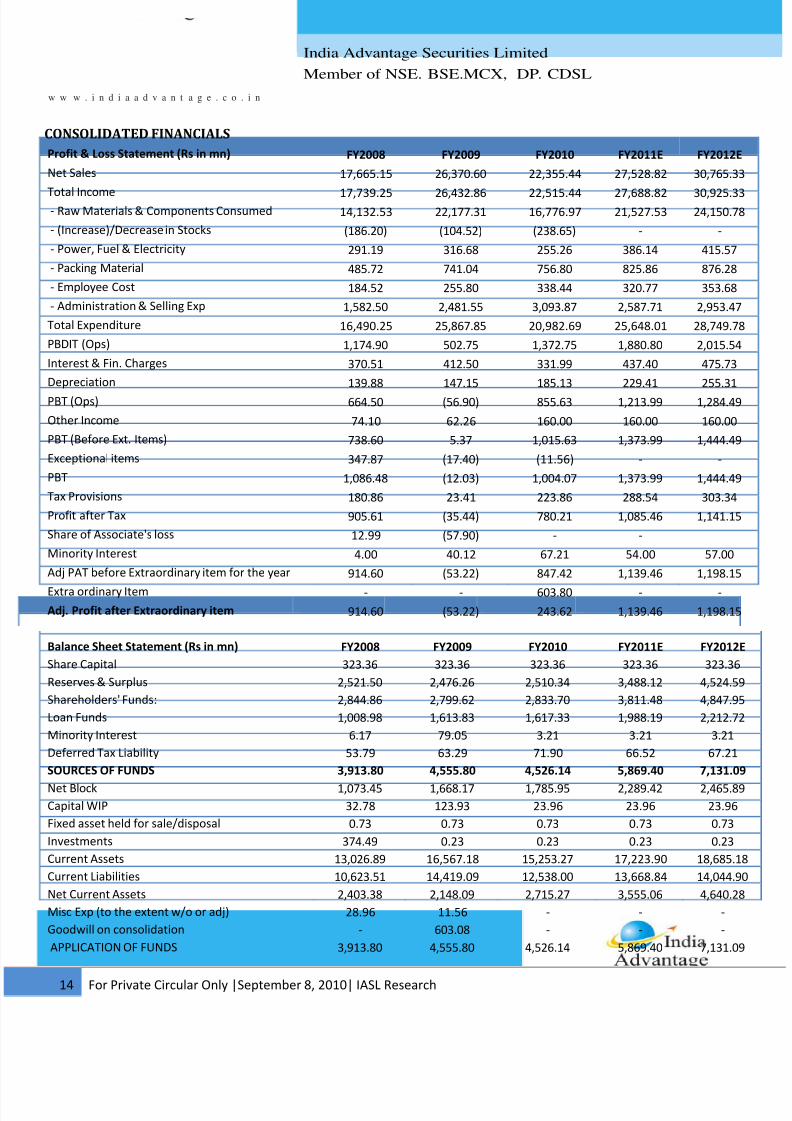
Profit & Loss Statement (Rs in mn) FY2008 FY2009 FY2010 FY2011E FY2012E
Net Sales 17,665.15 26,370.60 22,355.44 27,528.82 30,765.33
Total
Income
17,739.25 26,432.86 22,515.44 27,688.82 30,925.33‐ Raw Materials & Components Consumed 14,132.53 22,177.31 16,776.97 21,527.53 24,150.78
‐ (Increase)/Decrease in Stocks (186.20) (104.52) (238.65) ‐ ‐
‐ Power, Fuel & Electricity 291.19 316.68 255.26 386.14 415.57
‐ Packing Material 485.72 741.04 756.80 825.86 876.28
‐ Employee Cost 184.52 255.80 338.44 320.77 353.68
‐ Administration & Selling Exp 1,582.50 2,481.55 3,093.87 2,587.71 2,953.47
Total Expenditure 16,490.25 25,867.85 20,982.69 25,648.01 28,749.78
PBDIT (Ops) 1,174.90 502.75 1,372.75 1,880.80 2,015.54
Interest & Fin. Charges 370.51 412.50 331.99 437.40 475.73
Depreciation 139.88 147.15 185.13 229.41 255.31
PBT (Ops) 664.50 (56.90) 855.63 1,213.99 1,284.49
Other Income 74.10 62.26 160.00 160.00 160.00
PBT (Before Ext. Items) 738.60 5.37 1,015.63 1,373.99 1,444.49
Exceptional items 347.87 (17.40) (11.56) ‐ ‐
PBT 1,086.48 (12.03) 1,004.07 1,373.99 1,444.49
Tax Provisions 180.86 23.41 223.86 288.54 303.34
Profit after Tax 905.61 (35.44) 780.21 1,085.46 1,141.15
Share of Associate's loss 12.99 (57.90) ‐ ‐
Minority Interest 4.00 40.12 67.21 54.00 57.00
Adj PAT before Extraordinary item for the year 914.60 (53.22) 847.42 1,139.46 1,198.15
Extra ordinary Item ‐ ‐ 603.80 ‐ ‐
Adj. Profit after Extraordinary item 914.60 (53.22) 243.62 1,139.46 1,198.15
CONSOLIDATED FINANCIALS
Source: IASL Research
Balance Sheet Statement (Rs in mn) FY2008 FY2009 FY2010 FY2011E FY2012E
Share Capital 323.36 323.36 323.36 323.36 323.36
Reserves & Surplus 2,521.50 2,476.26 2,510.34 3,488.12 4,524.59
Shareholders' Funds: 2,844.86 2,799.62 2,833.70 3,811.48 4,847.95
Loan Funds 1,008.98 1,613.83 1,617.33 1,988.19 2,212.72
Minority Interest 6.17 79.05 3.21 3.21 3.21
Deferred Tax Liability 53.79 63.29 71.90 66.52 67.21
SOURCES OF FUNDS 3,913.80 4,555.80 4,526.14 5,869.40 7,131.09
Net Block 1,073.45 1,668.17 1,785.95 2,289.42 2,465.89
Capital WIP 32.78 123.93 23.96 23.96 23.96
Fixed asset held for sale/disposal 0.73 0.73 0.73 0.73 0.73
Investments 374.49 0.23 0.23 0.23 0.23
Current Assets 13,026.89 16,567.18 15,253.27 17,223.90 18,685.1
Current Liabilities 10,623.51 14,419.09 12,538.00 13,668.84 14,044.9
Net Current Assets 2,403.38 2,148.09 2,715.27 3,555.06 4,640.28
Misc Exp (to the extent w/o or adj) 28.96 11.56 ‐ ‐ ‐
Goodwill on consolidation ‐ 603.08 ‐ ‐ ‐
APPLICATION OF FUNDS 3,913.80 4,555.80 4,526.14 5,869.40 7,131.09
8/6/2019 APAR - Initial Coverage
http://slidepdf.com/reader/full/apar-initial-coverage 15/16
India Advantage Securities Limited
Member of NSE. BSE.MCX, DP. CDSL
15 For Private Circular Only |September 8, 2010| IASL Research
w w w . i n d i a a d v a n t a g e . c o . i n
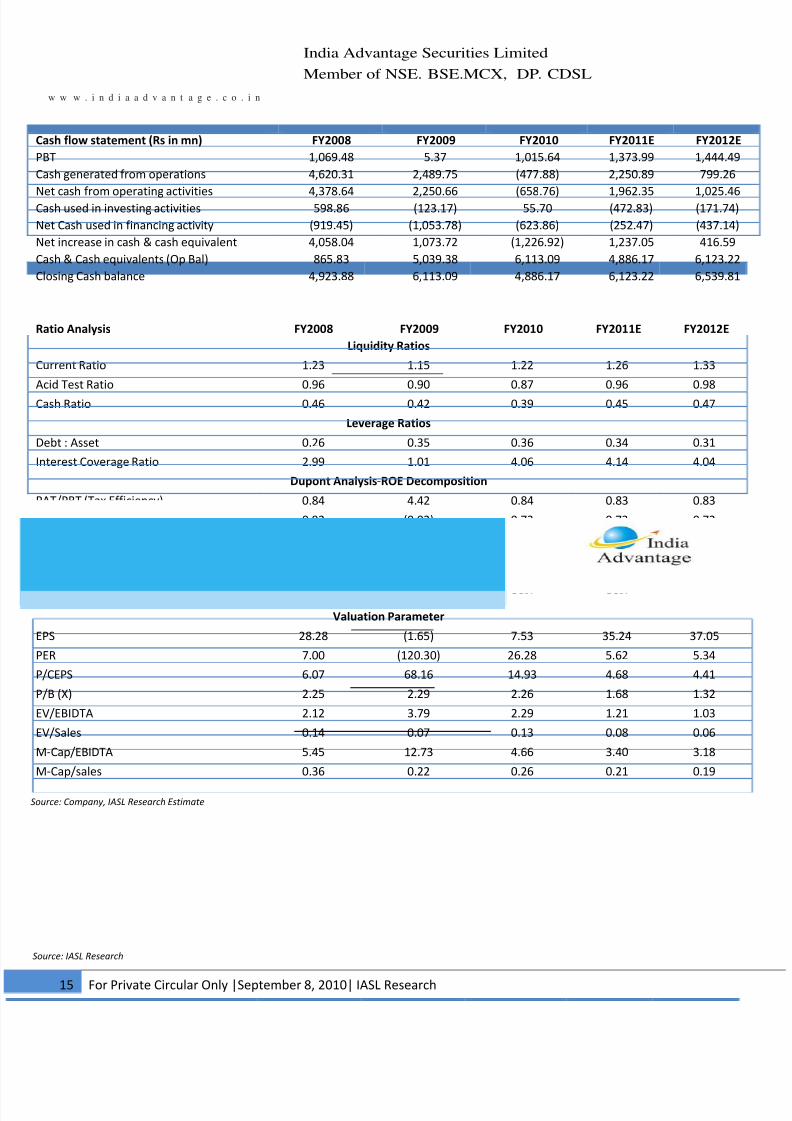
Cash flow statement (Rs in mn) FY2008 FY2009 FY2010 FY2011E FY2012E
PBT 1,069.48 5.37 1,015.64 1,373.99 1,444.49
Cash generated from operations 4,620.31 2,489.75 (477.88) 2,250.89 799.26
Net
cash
from
operating
activities
4,378.64 2,250.66 (658.76)
1,962.35 1,025.46Cash used in investing activities 598.86 (123.17) 55.70 (472.83) (171.74)
Net Cash used in financing activity (919.45) (1,053.78) (623.86) (252.47) (437.14)
Net increase in cash & cash equivalent 4,058.04 1,073.72 (1,226.92) 1,237.05 416.59
Cash & Cash equivalents (Op Bal) 865.83 5,039.38 6,113.09 4,886.17 6,123.22
Closing Cash balance 4,923.88 6,113.09 4,886.17 6,123.22 6,539.81
Ratio Analysis FY2008 FY2009 FY2010 FY2011E FY2012E
Liquidity Ratios
Current Ratio 1.23 1.15 1.22 1.26 1.33
Acid Test Ratio 0.96 0.90 0.87 0.96 0.98
Cash Ratio 0.46 0.42 0.39 0.45 0.47
Leverage Ratios
Debt : Asset 0.26 0.35 0.36 0.34 0.31
Interest Coverage Ratio 2.99 1.01 4.06 4.14 4.04
Dupont Analysis‐ROE Decomposition
PAT/PBT (Tax Efficiency) 0.84 4.42 0.84 0.83 0.83
PBT/EBIT (Interest Burden) 0.92 (0.02) 0.73 0.73 0.72
EBIT/Sales (OPM) 0.07 0.02 0.06 0.07 0.07
Sales/Total Assets (Asset Turnover) 4.51 5.79 4.94 4.69 4.31
TA/NW (Financial Leverage) 1.38 1.63 1.60 1.54 1.47
ROE 32% ‐2% 30% 30% 25%
Valuation Parameter
EPS 28.28 (1.65) 7.53 35.24 37.05
PER 7.00 (120.30) 26.28 5.62 5.34
P/CEPS 6.07 68.16 14.93 4.68 4.41
P/B (X) 2.25 2.29 2.26 1.68 1.32
EV/EBIDTA 2.12 3.79 2.29 1.21 1.03
EV/Sales 0.14 0.07 0.13 0.08 0.06
M‐Cap/EBIDTA 5.45 12.73 4.66 3.40 3.18
M‐Cap/sales 0.36 0.22 0.26 0.21 0.19
Source: IASL Research
Source: Company, IASL Research Estimate
8/6/2019 APAR - Initial Coverage
http://slidepdf.com/reader/full/apar-initial-coverage 16/16
India Advantage Securities Limited
Member of NSE. BSE.MCX, DP. CDSL
w w w . i n d i a a d v a n t a g e . c o . i n
IASL Research: E‐mail: [email protected]
Disclaimer: This document has been prepared by India Advantage Security Ltd. IASL is a full service, integrated portfolio management and brokerage group. Our rese
analysts and sales persons provide important input into our investment banking activities. This document does not constitute an offer or solicitation for the purchase or
of any financial instrument or as an official confirmation of any transaction. The information contained herein is from publicly available data or other sources believed t
reliable, but we do not represent that it is accurate or complete and it should not be relied on as such. IASL or any of its affiliates shall not be in any way responsible for
loss or damage that may arise to any person from any inadvertent error in the information contained in this report. This document is provided for assistance only and is
intended to be and must not alone be taken as the basis for an investment decision. The user assumes the entire risk of any use made of this information. Each recipie
this document should make such investigation as it deems necessary to arrive at an independent evaluation of an investment in the securities of companies referred t
this document (including the merits and risks involved), and should consult his own advisors to determine the merits and risks of such investment. The investment discu
or views expressed may not be suitable for all investors. We and our affiliates, officers, directors, and employees may: (a) from time to time, have long or short position
and buy or sell the securities thereof, of company (ies) mentioned herein or (b) be engaged in any other transaction involving such securities and earn brokerage or o
compensation or act as advisor or lender / borrower to such company (ies) or have other potential conflict of interest with respect to any recommendation and rel
information and opinions. This information is strictly confidential and is being furnished to you solely for your information.
This information should not be reproduced or redistributed or passed on directly or indirectly in any form to any other person or published, copied, in whole or in part
any purpose. This report is not directed or intended for distribution to, or use by, any person or entity who is a citizen or resident of or located in any locality, state, cou
or other jurisdiction, where such distribution, publication, availability or use would be contrary to law, regulation or which would subject IASL and affiliates to
registration or licensing requirements within such jurisdiction. The distribution of this document in certain jurisdictions may be restricted by law, and persons in w
possession this document comes, should inform themselves about and observe, any such restrictions. The information given in this document is as of the date of this re
and there can be no assurance that future results or events will be consistent with this information. This information is subject to change without any prior notice.
reserves the right to make modifications and alterations to this statement as may be required from time to time. However, IASL is under no obligation to update or keep
information current. Nevertheless, IASL is committed to providing independent and transparent recommendation to its client and would be happy to provide
information in response to specific client queries. Neither IASL nor any of its affiliates, directors, employees, agents or representatives shall be liable for any dam
whether direct, indirect, special or consequential including lost revenue or lost profits that may arise from or in connection with the use of the information. The analys
this report certifies that all of the views expressed in this report accurately reflect his or her personal views about the subject company or companies and its or t
securities, and no part of his or her compensation was, is or will be, directly or indirectly related to specific recommendations or views expressed in this report.
Analyst holding in stock: No.
Key to IASL Investment Rankings
Buy: Upside by>15%, Accumulate: Upside by +5% to 15%, Hold: Upside/Downside by ‐5% to +5%
Reduce: Downside by 5% to 15%, Sell: Downside by>15%
INDIA ADVANTAGE SECURITIES Ltd. (www.indiaadvantage.co.in)
Corporate Office: ‐ Om Plaza, Vasanji Lalji Road, Opp. Railway Station, Kandivali (W), Mumbai – 400 067.
Tel Phone nos.: 022 ‐ 3301 8475 Fax nos.: 022 – 2809 2800.