Initial Coverage Yestar International Holdings (2393 HK)
22
Hong Kong Equity Research 26 October 2015 Please refer to important disclosures at the end of this report 1 0.0 0.5 1.0 1.5 2.0 2.5 3.0 3.5 4.0 4.5 Yestar International Holdings (2393 HK) Initial Coverage Yestar International Holdings (2393 HK) Tapping into high-end PRC in vitro diagnostics market; initiate BUY rating Acquisitions of Jiangsu Uno and Shanghai Emphasis will enable Yestar to transform into a leading medical consumable distributor in the PRC with medical consumable segment revenue CAGR of 56.9% in FY14-FY17E Promising growth from medical consumables and stable business performance from colour photographic paper and industrial imaging products will boost FY14-FY17E revenue and EPS CAGR of 36% and 40% respectively We recommend BUY rating with TP of HK$3.97 implying 28.2% upside from the current level Will Chu, CFA (852) 2533 3713 [email protected] *Data as at 23 October 2015 Thriving demand for in vitro diagnostics products in China The in vitro diagnostics (IVD) market in the PRC is expected to grow at a CAGR of 19.5% through 2020. Yestar, upon completion of acquisition of 70% stake in Shanghai Emphasis, will become one of the largest IVD product distributors of Roche Diagnostics China, a subsidiary of Roche Holding AG (ROG VX). We expect Yestar to post exceptional growth in medical consumables segment with segment revenue CAGR of 56.9% in FY14-17E. Margin improvement driven by IVD M&As The revenue accretion of Shanghai Emphasis to Yestar’s P/L should lift Yestar ’s GPM from 18.0% for 1H15 to 23.1% for FY17E. Further IVD acquisitions (not factored in our model) with product offerings with higher GPMs should provide further GPM improvement potential. Traditional business segments are likely to be retained As a trusted business partner of Fujifilm Holdings (4901 JP) in the PRC, Yestar has been a leading manufacturer and distributor of a wide range of colour photographic papers and industrial imaging products. The long-standing strategic cooperation with Fujifilm enables Yestar to continue to generate stable cash flows for potential M&A in IVD business and development of sales channels. We initiate BUY with TP of HK$3.97 With IVD business as Yestar’s key growth driver, we estimate EPS CAGR of 40% in FY14-FY17E. Our TP of HK$3.97 translates into forward PER of 28.4x for FY16E, reflecting a fair valuation substantiated by the Company’s high EPS growth potential over 3-year forecast period. Exhibit 1: Financials and Valuation FY13 FY14 FY15E FY16E FY17E Turnover (RMB mn) 1,173.3 1,531.4 2,319.5 3,333.3 3,835.7 Turnover growth (%) 22.8% 30.5% 51.5% 43.7% 15.1% Operating profit (RMB mn) 99.4 152.8 279.1 483.8 579.7 Operating profit growth (%) 17.7% 53.6% 82.7% 73.3% 19.8% Net profit (RMB mn) 65.1 100.9 158.0 249.1 322.0 Net profit growth (%) 15.1% 55.1% 56.5% 57.7% 29.3% EPS (RMB cents) 4.4 5.4 7.8 11.5 14.8 DPS (HK$ cents) 2.2 3.4 4.2 6.1 7.9 P/E (x) 54.4 45.9 32.5 22.2 17.2 P/BV (x) 10.6 14.7 8.3 8.5 7.0 Dividend yield (%) 0.6% 0.9% 1.1% 1.5% 2.0% Source: Company Data, SBI Research Estimates Source: Bloomberg Stock Data (2393 HK) Rating BUY Price (HK$) 3.1 Target Price (HK$) 3.97 12m Price Range (HK$) 1.73-4.61 Market cap. (HK$m) 6,743 Daily t/o (HK$m) 14 Free float (%) 39% Source: Bloomberg HK$
Transcript of Initial Coverage Yestar International Holdings (2393 HK)

Hong Kong Equity Research 26 October 2015
Please refer to important disclosures at the end of this report 1
0.0
0.5
1.0
1.5
2.0
2.5
3.0
3.5
4.0
4.5
Yestar International Holdings (2393 HK)
Initial Coverage
Yestar International Holdings (2393 HK) Tapping into high-end PRC in vitro diagnostics market; initiate BUY rating
Acquisitions of Jiangsu Uno and Shanghai Emphasis will enable Yestar to transform into a leading medical consumable distributor in the PRC with medical consumable segment revenue CAGR of 56.9% in FY14-FY17E
Promising growth from medical consumables and stable business performance from colour photographic paper and industrial imaging products will boost FY14-FY17E revenue and EPS CAGR of 36% and 40% respectively
We recommend BUY rating with TP of HK$3.97 implying 28.2% upside from the current level
Will Chu, CFA (852) 2533 3713 [email protected]
*Data as at 23 October 2015
Thriving demand for in vitro diagnostics products in China
The in vitro diagnostics (IVD) market in the PRC is expected to grow at a CAGR of 19.5%
through 2020. Yestar, upon completion of acquisition of 70% stake in Shanghai Emphasis,
will become one of the largest IVD product distributors of Roche Diagnostics China, a
subsidiary of Roche Holding AG (ROG VX). We expect Yestar to post exceptional growth in
medical consumables segment with segment revenue CAGR of 56.9% in FY14-17E.
Margin improvement driven by IVD M&As
The revenue accretion of Shanghai Emphasis to Yestar’s P/L should lift Yestar’s GPM from
18.0% for 1H15 to 23.1% for FY17E. Further IVD acquisitions (not factored in our model)
with product offerings with higher GPMs should provide further GPM improvement
potential.
Traditional business segments are likely to be retained
As a trusted business partner of Fujifilm Holdings (4901 JP) in the PRC, Yestar has been a
leading manufacturer and distributor of a wide range of colour photographic papers and
industrial imaging products. The long-standing strategic cooperation with Fujifilm enables
Yestar to continue to generate stable cash flows for potential M&A in IVD business and
development of sales channels.
We initiate BUY with TP of HK$3.97
With IVD business as Yestar’s key growth driver, we estimate EPS CAGR of 40% in
FY14-FY17E. Our TP of HK$3.97 translates into forward PER of 28.4x for FY16E, reflecting a
fair valuation substantiated by the Company’s high EPS growth potential over 3-year
forecast period.
Exhibit 1: Financials and Valuation
FY13 FY14 FY15E FY16E FY17E
Turnover (RMB mn) 1,173.3 1,531.4 2,319.5 3,333.3 3,835.7
Turnover growth (%) 22.8% 30.5% 51.5% 43.7% 15.1%
Operating profit (RMB mn) 99.4 152.8 279.1 483.8 579.7
Operating profit growth (%) 17.7% 53.6% 82.7% 73.3% 19.8%
Net profit (RMB mn) 65.1 100.9 158.0 249.1 322.0
Net profit growth (%) 15.1% 55.1% 56.5% 57.7% 29.3%
EPS (RMB cents) 4.4 5.4 7.8 11.5 14.8
DPS (HK$ cents) 2.2 3.4 4.2 6.1 7.9
P/E (x) 54.4 45.9 32.5 22.2 17.2
P/BV (x) 10.6 14.7 8.3 8.5 7.0
Dividend yield (%) 0.6% 0.9% 1.1% 1.5% 2.0%
Source: Company Data, SBI Research Estimates
Source: Bloomberg
Stock Data (2393 HK)Rating BUY
Price (HK$) 3.1
Target Price (HK$) 3.97
12m Price Range (HK$) 1.73-4.61
Market cap. (HK$m) 6,743
Daily t/o (HK$m) 14
Free float (%) 39%
Source: Bloomberg
HK$

Hong Kong Equity Research 26 October 2015
Please refer to important disclosures at the end of this report 2
Investment Thesis Business Our view Yestar International Holdings Company Limited (“the Company” or “Yestar”) is the largest OEM manufacturer and distributor of Fujifilm in the PRC. Hartono family, the major ultimate beneficiaries of the Company, has established business relationship with Fujifilm since 1971. In 2001, Yestar began the co-development of the imaging consumables market with Fujifilm in the PRC. The company has endeavoured to shift their development focus to the medical consumable business and is transforming from a traditional colour photographic paper and industrial imaging product manufacturer into a medical consumables distributor. In November 2014, the company acquired 70% stake in Jiangsu Uno Technology Development Company Limited (“Jiangsu Uno”), a distributor of medical consumables and equipment of Roche Diagnostics and Becton Dickinson and Company (BDX US) in Jiangsu and Anhui provinces. Moreover, the company is in the process of completing the acquisition of 70% equity interest in Shanghai Emphasis Investment Management Consulting Co., Ltd. and other 4 companies (collectively referred to as “Shanghai Emphasis”) in order to venture into the IVD distribution market in Shanghai. Shanghai Emphasis, being one of the major distributors of IVD products of Roche Diagnostics and Thermo Fisher Scientific Inc. (TMO US) in Shanghai, will add substantial weight to Yestar’s medical consumables revenue from 4Q15 onwards.
We project medical consumables segment revenue and gross profit CAGRs of 56.9% and 93.8% respectively for FY14-FY17E on the back of solid expected revenue growths from Jiangsu Uno and Shanghai Emphasis whose IVD products yield higher GPMs than Yestar’s other existing products.
Valuation is attractive in respect of high growth rates Yestar is trading at FY14 historical PER of 46x and FY15E forward PER of 32.5x. Its comparable peers listed in Hong Kong and the PRC are expected to post similar or slower EPS growth rates in FY15E and FY16E but have a much lower ROE than Yestar. Our TP of HK$3.97 is translated into FY16E forward PER of 28.4x. Current valuation is attractive in respect of Yestar’s promising EPS growth rates upon completion of announced M&A transactions while further acquisitions of IVD distributors serve as a price catalyst.
Hong Kong Equity Research 26 October 2015
Please refer to important disclosures at the end of this report 3
Contents
Company Overview ..................................................................................................................................................... 4
Company Background .............................................................................................................................................. 4
Tapping into Thriving in vitro Diagnostics Market in the PRC ..................................................................................... 7
Yestar’s Transformation Rides on the Leading Position of Roche Diagnostics China ............................................. 9
Stunning Profit Growth with Improved Profitability ................................................................................................. 11
Well Managed Liquidity and Leverage .................................................................................................................. 12
SWOT Analysis ........................................................................................................................................................... 13
Company Valuation ................................................................................................................................................... 14
Key Assumptions ................................................................................................................................................... 14
DCF Valuation ........................................................................................................................................................ 16
Risks ....................................................................................................................................................................... 17
Yestar International Holdings (2393 HK): Financial Statements ............................................................................... 18
Appendix I: Company Structure................................................................................................................................. 20
Appendix II: Company History and Development ..................................................................................................... 21

Hong Kong Equity Research 26 October 2015
Please refer to important disclosures at the end of this report 4
Company Overview
Yestar International is a high-margin medical consumables company in the PRC. Its core businesses include manufacturing and distribution of medical and dental films for Fujifilm and marketing Roche Diagnostics and BD branded in vitro diagnostic (IVD) products in Jiangsu and Anhui provinces. The company also manufactures and distributes dental films under its house brand “Yes!Star.” Meanwhile, the company is also a sole processor and exclusive distributor of Fujifilm colour photographic papers and industrial imaging products (including industrial Non-Destructive Testing (NDT) x-ray films and printed wiring board (PWB) films) in the PRC.
Company Background Hartono family (holding 61.17% of Yestar) has been conducting business with Fujifilm Group since 1971. Their cooperation began with the sales of photo-related products of Fujifilm Group in Indonesia in 1970s and has since included the manufacturing and sales of photo imaging products (such as colour photographic paper, colour film and other photo-related products), document printing products and medical products (such as medical dry films and wet films) in Indonesia, Vietnam, India, Cambodia and the PRC. Yestar’s key operating subsidiary, Yestar (Shanghai) Co., Ltd., was established as a limited liability company in July 2000. Over the years, the variety and quantity of Fujifilm Group’s products processed and sold by the Company have expanded significantly. An introduction of the major products (excluding IVD ones) is listed as follows:
(i) Medical dry film Medical dry film is a type of medical films printed by imagers and does not require wet processing chemistry or a darkroom environment. Yestar’s medical dry film business with Fujifilm began in July 2010. The master rolls of medical dry film are purchased from Fujifilm before processed and packaged under the Fujifilm brand for selling back to Fujifilm. The Company is not involved in the distribution of the processed Fujifilm medical dry film. On the other hand, the Company targets to introduce a series of Yes!Star brand medical dry film and dry film applications in 2015 to cater to the demand from the rural areas, complementary to Fujifilm branded products which target at high-end customers.
(ii) Medical wet film Medical wet film is the traditional form of medical film used in diagnostic imaging that needs to be developed through wet processing in a darkroom. Similar to medical dry film, Yestar purchases the raw material from Fujifilm and sells the processed and packaged Fujifilm-branded film back to Fujifilm. The production of the medical wet film began in November 2012.
(iii) Dental film
In March 2011, Yestar began manufacturing and packaging the processed dental films for sale to hospitals, clinics and wholesalers in the PRC.
(iv) Colour photographic papers
Yestar Shanghai commenced purchase of colour photographic paper and colour film from Fujifilm Group in 2001. Master rolls of colour photographic paper purchased from Fujifilm Group are converted into customized ready-to-use sizes and packaged under the Fujifilm brand for sale in the PRC. Products of colour photographic paper include: i) minilab colour photographic paper sold to wholesalers and end users such as image printing shops, and ii) professional colour photographic paper sold to wholesalers and end users such as professional photo processing labs which

Hong Kong Equity Research 26 October 2015
Please refer to important disclosures at the end of this report 5
develop photos for photo studios. The Company entered into master contracts with Fujifilm Group in 2005 to process and sell Fujifilm colour photographic papers in the PRC. In June 2013, the Company was appointed as the sole and exclusive distributor of Fujifilm colour photographic papers in the PRC.
(v) Industrial NDT x-ray film In October 2011, Yestar commenced mass production of industrial NDT x-ray films, converting master rolls into sheets of customized ready-to-use sizes and selling them under “Yes!Star” brand. The Company also obtained non-exclusive distributorship of Fujifilm industrial NDT x-ray film in the PRC in the same month and its sales began in 2012. At present customers are mainly companies engaged in quality inspection of industrial goods, as well as the trading, installation and repair of the relevant quality inspection equipment. The company targets Fujifilm industrial NDT x-ray film at customers who require higher quality films, and Yes!Star industrial NDT x-ray films at low to mid-end customers, respectively.
(vi) PWB film
Yestar purchases master rolls of PWB film from Fujifilm Group, slits them into specified sizes and packages them under the Fujifilm brand for sale back to Fujifilm Group. The sales of the PWB film commenced in November 2012. As of 30 June 2015, Fujifilm is the only customer of the processed PWB film.
Processing and Distribution
Yestar currently has two processing plants, both located in Nanning, Guangxi province. The processed films are transported and stored in warehouses located in 3 different cities and subsequently distributed through its sales network covering 18 cities and municipalities in the PRC.
Exhibit 2: Yestar’s Production Facilities
Name Gaoxin Processing Plant, Nanning Jinkai Processing Plant,
Nanning
GFA (sq. m) 16,856 39,862
Products processed Medical dry film
Medical wet film
Dental film
Colour photographic paper
Industrial NDT x-ray film
PWB film
Colour photographic paper
Source: Company Prospectus
Exhibit 3: Yestar’s Warehouses
Location Hi-tech District, Nanning Dongxihu District, Wuhan Dadong District, Shenyang
Area (sq. m) 2,000 200 10
Source: Company Prospectus

Hong Kong Equity Research 26 October 2015
Please refer to important disclosures at the end of this report 6
Exhibit 4: Processes for Colour Photographic Paper, Industrial Imaging Films and
Medical Imaging Films
Source: Company Prospectus
Master rolls
Removal of inner and outer
packaging material
Slitting and cutting
Inner packaging
Outer packaging

Hong Kong Equity Research 26 October 2015
Please refer to important disclosures at the end of this report 7
11,574 14,535
17,542 19,980
24,346 27,847
31,662
62,147
0
10,000
20,000
30,000
40,000
50,000
60,000
70,000
2007 2008 2009 2010 2011 2012 2013 2020E
Health Expenditure in China (RMB100mn)
17.1%
11.7% 11.3% 10.9%
9.4% 9.1%
5.6%
10.3%
7.2%
4.6%
0%
2%
4%
6%
8%
10%
12%
14%
16%
18%
Tapping into Thriving in vitro Diagnostics Market in the
PRC
In vitro diagnostics (IVDs) refer to tests which make use of instruments, apparatuses, reagents, calibrators and systems tailor-made for determining health status or diagnosing diseases, thus for the purpose of preventing, curing, mitigating and post-treatment monitoring diseases, infections and their sequelae
1. IVD products
are specifically designed and manufactured for collecting specimens (such as blood samples, body fluid and tissues) derived from the human body and examining them outside the human body. The tests are usually carried out in hospitals, clinics and laboratories but are sometimes applied to personal settings too. Roche Diagnostics, Abbott Laboratories Inc., Danaher Corporation, Siemens and Johnson and Johnson are the prominent leaders in the global IVD market which attained an aggregate market value of US$53.3bn in 2013.
PRC’s IVD Market Is Outpacing the Overall Health Expenditure
Official publications report that the total health expenditure in the PRC in 2013 reached RMB3,166.2bn or 5.6% of GDP of that year. The proportion is much lower than major developed countries and many other Asian counterparts. A report published by Deloitte earlier this year suggests that if the proportion of health expenditure to GDP increases to 6.4%, the PRC’s health expenditure will grow to RMB6,214.7bn in 2020, representing a CAGR of 10.1% for 2013-2020E. Apparently there is substantial room for the PRC Government to catch up with the developed countries in terms of the proportion of health expenditure on her citizens for the many years to come.
Exhibit 5: Health Expenditure in China Exhibit 6: Health Expenditure as % of GDP in 2013
Source: Health Statistics Yearbook, Deloitte Analysis, SBI Research Source: World Bank, Deloitte, SBI Research
The PRC’s IVD market is outpacing the country’s health expenditure. A report published by Renub Research estimates a boom of the PRC’s IVD market from US$3,111mn in 2014 to US$6,336mn in 2018 with CAGR of 19.5%. The impressive expected growth also contrasts with the projected CAGR of 5.34% for the global IVD market over the same period. Continued urbanization, increased disease burdens, rising Chinese disposable incomes leading to higher affordability for more precise and more reliable medical treatments, and the PRC Government’s priority for healthcare reforms and continued healthcare investments, are among the key growth drivers of the PRC’s IVD market, making it attractive to both local and foreign players.

Hong Kong Equity Research 26 October 2015
Please refer to important disclosures at the end of this report 8
1,472 1,685 1,943
2,258 2,642
3,111 3,686
4,393
5,263
6,336
0
1,000
2,000
3,000
4,000
5,000
6,000
7,000
2009 2010 2011 2012 2013 2014E 2015E 2016E 2017E 2018E
426 481
656
843
1,062
0%
5%
10%
15%
20%
25%
30%
0
200
400
600
800
1,000
1,200
FY10 FY11 FY12 FY13 FY14
Revenue
Y/Y % change (CER)
Exhibit 7: IVD Market in the PRC
Source: Renub Research Analysis, Company Data, SBI Research
The PRC’s IVD market concentration is not as high as that globally though the market is also dominated by foreign multinational corporations. Roche Diagnostics stands first with c.21% market share, followed by Danaher Corporation’s Beckman Coulter (c.10%) and Siemens Healthcare (c.8%). More specifically, the high-end IVD market is predominantly occupied by foreign players which leverage their technical expertise to manufacture high-quality reagents and automatic analyzers embedded with well-developed closed-end systems. In contrast, the low and mid-end markets are crowded with local players, some of which are trying to gain a foothold in the high-end market by marketing substitution equipment and analyzers to low-end hospitals with lower selling prices than foreign competitors. Roche Diagnostics China is one of the fastest-growing geographical units for Roche Diagnostics, achieving revenue of CHF1,062mn (RMB6,600mn) in FY14 with 4-year revenue CAGR of 26% on constant exchange rate (CER) terms. In FY14, the revenue growth of Roche Diagnostic China was primarily driven by the Professional Diagnostics Division with noteworthy performance in immunodiagnostics, clinical chemistry and coagulation monitoring businesses.
Exhibit 8: Revenue Performance of Roche Diagnostics China
Source: Roche Holding Annual Reports, SBI Research
The distinguished sales performance of Roche Diagnostics China and the rising importance of the PRC in Roche’s business in emerging markets have prompted the company’s commitment to upscale its capital investment in the country. In November 2014, Roche announced to invest as much as CHF450mn in the establishment of a new Roche Diagnostics manufacturing site at the Suzhou Industrial Park in Suzhou, Jiangsu province. The facility, which is the first in the Asian Pacific Region for Roche, will focus on production crucial to clinical laboratory testing and is expected to be fully operational by 2018. Renub Research expects Roche to attain 27.9% market share in the PRC IVD market by then.
US$ mn
CHF mn
US$ mn

Hong Kong Equity Research 26 October 2015
Please refer to important disclosures at the end of this report 9
45 54 64
156 187
225
0
50
100
150
200
250
300
FY14 FY15E FY16E FY17E
Shanghai Emphasis
Jiangsu Uno
Yestar’s Transformation Rides on the Leading Position of Roche
Diagnostics China Yestar’s transformation into a medical consumable and equipment distributor concurs with Roche Diagnostics’ aggressive expansion in the PRC. In November 2014, the company acquired 70% stake in Jiangsu Uno Technology Development Company Limited (“Jiangsu Uno”), a leading distributor of medical consumables and equipment of Roche Diagnostics and BD covering as many as 279 hospitals (mainly Grade 3 hospitals) and clinics in Jiangsu and Anhui provinces. The acquisition (consideration: RMB245mn) is appended by a condition that Yestar shall purchase the remaining 30% stake in Jiangsu Uno for RMB250mn when all the Annual Guarantee Profits for FY14E-FY16E are met. A similar Profit Guarantee arrangement is imposed on Yestar’s 70% share acquisition of Shanghai Emphasis (in progress, with consideration RMB910mn), one of the largest Roche Diagnostics and Thermo Fisher Scientific distributors in Shanghai with extensive coverage of 382 hospitals and clinics in the city. Should all the Annual Guarantee Profits for FY15E, FY16E and FY17E be complied, Yestar shall purchase the remaining 30% of shares in Shanghai Emphasis for RMB675mn. Upon the acquisition of the shares of Shanghai Emphasis, Yestar ’s share of the Roche Diagnostics China market will reach c.15%. We compare Yestar’s acquisitions to the case of Humanwell Healthcare (Group) Co., Ltd. (600079 CH), a Wuhan-based pharmaceutical company which acquired 80% equity interest in Beijing Baron Medical Equipment Co., Ltd. (the largest Roche Diagnostics product distributor in the PRC) in June 2012. All the Annual Guarantee Profits imply a NPAT CAGR of 20% over the guarantee periods, in line with Renub Research’s projected revenue CAGR of 19.5% for the PRC’s IVD market. Also, the acquisition valuation is translated into forward PER of 7.5x - 8.5x of the individual target’s Annual Profit Guarantee in the respective year of acquisition. Yestar’s recent acquisitions are therefore not expensive, in our view.
Exhibit 9: Profit Guarantees for Yestar’s Acquisitions
Source: Company Data, SBI Research
US$ mn RMB mn

Hong Kong Equity Research 26 October 2015
Please refer to important disclosures at the end of this report 10
Exhibit 10: Recent M&As Involving Distributors of Roche Diagnostics China
Acquirer Humanwell Healthcare
(Group) Co., Ltd.
(600079 CH)
Yestar (2393 HK) Yestar (2393 HK)
Target Beijing Baron Medical
Equipment Co., Ltd.
Jiangsu Uno Shanghai Emphasis
Acquisition Date June 2012
(completed)
November 2014 (completed) October 2015
(expected)
Consideration of
Acquisition
RMB776mn for 80% stake RMB245mn for 70% stake RMB910mn for 70% stake
Acquisition Valuation 10x (based on FY11
historical PE)
8.3x (based on FY12E net
profit guarantee)
7.8x (based on FY14E net
profit guarantee)
6.5x (based on FY15E net
profit guarantee)
13x (based on 2014 IFRS
NPAT)
8.3x (based on FY15E net
profit guarantee)
Profit Guarantee
(If Any)
RMB116.4mn/ 139.7mn/
167.6mn for FY12E/ FY13E/
FY14E
RMB45mn/ 54mn/ 64mn for
FY14E/ FY15E/ FY16E
RMB156mn/ 187mn/ 225mn
for FY15E/ FY16E/ FY17E
Remarks N.A. Yestar shall acquire the
remaining 30% equity
interest in Jiangsu Uno for
RMB250mn when all the
profit guarantees are
achieved
Yestar shall acquire the
remaining 30% equity
interest in Shanghai Emphasis
for RMB675mn when all the
profit guarantees are
achieved
Source: Company Data, Humanwell Healthcare Annual Reports, SBI Research Estimates
Given the enhanced business relationship between Yestar and Roche, we expect Yestar’s next M&A target (possibly by the end of FY15) to be another Roche Diagnostics distributor located in Eastern China such that Yestar will deepen its distribution network and uphold its leading Roche distributorship position across the region. Further, we expect the scale of such acquisition to be similar to that of Jiangsu Uno so the Company could make use of the bank borrowing facilities rather than further equity financing to fill the funding gap. Nevertheless, our valuation model does not factor in the financial impacts of the potential transaction whose details are yet announced.
GPM to Improve Further upon Completion of Shanghai Emphasis
Acquisition
Yestar’s ongoing transformation into a medical consumable company has not only led to a surge in the total revenue but also improvement in profit margins. Overall GPM attained 18.0% for 1H15 versus 15.7% for 1H14 thanks to Jiangsu Uno’s IVD products delivering high GPM at 28.2% during the period. As Shanghai Emphasis is expected to contribute as much as 3 times the annual revenue of Jiangsu Uno with product GPM expected to be as high as c.35%, we expect Company GPM to shoot past 20% from FY16E onwards, attaining 22.5% in FY17E.

Hong Kong Equity Research 26 October 2015
Please refer to important disclosures at the end of this report 11
22.8%
30.5%
0%
10%
20%
30%
40%
0
500
1,000
1,500
2,000
FY12 FY13 FY14
Medical consumables Colour photographic papers Industrial imaging & other image printing products Revneue Y/Y growth rate (%)
0
200
400
600
800
1,000
1,200
1H14 1H15
Industrial imaging & other image printing products
Colour photographic papers
Medical consumables
109
180
15.7%
18.0%
10%
12%
14%
16%
18%
20%
0
50
100
150
200
1H14 1H15 Gross Profit GPM
Stunning Profit Growth with Improved Profitability
As the consolidation of Jiangsu Uno’s financials effects further in 1H15, the Company recorded revenue of RMB1.0bn in the period or 44% revenue growth Y/Y. The medical consumable business soared 86.6% Y/Y to RMB629.1mn, as the Company successfully introduced 3 series of IVD products, namely ProGRP (lung cancer), Calcitonin (medullary thyroid cancer) and Syphilis (syphilis disease). The colour photographic paper and industrial imaging product managed to post 3.8% Y/Y revenue growth in 1H15 with revenue RMB370.5mn.
Exhibit 11: Revenue and Revenue Growth Rates
Source: Company Data, SBI Research
Gross profit increased by 64.5% Y/Y, from RMB109mn for 1H14 to RMB180mn for 1H15. Overall GPM improved from 15.7% in 1H14 to 18.0% in 1H15, as the medical consumable business which, with the inclusion of sales of high-margin Jiangsu Uno IVD products, attained segment GPM of 19.3% in the period, up 710bps from a year earlier. This was partially offset by the decreased GPM from the colour photographic paper and industrial imaging segments (15.8% for 1H15 vs 19.0% for 1H14) mainly due to a decrease in the unit price of the industrial imaging products.
Exhibit 12: Gross Profit and GPM
Source: Company Data, SBI Research
RMB mn RMB mn
694
1000
337
257
100
629
268
103
RMB mn

Hong Kong Equity Research 26 October 2015
Please refer to important disclosures at the end of this report 12
4.4%
3.8%
3.5% 3.9%
0.4% 0.6%
0.0%
0.5%
1.0%
1.5%
2.0%
2.5%
3.0%
3.5%
4.0%
4.5%
5.0%
1H14 1H15
Selling and distribution costs
Administrative expenses
Finance costs
The net profit attributable to shareholders of Yestar soared 49% Y/Y from RMB37mn for 1H14 to RMB56mn for 1H15. NPM improved slightly from 5.4% for 1H15 to 5.6% for 1H15. The reduction in selling and distribution costs as % of total revenue was offset by increased administrative expenses as % of revenue owing to amortization of intangible assets from Jiangsu Uno, and by increased finance costs incurred in the acquisition of the shares of Jiangsu Uno.
Exhibit 13: Key Expenses as % of Revenue
Source: Company Data, SBI Research
Well Managed Liquidity and Leverage The consolidation of IVD business has led to a higher number of days of AR while Yestar benefits from a shorter inventory period. As a result, additional AR of RMB270mn was recorded on 30 Jun 2015 compared to the snapshot recorded on 31 Dec 2014. The lengthened cash conversion cycle does not hamper Yestar’s liquidity whose current ratio improved to 1.35x as at 30 Jun 2015 from 1.19x of the end of FY14.
Exhibit 14: Cash Conversion Cycle
1H14 1H15
Inventory turnover days 84.3 72.0
Receivables turnover days 4.4 35.5
Payable turnover days 61.9 65.2
Cash conversion cycle in days 26.8 42.3
Source: Company Data, SBI Research
Recent acquisitions of IVD product suppliers have prompted the Company’s utilization of debt financing as the firm’s net debt-to-equity ratio rose from 9.5% as at 31 Dec 2014 to 22.4% as at 30 Jun 2015. Although the interest-bearing bank borrowings surged by RMB280mn throughout 1H15, the Company has made it clear that RMB100mn-200mn undrawn credit facilities with banks are still available for the purpose of the upcoming IVD acquisition. The Company has ample room to increase its bank borrowings and therefore leverage to support high revenue growth, in our view.

Hong Kong Equity Research 26 October 2015
Please refer to important disclosures at the end of this report 13
Strengths
- Over 40 years of relationship with Fujifilm - Relationship with Roche China strengthened as more M&As are engaged
Weaknesses
- Short history of IVD product distribution
Opportunities
- >100 IVD distributors in the PRC with low concentration. The trend of consolidation of distributors offers further M&A opportunities for Yestar
Threats
- IVD products have a longer cash conversion cycle than traditional industrial products - Local players have begun to penetrate into the high-end IVD market
SWOT Analysis
We believe the business prospect of Yestar hinges critically on two relationships: one with Fujifilm and the other with Roche. The Company’s long-standing relationship with Fujifilm has earned it exclusive and non-exclusive distribution rights of a number of Fujifilm industrial products in the PRC, with relatively stable profit margins. This has enabled the Company to maintain a leading market position in traditional products (No.1 in colour photographic paper market with c.55% share). The business partnership with Fujifilm is expected to continue in the medium- to-long term. On the other hand, as the Company engages in further M&As involving Roche Diagnostics China product distributors, the Company would be able to secure the stable supply of Roche Diagnostics branded products delivering substantially higher margins than the existing combination of photographic and industrial imaging products. As Roche Diagnostics is dedicated to investment in the PRC in view of the IVD market boom, Yestar is poised for a promising growth in their medical consumable business for the years to come.
Exhibit 15: SWOT Analysis Diagram
Source: SBI Research

Hong Kong Equity Research 26 October 2015
Please refer to important disclosures at the end of this report 14
0%
10%
20%
30%
40%
50%
60%
0
500
1,000
1,500
2,000
2,500
3,000
3,500
4,000
4,500
FY13 FY14 FY15E FY16E FY17E
Revenue Y/Y revenue growth rate (%)
0%
10%
20%
30%
40%
50%
60%
70%
80%
90%
100%
FY13 FY14 FY15E FY16E FY17E
Industrial imaging & other products
Colour photographic papers
Medical consumables
0
500
1,000
1,500
2,000
2,500
3,000
FY13 FY14 FY15E FY16E FY17E Medical consumables
Company Valuation
Key Assumptions Equity investment in Shanghai Emphasis is complete in Oct 2015 and
consolidation begins from 4Q15 No further share placement or other forms of dilution All profit guarantees for Jiangsu Uno and Shanghai Emphasis are met Acquisition of the minority interests in Jiangsu Uno in 2017 and Shanghai
Emphasis in 2018 are financed by internal resources or bank facilities
Revenue is Expected to Grow at CAGR of 36% for FY14-FY17E
We expect Yestar’s medical consumable revenue to grow at CAGR of 56.9% for FY14E-FY17E as Jiangsu Uno’s revenue contribution is fully reflected and as revenue accretion of Shanghai Emphasis takes effect. The colour photographic paper and industrial imaging paper segments are expected to increase at CAGR of c.10% over the same period as we factor in a slight price pressure from these segments in FY15E. Overall, we project a revenue CAGR of 36% for the period, when the total revenue should reach RMB3,855mn in FY17E. As the 3-year growth rate for medical consumables is expected to be much higher than those for colour photographic papers and industrial imaging products, we expect the proportion of company revenue from the medical consumable segment would increase to 73% in FY17E.
Exhibit 16: Revenue and Y/Y growth Exhibit 17: Revenue breakdown by segment
Source: Company Data, SBI Research Estimates Source: Company Data, SBI Research Estimates
Exhibit 18: Revenue of Medical Consumables Segment
Source: Company Data, SBI Research Estimates
RMB mn
RMB mn

Hong Kong Equity Research 26 October 2015
Please refer to important disclosures at the end of this report 15
Exhibit 19: Key Assumptions
FY13 FY14 FY15E FY16E FY17E
Revenue Y/Y growth (%)
Medical consumables 60.9% 52.0% 99.2% 65.0% 17.5%
Colour photographic papers -9.1% 11.3% 9.0% 9.0% 9.0%
Industrial imaging & other products 149.9% 32.2% 9.0% 9.0% 9.0%
SG&A expenses as % of revenue -9.8% -7.6% -8.0% -8.0% -8.0%
Finance costs as % of revenue -0.5% -0.4% -0.7% -0.8% -0.8%
Effective tax rate (%) 30.2% 29.6% 29.3% 29.3% 29.3%
Segment Breakdown
FY13 FY14 FY15E FY16E FY17E
Revenue (RMB mn)
Medical consumables 474 721 1,436 2,371 2,786
Colour photographic papers 545 607 661 721 786
Industrial imaging & other products 154 204 222 242 264
Total 1,173 1,531 2,320 3,333 3,836
Gross Profit (RMB mn)
Medical consumables 65 96 302 574 699
Colour photographic papers 121 131 122 133 141
Industrial imaging & other products 23 36 39 42 45
Total 209 263 463 749 885
GPM (%)
Medical consumables 13.7% 13.3% 21.0% 24.2% 25.1%
Colour photographic papers 22.2% 21.6% 18.5% 18.5% 18.0%
Industrial imaging & other products 15.2% 17.9% 17.5% 17.5% 17.0%
Overall 17.8% 17.2% 20.0% 22.5% 23.1%
Source: Company Data, SBI Research Estimates

Hong Kong Equity Research 26 October 2015
Please refer to important disclosures at the end of this report 16
DCF Valuation Our valuation for the Company is based on the multi-stage DCF model with risk-free rate 4%, market risk premium of 7%, equity beta of 0.85 and terminal growth rate of 3.5% beyond FY25E. We project negative free cash flow to the Company in FY15E and FY18E due to the cash paid (as part of capex) for the purpose of acquiring 70% and 30% stake, in Shanghai Emphasis in the respective years. Beyond FY18E the Company is expected to produce stable free cash flow assuming no further M&As take place. Our fair value per share of HK$3.97 is equivalent to PER of 41.6x for FY15E and 28.4x for FY16E, implying a 28.2% upside from the current price.
Exhibit 20: DCF Model
Terminal Growth Rate (%) 3.5%
Risk-free Rate (%) 4.0%
Market Risk Premium (%) 7.0%
Equity Beta 0.85
Cost of Debt (%) 5.00%
Cost of Equity (%) 9.95%
Target D/A 15.00%
Target E/A 85.00%
Tax Shield (%) 70.70%
WACC (%) 8.99%
('000) FY15E FY16E FY17E FY18E FY19E FY20E FY21E FY22E FY23E FY24E FY25E
FCFF (RMB) (924,883) 114,607 40,130 (294,112) 428,237 494,863 544,916 601,667 662,710 715,677 752,300
Discount Factor 1.000 0.918 0.842 0.772 0.709 0.650 0.597 0.547 0.502 0.461 0.423
Discounted FCFF (RMB) (924,883) 105,156 33,785 (227,185) 303,510 321,808 325,135 329,391 332,891 329,851 318,137
PV of Estimated FCFF (RMB) 1,247,596
PV of Terminal FCFF (RMB) 6,000,123
Value of Firm (RMB) 7,247,718
Add: Cash and Cash Equiv (RMB) 333,971
Minus: Debt (RMB) (494,593)
Value of Equity (RMB) 7,087,096
Value of Equity (HKD) 8,646,258
No. of shares 2,175,200
Intrinsic Value pEr Share (HKD) 3.97
Current Price (HKD) 3.10
Potential Upside (%) 28.2%
Source: SBI Research Estimates
Hong Kong Equity Research 26 October 2015
Please refer to important disclosures at the end of this report 17
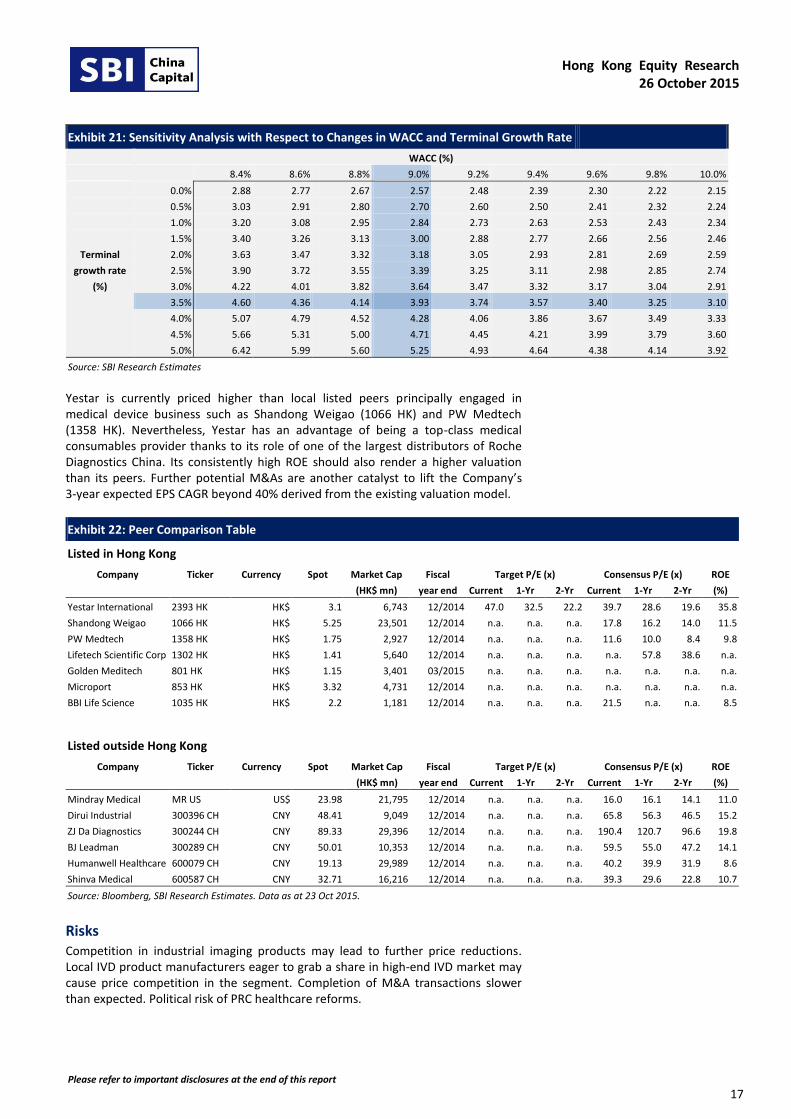
Exhibit 21: Sensitivity Analysis with Respect to Changes in WACC and Terminal Growth Rate
WACC (%)
8.4% 8.6% 8.8% 9.0% 9.2% 9.4% 9.6% 9.8% 10.0%
0.0% 2.88 2.77 2.67 2.57 2.48 2.39 2.30 2.22 2.15
0.5% 3.03 2.91 2.80 2.70 2.60 2.50 2.41 2.32 2.24
1.0% 3.20 3.08 2.95 2.84 2.73 2.63 2.53 2.43 2.34
1.5% 3.40 3.26 3.13 3.00 2.88 2.77 2.66 2.56 2.46
Terminal 2.0% 3.63 3.47 3.32 3.18 3.05 2.93 2.81 2.69 2.59
growth rate 2.5% 3.90 3.72 3.55 3.39 3.25 3.11 2.98 2.85 2.74
(%) 3.0% 4.22 4.01 3.82 3.64 3.47 3.32 3.17 3.04 2.91
3.5% 4.60 4.36 4.14 3.93 3.74 3.57 3.40 3.25 3.10
4.0% 5.07 4.79 4.52 4.28 4.06 3.86 3.67 3.49 3.33
4.5% 5.66 5.31 5.00 4.71 4.45 4.21 3.99 3.79 3.60
5.0% 6.42 5.99 5.60 5.25 4.93 4.64 4.38 4.14 3.92
Source: SBI Research Estimates
Yestar is currently priced higher than local listed peers principally engaged in medical device business such as Shandong Weigao (1066 HK) and PW Medtech (1358 HK). Nevertheless, Yestar has an advantage of being a top-class medical consumables provider thanks to its role of one of the largest distributors of Roche Diagnostics China. Its consistently high ROE should also render a higher valuation than its peers. Further potential M&As are another catalyst to lift the Company’s 3-year expected EPS CAGR beyond 40% derived from the existing valuation model.
Exhibit 22: Peer Comparison Table
Listed in Hong Kong
Company
Ticker
Currency
Spot
Market Cap Fiscal Target P/E (x) Consensus P/E (x) ROE
(HK$ mn) year end Current 1-Yr 2-Yr Current 1-Yr 2-Yr (%)
Yestar International 2393 HK HK$ 3.1 6,743 12/2014 47.0 32.5 22.2 39.7 28.6 19.6 35.8
Shandong Weigao 1066 HK HK$ 5.25 23,501 12/2014 n.a. n.a. n.a. 17.8 16.2 14.0 11.5
PW Medtech 1358 HK HK$ 1.75 2,927 12/2014 n.a. n.a. n.a. 11.6 10.0 8.4 9.8
Lifetech Scientific Corp 1302 HK HK$ 1.41 5,640 12/2014 n.a. n.a. n.a. n.a. 57.8 38.6 n.a.
Golden Meditech 801 HK HK$ 1.15 3,401 03/2015 n.a. n.a. n.a. n.a. n.a. n.a. n.a.
Microport 853 HK HK$ 3.32 4,731 12/2014 n.a. n.a. n.a. n.a. n.a. n.a. n.a.
BBI Life Science 1035 HK HK$ 2.2 1,181 12/2014 n.a. n.a. n.a. 21.5 n.a. n.a. 8.5
Listed outside Hong Kong
Company
Ticker
Currency
Spot
Market Cap Fiscal Target P/E (x) Consensus P/E (x) ROE
(HK$ mn) year end Current 1-Yr 2-Yr Current 1-Yr 2-Yr (%)
Mindray Medical MR US US$ 23.98 21,795 12/2014 n.a. n.a. n.a. 16.0 16.1 14.1 11.0
Dirui Industrial 300396 CH CNY 48.41 9,049 12/2014 n.a. n.a. n.a. 65.8 56.3 46.5 15.2
ZJ Da Diagnostics 300244 CH CNY 89.33 29,396 12/2014 n.a. n.a. n.a. 190.4 120.7 96.6 19.8
BJ Leadman 300289 CH CNY 50.01 10,353 12/2014 n.a. n.a. n.a. 59.5 55.0 47.2 14.1
Humanwell Healthcare 600079 CH CNY 19.13 29,989 12/2014 n.a. n.a. n.a. 40.2 39.9 31.9 8.6
Shinva Medical 600587 CH CNY 32.71 16,216 12/2014 n.a. n.a. n.a. 39.3 29.6 22.8 10.7
Source: Bloomberg, SBI Research Estimates. Data as at 23 Oct 2015.
Risks Competition in industrial imaging products may lead to further price reductions. Local IVD product manufacturers eager to grab a share in high-end IVD market may cause price competition in the segment. Completion of M&A transactions slower than expected. Political risk of PRC healthcare reforms.

Hong Kong Equity Research 26 October 2015
Please refer to important disclosures at the end of this report 18
Yestar International Holdings (2393 HK): Financial Statements
Income Statement
(RMB mn) FY13 FY14 FY15E FY16E FY17E
Revenue 1,173.3 1,531.4 2,319.5 3,333.3 3,835.7
COGS (963.9) (1,267.9) (1,856.2) (2,584.0) (2,950.5)
GP 209.4 263.5 463.4 749.3 885.2
SG&A (115.4) (115.7) (185.6) (266.7) (306.9)
Other income and expenses 5.4 5.0 1.3 1.2 1.4
EBIT 99.4 152.8 279.1 483.8 579.7
Finance costs (5.8) (5.7) (16.2) (25.0) (28.8)
EBT 93.7 147.0 262.9 458.8 550.9
Income tax (28.3) (43.5) (77.0) (134.4) (161.4)
Net profit after tax 65.3 103.5 185.9 324.4 389.5
Minority interests (0.3) (2.6) (27.9) (75.3) (67.5)
Net profit attributable to equity holders 65.1 100.9 158.0 249.1 322.0
EPS - Basic and fully diluted (cents) 4.4 5.4 7.8 11.5 14.8
DPS (HK$ cents) 2.2 3.4 4.2 6.1 7.9
Source: Company Data, SBI Research Estimates
Balance Sheet
(RMB mn) FY13 FY14 FY15E FY16E FY17E
CURRENT ASSETS
Trade and bills receivables 16.8 105.2 228.8 547.9 735.6
Inventories 272.7 327.2 356.0 424.8 404.2
Prepayments, deposits and other receivables 29.3 22.9 34.8 50.0 57.5
Pledged deposits 3.3 4.1 16.0 16.0 16.0
Cash and cash equivalents 283.0 194.7 334.0 348.0 299.7
Total current assets 605.2 654.1 969.5 1,386.7 1,513.0
NON-CURRENT ASSETS
PP&E 104.4 104.0 111.9 120.6 129.0
Prepaid land lease payments 15.6 15.3 15.0 14.6 14.3
Intangible assets 2.5 249.7 232.8 216.0 199.3
Other non-current assets 8.4 94.8 1,049.8 1,063.6 1,070.1
Total non-current assets 130.8 463.8 1,409.5 1,414.9 1,412.6
TOTAL ASSETS 736.0 1,117.9 2,379.0 2,801.5 2,925.7
CURRENT LIABILITIES
Trade and bills payables 215.3 282.8 330.5 460.2 485.0
Interest-bearing bank and other borrowings 117.2 101.7 193.3 201.3 186.3
Tax payable 7.4 29.4 48.5 84.6 101.6
Other payables and accruals 40.5 137.8 43.8 297.8 728.0
Total current liabilities 380.4 551.7 616.2 1,043.8 1,500.9
NON-CURRENT LIABILITIES
Interest-bearing bank and other borrowings - 4.5 301.3 286.3 350.0
Deferred tax liabilities 4.3 72.4 11.6 16.1 14.5
Other non-current liabilities 9.1 164.3 707.2 606.0 8.6
Total non-current liabilities 13.4 241.1 1,020.0 908.4 373.2
TOTAL LIABILITIES 393.8 792.9 1,636.2 1,952.2 1,874.1
NET ASSETS 342.2 325.1 742.9 849.4 1,051.6
Equity attributable to owners of the parent 333.0 315.7 621.6 652.8 787.5
Non-controlling interests 9.2 9.4 121.3 196.6 264.1
TOTAL EQUITY 342.2 325.1 742.9 849.4 1,051.6
Source: Company Data, SBI Research Estimates

Hong Kong Equity Research 26 October 2015
Please refer to important disclosures at the end of this report 19
Statement of Cash Flows
(RMB mn) FY13 FY14 FY15E FY16E FY17E
CASH FLOWS FROM OPERATING ACTIVITIES
Profit before tax 93.7 147.0 262.9 458.8 550.9
Finance costs, net 5.1 3.2 15.1 24.0 27.6
Adjustment for non-cash items (20.2) (7.7) (89.6) (232.1) (104.4)
Income tax paid (42.5) (29.5) (129.8) (107.5) (152.5)
Net cash generated from operating activities 36.1 113.1 58.6 143.3 321.6
CASH FLOWS FROM INVESTING ACTIVITIES
Purchases of items of PP&E (22.4) (10.4) (25.0) (28.1) (31.2)
Proceeds from disposal of items of PP&E 0.9 0.1 0.0 0.0 0.0
Purchases of intangible assets (0.4) (0.7) (0.5) (0.6) (0.7)
Interest received from term deposits 0.0 3.1 1.1 1.0 1.2
Acquisition of a subsidiary 0.0 (140.8) (958.0) 0.0 (249.6)
Others (5.3) 0.0 0.0 0.0 0.0
Net cash used in investing activities (27.1) (148.7) (982.4) (27.7) (280.3)
CASH FLOWS FROM FINANCING ACTIVITIES
Net proceeds from capital contribution 128.6 0.0 741.3 0.0 0.0
New interest-bearing loans, net 72.2 (11.0) 388.4 (7.1) 48.8
Dividend paid (80.6) (36.2) (50.5) (69.5) (109.6)
Interest paid (5.8) (5.7) (16.2) (25.0) (28.8)
Net cash generated from financing activities 114.5 (52.9) 1,063.0 (101.6) (89.6)
NET INCREASE IN CASH AND CASH EQUIVALENTS 123.5 (88.5) 139.2 14.0 (48.3)
Cash and cash equivalents at beginning of year 160.4 283.0 194.7 334.0 348.0
Effect of foreign exchange rate changes, net (0.9) 0.2 0.0 0.0 0.0
CASH AND CASH EQUIVALENTS AT END OF YEAR 283.0 194.7 334.0 348.0 299.7
Source: Company Data, SBI Research Estimates
Key Financial Measures
FY13 FY14 FY15E FY16E FY17E
Revenue growth Y/Y (%) 22.8% 30.5% 51.5% 43.7% 15.1%
GPM (%) 17.8% 17.2% 20.0% 22.5% 23.1%
EBIT margin (%) 8.5% 10.0% 12.0% 14.5% 15.1%
NPM (%) 5.5% 6.6% 6.8% 7.5% 8.4%
Average ROA (%) 9.8% 10.9% 9.0% 9.6% 11.2%
Average ROE (%) 27.5% 31.1% 33.7% 39.1% 44.7%
EBITDA (RMB mn) 113 171 314 521 620
EV/EBITDA (x) 43.2 23.5 14.1 11.9 10.5
CR (x) 1.6 1.2 1.6 1.3 1.0
Total liabilities/Total assets (x) 0.5 0.7 0.7 0.7 0.6
Per share measure
EPS growth Y/Y (%) 6.29% 21.42% 44.63% 46.55% 29.27%
Payout ratio (%) 39.04% 50.35% 44.00% 44.00% 44.00%
BVPS (RMB) 0.23 0.17 0.31 0.30 0.36
P/E (x) 54.4 45.9 32.5 22.2 17.2
P/BV (x) 10.6 14.7 8.3 8.5 7.0
Source: Company Data, SBI Research Estimates

Hong Kong Equity Research 26 October 2015
Please refer to important disclosures at the end of this report 20
Appendix I: Company Structure
*Including new shares subscribed by Vivo VII Galaxy Investment Limited and OrbiMed Global Healthcare Master Fund, L.P. in
July 2015
Source: Company Data, SBI Research. Data as of 23 October 2015. Only key operating entities are shown.
Hartono family *Public shareholders
The Company
(2393 HK)
Yestar Shanghai Yestar Guangxi
Jiangsu Uno Shanghai Emphasis
(5 entities)
61.17% 38.83%
100% 100%
70% 70% (to be completed)

Hong Kong Equity Research 26 October 2015
Please refer to important disclosures at the end of this report 21
Appendix II: Company History and Development
Source: Company Data
2000 •Yestar Shanghai was established to engage in imaging business
2004 •Authorized by Fujifilm to establish Fujifilm Yestar Digital Imaging Stores in the PRC
2005
•First production line for colour photographic paper and colour film commenced operation in Gaoxin Processing Plant, Nanning
2006 •Commenced processing and sales of Fujifilm medical dry films to Fujifilm Group in the PRC
2011
•Started to manufacture and sell dental film and industrial NDT x-ray film under own Yes!Star brand in the PRC
2012 •Commenced distribution of Fujifilm industrial NDT x-ray film in the PRC
2013
•Appointed by Fujifilm China Investment as the sole and exclusive distributor of Fujifilm color photographic paper in the PRC
•Listed on the Stock Exchange of Hong Kong
2014
•Acquired 70% stake in Jiangsu Uno and became a distributor of Roche Diagnostic and BD products in Jiangsu and Anhui Provinces
2015
•Announced acquisition of 70% stake in Shanghai Emphasis for distribution of Roche and Thermo Fisher products in Shanghai

Hong Kong Equity Research 26 October 2015
Please refer to important disclosures at the end of this report 22
SBI China Capital is a dedicated small/mid cap investment banking/ stockbrokerage house. Find our research on:
[email protected], thomsononeanalytics.com, factset.com, S&P Capital IQ and multex.com.
SBI China Capital stock ratings:
STRONG BUY : absolute upside of >50% over the next three months
BUY : absolute upside of >10% over the next six months
HOLD : absolute return of -10% to +10% over the next six months
SELL : absolute downside of >10% over the next six months
Investors should assume that SBI China Capital is seeking or will seek investment banking or other related businesses with the companies
in this report.
Analyst certification: The views expressed in this report accurately reflect the analyst’s personal views of the subject securities and that
the analyst has not received and will not receive direct or indirect compensation in exchange for expressing specific recommendations or
views in this report.
Disclaimer:
This research report is not an offer to sell or the solicitation of an offer to buy or subscribe for any securities. The securities referred to in
this report may not be eligible for sale in some jurisdictions. The information contained in this report has been compiled by the Research
Department of SBI China Capital Financial Services Limited (‘SBI China Capital’) from sources that it believes to be reliable but no
representation, warranty or guarantee is made or given by SBI China Capital or any other person as to its accuracy or completeness. All
opinions and estimates expressed in this report are (unless otherwise indicated) entirely those of SBI China Capital as of the date of this
report only and are subject to change without notice. Neither SBI China Capital nor any other person, accepts any liability whatsoever for
any loss howsoever arising from any use of this report or its contents or otherwise arising in connection therewith. Each recipient of this
report shall be solely responsible for making its own independent investigation of the business, financial condition and prospects of the
companies referred to in this report. SBI China Capital and their respective officers, directors and employees, including persons involved in
the preparation or issuance of this report, may from time to time (1) have positions in, and buy or sell, the securities of companies
referred to in this report (or related investments); (2) have a consulting, investment banking or broking relationship with any company
referred to in this report; and (3) to the extent permitted under applicable law, have acted upon or used the information contained or
referred to in this report including effecting transactions for their own account in an investment (or related investment) in respect of any
company referred to in this report, prior to or immediately following its publication. This report may not have been distributed to all
recipients at the same time. This report is issued only for the information of and may only be distributed to professional investors and
dealers in securities and must not be copied, published, reproduced or redistributed (in whole or in part) by any recipient for any purpose.
This report is distributed in Hong Kong by SBI China Capital. Any recipient of this report who requires further information regarding any
securities referred to in this report should contact the relevant office of SBI China Capital located in such recipient’s home jurisdiction.
Copyright© SBI China Capital Financial Services Limited. All rights reserved.