AP STATISTICS H
21
AP STATISTICS – H PREREQUISITE: Successful completion of Pre‐Calculus–H OR AP Calculus–H OR B‐ or better in Pre‐Calculus –A. CREDIT: 1 credit The topics for Honors Statistics will be divided into four major themes that are covered by the AP Statistics Course: exploratory analysis (20–30 percent of the exam), planning and conducting a study (10–15 percent of the exam), probability (20–30 percent of the exam), and statistical inference (30–40 percent of the exam). This is a full year course designed to prepare students to take the AP Statistics Exam. Page 1
Transcript of AP STATISTICS H
APSTATISTICS–H
PREREQUISITE: Successful completion of Pre‐Calculus–H OR AP Calculus–H OR B‐ or better in Pre‐Calculus –A. CREDIT: 1 credit
The topics for Honors Statistics will be divided into four major themes that are covered by the
AP Statistics Course: exploratory analysis (20–30 percent of the exam), planning and
conducting a study (10–15 percent of the exam), probability (20–30 percent of the exam), and
statistical inference (30–40 percent of the exam). This is a full year course designed to prepare
students to take the AP Statistics Exam.
Page 1

APSTATISTICS–H
The topics for Honors Statistics will be divided into four major themes that are covered by the AP
Statistics Course: exploratory analysis (20–30 percent of the exam), planning and conducting a study
(10–15 percent of the exam), probability (20–30 percent of the exam), and statistical inference (30–40
percent of the exam). This is a full year course designed to prepare students to take the AP Statistics
Exam.
I. Exploratory Analysis: Exploratory analysis of data makes use of graphical and numerical techniques
to study patterns and departures from patterns. In examining distributions of data, students should
be able to detect important characteristics, such as shape, location, variability and unusual values.
From careful observations of patterns in data, students can generate conjectures about
relationships among variables. The notion of how one variable may be associated with another
permeates almost all of statistics, from simple comparisons of proportions through linear
regression. The difference between association and causation must accompany this conceptual
development throughout.
II. Planning and Conducting a Study: Data must be collected according to a well‐developed plan if
valid information is to be obtained. If data are to be collected to provide an answer to a question of
interest, a careful plan must be developed. Both the type of analysis that is appropriate and the
nature of conclusions that can be drawn from that analysis depend in a critical way on how the data
was collected. Collecting data in a reasonable way, through either sampling or experimentation, is
an essential step in the data analysis process.
III. Probability: Probability is the tool used for anticipating what the distribution of data should look
like under a given model. Random phenomena are not haphazard: they display an order that
emerges only in the long run and is described by a distribution. The mathematical description of
variation is central to statistics. The probability required for statistical inference is not primarily
axiomatic or combinatorial but is oriented toward using probability distributions to describe data.
IV. Statistical Inference: Statistical inference guides the selection of appropriate models. Models and
data interact in statistical work: models are used to draw conclusions from data, while the data are
allowed to criticize and even falsify the model through inferential and diagnostic methods. Inference
from data can be thought of as the process of selecting a reasonable model, including a statement in
probability language, of how confident one can be about the selection.
Page 2
APSTATISTICS–H
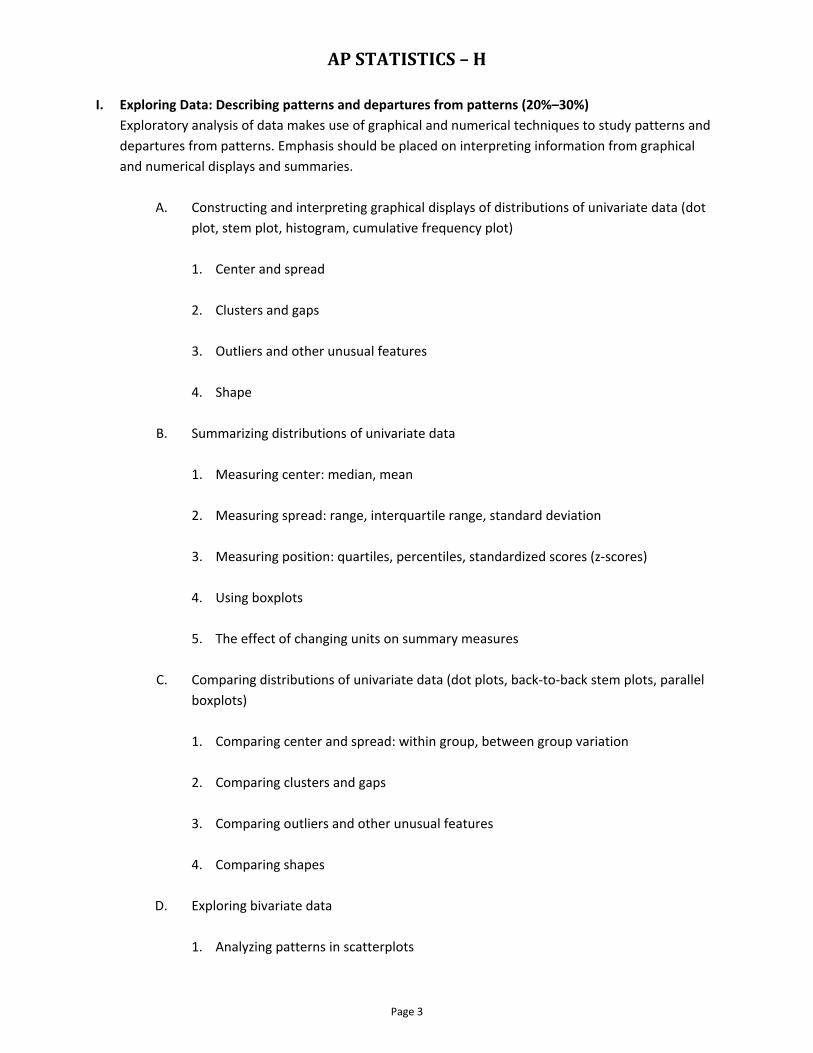
I. Exploring Data: Describing patterns and departures from patterns (20%–30%)
Exploratory analysis of data makes use of graphical and numerical techniques to study patterns and
departures from patterns. Emphasis should be placed on interpreting information from graphical
and numerical displays and summaries.
A. Constructing and interpreting graphical displays of distributions of univariate data (dot
plot, stem plot, histogram, cumulative frequency plot)
1. Center and spread
2. Clusters and gaps
3. Outliers and other unusual features
4. Shape
B. Summarizing distributions of univariate data
1. Measuring center: median, mean
2. Measuring spread: range, interquartile range, standard deviation
3. Measuring position: quartiles, percentiles, standardized scores (z‐scores)
4. Using boxplots
5. The effect of changing units on summary measures
C. Comparing distributions of univariate data (dot plots, back‐to‐back stem plots, parallel
boxplots)
1. Comparing center and spread: within group, between group variation
2. Comparing clusters and gaps
3. Comparing outliers and other unusual features
4. Comparing shapes
D. Exploring bivariate data
1. Analyzing patterns in scatterplots
Page 3

APSTATISTICS–H
2. Correlation and linearity
3. Least‐squares regression line
4. Residual plots, outliers and influential points
5. Transformations to achieve linearity: logarithmic and power transformations
E. Exploring categorical data
1. Frequency tables and bar charts
2. Marginal and joint frequencies for two‐way tables
3. Conditional relative frequencies and association
4. Comparing distributions using bar charts
II. Sampling and Experimentation: Planning and conducting a study (10%–15%)
Data must be collected according to a well‐developed plan if valid information on a conjecture is
to be obtained. This plan includes clarifying the question and deciding upon a method of data
collection and analysis.
A. Overview of methods of data collection
1. Census
2. Sample survey
3. Experiment
4. Observational study
B. Planning and conducting surveys
1. Characteristics of a well‐designed and well‐conducted survey
2. Populations, samples and random selection
3. Sources of bias in sampling and surveys
Page 4

APSTATISTICS–H
4. Sampling methods, including simple random sampling, stratified random sampling
and cluster sampling
C. Planning and conducting experiments
1. Characteristics of a well‐designed and well‐conducted experiment
2. Treatments, control groups, experimental units, random assignments and
replication
3. Sources of bias and confounding, including placebo effect and blinding
4. Completely randomized design
5. Randomized block design, including matched pairs design
D. Generalizability of results and types of conclusions that can be drawn from
observational studies, experiments and surveys
III. Anticipating Patterns: Exploring random phenomena using probability and simulation (20%–
30%)
Probability is the tool used for anticipating what the distribution of data should look like under a
given model.
A. Probability
1. Interpreting probability, including long‐run relative frequency interpretation
2. “Law of Large Numbers” concept
3. Addition rule, multiplication rule, conditional probability and independence
4. Discrete random variables and their probability distributions, including binomial and
geometric
5. Simulation of random behavior and probability distributions
6. Mean (expected value) and standard deviation of a random variable, and linear
transformation of a random variable
B. Combining independent random variables
Page 5
APSTATISTICS–H
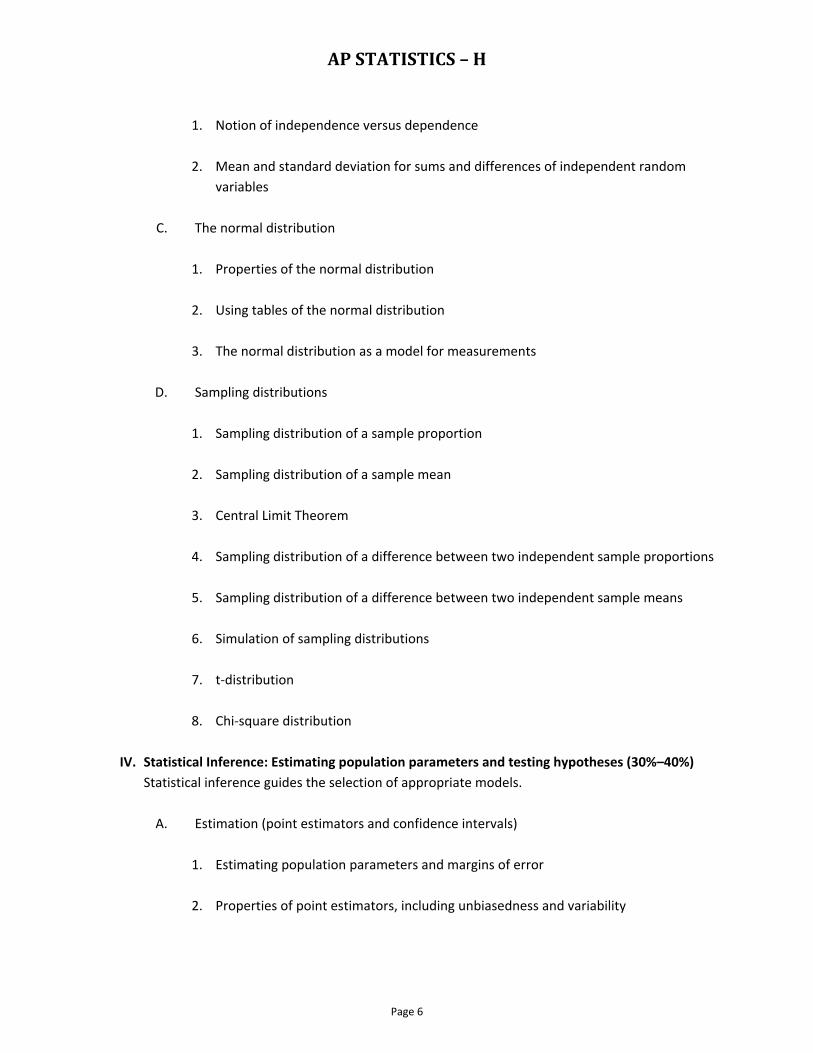
1. Notion of independence versus dependence
2. Mean and standard deviation for sums and differences of independent random
variables
C. The normal distribution
1. Properties of the normal distribution
2. Using tables of the normal distribution
3. The normal distribution as a model for measurements
D. Sampling distributions
1. Sampling distribution of a sample proportion
2. Sampling distribution of a sample mean
3. Central Limit Theorem
4. Sampling distribution of a difference between two independent sample proportions
5. Sampling distribution of a difference between two independent sample means
6. Simulation of sampling distributions
7. t‐distribution
8. Chi‐square distribution
IV. Statistical Inference: Estimating population parameters and testing hypotheses (30%–40%)
Statistical inference guides the selection of appropriate models.
A. Estimation (point estimators and confidence intervals)
1. Estimating population parameters and margins of error
2. Properties of point estimators, including unbiasedness and variability
Page 6
APSTATISTICS–H
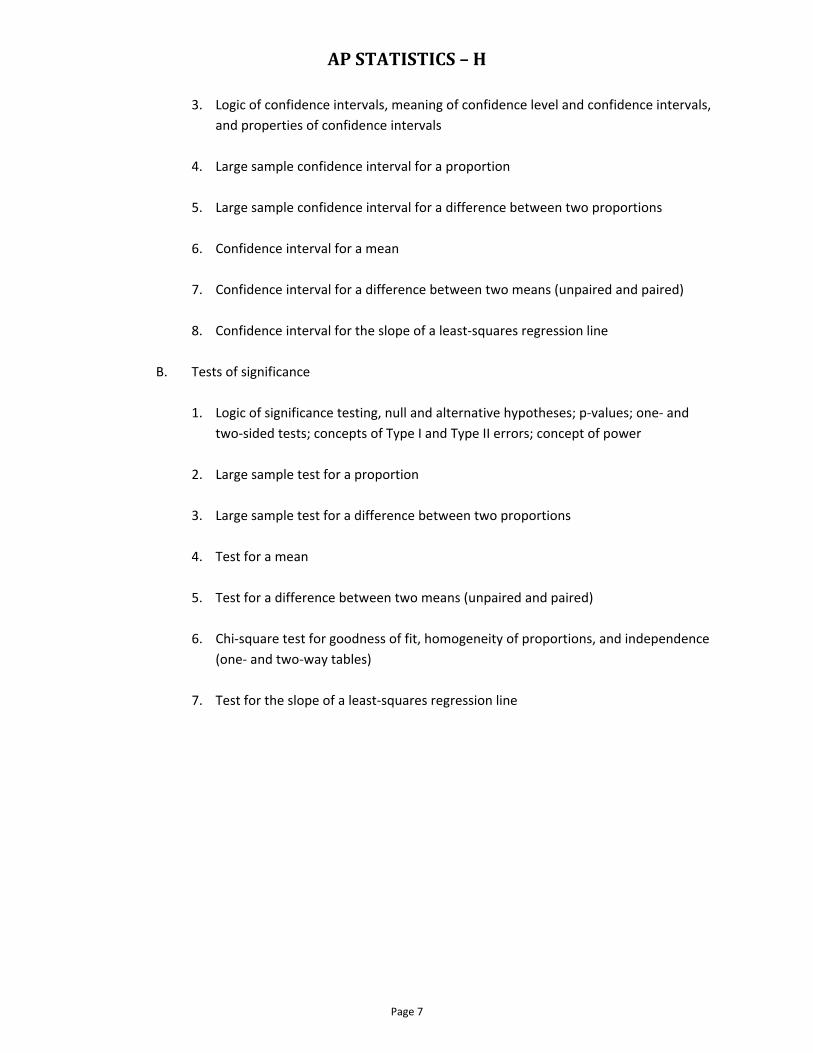
3. Logic of confidence intervals, meaning of confidence level and confidence intervals,
and properties of confidence intervals
4. Large sample confidence interval for a proportion
5. Large sample confidence interval for a difference between two proportions
6. Confidence interval for a mean
7. Confidence interval for a difference between two means (unpaired and paired)
8. Confidence interval for the slope of a least‐squares regression line
B. Tests of significance
1. Logic of significance testing, null and alternative hypotheses; p‐values; one‐ and
two‐sided tests; concepts of Type I and Type II errors; concept of power
2. Large sample test for a proportion
3. Large sample test for a difference between two proportions
4. Test for a mean
5. Test for a difference between two means (unpaired and paired)
6. Chi‐square test for goodness of fit, homogeneity of proportions, and independence
(one‐ and two‐way tables)
7. Test for the slope of a least‐squares regression line
Page 7

1
Waterford High School AP Statistics Syllabus COURSE DESCRIPTION: AP Statistics is the high school equivalent of a one semester, introductory college statistics course. In this course, students develop strategies for collecting, organizing, analyzing, and drawing conclusions from data. Students design, administer, and tabulate results from surveys and experiments. Probability and simulations aid students in constructing models for chance behavior. Sampling distributions provide the logical structure for confidence intervals and hypothesis tests. Students use a TI-83/84 graphing calculator, and Web-based java applets to investigate statistical concepts. To develop effective statistical communication skills, students are required to prepare frequent written and oral analyses of real data. COURSE GOALS: In AP Statistics, students are expected to learn
Skills To produce convincing oral and written statistical arguments, using appropriate
terminology, in a variety of applied settings. When and how to use technology to aid them in solving statistical problems Knowledge Essential techniques for producing data (surveys, experiments, observational studies),
analyzing data (graphical & numerical summaries), modeling data (probability, random variables, sampling distributions), and drawing conclusions from data (inference procedures – confidence intervals and significance tests)
Habits of mind To become critical consumers of published statistical results by heightening their
awareness of ways in which statistics can be improperly used to mislead, confuse, or distort the truth.
COURSE OUTLINE: Text: The Practice of Statistics (5th edition), by Starnes, Tabor, Yates, and Moore, W. H. Freeman & Co., 2014.

2
Chapter 4
Day Topics Learning Objectives Students will be able to… Suggested assignment
1
4.1 Introduction, The Idea of a Sample Survey, How to Sample Badly, How to Sample Well: Simple Random Sampling
Identify the population and sample in a statistical study. Identify voluntary response samples and convenience
samples. Explain how these sampling methods can lead to bias.
Describe how to obtain a random sample using slips of paper, technology, or a table of random digits.
Complete the Federalist Papers Activity
1, 3, 5, 7, 9, 11
2 4.1 Other Random Sampling Methods
Distinguish a simple random sample from a stratified random sample or cluster sample. Give the advantages and disadvantages of each sampling method.
Complete the Rolling Down the River Activity Looks at differences between SRS and Stratified
Sampling
13, 17, 19, 21, 23, 25
3 4.1 Inference for Sampling, Sample Surveys: What Can Go Wrong?
Explain how undercoverage, nonresponse, question wording, and other aspects of a sample survey can lead to bias.
27, 29, 31, 33, 35
4 4.2 Observational Study versus Experiment, The Language of Experiments
Distinguish between an observational study and an experiment.
Explain the concept of confounding and how it limits the ability to make cause-and-effect conclusions.
37–42, 45, 47, 49, 51,
53, 55
5
4.2 How to Experiment Badly, How to Experiment Well, Completely Randomized Designs
Identify the experimental units, explanatory and response variables, and treatments.
Explain the purpose of comparison, random assignment, control, and replication in an experiment.
Describe a completely randomized design for an experiment, including how to randomly assign treatments using slips of paper, technology, or a table of random digits.
57, 59, 61, 63, 65
6 4.2 Experiments: What Can Go Wrong? Inference for Experiments
Describe the placebo effect and the purpose of blinding in an experiment.
Interpret the meaning of statistically significant in the context of an experiment.
Complete Distracted Driving Activity
67, 69, 71, 73
7 4.2 Blocking
Explain the purpose of blocking in an experiment. Describe a randomized block design or a matched pairs
design for an experiment. Complete the Standing/Standing Pulse Rates
Activity
75, 77, 79, 81, 85
8 4.3 Scope of Inference, The Challenges of Establishing Causation
Describe the scope of inference that is appropriate in a statistical study.
83, 87–94, 97–104
9 4.3 Data Ethics (optional topic)
Evaluate whether a statistical study has been carried out in an ethical manner.
Chapter 4 Review
Exercises
10 Chapter 4 Review/FRAPPY! Chapter 4
AP® Practice Exam
11 Chapter 4 Test Cumulative AP Practice
Test 1

3
Chapter 1
Day Topics Learning Objectives Students will be able to … Suggested assignment
1 Chapter 1 Introduction Identify the individuals and variables in a set of data. Classify variables as categorical or quantitative.
1, 3, 5, 7, 8
2 1.1 Bar Graphs and Pie Charts, Graphs: Good and Bad
Display categorical data with a bar graph. Decide if it would be appropriate to make a pie chart.
Identify what makes some graphs of categorical data deceptive.
11, 13, 15, 17
3
1.1 Two-Way Tables and Marginal Distributions, Relationships between Categorical Variables: Conditional Distributions
Calculate and display the marginal distribution of a categorical variable from a two-way table.
Calculate and display the conditional distribution of a categorical variable for a particular value of the other categorical variable in a two-way table.
Describe the association between two categorical variables by comparing appropriate conditional distributions.
19, 21, 23, 25, 27–32
4 1.2 Dotplots, Describing Shape, Comparing Distributions, Stemplots
Make and interpret dotplots and stemplots of quantitative data.
Describe the overall pattern (shape, center, and spread) of a distribution and identify any major departures from the pattern (outliers).
Identify the shape of a distribution from a graph as roughly symmetric or skewed.
Compare distributions of quantitative data using dotplots or stemplots.
37, 39, 41, 43, 45, 47
5 1.2 Histograms, Using Histograms Wisely
Make and interpret histograms of quantitative data. Compare distributions of quantitative data using
histograms.
53, 55, 59, 60, 65, 69–74
6
1.3 Measuring Center: Mean and Median, Comparing the Mean and Median, Measuring Spread: Range and IQR, Identifying Outliers, Five-Number Summary and Boxplots
Calculate measures of center (mean, median). Calculate and interpret measures of spread (range,
IQR). Choose the most appropriate measure of center and
spread in a given setting. Identify outliers using the 1.5×IQR rule. Make and interpret boxplots of quantitative data.
79, 81, 83, 87, 89, 91, 93
7
1.3 Measuring Spread: Standard Deviation, Choosing Measures of Center and Spread, Organizing a Statistics Problem
Calculate and interpret measures of spread (standard deviation).
Choose the most appropriate measure of center and spread in a given setting.
Use appropriate graphs and numerical summaries to compare distributions of quantitative variables.
RossmanChance applet on selecting median vs. mean
95, 97, 99, 103, 105, 107–110
8 Chapter 1 Review/FRAPPY!
Chapter 1 Review
Exercises 9 Chapter 1 Test
Chapter 1/4 Project: Students work in teams of 2 to design and carry out an experiment to investigate response bias, write a summary report, and give a 10 minute oral synopsis to their classmates. See rubric on page 14.

4
Chapter 2
Day Topics Learning Objectives Students will be able to… Suggested assignment
1
2.1 Measuring Position: Percentiles; Cumulative Relative Frequency Graphs; Measuring Position: z-scores
Find and interpret the percentile of an individual value within a distribution of data.
Estimate percentiles and individual values using a cumulative relative frequency graph.
Find and interpret the standardized score (z-score) of an individual value within a distribution of data.
Activity: Where do I stand?
1, 3, 5, 9, 11, 13, 15
2 2.1 Transforming Data Describe the effect of adding, subtracting, multiplying
by, or dividing by a constant on the shape, center, and spread of a distribution of data.
17, 19, 21, 23,
25–30
3 2.2 Density Curves, The 68–95–99.7 Rule; The Standard Normal Distribution
Estimate the relative locations of the median and mean on a density curve.
Use the 68–95–99.7 rule to estimate areas (proportions of values) in a Normal distribution.
Use Table A or technology to find (i) the proportion of z-values in a specified interval, or (ii) a z-score from a percentile in the standard Normal distribution.
Activity: The Normal density curve applet
33, 35, 39, 41, 43, 45, 47, 49, 51
4 2.2 Normal Distribution Calculations
Use Table A or technology to find (i) the proportion of values in a specified interval, or (ii) the value that corresponds to a given percentile in any Normal distribution.
53, 55, 57, 59
5 2.2 Assessing Normality Determine if a distribution of data is approximately Normal from graphical and numerical evidence.
54, 63, 65, 66, 67, 69–74
6 Chapter 2 Review/FRAPPY!
Chapter 2 Review
Exercises 7 Chapter 2 Test
5
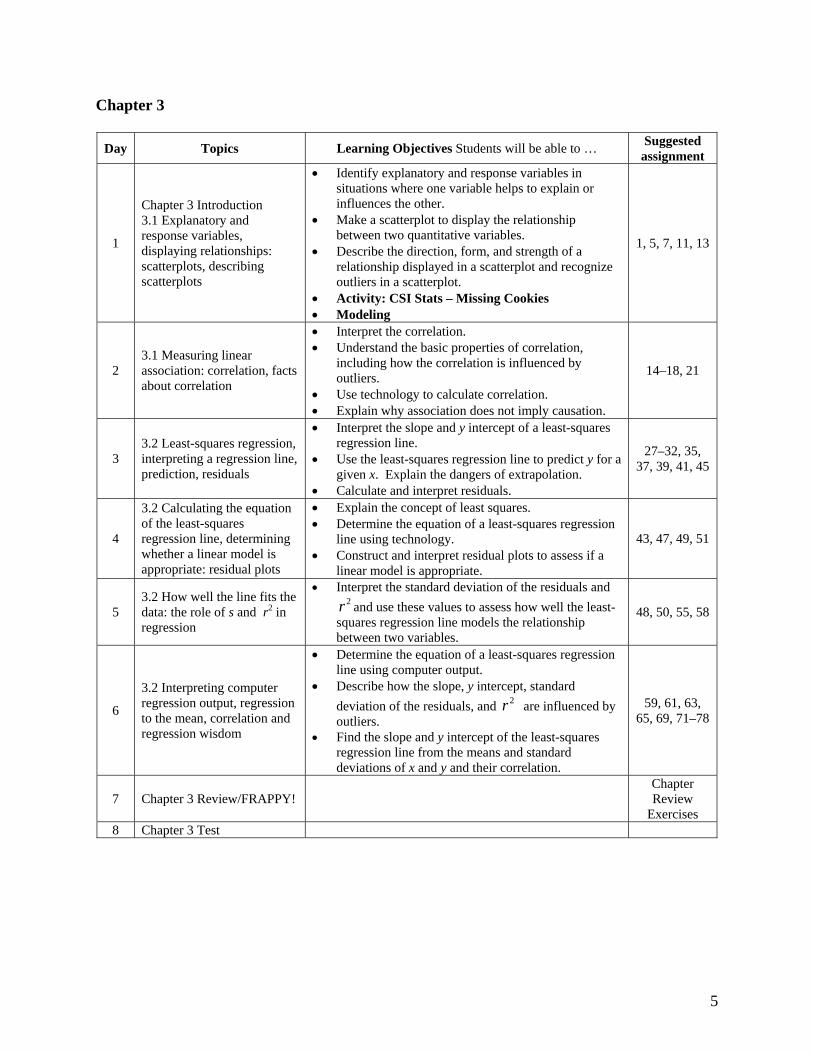
Chapter 3
Day Topics Learning Objectives Students will be able to … Suggested assignment
1
Chapter 3 Introduction 3.1 Explanatory and response variables, displaying relationships: scatterplots, describing scatterplots
Identify explanatory and response variables in situations where one variable helps to explain or influences the other.
Make a scatterplot to display the relationship between two quantitative variables.
Describe the direction, form, and strength of a relationship displayed in a scatterplot and recognize outliers in a scatterplot.
Activity: CSI Stats – Missing Cookies Modeling
1, 5, 7, 11, 13
2 3.1 Measuring linear association: correlation, facts about correlation
Interpret the correlation. Understand the basic properties of correlation,
including how the correlation is influenced by outliers.
Use technology to calculate correlation. Explain why association does not imply causation.
14–18, 21
3 3.2 Least-squares regression, interpreting a regression line, prediction, residuals
Interpret the slope and y intercept of a least-squares regression line.
Use the least-squares regression line to predict y for a given x. Explain the dangers of extrapolation.
Calculate and interpret residuals.
27–32, 35, 37, 39, 41, 45
4
3.2 Calculating the equation of the least-squares regression line, determining whether a linear model is appropriate: residual plots
Explain the concept of least squares. Determine the equation of a least-squares regression
line using technology. Construct and interpret residual plots to assess if a
linear model is appropriate.
43, 47, 49, 51
5 3.2 How well the line fits the data: the role of s and r2 in regression
Interpret the standard deviation of the residuals and 2r and use these values to assess how well the least-
squares regression line models the relationship between two variables.
48, 50, 55, 58
6
3.2 Interpreting computer regression output, regression to the mean, correlation and regression wisdom
Determine the equation of a least-squares regression line using computer output.
Describe how the slope, y intercept, standard
deviation of the residuals, and 2r are influenced by outliers.
Find the slope and y intercept of the least-squares regression line from the means and standard deviations of x and y and their correlation.
59, 61, 63, 65, 69, 71–78
7 Chapter 3 Review/FRAPPY! Chapter Review
Exercises 8 Chapter 3 Test

6
Chapter 5
Day Topics Learning Objectives Students will be able to… Suggested assignment
1 5.1 The Idea of Probability, Myths about Randomness
Interpret probability as a long-run relative frequency. Activity: “1-in-6 wins” game Introduction to significance testing
1, 3, 7, 9, 11
2 5.1 Simulation Use simulation to model chance behavior. Applet: Probability simulation applet
15, 17, 19, 23, 25
3 5.2 Probability Models, Basic Rules of Probability
Determine a probability model for a chance process. Use basic probability rules, including the complement
rule and the addition rule for mutually exclusive events.
27, 31, 32, 39, 41, 43,
45, 47
4
5.2 Two-Way Tables, Probability, and the General Addition Rule, Venn Diagrams and Probability
Use a two-way table or Venn diagram to model a chance process and calculate probabilities involving two events.
Use the general addition rule to calculate probabilities.
29, 33–36, 49, 51, 53, 55
5
5.3 What Is Conditional Probability?, The General Multiplication Rule and Tree Diagrams,
Calculate and interpret conditional probabilities. Use the general multiplication rule to calculate
probabilities. Use tree diagrams to model a chance process and
calculate probabilities involving two or more events.
57–60, 63, 65, 67, 71, 73, 77, 79
6 5.3 Conditional Probability and Independence: A Special Multiplication Rule
Determine whether two events are independent. When appropriate, use the multiplication rule for
independent events to compute probabilities.
81, 83, 85, 89, 91, 93, 95, 97–99
7 Chapter 5 Review/FRAPPY! Chapter 5 Review
Exercises 8 Chapter 5 Test
7
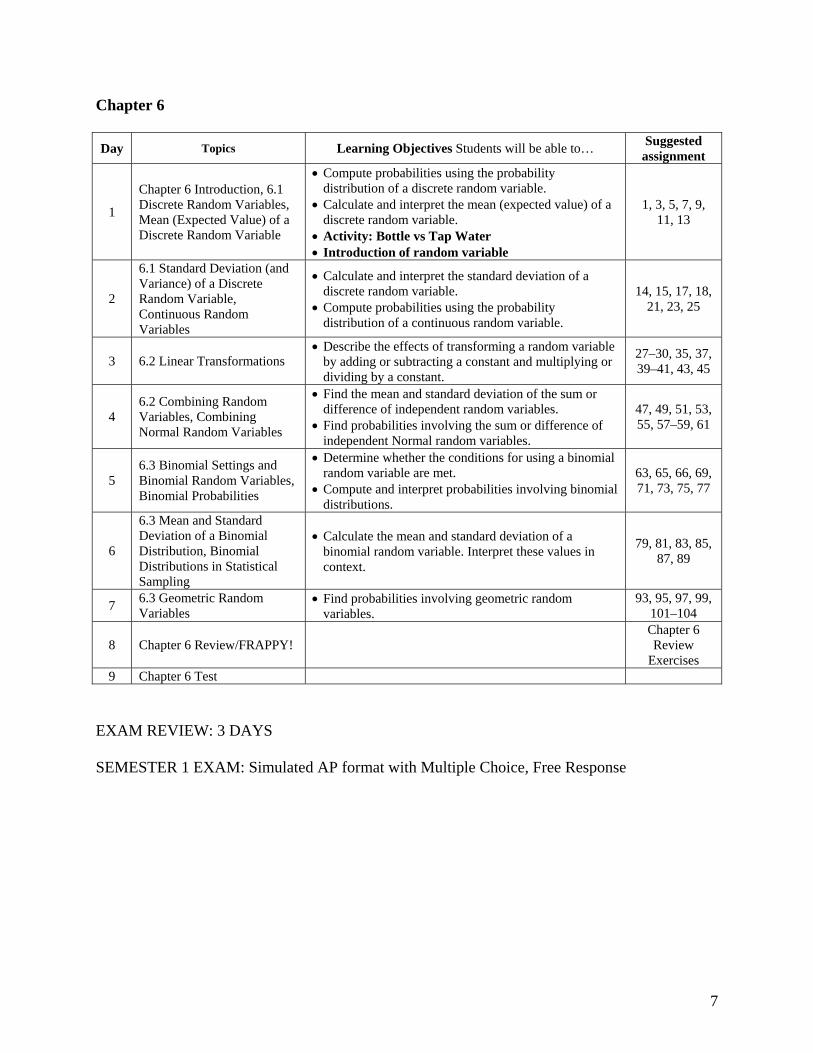
Chapter 6
Day Topics Learning Objectives Students will be able to… Suggested assignment
1
Chapter 6 Introduction, 6.1 Discrete Random Variables, Mean (Expected Value) of a Discrete Random Variable
Compute probabilities using the probability distribution of a discrete random variable.
Calculate and interpret the mean (expected value) of a discrete random variable.
Activity: Bottle vs Tap Water Introduction of random variable
1, 3, 5, 7, 9, 11, 13
2
6.1 Standard Deviation (and Variance) of a Discrete Random Variable, Continuous Random Variables
Calculate and interpret the standard deviation of a discrete random variable.
Compute probabilities using the probability distribution of a continuous random variable.
14, 15, 17, 18, 21, 23, 25
3 6.2 Linear Transformations Describe the effects of transforming a random variable
by adding or subtracting a constant and multiplying or dividing by a constant.
27–30, 35, 37, 39–41, 43, 45
4 6.2 Combining Random Variables, Combining Normal Random Variables
Find the mean and standard deviation of the sum or difference of independent random variables.
Find probabilities involving the sum or difference of independent Normal random variables.
47, 49, 51, 53, 55, 57–59, 61
5 6.3 Binomial Settings and Binomial Random Variables, Binomial Probabilities
Determine whether the conditions for using a binomial random variable are met.
Compute and interpret probabilities involving binomial distributions.
63, 65, 66, 69, 71, 73, 75, 77
6
6.3 Mean and Standard Deviation of a Binomial Distribution, Binomial Distributions in Statistical Sampling
Calculate the mean and standard deviation of a binomial random variable. Interpret these values in context.
79, 81, 83, 85, 87, 89
7 6.3 Geometric Random Variables
Find probabilities involving geometric random variables.
93, 95, 97, 99, 101–104
8 Chapter 6 Review/FRAPPY! Chapter 6 Review
Exercises 9 Chapter 6 Test
EXAM REVIEW: 3 DAYS SEMESTER 1 EXAM: Simulated AP format with Multiple Choice, Free Response
8
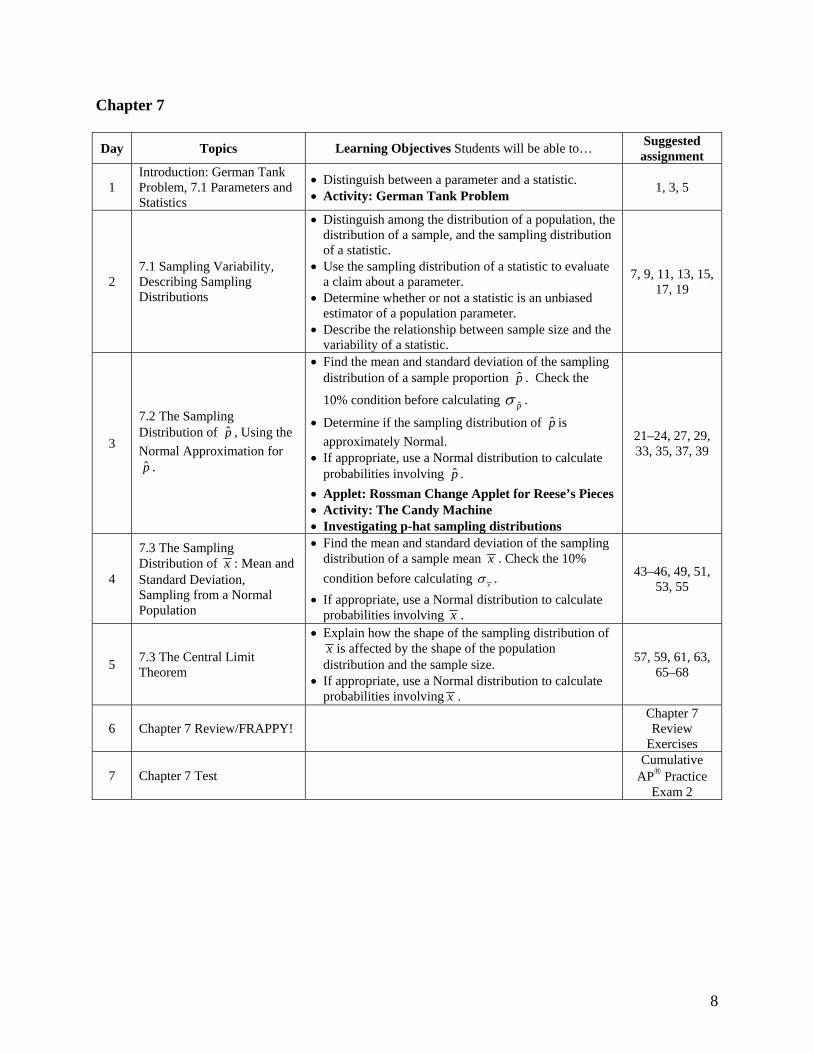
Chapter 7
Day Topics Learning Objectives Students will be able to… Suggested assignment
1 Introduction: German Tank Problem, 7.1 Parameters and Statistics
Distinguish between a parameter and a statistic. Activity: German Tank Problem
1, 3, 5
2 7.1 Sampling Variability, Describing Sampling Distributions
Distinguish among the distribution of a population, the distribution of a sample, and the sampling distribution of a statistic.
Use the sampling distribution of a statistic to evaluate a claim about a parameter.
Determine whether or not a statistic is an unbiased estimator of a population parameter.
Describe the relationship between sample size and the variability of a statistic.
7, 9, 11, 13, 15, 17, 19
3
7.2 The Sampling Distribution of p̂ , Using the
Normal Approximation for p̂ .
Find the mean and standard deviation of the sampling distribution of a sample proportion p̂ . Check the
10% condition before calculating p̂ .
Determine if the sampling distribution of p̂ is
approximately Normal. If appropriate, use a Normal distribution to calculate
probabilities involving p̂ .
Applet: Rossman Change Applet for Reese’s Pieces Activity: The Candy Machine Investigating p-hat sampling distributions
21–24, 27, 29, 33, 35, 37, 39
4
7.3 The Sampling Distribution of x : Mean and Standard Deviation, Sampling from a Normal Population
Find the mean and standard deviation of the sampling distribution of a sample mean x . Check the 10%
condition before calculating x
.
If appropriate, use a Normal distribution to calculate probabilities involving x .
43–46, 49, 51, 53, 55
5 7.3 The Central Limit Theorem
Explain how the shape of the sampling distribution of x is affected by the shape of the population
distribution and the sample size. If appropriate, use a Normal distribution to calculate
probabilities involving x .
57, 59, 61, 63, 65–68
6 Chapter 7 Review/FRAPPY! Chapter 7 Review
Exercises
7 Chapter 7 Test Cumulative
AP® Practice Exam 2
9
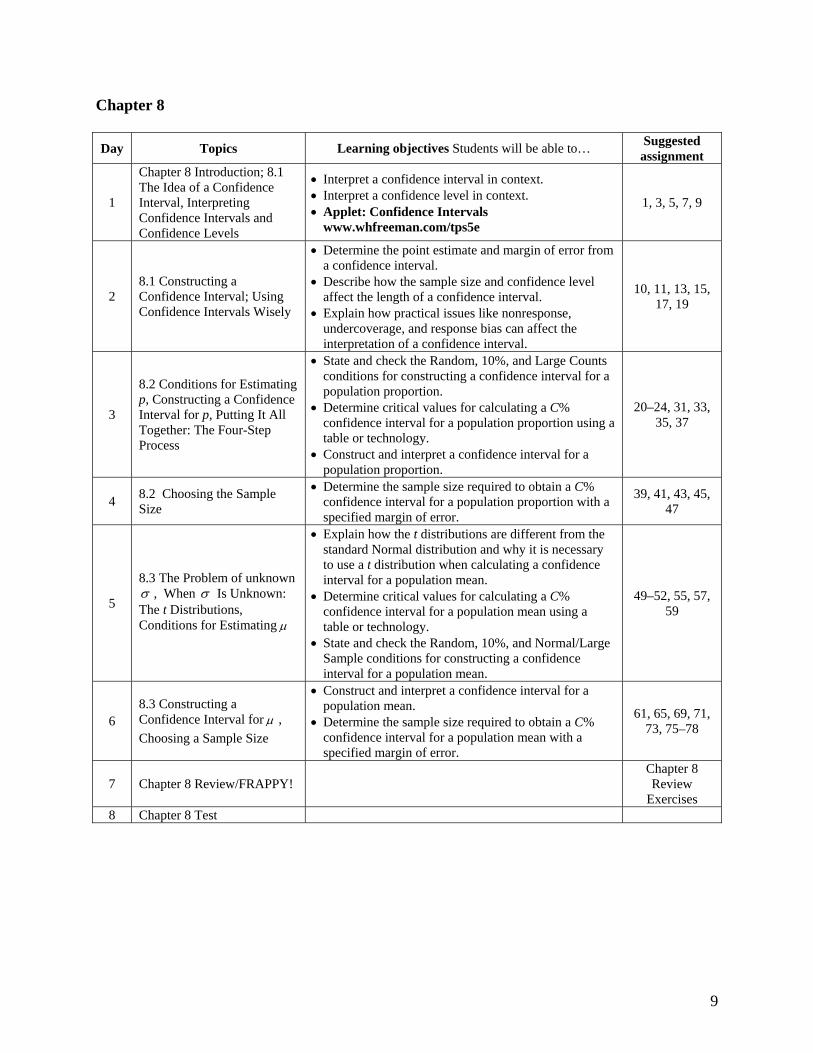
Chapter 8
Day Topics Learning objectives Students will be able to… Suggested assignment
1
Chapter 8 Introduction; 8.1 The Idea of a Confidence Interval, Interpreting Confidence Intervals and Confidence Levels
Interpret a confidence interval in context. Interpret a confidence level in context. Applet: Confidence Intervals
www.whfreeman.com/tps5e
1, 3, 5, 7, 9
2 8.1 Constructing a Confidence Interval; Using Confidence Intervals Wisely
Determine the point estimate and margin of error from a confidence interval.
Describe how the sample size and confidence level affect the length of a confidence interval.
Explain how practical issues like nonresponse, undercoverage, and response bias can affect the interpretation of a confidence interval.
10, 11, 13, 15, 17, 19
3
8.2 Conditions for Estimating p, Constructing a Confidence Interval for p, Putting It All Together: The Four-Step Process
State and check the Random, 10%, and Large Counts conditions for constructing a confidence interval for a population proportion.
Determine critical values for calculating a C% confidence interval for a population proportion using a table or technology.
Construct and interpret a confidence interval for a population proportion.
20–24, 31, 33, 35, 37
4 8.2 Choosing the Sample Size
Determine the sample size required to obtain a C% confidence interval for a population proportion with a specified margin of error.
39, 41, 43, 45, 47
5
8.3 The Problem of unknown , When Is Unknown: The t Distributions, Conditions for Estimating
Explain how the t distributions are different from the standard Normal distribution and why it is necessary to use a t distribution when calculating a confidence interval for a population mean.
Determine critical values for calculating a C% confidence interval for a population mean using a table or technology.
State and check the Random, 10%, and Normal/Large Sample conditions for constructing a confidence interval for a population mean.
49–52, 55, 57, 59
6 8.3 Constructing a Confidence Interval for ,
Choosing a Sample Size
Construct and interpret a confidence interval for a population mean.
Determine the sample size required to obtain a C% confidence interval for a population mean with a specified margin of error.
61, 65, 69, 71, 73, 75–78
7 Chapter 8 Review/FRAPPY! Chapter 8 Review
Exercises 8 Chapter 8 Test
10
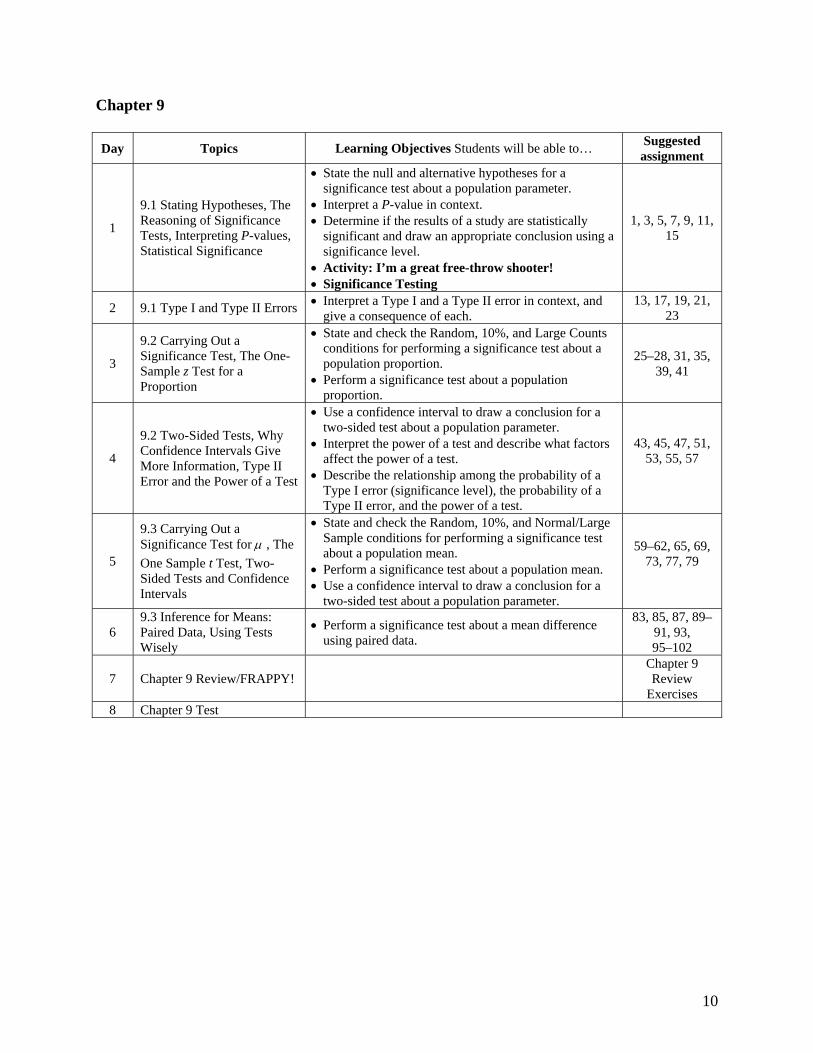
Chapter 9
Day Topics Learning Objectives Students will be able to… Suggested assignment
1
9.1 Stating Hypotheses, The Reasoning of Significance Tests, Interpreting P-values, Statistical Significance
State the null and alternative hypotheses for a significance test about a population parameter.
Interpret a P-value in context. Determine if the results of a study are statistically
significant and draw an appropriate conclusion using a significance level.
Activity: I’m a great free-throw shooter! Significance Testing
1, 3, 5, 7, 9, 11, 15
2 9.1 Type I and Type II Errors Interpret a Type I and a Type II error in context, and give a consequence of each.
13, 17, 19, 21, 23
3
9.2 Carrying Out a Significance Test, The One-Sample z Test for a Proportion
State and check the Random, 10%, and Large Counts conditions for performing a significance test about a population proportion.
Perform a significance test about a population proportion.
25–28, 31, 35, 39, 41
4
9.2 Two-Sided Tests, Why Confidence Intervals Give More Information, Type II Error and the Power of a Test
Use a confidence interval to draw a conclusion for a two-sided test about a population parameter.
Interpret the power of a test and describe what factors affect the power of a test.
Describe the relationship among the probability of a Type I error (significance level), the probability of a Type II error, and the power of a test.
43, 45, 47, 51, 53, 55, 57
5
9.3 Carrying Out a Significance Test for , The
One Sample t Test, Two-Sided Tests and Confidence Intervals
State and check the Random, 10%, and Normal/Large Sample conditions for performing a significance test about a population mean.
Perform a significance test about a population mean. Use a confidence interval to draw a conclusion for a
two-sided test about a population parameter.
59–62, 65, 69, 73, 77, 79
6 9.3 Inference for Means: Paired Data, Using Tests Wisely
Perform a significance test about a mean difference using paired data.
83, 85, 87, 89–91, 93, 95–102
7 Chapter 9 Review/FRAPPY! Chapter 9 Review
Exercises 8 Chapter 9 Test

11
Chapter 10
Day Topics Learning Objectives Students will be able to… Suggested assignment
1
“Is Yawning Contagious?” Activity, 10.1 The Sampling Distribution of a Difference between Two Proportions
Describe the shape, center, and spread of the sampling
distribution of 1 2
ˆ ˆ .p p 1, 3
2 10.1 Confidence Intervals for
1 2p p
Determine whether the conditions are met for doing
inference about 1 2
.p p
Construct and interpret a confidence interval to compare two proportions.
5, 7, 9, 11
3
10.1 Significance Tests for
1 2,p p Inference for
Experiments
Perform a significance test to compare two proportions.
13, 15, 17, 21, 23
4
10.2 “Does Polyester Decay?” Activity, The Sampling Distribution of a Difference between Two Means
Describe the shape, center, and spread of the sampling
distribution of 1 2
.x x
Determine whether the conditions are met for doing
inference about 1 2
.
31, 33, 35, 51
5
10.2 The Two-Sample t Statistic, Confidence
Intervals for 1 2
Construct and interpret a confidence interval to compare two means.
25–28, 37, 39
6
10.2 Significance Tests for
1 2 , Using Two-Sample t
Procedures Wisely
Perform a significance test to compare two means. Determine when it is appropriate to use two-sample t
procedures versus paired t procedures.
41, 43, 45, 47, 53, 57–60
7 Chapter 10 Review/ FRAPPY!
Chapter 10
Review Exercises
8 Chapter 10 Test Cumulative
AP® Practice Exam 3

12
Chapter 11
Day Topics Learning objectives Students will be able to… Suggested assignment
1
Activity: The Candy Man Can; 11.1 Comparing Observed and Expected Counts: The Chi-Square Statistic; The Chi-Square Distributions and P-values
State appropriate hypotheses and compute expected counts for a chi-square test for goodness of fit.
Calculate the chi-square statistic, degrees of freedom, and P-value for a chi-square test for goodness of fit.
1, 3, 5
2 11.1 Carrying Out a Test; Follow-Up Analysis
Perform a chi-square test for goodness of fit. Conduct a follow-up analysis when the results of a
chi-square test are statistically significant. 7, 9, 11, 15, 17
3
11.2 Comparing Distributions of a Categorical Variable; Expected Counts and the Chi-Square Statistic; The Chi-Square Test for Homogeneity
Compare conditional distributions for data in a two-way table.
State appropriate hypotheses and compute expected counts for a chi-square test based on data in a two-way table.
Calculate the chi-square statistic, degrees of freedom, and P-value for a chi-square test based on data in a two-way table.
Perform a chi-square test for homogeneity.
19–22, 27, 29, 31, 33, 35, 37,
39
4
11.2 Relationships between Two Categorical Variables; the Chi-Square Test for Independence; Using Chi-Square Tests Wisely
Perform a chi-square test for independence. Choose the appropriate chi-square test.
41, 43, 45, 47, 49, 51–55
5 Chapter 11 Review/ FRAPPY!
Chapter 11
Review Exercises
6 Chapter 11 Test

13
Chapter 12
Day Topics Learning Objectives Students will be able to … Suggested assignment
1
Activity: The Helicopter Experiment; 12.1 Sampling Distribution of b; Conditions for Regression Inference
Check the conditions for performing inference about the slope of the population (true)
regression line. 1, 3
2
12.1 Estimating the Parameters; Constructing a Confidence Interval for the Slope
Interpret the values of a, b, s, SEb, and 2r in
context, and determine these values from computer output.
Construct and interpret a confidence interval for the slope of the population (true) regression line.
5, 7, 9, 11
3 12.1 Performing a Significance Test for the Slope
Perform a significance test about the slope of the
population (true) regression line. 13, 15, 17
4 12.2 Transforming with Powers and Roots
Use transformations involving powers and roots to find a power model that describes the relationship between two variables, and use the model to make predictions.
19–24, 31, 33
5
12.2 Transforming with Logarithms; Putting it all Together: Which Transformation Should We Choose?
Use transformations involving logarithms to find a power model or an exponential model that describes the relationship between two variables, and use the model to make predictions.
Determine which of several transformations does a better job of producing a linear relationship.
35, 37, 39, 41, 43, 45, 47–50
6 Chapter 12 Review/ FRAPPY!
Chapter 12
Review Exercises
7 Chapter 12 Test Cumulative AP® Practice Test 4
AP EXAM REVIEW (10 days)
Practice AP Free Response Questions Choosing the Correct Inference Procedure Flash cards Mock Grading Sessions Rubric development by student teams Practice Multiple Choice Questions

14
Rubric for Chapter 1/4 Project
Response Bias Project
4 = Complete 3 = Substantial 2 = Developing 1 = Minimal
Introduction
Describes the context of the research
Has a clearly stated question of interest
Provides a hypothesis about the question of interest
Question of interest is of appropriate difficulty
Introduces the context of the research and has a specific question of interest
Suggests hypothesis OR has appropriate difficulty
Introduces the context of the research and question of interest OR has question of interest and a hypothesis
Briefly describes the context of the research
Data Collection
Method of data collection is clearly described
Includes appropriate randomization
Describes efforts to reduce bias, variability, confounding
Quantity of data collected is appropriate
Method of data collection is clearly described
Some effort is made to incorporate principles of good data collection
Quantity of data collected is appropriate
Method of data collection is described
Some effort is made to incorporate principles of good data collection
Some evidence of data collection
Graphs and Summary Statistics
Raw data is included in a two-way table (categorical) or in lists (quantitative)
Appropriate graphs are included
Graphs are neat, easy to compare, and clearly labeled, including clear identification of treatments
Appropriate summary statistics are included in discussion (e.g., percentages for categorical data, means for quantitative data)
Appropriate graphs are included
Graphs are neat, clearly labeled, and easy to compare
Appropriate summary statistics or raw data are included
Graphs and summary statistics are included
Graphs or summary statistics are included
Conclusions
Uses the results of the study to correctly answer question of interest
Discusses what inferences are appropriate based on study design
Shows good evidence of critical reflection (discusses possible errors, limitations.)
Makes a correct conclusion
Discusses what inferences are appropriate or shows good evidence of critical reflection
Makes a partially correct conclusion
Shows some evidence of critical reflection
Makes a conclusion
Poster, Presentation, & Communication
Has a clear, holistic understanding of the project
Poster is well organized, neat, and easy to read
Poster included pictures of data collection in progress and is visually appealing
Oral is well organized
Has a clear, holistic understanding of the project, but poster is unorganized, lacks visual appeal, or oral presentation is not organized
The poster and oral presentation have several problems
Commun-ication and organization are poor