Test_B AP Statistics
24
Chapter 2 Test 2B 1 Test 2B AP Statistics Name: Directions: Work on these sheets. A standard normal table is attached. Part 1: Multiple Choice. Circle the letter corresponding to the best answer. 1. For the density curve shown, which statement is true? (a) The density curve is symmetric. (b) The density curve is skewed right. (c) The density curve is skewed left. (d) The density curve is normal. (e) None of the above is correct. 2. For the density curve shown in Question 1, which statement is true? (a) The mean and median are equal. (b) The mean is greater than the median. (c) The mean is less than the median. (d) The mean could be either greater than or less than the median. (e) None is the above is correct. 3. Suppose that sixteen-ounce bags of chocolate chips cookies are produced with an actual mean weight of 16.1 ounces and a standard deviation of 0.1 ounce. The percentage of bags that will contain between 16.0 and 16.1 ounces is (a) 10 (b) 16 (c) 34 (d) 68 (e) none of the above 4. This is a continuation of Question 3. Approximately what percentage of the bags will likely be underweight (i.e., less than 16 ounces)? (a) 10 (b) 16 (c) 32 (d) 64 (e) none of the above 5. Which statement is true for any density curve? (a) The bars must be of equal width. (b) It is symmetric. (c) It must either steadily rise or steadily fall, since it cannot do both. (d) One can use Table A (table of standard normal values) to find relative frequencies. (e) None of the above is correct. Chapter 2 Test 2B 2 6. Increasing the frequencies in the tails of a distribution will: (a) Not affect the standard deviation as long as the increases are balanced on each side of the mean (b) Not affect the standard deviation (c) Increase the standard deviation (d) Reduce the standard deviation (e) None of the above 7. The plot shown is a normal probability plot for a set of data. The data value is plotted on the x- axis, and the standardized value is plotted on the y-axis. Which statement is true for this data set? (a) The data are clearly normally distributed. (b) The data are approximately normally distributed. (c) The data are clearly skewed to the right. (d) The data are clearly skewed to the left. (e) There is insufficient information to determine the shape of the distribution. 8. Which of the following are true statements? I. The area under a normal curve is always 1, regardless of the mean and standard deviation. II. The mean is always equal to the median for any normal distribution. III. The interquartile range for any normal curve extends from μ–1s to μ+1s. (a) I and II (b) I and III (c) II and III (d) I, II, and III (e) None of the above gives the correct set of true responses. 9. Pop1 and Pop2 are normal density curves with means and standard deviations μ 1 , s 1 and μ 2 , s 2 , respectively. Suppose that μ 1 = μ 2 and σ 1 = 2(σ 2 ). Consider these statements: I. Pop1 has twice as many observations within one standard deviation as Pop2. II. The density curve for Pop1 is taller than that of Pop2. III. The density curves are centered around different numbers. Which of these statements are correct? (a) I only (b) II only (c) III only (d) I and II only (e) None of the above gives the correct set of true responses.
-
Upload
john-smith -
Category
Documents
-
view
17.856 -
download
21
description
All AP Statistics Tests without answers
Transcript of Test_B AP Statistics

Chapter 2 Test 2B
1
Test 2B AP Statistics Name: Directions: Work on these sheets. A standard normal table is attached.
Part 1: Multiple Choice. Circle the letter corresponding to the best answer. 1. For the density curve shown, which statement is true? (a) The density curve is symmetric. (b) The density curve is skewed right. (c) The density curve is skewed left. (d) The density curve is normal. (e) None of the above is correct. 2. For the density curve shown in Question 1, which statement is true? (a) The mean and median are equal. (b) The mean is greater than the median. (c) The mean is less than the median. (d) The mean could be either greater than or less than the median. (e) None is the above is correct. 3. Suppose that sixteen-ounce bags of chocolate chips cookies are produced with an actual mean
weight of 16.1 ounces and a standard deviation of 0.1 ounce. The percentage of bags that will contain between 16.0 and 16.1 ounces is
(a) 10 (b) 16 (c) 34 (d) 68 (e) none of the above 4. This is a continuation of Question 3. Approximately what percentage of the bags will likely be
underweight (i.e., less than 16 ounces)? (a) 10 (b) 16 (c) 32 (d) 64 (e) none of the above 5. Which statement is true for any density curve? (a) The bars must be of equal width. (b) It is symmetric. (c) It must either steadily rise or steadily fall, since it cannot do both. (d) One can use Table A (table of standard normal values) to find relative frequencies.
(e) None of the above is correct.
Chapter 2 Test 2B
2
6. Increasing the frequencies in the tails of a distribution will: (a) Not affect the standard deviation as long as the increases are balanced on each side of the
mean (b) Not affect the standard deviation (c) Increase the standard deviation (d) Reduce the standard deviation (e) None of the above 7. The plot shown is a normal probability plot for a set of data. The data value is plotted on the x-
axis, and the standardized value is plotted on the y-axis. Which statement is true for this data set?
(a) The data are clearly normally distributed. (b) The data are approximately normally distributed. (c) The data are clearly skewed to the right. (d) The data are clearly skewed to the left. (e) There is insufficient information to determine the shape of the
distribution. 8. Which of the following are true statements? I. The area under a normal curve is always 1, regardless of the mean and standard deviation. II. The mean is always equal to the median for any normal distribution. III. The interquartile range for any normal curve extends from µ–1s to µ+1s. (a) I and II (b) I and III (c) II and III (d) I, II, and III (e) None of the above gives the correct set of true responses. 9. Pop1 and Pop2 are normal density curves with means and standard deviations µ1, s1 and µ2, s2,
respectively. Suppose that µ1 = µ2 and σ1 = 2(σ2). Consider these statements: I. Pop1 has twice as many observations within one standard deviation as Pop2. II. The density curve for Pop1 is taller than that of Pop2. III. The density curves are centered around different numbers. Which of these statements are correct? (a) I only (b) II only (c) III only (d) I and II only (e) None of the above gives the correct set of true responses.
Chapter 2 Test 2B
3
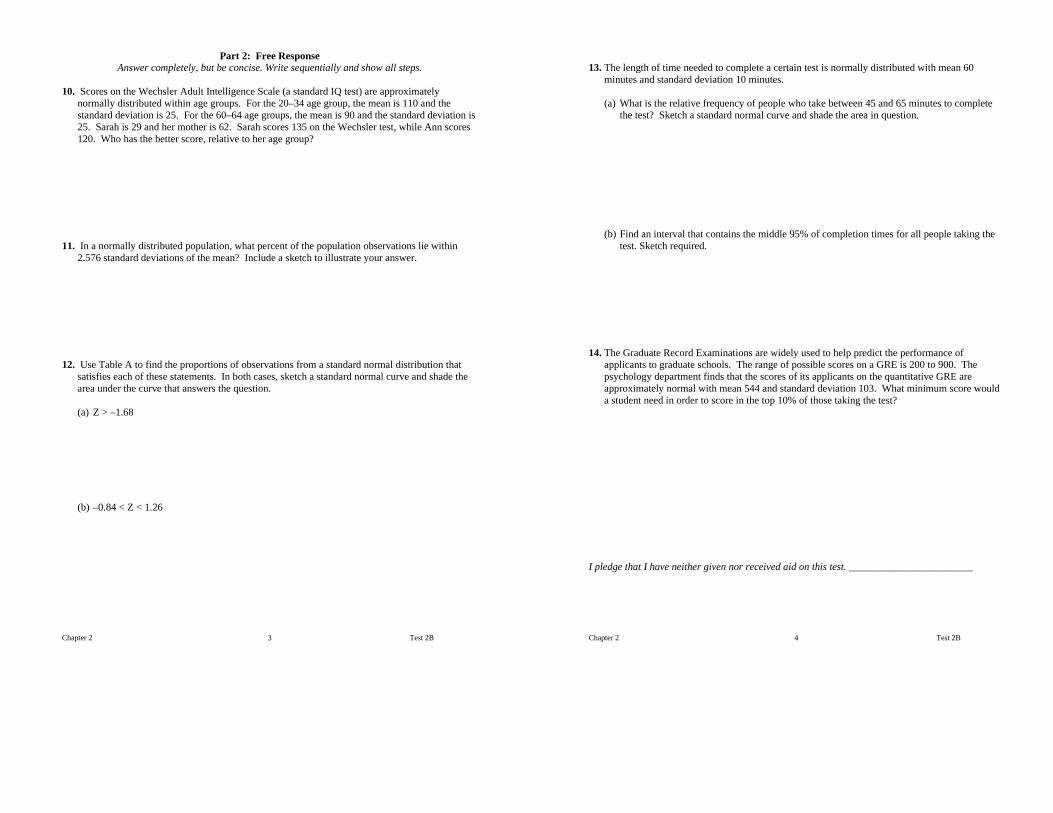
Part 2: Free Response Answer completely, but be concise. Write sequentially and show all steps.
10. Scores on the Wechsler Adult Intelligence Scale (a standard IQ test) are approximately
normally distributed within age groups. For the 20–34 age group, the mean is 110 and the standard deviation is 25. For the 60–64 age groups, the mean is 90 and the standard deviation is 25. Sarah is 29 and her mother is 62. Sarah scores 135 on the Wechsler test, while Ann scores 120. Who has the better score, relative to her age group?
11. In a normally distributed population, what percent of the population observations lie within
2.576 standard deviations of the mean? Include a sketch to illustrate your answer. 12. Use Table A to find the proportions of observations from a standard normal distribution that
satisfies each of these statements. In both cases, sketch a standard normal curve and shade the area under the curve that answers the question.
(a) Z > –1.68 (b) –0.84 < Z < 1.26
Chapter 2 Test 2B
4
13. The length of time needed to complete a certain test is normally distributed with mean 60
minutes and standard deviation 10 minutes. (a) What is the relative frequency of people who take between 45 and 65 minutes to complete
the test? Sketch a standard normal curve and shade the area in question. (b) Find an interval that contains the middle 95% of completion times for all people taking the
test. Sketch required. 14. The Graduate Record Examinations are widely used to help predict the performance of
applicants to graduate schools. The range of possible scores on a GRE is 200 to 900. The psychology department finds that the scores of its applicants on the quantitative GRE are approximately normal with mean 544 and standard deviation 103. What minimum score would a student need in order to score in the top 10% of those taking the test?
I pledge that I have neither given nor received aid on this test. ________________________

Chapter 3 1 Test 3B
Test 3B AP Statistics Name: Directions: Work on these sheets.
Part 1: Multiple Choice. Circle the letter corresponding to the best answer.
1. The correlation r for the data in this scatterplot is (a) Near –1 (b) Clearly negative but not near –1 (c) Near 0 (d) Clearly positive but not near 1 (e) Near 1 2. In the scatterplot in the previous question, if each x-value were decreased by one unit and the y-values
remained the same, then the correlation r would (a) Decrease by 1 unit (b) Decease slightly (c) Increase slightly (d) Stay the same (e) Can’t tell without knowing the data values 3. In regression, the residuals are which of the following? (a) Those factors unexplained by the data (b) The difference between the observed responses and the values predicted by the regression line (c) Those data points which were recorded after the formal investigation was completed (d) Possible models unexplored by the investigator (e) None of the above 4. What does the square of the correlation (r2) measure? (a) The slope of the least squares regression line (b) The intercept of the least squares regression line (c) The extent to which cause and effect is present in the data (d) The fraction of the variation in the values of y that is explained by least-squares regression on the
other 5. Which of the following statements are true? I. Correlation and regression require explanatory and response variables. II. Scatterplots require that both variables be quantitative. III. Every least-square regression line passes through (x , y ). (a) I and II only (b) I and III only (c) II and III only (d) I, II, and III (e) None of the above
Chapter 3 2 Test 3B
6. A local community college announces the correlation between college entrance exam grades and
scholastic achievement was found to be –1.08. On the basis of this you would tell the college that (a) The entrance exam is a good predictor of success. (b) The exam is a poor predictor of success. (c) Students who do best on this exam will be poor students. (d) Students at this school are underachieving. (e) The college should hire a new statistician. 7. A researcher finds that the correlation between the personality traits “greed” and “superciliousness” is
–.40. What percentage of the variation in greed can be explained by the relationship with superciliousness?
(a) 0% (b) 16% (c) 20% (d) 40% (e) 60% 8. Suppose the following information was collected, where X = diameter of tree trunk in inches, and Y =
tree height in feet. X 4 2 8 6 10 6 Y 8 4 18 22 30 8
If the LSRL equation is y = –3.6 + 3.1x, what is your estimate of the average height of all trees having a trunk diameter of 7 inches?
(a) 18.1 (b) 19.1 (c) 20.1 (d) 21.1 (e) 22.1 9. Suppose we fit the least squares regression line to a set of data. What is true if a plot of the residuals
shows a curved pattern? (a) A straight line is not a good model for the data. (b) The correlation must be 0. (c) The correlation must be positive. (d) Outliers must be present. (e) The LSRL might or might not be a good model for the data, depending on the extent of the curve. 10. The following are resistant: (a) Least squares regression line (b) Correlation coefficient (c) Both the least square line and the correlation coefficient (d) Neither the least square line nor the correlation coefficient (e) It depends

Chapter 3 3 Test 3B
Part 2: Free Response Answer completely, but be concise. Write sequentially and show all steps.
A certain psychologist counsels people who are getting divorced. A random sample of six of her patients provided the following data where x = number of years of courtship before marriage, and y = number of years of marriage before divorce. x 3 0.5 2 1.5 5 y 9 6 14 10 20 11. Construct a scatterplot of these points:
12. Use your calculator to determine the least-squares regression line (LSRL). Write the equation, and
plot this line on your graph. (Be sure to show what information you’re using to plot the line.) 13. What is the correlation between x and y? Interpret this number. 14. Show how the residual for the first data point in the table is calculated.
Chapter 3 4 Test 3B
Joey appears to be growing slowly as a toddler. His height between 18 and 30 months of age increases as follows: Observed Predicted Age (months) Height (cm) Height Residual 18 76.5 -.066 21 78.7 79.077 24 82.0 81.588 .412 27 84.8 84.099 30 86.0 -.61 The least squares regression line (LSRL) fitted to this data has equation HEIGHT = 61.5 + 0.837 AGE 15. Finish filling in the table above. 16. Draw a residual plot. 17. Based on your residual plot, would you describe Joey's growth pattern from 18 to 30 months as being
linear? Explain. 18. Predict Joey's height at 20 months. I pledge that I have neither given nor received aid on this test. _________________________________
Chapter 4 Test 4B 1
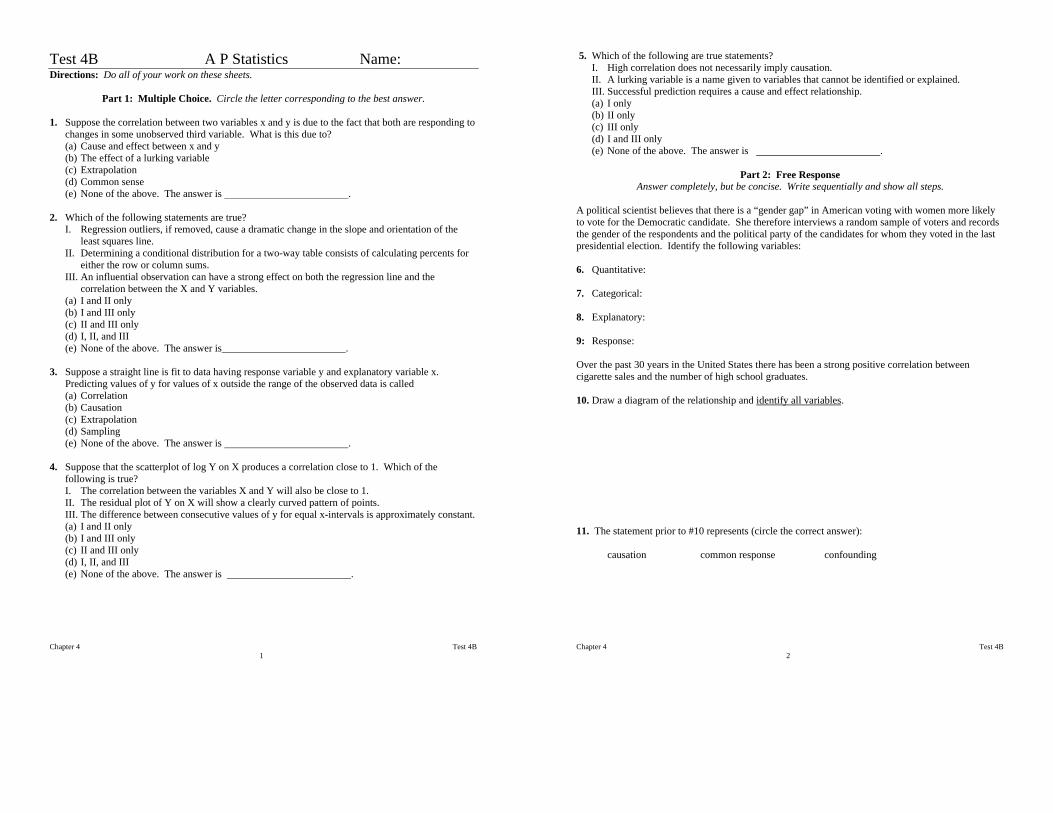
Test 4B A P Statistics Name: Directions: Do all of your work on these sheets.
Part 1: Multiple Choice. Circle the letter corresponding to the best answer. 1. Suppose the correlation between two variables x and y is due to the fact that both are responding to
changes in some unobserved third variable. What is this due to? (a) Cause and effect between x and y (b) The effect of a lurking variable (c) Extrapolation (d) Common sense (e) None of the above. The answer is . 2. Which of the following statements are true? I. Regression outliers, if removed, cause a dramatic change in the slope and orientation of the
least squares line. II. Determining a conditional distribution for a two-way table consists of calculating percents for
either the row or column sums. III. An influential observation can have a strong effect on both the regression line and the
correlation between the X and Y variables. (a) I and II only (b) I and III only (c) II and III only (d) I, II, and III (e) None of the above. The answer is . 3. Suppose a straight line is fit to data having response variable y and explanatory variable x.
Predicting values of y for values of x outside the range of the observed data is called (a) Correlation (b) Causation (c) Extrapolation (d) Sampling (e) None of the above. The answer is . 4. Suppose that the scatterplot of log Y on X produces a correlation close to 1. Which of the
following is true? I. The correlation between the variables X and Y will also be close to 1. II. The residual plot of Y on X will show a clearly curved pattern of points. III. The difference between consecutive values of y for equal x-intervals is approximately constant. (a) I and II only (b) I and III only (c) II and III only (d) I, II, and III (e) None of the above. The answer is .
Chapter 4 Test 4B 2
5. Which of the following are true statements? I. High correlation does not necessarily imply causation. II. A lurking variable is a name given to variables that cannot be identified or explained. III. Successful prediction requires a cause and effect relationship. (a) I only (b) II only (c) III only (d) I and III only (e) None of the above. The answer is .
Part 2: Free Response Answer completely, but be concise. Write sequentially and show all steps.
A political scientist believes that there is a “gender gap” in American voting with women more likely to vote for the Democratic candidate. She therefore interviews a random sample of voters and records the gender of the respondents and the political party of the candidates for whom they voted in the last presidential election. Identify the following variables: 6. Quantitative: 7. Categorical: 8. Explanatory: 9: Response: Over the past 30 years in the United States there has been a strong positive correlation between cigarette sales and the number of high school graduates. 10. Draw a diagram of the relationship and identify all variables. 11. The statement prior to #10 represents (circle the correct answer): causation common response confounding

Chapter 4 Test 4B 3
In a study of the relationship between the amount of violence a person watches on TV and the viewer’s age, 81 regular TV watchers were randomly selected and classified according to their age group and whether the were a “low-violence” or “high violence” viewer. Here is a two-way table of the results. Age Group 16-34 35-54 55 & over Amount of Low 8 12 21 Violence Watched High 18 15 7___ 12. Compute (in percents) the marginal distribution of age group for all people surveyed. 13. Construct a bar chart to show your results visually. 14. Compute (in percents) the conditional distributions of age group among “low-violence” viewers.
Then do the same for “high-violence” viewers. 15. How do these distributions differ from the marginal distribution of age group?
Chapter 4 Test 4B 4
Cell phones, a recent innovation, have become increasingly popular with all segments of our society. According to the Strategis Group, the number of cellular and personal communications systems subscribers in the United States have increased dramatically since 1990, as shown in the following table. No.of Subscribers Year (millions) 1990 5.3 1991 7.6 1992 11.0 1993 16.0 1994 24.1 1995 33.8 1996 43.4 16. Apply a test to show that the cellular systems are increasing exponentially. 17. Calculate the logarithms of the y-values and extend the table above to show the transformed data. 18. Plot the transformed data on the grid provided. Label the axes completely. 19. You want to construct a model to predict cell phone growth in
the near future. Perform linear regression on the transformed data. Write your LSRL equation. What is the correlation for the transformed data?
20. Now transform your linear equation back to obtain a model for the original data. (It should be in
the form y = c•10 ^kx) Write the equation for this model. 21. The Strategis Group predicts 70.8 million subscribers in 1998, and 99.2 million in the year 2000.
How many cellular subscribers does your model predict for these years? I pledge that I have neither given nor received aid on this test. _____________________________

Chapter 5 1 Test 5C
Test 5B AP Statistics Name: Directions: Work on these sheets. A random digit table is provided separately.
Part 1: Multiple Choice. Circle the letter corresponding to the best answer. A chemical engineer is designing the production process for a new product. The chemical reaction that produces the product may have a higher or lower yield depending on the temperature and the stirring rate in the vessel in which the reaction takes place. The engineer decides to investigate the effects of combinations of two temperatures (50˚C and 60˚C) and three stirring rates (60 rpm, 90 rpm, and 120 rpm) on the yield of the process. Ten batches of feedstock will be processed at each combination of temperature and stirring rate. 1. What are the experimental units? (a) The two temperatures (50˚C and 60˚C) (b) The three stirring rates (60 rpm, 90 rpm, and 120 rpm) (c) The two temperatures and the three stirring rates (d) The batches of feedstock (e) None of the above. The answer is 2. Identify all factors (explanatory variables). (a) The two temperatures (50˚C and 60˚C) (b) The three stirring rates (60 rpm, 90 rpm, and 120 rpm) (c) The two temperatures and the three stirring rates (d) The batches of feedstock (e) None of the above. The answer is __________________________. 3. What is the response variable? (a) The two temperatures (50˚C and 60˚C) (b) The three stirring rates (60 rpm, 90 rpm, and 120 rpm) (c) The two temperatures and the three stirring rates (d) The batches of feedstock (e) None of the above. The answer is 4. How many treatments are there? (a) 2 (b) 3 (c) 5 (d) 6 (e) None of the above. The answer is _______________________________. 5. How many experimental units are needed? (a) 2 (b) 3 (c) 5 (d) 6 (e) None of the above. The answer is __________________________________.
Chapter 5 2 Test 5C
Part 2: Free Response Answer completely, but be concise. Write sequentially and show all steps.
Read the article about the connection between vitamin E and heart bypass surgery.
6. Describe the experimental units/subjects in the experiment. How many were there? 7. Identify the explanatory variable(s). 8. How many treatments were there? ____ List them. 9. How many subjects were in each treatment group? 10. What was the response variable? Suppose there are 500 students in your school. 11. Using Line 125 of the attached Random Numbers Table(RNT), select the first 5 students in a
simple random sample (SRS) of 20 students.
Vitamin E may have special health benefits Large doses of vitamin E apparently can reduce harmful side effects of bypass surgery in heart patients. A study involving 28 bypass patients found that the 14 patients who took vitamin E for two weeks before their operations had significantly better heart function after the procedure than the 14 patients who took placebos. The vitamins apparently prevent damage to the heart muscle by destroying the toxic chemicals, called free radicals, that form when blood is cut off during the surgery, said Dr. Terrance Yau of the University of Toronto.
Chapter 5 3 Test 5C
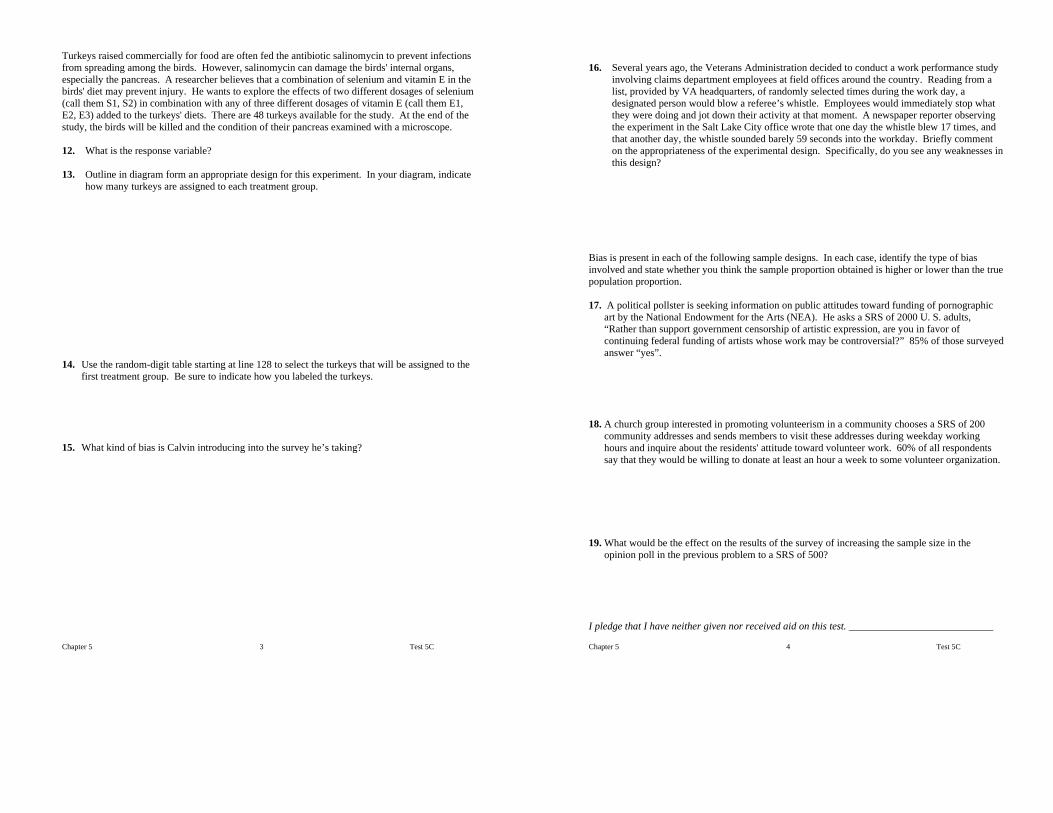
Turkeys raised commercially for food are often fed the antibiotic salinomycin to prevent infections from spreading among the birds. However, salinomycin can damage the birds' internal organs, especially the pancreas. A researcher believes that a combination of selenium and vitamin E in the birds' diet may prevent injury. He wants to explore the effects of two different dosages of selenium (call them S1, S2) in combination with any of three different dosages of vitamin E (call them E1, E2, E3) added to the turkeys' diets. There are 48 turkeys available for the study. At the end of the study, the birds will be killed and the condition of their pancreas examined with a microscope. 12. What is the response variable? 13. Outline in diagram form an appropriate design for this experiment. In your diagram, indicate
how many turkeys are assigned to each treatment group. 14. Use the random-digit table starting at line 128 to select the turkeys that will be assigned to the
first treatment group. Be sure to indicate how you labeled the turkeys. 15. What kind of bias is Calvin introducing into the survey he’s taking?
Chapter 5 4 Test 5C
16. Several years ago, the Veterans Administration decided to conduct a work performance study
involving claims department employees at field offices around the country. Reading from a list, provided by VA headquarters, of randomly selected times during the work day, a designated person would blow a referee’s whistle. Employees would immediately stop what they were doing and jot down their activity at that moment. A newspaper reporter observing the experiment in the Salt Lake City office wrote that one day the whistle blew 17 times, and that another day, the whistle sounded barely 59 seconds into the workday. Briefly comment on the appropriateness of the experimental design. Specifically, do you see any weaknesses in this design?
Bias is present in each of the following sample designs. In each case, identify the type of bias involved and state whether you think the sample proportion obtained is higher or lower than the true population proportion. 17. A political pollster is seeking information on public attitudes toward funding of pornographic
art by the National Endowment for the Arts (NEA). He asks a SRS of 2000 U. S. adults, “Rather than support government censorship of artistic expression, are you in favor of continuing federal funding of artists whose work may be controversial?” 85% of those surveyed answer “yes”.
18. A church group interested in promoting volunteerism in a community chooses a SRS of 200
community addresses and sends members to visit these addresses during weekday working hours and inquire about the residents' attitude toward volunteer work. 60% of all respondents say that they would be willing to donate at least an hour a week to some volunteer organization.
19. What would be the effect on the results of the survey of increasing the sample size in the
opinion poll in the previous problem to a SRS of 500? I pledge that I have neither given nor received aid on this test. ____________________________

Chapter 6 1 Test 6B
Test 6B AP Statistics Name: Directions: Work on these sheets.
Part 1: Multiple Choice. Circle the letter corresponding to the best answer. 1. Which of the following pairs of events are disjoint (mutually exclusive)? (a) A: the odd numbers; B: the number 5 (b) A: the even numbers; B: the numbers greater than 10 (c) A: the numbers less than 5; B: all negative numbers (d) A: the numbers above 100; B: the numbers less than –200 (e) A: negative numbers; B: odd numbers 2. Which of the following are true? I. The sum of the probabilities in a probability distribution can be any number between 0 and 1. II. The probability of the union of two events is the sum of the probabilities of those events. III. The probability that an event happens is equal to 1 – (the probability that the event does not
happen). (a) I and II only (b) I and III only (c) II and III only (d) I, II, and III (e) None of the above gives the complete set of true responses 3. Government data show that 26% of the civilian labor force has at least 4 years of college and that
15% of the labor force works as laborers or operators of machines or vehicles. Can you conclude that because (0.26)(0.15) = .039 about 4% of the labor force are college-educated laborers or operators?
(a) Yes, by the multiplication rule (b) Yes, by conditional probabilities (c) Yes, by the law of large numbers (d) No, because the events are not independent (e) No, because the events are not mutually exclusive 4. If a peanut M&M is chosen at random, the chances of it being of a particular color are shown in the
table below. Color Brown Red Yellow Green Orange Blue Probability .3 .2 .2 .2 .1 The probability of randomly drawing a blue peanut M&M is (a) 0.1 (b) 0.2 (c) 0.3 (d) 1.0 (e) According to this distribution, it’s impossible to draw a blue peanut M&M.
Chapter 6 2 Test 6B
5. If A∪B = S (sample space), P(A and Bc) = 0.25, and P(Ac) = 0.35, then P(B) = (a) 0.35 (b) 0.4 (c) 0.65 (d) 0.75 (e) None of the above. The answer is ________________.
Part 2: Free Response Answer completely, but be concise. Write sequentially and show all steps.
A box contains six red tags numbered 1 through 6, and four white tags numbered 1 through 4. One tag is drawn at random. 6. Write the sample space for this experiment. Calculate the following probabilities: 7. P(red) 8. P(even number) 9. P(red and even) 10. P(red or even) 11. P(neither red nor even) 12. P(even | red) 13. P(red | even) 14. P( <4 | odd) 15. Suppose that for a group of consumers, the probability of eating pretzels is .75 and that the
probability of drinking Coke is .65. Further suppose that the probability of eating pretzels and drinking Coke is .55. Determine if these two events are independent.
Chapter 6 3 Test 6B
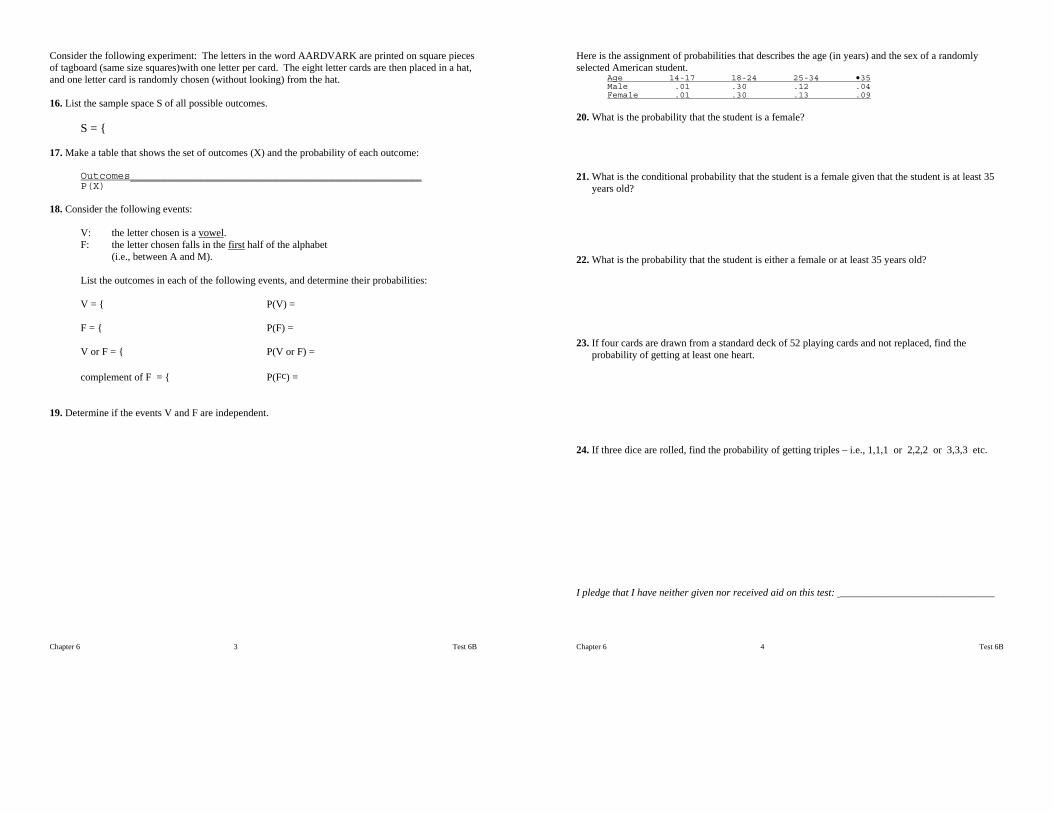
Consider the following experiment: The letters in the word AARDVARK are printed on square pieces of tagboard (same size squares)with one letter per card. The eight letter cards are then placed in a hat, and one letter card is randomly chosen (without looking) from the hat. 16. List the sample space S of all possible outcomes. S = { 17. Make a table that shows the set of outcomes (X) and the probability of each outcome: Outcomes_______________________________________________ P(X) 18. Consider the following events: V: the letter chosen is a vowel. F: the letter chosen falls in the first half of the alphabet (i.e., between A and M).
List the outcomes in each of the following events, and determine their probabilities: V = { P(V) = F = { P(F) = V or F = { P(V or F) = complement of F = { P(Fc) = 19. Determine if the events V and F are independent.
Chapter 6 4 Test 6B
Here is the assignment of probabilities that describes the age (in years) and the sex of a randomly selected American student. Age 14-17 18-24 25-34 •35 Male .01 .30 .12 .04 Female .01 .30 .13 .09 20. What is the probability that the student is a female? 21. What is the conditional probability that the student is a female given that the student is at least 35
years old? 22. What is the probability that the student is either a female or at least 35 years old? 23. If four cards are drawn from a standard deck of 52 playing cards and not replaced, find the
probability of getting at least one heart. 24. If three dice are rolled, find the probability of getting triples – i.e., 1,1,1 or 2,2,2 or 3,3,3 etc. I pledge that I have neither given nor received aid on this test: ______________________________

Chapter 7 1 Test 7B
Test 7B AP Statistics Name: Directions: Work on these sheets.
Part 1: Multiple Choice. Circle the letter corresponding to the best answer. A psychologist studied the number of puzzles subjects were able to solve in a five-minute period while listening to soothing music. Let X be the number of puzzles completed successfully by a subject. X had the following distribution: X 1 2 3 4 Probability 0.2 0.4 0.3 0.1 1. Using the above data, what is the probability that a randomly chosen subject completes at least 3
puzzles in the five-minute period while listening to soothing music? (a) 0.3 (b) 0.4 (c) 0.6 (d) 0.9 (e) The answer cannot be computed from the information given. 2. Using the above data, P(X < 3) is (a) 0.3 (b) 0.4 (c) 0.6 (d) 0.9 (e) The answer cannot be computed from the information given. 3. Using the above data, the mean µ of X is (a) 2.0 (b) 2.3 (c) 2.5 (d) 3.0 (e) The answer cannot be computed from the information given. 4. Which of the following random variables should be considered continuous? (a) The time it takes for a randomly chosen woman to run 100 meters (b) The number of brothers a randomly chosen person has (c) The number of cars owned by a randomly chosen adult male (d) The number of orders received by a mail order company in a randomly chosen week (e) None of the above
Chapter 7 2 Test 7B
5. Let the random variable X represent the profit made on a randomly selected day by a certain store. Assume that X is normal with mean $360 and standard deviation $50. What is the value of P(X > $400)?
(a) 0.2119 (b) 0.2881 (c) 0.7881 (d) 0.8450 (e) The answer cannot be computed from the information given.
Part 2: Free Response Answer completely, but be concise. Write sequentially and show all steps.
The probability that 0, 1, 2, 3, or 4 people will seek treatment for the flu during any given hour at an emergency room is shown in the distribution. X 0 1 2 3 4 P(X) 0.12 0.25 0.32 0.24 0.06 6. What does the random variable count or measure? 7. What is the mean of X? 8. What is the variance and standard deviation of X? 9. If a player rolls two dice and gets a sum of 2 or 12, he wins $20. If the person gets a 7, he wins $5.
The cost to play the game is $3. Find the expectation of the game.

Chapter 7 3 Test 7B
A box contains 5 pennies, 5 dimes, 1 quarter, and 1 half dollar. You reach into the box (without looking) and select a single coin. 10. Identify the random variable. X = 11. Construct a probability distribution for this data. 12. If you reach into the box and randomly select one coin, what is the probability you will get
something between 5 cents and 35 cents? Here is the probability distribution function for a continuous random variable.
Determine the following probabilities: 13. P(0 ≤ X ≤ 3) = 14. P(2 ≤ X ≤ 3) = 15. P(X = 2) = 16. P(X < 2) = 17. P(1 < X < 3) =
Chapter 7 4 Test 7B
Suppose that the discrete random variable has the following probability distribution. X 1 3 5 P(X) 1/4 1/4 1/2 18. Find the mean µX of X. 19. Find the variance (sX)2 of X. 20. Define the new random variable Y = 3X + 1. Use the properties of the mean of linear functions of
random variables and your results in the previous problems to find the mean of Y. 21. Use the properties of the variance of linear functions of random variables to calculate the variance
and standard deviation of the new random variable Y. I pledge that I have neither given nor received aid on this test. ________________

Chapter 8 1 Test 8B
Test 8B A P Statistics Name: Directions: Work on these sheets. A random digit table is attached.
Part 1: Multiple Choice. Circle the letter corresponding to the best answer. 1. A dealer in the Sands Casino in Las Vegas selects 40 cards from a standard deck of 52 cards. Let
Y be the number of red cards (hearts or diamonds) in the 40 cards selected. Which of the following best describes this setting: (a) Y has a binomial distribution with n = 40 observations and probability of success p = 0.5. (b) Y has a binomial distribution with n=40 observations and probability of success p = 0.5,
provided the deck is shuffled well. (c) Y has a binomial distribution with n=40 observations and probability of success p = 0.5,
provided after selecting a card it is replaced in the deck and the deck is shuffled well before the next card is selected.
(d) Y has a normal distribution with mean p = 0.5. 2. In a certain large population, 40% of households have a total annual income of over $70,000. A
simple random sample is taken of 4 of these households. Let X be the number of households in the sample with an annual income of over $70,000 and assume that the binomial assumptions are reasonable. What is the mean of X?
(a) 1.6 (b) 28,000 (c) 0.96 (d) 2, since the mean must be an integer (e) The answer cannot be computed from the information given. 3. The probability that a three-year-old battery still works is 0.8. A cassette recorder requires four
working batteries to operate. The state of batteries can be regarded as independent, and four three-year-old batteries are selected for the cassette recorder. What is the probability that the cassette recorder operates?
(a) 0.9984 (b) 0.8000 (c) 0.5904 (d) 0.4096 (e) The answer cannot be computed from the information given. 4. Twenty percent of all trucks undergoing a certain inspection will fail the inspection. Assume that
trucks are independently undergoing this inspection, one at a time. The expected number of trucks inspected before a truck fails inspection is
(a) 2 (b) 4 (c) 5 (d) 20 (e) The answer cannot be computed from the information given.
Chapter 8 2 Test 8B
5. Two percent of the circuit boards manufactured by a particular company are defective. If circuit
boards are randomly selected for testing, the probability that the number of circuit boards inspected before a defective board is found is greater than 10 is
(a) 1.024 × 10^7 (b) 5.12 × 10^7 (c) 0.1829 (d) 0.8171 (e) The answer cannot be computed from the information given.
Part 2: Free Response Answer completely, but be concise. Write sequentially and show all steps.
A headache remedy is said to be 80% effective in curing headaches caused by simple nervous tension. An investigator tests this remedy on 100 randomly selected patients suffering from nervous tension. 6. Define the random variable being measured. X = What kind of distribution does X have? 7. Calculate the mean and standard deviation of X. 8. Determine the probability that exactly 80 subjects experience headache relief with this remedy. 9. What is the probability that between 75 and 90 (inclusive) of the patients will obtain relief? Justify
your method of solution.

Chapter 8 3 Test 8B
The Ferrells have three children: Jennifer, Jessica, and Jaclyn. If we assume that a couple is equally likely to have a girl or a boy, then how unusual is it for a family like the Ferrells to have three children who are all girls. Let X = number of girls (in a family of three children). 10. Construct a pdf (probability distribution function) table for the variable X. 11. Construct a pdf histogram for X. 12. Construct a cdf (cumulative distribution function) table for X. 13. Construct a cdf histogram for X. 14. What is the probability that a family like the Ferrells would have three children who are all
girls?
Chapter 8 4 Test 8B
A survey conducted by the Harris polling organization discovered that 63% of all Americans are overweight. Suppose that a number of randomly selected Americans are weighed. 15. Find the probability that 18 or more of the 30 students in a particular adult Sunday School class are
overweight. 16. How many Americans would you expect to weigh before you encounter the first overweight
individual? 17. What is the probability that it takes more than 5 attempts before an overweight person is found? 18. Construct the cumulative distribution table (stop at n = 6) for the number of Americans weighed
before an overweight person was found. 19. Sketch a cumulative distribution histogram (stop at
n = 6) for the table you constructed in the previous problem. Don’t forget to label the axes.
I pledge that I have neither given nor received aid on this test. ________________________________
Chapter 9 1 Test 9B
Test 9B A P Statistics Name: Directions: Work on these sheets. Answer completely, but be concise.
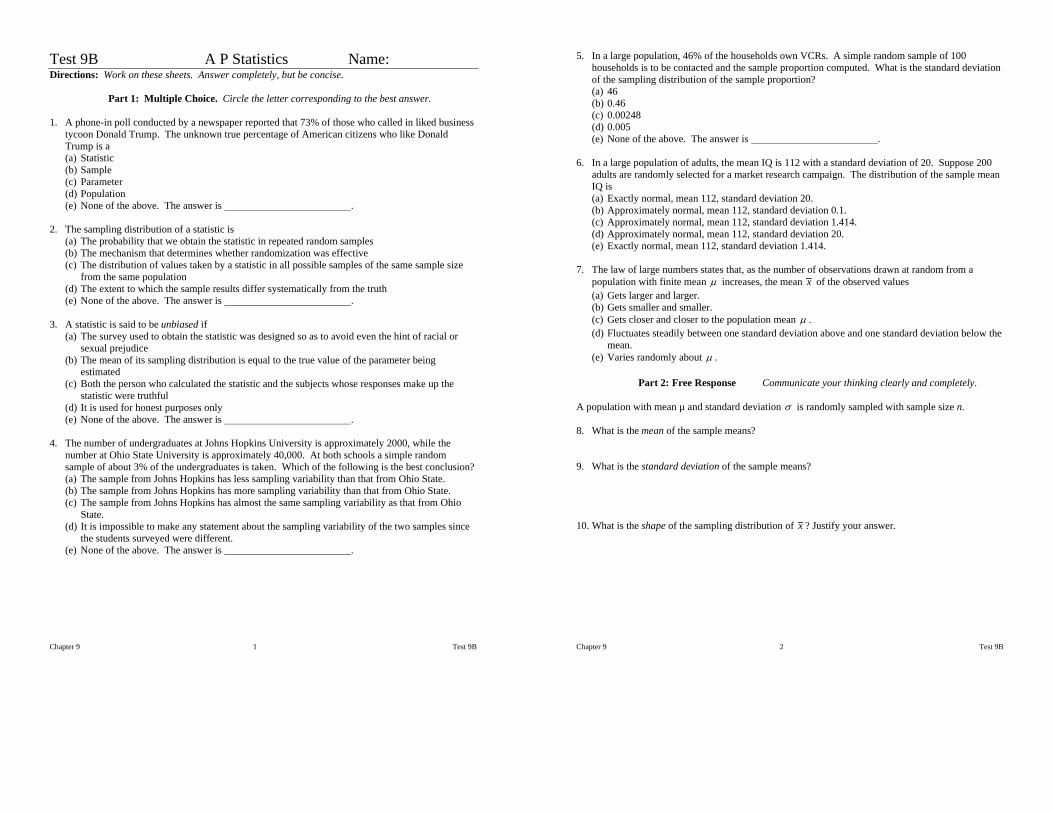
Part 1: Multiple Choice. Circle the letter corresponding to the best answer. 1. A phone-in poll conducted by a newspaper reported that 73% of those who called in liked business
tycoon Donald Trump. The unknown true percentage of American citizens who like Donald Trump is a
(a) Statistic (b) Sample (c) Parameter (d) Population (e) None of the above. The answer is . 2. The sampling distribution of a statistic is (a) The probability that we obtain the statistic in repeated random samples (b) The mechanism that determines whether randomization was effective
(c) The distribution of values taken by a statistic in all possible samples of the same sample size from the same population
(d) The extent to which the sample results differ systematically from the truth (e) None of the above. The answer is . 3. A statistic is said to be unbiased if
(a) The survey used to obtain the statistic was designed so as to avoid even the hint of racial or sexual prejudice
(b) The mean of its sampling distribution is equal to the true value of the parameter being estimated
(c) Both the person who calculated the statistic and the subjects whose responses make up the statistic were truthful
(d) It is used for honest purposes only (e) None of the above. The answer is . 4. The number of undergraduates at Johns Hopkins University is approximately 2000, while the
number at Ohio State University is approximately 40,000. At both schools a simple random sample of about 3% of the undergraduates is taken. Which of the following is the best conclusion?
(a) The sample from Johns Hopkins has less sampling variability than that from Ohio State. (b) The sample from Johns Hopkins has more sampling variability than that from Ohio State. (c) The sample from Johns Hopkins has almost the same sampling variability as that from Ohio
State. (d) It is impossible to make any statement about the sampling variability of the two samples since
the students surveyed were different. (e) None of the above. The answer is .
Chapter 9 2 Test 9B
5. In a large population, 46% of the households own VCRs. A simple random sample of 100 households is to be contacted and the sample proportion computed. What is the standard deviation of the sampling distribution of the sample proportion?
(a) 46 (b) 0.46 (c) 0.00248 (d) 0.005 (e) None of the above. The answer is . 6. In a large population of adults, the mean IQ is 112 with a standard deviation of 20. Suppose 200
adults are randomly selected for a market research campaign. The distribution of the sample mean IQ is (a) Exactly normal, mean 112, standard deviation 20. (b) Approximately normal, mean 112, standard deviation 0.1. (c) Approximately normal, mean 112, standard deviation 1.414. (d) Approximately normal, mean 112, standard deviation 20. (e) Exactly normal, mean 112, standard deviation 1.414.
7. The law of large numbers states that, as the number of observations drawn at random from a
population with finite mean μ increases, the mean x of the observed values (a) Gets larger and larger. (b) Gets smaller and smaller. (c) Gets closer and closer to the population mean μ . (d) Fluctuates steadily between one standard deviation above and one standard deviation below the
mean. (e) Varies randomly about μ .
Part 2: Free Response Communicate your thinking clearly and completely.
A population with mean µ and standard deviation σ is randomly sampled with sample size n. 8. What is the mean of the sample means? 9. What is the standard deviation of the sample means? 10. What is the shape of the sampling distribution of x ? Justify your answer.

Chapter 9 3 Test 9B
An opinion poll asks a sample of 500 adults (an SRS) whether they favor giving parents of school-age children vouchers that can be exchanged for education at any public or private school of their choice. Each school would be paid by the government on the basis of how many vouchers it collected. Suppose that in fact 45% of the population favor this idea. 11. What is the mean of the sampling distribution of p̂ , the proportion of adults in samples of 500 who
favor giving parents of school-age children these vouchers? 12. What is the standard deviation of p̂ ? 13. Explain why you can use the formula for the standard deviation of p̂ in this setting. 14. Check that you can use the normal approximation for the distribution of p̂ . 15. What is the probability that more than half of the sample is in favor? (Sketch required.)
Chapter 9 4 Test 9B
A study of college freshmen’s study habits found that the time (in hours) that college freshmen use to study each week is approximately normally distributed with a mean of 7.2 hours and a standard deviation of 5.3 hours. 16. What is the probability that a randomly chosen freshman studies more than twice the average
number of hours? (Sketch required.) 17. Describe the shape of the sampling distribution of the mean x of a sample of 55 randomly selected
freshmen. 18. What are the mean and standard deviation for the average number of hours x spent studying by an
SRS of 55 freshmen? 19. What is the probability that the average number of hours spent studying of an SRS of 55 students is
greater than 14.2 hours? 20. Would your answers to 16–19 be affected if the distribution of number of hours freshmen study
were distinctly nonnormal? Explain briefly. I pledge that I have neither given nor received aid on this test. _________________________
Chapter 10 1 Test 10B
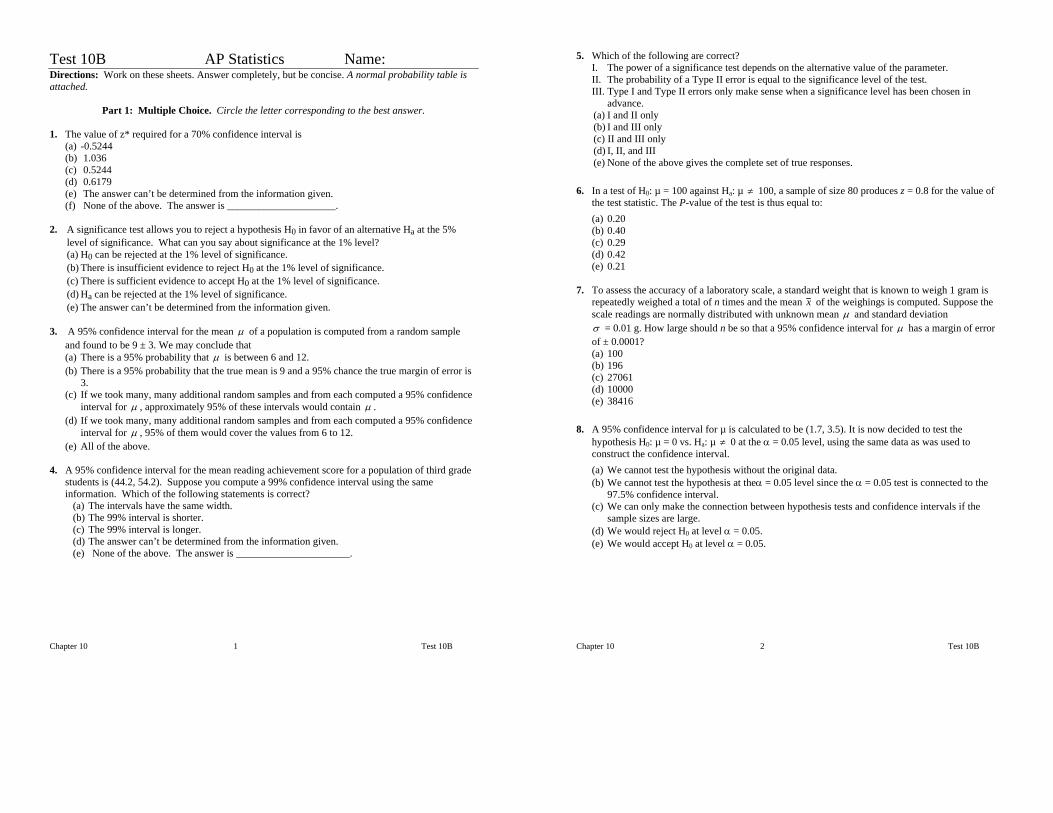
Test 10B AP Statistics Name: Directions: Work on these sheets. Answer completely, but be concise. A normal probability table is attached.
Part 1: Multiple Choice. Circle the letter corresponding to the best answer. 1. The value of z* required for a 70% confidence interval is (a) -0.5244 (b) 1.036 (c) 0.5244 (d) 0.6179 (e) The answer can’t be determined from the information given. (f) None of the above. The answer is _____________________. 2. A significance test allows you to reject a hypothesis H0 in favor of an alternative Ha at the 5%
level of significance. What can you say about significance at the 1% level? (a) H0 can be rejected at the 1% level of significance. (b) There is insufficient evidence to reject H0 at the 1% level of significance. (c) There is sufficient evidence to accept H0 at the 1% level of significance. (d) Ha can be rejected at the 1% level of significance. (e) The answer can’t be determined from the information given. 3. A 95% confidence interval for the mean μ of a population is computed from a random sample
and found to be 9 ± 3. We may conclude that (a) There is a 95% probability that μ is between 6 and 12. (b) There is a 95% probability that the true mean is 9 and a 95% chance the true margin of error is
3. (c) If we took many, many additional random samples and from each computed a 95% confidence
interval for μ , approximately 95% of these intervals would contain μ . (d) If we took many, many additional random samples and from each computed a 95% confidence
interval for μ , 95% of them would cover the values from 6 to 12. (e) All of the above.
4. A 95% confidence interval for the mean reading achievement score for a population of third grade
students is (44.2, 54.2). Suppose you compute a 99% confidence interval using the same information. Which of the following statements is correct?
(a) The intervals have the same width. (b) The 99% interval is shorter. (c) The 99% interval is longer. (d) The answer can’t be determined from the information given.
(e) None of the above. The answer is ______________________.
Chapter 10 2 Test 10B
5. Which of the following are correct? I. The power of a significance test depends on the alternative value of the parameter. II. The probability of a Type II error is equal to the significance level of the test. III. Type I and Type II errors only make sense when a significance level has been chosen in
advance. (a) I and II only (b) I and III only (c) II and III only (d) I, II, and III (e) None of the above gives the complete set of true responses. 6. In a test of H0: µ = 100 against Ha: µ ≠ 100, a sample of size 80 produces z = 0.8 for the value of
the test statistic. The P-value of the test is thus equal to: (a) 0.20 (b) 0.40 (c) 0.29 (d) 0.42 (e) 0.21
7. To assess the accuracy of a laboratory scale, a standard weight that is known to weigh 1 gram is
repeatedly weighed a total of n times and the mean x of the weighings is computed. Suppose the scale readings are normally distributed with unknown mean μ and standard deviation σ = 0.01 g. How large should n be so that a 95% confidence interval for μ has a margin of error of ± 0.0001? (a) 100 (b) 196 (c) 27061 (d) 10000 (e) 38416
8. A 95% confidence interval for µ is calculated to be (1.7, 3.5). It is now decided to test the
hypothesis H0: µ = 0 vs. Ha: µ ≠ 0 at the α = 0.05 level, using the same data as was used to construct the confidence interval. (a) We cannot test the hypothesis without the original data. (b) We cannot test the hypothesis at theα = 0.05 level since the α = 0.05 test is connected to the
97.5% confidence interval. (c) We can only make the connection between hypothesis tests and confidence intervals if the
sample sizes are large. (d) We would reject H0 at level α = 0.05. (e) We would accept H0 at level α = 0.05.
Chapter 10 3 Test 10B
Part 2: Free Response Communicate your thinking clearly and completely.
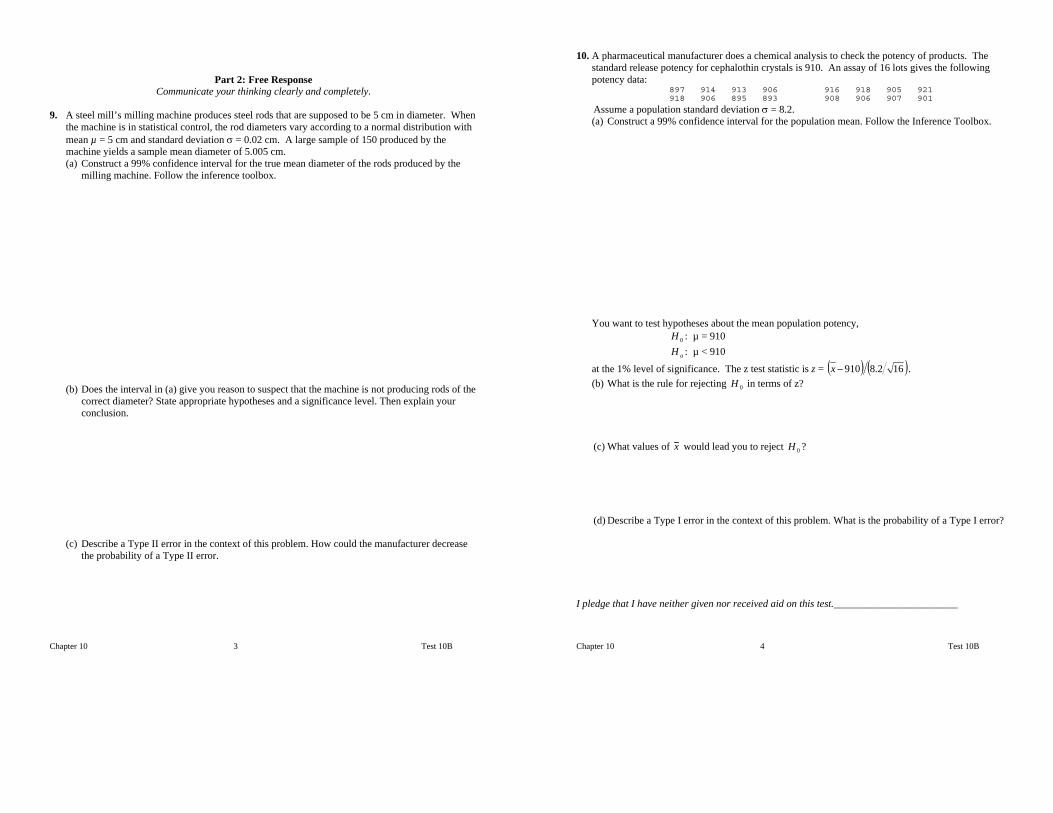
9. A steel mill’s milling machine produces steel rods that are supposed to be 5 cm in diameter. When
the machine is in statistical control, the rod diameters vary according to a normal distribution with mean µ = 5 cm and standard deviation σ = 0.02 cm. A large sample of 150 produced by the machine yields a sample mean diameter of 5.005 cm. (a) Construct a 99% confidence interval for the true mean diameter of the rods produced by the
milling machine. Follow the inference toolbox.
(b) Does the interval in (a) give you reason to suspect that the machine is not producing rods of the correct diameter? State appropriate hypotheses and a significance level. Then explain your conclusion.
(c) Describe a Type II error in the context of this problem. How could the manufacturer decrease the probability of a Type II error.
Chapter 10 4 Test 10B
10. A pharmaceutical manufacturer does a chemical analysis to check the potency of products. The standard release potency for cephalothin crystals is 910. An assay of 16 lots gives the following potency data:
897 914 913 906 916 918 905 921 918 906 895 893 908 906 907 901
Assume a population standard deviation σ = 8.2. (a) Construct a 99% confidence interval for the population mean. Follow the Inference Toolbox.
You want to test hypotheses about the mean population potency, 0H : µ = 910 aH : µ < 910
at the 1% level of significance. The z test statistic is z = ( ) ( )162.8910−x . (b) What is the rule for rejecting 0H in terms of z? (c) What values of x would lead you to reject 0H ? (d) Describe a Type I error in the context of this problem. What is the probability of a Type I error? I pledge that I have neither given nor received aid on this test.________________________

Chapter 11 1 Test 11B
Test 11B AP Statistics Name: Directions: Work on these sheets. Tables and formulas appear on a separate sheet.
Part 1: Multiple Choice. Circle the letter corresponding to the best answer. 1. You want to compute a 90% confidence interval for the mean of a population with unknown
population standard deviation. The sample size is 30. The value of t* you would use for this interval is
(a) 1.96 (b) 1.645 (c) 1.699 (d) .90 (e) 1.311 (f) None of the above 2. A 95% confidence interval for the mean reading achievement score for a population of third-grade
students is (44.2, 54.2). The margin of error of this interval is (a) 95% (b) 5 (c) 2.5 (d) 10 (e) The answer cannot be determined from the information given. 3. The effect of acid rain upon the yield of crops is of concern in many places. In order to determine
baseline yields, a sample of 13 fields was selected, and the yield of barley (g/400m2) was determined. The output from SAS appears below:
QUANTILES(DEF=4) EXTREMES N 13 SUM WGTS 13 100% MAX 392 99% 392 LOW HIGH
MEAN 220.231 SUM 2863 75% Q3 234 95% 392 161 225 STD DEV 58.5721 VAR 3430.69 50% MED 221 90% 330 168 232 SKEW 2.21591 KURT 6.61979 25% Q1 174 10% 163 169 236 USS 671689 CSS 41168.3 0% MIN 161 5% 161 179 239 CV 26.5958 STD MEAN 16.245 1% 161 205 392
A 95% confidence interval for the mean yield is: (a) 220.2 ± 1.96(58.6) (b) 220.2 ± 1.96(16.2) (c) 220.2 ± 2.18(58.6) (d) 220.2 ± 2.18(16.2) (e) 220.2 ± 2.16(16.2)
4. To use the two-sample t procedure to perform a significance test on the difference between two
means, we assume (a) The populations’ standard deviations are known (b) The samples from each population are independent (c) The distributions are exactly normal in each population (d) The sample sizes are large (e) All of the above
Chapter 11 2 Test 11B
5. We wish to test if a new feed increases the mean weight gain compared to an old feed. At the conclusion of the experiment it was found that the new feed gave a 10 kg bigger gain than the old feed. A two-sample t-test with the proper one-sided alternative was done and the resulting P-value was 0.082. This means: (a) There is an 8.2% chance the null hypothesis is true. (b) There was only a 8.2% chance of observing an increase greater than 10 kg (assuming the null
hypothesis was true). (c) There was only an 8.2% chance of observing an increase greater than 10 kg (assuming the null
hypothesis was false). (d) There is an 8.2% chance the alternate hypothesis is true. (e) There is only an 8.2% chance of getting a 10 kg. increase.
6. The water diet requires one to drink two cups of water every half hour from when one gets up until
one goes to bed, but otherwise allows one to eat whatever one likes. Four adult volunteers agree to test the diet. They are weighed prior to beginning the diet and after six weeks on the diet. The weights (in pounds) are
Person 1 2 3 4__ Weight before the diet 180 125 240 150 Weight after six weeks 170 130 215 152
For the population of all adults, assume that the weight loss after six weeks on the diet (weight before beginning the diet – weight after six weeks on the diet) is normally distributed with mean µ. To determine if the diet leads to weight loss, we test the hypotheses
H0:μ = 0, Ha: μ > 0. Based on these data we conclude that (a) We would not reject H0 at significance level 0.10. (b) We would reject H0 at significance level 0.10 but not at 0.05. (c) We would reject H0 at significance level 0.05 but not at 0.01. (d) We would reject H0 at significance level 0.01. (e) The sample size is too small to allow use of the t procedures.

Chapter 11 3 Test 11B
Part 2: Free Response Answer completely, but be concise. Write sequentially and show all steps.
7. The level of dissolved oxygen in a river is an important indicator of the water’s ability to support
aquatic life. You collect water samples at 15 randomly chosen locations along a stream and measure the dissolved oxygen. Here are your results in milligrams per liter:
4.53, 5.04, 3.29, 5.23, 4.13, 5.50, 4.83, 4.40, 5.42, 6.38, 4.01, 4.66, 2.87, 5.73, 5.55 Construct a 95% confidence interval for the mean dissolved oxygen level for this stream. Follow the Inference Toolbox. In a study of the effectiveness of weight-loss programs, 47 subjects who were at least 20% overweight took part in a group support program for 10 weeks. Private weighings determined each subject’s weight at the beginning of the program and 6 months after the program’s end. The matched pairs t test was used to assess the significance of the average weight loss. The paper reporting the study said, “The subjects lost a significant amount of weight over time, t(46) = 4.68, P < 0.01.” 8. Why was the matched-pairs t statistic appropriate? 9. Explain to someone who knows no statistics but is interested in weight-loss programs what the
practical conclusion is.
Chapter 11 4 Test 11B
10. The paper follows the tradition of reporting significance only at fixed levels such as α = 0.01. In fact the results are more significant than “P < 0.01” suggests. What can you say about the P-value of the t test?
A study of iron deficiency among infants compared samples of infants following different feeding regimens. One group contained breast-fed infants, while the children in another group were fed a standard baby formula without any iron supplements. Here are the results on blood hemoglobin levels at 12 months of age. Group n x s ______________________________________________ Breast-fed 23 13.3 1.7 Formula 19 12.4 1.8 11. Is there significant evidence that the mean hemoglobin level is higher among breast-fed babies? Give
appropriate statistical evidence to support your conclusion. 12. Construct a 95% confidence interval for the mean difference in hemoglobin level between the two
populations of infants. Interpret your interval in the context of this problem. I pledge that I have neither given nor received aid on this test. ____________________________
Chapter 12 1 Test 12B
Test 12B AP Statistics Name: Directions: Work on these sheets. Answer completely, but be concise. A normal probability table is attached.
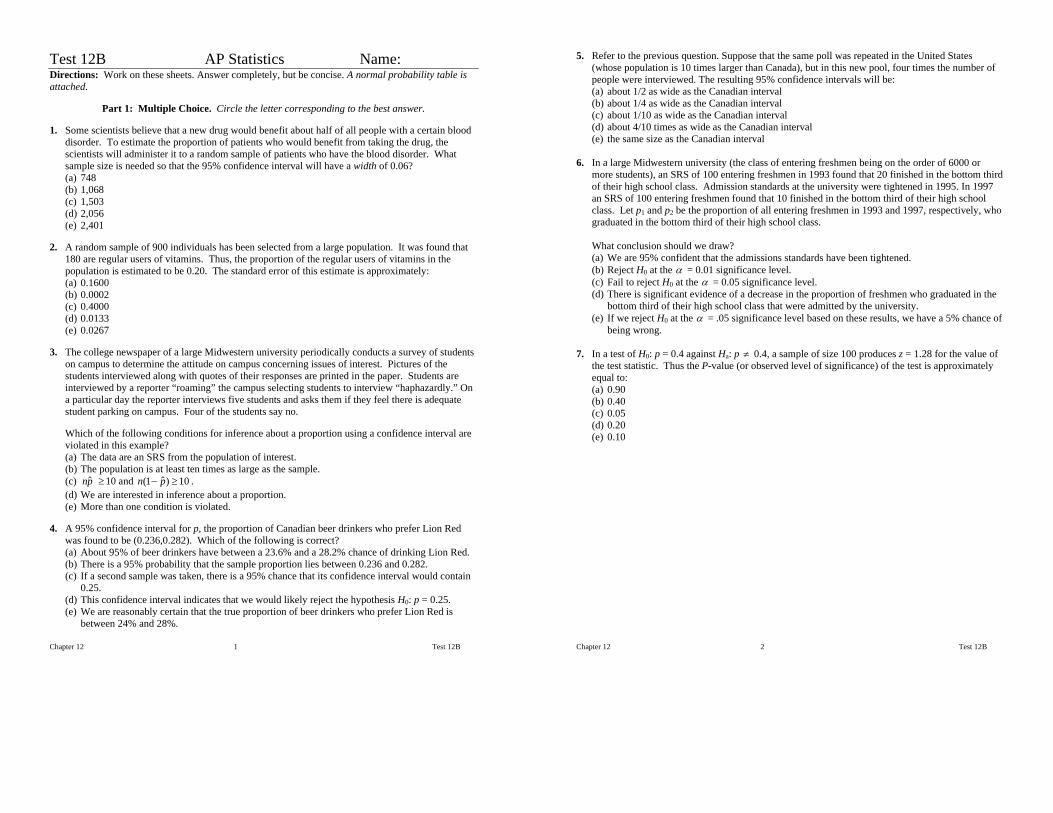
Part 1: Multiple Choice. Circle the letter corresponding to the best answer. 1. Some scientists believe that a new drug would benefit about half of all people with a certain blood
disorder. To estimate the proportion of patients who would benefit from taking the drug, the scientists will administer it to a random sample of patients who have the blood disorder. What sample size is needed so that the 95% confidence interval will have a width of 0.06? (a) 748 (b) 1,068 (c) 1,503 (d) 2,056 (e) 2,401
2. A random sample of 900 individuals has been selected from a large population. It was found that
180 are regular users of vitamins. Thus, the proportion of the regular users of vitamins in the population is estimated to be 0.20. The standard error of this estimate is approximately: (a) 0.1600 (b) 0.0002 (c) 0.4000 (d) 0.0133 (e) 0.0267
3. The college newspaper of a large Midwestern university periodically conducts a survey of students
on campus to determine the attitude on campus concerning issues of interest. Pictures of the students interviewed along with quotes of their responses are printed in the paper. Students are interviewed by a reporter “roaming” the campus selecting students to interview “haphazardly.” On a particular day the reporter interviews five students and asks them if they feel there is adequate student parking on campus. Four of the students say no.
Which of the following conditions for inference about a proportion using a confidence interval are violated in this example? (a) The data are an SRS from the population of interest. (b) The population is at least ten times as large as the sample. (c) pnˆ ≥ 10 and 10)ˆ1( ≥− pn . (d) We are interested in inference about a proportion. (e) More than one condition is violated.
4. A 95% confidence interval for p, the proportion of Canadian beer drinkers who prefer Lion Red
was found to be (0.236,0.282). Which of the following is correct? (a) About 95% of beer drinkers have between a 23.6% and a 28.2% chance of drinking Lion Red. (b) There is a 95% probability that the sample proportion lies between 0.236 and 0.282. (c) If a second sample was taken, there is a 95% chance that its confidence interval would contain
0.25. (d) This confidence interval indicates that we would likely reject the hypothesis H0: p = 0.25. (e) We are reasonably certain that the true proportion of beer drinkers who prefer Lion Red is
between 24% and 28%.
Chapter 12 2 Test 12B
5. Refer to the previous question. Suppose that the same poll was repeated in the United States (whose population is 10 times larger than Canada), but in this new pool, four times the number of people were interviewed. The resulting 95% confidence intervals will be: (a) about 1/2 as wide as the Canadian interval (b) about 1/4 as wide as the Canadian interval (c) about 1/10 as wide as the Canadian interval (d) about 4/10 times as wide as the Canadian interval (e) the same size as the Canadian interval
6. In a large Midwestern university (the class of entering freshmen being on the order of 6000 or
more students), an SRS of 100 entering freshmen in 1993 found that 20 finished in the bottom third of their high school class. Admission standards at the university were tightened in 1995. In 1997 an SRS of 100 entering freshmen found that 10 finished in the bottom third of their high school class. Let p1 and p2 be the proportion of all entering freshmen in 1993 and 1997, respectively, who graduated in the bottom third of their high school class.
What conclusion should we draw? (a) We are 95% confident that the admissions standards have been tightened. (b) Reject H0 at the α = 0.01 significance level. (c) Fail to reject H0 at the α = 0.05 significance level. (d) There is significant evidence of a decrease in the proportion of freshmen who graduated in the
bottom third of their high school class that were admitted by the university. (e) If we reject H0 at the α = .05 significance level based on these results, we have a 5% chance of
being wrong. 7. In a test of H0: p = 0.4 against Ha: p ≠ 0.4, a sample of size 100 produces z = 1.28 for the value of
the test statistic. Thus the P-value (or observed level of significance) of the test is approximately equal to: (a) 0.90 (b) 0.40 (c) 0.05 (d) 0.20 (e) 0.10

Chapter 12 3 Test 12B
Part 2: Free Response Communicate your thinking clearly and completely.
The U.S. Forest Service is considering additional restrictions on the number of vehicles allowed to enter Yellowstone National Park. To assess public reaction, the service asks a random sample of 150 visitors if they favor the proposal. Of these, 89 say “Yes.” 8. Construct and interpret a 99% confidence interval for the proportion of all visitors to Yellowstone
who favor the restrictions. 9. Based on the survey results, can the U.S. Park Service conclude that more than half of all
Yellowstone visitors are in favor of the added restrictions? Carry out an appropriate test.
Chapter 12 4 Test 12B
When the antihistamine Seldane was first introduced, it was heavily promoted because it supposedly didn’t cause drowsiness, unlike other antihistamines. A portion of the prescribing information for the drug is taken from an advertisement: 10. If we let =1p the proportion of all people experiencing drowsiness who take Seldane, and let
=2p the proportion of all people experiencing drowsiness who take the placebo, then determine
1p̂ and 2p̂ . (Caution: 1p̂ is not 0.0115!) 11. State appropriate hypotheses in symbols and words for carrying out a significance test. 12. Verify the necessary conditions for performing inference in this setting. 13. Calculate the test statistic and the P-value. 14. What conclusion would you draw? Explain. I pledge that I have neither given nor received aid on this test. ___________________________
ADVERSE EVENTS REPORTED IN CLINICAL TRIALS Percent of Patients Reporting
Adverse Event Seldane (N = 781) Placebo (N = 665) Drowsiness 9.0 8.1

Chapter 13 1 Test 13B
Test 13B AP Statistics Name: Directions: Work on these sheets. A chi-square table appears at the end of this test.
Part 1: Multiple Choice. Circle the letter corresponding to the best answer. The information in this box is used in questions 1, 2, 3, and 4. All current-carrying wires produce electromagnetic (EM) radiation, including the electrical wiring running into, through, and out of our homes. High-frequency EM radiation is thought to be a cause of cancer; the lower frequencies associated with household current are generally assumed to be harmless. To investigate this, researchers visited the addresses of children in the Denver area who had died of some form of cancer (leukemia, lymphoma, or some other type) and classified the wiring configuration outside the building as either a high-current configuration (HCC) or as a low-current configuration (LCC). Here are some of the results of the study. Leukemia Lymphoma Other Cancers HCC 52 10 17 LCC 84 21 31 The Minitab output for the above table is given below. The output includes the cell counts, the expected cell counts, and the chi-square statistic. Expected counts are printed below observed counts. C1 C2 C3 Total 1 52 10 17 79 49.97 11.39 17.64 2 84 21 31 136 86.03 19.61 30.36 Total 136 31 48 215 ChiSq = 0.082 + 0.170 + 0.023 + 0.048 + 0.099 + 0.013 = 0.435 1. Using the above data, what are the appropriate degrees of freedom for the chi-square statistic?
(a) 6 (b) 2 (c) 3 (d) 5 (e) None of the above 2. Using the above data, what is the P-value for the chi-square statistic?
(a) Larger than 0.10 (b) Between 0.05 and 0.10 (c) Between 0.01 and 0.05 (d) Less than 0.01 (e) It is impossible to tell from the information presented.
Chapter 13 2 Test 13B
3. Using the above data, which cell contributes most to the chi-square statistic? (a) The cases of leukemia that occurred in homes with an HCC (b) The cases of leukemia that occurred in homes with an LCC (c) The cases of other cancers that occurred in homes with an LCC (d) The cases of lymphoma that occurred in homes with an HCC (e) None of the above 4. Using the above data, which of the following is the best conclusion?
(a) There is strong evidence of an association between wiring configuration and the chance a child will develop some form of cancer.
(b) HCC either causes cancer directly or is a major contributing factor to the development of cancer in children.
(c) There is weak evidence that HCC causes cancer in children. (d) There is not much evidence of an association between wiring configuration and the type of
cancer children in the study died of. (e) There is insufficient information provided to reach a conclusion.
Part 2: Free Response
Answer completely, but be concise. Write sequentially and show all steps. 5. The M&M/Mars Company reports that their Peanut Chocolate Candies are produced in the
following distribution: 20 percent each of browns, yellows, reds and blues, and 10 percent each of greens and oranges. Joey bought a bag of Peanut Chocolate Candies and counted out the following distribution of colors: 12 brown, 7 yellow, 4 red, 8 blue, 13 green and 2 orange. Perform a goodness of fit test of the company’s reported distribution and report your results. Don’t forget to do a complete analysis (i.e., include all of the important steps).
Chapter 13 3 Test 13B
Your school administration wants to install new soft drink machines in the gym and cafeteria. Their market analysts want to know if flavor preference depends on the location. A random sample of 180 students was selected and interviewed. Their location and soft drink preference are given in the table. Soft Drink Gym Cafeteria Coca Cola 33 57 Pepsi 30 20 Sprite 5 35 6. Enter the marginal values in the table and the expected counts next to the observed counts. 7. Write null and alternative hypotheses for a chi-square analysis of these data. 8. State and verify conditions for carrying out the inference procedure. 9. Determine the test statistic, the degrees of freedom, and the P-value. 10. State your conclusion(s).
Chapter 13 4 Test 13B
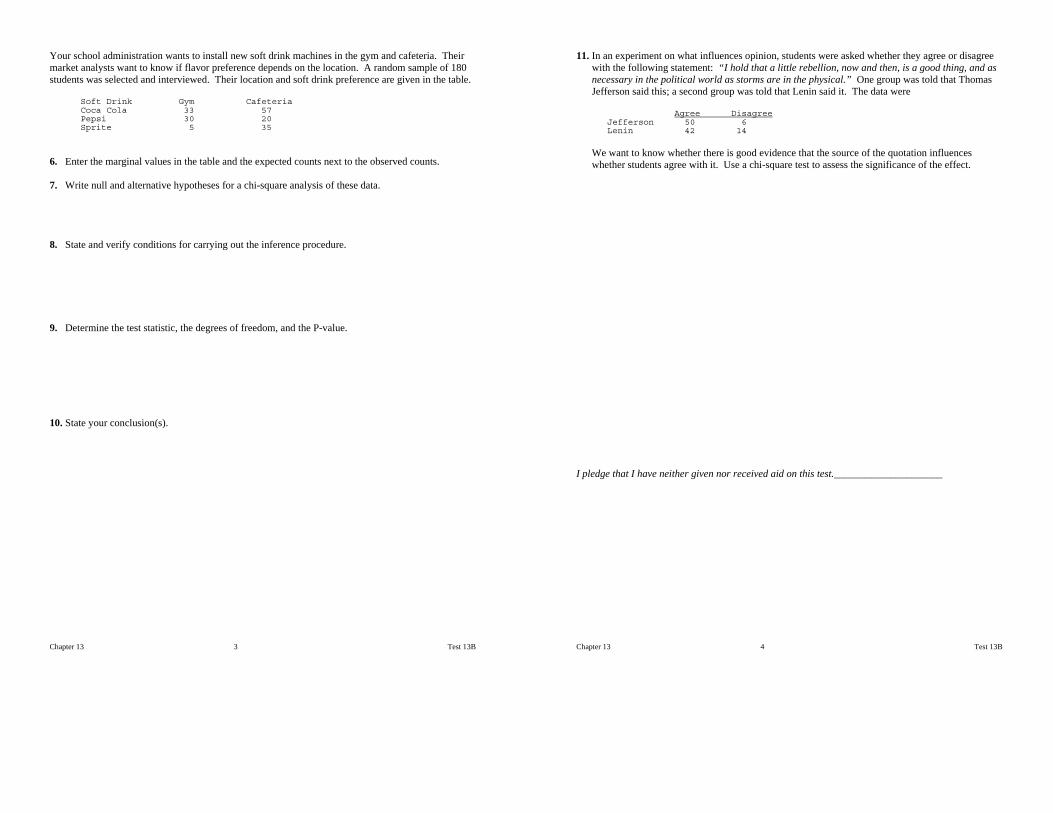
11. In an experiment on what influences opinion, students were asked whether they agree or disagree with the following statement: “I hold that a little rebellion, now and then, is a good thing, and as necessary in the political world as storms are in the physical.” One group was told that Thomas Jefferson said this; a second group was told that Lenin said it. The data were
Agree Disagree Jefferson 50 6 Lenin 42 14
We want to know whether there is good evidence that the source of the quotation influences whether students agree with it. Use a chi-square test to assess the significance of the effect.
I pledge that I have neither given nor received aid on this test._____________________