Anti-Dynamin1 Anti-actin -...
18
Supplementary Figure 1 Insulin Dyn1 Merge Insulin Dyn2 Dyn3 Insulin Merge Merge C Islets Wild type neurons Dyn1,3 KO neurons A Anti-Dynamin1 Anti-actin Islets Dyn2 KO fibroblasts Dyn1,3 KO neurons B Anti-Dynamin1 Anti-actin
Transcript of Anti-Dynamin1 Anti-actin -...

Supplementary Figure 1
Insulin Dyn1 Merge
Insulin
Dyn2
Dyn3
Insulin Merge
Merge
C
Islets Wild type
neurons
Dyn1,3 KO
neurons
A
Anti-Dynamin1
Anti-actin
Islets Dyn2 KO
fibroblasts
Dyn1,3 KO
neurons
B
Anti-Dynamin1
Anti-actin

Supplementary Figure 2
X-Y (top view) Z-Y
X-Z
C
Mid
dle
leve
l
B
ott
om
leve
l Anti-Ins Anti-dyn2 Merge A
B

Con
trol
Dyn2 K
O
Ins Glu Merge
Supplementary Figure 3.
A
B
Supplementary Figure 4
Co
ntr
ol
Insulin Dyn2 Glucagon Merge A
Dyn
2KO
B

Supplementary Figure 5.
A
N
B
N
E Dyn2 KO 20 mM Glucose
Control Dyn2 KO
0 2 4 6 8
10 12 14 16
Gra
nu
le n
um
be
r
( #
/ s
ect
ion
)
Granule distance from the plasma membrane (μm)
Ctrl (n=15)
Dyn2KO_rest (n=10)
C
Control Dyn2 KO
1000 nm
1
2
3
1
2
3
50 nm
D

* #
$
IG MG
MG
IG
M
G
G
G
G
MG IG
M
mature granule
1 2
Lateral view Top views
Level 1
Level 2
x
y z x
y
Immature granule
1 2
Level 1
Level 2
Lateral view Top views
x y
x y z
A
B
C
Supplementary Figure 6.

Supplementary Figure 7.
A
C
B

Supplementary files for “Dynamin 2 regulates biphasic insulin secretion and plasma
glucose homeostasis” by Fan et al.
1. Supplementary Material and methods;
2. Supplementary figure legends
SUPPLEMENTARY MATERIALS AND METHODS
Temporally Controlled And β Cell Specific Gene Deletion In Mice
Pancreatic β cell specific, tamoxifen inducible Dnm2 KO mice were generated using
a Cre-Lox directed gene knockout strategy. We crossed mice carrying floxed sites in the
exon-2 of dynamin 2 gene (Dnm2 f/f) (48) with Tg(Ins1-cre/ERT)1Lpi (also termed MIP1-
CreERT) transgenic mice(49). Dnm2 f/f mice were provided by Dr. Pietro De Camilli (Yale
University). Mouse genotypes were determined by PCR (primers sequence for Dnm2f/f: 5’-
GCA GGA AGA CAC ACA ACT GAA C -3’ and 5’-CCT GCT AGT GAC CTT TCT TGA G-3’;
for MIP1-CreERT: 5'- CCTGGCGATCCCTGAACATGTCCT-3' and 5'-
TGGACTATAAAGCTGGTGGGCAT -3’). Dnm2f/fMIP1-CreER mice and the age-matched
littermate controls (Dnm2f/f) were paired for most experiments if possible, although black-6
mice were also occasionally used in some earlier experiments.
Mice were administrated at an age of 1-3 months with Tamoxifen (0.15 g/kg body
weight dissolved in corn oil as vehicle, injected intraperitoneally, once a day) for 10 days,
and experiments started ~4 weeks after the first tamoxifen treatment. 76-94.3% of β cells
showed efficient dynamin 2 depletion in isolated β cell cultures, depending on the doses
and protocols (data not shown). Dynamin 2 elimination efficiency in pancreatic β cells was
confirmed by both western blotting and pancreatic islet immunofluorescence (Figure 2B-C).
The remaining weak signals in Dnm2 KO samples may arise from the dynamin 2 in non-β
cells in islets (i.e., α cells, Figure 2C) or incomplete dynamin 2 depletion in a small number
of β cells. The Dnm2 null mice appeared normal overall as compared to their littermate
controls. Mice were housed in a temperature and humidity controlled room with standard
light-dark cycle and free access to food (standard chow) and water if not specified.

Glucose Tolerance Tests (GTTs) and Insulin Tolerance Tests (ITTs)
Mice were fasted (single mouse per cage with water supplied) overnight (for ~14
hours, 6:30pm-8:30am) in a quiet procedure room and injected with glucose (i.p., 2 g/kg
body weight). Mouse blood was sampled from the tail vein at 0, 15, 30, 60, and 120
minutes after glucose injection. The plasma glucose levels were measured using a glucose
meter (OneTouch-Ultra2, LifeScan Inc. or TRUEresult, Nipro Diagnostics, Inc.). For insulin
tolerance tests, mice were fasted for ~6 h (9:00am–3:00pm) and intraperitoneally injected
with Novolin R (0.75 units/kg body weight; Novo Nordisk Inc) before sampling tail blood.
Age-matched littermates (Dnm2f/f MIP1-CreER and Dnm2f/f after injections of vehicle with
and without tamoxifen) were used for GTTs as specified in the main text to minimize the
variation in litter background, intrauterine environment, etc. For high fat diet experiments,
mice were fed with the high fat diet (Research Diets Inc, D12331, 58 kcal% fat with sucrose)
starting at an age of ~1 month for 3 months before experiments.
Islet Perifusion and Insulin Secretion Assays
Islet perifusion was performed at 37 oC using a system designed in this laboratory.
Islets were loaded into the micro-chamber (60 µl) and perifused with Krebs-Ringer
bicarbonate buffer (KRBB) (in mM: 120 NaCl, 4.7 KCl, 2.5 CaCl2, 1.2 MgSO4, 25 NaHCO3,
1.2 KH2PO4, 10 HEPES, 2.8 D-Glucose, 0.1% BSA) using 1/32 ID polyethylene tubing
(PE20). The flow rate was controlled by a perfusion pump at 310 µl/min, and the dead
volume of the perifusion system was 600 µl total with a stimulation time delay of 95 s.
Fractions were collected with a fraction collector using a 96-well plate at a flow rate of 310
µl/well/min. Equal number (30-50) and size of isolated islets were closely paired between
control and KO mice in each experiment. Islets were first stabilized for at least 30 minutes
with continuous perfusion of 2.8 mM glucose in KRBB at 37 oC before fraction collection.
Following the establishment of a baseline with perfusion of 2.8 mM glucose (in KRBB) for
10 minutes, 20 mM glucose in KRBB was applied for 30 minutes followed by a return to 2,8
mM glucose for 10 minutes, 30 mM KCl (containing 2.8 mM glucose) was applied for 10
minutes. Insulin levels in fractions were measured using an insulin AlphaLISA assay (101)
(#AL204C, 2 µl scale, PerkinElmer Inc., Waltham, MA) according to the manufacture
instructions. Fraction samples were measured at different interval, with 1 minute per

sample during fast insulin dynamic time windows (Figure 3A-B). Samples were loaded in a
384-well testing plate (proxiPlate-384 white, #6008280, PerkinElmer Inc.) and scanned with
an EnSpire plate reader (680 nm laser excitation and 615 nm emission, PerkinElmer Inc.),
and insulin levels were calculated using standard curves (fitted with the Hill equation)
obtained in each experiment. In area under curve (AUC) analysis, secretion between the
time windows of 10-20 minutes and 20-40 minutes in Figure 3 were calculated as the first
phase and second phase.
Patch-clamp and Cell Membrane Capacitance Measurements
β cells were perfused continuously in a heated chamber (RC-26GLP laminar flow
chamber with PH-1 heating plate, Warner Instruments) under an IX-70 inverted microscope
(Olympus), with temperature maintained at 34-36 oC by a temperature controller (TC344-B,
Warner Instruments). Whole-cell voltage patch-clamp recordings were performed as
previously described (60) using an EPC10-2 amplifier and Patch-master software (HEKA
Electronik, Germany). The pipette resistance was about 3-5 MΩ and access resistance (Rs)
compensation was > 80% during recordings with a holding potential (Vh) of -70 mV. β cells
were identified with fully inactivated sodium channels(60) at Vh of -70 but not -120 mV
(supplementary Figure 7A). Cm measurements were carried out with the Sine-DC technique
via the lock-in extension of Patch-master as described previously (40). The amplitude of
exocytosis (Cm jump) was measured as the difference in Cm before and after depolarization.
Endocytosis was quantified as the Cm decrease at 2 s and 10 s after stimulation.
Endocytosis during the train of pulses was analyzed as described previously (40). The
extracellular solution contained (in mM): 118 NaCl, 20 TEA-Cl, 5.6 KCl, 1.2 MgCl2, 2.6
CaCl2, 10 HEPES, and 5 D-glucose (pH 7.4, ~298 mOsm). The intracellular/pipette solution
consisted of (in mM) 118 Cs-glutamate, 20 TEA-Cl, 10 NaCl, 1 MgCl2, 0.05 CsEGTA, 3 Mg-
ATP, 0.35 GTP, 0.1 cyclic-AMP, and 10 HEPES (pH 7.2 with CsOH, ~295 mOsm). Data
were analyzed with Igor Pro (Wavemetrics).
Western Blotting
Pancreatic islets were homogenized in lysis buffer (1% SDS + 1 mM EDTA + 25 mM
Tris + 15 mM NaCl), loaded on 12-15% gradient SDS-PAGE (~120 islets per well), and

proteins separated by electrophoresis were transferred to a nitrocellulose membrane and
immuno-blotted with the specified primary antibodies: Actin (Millipore, 69100, mouse 1:500),
Tubulin (Santa Cruz, SC8035, mouse, 1:1000), GAPDH (Thermo Fisher Scientific, MA5-
15738, 1:5000), Syntaxin1 (Santa Cruz, 1:1000) and dynamin antibodies (see below). HRP
conjugated secondary antibodies were used for chemiluminescent imaging.
Immunofluorescence Staining
Pancreata were fixed with 4% paraformaldehyde (PFA) + 4% sucrose in 0.12 M
sodium phosphate buffer, embedded in OCT and cut in 8 µM frozen sections. Tissue
sections were permeabilized and blocked with 0.4% TritonX-100+ 3 % bovine serum
albumin+ 2 % goat serum for 1 hour. Heat retrieval was applied before permeabilization if
required. Specimens were incubated with primary antibodies for 2 hours followed by
thorough washing. Fluorescence conjugated secondary antibodies were applied for 50
minutes to visualize staining, counterstained with DAPI (sigma, D8417) if necessary, and
mounted on glass slides with Fluoromount-G (Southern Biotech, 0100-01). Cells grown on
the coverslips were fixed in 2% PFA for 20 minutes, and similarly treated as tissue sections.
Primary antibodies used in this study: Insulin (Abcam ab7842, guinea pig, 1:100), Glucagon
(Abcam, ab10988, mouse, 1:100), Clathrin light chain (Millipore, AB9884, IF 1:500, WB
1:2000), Dynamin 1 (Epitomics, 1851-1, IF 1:100, WB 1:2000), Dynamin 2 (rabbit
polyclonal from PDC lab, IF 1:100, WB 1:500 (39); or Santa Cruz, sc-6400, (C-18), goat
polyclonal IgG, IF 1:100, WB 1:500, cross-react with dynamin 3), Dynamin 3 (mouse
monoclonal from PDC lab, IF1:100, WB 1:1000) (41), pan-dynamin (BD 610246,IF 1:100,
WB 1:2000), proinsulin (GS-9A8, monoclonal IgG1, DSHB, University of Iowa, Iowa city).
Alexa Fluor® 488 Phalloidin (A12379, 300 unite), Alexa Fluor® 647 Phalloidin (A 22287,
300 unite). All the secondary antibodies conjugated with different Alexa Fluorophores were
from LifeTechnology.
Spinning Disk Confocal and TIRF imaging
Fluorescence imaging was performed with a Nikon Ti-E Eclipse inverted
microscope based imaging system under the control of NIS-Elements software. It was
equipped with Ti-ND6-PFS Perfect Focus, motorized nosepiece with multiple objectives

(CFI Plan Fluor 4X, NA 0.13 WD, 17.2 mm; CFI Plan APO Lambda 20X, NA 0.75, WD 1.00
mm; Plan APO VC 60X Oil, NA 1.4, WD 0.13 mm and APO 100X Oil, NA 1.49, WD
0.12mm), a spinning disk (CSU X-1, 10,000 rpm, Yokogawa), Ti-TIRF Motorized
Illuminator Unit, Agilent MLC400 High Power Monolithic Laser Combiner SP with 405, 488,
561 and 642 nm lasers, EMCCD (iXon X3 DU897, Andor) and Neo-sCMOS cameras
(Andor) at the left and the right imaging port of the microscope respectively, 10-position
filter wheels (Sutter), and Lumen 200 Illumination System. Spinning disk confocal imaging
was performed using the left imaging port and TIRF images were taken using the right
imaging port through the 100x objective (NA=1.49) under the critical illumination angle. For
3-D cell imaging, 200~300 nm optical section images were acquired between the top and
the bottom of cells. The z-projections were shown for pro-insulin. Imaging 3-D
reconstruction, fluorescence analysis, and quantification were done using NIS-Elements
(Nikon). Images in each figure were displayed using the same contrast/ brightness scale for
both control and Dnm2 KO cells unless specified.
TIRF images were acquired using the same configurations for paired control and KO
experiments. The insulin granules that were visualized under a narrow TIRF illumination
angle were define as docked granules. This may slightly over estimate docked granules
since TIRFM penetration depth is ~100 nm (or less), but this should not affect our
conclusion since both control and KO were treated in the same way. The granule number
were analyzed using the spot detection function of NIS elements with the same parameter
settings. For Figure 8F, cells were preincubated with 10 nM GLP-1 for 30 minutes, then
stimulated with 20 mM glucose and 10 nM GLP-1 for 1 hour at 37 oC and fixed immediately,
followed with insulin antibody immunostaining for TIRF imaging. For F-actin rescue
experiments, β cell cultures were transfected with dynamin 2 RFP (From Pietro De Camilli)
using Lipofectamine® 2000. Cells were fixed and stained with phalloidin and anti-insulin
antibody after 3 days of expression. Insulin positive cells with and without RFP were
imaged under TIRFM using the same settings.
Live-cell TIRF Imaging of Insulin Granule Fusion In Individual β Cells
We first generated NPY-pHluorin as a new probe by replacing EGFP in NPY-EGFP
plasmid with the pH sensitive pHluorin (Both NPY-EGFP and pHluorin were from Pietro De

Camili). NPY-pHluorin has the advantage of higher signal/noise ratio for fusion events due
to its pH sensitivity, and it is more sensitive to granule fusion events than NPY-EGFP. It
was sometimes hard to distinguish granule release from granule undocking or granule
visiting to the PM when the fluorescence spots disappeared without typical fluorescence
“flashes” when using EGFP. NPY-pHluorin has advantage to avoid this complication since
it showed fluorescence only upon granule fusion, but a trade-off is that it provides no
information on granule dynamics before granule fusion due to its invisibility in the cells.
β cells grown on coverslips were transfected with NPY-pHluorin with Lipofectamine®
2000 (LifeTechnology), live-cell imaging of insulin secretion were performed within 40 hours
after transfection to have reproducible measure of fusion events. After that time, fusion
events induced by 20 mM glucose often rapidly declined somehow. Cells were loaded in a
temperature controlled chamber placed in a heating device (QE-1, Warner Instrument)
under the continuous perfusion of KRBB or 20 mM glucose in KRBB (pH=7.3), the
temperature at the center of the cover glass (#1.5, Warner Instrument) was maintained at
35-37 oC by a two-channel temperature controller (TC344B, Warner Instrument). Cells were
excited by a 488 nm laser and emission fluorescence light was collected through a
BP525/50 filter by the Neo-sCMOS cameras (Andor). TIRFM Images were continuously
acquired at 5 Hz (200 ms exposure) with 2x2 pixel binning unless specified. The fusion
events can be unambiguously identified using the new fluorescence probe which has a
large signal/noise ratio (as shown in Figure 3F), and fusion events were counted and
marked manually. All the events detected between 0-6 minutes and 7-20 minutes during 20
mM glucose perfusion were defined as 1st and 2nd phase, respectively. Vesicle fusion
events were normalized to the individual areas of the cell footprint imaged.
Transferrin Uptake Assay
Cultured β cells were incubated with Alexa Fluor 567 conjugated-transferrin
(Transferrin-AF567, 25 µg/ml, Invitrogen,T23365) in normal culture medium for 10 minutes
(37 oC) after pre-incubation in serum-free DMEM for an hour, then washed with acidic
buffer, and fixed with 2% PFA. Cells were further immunostained with insulin antibody to
identify β cells. Transferrin fluorescent signal was imaged at the middle and bottom of
individual cells with spinning disk confocal microscopy (561 nm laser excitation, 100X, NA

1.49, BP605/70 nm filter). Averaged fluorescence intensity of insulin-positive cells was
measured in NIS-Elements. Normally, data were analyzed from 6-12 cells in each control
and KO group in an individual experiment for a total of 3-5 independent experiments.
Cytosolic Ca2+ Imaging and NADPH imaging
Intracellular Ca2+ ([Ca2+]i) was measured by fura-2 ratiometric fluorescence imaging
as described previously (42). Purified pancreatic islets were loaded with 5 µM Fura-2-
acetoxymethyl ester (TEFLabs, Austin) at 37 oC for 30 minutes in an incubator. Islets were
washed 2 times and placed into a heated imaging chamber (RC-26G laminar flow chamber
with PH-1 heating plate, Warner Instruments) under the Olympus upright microscope (BX-
51), islets were continuously perfused with 2.8 mM Glucose KRBB solution with
temperature maintained at 34 oC with a temperature controller (TC344-B, Warner
Instruments). 12.8 mM glucose and 30 mM KCl were applied through the perfusion solution.
The islets were excited with 350 and 380 nm light sequentially from monochromator (TILL-
Photonics) and fluorescent signals passed through a water immersion lens (20X, 1.0 NA)
and a LP-440 filter and collected with an EMCCD camera (iXon DU885, Andor, 4x4 binning,
5 ms exposure time) at 0.5 Hz. Fluorescence from individual islets was collected, and
[Ca2+]i was calculated from background corrected fluorescence ratios using in vitro
calibration procedures as described previously (102).
NADPH fluorescence imaging was carried out with the same system as the Ca2+
imaging. Islets were perfused with KRBB containing 2.8 mM and 20 mM glucose at 34 oC
and excited at 372 nm at which NADPH reached its maximum in our fluorescence scanning
system (Figure 2G), and images were acquired at 0.5 Hz through an ET525/50 filter
(Chroma). Fluorescence signals from each islet were presented as average fluorescence
intensity after background subtraction.
Electron Microscopy (EM) and EM Tomography
Electron microscopy was carried out as describe previously(40), with minor
modification. Pancreatic islets (cultured overnight in normal medium) were rinsed with PBS,
immersion fixed with 2.5% glutaraldehyde in 0.1 M sodium cacodylate buffer for 2 hours,
washed with PBS and post-fixed in 1% OsO4, 1.5% K4Fe(CN)6, 0.1M sodium cacodylate for

1 hour. Islets were en bloc stained in 0.5% uranyl magnesium acetate for 1 hour after
multiple rinses with PBS (all above steps were at room temperature), dehydrated and
embedded in PolyBed 812. Ultrathin sections (70-90 nm) were cut and placed on Pioloform
coated 2x1 copper slot grids, post-stained with uranyl acetate and Sato’s lead citrate for
further contrast. In order to preserve the fine structures of cellular membranes, En bloc
staining and post uranyl acetate staining were skipped in some experiments, and the
typical insulin granule dense cores were not obvious in these samples. Islets sections were
viewed under a Philips CM120 (or CM10) electron microscope at 80 KV and images were
captured with an SIS MegaView III (or Morada, 2k x 2k) CCD camera (Olympus, Lakewood,
CO). For glucose stimulation, islets were incubated with 20 mM glucose in KRBB for 20
minutes at 37 oC in an incubator before fixation. Electron microscopy reagents were
purchased from Electron Microscopy Sciences (Hatfield, PA).
EM images were quantified in iTEM software (Olympus). Different cell types in islets
were identified according to their abundance and typical granule appearance: β cells
contained numerous granules with electronic dense cores surrounded by white space; α
cells often contained prominent long rough ER and fewer granules; their secretory granules
were spherical, smaller in size, and contained extremely electron dense cores (data not
shown). Insulin granule density was calculated by the total number of dense core granules
in each cell divided by the cell area in the same section (nucleus excluded); Immature
granules were identified by the following criteria: 1) homogeneous, lighter electron density
granules with tight fitting membrane; 2) lack of the characteristic halo of the dense core
granule. Docked granules were defined as the granules directly attached to the plasma
membrane in EM sections (Figure 5). Obviously, this is a lower estimate for docked granule
number in both control and KO β cells since the chance cutting tissue section exactly at the
contact site between a spherical granule and the PM is low. For the spatial distribution of
insulin granules, the shortest distance between each granule membrane and the PM was
measured within 2.5 µm from the PM in each EM section.
For electron tomography, tissue sections (200-250 nm) were imaged in a TECNAI
TF20 transmission electron microscope (FEI, The Netherlands) operated at 200 kV (Yale
Center for Cellular and Molecular Imaging, Yale University) as described previously(43). The

dual tilt series data from each section were collected every 2° over a ± 60° range using a FEI
Eagle 4K × 4K CCD camera, and data from up to 3 consecutive sections were combined.
Subcellular structures within three dimensions were segmented, aligned and modeled with
IMOD Etomo software. For the generation of the final models, contours of membranes were
traced using IMOD software manually.
Statistics
All values were presented as mean ± SEM unless otherwise indicated. Statistic
comparisons for two samples were performed with two-tailed Student’s t test, and one-way
analysis of Variance (ANOVA) with the post-hoc Tukey Honest Significant Differences
(HSD) Tests were used to compare three or more samples. p < 0.05 was taken as a
statistically significant difference, as denoted with asterisks (* p < 0.05, ** p < 0.01, *** p <
0.005).
Study approval
All protocols involving animals in this study were approved by the Institutional Animal
Care and Use Committee of the University of Wisconsin-Madison and followed the NIH
Guide for the Care and Use of Laboratory Animals.

SUPPLEMENTARY FIGURE LEGENDS:
Suppl. Figure 1. Dynamin 1 is undetectable in mouse islet lysate and isolated β cells.
(A) Western blots with rabbit polyclonal anti-dynamin 1 antibody (Cat#1851, Epitomics) with
longer exposure (6 minutes, the same blots as Figure 1a). (B) Western blots with mouse
monoclonal anti-dynamin 1 antibody (Clone 5, PDC lab), also with long exposure time.
Note the dynamin 1 was detected in fibroblasts but not islets. (C) Immunofluorescence of
different dynamin isoforms in isolated β cell cultures. Note the different dynamin isoform
signals in individual insulin positive cells. Arrows indicate non-β cells in the cultures.
Suppl. Figure 2. Subcellular distribution of dynamin 2 in β cells. (A-B) A primary
pancreatic β cell was imaged in the bottom (A) and middle (B) optical sections using
spinning disk confocal microscopy. Note the punctate appearance of endogenous dynamin
2 at the PM vs the relatively diffuse signal in the cytosol. (C) Cross section views of
dynamin 2 distribution in a 3-D reconstructed β cell (300 nm for each optical section). This
was the same cell shown in Figure 1g but imaged at three-dimension. Scale bar 5 µm.
Suppl. Figure 3. Pancreatic islet cellular structure re-organization in Dnm2 KO mice
(A) α cells mainly located in the periphery of islets in control mice. (B) In dnm2 KO mice, α
cells also appeared in the center of islets as indicated by arrows, and they were intermixed
with β cells. Scale Bar: 20 µm.
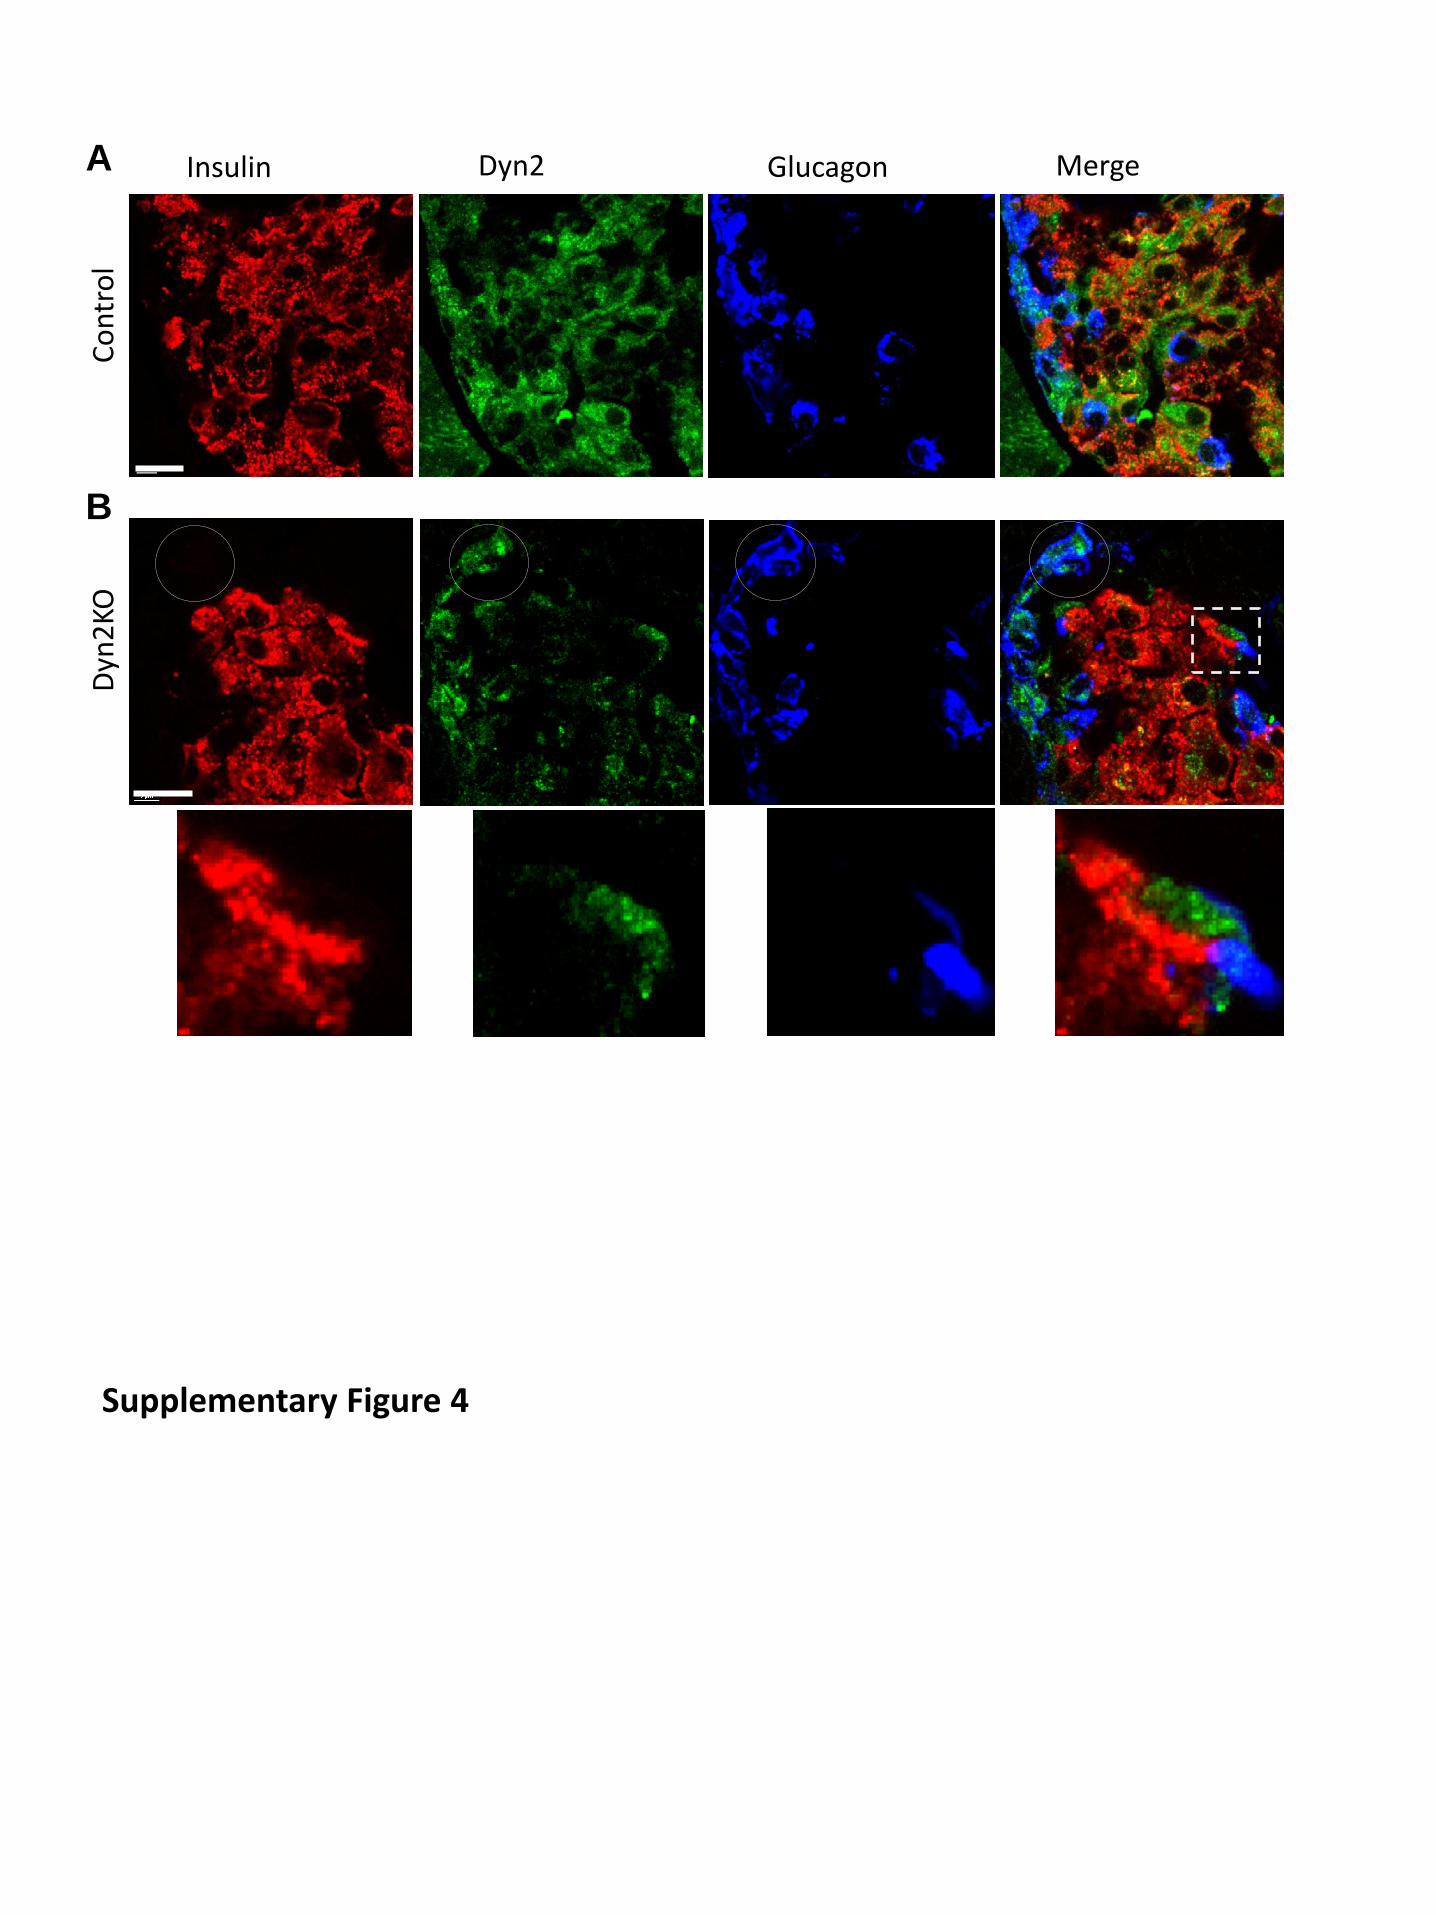
Suppl. Figure 4. Selective dynamin 2 deletion in β cells in pancreatic islets from
conditional Dnm2 KO mice. (A) Triple-color immunofluorescence images of the part of a
control pancreatic islet. Insulin, glucagon, and dynamin 2 were in red, green and blue; 100x
objective. (B) the same as A but from a KO mice. Note dynamin fluorescence largely
disappeared in insulin positive area but not from glucagon positive cells (circle). Insert
Showed a enlarge view of a small area where dynamin 2 signal was not overlapped with
insulin-positive cells. Scale bars: 10 μm.
Suppl. Figure 5. Ultra-structure changes of Dnm2 KO β cells. (A-B) Low magnification
EM images of β cells from control (A) and Dnm2 KO mice (B). The β cell in the center of the
image is labeled with pseudo color; inserts show the enlarged views of boxed regions. Note
the larger, immature granules (see Methods for identification of immature granules) in the

Dnm2 KO β cell (arrows). (C) Spatial distribution of granules in β cells (n=15 cells for
control; n=10 for dyn2 KO). (D) Increased accumulation of endocytic intermediates after 20
mM glucose stimulation for 20 minutes in dyn2 KO cells, the enlarged views of a few
membrane invaginations (arrows) were shown on the right. (E) A gallery of endocytic
intermediates in Dnm2 KO cells. Scale bars: 5 μm in (A-B), 1µm in (d1). 50 nm in (d2)
Suppl. Figure 6. Distinct characteristic structures between immature granules and
mature granules in mouse pancreatic β cells revealed by electron microscopy. (A)
Schematic illustration of different appearance of typical immature granules and mature
granules at different ultrathin section levels. (B) The EM image captured at the Glogi area
of a β cell in dynamin 2 KO islets, where the immature granules and mature granules were
present, granules with different maturation statuses were also visible. G=Golgi,
M=Mitochondrial, MG=Mature granule, IG=Immature granule. (C) the enlarged view of the
boxed region in (B). An immature granule (left) was next to the mature one (right). Note that
the immature granule was filled with lighter electron density which is distinguishable from
those in dense core or the surrounding halo region of the mature granule, as illustrated in
(A).
Suppl. Figure 7. Robust endocytosis in mouse pancreatic β cells under whole-cell
patch-clamp (A) Typical sodium channel inactivation at different membrane holding
potentials in a β cell. Note the sizeable sodium current at -120 mV but not at -70 mV (red
trace). (B) Ca2+ current, Cm, and Gs changes elicited by a short train of depolarizing pulses
(30 ms x 10, 0 mV) shown at high time resolution. (C) Robust and reproducible endocytosis
triggered repeatedly by the train of pulses (arrows) as shown in (B). Note that Cm decays
follow a single exponential function with similar time constants (~5 s), with little change in
Gs trace.


![CYTOSKELETON NEWS - fnkprddata.blob.core.windows.net · Dynamic remodeling of the actin cytoskeleton [i.e., rapid cycling between filamentous actin (F-actin) and monomer actin (G-actin)]](https://static.fdocuments.us/doc/165x107/609edd2b88630103265d18ee/cytoskeleton-news-dynamic-remodeling-of-the-actin-cytoskeleton-ie-rapid-cycling.jpg)