
static-content.springer.com10.1007... · Web viewComparison of minimal Tpm-actin distances between...
15
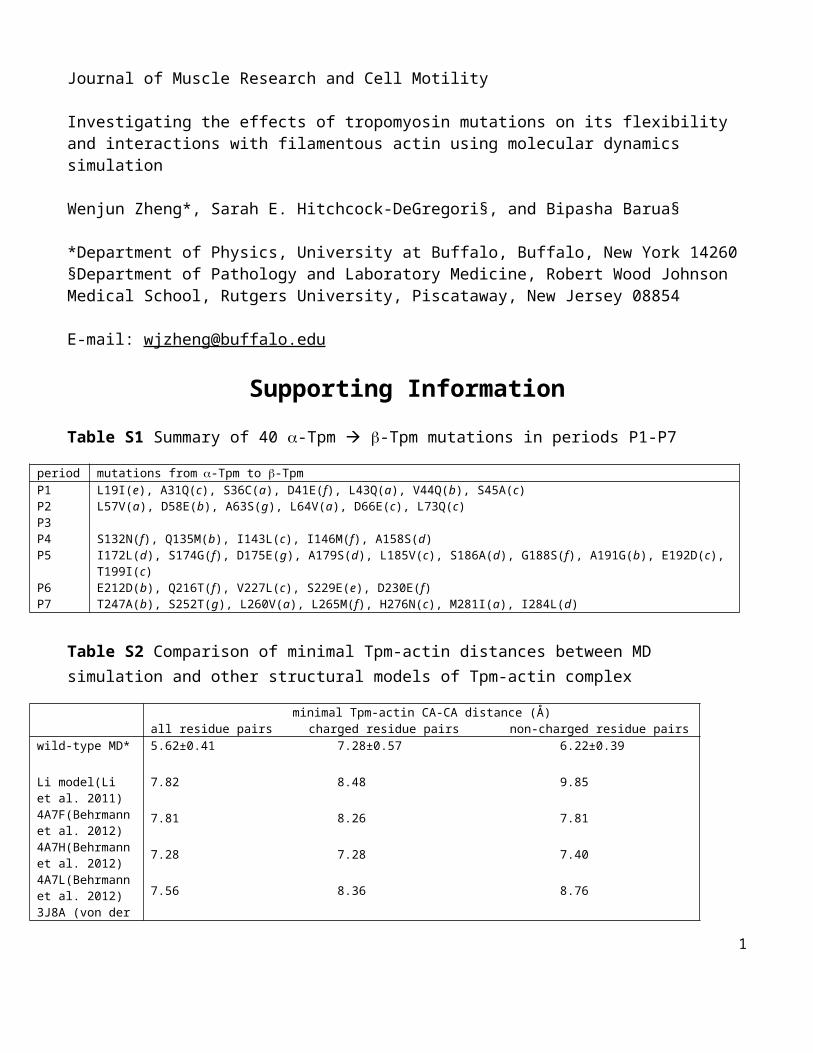
Journal of Muscle Research and Cell Motility Investigating the effects of tropomyosin mutations on its flexibility and interactions with filamentous actin using molecular dynamics simulation Wenjun Zheng*, Sarah E. Hitchcock-DeGregori§, and Bipasha Barua§ *Department of Physics, University at Buffalo, Buffalo, New York 14260 §Department of Pathology and Laboratory Medicine, Robert Wood Johnson Medical School, Rutgers University, Piscataway, New Jersey 08854 E-mail: [email protected] Supporting Information Table S1 Summary of 40 -Tpm -Tpm mutations in periods P1-P7 period mutations from -Tpm to -Tpm P1 P2 P3 P4 P5 P6 P7 L19I(e), A31Q(c), S36C(a), D41E(f), L43Q(a), V44Q(b), S45A(c) L57V(a), D58E(b), A63S(g), L64V(a), D66E(c), L73Q(c) S132N(f), Q135M(b), I143L(c), I146M(f), A158S(d) I172L(d), S174G(f), D175E(g), A179S(d), L185V(c), S186A(d), G188S(f), A191G(b), E192D(c), T199I(c) E212D(b), Q216T(f), V227L(c), S229E(e), D230E(f) T247A(b), S252T(g), L260V(a), L265M(f), H276N(c), M281I(a), I284L(d) Table S2 Comparison of minimal Tpm-actin distances between MD simulation and other structural models of Tpm-actin complex minimal Tpm-actin CA-CA distance (Å) all residue pairs charged residue pairs non-charged residue pairs wild-type MD* Li model(Li et al. 2011) 4A7F(Behrmann et al. 2012) 4A7H(Behrmann et al. 2012) 4A7L(Behrmann et al. 2012) 3J8A (von der 5.62±0.41 7.28±0.57 6.22±0.39 7.82 8.48 9.85 7.81 8.26 7.81 7.28 7.28 7.40 7.56 8.36 8.76 1
Transcript of static-content.springer.com10.1007... · Web viewComparison of minimal Tpm-actin distances between...
Journal of Muscle Research and Cell Motility
Investigating the effects of tropomyosin mutations on its flexibility and interactions with filamentous actin using molecular dynamics simulation
Wenjun Zheng*, Sarah E. Hitchcock-DeGregori§, and Bipasha Barua§
*Department of Physics, University at Buffalo, Buffalo, New York 14260§Department of Pathology and Laboratory Medicine, Robert Wood Johnson Medical School, Rutgers University, Piscataway, New Jersey 08854
E-mail: [email protected]
Supporting InformationTable S1 Summary of 40 -Tpm -Tpm mutations in periods P1-P7
period mutations from-Tpm to -Tpm P1P2P3P4P5
P6P7
L19I(e), A31Q(c), S36C(a), D41E(f), L43Q(a), V44Q(b), S45A(c) L57V(a), D58E(b), A63S(g), L64V(a), D66E(c), L73Q(c)
S132N(f), Q135M(b), I143L(c), I146M(f), A158S(d)I172L(d), S174G(f), D175E(g), A179S(d), L185V(c), S186A(d), G188S(f), A191G(b), E192D(c), T199I(c)E212D(b), Q216T(f), V227L(c), S229E(e), D230E(f)T247A(b), S252T(g), L260V(a), L265M(f), H276N(c), M281I(a), I284L(d)
Table S2 Comparison of minimal Tpm-actin distances between MD simulation and other structural models of Tpm-actin complex
minimal Tpm-actin CA-CA distance (Å)all residue pairs charged residue pairs non-charged residue pairs
wild-type MD*
Li model(Li et al. 2011)4A7F(Behrmann et al. 2012)4A7H(Behrmann et al. 2012)4A7L(Behrmann et al. 2012)3J8A (von der Ecken et al. 2015) 3J4K (Sousa et al. 2013)
5.62±0.41 7.28±0.57 6.22±0.39
7.82 8.48 9.85
7.81 8.26 7.81
7.28 7.28 7.40
7.56 8.36 8.76
8.31
7.09
*averaged over five actin subunits (AC07, AC09, AC11, AC13 and AC15, see Fig 1a) grep calc_mindis2ac out_tmac_1 | awk -f awkfile_avg_std
1

Table S3 Radial distance of Tpm from the F-actin axis
radial distance* (Å)average minimum maximum
wild-type MD
Li model(Li et al. 2011)
41.84±0.68 32.85±0.82 53.87±3.60
44.47 36.89 51.81
*assessed by the average, minimum, or maximum of distances between all Tpm residues and the F-actin axis
Table S4 Fitting of Tpm-actin binding data to reparameterize and
mutant Kd ratio between mutant and WT target Gmutant-GWT
(kcal/mol)fitted Gmutant-GWT with G=EvdW+Eelec * (=0.08, =0.12) (kcal/mol)
L185R D137L
D175N
E180G
E54K
0.62 (Gupte et al. 2015)no effect (Matyushenko et al. 2015; Sumida et al. 2008)2.83 (Kremneva et al. 2004)1.26 (Golitsina et al. 1997)2.6 (Janco et al. 2012)3.78 (Kremneva et al. 2004) 2.62 (Golitsina et al. 1997) 2.1 (Janco et al. 2012)3.52 (Mirza et al. 2007)
-0.3 0.0 0.5
0.6
0.8
-0.1 0.0 0.3
0.6
0.9dG fitting of alpha and beta (dg_tmac.c) -> a.out
* Further adding flexibility parameters (such as or persistent length) into G does not improve the fitting, which supports our choice to ignore entropy in the calculation.
2
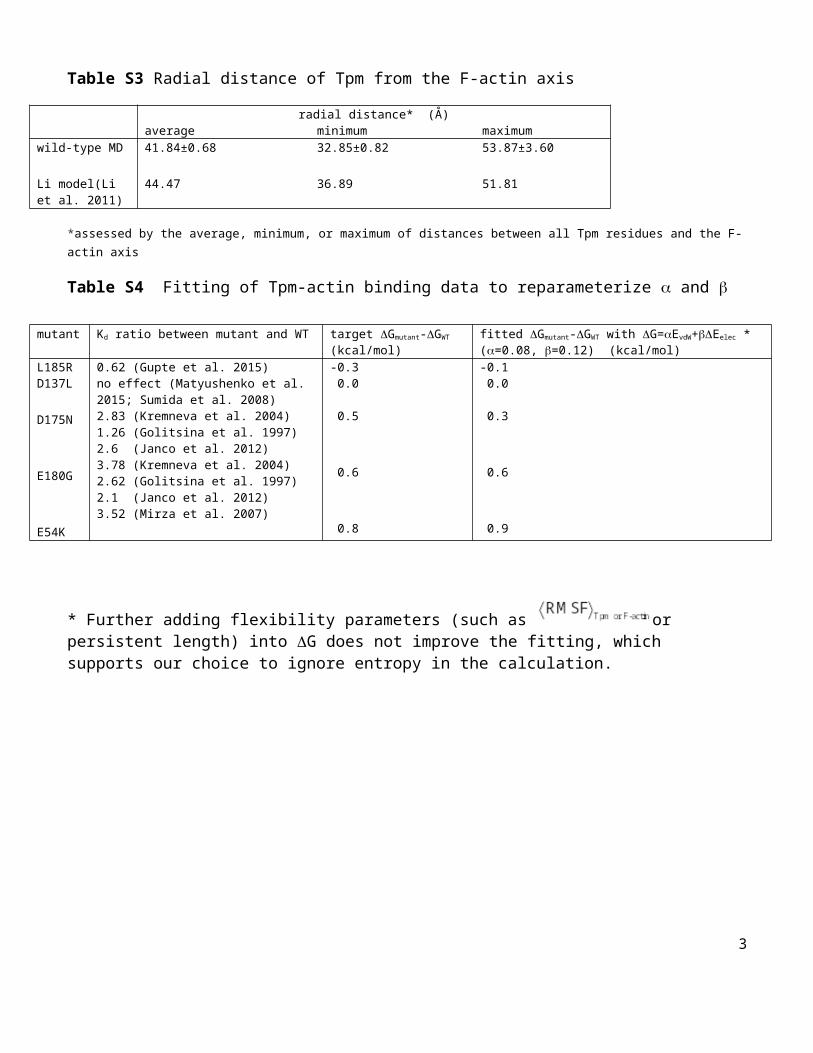
Figure S1. Results of local flexibility analysis of the E62Q mutant in comparison with the wild-type Tpm
using the following parameters: (a) , (b) , (c) , (d) AS, (e) diameter. The average (AVE) and standard deviation (SD) of the above parameters as a function of a/d residue positions of Tpm are shown as points (colored blue for the wild type and red for the mutant). The data points for AVE (SD) are shown in the upper (lower) half of each panel. The green vertical lines mark the center positions of six Ala clusters (A22, A78, A120, A155, A183, and A239). The black dashes give the SD differences between the wild type and the mutant Tpm. Regions with pronounced SD differences are marked by arrows (e.g., near ALA1, ALA5, ALA6, and E218).
3
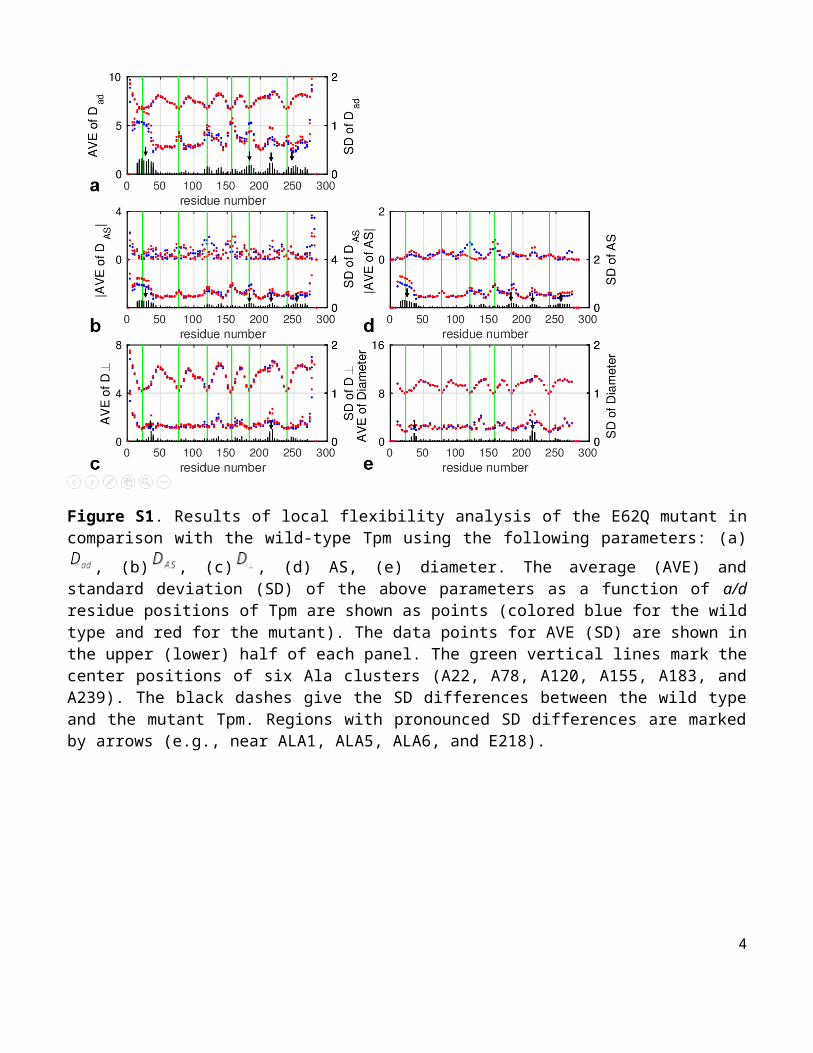
Figure S2. Results of local flexibility analysis of the A63V mutant in comparison with the wild-type Tpm
using the following parameters: (a) , (b) , (c) , (d) AS, (e) diameter. The average (AVE) and standard deviation (SD) of the above parameters as a function of a/d residue positions of Tpm are shown as points (colored blue for the wild type and red for the mutant). The data points for AVE (SD) are shown in the upper (lower) half of each panel. The green vertical lines mark the center positions of six Ala clusters (A22, A78, A120, A155, A183, and A239). The black dashes give the SD differences between the wild type and the mutant Tpm. Regions with pronounced SD differences are marked by arrows (e.g., near ALA1, ALA3, ALA4, ALA6, and E218).
4

Figure S3. Results of local flexibility analysis of the K70T mutant in comparison with the wild-type Tpm
using the following parameters: (a) , (b) , (c) , (d) AS, (e) diameter. The average (AVE) and standard deviation (SD) of the above parameters as a function of a/d residue positions of Tpm are shown as points (colored blue for the wild type and red for the mutant). The data points for AVE (SD) are shown in the upper (lower) half of each panel. The green vertical lines mark the center positions of six Ala clusters (A22, A78, A120, A155, A183, and A239). The black dashes give the SD differences between the wild type and the mutant Tpm. Regions with pronounced SD differences are marked by arrows (e.g., near ALA1, ALA3, ALA5, and E218).
5
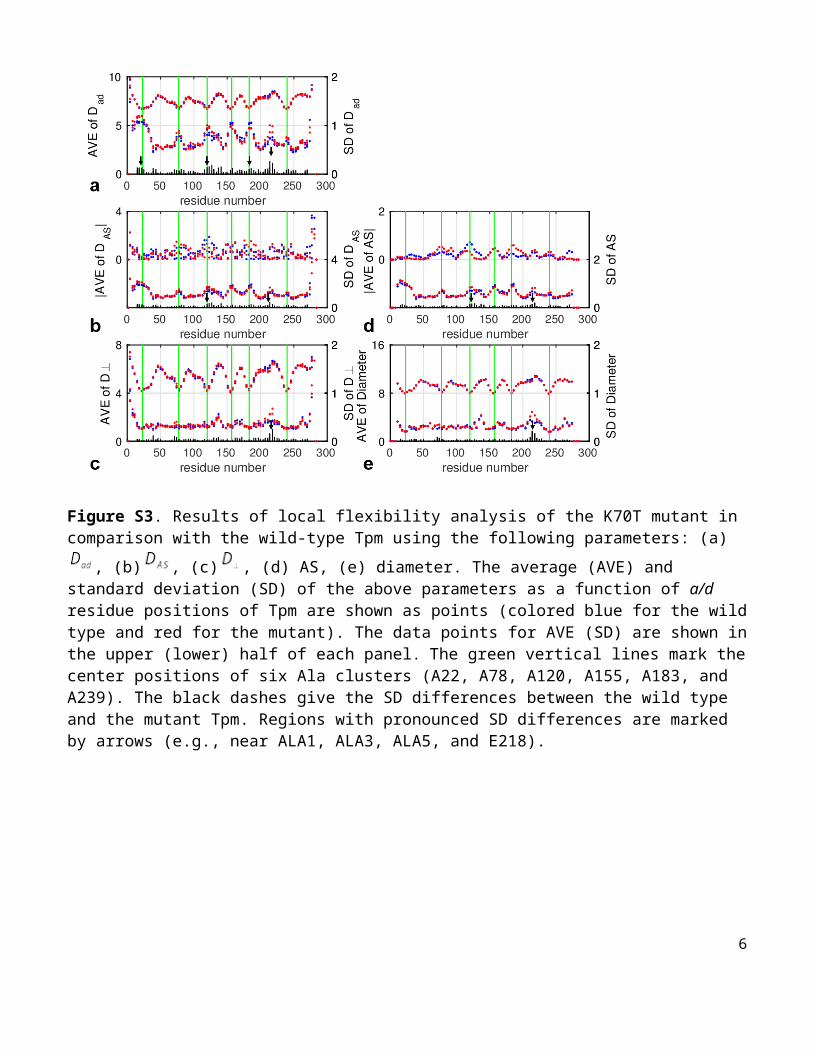
Figure S4. Results of local flexibility analysis of the V95A mutant in comparison with the wild-type Tpm
using the following parameters: (a) , (b) , (c) , (d) AS, (e) diameter. The average (AVE) and standard deviation (SD) of the above parameters as a function of a/d residue positions of Tpm are shown as points (colored blue for the wild type and red for the mutant). The data points for AVE (SD) are shown in the upper (lower) half of each panel. The green vertical lines mark the center positions of six Ala clusters (A22, A78, A120, A155, A183, and A239). The black dashes give the SD differences between the wild type and the mutant Tpm. Regions with pronounced SD differences are marked by arrows (e.g., near ALA2, ALA4, and ALA5).
6
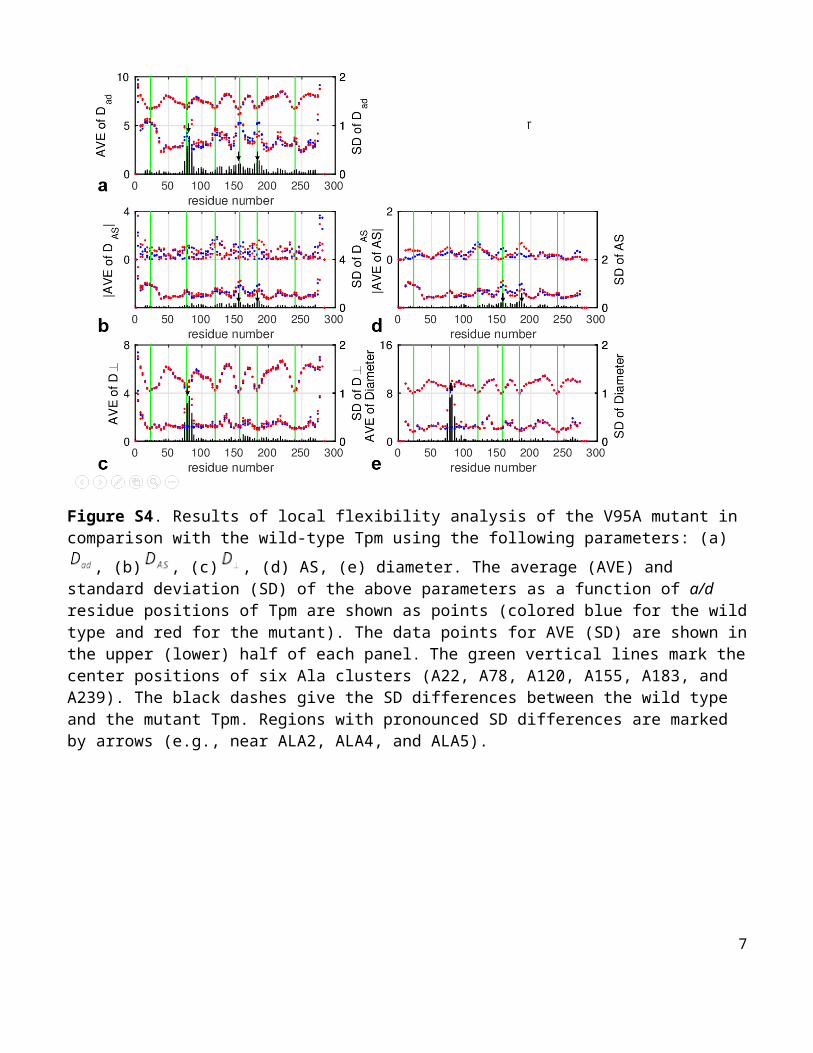
Figure S5. Results of local flexibility analysis of the D137L mutant in comparison with the wild-type
Tpm using the following parameters: (a) , (b) , (c) , (d) AS, (e) diameter. The average (AVE) and standard deviation (SD) of the above parameters as a function of a/d residue positions of Tpm are shown as points (colored blue for the wild type and red for the mutant). The data points for AVE (SD) are shown in the upper (lower) half of each panel. The green vertical lines mark the center positions of six Ala clusters (A22, A78, A120, A155, A183, and A239). The black dashes give the SD differences between the wild type and the mutant Tpm. Regions with pronounced SD differences are marked by arrows (e.g., near ALA1, ALA2, D137, ALA5, and E218).
7
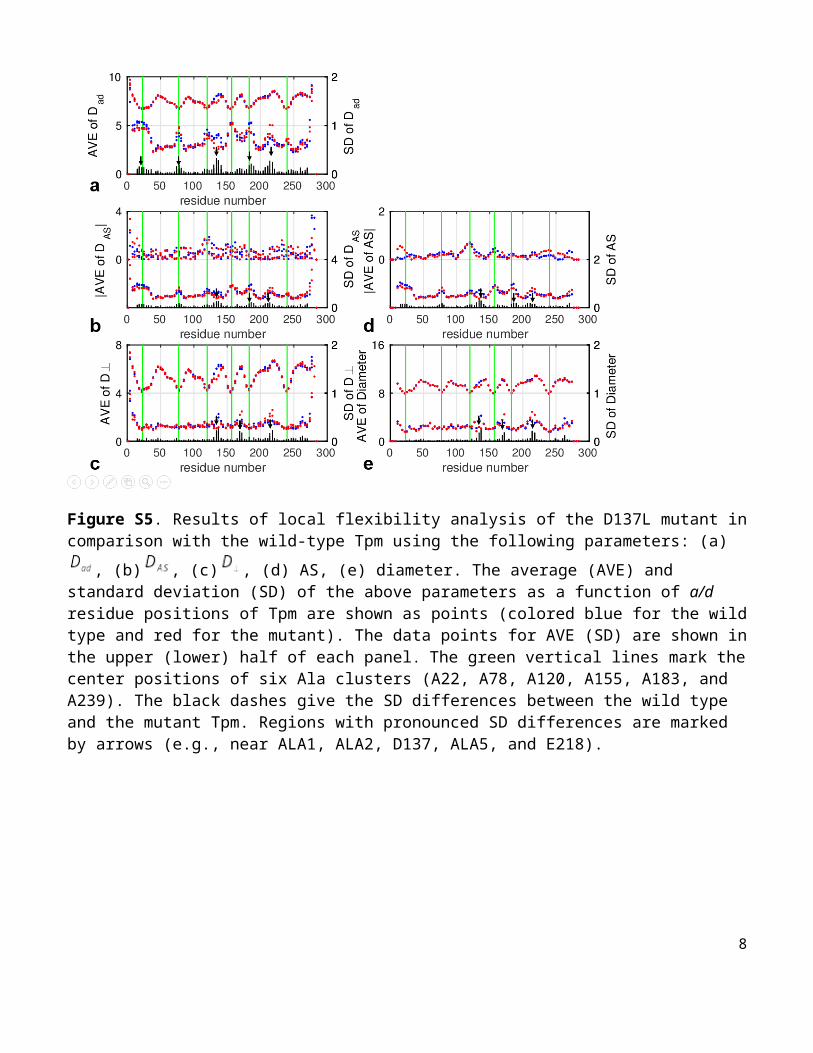
Figure S6. Results of local flexibility analysis of the E54R mutant in comparison with the WT Tpm using
the following parameters: (a) , (b) , (c) , (d) AS, (e) diameter. The average (AVE) and standard deviation (SD) of the above parameters as a function of a/d residue position of Tpm are shown as points in the upper and lower half of each panel, respectively (colored blue for the WT and red for the mutant). The data points for AVE (SD) are shown in the upper (lower) half of each panel. The green vertical lines mark the center positions of six Ala clusters ALA1-ALA6 (A22, A78, A120, A155, A183, and A239). The black dashes give the SD differences between the WT and the mutant Tpm. Regions with pronounced SD differences are marked by arrows (e.g., near D137, E218, and ALA5 in P5).
8
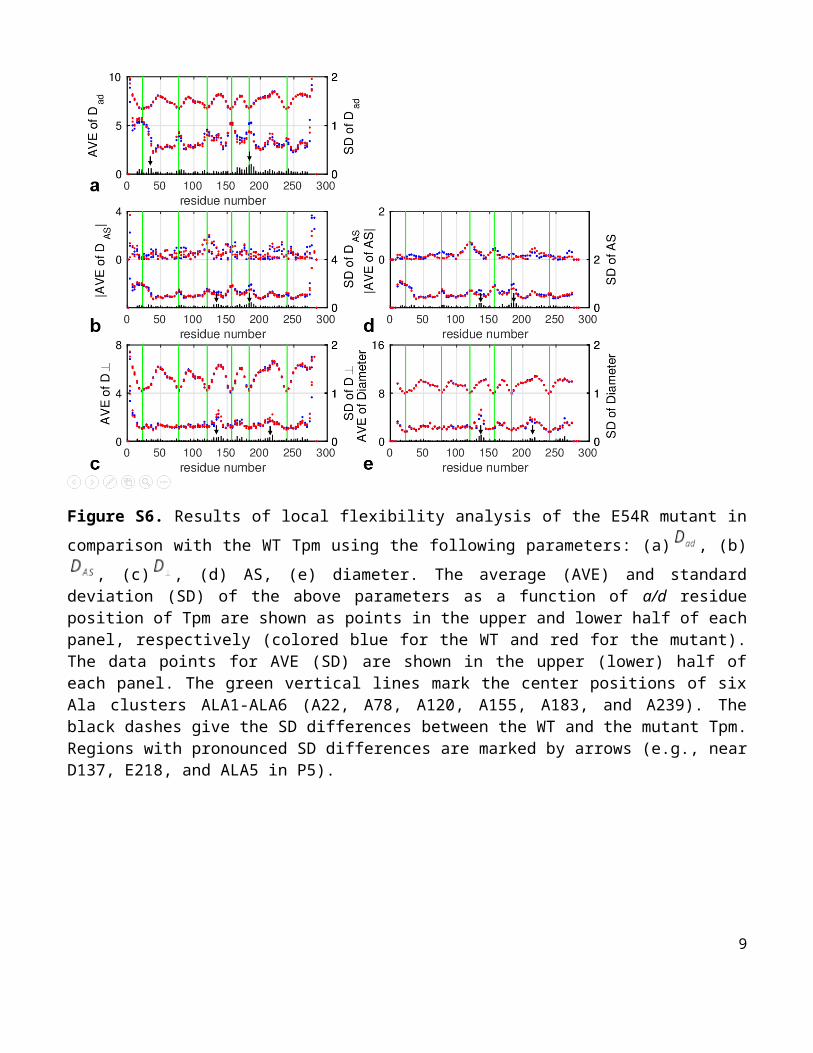
Figure S7. Results of local flexibility analysis of the E180G mutant in comparison with the wild-type
Tpm using the following parameters: (a) , (b) , (c) , (d) AS, (e) diameter. The average (AVE) and standard deviation (SD) of the above parameters as a function of a/d residue positions of Tpm are shown as points (colored blue for the wild type and red for the mutant). The data points for AVE (SD) are shown in the upper (lower) half of each panel. The green vertical lines mark the center positions of six Ala clusters (A22, A78, A120, A155, A183, and A239). The black dashes give the SD differences between the wild type and the mutant Tpm. Regions with pronounced SD differences are marked by arrows (e.g., near D137, ALA5, and E218).
9
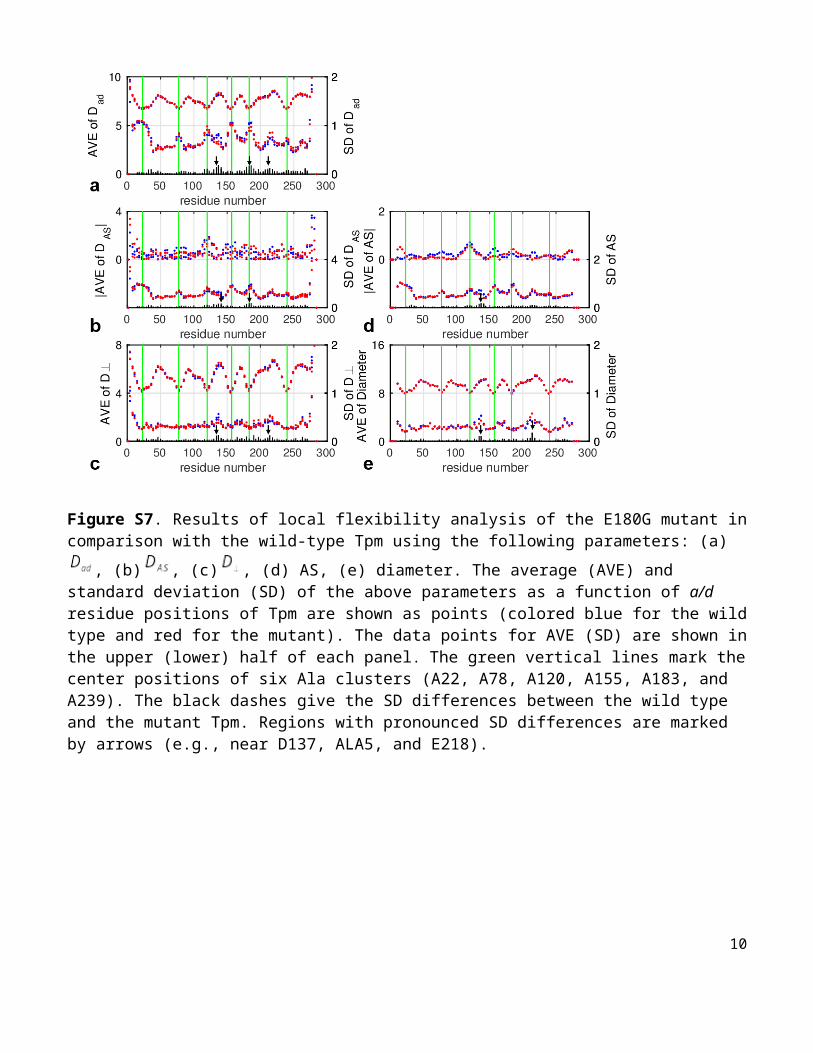
Figure S8. Results of local flexibility analysis of the L185R mutant in comparison with the wild-type
Tpm using the following parameters: (a) , (b) , (c) , (d) AS, (e) diameter. The average (AVE) and standard deviation (SD) of the above parameters as a function of a/d residue positions of Tpm are shown as points (colored blue for the wild type and red for the mutant). The data points for AVE (SD) are shown in the upper (lower) half of each panel. The green vertical lines mark the center positions of six Ala clusters (A22, A78, A120, A155, A183, and A239). The black dashes give the SD differences between the wild type and the mutant Tpm. Regions with pronounced SD differences are marked by arrows (e.g., near ALA1, ALA5, and E218).
10
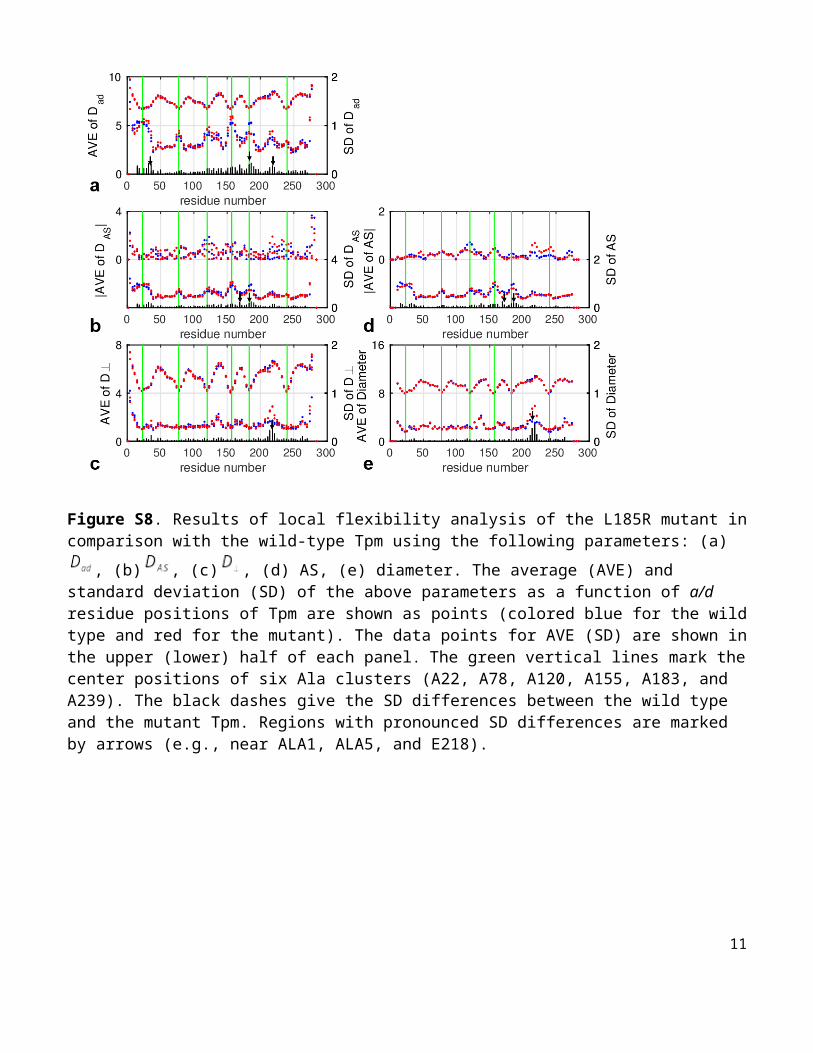
Figure S9. Results of local flexibility analysis of the E192K mutant in comparison with the wild-type
Tpm using the following parameters: (a) , (b) , (c) , (d) AS, (e) diameter. The average (AVE) and standard deviation (SD) of the above parameters as a function of a/d residue positions of Tpm are shown as points (colored blue for the wild type and red for the mutant). The data points for AVE (SD) are shown in the upper (lower) half of each panel. The green vertical lines mark the center positions of six Ala clusters (A22, A78, A120, A155, A183, and A239). The black dashes give the SD differences between the wild type and the mutant Tpm. Regions with pronounced SD differences are marked by arrows (e.g., near ALA1, ALA2, ALA3, ALA4, and E218).
11
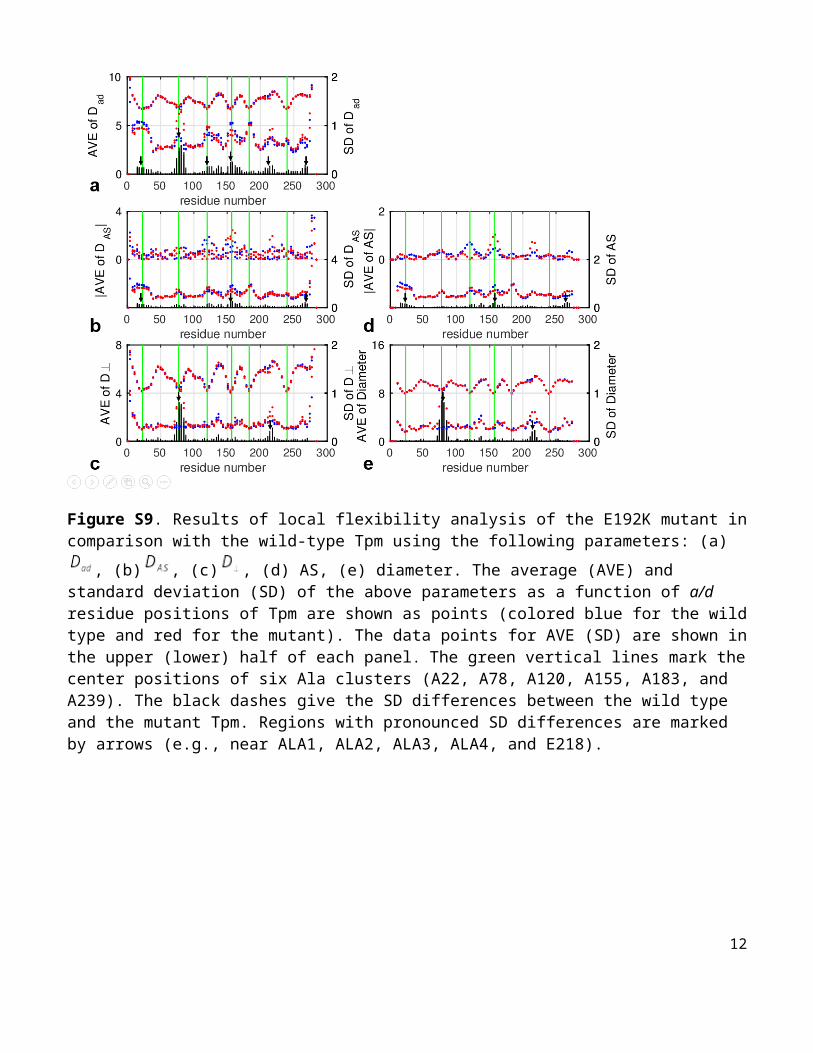
Figure S10. Results of local flexibility analysis of the -Tpm in comparison with the -Tpm using the
following parameters: (a) , (b) , (c) , (d) AS, (e) diameter. The average (AVE) and standard deviation (SD) of the above parameters as a function of a/d residue positions of Tpm are shown as points (colored blue for -Tpm and red for -Tpm). The data points for AVE (SD) are shown in the upper (lower) half of each panel. The green vertical lines mark the center positions of six Ala clusters (A22, A78, A120, A155, A183, and A239). The black dashes give the SD differences between -Tpm and -Tpm. Regions with pronounced SD differences are marked by arrows (e.g., near ALA1, ALA3, ALA4, ALA5, and E218).
12
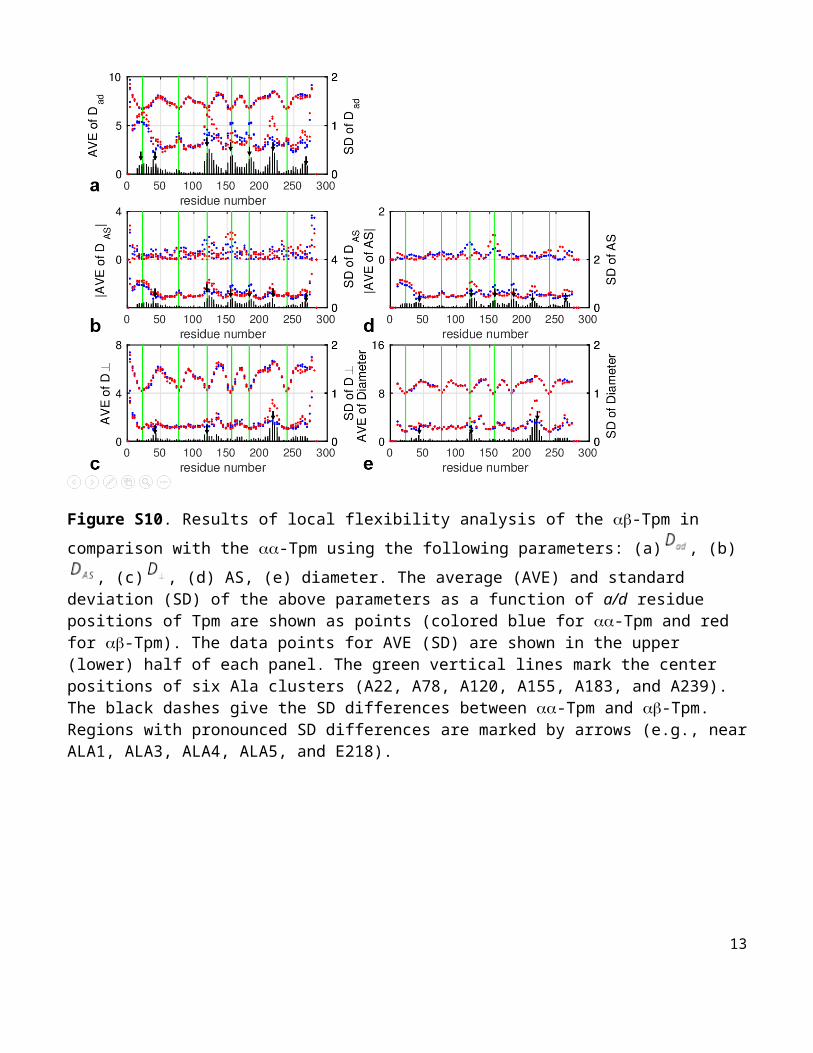
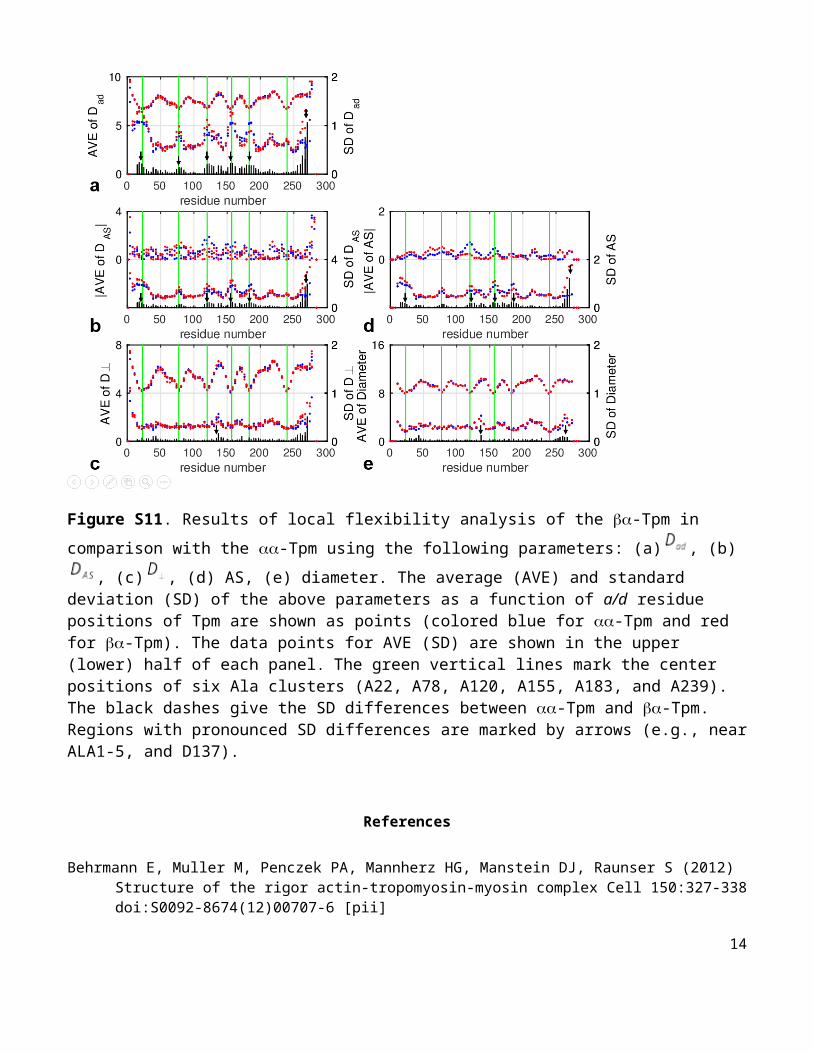
Figure S11. Results of local flexibility analysis of the -Tpm in comparison with the -Tpm using the
following parameters: (a) , (b) , (c) , (d) AS, (e) diameter. The average (AVE) and standard deviation (SD) of the above parameters as a function of a/d residue positions of Tpm are shown as points (colored blue for -Tpm and red for -Tpm). The data points for AVE (SD) are shown in the upper (lower) half of each panel. The green vertical lines mark the center positions of six Ala clusters (A22, A78, A120, A155, A183, and A239). The black dashes give the SD differences between -Tpm and -Tpm. Regions with pronounced SD differences are marked by arrows (e.g., near ALA1-5, and D137).
References
Behrmann E, Muller M, Penczek PA, Mannherz HG, Manstein DJ, Raunser S (2012) Structure of the rigor actin-tropomyosin-myosin complex Cell 150:327-338 doi:S0092-8674(12)00707-6 [pii]
10.1016/j.cell.2012.05.037Golitsina N et al. (1997) Effects of two familial hypertrophic cardiomyopathy-causing mutations on alpha-
tropomyosin structure and function Biochemistry 36:4637-4642 doi:10.1021/bi962970yGupte TM et al. (2015) Mechanistic heterogeneity in contractile properties of alpha-tropomyosin (TPM1) mutants
associated with inherited cardiomyopathies J Biol Chem 290:7003-7015 doi:10.1074/jbc.M114.596676Janco M, Kalyva A, Scellini B, Piroddi N, Tesi C, Poggesi C, Geeves MA (2012) alpha-Tropomyosin with a
D175N or E180G mutation in only one chain differs from tropomyosin with mutations in both chains Biochemistry 51:9880-9890 doi:10.1021/bi301323n
13
Kremneva E, Boussouf S, Nikolaeva O, Maytum R, Geeves MA, Levitsky DI (2004) Effects of two familial hypertrophic cardiomyopathy mutations in alpha-tropomyosin, Asp175Asn and Glu180Gly, on the thermal unfolding of actin-bound tropomyosin Biophys J 87:3922-3933 doi:10.1529/biophysj.104.048793
Li XE, Tobacman LS, Mun JY, Craig R, Fischer S, Lehman W (2011) Tropomyosin position on F-actin revealed by EM reconstruction and computational chemistry Biophysical Journal 100:1005-1013 doi:S0006-3495(10)05213-6 [pii]
10.1016/j.bpj.2010.12.3697Matyushenko AM, Artemova NV, Sluchanko NN, Levitsky DI (2015) Effects of two stabilizing substitutions,
D137L and G126R, in the middle part of alpha-tropomyosin on the domain structure of its molecule Biophysical chemistry 196:77-85 doi:10.1016/j.bpc.2014.10.001
Mirza M et al. (2007) The effect of mutations in alpha-tropomyosin (E40K and E54K) that cause familial dilated cardiomyopathy on the regulatory mechanism of cardiac muscle thin filaments J Biol Chem 282:13487-13497 doi:10.1074/jbc.M701071200
Sousa DR, Stagg SM, Stroupe ME (2013) Cryo-EM structures of the actin:tropomyosin filament reveal the mechanism for the transition from C- to M-state J Mol Biol 425:4544-4555 doi:10.1016/j.jmb.2013.08.020
Sumida JP, Wu E, Lehrer SS (2008) Conserved Asp-137 imparts flexibility to tropomyosin and affects function J Biol Chem 283:6728-6734 doi:M707485200 [pii]
10.1074/jbc.M707485200von der Ecken J, Muller M, Lehman W, Manstein DJ, Penczek PA, Raunser S (2015) Structure of the F-actin-
tropomyosin complex Nature 519:114-117 doi:10.1038/nature14033
14


![Review Actin-targeting natural products: structures ... · actin-binding proteins actively break or ‘sever’ actin filaments [e.g. actin-depolymerizing factor (ADF) and cofilin].](https://static.fdocuments.us/doc/165x107/5f0f85bd7e708231d44494d0/review-actin-targeting-natural-products-structures-actin-binding-proteins-actively.jpg)


