ANNUAL WATER QUALITY REPORT 2018-19
23
ANNUAL WATER QUALITY REPORT 2018-19 busseltonwater.wa.gov.au
Transcript of ANNUAL WATER QUALITY REPORT 2018-19

busseltonwater.wa.gov.au2
1 Fairbairn Road Busselton WA 6280
PO Box 57 Busselton WA 6280+61 (8) 9781 [email protected]
/busselton.water @BusseltonWater

BUSSELTON WATER – Annual Water Quality Report 2018-19 3
Message from the Managing Director 4
Our Commitment 5
Drinking Water Quality Policy 5
Drinking Water Quality Management Framework 5
Our Geographic Coverage 6
Current Extent of Operation 6
Our Licence Area 6
System Analysis and Management 7
Our Water Source 7
Understanding Water Quality 8
Water Treatment 9
Our Water Treatment Plants 10
Distribution Network 11
Multi-barrier Approach 11
Incident Responses 11
Water Quality Monitoring and Testing 12
Development, Training and Innovation 12
Our Customers 12
Review 13
Microbiological Health and Disinfection Results 13
Chemical Health Results 13
Radiological Health Results 13
Non-health (Aesthetic) Results 13
Water Quality Results 14
Contents

busseltonwater.wa.gov.au4
I am pleased to present the 2018-19 Water Quality
Report on behalf of Busselton Water.
Busselton Water continued to achieve exceptional water quality results in 2018-19 as detailed in this report and summarised in the table below.
In addition to presenting water quality results and performance against the ADWG, this report describes the processes Busselton Water uses to collect, treat and distribute drinking water to our customers.
2018-19 WATER QUALITY RESULTS AT A GLANCE
Incident management
Incidents reportable to the Department of Health Nil
Health related characteristics Compliance
Escherichia coli 100%
Naegleria 100%
Chemical 100%
Pesticides 100%
Radiological 100%
Chlorine Disinfection 100%
Non-health characteristics Compliance
Aesthetic characteristics (excluding chlorine)* 100%
MESSAGE FROM THE MANAGING DIRECTOR
Our commitment to compliance with health related and non-health related water quality criteria in the Australian Drinking Water Guidelines (ADWG) is firmly established. Our application of the ADWG is reinforced through our Memorandum of Understanding (MoU) with the Department of Health.
I wish to thank everyone who has contributed to these excellent results, particularly staff and representatives from Department of Health and the many contracted companies that support delivery of our services.
Chris ElliottManaging Director
* Busselton Water achieved full compliance with Australian Drinking Water Guidelines except for the 0.6 mg/L aesthetic guideline value for chlorine concentration. This aesthetic guideline value is exceeded to ensure the microbiological safety of our water supply.

BUSSELTON WATER – Annual Water Quality Report 2018-19 5
We are committed to achieving 100 per cent compliance, with health-related and non-health related water quality criteria in the ADWG.
To enable us to achieve this, we will:
• systematically monitor and report water quality performance;
• be prepared for incidents including regular testing of our response plans;
• fulfil all the requirements of our Operating Licence and MoU with the Department of Health; and
• review and implement the Drinking Water Quality Management Plan.
Drinking Water Quality Policy
Busselton Water is committed to providing our current and future customers with high quality, safe drinking water consistent with the ADWG.
In pursuit of our commitments, we will:
• endorse and embrace the ADWG including protection of catchments and sources;
• fulfil all the requirements of our Operating Licence and MoU with the Department of Health;
• maintain and implement a Drinking Water Quality Management System consistent with the 12 elements of the ADWG Framework;
• systematically monitor and report water quality performance;
• prepare for incidents and regularly test our response plans;
• ensure our own water extraction is sustainable; and
• champion protection of source catchments in collaboration with relevant government agencies and regulators.
Drinking Water Quality Management Framework
Busselton Water bases its Drinking Water Quality Management System on the ADWG Framework for Management of Drinking Water Quality, endorsed by the National Health and Medical Research Council. The Framework provides benchmark water quality guidelines and values for designing a structured system for drinking water quality management. It aims to ensure a safe and reliable water supply.
OUR COMMITMENT
1 The “Australian Drinking Water Guidelines” published by the National Health and Medical Research Council, Australia’s peak health research body, provides an authoritative reference on what defines safe, good quality drinking water; how it can be achieved; and how it can be assured. It is available for download from https://www.nhmrc.gov.au/about-us/publications/australian-drinking-water-guidelines.
2 A copy of the Memorandum of Understanding with the Department of Health is available on the Busselton Water website.
3 More information on the Advisory Committee for the Purity of Water can be found at https://ww2.health.wa.gov.au/Articles/A_E/Advisory-Committee-for-the-Purity-of-Water
There are 12 elements within the ADWG Framework1 which are considered best practice. These elements are divided into four sections:
1. Commitment to drinking water quality management;
2. System analysis and management;
3. Supporting requirements;4. Review.
Busselton Water regularly assesses its performance against these elements.
In addition, our Operating Licence issued by the Economic Regulation Authority, incorporates our MoU2 with the Department of Health. The MoU describes the Department of Health requirements for compliance with the microbiological, health, chemical and radiological criteria.
Busselton Water provides the Department of Health with a quarterly water quality report, outlining how our organisation has performed against agreed requirements specified in the MoU.
Busselton Water is a member of Western Australia’s Advisory Committee for the Purity of Water3.

Current Extent of Operation
Established in 1906, Busselton Water is a local water corporation. We share a 113-year history and culture with the local community. We provide potable water services to more than 26,000 people within the city of Busselton (doubling to more than 50,000 in peak holiday periods), as well as bulk water supplies to the neighbouring town of Dunsborough.
We currently provide drinking water within a serviced area of 81,200ha, centred around Busselton as shown above. Red, green and blue lines depict water distribution pipes of various sizes, with red being the largest mains pipes and blue being the smallest.
Our Licence Area
Busselton Water’s operating licence (WL 3, Version 7) authorises Busselton Water to provide potable water supply services to an area of approximately 688,700ha.
A map of our Operating Licence Area can be viewed on the Economic Regulation Authority website.4
OUR GEOGRAPHIC COVERAGE
busseltonwater.wa.gov.au6
4 https://www.erawa.com.au/cproot/12840/2/Operating%20area%20map%20-%20WL3%20-%20Busselton%20Water.PDF

BUSSELTON WATER – Annual Water Quality Report 2018-19 7
SYSTEM ANALYSIS AND MANAGEMENT
Our Water Source
Busselton Water sources the bulk of its raw water from the deep, confined, Yarragadee aquifer. There is some draw from the base of the shallower Leederville aquifer which extends from about 10 to 275 metres in depth. Below this the Yarragadee aquifer extends to over 800 metres in depth.
Busselton Water extracts this raw water under licences (GWLs 110850 and 110851), issued by the Department of Water and Environmental Regulation (DWER). There are eight production bores pumping the raw water to treatment plants for filtration and disinfection before the treated water is stored in tanks and reticulated to customers.
Source protection
Busselton Water, in conjunction with DWER, developed the Busselton Water Reserves Drinking Water Source Protection Plan (Report WRP 139) released by the Department of Water, predecessor of DWER, in August 2013. The Plan defines the boundaries of Busselton Water’s Water Reserve and assigns a Priority 1 to these reserves. This identifies that due to the confined nature of this drinking water source, there is no risk of contamination from overlying land uses. The purpose of proclaiming the water reserves was to ensure the bore locations are under legislative protection.
Busselton Water is also bound by DWER’s Groundwater Licence Operating Strategy (GLOS), issued March 2014, stipulating annual extraction entitlement limits, licence conditions and compliance requirements. Busselton Water’s consultant Hydrogeologists (Rockwater Pty Ltd) review this document along with the implementation of the borefield construction and maintenance plan, monitoring and reporting requirements, to ensure future operational strategies are sustainable in the long term.
Extraction of water in accordance with the operating strategy is shown as follows:
Financial Year
Extraction (gigalitres)
2008-2009 4.49
2009-2010 4.23
2010-2011 4.30
2011-2012 4.30
2012-2013 4.59
2013-2014 5.05
2014-2015 5.18
2015-2016 5.38
2016-2017 5.15
2017-2018 5.35
2018-2019 5.41

busseltonwater.wa.gov.au8
Turbidity Turbidity is the cloudy appearance of water caused by the presence of suspended matter.
The Australian Drinking Water Guidelines specify an aesthetic guideline of 5 Nephelometric Turbidity Units (NTU). If disinfection is required, a turbidity of less than 1 NTU is desirable at the point of disinfection.
Colour Colour in water originates mainly from natural drainage through soil and vegetation in a catchment.
The Australian Drinking Water Guidelines value for colour is based on the colour that is noticeable in a glass. This is generally accepted as 15 Hazen Units (HU).
Iron Iron occurs naturally in water as a result of contact with soil or rock in the catchment. Iron in the water does not present a health hazard.
The Australian Drinking Water Guidelines recommend that based on aesthetic consideration, the concentration of Iron should not exceed 0.3 milligrams per Litre (mg/L).
Manganese Manganese in water can come from contact with soil or rock in the catchment. Manganese is not considered a health concern unless the concentration exceeds 0.5 mg/L.
The Australian Drinking Water Guidelines recommend that based on aesthetic considerations, the levels of Manganese should not exceed 0.1 mg/L.
Total Dissolved Solids
Total dissolved solids (TDS) consist of inorganic (natural) salts and small amounts of organic matter dissolved in water. Total dissolved solids comprise sodium, potassium, calcium, magnesium, chloride, sulphate, bicarbonate, carbonate, silicon, organic matter, fluoride, iron, manganese, nitrate and phosphate.
Treated water quality containing TDS levels of below 500 mg/L is classified as good.
Microbial Pathogens
The most common and widespread health risk associated with drinking water is contamination by microorganisms. Organisms associated with the gut of humans and mammals cause the usual waterborne diseases. Tests are undertaken for Escherichia coli (E. coli) as an indicator of microbial contamination.
Thermophilic Naegleria refers to a group of amoebae which includes Naegleria fowleri, the organism that causes the waterborne disease primary amoebic meningoencephalitis. Naegleria fowleri is an environmental pathogen which naturally lives in fresh warm water.
The Australian Drinking Water Guidelines state that thermotolerant coliforms/E. coli should not be present in a minimum 100mL sample of drinking water.
The Department of Health WA has notification protocols in place regarding Naegleria. Busselton Water is required to immediately notify the Department of Health if Naegleria is detected in any microbiological sample.
Radiological There are natural levels of radiation within the environment, and groundwater sources such as that sourced from the Yarragadee aquifer can have higher background levels than that of surface water systems.
Testing is undertaken for gross alpha and gross beta radioactivity, where screening levels can be determined.
The Australian Drinking Water Guidelines recommend a screening level of 0.5 Becquerel per Litre (Bq/L).
pH pH is a measure of how acidic/basic water is. The range goes from 0 - 14, with 7 being neutral. pH is the measure of free hydrogen ion concentrations in the water.
The suggested aesthetic pH target from the Australian Drinking Water Guidelines is 6.5 to 8.5.
SYSTEM ANALYSIS AND MANAGEMENT
Understanding Water Quality

BUSSELTON WATER – Annual Water Quality Report 2018-19 9
SYSTEM ANALYSIS AND MANAGEMENT
Water Treatment
Busselton Water uses a three-step process to treat raw water from the deep groundwater aquifers to provide customers with safe drinking water.
Pre-oxidation and aeration
Raw water is dosed with a small amount of chlorine, which is a strong oxidizing agent. The water is then aerated through spray nozzles. These two processes oxidise naturally occurring iron and manganese, turning them from their soluble form into small solids.
Filtration
The pre-chlorinated and aerated water is then filtered through sand filters to remove the iron, manganese, turbidity and other impurities. The filtered water is then collected in a clear-water well.
Disinfection
A further dose of chlorine is added to water pumped from the clear-water well. This dose maintains the disinfection level required to preserve microbiological safety before the water is stored in tanks and pumped into the distribution system. Chlorine is approved for use in drinking water supplies and Busselton Water sources chlorine gas from an ISO 9001-accredited manufacturer.
The whole water supply process is shown schematically overleaf.

busseltonwater.wa.gov.au10
SYSTEM ANALYSIS AND MANAGEMENT
Our Water Treatment Plants
Busselton Water operates three water treatment plants (Plant 1, Plant 2 and Plant 3).
Chlorine disinfection occurs at each treatment plant to keep the concentration of chlorine in the distribution system at or above 0.4 mg/L to ensure adequate protection against Thermophilic Naegleria and other microbiological threats.
The ADWG set 5 mg/L of chlorine as the upper acceptable limit.
For further detail please refer to the non-health (aesthetic) results section on page 22.
WATER TREATMENT and SUPPLY PROCESS

BUSSELTON WATER – Annual Water Quality Report 2018-19 11
SYSTEM ANALYSIS AND MANAGEMENT
Distribution Network
Busselton Water’s distribution network delivers drinking water to customers within the City of Busselton and transfers bulk water to neighbouring Dunsborough. The network operates as one large, interconnected system. Materials used in the reticulation network have been approved either under Australian Standard AS/NZS 4020: 2005. (Testing of Products for Use in Contact with Drinking Water) or as scheduled in the MoU with the Department of Health. Strict protocols established by Busselton Water in conjunction with the Department of Health and the Department of Mines, Industry Regulation and Safety assure the:
• safety and integrity of water distributed to customers;
• safe handling of chlorine at the water treatment plants; and
• safety of chemicals used and materials in contact with drinking water.
Distribution Network Components
Estimated population
Approx. 26,000
Total number of connections
13,710
Total length of pipes 325 km
Number of storage tanks
5
Chlorine residual target
0.4 to 0.6 mg/L
Number of distribution water quality zones
1
Multi-barrier Approach
Preventing contamination and minimising potential hazards is an essential part of providing our customers with safe drinking water. The ADWG require the implementation of a multi-barrier approach as the most effective way of ensuring the safety of drinking water.
Busselton Water’s barriers include:
• protection of groundwater;• treatment;• chlorine disinfection; and• backflow prevention.
Busselton Water maintains and operates these multiple barriers, ensuring they are robust and that high-quality drinking water is delivered to our customers.
Incident Responses
While every effort is made to prevent water quality incidents from occurring, there will inevitably be times when our systems fail due to equipment malfunction, human error, extreme weather conditions
or unforeseen events. Busselton Water has incident response plans to manage such events with the minimum possible impact on water quality.
In the event of a water quality incident, Busselton Water activates its Water Quality Incident Response Plan. This comprehensive plan is applied to manage water quality incidents and is consistent with the MoU between Busselton Water and the Department of Health.
To maintain our preparedness to deal with any water quality incidents, as part of our compliance with the MoU with the Department of Health, a mock event simulating a major chlorine gas event was held in November 2019 in conjunction with the Department of Fire and Emergency Services (DFES). It tested the effectiveness of staff and BW’s Business Continuity and Emergency Response Plans.
There were no water quality incidents reportable to the Department of Health in 2018-19.

busseltonwater.wa.gov.au12
SYSTEM ANALYSIS AND MANAGEMENT
Development, Training and Innovation
Busselton Water utilises training in accordance with the National Water Industry Training package. Water quality operational staff progress towards Certificate III in Water Industry Operations.
Busselton Water adopts a best practice 70/20/10 development approach. This approach allocates more time to experiential learning and delivers better employee development and business outcomes. It consists of 70 per cent experiential learning, 20 per cent mentorship of employee learning (including development planning), and 10 per cent approved class-based training.
Personnel regularly attend relevant training courses and/or conferences.
Busselton Water continued to derive benefit from innovative detection of backflow from residential customers’ properties using radio frequency water meters.
Water Quality Monitoring and Testing
Busselton Water has a compre-hensive water quality monitoring program which has been reviewed and endorsed by the Department of Health.
Key parameters monitored by Busselton Water are:
• microbiological – including Thermophilic Naegleria and Escherichia coli;
• chemical health – including: — a large range of parameters
with health-related guideline values defined by the ADWG; and
— pesticides which are monitored and tested on an annual basis to monitor the risk of groundwater contamination by pesticides and agricultural chemicals used in proximity to our bores or in the aquifer recharge area;
• chemical non-health (aesthetic) – including a large range of parameters with non-health guideline values defined by the ADWG; and
• radiological health – monitored and tested on an annual basis.
Our Customers
We strive to deliver excellence in customer service and continue to improve our existing levels of customer satisfaction. Busselton Water holds Customer Advisory Group meetings twice per year.
Water quality complaints remain at a very low level. Busselton Water received 15 water quality complaints during 2018-19, with three relating to taste and odour, eleven relating to discoloured water, and one relating to customers’ water use for non-drinking purposes.
All customer complaints were investigated through personal contact with the customer. All complaints were resolved through either flushing the pipe network in the immediate vicinity of the customer’s property or improving the customer’s understanding of how drinking water quality is managed.

BUSSELTON WATER – Annual Water Quality Report 2018-19 13
REVIEW
Busselton Water monitors water quality by taking weekly water samples.
Microbiological Health and Disinfection Results
Busselton Water collected 350 samples from the reticulation system during the reporting period and 100 per cent of these samples were compliant with no detections of either Escherichia coli or Thermophilic Naegleria. A further 1,222 samples were taken to assess chlorine levels.
Chemical Health Results
There are many chemical parameters that have health-related guideline values in the ADWG. Busselton Water achieved 100 per cent compliance with all these requirements. The report in the next section gives more detail on the individual parameters.
Radiological Health Results
Groundwater radiological testing is carried out in accordance with parameters and frequencies based on the ADWG and in consultation with the Department of Health.
Groundwater radiological testing is only required periodically. Gross alpha and gross beta are tested annually in April and results from these samples were 100 per cent compliant.
Non-health (Aesthetic) Results
Except for chlorine as described below, Busselton Water achieved 100 per cent compliance.
Busselton Water uses chlorine to provide a disinfectant residual in the water distribution system. Disinfection is designed to kill pathogenic microorganisms, thereby preventing waterborne diseases.
Chlorination is the most commonly used process for disinfection and was endorsed by the National Health and Medical Research Council for use as a drinking water treatment chemical in 1983. The ADWG aesthetic upper guiding value for chlorine is 0.6 mg/L.
The ADWG state that “In some supplies it may be necessary to exceed the aesthetic guideline in order to maintain an effective disinfectant residual throughout the system.” Busselton Water closely manages chlorine dosing levels to maintain a minimum residual chlorine level of 0.4 mg/L throughout the distribution system. During the year, Busselton Water collected 1,222 chlorine samples in the distribution network. The minimum total chlorine level was 0.08 mg/L (in a new street slowly establishing consistent flows), and the maximum was 0.80 mg/L.
There are many parameters with aesthetic guideline values in the ADWG. Results of individual parameters are outlined in the next section of this report.

BUSSELTON WATER – Annual Water Quality Report 2018-19 14
BUSSELTON WATER Annual Water Quality Report 2018-19 13
WATER QUALITY RESULTS In the period 1 July 2018 to 30 June 2019, there were no water quality incidents reportable to the Department of Health.
CHLORINE SAMPLES – 1 JULY 2018 TO 30 JUNE 2019
Busselton Water collected 217 total chlorine samples during 2018-19 for formal assessment of our water’s chemical health characteristics. An additional 1,222 total chlorine samples were taken in the distribution network during 2018-19 to manage the disinfection performance achieved within the pipe network. The minimum average and maximum levels of these additional operational samples were:
TYPE Minimum mg/L
Average mg/L
Maximum mg/L
Distributed Chlorine (Total) 0.08 0.52 0.80
MICROBIOLOGICAL SAMPLES – 1 JULY 2018 TO 30 JUNE 2019
CHARACTERISTIC UNIT ADWG limit
Number of samples Total no. of
samples (treated + distribution)
Maximum value Number of non-compliance with ADWG limit Distribution water
Compliance
% Treated water (non-assessable)
Distribution water (assessable)
Treated water (non-assessable)
Distribution water (assessable)
Treated water (non-assessable)
Distribution water (assessable)
Escherichia coli CFU/ 100mL 0 228 357 585 0 0 0 0 100%
Thermophilic Naegleria org/ 250mL ND 223 350 573 ND ND 0 0 100%
Naegleria fowleri org/ 250mL ND 0 0 0 - - 0 0 100% Note: Five Treated Water and seven Distribution Water microbiological samples were not scheduled or carried out on 2 January 2019, because Busselton Water staff believed that the PathWest Laboratory, subcontracted to carry out TA and TN sampling for SGS Australia, would be closed over the Christmas / New Year period. These samples were not rescheduled.
RADIOLOGICAL SAMPLES – 1 JULY 2018 TO 30 JUNE 2019
CHARACTERISTIC UNIT ADWG (Health)
limit
Raw Water (Bores)
Treated Water (Storage Tanks)
Non-Compliance (Health) No. of Samples % Compliance
(Health)
Maximum Detected
Bq/L
Non-Compliance (Health) No. of Samples % Compliance
(Health) Maximum Detected
Bq/L
Gross Alpha Bq/L 0.5 0 7 100% 0.254 0 5 100% 0.312
Gross Beta Bq/L 0.5 0 7 100% 0.218 0 5 100% 0.157

BUSSELTON WATER – Annual Water Quality Report 2018-19 15
BUSSELTON WATER Annual Water Quality Report 2018-19 14
WATER QUALITY RESULTS
Memorandum of Understanding – Drinking Water Quality Report
CHEMICAL HEALTH – 1 JULY 2018 TO 30 JUNE 2019
CHARACTERISTIC UNIT ADWG LIMIT (Health)
Lab Limit of Reporting
(LOR)
Number of Samples Total No. of
Samples (Raw + Distribution)
Maximum Value Number of Non-compliance with ADWG limit
Compliance % Distribution
Water Raw Water Distribution Water Raw Water Distribution Water Raw Water Distribution Water
Antimony mg/L 0.003 0.001 NR 16 16 NR ND NR 0 100%
Arsenic mg/L 0.007 0.001 NR 16 16 NR ND NR 0 100%
Barium mg/L 0.7 0.001 NR 16 16 NR 0.31 NR 0 100%
Beryllium mg/L - 0.001 NR 16 16 NR ND NR 0 100%
Boron mg/L 4 0.005 NR 16 16 NR 0.21 NR 0 100%
Bromate mg/L 0.02 0.005 NR 7 7 NR ND NR 0 100%
Bromide mg/L - 0.05 NR 7 7 NR 0.12 NR 0 100%
Bromodichloromethane mg/L 0.25* 0.0005 NR 12 12 NR ND NR 0 100%
Bromoform mg/L 0.25* 0.0005 NR 12 12 NR 0.003 NR 0 100%
Cadmium mg/L 0.002 0.0001 NR 16 16 NR ND NR 0 100%
Chlorine (Total) mg/L 5 NR 217 217 NR 0.8 NR 0 100%
Chloroform mg/L 0.25* 0.0005 NR 12 12 NR ND NR 0 100%
Copper mg/L 2 0.001 NR 16 16 NR 0.13 NR 0 100%
Dibromochloromethane mg/L 0.25* 0.0005 NR 12 12 NR 0.0052 NR 0 100%
Fluoride mg/L 1.5 0.1 NR 84 84 NR 0.6 NR 0 100%
Lanthanum mg/L 0.002 0.001 NR 7 7 NR ND NR 0 100%
Lead mg/L 0.01 0.001 NR 16 16 NR ND NR 0 100%
Manganese (Soluble) mg/L 0.5 0.005 77 84 161 0.12 ND 0 0 100%
Manganese (Total) mg/L 0.5 0.005 77 84 161 0.18 ND 0 0 100%
Mercury mg/L 0.001 0.00005 NR 16 16 NR ND NR 0 100%
Molybdenum mg/L 0.05 0.001 NR 16 16 NR ND NR 0 100%
Nickel mg/L 0.02 0.001 NR 16 16 NR ND NR 0 100%
Nitrate mg/L 50 0.05 26 NR 26 0.12 NR 0 NR 100%
Nitrite mg/L 3 0.005 26 NR 26 0.55 NR 0 NR 100%
Selenium mg/L 0.01 0.001 NR 16 16 NR ND NR 0 100%
Silver mg/L 0.1 0.001 NR 16 16 NR ND NR 0 100%
Total Trihalomethanes mg/L 0.25* 0.0005 NR 12 12 NR 0.008 NR 0 100%
Uranium mg/L 0.017 0.001 NR 16 16 NR ND NR 0 100%
TOTAL 206 276 482 - - 0 0 100% mg/L = milligrams per litre NTU = Nephelometric turbidity units Note 1: ND = Not Detected Note 2: NR = Not required to be sampled Note 3: Chlorine Total is a Busselton Water in-house test. All others are accredited test results. Note 4: *The concentration of trihalomethanes, either individually or in total, in drinking water should not exceed 0.25 mg/L

BUSSELTON WATER – Annual Water Quality Report 2018-19 16
BUSSELTON WATER Annual Water Quality Report 2018-19 15
WATER QUALITY RESULTS
CHEMICAL HEALTH – PESTICIDES – 1 JULY 2018 TO 30 JUNE 2019
CHARACTERISTIC UNIT ADWG LIMIT (Health)
Lab Limit of Reporting (LOR)
Number of Samples Maximum Value Number of Non-compliance with
ADWG limit
Compliance %
Distribution Water
Organochlorine Pesticides Aldrin µg/L 0.3 0.01 5 ND 0 100%
Methoxychlor µg/L 0.3 0.1 5 ND 0 100%
Organochlorine Pesticides
Alpha Endosulfan µg/L 20 0.005 5 ND 0 100%
Beta Endosulfan µg/L 20 0.005 5 ND 0 100%
Endosulfan Sulphate µg/L 20 0.005 5 ND 0 100%
Heptachlor µg/L 0.3 0.002 5 ND 0 100%
Heptachlor Epoxide µg/L 0.3 0.002 5 ND 0 100%
Dieldrin µg/L 0.3 0.002 5 ND 0 100%
p,p'-DDT µg/L 9 0.001 5 ND 0 100%
Alpha Chlordane µg/L 2 0.002 5 ND 0 100%
Gamma Chlordane µg/L 2 0.002 5 ND 0 100%
Organophosphate Pesticides
Diazinon (Dimpylate) µg/L 4 0.01 5 ND 0 100%
Dichlorvos µg/L 5 0.5 5 ND 0 100%
Methidathion µg/L 6 0.05 5 ND 0 100%
Azinphos-methyl (Guthion) µg/L 30 0.05 5 ND 0 100%
Fenthion µg/L 7 1 5 ND 0 100%
Dimethoate µg/L 7 0.15 5 ND 0 100%
Ethion µg/L 4 0.05 5 ND 0 100%
Organophosphate Pesticides Chlorpyrifos (Chlorpyrifos Ethyl)
Ides Chlorpyrifos (Chlorpyrifos Ethyl)
µg/L 10 0.009 5 ND 0 100%
Parathion-ethyl (Parathion) µg/L 20 0.004 5 ND 0 100%
Fenitrothion µg/L 7 0.1 5 ND 0 100%
Acid Herbicides
Picloram µg/L 300 0.01 5 ND 0 100%
Triclopyr µg/L 20 0.01 5 ND 0 100%
2,4-D µg/L 30 0.01 5 ND 0 100%
Clopyralid µg/L 2000 0.01 5 ND 0 100%
2,4,5-T µg/L 100 0.01 5 ND 0 100%
MCPA µg/L 40 0.01 5 ND 0 100%
Bromoxynil µg/L 10 0.01 5 ND 0 100%
Dicamba µg/L 100 0.01 5 ND 0 100%
mg/L = milligrams per litre µg/L = micrograms per litre ND = Not Detected

BUSSELTON WATER – Annual Water Quality Report 2018-19 17
BUSSELTON WATER Annual Water Quality Report 2018-19 16
WATER QUALITY RESULTS
CHEMICAL HEALTH – VOLATILE ORGANIC COMPOUNDS (part 1) – 1 JULY 2018 TO 30 JUNE 2019
CHARACTERISTIC UNIT ADWG LIMIT (Health)
Lab Limit of Reporting (LOR)
Number of Samples Maximum Value Number of Non-compliance with
ADWG limit
Compliance %
Distribution Water
Fumigants
cis-1,3-dichloropropene µg/L 100 0.5 5 ND 0 100%
trans-1,3-dichloropropene µg/L 100 0.5 5 ND 0 100%
Halogenated Aliphatics
Tetrachloroethene (Perchloroethylene,PCE) µg/L 50 0.5 5 ND 0 100%
Trichloroethene (Trichloroethylene,TCE) µg/L no data 0.5 5 ND 0 100%
Vinyl chloride (Chloroethene) µg/L 0.3 0.3 5 ND 0 100%
1,1,1-trichloroethane µg/L no data 0.5 5 ND 0 100%
Carbon tetrachloride µg/L 3 0.5 5 ND 0 100%
1,1-dichloroethane µg/L no data 0.5 5 ND 0 100%
1,2-dichloroethane µg/L 1500 0.5 5 ND 0 100%
1,1-dichloroethene µg/L no data 0.5 5 ND 0 100%
cis-1,2-dichloroethene µg/L 60 0.5 5 ND 0 100%
trans-1,2-dichloroethene µg/L 60 0.5 5 ND 0 100%
Dichloromethane (Methylene chloride) µg/L 4 5 5 ND 0 100%
Halogenated Aromatics
1,2,3-trichlorobenzene µg/L 30 0.5 5 ND 0 100%
1,2,4-trichlorobenzene µg/L 30 0.5 5 ND 0 100%
1,3,5-trichlorobenzene µg/L no data 0.5 5 ND 0 100%
Total Trichlorobenzene µg/L no data 1 5 ND 0 100%
Chlorobenzene µg/L 0.3 0.5 5 ND 0 100%
1,2-dichlorobenzene µg/L 1500 0.5 5 ND 0 100%
1,3-dichlorobenzene µg/L no data 0.5 5 ND 0 100%
1,4-dichlorobenzene µg/L 40 0.3 5 ND 0 100%
Monocyclic Aromatic Hydrocarbons
Ethylbenzene µg/L 300 0.5 5 ND 0 100%
Toluene µg/L 800 0.5 5 ND 0 100%
m/p-xylene µg/L 600 1 5 ND 0 100%
o-xylene µg/L 600 0.5 5 ND 0 100%
Benzene µg/L 1 0.5 5 ND 0 100%
Styrene (Vinyl benzene) µg/L 30 0.5 5 ND 0 100%
mg/L = milligrams per litre µg/L = micrograms per litre ND = Not Detected

BUSSELTON WATER – Annual Water Quality Report 2018-19 18
BUSSELTON WATER Annual Water Quality Report 2018-19 17
WATER QUALITY RESULTS
CHEMICAL HEALTH – VOLATILE ORGANIC COMPOUNDS (part 2) – 1 JULY 2018 TO 30 JUNE 2019
CHARACTERISTIC UNIT ADWG LIMIT (Health)
Lab Limit of Reporting (LOR)
Number of Samples Maximum Value Number of Non-compliance with
ADWG limit
Compliance %
Distribution Water
Semi-Volatile Organic Compounds Fenarimol µg/L 1 5 ND 0 100%
Malathion µg/L 1 5 ND 0 100%
Metolachlor µg/L 1 5 ND 0 100%
Napropamide µg/L 1 5 ND 0 100%
Propachlor µg/L 1 5 ND 0 100%
Triadimefon µg/L 1 5 ND 0 100%
Vernolate µg/L 1 5 ND 0 100%
Additional Semi-Volatile Organic Compounds
Chlorothalonil* µg/L 1 5 ND 0 100%
Dichlorbenil* µg/L 1 5 ND 0 100%
Diclofop-methyl* µg/L 1 5 ND 0 100%
Etridiazole* µg/L 1 5 ND 0 100%
Flamprop-methyl* µg/L 1 5 ND 0 100%
Fluometuron* µg/L 1 5 ND 0 100%
pendimethalin* µg/L 1 5 ND 0 100%
Primiphos methyl* µg/L 1 5 ND 0 100%
Propargite* µg/L 1 5 ND 0 100%
Propyzamide µg/L 1 5 ND 0 100%
Pesticides / Herbicides
Aldicarb µg/L 1 5 ND 0 100%
Amitraz µg/L 1 5 ND 0 100%
Amitrole µg/L 9 10 5 ND 0 100%
Carbendazim µg/L 1 5 ND 0 100%
Diuron µg/L 20 1 5 ND 0 100%
2,2-DPA µg/L 1 5 ND 0 100%
Fipronil µg/L 1 5 ND 0 100%
Fluazifop µg/L 1 5 ND 0 100%
Methiocarb µg/L 1 5 ND 0 100%
Methomyl µg/L 1 5 ND 0 100%
Metsulfuron methyl µg/L 1 5 ND 0 100%
Oxamyl µg/L 1 5 ND 0 100%
mg/L = milligrams per litre µg/L = micrograms per litre ND = Not Detected

BUSSELTON WATER – Annual Water Quality Report 2018-19 19
BUSSELTON WATER Annual Water Quality Report 2018-19 18
WATER QUALITY RESULTS
CHEMICAL HEALTH – VOLATILE ORGANIC COMPOUNDS (part 3) – 1 JULY 2018 TO 30 JUNE 2019
CHARACTERISTIC UNIT ADWG LIMIT (Health)
Lab Limit of Reporting (LOR)
Number of Samples Maximum Value Number of Non-compliance with
ADWG limit
Compliance %
Distribution Water
Glyphosate
Glyphosate µg/L 1000 0.01 5 ND 0 100%
Paraquat and Diquat
Paraquat and Diquat in Water by GC MS µg/L 20 0.005 5 ND 0 100%
Diquat µg/L 7 0.005 5 ND 0 100%
Acrylamide in Water
Acrylamide µg/L 0.2 0.00005 5 ND 0 100%
Chelating Agents
Ethylenediamine tetraacetic acid µg/L 20 20 5 ND 0 100%
Nitrilotriacetic acid µg/L 20 20 5 ND 0 100%
Organotins
Dibutyltin µg/L no data 0.000005 5 ND 0 100%
Tributyltin µg/L 1 0.000002 5 ND 0 100%

BUSSELTON WATER – Annual Water Quality Report 2018-19 20
BUSSELTON WATER Annual Water Quality Report 2018-19 19
CHEMICAL HEALTH – PFAS AND PFOS – 1 JULY 2018 TO 30 JUNE 2019
CHARACTERISTIC UNIT ADWG LIMIT (Health)
Lab Limit of Reporting (LOR)
Number of Samples Maximum Value Number of Non-compliance with
ADWG limit
Compliance %
Raw Water
PFAS and PFOS
Perfluorobutanoic acid (PFBA) µg/L - 0.002 1 ND 0 100%
Perfluoropentanoic acid (PFPeA) µg/L - 0.002 1 ND 0 100%
Perfluorohexanoic acid (PFHxA) µg/L - 0.002 1 ND 0 100%
Perfluoroheptanoic acid (PFHpA) µg/L - 0.002 1 ND 0 100%
Perfluorooctanoic Acid (PFOA) µg/L 0.56 0.001 1 ND 0 100%
Perfluorononanoic acid (PFNA) µg/L - 0.004 1 ND 0 100%
Perfluorodecanoic acid (PFDA) µg/L - 0.004 1 ND 0 100%
Perfluoroundecanoic acid (PFUnA) µg/L - 0.004 1 ND 0 100%
Perfluorododecanoic acid (PFDoA) µg/L - 0.004 1 ND 0 100%
Perfluorotridecanoic acid (PFTrDA) µg/L - 0.004 1 ND 0 100%
Perfluorotetradecanoic acid (PFTeDA) µg/L - 0.004 1 ND 0 100%
Perfluorohexadecanoic acid (PFHxDA) µg/L - 0.008 1 ND 0 100%
Perfluorobutane sulfonate (PFBS) µg/L - 0.01 1 ND 0 100%
Perfluoropentane sulfonate (PFPeS) µg/L - 0.01 1 ND 0 100%
Perfluorohexane sulfonate (PFHxS) µg/L - 0.01 1 ND 0 100%
Perfluoroheptane sulfonate (PFHpS) µg/L - 0.01 1 ND 0 100%
Perfluorooctane sulfonate (PFOS) µg/L - 0.01 1 ND 0 100%
Perfluorooctane sulfonate (PFOS) + Perfluorohexane sulfonate (PFHxS)” µg/L 0.07 0.01 1 ND 0 100%
Perfluorononane sulfonate (PFNS) µg/L - 0.01 1 ND 0 100%
Perfluorodecane sulfonate (PFDS) µg/L - 0.01 1 ND 0 100%
Perfluorododecane sulfonate (PFDoS) µg/L - 0.01 1 ND 0 100%
1H,1H,2H,2H-Perfluorohexane sulfonate (4:2) (4:2 FTS) µg/L - 0.01 1 ND 0 100%
1H,1H,2H,2H-Perfluorooctane sulfonate (6:2) (6:2 FTS) µg/L - 0.01 1 ND 0 100%
1H,1H,2H,2H-Perfluorodecane sulfonate (8:2) (8:2 FTS) µg/L - 0.01 1 ND 0 100%
Perfluoroctane sulfonamide (PFOSA) µg/L - 0.008 1 ND 0 100%
N-Methylperfluoroctane sulphonamide (N-MeFOSA) µg/L - 0.01 1 ND 0 100%
N-Ethylperfluoroctane sulfonamide (N-EtFOSA) µg/L - 0.01 1 ND 0 100%
2-(N-Methylperfluorooctane sulfonamido)-ethanol (N-MeFOSE) µg/L - 0.02 1 ND 0 100%
2-(N-Ethylperfluorooctane sulfonamido)-ethanol (N-EtFOSE) µg/L - 0.02 1 ND 0 100%
N-Methylperfluorooctanesulfonamidoacetic acid (N_MeFOSAA) µg/L - 0.01 1 ND 0 100%
N-Ethylperfluorooctanesulfonamidoacetic Acid (N-EtFOSAA) µg/L - 0.01 1 ND 0 100%
mg/L = milligrams per litre µg/L = micrograms per litre ND = Not Detected
BUSSELTON WATER – Annual Water Quality Report 2018-19 21
BUSSELTON WATER Annual Water Quality Report 2018-19 20
WATER QUALITY RESULTS
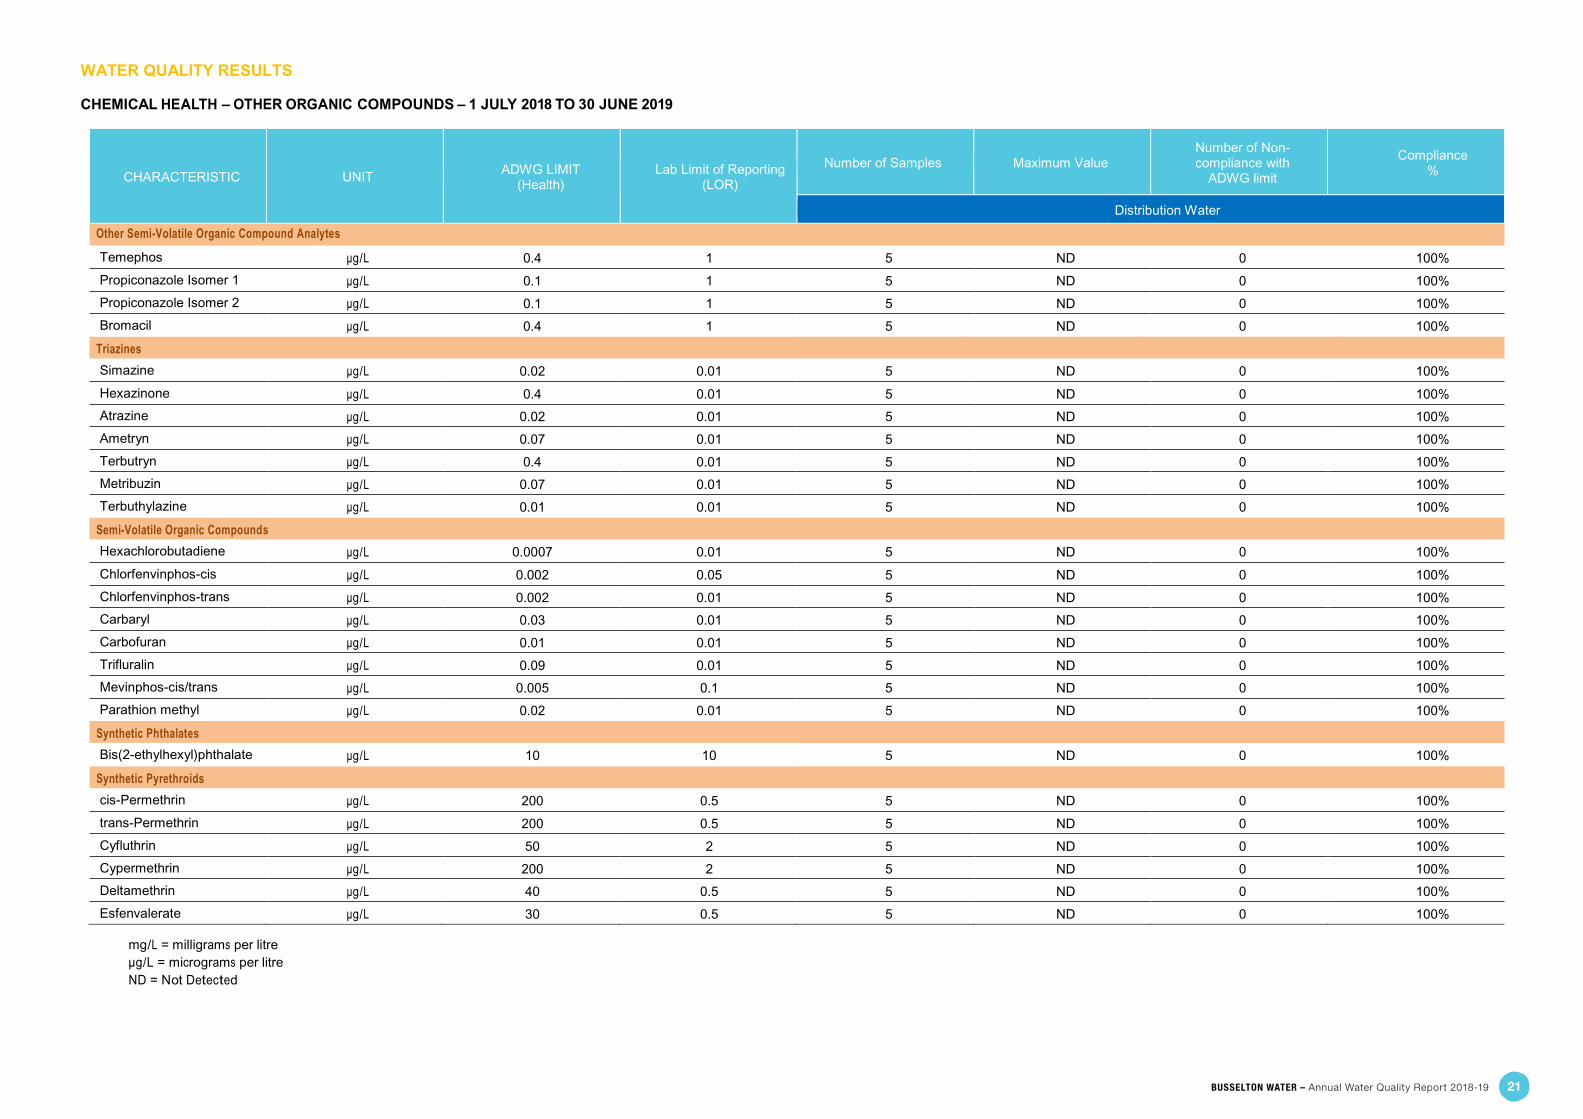
CHEMICAL HEALTH – OTHER ORGANIC COMPOUNDS – 1 JULY 2018 TO 30 JUNE 2019
CHARACTERISTIC UNIT ADWG LIMIT (Health)
Lab Limit of Reporting (LOR)
Number of Samples Maximum Value Number of Non-compliance with
ADWG limit
Compliance %
Distribution Water
Other Semi-Volatile Organic Compound Analytes
Temephos µg/L 0.4 1 5 ND 0 100%
Propiconazole Isomer 1 µg/L 0.1 1 5 ND 0 100%
Propiconazole Isomer 2 µg/L 0.1 1 5 ND 0 100%
Bromacil µg/L 0.4 1 5 ND 0 100%
Triazines
Simazine µg/L 0.02 0.01 5 ND 0 100%
Hexazinone µg/L 0.4 0.01 5 ND 0 100%
Atrazine µg/L 0.02 0.01 5 ND 0 100%
Ametryn µg/L 0.07 0.01 5 ND 0 100%
Terbutryn µg/L 0.4 0.01 5 ND 0 100%
Metribuzin µg/L 0.07 0.01 5 ND 0 100%
Terbuthylazine µg/L 0.01 0.01 5 ND 0 100%
Semi-Volatile Organic Compounds
Hexachlorobutadiene µg/L 0.0007 0.01 5 ND 0 100%
Chlorfenvinphos-cis µg/L 0.002 0.05 5 ND 0 100%
Chlorfenvinphos-trans µg/L 0.002 0.01 5 ND 0 100%
Carbaryl µg/L 0.03 0.01 5 ND 0 100%
Carbofuran µg/L 0.01 0.01 5 ND 0 100%
Trifluralin µg/L 0.09 0.01 5 ND 0 100%
Mevinphos-cis/trans µg/L 0.005 0.1 5 ND 0 100%
Parathion methyl µg/L 0.02 0.01 5 ND 0 100%
Synthetic Phthalates
Bis(2-ethylhexyl)phthalate µg/L 10 10 5 ND 0 100%
Synthetic Pyrethroids
cis-Permethrin µg/L 200 0.5 5 ND 0 100%
trans-Permethrin µg/L 200 0.5 5 ND 0 100%
Cyfluthrin µg/L 50 2 5 ND 0 100%
Cypermethrin µg/L 200 2 5 ND 0 100%
Deltamethrin µg/L 40 0.5 5 ND 0 100%
Esfenvalerate µg/L 30 0.5 5 ND 0 100%
mg/L = milligrams per litre µg/L = micrograms per litre ND = Not Detected

BUSSELTON WATER – Annual Water Quality Report 2018-19 22
BUSSELTON WATER Annual Water Quality Report 2018-19 21
WATER QUALITY RESULTS
CHEMICAL NON-HEALTH (AESTHETIC) SAMPLES – 1 JULY 2018 TO 30 JUNE 2019
CHARACTERISTIC UNIT ADWG LIMIT (non-health)
Lab Limit of
Reporting (LOR)
Number of Samples Total No. of Samples (Raw +
Distribution)
Maximum Value Number of Non-compliance with ADWG Limit
Distribution Water Compliance
% Raw Water Distribution Water Raw Water Distribution Water Raw Water Distribution Water
Alkalinity (Bicarbonate) mg/L - 5 26 16 42 210 190 0 0 100%
Alkalinity (Carbonate) mg/L - 5 26 16 42 ND ND 0 0 100%
Alkalinity (Hydroxide) mg/L - 5 26 16 42 ND ND 0 0 100%
Alkalinity (Total) mg/L - 5 26 16 42 170 160 0 0 100%
Aluminium (Soluble) mg/L 0.2 0.02 26 16 42 ND ND 0 0 100%
Aluminium (Total) mg/L 0.2 0.02 26 16 42 ND ND 0 0 100%
Ammonia mg/L 0.5 0.005 NR 16 16 NR ND NR 0 100%
Calcium mg/L - 0.2 NR 16 16 NR 27 NR 0 100%
Chloride mg/L 250 1 26 NR 26 130 NR 0 NR
Colour True HU 15 1 62 84 146 25 ND 1 0 100%
Electrical Conductivity uS/cm - 2 76 84 160 750 630 0 0 100%
Filterable Reactive Phosphorus mg/L - 0.005 26 NR 26 0.019 NR 0 NR
Filterable Reactive Phosphorus as PO4 mg/L - 0.01 26 NR 26 0.04 NR 0 NR
Hardness mg/L 200 5 26 16 42 130 120 0 0 100%
Iron (Soluble) mg/L 0.3 0.005 76 84 160 8.5 0.032 57 0 100%
Iron (Total) mg/L 0.3 0.005 76 84 160 8.6 0.041 58 0 100%
Magnesium mg/L - 0.1 NR 16 16 NR 14 NR 0 100%
pH pH 6.5-8.5 NR 77 217 294 8 8.3 0 0 100%
Salinity (as Total Dissolved Solids) mg/L 500 10 76 NR 76 400 NR 0 NR
Silica mg/L - 0.05 26 NR 26 19 NR 0 NR
Sodium mg/L 180 0.5 26 NR 26 100 NR 0 NR
Sulphate mg/L 250 1 26 NR 26 19 NR 0 NR
Total Hardness by Calculation mg/L 200 1 26 16 42 130 120 0 0 100%
Turbidity NTU 5 NR 77 216 293 3.62 0.45 0 0 100%
Zinc mg/L - 0.005 NR 16 16 NR 0.014 NR 0 100%
TOTAL 884 961 1845 100% Note 1: HU = Hazen Units NTU = Nephelometric Turbidity Units mg/L = milligrams per litre ND = Not Detected NR = Not required to be sampled Note 2: pH and Turbidity are Busselton Water in-house tests. All others are accredited test results.

1 Fairbairn Road Busselton WA 6280
PO Box 57 Busselton WA 6280
+61 (8) 9781 [email protected]
/busselton.water @BusseltonWater