Annual WATER QUALITY - AF
28
QUALITY Annual WATER REPORT 2019 Combined annual water quality reports summarizing test resuts from 2019 Table of Content Lower Peninsula Report 2 Lower Peninsula Extended Data 11 Lightfoot System Report 18 Lightfoot System Extended Data 25 Click any page number to go directly to that page
Transcript of Annual WATER QUALITY - AF
QUALITYAnnual
WATERREPORT
2019
Combined annualwater quality
reports
summarizing testresuts from 2019
Table of Content
Lower Peninsula Report 2Lower Peninsula Extended Data 11Lightfoot System Report 18Lightfoot System Extended Data 25Click any page number to go directly to that page
QUALITYAnnual
WATERREPORT
2019
Lower Peninsula System
Summarizing test results from

ANNUAL DRINKING WATER QUALITY REPORT 2019 1
CONTENTS
Your Water Utility ................................................................................................. 1
Where Your Water Comes From ............................................................................ 2
Source Water Assessment ..................................................................................... 2
More About Source Water .................................................................................... 3
How We Test Your Water....................................................................................... 4
Key Terms............................................................................................................. 5
Water Quality Testing Results - Regulated Substances ....................................... 6-7
Additional Testing ................................................................................................ 8
Water Quality Testing Results - Unregulated Substances ...................................... 8
Water Quality Testing Results - Non-regulated Microbials ..................................... 9
Important Health Information ............................................................................. 9
How We Treat Your Water ................................................................................... 10
Public Health Precautions .................................................................................. 10
About Lead ......................................................................................................... 11
Additional Information of Interest ...................................................................... 12
Contact Information .............................................................................. Back Cover
YOUR WATER UTILITY
Newport News Waterworks serves as a regional water provider
for five jurisdictions: Newport News, Hampton, Poquoson, York
County and part of James City County. We are committed to
providing a reliable supply of high quality drinking water to
our customers. Our drinking water is treated and tested using
state-of-the-art equipment and advanced
procedures, and it meets or surpasses state
and federal standards. The bottom line: The
quality of your water is excellent.
ABOUT THIS REPORT
This annual water quality report or “Consumer Confidence Report” is written,
prepared and distributed by the City of Newport News Waterworks Department
(Newport News Waterworks) as required by the Safe Drinking Water Act. It is
reviewed and approved by the Virginia Department of Health, Office of Drinking
Water in Norfolk. This report explains where your water comes from, what our
tests show about it and other things you should know about your drinking water.
This report and the water quality report for our Lightfoot System are available
online at nnva.gov/waterqualityreport. Both online reports include additional
test results. A paper copy of this report is available at all local libraries in the
Waterworks service area, in our walk-in services lobby at 700 Town Center Drive
in Newport News, and in city halls and county offices in our service area. If you
would like to receive a copy of this report in the mail, please call Waterworks at
757-926-1000.
HOW CAN I GET INVOLVED?
Since Waterworks is a department
of the City of Newport News, major
decisions about your drinking water are
made by Newport News City Council.
They meet on the second and fourth
Tuesdays of each month at 7:00 pm,
and you are welcome to attend and
participate. These meetings are
broadcast live on the Newport News
City Channel (in Newport News - Cox channel 48 and Verizon FIOS channel 19)
and streamed live on Facebook at www.facebook.com/NewportNewsTV. They
also can be viewed live or on-demand by all customers in our service area at
www.nnva.gov/nntv.
NOTICIA EN ESPAÑOL
Este reporte continiene información importante acerca de la calidad del
agua potable. Haga que algien lo traduzca para usted, o hable con alguien
que lo entienda.
ANNUAL DRINKING WATER QUALITY REPORT 2019 32 NEWPORT NEWS WATERWORKS
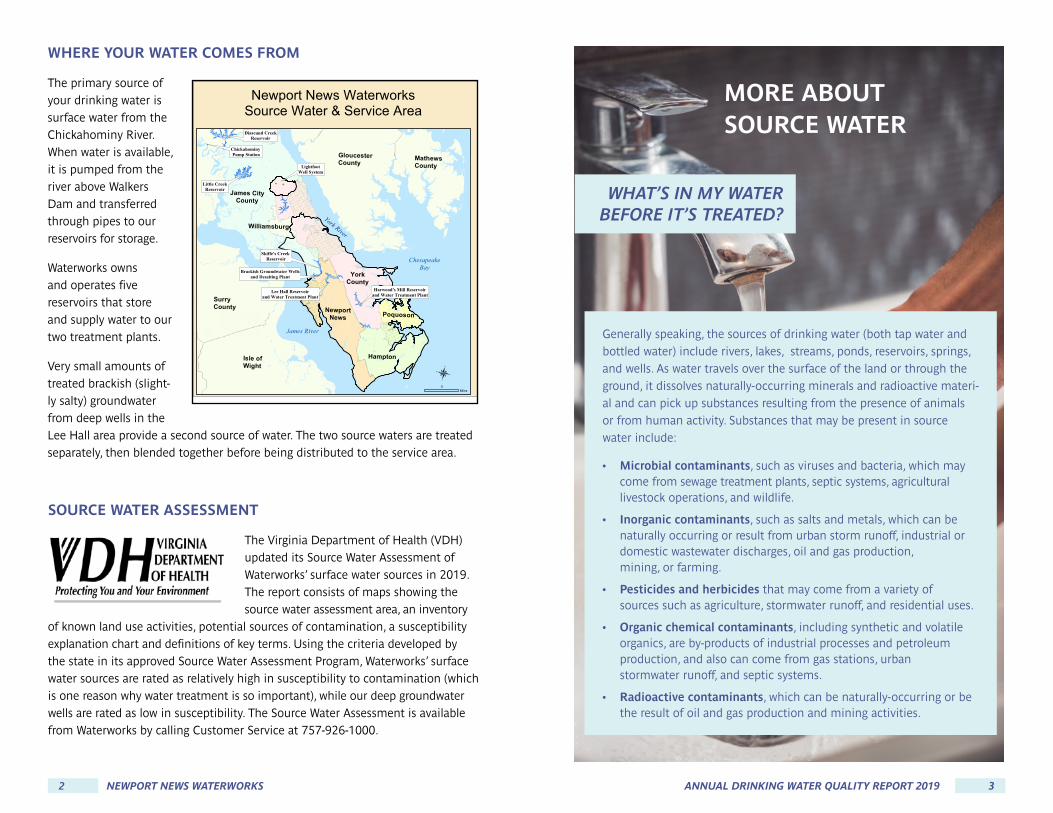
WHERE YOUR WATER COMES FROM
The primary source of
your drinking water is
surface water from the
Chickahominy River.
When water is available,
it is pumped from the
river above Walkers
Dam and transferred
through pipes to our
reservoirs for storage.
Waterworks owns
and operates five
reservoirs that store
and supply water to our
two treatment plants.
Very small amounts of
treated brackish (slight-
ly salty) groundwater
from deep wells in the
Lee Hall area provide a second source of water. The two source waters are treated
separately, then blended together before being distributed to the service area.
Hampton
NewportNews
YorkCounty
Poquoson
WilliamsburgYork River
James River
Norfolk
Isle of Wight C
ounty
James CityCounty
ChesapeakeBay
Elizabeth
RiverNansemond River
Lee Hall Reservoirand Water Treatment Plant
Harwood's Mill Reservoirand Water Treatment Plant
Skiffe's Creek Reservoir
Little CreekReservoir
Diascund CreekReservoir
Brackish Groundwater Wellsand Desalting Plant
GloucesterCounty
SurryCounty
Isle ofWight
City of Suffolk
MathewsCounty
Chickahominy Pump Station
§̈¦664
Suffolk
LightfootWell System
®
Newport News WaterworksSource Water & Service Area
5Miles
SOURCE WATER ASSESSMENT
The Virginia Department of Health (VDH)
updated its Source Water Assessment of
Waterworks’ surface water sources in 2019.
The report consists of maps showing the
source water assessment area, an inventory
of known land use activities, potential sources of contamination, a susceptibility
explanation chart and definitions of key terms. Using the criteria developed by
the state in its approved Source Water Assessment Program, Waterworks’ surface
water sources are rated as relatively high in susceptibility to contamination (which
is one reason why water treatment is so important), while our deep groundwater
wells are rated as low in susceptibility. The Source Water Assessment is available
from Waterworks by calling Customer Service at 757-926-1000.
MORE ABOUT SOURCE WATER
WHAT’S IN MY WATER BEFORE IT’S TREATED?
Generally speaking, the sources of drinking water (both tap water and
bottled water) include rivers, lakes, streams, ponds, reservoirs, springs,
and wells. As water travels over the surface of the land or through the
ground, it dissolves naturally-occurring minerals and radioactive materi-
al and can pick up substances resulting from the presence of animals
or from human activity. Substances that may be present in source
water include:
• Microbial contaminants, such as viruses and bacteria, which may come from sewage treatment plants, septic systems, agricultural livestock operations, and wildlife.
• Inorganic contaminants, such as salts and metals, which can be naturally occurring or result from urban storm runoff, industrial or domestic wastewater discharges, oil and gas production, mining, or farming.
• Pesticides and herbicides that may come from a variety of sources such as agriculture, stormwater runoff, and residential uses.
• Organic chemical contaminants, including synthetic and volatile organics, are by-products of industrial processes and petroleum production, and also can come from gas stations, urban stormwater runoff, and septic systems.
• Radioactive contaminants, which can be naturally-occurring or be the result of oil and gas production and mining activities.
ANNUAL DRINKING WATER QUALITY REPORTANNUAL DRINKING WATER QUALITY REPORT 2019 54 NEWPORT NEWS WATERWORKS
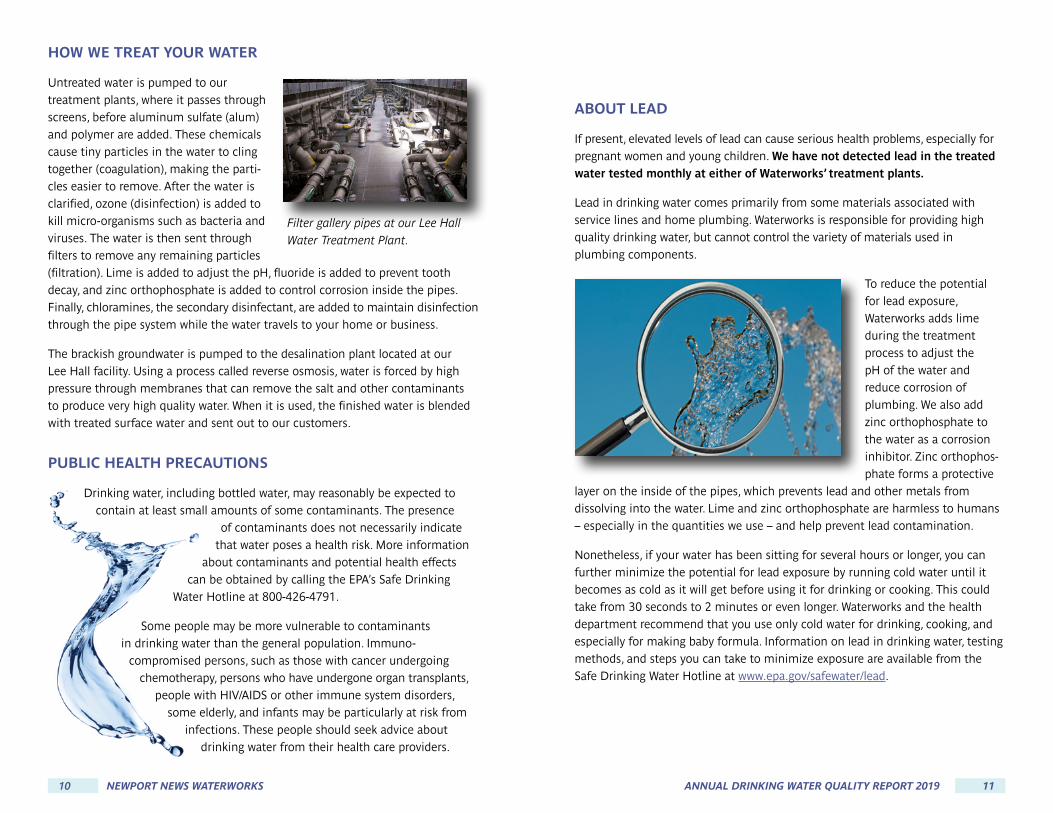
HOW WE TEST YOUR WATER
To ensure that tap water is safe to drink, U.S. Environmental Protection Agency
(EPA) regulations limit the amount of certain contaminants in water provided by
public water systems. (The U.S. Food and Drug Administration is responsible for
setting these limits on bottled water.) The water quality information listed here is
based upon tests conducted in 2019 by Newport News Waterworks. Samples of
finished water were taken at regular intervals from specific locations (the
treatment plants, residences, and businesses) across the Waterworks service area.
Every regulated substance
that we detected in the
water, even in the smallest
amounts, is listed in the
table on pages 6 and 7.
The table contains the
name of each substance,
the highest level allowed
by regulation (MCL), the
ideal goals for public
health (MCLG), the
amount detected, the
usual sources of such
contamination, and whether or not Waterworks meets the set regulation. For help
understanding the tables, please see the key terms on the next page and the foot-
notes at the bottom of the table. Tables with the results of testing for unregulated
substances and non-regulated microbials can be found on pages 8 and 10.
An expanded version of the tables in this report, which list additional test results,
can be found on our website at nnva.gov/waterqualityreport. A separate water
quality report is available for our Lightfoot well system customers in York County.
That report also can be found on our website. To request that copies of these
reports be mailed to you, call Newport News Waterworks Customer Service at
757-926-1000.
KEY TERMS
We’ve defined these water-quality terms and abbreviations, some unique to the water
industry, to help you better understand the test results on the following pages.
AL: Action Level - The concentration of a
contaminant which, if exceeded, triggers
treatment or other requirements that a
water system must follow.
MCL: Maximum Contaminant Level - The
highest level of a contaminant that is
allowed in drinking water. MCLs are set
as close to the MCLGs as feasible, using
the best available treatment technology.
MCLG: Maximum Contaminant Level
Goal - The level of a contaminant in
drinking water below which there is no
known or expected risk to health. MCLGs
allow for a margin of safety.
MRDL: Maximum Residual Disinfectant
Level - The highest level of a disinfectant
allowed in drinking water. The addition
of a disinfectant is necessary for control
of microbial contaminants.
MRDLG: Maximum Residual Disinfectant
Level Goal - The level of a drinking
water disinfectant below which there
is no known or expected risk to health.
MRDLGs do not reflect the benefits of
the use of disinfectants to control
microbial contamination.
MRL: Minimum Reporting Level -
Estimate of the lowest concentration of a
compound that laboratories would report
as a detection.
ND: Not detected - Does not equate
to zero, but refers to an amount below
analytical reporting limits.
NTU: Nephelometric Turbidity
Unit - A measure of water clarity.
Turbidity greater than five (5) NTUs is
just noticeable to the average person.
pCi/L: Picocuries per liter - A
measure of radioactivity. EPA
considers 50 pCi/L to be the level
of concern for beta particles.
ppb: Parts per billion or micrograms per
liter (μg/L). Equivalent to one penny in
$10 million.
ppm: Parts per million or milligrams
per liter (mg/L). Equivalent to one pen-
ny in $10 thousand.
ppt: Parts per trillion or nanograms per
liter [ng/L]. Equivalent to one penny in
$10 billion.
TT: Treatment Technique - A required
process intended to reduce the level of
a contaminant in drinking water.
Turbidity: A measure of water clarity,
which serves as an indicator of the
treatment facility’s performance.

ANNUAL DRINKING WATER QUALITY REPORT 2019 76 NEWPORT NEWS WATERWORKS
WATER QUALITY TESTING RESULTSREGULATED SUBSTANCES
Contaminant Unit
EPA’s Ideal Goal(MCLG)
Highest EPAAllowed Level(MCL)
Highest Reportable Result (what we found)
Range of Individual Test Results Low-High
Meets State & Federal Standards Likely Source
INORGANICS
Copper ppm 0 AL = 1.3 0.0621 0.008-0.319 YES Corrosion of household plumbing
Lead ppb 0 AL = 15 <1.01 <1.0 YES Corrosion of household plumbing
Fluoride ppm 4 4 0.93 0.66-0.93 YES Added to promote strong teeth
Barium ppm 2 2 0.027 0.026-0.027 YES Erosion of natural deposits
Nitrate ppm 10 10 0.057 0.057 YES Erosion of natural deposits
Nitrite ppm 1 1 0.002 <0.001-0.002 YES Erosion of natural deposits
DISINFECTION BY-PRODUCTS AND PRECURSORS
Total Trihalomethanes (TTHM) ppb 0 80 202 2-24 YES By-product of chlorination
Haloacetic Acids (HAA5) ppb 0 60 192 2-22 YES By-product of chlorination
Total Organic Carbon (TOC) Removal none TT 1.323 0.68-1.69 YES Naturally present in the environment
MICROBIOLOGICAL
Turbidity NTU n/a TT 0.214 0.02-0.21 YES Soil runoff
Total Chlorine (Chloramines) ppm MRDLG=4.0 MRDL=4.0 3.25 <0.02-5.35 YES Water additive (disinfectant) used to control microbes
RADIOLOGICAL (FROM TESTING COMPLETED IN 2016)
Radium-228 pCi/L 0 5 0.6 <0.6-0.6 YES Erosion of natural deposits
Beta emitters pCi/L 0 4 2.5 1.4-2.5 YES Decay of natural & man-made deposits
Footnotes:
Except for radiological testing, which was completed in 2016, the results reported in the table above are for samples taken in 2018-2019. Samples taken in 2018 are part of required four-quarter or annual running averages.
(1) At least 90% of the samples were at or below this level. None of the individual samples exceeded the Action Level. Because our lead and copper levels are
so low, we only have to test every three years. Lead and copper testing was completed in 2019. (2) The highest detected levels of THM and HAA are based on
a specific location’s four-quarter running average. The range numbers are the results from individual samples. The data in “Highest Result” column include
samples from 2018. The range is for samples taken in 2019. (3) Compliance is based on a running four-quarter average. The range is the individual monthly
ratio from both water treatment plants. TOC has no adverse health effects, but can be a critical component in the formation of disinfection by-products. The
data in the “Highest Result” column includes samples from 2018. The range is for samples taken in 2019. (4) Turbidity is a measure of water cloudiness. It is
a good indicator of the effectiveness of our filtration system. 100% of samples were within the turbidity limit. (5) For Chloramines, a system-wide annual
running average is used. The range numbers are the results of individual samples. The data in the “Highest Result” column includes samples from 2018. The
range is for samples taken in 2019.
MCLs are set at very stringent
levels. To experience the possible
health effects described for many
regulated contaminants, a person
would have to drink two liters of
water at the MCL level every day
for a lifetime to have a one-in-a-
million chance of having a possible
health effect.

ANNUAL DRINKING WATER QUALITY REPORT 2019 98 NEWPORT NEWS WATERWORKS
UNREGULATED CONTAMINANT MONITORING REGULATION-4
(UCMR4)
UNREGULATED CONTAMINANTS
Contaminant Unit MRL Average
Range of Test Results (Low-High)
Sources and Comments
Manganese μg/L 0.4 9.6 2.91-24.1
Naturally-occurring element; commercially available in combination with other elements and minerals; used in steel production, fertilizer, batteries and fireworks; drinking water and wastewater treatment chemical; essential nutrient
Haloacetic Acids
Dicloroacetic Acid (DCAA) μg/L 0.2 11.6 1.6-27.1
By-product of drinking water chlorination
Trichloroacetic Acid (TCAA) 0.5 3.0 0.7-11.7
By-product of drinking water chlorination
Dibromoacetic Acid (DBAA) 0.3 <0.3 <0.3-0.4
By-product of drinking water chlorination
Bromochloro- acetic Acid (BCAA) 0.3 2.2 0.4-3.3
By-product of drinking water chlorination
Bromodichloro- acetic Acid (BDCAA) 0.5 0.8 <0.5-2.3
By-product of drinking water chlorination
Chlorodibromo- acetic Acid (CDBAA) 0.3 <0.3 <0.3-0.7
By-product of drinking water chlorination
ADDITIONAL TESTING
In 2019, Waterworks participated in the EPA’s fourth round of the Unregulated
Contaminant Monitoring Rule (UCMR4). Unregulated contaminants are those
that don’t yet have a drinking water standard set by the EPA. The purpose of
monitoring for these contaminants is to help the EPA decide whether they need
to be regulated in the future in order to protect public health. The results for
contaminants we detected are shown in the table below.
IMPORTANT HEALTH INFORMATION
Cryptosporidium is a parasitic microbe found in surface waters throughout the
U.S. Our monitoring indicates the presence of these organisms at very low levels
in our source water but not in our treated water. Current test methods approved
by the EPA do not allow us to determine if the organisms are dead or if they
are capable of causing diease. Ingestion of Cryptosporidium may cause
cryptosporidiosis, an abdominal
infection. Symptoms of infection
include nausea, diarrhea, and
abdominal cramps.
Cryptosporidium must be ingested
to cause disease, and it may be spread
through means other than drinking
water. Most healthy individuals can
overcome the disease within a few
weeks. However, immuno-compromised people, infants and small children, and
the elderly are at greater risk of developing life-threatening illness.
We encourage immuno-compromised individuals to consult their doctor
regarding appropriate precautions to take to avoid infection. EPA/CDC guidelines
on appropriate means to lessen the risk of infection by Cryptosporidium are
available from the Safe Drinking Water Hotline at 800-426-4791.
WATER QUALITY TESTING RESULTS
NON-REGULATED MICROBIALS MONITORED AT THE SOURCE*
Contaminant Unit MCLG MCL
Highest Amount Detected
Range of Test Results (Low-High) Likely Source
Cryptosporidium #/L 0 TT 0.041 <0.041-0.041
Human or animal fecal waste
* Found in source water only, not in treated water.
ANNUAL DRINKING WATER QUALITY REPORT 2019 1110 NEWPORT NEWS WATERWORKS
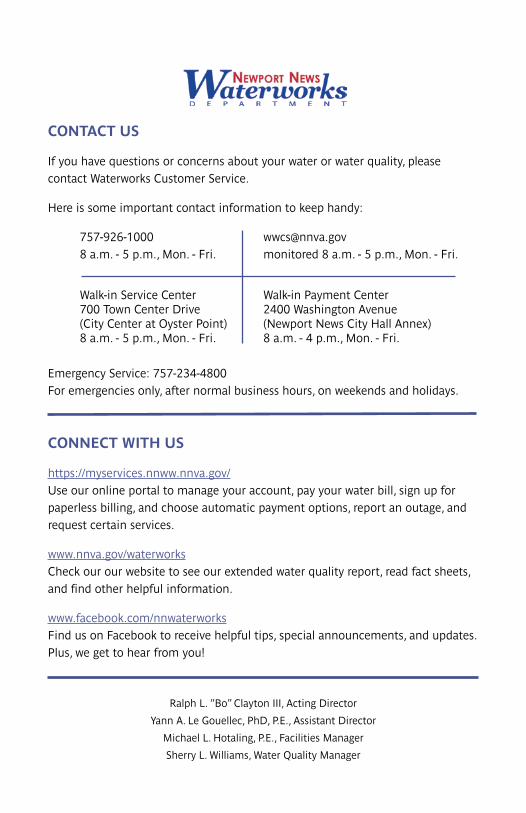
HOW WE TREAT YOUR WATER
Untreated water is pumped to our
treatment plants, where it passes through
screens, before aluminum sulfate (alum)
and polymer are added. These chemicals
cause tiny particles in the water to cling
together (coagulation), making the parti-
cles easier to remove. After the water is
clarified, ozone (disinfection) is added to
kill micro-organisms such as bacteria and
viruses. The water is then sent through
filters to remove any remaining particles
(filtration). Lime is added to adjust the pH, fluoride is added to prevent tooth
decay, and zinc orthophosphate is added to control corrosion inside the pipes.
Finally, chloramines, the secondary disinfectant, are added to maintain disinfection
through the pipe system while the water travels to your home or business.
The brackish groundwater is pumped to the desalination plant located at our
Lee Hall facility. Using a process called reverse osmosis, water is forced by high
pressure through membranes that can remove the salt and other contaminants
to produce very high quality water. When it is used, the finished water is blended
with treated surface water and sent out to our customers.
PUBLIC HEALTH PRECAUTIONS
Drinking water, including bottled water, may reasonably be expected to
contain at least small amounts of some contaminants. The presence
of contaminants does not necessarily indicate
that water poses a health risk. More information
about contaminants and potential health effects
can be obtained by calling the EPA’s Safe Drinking
Water Hotline at 800-426-4791.
Some people may be more vulnerable to contaminants
in drinking water than the general population. Immuno-
compromised persons, such as those with cancer undergoing
chemotherapy, persons who have undergone organ transplants,
people with HIV/AIDS or other immune system disorders,
some elderly, and infants may be particularly at risk from
infections. These people should seek advice about
drinking water from their health care providers.
Filter gallery pipes at our Lee Hall
Water Treatment Plant.
ABOUT LEAD
If present, elevated levels of lead can cause serious health problems, especially for
pregnant women and young children. We have not detected lead in the treated
water tested monthly at either of Waterworks’ treatment plants.
Lead in drinking water comes primarily from some materials associated with
service lines and home plumbing. Waterworks is responsible for providing high
quality drinking water, but cannot control the variety of materials used in
plumbing components.
To reduce the potential
for lead exposure,
Waterworks adds lime
during the treatment
process to adjust the
pH of the water and
reduce corrosion of
plumbing. We also add
zinc orthophosphate to
the water as a corrosion
inhibitor. Zinc orthophos-
phate forms a protective
layer on the inside of the pipes, which prevents lead and other metals from
dissolving into the water. Lime and zinc orthophosphate are harmless to humans
– especially in the quantities we use – and help prevent lead contamination.
Nonetheless, if your water has been sitting for several hours or longer, you can
further minimize the potential for lead exposure by running cold water until it
becomes as cold as it will get before using it for drinking or cooking. This could
take from 30 seconds to 2 minutes or even longer. Waterworks and the health
department recommend that you use only cold water for drinking, cooking, and
especially for making baby formula. Information on lead in drinking water, testing
methods, and steps you can take to minimize exposure are available from the
Safe Drinking Water Hotline at www.epa.gov/safewater/lead.

ANNUAL DRINKING WATER QUALITY REPORT 2019 1312 NEWPORT NEWS WATERWORKS
ADDITIONAL INFORMATION OF INTEREST
Sodium - The EPA has not set a standard for
sodium in drinking water. However, sodium levels are
usually low and unlikely to be a significant contribu-
tion to adverse health effects. The average level of
sodium found in our treated water in 2019 was 12.7
mg/L, and the range was 6.9-42.5. Should you have
a health concern, please contact your health care
provider.
Water Hardness - The EPA has not set a standard
for hardness. Water treated by Newport News
Waterworks is considered moderately hard (4-6
grains, which is equal to 70-120 mg/L as calcium
carbonate or CaCO3). In 2019 the average was 82
mg/L with a range of 58-112.
Fluoride - Fluoride is added to water to help prevent tooth decay. Newport News
Waterworks adheres to drinking water regulations set by the EPA and guidance
provided by the Virginia Department of Health
(VDH). VDH has adopted the recommendation
of 0.7 mg/l, set by the U.S. Department of Health
and Human Services, as the optimum level of flu-
oride concentration in drinking water. This is the
target Waterworks strives to achieve. Information
about fluoridation, oral health, and current issues
is available at www.cdc.gov/fluoridation.
CONTACT US
If you have questions or concerns about your water or water quality, please
contact Waterworks Customer Service.
Here is some important contact information to keep handy:
757-926-1000 [email protected]
8 a.m. - 5 p.m., Mon. - Fri. monitored 8 a.m. - 5 p.m., Mon. - Fri.
Walk-in Service Center Walk-in Payment Center 700 Town Center Drive 2400 Washington Avenue (City Center at Oyster Point) (Newport News City Hall Annex) 8 a.m. - 5 p.m., Mon. - Fri. 8 a.m. - 4 p.m., Mon. - Fri.
Emergency Service: 757-234-4800
For emergencies only, after normal business hours, on weekends and holidays.
CONNECT WITH US
https://myservices.nnww.nnva.gov/
Use our online portal to manage your account, pay your water bill, sign up for
paperless billing, and choose automatic payment options, report an outage, and
request certain services.
www.nnva.gov/waterworks
Check our our website to see our extended water quality report, read fact sheets,
and find other helpful information.
www.facebook.com/nnwaterworks
Find us on Facebook to receive helpful tips, special announcements, and updates.
Plus, we get to hear from you!
Ralph L. “Bo” Clayton III, Acting Director
Yann A. Le Gouellec, PhD, P.E., Assistant Director
Michael L. Hotaling, P.E., Facilities Manager
Sherry L. Williams, Water Quality Manager
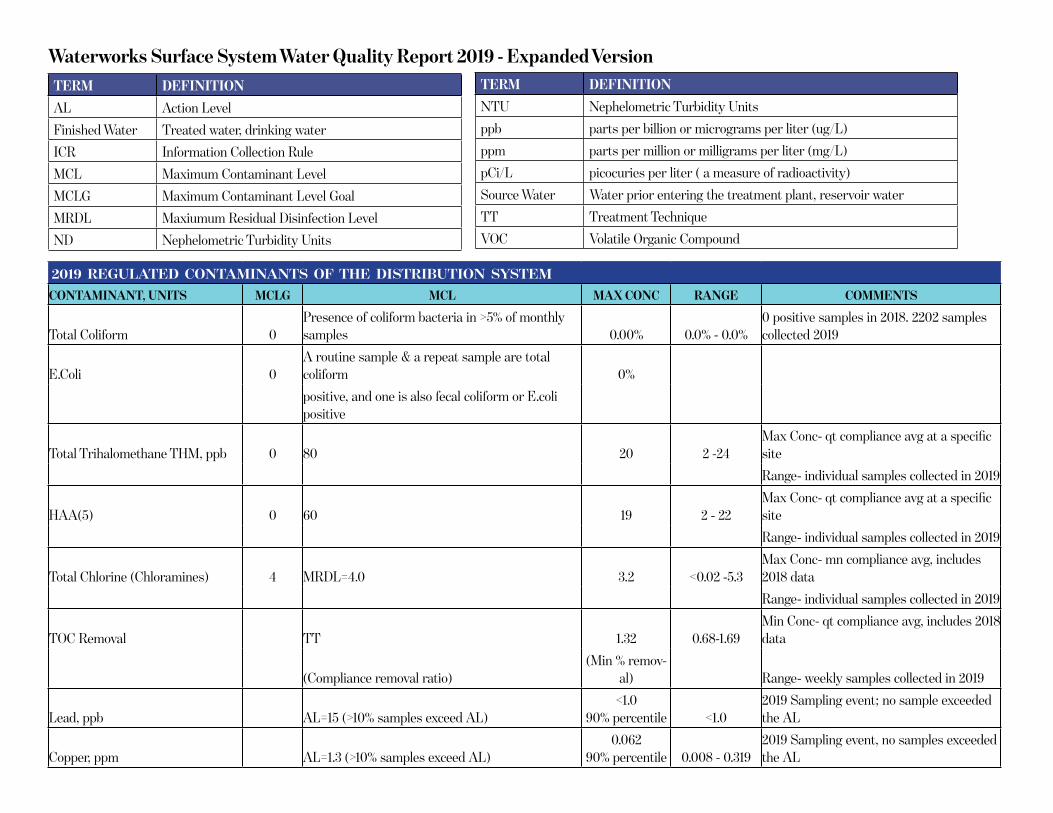
Waterworks Surface System Water Quality Report 2019 - Expanded Version
TERM DEFINITION
AL Action Level
Finished Water Treated water, drinking water
ICR Information Collection Rule
MCL Maximum Contaminant Level
MCLG Maximum Contaminant Level Goal
MRDL Maxiumum Residual Disinfection Level
ND Nephelometric Turbidity Units
TERM DEFINITION
NTU Nephelometric Turbidity Units
ppb parts per billion or micrograms per liter (ug/L)
ppm parts per million or milligrams per liter (mg/L)
pCi/L picocuries per liter ( a measure of radioactivity)
Source Water Water prior entering the treatment plant, reservoir water
TT Treatment Technique
VOC Volatile Organic Compound
2019 REGULATED CONTAMINANTS OF THE DISTRIBUTION SYSTEM
CONTAMINANT, UNITS MCLG MCL MAX CONC RANGE COMMENTS
Total Coliform 0Presence of coliform bacteria in >5% of monthly samples 0.00% 0.0% - 0.0%
0 positive samples in 2018. 2202 samples collected 2019
E.Coli 0A routine sample & a repeat sample are total coliform 0%
positive, and one is also fecal coliform or E.coli positive
Total Trihalomethane THM, ppb 0 80 20 2 -24Max Conc- qt compliance avg at a specific site
Range- individual samples collected in 2019
HAA(5) 0 60 19 2 - 22Max Conc- qt compliance avg at a specific site
Range- individual samples collected in 2019
Total Chlorine (Chloramines) 4 MRDL=4.0 3.2 <0.02 -5.3Max Conc- mn compliance avg, includes 2018 data
Range- individual samples collected in 2019
TOC Removal TT 1.32 0.68-1.69Min Conc- qt compliance avg, includes 2018 data
(Compliance removal ratio)(Min % remov-
al) Range- weekly samples collected in 2019
Lead, ppb AL=15 (>10% samples exceed AL)<1.0
90% percentile <1.0 2019 Sampling event; no sample exceeded the AL
Copper, ppm AL=1.3 (>10% samples exceed AL)0.062
90% percentile 0.008 - 0.3192019 Sampling event, no samples exceeded the AL
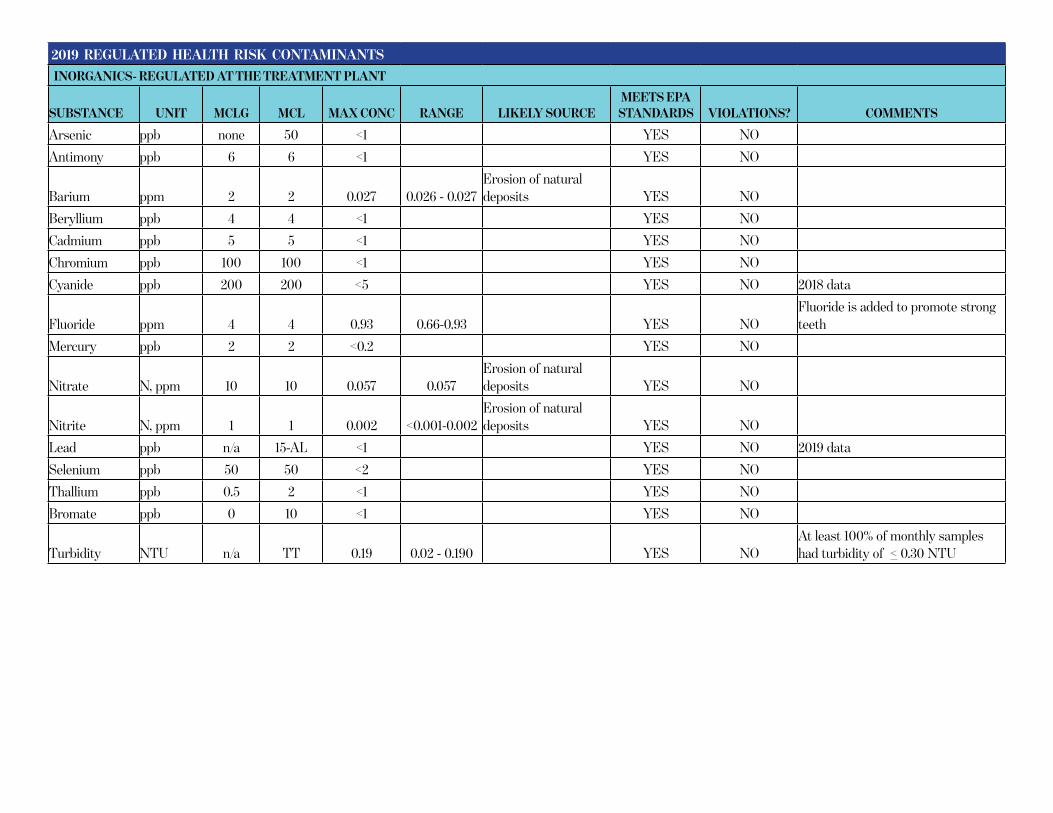
2019 REGULATED HEALTH RISK CONTAMINANTS
INORGANICS- REGULATED AT THE TREATMENT PLANT
SUBSTANCE UNIT MCLG MCL MAX CONC RANGE LIKELY SOURCEMEETS EPA
STANDARDS VIOLATIONS? COMMENTS
Arsenic ppb none 50 <1 YES NO
Antimony ppb 6 6 <1 YES NO
Barium ppm 2 2 0.027 0.026 - 0.027Erosion of natural deposits YES NO
Beryllium ppb 4 4 <1 YES NO
Cadmium ppb 5 5 <1 YES NO
Chromium ppb 100 100 <1 YES NO
Cyanide ppb 200 200 <5 YES NO 2018 data
Fluoride ppm 4 4 0.93 0.66-0.93 YES NOFluoride is added to promote strong teeth
Mercury ppb 2 2 <0.2 YES NO
Nitrate N, ppm 10 10 0.057 0.057Erosion of natural deposits YES NO
Nitrite N, ppm 1 1 0.002 <0.001-0.002Erosion of natural deposits YES NO
Lead ppb n/a 15-AL <1 YES NO 2019 data
Selenium ppb 50 50 <2 YES NO
Thallium ppb 0.5 2 <1 YES NO
Bromate ppb 0 10 <1 YES NO
Turbidity NTU n/a TT 0.19 0.02 - 0.190 YES NOAt least 100% of monthly samples had turbidity of < 0.30 NTU
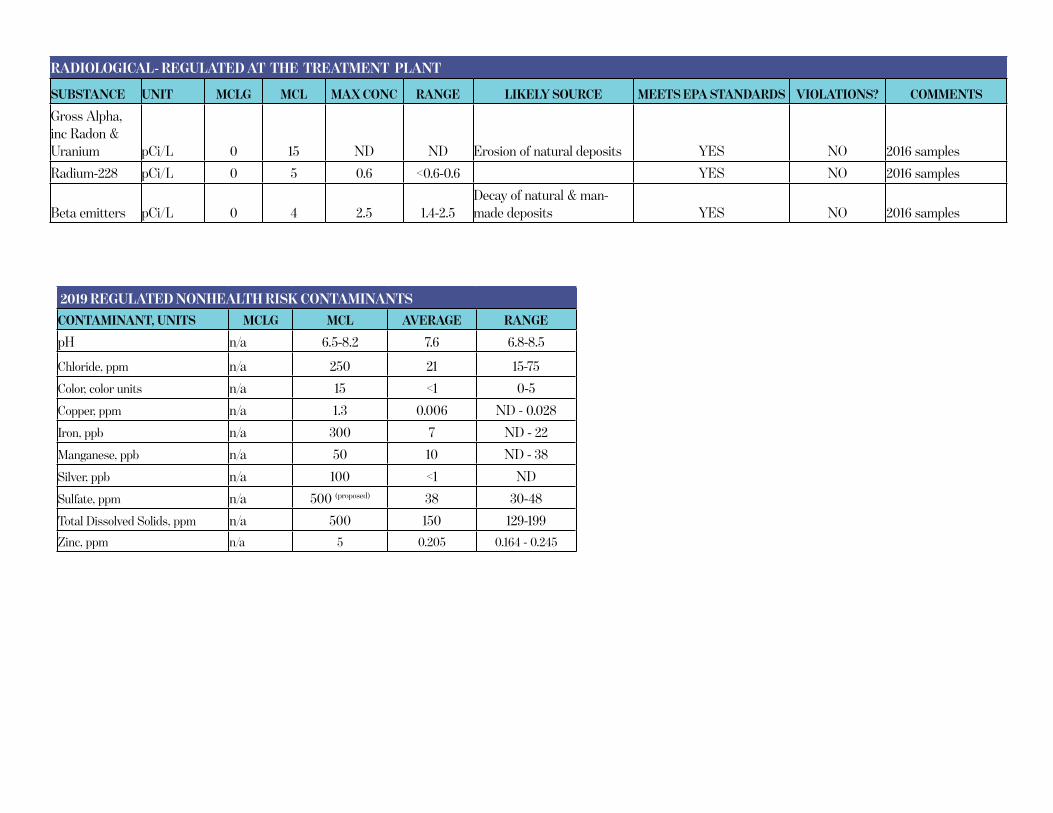
RADIOLOGICAL- REGULATED AT THE TREATMENT PLANT
SUBSTANCE UNIT MCLG MCL MAX CONC RANGE LIKELY SOURCE MEETS EPA STANDARDS VIOLATIONS? COMMENTS
Gross Alpha, inc Radon & Uranium pCi/L 0 15 ND ND Erosion of natural deposits YES NO 2016 samples
Radium-228 pCi/L 0 5 0.6 <0.6-0.6 YES NO 2016 samples
Beta emitters pCi/L 0 4 2.5 1.4-2.5Decay of natural & man-made deposits YES NO 2016 samples
2019 REGULATED NONHEALTH RISK CONTAMINANTS
CONTAMINANT, UNITS MCLG MCL AVERAGE RANGE
pH n/a 6.5-8.2 7.6 6.8-8.5
Chloride, ppm n/a 250 21 15-75
Color, color units n/a 15 <1 0-5
Copper, ppm n/a 1.3 0.006 ND - 0.028
Iron, ppb n/a 300 7 ND - 22
Manganese, ppb n/a 50 10 ND - 38
Silver, ppb n/a 100 <1 ND
Sulfate, ppm n/a 500 (proposed) 38 30-48
Total Dissolved Solids, ppm n/a 500 150 129-199
Zinc, ppm n/a 5 0.205 0.164 - 0.245
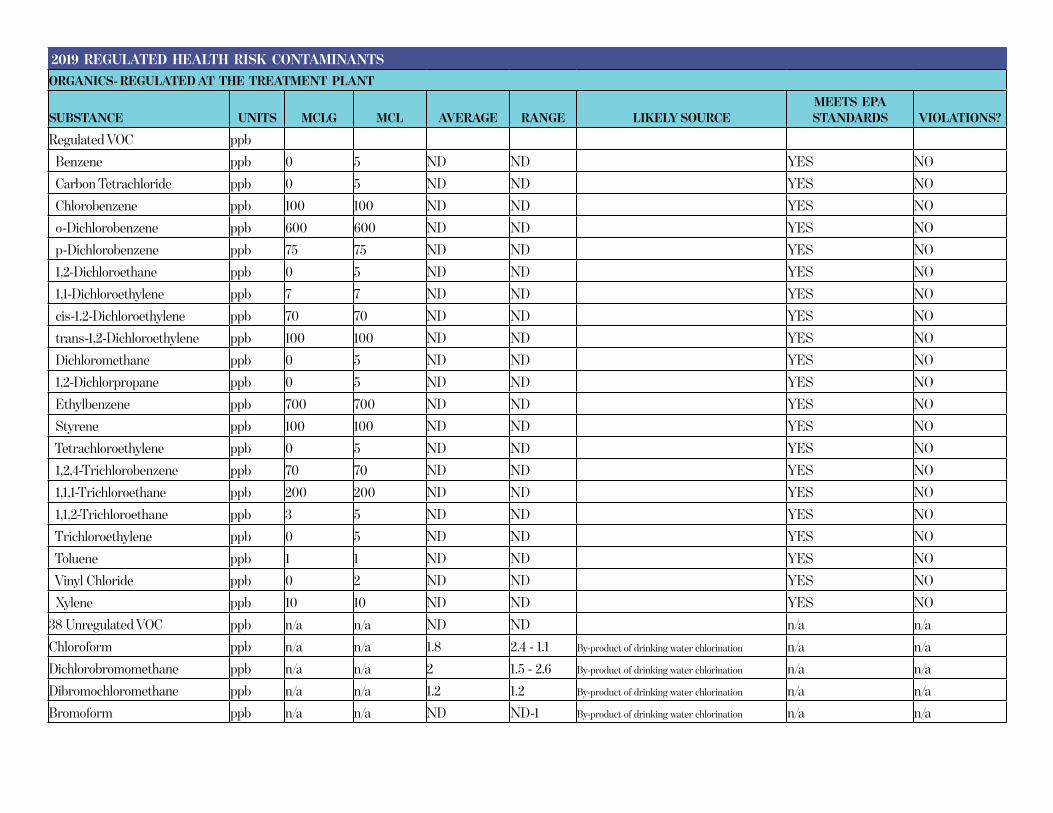
2019 REGULATED HEALTH RISK CONTAMINANTS
ORGANICS- REGULATED AT THE TREATMENT PLANT
SUBSTANCE UNITS MCLG MCL AVERAGE RANGE LIKELY SOURCEMEETS EPA STANDARDS VIOLATIONS?
Regulated VOC ppb
Benzene ppb 0 5 ND ND YES NO
Carbon Tetrachloride ppb 0 5 ND ND YES NO
Chlorobenzene ppb 100 100 ND ND YES NO
o-Dichlorobenzene ppb 600 600 ND ND YES NO
p-Dichlorobenzene ppb 75 75 ND ND YES NO
1,2-Dichloroethane ppb 0 5 ND ND YES NO
1,1-Dichloroethylene ppb 7 7 ND ND YES NO
cis-1.2-Dichloroethylene ppb 70 70 ND ND YES NO
trans-1,2-Dichloroethylene ppb 100 100 ND ND YES NO
Dichloromethane ppb 0 5 ND ND YES NO
1,2-Dichlorpropane ppb 0 5 ND ND YES NO
Ethylbenzene ppb 700 700 ND ND YES NO
Styrene ppb 100 100 ND ND YES NO
Tetrachloroethylene ppb 0 5 ND ND YES NO
1,2,4-Trichlorobenzene ppb 70 70 ND ND YES NO
1,1,1-Trichloroethane ppb 200 200 ND ND YES NO
1,1,2-Trichloroethane ppb 3 5 ND ND YES NO
Trichloroethylene ppb 0 5 ND ND YES NO
Toluene ppb 1 1 ND ND YES NO
Vinyl Chloride ppb 0 2 ND ND YES NO
Xylene ppb 10 10 ND ND YES NO
38 Unregulated VOC ppb n/a n/a ND ND n/a n/a
Chloroform ppb n/a n/a 1.8 2.4 - 1.1 By-product of drinking water chlorination n/a n/a
Dichlorobromomethane ppb n/a n/a 2 1.5 - 2.6 By-product of drinking water chlorination n/a n/a
Dibromochloromethane ppb n/a n/a 1.2 1.2 By-product of drinking water chlorination n/a n/a
Bromoform ppb n/a n/a ND ND-1 By-product of drinking water chlorination n/a n/a
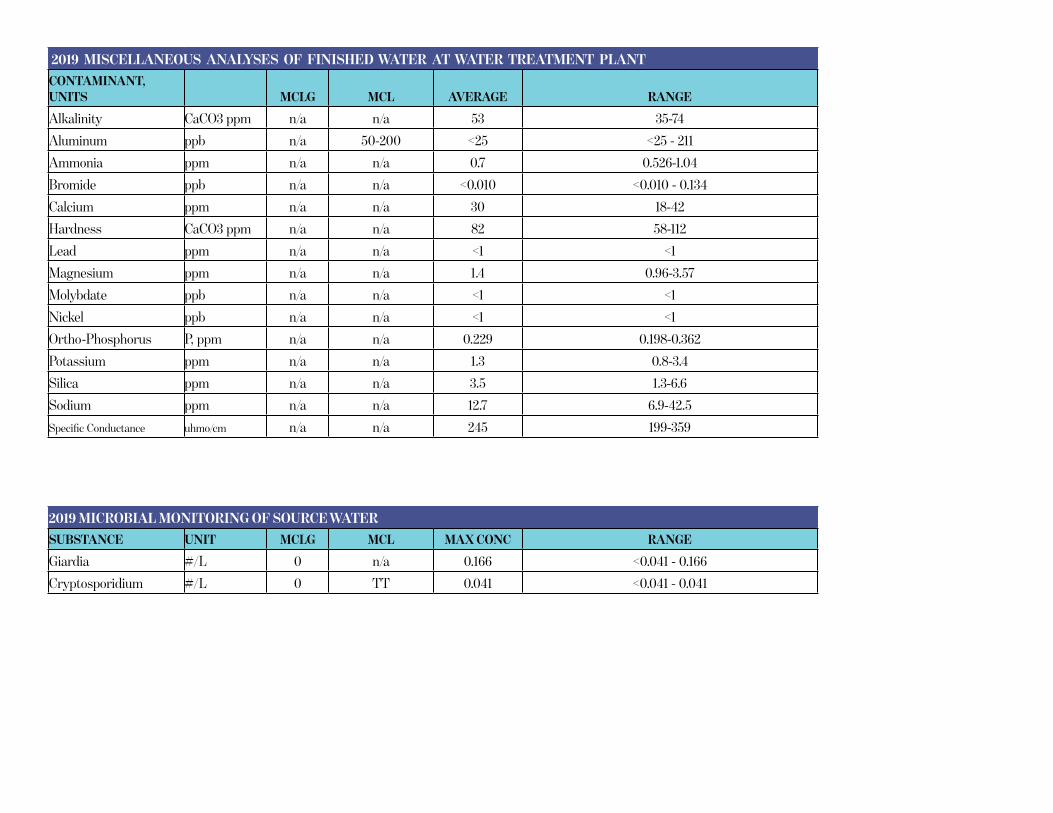
2019 MISCELLANEOUS ANALYSES OF FINISHED WATER AT WATER TREATMENT PLANT
CONTAMINANT, UNITS MCLG MCL AVERAGE RANGE
Alkalinity CaCO3 ppm n/a n/a 53 35-74
Aluminum ppb n/a 50-200 <25 <25 - 211
Ammonia ppm n/a n/a 0.7 0.526-1.04
Bromide ppb n/a n/a <0.010 <0.010 - 0.134
Calcium ppm n/a n/a 30 18-42
Hardness CaCO3 ppm n/a n/a 82 58-112
Lead ppm n/a n/a <1 <1
Magnesium ppm n/a n/a 1.4 0.96-3.57
Molybdate ppb n/a n/a <1 <1
Nickel ppb n/a n/a <1 <1
Ortho-Phosphorus P, ppm n/a n/a 0.229 0.198-0.362
Potassium ppm n/a n/a 1.3 0.8-3.4
Silica ppm n/a n/a 3.5 1.3-6.6
Sodium ppm n/a n/a 12.7 6.9-42.5
Specific Conductance uhmo/cm n/a n/a 245 199-359
2019 MICROBIAL MONITORING OF SOURCE WATER
SUBSTANCE UNIT MCLG MCL MAX CONC RANGE
Giardia #/L 0 n/a 0.166 <0.041 - 0.166
Cryptosporidium #/L 0 TT 0.041 <0.041 - 0.041
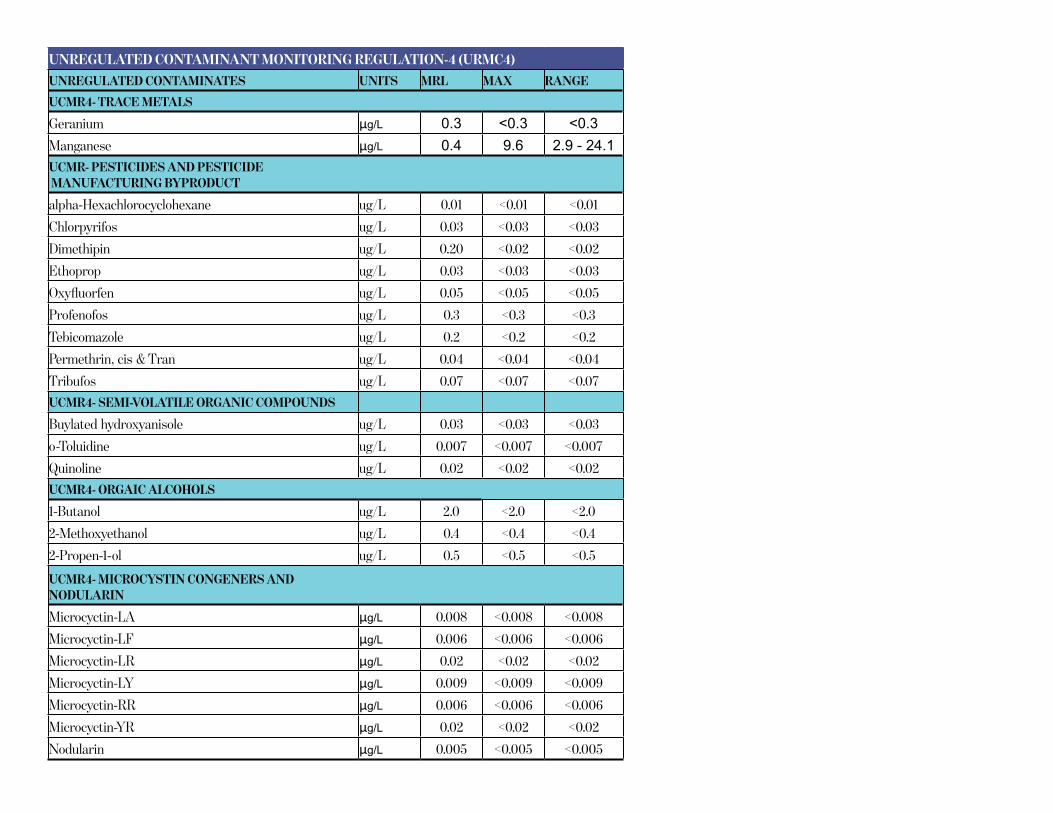
UNREGULATED CONTAMINANT MONITORING REGULATION-4 (URMC4)
UNREGULATED CONTAMINATES UNITS MRL MAX RANGE
UCMR4- TRACE METALS
Geranium μg/L 0.3 <0.3 <0.3Manganese μg/L 0.4 9.6 2.9 - 24.1UCMR- PESTICIDES AND PESTICIDE MANUFACTURING BYPRODUCT
alpha-Hexachlorocyclohexane ug/L 0.01 <0.01 <0.01
Chlorpyrifos ug/L 0.03 <0.03 <0.03
Dimethipin ug/L 0.20 <0.02 <0.02
Ethoprop ug/L 0.03 <0.03 <0.03
Oxyfluorfen ug/L 0.05 <0.05 <0.05
Profenofos ug/L 0.3 <0.3 <0.3
Tebicomazole ug/L 0.2 <0.2 <0.2
Permethrin, cis & Tran ug/L 0.04 <0.04 <0.04
Tribufos ug/L 0.07 <0.07 <0.07
UCMR4- SEMI-VOLATILE ORGANIC COMPOUNDS
Buylated hydroxyanisole ug/L 0.03 <0.03 <0.03
o-Toluidine ug/L 0.007 <0.007 <0.007
Quinoline ug/L 0.02 <0.02 <0.02
UCMR4- ORGAIC ALCOHOLS
1-Butanol ug/L 2.0 <2.0 <2.0
2-Methoxyethanol ug/L 0.4 <0.4 <0.4
2-Propen-1-ol ug/L 0.5 <0.5 <0.5
UCMR4- MICROCYSTIN CONGENERS AND NODULARIN
Microcyctin-LA μg/L 0.008 <0.008 <0.008
Microcyctin-LF μg/L 0.006 <0.006 <0.006
Microcyctin-LR μg/L 0.02 <0.02 <0.02
Microcyctin-LY μg/L 0.009 <0.009 <0.009
Microcyctin-RR μg/L 0.006 <0.006 <0.006
Microcyctin-YR μg/L 0.02 <0.02 <0.02
Nodularin μg/L 0.005 <0.005 <0.005
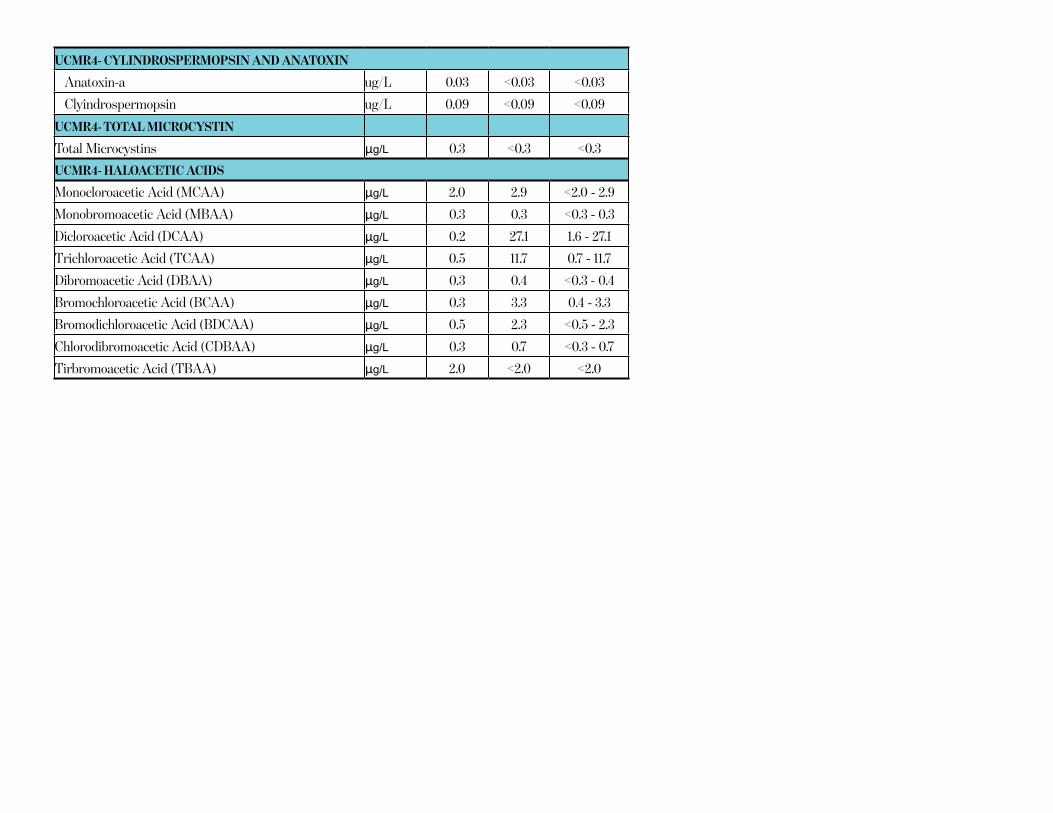
UCMR4- CYLINDROSPERMOPSIN AND ANATOXIN
Anatoxin-a ug/L 0.03 <0.03 <0.03
Clyindrospermopsin ug/L 0.09 <0.09 <0.09
UCMR4- TOTAL MICROCYSTIN
Total Microcystins μg/L 0.3 <0.3 <0.3
UCMR4- HALOACETIC ACIDS
Monocloroacetic Acid (MCAA) μg/L 2.0 2.9 <2.0 - 2.9
Monobromoacetic Acid (MBAA) μg/L 0.3 0.3 <0.3 - 0.3
Dicloroacetic Acid (DCAA) μg/L 0.2 27.1 1.6 - 27.1
Trichloroacetic Acid (TCAA) μg/L 0.5 11.7 0.7 - 11.7
Dibromoacetic Acid (DBAA) μg/L 0.3 0.4 <0.3 - 0.4
Bromochloroacetic Acid (BCAA) μg/L 0.3 3.3 0.4 - 3.3
Bromodichloroacetic Acid (BDCAA) μg/L 0.5 2.3 <0.5 - 2.3
Chlorodibromoacetic Acid (CDBAA) μg/L 0.3 0.7 <0.3 - 0.7
Tirbromoacetic Acid (TBAA) μg/L 2.0 <2.0 <2.0
QUALITYAnnual
WATERREPORT
2019
Lightfoot System
Summarizing test results from
Annual Drinking Water Quality Report 2019 1
INSIDE
Your Water Utility ................................................................................................................................... 1
How We Test Your Water ........................................................................................................................2
Additional Information of Interest ........................................................................................................2
Key Terms ................................................................................................................................................3
Water Quality Testing Results .......................................................................................................... 4-5
How Hard Is My Water? .........................................................................................................................5
Where Your Water Comes From ..........................................................................................................6
Source Water Assessment .....................................................................................................................6
How We Treat Your Water .....................................................................................................................6
More About Source Water .....................................................................................................................7
Important Health Information ...............................................................................................................8
About Lead ...............................................................................................................................................8
Contact Information ............................................................................................................. Back Cover
YOUR WATER UTILITY
Newport News Waterworks serves as a
regional water provider for five jurisdictions:
Newport News, Hampton, Poquoson, York
County and part of James City County.
We are committed to providing a reliable
supply of high quality drinking water to our
customers. Our drinking water is treated
and tested using state-of-the-art equipment
and advanced procedures, and it meets or
exceeds state and federal standards. The
bottom line: The quality of your water is excellent.
ABOUT THIS REPORT
This annual water quality report or “Consumer Confidence Report” is written, prepared and
distributed by the City of Newport News Waterworks Department (Waterworks) as required by
the Safe Drinking Water Act. It is reviewed and approved by the Virginia Department of Health,
Office of Drinking Water in Richmond. This report explains where your water comes from, what
our tests show about it and other things you should know about your drinking water.
The report provides details about the water you drink every day as a customer of Newport
News Waterworks. We test our water for the presence of more than 100 substances, and this
report includes a chart showing you the levels of several regulated and non-regulated substanc-
es we detected in 2019. Our goal is to meet your need for a clean, safe supply of drinking water
at a reasonable cost, while providing long-term management of our water resources.
This report is available on our website at www.nnva.gov/waterqualityreport, where you also can
find the water quality report for our surface water system and additional test results for both
systems. A paper copy of this report is available at the Williamsburg Regional Library in Norge
and at in our walk-in services lobby in Newport News. If you would like to receive a copy of this
report in the mail, please call Waterworks Customer Service at 757-926-1000.
HOW CAN I GET INVOLVED?
Since Waterworks is a department of the City
of Newport News, major decisions about your
drinking water are made by Newport News
City Council. They meet on the second and
fourth Tuesdays of each month at 7:00 pm,
and you are welcome to attend and partici-
pate. These meetings are broadcast live on
the Newport News City Channel (in Newport
News - Cox channel 48 and Verizon FIOS
channel 19) and streamed live on Facebook at www.facebook.com/NewportNewsTV. They
also can be viewed live or on-demand by all customers in our service area at
www.nnva.gov/nntv.

ANNUAL Drinking Water Quality Report 2019 32 Newport News Waterworks - Lightfoot System
HOW WE TEST YOUR WATER
To ensure that the water provided to you is safe to drink, the Virginia Department of Health
and the EPA set limits on the amounts of certain substances in water provided by public water
systems. We routinely monitor for substances in your drinking water according to these federal
and state laws. (The U.S. Food and Drug Administration is responsible for setting these limits
on bottled water.) The table on pages 4 and 5 includes the monitoring results for samples
collected by Newport News Waterworks in 2016, 2018 and 2019. Every regulated substance that
was detected in the water, even in the smallest amounts, is listed in the table.
The table contains the name of each substance, the highest level allowed by regulation (MCL),
the ideal goals for public health (MCLG), the
amount detected, the usual sources of such
contamination, and whether or not Water-
works meets the set regulation. For help
understanding the table, please see the defini-
tions on the next page and the footnotes at the
bottom of the table. More information about
contaminants and potential health effects can
be obtained by calling the EPA’s toll free Safe
Drinking Water Hotline at 1-800-426-4791.
An expanded version of the tables in this report, which lists additional test results, can be found
on our website at www.nnva.gov/waterqualityreport. (Be sure to view the Lightfoot Well System
Report). A second water quality report is available on our website for our customers on the
Lower Peninsula, who are served by our surface water supply system. To request that copies of
these reports be mailed to you, call Newport News Waterworks Customer Service at 757-926-1000.
KEY TERMS
We’ve defined these water-quality terms, unique to the water industry,
to help you better understand the test results on the following pages.
AL: Action Level - The concentration of a
contaminant which, if exceeded, triggers
treatment or other requirements that a
water system must follow.
MCL: Maximum Contaminant Level - The
highest level of a contaminant that is allowed
in drinking water. MCLs are set as close
to the MCLGs as feasible, using the best
available treatment technology.
MCLG: Maximum ContaXXmnant
Level Goal - The level of a contaminant
in drinking water below which there is no
known or expected risk to health. MCLGs
allow for a margin of safety.
MRDL: Maximum Residual
Disinfectant Level - The highest level of a
disinfectant allowed in drinking water. The
addition of a disinfectant is necessary for
control of microbial contaminants.
MRDLG: Maximum Residual
Disinfectant Level Goal - The level of a
drinking water disinfectant below which
there is no known or expected risk to health.
MRDLGs do not reflect the benefits of the
use of disinfectants to control microbial
contamination.
MRL: Minimum Reporting Level -
Estimate of the lowest concentration of a
compound that laboratories would report
as a detection.
ND: Not detected - Does not equate to zero,
but refers to an amount below analytical
reporting limits.
pCi/L: Picocuries per liter - A measure of
radioactivity. EPA considers 50 pCi/L to be
the level of concern for beta particles.
ppb: Parts per billion or micrograms per
liter (μg/L). Equivalent to one penny in
$10 million.
ppm: Parts per million or milligrams per
liter (mg/L). Equivalent to one penny in
$10 thousand.
ppt: Parts per trillion or nanograms per
liter [ng/L]. Equivalent to one penny in
$10 billion.
TT: Treatment Technique - A required
process intended to reduce the level of a
contaminant in drinking water.
ADDITIONAL INFORMATION OF INTEREST
Sodium - The EPA has not set a standard for sodium in
drinking water. However, sodium levels are usually low and
unlikely to be a significant contribution to adverse health
effects. The average level of sodium found in our treated
water in 2018 was 51 mg/L, and the range was 35-66. Should
you have a health concern, please contact your health care
provider.
Fluoride - No additional fluoride is added to your well water. Any fluoride
detected is naturally occurring.
Annual Drinking Water Quality Report 2019 54 Newport News Waterworks - Lightfoot System
Footnotes:
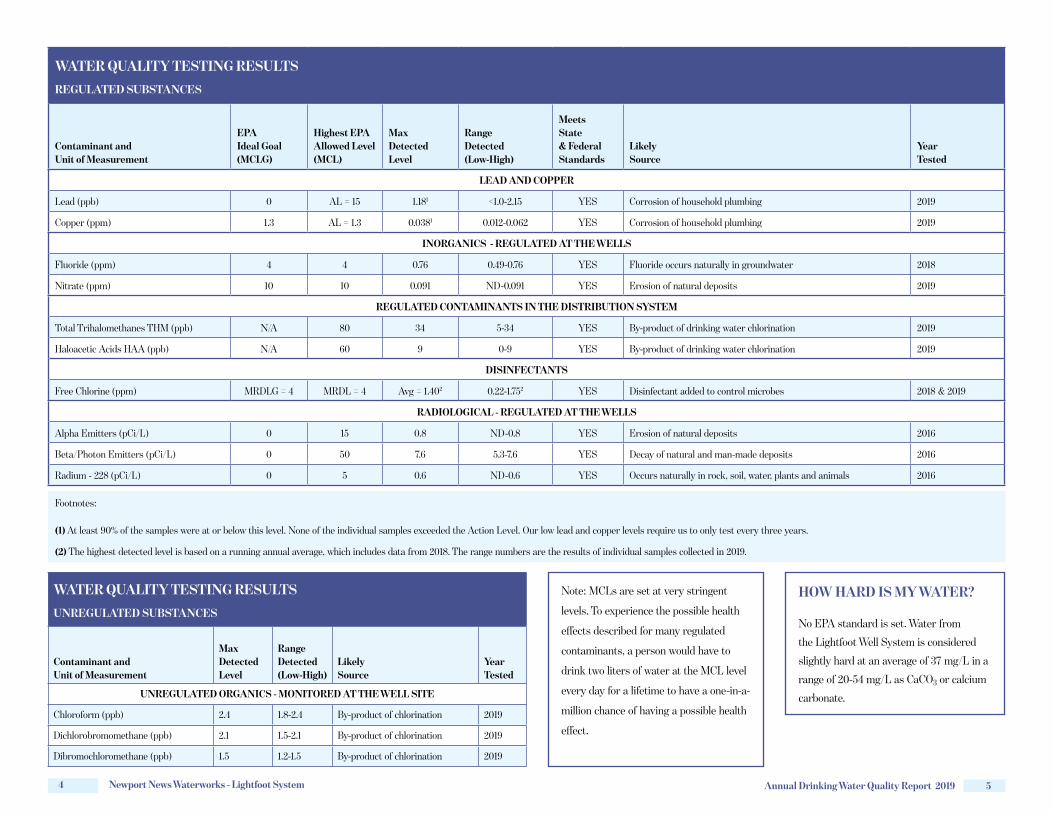
(1) At least 90% of the samples were at or below this level. None of the individual samples exceeded the Action Level. Our low lead and copper levels require us to only test every three years.
(2) The highest detected level is based on a running annual average, which includes data from 2018. The range numbers are the results of individual samples collected in 2019.
Note: MCLs are set at very stringent
levels. To experience the possible health
effects described for many regulated
contaminants, a person would have to
drink two liters of water at the MCL level
every day for a lifetime to have a one-in-a-
million chance of having a possible health
effect.
WATER QUALITY TESTING RESULTS
REGULATED SUBSTANCES
Contaminant and Unit of Measurement
EPA Ideal Goal (MCLG)
Highest EPA Allowed Level (MCL)
Max Detected Level
Range Detected (Low-High)
Meets State & Federal Standards
Likely Source
Year Tested
LEAD AND COPPER
Lead (ppb) 0 AL = 15 1.181 <1.0-2.15 YES Corrosion of household plumbing 2019
Copper (ppm) 1.3 AL = 1.3 0.0381 0.012-0.062 YES Corrosion of household plumbing 2019
INORGANICS - REGULATED AT THE WELLS
Fluoride (ppm) 4 4 0.76 0.49-0.76 YES Fluoride occurs naturally in groundwater 2018
Nitrate (ppm) 10 10 0.091 ND-0.091 YES Erosion of natural deposits 2019
REGULATED CONTAMINANTS IN THE DISTRIBUTION SYSTEM
Total Trihalomethanes THM (ppb) N/A 80 34 5-34 YES By-product of drinking water chlorination 2019
Haloacetic Acids HAA (ppb) N/A 60 9 0-9 YES By-product of drinking water chlorination 2019
DISINFECTANTS
Free Chlorine (ppm) MRDLG = 4 MRDL = 4 Avg = 1.402 0.22-1.752 YES Disinfectant added to control microbes 2018 & 2019
RADIOLOGICAL - REGULATED AT THE WELLS
Alpha Emitters (pCi/L) 0 15 0.8 ND-0.8 YES Erosion of natural deposits 2016
Beta/Photon Emitters (pCi/L) 0 50 7.6 5.3-7.6 YES Decay of natural and man-made deposits 2016
Radium - 228 (pCi/L) 0 5 0.6 ND-0.6 YES Occurs naturally in rock, soil, water, plants and animals 2016
WATER QUALITY TESTING RESULTS
UNREGULATED SUBSTANCES
Contaminant and Unit of Measurement
Max Detected Level
Range Detected (Low-High)
Likely Source
Year Tested
UNREGULATED ORGANICS - MONITORED AT THE WELL SITE
Chloroform (ppb) 2.4 1.8-2.4 By-product of chlorination 2019
Dichlorobromomethane (ppb) 2.1 1.5-2.1 By-product of chlorination 2019
Dibromochloromethane (ppb) 1.5 1.2-1.5 By-product of chlorination 2019
HOW HARD IS MY WATER?
No EPA standard is set. Water from
the Lightfoot Well System is considered
slightly hard at an average of 37 mg/L in a
range of 20-54 mg/L as CaCO3 or calcium
carbonate.
Annual Drinking Water Quality Report 2019 76 Newport News Waterworks - Lightfoot System
WHERE YOUR WATER COMES FROM
Your drinking water comes from fresh water wells
located in the Lightfoot area. These wells provide, on
average, a little more than 360,000 gallons of water per
day to our Lightfoot customers.
SOURCE WATER ASSESSMENT
The Virginia Department of Health (VDH) conducted its Source Water Assessment of the
Lightfoot Wells in 2002. Using the criteria developed by the state in its approved Source Water
Assessment Program, the VDH determined the
susceptibility to contamination was high for one of
the two wells. One way our well water customers
can protect their drinking water is by keeping
septic systems in good repair and ensure they are
functioning properly.
The assessment report consists of maps showing the Source Water Assessment area; inven-
tory of known land use activities, potential conduits to groundwater, and potential sources of
contamination of concern; susceptibility explanation chart; and definitions of key terms. The
Source Water Assessment is available from Waterworks by contacting Customer Service at
757-926-1000.
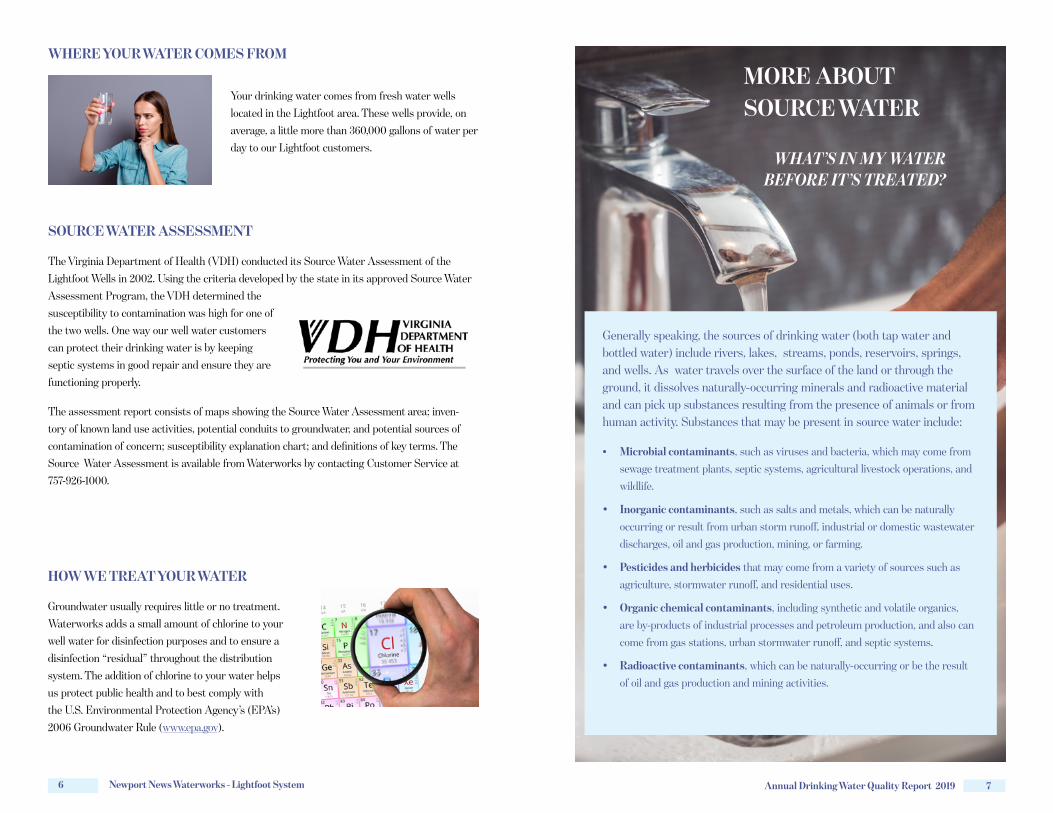
MORE ABOUT SOURCE WATER
Generally speaking, the sources of drinking water (both tap water and bottled water) include rivers, lakes, streams, ponds, reservoirs, springs, and wells. As water travels over the surface of the land or through the ground, it dissolves naturally-occurring minerals and radioactive material and can pick up substances resulting from the presence of animals or from human activity. Substances that may be present in source water include:
• Microbial contaminants, such as viruses and bacteria, which may come from
sewage treatment plants, septic systems, agricultural livestock operations, and
wildlife.
• Inorganic contaminants, such as salts and metals, which can be naturally
occurring or result from urban storm runoff, industrial or domestic wastewater
discharges, oil and gas production, mining, or farming.
• Pesticides and herbicides that may come from a variety of sources such as
agriculture, stormwater runoff, and residential uses.
• Organic chemical contaminants, including synthetic and volatile organics,
are by-products of industrial processes and petroleum production, and also can
come from gas stations, urban stormwater runoff, and septic systems.
• Radioactive contaminants, which can be naturally-occurring or be the result
of oil and gas production and mining activities.
WHAT’S IN MY WATER BEFORE IT’S TREATED?
HOW WE TREAT YOUR WATER
Groundwater usually requires little or no treatment.
Waterworks adds a small amount of chlorine to your
well water for disinfection purposes and to ensure a
disinfection “residual” throughout the distribution
system. The addition of chlorine to your water helps
us protect public health and to best comply with
the U.S. Environmental Protection Agency’s (EPA’s)
2006 Groundwater Rule (www.epa.gov).
8 Newport News Waterworks - Lightfoot System
IMPORTANT HEALTH INFORMATION
Drinking water, including bottled water, may reasonably be expected to contain at
least small amounts of some contaminants. The presence of contaminants does not
necessarily indicate that water poses a health risk. More
information about contaminants and potential health effects
can be obtained by calling the EPA’s Safe Drinking Water
Hotline at 800-426-4791. Some people may be more vulnerable to
contaminants in drinking water than the general population.
Immuno-compromised persons such as those with cancer undergoing
chemotherapy, persons who have undergone organ transplants, people with HIV/
AIDS or other immune system disorders, some elderly, and infants may be
particularly at risk from infections. These people should seek advice about
drinking water from their health care providers.
ABOUT LEAD
If present, elevated levels of lead can cause serious health problems, especially
for pregnant women and young children. We have not detected lead in the Lightfoot System
water that we tested at the wells. Lead in drinking water comes primarily from some
materials and components associated with service lines and home plumbing. Newport News
Waterworks is responsible for providing high quality drinking water but cannot control the
variety of materials used in plumbing components.
If your water has been sitting for several hours or longer,
you can minimize the potential for lead exposure by
running cold water until it becomes as cold as it will get
before using it for drinking or cooking. This could take
30 seconds to 2 minutes or longer. Waterworks and the
health department recommend that you use only cold
water for drinking, cooking, and especially for making
baby formula.
If you are concerned about lead in your water, you may
wish to have your water tested. Information on lead in
drinking water, testing methods, and steps you can
take to minimize any exposure is available from the Safe
Drinking Water Hotline (1-800-426-4791) or at epa.gov/safewater/lead.

CONTACT US
If you have questions or concerns about your water or water quality, please
contact Waterworks Customer Service.
Here is some important contact information to keep handy:
757-926-1000 [email protected] 8 a.m. - 5 p.m., Mon. - Fri. monitored 8 a.m. - 5 p.m., Mon. - Fri.
Walk-in Service Center Walk-in Payment Center 700 Town Center Drive 2400 Washington Avenue (City Center at Oyster Point) (Newport News City Hall Annex) 8 a.m. - 5 p.m., Mon. - Fri. 8 a.m. - 4 p.m., Mon. - Fri.
Emergency Service: 757-234-4800
For emergencies only, after normal business hours, on weekends and holidays.
CONNECT WITH US
https://myservices.nnww.nnva.gov
Use our online portal to manage your account, pay your water bill, sign up for paperless billing,
and choose automatic payment options, report an outage, and request certain services.
www.nnva.gov/waterworks
Check our our website to see our extended water quality report, read fact sheets, and find other
helpful information.
www.facebook.com/nnwaterworks
Find us on Facebook to receive helpful tips, special announcements, and updates. Plus, we get to
hear from you!
Ralph L. “Bo” Clayton III, Acting Director
Yann A. Le Gouellec, PhD, P. E., Assistant Director
Michael L. Hotaling, P. E., Facilities Manager
Sherry L. Williams, Water Quality Manager
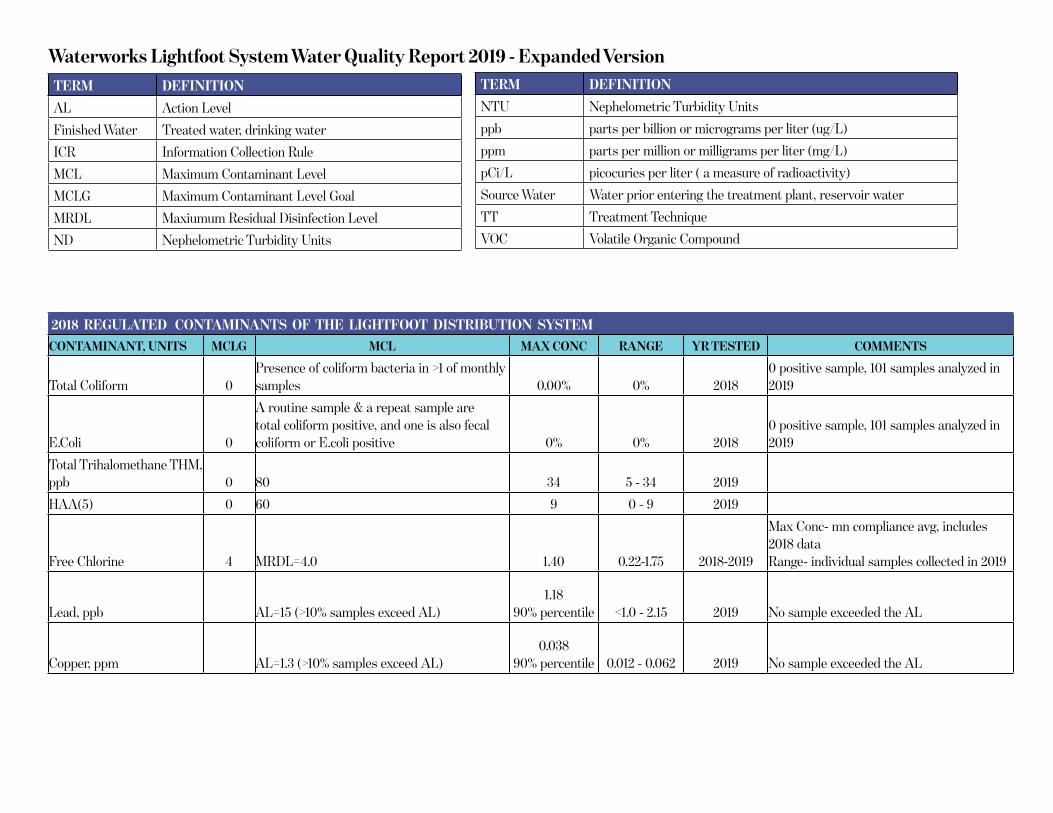
Waterworks Lightfoot System Water Quality Report 2019 - Expanded Version
TERM DEFINITION
AL Action Level
Finished Water Treated water, drinking water
ICR Information Collection Rule
MCL Maximum Contaminant Level
MCLG Maximum Contaminant Level Goal
MRDL Maxiumum Residual Disinfection Level
ND Nephelometric Turbidity Units
TERM DEFINITION
NTU Nephelometric Turbidity Units
ppb parts per billion or micrograms per liter (ug/L)
ppm parts per million or milligrams per liter (mg/L)
pCi/L picocuries per liter ( a measure of radioactivity)
Source Water Water prior entering the treatment plant, reservoir water
TT Treatment Technique
VOC Volatile Organic Compound
2018 REGULATED CONTAMINANTS OF THE LIGHTFOOT DISTRIBUTION SYSTEM
CONTAMINANT, UNITS MCLG MCL MAX CONC RANGE YR TESTED COMMENTS
Total Coliform 0Presence of coliform bacteria in >1 of monthly samples 0.00% 0% 2018
0 positive sample, 101 samples analyzed in 2019
E.Coli 0
A routine sample & a repeat sample are total coliform positive, and one is also fecal coliform or E.coli positive 0% 0% 2018
0 positive sample, 101 samples analyzed in 2019
Total Trihalomethane THM, ppb 0 80 34 5 - 34 2019
HAA(5) 0 60 9 0 - 9 2019
Free Chlorine 4 MRDL=4.0 1.40 0.22-1.75 2018-2019
Max Conc- mn compliance avg, includes 2018 data Range- individual samples collected in 2019
Lead, ppb AL=15 (>10% samples exceed AL)1.18
90% percentile <1.0 - 2.15 2019 No sample exceeded the AL
Copper, ppm AL=1.3 (>10% samples exceed AL)0.038
90% percentile 0.012 - 0.062 2019 No sample exceeded the AL
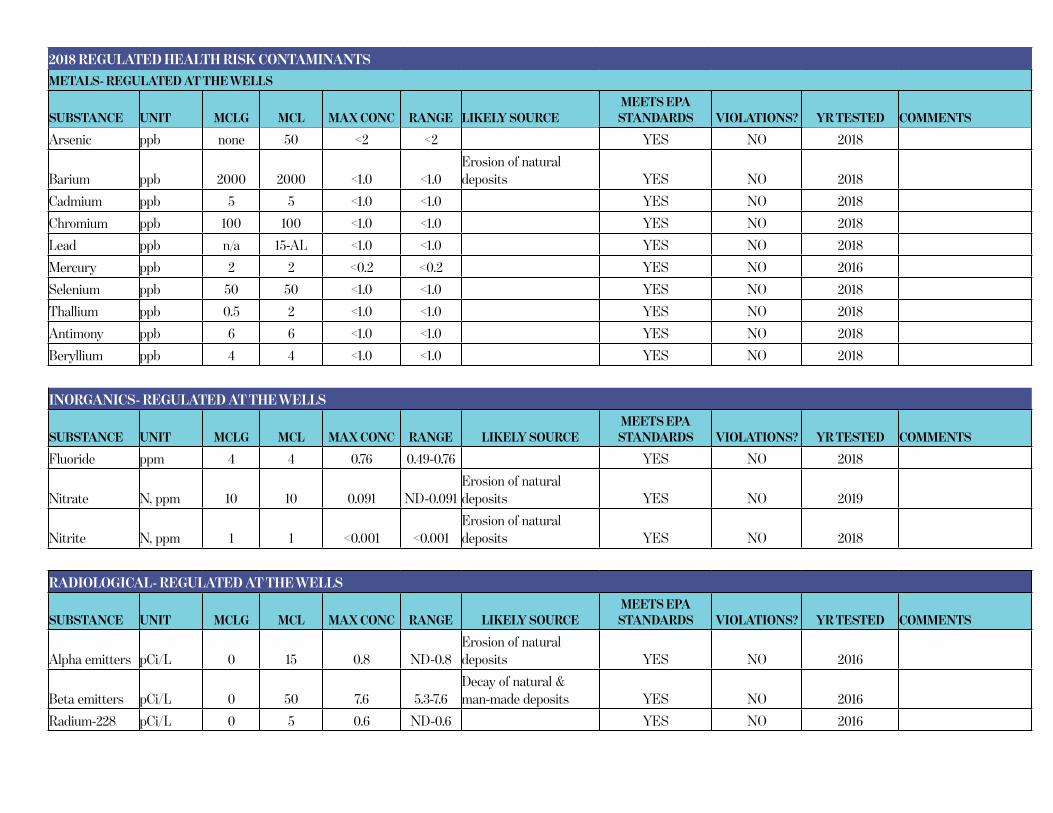
2018 REGULATED HEALTH RISK CONTAMINANTS
METALS- REGULATED AT THE WELLS
SUBSTANCE UNIT MCLG MCL MAX CONC RANGE LIKELY SOURCEMEETS EPA
STANDARDS VIOLATIONS? YR TESTED COMMENTS
Arsenic ppb none 50 <2 <2 YES NO 2018
Barium ppb 2000 2000 <1.0 <1.0Erosion of natural deposits YES NO 2018
Cadmium ppb 5 5 <1.0 <1.0 YES NO 2018
Chromium ppb 100 100 <1.0 <1.0 YES NO 2018
Lead ppb n/a 15-AL <1.0 <1.0 YES NO 2018
Mercury ppb 2 2 <0.2 <0.2 YES NO 2016
Selenium ppb 50 50 <1.0 <1.0 YES NO 2018
Thallium ppb 0.5 2 <1.0 <1.0 YES NO 2018
Antimony ppb 6 6 <1.0 <1.0 YES NO 2018
Beryllium ppb 4 4 <1.0 <1.0 YES NO 2018
INORGANICS- REGULATED AT THE WELLS
SUBSTANCE UNIT MCLG MCL MAX CONC RANGE LIKELY SOURCEMEETS EPA
STANDARDS VIOLATIONS? YR TESTED COMMENTS
Fluoride ppm 4 4 0.76 0.49-0.76 YES NO 2018
Nitrate N, ppm 10 10 0.091 ND-0.091Erosion of natural deposits YES NO 2019
Nitrite N, ppm 1 1 <0.001 <0.001 Erosion of natural deposits YES NO 2018
RADIOLOGICAL- REGULATED AT THE WELLS
SUBSTANCE UNIT MCLG MCL MAX CONC RANGE LIKELY SOURCEMEETS EPA
STANDARDS VIOLATIONS? YR TESTED COMMENTS
Alpha emitters pCi/L 0 15 0.8 ND-0.8Erosion of natural deposits YES NO 2016
Beta emitters pCi/L 0 50 7.6 5.3-7.6Decay of natural & man-made deposits YES NO 2016
Radium-228 pCi/L 0 5 0.6 ND-0.6 YES NO 2016
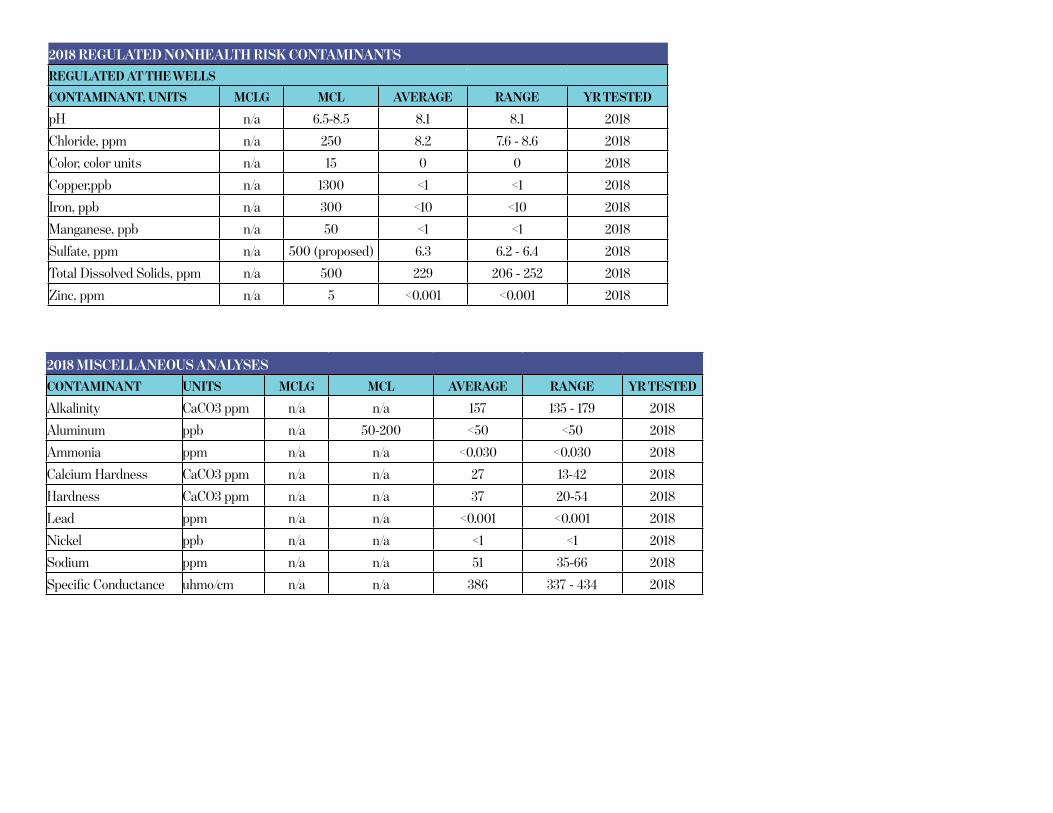
2018 REGULATED NONHEALTH RISK CONTAMINANTS
REGULATED AT THE WELLS
CONTAMINANT, UNITS MCLG MCL AVERAGE RANGE YR TESTED
pH n/a 6.5-8.5 8.1 8.1 2018
Chloride, ppm n/a 250 8.2 7.6 - 8.6 2018
Color, color units n/a 15 0 0 2018
Copper,ppb n/a 1300 <1 <1 2018
Iron, ppb n/a 300 <10 <10 2018
Manganese, ppb n/a 50 <1 <1 2018
Sulfate, ppm n/a 500 (proposed) 6.3 6.2 - 6.4 2018
Total Dissolved Solids, ppm n/a 500 229 206 - 252 2018
Zinc, ppm n/a 5 <0.001 <0.001 2018
2018 MISCELLANEOUS ANALYSES
CONTAMINANT UNITS MCLG MCL AVERAGE RANGE YR TESTED
Alkalinity CaCO3 ppm n/a n/a 157 135 - 179 2018
Aluminum ppb n/a 50-200 <50 <50 2018
Ammonia ppm n/a n/a <0.030 <0.030 2018
Calcium Hardness CaCO3 ppm n/a n/a 27 13-42 2018
Hardness CaCO3 ppm n/a n/a 37 20-54 2018
Lead ppm n/a n/a <0.001 <0.001 2018
Nickel ppb n/a n/a <1 <1 2018
Sodium ppm n/a n/a 51 35-66 2018
Specific Conductance uhmo/cm n/a n/a 386 337 - 434 2018
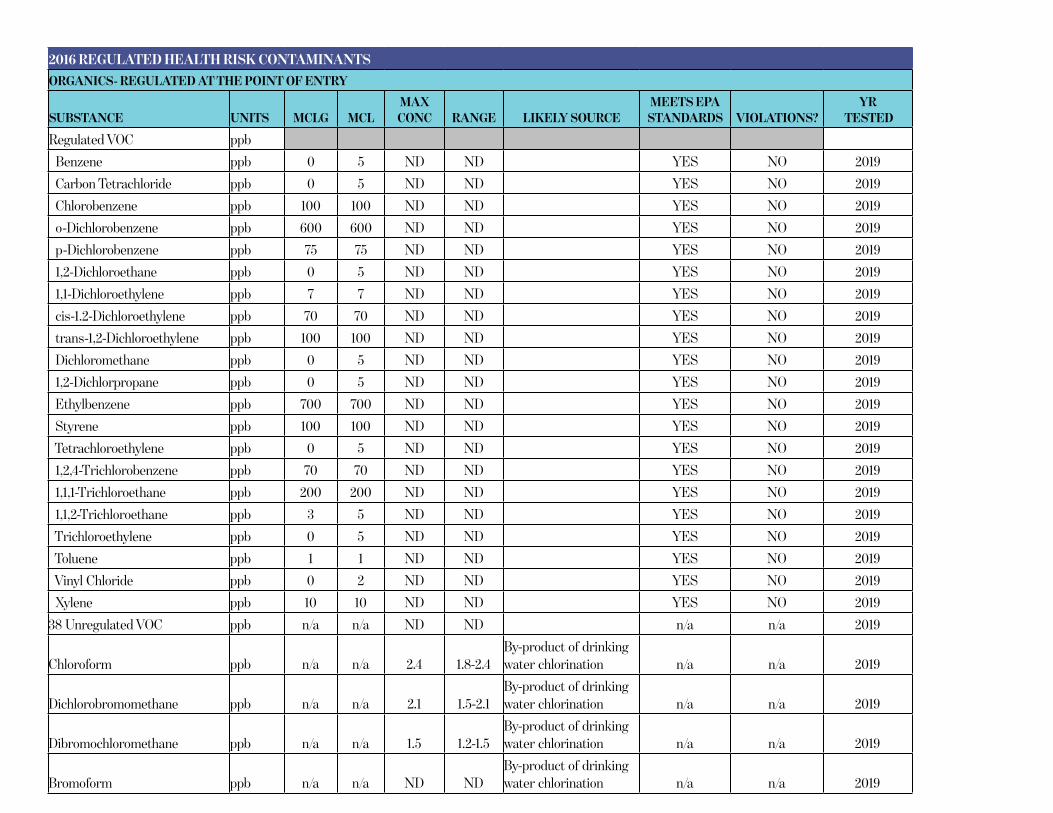
2016 REGULATED HEALTH RISK CONTAMINANTS
ORGANICS- REGULATED AT THE POINT OF ENTRY
SUBSTANCE UNITS MCLG MCLMAX
CONC RANGE LIKELY SOURCEMEETS EPA
STANDARDS VIOLATIONS?YR
TESTED
Regulated VOC ppb
Benzene ppb 0 5 ND ND YES NO 2019
Carbon Tetrachloride ppb 0 5 ND ND YES NO 2019
Chlorobenzene ppb 100 100 ND ND YES NO 2019
o-Dichlorobenzene ppb 600 600 ND ND YES NO 2019
p-Dichlorobenzene ppb 75 75 ND ND YES NO 2019
1,2-Dichloroethane ppb 0 5 ND ND YES NO 2019
1,1-Dichloroethylene ppb 7 7 ND ND YES NO 2019
cis-1.2-Dichloroethylene ppb 70 70 ND ND YES NO 2019
trans-1,2-Dichloroethylene ppb 100 100 ND ND YES NO 2019
Dichloromethane ppb 0 5 ND ND YES NO 2019
1,2-Dichlorpropane ppb 0 5 ND ND YES NO 2019
Ethylbenzene ppb 700 700 ND ND YES NO 2019
Styrene ppb 100 100 ND ND YES NO 2019
Tetrachloroethylene ppb 0 5 ND ND YES NO 2019
1,2,4-Trichlorobenzene ppb 70 70 ND ND YES NO 2019
1,1,1-Trichloroethane ppb 200 200 ND ND YES NO 2019
1,1,2-Trichloroethane ppb 3 5 ND ND YES NO 2019
Trichloroethylene ppb 0 5 ND ND YES NO 2019
Toluene ppb 1 1 ND ND YES NO 2019
Vinyl Chloride ppb 0 2 ND ND YES NO 2019
Xylene ppb 10 10 ND ND YES NO 2019
38 Unregulated VOC ppb n/a n/a ND ND n/a n/a 2019
Chloroform ppb n/a n/a 2.4 1.8-2.4By-product of drinking water chlorination n/a n/a 2019
Dichlorobromomethane ppb n/a n/a 2.1 1.5-2.1By-product of drinking water chlorination n/a n/a 2019
Dibromochloromethane ppb n/a n/a 1.5 1.2-1.5By-product of drinking water chlorination n/a n/a 2019
Bromoform ppb n/a n/a ND NDBy-product of drinking water chlorination n/a n/a 2019