Annual Revisions Show Improvements in Nevada’s...
13
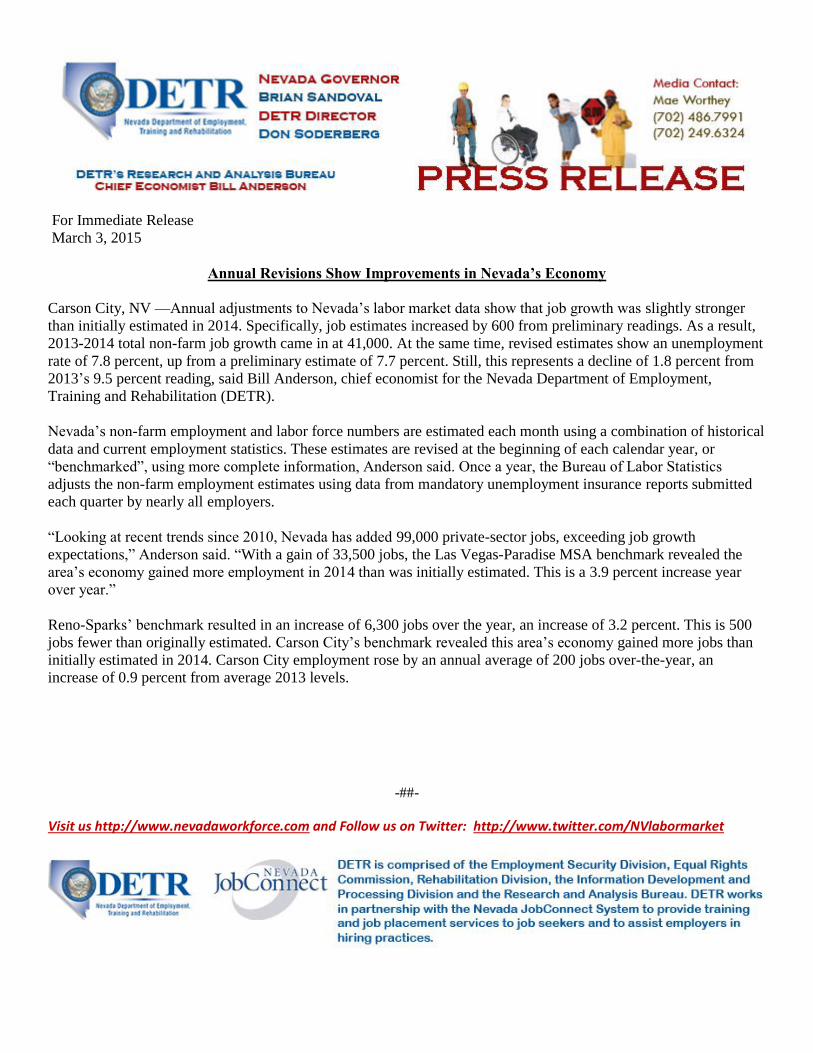
For Immediate Release March 3, 2015 Annual Revisions Show Improvements in Nevada’s Economy Carson City, NV —Annual adjustments to Nevada’s labor market data show that job growth was slightly stronger than initially estimated in 2014. Specifically, job estimates increased by 600 from preliminary readings. As a result, 2013-2014 total non-farm job growth came in at 41,000. At the same time, revised estimates show an unemployment rate of 7.8 percent, up from a preliminary estimate of 7.7 percent. Still, this represents a decline of 1.8 percent from 2013’s 9.5 percent reading, said Bill Anderson, chief economist for the Nevada Department of Employment, Training and Rehabilitation (DETR). Nevada’s non-farm employment and labor force numbers are estimated each month using a combination of historical data and current employment statistics. These estimates are revised at the beginning of each calendar year, or “benchmarked”, using more complete information, Anderson said. Once a year, the Bureau of Labor Statistics adjusts the non-farm employment estimates using data from mandatory unemployment insurance reports submitted each quarter by nearly all employers. “Looking at recent trends since 2010, Nevada has added 99,000 private-sector jobs, exceeding job growth expectations,” Anderson said. “With a gain of 33,500 jobs, the Las Vegas-Paradise MSA benchmark revealed the area’s economy gained more employment in 2014 than was initially estimated. This is a 3.9 percent increase year over year.” Reno-Sparks’ benchmark resulted in an increase of 6,300 jobs over the year, an increase of 3.2 percent. This is 500 jobs fewer than originally estimated. Carson City’s benchmark revealed this area’s economy gained more jobs than initially estimated in 2014. Carson City employment rose by an annual average of 200 jobs over-the-year, an increase of 0.9 percent from average 2013 levels. -##- Visit us http://www.nevadaworkforce.com and Follow us on Twitter: http://www.twitter.com/NVlabormarket
-
Upload
truongmien -
Category
Documents
-
view
217 -
download
2
Transcript of Annual Revisions Show Improvements in Nevada’s...
For Immediate Release
March 3, 2015
Annual Revisions Show Improvements in Nevada’s Economy
Carson City, NV —Annual adjustments to Nevada’s labor market data show that job growth was slightly stronger
than initially estimated in 2014. Specifically, job estimates increased by 600 from preliminary readings. As a result,
2013-2014 total non-farm job growth came in at 41,000. At the same time, revised estimates show an unemployment
rate of 7.8 percent, up from a preliminary estimate of 7.7 percent. Still, this represents a decline of 1.8 percent from
2013’s 9.5 percent reading, said Bill Anderson, chief economist for the Nevada Department of Employment,
Training and Rehabilitation (DETR).
Nevada’s non-farm employment and labor force numbers are estimated each month using a combination of historical
data and current employment statistics. These estimates are revised at the beginning of each calendar year, or
“benchmarked”, using more complete information, Anderson said. Once a year, the Bureau of Labor Statistics
adjusts the non-farm employment estimates using data from mandatory unemployment insurance reports submitted
each quarter by nearly all employers.
“Looking at recent trends since 2010, Nevada has added 99,000 private-sector jobs, exceeding job growth
expectations,” Anderson said. “With a gain of 33,500 jobs, the Las Vegas-Paradise MSA benchmark revealed the
area’s economy gained more employment in 2014 than was initially estimated. This is a 3.9 percent increase year
over year.”
Reno-Sparks’ benchmark resulted in an increase of 6,300 jobs over the year, an increase of 3.2 percent. This is 500
jobs fewer than originally estimated. Carson City’s benchmark revealed this area’s economy gained more jobs than
initially estimated in 2014. Carson City employment rose by an annual average of 200 jobs over-the-year, an
increase of 0.9 percent from average 2013 levels.
-##-
Visit us http://www.nevadaworkforce.com and Follow us on Twitter: http://www.twitter.com/NVlabormarket

1
Nevada 2014 Annual Benchmarking
Each year, Nevada’s Current Employment Statistics (CES) and Local Area Unemployment Statistics (LAUS) programs undergo a revision process called “benchmarking.” This process involves updating estimates and projections by incorporating more complete data that has become available since the time of the initial estimates. The benchmarking processes resulted in Nevada’s 2014 annual average unemployment rate estimate increasing from 7.7 percent up to 7.8 percent. Similarly, CES benchmark revisions show that Nevada gained 41,000 jobs over the year (up from the previous estimate of 39,100).
Marianne Segurson
Economist Research and Analysis Bureau
Chelsea Schmitt
Economist Research and Analysis Bureau
Jolie Daugherty
Economist Research and Analysis Bureau
March 2015

2
Nevada’s Statewide CES Benchmark 2014 Nevada’s non-farm employment numbers are estimated each month using a combination of historical data and current employment statistics. These estimates are revised at the beginning of each calendar year, or benchmarked, using more complete information. Once a year, the Bureau of Labor Statistics adjusts the non-farm employment estimates using data from mandatory unemployment insurance (UI) reports submitted each quarter by nearly all employers. Non adjusted data is revised over a 21-month period; the 2014 benchmark realigned the estimates from April 2013 to December 2014. Next, the seasonal adjustment factors are modeled with this updated information resulting in five years’ worth of revised seasonally adjusted data. This year’s benchmark revealed Nevada’s economy gained more jobs than initially estimated during the year. The benchmark increased employment numbers from previously reported estimates by 600 total nonfarm jobs in 2014. Employment levels for 2013 were revised down by 1,400. Nevada’s employment rose by an annual average of 41,000 jobs over-the year, an increase of 3.5 percent. The private sector leads the way with an annual average increase of 39,700 jobs, while the government sector gained 1,300. Service producing industries gained an annual average of 34,900 jobs, while the goods producing industries gained 6,100 jobs.
Nevada’s Metropolitan Statistical Areas (MSA’s) Benchmark 2014 The Las Vegas-Paradise MSA benchmark revealed the area’s economy gained more employment in 2014 than was initially estimated. Las Vegas-Paradise employment rose by an annual average of 33,500 jobs over-the-year, an increase of 3.9 percent. In total, the Las Vegas area gained 8,800 more jobs during the benchmark.
1,100,000
1,125,000
1,150,000
1,175,000
1,200,000
1,225,000
1,250,000
J F M A M J J A S O N D J F M A M J J A S O N D
2013 2014
Total Nonfarm Jobs: Statewide
Benchmark Pre-Benchmark

3
he Reno-Sparks MSA benchmark revealed the area’s economy gained employment in 2014 by an annual average of 6,300 jobs over-the-year, an increase of 3.2 percent. In total, the benchmark gained 500 less jobs than was initially reported in 2014.
780,000
800,000
820,000
840,000
860,000
880,000
900,000
920,000
J F M A M J J A S O N D J F M A M J J A S O N D
2013 2014
Las Vegas MSA
Benchmark Pre-Benchmark
175,000
180,000
185,000
190,000
195,000
200,000
205,000
210,000
J F M A M J J A S O N D J F M A M J J A S O N D
2013 2014
Reno MSA
Benchmark Pre-Benchmark

4
Carson City’s benchmark revealed the area’s economy gained employment in 2014 by an annual average of 200 jobs over-the-year, an increase of 0.9 percent. In total, Carson City gained 400 more jobs during the benchmark than was reported initially.
.
25,500
26,000
26,500
27,000
27,500
28,000
28,500
J F M A M J J A S O N D J F M A M J J A S O N D
2013 2014
Carson City MSA
Benchmark Pre-Benchmark
5
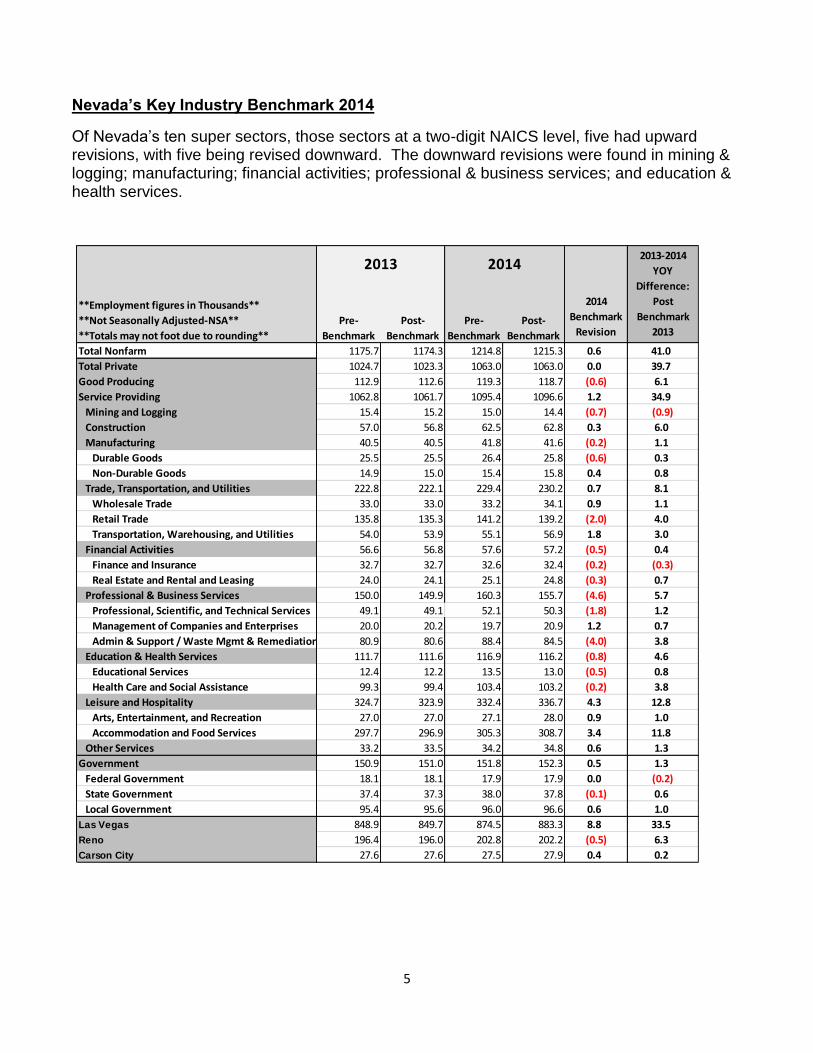
Nevada’s Key Industry Benchmark 2014
Of Nevada’s ten super sectors, those sectors at a two-digit NAICS level, five had upward revisions, with five being revised downward. The downward revisions were found in mining & logging; manufacturing; financial activities; professional & business services; and education & health services.
**Employment figures in Thousands**
**Not Seasonally Adjusted-NSA**
**Totals may not foot due to rounding**
Pre-
Benchmark
Post-
Benchmark
Pre-
Benchmark
Post-
Benchmark
Total Nonfarm 1175.7 1174.3 1214.8 1215.3 0.6 41.0
Total Private 1024.7 1023.3 1063.0 1063.0 0.0 39.7
Good Producing 112.9 112.6 119.3 118.7 (0.6) 6.1
Service Providing 1062.8 1061.7 1095.4 1096.6 1.2 34.9
Mining and Logging 15.4 15.2 15.0 14.4 (0.7) (0.9)
Construction 57.0 56.8 62.5 62.8 0.3 6.0
Manufacturing 40.5 40.5 41.8 41.6 (0.2) 1.1
Durable Goods 25.5 25.5 26.4 25.8 (0.6) 0.3
Non-Durable Goods 14.9 15.0 15.4 15.8 0.4 0.8
Trade, Transportation, and Utilities 222.8 222.1 229.4 230.2 0.7 8.1
Wholesale Trade 33.0 33.0 33.2 34.1 0.9 1.1
Retail Trade 135.8 135.3 141.2 139.2 (2.0) 4.0
Transportation, Warehousing, and Utilities 54.0 53.9 55.1 56.9 1.8 3.0
Financial Activities 56.6 56.8 57.6 57.2 (0.5) 0.4
Finance and Insurance 32.7 32.7 32.6 32.4 (0.2) (0.3)
Real Estate and Rental and Leasing 24.0 24.1 25.1 24.8 (0.3) 0.7
Professional & Business Services 150.0 149.9 160.3 155.7 (4.6) 5.7
Professional, Scientific, and Technical Services 49.1 49.1 52.1 50.3 (1.8) 1.2
Management of Companies and Enterprises 20.0 20.2 19.7 20.9 1.2 0.7
Admin & Support / Waste Mgmt & Remediation Services80.9 80.6 88.4 84.5 (4.0) 3.8
Education & Health Services 111.7 111.6 116.9 116.2 (0.8) 4.6
Educational Services 12.4 12.2 13.5 13.0 (0.5) 0.8
Health Care and Social Assistance 99.3 99.4 103.4 103.2 (0.2) 3.8
Leisure and Hospitality 324.7 323.9 332.4 336.7 4.3 12.8
Arts, Entertainment, and Recreation 27.0 27.0 27.1 28.0 0.9 1.0
Accommodation and Food Services 297.7 296.9 305.3 308.7 3.4 11.8
Other Services 33.2 33.5 34.2 34.8 0.6 1.3
Government 150.9 151.0 151.8 152.3 0.5 1.3
Federal Government 18.1 18.1 17.9 17.9 0.0 (0.2)
State Government 37.4 37.3 38.0 37.8 (0.1) 0.6
Local Government 95.4 95.6 96.0 96.6 0.6 1.0
Las Vegas 848.9 849.7 874.5 883.3 8.8 33.5
Reno 196.4 196.0 202.8 202.2 (0.5) 6.3
Carson City 27.6 27.6 27.5 27.9 0.4 0.2
2013 2014
2014
Benchmark
Revision
2013-2014
YOY
Difference:
Post
Benchmark
2013

6
Employment in the leisure & hospitality sector, Nevada’s largest employer by industry, was
adjusted upwards by an average of 4,300 jobs, or 1.3 percent, during the 2014 benchmark.
The leisure & hospitality industry did see a year-over-year increase, adding an annual average
of 12,800 jobs for a 4.0 percent growth rate for 2014. This was the largest employment gain
for any sector in Nevada in 2014. The majority of the employment growth in this sector came
from the accommodating and food services subsector, which gained an over-the-year increase
of 11,800 jobs.
The construction industry benchmark produced a slight revision upward – this industry gained
300 more jobs than was previously reported on average. The construction industry gained a
total of 6,000 jobs in 2014, growing at 10.5 percent for the year. In 2014, this employment gain
was the third largest for any sector in Nevada; however, the construction industry saw the
largest percentage gain over-the-year than any other sector.
300,000
310,000
320,000
330,000
340,000
350,000
J F M A M J J A S O N D J F M A M J J A S O N D
2013 2014
Leisure/Hospitality Jobs
Benchmark Pre-Benchmark
7
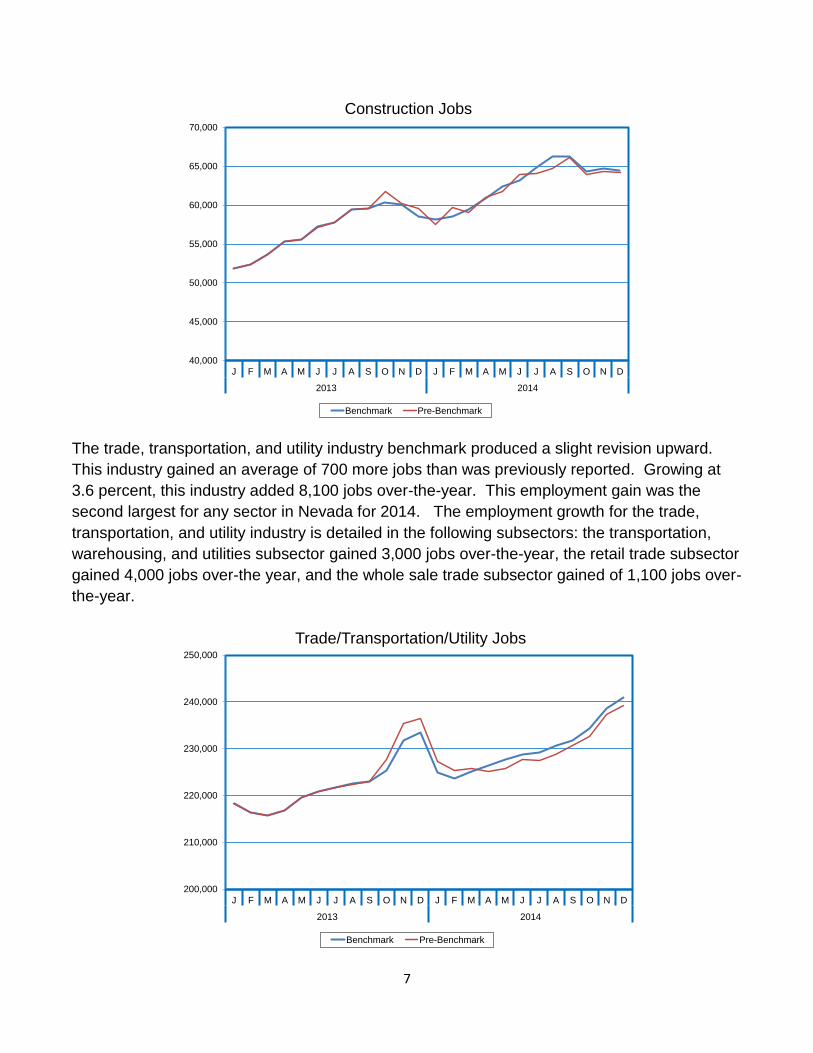
The trade, transportation, and utility industry benchmark produced a slight revision upward.
This industry gained an average of 700 more jobs than was previously reported. Growing at
3.6 percent, this industry added 8,100 jobs over-the-year. This employment gain was the
second largest for any sector in Nevada for 2014. The employment growth for the trade,
transportation, and utility industry is detailed in the following subsectors: the transportation,
warehousing, and utilities subsector gained 3,000 jobs over-the-year, the retail trade subsector
gained 4,000 jobs over-the year, and the whole sale trade subsector gained of 1,100 jobs over-
the-year.
40,000
45,000
50,000
55,000
60,000
65,000
70,000
J F M A M J J A S O N D J F M A M J J A S O N D
2013 2014
Construction Jobs
Benchmark Pre-Benchmark
200,000
210,000
220,000
230,000
240,000
250,000
J F M A M J J A S O N D J F M A M J J A S O N D
2013 2014
Trade/Transportation/Utility Jobs
Benchmark Pre-Benchmark

8
Employment in the health care and social assistance sector did decrease an average of 200
jobs in the 2014 benchmark; however, this sector gained 3,800 jobs over-the-year with a
growth rate of 3.8 percent for 2014. Although this sector saw an increase in 2014, the health
care and social assistance industry ranked fifth in terms of job growth.
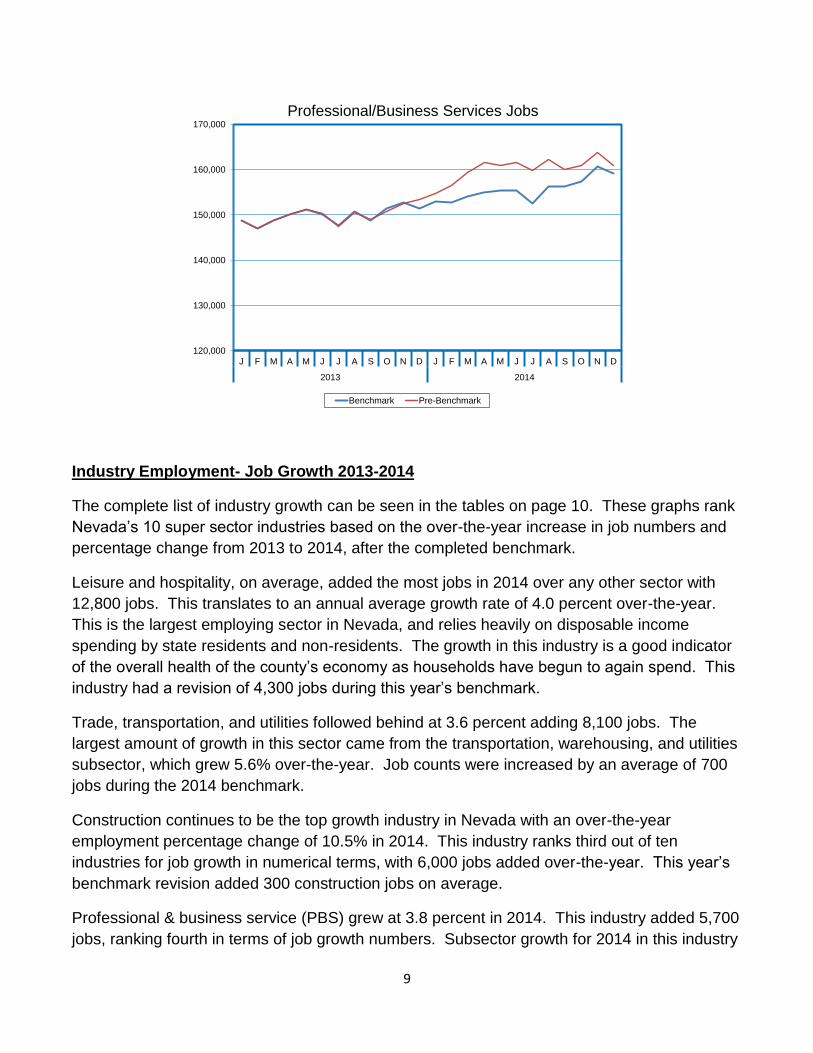
The professional and business services industry employment was revised downward by 2.9
percent, or 4,600 jobs on average, after the benchmark. Although the employment number
was revised down, this industry added 5,700 jobs over-the-year, or 3.8 percent. This was the
fourth largest gain in total employment in Nevada for any sector in 2014. Several subsectors
contributed to the growth in jobs for the professional and business services industry in 2014:
the administrative, support, waste management, and remediation subsector gained 3,800 jobs
over-the-year, the professional, scientific, and technical services subsector gained 1,200 jobs
over-the year, and the management of companies, and enterprises subsector gained of 700
jobs over-the-year.
90,000
92,500
95,000
97,500
100,000
102,500
105,000
107,500
110,000
J F M A M J J A S O N D J F M A M J J A S O N D
2013 2014
Health Care/Social Assistance Jobs
Benchmark Pre-Benchmark
9
Industry Employment- Job Growth 2013-2014
The complete list of industry growth can be seen in the tables on page 10. These graphs rank
Nevada’s 10 super sector industries based on the over-the-year increase in job numbers and
percentage change from 2013 to 2014, after the completed benchmark.
Leisure and hospitality, on average, added the most jobs in 2014 over any other sector with
12,800 jobs. This translates to an annual average growth rate of 4.0 percent over-the-year.
This is the largest employing sector in Nevada, and relies heavily on disposable income
spending by state residents and non-residents. The growth in this industry is a good indicator
of the overall health of the county’s economy as households have begun to again spend. This
industry had a revision of 4,300 jobs during this year’s benchmark.
Trade, transportation, and utilities followed behind at 3.6 percent adding 8,100 jobs. The
largest amount of growth in this sector came from the transportation, warehousing, and utilities
subsector, which grew 5.6% over-the-year. Job counts were increased by an average of 700
jobs during the 2014 benchmark.
Construction continues to be the top growth industry in Nevada with an over-the-year
employment percentage change of 10.5% in 2014. This industry ranks third out of ten
industries for job growth in numerical terms, with 6,000 jobs added over-the-year. This year’s
benchmark revision added 300 construction jobs on average.
Professional & business service (PBS) grew at 3.8 percent in 2014. This industry added 5,700
jobs, ranking fourth in terms of job growth numbers. Subsector growth for 2014 in this industry
120,000
130,000
140,000
150,000
160,000
170,000
J F M A M J J A S O N D J F M A M J J A S O N D
2013 2014
Professional/Business Services Jobs
Benchmark Pre-Benchmark

10
can be found in: administration & support and waste management & remediation, growing at
4.8 percent, professional, scientific, and technical services, growing at 2.5 percent, and
management of companies, and enterprises, growing at 3.3 percent. This industry had the
largest revision of employment during the benchmark, decreasing employment by 4,600 jobs
for a 2.9 percent revision to the PBS workforce for 2014.
Job counts in education & health services were revised downward by 800 jobs during the
benchmark, but managed to add 4,600 jobs for a 4.1 percent job growth rate over-the-year.
The health care and social assistance subsector saw the majority of the job growth adding
3,800, or 3.8 percent over-the-year.
Although other services did not experience growth in 2013, during 2014 other services added
1,300 jobs and had a growth rate of 3.7 percent over-the-year. The industry employment was
revised upwards by 1.8 percent during this year’s benchmark, which added an average of 600
jobs.
The government sector added 1,300 jobs growing at 0.9 percent for the year. The sample
estimated this industry’s employment well, with only a small revision of 500 jobs during this
year’s benchmark. State and local government both grew, while federal government did not
experience growth. Over-the year, state government added 600 jobs and local government
added 1,000 jobs; however, federal government contracted 200 jobs.
Manufacturing grew at 2.6 percent adding 1,100 jobs. Subsector growth in this industry was
strong in non-durable goods growing at 5.1 percent, or 800 jobs over-the-year. Employment
figures were revised down for this industry during this year’s benchmark by 200 jobs on
average.
Financial activities grew at 0.7% adding 400 jobs for the year. The real estate and rental and
leasing subsector grew at 2.9%; however, the finance and insurance subsector contracted 0.9
percent. Employment figures were revised down for this industry during this year’s benchmark
by 500 jobs on average.
The only industry that did not experience growth in the workforce over-the year was mining &
logging. Mining and logging employment contracted by 900 jobs over-the-year, down 5.8
percent. This industry also had a downward revision of 4.5 percent, or 700 jobs, during the
benchmark.

11
-2000 0 2000 4000 6000 8000 10000 12000 14000
Mining and Logging
Financial Activities
Manufacturing
Other Services
Government
Education & Health Services
Professional & Business Services
Construction
Trade, Transportation, and Utilities
Leisure and Hospitality
Industry Job Growth in Nevada 2013-2014
-1% 1% 3% 5% 7% 9% 11%
Mining and Logging
Financial Activities
Government
Manufacturing
Trade, Transportation, and Utilities
Other Services
Professional & Business Services
Leisure and Hospitality
Education & Health Services
Construction
Industry Growth by Percentage Change2013-2014
12
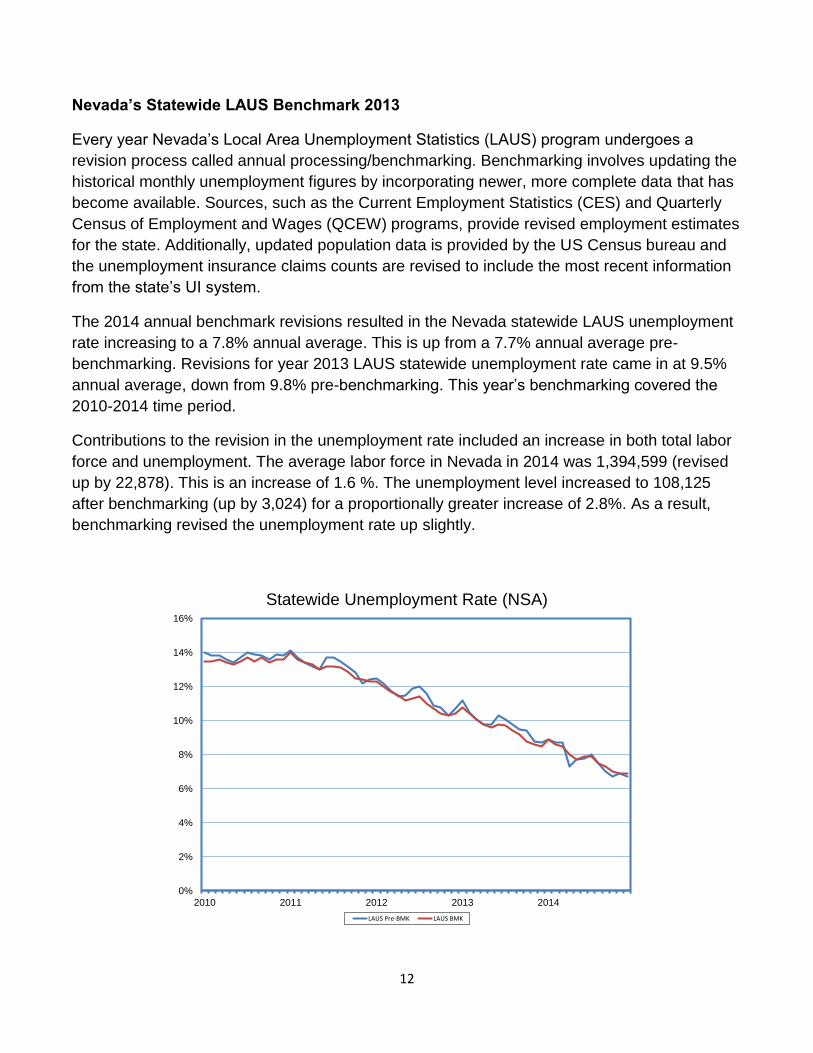
Nevada’s Statewide LAUS Benchmark 2013
Every year Nevada’s Local Area Unemployment Statistics (LAUS) program undergoes a
revision process called annual processing/benchmarking. Benchmarking involves updating the
historical monthly unemployment figures by incorporating newer, more complete data that has
become available. Sources, such as the Current Employment Statistics (CES) and Quarterly
Census of Employment and Wages (QCEW) programs, provide revised employment estimates
for the state. Additionally, updated population data is provided by the US Census bureau and
the unemployment insurance claims counts are revised to include the most recent information
from the state’s UI system.
The 2014 annual benchmark revisions resulted in the Nevada statewide LAUS unemployment
rate increasing to a 7.8% annual average. This is up from a 7.7% annual average pre-
benchmarking. Revisions for year 2013 LAUS statewide unemployment rate came in at 9.5%
annual average, down from 9.8% pre-benchmarking. This year’s benchmarking covered the
2010-2014 time period.
Contributions to the revision in the unemployment rate included an increase in both total labor
force and unemployment. The average labor force in Nevada in 2014 was 1,394,599 (revised
up by 22,878). This is an increase of 1.6 %. The unemployment level increased to 108,125
after benchmarking (up by 3,024) for a proportionally greater increase of 2.8%. As a result,
benchmarking revised the unemployment rate up slightly.
0%
2%
4%
6%
8%
10%
12%
14%
16%
2010 2011 2012 2013 2014
Statewide Unemployment Rate (NSA)
LAUS Pre-BMK LAUS BMK