Annual results 2013 - Rabobank · • Extra repayments of EUR 3.6 billion; EUR 1.3 billion higher...
23
Press conference 27 February 2014 Annual results 2013
Transcript of Annual results 2013 - Rabobank · • Extra repayments of EUR 3.6 billion; EUR 1.3 billion higher...

Press conference
27 February 2014
Annual results 2013

Annual results 2013 Rinus Minderhoud, chairman of the Executive Board

2013: a eventful year
• Difficult circumstances; more than EUR 2 billion net profit • LIBOR-settlements : no tax set off • Domestic banking: fewer loans, more savings and more repayments, increased use of
mobile and internet banking, high value adjustments • International banking: higher profits (excluding Libor settlements), lower value
adjustments, agreement on the sale of BGZ • 2014: continuing difficult market conditions with uncertain outlook • Transformation Rabobank:
• Vision 2016 • Merging of activities RN and Rabobank International • Reorganisations and decrease in staff numbers • Increased legislation and regulation; strong buffers necessary
• Rabobank: Sound basis because of cooperative model, anchored in the community

Annual results 2013 – analysis Bert Bruggink, CFO

Net profit By business segment
In millions of euros 31-Dec-13 31-Dec-12 change
Domestic retail banking 781 953* -18%
Wholesale and international retail banking 52 704 -93%
Leasing 422 367 +15%
Rabo Real Estate Group -817 -113
Discontinued operations (Robeco) and other 1,574 147
Rabobank Group 2,012 2,058 -2%
* Net profit is adjusted for non-charged costs from Rabobank Nederland.

Bad debt costs (1) above multi-year average
0
10
20
30
40
50
60
2004 2005 2006 2007 2008 2009 2010 2011 2012 2013
In basis points of average loan portfolio
Bad debt costs
10-year movingaverage
• Bad debt costs 59 (52) bp; multi-year average 28 bp • Increase mainly at Rabo Real Estate Group

Bad debt costs (2) By business segment
In basis points 2013 2012 multi-year average
Domestic retail banking 45 44 16
Wholesale and international retail banking 57 59 54
Leasing 59 53 68
Rabo Real Estate Group 278 124 49
Rabobank Group 59 52 28

Residential mortgages in the Netherlands 48% of lending; 5% of value adjustments
31-Dec-13
31-Dec-12
Residential mortgages in billions of euros
31-Dec-13
31-Dec-12
Value adjustments in millions of euros
first half second half
Residential mortgages EUR 209.1 (209.6) billion • Extra repayments of EUR 3.6 billion; EUR 1.3
billion higher than in 2012 • 20% (19)% of portfolio financed with NHG
mortgage guarantee scheme • Loan-to-value 81% (81)%
209.6
113
127
209.1
Bad debt costs 6 (6) basis points • Around 6,600 or 0.55% of customers have
payment arrears of 90 days or more • Recovery is no longer possible in the case of
approximately 3,400 or 0.28% of customers

Lending in commercial real estate in the Netherlands Write-offs versus value adjustments
0
100
200
300
400
500
600
700
800
900
2010 2011 2012 2013
In millions of euros
Value adjustments Write-offs

Domestic retail banking Net profit EUR 781 million; -18%
31-Dec-13
31-Dec-12
Net profit in millions of euros
31-Dec-13
31-Dec-12
In billions of euros
Amounts due to customers Loan portfolio
• Allowance for reorganisation • Bad debt costs above multi-year average
953
214.5 306.5
215.7 303.1
781
• Loan portfolio EUR 303.1 billion; -1% • More repayments on mortgages • Amounts due to customers EUR 215.7 billion;
+1%

Wholesale and international retail Net profit EUR 52 million; -93%
31-Dec-13
31-Dec-12
Net profit in millions of euros
31-Dec-13
31-Dec-12
In billions of euros
Amounts due to customers Loan portfolio
• Settlements relating to Libor investigations • Phase down of Equity Derivatives and ACC
Bank • Lower bad debt costs
704
52
117.9 107.5
111.6 92.1
• Loan portfolio EUR 92.1 billion; -14% of which Bank BGZ EUR 6.3 billion
• Share of food and agri in portfolio 54% (50%) • Amounts due to customers EUR 111.6 billion;
-5% of which Bank BGZ EUR 6.4 billion • RaboDirect savings deposits EUR 29.1 billion;
+23%
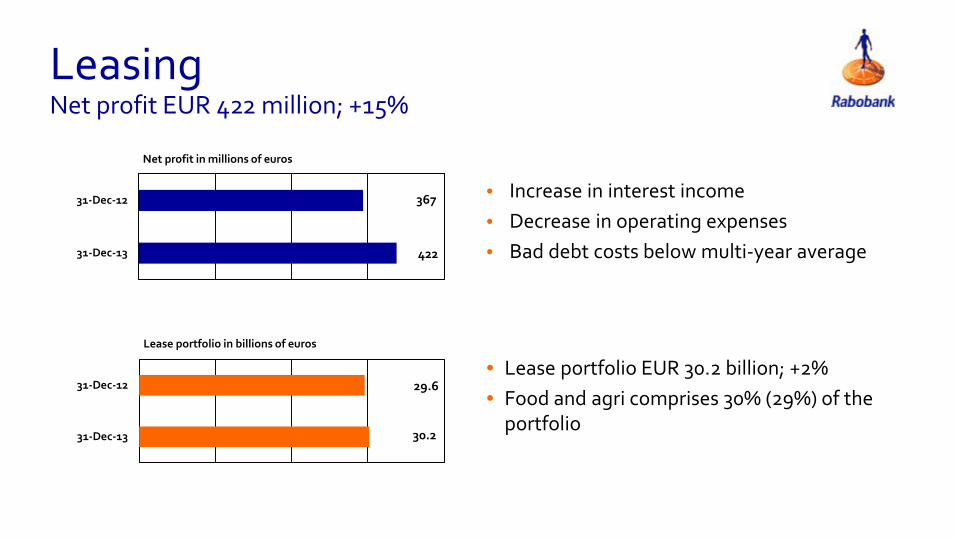
Leasing Net profit EUR 422 million; +15%
31-Dec-13
31-Dec-12
Net profit in millions of euros
31-Dec-13
31-Dec-12
Lease portfolio in billions of euros
• Increase in interest income • Decrease in operating expenses • Bad debt costs below multi-year average
367
422
29.6
30.2
• Lease portfolio EUR 30.2 billion; +2% • Food and agri comprises 30% (29%) of the
portfolio

Real Estate Net loss Rabo Real Estate Group EUR 817 million
31-Dec-13
31-Dec-12
Net loss Rabo Real Estate Group in millions of euros • Impairments on land positions and revaluation of land operations
• Impairments of commercial real estate positions • Increase in bad debt costs
-113
-817
7341
17200
8982
17800 31-Dec-13
31-Dec-12
In billions of euros
Loan portfolio Assets under management
• Number of homes sold 5,169; -18% • Loan portfolio EUR 19.4 billion; +1% • Assets under management EUR 5.9 billion;
+7%
19,2 5,5
5,9 19,4

g
Balance sheet
In billions of euros 31-Dec-13 31-Dec-12 31-Dec-13 31-Dec-12
Cash and cash Due to customers 329.4 334.3
equivalents 43.0 68.1 Debt securities in issue 195.4 223.3
Loans to customers 460.2 485.3 Due to other banks 15.5 27.1
Financial assets 56.7 62.7 Derivative financial
Due from other banks 40.8 35.4 instruments and other
Derivative financial trade liabilities 50.2 74.8
instruments 39.7 65.4 Other liabilities 43.7 49.1
Other assets 33.8 33.7 Equity 40.0 42.1
Total assets 674.1 750.7 Total liabilities 674.1 750.7

Lending
420
430
440
450
460
31-Dec-12 Private individuals TIS Food and agri 31-Dec-13
Private sector loan portfolio in billions of euros
Loan portfolio EUR 439.0 billion; -4% • Contraction at local Rabobanks and Rabobank International • Virtually stable at De Lage Landen and FGH Bank and moderate growth at Obvion
-2% -7% -6%
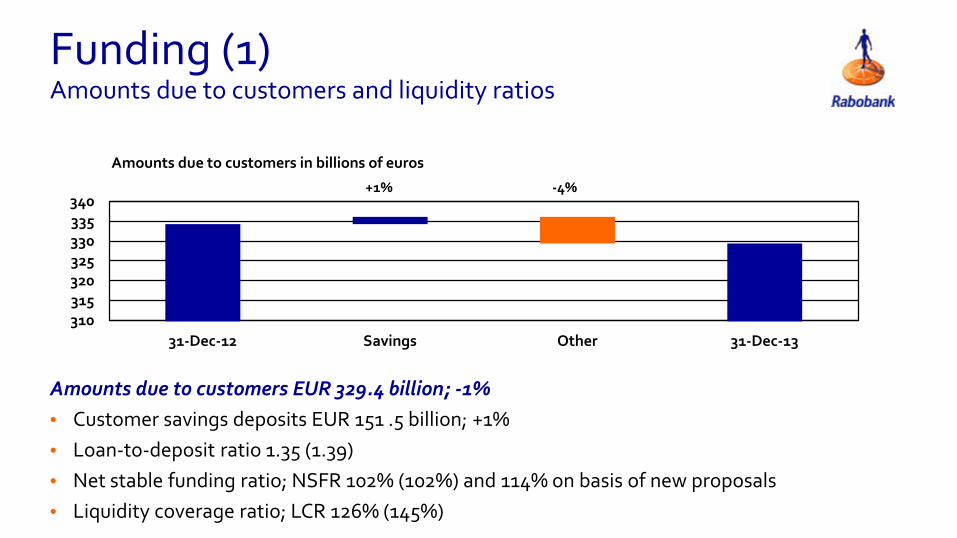
Funding (1) Amounts due to customers and liquidity ratios
310315320325330335340
31-Dec-12 Savings Other 31-Dec-13
Amounts due to customers in billions of euros
+1% -4%
Amounts due to customers EUR 329.4 billion; -1% • Customer savings deposits EUR 151 .5 billion; +1% • Loan-to-deposit ratio 1.35 (1.39) • Net stable funding ratio; NSFR 102% (102%) and 114% on basis of new proposals • Liquidity coverage ratio; LCR 126% (145%)

g
Funding (2) Comfortable liquidity position
In billions of euros 31-Dec-13 31-Dec-12 Change Domestic retail banking 215.7 214.5 +1.2 Wholesale and international retail banking 111.6 117.9 -6.3 Other entities 2.1 1.9 +0.2 Amounts due to customers 329.4 334.3 -4.9 Debt securities in issue 195.4 223.3 -27.9 Liquidity position 121 157 -36

Equity
In billions of euros Equity as at 31-Dec-12 42.1 Net profit 2.0 Payments on Member Certificates and hybrid capital -1.0 Reserve capacity 1.0 Revaluations -1.3 Change to Rabobank Member Certificates -0.8 Change in non-controlling interests -0.5 Repayments of hybrid capital -0.1 Other changes -0.4 Equity as at 31-Dec-13 40.0
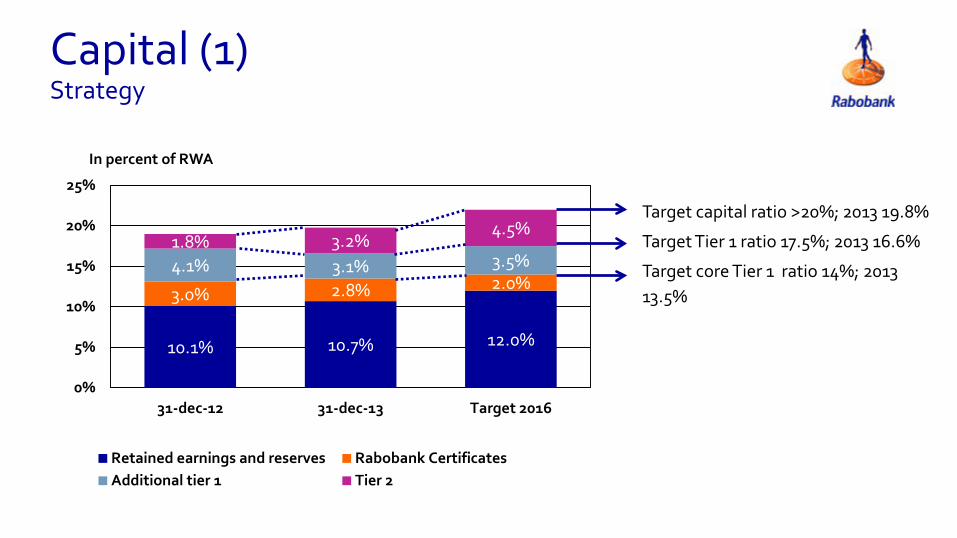
Capital (1) Strategy
10.1% 10.7% 12.0%
3.0% 2.8% 2.0% 4.1% 3.1% 3.5% 1.8% 3.2%
4.5%
0%
5%
10%
15%
20%
25%
31-dec-12 31-dec-13 Target 2016
In percent of RWA
Retained earnings and reserves Rabobank CertificatesAdditional tier 1 Tier 2
Target capital ratio >20%; 2013 19.8%
Target Tier 1 ratio 17.5%; 2013 16.6%
Target core Tier 1 ratio 14%; 2013 13.5%

Capital (2) Improved capital position
• Rabobank Member Certificates converted into Rabobank Certificates
• Amount of Tier 2 capital increased
• Transition to new pension scheme
• Sale of subsidiaries
• Stricter regulatory requirements - CRD IV

Change in capital ratios Continued improvement of ratios in 2013
0
4
8
12
16
20
24
2004 2005 2006 2007 2008 2009 2010 2011 2012 2013
Capital ratios in percent
Core Tier 1 ratio Non core Tier 1 Tier 2

22
Thank you for your attention

Annual results 2013