
ANNUAL REPORT - ORLEN Lietuva · ANNUAL REPORT of Public comPany orlen lietuva for the year 2011 5...
88
ANNUAL REPORT OF PUBLIC COMPANY ORLEN LIETUVA FOR THE YEAR 2011 1 ANNUAL REPORT of Public Company Orlen Lietuva for the year 2011
Transcript of ANNUAL REPORT - ORLEN Lietuva · ANNUAL REPORT of Public comPany orlen lietuva for the year 2011 5...

ANNUAL REPORT of Public comPany orlen lietuva for the year 2011 1
ANNUAL REPORT of Public Company Orlen Lietuva for the year 2011

ANNUAL REPORT of Public comPany orlen lietuva for the year 2011 2
About Public Company ORLEN Lietuva
ORLEN Lietuva is a crude oil refining company, which owns and operates a fuels refinery, a network of crude oil and petroleum product pipelines, and a marine terminal.
The Company’s main areas of activities include production and wholesale of the petroleum products. The Refinery is capable of processing about 10 million tons of crude oil annually.
The Company owns, via its subsidiary AB Ventus – Nafta, a network of filling stations, operated under ORLEN brand.
ORLEN Lietuva is a wholy owned subsidiary of the Polish Oil Concern PKN ORLEN S.A., a leader of the refining sector of Central and Eastern Europe.

ANNUAL REPORT of Public comPany orlen lietuva for the year 2011 3
Board*of Directors
Ireneusz Fąfara
Chairman of the Board of Direc-tors and General Director, Public Company ORLEN Lietuva
Vita Petrošienė
Deputy General Director for Business Support, Public Company ORLEN Lietuva
Krystian Pater
Member of the Management Board, Refinery Operations, PKN ORLEN
* December 31, 2011
Sławomir Robert Jędrzejczyk
Chief Financial Officer, PKN ORLEN
Jarosław Szaliński
Chief Financial Officer, Public Company ORLEN Lietuva

ANNUAL REPORT of Public comPany orlen lietuva for the year 2011 4
ANNUAL REPORT of Public Company Orlen Lietuva for the year 2011Despite the market instability and challenges faced by the refining industry worldwide, the result of the year 2011 evidences the continuous pursuit of Public Company ORLEN Lietuva and its subsidiaries (hereinafter – the Group) to increase operational efficiency as well as maintain a positive cash flow and steady increase in sales.
Performance optimization and labor efficiency increase were one of the most serious challenges for Public Company ORLEN Lietuva (hereinafter – the Parent Company) during the last year. In 2011, reorganizational changes were continued. The Parent Company succeeded in reduction of its energy consumption, increasing yields of the light petroleum products, reduction of manpower and implementation of the projects related to improvement of the Parent Company’s management.
The supply chain management undertakings implemented in the Parent Company allowed smooth coordination of operations, logistics and sales activities, reducing the level of inventories and, at the same time, the working capital demand as well as mitigating the impact of inventory depreciation on financial results.
Organizational changes and restructuring were followed by the workforce reduction during the last year. In comparison with 2010, the number of active employees in the Group decreased by 132. The number of active employees in the Group at the end of 2011 was 2,508.
Last year the Parent Company implemented only the most essential projects required for upgrade of existing units to ensure safe and continuous production process and compliance of petroleum products with the new requirements of the European Union.
Operating Results
In 2011, the feedstock processing volume was 9.5 million tons, i.e. by 0.2 million tons (2 %) higher than during the last year (9.3 million tons).
Sales of petroleum products by the Group in 2011 amounted to 9 million tons, compared to 8.7 million tons of petroleum products in 2010. Petroleum product sales volume increased by 0.3 million tons or 4 % if compared to 2010. As a result of the increased world prices for crude and petroleum products and higher sales by the Parent Company, revenue of the Group increased by 41.2 % and reached USD 8.2 billion (LTL 20.3 billion) in 2011, while the revenue in the year 2010 amounted to USD 5.8 billion (LTL 15.1 billion).
Despite the serious competition on the Baltic markets, the Group managed to increase its gasoline and diesel fuel sales on the markets of Lithuania, Latvia and Estonia. Volume of the said products sold to the above markets increased by 22.8 % in comparison with 2010.
In 2011, the Group exceeded the level of 2010 sales to Ukrainian market and markets of other CIS, reaching almost 700 thousand tons of gasoline and diesel fuel, i.e. by 6.6 % higher than during the previous year. Such sales results were impacted by the quality of fuel and recognition of the refined petroleum products on the market.
Increase of the refining volumes was followed by growth of the seaborne sales in 2011, amounting to 4.9 million tons, in comparison with 4.8 million tons in the year 2010.
Commercial Sales and Logistics Divisions of the Parent Company were successful in increasing efficiency of their activities, Operations Division reduced fuel consumption and improved the light products yield (73.9 % compared to 73.5 % in 2010), while

ANNUAL REPORT of Public comPany orlen lietuva for the year 2011 5
due to the increased refining volumes the capacity utilization reached 88.6 % compared to 88 % in 2010. In 2011, the Parent Company implemented the whole range of the projects intended for improvement of products’ quality as well as operations efficiency. All the indicated achievements had a positive impact on the Parent Company’s performance.
In 2011, the fuel stations of the Group operating under ORLEN LIETUVA and VENTUS brands sold 71.66 million liters of fuel, i.e. decrease by 13.6 % versus 2010. The main reasons for such reduction were further increase of fuel prices (diesel fuel price increased by approx. 0.50 LTL/liter, while growth of gasoline prices was by approx. 0.15 LTL/liter in comparison with 2010) as well as increasing size of the shadow economy. Due to the increased competition on the fuel retail market the fuel sales supporting promotions were less successful than in the year 2010.
The volume of sales in the shops of the fuel stations increased by 3 % in comparison with the year 2010 due to the continued growth of fast food and coffee sales as well as recovery in tobacco sales.
Financial Results
The net loss of the Group for the year 2011 under the International Financial Reporting Standards (IFRS) amounted to USD 5.6 million (LTL 13.9 million), while the net loss for 2010 was USD 31.4 million (LTL 81.9 million). Operating profit for the year 2011 comprised USD 25.2 million (LTL 62.6 million) in comparison with USD 11.3 million (LTL 29.4 million) for 2010.
Changes in financial indicators of the Group for the year 2011 in comparison to the same period of the last year were as follows: the return on assets was -0.003 (-0.017 in 2010), and the return on equity was -0.007 (-0.042 in 2010). Changes of other indicators were as follows: the long term debt to equity ratio was 0.49 (0.23 in 2010), the current ratio was 1.08 (0.84 in 2010), the asset turnover ratio was 4.38 (3.13 in 2010), and the net debt to equity ratio was 0.45 (0.33 in 2010).
Information on financial risk management of the Group is available in Note 27 of Financial Statements. Information includes financial risk management objectives, used insurance instruments to which the accounting of insurance transactions is applicable as well as the information on the extent of pricing risk, credit risk and cash flow risk of the Group.
Modernization, Mandatory and Other Projects
In 2011 the Parent Company implemented only the most essential projects required for upgrade of existing units to ensure safe and continuous production process and increase profitability.
The total amount of investments made by the Group into the modernization, mandatory and other projects during the year 2011 comprised USD 39.7 million, i.e. were by 134 % higher than in the year 2010 (USD 17 million in 2010).
In 2011, the following modernization projects significant to the Parent Company were implemented: Sulphur Degassing and Granulation Project, replacement of FCC Unit Reactor R-201 internals as well as implementation of Emergency Shutdown/Distributed Control Systems (ESD/DCS) with replacement of pneumatic devices to electronic devices.
Taking into consideration the financial status, the main targets were increase of the Parent Company’s profitability and implementation of the projects with the short pay-back period requiring minimum investment. In 2011, the number of such projects completed by the Parent Company amounted to 14, with the total budget reaching USD 3.9 million and the positive impact on EBITDA (Earnings before Interest, Taxes, Depreciation and Amortization) comprising approx. USD 20 million per year. The main projects intended for EBITDA improvement were as follows: FCC Unit capacity increase in summer period, installation of soot blowers for boilers KU-401/1,2, and utilization of Reactor R-301 in LK-2 Complex for kerosene hydrotreatment.

ANNUAL REPORT of Public comPany orlen lietuva for the year 2011 6
Work Compensation Policy and Employees’ Development
The Parent Company has the effective Collective Agreement concluded in 2009, offering its employees an attractive package of social benefits and guarantees. Work compensation policy is labor market oriented. Increase of the salaries for employees is based on the principles of internal equity and external competitiveness. At the end of 2011, negotiations with the joint representative team of the trade unions were commenced for conclusion of a new collective agreement. Collective Agreement in subsidiary UAB Paslaugos Tau was already signed at the end of the year, and negotiations started in other subsidiary UAB EMAS. Such collective agreements concluded are considered as the guarantee for fulfillment by the employer of its obligations towards the employees.
Continuous improvement of the employees’ qualifications is the priority area of the human resources management. Rich library, computerized Training Center of the Parent Company as well as training policy of the Parent Company ensure good conditions for employee training and professional education.
During 2011, the number of the Group employees who attended the training on formal safety programs amounted to 156; the Parent Company has the license for such trainings issued by the Ministry of Education and Science of the Republic of Lithuania. 400 employees attended trainings on fire safety, 180 employees completed the courses in first aid and hygiene for work under potential exposure to occupational risks.
The Parent Company turns special attention to the continuous improvement of workers’ qualifications to ensure proper servicing by its operational staff of additional process equipment and modernized units. During the year 2011, on-the-job trainings in this relation were attended by 374 employees, while 47 employees have improved their qualifications in execution of specialized works in other training institutions. More than 450 employees participated in trainings on improvement of negotiation skills, quality improvement, as well as in the areas of ecology, occupational health and safety, engineering, finance and accounting, law, computer literacy, internal audit of quality management system, assessment of organizational changes associated risks, identification of potentially explosive atmosphere, health care, etc.
In spring of 2011, the Parent Company completed the leadership training project for top and middle level managers aimed at improvement of the Parent Company’s internal communication and pursuit of the Company’s objectives. Special attention is also given to improvement of foreign language (English, Russian, Lithuania, and Polish) skills and knowledge, with more than 100 employees engaged in the said skills improvement courses. In 2011, the Languages Ambassador of the Year competition organized by the Ministry of Education and Science of the Republic of Lithuania awarded the Parent Company a nomination for strategic learning of languages for work.
Organizational Changes and Restructuring
Performance optimization and labor efficiency increase are considered as the most serious targets to achieve profitability; therefore in 2011 the Group was further executing the process of restructuring.
The Parent Company was further executing the process of restructuring by reducing its non-core activities and outsourcing the relevant services. This way, to facilitate saving of the costs the Parent Company in 2011 refused from further activities of its Non-Destructive Testing Laboratory, outsourced the services of maintenance and repairs of railcars, rolling stock and railways, commenced reorganization in Railway Transport and Infrastructure Section with further intended outsourcing of the rail maneuvering services. Upon implementation of the work organization associated changes, introduction of advanced technical measures and tools, modernization of processes and staff optimization in many organizational units of the Parent Company the labor efficiency increased.
Organizational changes and restructuring allowed for the staff reduction during the last year. The number of the Group active employees reduced by 132, with the total number of 2,508 at the end of 2011.
ANNUAL REPORT of Public comPany orlen lietuva for the year 2011 7
Changes in the Group Structure
By the 25 October 2011 Decision of the District Court of the City of Warsaw, Mazeikiu Nafta Trading House Sp. z o.o. in Liquidation was excluded from the National Court Register of Poland upon completion of the liquidation procedures.
Maintaining the Management Systems and their Recerti-fication
Activities of the Parent Company comply with the strict international integrated management system standards implemented by many European companies. In the European business practice, the companies which have introduced ISO 9001 standard are considered as the solid and reliable partners oriented towards the long-term plans and quality instead of pursue of the short-term profitability.
In 2011 the Parent Company further continued improvement of its internal order, implementation of more efficient management followed by better comprehension of the objectives and processes by the employees; but the most important here is the trust of the clients in our products and work quality.
The Parent Company performs continuous maintaining and improvement of its Integrated Management System. In June of 2011, LQRA Ltd successfully completed recertification of the Parent Company’s management system including environmental management, quality management as well as occupational health and safety management, issuing the certificate effective by the 11 July 2014.
Social Responsibility
Having secured one of the leading positions in Lithuanian economy, the Group seeks not only to improve its business results, but also to enhance quality of life of the Group employees and their families as well as communities of Mažeikiai, Biržai Districts, Palanga town as well as the community of Lithuania.
The Parent Company, taking care of the community in line with the provisions of its Social Policy, in cooperation with Mažeikiai District Municipality, granted support for installation of four children playgrounds and ten bus stop shelters in Mažeikiai. The Parent Company has also financed the disabled elderly people nursing services in Mažeikiai District provided by Mažeikiai Branch of the Lithuanian Red Cross Society.
Taking into consideration the needs of local community as well as national culture the Parent Company granted support to the XIII Festival of Wind Instruments in Mažeikiai, Biržai Town Festival, XVII Klaipėda Jazz Festival, as well as became the general sponsor of the 71st season of the Lithuanian National Philharmonic.
The General Assembly of the United Nations proclaimed the year 2011 as the International Year of Chemistry. The Parent Company has joined the initiative with a program propagating chemical science and increasing appreciation in chemistry, patronized by the Lithuanian National Commission for UNESCO. Within the framework of the said program the Parent Company granted support to the 49th Chemistry Olympiad of Lithuanian Secondary School Students as well as for the preparation of school students to the International Junior Science Olympiad in Durban (South Africa) where Lithuanian representatives received silver and bronze medals. In addition, the Parent Company organized ‘Live Chemistry’ days in Mažeikiai and Vilnius presenting the importance of chemistry in daily life and encouraging interest of young people in the sustainable future creating science,

ANNUAL REPORT of Public comPany orlen lietuva for the year 2011 8
as well as granted a one-time scholarship to Artūras Katelnikovas, chemistry PhD student of Vilnius University for the light synthesizing research. The Parent Company also granted support to Vilnius University, Kaunas University of Technology and Klaipėda University to facilitate environmental researches and improve the quality of chemistry studies.
Ownership Structure
Shares of the Parent Company are owned by the sole shareholder Polski Koncern Naftowy Orlen S.A. entitled to 100 % of the shares.
In 2011, the Group did not acquire or transfer any of its own shares either.
Branches
The Parent Company has no branches established. The Parent Company has Public Company ORLEN Lietuva Representative Office in Ukraine.
Year 2012 – year of continued labor efficiency improve-ment in all business segments
In the year 2012, the Group will further focus on improvement of labor efficiency in all business segments as well as manpower optimization through the processes of restructuring and elimination of non-core activities. Such arrangements are necessary seeking to ensure the long-term perspective not only for ORLEN Lietuva Group but for the whole PKN Orlen Group under the conditions of increasing competitiveness.
The forecasted throughput of the Parent Company’s Refinery in 2012 is about 9.6 million tons of feedstock.
The Group will further pursue its strategy and the goal of creating shareholder value by becoming the most efficient oil companies in Central and Eastern Europe.
Chairman of the Board of Directors
Ireneusz Fąfara

ANNUAL REPORT of Public comPany orlen lietuva for the year 2011 9
Independent auditor’s report to the shareholder of AB ORLEN Lietuva 12Consolidated statement of financial position 13Consolidated statement of comprehensive income 14Consolidated statement of cash flows 15Consolidated statement of changes in equity 16
1. Reporting entity 18
2. Accounting policies 19
2.1. Principles of presentation 19
2.2. Basis of measurement 19
2.3. Impact of amendments and interpretations of IFRSs on consolidated financial statements of the Group 192.3.1. Binding amendments and interpretations to IFRSs 192.3.2. IFRSs and interpretations to IFRSs not yet effective 192.3.3. Functional and presentation currency 23
2.4. Applied accounting policies 242.4.1. Changes in accounting policies and estimates 242.4.2. Transactions in foreign currencies 242.4.3. Principles of consolidation 242.4.4. Investments in subsidiaries 24
2.4.4.1. Investment in associates 242.4.4.2. Consolidation procedures 25
2.4.5. Business combinations 252.4.6. Operating Segments 252.4.7. Property, plant and equipment 262.4.8. Intangible assets 27
2.4.8.1. Goodwill 272.4.8.2. Rights 28
2.4.9. Perpetual usufruct of land 282.4.10. Borrowing cost 292.4.11. Impairment of assets 292.4.12. Inventories 302.4.13. Receivables 302.4.14. Cash and cash equivalents 312.4.15. Non-current assets held for sale 312.4.16. Equity 31
2.4.16.1. Share capital 312.4.16.2. Share premium 312.4.16.3. Revaluation surplus 322.4.16.4. Foreign exchange differences 322.4.16.5. Other reserve capitals 322.4.16.6. Retained earnings 32
2.4.17. Liabilities 322.4.17.1. Government grants 32
2.4.18. Employee benefits: Jubilee bonuses and post-employment benefits 322.4.19. Provisions 33
2.4.19.1. Environmental provision 332.4.19.2. Business risk 332.4.19.3. Restructuring 332.4.19.4. CO2 emissions 332.4.19.5. Accruals 33
2.4.20. Revenue from sale 342.4.20.1. Revenue from sales of finished goods, merchandise, materials and services 34
2.4.21. Costs 342.4.21.1. Cost of sales 342.4.21.2. Distribution expenses 34
Content

ANNUAL REPORT of Public comPany orlen lietuva for the year 2011 10
2.4.21.3. General and administrative expenses 342.4.22. Other operating revenue and expenses 34
2.4.22.1. Financial income and expense 352.4.22.2. Income tax expense 352.4.22.3. Earnings per share 36
2.4.23. Consolidated statement of cash flows 362.4.24. Financial instruments 36
2.4.24.1. Recognition and derecognition in the consolidated statement of financial position 362.4.24.2. Measurement of financial assets and liabilities 372.4.24.3. Transfers 382.4.24.4. Impairment of financial assets 38
2.4.25. Lease 392.4.26. Contingent assets and contingent liabilities 402.4.27. Subsequent events after reporting date 40
3. The Management Board estimates and assumptions 40
4. Operating segments 41
4.1. Revenue and financial result by segment 42
4.2. Other segment data 444.2.1. Assets by operating segment 444.2.2. Recognition and reversal of impairment allowances 454.2.3. Geographical information 45
4.3. Revenue from sale of core products and services 46
4.4. Information about major customers 46
5. Property, plant and equipment 47
6. Intangible assets 50
7. Perpetual usufruct of land 54
8. Investments into equity-accounted investees 54
9. Inventories 54
10. Trade and other receivables 55
11. Other short-term financial assets 56
12. Cash and cash equivalents 56
13. Non-current assets classified as held for sale 57
14. Share capital 57
15. Earnings per share 58
16. Loans and borrowings 58
17. Long-term employee benefits 61
18. Provisions 62
18.1. Environmental provision 64
18.2. Business risk provision 64
18.3. Restructuring provision 65
18.4. CO2 emission provision 65
19. Trade and other liabilities 66
20. Other financial liabilities 66

ANNUAL REPORT of Public comPany orlen lietuva for the year 2011 11
21. Sales revenue 67
22. Operating expenses 67
23. Other operating revenue and expenses 69
23.1. Other operating revenue 69
23.2. Other operating expenses 70
24. Financial revenue and expenses 70
24.1. Financial revenue 70
24.2. Financial expenses 70
25. Income tax expense 71
25.1. The differences between income tax expense recognised in profit or loss and the amount calculated based on profit before tax 71
25.2. Deferred tax 72
25.3. Change in deferred tax assets and liability, net 72
26. Financial instruments 73
26.1. Financial instruments by category and class 73
26.2. Fair value of financial instruments 76
27. Financial risk management 77
28. Capital commitments 83
29. Contingencies 84
30. Guarantees and sureties 85
31. Related party transactions 85
31.1. Information on material related party transactions concluded by the Group on other than market terms 85
31.2. Transactions with members of the Management Board and Supervisory Board, their spouses, siblings, descendants and ascendants and their other relatives 85
31.3. Transactions concluded by the Group with related parties through the key executive personnel 85
31.4. Transactions and balance of settlements of the Group with related parties 85
32. Remuneration together with profit-sharing paid and due or potentially due to Management Board, Supervisory Board and other members of key executive personnel of Parent Company and the Capital Group companies in accordance with IAS 24 86
33. Remuneration arising from the agreement with the entity authorized the conduct audit of the financial statements 87
34. Employment structure 87
35. Significant events after the end of the reporting period 88

ANNUAL REPORT of Public comPany orlen lietuva for the year 2011 12
Independent auditor’s report to the shareholder of AB ORLEN Lietuva

ANNUAL REPORT of Public comPany orlen lietuva for the year 2011 13
Consolidated statement of financial position
Note
USD LTL USD LTLASSETSNon-current assetsProperty,plant and equipment 5 927,699 2,476,399 988,054 2,578,720 Intangible assets 6 50,205 134,019 21,628 56,448 Perpetual usufruct of land 7 102 271 98 258 Investments into equity-accounted investees 8 1,756 4,689 1,646 4,295 Deferred tax assets 25 64,077 171,045 65,611 171,239 Other investments 1,612 4,302 - - Other non-current assets 2,854 7,617 2,536 6,620 Total non- current assets 1,048,305 2,798,342 1,079,573 2,817,580 Current assetsInventory 9 478,793 1,278,093 446,625 1,165,644 Trade and other receivables 10 265,963 709,962 271,075 707,479 Short term financial assets 11 6,539 17,456 13,002 33,934 Income tax receivable 2,835 7,568 3,453 9,013 Cash and cash equivalents 12 59,704 159,373 34,687 90,530 Non-current assets held for sale 13 5,129 13,690 480 1,254 Total current assets 818,963 2,186,142 769,322 2,007,854
Total assets 1,867,268 4,984,484 1,848,895 4,825,434 LIABILITIES AND SHAREHOLDERS' EQUITYEQUITYShare capital 14 181,886 708,821 181,886 708,821 Share premium 77,507 295,548 77,507 295,548 Other reserves 27,654 74,052 27,662 74,073 Currency translation reserve (607) (205,236) 2,338 (242,489)Retained earnings 462,107 1,124,984 466,334 1,136,421 Total equity 748,547 1,998,169 755,727 1,972,374 LIABILITIESLong-term liabilitiesInterest-bearing loans and borrowings 16 349,608 933,243 164,598 429,584 Employee benefits 17 7,597 20,280 7,359 19,207 Provisions 18 5,987 15,982 3,000 7,829 Deferred tax liabilities 25 1 3 3 9 Total long-term liabilities 363,193 969,508 174,960 456,629 Short-term liabilitiesTrade and other liabilities 19 653,901 1,745,523 724,684 1,891,354 Interest-bearing loans and borrowings 16 48,230 128,744 121,389 316,813 Income tax liability 190 507 - - Provisions 18 47,893 127,846 56,653 147,860 Deferred income 11 30 11 28 Other financial liabilities 20 5,303 14,157 15,471 40,376 Total short-term liabilities 755,528 2,016,807 918,208 2,396,431
Total liabilities 1,118,721 2,986,315 1,093,168 2,853,060
Total equity and liabilities 1,867,268 4,984,484 1,848,895 4,825,434
Ireneusz FąfaraGeneral Director Chief Financial Officer
Consolidated financial statements set out on pages 6 to 85 were approved by the General Director and the ChiefFinancial Officer on 28 March 2012.
as at 31/12/2011 as at 31/12/2010
Jaroslaw Szalinski
Consolidated financial statements set out on pages 13 to 88 were approved by the General Director and the ChiefFinancial Officer on 28 March 2012.
Ireneusz FąfaraGeneral Director
Jaroslaw SzalinskiChief Financial Officer

ANNUAL REPORT of Public comPany orlen lietuva for the year 2011 14
Consolidated statement of comprehensive income
Notefor the year
ended 31/12/2011
for the year ended
31/12/2011
for the year ended
31/12/2010
for the year ended
31/12/2010USD LTL USD LTL
Income statementSales revenue 21 8,169,601 20,274,499 5,785,722 15,081,641 Cost of sales 22 (7,927,040) (19,672,536) (5,531,717) (14,419,528)Gross profit on sale 242,561 601,963 254,005 662,113 Distribution expenses 22 (165,763) (411,373) (152,185) (396,701)General and administrative expenses 22 (70,251) (174,342) (73,397) (191,324)Other operating revenue 23 71,743 178,045 24,307 63,360 Other operating expenses 23 (53,076) (131,717) (41,465) (108,086)Profit from operation 25,214 62,576 11,265 29,362 Financial revenue 24 5,460 13,548 1,191 3,104 Financial expenses 24 (33,847) (83,999) (29,806) (77,697)Financial revenue and expenses (28,387) (70,451) (28,615) (74,593)Share of profit of equity-accounted investees
8 160 398 149 387
Profit/(loss) before tax (3,013) (7,477) (17,201) (44,844)Income tax expense 25 (2,571) (6,381) (14,218) (37,063)Net profit/(loss) (5,584) (13,858) (31,419) (81,907)
Items of other comprehensive income/(expenses):Foreign exchange differences on consolidation (1,596) 39,653 (3,265) 153,184
(1,596) 39,653 (3,265) 153,184
Total net comprehensive income/(expenses) (7,180) 25,795 (34,684) 71,277
Net profit/(loss) attributable to:equity holders of the parent (5,584) (13,858) (31,419) (81,907)
Total comprehensive income/(expenses) attributable to:
equity holders of the parent (7,180) 25,795 (34,684) 71,277
Net profit/(loss) per share attributable to equity holders of the parent
15 (0.01) (0.02) (0.04) (0.12)
Ireneusz Fąfara Jaroslaw SzalinskiGeneral Director Chief Financial Officer

ANNUAL REPORT of Public comPany orlen lietuva for the year 2011 15
Consolidated statement of cash flows
Notefor the year
ended 31/12/2011
for the year ended
31/12/2011
for the year ended
31/12/2010
for the year ended
31/12/2010USD LTL USD LTL
Cash flow - operating activitiesNet profit/(loss) (5,584) (13,858) (31,419) (81,907)Adjustments for:Share in profit/(loss) from investments accounted under equity method
8 (160) (398) (149) (387)
Depreciation and amortisation 5,6,7 79,510 197,319 92,538 241,218 Foreign exchange (gain)/loss (1,270) 27,541 2,101 52,328 Interest expenses 24 13,885 34,460 21,296 55,511 (Profit)/loss on investing activities 31,159 78,364 17,470 45,539 Change in receivables 4,668 (3,790) (83,574) (257,760)Change in inventories (28,570) (104,492) (59,210) (232,514)Change in liabilities (82,242) (178,886) 275,651 808,715 Change in provisions 41,133 105,973 47,057 132,743 Income tax expense 25 2,571 6,381 14,218 37,063 Income tax (paid)/received (1,515) (3,760) (1,139) (2,969)Emission rights recognised at fair value 6 (47,646) (118,243) (43,099) (112,347)Net cash provided by operating activities 5,939 26,611 251,741 685,233 Cash flows - investing activitiesAcquisition of property, plant and equipment and intangible assets (68,407) (169,766) (60,787) (158,454)Disposal of property, plant and equipment and intangible assets
5,6,7 319 791 40,965 106,784
Disposal of shares 229 568 - - Acquisition of sharesDerivatives (1,255) (3,350) - - Increase/(decrease) in deposits 5,604 13,907 (11,429) (29,792)Interest received 865 2,147 1,032 2,689 Net cash (used in) investing activities (62,645) (155,703) (30,219) (78,773)Cash flows - financing activitiesProceeds from loans and borrowings 1,220,487 3,028,883 1,976,721 5,152,719 Repayment of loans and borrowings (1,108,053) (2,749,855) (2,287,655) (5,963,232)Interest paid (14,983) (37,183) (22,916) (59,734)(Outflow)/inflow from cash pool (15,190) (39,635) 15,350 40,061 Net cash (used in) financing activities 82,261 202,210 (318,500) (830,186)
Net (decrease)/increase in cash and cash equivalents
25,555 73,118 (96,978) (223,726)
Effect of exchange rate changes (538) (4,275) (1,944) (7,101) Cash and cash equivalents, beginning of the period 12 34,687 90,530 133,609 321,357
Cash and cash equivalents, end of the period 12 59,704 159,373 34,687 90,530
Ireneusz Fąfara Jaroslaw SzalinskiGeneral Director Chief Financial Officer
791

ANNUAL REPORT of Public comPany orlen lietuva for the year 2011 16
Consolidated statement of changes in equity
USD
Share capital
Share premium
Revaluation reserve
Other reserve capitals
Foreign exchange
differences
Retained earnings
Total equity
1 January 2011 181,886 77,507 109 27,553 2,338 466,334 755,727 Loss for the year - - - - - (5,584) (5,584)Transfer of cumulative translation differences after liquidation of subsidiary
- - - - 278 (278) -
Transfer of cumulative result of the previous year by way of dividends
- - - - (1,627) 1,627 -
Foreign currency translation differences of foreign operations
- - - - (1,596) - (1,596)
Total comprehensive income/(expenses)
- - - - (2,945) (4,235) (7,180)
Transfer from legal reserve - - - (8) - 8 - Transactions with owners in their capacity as owners - - - (8) - 8 -
31 December 2011 181,886 77,507 109 27,545 (607) 462,107 748,547
1 January 2010 181,886 77,507 109 27,526 4,788 498,595 790,411 Loss for the year - - - - - (31,419) (31,419)Transfer of cumulative translation differences after liquidation of subsidiary
- - - - 19 (19) -
Transfer of cumulative result of the previous year by way of dividends
- - - - 796 (796) -
Foreign currency translation differences of foreign operations
- - - - (3,265) - (3,265)
Total comprehensive income/(expenses) - - - - (2,450) (32,234) (34,684)
Transferred to legal reserve - - - 27 - (27) - Transactions with owners in their capacity as owners - - - 27 - (27) -
31 December 2010 181,886 77,507 109 27,553 2,338 466,334 755,727
Ireneusz Fąfara Jaroslaw SzalinskiGeneral Director Chief Financial Officer
Equity attributable to equity holders of the parent

ANNUAL REPORT of Public comPany orlen lietuva for the year 2011 17
LTL Equity attributable to equity holders of the parent
Share capital
Share premium
Revaluation reserve
Other reserve capitals
Foreign exchange
differences
Retained earnings
Total equity
1 January 2011 708,821 295,548 437 73,636 (242,489) 1,136,421 1,972,374 Loss for the year - - - - - (13,858) (13,858)Transfer of cumulative translation differences after liquidation of subsidiary
- - - - 595 (595) -
Transfer of cumulative result of the previous year by way of dividends
- - - - (2,995) 2,995 -
Foreign currency translation differences of foreign operations
- - - - 39,653 - 39,653
Total comprehensive income/(expenses) - - - - 37,253 (11,458) 25,795
Transferred from legal reserve
- - - (21) - 21 -
Transactions with owners in their capacity as owners - - - (21) - 21 -
31 December 2011 708,821 295,548 437 73,615 (205,236) 1,124,984 1,998,169
1 January 2010 708,821 295,548 437 73,565 (397,722) 1,220,448 1,901,097 Loss for the year - - - - - (81,907) (81,907)Transfer of cumulative translation differences after liquidation of subsidiary
- - - - 50 (50) -
Transfer of cumulative result of the previous year by way of dividends
- - - - 1,999 (1,999) -
Foreign currency translation differences of foreign operations
- - - - 153,184 - 153,184
Total comprehensive income/(expenses) - - - - 155,233 (83,956) 71,277
Transferred to legal reserve - - - 71 - (71) - Transactions with owners in their capacity as owners
- - - 71 - (71) -
31 December 2010 708,821 295,548 437 73,636 (242,489) 1,136,421 1,972,374
Ireneusz Fąfara Jaroslaw SzalinskiGeneral Director Chief Financial Officer

ANNUAL REPORT of Public comPany orlen lietuva for the year 2011 18
Accounting policies, notes and other supplementary information
1. Reporting entity
Public Company ORLEN Lietuva (hereinafter – the Parent company) is incorporated and domiciled in Lithuania. Its registered office is located at the address: Mažeikių St. 75, Juodeikiai village, Mazeikiai District, Republic of Lithuania. The Parent company comprises an oil refinery enterprise in Mažeikiai operating since 1980, the Būtingė terminal operating since 1999, and an oil products pumping station in Biržai operating since 1970. The sole shareholder of the Parent company is PKN ORLEN S.A.
The consolidated financial statements as at 31 December 2011 include the Parent company and subsidiary companies. The Parent company also prepares separate financial statements.
The Consolidated group (hereinafter “the Group”) consists of the Parent company and its seven subsidiaries (eight subsidiaries in 2010). The Group has one associate which is accounted for using the equity method. The subsidiaries and the associate included into the Group’s consolidated financial statements are listed below:
31/12/2011 31/12/2010
SubsidiariesAB Ventus nafta Lithuania 2002 100 100 Retail trade in petroleum products.
SIA ORLEN Latvija Latvia 2003 100 100
Wholesale trading in petroleum productsin Latvia. This company is a subsidiary ofUAB Mažeikių Naftos prekybos namaiwhich holds 100 percent of shares of thiscompany. SIA Mazeikiu NaftaTirdcniecibas Nams changed the name toSIA ORLEN Latvija in December 2011.
OU ORLEN Eesti Estonia 2003 100 100
Wholesale trading in petroleum productsin Latvia. This company is a subsidiary ofUAB Mažeikių Naftos prekybos namaiwhich holds 100 percent of shares of thiscompany. OU Mazeikiu Nfta TradingHouse changed the name to OU ORLENEesti in December 2011.
Sp.z.o.o. Mazeikiu Nafta Trading House
Poland 2003 0 100 The company was liquidated in November 2011.
UAB Mažeikių Naftos sveikatos priežiūros centras
Lithuania 2007 100 100Provides services in relation to healthcare, training, hygienic assessment ofwork places and other related services.
UAB Paslaugos tau Lithuania 2008 100 100 Cleaning of premises, maintenance ofterritory.
UAB EMAS Lithuania 2009 100 100 Installation, supervision, repair ofelectrical equipment and related services.
Associated company
UAB Naftelf Lithuania 1996 34 34Trading in aviation fuel and constructionof storage facilities thereof.
100
It has two subsidiaries SIA ORLENLatvija and OU ORLEN Eesti. Theiractivity is wholesale trading in petroleumproducts in Latvia and Estonia.
UAB Mažeikių Naftos prekybos namai
Lithuania 2003 100
Year of establishment/
acquisition Nature of activity
Share of the Group (% )Subsidiary/associated
companyEstablished
in

ANNUAL REPORT of Public comPany orlen lietuva for the year 2011 19
2. Accounting policies
2.1. Principles of presentation
The consolidated financial statements have been prepared in accordance with International Financial Reporting Standards (IFRS) adopted by the European Union (EU). The consolidated financial statements cover the period from 1 January to 31 December 2011 and the comparative period from 1 January to 31 December 2010.
Presented consolidated financial statements are compliant with all requirements of IFRSs adopted by the EU and present a true and fair view of the Group’s financial position as at 31 December 2011 and comparative data as at 31 December 2010, results of its operations and cash flows for the year ended 31 December 2011 and comparative data as at 31 December 2010.
The consolidated financial statements have been prepared assuming that the Group will continue to operate as a going concern in the foreseeable future. As at the date of approval of these consolidated financial statements there is no evidence indicating that the Group will not be able to continue its operations as a going concern.
The foregoing financial statements, except for cash flow statement, have been prepared using the accrual basis of accounting.
The consolidated financial statements were authorized for issue by the General Director on 28 March 2012.
2.2. Basis of measurement
The consolidated financial statements have been prepared on the historical cost basis except for the following items in the statement of financial position:
• Derivative financial instruments are measured at fair value;• Non-derivative financial instruments at fair value through profit or loss are measured at fair value.
2.3. Impact of amendments and interpretations of IFRSs on consolidated financial statements of the Group
2.3.1. Binding amendments and interpretations to IFRSs
The amendments adopted from 1 January 2011 had no impact on the foregoing consolidated financial statements.
2.3.2. IFRSs and interpretations to IFRSs not yet effective
The Group intends to adopt amendments to IFRSs that are published but not effective as at 31 December 2011, in accordance with their effective date. In the current reporting period the Group did not make decision to voluntary early adopt amendments and interpretations to standards.
IFRSs and interpretations to IFRSs adopted by EU
Amendments to IFRS 7 Disclosures - Transfers of Financial Assets
The Amendments require disclosure of information that enables users of financial statements:• to understand the relationship between transferred financial assets that are not derecognised in their entirety and the
associated liabilities; and • to evaluate the nature of, and risks associated with, the Group’s continuing involvement in derecognised financial assets.
The Amendments define “continuing involvement” for the purposes of applying the disclosure requirements.
Effective date for periods beginning is the date of 1 July 2011 or after that date
The Group does not expect the amendment to IFRS 7 to have material impact on the consolidated financial statements, because of the nature of the Group’s operations and the types of financial assets that it holds.

ANNUAL REPORT of Public comPany orlen lietuva for the year 2011 20
Standards and interpretations waiting for approval of EU
Amendments to IFRS 7 Financial Instruments: Disclosures - Offsetting Financial Assets and Financial Liabilities
The Amendments contain new disclosure requirements for financial assets and liabilities that are:• offset in the statement of financial position; or• subject to master netting arrangements or similar agreements.
Effective date for periods beginning is the date of 1 July 2013 or after that date
The Group does not expect the Amendments to have any impact on the consolidated financial statements since it does not apply offsetting to any of its financial assets and financial liabilities and it has not entered into master netting arrangements.
New standard and additions – IFRS 9 Financial Instruments
The new Standard replaces the guidance in IAS 39, Financial Instruments: Recognition and Measurement, about classification and measurement of financial assets. The Standard eliminates the existing IAS 39 categories of held to maturity, available for sale and loans and receivable.
Financial assets will be classified into one of two categories on initial recognition: financial assets measured at amortized cost; or financial assets measured at fair value.
The 2010 additions to IFRS 9 replace the guidance in IAS 39 Financial Instruments: Recognition and Measurement, about classification and measurement of financial liabilities and the derecognition of financial assets and financial liabilities.
The Standard retains almost all of the existing requirements from IAS 39 on the classification and measurement of financial liabilities and for derecognition of financial assets and financial liabilities.
The Standard requires that the amount of change in fair value attributable to changes in the credit risk of a financial liability designated at initial recognition as fair value through profit or loss, be presented in other comprehensive income (OCI), with only the remaining amount of the total gain or loss included in profit or loss. However, if this requirement creates or enlarges an accounting mismatch in profit or loss, then the whole fair value change is presented in profit or loss.
Amounts presented in OCI are not subsequently reclassified to profit or loss but may be transferred within equity.
Derivative financial liabilities that are linked to and must be settled by delivery of an unquoted equity instrument whose fair value cannot be reliably measured, are required to be measured at fair value under IFRS 9.
Moreover, amendments change the disclosure and restatement requirements relating to the initial application of IFRS 9 Financial Instruments (2009) and IFRS 9 (2010).
The amended IFRS 7 requires to disclose more details about the effect of the initial application of IFRS 9 when the Group does not restate comparative information in accordance with the amended requirements of IFRS 9.
Effective date of IFRS 9 and its additions for periods beginning is the date of 1 January 2015 or after that date
The Group does not expect IFRS 9 to have material impact on the consolidated financial statements. The classification and measurement of the Group’s financial liabilities are not expected to change under IFRS 9 because of the nature of the Group’s operations and the types of financial assets that it holds.
New Standard – IFRS 10 Consolidated Financial Statements
IFRS 10 provides a new single model to be applied in the control analysis for all investees, including entities that currently are SPEs in the scope of SIC-12. IFRS 10 introduces new requirements to assess control that are different from the existing requirements in IAS 27 (2008). Under the new single control model, an investor controls an investee when: • it is exposed or has rights to variable returns from its involvements with the investee, • has the ability to affect those returns through its power over that investee and • there is a link between power and returns.
ANNUAL REPORT of Public comPany orlen lietuva for the year 2011 21
The new standard also includes the disclosure requirements and the requirements relating to preparation of consolidated financial statements. These requirements are carried forward from IAS 27 (2008).
Effective date for periods beginning is the date of 1 January 2013 or after that date.
The Group does not expect the new standard to have any impact on the consolidated financial statements, since the assessment of control over its current investees under the new standard is not expected to change the conclusion regarding the Group’s control over its investees.
New Standard – IFRS 11 Joint arrangements
IFRS 11, Joint Arrangements, supersedes and replaces IAS 31, Interest in Joint Ventures. IFRS 11 does not introduce substantive changes to the overall definition of an arrangement subject to joint control, although the definition of control, and therefore indirectly of joint control, has changed due to IFRS 10.
Under the new Standard, joint arrangements are divided into two types, each having its own accounting model defined as follows:• A joint operation is one whereby the jointly controlling parties, known as the joint operators, have rights to the assets, and
obligations for the liabilities, relating to the arrangement.• A joint venture is one whereby the jointly controlling parties, known as joint venturers, have rights to the net assets of the
arrangement.
IFRS 11 effectively carves out, from IAS 31 jointly controlled entities, those cases in which although there is a separate vehicle, that separation is ineffective in certain ways. These arrangements are treated similarly to jointly controlled assets/operations (line by line accounting of underlying assets and liabilities), and are now called joint operations. The remainder of IAS 31 jointly controlled entities, now called joint ventures, are stripped of the free choice of equity accounting or proportionate consolidation; they must now always use the equity method.
Effective date for periods beginning is the date of 1 January 2013 or after that date.
The Group does not expect IFRS 11 to have material impact on the consolidated financial statements since it is not a party to any joint arrangements.
New Standard – IFRS 12 Disclosure of interests in other entities
IFRS 12 requires additional disclosures relating to significant judgments and assumptions made in determining the nature of interests in an entity or arrangement, interests in subsidiaries, joint arrangements and associates and unconsolidated structured entities.
Effective date for periods beginning is the date of 1 January 2013 or after that date.The Group does not expect IFRS 12 to have material impact on the consolidated financial statements.
New Standard – IFRS 13 Fair value measurement
IFRS 13 replaces the fair value measurement guidance contained in individual IFRSs with a single source of fair value measurement guidance. It defines fair value, establishes a framework for measuring fair value and sets out disclosure requirements for fair value measurements. IFRS 13 explains ‘how’ to measure fair value when it is required or permitted by other IFRSs. IFRS 13 does not introduce new requirements to measure assets or liabilities at fair value, nor does it eliminate the practicability exceptions to fair value measurements that currently exist in certain standards.
The standard contains an extensive disclosure framework that provides additional disclosures to existing requirements to provide information that enables financial statement users to assess the methods and inputs used to develop fair value measurements and, for recurring fair value measurements that use significant unobservable inputs, the effect of the measurements on profit or loss or other comprehensive income.
Effective date for periods beginning is the date of 1 January 2013 or after that date.
The Group does not expect IFRS 13 to have material impact on the consolidated financial statements since management

ANNUAL REPORT of Public comPany orlen lietuva for the year 2011 22
considers the methods and assumptions currently used to measure the fair value of assets to be consistent with IFRS 13.
Amendments to IAS 1 Presentation of Items of Other Comprehensive Income
The amendments require that an entity present separately the items of OCI that may be reclassified to profit or loss in the future from those that would never be reclassified to profit or loss. Consequently an entity that presents items of OCI before related tax effects will also have to allocate the aggregated tax amount between these sections.
Effective date for periods beginning is the date of 1 July 2012 or after that date.
The change is not expected to have significant impact on the consolidated financial statements of the Group.
Amendments to IAS 12 Income taxes - Deferred Tax: Recovery of Underlying Assets
The 2010 amendment introduces an exception to the current measurement principles based on the manner of recovery in paragraph 52 of IAS 12 for investment property measured using the fair value model in accordance with IAS 40 by introducing a rebuttable presumption that in these for the assets the manner of recovery will be entirely by sale. Management’s intention would not be relevant unless the investment property is depreciable and held within a business model whose objective is to consume substantially all of the asset’s economic benefits over the life of the asset. This is the only instance in which the rebuttable presumption can be rebutted.
Effective date for periods beginning is the date of 1 January 2012 or after that date.
The amendments are not relevant to the Group’s consolidated financial statements, since the Group does not have any investment properties measured using the fair value model in IAS 40.
Amended to IAS 19 Employee Benefits
Actuarial gains and losses will be recognised immediately in other comprehensive income. This change will:• remove the corridor method and hence is expected to have a significant effect on entities that currently apply this method
to recognise actuarial gains and losses; and • eliminate the ability for entities to recognise all changes in the defined benefit obligation and in plan assets in profit or loss,
which currently is allowed under IAS 19.
Effective date for periods beginning is the date of 1 January 2013 or after that date.
The Group does not expect that the amendments have material impact on the consolidated financial statements.
Amended IAS 28 Investments in associates and joint ventures
There are limited amendments made to IAS 28 (2008): • Associates and joint ventures held for sale. IFRS 5 Non-current Assets Held for Sale and Discontinued Operations applies
to an investment, or a portion of an investment, in an associate or a joint venture that meets the criteria to be classified as held for sale. For any retained portion of the investment that has not been classified as held for sale, the equity method is applied until disposal of the portion held for sale. After disposal, any retained interest is accounted for using the equity method if the retained interest continues to be an associate or a joint venture.
• Changes in interests held in associates and joint ventures. Previously, IAS 28 (2008) and IAS 31 specified that the cessation of significant influence or joint control triggered remeasurement of any retained stake in all cases, even if significant influence was succeeded by joint control. IAS 28 (2011) now requires that in such scenarios the retained interest in the investment is not remeasured.
• Effective date for periods beginning is the date of 1 January 2013 or after that date.
It is expected that the standard, when initially applied, will have a significant impact on the consolidated financial statements. However, the Group is not able to prepare an analysis of the impact this will have on the consolidated financial statements until the date of initial application.

ANNUAL REPORT of Public comPany orlen lietuva for the year 2011 23
Amendments to IAS 32 Financial Instruments: Presentation - Offsetting Financial Assets and Financial Liabilities
The Amendments do not introduce new rules for offsetting financial assets and liabilities; rather they clarify the offsetting criteria to address inconsistencies in their application.
The Amendments clarify that an entity currently has a legally enforceable right to set-off if that right is:• not contingent on a future event; and • enforceable both in the normal course of business and in the event of default, insolvency or bankruptcy of the entity and
all counterparties.
Effective date for periods beginning is the date of 1 January 2014 or after that date.
The Group does not expect the Amendments to have any impact on the consolidated financial statements since it does not apply offsetting to any of its financial assets and financial liabilities and it has not entered into master netting arrangements.
IFRIC Interpretation 20: Stripping Costs in the Production Phase of a Surface Mine
The Interpretation addresses the following issues:• recognition of production stripping costs as an asset;• initial measurement of the stripping activity asset; and• subsequent measurement of the stripping activity asset.
Surface mining companies will capitalize production stripping costs that benefit future periods, if certain criteria are met. Capitalization, and the deprecation period, will depend on the identified component of the ore body to which the stripping activity relates.
Effective date for periods beginning is the date of 1 January 2013 or after that date.
The IFRIC is not relevant to the Group’s financial statements, since the Group does not incur any stripping costs in the production phase of a surface mine.
2.3.3. Functional and presentation currency
Items included in the financial statements of each of the Group’s entities are measured using the currency of the primary economic environment in which the entity operates (the ‘functional currency’). The functional currency of the Parent Company is the US dollar (USD) as it mainly influences sales prices for goods and services and material costs, the funds from financing activities are mainly generated in the USD and the Group retains the major part of receipts from its operating activities in the USD. A significant portion of the Group’s business is conducted in US dollars and management uses the USD to manage business risks and exposures and to measure performance of the business.
The consolidated financial statements are presented in US dollars, which is the Parent Company’s functional currency, and, due to the requirements of the laws of the Republic of Lithuania, also in Lithuanian Litas (LTL) being an additional presentation currency. Since 2 February 2002 the exchange rate of the Litas has been pegged to the euro at a rate of LTL 3.4528 = EUR 1.
CURRENCIES31/12/2011 31/12/2010 31/12/2011 31/12/2010
LTL/USD 2.48170 2.60670 2.6694 2.6099EUR/USD 0.71875 0.75495 0.7731 0.7559LVL/USD 0.50765 0.53505 0.5401 0.5365PLN/USD 2.95005 3.01210 3.4002 2.9944
average exchange ratefor the reporting period
exchange rateat the end of the reporting period
The consolidated financial statements of the Group, prepared in US dollars, the functional currency of the Parent Company, are translated to the presentation currency, Lithuanian Litas by using period end exchange rate for translation of assets and liabilities and average exchange rate for the year for translation of income and expenses (unless this average is not a reasonable approximation of the cumulative effect of the rates prevailing on the transaction dates, in which case income and expenses are translated at rates prevailing at the dates of the transactions). All resulting exchange differences are recognized as cumulative translation adjustments in other comprehensive income.

ANNUAL REPORT of Public comPany orlen lietuva for the year 2011 24
Accounting policies for foreign currency transactions are disclosed in Note 2.4.2.
2.4. Applied accounting policies
2.4.1. Changes in accounting policies and estimates
The Group will change an accounting policy only if the change:is required by an IFRS; orresults in the consolidated financial statements providing reliable and more relevant information about the effects of transactions, other events or conditions on the Group’s financial position, financial performance or cash flows.
In case of change in accounting policy it is assumed that the new policy had always been applied. The amount of the resulting adjustment is made to the equity. For comparability, the Group adjust the comparative information for the earliest prior period presented as if the new accounting policy had always been applied, unless it is impracticable to determine either the period-specific effects or the cumulative effect of the change.
An estimate may need revision if changes occur in the circumstances on which the estimate was based or as a result of new information or more experience.
2.4.2. Transactions in foreign currencies
A foreign currency transaction is recorded, on initial recognition in the functional currency, by applying to the foreign currency amount the spot exchange rate between the functional currency and the foreign currency at the date of the transaction.
At the end of each reporting period:1. foreign currency monetary items, including units of currency held by the Group and receivables and liabilities due in a defined or definable units of currency are translated using the closing rate, i.e. the spot rate at the end of the reporting period;non-monetary items that are measured in terms of historical cost in a foreign currency are translated using the exchange rate at the date of the transaction; andnon-monetary items that are measured at fair value in a foreign currency are translated using the exchange rates at the date when the fair value was determined.
Exchange differences arising on the settlement of monetary items or on translating monetary items at rates different from those at which they were translated on initial recognition during the period or in previous consolidated financial statements are recognised by the Group in profit or loss in the period in which they arise.
2.4.3. Principles of consolidation
The consolidated financial statements of the Group comprise the financial statements of Public Company ORLEN Lietuva and its subsidiaries prepared as at the end of the same reporting period using uniform accounting principles in relation to similar transactions and other events in similar circumstances.
2.4.4. Investments in subsidiaries
Subsidiaries are entities under the Parent’s control. Control is the power to govern the financial and operating policies of an entity so as to obtain benefits from its activities. It is assumed that the Parent Company controls another entity if it holds directly or indirectly – through its subsidiaries – more than 50% of the voting rights in an entity, unless in exceptional circumstances, it can be clearly demonstrated that such ownership does not constitute control. Control also exists when the Parent Company owns half or less of the voting power of an entity when there is:• power over more than half of the voting rights by virtue of an agreement with other investors,• power to govern the financial and operating policies of the entity under a statute or an agreement,• power to appoint or remove the majority of the members of the board of directors or equivalent governing body and control
of the entity is by that board or body, or• power to cast the majority of votes at meetings of the board of directors or equivalent governing body and control of the
entity is by that board or body.• Subsidiaries are consolidated from the date control commences to the date control ceases.

ANNUAL REPORT of Public comPany orlen lietuva for the year 2011 25
2.4.4.1. Investment in associates
Investments in associates (entities over which the investor has significant influence and that are neither controlled nor jointly controlled) are accounted for using the equity method, based on financial statements of associates prepared as at the end of same reporting period as separate financial statements of the Parent Company and using uniform accounting principles in relation to similar transactions and other events in similar circumstances.
It is assumed that the Investor has significant influence over another entity, if it has ability to participate in financial and operating decisions of the entity. Particularly, the significant influence is evidenced when the Group holds directly or indirectly more than 20%, and no more than 50% of the voting rights of an entity and participation in financial and operating decisions is not contractually or actually restrained and is actually executed.
2.4.4.2. Consolidation procedures
The consolidated financial statements are prepared using the line by line method and the proportionate method. When investor has significant influence over another entity, equity method is used to evaluate shares in entity.
Consolidated financial statements are the financial statements of a Group presented as those of a single economic entity.
In preparing consolidated financial statements using line by line method, an entity combines the financial statements of the Parent Company and its subsidiaries line by line by adding together like items of assets, liabilities, equity, income and expenses and then performs adequate consolidation procedures, including eliminations. Intra-group balances, revenue and expenses, as well as unrealized profits and losses and cash flows from intra-group transactions are eliminated. Unrealized losses are eliminated after assets, to which they relate are tested for impairment. Unrealized profits and losses are settled proportionately with non-controlling interest.
In line by line method the following steps are then taken: the carrying amount of the Parent’s investment in each subsidiary and the Parent’s portion of equity of each subsidiary are eliminated,intra group balances are eliminated,unrealized profits or losses from intra group transactions are eliminated,intra group revenue and expenses are eliminated.
Under the equity method, the investment in an associate is initially recognised at cost and the carrying amount is increased or decreased to recognise the investor’s share of the profit or loss of the investee after the date of acquisition. The investor’s share of the profit or loss of the investee is recognised in the investor’s profit or loss. Distributions received from an investee reduce the carrying amount of the investment. Adjustments to the carrying amount may also be necessary for a change in the investor’s proportionate interest in the investee arising from changes in the investee’s other comprehensive income. Such changes include those arising from the revaluation of property, plant and equipment and from foreign exchange translation differences. The investor’s share of those changes is recognised in other comprehensive income of the investor.
2.4.5. Business combinations
The Group accounts for each business combination by applying the acquisition method. Applying the acquisition method requires:identifying the acquirer,determining the acquisition date,recognising and measuring the identifiable assets acquired, the liabilities assumed and any non-controlling interest in the acquire, andrecognising and measuring goodwill or a gain from a bargain purchase.
The fair value of assets, liabilities and contingent liabilities for the purpose of allocating the acquisition cost is determined in accordance with principles set in attachment B to IFRS 3.
2.4.6. Operating Segments
An operating segment is a component of the Group: that engages in business activities from which it may earn revenue and incur expenses (including revenue and expenses relating to transactions with other components of the same group),whose operating results are regularly reviewed by the Group’s chief operating decision maker to make decisions about resources to be allocated to the segment and assess its performance, andfor which discrete financial information is available.

ANNUAL REPORT of Public comPany orlen lietuva for the year 2011 26
The operations of the Group were divided into following segments:the refining segment, which includes refinery products processing and wholesale, oil production and sale as well as supporting production, corporate functions which are reconciling item and include activities related to management and administration and other support functions as well as remaining activities not allocated to separate segments.
Segment revenue are revenue reported in the statement of comprehensive income that are directly attributable to a segment and the relevant portion of revenue that can be allocated on a reasonable basis to a segment, including revenue from sales to external customers and revenue from transactions with other segments.
Segment expenses are expenses resulting from the operating activities of a segment that are directly attributable to the segment and the relevant portion of the Group’s expenses that can be allocated on a reasonable basis to a segment, including expenses relating to sales to external customers and expenses relating to transactions with other segments.
Segment expenses do not include:income tax expense,interest, including interest incurred on advances or loans from other segments, unless the segment’s operations are primarily of a financial nature,losses on sales of investments or losses on extinguishment of debt unless the segment’s operations are primarily of a financial nature,
Segment result is calculated on the level of operating result.
Segment assets are those operating assets that are employed by that segment in operating activity and that are either directly attributable to the segment or can be allocated to the segment on a reasonable basis. Particularly segment assets do not include assets connected with income tax.
The revenue, result, assets of a given segment are defined before inter-segment adjustments are made, after adjustments within a given segment.
2.4.7. Property, plant and equipment
Property, plant and equipment are assets that:are held for use in the production or supply of goods or services, for rental to others, or for administrative purposes, andare expected to be used during more than one period (one year or the operating cycle, if longer than one year).
Property, plant and equipment include both fixed assets (assets that are in the condition necessary for them to be capable of operating in the manner intended by management) and construction in progress (assets that are in the course of construction or development necessary for them to be capable of operating in the manner intended by management).
Property, plant and equipment are initially stated at cost. The cost of an item of property, plant and equipment comprises its purchase price, including any costs directly attributable to bringing the asset into use. The cost of an item of property, plant and equipment includes also the initial estimate of the costs of dismantling and removing the item and restoring the site on which it is located, the obligation for which is connected with acquisition or construction of an item of property, plant and equipment.
Property, plant and equipment are stated in the statement of financial position prepared at the end of the reporting period at the carrying amount. The carrying amount is the amount at which an asset is initially recognised (cost) after deducting any accumulated depreciation and accumulated impairment losses.
Depreciation of an item of property, plant and equipment begins when it is available for use, i.e. when it is in the location and condition necessary for it to be capable of operating in the manner intended by management, over the period reflecting its estimated economic useful life, considering the residual value. Fixed assets are depreciated with straight-line method and in justified cases units of production method of depreciation. Each part of an item of property, plant and equipment with a cost that is significant in relation to the total cost of the item is depreciated separately over the period reflecting its economic useful life.
The depreciable amount of an asset is determined after deducting its residual value from the initial value.

ANNUAL REPORT of Public comPany orlen lietuva for the year 2011 27
The following standard economic useful lives are used for property, plant and equipment:
• buildings and constructions 10-80 years• machinery and equipment 4-60 years• Vehicles and other 2-20 years
Appropriateness of the applied depreciation rates is reviewed periodically (at least once a year). The adjustments are accounted for prospectively.
The cost of significant repairs and regular maintenance programs is recognised as property, plant and equipment and depreciated in accordance with their economic useful lives. The cost of current maintenance of property, plant and equipment is recognised as an expense when it is incurred.
The Group reviews (once a year) the residual value of property, plant and equipment. Property, plant and equipment are tested for impairment, when there are indicators or events that may imply that the carrying amount of those assets may not be recoverable.
2.4.8. Intangible assets
An intangible asset is an identifiable non-monetary asset without physical substance.
An asset is identifiable if it either:is separable, i.e. is capable of being separated or divided from the Group and sold, transferred, licensed, rented or exchanged, either individually or together with a related contract, identifiable asset or liability, arises from contractual or other legal rights, regardless of whether those rights are transferable or separable from the Group.
An intangible asset is recognised if, and only if: it is probable that the expected future economic benefits that are attributable to the asset will flow to the Group; andthe cost of the asset can be measured reliably.
If the definition criteria of an intangible asset are not met, the cost incurred to acquire or self-develop an asset are recognised in profit or loss when incurred.
An intangible asset is measured initially at cost. An intangible asset that is acquired in a business combination is recognised initially at fair value.
After initial recognition, an intangible asset is presented in the statement of financial position at its net carrying amount.
Intangible assets with finite useful life are amortised using straight-line method. Amortisation begins when the asset is available for use, i.e. when it is in the location and condition necessary for it to be capable of operating in the manner intended by management. The asset is amortised over the period reflecting its estimated useful life. The amortisation period and the amortisation method are reviewed periodically (at least at each financial year-end). The changes are reflected in the future accounting periods (prospectively).
The depreciable amount of an asset with a finite useful life is determined after deducting its residual value. Excluding particular cases, the residual value of an intangible asset with a finite useful life is assumed to be zero.
The following standard economic useful lives are used for intangible assets:
• Licenses, patents and similar 2–15 years• Software 2–10 years
Intangible assets with an indefinite useful life are not amortised. Their value is decreased by the impairment allowances, if any. Additionally, the useful life of an intangible asset that is not being amortised is reviewed each period to determine whether events and circumstances continue to support an indefinite useful life assessment for that asset.
2.4.8.1. Goodwill
Goodwill acquired in a business combination , from the acquisition date, is allocated to each of the acquirer’s cash-generating units, (or groups of cash-generating units), that is expected to benefit from the synergies of the combination, irrespective of

ANNUAL REPORT of Public comPany orlen lietuva for the year 2011 28
whether other assets or liabilities of the acquiree are assigned to those units or groups of units.
The acquirer recognises goodwill as of the acquisition date measured as the excess of a) over b) below:a) the aggregate of: the consideration transferred, which generally requires acquisition-date fair value; the amount of any non-controlling interest in the acquiree; and in a business combination achieved in stages, the acquisition-date fair value of the acquirer’s previously held equity interest in the acquiree.b) the net of the acquisition-date amounts of the identifiable assets acquired and the liabilities assumed.
Occasionally, an acquirer will make a bargain purchase, which is a business combination in which the amount in point (b) exceeds the aggregate of the amounts specified in point (a). If that excess remains, after reassessment of correct identification of all acquired assets and liabilities, the acquirer recognises the resulting gain in profit or loss on the acquisition date as other operating profit for the period.
The acquirer measures goodwill at the amount recognised at the acquisition date less any accumulated impairment allowances.A cash-generating unit to which goodwill has been allocated is tested for impairment annually, and whenever there is an indication that the unit may be impaired. The annual impairment test may be performed at any time during an annual period, provided the test is performed at the same time every year.
A cash-generating unit to which no goodwill has been allocated is tested for impairment only when there are indicators that the cash-generating unit might be impaired.
An impairment loss recognised for goodwill is not reversed in a subsequent period.
If the initial accounting for a business combination is incomplete by the end of the reporting period in which the combination occurs, the acquirer reports in its consolidated financial statements provisional amounts for the items for which the accounting is incomplete. During the measurement period, the acquirer retrospectively adjusts the provisional amounts recognised at the acquisition date to reflect new information obtained about facts and circumstances that existed as of the acquisition date and, if known, would have affected the measurement of the amounts recognised as of that date. During the measurement period, the acquirer also recognises additional assets or liabilities if new information is obtained about facts and circumstances that existed as of the acquisition date and, if known, would have resulted in the recognition of those assets and liabilities as of that date. The measurement period ends as soon as the acquirer receives the information it was seeking about facts and circumstances that existed as of the acquisition date or learns that more information is not obtainable. However, the measurement period does not exceed one year from the acquisition date.
2.4.8.2. Rights
Carbon dioxide emission rights (CO2)
CO2 emission rights are initially recognised as intangible assets, which are not amortised (assuming the high residual value), but tested for impairment.
Granted emission allowances are presented as separate items as intangible assets in correspondence with deferred income at fair value as at the date of registration. Purchased allowances are presented as intangible assets at purchase price.
For the estimated CO2 emissions during the reporting period, a provision is created in operating activity costs (taxes and charges).
Grants are recognised proportionally with the related costs for which the grants were intended to compensate. Consequently, the cost of recognition of the provision in the statement of comprehensive income is compensated by a decrease of deferred income (grants) with taking into consideration the proportion of the estimated quantity of emission (accumulated) to the quantity of evaluated annual emission. The surplus of grant over the estimated emission in the reporting period is recognised as other operating income.
Granted/purchased CO2 emission allowances are amortised against the book value of provision, as its settlement. Outgoing of allowances is recognised using FIFO method (first in, first out).
ANNUAL REPORT of Public comPany orlen lietuva for the year 2011 29
2.4.9. Perpetual usufruct of land
Perpetual usufruct of land is recognised at acquisition cost and presented in a separate line of the consolidated statement of financial position.
As at the end of the reporting period perpetual usufruct of land is valued at the net carrying amount, i.e. at acquisition cost less any accumulated depreciation and impairment losses.
2.4.10. Borrowing cost
Borrowing costs that are directly attributable to the acquisition, construction or production of a qualifying asset form part of the cost of that asset. Other borrowing costs are directly charged into profit or loss.
A qualifying asset is an asset that necessarily takes a substantial period of time to get ready for its intended use or sale.
Borrowing costs are capitalized based on so called net investment expenditures which means assets in the process of construction not funded through the use of investment commitments, but using other sources of external financing.
Borrowing costs may include:interest expense calculated using the effective interest method,finance charges in respect of finance leases, andexchange differences arising from foreign currency borrowings to the extent that they are regarded as an adjustment to interest costs.
The effective interest method is a method of calculating the amortised cost of a financial asset or a financial liability (or group of financial assets or financial liabilities) and of allocating the interest income or interest expense over the relevant period. The effective interest rate is the rate that exactly discounts estimated future cash payments or receipts through the expected life of the financial instrument or, when appropriate, a shorter period to the net carrying amount of the financial asset or financial liability. When calculating the effective interest rate, an entity shall estimate cash flows considering all contractual terms of the financial instrument (for example, prepayment, call and similar options) but shall not consider future credit losses. The calculation includes all fees and points paid or received between parties to the contract that are an integral part of the effective interest rate, transaction costs, and all other premiums or discounts.
The upper limit of the borrowing cost eligible for capitalization is the value of borrowing cost actually born by the Group.
The commencement date for capitalization is the date when all of the following three conditions are met:expenditures for the asset are incurred,borrowing costs are incurred,activities necessary to bring the asset into its intended use or sale are undertaken.
Capitalising of borrowing costs is ceased when substantially all the activities necessary to prepare the qualifying asset for its intended use or sale are complete. Necessity to perform additional administrative or decoration works or some adaptation requested by the buyer or user are not the basis for the capitalization.
After putting the asset into use, the capitalized borrowing costs are depreciated/ amortised over the period reflecting economic useful life of the asset as part of the cost of the asset.
2.4.11. Impairment of assets
The carrying amounts if the Group’s non financial assets, excluding inventory and deferred tax assets, are reviewed at each reporting date to determine if there are any indicators of impairment. The tests are carried out annually for intangible assets with an indefinite useful life and for goodwill.
When carrying amount of an asset or a cash generating unit exceeds its recoverable amount, the carrying amount is decreased to the recoverable amount by an adequate impairment allowance charged against cost in profit or loss. The recoverable amount of an asset or a cash-generating unit is the higher of its value in use and its fair value less costs to sell.
Value in use is the present value of the future cash flows expected to be derived from an asset or cash-generating unit.
Fair value less costs to sell is the amount obtainable from the sale of an asset or cash-generating unit in an arm’s length transaction between knowledgeable, willing parties, less the costs of disposal.

ANNUAL REPORT of Public comPany orlen lietuva for the year 2011 30
Assets that do not generate independent cash flows are grouped on the lowest level on which cash flows, independent from cash flows from other assets, are generated (cash generating units). To the cash generating unit following assets are allocated:goodwill, if it may be assumed, that the cash generating unit benefited from the synergies associated to a business combination with another entity,corporate assets, if they may be allocated on a reasonable and coherent basis.
The impairment loss is allocated to reduce the carrying amount of the assets of the unit in the following order:first, to reduce the carrying amount of any goodwill allocated to the cash-generating unit; andthen, to the other assets of the unit pro rata on the basis of the carrying amount of each asset in the unit.
At the end of each reporting period an assessment is made whether an impairment loss recognised in prior periods for an asset is partly or completely reversed. Indications of a potential decrease in an impairment loss mainly mirror the indications of a potential impairment loss in prior periods.
An impairment loss recognised for goodwill is not reversed.
Reversal of an impairment loss is recognised in profit or loss.
2.4.12. Inventories
Inventories are assets:held for sale in the ordinary course of business,in the process of production for such sale, orin the form of materials or supplies to be consumed in the production process or in the rendering of services.
Inventories comprise products, work in progress, merchandise and materials.
Finished goods and work in progress are measured initially at production cost. Production costs include costs of materials and costs of conversion for the production period.
Costs of production include also a systematic allocation of fixed and variable production overheads estimated for normal production level.
The production costs do not include:costs incurred as a consequence of low production or production losses,general and administrative expenses that are not directly attributable to bringing the inventories to the condition and location at the moment of measurement,storage costs of finished goods and work in progress, unless these costs are necessary in the production process,distribution expenses.
Finished goods and work in progress are measured at the end of the reporting period at the lower of cost and net realisable value, after deducting any impairment losses.Outgoings of finished goods and work in progress is determined based on the weighted average cost formula, the cost of each item is determined from the weighted average of the cost of similar items produced during the reporting period.Merchandise and raw materials are measured initially at acquisition cost.
As at the end of the reporting period merchandise and raw materials are measured at the lower of cost and net realizable value, considering any write-downs for obsolescence.
Write-down tests for specific items of merchandise and raw materials are carried out on a current basis during an annual reporting period. Write-down to net realizable value concerns raw materials and merchandise that are damaged or obsolete.
Raw materials held for use in the production are not written down below acquisition or production cost if the products in which they will be incorporated are expected to be sold at or above cost. However, when a decline in the price of materials indicates that the cost of the products exceeds net realizable value, the materials are written down to net realizable value.
Outgoings of merchandise and raw materials are determined based on the weighted average acquisition cost or production cost formula.

ANNUAL REPORT of Public comPany orlen lietuva for the year 2011 31
2.4.13. Receivables
Receivables, including trade receivables, are recognised initially at fair value and are subsequently measured at amortized cost using the effective interest method less impairment allowances. The Group uses simplified methods of receivables measurement including trade receivables, if it does not distort information included in the financial statements, particularly if the payment term of receivables is not long. Receivables, including trade receivables, in relation to which simplified methods are used, are measured initially at the amounts due and after initial recognition (including the end of the reporting period) at the amounts due less impairment allowances.
2.4.14. Cash and cash equivalents
Cash comprises cash on hand and in a bank account. Cash equivalents are short-term highly liquid investments (of initial maturity up to three months), that are readily convertible to known amounts of cash and which are subject to an insignificant risk of change in value.
2.4.15. Non-current assets held for sale
Non-current assets held for sale are those which comply simultaneously with the following criteria:the sales were declared by the appropriate level of management,the assets are available for an immediate sale in their present condition,an active program to locate a buyer has been initiated,the sale transaction is highly probable and can be settled within 12 months following the sales decision,the selling price is reasonable in relation to its current fair value,it is unlikely that significant changes to the sales plan of these assets will be introduced.
Reclassification is reflected in the reporting period when the classification criteria are met. If the criteria for classification of a non-current asset as held for sale are met after the reporting period, the Group does not classify a non-current asset as held for sale in those financial statements when issued.
While a non-current asset is classified as held for sale it is not depreciated (or amortised).A non-current assets held for sale (excluding among others financial assets and investment property) is measured at a lower of: book value or fair value less costs to sell.
A gain is recognised for any subsequent increase in fair value less costs to sell of an asset, but not in excess of the cumulative impairment loss that has been previously recognised.A discontinued operation is a component of the Group that either has been disposed of, or is classified as held for sale, and:represents a separate major line of business or geographical area of operations,is part of a single co-ordinated plan to dispose of a separate major line of business or geographical area of operations oris a subsidiary acquired exclusively with a view to resale.
The Group re-presents the disclosures presented with reference to discontinued operation for prior periods previously presented in the consolidated financial statements so that the disclosures relate to all operations that have been discontinued by the end of the reporting period for the latest period presented.
If the Group ceases to classify a discontinued operation, the results of operations previously presented in discontinued operations are reclassified and included in the results from continuing operations for all periods presented. The amounts for prior periods are described as having been re-presented.
2.4.16. Equity
Equity is recorded in accounting books by type, in accordance with legal regulations and the Parent company’s articles of association. Equity comprises:
2.4.16.1. Share capital
Share capital is equity paid by shareholders and is stated at nominal value in accordance with the Parent company’s articles of association and the entry in the Centre of Registers.
2.4.16.2. Share premium
Share premium is created by the surplus of the consideration received over the excess of the nominal value of shares decreased by issuance costs.

ANNUAL REPORT of Public comPany orlen lietuva for the year 2011 32
2.4.16.3. Revaluation surplus
Revaluation surplus relates to a difference between the fair value and the purchase cost, after deducting deferred tax, if there is a market price available from active regulated market, or fair value may be calculated on other reliable basis.
2.4.16.4. Foreign exchange differences
Foreign exchange differences arise from the translation of the financial statements of foreign operations and from translation of the consolidated financial statements amounts to the additional presentation currency Litas.
2.4.16.5. Other reserve capitals
Additional payments to equity are initially recognised at fair value.
According to Lithuanian legislation an annual transfer of 5% of net profit to the legal reserve is compulsory until the reserve reaches 10% of the share capital. The legal reserve cannot be distributed as dividends and is formed to cover future losses.
2.4.16.6. Retained earnings
• Retained earnings include:• the amounts arising from profit distribution/loss cover,• the undistributed result for prior periods,• the current period profit/(loss),• advance dividends paid, • the effects (profit/loss) of prior period errors,• changes in accounting principles.
2.4.17. Liabilities
Liabilities, including trade liabilities, are recognised initially at fair value and subsequently are stated at amortized cost using the effective interest method. The Group uses simplified methods of liabilities measurement, including trade liabilities that are usually measured at amortized cost, if it does not distort information included in the financial statements, particularly if the payment term of liabilities is not long. Liabilities, including trade liabilities, in relation to which simplified methods are used, are measured initially and after initial recognition (including the end of the reporting period) at the amounts due.
2.4.17.1. Government grants
Government grants are transfers of resources to the Group by government, government agencies and similar bodies whether local, national or international in return for past or future compliance with certain conditions relating to the operating activities of the Group.
Government grants are not recognised until there is reasonable assurance that the grants will be received and the Group will comply with the conditions attaching to them.
Grants related to costs are presented as compensation to the given cost at the period they are incurred. The surplus of the received grant over the value of the given cost is presented as other operating income.
Government grants related to assets are presented separately as deferred income that is amortised over the useful life of the asset (gross presentation).
2.4.18. Employee benefits: Jubilee bonuses and post-employment benefits
Under the Group’s remuneration plans employees are entitled to jubilee bonuses and retirement and pension benefits.
The jubilee bonuses are paid to employees after the elapse of a defined number of years in service. The retirement (pension) benefits are paid once at retirement (pension). The amount of retirement and pension benefits and jubilee bonuses depends on the number of years of service and an employee’s average salary.
The provision for jubilee bonuses, retirement and pension benefits is created in order to allocate costs to relevant periods.

ANNUAL REPORT of Public comPany orlen lietuva for the year 2011 33
The provisions set aside are equal to the present value of these liabilities and are estimated at the end of each reporting year by an independent actuary and adjusted if there are any material indications impacting the value of the liabilities. The accumulated liabilities equal discounted future payments, considering the demographic and financial assumption including employee rotation, planned increase of remuneration and relate to the period ended at the last day of the reporting year.
Actuarial gains or losses are recognised in profit or loss.
2.4.19. Provisions
A provision is a liability of uncertain timing or amount.
The Group recognises a provision when it has a present obligation (legal or constructive) as a result of a past event and it is probable that an outflow of resources embodying economic benefits will be required to settle the obligation and a reliable estimate can be made of the amount of the obligation. Long-term provisions are discounted.The amount recognised as a provision is the best estimate of the expenditure required to settle the present obligation at the end of the reporting period.
The provisions are reviewed at the end of each reporting period and adjusted to reflect the current best estimate. If it is no longer probable that an outflow of resources embodying economic benefits will be required to settle the obligation the provision is reversed. The provision is used only for expenditures for which the provision was originally recognised.
When the effect of the time value of money is material, the amount of the provision is the present value of the expenditure expected to be required to settle the obligation. If the discounting method is applied, the increase of provisions with time is recognised as financial expenses.
The provisions are created among others for:- environmental risk,- business risk,- restructuring,- CO2 emission.Provisions are not recognised for the future operating losses.
2.4.19.1. Environmental provision
The Group creates provisions for future liabilities due to reclamation of contaminated land or elimination of harmful substances if there is such a legal or constructive obligation. The Group conducts regular reclamation of contaminated land that decreases the provision by its utilization.
2.4.19.2. Business risk
Business risk provision is created after consideration of all available information, including legal opinions. If on the basis of such information:- it is more likely than not that a present obligation exists at the end of the reporting period, the Group recognises a provision
(if the recognition criteria are met); - it is more likely that no present obligation exists at the end of the reporting period, the Group discloses a contingent
liability, unless the possibility of an outflow of resources embodying economic benefits is remote.
2.4.19.3. Restructuring
A restructuring provision is created when the Group starts to implement a restructuring plan or has announced the main features of the restructuring plan to those affected by it in a sufficiently specific manner to raise a valid expectation that the Group will carry out the restructuring. A restructuring provision includes only the direct expenditures arising from the restructuring, i.e. connected with the termination of employment (paid leave payments and compensations), termination of lease contracts, dismantling of assets.
2.4.19.4. CO2 emissions
For the estimated CO2 emission during the reporting period, a provision should be created in operating activity costs (taxes and charges).

ANNUAL REPORT of Public comPany orlen lietuva for the year 2011 34
2.4.19.5. Accruals
Accruals are liabilities due for goods or services received/provided, but not paid, invoiced or formally agreed with the seller, together with amounts due to employees.
Although it is sometimes necessary to estimate the amount or timing of accruals, the uncertainty is generally much lower than it is for provisions.Accruals relate for example to:- uninvoiced services,- unused holidays.
2.4.20. Revenue from sale
Revenue from sale (from operating activity) comprise revenue that relate to core activity, i.e. activity for which the Group was founded, revenue is recurring and is not of an incidental character.
2.4.20.1. Revenue from sales of finished goods, merchandise, materials and services
Revenue from sales of finished goods, merchandise, materials and services are recognised when the amount of revenue can be measured reliably, it is probable that the economic benefits associated with the sale transaction will flow to the Group and the costs incurred or to be incurred in respect of the transaction can be measured reliably. Revenue from sale of finished goods, merchandise, raw materials and services are recognised when the Group has transferred to the buyer the significant risks and rewards of ownership of the goods and the Group retains neither continuing managerial involvement to the degree usually associated with ownership nor effective control over the goods sold. Revenue includes received or due payments for delivered goods or services rendered decreased by the amount of any trade discounts, value added tax (VAT), excise tax and fuel charges. Revenue is measured at fair value of the received or due payments.
Revenue and expenses relating to services for which the start and end dates fall within different reporting periods are recognised based on the percentage of completion method, if the outcome of a transaction can be measured reliably, i.e. when total contract revenue can be measured reliably, it is probable that the economic benefits associated with the contract will flow to the Group and the stage of completion can be measured reliably. If those conditions are not met, revenue is recognised up to the cost incurred, but not greater than the cost which are expected to be recovered by the Group.
2.4.21. Costs
Costs (relating to operating activity) comprise costs that relate to core activity, i.e. activity for which the Group was founded, costs are recurring and are not of incidental character. Particularly costs that are connected to purchase of raw materials, their processing and distribution, those are fully under Group’s control.The Group recognises costs in accordance with matching and prudence concept.
2.4.21.1. Cost of sales
Cost of sales comprises costs of finished goods, merchandise and raw materials sold, including services of support functions.
2.4.21.2. Distribution expenses
Distribution expenses include selling brokerage expenses, trading expenses, advertising and promotion expenses as well as distribution expenses.
2.4.21.3. General and administrative expenses
General and administrative expenses include expenses relating to management and administration of the Group as a whole.
2.4.22. Other operating revenue and expenses
Other operating revenue refers to operating revenue, in particular relating to profit from liquidation and sale of non-financial non-current assets, surplus of assets, return of court fees, penalties earned by the Group, surplus of grants received to revenue over the value of costs, assets received free of charge, reversal of receivable impairment allowances and some provisions, compensations earned, revaluation gains and profit on sale of investment property.
Other operating costs refer to operating costs, in particular relating to loss on liquidation and sale of non-financial non-

ANNUAL REPORT of Public comPany orlen lietuva for the year 2011 35
current assets, shortages of assets, court fees, contractual penalties and fines, penalties for non-compliance with environmental protection regulations, cash and tangible assets granted free of charge, impairment allowances (except those that are recognised as financial expenses), compensations paid, write-off of construction in progress which have not produced the desired economic effect, research costs, cost of recovery of receivables and liabilities, revaluation losses and loss on sale of investment property.
2.4.22.1. Financial income and expense
Financial income includes profit from the sale of shares and other securities, dividends received, interest earned on cash in bank accounts, term deposits and loans granted, increase in the value of financial assets and foreign exchange gains.
Dividends are recognised when the shareholders’ right to receive payments is established.
Financial expense includes, in particular, the loss on the sale of shares and securities sold and costs associated with such sale, impairment losses relating to financial assets such as shares, securities and interest receivables, foreign exchange losses, interest on bonds and other securities issued, interest on finance lease, commissions on bank loans, borrowings, guarantees and interest costs.
2.4.22.2. Income tax expense
Income tax expense comprises current tax and deferred tax.
Current tax is determined in accordance with the relevant tax law based on the taxable profit for a given period.
Current tax liabilities for current and prior periods represent the amounts payable at the reporting date. If the amount of the current and prior periods income tax paid exceeds the amount due the excess is recognised as a receivable.
Deferred tax assets are recognised for deductible temporary differences, unrealized tax losses and unrealized tax relief. Deferred tax liabilities are recognised for taxable temporary differences.
Deductible temporary differences are temporary differences that will result in reducing taxable amounts of future periods when the carrying amount of the asset or liability is recovered or settled. Deductible temporary differences arise when the carrying amount of an asset is lower than its tax base or when the carrying amount of a liability is higher than its tax base. Deductible temporary differences may also arise in connection with items not recognised in the accounting records as assets or liabilities.
Taxable temporary differences are temporary differences that will result in increasing taxable amounts of future periods when the value of the asset or liability at the end of the reporting period is recovered or settled. Taxable temporary differences arise when the carrying amount of an asset at the end of reporting period is higher than its tax base or when the carrying amount of a liability is lower than its tax base. Taxable temporary differences may also arise in connection with items not recognised in the accounting records as assets or liabilities.
The measurement of deferred tax liabilities and deferred tax assets reflect the tax consequences that would follow from the manner in which the Group expects, at the end of the reporting period, to recover or settle the carrying amount of its assets and liabilities
If the transaction is not a business combination, and affects neither accounting profit nor taxable profit (loss), the Group does not recognise the resulting deferred tax liability or asset arising on initial recognition of an asset or liability. No deferred tax liability is recognised on goodwill, amortisation of which is not a tax deductible expense.
Deferred tax assets and liabilities are measured at the end of each reporting period at the tax rates that are expected to apply to the period when the asset is realised or the liability is settled, based on tax rates (and tax laws) that have been enacted or substantively enacted by the end of the reporting period.
Deferred tax assets are recognised to the extent that it is probable that taxable profit will be available against which the deductible temporary difference can be utilized (impairment analysis of deferred tax assets at each reporting date).
Deferred tax assets and liabilities are not discounted.
Deferred tax assets and liabilities relating to transactions settled directly in equity are recognised in equity.
Deferred tax assets and liabilities are accounted for as non-current assets or long-term liabilities.

ANNUAL REPORT of Public comPany orlen lietuva for the year 2011 36
Deferred tax assets and liabilities are offset in the statement of financial position, if the Group has a legally enforceable right to set off the recognised amounts. It is assumed that a legally enforceable right exists if the amounts concern the same tax payer, and payable to the same tax authority, except for amounts taxed based on lump sum method or in a similar way, if tax law does not allow offsetting them with tax determined according to general rules.
2.4.22.3. Earnings per share
Basic earnings per share are calculated by dividing the net profit or loss for a given period which is attributable to ordinary shareholders of the Parent company (numerator) by the weighted average number of ordinary shares outstanding during the period (denominator).
For the purpose of calculating basic earnings per share, the amounts attributable to ordinary equity holders of the Parent company in respect of: profit or loss from continuing operations attributable to the Group; andprofit or loss attributable to the Group,the amounts above are adjusted for the after-tax amounts of preference dividends, differences arising on the settlement of preference shares, and other similar effects of preference shares classified as equity.
2.4.23. Consolidated statement of cash flows
The consolidated statement of cash flows is prepared using indirect method. Cash and cash equivalents presented in the consolidated statement of cash flows include cash and cash equivalents.
Group discloses components of cash and cash equivalents and reconciliation between amounts disclosed in the consolidated statement of cash flows and respective lines of consolidated statement of financial position.
Non-cash transactions are excluded from statement of cash flows.
Dividends received are presented in consolidated cash flows from investing activities.
Dividends paid are presented in cash flows from financing activities.
Interests received from finance leases, loans granted and short-term securities are presented in cash flows from investing activities. Other interests received are presented in cash flows from operating activities.
Interests paid and provisions on bank loans and borrowings received, debt securities issued and finance leases are presented in consolidated cash flows from financing activities. Other interests paid are presented in consolidated cash flows from operating activities.
Cash receipts and payments for items in which the turnover is quick, the amounts are large, and the maturities are short are reported on a net basis in the consolidated statement of cash flows.
Cash received or paid due to term agreements i.e. futures, forward, options, swap is presented in consolidated cash flows from investing activities, unless the agreements are held by the Group for trading or cash received or paid is presented in financing activities.
Cash flows from corporate income tax are presented in cash flows from operating activities, unless it may be related to investing or financing activities.
2.4.24. Financial instruments
A financial instrument is any contract that gives rise to a financial asset of one entity and a financial liability or equity instrument of another entity.
2.4.24.1. Recognition and derecognition in the consolidated statement of financial position
The Group recognises a financial asset or a financial liability on its statement of financial position when, and only when, the Group becomes a party to the contractual provisions of the instrument.
A regular way purchase or sale of financial assets is recognised by the Group as at trade date.

ANNUAL REPORT of Public comPany orlen lietuva for the year 2011 37
The Group derecognises a financial asset from the statement of financial position when and only when:− the contractual rights to the cash flows from the financial asset expire, or− it transfers the financial asset to another party.
The Group derecognises a financial liability (or part of financial liability) from its statement of financial position when, and only when it is extinguished - that is when the obligation specified in the contract: − is discharged, or− is cancelled, or− expired.
2.4.24.2. Measurement of financial assets and liabilities
When a financial asset is recognised initially, the Group measures it at its fair value plus, in the case of a financial asset or a financial liability not at fair value through profit or loss, transaction costs that are directly attributable to the acquisition or issue of the financial asset. Transaction costs comprise particularly fees and commissions paid to agents (including employees acting as selling agents), advisers, brokers and dealers, levies by regulatory agencies and security exchanges and transfer of taxes and duties. Transaction costs do not include debt premiums or discounts, financing costs or internal administrative or holding costs.
For the purpose of measuring a financial asset at the end of the reporting period or any other date after initial recognition, the Group classifies financial assets into the following four categories: − financial assets at fair value through profit or loss,− held-to-maturity investments,− loans and receivables,− available-for-sale financial assets.
Regardless of characteristics and purpose of a purchase transaction, the Group classifies initially selected financial assets as financial assets at fair value through profit or loss, when doing so results in more relevant information.
A financial asset at fair value through profit or loss is a financial asset that has been designated by the Group upon initial recognition as at fair value through profit or loss or classified as held for trading if it is:− acquired principally for the purpose of selling or repurchasing in the near term, or− part of a portfolio of identified financial instruments that are managed together and for which there is evidence of a recent actual pattern of short-term profit taking, or− a derivative (except for a derivative that is an effective hedging instrument).
Held-to-maturity investments are non-derivative financial assets with fixed or determinable payments and fixed maturity that the Group has the positive intention and ability to hold to maturity.
Loans and receivables are non-derivative financial assets with fixed or determinable payments that are not quoted on an active market.
Available-for-sale financial assets are those non-derivative financial assets that are designated by the Group as available for sale or are not classified as loans and receivables, held-to-maturity investments or financial assets at fair value through profit or loss.
a. Fair value measurement of financial assets
The Group measures financial assets at fair value through profit or loss, including derivative financial assets and available-for-sale financial assets at their fair value, without any deduction for transaction costs that may be incurred on sale or other disposal.
Fair value of financial assets is determined in the following way:− for instruments quoted on an active market based on current quotations available as at the end of the reporting period,− for debt instruments unquoted on an active market based on discounted cash flows analysis,− for forward and swap transactions based on discounted cash flows analysis.
If the fair value of investments in equity instruments (shares) that do not have a quoted market price on an active market is not reliably measurable, the Group measures them at cost, that is the acquisition price less any accumulated impairment losses.

ANNUAL REPORT of Public comPany orlen lietuva for the year 2011 38
A gain or loss on a financial asset classified as at fair value through profit or loss is recognised through profit or loss.
A gain or loss on an available-for-sale financial asset is recognised in other comprehensive income, except for impairment losses and foreign exchange gains and losses that are recognised in profit or loss. In case of debt financial instruments interest calculated using the effective interest method is recognised in profit or loss.
b. Amortized cost measurement of financial assets
The Group measures loans and other receivables, including trade receivables and held-to-maturity investments at amortized cost using the effective interest method. The Group uses simplified methods in respect of measurement of financial assets at amortized cost if it does not distort information included in the statement of financial position, especially when the maturity date is not long. Financial assets measured at amortized cost, in relation to which the Group uses simplifications, are measured initially at the amounts due and after initial recognition (including the end of the reporting period) at the amounts due less any cumulated impairment losses.
c. Fair value measurement of financial liabilities
As at the end of the reporting period or other dates after the initial recognition the Group measures financial liabilities at fair value through profit or loss (including particularly derivatives which are not designated as hedging instruments) at fair value. Regardless of characteristics and purpose of a purchase transaction, the Group classifies initially selected financial liabilities as financial liabilities at fair value through profit or loss, when doing so results in more relevant information. The fair value of a financial liability is the current price of instruments quoted on an active market.
If there is no active market for a financial instrument, the fair value of the financial liabilities is established by using the following techniques:− using recent arm’s length market transactions between knowledgeable, willing parties,− reference to the current fair value of another instrument that is substantially the same,− discounted cash flow analysis.
d. Amortised cost measurement of financial liabilities
The Group measures other financial liabilities at amortized cost using the effective interest rate method. The Group uses simplified methods of measurement of financial liabilities that are usually measured at amortized cost, if it does not distort information included in the financial statements, especially when the maturity date is not long. Financial liabilities in relation to which simplified methods are used, are measured initially and after initial recognition (including the end of the reporting period) at the amounts due.
Financial guarantee contracts, that are contracts that require the Group (issuer) to make specified payments to reimburse the holder for the loss it incurs because a specified debtor fails to make payment when due in accordance with the original or modified terms of a debt instrument, not classified as financial liabilities at fair value through profit or loss are measured at the higher of:− the amount determined in accordance with principles relating to valuation of provisions,the amount initially recognised less, when appropriate, cumulative amortization.
2.4.24.3. Transfers
The Group:- does not reclassify a derivative out the fair value through profit or loss category while it is held or issued;- does not reclassify a financial instrument out of fair value through profit or loss category if at initial recognition it has been
designated by the Group as measured at fair value through profit and loss; and- may, if a financial asset is no longer held for the purpose of selling or repurchasing it in the near term (notwithstanding
that the financial asset may have been acquired or incurred principally for the purpose of selling or repurchasing it in the near term), reclassify that financial asset out of the fair value through profit or loss category in limited circumstances, and in case of loans and receivables (if at initial recognition financial assets was not classified at held for trading) if the Group has intention and possibility to hold a financial asset in a foreseeable future or to maturity.
The Group does not reclassify financial instruments into category of fair value through profit or loss after initial recognition.
2.4.24.4. Impairment of financial assets

ANNUAL REPORT of Public comPany orlen lietuva for the year 2011 39
The Group assesses at the end of each reporting period whether there is any objective indicator that a financial asset or group of financial assets is impaired.
If there is an objective indicator that an impairment loss on loans and other receivables or held-to-maturity investments carried at amortized cost has been incurred, the amount of the loss is measured at the difference between the asset’s carrying amount and the present value of estimated future cash flows discounted at the financial asset’s original effective interest rate.
If, in a subsequent period, the amount of the impairment loss decreases and the decrease can be related objectively to an event occurring after the impairment was recognised, the previously recognised impairment loss is reversed and recognised in profit or loss as revenue.
If there is an objective indicator that an impairment loss has been incurred on an unquoted equity instrument that is not carried at fair value because its fair value cannot be reliably measured, the amount of the impairment loss is measured as the difference between the carrying amount of the financial asset and the present value of estimated future cash flows discounted at the current market rate of return for a similar financial asset. Such impairment losses are not reversed.
If there is an objective indicator that an impairment loss has been incurred on an available-for-sale financial asset, the cumulative loss that had been recognised in statement of comprehensive income is removed from equity and recognised in profit or loss. If, in a subsequent period, the fair value of a debt instrument classified as available for sale increases and the increase can be objectively related to an event occurring after the impairment loss was recognised in profit or loss, the impairment loss is reversed, with the amount of the reversal recognised in profit or loss. Impairment losses for an investment in an equity instrument classified as available for sale are not reversed through profit or loss.
2.4.25. Lease
A lease is an agreement whereby a lessor conveys to the lessee in return for a payment or series of payments the right to use an asset for an agreed period of time. Particularly leases are the agreements defined in the Civil Code as well as rent and tenancy agreements concluded for a definite time.
Assets used under a finance lease, that is the agreement that transfers substantially all the risks and rewards incidental to ownership of an asset to the lessee, are recognised as assets of the lessee. Assets used under an operating lease, that is the agreement that does not transfer substantially all the risks and rewards incidental to ownership of an asset to the lessee, are recognised as assets of the lessor.
Transfer of risks and rewards within finance lease agreements may include:- the lease transfers ownership of the asset to the lessee by or at the end of the lease term,- the lessee has the option to purchase the asset at a price that is expected to be sufficiently lower than the fair value at
the date the option becomes exercisable for it to be reasonably certain, at the inception of the lease, that the option will be exercised,
- the lease term is for the major part of the economic life of the asset even if title is not transferred,- at the inception of the lease the present value of the minimum lease payments amounts to at least substantially all of the
fair value of the leased asset; and, - the leased assets are of such a specialised nature that only the lessee can use them without major modifications.
If the Group uses an asset based on an operating lease, the asset is not recognised in the statement of financial position and lease payments are recognised as an expense in profit or loss.
If the Group uses an asset based on a finance lease, the asset is recognised as an item of property, plant and equipment or an intangible asset. The leased asset is measured at the lower of its fair value or the present value of the minimum lease payments that is the present (discounted) value of payments over the lease term that the lessee is or can be required to make.
The present value of the minimum lease payments is recognised in the statement of financial position as financial liabilities with the division into short-term part (due no more than one year after the end of the reporting period) and long-term part (due more than one year after the end of the reporting period). The minimum lease payments are discounted and apportioned between finance charge and the reduction of the outstanding liability using interest rate implicit in the lease, if this is practicable to determine, if not, the lessee’s incremental borrowing rate.Depreciation methods for assets leased under the finance lease as well as methods of determining impairment losses in respect of assets leased under the finance lease are consistent with policies applied for the Group’s owned assets. If there is a reasonable uncertainty that the lessee will obtain ownership by the end of the lease term, the asset is depreciated over the shorter of the lease term or useful life.
If the Group conveyed to another entity the right to use an asset under an operating lease, the asset is recognised based on the

ANNUAL REPORT of Public comPany orlen lietuva for the year 2011 40
same policies as applied for the Group’s owned asset that is as an item of property, plant and equipment or an intangible asset.
Lease income from operating leases is recognised as other operating revenue.
If the Group conveyed to another entity the right to use an asset under a finance lease, the present value of the minimum lease payments and unguaranteed residual value is recognised in the statement of financial position as receivables with the division into short-term part and long-term part. The minimum lease payments and unguaranteed residual value are discounted using interest rate implicit in the lease, that is the discount rate that, at the inception of the lease, causes the aggregate present value of the minimum lease payments, the unguaranteed residual value and the initial direct costs to be equal to the fair value of the leased asset.
2.4.26. Contingent assets and contingent liabilities
A contingent asset is a possible asset that arises from past events and whose existence will be confirmed only by the occurrence or non-occurrence of one or more uncertain future events not wholly within the control of the Group.
Contingent assets are assessed continually to ensure that developments are appropriately reflected in the consolidated financial statements. If it has become virtually certain that an inflow of economic benefits will arise, the asset and the related income are recognised in the consolidated financial statements of the period in which the change occurs. If an inflow of economic benefits has become probable, the Group discloses the contingent asset.
Contingent assets are not recognised in the consolidated statement of financial position, however the respective information on the contingent asset is disclosed in the additional information to the consolidated financial statements if the inflow of economic benefits is probable and if practicable is estimates the influence on financial results, as according to accounting principles for valuation of provisions.
A contingent liability is:- a possible obligation that arises from past events and whose existence will be confirmed only by the occurrence or non-
occurrence of one or more uncertain future events not wholly within the control of the Group; or- a present obligation that arises from past events but is not recognised because it is not probable that an outflow of
resources embodying economic benefits will be required to settle the obligations or the amount of the obligation (liabilities) cannot be measured with sufficient reliability.
Contingent liabilities are not recognised in the consolidated statement of financial position however the information on contingent liabilities is disclosed in the consolidated financial statements unless the probability of outflow of resources embodying to economic benefits is remote.
Contingent liabilities due to business combinations are disclosed in the consolidated statement of financial position as provisions.
2.4.27. Subsequent events after reporting date
Subsequent events after reporting date are those events, favourable and unfavourable events, which occur between end of the reporting period and date of when the consolidated financial statements are authorized for issue. Two types of subsequent events can be identified: - those, that provide evidence of conditions that existed as the end of the reporting period (adjusting events after the
reporting period), and - those that are indicative of conditions that arose after the reporting period (non-adjusting events after the reporting
period).
The Group adjusts the amounts recognised in its consolidated financial statements to reflect adjusting events after the reporting date.
The Group does not adjust the amounts recognised in its consolidated financial statements to reflect non-adjusting events after the reporting period.
3. The Management Board estimates and assumptions
The preparation of consolidated financial statements in accordance with IFRSs as adopted by the EU requires the Management Board to make judgements, estimates and assumptions that affect the adopted methods and reported amounts of assets,
ANNUAL REPORT of Public comPany orlen lietuva for the year 2011 41
liabilities and equity, revenue and expenses. The estimates and related assumptions are based on historical expertise and other factors regarded as reliable in given circumstances and their effects provide grounds for expert assessment of the carrying amount of assets and liabilities which is not based directly on any other factors.
In the matters of considerable weight, the Management Board might base its estimates on opinions of independent experts.
The estimates and related assumptions are reviewed on a regular basis. Changes in accounting estimates are recognised in the period when they are made only if they refer to that period or in the present and future periods if they concern both the present and future periods.
Actual results may differ from the estimated values.
Judgments, which have a significant impact on carrying amounts recognised in the consolidated financial statements were disclosed in the following notes:- Financial instruments classification, methods of fair value measurement concerning financial instruments, nature and
extent of risks related to financial instruments (Note 26). The Management Board classifies the financial instruments depending on the purpose of the purchase and nature of the instrument. The fair value of financial instruments is measured using common practiced valuation models. Details of the applied estimates and sensitivity analysis have been presented in the above note.
- Leases classification (Note 2.4.28). The Management Board classifies lease agreements as finance lease of operating lease on the basis of business nature analysis.
Estimates and assumptions, which have a significant impact on carrying amounts recognised in the consolidated financial statements, were disclosed in the following notes:- Impairment of property, plant and equipment and intangible assets (Note 5 and Note 6). The Management Board assess, if
there is an objective indicator for impairment of assets or cash generating units. If there is an indicator for impairment the Group assesses the recoverable amount of an asset or cash generating units by determining higher of fair value less cost to sell or value in use by applying the proper discount rate.
- Estimated economic useful lives of property, plant and equipment and intangible assets (Note 5 and Note 6). As described in Note 2.4.6 and 2.4.7 the Group verifies economic useful lives of property, plant and equipment and intangible assets at least once a year. The effect of verification performed in the current reporting year was disclosed in Note 5 and Note 6.
- Provisions (Note 18). As described in Note 2.4.18, recognition of provisions requires estimate of the probable outflow of economic benefits and defining the best estimate of the expenditure required to settle the present obligation at the end of reporting period. Details of applied estimates and their influence on the foregoing consolidated financial statements are disclosed in Note 18.
– Contingent liabilities (Note 29). As described in Note 2.4.29, disclosing of contingent liabilities requires estimate of the probable outflow of economic benefits and defining the best estimate of the expenditure required to settle the present and possible obligation at the end of reporting period.
– Utilization of deductible temporary differences and recognition of deferred tax assets (Note 25). As described in Note 2.4.24, deferred tax assets are recognized to the extent that it is probable that taxable profit will be available against which the deductible temporary differences could be utilized.
– Measurement of defined benefit obligations (Note 17).
4. Operating segments
Accounting principles used in reportable segments are in line with the Group’s accounting principles, described in the Note 2. The segments’ result is the result generated by respective segments without the allocation of corporate functions, financial revenue and expenses, as well as income tax expenses. This information is passed on to chief operating decision makers responsible for allocation of resources and evaluation of segment results.
Revenue from transactions with external parties are arm’s length operations. External segment revenue presented to the Management Board are measured coherently to the method used in the statement of comprehensive income. The Management Board evaluates the results of segment activities based on the segment’s operating result.
The Group has three reportable segments: refining, retail, and corporate functions.
The segment of refining includes production and trade divisions of the Parent company, UAB Mažeikių Naftos prekybos namai, SIA ORLEN Latvija, OU ORLEN Eesti, Sp.z.o.o.Mazeikiu Nafta Trading House, UAB EMAS, UAB Paslaugos tau.
The segment of retail includes 26 owned gas stations of AB Ventus Nafta in Lithuania and 9 gas stations operated under

ANNUAL REPORT of Public comPany orlen lietuva for the year 2011 42
franchise agreements.
The segment of corporate functions includes the Parent company‘s divisions of business maintenance and administration and the UAB Mažeikių Naftos sveikatos priežiūros centras.
4.1. Revenue and financial result by segment
For the year ended 31 December 2011
USDRefining segment
Retail segment
Corporate functions Adjustments Total
Sales to external customers 8,104,741 62,588 2,272 - 8,169,601 Transactions with other segments 39,133 433 1,569 (41,135) - Total sales revenue 8,143,874 63,021 3,841 (41,135) 8,169,601 Total operating expenses (8,071,163) (63,025) (70,001) 41,135 (8,163,054)Other operating revenue 31,636 172 39,935 - 71,743 Other operating expenses (35,432) (4,227) (13,417) - (53,076)Segments operating profit/(loss) 68,915 (4,059) (39,642) - 25,214 Financial revenue 5,460 Financial expenses (33,847)Share of profit of equity-accounted investees 160 - - - 160 Profit/(loss) before tax (3,013)Income tax expense (2,571)Net profit/(loss) (5,584)
Depreciation and amortisation (73,590) (2,624) (3,296) - (79,510)
Additions to non-current assets 121,240 380 580 - 122,200
LTLRefining segment
Retail segment
Corporate functions Adjustments Total
Sales to external customers 20,113,537 155,324 5,638 - 20,274,499 Transactions with other segments 97,116 1,075 3,894 (102,085) - Total sales revenue 20,210,653 156,399 9,532 (102,085) 20,274,499 Total operating expenses (20,030,205) (156,410) (173,721) 102,085 (20,258,251)Other operating revenue 78,511 427 99,107 - 178,045 Other operating expenses (87,930) (10,490) (33,297) - (131,717)Segments operating profit/(loss) 171,029 (10,074) (98,379) - 62,576 Financial revenue 13,548 Financial expenses (83,999)Share of profit of equity-accounted investees 398 - - - 398 Profit/(loss) before tax (7,477)Income tax expense (6,381)Net profit/(loss) (13,858)
Depreciation and amortisation (182,627) (6,512) (8,180) - (197,319)
Additions to non-current assets 300,881 943 1,439 - 303,263

ANNUAL REPORT of Public comPany orlen lietuva for the year 2011 43
For the year ended 31 December 2010
USDRefining segment
Retail segment
Corporate functions Adjustments Total
Sales to external customers 5,728,865 54,380 2,477 - 5,785,722 Transactions with other segments 36,085 357 850 (37,292) - Total sales revenue 5,764,950 54,737 3,327 (37,292) 5,785,722 Total operating expenses (5,688,136) (54,843) (51,612) 37,292 (5,757,299)Other operating revenue 17,691 3,743 2,873 - 24,307 Other operating expenses (41,573) (3,349) 3,457 - (41,465)Segments operating profit/(loss) 52,932 288 (41,955) - 11,265 Financial revenue 1,191 Financial expenses (29,806)Share of profit of equity-accounted investees 149 - - - 149 Profit/(loss) before tax (17,201)Income tax expense (14,218)Net profit/(loss) (31,419)
Depreciation and amortisation (87,122) (2,422) (2,994) - (92,538)
Additions to non-current assets 102,332 207 203 - 102,742
LTLRefining segment
Retail segment
Corporate functions Adjustments Total
Sales to external customers 14,933,432 141,752 6,457 - 15,081,641 Transactions with other segments 94,063 931 2,216 (97,210) - Total sales revenue 15,027,495 142,683 8,673 (97,210) 15,081,641 Total operating expenses (14,827,267) (142,959) (134,537) 97,210 (15,007,553)Other operating revenue 46,114 9,757 7,489 - 63,360 Other operating expenses (108,368) (8,729) 9,011 - (108,086)Segments operating profit/(loss) 137,974 752 (109,364) - 29,362 Financial revenue 3,104 Financial expenses (77,697)Share of profit of equity-accounted investees 387 - - - 387 Profit/(loss) before tax (44,844)Income tax expense (37,063)Net profit/(loss) (81,907)
Depreciation and amortisation (227,101) (6,313) (7,804) - (241,218)
Additions to non-current assets 266,752 539 528 - 267,819 Adjustments in the tables above represent eliminations of inter-segment transactions.
Additions to non-current assets include purchases and other increases, which are widely described in Notes 5 and 6.
CO2 emission rights granted for free are included to Additions to non-current assets amounts.

ANNUAL REPORT of Public comPany orlen lietuva for the year 2011 44
4.2. Other segment data
4.2.1. Assets by operating segment
USD as at as at31/12/2011 31/12/2010
Refining Segment 1,735,180 1,713,492 Retail Segment 23,760 30,813 Total segment assets 1,758,940 1,744,305 Corporate Functions 47,338 42,998 Not allocated 68,668 70,710 Adjustments (7,678) (9,118)
1,867,268 1,848,895
LTL as at as at31/12/2011 31/12/2010
Refining Segment 4,631,891 4,472,045 Retail Segment 63,425 80,418 Total segment assets 4,695,316 4,552,463 Corporate Functions 126,362 112,221 Not allocated 183,302 184,547 Adjustments (20,496) (23,797)
4,984,484 4,825,434
Adjustments in the tables above represent eliminations of inter-segment transactions.
Including:
USD
as at as at as at as at31/12/2011 31/12/2010 31/12/2011 31/12/2010
Refining Segment 4,977 317 1,756 1,646 Total segment assets 4,977 317 1,756 1,646 Corporate Functions 152 163 - -
5,129 480 1,756 1,646
Non-current assets classified as held for sale
Investments into equity-accounted investees
LTL
as at as at as at as at31/12/2011 31/12/2010 31/12/2011 31/12/2010
Refining Segment 13,285 828 4,689 4,295 Total segment assets 13,285 828 4,689 4,295 Corporate Functions 405 426 - -
13,690 1,254 4,689 4,295
Non-current assets classified as held for sale
Investments into equity-accounted investees
Operating segments include all assets except for financial assets and tax assets. Assets used jointly by different segments are allocated based on revenue generated by particular segments.

ANNUAL REPORT of Public comPany orlen lietuva for the year 2011 45
4.2.2. Recognition and reversal of impairment allowances
USD for the year ended for the year ended for the year ended for the year ended31/12/2011 31/12/2010 31/12/2011 31/12/2010
Refining Segment (90,092) (57,413) 946 - Retail Segment (4,206) (3,228) 82 3,709 Total segment assets (94,298) (60,641) 1,028 3,709 Corporate Functions (48) - - -
(94,346) (60,641) 1,028 3,709
Recognition Reversal
LTLfor the year ended for the year ended for the year ended for the year ended
31/12/2011 31/12/2010 31/12/2011 31/12/2010Refining Segment (223,581) (149,659) 2,348 - Retail Segment (10,438) (8,413) 203 9,669 Total segment assets (234,019) (158,072) 2,551 9,669 Corporate Functions (120) - - 1,090
(234,139) (158,072) 2,551 10,759
Recognition Reversal
Impairment allowances of assets by segment include items recognised in statement of comprehensive income i.e.:- receivables allowances;- inventories allowances;- non-current assets impairment allowances.
Recognition and reversal of allowances are undertaken in conjunction with valuation of inventories, occurrence or reversal of indications in respect of overdue receivables, uncollectible receivables or receivables in court as well as potential impairment of property, plant and equipment, intangible assets and shares.
4.2.3. Geographical information
Revenue from sales
for the year ended
for the year ended
for the year ended
for the year ended
31/12/2011 31/12/2011 31/12/2010 31/12/2010USD LTL USD LTL
Poland 515,201 1,278,575 602,024 1,569,295 Lithuania 1,470,143 3,648,454 1,053,606 2,746,435 Other baltic countries 1,475,983 3,662,947 737,883 1,923,440 Other EU countries 2,615,375 6,490,576 681,375 1,776,140 Other countries, including: 2,092,899 5,193,947 2,710,834 7,066,331
Switzerland 1,326,303 3,291,486 1,722,836 4,490,917 Ukraine 621,066 1,541,299 403,140 1,050,865 Other countries 145,530 361,162 584,858 1,524,549
8,169,601 20,274,499 5,785,722 15,081,641
Non-current assets
for the year ended
for the year ended
for the year ended
for the year ended
31/12/2011 31/12/2012 31/12/2010 31/12/2011USD LTL USD LTL
Lithuania 977,952 2,610,544 1,009,721 2,635,272 Other Baltic countries 54 145 59 154
978,006 2,610,689 1,009,780 2,635,426
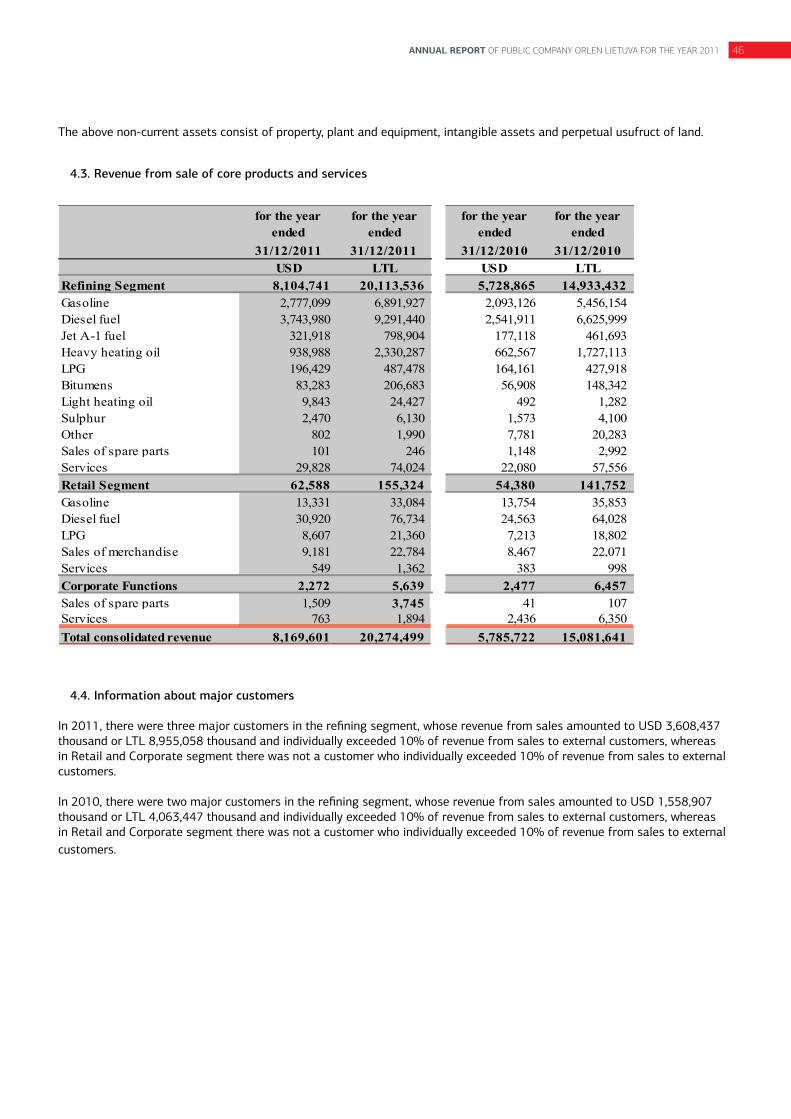
ANNUAL REPORT of Public comPany orlen lietuva for the year 2011 46
The above non-current assets consist of property, plant and equipment, intangible assets and perpetual usufruct of land.
4.3. Revenue from sale of core products and services
for the year ended
for the year ended
for the year ended
for the year ended
31/12/2011 31/12/2011 31/12/2010 31/12/2010USD LTL USD LTL
Refining Segment 8,104,741 20,113,536 5,728,865 14,933,432 Gasoline 2,777,099 6,891,927 2,093,126 5,456,154 Diesel fuel 3,743,980 9,291,440 2,541,911 6,625,999 Jet A-1 fuel 321,918 798,904 177,118 461,693 Heavy heating oil 938,988 2,330,287 662,567 1,727,113 LPG 196,429 487,478 164,161 427,918 Bitumens 83,283 206,683 56,908 148,342 Light heating oil 9,843 24,427 492 1,282 Sulphur 2,470 6,130 1,573 4,100 Other 802 1,990 7,781 20,283 Sales of spare parts 101 246 1,148 2,992 Services 29,828 74,024 22,080 57,556 Retail Segment 62,588 155,324 54,380 141,752 Gasoline 13,331 33,084 13,754 35,853 Diesel fuel 30,920 76,734 24,563 64,028 LPG 8,607 21,360 7,213 18,802 Sales of merchandise 9,181 22,784 8,467 22,071 Services 549 1,362 383 998 Corporate Functions 2,272 5,639 2,477 6,457 Sales of spare parts 1,509 3,745 41 107 Services 763 1,894 2,436 6,350 Total consolidated revenue 8,169,601 20,274,499 5,785,722 15,081,641
4.4. Information about major customers
In 2011, there were three major customers in the refining segment, whose revenue from sales amounted to USD 3,608,437 thousand or LTL 8,955,058 thousand and individually exceeded 10% of revenue from sales to external customers, whereas in Retail and Corporate segment there was not a customer who individually exceeded 10% of revenue from sales to external customers.
In 2010, there were two major customers in the refining segment, whose revenue from sales amounted to USD 1,558,907 thousand or LTL 4,063,447 thousand and individually exceeded 10% of revenue from sales to external customers, whereas in Retail and Corporate segment there was not a customer who individually exceeded 10% of revenue from sales to external customers.

ANNUAL REPORT of Public comPany orlen lietuva for the year 2011 47
5. Property, plant and equipment
as at31/12/2011
as at31/12/2011
as at31/12/2010
as at31/12/2010
USD LTL USD LTLLand 1,860 4,965 2,342 6,110 Buildings and constructions 44,029 117,530 49,654 129,592 Machinery and equipment 795,300 2,122,974 848,623 2,214,821 Vehicles and other 34,562 92,260 44,992 117,425 Construction in progress 51,948 138,670 42,443 110,772
927,699 2,476,399 988,054 2,578,720

ANNUAL REPORT of Public comPany orlen lietuva for the year 2011 48
Changes in property, plant and equipment by class:
USD Land Buildings and constructions
Machinery and equipment
Vehicles and other
Construction in progress
Total
Gross book value1 January 2011 2,872 95,616 1,390,446 106,035 61,052 1,656,021 Acquisitions 16 337 8,603 275 32,468 41,699 Other increases - - - - 3 3 Reclassifications - (3) 6,135 753 (16,283) (9,398)Decreases - (2) (5,499) (818) (1,796) (8,115)Foreign exchange differences (64) (521) (393) (271) (16) (1,265) 31 December 2011 2,824 95,427 1,399,292 105,974 75,428 1,678,945 Accumulated depreciation and impairment allowances1 January 2011 530 45,962 541,823 61,043 18,609 667,967 Depreciation - 2,517 64,225 11,441 - 78,183 Impairment allowances, net 432 3,319 1,948 504 4,883 11,086
recognition 432 3,319 1,948 504 7,089 13,292 decreases - - - - (2,206) (2,206)
Reclassifications 31 (3) (718) (491) - (1,181)Decreases of depreciation due to liquidation and sale of property, plant and equipment and other decreases
- (2) (2,947) (809) - (3,758)
Foreign exchange differences (29) (395) (339) (276) (12) (1,051) 31 December 2011 964 51,398 603,992 71,412 23,480 751,246
Gross book value1 January 2010 3,112 97,392 1,384,046 112,754 67,890 1,665,194 Acquisitions - 93 6,187 428 9,137 15,845 Reclassifications 4 151 3,323 (2,460) (14,380) (13,362)Decreases - (46) (1,655) (3,669) (1,549) (6,919)Foreign exchange differences (244) (1,974) (1,455) (1,018) (46) (4,737) 31 December 2010 2,872 95,616 1,390,446 106,035 61,052 1,656,021 Accumulated depreciation and impairment allowances1 January 2010 343 43,701 473,575 50,511 5,520 573,650 Depreciation - 2,654 73,335 15,553 - 91,542 Impairment allowances, net 223 535 1,458 757 13,133 16,106
recognition 321 2,014 3,523 1,231 13,133 20,222 reversal (98) (1,479) (1,657) (469) - (3,703)decreases - - (408) (5) - (413)
Reclassifications - (3) (4,676) (1,625) - (6,304)
Decreases of depreciation due to liquidation and sale of property, plant and equipment and other decreases - (28) (976) (3,590) - (4,594)
Foreign exchange differences (36) (897) (893) (563) (44) (2,433) 31 December 2010 530 45,962 541,823 61,043 18,609 667,967
Net book value 1 January 2011 2,342 49,654 848,623 44,992 42,443 988,054
31 December 2011 1,860 44,029 795,300 34,562 51,948 927,699
1 January 2010 2,769 53,691 910,471 62,243 62,370 1,091,544
31 December 2010 2,342 49,654 848,623 44,992 42,443 988,054

ANNUAL REPORT of Public comPany orlen lietuva for the year 2011 49
LTL Land Buildings and constructions
Machinery and equipment
Vehicles and other
Construction in progress
Total
Gross book value1 January 2011 7,496 249,548 3,628,925 276,741 159,340 4,322,050 Acquisitions 39 838 21,351 682 80,575 103,485 Other increases - - - - 8 8 Reclassifications - (8) 15,224 1,870 (40,410) (23,324)Decreases - (4) (13,648) (2,032) (4,457) (20,141)Foreign exchange differences 1 4,359 83,419 5,625 6,292 99,696 31 December 2011 7,536 254,733 3,735,271 282,886 201,348 4,481,774 Accumulated depreciation and impairment allowances1 January 2011 1,386 119,956 1,414,104 159,316 48,568 1,743,330 Depreciation - 6,247 159,385 28,393 - 194,025 Impairment allowances, net 1,071 8,237 4,835 1,251 12,118 27,512
recognition 1,071 8,237 4,835 1,251 17,593 32,987 decreases - - - - (5,475) (5,475)
Reclassifications 78 (8) (1,782) (1,220) - (2,932)
Decreases of depreciation due to liquidation and sale of property, plant and equipment and other decreases - (4) (7,313) (2,007) - (9,324)
Foreign exchange differences 36 2,775 43,068 4,893 1,992 52,764 31 December 2011 2,571 137,203 1,612,297 190,626 62,678 2,005,375
Gross book value1 January 2010 7,486 234,249 3,328,903 271,196 163,290 4,005,124 Acquisitions - 242 16,128 1,116 23,817 41,303 Reclassifications 10 394 8,661 (6,412) (37,484) (34,831)Decreases - (120) (4,314) (9,564) (4,038) (18,036)Foreign exchange differences - 14,783 279,547 20,405 13,755 328,490 31 December 2010 7,496 249,548 3,628,925 276,741 159,340 4,322,050 Accumulated depreciation and impairment allowances1 January 2010 825 105,113 1,139,039 121,489 13,278 1,379,744 Depreciation - 6,918 191,161 40,542 - 238,621 Impairment allowances, net 582 1,394 3,800 1,973 34,234 41,983
recognition 837 5,250 9,183 3,209 34,234 52,713 reversal (255) (3,856) (4,320) (1,223) - (9,654)decreases - - (1,063) (13) - (1,076)
Reclassifications - (8) (12,189) (4,236) - (16,433)
Decreases of depreciation due to liquidation and sale of property, plant and equipment and other decreases - (73) (2,544) (9,358) - (11,975)
Foreign exchange differences (21) 6,612 94,837 8,906 1,056 111,390 31 December 2010 1,386 119,956 1,414,104 159,316 48,568 1,743,330
Net book value 1 January 2011 6,110 129,592 2,214,821 117,425 110,772 2,578,720
31 December 2011 4,965 117,530 2,122,974 92,260 138,670 2,476,399
1 January 2010 6,661 129,136 2,189,864 149,707 150,012 2,625,380
31 December 2010 6,110 129,592 2,214,821 117,425 110,772 2,578,720
Concerning reclassifications in the tables above, in 2011 property, plant and equipment with the carrying amount of USD 8,217 thousand or LTL 20,392 thousand was reclassified to non-current assets held for sale (USD 8,175 thousand or LTL 20,288 thousand), perpetual usufruct of land (USD 31 thousand or LTL 77 thousand), and intangible assets (USD 11 thousand or LTL 27 thousand). In 2010 property, plant and equipment with the carrying amount of 7,058 thousands or LTL 18,398 thousand was reclassified to non-current assets held for sale (USD 408 thousand or LTL 1,064 thousand) and inventories (USD 6,650 thousand or LTL 17,334 thousand).
Total impairment allowances of property, plant and equipment as at 31 December 2011 amounted to USD 40,285 thousand or LTL 107,537 thousand and 31 December 2010 USD 33,486 thousand or LTL 87,395 thousand.
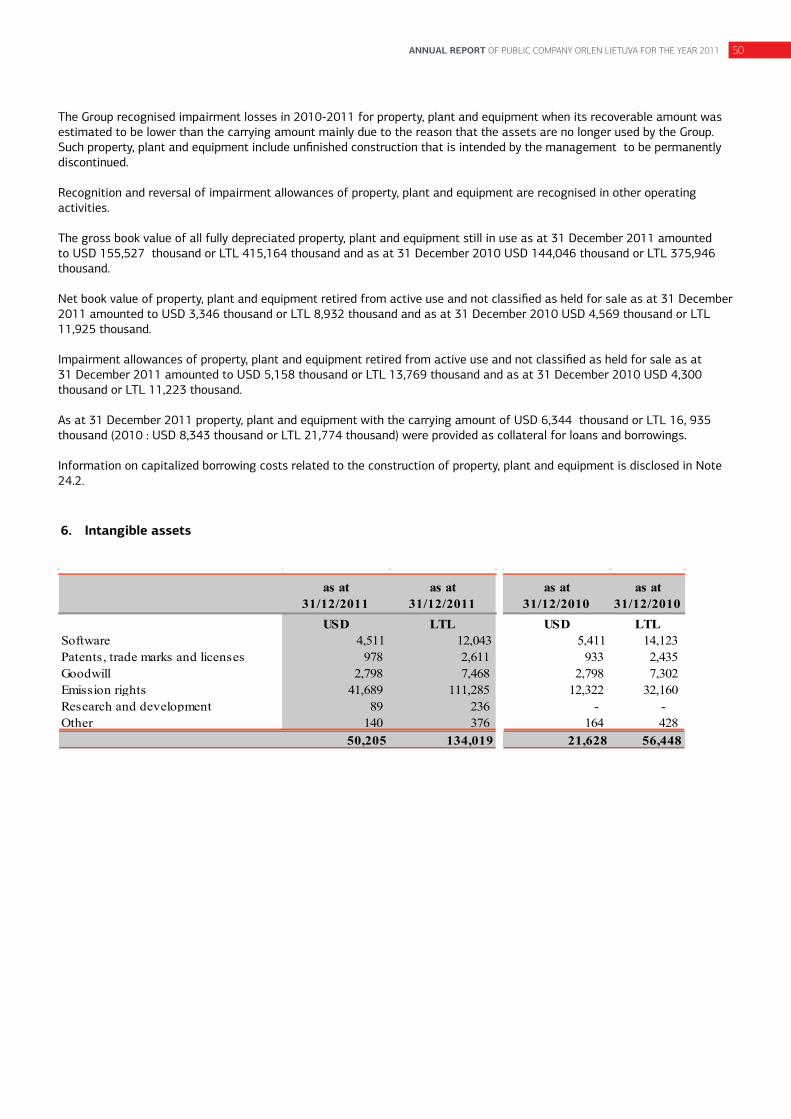
ANNUAL REPORT of Public comPany orlen lietuva for the year 2011 50
The Group recognised impairment losses in 2010-2011 for property, plant and equipment when its recoverable amount was estimated to be lower than the carrying amount mainly due to the reason that the assets are no longer used by the Group. Such property, plant and equipment include unfinished construction that is intended by the management to be permanently discontinued.
Recognition and reversal of impairment allowances of property, plant and equipment are recognised in other operating activities.
The gross book value of all fully depreciated property, plant and equipment still in use as at 31 December 2011 amounted to USD 155,527 thousand or LTL 415,164 thousand and as at 31 December 2010 USD 144,046 thousand or LTL 375,946 thousand.
Net book value of property, plant and equipment retired from active use and not classified as held for sale as at 31 December 2011 amounted to USD 3,346 thousand or LTL 8,932 thousand and as at 31 December 2010 USD 4,569 thousand or LTL 11,925 thousand.
Impairment allowances of property, plant and equipment retired from active use and not classified as held for sale as at 31 December 2011 amounted to USD 5,158 thousand or LTL 13,769 thousand and as at 31 December 2010 USD 4,300 thousand or LTL 11,223 thousand.
As at 31 December 2011 property, plant and equipment with the carrying amount of USD 6,344 thousand or LTL 16, 935 thousand (2010 : USD 8,343 thousand or LTL 21,774 thousand) were provided as collateral for loans and borrowings.
Information on capitalized borrowing costs related to the construction of property, plant and equipment is disclosed in Note 24.2.
6. Intangible assets
as at31/12/2011
as at31/12/2011
as at31/12/2010
as at31/12/2010
USD LTL USD LTLSoftware 4,511 12,043 5,411 14,123 Patents, trade marks and licenses 978 2,611 933 2,435 Goodwill 2,798 7,468 2,798 7,302 Emission rights 41,689 111,285 12,322 32,160 Research and development 89 236 - - Other 140 376 164 428
50,205 134,019 21,628 56,448

ANNUAL REPORT of Public comPany orlen lietuva for the year 2011 51
The changes of intangible assets were as follows:
USD SoftwarePatents,
trade marks and licenses
Goodwill Emission rights
Research and
development Other Total
Gross book value1 January 2011 15,553 10,127 2,798 12,322 - 167 40,967 Acquisitions 421 49 - 32,281 89 12 32,852 Other increases - - - 47,646 - - 47,646 Reclassifications 36 - - - - (30) 6 Decreases (7) (3,137) - (39,309) - - (42,453)Foreign exchange differences (25) - - - - (2) (27) 31 December 2011 15,978 7,039 2,798 52,940 89 147 78,991 Accumulated amortisation and impairment allowances1 January 2011 10,142 9,194 - - - 3 19,339 Amortisation 1,318 4 - - - 3 1,325 Impairment allowances, net 43 (3,120) - 11,251 - - 8,174
recognition 43 - - 11,251 - - 11,294 decreases - (3,120) - - - - (3,120)
Reclassifications (4) - - - - - (4)Decreases of amortisation due to liquidation and sale of property, plant and equipment and other decreases
(7) (17) - - - - (24)
Foreign exchange differences (25) - - - - 1 (24) 31 December 2011 11,467 6,061 - 11,251 - 7 28,786
Gross book value1 January 2010 14,946 9,689 2,798 - - 182 27,615 Acquisitions 733 467 - 42,598 - - 43,798 Other increases - - - 43,099 - - 43,099 Decreases (6) (29) - (73,375) - - (73,410)Foreign exchange differences (120) - - - - (15) (135) 31 December 2010 15,553 10,127 2,798 12,322 - 167 40,967 Accumulated amortisation and impairment allowances1 January 2010 9,247 6,230 - - - - 15,477 Amortisation 988 4 - - - 3 995 Impairment allowances, net (2) 2,989 - - - - 2,987
recognition 4 2,989 - - - - 2,993 reversal (6) - - - - - (6)
Decreases of amortisation due to liquidation and sale of property, plant and equipment and other decreases
(6) (29) - - - - (35)
Foreign exchange differences (85) - - - - - (85) 31 December 2010 10,142 9,194 - - - 3 19,339
Net book value 1 January 2011 5,411 933 2,798 12,322 - 164 21,628
31 December 2011 4,511 978 2,798 41,689 89 140 50,205
1 January 2010 5,699 3,459 2,798 - - 182 12,138
31 December 2010 5,411 933 2,798 12,322 - 164 21,628

ANNUAL REPORT of Public comPany orlen lietuva for the year 2011 52
LTL SoftwarePatents,
trade marks and licenses
Goodwill Emission rights
Research and
development Other Total
Gross book value1 January 2011 40,593 26,430 7,302 32,160 - 437 106,922 Acquisitions 1,044 122 - 80,112 220 29 81,527 Other increases - - - 118,243 - - 118,243 Reclassifications 91 - - - - (75) 16 Decreases (15) (7,785) - (97,554) - - (105,354)Foreign exchange differences 939 23 166 8,358 16 3 9,505 31 December 2011 42,652 18,790 7,468 141,319 236 394 210,859 Accumulated amortisation and impairment allowances1 January 2011 26,470 23,995 - - - 9 50,474 Amortisation 3,271 10 - - - 9 3,290 Impairment allowances, net 106 (7,743) - 27,922 - - 20,285
recognition 106 - - 27,922 - - 28,028 decreases - (7,743) - - - - (7,743)
Reclassifications (11) - - - - - (11)Decreases of amortisation due to liquidation and sale of property, plant and equipment and other decreases
(14) (42) - - - - (56)
Foreign exchange differences 787 (41) - 2,112 - - 2,858 31 December 2011 30,609 16,179 - 30,034 - 18 76,840
Gross book value1 January 2010 35,948 23,304 6,729 - - 437 66,418 Acquisitions 1,911 1,217 - 111,041 - - 114,169 Other increases - - - 112,347 - - 112,347 Decreases (16) (76) - (191,268) - - (191,360)Foreign exchange differences 2,750 1,985 573 40 - - 5,348 31 December 2010 40,593 26,430 7,302 32,160 - 437 106,922 Accumulated amortisation and impairment allowances1 January 2010 22,240 14,983 - - - - 37,223 Amortisation 2,576 10 - - - 8 2,594 Impairment allowances, net (5) 7,791 - - - - 7,786
recognition 10 7,791 - - - - 7,801 reversal (15) - - - - - (15)
Decreases of amortisation due to liquidation and sale of property, plant and equipment and other decreases
(16) (76) - - - - (92)
Foreign exchange differences 1,675 1,287 - - - 1 2,963 31 December 2010 26,470 23,995 - - - 9 50,474
Net book value 1 January 2011 14,123 2,435 7,302 32,160 - 428 56,448
31 December 2011 12,043 2,611 7,468 111,285 236 376 134,019
1 January 2010 13,708 8,321 6,729 - - 437 29,195
31 December 2010 14,123 2,435 7,302 32,160 - 428 56,448
Total impairment allowances of intangible assets as at 31 December 2011 amounted to USD 11,324 thousand or LTL 30,228 thousand and as at 31 December 2010 USD 3,193 thousand or LTL 8,333 thousand.
Recognition and reversal of impairment allowances of intangible assets are recognised in other operating activities.

ANNUAL REPORT of Public comPany orlen lietuva for the year 2011 53
The Group reviews economic useful lives of intangible assets and adjustment of amortisation expense is made prospectively.
The gross book value of all fully depreciated intangible assets still in use as at 31 December 2011 amounted USD 10,851 thousand or LTL 28,966 thousand and as at 31 December 2010 USD 10,326 thousand or LTL 26,950 thousand.
As at 31 December 2011 the Group reviewed the recoverable amount of goodwill and declared the lack of necessity to recognise impairment allowances.
Emission rights were tested for impairment as at 31 December 2011 and impairment loss USD 11,251 thousand or LTL 27,922 thousand was recognised to the extent that the carrying amount of emission rights exceeded their recoverable amount. The recoverable amount was the fair value of emission rights as at 31 December 2011 less costs to sell; where market bid price was considered as the best estimate of fair value.
Rights
CO2 emission allowances are allocated according to Order No. D1-609/4-477 of the Minister of Economy and Minister of Environment of the Republic of Lithuania on 19 November 2007 whereby II National EUA Allocation Plan for 2008-2012 was approved, i.e. for the second period of emission allowance trading.
Change in CO2 emission rights in 2011:
Quantity (in tonnes) Value USD Value LTL
Allowances at the beginning of period 815,575 12,322 32,160 Granted free of charge 2,320,645 47,646 118,243 Settled emission of 2010 (1,967,110) (39,309) (97,554) Purchase/(Sale), net 1,815,951 32,281 80,112 Impairment allowances recognition - (11,251) (27,922) Foreign exchange differences - - 6,246 As at 31 December 2011 2,985,061 41,689 111,285 Emission in 2011 1,903,722 32,771 87,479 Surplus 1,081,339 8,918 23,806
Change in CO2 emission rights in 2010:
Quantity (in tonnes) Value USD Value LTL
Allowances at the beginning of period - - - Granted free of charge 2,474,876 43,099 112,343 Settled emission of 2009 (2,102,763) (36,479) (95,090) Purchase/(Sale), net 443,462 5,702 14,863 Foreign exchange differences - - 44 As at 31 December 2010 815,575 12,322 32,160 Emission in 2010 1,967,098 32,666 85,256 Shortage (1,151,523) (20,344) (53,096)

ANNUAL REPORT of Public comPany orlen lietuva for the year 2011 54
7. Perpetual usufruct of land
for the year ended
for the year ended
for the year ended
for the year ended
31/12/2011 31/12/2011 31/12/2010 31/12/2010USD LTL USD LTL
Begining of the period 98 258 109 261 Reclassifications 31 78 - - Depreciation (2) (4) (1) (3) Impairment allowances recognition (24) (61) - - Foreign exchange differences (1) - (10) -
102 271 98 258
The total amount of perpetual usufruct charges, recognized as expenses in profit or loss in 2011 and 2010 amounted to USD 2 thousand or LTL 4 thousand and USD 1 thousand or LTL 3 thousand, respectively.
8. Investments into equity-accounted investees
USD LTL USD LTL Beginning of the year 1,646 4,295 1,624 3,907 Share of profit (loss) ,net of tax 160 398 149 387 Foreign exchange differences (50) (4) (127) 1 End of the year 1,756 4,689 1,646 4,295
as at31/12/2011
as at31/12/2010
Investments in associates represent an investment of a 34% interest in Naftelf UAB, incorporated in Lithuania. No dividends were received from the company in 2011 and 2010.
There were no possibilities to determine the fair value of the investment as at 31 December 2011 or as at 31 December 2010 as the shares of the associate are not quoted in any open market, the Group measures them at cost that is the acquisition price.
9. Inventories
as at31/12/2011
as at31/12/2011
as at31/12/2010
as at31/12/2010
USD LTL USD LTLRaw materials 203,280 542,639 196,118 511,846 Work in progress 30,199 80,613 31,879 83,201 Finished goods 195,362 521,499 172,185 449,385 Goods for resale 25,070 66,922 - - Spare parts 24,882 66,420 46,443 121,212 Inventories, net 478,793 1,278,093 446,625 1,165,644 Write-down for obsolescence 30,541 81,526 20,408 53,264 Inventories, gross 509,334 1,359,619 467,033 1,218,908

ANNUAL REPORT of Public comPany orlen lietuva for the year 2011 55
The change of write-downs for obsolescence on inventories
for the year ended
31/12/2011
for the year ended
31/12/2011
for the year ended
31/12/2010
for the year ended
31/12/2010 USD LTL USD LTL
Beginning of the period 20,408 53,264 13,965 33,589 Recognition 60,784 150,848 37,426 97,558 Utilization (49,705) (123,353) (30,983) (80,763)Reversal (946) (2,348) - - Foregn exchange differences - 3,115 - 2,880
30,541 81,526 20,408 53,264
As at 31 December 2011 the balance of write-down to net realizable value:for spare parts was USD 27,834 thousand or LTL 74,300 thousand. for raw materials was USD 109 thousand or LTL 291 thousand. for finished goods and goods for resale was USD 1,079 thousand or LTL 2,880 thousand.for work in progress was USD 1,519 thousand or LTL 4,055 thousand.
As at 31 December 2010 the balance of write-down to net realizable value: - for spare parts was USD 19,550 thousand or LTL 51,024 thousand. - for raw materials was USD 29 thousand or LTL 76 thousand. - for finished goods was USD 465 thousand or LTL 1,214 thousand. - for work in progress was USD 364 thousand or LTL 950 thousand.
Change in write-down to net realizable value of spare parts, raw materials, finished goods and work in progress was included in costs of sales.
No inventories were pledged in 2011 and 2010 to secure letters of credit and guarantees issued by the banks on behalf of the Group.
In 2011 the Parent Company signed an agreement with Baltimar VT for fuel oil storage. The agreement is effective until 15 July 2012. As at 31 December 2011 the Parent Company inventory included the fuel oil of limited use for USD 2,071 thousand or LTL 5,528 thousand.
10. Trade and other receivables
as at31/12/2011
as at31/12/2011
as at31/12/2010
as at31/12/2010
USD LTL USD LTLTrade receivables 228,253 609,300 229,261 598,349 Financial assets 228,253 609,300 229,261 598,349 Other taxation, duty social security receivables an other benefits
74 197 2,770 7,229
Prepayments, accrued income and deferred charges
12,888 34,402 11,901 31,060
Other 24,748 66,063 27,143 70,841 Non-financial assets 37,710 100,662 41,814 109,130 Receivables, net 265,963 709,962 271,075 707,479 Receivables impairment allowance 10,017 26,740 17,686 46,158 Receivables, gross 275,980 736,702 288,761 753,637
As at 31 December 2011 and 31 December 2010 trade receivables and other receivables denominated in functional currencies amounted to USD 143,934 thousand or LTL 384,217 thousand and USD 160,874 thousand or LTL 419,865 thousand, respectively.

ANNUAL REPORT of Public comPany orlen lietuva for the year 2011 56
Detailed split of receivables from related entities are disclosed in Note 31.
Change in impairment allowances of trade and other receivables
for the year ended
31/12/2011
for the year ended
31/12/2011
for the year ended
31/12/2010
for the year ended
31/12/2010USD LTL USD LTL
Beginning of the period 17,686 46,158 26,616 64,015 Recognition 1,717 4,261 1 3 Amounts written-off (10,683) (26,511) (7,655) (19,953)Foreign exchange differences 1,297 2,832 (1,276) 2,093
10,017 26,740 17,686 46,158
Recognition and reversal of impairment allowances of trade and other receivables are presented in other operating activities.
11. Other short-term financial assets
as at31/12/2011
as at31/12/2011
as at31/12/2010
as at31/12/2010
USD LTL USD LTLDerivatives not designated as hedge accounting 1,255 3,350 - -
commodity swaps 1,255 3,350 - - Deposits 4,446 11,869 11,765 30,704 Loans granted 838 2,237 1,237 3,230
6,539 17,456 13,002 33,934
Commodity swaps notional amount are USD 42,039 thousand or LTL 104,328 thousand.
The average term of deposits is 351 days, the interest rate is 1.95%. Derivatives are stated at fair value through profit or loss. Deposits and loans granted are stated at amortized cost.
Loans granted have a maturity of 31 August 2012 and effective interest rate during 2011 was 5% (2010:10%)
12. Cash and cash equivalents
as at31/12/2011
as at31/12/2011
as at31/12/2010
as at31/12/2010
USD LTL USD LTLCash on hand and in bank 47,151 125,865 32,096 83,768Short-term deposit 12,553 33,508 2,591 6,762
59,704 159,373 34,687 90,530
As at 31 December 2011 an average maturity of deposits is 37 days and 60 days as at 31 December 2010.
Cash and cash equivalents required to be maintained under the terms of letters of credit and guarantees issued by banks for settlements with suppliers are presented below:

ANNUAL REPORT of Public comPany orlen lietuva for the year 2011 57
as at31/12/2011
as at31/12/2011
as at31/12/2010
as at31/12/2010
USD LTL USD LTLCash at bank and short-term deposits held at banks to secure issued letters of credit
34,343 91,675 2,913 7,603
Cash held at banks to secure guaranties issued by banks
3,547 9,468 6,860 17,904
37,890 101,144 9,773 25,507
Use of amounts stated above in the table is restricted.
Cash at bank and short-term deposits to be maintained under the terms of letters of credit and guarantees issued for settlements with suppliers were classified as cash and cash equivalents for the purposes of the statement of cash flows because these funds are held for meeting short term operating cash commitments with restriction of usage no longer than for period of three months.
Cash at bank amounting to USD 2,723 thousand or LTL 7,268 thousand as at 31 December 2011 and USD 1,685 thousand or LTL 4,397 thousand as at 31 December 2010 is provided as collateral for bank borrowings and for letters of credit and guarantees issued by banks on behalf of the Group.
The carrying amounts of cash and cash equivalents are denominated in the following currencies:
as at31/12/2011
as at31/12/2011
as at31/12/2010
as at31/12/2010
USD LTL USD LTLUS dolar 33,731 90,042 15,915 41,537Lithuanian Litas 17,251 46,050 9,059 23,643Euro 5,375 14,347 211 551Other 3,347 8,934 9,502 24,799
59,704 159,373 34,687 90,530
13. Non-current assets classified as held for sale
Net book value of non-current assets classified as held for sale amounted to USD 5,129 thousand or LTL 13,690 thousand as at 31 December 2011 and USD 480 thousand or LTL 1,254 thousand as at 31 December 2010, respectively.
In the Group, as at 31 December 2011 and as at 31 December 2010 non-current assets classified as held for sale include buildings and constructions, machinery and equipment and vehicles.
Impairment on measurement of non-current assets classified as held for sale to the lower of carrying amount and fair value less costs to sell amounted to USD 56 thousand or LTL 149 thousand as at 31 December 2011. No impairment of non-current assets classified as held for sale was recognised as at 31 December 2010.
14. Share capital
As at 31 December 2011 the Parent company’s authorised share capital comprised 708 821 122 ordinary registered shares with a par value of LTL 1 per share. All issued shares are fully paid.
There were no changes in the share capital during 2011 and 2010. All shares rank equally with regard to the Group’s residual assets. The holders of ordinary shares are entitled to receive dividends as declared from time to time, and are entitled to one vote per share at meetings of the Parent company.

ANNUAL REPORT of Public comPany orlen lietuva for the year 2011 58
The sole shareholder of the Parent company is PKN ORLEN S.A., controlling 100 % shares. In 2011 and 2010 the Parent company did not pay any dividends to the shareholders.
15. Earnings per share
Basic
Basic earnings per share are calculated by dividing the profit attributable to shareholders of the Parent company by the weighted average number of ordinary shares issued during the year.
as at31/12/2011
as at31/12/2011
as at31/12/2010
as at31/12/2010
USD LTL USD LTLProfit (loss) attributable to shareholders of the Parent Company
(5,584) (13,858) (31,419) (81,907)
Weighted average of the ordinary shares in issue (thousands)
708,821 708,821 708,821 708,821
Basic earning per share (0.01) (0.02) (0.04) (0.12)
Diluted
The Parent Company does not have potentially dilutive ordinary shares.
16. Loans and borrowings
as at 31/12/2011
as at 31/12/2011
as at 31/12/2010
as at 31/12/2010
USD LTL USD LTL Loans from Government and Ministry of Finance
- - 108,348 282,777
Loans from related parties 199,566 532,721 - - Loans from banks 150,042 400,522 56,250 146,807 Total long-term loans and borrowings 349,608 933,243 164,598 429,584 Overdraft 32,077 85,626 10,239 26,723 Factoring with recourse 15,637 41,742 614 1,603 Current part of loans from Government and Ministry of Finance
- - 72,420 189,008
Current part of long-term loans from related parties
259 690 - -
Current part of long-term loans from banks 257 686 38,116 99,479 Total short-term loans and borrowings 48,230 128,744 121,389 316,813 Total loans and borrowings 397,838 1,061,987 285,987 746,397

ANNUAL REPORT of Public comPany orlen lietuva for the year 2011 59
Currency Interest rate Maturity Principal amount
USD LTL
PKN ORLEN S.A. USD 6 month USD Libor+margin%
2014.06.06 200,000 199,825 533,411
AB SEB Bank USD 3 month USD Libor+margin%
2016.04.26 150,000 150,299 401,208
AB DnB NORD (overdraft)
USD 3 month USD Libor+margin%
2012.11.25 50,000 27,976 74,679
AB SEB Bank (overdraft) USD o/n USD Libor+margin%
2012.05.30 30,000 4,059 10,835
AB Swedbank (overdraft)
LT 6 month Vilibor+margin%
2011.12.31 56 42 112
Danske Bank A/S Eesti Filiaal
EUR Eonia+margin% 2012.09.26 25,869 704 1,879
Swedbank Liising AS EUR6 month
EURIBOR+margin% 2012.05.24 13,607 10,445 27,882
SEB Liising AS EUR1 month
EURIBOR+margin% 2012.06.15 10,348 3,876 10,347
SEB Liising AS USD6 month USD
Libor+margin% 2012.06.15 7,761 612 1,634
397,838 1,061,987
Balance at 31/12/2011
Currency Interest rate Maturity Principal amount
USD LTL
Govermment of Lithuania USD7%
2013.07.12 288,928 180,580 471,295
Ministry of Finance of Lithuania
EUR4.95%
2011.04.15 2,310 188 490
AB SEB Bank/ AS UniCredit Bank
USD 3 month USD Libor+margin%
2013.07.11 150,000 93,824 244,871
NORDEA Bank EUR 3 month EURIBOR+margin%
2011.12.31 2,204 542 1,415
AB SEB Bank (overdraft) USD O/N USD Libor+margin%
2011.05.31 120,000 10,196 26,611
AB Swedbank (overdraft)
LT 6 month Vilibor+margin%
2011.12.30 57 43 112
Swedbank Liising AS EUR1 month
EURIBOR+margin% 2011.05.24 9,808 614 1,603
285,987 746,397
Balance at 31/12/2010
As at 31 December 2011 and 31 December 2010 bank loans of USD 0.1 thousand or LTL 0.3 thousand and USD 542 thousand or LTL 1,413 thousand, respectively, were pledged on the Group’s assets and cash.
On 30 June 2011 Parent company repaid USD 180,580 thousand or LTL 448,145 thousand loan and fulfilled all of its obligations before maturity date under USD 288,928 thousand or LTL 717,033 thousand loan, signed between the Parent company and the Government of the Republic of Lithuania on 29 October 1999 as amended and restated on 18 June 2002 and 8 July 2003.
On 31 August 2011 the Parent company fulfilled all of its obligations before maturity date under USD 150,000 thousand or LTL 372,255 thousand Loan Agreement signed between the Parent company and AB SEB bank and AS UniCredit Bank

ANNUAL REPORT of Public comPany orlen lietuva for the year 2011 60
Lithuanian branch on 8 July 2003 guaranteed by the Republic of Lithuania. Hereby all the commitments of the Parent company towards the Government of the Republic of Lithuania under the above mentioned agreements have expired.
Parent company refinanced its loans with new loans received from PKN ORLEN S.A. for the amount of USD 200,000 thousand or LTL 496,340 thousand for 3 years and loan from AB SEB bank for the amount of USD 150,000 thousand or LTL 372,255 thousand thousand for 5 years. The loan received from AB SEB bank secured with a guarantee from PKN ORLEN S.A. of USD 175,000 thousand or LTL 434,298 thousand .
Maturity terms of long-term liabilities:
as at 31/12/2011
as at 31/12/2011
as at 31/12/2010
as at 31/12/2010
USD LTL USD LTLBetween 1 - 2 years - - 109,732 286,390 Between 2 - 5 years 349,608 933,243 54,866 143,195
349,608 933,243 164,598 429,584
Effective interest rates as at the date of statement of financial position:
as at 31/12/2011
as at 31/12/2011
as at 31/12/2010
as at 31/12/2010
USD Other USD OtherBank account credit 1.7% 5.3% 2.1% 5.3%Bank loans 1.9% - 0.9% 3.3%Factoring with recourse 1.6% 1.7% - 2.8%Loans from other institutions - - 7.0% 5.0%Loans from related parties 3.8% - - -
Carrying amounts of the Group‘s borrowings denominated in the following currencies:
as at 31/12/2011
as at 31/12/2011
as at 31/12/2010
as at 31/12/2010
USD LTL USD LTLUS dollars 382,771 1,021,767 284,522 742,574 Other currencies 15,067 40,220 1,465 3,823
397,838 1,061,987 285,987 746,397
The Group has the following undrawn borrowing facilities bearing floating interest rates:
as at 31/12/2011
as at 31/12/2011
as at 31/12/2010
as at 31/12/2010
USD LTL USD LTLExpiry term within one year 98,992 264,249 268,299 700,234
The loans and borrowings outstanding as of 31 December 2011 and 31 December 2010 were subject to a number of covenants, such as exclusive use of loans and restricted management ability to pledge, mortgage or sell the assets, the acquisition of which was financed by loans and borrowings or which value exceeds amounts specified in the loan and borrowing agreements, restricted entering into lease agreements or assuming any obligations on behalf of third parties pursuant to guarantees, asset pledge or any other agreements if the Group commitments exceed the amounts specified in loan and borrowing agreements, restricted investments into other entities if the Group’s commitments exceed the amounts specified in the loan and borrowing agreements, prohibited granting of loans and borrowings to the third parties if the loan and borrowing amount exceeds the amount specified in the loan and borrowing agreements, throughout the duration of the loan and borrowing agreements without the lenders’ approval. The management believes that the Group has complied with these covenants.

ANNUAL REPORT of Public comPany orlen lietuva for the year 2011 61
17. Long-term employee benefits
The Group realizes the program of paying out the jubilee bonuses and post-employment benefits, which includes retirement and pension benefits in line with remuneration systems in force as well as other post-employment benefits. Provisions for jubilee bonuses and post-employment benefits are calculated individually for each entitled individual. The base for the calculation of provision for an employee is expected benefit which the Group is obliged to pay in accordance with internal regulation. The jubilee bonuses are paid to employees after elapse of a defined number of years in service. The retirement (pension) benefits are paid once at retirement (pension). The amount of retirement and pension benefits as well as jubilee bonuses depends on the number of years of service and an employee’s remuneration. The present value of these obligations is estimated at the end of each reporting year by an independent actuary and adjusted if there are any material indications impacting the value of the obligations. The provision amount equals discounted future payments, considering employee rotation and relate to the period ended at the last day of the reporting year.
USD LTL USD LTL10,119 27,012 12,169 31,760 (2,522) (6,732) (4,810) (12,553) 7,597 20,280 7,359 19,207 Defined benefit liability
as at 31/12/2010
Past Service costs not yet recognised
as at 31/12/2011
Present value of defined benefit obligation
Change in present value of defined benefits obligations in 2011
Total Total
USD LTL USD LTL USD LTL1 January 2011 3,177 8,292 8,992 23,468 12,169 31,760 Current service cost 152 377 426 1,057 578 1,434 Interest expense 159 395 454 1,127 613 1,522 Actuarial gains/losses 33 82 (627) (1,556) (594) (1,474)Benefits paid (460) (1,142) (70) (174) (530) (1,316)Past service cost - - (1,836) (4,556) (1,836) (4,556)Other (5) (12) - - (5) (12)Exchange differences (68) (19) (208) (327) (276) (346) 31 December 2011 2,988 7,973 7,131 19,039 10,119 27,012
Jubilee bonuses provisions Post-employment benefits
Change in present value of defined benefits obligations in 2010
Total Total
USD LTL USD LTL USD LTL1 January 2010 3,579 8,608 9,305 22,380 12,884 30,988 Current service cost 169 441 394 1,027 563 1,468 Interest expense 184 480 474 1,236 658 1,716 Actuarial gains/losses (17) (44) (221) (576) (238) (620)Benefits paid (461) (1,202) (232) (605) (693) (1,807)Exchange differences (277) 9 (728) 6 (1,005) 15 31 December 2010 3,177 8,292 8,992 23,468 12,169 31,760
Jubilee bonuses provisions Post-employment benefits

ANNUAL REPORT of Public comPany orlen lietuva for the year 2011 62
as at
USD LTL31/12/2011 10,119 27,012 31/12/2010 12,169 31,760 31/12/2009 12,884 30,988 31/12/2008 18,254 44,736 31/12/2007 22,480 52,990
Present value of the above mentioned employee benefits obligation
Total expense recognised in profit or loss
for the year ended
31/12/2011
for the year ended
31/12/2011
for the year ended
31/12/2010
for the year ended
31/12/2010USD LTL USD LTL
Current service cost 578 1,434 563 1,468 Interest expense 613 1,522 658 1,716 Actuarial gains/losses (594) (1,474) (238) (620)Benefits paid (530) (1,316) (693) (1,807)Past service cost (1,836) (4,556) - - Other (5) (12) - - Exchange differences (276) (346) (1,005) 15
(2,050) (4,748) (715) 772
Costs of employee benefits are recognised in general and administrative expenses.
For updating the provision for employment benefits as at 31 December 2011, the Group adopted the following actuarial assumptions: discount rate – 5.5 %;expected inflation rate – 2 %;remuneration increase rates: starting from 0 % in 2012; up to 3 % in 2014; 4 % in 2015; 5 % in 2016 and later.
Based on the existing regulations the Group is obliged to make contributions to the national retirement and pension plans. These expenses are recognised as employee benefits costs. There are no other obligations as far as employee benefits are concerned.
18. Provisions
USDas at
31/12/2011as at
31/12/2010as at
31/12/2011as at
31/12/2010as at
31/12/2011as at
31/12/2010Environmental provision 2,933 3,000 1,556 2,686 4,489 5,686 Business risk provision 3,054 - 8,309 20,423 11,363 20,423 Restructuring provision - - 6,324 878 6,324 878 Provision for CO2 emission - - 31,704 32,666 31,704 32,666
5,987 3,000 47,893 56,653 53,880 59,653
long-term short-term Total

ANNUAL REPORT of Public comPany orlen lietuva for the year 2011 63
LTLas at
31/12/2011as at
31/12/2010as at
31/12/2011as at
31/12/2010as at
31/12/2011as at
31/12/2010Environmental provision 7,829 7,829 4,154 7,011 11,983 14,840 Business risk provision 8,153 - 22,180 53,302 30,333 53,302 Restructuring provision - 16,881 2,291 16,881 2,291 Provision for CO2 emission - 84,631 85,256 84,631 85,256
15,982 7,829 127,846 147,860 143,828 155,689
long-term short-term Total
Change in provisions in 2011
USDEnvironmental
provisionBusiness risk
provisionRestructuring
provisionProvision for
CO2 emission Total
1 January 2011 5,686 20,423 878 32,666 59,653 Recognition 324 788 5,921 35,437 42,470 Usage (1,482) (6,055) (445) (39,309) (47,291)Discounting - (915) - - (915)Reversal - (2,544) - - (2,544)Foreign exchange differences (39) (334) (30) 2,910 2,507 31 December 2011 4,489 11,363 6,324 31,704 53,880
LTLEnvironmental
provisionBusiness risk
provisionRestructuring
provisionProvision for
CO2 emission Total
1 January 2011 14,840 53,302 2,291 85,256 155,689 Recognition 803 1,957 14,694 87,943 105,397 Usage (3,678) (15,027) (1,104) (97,554) (117,363)Discounting - (2,271) - - (2,271)Reversal - (6,313) - - (6,313)Foreign exchange differences 18 (1,315) 1,000 8,986 8,689 31 December 2011 11,983 30,333 16,881 84,631 143,828
Change in provisions in 2010
USDEnvironmental
provisionBusiness risk
provisionRestructuring
provisionProvision for
CO2 emission Total
1 January 2010 6,895 6,241 1,808 34,131 49,075 Recognition 166 14,182 728 35,014 50,090 Usage (822) - (1,549) (36,479) (38,850)Foreign exchange differences (553) - (109) - (662) 31 December 2010 5,686 20,423 878 32,666 59,653
LTLEnvironmental
provisionBusiness risk
provisionRestructuring
provisionProvision for
CO2 emission Total
1 January 2010 16,584 15,011 4,349 82,092 118,036 Recognition 433 36,968 1,898 91,271 130,570 Usage (2,143) - (4,038) (95,090) (101,271)Foreign exchange differences (34) 1,323 82 6,983 8,354 31 December 2010 14,840 53,302 2,291 85,256 155,689
--
ANNUAL REPORT of Public comPany orlen lietuva for the year 2011 64
18.1. Environmental provision
The Parent company has legal obligation to clean contaminated land-water environment in the area of production plant in Mazeikiai.
The operation of the refinery causes pollution. A provision was recognized for the costs to be incurred for handling of waste which was accumulated before the end of 2007. According to the waste treatment plan agreed with the Ministry of Environment of the Republic of Lithuania, the Parent company is required to clean up all contamination that it causes before 2013. The amount of the provisions is the best estimate of the Management Board based on evaluation of the remaining quantities and average level of costs necessary to remove contamination. The potential future changes in regulation and common practice regarding environmental protection may influence the value of this provision in the future periods.
18.2. Business risk provision
In 2007 IMTC/Maintenance Enterprises Inc. (MEI) started arbitration process against the Parent Company in the London Court of International Arbitration (LCIA) with the purpose to receive part of remuneration (bonus) for the services provided by MEI under the services agreement. A provision of USD 5,127 thousand or LTL 12,331 thousand was established in the consolidated financial statements as at 31 December 2009. Arbitrage hearing was finalized in 1st quarter of 2011. In accordance with the award received and provisions of the Settlement Agreement among the parties, the Parent company paid USD 2,600 thousand or LTL 6,452 thousand of remuneration and USD 500 thousand or LTL 1,241 thousand of interest and reversed provision created before.
In 2007 the Parent company and Haldor Topsoe (HT) signed an agreement related to a long-term construction project. The Parent company made a EUR 8,317 thousand or USD 11,837 thousand or LTL 28,719 thousand prepayment to HT. They provided services and sold licenses for EUR 3,325 thousand or USD 4,732 thousand or LTL 11,481 thousand to the Parent Company. However, later the agreement was suspended. In 2009 HT initiated an arbitration process against the Parent Company. In 2009 the management recognized allowance for impairment of 100% of the prepayment and in addition a provision of USD 1,114 thousand or LTL 2,679 thousand was made to cover claimed compensation of losses incurred by HT. In 2010 management reviewed created provision and amount was increased by USD 7,485 thousand or LTL 19,764 thousand. The arbitration proceedings were brought in principle in January 2011. In June 2011 the Settlement Agreement was signed between the parties based on which the Parent Company paid a settlement payment of EUR 1,000 thousand or USD 1,421 thousand or LTL 3,453 thousand and issued an irrevocable letter of credit in favor of HT for the amount of EUR 8,800 thousand or USD 12,244 thousand or LTL 30,385 thousand. The final settlement in favor of HT will equal to 50% of the amount of the letter of credit less the amount paid for the goods and services acquired from HT by the PKN ORLEN S.A. Group companies during the period of 5 years (validity of the letter of credit). As at 31 December 2011 the management updated provision to reflect their best estimate of the final settlement and booked remaining amount of provision USD 4,453 thousand or LTL 11,887 thousand.
The Parent Company applied to the State Court of Arbitration of Nyzhnij Novgorod (Russia) regarding recovery of the prepayments made by the Parent Company of EUR 461 thousand or USD 715 thousand or LTL 1,592 thousand to ZAO Nauchno-Proizvodstvennoje Objedinienije Chimmasheksport because of its failure to perform the contractual obligations under the transportation agreement. The defendant made the counterclaim in the same case regarding failure to perform the assumed contractual obligations by the Parent Company and recovery of the related losses in the amount of EUR 785 thousand or USD 1,218 thousand or LTL 2,710 thousand. The State Court of Arbitration in first instance ruled out payment of EUR 247 thousand or USD 344 thousand or LTL 853 thousand for the benefit of Public Company ORLEN Lietuva, and after both parties appealed the first instance decision in the Court of the Second Instance, the First Court of Arbitration Appeals on 15 December 2011 made a decision to leave the resolution adopted by the Court of First Instance in effect. The Parent Company applied to the Court of Arbritration of Nyzhnij Novgorod (Russia) where a bankruptcy case was filed against ZAO NPO Chimmasheksport by third entity, and submitted its creditor’s claim for EUR 436 thousand or USD 1,164 thousand or LTL 1,505 thousand. The Parent Company was added to the list of creditors for the said amount. Provision of USD 596 thousand or LTL 1,592 thousand has been established in the consolidated financial statements as at 31 December 2011.

ANNUAL REPORT of Public comPany orlen lietuva for the year 2011 65
In March 2009 an accident occurred resulting in environmental damage (a pipe that was allegedly illegally connected to Parent company’s pipeline was damaged and spillage of oil products occurred). In January 2011 the Environmental Department of Panevėžys Region applied to the court regarding recovery of LTL 9,702 thousand or USD 3,717 thousand. A provision of 50% of the claim value in the amount of LTL 4,851 thousand or USD 1,859 thousand was established in the consolidated financial statements as at 31 December 2010. In October 2011 the Court of Panevėžys District ruled that the Parent company must pay LTL 6,791 thousand or USD 2,605 thousand. Amount provided as at 31 December 2011 equals the latest amount ruled by the Court as it is the best management estimate. Appeal has been provided by the Parent Company. The next Court hearing has not been set yet.
The Parent Company was convicted in abuse of dominant position under the provisions of Article 9 of Law on Competition and Article 82 of EC Treaty during the period from the year 2002 to 2004 and was imposed with a fine in the amount of LTL 32 million by the decision of the Competition Council from the year 2005. After the Parent Company’s complaints to the respective administrative courts the aforementioned decision was dismissed with an option of additional investigation in the Competition Council. In 2010 the Parent company has received a revised ruling of Competition Council by which the Parent Company was convicted in abuse of dominant position under the provisions of Article 9 of Law on Competition and Article 102 of Treaty on the Functioning of the European Union (formerly Article 82 of EC Treaty) and imposed with a fine in the amount of LTL 8,231 thousand or USD 3,154 thousand. After the Parent Company’s complaint to the court by the decision of the first instance court issued in April 2011 the Parent Company was obliged to pay the full amount of the fine. Amount provided as at 31 December 2011 equals the latest amount ruled by the Court as it is the best management estimate. Appeal has been provided by the Parent Company. The next Court hearing has not yet been set.
18.3. Restructuring provision
The reorganization plan provides for the reduction of the number of employees. In the opinion of the Group’s management, the reorganization will not have significant influence on the Group’s activity and financial statements.
Employee restructuring provision were launched to support the restructuring process conducted in the Group. The programs provide additional money considerations and trainings for employees with whom the employment agreement was or would be dissolved by mutual consent due to reasons independent from employees by virtue of the restructuring process.
In 2011 restructuring provision has changed due to assumptions update: average benefit cost and different number of employees entitled to restructuring program.
18.4. CO2 emission provision
The Parent Company recognises provision for estimated CO2 emissions in the reporting period. The cost of recognised provision in the consolidated profit or loss is compensated with settlement of deferred income on CO2 emission rights granted free of charge.

ANNUAL REPORT of Public comPany orlen lietuva for the year 2011 66
19. Trade and other liabilities
as at31/12/2011
as at31/12/2011
as at31/12/2010
as at31/12/2010
USD LTL USD LTLTrade liabilities 560,349 1,495,796 637,564 1,663,979 Investment liabilities 8,517 22,735 3,028 7,903 Total trade liabilities 568,866 1,518,531 640,592 1,671,882 Received prepayments 2,120 5,659 9,603 25,063 Payroll liabilities 2,517 6,719 2,695 7,033 Excise tax and fuel charge 16,737 44,678 14,955 39,031 Value added tax 41,250 110,113 34,632 90,386 Other taxation, duties, social security and other benefits
7,093 18,934 6,832 17,831
Other liabilities 22 59 429 1,120 Total other liabilities 69,739 186,161 69,146 180,463 Holiday pay accrual 4,546 12,135 4,778 12,470 Costs of not invoiced services 9,702 25,900 8,820 23,019 Other accruals 1,048 2,797 1,348 3,519 Total accruals 15,296 40,831 14,946 39,009
653,901 1,745,523 724,684 1,891,354
Trade and other liabilities denominated in foreign currencies amounted to USD 517,534 thousand or LTL 1,381,505 thousand as at 31 December 2011 and USD 601,462 thousand or LTL 1,569,756 thousand as at 31 December 2010.
20. Other financial liabilities
as at31/12/2011
as at31/12/2011
as at31/12/2010
as at31/12/2010
USD LTL USD LTLDerivatives 5,143 13,731 121 315
foreign currency forward 5,143 13,731 121 315 Liabilities from Cash Pool 160 426 15,350 40,061
5,303 14,157 15,471 40,376

ANNUAL REPORT of Public comPany orlen lietuva for the year 2011 67
21. Sales revenue
for the year ended
31/12/2011
for the year ended
31/12/2011
for the year ended
31/12/2010
for the year ended
31/12/2010USD LTL USD LTL
Sales of finished goods 8,127,670 20,170,439 5,751,167 14,991,567 Sales of services 31,140 77,280 24,899 64,904 Revenue from sales of finished goods and services, net
8,158,810 20,247,719 5,776,066 15,056,471
Sales of merchandise 9,181 22,784 8,467 22,071 Sales of spare parts 1,610 3,996 1,189 3,099 Revenue from sales merchandise and spare parts, net 10,791 26,780 9,656 25,170
8,169,601 20,274,499 5,785,722 15,081,641
22. Operating expenses
Costs of sales
for the year ended
31/12/2011
for the year ended
31/12/2011
for the year ended
31/12/2010
for the year ended
31/12/2010 USD LTL USD LTL
Cost of finished goods and services sold 7,806,573 19,373,573 5,522,609 14,395,786 Cost of goods for relase and merchandise sold 120,467 298,963 9,108 23,742
7,927,040 19,672,536 5,531,717 14,419,528

ANNUAL REPORT of Public comPany orlen lietuva for the year 2011 68
Cost by kind
for the year ended
31/12/2011
for the year ended
31/12/2011
for the year ended
31/12/2010
for the year ended
31/12/2010 USD LTL USD LTL
Usage of materials and energy, including: 7,780,592 19,309,095 5,408,503 14,098,348 usage of materials 7,718,358 19,154,649 5,355,477 13,960,125 usage of energy 62,234 154,446 53,026 138,223 External services, including: 208,260 516,836 187,515 488,795 railway services 114,071 283,089 95,003 247,644 repairs and maintenance services 26,521 65,816 24,867 64,821 terminal services,transit and freight 43,601 108,205 44,301 115,479 advisory services 5,425 13,462 7,008 18,268 lease 5,594 13,882 5,891 15,356 security of property 3,410 8,463 2,997 7,812 others services 9,638 23,919 7,448 19,415 Payroll, social security and other employee benefits
75,112 186,405 79,725 207,819
Depreciation and amortisation (Note 5,6) 79,510 197,319 92,538 241,218 Taxes and charges 8,494 21,080 7,147 18,630 Write-down of spare parts for obsolescence 8,284 20,558 4,001 10,429 Other costs, including: 14,686 36,451 13,858 36,124 insurance 9,013 22,368 8,809 22,962 other costs 5,673 14,083 5,049 13,162
8,174,938 20,287,744 5,793,287 15,101,363 Change in inventories (5,181) (12,858) (30,930) (80,625)Cost of products and services for own use (6,703) (16,635) (5,058) (13,185) Total operating expenses 8,163,054 20,258,251 5,757,299 15,007,553 Distribution expenses 165,763 411,373 152,185 396,701 General and administrative expenses 70,251 174,342 73,397 191,324 Costs of sales 7,927,040 19,672,536 5,531,717 14,419,528 Total operating expenses 8,163,054 20,258,251 5,757,299 15,007,553

ANNUAL REPORT of Public comPany orlen lietuva for the year 2011 69
Employee benefits costs
for the year ended
31/12/2011
for the year ended
31/12/2011
for the year ended
31/12/2010
for the year ended
31/12/2010 USD LTL USD LTL
Payroll expenses 55,650 138,107 59,172 154,244 Social security expenses 17,215 42,721 18,321 47,757 Future benefits expenses 412 1,022 728 1,898 Other employee benefits expenses 1,835 4,555 1,504 3,920
75,112 186,405 79,725 207,819
23. Other operating revenue and expenses
23.1. Other operating revenue
for the year ended
31/12/2011
for the year ended
31/12/2011
for the year ended
31/12/2010
for the year ended
31/12/2010
USD LTL USD LTLProfit on sales of non-current non-financial assets - - 200 523 Settlement surplus of CO2 grants 8,560 21,243 8,421 21,950 Update provisions related to the sale of CO2 rights 6,315 15,673 - - Profit from emission allwances sales - - 3,124 8,143 Releases of provisions 4,954 12,294 847 2,208 Written-off of receivables impairment allowances 7,221 17,920 418 1,090 Decreases of impairment allowances of property, plant and equipment and intangible assets
5,326 13,218 4,117 10,732
Penalties and compensations earned 1,833 4,549 1,284 3,347 Income from insurance 35,741 88,698 303 790 Other 1,793 4,450 5,593 14,577
71,743 178,045 24,307 63,360 In October 2011 the Parent Company received USD 35,000 thousand or LTL 86,860 thousand as insurance compensation for the losses incurred during the fire in the Refinery on 12 October 2006.

ANNUAL REPORT of Public comPany orlen lietuva for the year 2011 70
23.2. Other operating expenses
for the year ended
31/12/2011
for the year ended
31/12/2011
for the year ended
31/12/2010
for the year ended
31/12/2010
USD LTL USD LTLLoss from disposal of non-financial fixed assets 4,535 11,256 - - Recognition of provisions 6,588 16,349 15,076 39,299 Update provisions related to the sale of CO2 rights 2,665 6,614 2,348 6,119 Write down of overdue accounts recievable 7,179 17,816 29 76 Recognition of impairment receivables (Note 10) 1,717 4,261 1 3 Recognition of impairment allowances of property, plant and equipment and intangible assets 24,666 61,214 23,214 60,513
Penalties and compensations 2,839 7,046 178 463 Other 2,887 7,161 619 1,613
53,076 131,717 41,465 108,086
24. Financial revenue and expenses
24.1. Financial revenue
for the year ended
31/12/2011
for the year ended
31/12/2011
for the year ended
31/12/2010
for the year ended
31/12/2010
USD LTL USD LTLInterest 535 1,328 1,171 3,053 Settlement and valuation of financial instruments 2,726 6,765 - - Grain on liquidation of subsidiary 1,281 3,178 18 47 Other 918 2,277 2 4
5,460 13,548 1,191 3,104
24.2. Financial expenses
for the year ended
31/12/2011
for the year ended
31/12/2011
for the year ended
31/12/2010
for the year ended
31/12/2010
USD LTL USD LTLInterest 14,420 35,788 22,467 58,564 Foreign exchange loss 10,989 27,271 5,146 13,415 Settlement and valuation of financial instruments 7,331 18,193 - - Other 1,107 2,747 2,193 5,718
33,847 83,999 29,806 77,697
The Group capitalizes as a part of purchase price or construction costs those borrowing costs which could be assigned to the acquisition, construction or production of a qualifying asset. In 2011 and 2010 capitalized borrowing costs amounted to USD 643 thousand or LTL 1,595 thousand and USD 477 thousand or LTL 1,243 thousand, respectively. Capitalization rate used to calculate capitalised borrowing costs in 2011 and 2010 amounted to 0.28% p.a. and to 0.36% p.a., respectively.

ANNUAL REPORT of Public comPany orlen lietuva for the year 2011 71
25. Income tax expense
for the year ended
31/12/2011
for the year ended
31/12/2011
for the year ended
31/12/2010
for the year ended
31/12/2010
USD LTL USD LTL Current income tax (1,042) (2,586) (493) (1,286)Income tax of the previous year - - 25 66 Deferred income tax (1,529) (3,795) (13,750) (35,843)
(2,571) (6,381) (14,218) (37,063)
25.1. The differences between income tax expense recognised in profit or loss and the amount calculated based on profit before tax
for the year ended
31/12/2011
for the year ended
31/12/2011
for the year ended
31/12/2010
for the year ended
31/12/2010USD LTL USD LTL
Profit (loss) for the period before tax (3,013) (7,477) (17,201) (44,844)
Profit tax applying 15 % tax rate (452) (1,122) 2,581 6,728 Effect of different tax rates in other countries 347 861 33 86 Effect of changes in tax rates - - 9 23 Non-taxable exchange gains 3,904 9,689 5,603 14,605 Non-taxable income 8,593 21,325 2,541 6,624 Expenses not deductible for tax purposes (15,460) (38,368) (26,092) (68,015)Tax losses for which no deferred income tax assets was recognised
192 477 (46) (120)
Income tax on dividends paid (237) (588) (228) (594)Incentive on investment in non-current assets 542 1,345 1,013 2,641 Income tax of previous periods recognised in the current year
- - 25 65
Tax loss utilization - - 343 894 Income tax (2,571) (6,381) (14,218) (37,063)

ANNUAL REPORT of Public comPany orlen lietuva for the year 2011 72
25.2. Deferred tax
for the year ended
31/12/2011
for the year ended
31/12/2011
for the year ended
31/12/2010
for the year ended
31/12/2010 Deferred tax assets USD LTL USD LTL Assets allowances 8,567 22,866 4,481 11,696 Provisions and accruals 9,257 24,711 9,256 24,157 Unrealized foreign exchange losses 7,202 19,225 13,445 35,090 Difference between carrying amount and tax base of property, plant and equipment
(6) (16) 938 2,448
Tax loss 43,707 116,671 38,837 101,361 Investment relief 2,572 6,866 2,029 5,295 Other (7,222) (19,278) (3,375) (8,808)
64,077 171,045 65,611 171,239 Deferred tax liabilitiesOther 1 3 3 9
1 3 3 9
Deferred tax, net 64,076 171,042 65,608 171,230
25.3. Change in deferred tax assets and liability, net
for the year ended
31/12/2011
for the year ended
31/12/2011
for the year ended
31/12/2010
for the year ended
31/12/2010
Beginning of the period 65,608 171,230 79,387 190,941 Deferred tax recognised in profit or loss (1,529) (3,795) (13,750) (35,843)Foreign exchange differences (3) 3,607 (29) 16,132
64,076 171,042 65,608 171,230

ANNUAL REPORT of Public comPany orlen lietuva for the year 2011 73
26. Financial instruments
26.1. Financial instruments by category and class
Financial assets
as at 31 December 2011
USD
Financial assets at fair
value through
profit or loss
Loans and receivables
Financial assets held to maturity
Cash and cash
equivalents
Financial assets
excluded from the scope of
IAS 39
Total
Financial instruments by class NoteInvestments into equity-accounted investees
8 - - - - 1,756 1,756
Long-term deposits - - 1,612 - - 1,612 Long-term receivable - 1,229 - - - 1,229 Deposits 11 - - 4,446 - - 4,446 Trade receivables 10 - 228,253 - - - 228,253 Other receivables 10 - 24,748 - - - 24,748 Loans granted 11 - 838 - - - 838 Derivatives 11 1,255 - - - 1,255 Cash and cash equivalents 12 - - - 59,704 - 59,704
1,255 255,068 6,058 59,704 1,756 323,841
Financial instruments by category
LTL
Financial assets at fair
value through
profit or loss
Loans and receivables
Financial assets held to maturity
Cash and cash
equivalents
Financial assets
available for sale
Total
Financial instruments by class NoteInvestments into equity-accounted investees
8 - - - - 4,689 4,689
Long-term deposits - - 4,302 - - 4,302 Long-term receivable - 3,281 - - - 3,281 Deposits 11 - - 11,869 - - 11,869 Trade receivables 10 - 609,300 - - - 609,300 Other receivables 10 - 66,063 - - - 66,063 Loans granted 11 - 2,237 - - - 2,237 Derivatives 11 3,350 - - - - 3,350 Cash and cash equivalents 12 - - - 159,373 - 159,373
3,350 680,881 16,171 159,373 4,689 864,464
Financial instruments by category

ANNUAL REPORT of Public comPany orlen lietuva for the year 2011 74
as at 31 December 2010
USD
Financial assets at fair
value through
profit or loss
Loans and receivables
Financial assets held to maturity
Cash and cash
equivalents
Financial assets
available for sale
Total
Financial instruments by class NoteInvestments into equity-accounted investees
8 - - - - 1,646 1,646
Long-term receivable - 1,344 - - - 1,344 Deposits 11 - - 11,765 - - 11,765 Trade receivables 10 - 229,261 - - - 229,261 Other receivables 10 - 27,143 - - - 27,143 Loans granted 11 - 1,237 - - - 1,237 Cash and cash equivalents 12 - - 34,687 - 34,687
- 258,985 11,765 34,687 1,646 307,083
Financial instruments by category
LTL
Financial assets at fair
value through
profit or loss
Loans and receivables
Financial assets held to maturity
Cash and cash
equivalents
Financial assets
available for sale
Total
Financial instruments by class NoteInvestments into equity-accounted investees 8 - - - - 4,295 4,295
Long-term receivable - 3,507 - - - 3,507 Deposits 11 - - 30,704 - - 30,704 Trade receivables 10 - 598,349 - - - 598,349 Other receivables 10 - 70,841 - - - 70,841 Loans granted 11 - 3,230 - - - 3,230 Cash and cash equivalents 12 - - - 90,530 - 90,530
- 675,927 30,704 90,530 4,295 801,456
Financial instruments by category
Financial liabilities
as at 31 December 2011
USD
Financial liabilities at fair
value through profit or loss
Financial liabilities valued at amortized cost
Liabilities excluded from
the scope of IAS 39
Total
Financial instruments by class NoteLoans 16 - 182,376 - 182,376 Borrowings 16 - 199,825 - 199,825 Factoring with recourse 16 - 15,637 - 15,637 Trade liabilities 19 - 560,349 - 560,349 Investment liabilities 19 - 8,517 - 8,517 Employee benefits 17 - - 7,597 7,597 Other 19,20 5,143 17,973 - 23,116
5,143 984,677 7,597 997,417
Financial instruments by category

ANNUAL REPORT of Public comPany orlen lietuva for the year 2011 75
LTL
Financial liabilities at fair
value through profit or loss
Financial liabilities valued at amortized cost
Liabilities excluded from
the scope of IAS 39
Total
Financial instruments by class NoteLoans 16 - 486,834 - 486,834 Borrowings 16 - 533,411 - 533,411 Factoring with recourse 16 - 41,742 - 41,742 Trade liabilities 19 - 1,495,796 - 1,495,796 Investment liabilities 19 - 22,735 - 22,735 Employee benefits 17 - - 20,280 20,280 Other 19,20 13,731 47,977 - 61,708
13,731 2,628,495 20,280 2,662,506
Financial instruments by category
as at 31 December 2010
USD
Financial liabilities at fair
value through profit or loss
Financial liabilities valued at amortized cost
Liabilities excluded from
the scope of IAS 39
Total
Financial instruments by class NoteLoans 16 - 104,605 - 104,605 Borrowings 16 - 180,768 - 180,768 Factoring with recourse 16 - 614 - 614 Trade liabilities 19 - 637,564 - 637,564 Investment liabilities 19 - 3,028 - 3,028 Employee benefits 17 - - 7,359 7,359 Other 19,20 121 32,991 - 33,112
121 959,570 7,359 967,050
Financial instruments by category
LTL
Financial liabilities at fair
value through profit or loss
Financial liabilities valued at amortized cost
Liabilities excluded from
the scope of IAS 39
Total
Financial instruments by class NoteLoans 16 - 273,009 - 273,009 Borrowings 16 - 471,785 - 471,785 Factoring with recourse 16 - 1,603 - 1,603 Trade liabilities 19 - 1,663,979 - 1,663,979 Investment liabilities 19 - 7,903 - 7,903 Employee benefits 17 - - 19,207 19,207 Other 19,20 315 86,103 - 86,418
315 2,504,383 19,207 2,523,905
Financial instruments by category

ANNUAL REPORT of Public comPany orlen lietuva for the year 2011 76
26.2. Fair value of financial instruments
fair value carrying amount fair value carrying amountFinancial assetsUnquoted shares not applicable not applicable Investments into equity-accounted investees
1,756 1,756 1,646 1,646
Long - term deposits 1,612 1,612 - - Short - term deposits 4,446 4,446 11,765 11,765 Long-term receivables 1,229 1,229 1,344 1,344 Trade and other receivables 253,001 253,001 256,404 256,404 Loans granted 838 838 1,237 1,237 Derivatives 1,255 1,255 - - Cash and cash equivalents 59,704 59,704 34,687 34,687
323,841 323,841 307,083 307,083 Financial liabilitiesLoans 181,579 182,376 104,605 104,605 Borrowings 198,736 199,825 195,136 180,768 Factoring with recourse 15,471 15,637 614 614 Trade and other liabilities 586,679 586,679 658,233 658,233 Derivatives 5,143 5,143 121 121 Other 157 160 15,350 15,350
987,765 989,820 974,059 959,691
USD as at 31/12/2011 as at 31/12/2010
fair value carrying amount fair value carrying amountFinancial assetsUnquoted shares not applicable not applicable Investments into equity-accounted investees 4,689 4,689 4,295 4,295
Long - term deposits 4,302 4,302 - - Short - term deposits 11,869 11,869 30,704 30,704 Long-term receivables 3,281 3,281 3,507 3,507 Trade and other receivables 675,363 675,363 669,190 669,190 Loans granted 2,237 2,237 3,230 3,230 Derivatives 3,350 3,350 - - Cash and cash equivalents 159,373 159,373 90,530 90,530
864,464 864,464 801,456 801,456 Financial liabilitiesLoans 484,707 486,834 273,009 273,009 Borrowings 530,506 533,411 509,285 471,785 Factoring with recourse 41,298 41,742 1,603 1,603 Trade and other liabilities 1,566,082 1,566,082 1,717,924 1,717,924 Derivatives 13,731 13,731 315 315 Other 419 426 40,061 40,061
2,636,743 2,642,226 2,542,198 2,504,697
LTL as at 31/12/2011 as at 31/12/2010
Financial instruments for which fair value cannot be measured reliably
As at 31 December 2011 and 31 December 2010 the Group held unquoted shares in associated entity, fair value of which cannot be measured reliably. There are no active markets for these shares and no comparable transactions in the same type of instruments. Shares were recognised in the Group’s statement of financial position at equity method in total amount of USD 1,756 thousand or LTL 4,689 thousand as at 31 December 2011 and USD 1,646 thousand or LTL 4,295 thousand as at 31 December 2010. As at the end of the reporting period there are no binding decisions relating to ways and dates of disposal of these assets.

ANNUAL REPORT of Public comPany orlen lietuva for the year 2011 77
Methods applied in determining fair values of financial instruments recognised in the statement of financial posi-tion at fair value (fair value hierarchy)
The Group measures derivative instruments at fair value using valuation models for financial instruments based on generally available exchange rates, interest rates, forward and volatility curves, for currencies and commodities quoted on active markets. As compared to the previous reporting period the Group has not changed valuation methods concerning derivative instruments.
Derivative instruments are presented as assets, when their valuation is positive and as liabilities, when their valuation is negative. Gains and losses resulting from changes in fair value of derivative instruments are recognised in a current year profit or loss.
Fair value of derivatives is determined based on other input data, apart from market quotations, which are directly or indirectly possible to observe (so called Level 2).
Methods and assumptions applied in determining fair values of financial instruments recognised in the statement of financial position at amortized cost
Loans granted, loans liabilities and other financial instruments are measured at fair value using discounted cash flows method. Future cash flows are discounted using discount factors calculated based on market interest rates as at 31 December 2011 and 31 December 2010 respectively increased by margins proper for particular financial instruments.
The Group’s management is of the opinion that the carrying amounts less impairment losses of cash and cash equivalents, trade and other receivables, and the carrying amounts of accounts payable approximate their fair value due to the short-term nature of expected cash-flows.
27. Financial risk management
The Group is exposed particularly to the following financial risks:• credit risk;• liquidity risk;• market risks (including currency risk, interest rate risk, risk of changes in commodity prices, risk of changes in CO2 emission
rights prices).
Credit risk
Within its trading activity the Group sells products and services with deferred payment term, which may result in the risk that customers will not pay for the Group’s receivables from sales of products and services. In order to minimize credit risk the Group manages the risk by credit limit policies governing granting of credit limits to customers and establishment of pledges of appropriate types such as:• limit,• insurance,• securities.
The established payment term of receivables connected with the ordinary course of sales amounts to 13 days.
Each non-cash customer is individually assessed with regard to credit risk. Trade receivables are monitored by finance departments on a regular basis. In the event of occurrence of overdue receivables, sale is withheld and debt recovery procedures implemented as described by the obliging procedures.
The carrying amount of financial assets (as disclosed in Note 26.1) represents the maximum credit exposure at the reporting date.
The ageing analysis of financial assets past due, but not impaired as at the end of the reporting period:

ANNUAL REPORT of Public comPany orlen lietuva for the year 2011 78
USDas at
31/12/2011as at
31/12/2010as at
31/12/2011as at
31/12/2010Due 225,421 226,335 838 1,237Overdue:Up to 1 month 1,944 2,514 - - 1-3 months 814 286 - - 3-6 months 143 70 - - 6-12 months 97 126 - - Above 1 year 7,812 9,375 - - Impairment (7,978) (9,445) - -
228,253 229,261 838 1,237
Current receivables Loans granted
LTLas at
31/12/2011as at
31/12/2010as at
31/12/2011as at
31/12/2010Due 601,739 590,712 2,237 3,230Overdue:Up to 1 month 5,189 6,561 - - 1-3 months 2,173 746 - - 3-6 months 382 183 - - 6-12 months 259 329 - - Above 1 year 20,854 24,467 - - Impairment (21,296) (24,649) - -
609,300 598,349 2,237 3,230
Current receivables Loans granted
The concentration of risk connected with trade receivables is limited due to large number of customers with trade credit dispersed in various sectors of the Lithuania, Poland, Estonia, Latvia, Ukraine, United Kingdom, Switzerland economies.
Liquidity risk
The Group is exposed to liquidity risk associated with the relation between short term liabilities and current assets.
As at 31 December 2011 and as at 31 December 2010 current assets to short-term liabilities ratio (current ratio) amounted to 1.08 and 0.84, respectively.
Detailed information regarding loans is disclosed in the note 16.
As at 31 December 2011 and 31 December 2010 the maximum possible indebtedness due to signed loans agreements amounted to USD 496,830 thousand or 1,326,236 LTL thousand and USD 554,286 thousand or LTL 1,446,631 thousand, respectively. As at 31 December 2011 and 31 December 2010 there were available to use USD 98,992 thousand or LTL 264,249 thousand and USD 268,299 thousand or LTL 700,234 thousand, respectively.
Maturity analysis for financial liabilities:
USD up to 1 year 1-3 years 3-5 years Total Carrying amount
Loans - undiscounted value 35,569 24,458 134,212 194,239 182,376 Borrowings - undiscounted value 7,296 210,644 - 217,940 199,825 Factoring with recourse 15,757 - - 15,757 15,637 Trade and other liabilities 586,679 - - 586,679 586,679 Derivatives 5,143 - - 5,143 5,143 Other - 69 - 69 160
650,444 235,171 134,212 1,019,827 989,820
as at 31/12/2011
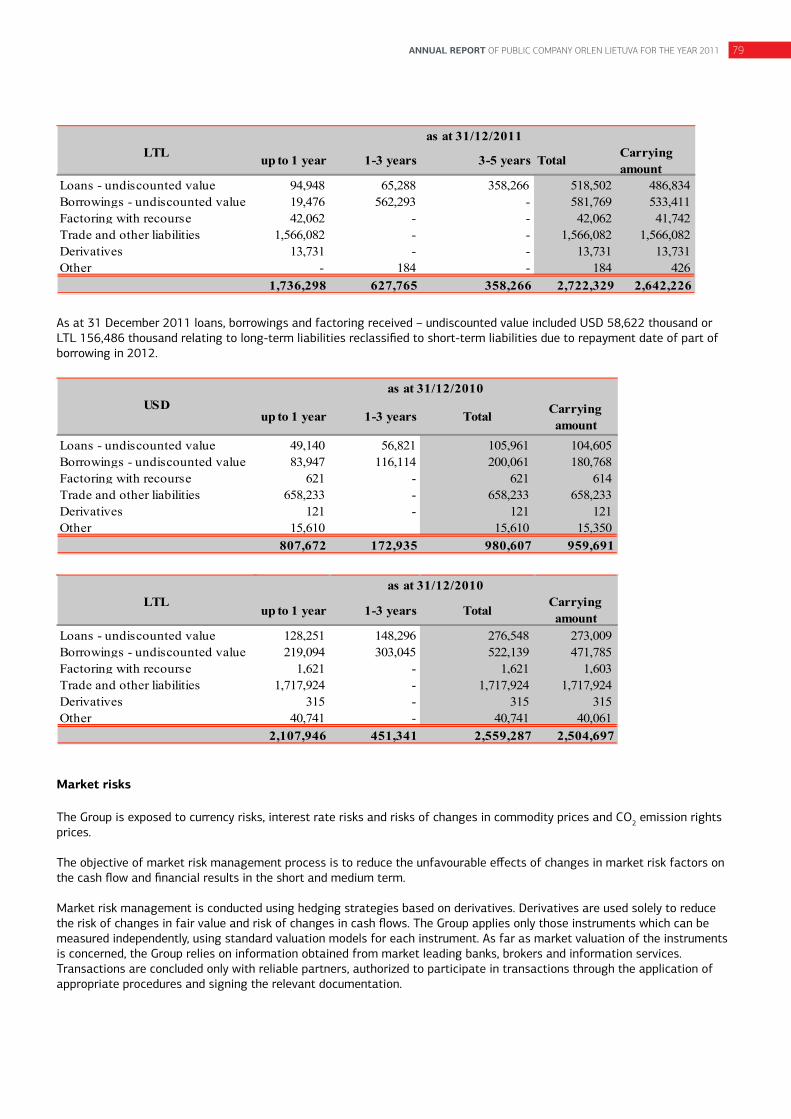
ANNUAL REPORT of Public comPany orlen lietuva for the year 2011 79
LTL up to 1 year 1-3 years 3-5 years Total Carrying amount
Loans - undiscounted value 94,948 65,288 358,266 518,502 486,834 Borrowings - undiscounted value 19,476 562,293 - 581,769 533,411 Factoring with recourse 42,062 - - 42,062 41,742 Trade and other liabilities 1,566,082 - - 1,566,082 1,566,082 Derivatives 13,731 - - 13,731 13,731 Other - 184 - 184 426
1,736,298 627,765 358,266 2,722,329 2,642,226
as at 31/12/2011
As at 31 December 2011 loans, borrowings and factoring received – undiscounted value included USD 58,622 thousand or LTL 156,486 thousand relating to long-term liabilities reclassified to short-term liabilities due to repayment date of part of borrowing in 2012.
USDup to 1 year 1-3 years Total Carrying
amountLoans - undiscounted value 49,140 56,821 105,961 104,605 Borrowings - undiscounted value 83,947 116,114 200,061 180,768 Factoring with recourse 621 - 621 614 Trade and other liabilities 658,233 - 658,233 658,233 Derivatives 121 - 121 121 Other 15,610 15,610 15,350
807,672 172,935 980,607 959,691
as at 31/12/2010
LTLup to 1 year 1-3 years Total
Carrying amount
Loans - undiscounted value 128,251 148,296 276,548 273,009 Borrowings - undiscounted value 219,094 303,045 522,139 471,785 Factoring with recourse 1,621 - 1,621 1,603 Trade and other liabilities 1,717,924 - 1,717,924 1,717,924 Derivatives 315 - 315 315 Other 40,741 - 40,741 40,061
2,107,946 451,341 2,559,287 2,504,697
as at 31/12/2010
Market risks
The Group is exposed to currency risks, interest rate risks and risks of changes in commodity prices and CO2 emission rights prices.
The objective of market risk management process is to reduce the unfavourable effects of changes in market risk factors on the cash flow and financial results in the short and medium term.
Market risk management is conducted using hedging strategies based on derivatives. Derivatives are used solely to reduce the risk of changes in fair value and risk of changes in cash flows. The Group applies only those instruments which can be measured independently, using standard valuation models for each instrument. As far as market valuation of the instruments is concerned, the Group relies on information obtained from market leading banks, brokers and information services. Transactions are concluded only with reliable partners, authorized to participate in transactions through the application of appropriate procedures and signing the relevant documentation.

ANNUAL REPORT of Public comPany orlen lietuva for the year 2011 80
Currency risk
The Group is exposed to currency risk resulting from current receivables and short-term liabilities, cash and cash equivalents, investment expenditures as well as from future planned cash flows from sales and purchases of refinery products. Currency risk exposure is hedged by USD/EUR forward instruments.
Currency structure of financial instruments as at 31 December 2011:
Financial instruments by class EUR USD LTL LVL PLN OtherTotal after conversion
to USD
Total after conversion
to LTLFinancial assetsInvestments into equity-accounted investees
- - 4,689 - - - 1,756 4,689
Long-term deposits 1,246 - - - - - 1,612 4,302 Long-term receivables - - 3,281 - - - 1,229 3,281 Deposits 1,418 - 6,971 - - - 4,446 11,869 Trade receivables 18,875 134,708 173,001 2,333 - - 228,253 609,300 Other receivables 68 230 64,821 80 - - 24,748 66,063 Loans granted 648 - - - - - 838 2,237 Derivatives 344 810 - - - - 1,255 3,350 Cash 4,156 33,738 46,050 1,808 - - 59,704 159,373
26,755 169,486 298,813 4,221 - - 323,841 864,464 Financial liabilitiesLoans - 182,334 112 - - - 182,376 486,834 Borrowings - 199,825 - - - - 199,825 533,411 Factoring with recourse 11,616 612 - - - - 15,637 41,742 Trade liabilities 4,298 509,968 118,540 - 864 270 560,349 1,495,796 Investment liabilities 4,812 1,026 3,382 - - - 8,517 22,735 Derivatives - - 13,732 - - - 5,143 13,731 Employee benefits 3 - 20,255 3 - - 7,597 20,280 Other 2,507 5,630 22,532 285 458 17,973 47,977
23,236 899,395 178,553 288 1,322 270 997,417 2,662,506
Sensitivity analysis for currency risk
Increase/decrease in exchange rate means appreciation/depreciation of the relevant currencies against the functional currency of the Group (USD). Litas (LTL) has been pegged to the Euro (EUR) at a fixed exchange rate of 3.4528 LTL / EUR and would only be expected to change as a result of government macroeconomic policy. The influence of potential changes in carrying amounts of financial instruments (as at 31 December 2011) arising from hypothetical changes in exchange rates of relevant currencies in relation to functional currency (USD) on profit before tax:
Financial instruments by classIncrease of
exchange rate Total influenceDecrease of
exchange rate Total influence
EUR/USD +15% 864 -15% (864)LTL/USD +15% 8,552 -15% (8,552)LVL/USD +15% 1,367 -15% (1,367)PLN/USD +15% (79) -15% 79
10,704 (10,704)
Influence of financial instruments on profit before tax
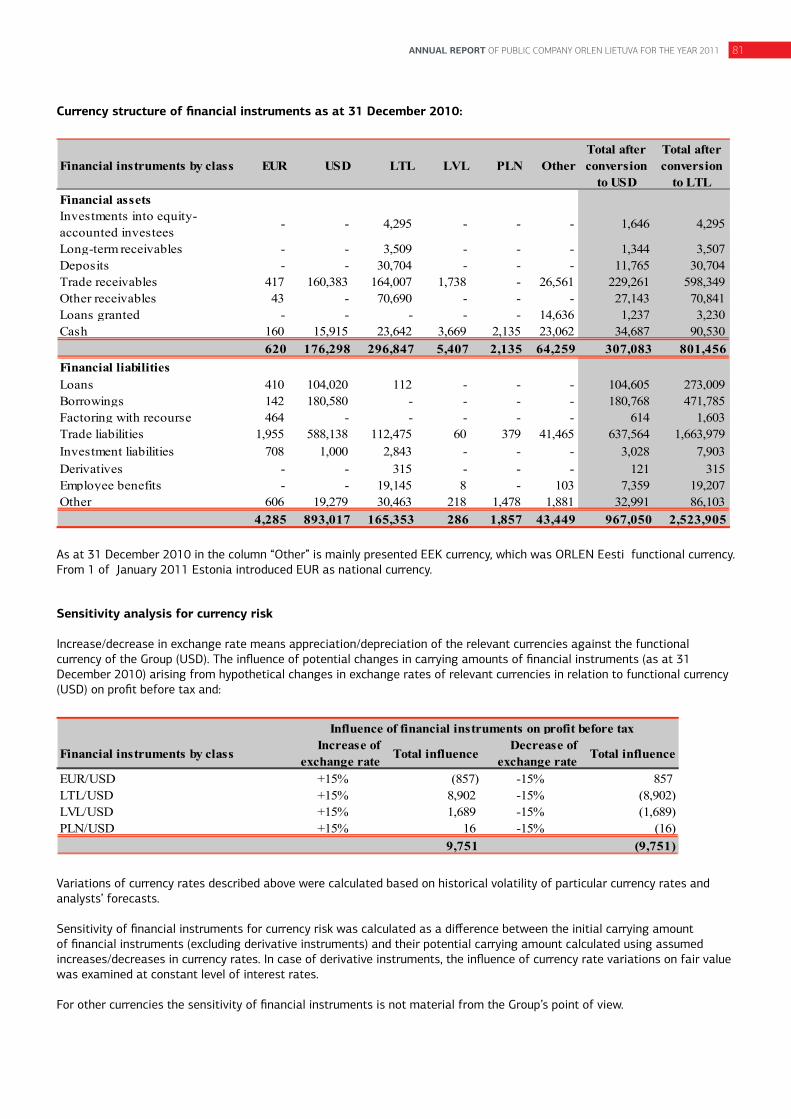
ANNUAL REPORT of Public comPany orlen lietuva for the year 2011 81
Currency structure of financial instruments as at 31 December 2010:
Financial instruments by class EUR USD LTL LVL PLN OtherTotal after conversion
to USD
Total after conversion
to LTLFinancial assetsInvestments into equity-accounted investees
- - 4,295 - - - 1,646 4,295
Long-term receivables - - 3,509 - - - 1,344 3,507 Deposits - - 30,704 - - - 11,765 30,704 Trade receivables 417 160,383 164,007 1,738 - 26,561 229,261 598,349 Other receivables 43 - 70,690 - - - 27,143 70,841 Loans granted - - - - - 14,636 1,237 3,230 Cash 160 15,915 23,642 3,669 2,135 23,062 34,687 90,530
620 176,298 296,847 5,407 2,135 64,259 307,083 801,456 Financial liabilitiesLoans 410 104,020 112 - - - 104,605 273,009 Borrowings 142 180,580 - - - - 180,768 471,785 Factoring with recourse 464 - - - - - 614 1,603 Trade liabilities 1,955 588,138 112,475 60 379 41,465 637,564 1,663,979 Investment liabilities 708 1,000 2,843 - - - 3,028 7,903 Derivatives - - 315 - - - 121 315 Employee benefits - - 19,145 8 - 103 7,359 19,207 Other 606 19,279 30,463 218 1,478 1,881 32,991 86,103
4,285 893,017 165,353 286 1,857 43,449 967,050 2,523,905
As at 31 December 2010 in the column “Other” is mainly presented EEK currency, which was ORLEN Eesti functional currency. From 1 of January 2011 Estonia introduced EUR as national currency.
Sensitivity analysis for currency risk
Increase/decrease in exchange rate means appreciation/depreciation of the relevant currencies against the functional currency of the Group (USD). The influence of potential changes in carrying amounts of financial instruments (as at 31 December 2010) arising from hypothetical changes in exchange rates of relevant currencies in relation to functional currency (USD) on profit before tax and:
Financial instruments by classIncrease of
exchange rate Total influenceDecrease of
exchange rate Total influence
EUR/USD +15% (857) -15% 857 LTL/USD +15% 8,902 -15% (8,902)LVL/USD +15% 1,689 -15% (1,689)PLN/USD +15% 16 -15% (16)
9,751 (9,751)
Influence of financial instruments on profit before tax
Variations of currency rates described above were calculated based on historical volatility of particular currency rates and analysts’ forecasts.
Sensitivity of financial instruments for currency risk was calculated as a difference between the initial carrying amount of financial instruments (excluding derivative instruments) and their potential carrying amount calculated using assumed increases/decreases in currency rates. In case of derivative instruments, the influence of currency rate variations on fair value was examined at constant level of interest rates.
For other currencies the sensitivity of financial instruments is not material from the Group’s point of view.

ANNUAL REPORT of Public comPany orlen lietuva for the year 2011 82
Interest rate risk
The Group is exposed to risk of volatility of cash flows due to interest rates resulting from borrowings, cash pool facility and bank loans based on floating interest rates.
Subject to interest rate risk:
USD EURIBOR LIBOR VILIBOR Other Fixed rate TotalFinancial instruments by classFinancial assetsLong-term deposits - - - - 1,612 1,612 Deposits - - - - 4,446 4,446 Loans granted - - - - 838 838
- - - - 6,896 6,896 Financial liabilitiesLoans - 182,334 42 - - 182,376 Borrowings - 199,825 - - - 199,825 Factoring with recourse 14,321 612 - 704 15,637 Cash Pool - 160 - - - 160
14,321 382,931 42 704 - 397,998
as at 31/12/2011
LTL EURIBOR LIBOR VILIBOR Other Fixed rate TotalFinancial instruments by classFinancial assetsLong-term deposits - - - - 4,302 4,302 Deposits - - - - 11,869 11,869 Loans granted - - - - 2,237 2,237
- - - - 18,408 18,408 Financial liabilitiesLoans - 486,722 112 - - 486,834 Borrowings - 533,411 - - - 533,411 Factoring with recourse 38,229 1,634 - 1,879 - 41,742 Cash Pool - 426 - - - 426
38,229 1,022,193 112 1,879 - 1,062,413
as at 31/12/2011
USD EURIBOR LIBOR VILIBOR Other Fixed rate TotalFinancial instruments by classFinancial assetsDeposits - - - - 11,765 11,765 Loans granted - - - - 1,237 1,237
- - - - 13,002 13,002 Financial liabilitiesLoans 542 104,020 43 - - 104,605 Borrowings - - - - 180,768 180,768 Factoring with recourse 614 - - - - 614 Cash Pool 15,350 - - - 15,350
1,156 119,370 43 - 180,768 301,337
as at 31/12/2010

ANNUAL REPORT of Public comPany orlen lietuva for the year 2011 83
LTL EURIBOR LIBOR VILIBOR Other Fixed rate TotalFinancial instruments by classFinancial assetsDeposits - - - - 30,704 30,704 Loans granted - - - - 3,230 3,230
- - - - 33,934 33,934 Financial liabilitiesLoans 1,415 271,482 112 - - 273,009 Borrowings - - - - 471,785 471,785 Factoring with recourse 1,603 - - - - 1,603 Cash Pool - 40,061 - - - 40,061
3,018 311,543 112 - 471,785 786,458
as at 31/12/2010
Sensitivity analysis for interest rate risk
The influence of financial instruments on profit before tax due to changes in significant interest rates:
Interest rate as at as at as at as at as at as at31/12/2011 31/12/2010 31/12/2011 31/12/2011 31/12/2010 31/12/2010
USD LTL USD LTLEURIBOR +50 +50 72 192 6 16 LIBOR +50 +50 1,943 5,187 596 1,556 Other +50 +50 3 8 - -
2,018 5,387 602 1,571
Assumed variation Influence on profit before tax
The above interest rates variations were calculated based on observations of interest rates fluctuations in the current and prior year annual reporting period as well as on the basis of available forecasts.
The Group does not take the potential decrease of LIBOR into consideration because of low level of LIBOR interest rates as at the end of 2011 and market forecast.
The sensitivity analysis was performed on the basis of instruments held as at 31 December 2011 and 31 December 2010. The influence of interest rates changes was presented on annual basis.
The sensitivity of financial instruments for interest rate risk was calculated as arithmetic product of the balance of the statements of financial position items sensitive to interest rates (excluding derivatives) multiplied by adequate variation of interest rate.
Capital management policy
The purpose of the Board policy – to keep the shareholders equity over borrowings at the level to maintain investors, creditors and market trust and have the possibilities of business development in the future. The board monitors rates of return and makes proposals on dividend payment to shareholders into consideration the Group’s financial results and strategic plans.
28. Capital commitments
Capital expenditure contracted for at the reporting date but not yet incurred is as follows:
USD LTL USD LTLProperty, plant and equipment 28,899 77,143 3,954 10,320
as at 31/12/2011 as at 31/12/2010

ANNUAL REPORT of Public comPany orlen lietuva for the year 2011 84
29. Contingencies
Payment request from a group of inventors
In November 2010 inventors group (seven individuals) made a claim in Šiauliai District Court for royalties and interest in the amount of LTL 38 million. It was received by the Parent Company in February 2011. A payment request from a group of individuals related to a production improvement process invented and patented by the group and subsequently implemented by the oil refinery covers the period of years 1996-2010. The management of the Parent Company assessed the claim as defective and unjustified.
Other litigations and claims
The Parent company is involved in other litigation where claims have been lodged against it for the matters arising in the ordinary course of business, which have not been described above. In the opinion of the management, the outcome of these claims will not have a material adverse effect on the Parent company’s operations.
Guarantees under waste treatment plans
As required by waste treatment plans approved by the Ministry of Environment in 2004, the banks on behalf of the Parent company issued guarantees to regional departments of the Ministry of Environment for a total amount of USD 3,097 thousand or LTL 8,268 thousand as at 31 December 2011 and USD 4,451 thousand or LTL 11,617 thousand as at 31 December 2010. Guarantees are valid until 5 December 2012. Payments under these guarantees should be made in cases when the Parent company is unable to continue treatment of waste accumulating in production process. In the consolidated financial statements for the year ended on 31 December 2011, the Parent company made a provision for the environmental liabilities amounting to USD 4,489 thousand or LTL 11,983 thousand and as at 31 December 2010 it was made USD 5,686 thousand or LTL 14,840 thousand (Note 18).
Tax inspections
No tax inspections for the year 2007 and subsequent years have been performed by the tax authorities up to 31 January 2011 in the Parent company.
Customs inspections
From 3 May 2010 until 8 June 2010 Klaipeda Territorial Custom Office executed the inspection regarding the compliance of the customs and other requirements established in the legislation during the period from 1 April 2010 until 23 April 2010 (instruction to conduct custom inspection No P6-17, 23 April 2010). No violations or infringements have been found (inspection report No OSM320022, dated 23 June 2010).
From 2 July 2010 until 19 June 2010 Klaipeda Territorial Custom Office executed the inspection regarding the correctness of classification and customs valued declaration for goods imported to Lithuania (instruction to conduct custom inspection No RŽ78(SM)-2, dated 2 July 2010). No violations or infringements have been found (inspection report No OSM320025, dated 10 September 2011).
From 29 June 2011 until 28 July 2011 Klaipeda Territorial Custom Office executed the targeted inspection of the Parent company’s economic activity (instruction to conduct custom inspection No RŽ(SM32)-26, dated 29 June 2011). No violations or infringements have been found (inspection report No 1SM320032P, dated 28 July 2011).
No other customs inspections or disputes with Klaipeda Territorial Custom Office up to 31 December 2011.

ANNUAL REPORT of Public comPany orlen lietuva for the year 2011 85
30. Guarantees and sureties
Excise tax guarantees and excise tax on goods and merchandise under the excise tax suspension procedure as at 31 December 2011 and 31 December 2010 amounted to USD 562 thousand or LTL 1,500 thousand and USD 690 thousand or LTL 1,800 thousand, respectively.
Guarantees granted as at 31 December 2011 and 31 December 2010 amounted to USD 4,571 thousand or LTL 12,202 thousand and USD 3,338 thousand or LTL 8,712 thousand, respectively.
31. Related party transactions
31.1. Information on material related party transactions concluded by the Group on other than market terms
In 2011 and 2010 the Group did not conclude any material related party transactions on other than market terms.
31.2. Transactions with members of the Management Board and Supervisory Board, their spouses, siblings, descen-dants and ascendants and their other relatives
In 2011 and 2010 the Group did not grant to managing and supervising persons and their relatives any advances, borrowings, loans, guarantees and sureties, or concluded other agreements obliging to render services to the Group and its related parties.
In 2011 there were no significant transactions concluded with members of the Management Board, Supervisory Board, their spouses, siblings, descendants, ascendants or their other relatives.
31.3. Transactions concluded by the Group with related parties through the key executive personnel
In 2011 members of the Group’s key executive personnel did not conclude any transactions with related parties. In 2010 members of the Group’s key executive personnel did conclude any transactions with related parties too.
31.4. Transactions and balance of settlements of the Group with related parties
for the year ended 31 December 2011
USD Related parties Associates Total related partiesSales 515,254 24,149 539,403 Purchases 7,142,285 - 7,142,285 Interest expenses 6,398 - 6,398 Other financial costs 111 - 111 Trade and other receivables (net) 13,807 786 14,593 Cash Pool 160 - 160 Borrowings 199,825 - 199,825 Trade and other liabilities 499,000 - 499,000
LTL Related parties Associates Total related parties Sales 1,278,704 59,931 1,338,635 Purchases 17,725,009 - 17,725,009 Interest expenses 15,878 - 15,878 Other financial costs 275 - 275 Trade and other receivables (net) 36,856 2,098 38,954 Cash Pool 426 - 426 Borrowings 533,412 - 533,412 Trade and other liabilities 1,332,031 - 1,332,031

ANNUAL REPORT of Public comPany orlen lietuva for the year 2011 86
for the year ended 31 December 2010
USD Related parties Associates Total related parties Sales 563,963 10,915 574,878 Purchases 5,223,002 - 5,223,002 Interest expenses 1,198 - 1,198 Other financial costs 729 - 729 Trade and other receivables (net) 34,451 496 34,947 Cash Pool 15,350 - 15,350 Trade and other liabilities 588,443 - 588,443
LTL Related parties Associates Total related parties Sales 1,470,082 28,451 1,498,533 Purchases 13,614,797 - 13,614,797 Interest expenses 3,123 - 3,123 Other financial costs 1,900 - 1,900 Trade and other receivables (net) 89,913 1,295 91,208 Cash Pool 40,061 - 40,061 Trade and other liabilities 1,535,779 - 1,535,779
The above transactions with related parties include sale and purchase of refinery products, purchases of repair, transportation and other services. Settlements with related parties include trade and financial receivables and liabilities.
32. Remuneration together with profit-sharing paid and due or potentially due to Management Board, Supervisory Board and other members of key executive personnel of Parent Company and the Capital Group companies in accordance with IAS 24
The Management Board’s, the Supervisory Board’s and other key executive personnel’s remuneration includes short-term employee benefits, post-employment benefits, other long-term employee benefits and termination benefits paid, due and potentially due during the period.
USD LTL USD LTLRemuneration of the Management Board members of the Company 1,664 4,130 1,198 3,123 - remuneration and other benefits 1,376 3,415 969 2,526 - bonus paid for previous year 288 715 229 597
Bonus potentially due to Management Board members, to be paid in the following year 354 944 353 922
Remuneration and other benefits of the key executive personnel 3,724 9,242 3,430 8,941 - other key executive personnel of the company 2,547 6,321 2,288 5,964 - key executive personnel of the subsidiaries belonging to the Group 1,177 2,921 1,142 2,977
as at 31/12/2011 as at 31/12/2010
In 2011 the Parent company’s key executive personnel was participating in the annual MBO bonus system (Management by objectives). The regulations applicable to Parent company General Director and Deputies of General Director and other key positions in the Parent company have certain common features. The persons subject to the above mentioned systems are

ANNUAL REPORT of Public comPany orlen lietuva for the year 2011 87
remunerated for the accomplishment of specific goals set at the beginning of the bonus period, by the Bord for the General Director and his deputies and by the General Director of the Company for the key personnel members. The bonus systems are structured in such way, so as to promote the cooperation between individual employees in view to achieve the best possible results for the Parent company. The goals so-said are qualitative or quantitative (measurable) and are accounted for following the end of the year for which they were set, on the rules adopted in the applicable Bonus System Regulations.
In 2010 new standards of MBO for top level management in the Parent company were developed and accepted, to enter into force starting from 2011. The basic assumptions for implementing the changers is to make the bonus system match the Parent company Management Board’s goals and to enhance the highest management’s liability for the results generated by the Parent company.
33. Remuneration arising from the agreement with the entity authorized the conduct audit of the financial statements
In the period covered by this consolidated financial statement the entity authorized to conduct audit of the Group’s financial statements is KPMG Baltics. According to the agreement concluded on 27 July 2011 with Parent Company and later with subsidiaries for period 2011 and 2012 KPMG Baltics executes the reviews of interim and audits of separate and consolidated financial statements.
USD LTL USD LTLFees payable to KPMG Baltics UAB in respect of the Parent Company
207 514 205 534
audit of the annual financial statements 93 231 106 276reviews of financial statements 95 236 83 216other services 19 47 16 42
Fees payable to KPMG companies in respect of subsidiaries belonging to the Capital Group
66 163 76 199
audit of the annual financial statements 55 136 38 99reviews of financial statements 10 25 30 78other services 1 2 8 22
273 677 281 733
as at 31/12/2011 as at 31/12/2010
Remuneration comprises net fees due or paid to the entity authorized to conduct audit for:- audit of separate and consolidated financial statements, - quarterly agreed-upon procedures on financial reporting package prepared for consolidation purpose,- related services comprising mainly other services related to the audit and agreed-upon procedures, not included in the above
mentioned positions.
34. Employment structure
as at31/12/2011
as at31/12/2010
Average employment in personsBlue collar workers 1,637 1,790 White collar workers 933 1,023
2,571 2,812 Employment in personsBlue collar workers 1,611 1,716 White collar workers 941 980
2,552 2,696

ANNUAL REPORT of Public comPany orlen lietuva for the year 2011 88
35. Significant events after the end of the reporting period
After the end of the reporting period there were no significant events that should be recognised or disclosed in the consolidated financial statements for 2011.