
Annual Report | Informe Anual · 2009 Annual Report | Informe Anual. Founded in 1893, Popular, Inc....
204
2009 Annual Report | Informe Anual
-
Upload
hoangtuyen -
Category
Documents
-
view
213 -
download
0
Transcript of Annual Report | Informe Anual · 2009 Annual Report | Informe Anual. Founded in 1893, Popular, Inc....
2009 Annual Report | Informe Anual
Founded in 1893, Popular, Inc. (NASDAQ: BPOP) is the
leading banking institution by both assets and deposits in
Puerto Rico and ranks 38th by assets among U.S. banks.
In the United States, Popular has established a community-
banking franchise providing a broad range of financial
services and products with branches in New York, New
Jersey, Illinois, Florida and California.
Popular also continues to expand its expertise in processing
technology through its subsidiary EVERTEC, which
processes approximately 1.1 billion transactions annually
in the Caribbean and Latin America.
1 Letter to Shareholders
2 Institutional Values
5 2009 Highlights, Key Facts and Figures
6 Fundación Banco Popular 30 Years
8 25-Year Historical Financial Summary
10 Our People / Our Creed / Board of Directors
Executive Officers / Corporate Information
21 Financial Review and Supplementary Information
Popular, Inc. (NASDAQ: BPOP) se fundó en 1893; es la
principal institución bancaria en Puerto Rico, tanto en
activos y depósitos, y es el trigésimo octavo banco en activos
en los Estados Unidos. En Estados Unidos Popular tiene
una franquicia bancaria de base comunitaria que provee
una amplia gama de servicios y productos financieros en
sucursales en Nueva York, Nueva Jersey, Illinois, Florida
y California.
Popular también continúa expandiendo su capacidad en
la tecnología de procesamiento de datos a través de su
subsidiaria EVERTEC, que procesa aproximadamente
1,100 millones de transacciones anualmente en el Caribe
y en América Latina.
11 Carta a Nuestros Accionistas
12 Valores Institucionales
15 Puntos Principales, Cifras y Datos Clave de 2009
16 Fundación Banco Popular 30 Años
18 Resumen Financiero Histórico – 25 Años
20 Nuestra Gente / Nuestro Credo / Junta de Directores
Oficiales Ejecutivos / Información Corporativa
2009 Annual Report | Informe Anual

Letter toShareholders
Financial institutions again faced significant challenges in
2009 amid deep economic recession, continued deterioration
in credit quality, and new regulatory requirements for bank
capital structures. Reflecting this difficult economic and credit environment, Popular reported a net loss of $574 million in 2009, compared with a net loss of $1.2 billion in 2008. Our share price was negatively impacted, closing the year at $2.26, compared with $5.16 in 2008.
Despite these challenges, we registereD a
number of notable accomplishments in 2009
as we continueD to focus on executing the
tough but necessary actions to position popular
for a return to profitability anD Deliver value
to our shareholDers over the long term.
Notable actions taken in 2009 include a significant increase in the Corporation’s Tier 1 common equity ratio to well above regulatory guidelines; improved credit risk management; and substantial downsizing of our operations in the continental United States, where we continued to reduce both our assets and U.S. footprint.
These actions were accompanied by aggressive efforts to reduce our expense base. Our efforts included, among other measures, a freeze in the pension plan and the suspension of matching contributions to all savings plans. Personnel expenses declined 12% and the number of employees fell 11% during the year.
economic and credit environment
the Puerto rico economy contracted 3.7% during fiscal year
2009. The unemployment rate fluctuates around 15% and the real estate market remains under pressure due to oversupply in the housing sector and decreased economic activity. While the recession is expected to continue in 2010, some indices are showing signs of stabilization. The unemployment rate has improved slightly in recent months, and the influx of U.S. government stimulus funds could help reverse negative trends.
In the United States, the unemployment rate remains close to 10% and real estate prices continue to decline, albeit at slower rates in some markets. Despite early signs of an economic recovery in the U.S. in the second half of 2009, we are unlikely to see significant changes in credit quality until the employment market improves.
The economic environment continued to impact credit quality throughout the financial services industry. Net charge-off and non-current loan rates stand at their highest level since insured institutions began reporting them to the FDIC in 1984. Given the mixed signals in both Puerto Rico and the United States, our outlook remains cautious until we see clearer signs that an economic recovery is under way.
Non-performing assets were $2.4 billion or 6.91% of total assets, compared with $1.3 billion and 3.32%, respectively, in 2008. Net charge-offs increased from $600 million in 2008 to $1.0 billion in 2009. As a result, the provision for loan losses was $1.4 billion in 2009, up 42% from 2008.
caPitaL Structure
Given the widespread turmoil in the credit and financial
markets, and the erosion of capital resulting from the large
losses sustained by many banks, the Federal reserve conducted
its Supervisory capital assessment Program (“ScaP”) in 2009
to determine the amount of capital needed by the largest bank
holding companies to provide a buffer against larger than
expected losses in a more adverse credit scenario. Regulators identified voting common equity as the dominant element of Tier 1 capital and established a guideline of a minimum 4% Tier 1 common/risk-weighted assets ratio for determining capital needs.
Even though we were not one of the institutions included in SCAP, we executed several actions to increase common equity capital above the new guideline. As a result, the Corporation’s Tier 1 common equity ratio, which stood at 2.45% before these actions, was raised to 6.39% as of December 31, 2009. All other capital ratios also remain above the regulatory minimum “well-capitalized” levels.
P o P u l a r , I n c . 2 0 0 9 a n n u a l r e P o r t 1

We made the difficult decision to suspend dividends on shares of common stock and Series A and B Preferred Stock. We also launched an offer to exchange outstanding Series A Preferred Stock, Series B Preferred Stock, and the outstanding Trust Preferred Securities for newly issued common stock. Tendered securities amounted to $934 million, and approximately 357.5 million shares were issued. Finally, we completed the exchange of all $935 million of outstanding shares of Series C Preferred Stock owned by the U.S. Treasury for $935 million of newly issued trust preferred securities (the “New Trust Preferred Securities”). These actions generated more than $1.4 billion of Tier 1 common equity, comprised of approximately $920 million as a result of the Exchange Offer and $485 million from the exchange of the U.S. Treasury’s shares, representing the difference between the book value of the preferred stock and the estimated fair value of the New Trust Preferred Securities.
Banco PoPuLar Puerto rico
Banco Popular Puerto rico, which includes the operations
of the bank and its specialized mortgage, auto loan, securities
and insurance subsidiaries, reported net income of $170 million
in 2009, compared with $239 million in 2008. Results were impacted by an increase of $105 million in the provision for loan losses and a decrease of $92 million in net interest income due to a lower yield on earning assets resulting from an increase in non-performing loans and a low interest rate environment. Average earning assets declined mainly due to a lower volume of investments and loans, in part due to a slowdown in loan originations and increased levels of charge-offs. These negative factors were partially offset by an increase of $157 million in gains on the sale of securities. Our continued focus on cost reduction resulted in lower expenses in the areas of personnel, business promotion and technology. However, higher FDIC insurance assessments on deposits resulted in higher total expenses in 2009 than in the previous year.
creDit quality remains the critical issue impacting
the profitability of our financial services operations
in puerto rico. net charge-offs were $512 million
in 2009, an increase of 46% from the previous year.
reflecting the general economic environment
anD continueD oversupply in the resiDential
housing market, losses were concentrateD in the
construction anD commercial creDit portfolios,
where banco popular puerto rico took further steps
to manage creDit quality proactively anD intensively.
In the Commercial Banking Group, all credit functions were transferred from the relationship officers to a group of analysts responsible for evaluating loans and making recommendations to credit officers. We also introduced monthly portfolio reviews for larger commercial and construction loans in order to identify potential problems early in the process and manage them accordingly.
In the construction portfolio, we have focused on working with developers to provide them with market intelligence and marketing and sales support. In July, Popular Mortgage launched a special offer for housing units in projects financed by Banco Popular. As a result of these efforts, the sale of housing units in our projects increased by 40% between the first and second half of the year.
The consumer credit area continued to manage its underwriting processes to minimize risks and implemented more sophisticated tools to prioritize collection efforts. We intensified our efforts to work with clients in financial distress, doubling our loss mitigation production.
In an effort to support not only our customers but the general population as well, Banco Popular launched a financial education program. Seminars were conducted at Banco Popular branches and several shopping centers throughout the island
Letter toShareholders
Social CommitmentWe are committed to work actively in promoting the social and economic well-being of the communities we serve.
CustomerWe achieve satisfaction for our customers and earn their loyalty by adding value to each interaction. Our relationship with the customer takes precedence over any particular transaction.
Institutional values2 P o P u l a r , I n c . 2 0 0 9 a n n u a l r e P o r t

on topics such as household budgeting, managing savings and credit, communicating with creditors and managing a possible bankruptcy.
Despite the current challenges, Banco Popular’s ability to generate top line revenue continues to be strong, which bodes well for profitability once credit costs in our home market normalize. With approximately 1.4 million customers, Banco Popular Puerto Rico is by far the strongest player on the island, where 80% of banked individuals have a relationship with Popular. It has three times as many customers, branches, ATMs and share of deposits than its closest competitor in each of these categories. Its powerful brand recognition is substantially greater than that of the next bank and surpasses that of all local brands.
Our goal remains to work with our customers to find mutually beneficial alternatives to navigate this difficult economy and to offer quality products and services to our vast customer base, as we have done for well over a century.
Banco PoPuLar north america
in the united States, high credit costs continued to drive
losses at Banco Popular north america (“BPna”), which
includes e-Loan’s remaining portfolio and deposit operations. BPNA reported a net loss of $726 million compared with a net loss of $525 million in 2008. The provision expense totaled $782 million, an increase of 66% from the previous year. Net charge-offs were $515 million, compared with $248 million in 2008. The commercial, construction, mortgage and E-LOAN home equity loan portfolios suffered the most from the U.S. economic recession and the turmoil in the real estate market.
Management successfully pursued significant restructuring efforts in 2009 under the comprehensive plan we announced in late 2008 to refocus BPNA on its core business. As President of BPNA and Chief Operating Officer of Popular, Inc., David H. Chafey Jr. assumed responsibility for integrating the bank in Puerto Rico and the bank in the United States under a single management group to achieve efficiencies and greater control of the U.S. restructuring efforts.
In 2009, consistent with our plan, we exited or downsized asset-generating businesses that were not relationship-based or whose profitability was being severely impacted by market conditions. As part of this effort, we sold the assets of Popular Equipment Finance, our leasing unit in the United States. These initiatives, combined, resulted in an estimated reduction of approximately $1.3 billion in loan balances when compared to 2008. We closed, sold or consolidated a total of 38 underperforming branches, leaving BPNA with a network of 101 branches. We successfully transferred all of E-LOAN’s remaining operations, which consist of the gathering of online deposits for BPNA and the transfer of loan applications to third parties, to BPNA and EVERTEC. Headcount in our U.S. operations decreased by close to 900 employees or 40% of the workforce.
the restructuring efforts unDertaken in 2009 are
part of a larger process we began in 2007 to reDuce
the size of our u.s. operations.
This process includes major actions such as the discontinuance of wholesale subprime lending operations, the sale of Equity One assets to American General Financial, the sale of Popular Financial Holding (“PFH”) assets to Goldman Sachs affiliates, the discontinuance of E-LOAN’s lending operations, and the substantial reduction of BPNA’s support areas by leveraging the infrastructure available in Puerto Rico. The number of employees in our U.S. operations, including PFH, has fallen from 4,800 at the peak in 2005 to 1,400 in 2009, a reduction of 71%, and the number of offices has been cut to approximately one third. Assets in the U.S. have decreased from $22 billion at the close of 2006 to $11 billion at the close of 2009 and their share of Popular’s overall assets has declined from 46% in 2006 to 32% in 2009.
with approximately 1.4 million customers, banco popular puerto rico is by far the strongest player on
the islanD, where 80% of bankeD inDiviDuals have a relationship with popular. it has three times as many
customers, branches, atms anD share of Deposits than its closest competitor in each of these categories.
IntegrityWe are guided by the highest standards of ethics, integrity and morality. Our customers’ trust is of utmost importance to our institution.
ExcellenceWe believe there is only one way to do things: the right way.
InnovationWe foster a constant search for new solutions as a strategy to enhance our competitive advantage.
Our PeopleWe strive to attract, develop, compensate and retain the most qualified people in a work environment characterized by discipline and affection.
Shareholder ValueOur goal is to produce high and consistent financial returns for our shareholders, based on a long-term view.
3

As a result of these painful but necessary actions, BPNA is now a community bank with locations in Florida, New York, New Jersey, Illinois and California focused on serving individual and commercial customers through quality products and services. We will continue to work tirelessly to maximize the potential of these operations and reach appropriate levels of profitability. Our goal continues to be to capture the value of our operation on the U.S. mainland to Popular as an additional and diversified source of revenue.
evertec
evertec, our processing and information technology company,
reported net income of $50 million in 2009, compared with
$44 million in 2008. While EVERTEC was not immune to the effects of the economic recession in Puerto Rico, the company’s main market, it succeeded in maintaining a similar level of revenues to 2008. This, combined with a significant reduction in operational expenses, increased its net contribution to Popular in 2009.
the ath network haD an excellent year, incluDing
high transaction volumes anD Development of
several innovative proDucts.
Latin America is an increasingly important part of EVERTEC’s business. In 2009, we continued our expansion in Mexico, where we launched operations in 2008, and entered the Panama market. We also are expanding our product offering in these countries, leveraging the wide variety of services we provide in Puerto Rico.
These services, which include business process outsourcing, network services, human resources solutions, software development and consulting, make EVERTEC a complete information technology provider. With offices in nine countries servicing customers in 16 countries, EVERTEC continues to provide Popular with a solid and diversified revenue stream.
our PeoPLe
our accomplishments in 2009 are significant in light of
the current environment and would not have been possible
without the dedication and resolve of our senior management
team, our employees and the support and guidance of our
Board of directors.
After more than two decades of service, Juan J. Bermúdez and Francisco J. Rexach, Jr. retired from our Board. Their insight and counsel will be missed. We are pleased to welcome two new directors, Alejandro M. Ballester and Carlos A. Unanue. Mr. Ballester is President of Ballester Hermanos, a major food, wine and spirits distributor in Puerto Rico, and Mr. Unanue is President of Goya of Puerto Rico, part of Goya Foods, the largest Hispanic-owned food company in the United States. Both are accomplished professionals and will bring great value and expertise to our Board and help lead this great organization into the future.
Popular boasts 9,400 highly committed employees, with an employee satisfaction level comparable to or higher than organizations recognized as the best places to work. To them, I extend my most heartfelt gratitude. I would like to recognize the work of Emilio E. Piñero who, after dedicating 39 years to our organization, decided to enjoy a well-deserved retirement. I thank Emilio dearly for his enthusiasm and unwavering commitment throughout his many years at Popular.
It is with profound sadness that I inform you of the passing of Brunilda Santos de Alvarez, our General Counsel, who, after more than two decades of service to Popular, had recently retired for health reasons. I will personally miss her unique combination of wisdom and common sense, of strength and gentleness, which I had the privilege to enjoy during the most interesting, as well as the most difficult, of times. I know that she will also be missed by the entire management team and all her co-workers. Her legacy will always live on in our institutional values, which she embodied so well, and on the generation of Popular professionals that she so deeply touched.
Our organization has a 116-year history, and each time it has faced challenges as difficult, if not more so than those we face now, it has emerged stronger. I am confident that with the same spirit that has guided us throughout our history and the continued commitment of everyone in our organization we will once again overcome the challenges and set Popular firmly on a path to profitability for the future.
Thank you for your continued support.
richard L. carrión
chairman and chief executive officer
Letter toShareholders
4 P o P u l a r , I n c . 2 0 0 9 a n n u a l r e P o r t

5
Key Facts and Figures2009 hiGhLiGhtS
1 As of 12/31/09 2 As of 9/30/09
Ba
nk
inG
Bu
Sin
eS
SP
oP
uL
ar
, inc
.P
ro
ce
SS
inG
Bu
Sin
eS
S
PoPuLar, inc.
• 38th largest bank holding company in the U.S. with $34.7 billion in assets and 9,400 employees
2009 highlights
• Generated more than $1.4 billion of Tier 1 common equity in a series of exchange transactions
• Continued the restructuring of our operations in the United States, selling or
closing unprofitable businesses and reducing the number of branches from 139 to 101
• Restructured the Corporation’s credit divisions by relocating the most experienced credit
officers and transferring credit functions from relationship officers to a special group of analysts
responsible for evaluating loans and making recommendations
Banco PoPuLar Puerto rico
• Approximately 1.4 million clients
• 181 branches and 51 offices throughout Puerto Rico and the Virgin Islands
• 6,066 FTEs1
• 588 ATMs and 26,508 POS throughout Puerto Rico and the Virgin Islands
• No. 1 market share in total deposits (35.0%)2 and total loans (21.8%)2
• $23.6 billion in assets, $15.1 billion in loans and $17.8 billion in deposits1
Banco PoPuLar north america
• Approximately 422,000 clients
• 101 branches throughout five states: 41 in New York and New Jersey, 16 in Illinois,
20 in Florida and 24 in California
• 1,410 FTEs1
• E-LOAN captured $850 million in deposits1 and has approximately 39,400 clients
• $10.8 billion in assets, $8.7 billion in loans and $8.3 billion in total deposits1
evertec
• Leading ATM/POS processor in the Caribbean and Central America
• 9 offices servicing customers in 16 countries
• 1,767 FTEs1
• Processed over 1.1 billion transactions1, of which more than 565 million corresponded
to the ATH® Network
• 5,069 ATMs and over 133,461 POS throughout the United States and Latin America

Fundación Banco PoPuLar 30 Years
6 P o P u l a r , I n c . 2 0 0 9 a n n u a l r e P o r t
Banco Popular is proud of its 116-year legacy of community
involvement. Fundación Banco Popular, the philanthropic arm of Popular, is devoted to improving the quality of life in the communities we are privileged to serve.
We challenge ourselves every day to achieve the highest levels of corporate social responsibility through our actions and values. We remain steadfast in our commitment to education and community development through our philanthropic efforts and through active employee participation.
Thirty years after its creation, Fundación Banco Popular continues to cultivate long-term relationships with grassroots and community organizations, while inspiring positive change through education and community development initiatives. We have proudly supported more than 250 organizations and contributed $21,147,866 from 1982–2009.
education
We believe that education is the cornerstone of a community’s
future. Fundación Banco Popular focuses on programs that emphasize school transformation, alternative education and after-school programs. We support:• Teacher Development• School Desertion Prevention• After-School Programs• Arts Education• Special Education• Leadership Development• Community Library Services• Mentoring• Vocational Education
throughout its 30 years, funDaciÓn banco
popular has createD seven enDoweD scholarship
funDs at universities that proviDe opportunities
for puerto rican stuDents. two hunDreD anD
sixty one stuDents have benefiteD from these
scholarships. the rafael carriÓn, Jr. scholarship
funD for the chilDren of popular employees
has awarDeD 1,826 scholarships for a total
investment of $2,678,841.
The past few years have brought great challenges and economic difficulty. Now more than ever, we passionately work hand-in-hand with our communities to stimulate growth, support education and encourage cultural expression.
community deveLoPment
Fundación Banco Popular focuses its resources on
empowering communities and individuals to help
spur local economic growth. Through its efforts, Fundación Banco Popular supports:• Community Self-Management• Entrepreneurship Development • Community Support for Schools• Controlled Substance Use Prevention • Teen Pregnancy Prevention and Support
for Single Teen Mothers
school of special education and integral rehabilitation (spanish acronym coDeri)
cultural and service center of cantera
the new school for puerto rico
santo Domingo savio corporation

30 Years
Our social commitment was expanded in 2004 to include Popular’s operations in the United States through Banco Popular Foundation. The employee-sponsored organizations focus their efforts on education, affordable housing, small business and community development. During the last five years, the foundation has awarded $1,607,200 in 152 grants to organizations in the communities we serve in the United States.
emPLoyeeS’ voLuntary Service
our employees invest thousands of hours of community
service in local and national initiatives each year. Over 95% of the non-profit organizations we support have a Popular employee serving as an active member.
Last year, more than 3,000 employees of Banco Popular from Puerto Rico, California, Florida, Illinois, New Jersey, New York and the Virgin Islands joined their families and friends to volunteer with local organizations and initiatives for Make a Difference Day.
popular employees also make economic contributions
to both funDaciÓn banco popular anD the banco
popular founDation. in 2009, employees contributeD
$692,759. since 2000, employees have contributeD over
$4.5 million to both founDations.
The bank emphasizes service as an important element of our culture and what we offer to our communities. Much has changed over the years, except our unwavering dedication to service.
the past few years have brought great challenges anD economic Difficulty. now more than ever,
we passionately work hanD-in-hanD with our communities to stimulate growth, support eDucation,
anD encourage cultural expression.
7
Be a voice in our city’S Future
the rafael carrión pacheco exhibit hall, a unique
cultural space organized by banco popular in its
historic old san Juan building, has served to enrich
puerto rico’s cultural life for over 20 years. we have
organized 16 exhibits focusing on initiatives that
improve puerto rico’s urban landscape, illustrate our
rich musical and sports heritage, and discuss key
environmental issues. our current exhibit On Rails,
enjoyed by over 41,000 visitors, demonstrates
commuting access to old san Juan, transportation
challenges and proposes viable solutions by using
an interactive, 38-foot scale model. the project has
garnered strong dialogue and a public plan to develop
a tram option for the city is being advanced.
make a Difference Day 2009
ernesto ramos antonini school of music
0
200,000
400,000
600,000
800,000
1,000,000
1,200,000
1,400,000
1,600,000
1,800,000
$2,000,000
2009200419991994198919841979
0
10
20
30
40
50
60
70
80
90
100
TOTAL GRANTS AWARDED (1979–2009)
Grants Organizations
(Dollars in millions, except per share data) 1985 1986 1987 1988 1989 1990 1991 1992 1993 1994 1995 1996 1997 1998 1999 2000 2001 2002 2003 2004 2005 2006 2007 2008 2009
SelectedFinancial Information
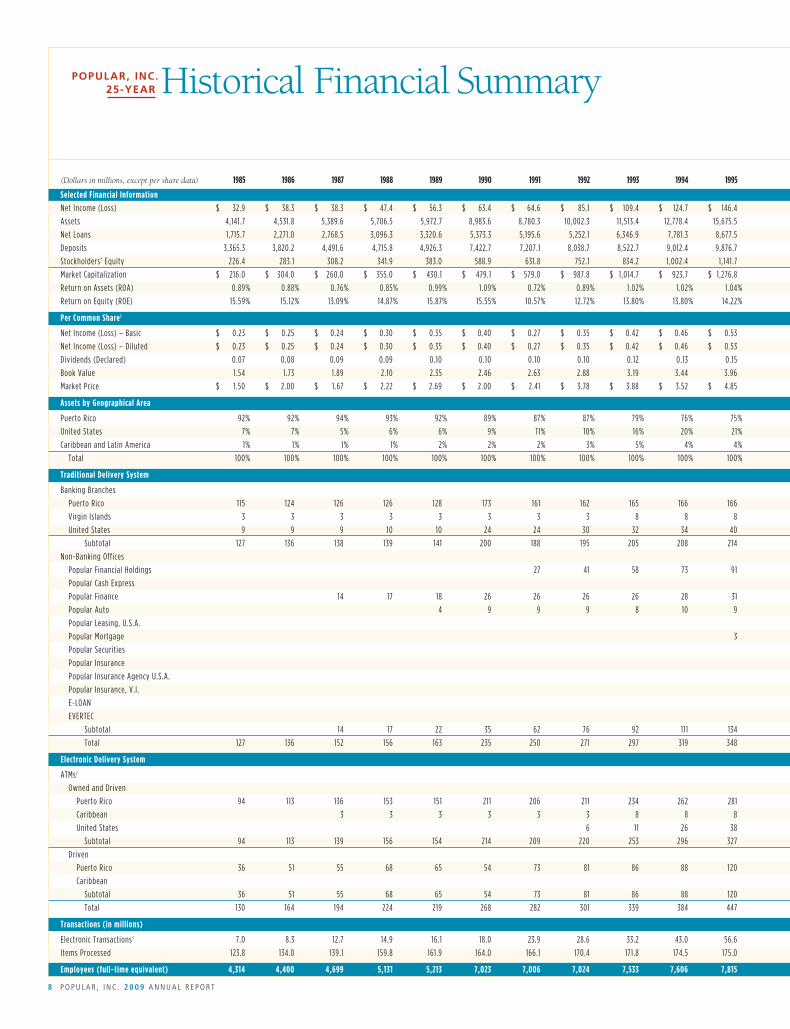
Net Income(Loss) $ 32.9 $ 38.3 $ 38.3 $ 47.4 $ 56.3 $ 63.4 $ 64.6 $ 85.1 $ 109.4 $ 124.7 $ 146.4 $ 185.2 $ 209.6 $ 232.3 $ 257.6 $ 276.1 $ 304.5 $ 351.9 $ 470.9 $ 489.9 $ 540.7 $ 357.7 $ (64.5) $ (1,243.9) $ (573.9)
Assets 4,141.7 4,531.8 5,389.6 5,706.5 5,972.7 8,983.6 8,780.3 10,002.3 11,513.4 12,778.4 15,675.5 16,764.1 19,300.5 23,160.4 25,460.5 28,057.1 30,744.7 33,660.4 36,434.7 44,401.6 48,623.7 47,404.0 44,411.4 38,882.8 34,736.3
NetLoans 1,715.7 2,271.0 2,768.5 3,096.3 3,320.6 5,373.3 5,195.6 5,252.1 6,346.9 7,781.3 8,677.5 9,779.0 11,376.6 13,078.8 14,907.8 16,057.1 18,168.6 19,582.1 22,602.2 28,742.3 31,710.2 32,736.9 29,911.0 26,276.1 23,803.9
Deposits 3,365.3 3,820.2 4,491.6 4,715.8 4,926.3 7,422.7 7,207.1 8,038.7 8,522.7 9,012.4 9,876.7 10,763.3 11,749.6 13,672.2 14,173.7 14,804.9 16,370.0 17,614.7 18,097.8 20,593.2 22,638.0 24,438.3 28,334.4 27,550.2 25,924.9
Stockholders’Equity 226.4 283.1 308.2 341.9 383.0 588.9 631.8 752.1 834.2 1,002.4 1,141.7 1,262.5 1,503.1 1,709.1 1,661.0 1,993.6 2,272.8 2,410.9 2,754.4 3,104.6 3,449.2 3,620.3 3,581.9 3,268.4 2,538.8
MarketCapitalization $ 216.0 $ 304.0 $ 260.0 $ 355.0 $ 430.1 $ 479.1 $ 579.0 $ 987.8 $ 1,014.7 $ 923.7 $ 1,276.8 $ 2,230.5 $ 3,350.3 $ 4,611.7 $ 3,790.2 $ 3,578.1 $ 3,965.4 $ 4,476.4 $ 5,960.2 $ 7,685.6 $ 5,836.5 $ 5,003.4 $ 2,968.3 $ 1,455.1 $ 1,445.4
ReturnonAssets(ROA) 0.89% 0.88% 0.76% 0.85% 0.99% 1.09% 0.72% 0.89% 1.02% 1.02% 1.04% 1.14% 1.14% 1.14% 1.08% 1.04% 1.09% 1.11% 1.36% 1.23% 1.17% 0.74% -0.14% -3.04% -1.57%
ReturnonEquity(ROE) 15.59% 15.12% 13.09% 14.87% 15.87% 15.55% 10.57% 12.72% 13.80% 13.80% 14.22% 16.17% 15.83% 15.41% 15.45% 15.00% 14.84% 16.29% 19.30% 17.60% 17.12% 9.73% -2.08% -44.47% -32.95%
PerCommonShare1
Net Income(Loss)–Basic $ 0.23 $ 0.25 $ 0.24 $ 0.30 $ 0.35 $ 0.40 $ 0.27 $ 0.35 $ 0.42 $ 0.46 $ 0.53 $ 0.67 $ 0.75 $ 0.83 $ 0.92 $ 0.99 $ 1.09 $ 1.31 $ 1.74 $ 1.79 $ 1.98 $ 1.24 $ (0.27) $ (4.55) $ 0.24
Net Income(Loss)–Diluted $ 0.23 $ 0.25 $ 0.24 $ 0.30 $ 0.35 $ 0.40 $ 0.27 $ 0.35 $ 0.42 $ 0.46 $ 0.53 $ 0.67 $ 0.75 $ 0.83 $ 0.92 $ 0.99 $ 1.09 $ 1.31 $ 1.74 $ 1.79 $ 1.97 $ 1.24 $ (0.27) $ (4.55) $ 0.24
Dividends(Declared) 0.07 0.08 0.09 0.09 0.10 0.10 0.10 0.10 0.12 0.13 0.15 0.18 0.20 0.25 0.30 0.32 0.38 0.40 0.51 0.62 0.64 0.64 0.64 0.48 0.02
BookValue 1.54 1.73 1.89 2.10 2.35 2.46 2.63 2.88 3.19 3.44 3.96 4.40 5.19 5.93 5.76 6.96 7.97 9.10 9.66 10.95 11.82 12.32 12.12 6.33 3.89
MarketPrice $ 1.50 $ 2.00 $ 1.67 $ 2.22 $ 2.69 $ 2.00 $ 2.41 $ 3.78 $ 3.88 $ 3.52 $ 4.85 $ 8.44 $ 12.38 $ 17.00 $ 13.97 $ 13.16 $ 14.54 $ 16.90 $ 22.43 $ 28.83 $ 21.15 $ 17.95 $ 10.60 $ 5.16 $ 2.26
AssetsbyGeographicalArea
PuertoRico 92% 92% 94% 93% 92% 89% 87% 87% 79% 76% 75% 74% 74% 71% 71% 72% 68% 66% 62% 55% 53% 52% 59% 64% 65%
UnitedStates 7% 7% 5% 6% 6% 9% 11% 10% 16% 20% 21% 22% 23% 25% 25% 26% 30% 32% 36% 43% 45% 45% 38% 33% 32%
CaribbeanandLatinAmerica 1% 1% 1% 1% 2% 2% 2% 3% 5% 4% 4% 4% 3% 4% 4% 2% 2% 2% 2% 2% 2% 3% 3% 3% 3%
Total 100% 100% 100% 100% 100% 100% 100% 100% 100% 100% 100% 100% 100% 100% 100% 100% 100% 100% 100% 100% 100% 100% 100% 100% 100%
TraditionalDeliverySystem
BankingBranches
PuertoRico 115 124 126 126 128 173 161 162 165 166 166 178 201 198 199 199 196 195 193 192 194 191 196 179 173
Virgin Islands 3 3 3 3 3 3 3 3 8 8 8 8 8 8 8 8 8 8 8 8 8 8 8 8 8
UnitedStates 9 9 9 10 10 24 24 30 32 34 40 44 63 89 91 95 96 96 97 128 136 142 147 139 101
Subtotal 127 136 138 139 141 200 188 195 205 208 214 230 272 295 298 302 300 299 298 328 338 341 351 326 282
Non-BankingOffices
PopularFinancialHoldings 27 41 58 73 91 102 117 128 137 136 149 153 181 183 212 158 134 2
PopularCashExpress 51 102 132 154 195 129 114 4
PopularFinance 14 17 18 26 26 26 26 28 31 39 44 48 47 61 55 36 43 43 49 52 51 9
PopularAuto 4 9 9 9 8 10 9 8 10 10 12 12 20 18 18 18 17 15 12 12 10
PopularLeasing,U.S.A. 7 8 10 11 13 13 11 15 14 11 24 22
PopularMortgage 3 3 3 11 13 21 25 29 32 30 33 32 32 32 33
PopularSecurities 1 2 2 2 3 4 7 8 9 12 12 13 7 6
Popular Insurance 2 2 2 2 2 2 2 2 1 1
Popular InsuranceAgencyU.S.A. 1 1 1 1 1 1 1 1 1
Popular Insurance,V.I. 1 1 1 1 1 1 1 1
E-LOAN 1 1 1 1
EVERTEC 4 4 4 5 5 5 5 7 9 9 9
Subtotal 14 17 22 35 62 76 92 111 134 153 183 258 327 382 427 460 431 421 351 292 280 97 61
Total 127 136 152 156 163 235 250 271 297 319 348 383 455 553 625 684 727 759 729 749 689 633 631 423 343
ElectronicDeliverySystem
ATMs2
OwnedandDriven
PuertoRico 94 113 136 153 151 211 206 211 234 262 281 327 391 421 442 478 524 539 557 568 583 605 615 605 571
Caribbean 3 3 3 3 3 3 8 8 8 9 17 59 68 37 39 53 57 59 61 65 69 74 77
UnitedStates 6 11 26 38 53 71 94 99 109 118 131 129 163 181 192 187 176 138
Subtotal 94 113 139 156 154 214 209 220 253 296 327 389 479 574 609 624 681 723 743 790 825 862 871 855 786
Driven
PuertoRico 36 51 55 68 65 54 73 81 86 88 120 162 170 187 102 118 155 174 176 167 212 226 433 462 443
Caribbean 97 192 265 851 920 823 926 1,110 1,216 1,726 1,360 1,454 1,560 1,604
Subtotal 36 51 55 68 65 54 73 81 86 88 120 259 362 452 953 1,038 978 1,100 1,286 1,383 1,938 1,586 1,887 2,022 2,047
Total 130 164 194 224 219 268 282 301 339 384 447 648 841 1,026 1,562 1,662 1,659 1,823 2,029 2,173 2,763 2,448 2,758 2,877 2,833
Transactions(inmillions)
ElectronicTransactions3 7.0 8.3 12.7 14.9 16.1 18.0 23.9 28.6 33.2 43.0 56.6 78.0 111.2 130.5 159.4 199.5 206.0 236.6 255.7 568.5 625.9 690.2 772.7 849.4 804.1
ItemsProcessed 123.8 134.0 139.1 159.8 161.9 164.0 166.1 170.4 171.8 174.5 175.0 173.7 171.9 170.9 171.0 160.2 149.9 145.3 138.5 133.9 140.3 150.0 175.2 202.2 191.7
Employees(full-timeequivalent) 4,314 4,400 4,699 5,131 5,213 7,023 7,006 7,024 7,533 7,606 7,815 7,996 8,854 10,549 11,501 10,651 11,334 11,037 11,474 12,139 13,210 12,508 12,303 10,587 9,407
8 P o P u l a r , I n c . 2 0 0 9 a n n u a l r e P o r t
25-year Historical Financial SummaryPoPuLar, inc.

(Dollars in millions, except per share data) 1985 1986 1987 1988 1989 1990 1991 1992 1993 1994 1995 1996 1997 1998 1999 2000 2001 2002 2003 2004 2005 2006 2007 2008 2009
SelectedFinancial Information
Net Income(Loss) $ 32.9 $ 38.3 $ 38.3 $ 47.4 $ 56.3 $ 63.4 $ 64.6 $ 85.1 $ 109.4 $ 124.7 $ 146.4 $ 185.2 $ 209.6 $ 232.3 $ 257.6 $ 276.1 $ 304.5 $ 351.9 $ 470.9 $ 489.9 $ 540.7 $ 357.7 $ (64.5) $ (1,243.9) $ (573.9)
Assets 4,141.7 4,531.8 5,389.6 5,706.5 5,972.7 8,983.6 8,780.3 10,002.3 11,513.4 12,778.4 15,675.5 16,764.1 19,300.5 23,160.4 25,460.5 28,057.1 30,744.7 33,660.4 36,434.7 44,401.6 48,623.7 47,404.0 44,411.4 38,882.8 34,736.3
NetLoans 1,715.7 2,271.0 2,768.5 3,096.3 3,320.6 5,373.3 5,195.6 5,252.1 6,346.9 7,781.3 8,677.5 9,779.0 11,376.6 13,078.8 14,907.8 16,057.1 18,168.6 19,582.1 22,602.2 28,742.3 31,710.2 32,736.9 29,911.0 26,276.1 23,803.9
Deposits 3,365.3 3,820.2 4,491.6 4,715.8 4,926.3 7,422.7 7,207.1 8,038.7 8,522.7 9,012.4 9,876.7 10,763.3 11,749.6 13,672.2 14,173.7 14,804.9 16,370.0 17,614.7 18,097.8 20,593.2 22,638.0 24,438.3 28,334.4 27,550.2 25,924.9
Stockholders’Equity 226.4 283.1 308.2 341.9 383.0 588.9 631.8 752.1 834.2 1,002.4 1,141.7 1,262.5 1,503.1 1,709.1 1,661.0 1,993.6 2,272.8 2,410.9 2,754.4 3,104.6 3,449.2 3,620.3 3,581.9 3,268.4 2,538.8
MarketCapitalization $ 216.0 $ 304.0 $ 260.0 $ 355.0 $ 430.1 $ 479.1 $ 579.0 $ 987.8 $ 1,014.7 $ 923.7 $ 1,276.8 $ 2,230.5 $ 3,350.3 $ 4,611.7 $ 3,790.2 $ 3,578.1 $ 3,965.4 $ 4,476.4 $ 5,960.2 $ 7,685.6 $ 5,836.5 $ 5,003.4 $ 2,968.3 $ 1,455.1 $ 1,445.4
ReturnonAssets(ROA) 0.89% 0.88% 0.76% 0.85% 0.99% 1.09% 0.72% 0.89% 1.02% 1.02% 1.04% 1.14% 1.14% 1.14% 1.08% 1.04% 1.09% 1.11% 1.36% 1.23% 1.17% 0.74% -0.14% -3.04% -1.57%
ReturnonEquity(ROE) 15.59% 15.12% 13.09% 14.87% 15.87% 15.55% 10.57% 12.72% 13.80% 13.80% 14.22% 16.17% 15.83% 15.41% 15.45% 15.00% 14.84% 16.29% 19.30% 17.60% 17.12% 9.73% -2.08% -44.47% -32.95%
PerCommonShare1
Net Income(Loss)–Basic $ 0.23 $ 0.25 $ 0.24 $ 0.30 $ 0.35 $ 0.40 $ 0.27 $ 0.35 $ 0.42 $ 0.46 $ 0.53 $ 0.67 $ 0.75 $ 0.83 $ 0.92 $ 0.99 $ 1.09 $ 1.31 $ 1.74 $ 1.79 $ 1.98 $ 1.24 $ (0.27) $ (4.55) $ 0.24
Net Income(Loss)–Diluted $ 0.23 $ 0.25 $ 0.24 $ 0.30 $ 0.35 $ 0.40 $ 0.27 $ 0.35 $ 0.42 $ 0.46 $ 0.53 $ 0.67 $ 0.75 $ 0.83 $ 0.92 $ 0.99 $ 1.09 $ 1.31 $ 1.74 $ 1.79 $ 1.97 $ 1.24 $ (0.27) $ (4.55) $ 0.24
Dividends(Declared) 0.07 0.08 0.09 0.09 0.10 0.10 0.10 0.10 0.12 0.13 0.15 0.18 0.20 0.25 0.30 0.32 0.38 0.40 0.51 0.62 0.64 0.64 0.64 0.48 0.02
BookValue 1.54 1.73 1.89 2.10 2.35 2.46 2.63 2.88 3.19 3.44 3.96 4.40 5.19 5.93 5.76 6.96 7.97 9.10 9.66 10.95 11.82 12.32 12.12 6.33 3.89
MarketPrice $ 1.50 $ 2.00 $ 1.67 $ 2.22 $ 2.69 $ 2.00 $ 2.41 $ 3.78 $ 3.88 $ 3.52 $ 4.85 $ 8.44 $ 12.38 $ 17.00 $ 13.97 $ 13.16 $ 14.54 $ 16.90 $ 22.43 $ 28.83 $ 21.15 $ 17.95 $ 10.60 $ 5.16 $ 2.26
AssetsbyGeographicalArea
PuertoRico 92% 92% 94% 93% 92% 89% 87% 87% 79% 76% 75% 74% 74% 71% 71% 72% 68% 66% 62% 55% 53% 52% 59% 64% 65%
UnitedStates 7% 7% 5% 6% 6% 9% 11% 10% 16% 20% 21% 22% 23% 25% 25% 26% 30% 32% 36% 43% 45% 45% 38% 33% 32%
CaribbeanandLatinAmerica 1% 1% 1% 1% 2% 2% 2% 3% 5% 4% 4% 4% 3% 4% 4% 2% 2% 2% 2% 2% 2% 3% 3% 3% 3%
Total 100% 100% 100% 100% 100% 100% 100% 100% 100% 100% 100% 100% 100% 100% 100% 100% 100% 100% 100% 100% 100% 100% 100% 100% 100%
TraditionalDeliverySystem
BankingBranches
PuertoRico 115 124 126 126 128 173 161 162 165 166 166 178 201 198 199 199 196 195 193 192 194 191 196 179 173
Virgin Islands 3 3 3 3 3 3 3 3 8 8 8 8 8 8 8 8 8 8 8 8 8 8 8 8 8
UnitedStates 9 9 9 10 10 24 24 30 32 34 40 44 63 89 91 95 96 96 97 128 136 142 147 139 101
Subtotal 127 136 138 139 141 200 188 195 205 208 214 230 272 295 298 302 300 299 298 328 338 341 351 326 282
Non-BankingOffices
PopularFinancialHoldings 27 41 58 73 91 102 117 128 137 136 149 153 181 183 212 158 134 2
PopularCashExpress 51 102 132 154 195 129 114 4
PopularFinance 14 17 18 26 26 26 26 28 31 39 44 48 47 61 55 36 43 43 49 52 51 9
PopularAuto 4 9 9 9 8 10 9 8 10 10 12 12 20 18 18 18 17 15 12 12 10
PopularLeasing,U.S.A. 7 8 10 11 13 13 11 15 14 11 24 22
PopularMortgage 3 3 3 11 13 21 25 29 32 30 33 32 32 32 33
PopularSecurities 1 2 2 2 3 4 7 8 9 12 12 13 7 6
Popular Insurance 2 2 2 2 2 2 2 2 1 1
Popular InsuranceAgencyU.S.A. 1 1 1 1 1 1 1 1 1
Popular Insurance,V.I. 1 1 1 1 1 1 1 1
E-LOAN 1 1 1 1
EVERTEC 4 4 4 5 5 5 5 7 9 9 9
Subtotal 14 17 22 35 62 76 92 111 134 153 183 258 327 382 427 460 431 421 351 292 280 97 61
Total 127 136 152 156 163 235 250 271 297 319 348 383 455 553 625 684 727 759 729 749 689 633 631 423 343
ElectronicDeliverySystem
ATMs2
OwnedandDriven
PuertoRico 94 113 136 153 151 211 206 211 234 262 281 327 391 421 442 478 524 539 557 568 583 605 615 605 571
Caribbean 3 3 3 3 3 3 8 8 8 9 17 59 68 37 39 53 57 59 61 65 69 74 77
UnitedStates 6 11 26 38 53 71 94 99 109 118 131 129 163 181 192 187 176 138
Subtotal 94 113 139 156 154 214 209 220 253 296 327 389 479 574 609 624 681 723 743 790 825 862 871 855 786
Driven
PuertoRico 36 51 55 68 65 54 73 81 86 88 120 162 170 187 102 118 155 174 176 167 212 226 433 462 443
Caribbean 97 192 265 851 920 823 926 1,110 1,216 1,726 1,360 1,454 1,560 1,604
Subtotal 36 51 55 68 65 54 73 81 86 88 120 259 362 452 953 1,038 978 1,100 1,286 1,383 1,938 1,586 1,887 2,022 2,047
Total 130 164 194 224 219 268 282 301 339 384 447 648 841 1,026 1,562 1,662 1,659 1,823 2,029 2,173 2,763 2,448 2,758 2,877 2,833
Transactions(inmillions)
ElectronicTransactions3 7.0 8.3 12.7 14.9 16.1 18.0 23.9 28.6 33.2 43.0 56.6 78.0 111.2 130.5 159.4 199.5 206.0 236.6 255.7 568.5 625.9 690.2 772.7 849.4 804.1
ItemsProcessed 123.8 134.0 139.1 159.8 161.9 164.0 166.1 170.4 171.8 174.5 175.0 173.7 171.9 170.9 171.0 160.2 149.9 145.3 138.5 133.9 140.3 150.0 175.2 202.2 191.7
Employees(full-timeequivalent) 4,314 4,400 4,699 5,131 5,213 7,023 7,006 7,024 7,533 7,606 7,815 7,996 8,854 10,549 11,501 10,651 11,334 11,037 11,474 12,139 13,210 12,508 12,303 10,587 9,407
1 Per common share data adjusted for stock splits.2 Does not include host-to-host ATMs (2,478 in 2009) which are neither owned nor driven, but are part of the ATH® Network. 3 From 1981 to 2003, electronic transactions include ACH, Direct Payment, TelePago, Internet Banking and ATH® Network transactions in Puerto Rico. Since 2004, these numbers were adjusted to include ATH® Network transactions in the Dominican Republic, Costa Rica, El Salvador and United States, health care transactions, wire transfers, and other electronic payment transactions in addition to those previously stated.
9

our PeoPLe
The men and women who work for our institution, from the highest executive to the employees who handle the most routine tasks, feel a special pride in serving our customers with care and dedication. All of them feel the personal satisfaction of belonging to the “Banco Popular Family,” which fosters affection and understanding among its members, and which at the same time firmly complies with the highest ethical and moral standards of behavior.
These words by Don Rafael Carrión Jr.,
President and Chairman of the Board
(1956–1991), were written in 1988 to
commemorate the 95th anniversary of
Banco Popular de Puerto Rico, and reflect
our commitment to human resources.
our creed
Banco Popular is a local institution dedicating its efforts exclusively to the enhancement of the social and economic conditions in Puerto Rico and inspired by the most sound principles and fundamental practices of good banking.
Banco Popular pledges its efforts and resources to the development of a banking service for Puerto Rico within strict commercial practices and so efficient that it could meet the requirements of the most progressive community of the world.
These words, written in 1928 by Don Rafael
Carrión Pacheco, Executive Vice President
and President (1927–1956), embody the
philosophy of Popular, Inc. in all its markets.
executive oFFicerS
richard l. carrión chairman chief executive officer popular, inc.
David h. chafey Jr. president chief operating officer popular, inc.
Jorge a. Junquera senior executive vice president chief financial officer popular, inc.
brunilda santos de Álvarez, esq. executive vice president chief legal officer popular, inc.
amílcar Jordán executive vice president risk management popular, inc.
carlos J. vázquez executive vice president individual credit, u.s. community banking popular, inc.
elí sepúlveda executive vice president commercial credit popular, inc.
Board oF directorS
richard l. carrión chairman chief executive officer popular, inc.
alejandro m. ballester president ballester hermanos, inc.
maría luisa ferré president and chief executive officer grupo ferré rangel
michael masin private investor
manuel morales Jr. president parkview realty, inc.
frederic v. salerno private investor
william J. teuber Jr. vice chairman emc corporation
carlos a. unanue president goya de puerto rico, inc.
José r. vizcarrondo president and chief executive officer Desarrollos metropolitanos, s.e.
samuel t. céspedes, esq. secretary of the board of Directors popular, inc.
corPorate inFormation
independent registered public accounting firm pricewaterhousecoopers llp
annual meeting the 2010 annual stockholders’ meeting of popular, inc. will be held on tuesday, may 4, at 9:00 a.m. at centro europa building in san Juan, puerto rico.
additional information the annual report to the securities and exchange commission on form 10-k and any other financial information may also be viewed by visiting our website:
www.popular.com
corPorate Information
1 0 P o P u l a r , I n c . 2 0 0 9 a n n u a l r e P o r t

carta a nueStroSAccionistas
Las instituciones financieras, en general, confrontaron una serie
de retos difíciles en el 2009; entre ellos cabe destacar la recesión
económica, el deterioro continuo en la calidad de crédito y las
nuevas regulaciones para los componentes de capital. Reflejando el ambiente económico y crediticio difícil, Popular informó una pérdida neta de $574 millones en el 2009, comparado con una pérdida neta de $1,200 millones en el 2008. Nuestro precio por acción se impactó negativamente, cerrando el año en $2.26, comparado con $5.16 en el 2008.
a pesar De estos retos, alcanzamos varios logros
significativos en el 2009. mantuvimos nuestro enfoque
en tomar Distintas acciones Difíciles pero necesarias
para encaminar a popular nuevamente hacia la
rentabiliDaD y proveer valor a largo plazo para
nuestros accionistas.
Entre las iniciativas más notables que tomamos en el 2009 se destacan un aumento significativo en la proporción de capital básico conocido como “Tier 1” de la Corporación a niveles por encima de lo recomendado por los reguladores, una mejoría en la administración de riesgo crediticio y una contracción sustancial en nuestras operaciones en los Estados Unidos continentales, donde seguimos reduciendo nuestros activos y nuestra presencia.
Estas acciones estuvieron acompañadas de esfuerzos enérgicos para reducir gastos. Los esfuerzos incluyeron, entre otras medidas, la congelación del plan de pensiones y la suspensión del pareo de aportaciones en todos los planes de ahorros. Durante el año, los gastos de personal disminuyeron 12% y el número total de empleados se redujo 11%.
amBiente económico y crediticiodurante el año fiscal 2009, la economía de Puerto rico sufrió
una contracción de 3.7%. La tasa de desempleo llegó a cerca del 15% y el mercado de bienes raíces siguió inestable, debido al exceso de oferta de unidades de vivienda y una menor actividad económica. Aunque entendemos que la recesión continuará durante el 2010, algunos indicadores muestran señales de estabilización. La tasa de desempleo ha dado señales de una leve mejora en los últimos meses y el flujo de fondos de estímulo federal podría ayudar a cambiar las tendencias bajistas.
En Estados Unidos, la tasa de desempleo permanece alrededor del 10% y el valor de bienes raíces continúa descendiendo, aunque a niveles más lentos en algunos lugares. A pesar de señales de mejoría en la economía durante la segunda mitad del 2009, es poco probable que se vean cambios en la calidad del crédito hasta que no mejoren los niveles de empleo.
El ambiente económico siguió impactando la calidad de crédito en toda la industria de servicios financieros. El volumen de préstamos morosos y de pérdidas en préstamos se encuentra en los niveles más altos desde que las instituciones aseguradas comenzaron a informarlos a la FDIC en 1984. Ante la incertidumbre que vemos en Puerto Rico y en Estados Unidos, continuaremos siendo cautelosos en nuestras proyecciones hasta que no se vean señales claras de una recuperación económica.
Los activos no acumulativos ascendieron a $2,400 millones, o 6.91% del total de activos, comparados con $1,300 millones y 3.32%, respectivamente, en el 2008. Las pérdidas netas en préstamos aumentaron de $600 millones en 2008 a $1,000 millones en el 2009. Como resultado, la provisión para pérdidas en préstamos llegó a $1,400 millones en el 2009, que representa un aumento del 42% ante el 2008.
eStructura de caPitaLante la inestabilidad evidenciada en los mercados de crédito
y financieros y la erosión de capital que resultó de las grandes
pérdidas que sufrieron muchos bancos, la reserva Federal
implantó su Programa de Supervisión de requerimientos de
capital (ScaP, por sus siglas en inglés) en el 2009, para determinar
el monto de capital que necesitarían las principales compañías
tenedoras de acciones bancarias para amortiguar pérdidas
mayores de las esperadas en el caso de un escenario crediticio
más desfavorable del anticipado. Los reguladores identificaron el capital común como el componente predominante en el capital básico Tier 1 establecieron como guía una proporción mínima de 4% de activos comunes Tier 1 ajustados por riesgo para determinar las necesidades de capital.
Aún cuando no fuimos una de las instituciones que se incluyeron en SCAP, tomamos varias medidas para aumentar la proporción de capital común por encima de las nuevas normas. Como resultado, la proporción de capital común (Tier 1) de la Corporación, que era de 2.45% antes de estas medidas, subió a 6.39% para el 31 de diciembre de 2009. Todas las otras proporciones de capital se mantienen por encima del mínimo reglamentario para niveles “bien capitalizados”.
1 1

Compromiso SocialEstamos comprometidos a trabajar activamente para promover el bienestar social y económico de las comunidades que servimos.
ClienteLogramos la satisfacción y lealtad de nuestros clientes añadiéndole valor a cada interacción. La relación con nuestro cliente está por encima de una transacción particular.
valores
Tomamos la decisión difícil de suspender los dividendos de las acciones comunes y de las acciones preferidas Series A y B. También hicimos una oferta para intercambiar las acciones preferidas Series A y B, así como valores fiduciarios preferidos (“Trust Preferred Securities”) por nuevas acciones comunes. Las acciones redimidas sumaron $934 millones y se emitieron aproximadamente 357.5 millones de acciones. También completamos el intercambio de todas las $935 millones de acciones de la Serie C de acciones preferidas en poder del Tesoro de Estados Unidos, por $935 millones de una nueva emisión de valores fiduciarios preferidos. Estas transacciones generaron más de $1,400 millones de capital básico común (Tier 1) que se desglosa en $920 millones como resultado del intercambio de acciones preferidas y $485 millones como resultado del intercambio de las acciones del Tesoro de Estados Unidos, que representan la diferencia entre el valor en los libros de las acciones preferidas y el justo valor estimado de los nuevos valores fiduciarios preferidos.
Banco PoPuLar de Puerto ricoBanco Popular de Puerto rico, que incluye las operaciones del
banco y de sus subsidiarias especializadas en hipotecas, préstamos
para autos, corretaje y seguros, informó un ingreso neto de
$170 millones en 2009, comparado con $239 millones en el 2008. Los resultados se afectaron por un aumento de $105 millones en la provisión de pérdidas de préstamos y por una reducción de $92 millones en ingreso neto por intereses, debido a un rendimiento menor en activos que devengan intereses resultante de un aumento en los préstamos morosos y un ambiente de tasas de interés más bajas. El promedio de activos que generan intereses se redujo, principalmente debido a menores volúmenes de inversiones y préstamos, parcialmente debido a una reducción en la originación de préstamos y mayores niveles de pérdidas en préstamos. Estos factores negativos fueron parcialmente compensados con un aumento de $157 millones en ganancias por la venta de valores. El enfoque continuo que le hemos dado a la reducción de costos resultó en menores gastos en las áreas de recursos humanos, gastos de promoción y tecnología. Sin embargo, un aumento en los gastos de seguro de depósitos por parte del FDIC resultó en un total de gastos mayor en el 2009, comparado con el año anterior.
la caliDaD De créDito sigue sienDo el factor crítico
que afecta la rentabiliDaD De nuestras operaciones
De servicios financieros en puerto rico. las pérDiDas
netas en préstamos alcanzaron $512 millones en el 2009,
un aumento De 46% ante el año anterior. las pérDiDas
se concentraron en las carteras De préstamos De
construcciÓn y comerciales, como refleJo Del ambiente
econÓmico en general y De un exceso De oferta en
el mercaDo resiDencial. en estas Áreas, banco popular
tomÓ varias meDiDas para maneJar la caliDaD De
créDito De manera proactiva e intensa.
Todas las funciones de crédito en el Grupo de Banca Comercial se transfirieron de los oficiales de relación a un grupo de analistas responsable de evaluar los préstamos y dar recomendaciones a los oficiales de crédito. También implementamos un sistema de revisiones mensuales de las carteras de préstamos comerciales y de construcción más cuantiosas, para identificar cualquier problema potencial tempranamente y tomar las acciones necesarias.
En la cartera de construcción, nos hemos enfocado en trabajar con los desarrolladores para proveerles información sobre el mercado y apoyo en el área de mercadeo y ventas. En julio, Popular Mortgage lanzó una oferta especial para unidades de vivienda en proyectos financiados por Banco Popular. Como resultado de estos esfuerzos, la venta de unidades de vivienda en nuestros proyectos aumentó 40% entre la primera y la segunda mitad del año.
El área de crédito al consumidor siguió manejando el proceso de suscripción de manera que se minimizara el riesgo e implementó el uso de herramientas más sofisticadas para darle prioridad a los esfuerzos de cobro. Reforzamos nuestros servicios para trabajar con clientes con dificultades financieras, duplicando nuestros esfuerzos en el área de mitigación de pérdidas.
En un intento por apoyar a nuestros clientes y a la población en general, Banco Popular lanzó un programa de educación financiera. Distintos seminarios se llevaron a cabo en las sucursales del Banco Popular y en varios centros comerciales en toda la isla, con temas tales como la preparación de
carta a nueStroS Accionistas
1 2 P o P u l a r , I n c . 2 0 0 9 I n f o r m e a n u a l
Institucionales

presupuestos para el hogar, la administración de ahorros y crédito, comunicación con acreedores y el manejo de una bancarrota potencial.
A pesar de los retos que enfrentamos en la actualidad, la capacidad de Banco Popular para generar ingresos sigue siendo sólida. Esto debe traducirse en buenos niveles de rentabilidad una vez que la situación relacionada con la calidad de crédito en nuestro mercado principal se normalice. Con aproximadamente 1.4 millones de clientes, Banco Popular es la principal institución bancaria en la isla, en donde el 80% de los usuarios de servicios bancarios tiene una relación con Popular. La institución tiene tres veces el volumen de depósitos, número de clientes, sucursales y cajeros automáticos que su principal competidor en cada una de esas categorías y tres veces la participación de mercado en el área de depósitos. Su sólido reconocimiento de marca es siete veces mayor que el de su competidor más cercano y sobrepasa el reconocimiento de todas las marcas locales.
Nuestra meta sigue siendo la de trabajar con nuestros clientes para buscar alternativas de beneficio mutuo para poder navegar en esta economía difícil, así como ofrecer productos y servicios de calidad para nuestra amplia base de clientes, como lo hemos hecho durante más de un siglo de existencia.
Banco PoPuLar north americaen estados unidos, el deterioro en la calidad de crédito impulsó
las pérdidas en las operaciones de Banco Popular north america
(“BPna”). Estas operaciones incluyen los depósitos y la cartera restante de E-LOAN. BPNA reportó una pérdida neta de $726 millones, comparada con una pérdida neta de $525 millones en el 2008. La provisión para pérdidas en préstamos llegó a $782 millones, un aumento de 66% ante el año anterior. Los préstamos cargados a pérdidas ascendieron a $515 millones, comparados con $248 millones en 2008. Las carteras de préstamos comerciales, construcción, hipotecarios y préstamos sobre el valor neto de la propiedad de E-LOAN se impactaron principalmente por la recesión económica en Estados Unidos, así como por la inestabilidad en el mercado de bienes raíces.
La gerencia logró completar varios proyectos de reestructuración en el 2009–esbozados en un plan abarcador anunciado en el 2008–, para redirigir las operaciones de BPNA y enfocarlo en su negocio medular. Como Presidente de BPNA y Principal Oficial de Operaciones de Popular, Inc.,
David H. Chafey, Jr. asumió la responsabilidad de integrar las operaciones del banco en Estados Unidos y en Puerto Rico bajo un mismo grupo gerencial, logrando así mayores eficiencias y obteniendo mayor control sobre los esfuerzos de reestructuración en Estados Unidos.
En el 2009, de acuerdo a lo proyectado en nuestro plan, nos salimos de, o redujimos, los negocios de generación de activos que no tenían una relación directa con nuestro negocio bancario principal, o cuya capacidad de generar ganancias estaba siendo impactada severamente por las condiciones del mercado. Como parte de este esfuerzo, vendimos los activos de Popular Equipment Finance, nuestra unidad de arrendamiento de equipo en Estados Unidos. La combinación de todas estas iniciativas resultó en una reducción aproximada de $1,300 millones en préstamos al compararlos con el 2008. Cerramos, vendimos o consolidamos un total de 38 sucursales de baja productividad, terminando el año con una red de 101 sucursales. Logramos transferir el resto de las operaciones de E-LOAN, es decir, los depósitos en línea y la transferencia de solicitudes de préstamos a terceros, a BPNA y EVERTEC. El total de la plantilla laboral en nuestras operaciones en los Estados Unidos se redujo por casi 900 empleados, o el 40% de la fuerza laboral.
los esfuerzos De reestructuraciÓn que hicimos
en el 2009 son parte De un proceso abarcaDor
que comenzÓ en el 2007 para reDucir nuestras
operaciones en estaDos uniDos.
Este proceso incluye medidas importantes, tales como la descontinuación de las operaciones de préstamos “subprime” al por mayor, la venta de los activos de Equity One a American General Financial, la venta de activos de Popular Financial Holdings (“PFH”) a afiliadas de Goldman Sachs, la suspensión de las operaciones de préstamos de E-LOAN y la reducción sustancial en las áreas de apoyo administrativo de BPNA, utilizando la infraestructura que tenemos disponible en Puerto Rico. El número de empleados en las operaciones en Estados Unidos, incluyendo PFH, disminuyó de su nivel más alto de 4,800 en el 2005, a 1,400 en el 2009, lo que representa una reducción del 71%. A su vez, el número de oficinas se redujo a aproximadamente una tercera parte de lo que era anteriormente.
con aproximaDamente 1.4 millones De clientes, banco popular es la principal instituciÓn bancaria en la isla,
en DonDe el 80% De los usuarios De servicios bancarios tiene una relaciÓn con popular. la instituciÓn tiene tres
veces el número De clientes, sucursales y caJeros automÁticos que su principal competiDor en caDa una De esas
categorías, y tres veces la participaciÓn De mercaDo en el Área De DepÓsitos.
IntegridadNos desempeñamos bajo las normas más estrictas de ética, integridad y moral. La confianza que nuestros clientes nos depositan es lo más importante.
ExcelenciaCreemos que sólo hay una forma de hacer las cosas: bien hechas.
InnovaciónFomentamos la búsqueda incesante de nuevas soluciones como estrategia para realzar nuestra ventaja competitiva.
Nuestra GenteNos esforzamos por atraer, desarrollar, recompensar y retener al mejor talento dentro de un ambiente de trabajo que se caracteriza por el cariño y la disciplina.
RendimientoNuestra meta es obtener resultados financieros altos y consistentes para nuestros accionistas fundamentados en una visión a largo plazo.
1 3

Los activos en Estados Unidos se han reducido de $22,000 millones al cierre de 2006 a $11,000 millones al cierre de 2009, y la proporción de éstos en el total de activos de Popular se ha reducido, del 46% en 2006 a 32% en el 2009.
Como resultado de esas acciones, por dolorosas que fuesen, BPNA es ahora un banco comunitario con presencia en Florida, Nueva York, Nueva Jersey, Illinois y California, enfocado en servir a sus clientes individuales y comerciales con productos y servicios de calidad. Seguiremos trabajando incansablemente para maximizar el potencial de estas operaciones y llegar a niveles adecuados de rentabilidad. Nuestra meta sigue siendo capturar el valor de nuestra operación en Estados Unidos, como una fuente de ingreso adicional y diversificado para beneficio de todo Popular.
evertecevertec, nuestra compañía de tecnología de información
y procesamiento de datos, reportó un ingreso neto de
$50 millones en el 2009, comparado con $44 millones en
el 2008. Aunque EVERTEC no ha estado inmune a los efectos de la recesión económica de Puerto Rico, su principal fuente de negocio logró mantener niveles similares de ingresos a los que obtuvo en 2008. Esto, sumado a una reducción significativa en sus gastos operacionales, aumentó su contribución neta a Popular en el 2009.
la reD ath tuvo un año excelente, tanto en el alto
volumen De transacciones como en el Desarrollo De
varios proDuctos innovaDores.
Latinoamérica sigue creciendo como parte importante del negocio de EVERTEC. En el 2009 seguimos nuestra expansión en México, donde inauguramos operaciones en el 2008, y entramos al mercado de Panamá. También estamos ampliando nuestra oferta de productos en estos países, logrando apalancar la amplia variedad de productos que proveemos en Puerto Rico.
Estos servicios, que incluyen el procesamiento de datos de negocio de terceros, servicios de creación de redes, soluciones de recursos humanos, desarrollo de aplicaciones y consultoría, han convertido a EVERTEC en un suplidor completo de tecnología informática. EVERTEC tiene oficinas en nueve países, sirve a clientes en 16 países, y continúa siendo una fuente de ingresos sólida y diversificada para Popular.
nueStra Gentenuestros logros en el 2009 son significativos, especialmente ante
el ambiente actual del mercado. no hubiesen sido posibles sin la
dedicación y el empeño de nuestro equipo gerencial y nuestros
empleados, así como el apoyo y la dirección de nuestra Junta de
directores.
Después de haber servido por dos décadas como miembros de nuestra Junta, Juan J. Bermúdez y Francisco J. Rexach, Jr. se retiraron. Echaremos de menos su visión y asesoramiento. Nos complace darle la bienvenida a Alejandro M. Ballester y a Carlos A. Unanue. El Sr. Ballester es Presidente de Ballester Hermanos, un importante distribuidor de alimentos, vinos y licores en Puerto Rico, y el Sr. Unanue es Presidente de Goya de Puerto Rico, parte de Goya Foods, la principal compañía hispana de alimentos en los Estados Unidos. Ambos son profesionales comprobados, que le añadirán valor y experiencia a nuestra Junta y ayudarán a dirigir a esta gran organización hacia el futuro.
Popular cuenta con 9,400 empleados altamente comprometidos con la institución; tienen un nivel de satisfacción de empleados que se compara con, o está por encima de, otras organizaciones reconocidas como los mejores lugares en donde trabajar. A ellos, les extiendo mi más sentido agradecimiento.
Quisiera reconocer el trabajo de Emilio E. Piñero, quien después de haberle dedicado 39 años a nuestra organización, ha decidido acogerse a un retiro muy merecido.
Es con profunda tristeza que informo el fallecimiento de Brunilda Santos de Álvarez, Principal Oficial Legal, quien recientemente se había retirado por razones de salud luego de más de dos décadas de servicio en Popular. Personalmente, extrañaré su combinación de sabiduría y sentido común, su fortaleza y gentileza, las cuales tuve el privilegio de disfrutar durante los tiempos más interesantes, al igual que en los más difíciles. Sé que también será extrañada por todo el grupo gerencial y sus compañeros de trabajo. Su legado siempre vivirá en nuestros valores institucionales, los cuales representaba tan bien, y en la generación de profesionales de Popular a los que ella tocó.
Nuestra organización tiene una historia de 116 años; cada vez que ha confrontado retos tan difíciles como los que enfrentamos hoy, ha salido fortalecida. Confío en que, con el mismo espíritu que nos ha guiado a lo largo de nuestra historia y con el apoyo continuo de todos los que formamos esta organización, sobrepasaremos los retos que vivimos actualmente y posicionaremos a Popular en un camino de rentabilidad y prosperidad para el futuro.
Muchas gracias por su apoyo.
richard L. carrión
Presidente de la Junta de directores y Principal oficial ejecutivo
1 4 P o P u l a r , I n c . 2 0 0 9 I n f o r m e a n u a l
carta a nueStroS Accionistas

1 5
Cifras y Datos Clave de 2009PuntoS PrinciPaLeS
1 Al 31/12/09 2 Al 30/9/09
ne
Go
cio
Ba
nc
ar
ioP
oP
uL
ar
, inc
.n
eG
oc
io d
e P
ro
ce
Sa
mie
nt
o
PoPuLar, inc.
• Trigésima octava (38) compañía bancaria en Estados Unidos, con $34,700 millones en
activos y 9,400 empleados
Puntos Principales, 2009
• Generó más de $1,400 millones de capital básico común “Tier 1”, en una serie de transacciones
de intercambio
• Continuó la restructuración de sus operaciones en los Estados Unidos continentales,
ya fuera con la venta o cierre de negocios no rentables, y reduciendo el número de
sucursales, de 139 a 101
• Reestructuramos las divisiones de crédito de la Corporación al relocalizar a los oficiales
de crédito de mayor experiencia y transferir las funciones de crédito de los oficiales de
relación a un grupo especial de analistas responsable de evaluar los préstamos y hacer
recomendaciones
Banco PoPuLar Puerto rico
• Aproximadamente 1.4 millones clientes
• 181 sucursales y 51 oficinas a través de Puerto Rico y las Islas Vírgenes
• 6,066 empleados a tiempo completo1
• 588 cajeros electrónicos y 26,508 puntos de venta a través de Puerto Rico y las Islas Vírgenes
• Primer lugar en el mercado en depósitos totales (35.0%)2 y total de préstamos (21.8%)2
• $23,600 millones en activos, $15,100 millones en préstamos y $17,800 millones en depósitos1
Banco PoPuLar north america
• Aproximadamente 422,000 clientes
• 101 sucursales en cinco estados: 41 en Nueva York y Nueva Jersey, 16 en Illinois,
20 en Florida y 24 en California
• 1,410 empleados a tiempo completo1
• E-LOAN captura $850 millones en depósitos1 y aproximadamente 39,400 clientes
• $10,800 millones en activos, $8,700 millones en préstamos y $8,300 millones en
depósitos totales1
evertec
• Principal procesador de cajeros automáticos y puntos de venta en el Caribe y Centroamérica
• 9 oficinas proveen servicios en 16 países
• 1,767 empleados a tiempo completo1
• Procesó más de 1,100 millones de transacciones1, de las que más de 565 millones
correspondían a la Red ATH®
• 5,069 cajeros automáticos y más de 133,461 puntos de venta a través de Estados Unidos
y Latinoamérica

Fundación Banco PoPuLar 30 Años
1 6 P o P u l a r , I n c . 2 0 0 9 I n f o r m e a n u a l
Banco Popular se honra de su legado de 116 años de servicio
a la comunidad. Fundación Banco Popular, el brazo filantrópico de Popular, se dedica a trabajar para mejorar la calidad de vida de las comunidades a las que servimos.
A través de nuestros valores y nuestras acciones, cada día nos retamos para llegar a los más altos niveles de responsabilidad social corporativa. Nuestro compromiso con la educación y el desarrollo comunitario a través de nuestros esfuerzos filantrópicos, y la participación activa de nuestros empleados, es sólido.
A treinta años de su establecimiento, la Fundación Banco Popular sigue nutriendo sus relaciones a largo plazo con organizaciones comunitarias de base, a la vez que fomenta el cambio positivo a través de iniciativas educativas y de desarrollo comunitario. De 1982 a 2009 nos honra haber apoyado a más de 250 organizaciones y haber contribuido con $21,147,866.
educación
creemos que la educación representa la piedra angular para
el futuro de una comunidad. La Fundación Banco Popular se ha enfocado en programas que buscan lograr una transformación en las escuelas, una educación alternativa y programas fuera de las horas escolares, tales como:• Capacitación de maestros• Prevención de deserción escolar• Programas fuera de horas escolares• Educación en las artes• Educación especial• Desarrollo de liderazgo• Servicios bibliotecarios comunitarios• Tutoría• Educación vocacional
a lo largo De sus 30 años De existencia, la funDaciÓn
banco popular ha creaDo siete fonDos Dotales para
becas en universiDaDes que proveen oportuniDaDes para
estuDiantes puertorriqueños. se han beneficiaDo De esas
becas 261 estuDiantes. el fonDo De becas rafael carriÓn,
Jr., para los hiJos De empleaDos De popular,
ha DistribuiDo 1,826 becas, que representan un total
De $2,678,841.
En los últimos años hemos vivido muchos retos y dificultades económicas. Ahora, más que nunca, seguimos trabajando hombro a hombro con nuestras comunidades para estimular su crecimiento económico, apoyar la educación y alentar las expresiones culturales.
deSarroLLo comunitario
La Fundación Banco Popular enfoca sus recursos en el
apoderamiento de comunidades e individuos, para ayudar
a impulsar el desarrollo económico. Fundación Banco Popular apoya proyectos dedicados a:• Autogestión comunitaria• Adiestramiento en gerencia• Apoyo comunitario para las escuelas• Prevención de uso de sustancias controladas• Prevención de embarazo en adolescentes y apoyo
para madres adolescentes
colegio de educación especial y rehabilitación integral (coDeri)
centro cultural y de servicios de cantera
la nueva escuela para puerto rico
corporación santo Domingo savio

30 Años
Nuestro compromiso social se expandió en el 2004 para incluir a las operaciones de Popular en los Estados Unidos. Las organizaciones que apoyan nuestros empleados se enfocan en las áreas de educación, vivienda, pequeños negocios y desarrollo comunitario. Durante los últimos cinco años la fundación ha distribuido $1,607,200 en donativos a 152 organizaciones en comunidades en las que trabajamos en Estados Unidos.
Servicio voLuntario de nueStroS emPLeadoS
cada año, nuestros empleados aportan miles de horas de trabajo
voluntario en iniciativas locales y nacionales. Más del 95% de las organizaciones sin fines de lucro que apoyamos tienen a un empleado de Popular como miembro activo de la organización.
El año pasado más de 3,000 empleados del Banco Popular, de Puerto Rico, California, Florida, Illinois, Nueva Jersey, Nueva York y las Islas Vírgenes, se juntaron con sus familias y amigos para servir como voluntarios en organizaciones e iniciativas locales durante el Día de Hacer la Diferencia.
los empleaDos De popular también hacen contribuciones
a la funDaciÓn banco popular o a banco popular
founDation. en el 2009, nuestros empleaDos
contribuyeron $692,759 a las Dos organizaciones.
DesDe el 2000, los empleaDos han contribuiDo mÁs De
$4.5 millones a ambas funDaciones.
Como elemento importante de nuestra cultura y lo que le ofrecemos a nuestras comunidades, el Banco también recalca el concepto de servicio. Aunque mucho ha cambiado a lo largo de los años, nuestro compromiso con la calidad del servicio sigue siendo igual.
en los últimos años hemos viviDo muchos retos y DificultaDes econÓmicas. ahora, mÁs que nunca,
seguimos trabaJanDo hombro a hombro con nuestras comuniDaDes para estimular su crecimiento
econÓmico, apoyar la eDucaciÓn y alentar las expresiones culturales.
1 7
tenemoS voz en eL deSarroLLo
Futuro de nueStra ciudad
la sala de exhibiciones rafael carrión pacheco,
un espacio cultural único en el edificio histórico del
banco popular en el viejo san Juan, ha contribuido
al enriquecimiento cultural de puerto rico por más
de 20 años. hemos organizado 16 exhibiciones en
este espacio, dedicadas a iniciativas para mejorar el
panorama urbano de puerto rico, ilustrar nuestra rica
herencia musical y deportiva, y adelantar la discusión de
necesidades de nuestro medio ambiente. la exhibición
actual, En Rieles, ha recibido a más de 41,000 visitantes;
muestra la transportación y el acceso hacia el viejo
san Juan, los retos de transportación que enfrentamos,
y propone soluciones viables utilizando una maqueta
interactiva de 38 pies a escala. el proyecto ha generado
un diálogo sostenido y ha propiciado la creación de un
plan público para establecer un tranvía para la cuidad.
Día De hacer la Diferencia 2009
escuela libre de música ernesto ramos antonini
0
200,000
400,000
600,000
800,000
1,000,000
1,200,000
1,400,000
1,600,000
1,800,000
$2,000,000
2009200419991994198919841979
0
10
20
30
40
50
60
70
80
90
100
TOTAL DE DONACIONES OTORGADAS (1979–2009)
Donaciones Organizaciones

(Dólares en millones, excepto información por acción) 1985 1986 1987 1988 1989 1990 1991 1992 1993 1994 1995 1996 1997 1998 1999 2000 2001 2002 2003 2004 2005 2006 2007 2008 2009
InformaciónFinancieraSeleccionada
IngresoNeto(PérdidaNeta) $ 32.9 $ 38.3 $ 38.3 $ 47.4 $ 56.3 $ 63.4 $ 64.6 $ 85.1 $ 109.4 $ 124.7 $ 146.4 $ 185.2 $ 209.6 $ 232.3 $ 257.6 $ 276.1 $ 304.5 $ 351.9 $ 470.9 $ 489.9 $ 540.7 $ 357.7 $ (64.5) $ (1,243.9) $ (573.9)
Activos 4,141.7 4,531.8 5,389.6 5,706.5 5,972.7 8,983.6 8,780.3 10,002.3 11,513.4 12,778.4 15,675.5 16,764.1 19,300.5 23,160.4 25,460.5 28,057.1 30,744.7 33,660.4 36,434.7 44,401.6 48,623.7 47,404.0 44,411.4 38,882.8 34,736.3
PréstamosNetos 1,715.7 2,271.0 2,768.5 3,096.3 3,320.6 5,373.3 5,195.6 5,252.1 6,346.9 7,781.3 8,677.5 9,779.0 11,376.6 13,078.8 14,907.8 16,057.1 18,168.6 19,582.1 22,602.2 28,742.3 31,710.2 32,736.9 29,911.0 26,276.1 23,803.9
Depósitos 3,365.3 3,820.2 4,491.6 4,715.8 4,926.3 7,422.7 7,207.1 8,038.7 8,522.7 9,012.4 9,876.7 10,763.3 11,749.6 13,672.2 14,173.7 14,804.9 16,370.0 17,614.7 18,097.8 20,593.2 22,638.0 24,438.3 28,334.4 27,550.2 25,924.9
CapitaldeAccionistas 226.4 283.1 308.2 341.9 383.0 588.9 631.8 752.1 834.2 1,002.4 1,141.7 1,262.5 1,503.1 1,709.1 1,661.0 1,993.6 2,272.8 2,410.9 2,754.4 3,104.6 3,449.2 3,620.3 3,581.9 3,268.4 2,538.8
ValorAgregadoenelMercado $ 216.0 $ 304.0 $ 260.0 $ 355.0 $ 430.1 $ 479.1 $ 579.0 $ 987.8 $ 1,014.7 $ 923.7 $ 1,276.8 $ 2,230.5 $ 3,350.3 $ 4,611.7 $ 3,790.2 $ 3,578.1 $ 3,965.4 $ 4,476.4 $ 5,960.2 $ 7,685.6 $ 5,836.5 $ 5,003.4 $ 2,968.3 $ 1,455.1 $ 1,445.4
RendimientodeActivos(ROA) 0.89% 0.88% 0.76% 0.85% 0.99% 1.09% 0.72% 0.89% 1.02% 1.02% 1.04% 1.14% 1.14% 1.14% 1.08% 1.04% 1.09% 1.11% 1.36% 1.23% 1.17% 0.74% -0.14% -3.04% -1.57%
RendimientodeCapital(ROE) 15.59% 15.12% 13.09% 14.87% 15.87% 15.55% 10.57% 12.72% 13.80% 13.80% 14.22% 16.17% 15.83% 15.41% 15.45% 15.00% 14.84% 16.29% 19.30% 17.60% 17.12% 9.73% -2.08% -44.47% -32.95%
PorAcciónComún1
IngresoNeto(PérdidaNeta)–Básico $ 0.23 $ 0.25 $ 0.24 $ 0.30 $ 0.35 $ 0.40 $ 0.27 $ 0.35 $ 0.42 $ 0.46 $ 0.53 $ 0.67 $ 0.75 $ 0.83 $ 0.92 $ 0.99 $ 1.09 $ 1.31 $ 1.74 $ 1.79 $ 1.98 $ 1.24 $ (0.27) $ (4.55) $ 0.24
IngresoNeto(PérdidaNeta)–Diluido $ 0.23 $ 0.25 $ 0.24 $ 0.30 $ 0.35 $ 0.40 $ 0.27 $ 0.35 $ 0.42 $ 0.46 $ 0.53 $ 0.67 $ 0.75 $ 0.83 $ 0.92 $ 0.99 $ 1.09 $ 1.31 $ 1.74 $ 1.79 $ 1.97 $ 1.24 $ (0.27) $ (4.55) $ 0.24
Dividendos(Declarados) 0.07 0.08 0.09 0.09 0.10 0.10 0.10 0.10 0.12 0.13 0.15 0.18 0.20 0.25 0.30 0.32 0.38 0.40 0.51 0.62 0.64 0.64 0.64 0.48 0.02
Valoren losLibros 1.54 1.73 1.89 2.10 2.35 2.46 2.63 2.88 3.19 3.44 3.96 4.40 5.19 5.93 5.76 6.96 7.97 9.10 9.66 10.95 11.82 12.32 12.12 6.33 3.89
PrecioenelMercado $ 1.50 $ 2.00 $ 1.67 $ 2.22 $ 2.69 $ 2.00 $ 2.41 $ 3.78 $ 3.88 $ 3.52 $ 4.85 $ 8.44 $ 12.38 $ 17.00 $ 13.97 $ 13.16 $ 14.54 $ 16.90 $ 22.43 $ 28.83 $ 21.15 $ 17.95 $ 10.60 $ 5.16 $ 2.26
ActivosporÁreaGeográfica
PuertoRico 92% 92% 94% 93% 92% 89% 87% 87% 79% 76% 75% 74% 74% 71% 71% 72% 68% 66% 62% 55% 53% 52% 59% 64% 65%
EstadosUnidos 7% 7% 5% 6% 6% 9% 11% 10% 16% 20% 21% 22% 23% 25% 25% 26% 30% 32% 36% 43% 45% 45% 38% 33% 32%
CaribeyLatinoamérica 1% 1% 1% 1% 2% 2% 2% 3% 5% 4% 4% 4% 3% 4% 4% 2% 2% 2% 2% 2% 2% 3% 3% 3% 3%
Total 100% 100% 100% 100% 100% 100% 100% 100% 100% 100% 100% 100% 100% 100% 100% 100% 100% 100% 100% 100% 100% 100% 100% 100% 100%
SistemadeDistribuciónTradicional
SucursalesBancarias
PuertoRico 115 124 126 126 128 173 161 162 165 166 166 178 201 198 199 199 196 195 193 192 194 191 196 179 173
IslasVírgenes 3 3 3 3 3 3 3 3 8 8 8 8 8 8 8 8 8 8 8 8 8 8 8 8 8
EstadosUnidos 9 9 9 10 10 24 24 30 32 34 40 44 63 89 91 95 96 96 97 128 136 142 147 139 101
Subtotal 127 136 138 139 141 200 188 195 205 208 214 230 272 295 298 302 300 299 298 328 338 341 351 326 282
OficinasNoBancarias
PopularFinancialHoldings 27 41 58 73 91 102 117 128 137 136 149 153 181 183 212 158 134 2
PopularCashExpress 51 102 132 154 195 129 114 4
PopularFinance 14 17 18 26 26 26 26 28 31 39 44 48 47 61 55 36 43 43 49 52 51 9
PopularAuto 4 9 9 9 8 10 9 8 10 10 12 12 20 18 18 18 17 15 12 12 10
PopularLeasing,U.S.A. 7 8 10 11 13 13 11 15 14 11 24 22
PopularMortgage 3 3 3 11 13 21 25 29 32 30 33 32 32 32 33
PopularSecurities 1 2 2 2 3 4 7 8 9 12 12 13 7 6
Popular Insurance 2 2 2 2 2 2 2 2 1 1
Popular InsuranceAgencyU.S.A. 1 1 1 1 1 1 1 1 1
Popular Insurance,V.I. 1 1 1 1 1 1 1 1
E-LOAN 1 1 1 1
EVERTEC 4 4 4 5 5 5 5 7 9 9 9
Subtotal 14 17 22 35 62 76 92 111 134 153 183 258 327 382 427 460 431 421 351 292 280 97 61
Total 127 136 152 156 163 235 250 271 297 319 348 383 455 553 625 684 727 759 729 749 689 633 631 423 343
SistemaElectrónicodeDistribución
CajerosAutomáticos2
PropiosyAdministrados
PuertoRico 94 113 136 153 151 211 206 211 234 262 281 327 391 421 442 478 524 539 557 568 583 605 615 605 571
Caribe 3 3 3 3 3 3 8 8 8 9 17 59 68 37 39 53 57 59 61 65 69 74 77
EstadosUnidos 6 11 26 38 53 71 94 99 109 118 131 129 163 181 192 187 176 138
Subtotal 94 113 139 156 154 214 209 220 253 296 327 389 479 574 609 624 681 723 743 790 825 862 871 855 786
Administrados
PuertoRico 36 51 55 68 65 54 73 81 86 88 120 162 170 187 102 118 155 174 176 167 212 226 433 462 443
Caribe 97 192 265 851 920 823 926 1,110 1,216 1,726 1,360 1,454 1,560 1,604
Subtotal 36 51 55 68 65 54 73 81 86 88 120 259 362 452 953 1,038 978 1,100 1,286 1,383 1,938 1,586 1,887 2,022 2,047
Total 130 164 194 224 219 268 282 301 339 384 447 648 841 1,026 1,562 1,662 1,659 1,823 2,029 2,173 2,763 2,448 2,758 2,877 2,833
Transacciones(enmillones)
TransaccionesElectrónicas3 7.0 8.3 12.7 14.9 16.1 18.0 23.9 28.6 33.2 43.0 56.6 78.0 111.2 130.5 159.4 199.5 206.0 236.6 255.7 568.5 625.9 690.2 772.7 849.4 804.1
EfectosProcesados 123.8 134.0 139.1 159.8 161.9 164.0 166.1 170.4 171.8 174.5 175.0 173.7 171.9 170.9 171.0 160.2 149.9 145.3 138.5 133.9 140.3 150.0 175.2 202.2 191.7
Empleados(equivalenteatiempocompleto) 4,314 4,400 4,699 5,131 5,213 7,023 7,006 7,024 7,533 7,606 7,815 7,996 8,854 10,549 11,501 10,651 11,334 11,037 11,474 12,139 13,210 12,508 12,303 10,587 9,407
1 8 P o P u l a r , I n c . 2 0 0 9 I n f o r m e a n u a l
Resumen Financiero Histórico25 añoS PoPuLar, inc.

(Dólares en millones, excepto información por acción) 1985 1986 1987 1988 1989 1990 1991 1992 1993 1994 1995 1996 1997 1998 1999 2000 2001 2002 2003 2004 2005 2006 2007 2008 2009
InformaciónFinancieraSeleccionada
IngresoNeto(PérdidaNeta) $ 32.9 $ 38.3 $ 38.3 $ 47.4 $ 56.3 $ 63.4 $ 64.6 $ 85.1 $ 109.4 $ 124.7 $ 146.4 $ 185.2 $ 209.6 $ 232.3 $ 257.6 $ 276.1 $ 304.5 $ 351.9 $ 470.9 $ 489.9 $ 540.7 $ 357.7 $ (64.5) $ (1,243.9) $ (573.9)
Activos 4,141.7 4,531.8 5,389.6 5,706.5 5,972.7 8,983.6 8,780.3 10,002.3 11,513.4 12,778.4 15,675.5 16,764.1 19,300.5 23,160.4 25,460.5 28,057.1 30,744.7 33,660.4 36,434.7 44,401.6 48,623.7 47,404.0 44,411.4 38,882.8 34,736.3
PréstamosNetos 1,715.7 2,271.0 2,768.5 3,096.3 3,320.6 5,373.3 5,195.6 5,252.1 6,346.9 7,781.3 8,677.5 9,779.0 11,376.6 13,078.8 14,907.8 16,057.1 18,168.6 19,582.1 22,602.2 28,742.3 31,710.2 32,736.9 29,911.0 26,276.1 23,803.9
Depósitos 3,365.3 3,820.2 4,491.6 4,715.8 4,926.3 7,422.7 7,207.1 8,038.7 8,522.7 9,012.4 9,876.7 10,763.3 11,749.6 13,672.2 14,173.7 14,804.9 16,370.0 17,614.7 18,097.8 20,593.2 22,638.0 24,438.3 28,334.4 27,550.2 25,924.9
CapitaldeAccionistas 226.4 283.1 308.2 341.9 383.0 588.9 631.8 752.1 834.2 1,002.4 1,141.7 1,262.5 1,503.1 1,709.1 1,661.0 1,993.6 2,272.8 2,410.9 2,754.4 3,104.6 3,449.2 3,620.3 3,581.9 3,268.4 2,538.8
ValorAgregadoenelMercado $ 216.0 $ 304.0 $ 260.0 $ 355.0 $ 430.1 $ 479.1 $ 579.0 $ 987.8 $ 1,014.7 $ 923.7 $ 1,276.8 $ 2,230.5 $ 3,350.3 $ 4,611.7 $ 3,790.2 $ 3,578.1 $ 3,965.4 $ 4,476.4 $ 5,960.2 $ 7,685.6 $ 5,836.5 $ 5,003.4 $ 2,968.3 $ 1,455.1 $ 1,445.4
RendimientodeActivos(ROA) 0.89% 0.88% 0.76% 0.85% 0.99% 1.09% 0.72% 0.89% 1.02% 1.02% 1.04% 1.14% 1.14% 1.14% 1.08% 1.04% 1.09% 1.11% 1.36% 1.23% 1.17% 0.74% -0.14% -3.04% -1.57%
RendimientodeCapital(ROE) 15.59% 15.12% 13.09% 14.87% 15.87% 15.55% 10.57% 12.72% 13.80% 13.80% 14.22% 16.17% 15.83% 15.41% 15.45% 15.00% 14.84% 16.29% 19.30% 17.60% 17.12% 9.73% -2.08% -44.47% -32.95%
PorAcciónComún1
IngresoNeto(PérdidaNeta)–Básico $ 0.23 $ 0.25 $ 0.24 $ 0.30 $ 0.35 $ 0.40 $ 0.27 $ 0.35 $ 0.42 $ 0.46 $ 0.53 $ 0.67 $ 0.75 $ 0.83 $ 0.92 $ 0.99 $ 1.09 $ 1.31 $ 1.74 $ 1.79 $ 1.98 $ 1.24 $ (0.27) $ (4.55) $ 0.24
IngresoNeto(PérdidaNeta)–Diluido $ 0.23 $ 0.25 $ 0.24 $ 0.30 $ 0.35 $ 0.40 $ 0.27 $ 0.35 $ 0.42 $ 0.46 $ 0.53 $ 0.67 $ 0.75 $ 0.83 $ 0.92 $ 0.99 $ 1.09 $ 1.31 $ 1.74 $ 1.79 $ 1.97 $ 1.24 $ (0.27) $ (4.55) $ 0.24
Dividendos(Declarados) 0.07 0.08 0.09 0.09 0.10 0.10 0.10 0.10 0.12 0.13 0.15 0.18 0.20 0.25 0.30 0.32 0.38 0.40 0.51 0.62 0.64 0.64 0.64 0.48 0.02
Valoren losLibros 1.54 1.73 1.89 2.10 2.35 2.46 2.63 2.88 3.19 3.44 3.96 4.40 5.19 5.93 5.76 6.96 7.97 9.10 9.66 10.95 11.82 12.32 12.12 6.33 3.89
PrecioenelMercado $ 1.50 $ 2.00 $ 1.67 $ 2.22 $ 2.69 $ 2.00 $ 2.41 $ 3.78 $ 3.88 $ 3.52 $ 4.85 $ 8.44 $ 12.38 $ 17.00 $ 13.97 $ 13.16 $ 14.54 $ 16.90 $ 22.43 $ 28.83 $ 21.15 $ 17.95 $ 10.60 $ 5.16 $ 2.26
ActivosporÁreaGeográfica
PuertoRico 92% 92% 94% 93% 92% 89% 87% 87% 79% 76% 75% 74% 74% 71% 71% 72% 68% 66% 62% 55% 53% 52% 59% 64% 65%
EstadosUnidos 7% 7% 5% 6% 6% 9% 11% 10% 16% 20% 21% 22% 23% 25% 25% 26% 30% 32% 36% 43% 45% 45% 38% 33% 32%
CaribeyLatinoamérica 1% 1% 1% 1% 2% 2% 2% 3% 5% 4% 4% 4% 3% 4% 4% 2% 2% 2% 2% 2% 2% 3% 3% 3% 3%
Total 100% 100% 100% 100% 100% 100% 100% 100% 100% 100% 100% 100% 100% 100% 100% 100% 100% 100% 100% 100% 100% 100% 100% 100% 100%
SistemadeDistribuciónTradicional
SucursalesBancarias
PuertoRico 115 124 126 126 128 173 161 162 165 166 166 178 201 198 199 199 196 195 193 192 194 191 196 179 173
IslasVírgenes 3 3 3 3 3 3 3 3 8 8 8 8 8 8 8 8 8 8 8 8 8 8 8 8 8
EstadosUnidos 9 9 9 10 10 24 24 30 32 34 40 44 63 89 91 95 96 96 97 128 136 142 147 139 101
Subtotal 127 136 138 139 141 200 188 195 205 208 214 230 272 295 298 302 300 299 298 328 338 341 351 326 282
OficinasNoBancarias
PopularFinancialHoldings 27 41 58 73 91 102 117 128 137 136 149 153 181 183 212 158 134 2
PopularCashExpress 51 102 132 154 195 129 114 4
PopularFinance 14 17 18 26 26 26 26 28 31 39 44 48 47 61 55 36 43 43 49 52 51 9
PopularAuto 4 9 9 9 8 10 9 8 10 10 12 12 20 18 18 18 17 15 12 12 10
PopularLeasing,U.S.A. 7 8 10 11 13 13 11 15 14 11 24 22
PopularMortgage 3 3 3 11 13 21 25 29 32 30 33 32 32 32 33
PopularSecurities 1 2 2 2 3 4 7 8 9 12 12 13 7 6
Popular Insurance 2 2 2 2 2 2 2 2 1 1
Popular InsuranceAgencyU.S.A. 1 1 1 1 1 1 1 1 1
Popular Insurance,V.I. 1 1 1 1 1 1 1 1
E-LOAN 1 1 1 1
EVERTEC 4 4 4 5 5 5 5 7 9 9 9
Subtotal 14 17 22 35 62 76 92 111 134 153 183 258 327 382 427 460 431 421 351 292 280 97 61
Total 127 136 152 156 163 235 250 271 297 319 348 383 455 553 625 684 727 759 729 749 689 633 631 423 343
SistemaElectrónicodeDistribución
CajerosAutomáticos2
PropiosyAdministrados
PuertoRico 94 113 136 153 151 211 206 211 234 262 281 327 391 421 442 478 524 539 557 568 583 605 615 605 571
Caribe 3 3 3 3 3 3 8 8 8 9 17 59 68 37 39 53 57 59 61 65 69 74 77
EstadosUnidos 6 11 26 38 53 71 94 99 109 118 131 129 163 181 192 187 176 138
Subtotal 94 113 139 156 154 214 209 220 253 296 327 389 479 574 609 624 681 723 743 790 825 862 871 855 786
Administrados
PuertoRico 36 51 55 68 65 54 73 81 86 88 120 162 170 187 102 118 155 174 176 167 212 226 433 462 443
Caribe 97 192 265 851 920 823 926 1,110 1,216 1,726 1,360 1,454 1,560 1,604
Subtotal 36 51 55 68 65 54 73 81 86 88 120 259 362 452 953 1,038 978 1,100 1,286 1,383 1,938 1,586 1,887 2,022 2,047
Total 130 164 194 224 219 268 282 301 339 384 447 648 841 1,026 1,562 1,662 1,659 1,823 2,029 2,173 2,763 2,448 2,758 2,877 2,833
Transacciones(enmillones)
TransaccionesElectrónicas3 7.0 8.3 12.7 14.9 16.1 18.0 23.9 28.6 33.2 43.0 56.6 78.0 111.2 130.5 159.4 199.5 206.0 236.6 255.7 568.5 625.9 690.2 772.7 849.4 804.1
EfectosProcesados 123.8 134.0 139.1 159.8 161.9 164.0 166.1 170.4 171.8 174.5 175.0 173.7 171.9 170.9 171.0 160.2 149.9 145.3 138.5 133.9 140.3 150.0 175.2 202.2 191.7
Empleados(equivalenteatiempocompleto) 4,314 4,400 4,699 5,131 5,213 7,023 7,006 7,024 7,533 7,606 7,815 7,996 8,854 10,549 11,501 10,651 11,334 11,037 11,474 12,139 13,210 12,508 12,303 10,587 9,407
1 Datos ajustados por las divisiones en acciones.2 No incluyen cajeros automáticos que están conectados a la Red ATH® (2,478 en 2009) pero que son administrados por otras instituciones financieras.
3 Desde el 1981 hasta 2003, transacciones electrónicas incluyen transacciones ACH, Pago Directo, TelePago, Banca por Internet y transacciones por la Red ATH® en Puerto Rico. Desde 2004, estos números incluyen el total de transacciones por la Red ATH® en República Dominicana, Costa Rica, El Salvador y Estados Unidos, transacciones de facturación médica, transferencias cablegráficas y otros pagos electrónicos además de lo previamente señalado.
1 9

nueStra Gente
Los hombres y mujeres que laboran para nuestra institución, desde los más altos ejecutivos hasta los empleados que llevan a cabo las tareas más rutinarias, sienten un orgullo especial al servir a nuestra clientela con esmero y dedicación. Todos sienten la íntima satisfacción de pertenecer a la Gran “Familia del Banco Popular”, en la que se fomenta el cariño y la comprensión entre todos sus miembros, y en la que a la vez se cumple firmemente con las más estrictas reglas de conducta y de moral.
Estas palabras fueron escritas en 1988
por don Rafael Carrión, Jr., Presidente
y Presidente de la Junta de Directores,
(1956-1991), con motivo del 95 aniversario
del Banco Popular de Puerto Rico y son
muestra de nuestro compromiso con
nuestros recursos humanos.
nueStro credo
El Banco Popular es una institución genuinamente nativa dedicada exclusivamente a trabajar por el bienestar social y económico de Puerto Rico e inspirada en los principios más sanos y fundamentales de una buena práctica bancaria.
El Popular tiene empeñados sus esfuerzos y voluntad al desarrollo de un servicio bancario para Puerto Rico dentro de normas estrictamente comerciales tan eficiente como pueda requerir la comunidad más progresista del mundo.
Estas palabras, escritas en 1928 por don
Rafael Carrión Pacheco, Vicepresidente
Ejecutivo y Presidente (1927-1956),
representan el pensamiento que rige a
Popular, Inc. en todos sus mercados.
oFiciaLeS eJecutivoS
richard l. carrión presidente de la Junta de Directores principal oficial ejecutivo popular, inc.
David h. chafey, Jr. presidente principal oficial de operaciones popular, inc.
Jorge a. Junquera primer vicepresidente ejecutivo principal oficial financiero popular, inc.
lcda. brunilda santos de Álvarez vicepresidenta ejecutiva principal oficial legal popular, inc.
amílcar Jordán vicepresidente ejecutivo manejo de riesgo popular, inc.
carlos J. vázquez vicepresidente ejecutivo crédito a individuos, banca de la comunidad en los estados unidos popular, inc.
elí sepúlveda vicepresidente ejecutivo crédito comercial popular, inc.
Junta de directoreS
richard l. carrión presidente de la Junta de Directores principal oficial ejecutivo popular, inc.
alejandro m. ballester presidente ballester hermanos, inc.
maría luisa ferré presidenta y principal oficial ejecutiva grupo ferré rangel
michael masin inversionista privado
manuel morales, Jr. presidente parkview realty, inc.
frederic v. salerno inversionista privado
william J. teuber, Jr. vicepresidente ejecutivo emc corporation
carlos a. unanue presidente goya de puerto rico, inc.
José r. vizcarrondo presidente y principal oficial ejecutivo Desarrollos metropolitanos, s.e.
lcdo. samuel t. céspedes secretario de la Junta de Directores popular, inc.
inFormación corPorativa
firma registrada de contabilidad pública independiente pricewaterhousecoopers llp
reunión anual la reunión anual de accionistas del 2010 de popular, inc. se celebrará el martes, 4 de mayo, a las 9:00 a.m. en el edificio centro europa en san Juan, puerto rico.
información adicional el informe anual en la forma 10-k radicado con la comisión de valores e intercambio e información financiera adicional están disponibles visitando nuestra página de internet:
www.popular.com
inFormación Corporativa
2 0 P o P u l a r , I n c . 2 0 0 9 I n f o r m e a n u a l

Management’s Discussion and Analysis of Financial Condition and Results of Operations 3
Statistical Summaries 82
Financial Statements
Management’s Report to Stockholders 87
Report of Independent RegisteredPublic Accounting Firm 88
Consolidated Statements of Condition as of December 31, 2009 and 2008 90
Consolidated Statements of Operations for the years ended December 31, 2009,2008 and 2007 91
Consolidated Statements of Cash Flowsfor the years ended December 31, 2009, 2008 and 2007 92
Consolidated Statements of Changes in Stockholders’ Equity for the years endedDecember 31, 2009, 2008 and 2007 93
Consolidated Statements of Comprehensive(Loss) Income for the years ended December31, 2009, 2008 and 2007 94
Notes to Consolidated Financial Statements 95
Financial Review and Supplementary Information
BOA22177_wo18_Popular.indd 1 3/3/2010 10:46:48 AM

2 POPULAR, INC. 2009 ANNUAL REPORT
Forward-Looking Statements 3
Overview 3
Legislative and Regulatory Developments 6
Subsequent Events 10
Critical Accounting Policies / Estimates 10
Statement of Operations Analysis Net Interest Income 20 Provision for Loan Losses 21 Non-Interest Income 24 Operating Expenses 26 Income Taxes 29 Fourth Quarter Results 30
Reportable Segment Results 31
Discontinued Operations 35
Statement of Condition Analysis Assets 36 Deposits and Borrowings 39 Stockholders’ Equity 39
Exchange Offers 40
Regulatory Capital 42
Risk Management 44 Market / Interest Rate Risk 46 Liquidity 52 Credit Risk Management and Loan Quality 62 Operational Risk Management 73 Legal Proceedings 74
Adoption of New Accounting Standards and Issued But Not Yet Effective Accounting Standards 75
Glossary of Selected Financial Terms 79
Statistical Summaries Statements of Condition 82 Statements of Operations 83 Average Balance Sheet and Summary of Net Interest Income 84 Quarterly Financial Data 86
Management’s Discussion and Analysis of Financial Condition and Results of Operations
BOA22177_wo18_Popular.indd 2 3/3/2010 10:46:50 AM
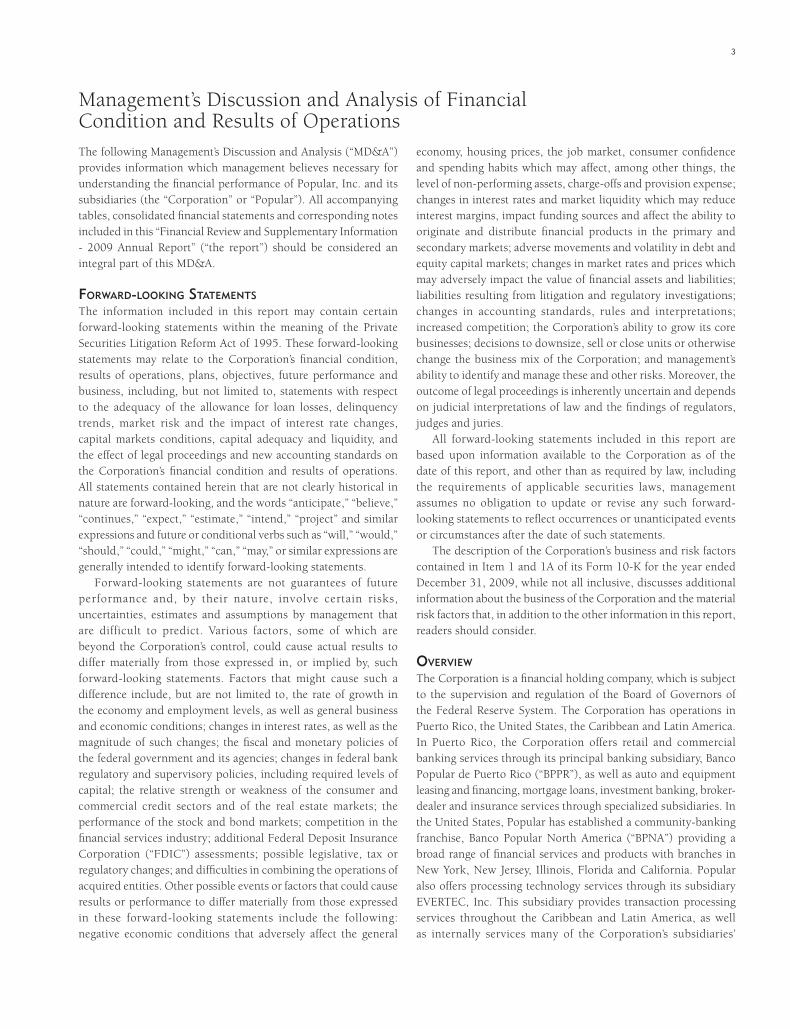
3
The following Management’s Discussion and Analysis (“MD&A”) provides information which management believes necessary for understanding the fi nancial performance of Popular, Inc. and its subsidiaries (the “Corporation” or “Popular”). All accompanying tables, consolidated fi nancial statements and corresponding notes included in this “Financial Review and Supplementary Information - 2009 Annual Report” (“the report”) should be considered an integral part of this MD&A.
FORWARD-LOOKING STATEMENTS
The information included in this report may contain certain forward-looking statements within the meaning of the Private Securities Litigation Reform Act of 1995. These forward-looking statements may relate to the Corporation’s fi nancial condition, results of operations, plans, objectives, future performance and business, including, but not limited to, statements with respect to the adequacy of the allowance for loan losses, delinquency trends, market risk and the impact of interest rate changes, capital markets conditions, capital adequacy and liquidity, and the effect of legal proceedings and new accounting standards on the Corporation’s fi nancial condition and results of operations. All statements contained herein that are not clearly historical in nature are forward-looking, and the words “anticipate,” “believe,” “continues,” “expect,” “estimate,” “intend,” “project” and similar expressions and future or conditional verbs such as “will,” “would,” “should,” “could,” “might,” “can,” “may,” or similar expressions are generally intended to identify forward-looking statements.
Forward-looking statements are not guarantees of future performance and, by their nature, involve certain risks, uncertainties, estimates and assumptions by management that are difficult to predict. Various factors, some of which are beyond the Corporation’s control, could cause actual results to differ materially from those expressed in, or implied by, such forward-looking statements. Factors that might cause such a difference include, but are not limited to, the rate of growth in the economy and employment levels, as well as general business and economic conditions; changes in interest rates, as well as the magnitude of such changes; the fi scal and monetary policies of the federal government and its agencies; changes in federal bank regulatory and supervisory policies, including required levels of capital; the relative strength or weakness of the consumer and commercial credit sectors and of the real estate markets; the performance of the stock and bond markets; competition in the fi nancial services industry; additional Federal Deposit Insurance Corporation (“FDIC”) assessments; possible legislative, tax or regulatory changes; and diffi culties in combining the operations of acquired entities. Other possible events or factors that could cause results or performance to differ materially from those expressed in these forward-looking statements include the following: negative economic conditions that adversely affect the general
economy, housing prices, the job market, consumer confi dence and spending habits which may affect, among other things, the level of non-performing assets, charge-offs and provision expense; changes in interest rates and market liquidity which may reduce interest margins, impact funding sources and affect the ability to originate and distribute fi nancial products in the primary and secondary markets; adverse movements and volatility in debt and equity capital markets; changes in market rates and prices which may adversely impact the value of fi nancial assets and liabilities; liabilities resulting from litigation and regulatory investigations; changes in accounting standards, rules and interpretations; increased competition; the Corporation’s ability to grow its core businesses; decisions to downsize, sell or close units or otherwise change the business mix of the Corporation; and management’s ability to identify and manage these and other risks. Moreover, the outcome of legal proceedings is inherently uncertain and depends on judicial interpretations of law and the fi ndings of regulators, judges and juries.
All forward-looking statements included in this report are based upon information available to the Corporation as of the date of this report, and other than as required by law, including the requirements of applicable securities laws, management assumes no obligation to update or revise any such forward-looking statements to refl ect occurrences or unanticipated events or circumstances after the date of such statements.
The description of the Corporation’s business and risk factors contained in Item 1 and 1A of its Form 10-K for the year ended December 31, 2009, while not all inclusive, discusses additional information about the business of the Corporation and the material risk factors that, in addition to the other information in this report, readers should consider.
OVERVIEW
The Corporation is a fi nancial holding company, which is subject to the supervision and regulation of the Board of Governors of the Federal Reserve System. The Corporation has operations in Puerto Rico, the United States, the Caribbean and Latin America. In Puerto Rico, the Corporation offers retail and commercial banking services through its principal banking subsidiary, Banco Popular de Puerto Rico (“BPPR”), as well as auto and equipment leasing and fi nancing, mortgage loans, investment banking, broker-dealer and insurance services through specialized subsidiaries. In the United States, Popular has established a community-banking franchise, Banco Popular North America (“BPNA”) providing a broad range of fi nancial services and products with branches in New York, New Jersey, Illinois, Florida and California. Popular also offers processing technology services through its subsidiary EVERTEC, Inc. This subsidiary provides transaction processing services throughout the Caribbean and Latin America, as well as internally services many of the Corporation’s subsidiaries’
Management’s Discussion and Analysis of Financial Condition and Results of Operations
BOA22177_wo18_Popular.indd 3 3/3/2010 10:46:50 AM

4 POPULAR, INC. 2009 ANNUAL REPORT
system infrastructures and transactional processing businesses. Note 39 to the consolidated fi nancial statements, as well as the Reportable Segments Results section in this MD&A, present further information about the Corporation’s business segments.
The Corporation reported a net loss of $573.9 million for the year ended December 31, 2009, compared with a net loss of $1.2 billion for the year ended December 31, 2008 and a net loss of $64.5 million for the year ended December 31, 2007. During 2008, the Corporation discontinued the operations of its consumer and mortgage lending subsidiary in the United States mainland. The Corporation’s net loss from continuing operations amounted to $553.9 million for the year ended December 31, 2009, compared with a net loss of $680.5 million in 2008 and net income of $202.5 million in 2007.
The discussions that follow pertain to Popular, Inc.’s continuing operations, unless otherwise indicated. Refer to the Discontinued Operations section in this MD&A for details on the fi nancial results and major events of Popular Financial Holdings (“PFH”) for the years 2009, 2008 and 2007.
Financial results for 2009 continued to refl ect high levels in the provision for loan losses to maintain adequate reserve levels in a deteriorated credit environment. The provision for loan losses from continuing operations in 2009 totaled $1.4 billion, compared with $991 million in 2008 and $341 million in 2007. The allowance for loan losses to loans held-in-portfolio ratio was 5.32% at December 31, 2009, compared with 3.43% at December 31, 2008 and 1.96% at December 31, 2007. The higher provision for loan losses was driven mostly by depressed economic conditions in Puerto Rico and the United States which has resulted in higher loan net charge-offs, non-performing loans and foreclosures, and a real estate market impacted by declining property values, oversupply in certain areas, and reduced absorption rates. The higher net loss in 2009 was also driven by a reduction of $178.0 million in net interest income, principally as a result of lower average volume of loans, elevated levels of non-performing loans, declining asset yields in a lower interest rate scenario and higher cost of long-term debt.
Furthermore, financial results for 2009 were favorably impacted by a $469.8 million reduction in income tax expense when compared with 2008, principally as a result of the valuation allowance on the Corporation’s deferred tax assets related to the U.S. operations recorded during the previous year. Refer to the Income Taxes section in this MD&A for further information. Also, operating expenses declined by $182.5 million, principally refl ecting a favorable impact of $80.3 million resulting from the gain on the early extinguishment of debt related to the exchange of trust preferred securities for common stock recognized in the third quarter of 2009, lower restructuring costs and the impact of cost-cutting measures, which include headcount reduction, partially offset by higher FDIC insurance assessments. Non-interest income
amounted to $896.5 million for the year ended December 31, 2009, compared with $830.0 million for the year ended December 31, 2008. The increase in non-interest income was principally due to higher gains on the sale of investment securities in 2009.
During 2009, the Corporation’s financial performance continued to be under pressure as a result of continued recessionary conditions in Puerto Rico and the United States. The economic pressure, capital and credit markets turmoil, and tightening of credit have led to an increased level of commercial and consumer delinquencies, lack of consumer confi dence, increased market volatility and widespread reduction of business activity in general. The resulting economic pressure on consumers and lack of confi dence in the fi nancial markets has adversely affected the fi nancial services industry and the Corporation’s fi nancial condition and results of operations, as well as its capital position. Disrupted market conditions have also increased the Corporation’s liquidity risk exposure due primarily to increased risk aversion on the part of traditional credit providers, as well as the material declines in the Corporation’s credit ratings that occurred during 2009. Refer to the Risk Management section in this MD&A for further information.
During 2009, the Corporation carried out a series of actions designed to improve its U.S. operations, address credit quality, contain controllable costs, maintain well-capitalized ratios and improve capital and liquidity positions. These actions included the following:
• Sale or closing of unprofitable businesses and the consolidation of branches in the United States and Puerto Rico markets, resulting in a net reduction of 44 branches. During 2009, the Corporation continued to make progress in the restructuring of its U.S. operations. As part of the BPNA Restructuring Plan, the Corporation determined to exit certain businesses including, among the principal ones, those related to the origination of non-conventional mortgages, equipment lease fi nancing, business loans to professionals, multifamily lending, mixed-used commercial loans and credit cards. The Corporation holds the existing portfolios of the exited businesses in a run-off mode. Also, the Corporation downsized the following businesses related to its U.S. mainland banking operations: business banking, Small Business Administration (“SBA”) lending, and consumer / mortgage lending. Furthermore, the Corporation divested its U.S. equipment-fi nance business (Popular Equipment Finance) to reduce risk exposure. In the United States, the Corporation also exited subprime mortgage lending and shut-down the E-LOAN and home equity lines of credit origination channels. These efforts began in late 2008. The Corporation completed the integration of both banking subsidiaries, BPPR and BPNA, under one management structure. As a result, the divisions of retail banking and commercial banking, in addition to
BOA22177_wo18_Popular.indd 4 3/3/2010 10:46:50 AM

5
administrative and operational personnel, at BPNA, are now reporting to management in Puerto Rico. Also, in October
2009, BPNA sold six of its New Jersey branches.
• Implementation of cost-cutting measures such as the hiring and pension plan freezes and the suspension of matching contributions to retirement plans.
• Restructuring of the Corporation’s credit divisions, working with clients to fi nd individual solutions and heightening the focus on collection processes.
• Suspension of dividends on its common stock and preferred stock.
• Restructuring of the investment securities portfolio by selling $3.4 billion of its investment securities available-for-sale portfolio, principally of U.S. agency securities (FHLB notes) and invested $2.9 billion of the proceeds, primarily in Government National Mortgage Association (“GNMA”) mortgage-backed securities. This sale resulted in a gain of $182.7 million. Other positive impacts of the sale were the strengthening of common equity by realizing an unrealized gain that was subject to market risk, if bond prices were to decline; increase the Corporation’s regulatory capital ratios; redeploy most of the proceeds in securities with a risk weighting of 0% for regulatory capital purposes, as compared to the 20% risk-weighting which applied to the FHLB notes sold; and mitigate the impact of the portfolio’s restructuring on net interest income, by reinvesting most of the sale proceeds in a higher-yielding asset class.
• Completion of an exchange offer which resulted in the issuance of over 357 million in new shares of common stock in exchange for preferred stock and trust preferred securities during the third quarter of 2009. This exchange contributed with an increase in common stockholders’ equity of $923 million, which included $612.4 million in newly issued common stock and surplus and $310.6 million favorable impact to accumulated defi cit, including $80.3 million in gains on the early extinguishment of junior subordinated debentures that were related to the trust preferred securities. In connection with the abovementioned exchange offer, the Corporation also agreed with the U.S. Treasury to exchange all $935 million of its outstanding shares of Series C preferred stock of the Corporation for $935 million of newly issued trust preferred securities. The transaction with the U.S. Treasury settled on August 24, 2009 and resulted in a favorable impact to accumulated defi cit of $485.3 million.
The aforementioned exchanges resulted in total additions of $1.4 billion to Tier 1 common equity. The Corporation’s Tier 1 common to risk-weighted assets ratio increased from 2.45% at June 30, 2009 to 6.39% at December 31, 2009.
See the Regulatory Capital section in this MD&A for a reconciliation of Tier 1 common to common stockholders’ equity and a discussion of the use of this non-GAAP fi nancial measure in this report. Refer to the Exchange Offer section in this MD&A for a more detailed description of the above transactions.
The following table provides a reconciliation of net income (loss) per common share (“EPS”) for the year ended December 31, 2009 and depicts the favorable impact that the exchanges had on EPS.
Table - Net Income per Common Share(In thousands, except per share information) 2009Net loss from continuing operations ($553,947)Net loss from discontinued operations (19,972)Preferred stock dividends (39,857)Preferred stock discount accretion (4,515) Favorable impact from exchange of shares of Series A and B preferred stock for common stock, net of issuance costs 230,388Favorable impact from exchange of Series C preferred stock for trust preferred securities 485,280Net income applicable to common stock $97,377
Average common shares outstanding 408,229,498Average potential common shares -Average common shares outstanding - assuming dilution 408,229,498
Basic and diluted EPS from continuing operations $0.29Basic and diluted EPS from discontinued operations (0.05)Total basic and diluted income per common share $0.24
Table A presents a fi ve-year summary of the components of net income (loss) as a percentage of average total assets. Table B presents the changes in net income (loss) applicable to common stock and income (loss) per common share for the last three years. In addition, Table C provides selected fi nancial data for the past fi ve years. A glossary of selected fi nancial terms has been included at the end of this MD&A.
Total assets at December 31, 2009 amounted to $34.7 billion, a decrease of $4.1 billion, or 11%, compared with December 31, 2008. Total earning assets at December 31, 2009 decreased by $3.8 billion, or 11%, compared with December 31, 2008. The decline in total assets, when compared to the previous year, was principally due to a decrease in loans held-in-portfolio of $2.0 billion, or 8%, and a decrease in the portfolio of investment securities available-for-sale and held-to-maturity of $1.3 billion, or 16%. The Corporation has strengthened its underwriting standards and ensured appropriate pricing for its loans. As a result of this challenging fi nancial environment and management’s decision to exit selected businesses on the United States mainland, the Corporation has experienced a reduction in the volume of loans. The decline in the Corporation’s investment securities available-
BOA22177_wo18_Popular.indd 5 3/3/2010 10:46:50 AM

6 POPULAR, INC. 2009 ANNUAL REPORT
for-sale and held-to-maturity portfolios, when compared to the previous year, was mainly driven by the sale and maturities of investment securities. The related proceeds were not fully reinvested as part of a strategy to deleverage the balance sheet. For detailed information on lending and investing activities, refer to the Statement of Condition Analysis and the Credit Risk Management and Loan Quality sections of this MD&A.
At December 31, 2009, assets were funded principally through deposits, primarily time deposits; supporting approximately 75% of the asset base; while borrowings, other liabilities and stockholders’ equity accounted for approximately 25%. This compares to 71% and 29% at December 31, 2008, respectively. For additional data on funding sources, refer to the Statement of Condition Analysis and Liquidity sections of this MD&A.
Stockholders’ equity totaled $2.5 billion at December 31, 2009, compared with $3.3 billion at December 31, 2008. The reduction in stockholders’ equity from the end of 2008 to December 31, 2009 was principally due to the net loss for the current year of $573.9 million.
At December 31, 2009, the Corporation was well-capitalized under the regulatory framework. Refer to Table I of this report for information on capital adequacy data, including regulatory capital ratios.
The shares of the Corporation’s common stock are traded on the National Association of Securities Dealers Automated Quotations (“NASDAQ”) system under the symbol BPOP. Table J shows the Corporation’s common stock performance on a quarterly
basis during the last fi ve years, including market prices and cash dividends declared.
Further discussions of operating results, fi nancial condition and business risks are presented in the narrative and tables included herein.
LEGISLATIVE AND REGULATORY DEVELOPMENTS
FDIC Rule Regarding AssessmentsMarket developments have signifi cantly depleted the insurance fund of the FDIC and reduced the ratio of reserves to insured deposits. As a result, we may be required to pay signifi cantly increased premiums or additional special assessments. In 2009, we paid $16.7 million for a special industry-wide FDIC deposit insurance assessment. Also, on November 12, 2009, the FDIC Board approved a fi nal rule requiring banks to prepay their estimated quarterly assessments for the fourth quarter of 2009, as well as, for the years 2010, 2011, and 2012. In December 2009, the Corporation prepaid $221 million, which includes all of its quarterly assessments, typically paid one quarter in arrears, for the calendar quarters ending December 31, 2009 through December 31, 2012. Each quarter, the FDIC will bill banks for the actual risk-based premium for that quarter; such amounts will reduce the prepaid asset. Once the asset is exhausted, banks will resume paying and accounting for quarterly deposit insurance assessments as they did prior to the implementation of this rule. The FDIC decided that if the prepayment is not exhausted by June 30, 2013, any remaining amount will be returned to the banks.
Table AComponents of Net (Loss) Income as a Percentage of Average Total Assets Year ended December 31, 2009 2008 2007 2006 2005
Net interest income 3.01% 3.13% 2.77% 2.60% 2.64%Provision for loan losses (3.84) (2.42) (0.72) (0.39) (0.26)Sales and valuation adjustments of investment securities 0.60 0.17 0.21 0.04 0.14(Loss) gain on sale of loans, including adjustments to indemnity reserves, and valuation adjustments on loans held-for-sale (0.10) 0.01 0.13 0.16 0.08Trading account profi t 0.11 0.11 0.08 0.08 0.07Other non-interest income 1.84 1.74 1.43 1.32 1.29 1.62 2.74 3.90 3.81 3.96Operating expenses (3.16) (3.27) (3.28) (2.65) (2.51)(Loss) income from continuing operations before income tax and cumulative effect of accounting change (1.54) (0.53) 0.62 1.16 1.45Income tax benefi t (expense) 0.02 (1.13) (0.19) (0.29) (0.31)Cumulative effect of accounting change, net of tax - - - - 0.01(Loss) income from continuing operations (1.52) (1.66) 0.43 0.87 1.15(Loss) income from discontinued operations, net of tax (0.05) (1.38) (0.57) (0.13) 0.02Net (loss) income (1.57%) (3.04%) (0.14%) 0.74% 1.17%
BOA22177_wo18_Popular.indd 6 3/3/2010 10:46:50 AM

7
Table BChanges in Net Income (Loss) Applicable to Common Stock and Net Income (Loss) per Common Share
2009 2008 2007(In thousands, except per common share amounts) Dollars Per share Dollars Per share Dollars Per share
Net (loss) income applicable to common stock for prior year ($1,279,200) ($4.55) ($76,406) ($0.27) $345,763 $1.24Favorable (unfavorable) changes in: Net interest income (177,951) (0.63) (26,454) (0.10) 50,927 0.18 Provision for loan losses (414,423) (1.47) (650,165) (2.33) (153,663) (0.55) Sales and valuation adjustments of investment securities 149,830 0.53 (31,153) (0.11) 78,749 0.28 Trading account profi t (3,905) (0.01) 6,448 0.02 939 - Sales of loans, including adjustments to indemnity reserves, and valuation adjustments on loans held-for-sale (41,078) (0.15) (54,028) (0.19) (16,291) (0.06) Other non-interest income (38,320) (0.14) 35,012 0.13 39,789 0.14 Gain on early extinguishment of debt 78,300 0.28 - - - - Impairment losses on long-lived assets 11,946 0.04 (3,013) (0.01) (10,478) (0.04) Goodwill and trademark impairment losses 12,480 0.04 199,270 0.71 (211,750) (0.76) Amortization of intangibles 2,027 0.01 (1,064) - 1,576 0.01 All other operating expenses 77,779 0.28 13,541 0.05 (46,579) (0.16) Income tax 469,836 1.67 (371,370) (1.33) 49,530 0.18Change in (loss) income from continuing operations (1,152,679) (4.10) (959,382) (3.43) 128,512 0.46Change in loss from discontinued operations, net of income tax 543,463 1.93 (296,434) (1.06) (204,918) (0.73)Net loss before preferred stock dividends, TARP preferred stock discount accretion, favorable impact from exchange of shares of Series A, B, and C preferred stock, and change in average common shares (609,216) (2.17) (1,255,816) (4.49) (76,406) (0.27)Change in preferred stock dividends and in TARP preferred stock discount accretion (9,075) (0.03) (23,384) (0.08) - -Change in favorable impact from exchange of shares of Series A and B preferred stock for common stock, net of issuance costs (Refer to Note 21) 230,388 0.82 - - - -Change in favorable impact from exchange of shares of Series C preferred stock to trust preferred securities (Refer to Note 21) 485,280 1.73 - - - -Change in average common shares** - (0.11) - 0.02 - -
Net income (loss) applicable to common stock $97,377 $0.24 ($1,279,200) ($4.55) ($76,406) ($0.27)** Refl ects the effect of the shares repurchased, plus the shares issued through the Dividend Reinvestment Plan and the subscription rights offering, and the effect of stock options exercised in the years presented. The year 2009 refl ects the effect of the issuance of 357,510,076 shares of common stock in exchange for its Series A and B preferred stock and for the trust preferred securities.
Additionally, in January 2010, the FDIC issued an Advance Notice of Proposed Rulemaking seeking comment on ways that the FDIC’s risk-based deposit insurance assessment system could be changed
to account for the risks posed by certain employee compensation programs. Rulemaking as a result of this review could result in further assessments.
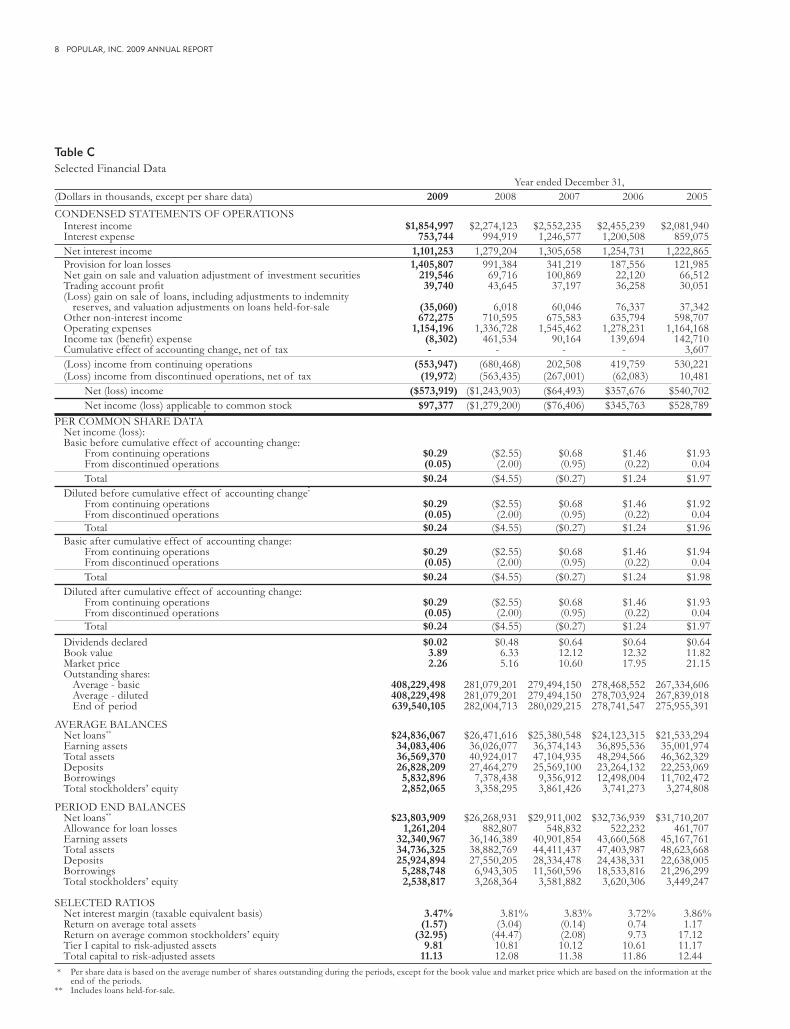
8 POPULAR, INC. 2009 ANNUAL REPORT
Table CSelected Financial Data Year ended December 31,(Dollars in thousands, except per share data) 2009 2008 2007 2006 2005CONDENSED STATEMENTS OF OPERATIONS Interest income $1,854,997 $2,274,123 $2,552,235 $2,455,239 $2,081,940 Interest expense 753,744 994,919 1,246,577 1,200,508 859,075 Net interest income 1,101,253 1,279,204 1,305,658 1,254,731 1,222,865 Provision for loan losses 1,405,807 991,384 341,219 187,556 121,985 Net gain on sale and valuation adjustment of investment securities 219,546 69,716 100,869 22,120 66,512 Trading account profi t 39,740 43,645 37,197 36,258 30,051 (Loss) gain on sale of loans, including adjustments to indemnity reserves, and valuation adjustments on loans held-for-sale (35,060) 6,018 60,046 76,337 37,342 Other non-interest income 672,275 710,595 675,583 635,794 598,707 Operating expenses 1,154,196 1,336,728 1,545,462 1,278,231 1,164,168 Income tax (benefi t) expense (8,302) 461,534 90,164 139,694 142,710 Cumulative effect of accounting change, net of tax - - - - 3,607 (Loss) income from continuing operations (553,947) (680,468) 202,508 419,759 530,221 (Loss) income from discontinued operations, net of tax (19,972) (563,435) (267,001) (62,083) 10,481 Net (loss) income ($573,919) ($1,243,903) ($64,493) $357,676 $540,702
Net income (loss) applicable to common stock $97,377 ($1,279,200) ($76,406) $345,763 $528,789
PER COMMON SHARE DATA*
Net income (loss): Basic before cumulative effect of accounting change: From continuing operations $0.29 ($2.55) $0.68 $1.46 $1.93 From discontinued operations (0.05) (2.00) (0.95) (0.22) 0.04 Total $0.24 ($4.55) ($0.27) $1.24 $1.97 Diluted before cumulative effect of accounting change: From continuing operations $0.29 ($2.55) $0.68 $1.46 $1.92 From discontinued operations (0.05) (2.00) (0.95) (0.22) 0.04 Total $0.24 ($4.55) ($0.27) $1.24 $1.96 Basic after cumulative effect of accounting change: From continuing operations $0.29 ($2.55) $0.68 $1.46 $1.94 From discontinued operations (0.05) (2.00) (0.95) (0.22) 0.04 Total $0.24 ($4.55) ($0.27) $1.24 $1.98 Diluted after cumulative effect of accounting change: From continuing operations $0.29 ($2.55) $0.68 $1.46 $1.93 From discontinued operations (0.05) (2.00) (0.95) (0.22) 0.04 Total $0.24 ($4.55) ($0.27) $1.24 $1.97 Dividends declared $0.02 $0.48 $0.64 $0.64 $0.64 Book value 3.89 6.33 12.12 12.32 11.82 Market price 2.26 5.16 10.60 17.95 21.15 Outstanding shares: Average - basic 408,229,498 281,079,201 279,494,150 278,468,552 267,334,606 Average - diluted 408,229,498 281,079,201 279,494,150 278,703,924 267,839,018 End of period 639,540,105 282,004,713 280,029,215 278,741,547 275,955,391
AVERAGE BALANCES Net loans** $24,836,067 $26,471,616 $25,380,548 $24,123,315 $21,533,294 Earning assets 34,083,406 36,026,077 36,374,143 36,895,536 35,001,974 Total assets 36,569,370 40,924,017 47,104,935 48,294,566 46,362,329 Deposits 26,828,209 27,464,279 25,569,100 23,264,132 22,253,069 Borrowings 5,832,896 7,378,438 9,356,912 12,498,004 11,702,472 Total stockholders’ equity 2,852,065 3,358,295 3,861,426 3,741,273 3,274,808
PERIOD END BALANCES Net loans** $23,803,909 $26,268,931 $29,911,002 $32,736,939 $31,710,207 Allowance for loan losses 1,261,204 882,807 548,832 522,232 461,707 Earning assets 32,340,967 36,146,389 40,901,854 43,660,568 45,167,761 Total assets 34,736,325 38,882,769 44,411,437 47,403,987 48,623,668 Deposits 25,924,894 27,550,205 28,334,478 24,438,331 22,638,005 Borrowings 5,288,748 6,943,305 11,560,596 18,533,816 21,296,299 Total stockholders’ equity 2,538,817 3,268,364 3,581,882 3,620,306 3,449,247
SELECTED RATIOS Net interest margin (taxable equivalent basis) 3.47% 3.81% 3.83% 3.72% 3.86% Return on average total assets (1.57) (3.04) (0.14) 0.74 1.17 Return on average common stockholders’ equity (32.95) (44.47) (2.08) 9.73 17.12 Tier I capital to risk-adjusted assets 9.81 10.81 10.12 10.61 11.17 Total capital to risk-adjusted assets 11.13 12.08 11.38 11.86 12.44 * Per share data is based on the average number of shares outstanding during the periods, except for the book value and market price which are based on the information at the
end of the periods.** Includes loans held-for-sale.
BOA22177_wo18_Popular.indd 8 3/3/2010 10:46:50 AM
9
Financial Regulatory Reform Reacting to the financial crisis and proposals from the Administration, Congress is considering extensive changes to the laws regulating fi nancial services fi rms. In December 2009, the House of Representatives approved the “Wall Street Reform and Consumer Protection Act”. The Senate Banking Committee plans to consider a version of fi nancial regulatory reform legislation in February 2010.
The proposed legislation addresses risks to the economy and the payments system, especially those posed by large “systemically signifi cant” fi nancial fi rms, through a variety of measures, including regulatory oversight of nonbanking entities, increased capital requirements, enhanced authority to limit activities and growth, changes in supervisory authority, resolution authority for failed fi nancial fi rms, enhanced regulation of derivatives and asset-backed securities (e.g., requiring loan originators to retain at least 5% of the credit risk of securitized exposures), restrictions on executive compensation, and oversight of credit rating agencies. The House bill would establish a new independent Consumer Financial Protection Agency (“CFPA”) that would regulate consumer fi nancial services and products, including credit, savings and payment products to prevent “unfair, deceptive or abusive practices,” promote product “simplicity” and ensure “equal access” to fi nancial products. The CFPA would have sole rulemaking and interpretive authority under existing and future consumer fi nancial services laws and supervisory, examination and enforcement authority over institutions subject to its regulations. Proposals have also been put forward that would limit the ability of federal laws to preempt state and local law. The President has made the enactment of fi nancial reform legislation a priority, although there is signifi cant opposition to several components, including the creation of a CFPA. Passage of the House bill in its present form would have an adverse impact on the Corporation, but prospects for approval of the legislation, and the content of a fi nal bill are unclear.
Additionally, in January 2010, the Administration announced plans to propose a “Financial Crisis Responsibility Fee” over a ten-year period on large fi nancial fi rms to offset the cost of the U.S. Treasury’s Troubled Asset Relief Program. As currently outlined, the Corporation would not be subject to the fee because the size of the Corporation’s balance sheet does not exceed the $50 billion threshold established by the proposal. As proposed, beginning June 30, 2010 qualifying institutions would pay 15 basis points on total assets less Tier 1 capital and deposits. Whether the fee will be implemented, and how is uncertain.
Legislation Addressing Overdraft Programs and Credit Card Practices In November 2009, the Board of Governors of the Federal Reserve System promulgated a fi nal rule (the “Final Rule”), amending Regulation E, to require financial institutions to obtain an
accountholder’s consent prior to assessing any fees or charges in connection with the payment of any consumer overdraft for any ATM or one-time debit transaction. This move represents the latest in a series of actions by federal banking regulators and Congress to provide greater consumer protections (such as those provided by the recently enacted Credit Card Accountability Responsibility and Disclosure Act of 2009, referred herein as the “Credit CARD Act”). The Final Rule applies to all accounts subject to Regulation E, including payroll cards, and must be implemented no later than July 1, 2010. Under the Final Rule, a fi nancial institution may not assess a fee or charge on a consumer’s account for paying an ATM withdrawal or one-time debit card transaction pursuant to the institution’s overdraft service unless the institution: (i) provides the consumer with a notice explaining the overdraft service; (ii) provides a reasonable opportunity for the consumer to affi rmatively consent (opt-in) to the service for such transactions; (iii) obtains the consumer’s affi rmative consent, or opt-in, to the institution’s payment of ATM withdrawals or one-time debit card transactions pursuant to the institution’s overdraft service; and (iv) provides the consumer with written confi rmation of the consumer’s consent.
However, some members of Congress apparently understood that these requirements did not adequately address the issues associated with overdraft programs, thus leading to the introduction by the U.S. House and Senate of two substantially similar overdraft coverage bills intended to amend the Truth in Lending Act (collectively, the “Overdraft Acts”), which are currently pending in committee and, as further discussed below, contain provisions which are notably more restrictive than those of the Final Rule.
While the proposed Overdraft Acts contain initial notice and opt-in requirements which are substantially similar to those contained in the Final Rule, they go far beyond the scope of the Final Rule by imposing requirements such as the following: (i) limitation on the number of overdraft fees; (ii) limitation on the amount of overdraft fees; (iii) prohibition on processing manipulation (requires an institution to post transactions to a consumer’s account in such a manner which does not cause the consumer to incur otherwise avoidable overdraft fees); (iv) elimination of overdraft fees caused by “holds” (prohibits an institution from assessing an overdraft fee for paying an overdraft if the overdraft would not have occurred but for a hold placed on funds in the consumer’s account in connection with a debit card transaction which exceeds the actual dollar amount of the overdraft); (v) consumer warning prior to overdraft; and (vi) consumer notifi cation following overdraft.
If adopted in their current form, the Overdraft Acts would negatively impact the Corporation’s net interest income, service charges on deposit accounts and other credit and debit card fees.
In May 2009, the Credit CARD Act was enacted. The Credit CARD Act makes numerous changes to the Truth in Lending Act,
BOA22177_wo18_Popular.indd 9 3/3/2010 10:46:50 AM
10 POPULAR, INC. 2009 ANNUAL REPORT
affecting the marketing, underwriting, pricing, billing and other aspects of the consumer credit card business. Several provisions of the Credit CARD Act became effective in August 2009, but most of the requirements became effective in February 2010 and others will become effective in August 2010. Legislation has been proposed to accelerate the effective date of all of the Credit CARD Act provisions as soon as the legislation is enacted, but prospects for enactment are uncertain. The Credit CARD Act establishes certain provisions, such as those addressing limitations on interest rate increases, late and over-limit fees and payment allocation. The Credit CARD Act will negatively impact the Corporation’s net interest income, service charges on deposit accounts and other credit and debit card service fees.
SUBSEQUENT EVENTS
Management has evaluated the effects of subsequent events that have occurred subsequent to December 31, 2009. There are no material events that would require recognition or disclosure in the consolidated fi nancial statements for the year ended December 31, 2009.
CRITICAL ACCOUNTING POLICIES / ESTIMATES
The accounting and reporting policies followed by the Corporation and its subsidiaries conform with generally accepted accounting principles (“GAAP”) in the United States of America and general practices within the fi nancial services industry. The Corporation’s signifi cant accounting policies are described in detail in Note 1 to the consolidated fi nancial statements and should be read in conjunction with this section.
Critical accounting policies require management to make estimates and assumptions, which involve signifi cant judgment about the effect of matters that are inherently uncertain and that involve a high degree of subjectivity. These estimates are made under facts and circumstances at a point in time and changes in those facts and circumstances could produce actual results that differ from those estimates. The following MD&A section is a summary of what management considers the Corporation’s critical accounting policies / estimates.
Fair Value Measurement of Financial InstrumentsThe Corporation measures fair value as required by ASC Subtopic 820-10 “Fair Value Measurements and Disclosures”; which defi nes fair value as the exchange price that would be received for an asset or paid to transfer a liability (an exit price) in the principal or most advantageous market for the asset or liability in an orderly transaction between market participants on the measurement date. The Corporation currently measures at fair value on a recurring basis its trading assets, available-for-sale securities, derivatives and mortgage servicing rights. Occasionally, the Corporation may be required to record at fair value other assets on a nonrecurring
basis, such as loans held-for-sale, impaired loans held-in-portfolio that are collateral dependent and certain other assets. These nonrecurring fair value adjustments typically result from the application of lower of cost or fair value accounting or write-downs of individual assets.
As required by ASC Subtopic 820-10, the Corporation categorizes its assets and liabilities measured at fair value under the three-level hierarchy. The level within the hierarchy is based on whether the inputs to the valuation methodology used for the fair value measurement are observable. Observable inputs refl ect the assumptions market participants would use in pricing the asset or liability based on market data obtained from external sources. Unobservable inputs refl ect the Corporation’s estimates about assumptions that market participants would use in pricing the asset or liability based on the best information available. The hierarchy is broken down into three levels based on the reliability of inputs as follows:
• Level 1- Unadjusted quoted prices in active markets for identical assets or liabilities that the Corporation has the ability to access at the measurement date. No signifi cant degree of judgment for these valuations is needed, as they are based on quoted prices that are readily available in an active market.
• Level 2- Quoted prices other than those included in Level 1 that are observable either directly or indirectly. Level 2 inputs include quoted prices for similar assets or liabilities in active markets, quoted prices for identical or similar assets or liabilities in markets that are not active, and other inputs that are observable or that can be corroborated by observable market data for substantially the full term of the fi nancial instrument.
• Level 3- Unobservable inputs that are supported by little or no market activity and that are signifi cant to the fair value measurement of the fi nancial asset or liability. Unobservable inputs refl ect the Corporation’s own assumptions about what market participants would use to price the asset or liability, including assumptions about risk. The inputs are developed based on the best available information, which might include the Corporation’s own data, such as internally-developed models and discounted cash fl ow analyses.
The Corporation requires the use of observable inputs when available, in order to minimize the use of unobservable inputs to determine fair value. The amount of judgment involved in estimating the fair value of a fi nancial instrument depends upon the availability of quoted market prices or observable market parameters. In addition, it may be affected by other factors such as the type of instrument, the liquidity of the market for the instrument, transparency around the inputs to the valuation, as well as the contractual characteristics of the instrument.
BOA22177_wo18_Popular.indd 10 3/3/2010 10:46:50 AM

11
If listed prices or quotes are not available, the Corporation employs valuation models that primarily use market-based inputs including yield curves, interest rate curves, volatilities, credit curves, and discount, prepayment and delinquency rates, among other considerations. When market observable data is not available, the valuation of fi nancial instruments becomes more subjective and involves substantial judgment. The need to use unobservable inputs generally results from diminished observability of both actual trades and assumptions resulting from the lack of market liquidity for those types of loans or securities. When fair values are estimated based on modeling techniques such as discounted cash fl ow models, the Corporation uses assumptions such as interest rates, prepayment speeds, default rates, loss severity rates and discount rates. Valuation adjustments are limited to those necessary to ensure that the fi nancial instrument’s fair value is adequately representative of the price that would be received or paid in the marketplace.
Management believes that fair values are reasonable and consistent with the fair value measurement guidance based on the Corporation’s internal validation procedure and consistency of the processes followed, which include obtaining market quotes when possible or using valuation techniques that incorporate market-based inputs.
Refer to Note 36 to the consolidated fi nancial statements for information on the Corporation’s fair value measurement disclosures required by the standard. At December 31, 2009, approximately $7.0 billion, or 94%, of the assets measured at fair value on a recurring basis, used market-based or market-derived valuation inputs in their valuation methodology and, therefore, were classifi ed as Level 1 or Level 2. The majority of instruments measured at fair value are classifi ed as Level 2, including U.S. Treasury securities, obligations of U.S. Government sponsored entities, obligations of Puerto Rico, States and political subdivisions, most mortgage-backed securities (“MBS”) and collateralized mortgage obligations (“CMOs”), and derivative instruments. U.S. Treasury securities are valued based on yields that are interpolated from the constant maturity treasury curve. Obligations of U.S. Government sponsored entities are priced based on an active exchange market and on quoted prices for similar securities. Obligations of Puerto Rico, States and political subdivisions are valued based on trades, bid price or spread, two sided markets, quotes, benchmark curves, market data feeds, discount and capital rates and trustee reports. MBS and CMOs are priced based on a bond’s theoretical value from similar bonds defi ned by credit quality and market sector. Refer to the Derivatives section below for a description of the valuation techniques used to value these instruments. The Corporation uses prices from third-party pricing sources to measure the fair value of most of these fi nancial instruments. These prices are compared for reasonability with other sources and differences that
exceed a pre-established threshold are further validated to ensure compliance with the fair value measurement guidance. Validations may include comparisons with secondary pricing services, as well as corroborations with secondary broker quotes and relevant benchmark indices. Furthermore, the Corporation also reviews the fair value documentation provided by the third-party pricing services and validates an indicative sample of the inputs utilized by the third-party pricing services.
At December 31, 2009, the remaining 6% of assets measured at fair value on a recurring basis were classifi ed as Level 3 since their valuation methodology considered signifi cant unobservable inputs. The fi nancial assets measured as Level 3 mostly include tax exempt mortgage-backed securities guaranteed by GNMA and Federal National Mortgage Association (“FNMA”), and mortgage servicing rights (“MSRs”). Agency tax exempt mortgage-backed securities are priced using a local demand price matrix prepared from local dealer quotes and other local investments such as corporate securities, and local mutual funds priced by local dealers. MSRs, on the other hand, are priced internally using a discounted cash fl ow model which considers servicing fees, portfolio characteristics, prepayment assumptions, delinquency rates, late charges, other ancillary revenues, cost to service and other economic factors. Additionally, the Corporation reported $877 million of fi nancial assets that were measured at fair value on a nonrecurring basis at December 31, 2009, all of which were classifi ed as Level 3 in the hierarchy.
Commencing in January 2009, the Corporation adopted the provisions of fair value measurements and disclosures for nonfinancial assets, particularly impacting other real estate. Nonfi nancial assets reported under the guidelines of ASC 820-10 amounted to $65 million at December 31, 2009.
The fair value measurements and disclosures guidance in ASC Subtopic 820-10 also addresses measuring fair value in situations where markets are inactive and transactions are not orderly. Transactions or quoted prices for assets and liabilities may not be determinative of fair value when transactions are not orderly and thus may require adjustments to estimate fair value. Price quotes based on transactions that are not orderly should be given little, if any, weight in measuring fair value. Price quotes based upon transactions that are orderly shall be considered in determining fair value and the weight given is based on facts and circumstances. If suffi cient information is not available to determine if price quotes are based upon orderly transactions, less weight should be given to the price quote relative to other transactions that are known to be orderly.
The lack of liquidity is incorporated into the fair value measurement based on the type of asset measured and the valuation methodology used. An illiquid market is one in which little or no observable activity has occurred or one that lacks willing buyers or willing sellers. Discounted cash fl ow techniques incorporate
BOA22177_wo18_Popular.indd 11 3/3/2010 10:46:50 AM

12 POPULAR, INC. 2009 ANNUAL REPORT
forecasting of expected cash fl ows discounted at appropriate market discount rates to refl ect the lack of liquidity in the market which a market participant would consider. Broker quotes used for fair value measurements inherently refl ect any lack of liquidity in the market since they represent an exit price for the perspective of the market participants.
Financial assets that were fair valued using broker quotes amounted to $271 million at December 31, 2009, from which $264 million were Level 3 assets and $7 million were Level 2 assets. These assets consisted principally of tax-exempt agency mortgage-backed securities. Fair value for these securities is based on an internally-prepared matrix derived from an average of two indicative local broker quotes, and adjusted for additional inputs obtained from industry sources for FNMA tax-exempt mortgage-backed securities. The main input used in the matrix pricing is non-binding local broker quotes obtained from limited trade activity. Therefore, these securities are classifi ed as Level 3. To ensure fair value is consistent with ASC Subtopic 820-10, these prices are validated by reviewing the prices provided by the brokers to verify any discrepancies between quotes, testing matrix prices using the weighted average against the total pool price provided by the broker, assessing the spread between local tax-exempt mortgage-backed securities and the price of U.S. mortgage-backed securities for reasonability and validating inputs with external pricing service providers.
There were no significant changes in the Corporation’s valuation methodologies at December 31, 2009 when compared with December 31, 2008. Refer to Note 36 to the consolidated fi nancial statements for a description of the Corporation’s valuation methodologies used for the assets and liabilities measured at fair value at December 31, 2009.
Trading Account Securities and Investment Securities Available-for-Sale The majority of the values for trading account securities and investment securities available-for-sale are obtained from third-party pricing service providers and, as indicated earlier, are validated with alternate pricing sources when available. Securities not priced by a secondary pricing source are documented and validated internally according to their signifi cance to the Corporation’s fi nancial statements. Management has established materiality thresholds according to the investment class to monitor and investigate material deviations in prices obtained from the primary pricing service provider and the secondary pricing source used as support for the valuation results. During the year ended December 31, 2009, the Corporation did not adjust any prices obtained from pricing service providers or broker dealers.
Inputs are evaluated to ascertain that they consider current market conditions, including the relative liquidity of the market. When a market quote for a specifi c security is not available, the
pricing service provider generally uses observable data to derive an exit price for the instrument, such as benchmark yield curves and trade data for similar products. To the extent trading data is not available, the pricing service provider relies on specifi c information including dialogue with brokers, buy side clients, credit ratings, spreads to established benchmarks and transactions on similar securities, to draw correlations based on the characteristics of the evaluated instrument. If for any reason the pricing service provider cannot observe data required to feed its model, it discontinues pricing the instrument. During the year ended December 31, 2009, none of the Corporation’s investment securities were subject to pricing discontinuance by the pricing service providers. The pricing methodology and approach of our primary pricing service providers is concluded to be consistent with the fair value measurement guidance.
Furthermore, management assesses the fair value of its portfolio of investment securities at least on a quarterly basis, which includes analyzing changes in fair value that have resulted in losses that may be considered other-than-temporary. Factors considered include, for example, the nature of the investment, severity and duration of possible impairments, industry reports, sector credit ratings, economic environment, creditworthiness of the issuers and any guarantees.
Securities are classifi ed in the fair value hierarchy according to product type, characteristics and market liquidity. At the end of each quarter, management assesses the valuation hierarchy for each asset or liability measured. The fair value measurement analysis performed by the Corporation includes validation procedures and review of market changes, pricing methodology, assumption and level hierarchy changes, and evaluation of distressed transactions.
At December 31, 2009, the Corporation’s portfolio of trading and investment securities available-for-sale amounted to $7.2 billion and represented 97% of the Corporation’s assets from continuing operations measured at fair value on a recurring basis. As of December 31, 2009, net unrealized gains on the trading and available-for-sale investment securities portfolios approximated $20 million and $104 million, respectively. Fair values for most of the Corporation’s trading and investment securities available-for-sale are classifi ed as Level 2. Trading and investment securities available-for-sale classifi ed as Level 3, which are the securities that involved the highest degree of judgment, represent only 4% of the Corporation’s total portfolio of trading and investment securities available-for-sale.
Derivatives Derivatives, such as interest rate swaps, interest rate caps and index options, are traded in over-the-counter active markets. These derivatives are indexed to an observable interest rate benchmark, such as LIBOR or equity indexes, and are priced using an income approach based on present value and option
BOA22177_wo18_Popular.indd 12 3/3/2010 10:46:50 AM
13
pricing models using observable inputs. Other derivatives are liquid and have quoted prices, such as forward contracts or “to be announced” securities (“TBAs”). All of these derivatives held by the Corporation are classifi ed as Level 2. Valuations of derivative assets and liabilities refl ect the values associated with counterparty risk and nonperformance risk, respectively. The non-performance risk, which measures the Corporation’s own credit risk, is determined using internally-developed models that consider the net realizable value of the collateral posted, remaining term, and the creditworthiness or credit standing of the Corporation. The counterparty risk is also determined using internally-developed models which incorporate the creditworthiness of the entity that bears the risk, net realizable value of the collateral received, and available public data or internally-developed data to determine their probability of default. To manage the level of credit risk, the Corporation employs procedures for credit approval and credit limits, monitors the counterparty credit condition, enters into master netting agreements whenever possible and, when appropriate, request additional collateral. The Corporation assessed that the maximum exposure to a deterioration of the counterparty's credit is equal to the amount reported on the balance sheet as derivative asset reduced by the net realizable value of the collateral received. At December 31, 2009, this exposure is estimated to be $38 million. During the year ended December 31, 2009, inclusion of the credit risk in the fair value of the derivatives resulted in a net loss of $4.8 million recorded in the other operating income caption of the consolidated statement of operations, which consisted of a loss of $6.8 million resulting from the Corporation’s own credit standing adjustment and a gain of $2.0 million from the assessment of the counterparties’ credit risk.
Mortgage Servicing RightsMortgage servicing rights (“MSRs”), which amounted to $170 million at December 31, 2009, do not trade in an active, open market with readily observable prices. Fair value is estimated based upon discounted net cash fl ows calculated from a combination of loan level data and market assumptions. The valuation model combines loans with common characteristics that impact servicing cash fl ows (e.g., investor, remittance cycle, interest rate, product type, etc.) in order to project net cash fl ows. Market valuation assumptions include prepayment speeds, discount rate, cost to service, escrow account earnings, and contractual servicing fee income, among other considerations. Prepayment speeds are derived from market data that is more relevant to U.S. mainland loan portfolios and, thus, are adjusted for the Corporation’s loan characteristics and portfolio behavior since prepayment rates in Puerto Rico have been historically lower. Other assumptions are, in the most part, directly obtained from third-party providers. Disclosure of two of the key economic assumptions used to measure MSRs, which are prepayment speed and discount rate,
and a sensitivity analysis to adverse changes to these assumptions, is included in Note 13 to the consolidated fi nancial statements.
Loans held-in-portfolio considered impaired under ASC subsection 310-10-35 that are collateral dependentThe impairment is measured based on the fair value of the collateral, which is derived from appraisals that take into consideration prices in observed transactions involving similar assets in similar locations, size and supply and demand. Continued deterioration of the housing markets and the economy in general have adversely impacted and continue to affect the market activity related to real estate properties. These collateral dependent impaired loans are classifi ed as Level 3 and are reported as a nonrecurring fair value measurement.
Loans and Allowance for Loan Losses Interest on loans is accrued and recorded as interest income based upon the principal amount outstanding.
Recognition of interest income on commercial and construction loans is discontinued when the loans are 90 days or more in arrears on payments of principal or interest or when other factors indicate that the collection of principal and interest is doubtful. The impaired portions on these loans are charged-off at no longer than 365 days past due. Recognition of interest income on mortgage loans is discontinued when 90 days or more in arrears on payments of principal or interest. The impaired portions on mortgage loans are charged-off at 180 days past due. Recognition of interest income on closed-end consumer loans and home equity lines of credit is discontinued when the loans are 90 days or more in arrears on payments of principal or interest. Income is generally recognized on open-end consumer loans, except for home equity lines of credit, until the loans are charged-off. Recognition of interest income for lease fi nancing is ceased when loans are 90 days or more in arrears. Closed-end consumer loans and leases are charged-off when they are 120 days in arrears. Open-end (revolving credit) consumer loans are charged-off when 180 days in arrears.
Certain loans which would be treated as non-accrual loans pursuant to the foregoing policy are treated as accruing loans if they are considered well-secured and in the process of collection. Also, unsecured retail loans to borrowers who declare bankruptcy are charged-off within 60 days of receipt of notifi cation of fi ling from the bankruptcy court.
Once a loan is placed on non-accrual status, the interest previously accrued and uncollected is charged against current earnings and thereafter income is recorded only to the extent of any interest collected. Loans designated as non-accruing are not returned to an accrual status until interest is received on a current basis and those factors indicative of doubtful collection cease to exist. Special guidelines exist for troubled-debt restructurings.
One of the most critical and complex accounting estimates
BOA22177_wo18_Popular.indd 13 3/3/2010 10:46:50 AM
14 POPULAR, INC. 2009 ANNUAL REPORT
is associated with the determination of the allowance for loan losses. The provision for loan losses charged to current operations is based on this determination. The Corporation’s assessment of the allowance for loan losses is determined in accordance with accounting guidance, specifi cally guidance of loss contingencies in ASC Subtopic 450-20 and loan impairment guidance in ASC Section 310-10-35.
The accounting guidance provides for the recognition of a loss allowance for groups of homogeneous loans. During 2009, the Corporation enhanced the reserve assessment of homogeneous loans by establishing a more granular segmentation of loans with similar risk characteristics, reducing the historical base loss periods employed, and strengthening the analysis pertaining to the environmental factors considered. The revised segmentation considers business segments and product types, which are further segregated based on their secured or unsecured status. The determination for general reserves of the allowance for loan losses is based on historical net loss rates (including losses from impaired loans) by loan type and by legal entity adjusted for recent net charge-off trends and environmental factors. The base net loss rates are based on the moving average of annualized net charge-offs computed over a 3-year historical loss window for commercial and construction loan portfolios, and an 18-month period for consumer loan portfolios. The net charge-off trend factors are applied to adjust the base loss rates based on recent loss trends. The environmental factors, which include credit and macroeconomic indicators, are assessed to account for current market conditions that are likely to cause estimated credit losses to differ from historical loss experience. The Corporation refl ects the effect of these environmental factors on each loan group as an adjustment that, as appropriate, increases or decreases the historical loss rate applied to each group. Correlation and regression analyses are used to select and weight these indicators. For subprime mortgage loans, the allowance for loan losses is established to cover at least one year of projected losses which are inherent in these portfolios.
According to the accounting guidance criteria for specifi c impairment of a loan, up to December 31, 2008, the Corporation defi ned as impaired loans those commercial and construction borrowers with outstanding debt of $250,000 or more and with interest and /or principal 90 days or more past due. Also, specifi c commercial and construction borrowers with outstanding debt of $500,000 and over were deemed impaired when, based on current information and events, management considered that it was probable that the debtor would be unable to pay all amounts due according to the contractual terms of the loan agreement. Effective January 1, 2009, the Corporation continues to apply the same defi nition except that it prospectively increased the threshold of outstanding debt to $1,000,000 for the identifi cation of newly impaired loans. Although the accounting codifi cation guidance for specifi c impairment of a loan excludes large groups of smaller
balance homogeneous loans that are collectively evaluated for impairment (e.g., mortgage loans), it specifi cally requires that loan modifi cations considered troubled debt restructurings (“TDRs”) be analyzed under its provisions. An allowance for loan impairment is recognized to the extent that the carrying value of an impaired loan exceeds the present value of the expected future cash fl ows discounted at the loan’s effective rate, the observable market price of the loan, if available, or the fair value of the collateral if the loan is collateral dependent. The fair value of the collateral is generally obtained from appraisals. The Corporation requests updated appraisal reports for loans that are considered impaired following a corporate reappraisal policy. This policy requires updated appraisals for loans secured by real estate (including construction loans) either annually, every two years or every three years depending on the total exposure of the borrower. As a general procedure, the Corporation internally reviews appraisals as part of the underwriting and approval process and also for credits considered impaired.
TDRs represent loans where concessions have been granted to borrowers experiencing fi nancial diffi culties that the creditor would not otherwise consider. These concessions could include a reduction in the interest rate on the loan, payment extensions, forgiveness of principal, forbearance or other actions intended to maximize collection. These concessions stem from an agreement between the creditor and the debtor or are imposed by law or a court. Classifi cation of loan modifi cations as TDRs involves a degree of judgment. Indicators that the debtor is experiencing fi nancial diffi culties include, for example: (i) the debtor is currently in default on any of its debt; (ii) the debtor has declared or is in the process of declaring bankruptcy; (iii) there is signifi cant doubt as to whether the debtor will continue to be a going concern; (iv) currently, the debtor has securities that have been delisted, are in the process of being delisted, or are under threat of being delisted from an exchange; and (v) based on estimates and projections that only encompass the current business capabilities, the debtor forecasts that its entity-specifi c cash fl ows will be insuffi cient to service the debt (both interest and principal) in accordance with the contractual terms of the existing agreement through maturity; and absent the current modifi cation, the debtor cannot obtain funds from sources other than the existing creditors at an effective interest rate equal to the current market interest rate for similar debt for a nontroubled debtor. The identifi cation of TDRs is critical in the determination of the adequacy of the allowance for loan losses. Loans classifi ed as TDRs are reported in non-accrual status if the loan was in non-accruing status at the time of the modifi cation. The TDR loan should continue in non-accrual status until the borrower has demonstrated a willingness and ability to make the restructured loan payments (at least six months of sustained performance after classifi ed as TDR). Loans classifi ed as TDRs are excluded from TDR status if performance under the restructured terms exists for a
BOA22177_wo18_Popular.indd 14 3/3/2010 10:46:50 AM

15
reasonable period (at least twelve months of sustained performance after classifi ed) and the loan yields a market rate.
The Corporation’s management evaluates the adequacy of the allowance for loan losses on a quarterly basis following a systematic methodology in order to provide for known and inherent risks in the loan portfolio. In developing its assessment of the adequacy of the allowance for loan losses, the Corporation must rely on estimates and exercise judgment regarding matters where the ultimate outcome is unknown such as economic developments affecting specifi c customers, industries or markets. Other factors that can affect management’s estimates are the years of historical data to include when estimating losses, the level of volatility of losses in a specifi c portfolio, changes in underwriting standards, fi nancial accounting standards and loan impairment measurement, among others. Changes in the fi nancial condition of individual borrowers, in economic conditions, in historical loss experience and in the condition of the various markets in which collateral may be sold may all affect the required level of the allowance for loan losses. Consequently, the business, fi nancial condition, liquidity, capital and results of operations could also be affected.
A discussion about the process used to estimate the allowance for loan losses is presented in the Credit Risk Management and Loan Quality section of this MD&A.
Income Taxes Income taxes are accounted for using the asset and liability method. Under this method, deferred tax assets and liabilities are recognized based on the future tax consequences attributable to temporary differences between the fi nancial statement carrying amounts of existing assets and liabilities and their respective tax basis, and attributable to operating loss and tax credit carryforwards. Deferred tax assets and liabilities are measured using enacted tax rates expected to apply in the years in which the temporary differences are expected to be recovered or paid. The effect on deferred tax assets and liabilities of a change in tax rates is recognized in earnings in the period when the changes are enacted.
The calculation of periodic income taxes is complex and requires the use of estimates and judgments. The Corporation has recorded two accruals for income taxes: (1) the net estimated amount currently due or to be received from taxing jurisdictions, including any reserve for potential examination issues, and (2) a deferred income tax that represents the estimated impact of temporary differences between how the Corporation recognizes assets and liabilities under GAAP, and how such assets and liabilities are recognized under the tax code. Differences in the actual outcome of these future tax consequences could impact the Corporation’s fi nancial position or its results of operations. In estimating taxes, management assesses the relative merits and risks of the appropriate tax treatment of transactions taking into consideration statutory, judicial and regulatory guidance.
A deferred tax asset should be reduced by a valuation allowance if based on the weight of all available evidence, it is more likely than not (a likelihood of more than 50%) that some portion or the entire deferred tax asset will not be realized. The valuation allowance should be suffi cient to reduce the deferred tax asset to the amount that is more likely than not to be realized. The determination of whether a deferred tax asset is realizable is based on weighting all available evidence, including both positive and negative evidence. The realization of deferred tax assets, including carryforwards and deductible temporary differences, depends upon the existence of suffi cient taxable income of the same character during the carryback or carryforward period. The realization of deferred tax assets requires the consideration of all sources of taxable income available to realize the deferred tax asset, including the future reversal of existing temporary differences, future taxable income exclusive of reversing temporary differences and carryforwards, taxable income in carryback years and tax-planning strategies.
The Corporation’s U.S. mainland operations are in a cumulative loss position for the three-year period ended December 31, 2009. For purposes of assessing the realization of the deferred tax assets in the U.S. mainland, this cumulative taxable loss position is considered signifi cant negative evidence and has caused the Corporation to conclude that it will not be able to realize the deferred tax assets in the future. At December 31, 2009, the Corporation recorded a full valuation allowance of $1.1 billion on the deferred tax assets of the Corporation’s U.S. operations. At December 31, 2009, the Corporation had deferred tax assets related to its Puerto Rico operations amounting to $382 million. The Corporation has assessed the realization of the Puerto Rico portion of the net deferred tax assets and based on the weighting of all available evidence has concluded that it is more likely than not that such net deferred tax assets will be realized. Management will reassess the realization of the deferred tax assets based on the criteria of the applicable accounting pronouncement each reporting period.
Changes in the Corporation’s estimates can occur due to changes in tax rates, new business strategies, newly enacted guidance, and resolution of issues with taxing authorities regarding previously taken tax positions. Such changes could affect the amount of accrued taxes. The current income tax payable for 2009 has been paid during the year in accordance with estimated tax payments rules. Any remaining payment will not have any signifi cant impact on liquidity and capital resources.
The valuation of deferred tax assets requires judgment in assessing the likely future tax consequences of events that have been recognized in the fi nancial statements or tax returns and future profi tability. The accounting for deferred tax consequences represents management’s best estimate of those future events. Changes in management’s current estimates, due to unanticipated events, could have a material impact on the Corporation’s fi nancial
BOA22177_wo18_Popular.indd 15 3/3/2010 10:46:51 AM

16 POPULAR, INC. 2009 ANNUAL REPORT
condition and results of operations.The Corporation establishes tax liabilities or reduces tax assets
for uncertain tax positions when, despite its assessment that its tax return positions are appropriate and supportable under local tax law, the Corporation believes it may not succeed in realizing the tax benefi t of certain positions if challenged. In evaluating a tax position, the Corporation determines whether it is more likely than not that the position will be sustained upon examination, including resolution of any related appeals or litigation processes, based on the technical merits of the position. The Corporation’s estimate of the ultimate tax liability contains assumptions based on past experiences, and judgments about potential actions by taxing jurisdictions as well as judgments about the likely outcome of issues that have been raised by taxing jurisdictions. The tax position is measured as the largest amount of benefi t that is greater than 50% likely of being realized upon ultimate settlement. The Corporation evaluates these uncertain tax positions each quarter and adjusts the related tax liabilities or assets in light of changing facts and circumstances, such as the progress of a tax audit or the expiration of a statute of limitations. The Corporation believes the estimates and assumptions used to support its evaluation of uncertain tax positions are reasonable.
The amount of unrecognized tax benefi ts, including accrued interest, as of December 31, 2009 amounted to $49 million. Refer to Note 30 to the consolidated fi nancial statements for further information on this subject matter. As a result of examinations, the Corporation anticipates a reduction in the total amount of unrecognized tax benefi ts within the next 12 months, which could amount to approximately $15 million.
The amount of unrecognized tax benefi ts may increase or decrease in the future for various reasons including adding amounts for current tax year positions, expiration of open income tax returns due to the statutes of limitation, changes in management’s judgment about the level of uncertainty, status of examinations, litigation and legislative activity and the addition or elimination of uncertain tax positions. Although the outcome of tax audits is uncertain, the Corporation believes that adequate amounts of tax, interest and penalties have been provided for any adjustments that are expected to result from open years. From time to time, the Corporation is audited by various federal, state and local authorities regarding income tax matters. Although management believes its approach in determining the appropriate tax treatment is supportable and in accordance with the accounting standards, it is possible that the fi nal tax authority will take a tax position that is different than the tax position refl ected in the Corporation’s income tax provision and other tax reserves. As each audit is conducted, adjustments, if any, are appropriately recorded in the consolidated fi nancial statement in the period determined. Such differences could have an adverse effect on the Corporation’s income tax provision or benefi t, or other tax reserves, in the reporting period in which such determination is
made and, consequently, on the Corporation’s results of operations, fi nancial position and / or cash fl ows for such period.
Goodwill The Corporation’s goodwill and other identifi able intangible assets having an indefi nite useful life are tested for impairment. Intangibles with indefi nite lives are evaluated for impairment at least annually and on a more frequent basis if events or circumstances indicate impairment could have taken place. Such events could include, among others, a signifi cant adverse change in the business climate, an adverse action by a regulator, an unanticipated change in the competitive environment and a decision to change the operations or dispose of a reporting unit.
Under applicable accounting standards, goodwill impairment analysis is a two-step test. The fi rst step of the goodwill impairment test involves comparing the fair value of the reporting unit with its carrying amount, including goodwill. If the fair value of the reporting unit exceeds its carrying amount, goodwill of the reporting unit is considered not impaired; however, if the carrying amount of the reporting unit exceeds its fair value, the second step must be performed. The second step involves calculating an implied fair value of goodwill for each reporting unit for which the fi rst step indicated possible impairment. The implied fair value of goodwill is determined in the same manner as the amount of goodwill recognized in a business combination, which is the excess of the fair value of the reporting unit, as determined in the fi rst step, over the aggregate fair values of the individual assets, liabilities and identifi able intangibles (including any unrecognized intangible assets, such as unrecognized core deposits and trademark) as if the reporting unit was being acquired in a business combination and the fair value of the reporting unit was the price paid to acquire the reporting unit. The Corporation estimates the fair values of the assets and liabilities of a reporting unit, consistent with the requirements of the fair value measurements accounting standard, which defi nes fair value as the price that would be received to sell an asset or paid to transfer a liability in an orderly transaction between market participants at the measurement date. The fair value of the assets and liabilities refl ects market conditions, thus volatility in prices could have a material impact on the determination of the implied fair value of the reporting unit goodwill at the impairment test date. The adjustments to measure the assets, liabilities and intangibles at fair value are for the purpose of measuring the implied fair value of goodwill and such adjustments are not refl ected in the consolidated statement of condition. If the implied fair value of goodwill exceeds the goodwill assigned to the reporting unit, there is no impairment. If the goodwill assigned to a reporting unit exceeds the implied fair value of the goodwill, an impairment charge is recorded for the excess. An impairment loss recognized cannot exceed the amount of goodwill assigned to a reporting unit, and the loss
BOA22177_wo18_Popular.indd 16 3/3/2010 10:46:51 AM

17
establishes a new basis in the goodwill. Subsequent reversal of goodwill impairment losses is not permitted under applicable accounting standards.
At December 31, 2009, goodwill totaled $604 million. Note 14 to the consolidated fi nancial statements provide an allocation of goodwill by business segment. In October 2009, the Corporation recorded a goodwill write-off amounting to $2.2 million as a result of the sale of the six New Jersey branches pertaining to BPNA.
The Corporation performed the annual goodwill impairment evaluation for the entire organization during the third quarter of 2009 using July 31, 2009 as the annual evaluation date. The reporting units utilized for this evaluation were those that are one level below the business segments, which basically are the legal entities that compose the reportable segment. The Corporation follows push-down accounting, as such all goodwill is assigned to the reporting units when carrying out a business combination.
In determining the fair value of a reporting unit, the Corporation generally uses a combination of methods, including market price multiples of comparable companies and transactions, as well as discounted cash fl ow analysis. Management evaluates the particular circumstances of each reporting unit in order to determine the most appropriate valuation methodology. The Corporation evaluates the results obtained under each valuation methodology to identify and understand the key value drivers in order to ascertain that the results obtained are reasonable and appropriate under the circumstances. Elements considered include current market and economic conditions, developments in specifi c lines of business, and any particular features in the individual reporting units.
The computations require management to make estimates and assumptions. Critical assumptions that are used as part of these evaluations include:
• a selection of comparable publicly traded companies, based on nature of business, location and size;
• a selection of comparable acquisition and capital raising transactions;
• the discount rate applied to future earnings, based on an estimate of the cost of equity;
• the potential future earnings of the reporting unit; and
• the market growth and new business assumptions.For purposes of the market comparable approach, valuations
were determined by calculating average price multiples of relevant value drivers from a group of companies that are comparable to the reporting unit being analyzed and applying those price multiples to the value drivers of the reporting unit. Multiples used are minority based multiples and thus, no control premium adjustment is made to the comparable companies market multiples. While the market price multiple is not an assumption, a presumption that it provides an indicator of the value of the reporting unit is inherent in the valuation. The determination of the market comparables also
involves a degree of judgment. For purposes of the discounted cash fl ows (“DCF”) approach,
the valuation is based on estimated future cash fl ows. The fi nancial projections used in the DCF valuation analysis for each reporting unit are based on the most recent (as of the valuation date) fi nancial projections presented to the Corporation’s Asset / Liability Management Committee (“ALCO”). The growth assumptions included in these projections are based on management’s expectations for each reporting unit’s financial prospects considering economic and industry conditions as well as particular plans of each entity (i.e. restructuring plans, de-leveraging, etc.) The cost of equity used to discount the cash fl ows was calculated using the Ibbotson Build-Up Method and ranged from 11.24% to 17.78% for the 2009 analysis. The Ibbottson Build-Up Model builds up a cost of equity starting with the rate of return of a “risk less” asset (10 year U.S. Treasury note) and adds to it additional risk elements such as equity risk premium, size premium, and industry risk premium. The resulting discount rates were analyzed in terms of reasonability given the current market conditions and adjustments were made when necessary.
For BPNA, the only reporting unit that failed Step 1, the Corporation determined the fair value of Step 1 utilizing a market value approach based on a combination of price multiples from comparable companies and multiples from capital raising transactions of comparable companies. The market multiples used included “price to book” and “price to tangible book”. Additionally, the Corporation determined the reporting unit fair value using a DCF analysis based on BPNA’s fi nancial projections, but assigned no weight to it given that the current market approaches provide a more meaningful measure of fair value considering the reporting unit’s fi nancial performance and current market conditions. The Step 1 fair value for BPNA under both valuation approaches (market and DCF) was below the carrying amount of its equity book value as of the valuation date (July 31), requiring the completion of Step 2. In accordance with accounting standards, the Corporation performed a valuation of all assets and liabilities of BPNA, including any recognized and unrecognized intangible assets, to determine the fair value of BPNA’s net assets. To complete Step 2, the Corporation subtracted from BPNA’s Step 1 fair value the determined fair value of the net assets to arrive at the implied fair value of goodwill. The results of the Step 2 indicated that the implied fair value of goodwill exceeded the goodwill carrying value of $404 million at July 31, 2009, resulting in no goodwill impairment. The reduction in BPNA’s Step 1 fair value was offset by a reduction in the fair value of its net assets, resulting in an implied fair value of goodwill that exceeds the recorded book value of goodwill.
The analysis of the results for Step 2 indicates that the reduction in the fair value of the reporting unit was mainly attributed to the deteriorated fair value of the loan portfolios and not to the fair
BOA22177_wo18_Popular.indd 17 3/3/2010 10:46:51 AM

18 POPULAR, INC. 2009 ANNUAL REPORT
value of the reporting unit as a going concern entity. The current negative performance of the reporting unit is principally related to deteriorated credit quality in its loan portfolio, which agrees with the results of the Step 2 analysis. The fair value determined for BPNA’s loan portfolio in the July 31, 2009 annual test represented a discount of 21.7%, compared with 41.6% at December 31, 2008. The discount is mainly attributed to market participant’s expected rate of returns, which affected the market discount on the commercial and construction loan portfolios and deteriorated credit quality of the consumer and mortgage loan portfolios of BPNA. Refer to the Reportable Segments Results section of this MD&A, which provides highlights of BPNA’s reportable segment fi nancial performance for the year ended December 31, 2009. BPNA’s provision for loan losses, as a stand-alone legal entity, which is the reporting unit level used for the goodwill impairment analysis, amounted to $633.4 million for the year ended December 31, 2009, which represented 115% of BPNA legal entity’s net loss of $552.0 million for that period.
If the Step 1 fair value of BPNA declines further in the future without a corresponding decrease in the fair value of its net assets or if loan discounts improve without a corresponding increase in the Step 1 fair value, the Corporation may be required to record a goodwill impairment charge. The Corporation engaged a third-party valuator to assist management in the annual evaluation of BPNA’s goodwill (including Step 1 and Step 2) as well as BPNA’s loan portfolios as of the July 31, 2009 valuation date. Management discussed the methodologies, assumptions and results supporting the relevant values for conclusions and determined they were reasonable.
For the BPPR reporting unit, had the average reporting unit estimated fair value calculated in Step 1 using all valuation methodologies been approximately 25% lower, there would still be no requirement to perform a Step 2 analysis, thus there would be no indication of impairment on the goodwill recorded in BPPR at July 31, 2009. For the BPNA reporting unit, had the estimated implied fair value of goodwill calculated in Step 2 been approximately 67% lower, there would still be no impairment of the goodwill recorded in BPNA at July 31, 2009. The goodwill balance of BPPR and BPNA, as legal entities, represented approximately 89% of the Corporation’s total goodwill balance as of the July 31, 2009 valuation date.
Furthermore, as part of the analyses, management performed a reconciliation of the aggregate fair values determined for the reporting units to the market capitalization of Popular, Inc. concluding that the fair value results determined for the reporting units in the July 31, 2009 annual assessment were reasonable.
The goodwill impairment evaluation process requires the Corporation to make estimates and assumptions with regard to the fair value of the reporting units. Actual values may differ signifi cantly from these estimates. Such differences could result
in future impairment of goodwill that would, in turn, negatively impact the Corporation’s results of operations and the reporting units where the goodwill is recorded. Declines in the Corporation’s market capitalization increase the risk of goodwill impairment in the future.
Management monitors events or changes in circumstances between annual tests to determine if these events or changes in circumstances would more likely than not reduce the fair value of a reporting unit below its carrying amount. As indicated in this MD&A, the economic situation in the United States and Puerto Rico, including deterioration in the housing market and credit market, continued to negatively impact the fi nancial results of the Corporation during 2009.
Accordingly, management continued monitoring the fair value of the reporting units, particularly the unit that failed the Step 1 test in the annual goodwill impairment evaluation. As part of the monitoring process, management performed an assessment for BPNA at December 31, 2009. The Corporation determined BPNA’s fair value utilizing the same valuation approaches (market and DCF) used in the annual goodwill impairment test. The determined fair value for BPNA at December 31, 2009 continued to be below its carrying amount under all valuation approaches. The fair value determination of BPNA’s assets and liabilities was updated at December 31, 2009 utilizing valuation methodologies consistent with the July 31, 2009 test. The results of the assessment at December 31, 2009 indicated that the implied fair value of goodwill exceeded the goodwill carrying amount, resulting in no goodwill impairment. The results obtained in the December 31, 2009 assessment were consistent with the results of the annual impairment test in that the reduction in the fair value of BPNA was mainly attributable to a signifi cant reduction in the fair value of BPNA’s loan portfolio. The discount on BPNA’s loan portfolio was approximately 20% at December 31, 2009.
Pension and Postretirement Benefi t Obligations The Corporation provides pension and restoration benefi t plans for certain employees of various subsidiaries. The Corporation also
provides certain health care benefi ts for retired employees of BPPR. In February 2009, BPPR’s non-contributory defi ned pension
and benefi t restoration plans (“the Plans”) were frozen with regards to all future benefi t accruals after April 30, 2009. This action was taken by the Corporation to generate signifi cant cost savings in light of the severe economic downturn and the decline in the Corporation’s fi nancial performance. This measure will be reviewed periodically as economic conditions and the Corporation’s fi nancial situation improve. The pension obligation and the assets were remeasured as of February 28, 2009. The Plans had been closed to new hires and were frozen as of December 31, 2005 to employees who were under 30 years of age or were credited with
less than 10 years of benefi t service.
BOA22177_wo18_Popular.indd 18 3/3/2010 10:46:51 AM
19
The estimated benefi t costs and obligations of the pension and postretirement benefi t plans are impacted by the use of subjective assumptions, which can materially affect recorded amounts, including expected returns on plan assets, discount rates, rates of compensation increase and health care trend rates. Management applies judgment in the determination of these factors, which normally undergo evaluation against current industry practice and the actual experience of the Corporation. The Corporation uses an independent actuarial fi rm for assistance in the determination of the pension and postretirement benefi t costs and obligations. Detailed information on the plans and related valuation assumptions are
included in Note 27 to the consolidated fi nancial statements. The Corporation periodically reviews its assumption for the
long-term expected return on pension plan assets in the Banco Popular de Puerto Rico Retirement Plan, which is the Corporation’s largest pension plan with assets with a fair value of $ 401.4 million at December 31, 2009 (2008 - $361.5 million). The expected return on plan assets is determined by considering various factors, including a total fund return estimate based on a weighted average of estimated returns for each asset class in the plan. Asset class returns are estimated using current and projected economic and market factors such as real rates of return, infl ation, credit spreads,
equity risk premiums and excess return expectations. As part of the review, the Corporation’s independent consulting
actuaries performed an analysis of expected returns based on the plan’s asset allocation at January 1, 2010. This analysis is reviewed by the Corporation and used as a tool to develop expected rates of return, together with other data. This forecast refl ects the actuarial fi rm’s view of expected long-term rates of return for each signifi cant asset class or economic indicator; for example, 8.6% for large / mid-cap stocks, 4.5% for fi xed income, 9.3% for small cap stocks and 2.3% infl ation at January 1, 2010. A range of expected investment returns is developed, and this range relies both on forecasts and on broad-market historical benchmarks for
expected returns, correlations, and volatilities for each asset class. As a consequence of recent reviews, the Corporation left
unchanged its expected return on plan assets for year 2010 at 8.0%, similar to the expected rate assumed in 2009 and 2008. The Corporation uses a long-term infl ation estimate of 2.8% to determine the pension benefi t cost, which is higher than the 2.3% rate used in the actuary’s expected return forecast model. Since the expected return assumption is on a long-term basis, it is not materially impacted by the yearly fl uctuations (either positive or negative) in the actual return on assets. However, if the actual return on assets performs below management’s expectations for a continued period of time, this could eventually result in the
reduction of the expected return on assets percentage assumption.Pension expense for the Banco Popular de Puerto Rico
Retirement Plan in 2009 amounted to $24.6 million (includes a curtailment charge of $0.8 million). This included a credit of $25.1
million for the expected return on assets. Pension expense is sensitive to changes in the expected return
on assets. For example, decreasing the expected rate of return for 2010 from 8.00% to 7.50% would increase the projected 2010 expense for the Banco Popular de Puerto Rico Retirement Plan by approximately $1.9 million.
The Corporation accounts for the underfunded status of its pension and postretirement benefi t plans as a liability, with an offset, net of tax, in accumulated other comprehensive income or loss. The determination of the fair value of pension plan obligations involves judgment, and any changes in those estimates could impact the Corporation’s consolidated statement of fi nancial condition. The valuation of pension plan obligations is discussed above. Management believes that the fair value estimates of the pension plan assets are reasonable given that the plan assets are managed, in the most part, by the fi duciary division of BPPR, which is subject to periodic audit verifi cations. Also, the composition of the plan assets, as disclosed in Note 27 of the consolidated fi nancial statements, is primarily in equity and debt securities, which have readily determinable quoted market prices.
The Corporation uses the Citigroup Yield Curve to discount the expected program cash fl ows of the plans as a guide in the selection of the discount rate, as well as the Citigroup Pension Liability Index. The Corporation decided to use a discount rate of 5.90% to determine the benefi t obligation at December 31, 2009, compared with 6.10% at December 31, 2008.
A 50 basis point decrease in the assumed discount rate of 5.90% as of the beginning of 2010 would increase the projected 2010 expense for the Banco Popular de Puerto Rico Retirement Plan by approximately $2.4 million. The change would not affect the minimum required contribution to the Plan.
The Corporation also provides a postretirement health care benefi t plan for certain employees of BPPR. This plan was unfunded (no assets were held by the plan) at December 31, 2009. The Corporation had an accrual for postretirement benefi t costs of $111.6 million at December 31, 2009. Assumed health care trend rates may have signifi cant effects on the amounts reported for the health care plan. Note 27 to the consolidated fi nancial statements provides information on the assumed rates considered by the Corporation and on the sensitivity that a one-percentage point change in the assumed rate may have on specifi ed cost components and postretirement benefi t obligation of the Corporation.
BOA22177_wo18_Popular.indd 19 3/3/2010 10:46:51 AM

20 POPULAR, INC. 2009 ANNUAL REPORT
STATEMENT OF OPERATIONS ANALYSIS
Net Interest IncomeNet interest income, the Corporation’s primary source of earnings, represented 55% of top line income (defi ned as net interest income plus non-interest income) for 2009 and 61% for 2008. This source of earnings is subject to volatility derived from several risk factors which include market driven events as well as strategic decisions made by the Corporation’s management.
Interest earning assets include investment securities and loans that are exempt from income tax, principally in Puerto Rico. The main sources of tax-exempt interest income are investments in obligations of some U.S. Government agencies and sponsored entities of the Puerto Rico Commonwealth and its agencies. Assets held by the Corporation’s international banking entities, which previously were tax-exempt under Puerto Rico law, are currently subject to a temporary 5% tax. To facilitate the comparison of all interest data related to these assets, the interest income has been converted to a taxable equivalent basis, using the applicable statutory income tax rates. The taxable equivalent computation considers the interest expense disallowance required by the Puerto Rico tax law.
Average outstanding securities balances are based on amortized cost excluding any unrealized gains or losses on securities available-for-sale. Non-performing loans have been included in their respective average loans and leases categories. Loan fees collected and costs incurred in the origination of loans are deferred and amortized over the term of the loan as an adjustment to interest yield. Prepayment penalties, late fees collected and the amortization of premiums / discounts on purchased loans are also included as part of the loan yield. Interest income for the year ended December 31, 2009 included a favorable impact of $21.7 million related to these items, primarily in the commercial and mortgage loans portfolios. In addition, these amounts approximated favorable impacts of $17.4 million and $25.3 million, respectively, for the years ended December 31, 2008 and 2007. The $4.3 million increase from 2008 to 2009 was in part infl uenced by higher late payment fees in the Puerto Rico mortgage loan portfolio.
Table D presents the different components of the Corporation’s net interest income, on a taxable equivalent basis, for the year ended December 31, 2009, as compared with the same period in 2008, segregated by major categories of interest earning assets and interest bearing liabilities.
The decrease in average earning assets was in part due to the impact of recessions in both the U.S. mainland and Puerto Rico, and to strategic decisions made by the Corporation’s management. The BPPR reportable segment accounted for 77% of the decrease in the combined caption of commercial and construction loans. The decrease is in part the result of current economic conditions on the island, which have generated a higher balance of charge-offs, as well as a reduction in the loan origination activity. The
decrease in the lease fi nancing portfolio was mainly the result of the Corporation’s decision to exit the equipment lease fi nancing business in the U.S. mainland operations. The majority of the Popular Equipment Finance lease fi nancing portfolio was sold during the fi rst quarter of 2009. The decrease in the mortgage loans category was in part the result of strategic decisions in response to current economic conditions, which included exiting the non-conventional mortgage market in the U.S. mainland and discontinuing the E-LOAN loan origination platform. Consumer loans continue to decrease as the remaining closed-end second mortgages and home equity lines of credit (“HELOCs”) originated through the E-LOAN platform continue to amortize, in addition to a reduction in the loan origination activity. Further contributing to the decrease in the consumer loan portfolio was the sale of the E-LOAN auto portfolio during the latter part of the second quarter of 2008.
In addition to the decrease in the average loan portfolio, during the fi rst quarter of 2009, the Corporation sold approximately $3.4 billion in available-for-sale securities, mostly FHLB notes. The Corporation subsequently reinvested $2.9 billion of the proceeds in GNMA mortgage-backed securities. The remaining proceeds were used to repay borrowings, contributing to the balance sheet deleveraging.
The net interest margin, while remaining relatively steady from 2007 to 2008, decreased by 34 basis points during 2009. The following factors contributed to the reduction in the net interest margin:
• The Federal Reserve (“Fed”) lowered the federal funds target rate from 4.25% at the beginning of 2008 to a target range of 0% - 0.25% at December 31, 2008; which prevailed throughout 2009. The low rate environment impacted the yield of several of the Corporation’s earning assets. These assets included commercial and construction loans, of which 68% have fl oating or adjustable rates, fl oating rate collateralized mortgage obligations and HELOCs, as well as
the origination of loans in a low interest rate environment.
• A higher balance of non-performing loans across the different loan categories, which is discussed in the Credit Risk and Loan Quality section of this MD&A, also challenged the net interest margin.
• Liquidity strategies maintained throughout the year generated a higher balance of short-term investments at lower rates. The negative margin generated by these short-term investments pressured the net interest margin.
• During the latter part of the third quarter of 2009 the Corporation exchanged $935 million of Series C preferred stock for junior subordinated debenture securities. The junior subordinated debentures were recorded at fair value, generating a discount. The impact of both the
BOA22177_wo18_Popular.indd 20 3/3/2010 10:46:51 AM

21
contractual interest payments and the discount accretion generated additional interest expense of $23.5 million for 2009. Prior to the conversion, the payments to holders of Series C preferred stock were accounted for as dividends. The negative effect of this additional interest expense was partially offset by the conversion of trust preferred securities into common stock, which resulted in a reduction in interest expense of $11.9 million for 2009, when compared with the previous year.
• Rating downgrades that occurred during 2009 also contributed to an increase in the average cost of $350 million of unsecured senior notes of the Corporation by approximately $6.6 million during 2009. Refer to the Liquidity Risk section of this MD&A for further information on the Corporation’s credit rating downgrades by major rating agencies.
A lower cost of short-term borrowings and interest bearing deposits had a positive effect in the net interest margin. The Corporation’s management lowered the rates paid on certain non-maturity deposits and certifi cates of deposit during the year. Also, management is actively monitoring the impact that the rate reductions may have in the Corporation’s liquidity.
The average key index rates for the years 2007 through 2009 were as follows:
Table - Key Index Rates
2009 2008 2007
Prime rate 3.25% 5.08% 8.05%Fed funds rate 0.17 2.08 5.053-month LIBOR 0.69 2.93 5.303-month Treasury Bill 0.14 1.45 4.4610-year Treasury 3.24 3.64 4.63FNMA 30-year 4.68 5.79 6.24
The Corporation’s taxable equivalent adjustment presented a decrease when compared to 2008. Part of this decrease is the result of the aforementioned sale of FHLB notes, which are tax-exempt in Puerto Rico, and the subsequent reinvestment of the proceeds in taxable GNMA securities. Average tax-exempt earning assets approximated $3.8 billion in 2009, of which 89% represented tax-exempt investment securities, compared with $7.9 billion and 80% in 2008, and $8.9 billion and 83% in 2007, respectively.
In 2008, the Corporation was able to maintain a steady net interest margin when compared to 2007. However, the year presented various challenges as the liquidity concerns that began in the second half of 2007 continued during 2008. As shown in Table D, the decrease in net interest income for the year ended December 31, 2008, compared with the previous year, was mainly attributed to the impact that reductions in market rates had in the Corporation’s yield on earning assets. The Corporation was
able to maintain a consistent net interest margin by implementing strategies that reduced low yielding assets; including not reinvesting maturities of low yield investments. Similar to 2009, reductions in the average cost of non-maturity deposits and certifi cates of deposits also served as mitigating factors that contributed to a stable margin.
Provision for Loan LossesThe provision for loan losses totaled $1.4 billion, or 137% of net charge-offs, for the year ended December 31, 2009, compared with $991.4 million, or 165%, respectively, for 2008, and $341.2 million, or 136%, respectively, for 2007.
The provision for loan losses for the year ended December 31, 2009, when compared with the previous year, refl ects an increase in the level of the allowance for loan losses and higher net charge-offs by $427.4 million, mainly in construction loans by $189.5 million, commercial loans by $93.9 million, consumer loans by $77.7 million, and mortgage loans by $67.7 million. During the year ended December 31, 2009, the Corporation recorded $566.0 million in provision for loan losses for loans individually evaluated for impairment, compared with $316.5 million for 2008.
The Corporation’s allowance for loan losses increased to $1.3 billion at December 31, 2009, an increase of $378 million from December 31, 2008, despite the decrease of $2.0 billion in loans held-in-portfolio. The Corporation’s allowance for loan losses represented 5.32% of loans held-in-portfolio at December 31, 2009, compared with 3.43% at December 31, 2008. During 2009, the Corporation increased the allowance for loan losses across all its major loan portfolios, excluding the lease fi nancing portfolio. As indicated in the Overview section, during 2009, the Corporation exited the business of originating lease equipment fi nancing in its U.S. mainland operations. Refer to Table P for the allocation of the allowance for loan losses by loan type.
The increase in the provision for loan losses for 2009, compared with 2008, was principally the result of higher general reserve requirements for commercial loans, construction loans, U.S. mainland non-conventional residential mortgages and home equity lines of credit, combined with specifi c reserves recorded for loans considered impaired. The continued recessionary conditions of the Puerto Rico and the United States economies, housing value declines, a slowdown in consumer spending and the turmoil in the global fi nancial markets impacted the Corporation’s commercial and construction loan portfolios; increasing charge-offs, non-performing assets and loans judgmentally classifi ed as impaired. The stress consumers experienced from depreciating home prices, rising unemployment and tighter credit conditions resulted in higher levels of delinquencies and losses in the Corporation’s mortgage and consumer loan portfolios.
The increase in the provision for loan losses for the year ended December 31, 2008, when compared to 2007, was as a result of
BOA22177_wo18_Popular.indd 21 3/3/2010 10:46:51 AM
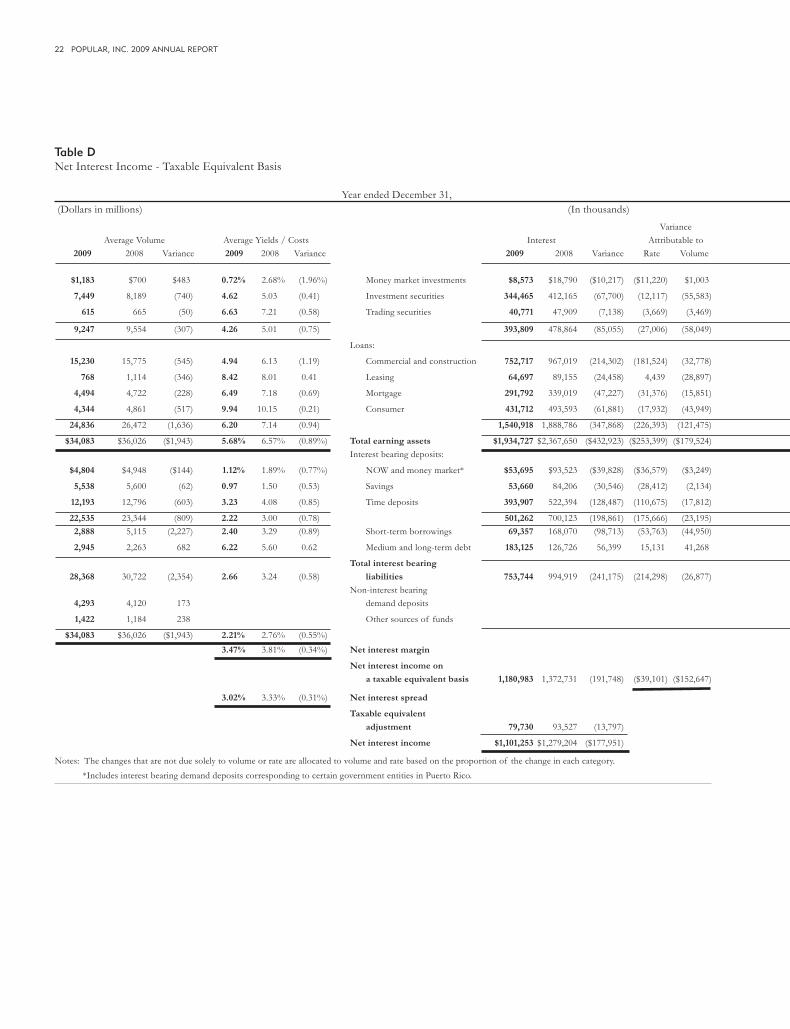
22 POPULAR, INC. 2009 ANNUAL REPORT
Table DNet Interest Income - Taxable Equivalent Basis
Year ended December 31, (Dollars in millions) (In thousands) Variance Average Volume Average Yields / Costs Interest Attributable to 2009 2008 Variance 2009 2008 Variance 2009 2008 Variance Rate Volume $1,183 $700 $483 0.72% 2.68% (1.96%) Money market investments $8,573 $18,790 ($10,217) ($11,220) $1,003
7,449 8,189 (740) 4.62 5.03 (0.41) Investment securities 344,465 412,165 (67,700) (12,117) (55,583)
615 665 (50) 6.63 7.21 (0.58) Trading securities 40,771 47,909 (7,138) (3,669) (3,469)
9,247 9,554 (307) 4.26 5.01 (0.75) 393,809 478,864 (85,055) (27,006) (58,049)
Loans:
15,230 15,775 (545) 4.94 6.13 (1.19) Commercial and construction 752,717 967,019 (214,302) (181,524) (32,778)
768 1,114 (346) 8.42 8.01 0.41 Leasing 64,697 89,155 (24,458) 4,439 (28,897)
4,494 4,722 (228) 6.49 7.18 (0.69) Mortgage 291,792 339,019 (47,227) (31,376) (15,851)
4,344 4,861 (517) 9.94 10.15 (0.21) Consumer 431,712 493,593 (61,881) (17,932) (43,949)
24,836 26,472 (1,636) 6.20 7.14 (0.94) 1,540,918 1,888,786 (347,868) (226,393) (121,475)
$34,083 $36,026 ($1,943) 5.68% 6.57% (0.89%) Total earning assets $1,934,727 $2,367,650 ($432,923) ($253,399) ($179,524) Interest bearing deposits:
$4,804 $4,948 ($144) 1.12% 1.89% (0.77%) NOW and money market* $53,695 $93,523 ($39,828) ($36,579) ($3,249)
5,538 5,600 (62) 0.97 1.50 (0.53) Savings 53,660 84,206 (30,546) (28,412) (2,134)
12,193 12,796 (603) 3.23 4.08 (0.85) Time deposits 393,907 522,394 (128,487) (110,675) (17,812)
22,535 23,344 (809) 2.22 3.00 (0.78) 501,262 700,123 (198,861) (175,666) (23,195) 2,888 5,115 (2,227) 2.40 3.29 (0.89) Short-term borrowings 69,357 168,070 (98,713) (53,763) (44,950)
2,945 2,263 682 6.22 5.60 0.62 Medium and long-term debt 183,125 126,726 56,399 15,131 41,268
Total interest bearing
28,368 30,722 (2,354) 2.66 3.24 (0.58) liabilities 753,744 994,919 (241,175) (214,298) (26,877) Non-interest bearing 4,293 4,120 173 demand deposits
1,422 1,184 238 Other sources of funds
$34,083 $36,026 ($1,943) 2.21% 2.76% (0.55%) 3.47% 3.81% (0.34%) Net interest margin
Net interest income on
a taxable equivalent basis 1,180,983 1,372,731 (191,748) ($39,101) ($152,647)
3.02% 3.33% (0.31%) Net interest spread
Taxable equivalent
adjustment 79,730 93,527 (13,797)
Net interest income $1,101,253 $1,279,204 ($177,951)
Notes: The changes that are not due solely to volume or rate are allocated to volume and rate based on the proportion of the change in each category. *Includes interest bearing demand deposits corresponding to certain government entities in Puerto Rico.
BOA22177_wo18_Popular.indd 22 3/3/2010 10:46:51 AM

23
(Dollars in millions) (In thousands) Variance Average Volume Average Yields / Costs Interest Attributable to 2008 2007 Variance 2008 2007 Variance 2008 2007 Variance Rate Volume $700 $514 $186 2.68% 5.17% (2.49%) Money market investments $18,790 $26,565 ($7,775) ($14,482) $6,707
8,189 9,827 (1,638) 5.03 5.16 (0.13) Investment securities 412,165 507,047 (94,882) (12,538) (82,344)
665 653 12 7.21 6.19 1.02 Trading securities 47,909 40,408 7,501 6,729 772
9,554 10,994 (1,440) 5.01 5.22 (0.21) 478,864 574,020 (95,156) (20,291) (74,865)
Loans:
15,775 14,917 858 6.13 7.72 (1.59) Commercial and construction 967,019 1,151,602 (184,583) (245,680) 61,097
1,114 1,178 (64) 8.01 7.89 0.12 Leasing 89,155 92,940 (3,785) 1,345 (5,130)
4,722 4,748 (26) 7.18 7.32 (0.14) Mortgage 339,019 347,302 (8,283) (6,384) (1,899)
4,861 4,537 324 10.15 10.50 (0.35) Consumer 493,593 476,234 17,359 (20,645) 38,004
26,472 25,380 1,092 7.14 8.15 (1.01) 1,888,786 2,068,078 (179,292) (271,364) 92,072
$36,026 $36,374 ($348) 6.57% 7.26% (0.69%) Total earning assets $2,367,650 $2,642,098 ($274,448) ($291,655) $17,207 Interest bearing deposits:
$4,948 $4,429 $519 1.89% 2.60% (0.71%) NOW and money market* $93,523 $115,047 ($21,524) ($34,997) $13,473
5,600 5,698 (98) 1.50 1.96 (0.46) Savings 84,206 111,877 (27,671) (19,242) (8,429)
12,796 11,399 1,397 4.08 4.73 (0.65) Time deposits 522,394 538,869 (16,475) (83,055) 66,580
23,344 21,526 1,818 3.00 3.56 (0.56) 700,123 765,793 (65,670) (137,294) 71,624 5,115 8,316 (3,201) 3.29 5.11 (1.82) Short-term borrowings 168,070 424,530 (256,460) (131,385) (125,075)
2,263 1,041 1,222 5.60 5.40 0.20 Medium and long-term debt 126,726 56,254 70,472 2,130 68,342
Total interest bearing
30,722 30,883 (161) 3.24 4.04 (0.80) liabilities 994,919 1,246,577 (251,658) (266,549) 14,891 Non-interest bearing 4,120 4,043 77 demand deposits
1,184 1,448 (264) Other sources of funds
$36,026 $36,374 ($348) 2.76% 3.43% (0.67%) 3.81% 3.83% (0.02%) Net interest margin
Net interest income on
a taxable equivalent basis 1,372,731 1,395,521 (22,790) ($25,106) $2,316
3.33% 3.22% 0.11% Net interest spread
Taxable equivalent
adjustment 93,527 89,863 3,664
Net interest income $1,279,204 $1,305,658 ($26,454)
BOA22177_wo18_Popular.indd 23 3/3/2010 10:46:51 AM
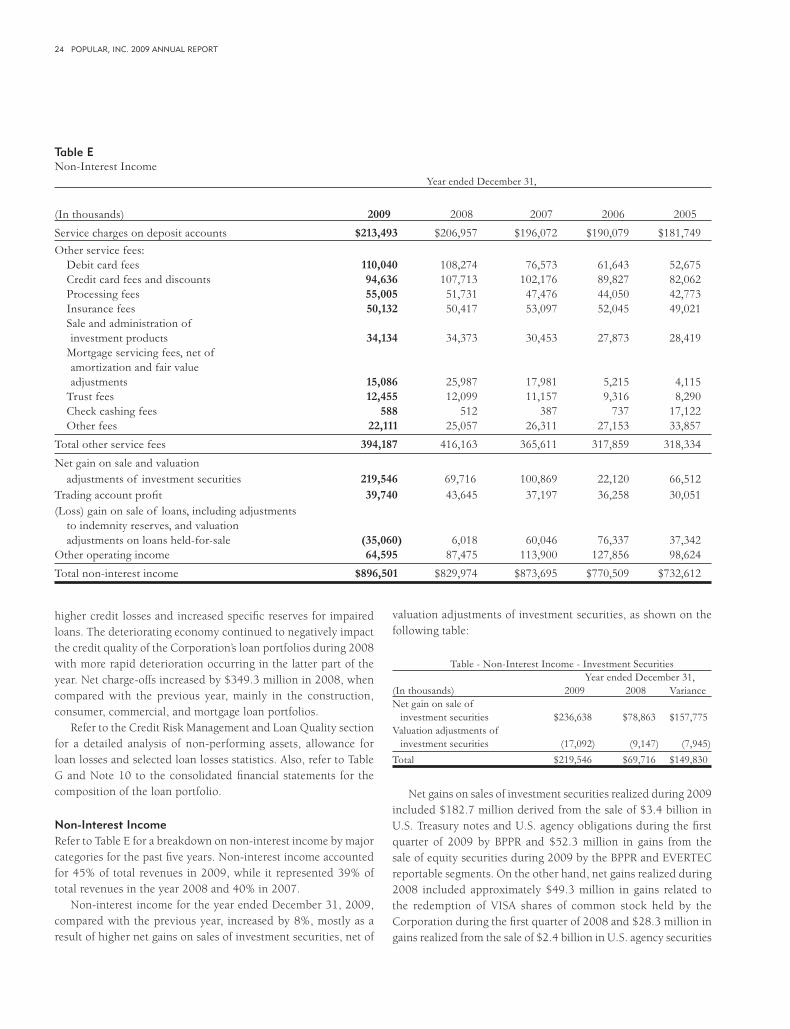
24 POPULAR, INC. 2009 ANNUAL REPORT
higher credit losses and increased specifi c reserves for impaired loans. The deteriorating economy continued to negatively impact the credit quality of the Corporation’s loan portfolios during 2008 with more rapid deterioration occurring in the latter part of the year. Net charge-offs increased by $349.3 million in 2008, when compared with the previous year, mainly in the construction, consumer, commercial, and mortgage loan portfolios.
Refer to the Credit Risk Management and Loan Quality section for a detailed analysis of non-performing assets, allowance for loan losses and selected loan losses statistics. Also, refer to Table G and Note 10 to the consolidated fi nancial statements for the composition of the loan portfolio.
Non-Interest IncomeRefer to Table E for a breakdown on non-interest income by major categories for the past fi ve years. Non-interest income accounted for 45% of total revenues in 2009, while it represented 39% of total revenues in the year 2008 and 40% in 2007.
Non-interest income for the year ended December 31, 2009, compared with the previous year, increased by 8%, mostly as a result of higher net gains on sales of investment securities, net of
valuation adjustments of investment securities, as shown on the following table:
Table - Non-Interest Income - Investment Securities Year ended December 31,
(In thousands) 2009 2008 VarianceNet gain on sale of investment securities $236,638 $78,863 $157,775Valuation adjustments of investment securities (17,092) (9,147) (7,945)Total $219,546 $69,716 $149,830
Net gains on sales of investment securities realized during 2009 included $182.7 million derived from the sale of $3.4 billion in U.S. Treasury notes and U.S. agency obligations during the fi rst quarter of 2009 by BPPR and $52.3 million in gains from the sale of equity securities during 2009 by the BPPR and EVERTEC reportable segments. On the other hand, net gains realized during 2008 included approximately $49.3 million in gains related to the redemption of VISA shares of common stock held by the Corporation during the fi rst quarter of 2008 and $28.3 million in gains realized from the sale of $2.4 billion in U.S. agency securities
Table ENon-Interest Income Year ended December 31,
(In thousands) 2009 2008 2007 2006 2005Service charges on deposit accounts $213,493 $206,957 $196,072 $190,079 $181,749Other service fees: Debit card fees 110,040 108,274 76,573 61,643 52,675 Credit card fees and discounts 94,636 107,713 102,176 89,827 82,062 Processing fees 55,005 51,731 47,476 44,050 42,773 Insurance fees 50,132 50,417 53,097 52,045 49,021 Sale and administration of investment products 34,134 34,373 30,453 27,873 28,419 Mortgage servicing fees, net of amortization and fair value adjustments 15,086 25,987 17,981 5,215 4,115 Trust fees 12,455 12,099 11,157 9,316 8,290 Check cashing fees 588 512 387 737 17,122 Other fees 22,111 25,057 26,311 27,153 33,857Total other service fees 394,187 416,163 365,611 317,859 318,334Net gain on sale and valuation adjustments of investment securities 219,546 69,716 100,869 22,120 66,512Trading account profi t 39,740 43,645 37,197 36,258 30,051(Loss) gain on sale of loans, including adjustments to indemnity reserves, and valuation adjustments on loans held-for-sale (35,060) 6,018 60,046 76,337 37,342Other operating income 64,595 87,475 113,900 127,856 98,624Total non-interest income $896,501 $829,974 $873,695 $770,509 $732,612
BOA22177_wo18_Popular.indd 24 3/3/2010 10:46:51 AM
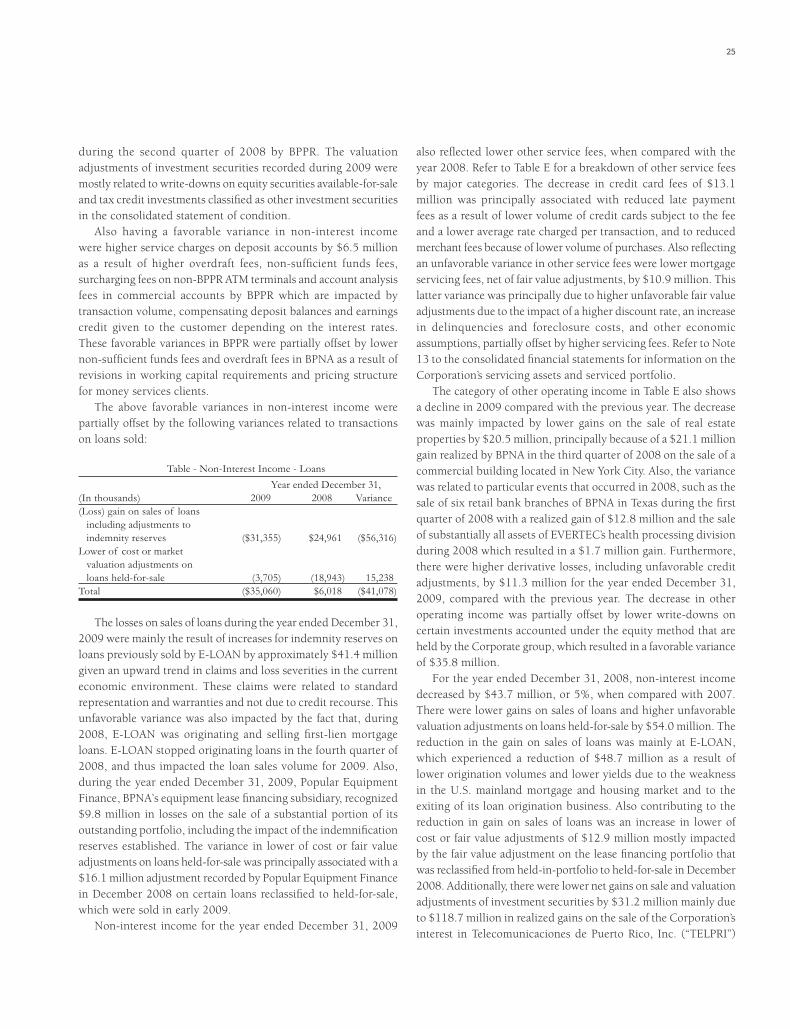
25
during the second quarter of 2008 by BPPR. The valuation adjustments of investment securities recorded during 2009 were mostly related to write-downs on equity securities available-for-sale and tax credit investments classifi ed as other investment securities in the consolidated statement of condition.
Also having a favorable variance in non-interest income were higher service charges on deposit accounts by $6.5 million as a result of higher overdraft fees, non-suffi cient funds fees, surcharging fees on non-BPPR ATM terminals and account analysis fees in commercial accounts by BPPR which are impacted by transaction volume, compensating deposit balances and earnings credit given to the customer depending on the interest rates. These favorable variances in BPPR were partially offset by lower non-suffi cient funds fees and overdraft fees in BPNA as a result of revisions in working capital requirements and pricing structure for money services clients.
The above favorable variances in non-interest income were partially offset by the following variances related to transactions on loans sold:
Table - Non-Interest Income - Loans Year ended December 31,
(In thousands) 2009 2008 Variance(Loss) gain on sales of loans including adjustments to indemnity reserves ($31,355) $24,961 ($56,316)Lower of cost or market valuation adjustments on loans held-for-sale (3,705) (18,943) 15,238Total ($35,060) $6,018 ($41,078)
The losses on sales of loans during the year ended December 31, 2009 were mainly the result of increases for indemnity reserves on loans previously sold by E-LOAN by approximately $41.4 million given an upward trend in claims and loss severities in the current economic environment. These claims were related to standard representation and warranties and not due to credit recourse. This unfavorable variance was also impacted by the fact that, during 2008, E-LOAN was originating and selling fi rst-lien mortgage loans. E-LOAN stopped originating loans in the fourth quarter of 2008, and thus impacted the loan sales volume for 2009. Also, during the year ended December 31, 2009, Popular Equipment Finance, BPNA’s equipment lease fi nancing subsidiary, recognized $9.8 million in losses on the sale of a substantial portion of its outstanding portfolio, including the impact of the indemnifi cation reserves established. The variance in lower of cost or fair value adjustments on loans held-for-sale was principally associated with a $16.1 million adjustment recorded by Popular Equipment Finance in December 2008 on certain loans reclassifi ed to held-for-sale, which were sold in early 2009.
Non-interest income for the year ended December 31, 2009
also refl ected lower other service fees, when compared with the year 2008. Refer to Table E for a breakdown of other service fees by major categories. The decrease in credit card fees of $13.1 million was principally associated with reduced late payment fees as a result of lower volume of credit cards subject to the fee and a lower average rate charged per transaction, and to reduced merchant fees because of lower volume of purchases. Also refl ecting an unfavorable variance in other service fees were lower mortgage servicing fees, net of fair value adjustments, by $10.9 million. This latter variance was principally due to higher unfavorable fair value adjustments due to the impact of a higher discount rate, an increase in delinquencies and foreclosure costs, and other economic assumptions, partially offset by higher servicing fees. Refer to Note 13 to the consolidated fi nancial statements for information on the Corporation’s servicing assets and serviced portfolio.
The category of other operating income in Table E also shows a decline in 2009 compared with the previous year. The decrease was mainly impacted by lower gains on the sale of real estate properties by $20.5 million, principally because of a $21.1 million gain realized by BPNA in the third quarter of 2008 on the sale of a commercial building located in New York City. Also, the variance was related to particular events that occurred in 2008, such as the sale of six retail bank branches of BPNA in Texas during the fi rst quarter of 2008 with a realized gain of $12.8 million and the sale of substantially all assets of EVERTEC’s health processing division during 2008 which resulted in a $1.7 million gain. Furthermore, there were higher derivative losses, including unfavorable credit adjustments, by $11.3 million for the year ended December 31, 2009, compared with the previous year. The decrease in other operating income was partially offset by lower write-downs on certain investments accounted under the equity method that are held by the Corporate group, which resulted in a favorable variance of $35.8 million.
For the year ended December 31, 2008, non-interest income decreased by $43.7 million, or 5%, when compared with 2007. There were lower gains on sales of loans and higher unfavorable valuation adjustments on loans held-for-sale by $54.0 million. The reduction in the gain on sales of loans was mainly at E-LOAN, which experienced a reduction of $48.7 million as a result of lower origination volumes and lower yields due to the weakness in the U.S. mainland mortgage and housing market and to the exiting of its loan origination business. Also contributing to the reduction in gain on sales of loans was an increase in lower of cost or fair value adjustments of $12.9 million mostly impacted by the fair value adjustment on the lease fi nancing portfolio that was reclassifi ed from held-in-portfolio to held-for-sale in December 2008. Additionally, there were lower net gains on sale and valuation adjustments of investment securities by $31.2 million mainly due to $118.7 million in realized gains on the sale of the Corporation’s interest in Telecomunicaciones de Puerto Rico, Inc. (“TELPRI”)
BOA22177_wo18_Popular.indd 25 3/3/2010 10:46:51 AM
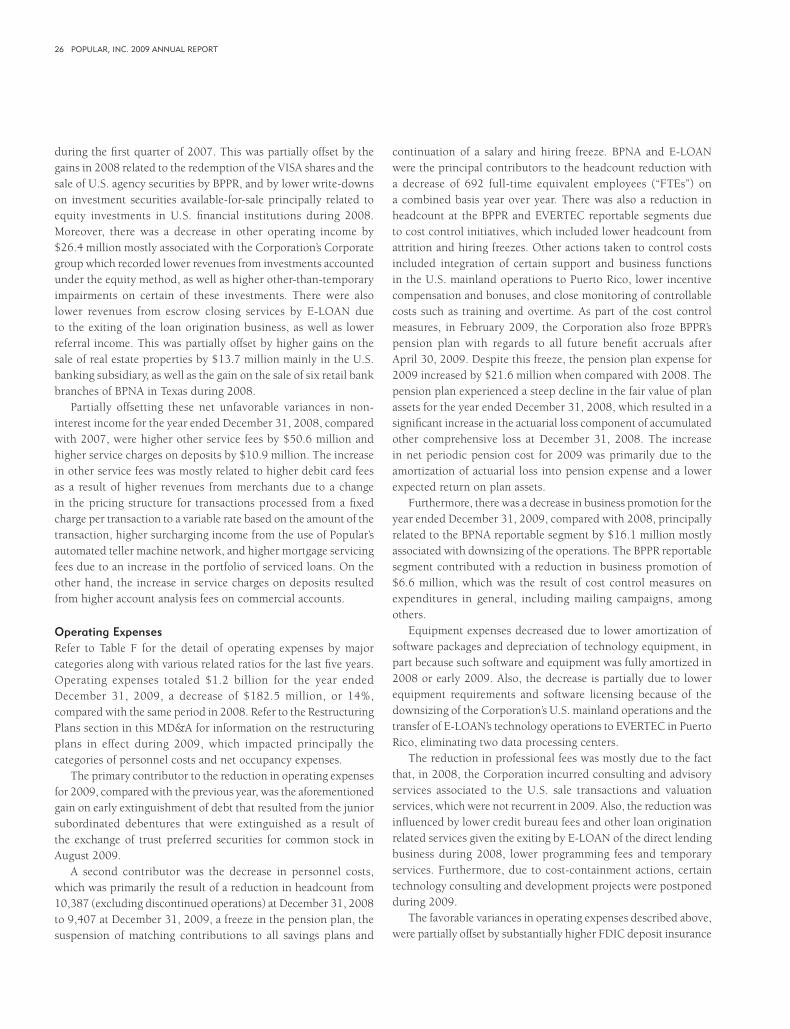
26 POPULAR, INC. 2009 ANNUAL REPORT
during the fi rst quarter of 2007. This was partially offset by the gains in 2008 related to the redemption of the VISA shares and the sale of U.S. agency securities by BPPR, and by lower write-downs on investment securities available-for-sale principally related to equity investments in U.S. fi nancial institutions during 2008. Moreover, there was a decrease in other operating income by $26.4 million mostly associated with the Corporation’s Corporate group which recorded lower revenues from investments accounted under the equity method, as well as higher other-than-temporary impairments on certain of these investments. There were also lower revenues from escrow closing services by E-LOAN due to the exiting of the loan origination business, as well as lower referral income. This was partially offset by higher gains on the sale of real estate properties by $13.7 million mainly in the U.S. banking subsidiary, as well as the gain on the sale of six retail bank branches of BPNA in Texas during 2008.
Partially offsetting these net unfavorable variances in non-interest income for the year ended December 31, 2008, compared with 2007, were higher other service fees by $50.6 million and higher service charges on deposits by $10.9 million. The increase in other service fees was mostly related to higher debit card fees as a result of higher revenues from merchants due to a change in the pricing structure for transactions processed from a fi xed charge per transaction to a variable rate based on the amount of the transaction, higher surcharging income from the use of Popular’s automated teller machine network, and higher mortgage servicing fees due to an increase in the portfolio of serviced loans. On the other hand, the increase in service charges on deposits resulted from higher account analysis fees on commercial accounts.
Operating ExpensesRefer to Table F for the detail of operating expenses by major categories along with various related ratios for the last fi ve years. Operating expenses totaled $1.2 billion for the year ended December 31, 2009, a decrease of $182.5 million, or 14%, compared with the same period in 2008. Refer to the Restructuring Plans section in this MD&A for information on the restructuring plans in effect during 2009, which impacted principally the categories of personnel costs and net occupancy expenses.
The primary contributor to the reduction in operating expenses for 2009, compared with the previous year, was the aforementioned gain on early extinguishment of debt that resulted from the junior subordinated debentures that were extinguished as a result of the exchange of trust preferred securities for common stock in August 2009.
A second contributor was the decrease in personnel costs, which was primarily the result of a reduction in headcount from 10,387 (excluding discontinued operations) at December 31, 2008 to 9,407 at December 31, 2009, a freeze in the pension plan, the suspension of matching contributions to all savings plans and
continuation of a salary and hiring freeze. BPNA and E-LOAN were the principal contributors to the headcount reduction with a decrease of 692 full-time equivalent employees (“FTEs”) on a combined basis year over year. There was also a reduction in headcount at the BPPR and EVERTEC reportable segments due to cost control initiatives, which included lower headcount from attrition and hiring freezes. Other actions taken to control costs included integration of certain support and business functions in the U.S. mainland operations to Puerto Rico, lower incentive compensation and bonuses, and close monitoring of controllable costs such as training and overtime. As part of the cost control measures, in February 2009, the Corporation also froze BPPR’s pension plan with regards to all future benefi t accruals after April 30, 2009. Despite this freeze, the pension plan expense for 2009 increased by $21.6 million when compared with 2008. The pension plan experienced a steep decline in the fair value of plan assets for the year ended December 31, 2008, which resulted in a signifi cant increase in the actuarial loss component of accumulated other comprehensive loss at December 31, 2008. The increase in net periodic pension cost for 2009 was primarily due to the amortization of actuarial loss into pension expense and a lower expected return on plan assets.
Furthermore, there was a decrease in business promotion for the year ended December 31, 2009, compared with 2008, principally related to the BPNA reportable segment by $16.1 million mostly associated with downsizing of the operations. The BPPR reportable segment contributed with a reduction in business promotion of $6.6 million, which was the result of cost control measures on expenditures in general, including mailing campaigns, among others.
Equipment expenses decreased due to lower amortization of software packages and depreciation of technology equipment, in part because such software and equipment was fully amortized in 2008 or early 2009. Also, the decrease is partially due to lower equipment requirements and software licensing because of the downsizing of the Corporation’s U.S. mainland operations and the transfer of E-LOAN’s technology operations to EVERTEC in Puerto Rico, eliminating two data processing centers.
The reduction in professional fees was mostly due to the fact that, in 2008, the Corporation incurred consulting and advisory services associated to the U.S. sale transactions and valuation services, which were not recurrent in 2009. Also, the reduction was infl uenced by lower credit bureau fees and other loan origination related services given the exiting by E-LOAN of the direct lending business during 2008, lower programming fees and temporary services. Furthermore, due to cost-containment actions, certain technology consulting and development projects were postponed during 2009.
The favorable variances in operating expenses described above, were partially offset by substantially higher FDIC deposit insurance
BOA22177_wo18_Popular.indd 26 3/3/2010 10:46:51 AM
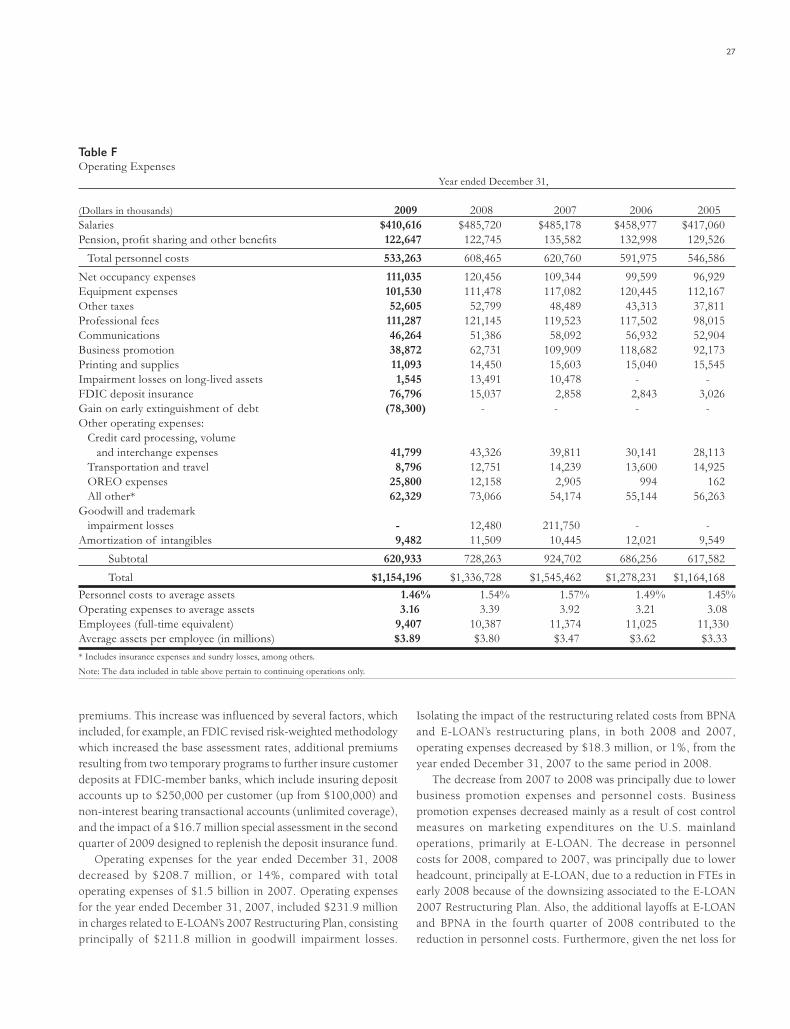
27
premiums. This increase was infl uenced by several factors, which included, for example, an FDIC revised risk-weighted methodology which increased the base assessment rates, additional premiums resulting from two temporary programs to further insure customer deposits at FDIC-member banks, which include insuring deposit accounts up to $250,000 per customer (up from $100,000) and non-interest bearing transactional accounts (unlimited coverage), and the impact of a $16.7 million special assessment in the second quarter of 2009 designed to replenish the deposit insurance fund.
Operating expenses for the year ended December 31, 2008 decreased by $208.7 million, or 14%, compared with total operating expenses of $1.5 billion in 2007. Operating expenses for the year ended December 31, 2007, included $231.9 million in charges related to E-LOAN’s 2007 Restructuring Plan, consisting principally of $211.8 million in goodwill impairment losses.
Isolating the impact of the restructuring related costs from BPNA and E-LOAN’s restructuring plans, in both 2008 and 2007, operating expenses decreased by $18.3 million, or 1%, from the year ended December 31, 2007 to the same period in 2008.
The decrease from 2007 to 2008 was principally due to lower business promotion expenses and personnel costs. Business promotion expenses decreased mainly as a result of cost control measures on marketing expenditures on the U.S. mainland operations, primarily at E-LOAN. The decrease in personnel costs for 2008, compared to 2007, was principally due to lower headcount, principally at E-LOAN, due to a reduction in FTEs in early 2008 because of the downsizing associated to the E-LOAN 2007 Restructuring Plan. Also, the additional layoffs at E-LOAN and BPNA in the fourth quarter of 2008 contributed to the reduction in personnel costs. Furthermore, given the net loss for
Table FOperating Expenses Year ended December 31, (Dollars in thousands) 2009 2008 2007 2006 2005Salaries $410,616 $485,720 $485,178 $458,977 $417,060Pension, profi t sharing and other benefi ts 122,647 122,745 135,582 132,998 129,526 Total personnel costs 533,263 608,465 620,760 591,975 546,586Net occupancy expenses 111,035 120,456 109,344 99,599 96,929Equipment expenses 101,530 111,478 117,082 120,445 112,167Other taxes 52,605 52,799 48,489 43,313 37,811Professional fees 111,287 121,145 119,523 117,502 98,015Communications 46,264 51,386 58,092 56,932 52,904Business promotion 38,872 62,731 109,909 118,682 92,173Printing and supplies 11,093 14,450 15,603 15,040 15,545Impairment losses on long-lived assets 1,545 13,491 10,478 - -FDIC deposit insurance 76,796 15,037 2,858 2,843 3,026Gain on early extinguishment of debt (78,300) - - - -Other operating expenses: Credit card processing, volume and interchange expenses 41,799 43,326 39,811 30,141 28,113 Transportation and travel 8,796 12,751 14,239 13,600 14,925 OREO expenses 25,800 12,158 2,905 994 162 All other* 62,329 73,066 54,174 55,144 56,263Goodwill and trademark impairment losses - 12,480 211,750 - -Amortization of intangibles 9,482 11,509 10,445 12,021 9,549 Subtotal 620,933 728,263 924,702 686,256 617,582 Total $1,154,196 $1,336,728 $1,545,462 $1,278,231 $1,164,168Personnel costs to average assets 1.46% 1.54% 1.57% 1.49% 1.45%Operating expenses to average assets 3.16 3.39 3.92 3.21 3.08Employees (full-time equivalent) 9,407 10,387 11,374 11,025 11,330Average assets per employee (in millions) $3.89 $3.80 $3.47 $3.62 $3.33* Includes insurance expenses and sundry losses, among others.Note: The data included in table above pertain to continuing operations only.
BOA22177_wo18_Popular.indd 27 3/3/2010 10:46:51 AM

28 POPULAR, INC. 2009 ANNUAL REPORT
the year and not attaining performance measures required under certain employee benefi t plans, there was lower compensation tied to fi nancial performance, including incentives and profi t sharing during 2008, when compared with 2007 results. These reductions were principally offset by lower deferred costs in 2008 given the reduction in loan originations. Also, these reductions were partially offset by the impact of the integration to BPPR of the employees from the retail branches of Citibank – Puerto Rico, an acquisition done in December 2007, higher severance payments related to key executive offi cers and higher pension costs. The favorable variances in the categories described above were partially offset by higher other operating expenses due to higher FDIC insurance assessments mainly in BPPR and BPNA, and higher other real estate expenses. Also, the increase in other operating expenses was due to the recording of reserves for unfunded loan commitments during 2008, primarily related to commercial and consumer lines of credit. In addition, there were higher credit card interchange and processing costs and higher sundry losses.
Restructuring PlansIn 2008, the Corporation determined to reduce the size of its banking operations in the U.S. mainland to a level better suited to present economic conditions and to focus on core banking activities. As indicated in the 2008 Annual Report, on October 17, 2008, the Board of Directors of Popular, Inc. approved two restructuring plans for the BPNA reportable segment. The objective of the restructuring plans was to improve profi tability in the short-term, increase liquidity and lower credit costs, and, over time, achieve a greater integration with corporate functions in Puerto Rico.
BPNA Restructuring PlanThe restructuring plan for BPNA’s banking operations (“the BPNA Restructuring Plan”) contemplated the following measures: closing, consolidating or selling approximately 40 underperforming branches in all existing markets; the shutting down, sale or downsizing of lending businesses that do not generate deposits or fee income; and the reduction of general expenses associated with functions supporting the branch and balance sheet initiatives. The BPNA Restructuring Plan also contemplated greater integration with the corporate functions in Puerto Rico. The BPNA Restructuring Plan was substantially complete at December 31, 2009. Management continues to evaluate branch actions and business lending opportunities as part of its business plans.
As part of the BPNA Restructuring Plan, the Corporation exited certain businesses including, among the principal ones, those related to the origination of non-conventional mortgages, equipment lease fi nancing, loans to professionals, multifamily lending, mixed-used commercial loans and credit cards. The Corporation holds the existing portfolios of the exited businesses
in a run-off mode. Also, the Corporation downsized the following businesses related to its U.S. mainland banking operations: business banking, SBA lending, and consumer / mortgage lending.
The following table details the expenses recorded by the Corporation related with the BPNA Restructuring Plan for the years ended December 31, 2009 and 2008.
Table - BPNA Restructuring Plan December 31,(In millions) 2009 2008 TotalPersonnel costs (a) $6.0 $5.3 $11.3Net occupancy expenses (b) 0.3 8.9 9.2Other operating expenses 0.4 - 0.4Total restructuring costs $6.7 $14.2 $20.9Impairment losses on long-lived assets (c) 0.4 5.5 5.9Total $7.1 $19.7 $26.8(a) Severance, retention bonuses and other benefi ts(b) Lease terminations(c) Leasehold improvements, furniture and equipment
At December 31, 2009, the reserve for restructuring costs associated with the BPNA Restructuring Plan amounted to $7 million and was mostly related with lease contracts. Refer to Note 4 to the consolidated fi nancial statements for a detail of the activity in the reserve for restructuring costs.
All restructuring efforts at BPNA are expected to result in approximately $50 million in recurrent annual cost savings. The majority of the savings are related to personnel costs. As a result of the BPNA Restructuring Plan, FTEs at BPNA banking operations were 1,409 at December 31, 2009, compared to 1,831 at the same date in the previous year.
E-LOAN 2008 Restructuring PlanIn October 2008, the Corporation’s Board of Directors approved a restructuring plan for E-LOAN (the “E-LOAN 2008 Restructuring Plan”), which involved E-LOAN to cease operating as a direct lender, an event that occurred in late 2008. E-LOAN continues to market deposit accounts under its name for the benefi t of BPNA. The E-LOAN 2008 Restructuring Plan was completed at December 31, 2009 since all operational and support functions were transferred to BPNA and EVERTEC, and loan servicing was transferred to a third-party provider. The E-LOAN 2008 Restructuring Plan resulted in a reduction in FTEs of 270 between December 31, 2008 and the end of 2009.
BOA22177_wo18_Popular.indd 28 3/3/2010 10:46:51 AM
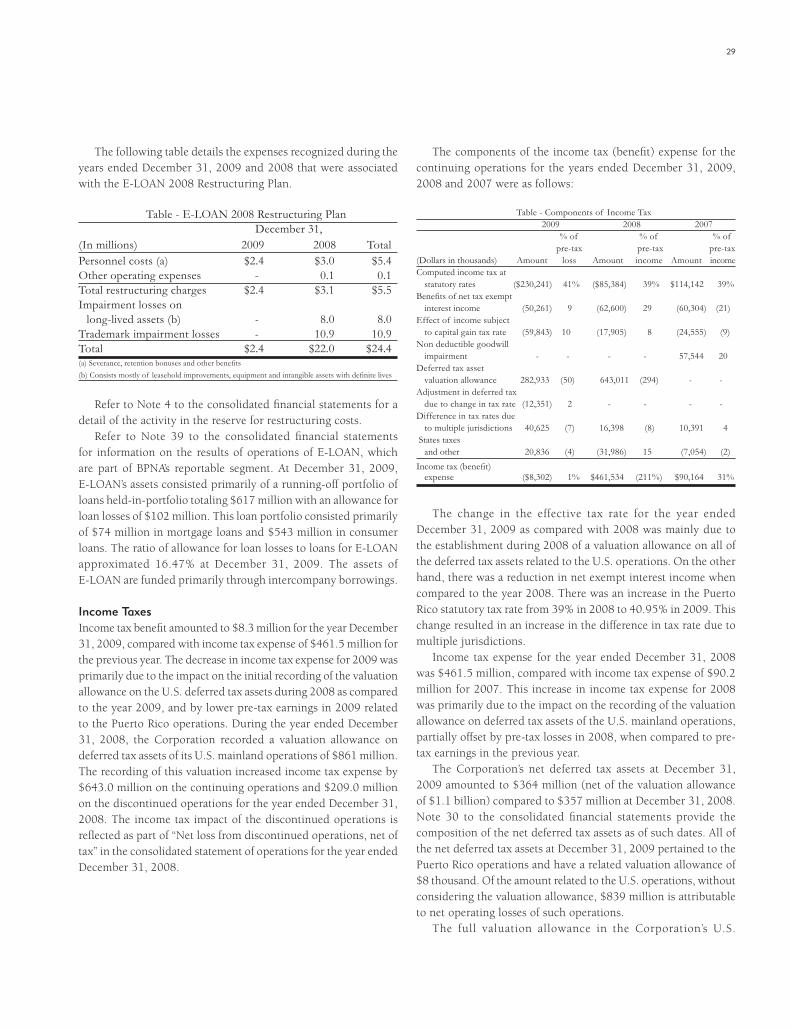
29
The following table details the expenses recognized during the years ended December 31, 2009 and 2008 that were associated with the E-LOAN 2008 Restructuring Plan.
Table - E-LOAN 2008 Restructuring Plan December 31,(In millions) 2009 2008 TotalPersonnel costs (a) $2.4 $3.0 $5.4Other operating expenses - 0.1 0.1Total restructuring charges $2.4 $3.1 $5.5Impairment losses on long-lived assets (b) - 8.0 8.0Trademark impairment losses - 10.9 10.9Total $2.4 $22.0 $24.4(a) Severance, retention bonuses and other benefi ts(b) Consists mostly of leasehold improvements, equipment and intangible assets with defi nite lives
Refer to Note 4 to the consolidated fi nancial statements for a detail of the activity in the reserve for restructuring costs.
Refer to Note 39 to the consolidated fi nancial statements for information on the results of operations of E-LOAN, which are part of BPNA’s reportable segment. At December 31, 2009, E-LOAN’s assets consisted primarily of a running-off portfolio of loans held-in-portfolio totaling $617 million with an allowance for loan losses of $102 million. This loan portfolio consisted primarily of $74 million in mortgage loans and $543 million in consumer loans. The ratio of allowance for loan losses to loans for E-LOAN approximated 16.47% at December 31, 2009. The assets of E-LOAN are funded primarily through intercompany borrowings.
Income TaxesIncome tax benefi t amounted to $8.3 million for the year December 31, 2009, compared with income tax expense of $461.5 million for the previous year. The decrease in income tax expense for 2009 was primarily due to the impact on the initial recording of the valuation allowance on the U.S. deferred tax assets during 2008 as compared to the year 2009, and by lower pre-tax earnings in 2009 related to the Puerto Rico operations. During the year ended December 31, 2008, the Corporation recorded a valuation allowance on deferred tax assets of its U.S. mainland operations of $861 million. The recording of this valuation increased income tax expense by $643.0 million on the continuing operations and $209.0 million on the discontinued operations for the year ended December 31, 2008. The income tax impact of the discontinued operations is refl ected as part of “Net loss from discontinued operations, net of tax” in the consolidated statement of operations for the year ended December 31, 2008.
The components of the income tax (benefi t) expense for the continuing operations for the years ended December 31, 2009, 2008 and 2007 were as follows:
Table - Components of Income Tax 2009 2008 2007 % of % of % of pre-tax pre-tax pre-tax(Dollars in thousands) Amount loss Amount income Amount incomeComputed income tax at statutory rates ($230,241) 41% ($85,384) 39% $114,142 39%Benefi ts of net tax exempt interest income (50,261) 9 (62,600) 29 (60,304) (21)Effect of income subject to capital gain tax rate (59,843) 10 (17,905) 8 (24,555) (9)Non deductible goodwill impairment - - - - 57,544 20Deferred tax asset valuation allowance 282,933 (50) 643,011 (294) - -Adjustment in deferred tax due to change in tax rate (12,351) 2 - - - -Difference in tax rates due to multiple jurisdictions 40,625 (7) 16,398 (8) 10,391 4 States taxes and other 20,836 (4) (31,986) 15 (7,054) (2)Income tax (benefi t) expense ($8,302) 1% $461,534 (211%) $90,164 31%
The change in the effective tax rate for the year ended December 31, 2009 as compared with 2008 was mainly due to the establishment during 2008 of a valuation allowance on all of the deferred tax assets related to the U.S. operations. On the other hand, there was a reduction in net exempt interest income when compared to the year 2008. There was an increase in the Puerto Rico statutory tax rate from 39% in 2008 to 40.95% in 2009. This change resulted in an increase in the difference in tax rate due to multiple jurisdictions.
Income tax expense for the year ended December 31, 2008 was $461.5 million, compared with income tax expense of $90.2 million for 2007. This increase in income tax expense for 2008 was primarily due to the impact on the recording of the valuation allowance on deferred tax assets of the U.S. mainland operations, partially offset by pre-tax losses in 2008, when compared to pre-tax earnings in the previous year.
The Corporation’s net deferred tax assets at December 31, 2009 amounted to $364 million (net of the valuation allowance of $1.1 billion) compared to $357 million at December 31, 2008. Note 30 to the consolidated fi nancial statements provide the composition of the net deferred tax assets as of such dates. All of the net deferred tax assets at December 31, 2009 pertained to the Puerto Rico operations and have a related valuation allowance of $8 thousand. Of the amount related to the U.S. operations, without considering the valuation allowance, $839 million is attributable to net operating losses of such operations.
The full valuation allowance in the Corporation’s U.S.
BOA22177_wo18_Popular.indd 29 3/3/2010 10:46:51 AM

30 POPULAR, INC. 2009 ANNUAL REPORT
operations was recorded in the year 2008 in consideration of the requirements of ASC Topic 740. Refer to the Critical Accounting Policies / Estimates section of this MD&A for information on the requirements of such accounting standard. The Corporation’s U.S. mainland operations are in a cumulative loss position for the three-year period ended December 31, 2009. For purposes of assessing the realization of the deferred tax assets in the U.S. mainland operations, this cumulative taxable loss position and the fi nancial results of the continuing business of those operations outweighed the positive evidence that is objectively verifi able, and caused management to conclude that it is more likely than not that the Corporation will not be able to realize the related deferred tax assets in the future.
Management will continue to reassess the realization of the deferred tax assets each reporting period.
Refer to Note 30 to the consolidated fi nancial statements for additional information on income taxes.
Fourth Quarter ResultsThe Corporation reported a net loss of $213.2 million for the quarter ended December 31, 2009, compared with a net loss of $702.9 for the same quarter of 2008. The Corporation’s continuing operations reported a net loss of $213.2 million for the quarter ended December 31, 2009, compared with a net loss of $627.7 million for the same quarter of 2008.
Net interest income for the fourth quarter of 2009 was $269.3 million, compared with $288.9 million for the fourth quarter of 2008. The decrease in net interest income was primarily due to a decline of $3.0 billion in average earning assets, principally loans, due to the sale of most of the lease fi nancing portfolio, the downsizing or discontinuance of certain loan origination units in the U.S. mainland operations and lower loan origination activity in general due to current market conditions. Also, the reduction in the average balance of investment securities resulted from the sale of available-for-sale securities, mostly U.S. agency securities (FHLB notes), during the fi rst quarter of 2009, as described in the Net Interest Income of this MD&A. The Corporation’s deposit volume and borrowings also decreased, which was associated with deleverage driven by the reduction in the earning assets they fund. Also, contributing to the reduction in net interest income was the decrease of the federal funds target rate by the Fed in December 2008. The reduction in short-term market rates impacted the yield of several of the Corporation’s earning assets during that period, including the yield on commercial and construction loans with fl oating or adjustable rates and fl oating rate collateralized mortgage obligations, as well as the yield of newly originated loans in a declining interest rate environment. On the positive side, the decrease in rates contributed to a reduction in the cost of interest-bearing deposits and short-term borrowings. Other factors impacting negatively the Corporation’s net interest income for the
quarter ended December 31, 2009 when compared with the same quarter in 2008 were the increase in non-performing loans, the exchange of Series C preferred stock for trust preferred securities and the increase in the cost of $350 million in term notes due to credit rating downgrades in 2009. Offsetting this negative variance was the reduction in interest expense from the exchange of the Corporation’s trust preferred securities for common stock.
The provision for loan losses totaled $352.8 million or 118% of net charge-offs for the quarter ended December 31, 2009, compared with $388.8 million or 174% of net charge-offs for the fourth quarter of 2008. The decrease in the provision for loan losses for the quarter ended December 31, 2009, compared with the same quarter in the previous year, was the result of higher increases in reserves during the fourth quarter of 2008. The provision for loan losses for the quarter ended December 31, 2009, when compared with the same quarter in 2008, refl ects higher net charge-offs by $75.3 million, mainly in construction loans by $29.7 million, commercial loans by $28.7 million, consumer loans by $9.3 million, and mortgage loans by $8.1 million. The U.S. mainland commercial lending segments which continue to report higher net charge-offs as a result of depressed economic conditions were primarily small businesses and commercial real estate. The losses in the construction loans sector are mainly related to residential development projects. Furthermore, consumer loans net charge-offs rose principally due to higher losses on home equity lines of credit and closed-end second mortgages of the Corporation’s U.S. mainland operations. The deterioration in the delinquency profi le and the declines in property values have negatively impacted charge-offs.
Non-interest income totaled $175.9 million for the quarter ended December 31, 2009, compared with $141.5 million for the same quarter in 2008. The results for the fourth quarter of 2008 included the aforementioned lower of cost or fair value adjustment of $16.1 million related to the reclassifi cation of loans from the equipment lease fi nancing portfolio of the U.S. mainland operations into loans held-for-sale. Also, non-interest income for the fourth quarter of 2008 was reduced by impairment losses on investments accounted for under the equity method that were recorded in the holding companies, which amounted to approximately $26.9 million. Having a negative impact on non-interest income for the fourth quarter of 2009 when compared to the same quarter in 2008 were lower mortgage servicing fees, net of fair value adjustments, by approximately $15.4 million.
Operating expenses totaled $298.8 million for the quarter ended December 31, 2009, compared with $360.2 million for the similar quarter in the previous year. The decrease in operating expenses was principally due to lower personnel costs and net occupancy expenses by $27.7 million and $8.9 million, respectively, principally due to downsizing of the U.S. mainland operations. Operating expenses for the fourth quarter of 2008
BOA22177_wo18_Popular.indd 30 3/3/2010 10:46:51 AM
31
included $41.7 million in costs related to the BPNA and E-LOAN restructuring plans launched in the fourth quarter of 2008, which included $13.5 million in impairment losses on long-lived assets and $10.9 million of the partial impairment of E-LOAN’s trademark. This fi gure compares to restructuring costs at BPNA reportable segment of $2.6 million in the fourth quarter of 2009.
Income tax expense from continuing operations amounted to $6.9 million for the quarter ended December 31, 2009, compared with an income tax expense of $309.1 million for the same quarter of 2008. The variance was primarily due to the recognition, during the fourth quarter of 2008, of a valuation allowance on the Corporation’s deferred tax asset related to the U.S. mainland operations that had a negative impact on income tax expense.
REPORTABLE SEGMENT RESULTS
The Corporation’s reportable segments for managerial reporting purposes consist of Banco Popular de Puerto Rico, EVERTEC and Banco Popular North America. A Corporate group has been defined to support the reportable segments. For managerial reporting purposes, the costs incurred by the Corporate group are not allocated to the reportable segments. For a description of the Corporation’s reportable segments, including additional fi nancial information and the underlying management accounting process, refer to Note 39 to the consolidated fi nancial statements.
The Corporate group had a net loss of $44.2 million in 2009, compared with a net loss of $435.4 million in 2008. The reduction in the net loss for 2009 when compared with 2008 was principally due to lower income tax expense by $321.9 million in 2009. The Corporate group’s fi nancial results for the year ended December 31, 2008 included an unfavorable impact to income taxes due to an allocation (for segment reporting purposes) of $357.4 million of the $861 million valuation allowance on the deferred tax assets of the U.S. mainland operations to Popular North America (“PNA”), holding company of the U.S. operations. PNA fi les a consolidated tax return for its operations.
For segment reporting purposes, the impact of recording the valuation allowance on deferred tax assets of the U.S. operations was assigned to each legal entity within PNA (including PNA holding company as an entity) based on each entity’s net deferred tax asset at December 31, 2008, except for PFH. The impact of recording the valuation allowance at PFH was allocated among continuing and discontinued operations. The portion attributed to the continuing operations was based on PFH’s net deferred tax asset balance at January 1, 2008. The valuation allowance on deferred taxes as it relates to the operating losses of PFH for the year 2008 was assigned to the discontinued operations.
The tax impact in results of operations for PFH attributed to the recording of the valuation allowance assigned to continuing operations was included as part of the Corporate group for segment reporting purposes since it does not relate to any of the legal entities
of the BPNA reportable segment. PFH is no longer considered a reportable segment.
Also contributing to the reduced net loss in 2009, compared with the previous year in the Corporate group, was the $80.3 million gain on early extinguishment of debt related to the aforementioned exchange of trust preferred securities for common stock. Also, impacting the results of the Corporate group was higher net interest expense by approximately $49.1 million, mainly due to additional interest expense on long-term debt as a result of the exchange of the $935 million of the Corporation’s Series C preferred stock for $935 million of newly issued trust preferred securities, and a higher cost on senior debt due to rate increases resulting from downgrades on Popular’s unsecured senior debt ratings, partially offset by lower interest expense on the extinguished junior subordinated debentures.
The Corporate group had a net loss of $435.4 million in 2008, compared with net income of $41.8 million in 2007. As indicated previously, the Corporate group’s fi nancial results for the year ended December 31, 2008 included the unfavorable impact to income taxes resulting from the allocation (for segment reporting purposes) of the valuation allowance on the deferred tax assets of the U.S. mainland operations. The Corporate group recorded non-interest losses amounting to $32.6 million for the year ended December 31, 2008, compared to non-interest income of $118.0 million in the previous year. In 2008, the Corporation’s holding companies within the Corporate group realized other-than-temporary impairment losses on investment securities available-for-sale and investments accounted under the equity method of $36.0 million, compared to gains of $118.7 million on the sale of equity securities in 2007.
Highlights on the earnings results for the reportable segments are discussed below.
Banco Popular de Puerto RicoThe Banco Popular de Puerto Rico reportable segment reported net income of $170.0 million for the year ended December 31, 2009, compared with $239.1 million for 2008 and $327.3 million for 2007. The challenging Puerto Rico economy, now in its fourth year of recession, continued pressuring credit quality and profi tability at this reportable segment. Deteriorating credit quality trends in the commercial and construction loan portfolios led to an increase in credit costs and higher levels of non-performing loans. Although management expects weakness in the Puerto Rico sector to persist during 2010, they will continue to work towards further strengthening its main market, Puerto Rico. BPPR’s franchise continues to be strong.
The main factors that contributed to the variance in the fi nancial results for 2009, compared with the previous year, included the following:
• lower net interest income by $92.2 million, or 10%, primarily due to a reduction in the yield of earning assets,
BOA22177_wo18_Popular.indd 31 3/3/2010 10:46:51 AM
32 POPULAR, INC. 2009 ANNUAL REPORT
principally commercial and construction loans. This decline can be attributed to two main factors: (1) the reduction in rates by the Fed as described in the Net Interest Income section of this MD&A and (2) an increase in non-performing loans. Also, the BPPR reportable segment experienced a decrease in the yield of investment securities and federal funds sold. Partially offsetting this unfavorable impact to net interest income was a reduction in the average cost of funds, driven by a reduction in the cost of deposits and short-term borrowings due to the decrease in rates by the Fed and management’s actions to lower the rates paid on certain deposits. Also, the unfavorable variance in net interest income was associated with a decline in the average volume of investment securities and in the loan portfolio, in part due to the slowdown of loan origination activity and increased levels of loan charge-offs. This negative impact from the reduction in the average volume of earning assets was partially offset by a reduction in the average volume of short-term borrowings, brokered deposits and public fund deposits. Despite a reduction in average loans for the BPPR reportable segment of $758 million when comparing 2009 with 2008, and a signifi cant increase in non-performing loans from $781 million at the end of 2008 to $1.5 billion at the end of 2009, the reportable segment’s net interest margin was 3.80% for 2009, compared with 3.94% for the previous year;
• higher provision for loan losses by $104.5 million, or 20%, primarily related to the construction and commercial loan portfolios. The BPPR reportable segment experienced an increase of $160.5 million in net charge-offs for the year ended December 31, 2009 compared with 2008, principally associated with an increase in construction loan net charge-offs by $131.8 million, mainly related to residential development projects. At December 31, 2009, there were $1.0 billion of loans individually evaluated for impairment in the BPPR reportable segment with a related allowance for loan losses of $190 million, compared with $639 million and $137 million, respectively, at December 31, 2008. Non-performing loans in this reportable segment totaled $1.5 billion at December 31, 2009, compared with $781 million at December 31, 2008. The increases in non-performing loans were mostly refl ected in construction loans by $389 million, commercial loans by $190 million and mortgage loans by $110 million. The ratio of allowance for loan losses to loans held-in-portfolio for the BPPR reportable segment was 4.36% at December 31, 2009, compared with 3.44% at December 31, 2008. The provision for loan losses represented 122% of net charge-offs for 2009, compared with 148% of net charge-offs for 2008. The ratio of net charge-offs to average loans held-in-portfolio for the BPPR
reportable segment was 3.34% for the year ended December 31, 2009, compared with 2.18% for 2008;
• higher non-interest income by $132.5 million, or 21%, mainly due to higher gains on the sale and valuation adjustment of investment securities by $156.8 million, principally due to the gain on sale of investment securities by BPPR. Service charges on deposit accounts increased by $11.9 million, principally for commercial account, overdraft and ATM fees. Other non-interest income categories decreased in the aggregate by $36.2 million, which was mostly the result of higher unfavorable changes in the fair value of the servicing rights due to factors such as higher discount rate, delinquency, foreclosure and other economic assumptions, and lower credit card fees mostly associated with late payment fees. These unfavorable variances were partially offset by higher mortgage servicing fees due to a greater volume of loans serviced for others;
• higher operating expenses by $19.7 million, or 3%, mainly due to higher FDIC deposit insurance by $38.4 million, partially offset by lower business promotion, professional fees, personnel costs, equipment expenses, among others. Several cost saving efforts were launched during the year targeting all controllable expenses. Some high impact initiatives included: (i) decreases in business promotion expenses, (ii) headcount reductions by attrition, and (iii) rationalization of technology investments; and
• lower income tax expense by $14.8 million. Refer to the Income Taxes section of this MD&A for additional information.
The main factors that contributed to the variance in the fi nancial results for the Banco Popular de Puerto Rico reportable segment during the year ended December 31, 2008, when compared to 2007, included:
• higher provision for loan losses by $275.3 million, or 113%, primarily related to the commercial, construction and consumer loan portfolios. These three portfolios experienced higher net charge-offs in 2008 compared to 2007 by $68.6 million, $65.6 million and $22.5 million, respectively. Also, during 2008, the Corporation increased its specifi c reserves for loans individually evaluated for impairment. The ratio of allowance for loan losses to loans held-in-portfolio for the BPPR reportable segment was 3.44% at December 31, 2008, compared with 2.31% at December 31, 2007;
• higher non-interest income by $135.1 million, or 28%, mainly due to the $40.9 million gain on the redemption of Visa stock in 2008 and a $28.3 million gain on the sale of $2.4 billion in U.S. agency securities during the second quarter of 2008. Other major contributors to the favorable variance in non-interest income were an increase in debit and credit cards fees, higher mortgage servicing fees, higher
BOA22177_wo18_Popular.indd 32 3/3/2010 10:46:51 AM
33
service charges on deposit accounts, and higher trading account profi t;
• higher operating expenses by $42.3 million, or 6%, primarily associated with the provision for reserves of unfunded lending commitments, FDIC deposit insurance, other real estate expenses, credit card interchange expenses, collection services, other professional fees, personnel costs, and net occupancy expenses, among others. These expenses were partially offset by lower business promotion expenses; and
• lower income taxes by $92.9 million, or 81%, primarily due to lower taxable income, an increase in net exempt interest income due to a lower disallowance of expenses related to exempt income, higher income subject to a preferential tax rate on capital gains, and tax benefi ts from the purchase of tax credits during 2008.
EVERTECEVERTEC is the Corporation’s reportable segment dedicated to processing and technology outsourcing services, servicing customers in Puerto Rico, the Caribbean, Central America and the U.S. mainland. EVERTEC provides support internally to the Corporation’s subsidiaries, as well as to third parties. EVERTEC’s main clients include fi nancial institutions, businesses and various levels of government. EVERTEC continues to strive to develop a strong presence in the Caribbean and Latin America, leverage its existing product offering and processing infrastructure to service new clients and markets, enhance the competitiveness of its automated teller machine “ATH” network and invest in new technology developments.
For the year ended December 31, 2009, net income for the reportable segment of EVERTEC totaled $50.1 million, compared with $43.6 million for 2008 and $31.3 million for 2007.
The principal factors that contributed to the variance in results for the year ended December 31, 2009, when compared to the previous year, included:
• lower non-interest income by $5.1 million, or 2%, primarily due to lower income derived from Information Technology (“IT”) consulting services; partially offset by higher business process outsourcing and higher electronic transaction processing fees, which are mainly related to payment services, item processing and point-of-sale (“POS”) terminals;
• lower operating expenses by $18.1 million, or 9%, primarily due to lower personnel costs as a result of attrition and lower incentive compensation, equipment expenses, and professional fees; and
• higher income tax expense by $6.2 million, or 32%.Factors that contributed to the variance in the results for 2008,
when compared to 2007, included:
• higher non-interest income by $21.6 million, or 9%, primarily due to higher transaction processing fees mainly related to the automated teller machine (“ATM”) network and point-of-sale (“POS”) terminals, and higher business process outsourcing. Also, there were higher payment, cash and item processing fees and information technology (“IT”) consulting services, among others. Furthermore, there were gains on sale of securities mostly as a result of a $7.6 million gain on the redemption of Visa stock held by ATH Costa Rica during the fi rst quarter of 2008;
• higher operating expenses by $7.5 million, or 4%, primarily due to higher other operating expenses, professional fees, personnel costs, and net occupancy expenses. These variances were offset by lower equipment and communication expenses; and
• higher income tax expense by $1.9 million, or 11%, primarily due to higher taxable income.
Banco Popular North AmericaFor the year ended December 31, 2009, the reportable segment of Banco Popular North America, which includes the operations of E-LOAN, had a net loss of $725.9 million, compared to a net loss of $524.8 million for 2008 and a net loss $195.4 million for 2007. E-LOAN’s net loss for the year ended December 31, 2009 amounted to $170.3 million, compared to a net loss of $233.9 million in 2008 and $245.7 million in 2007. As indicated in the Overview and Restructuring Plans sections of this MD&A, during 2009, the BPNA reportable segment continued its restructuring efforts to refocus the business, including the consolidation, sale or downsizing of underperforming branches and lending businesses. In addition, management integrated certain support and back-offi ce operations of BPNA into the operations of Puerto Rico to achieve synergies and reduce costs. Similarly, the operational and support functions of E-LOAN were transferred to BPNA and EVERTEC and the loan servicing of E-LOAN’s running-off loan portfolio was transferred to a third-party provider during 2009.
The main factors that contributed to the variance in results for the year ended December 31, 2009, when compared with 2008, included:
• lower net interest income by $36.1 million, or 10%, which was mainly due to lower average volume of commercial, mortgage and personal loans driven in part by the branch actions and the business lending initiatives whereby BPNA exited certain lines of business and E-LOAN’s operation as a direct fi rst mortgage lender was discontinued. Average loans in the BPNA reportable segment declined by $823 million in 2009 compared with 2008. The negative variance in net interest income was also due to lower loan yields, partially offset by lower cost of interest-bearing deposits;
• higher provision for loan losses by $310.0 million, or
BOA22177_wo18_Popular.indd 33 3/3/2010 10:46:51 AM

34 POPULAR, INC. 2009 ANNUAL REPORT
66%, principally as a result of higher general reserve requirements for commercial loans, construction loans, U.S. non-conventional residential mortgages and home equity lines of credit, combined with specifi c reserves recorded for individually evaluated impaired loans. There were higher net charge-offs in commercial loans by $93.2 million, mortgage loans by $59.9 million, construction loans by $57.7 million and consumer loans by $56.0 million. At December 31, 2009, there were $629 million of individually evaluated impaired loans in the BPNA reportable segment with a specifi c allowance for loan losses of $134 million, compared to $259 million and $58 million, respectively, at December 31, 2008. The increase in the provision for loan losses considers inherent losses in the portfolios evidenced by an increase in non-performing loans in this reportable segment by $377 million, when compared to December 31, 2008. The ratio of allowance for loan losses to loans held-in-portfolio for the BPNA reportable segment was 6.98% at December 31, 2009, compared with 3.42% at December 31, 2008. The provision for loan losses represented 152% of net charge-offs for 2009, compared with 190% of net charge-offs for 2008. The ratio of annualized net charge-offs to average loans held-in-portfolio for the Banco Popular North America operations was 5.54% for 2009, compared with 2.45% for the same quarter in 2008;
• lower non-interest income by $110.8 million, or 79%, mainly due to higher indemnity reserve requirements for representations and warranties on certain former sales agreements based on higher volume of claims and loss experience and lower gains on the sale of loans due to greater volume of loans sold during 2008 prior to E-LOAN ceasing to originate loans in late 2008. The indemnity reserve level approximated $33 million at December 31, 2009, compared with $6 million at December 31, 2008. The increase was due to a signifi cant rise in the level of registered and expected disbursements. Although the risk of loss or default was generally assumed by the investors, the Corporation is required to make certain representations relating to borrower creditworthiness, loan documentation, and collateral, which due to current credit conditions, have resulted in investors being very aggressive in the due diligence for claims. During 2009, repurchases or make-whole events required the Corporation to disburse approximately $15.8 million related to the indemnity reserves. Also, the unfavorable variance in non-interest income refl ects lower gains on the sale of a real estate property as the 2008 results included $21.1 million on the sale of a commercial building in New York City and $12.8 million on the sale of 6 Texas branches;
• lower operating expenses by $116.2 million, or 27%. This
variance was principally due to the result of lower personnel costs by $65.1 million and business promotion expenses by $16.1 million. Also, 2008 fi nancial results included $10.9 million of impairment on E-LOAN’s trademark. Operating expenses for the BPNA reportable segment included $41.7 million in restructuring related costs (including severance, lease cancellations, write-off of capitalized software and equipment, impairments on other long-lived assets and intangibles) in 2008, compared with $9.5 million in 2009. Besides the decrease associated with lower restructuring costs, the general expense reductions refl ected the combined impact of the branch actions and the lending business initiatives plus decreases in all discretionary expending across the organization. As part of the BPNA restructuring plan, E-LOAN’s operation as a direct fi rst mortgage lender was discontinued with all other activities consolidated into BPNA and EVERTEC. Throughout the implementation of the restructuring plan, FTEs in the BPNA reportable segment have decreased from 2,101 in December 2008 to approximately 1,409 in December 2009; and
• income tax benefi t of $24.9 million in 2009, compared with income tax expense of $114.7 million in 2008. Income tax expense for 2008 included the recording of a valuation allowance on the deferred tax assets. The income tax benefi t reported for 2009 relates in part to a tax refund as a result of the 2005 and 2006 net operating loss carrybacks.
The main factors that contributed to the variance in fi nancial results for 2008 when compared to 2007 for the Banco Popular North America reportable segment included:
• lower net interest income by $19.1 million, or 5%. This unfavorable variance was mainly due to lower loan yields, offset in part by a reduction in the cost of interest bearing deposits, mainly time deposits and internet-based deposits gathered through the E-LOAN deposit platform. Furthermore, BPNA incurred a penalty of $6.9 million on the cancellation of FHLB advances in December 2008. The variance due to a lower net interest margin was partially offset by an increase in the average volume of loans, which was funded through borrowings;
• higher provision for loan losses by $376.8 million, or 395%, primarily due to higher net charge-offs, specifi c reserves for commercial, construction and mortgage loans, as well as, the impact of the continuing deterioration of the U.S. residential housing market and the economy in general. The ratio of allowance for loan losses to loans held-in-portfolio for the Banco Popular North America reportable segment was 3.42% at December 31, 2008, compared with 1.26% at December 31, 2007. The provision for loan losses represented 190% of net charge-offs for 2008, compared with 168% in 2007. Net charge-offs to average loans held-
BOA22177_wo18_Popular.indd 34 3/3/2010 10:46:51 AM

35
in-portfolio for the Banco Popular North America reportable segment were 2.45% for the year ended December 31, 2008, compared with 0.61% in the previous year;
• lower non-interest income by $45.0 million, or 24%, mainly due to lower gains on sale of loans by $62.0 million, as well as lower revenues derived from escrow closing services and referral income, all of which were primarily associated to E-LOAN’s downsizing. This was partially offset by higher gains on the sale of real estate properties by the U.S. banking subsidiary, as well as the gain recorded in early 2008 related to the sale of BPNA’s retail bank branches located in Texas;
• lower operating expenses by $255.6 million, or 37%, mainly due to the goodwill impairment losses recorded in 2007 by E-LOAN, as well as a reduction in personnel and business promotion expenses for 2008 due to the downsizing of E-LOAN early that year; and
• income tax expense of $114.7 million in 2008, compared with income tax benefi t of $29.5 million in 2007. This variance was mainly due to the establishment of the valuation allowance on the deferred tax assets of the U.S. mainland continuing operations. The valuation allowance on deferred tax assets corresponding to the BPNA reportable segment amounted to $294.5 million at December 31, 2008.
DISCONTINUED OPERATIONS
For fi nancial reporting purposes, the results of the discontinued operations of PFH are presented as “Assets / Liabilities from discontinued operations” in the consolidated statements of condition as of December 31, 2008 and as “Loss from discontinued operations, net of tax” in the consolidated statements of operations for all periods presented in this report.
Total assets of the PFH discontinued operations amounted to $13 million at December 31, 2008 and $3.9 billion at December 31, 2007.
The following table provides fi nancial information for the discontinued operations for the years ended December 31, 2009, 2008 and 2007.
Table - PFH’s Results of Operations(In millions) 2009 2008 2007Net interest income $0.9 $30.8 $143.7Provision for loan losses - 19.0 221.4Non-interest loss, including fair value adjustments on loans and MSRs (3.2) (266.9) (89.3)Lower of cost or fair value adjustments on reclassifi cation of loans to held-for- sale prior to recharacterization - - (506.2)Gain upon completion of recharacterization - - 416.1Operating expenses, including reductions in value of servicing advances and other real estate, and restructuring costs 10.9 213.5 159.1Loss on disposition during the period (a) - (79.9) -Pre-tax loss from discontinued operations ($13.2) ($548.5) ($416.2)Income tax expense (benefi t) (b) 6.8 14.9 (149.2)Loss from discontinued operations, net of tax ($20.0) ($563.4) ($267.0)(a) Loss on disposition for 2008 includes the loss associated to the sale of manufactured housing loans in September 2008, including lower of cost or fair value adjustments at reclassifi cation from loans held-in-portfolio to loans held-for-sale, and the loss on sale of assets in November 2008.(b) Income tax for 2008 included the impact of recording a valuation allowance on deferred tax assets of $209.0 million.
The following paragraphs provide an overview of PFH’s principal events impacting the fi nancial results for 2009, 2008 and 2007 and the series of actions that led to the discontinuance of the PFH operations.
In 2007, PFH began downsizing its operations and shutting down certain loan origination channels. During that year, the Corporation executed the “PFH Restructuring and Integration Plan”, which called for PFH to exit the wholesale subprime mortgage loan origination business in early 2007 and to shut down the wholesale broker, retail and call center business divisions. This plan was substantially completed in 2007 and resulted in restructuring costs amounting to $14.7 million in that year. In December 2007, PFH signifi cantly reduced its asset base through the recharacterization of certain on-balance sheet securitizations as sales that involved approximately $3.2 billion in unpaid principal balance (“UPB”) of loans. The net impact of the recharacterization transaction was a pre-tax loss of $90.1 million. The recharacterization involved a series of steps, which included (i) amending the provisions of the related pooling and servicing agreements; (ii) reclassifying the loans as held-for-sale with the corresponding lower of cost or market adjustment as of the date of the transfer; (iii) removing from the Corporation’s books approximately $2.6 billion in mortgage loans recognized at fair value after reclassifi cation to the held-for-sale category (UPB of $3.2 billion) and $3.1 billion in related liabilities
BOA22177_wo18_Popular.indd 35 3/3/2010 10:46:51 AM
36 POPULAR, INC. 2009 ANNUAL REPORT
representing secured borrowings; (iv) recognizing assets referred to as residual interests, which represent the fair value of residual interest certifi cates that were issued by the securitization trusts and retained by PFH, and (v) recognizing mortgage servicing rights, which represent the fair value of PFH’s right to continue to service the mortgage loans transferred to the securitization trusts. Refer to the 2008 Annual Report, which is incorporated by reference in the Corporation’s Form 10-K for the year ended December 31, 2008, for further details on the nature of the recharacterization transaction. Also, refer to Note 3 to the consolidated fi nancial statements for additional information on the recharacterization and the PFH Restructuring and Integration Plan.
In early 2008, the Corporation executed the PFH Branch Network Restructuring Plan. As part of the plan, in March 2008, the Corporation sold approximately $1.4 billion of consumer and mortgage loans that were originated through Equity One’s (a subsidiary of PFH) consumer branch network and recognized a gain upon sale of approximately $54.5 million. Also, Equity One closed all consumer service branches, thus exiting PFH’s consumer fi nance business in early 2008. The PFH Branch Network Restructuring Plan resulted in restructuring costs amounting to $17.4 million for the year ended December 31, 2008. Refer to Note 3 to the consolidated fi nancial statements for additional information on this restructuring plan.
During the third and fourth quarters of 2008, the Corporation executed a series of significant asset sale transactions and a restructuring plan that led to the discontinuance of the Corporation’s PFH operations. The discontinuance included sales of PFH’s loan portfolio, servicing related assets, residual interests and other real estate assets. Also, the discontinuance included exiting the loan servicing functions, closing service branches and other units.
In September 2008, the Corporation sold PFH’s portfolio of manufactured housing loans with an unpaid principal balance of approximately $309 million and recognized a loss on disposition of $53.5 million. In November 2008, PFH consummated a transaction that involved the sale of approximately $748 million in assets, which included loans, residual interests and servicing related assets, and which for the most part were measured at fair value. The Corporation recognized a loss of approximately $26.4 million related to this disposition. During the third quarter of 2008, the Corporation recognized fair value adjustments on these assets held-for-sale of approximately $360 million.
As part of the actions to exit PFH’s business in the later part of 2008, the Corporation executed the “PFH Discontinuance Restructuring Plan”. The PFH Discontinuance Restructuring Plan included the elimination of substantially all employment positions and termination of contracts with the objective of discontinuing PFH’s operations.
During the year ended December 31, 2009 and 2008, the PFH Discontinuance Restructuring Plan resulted in charges, on a pre-tax basis, broken down as follows:
Table - PFH Discontinuance Restructuring Plan(In millions) 2009 2008Personnel costs (a) $1.1 $4.1Professional fees 0.1 -Other operating expenses 0.2 -Total restructuring costs $1.4 $4.1Impairment losses on long-lived assets (b) - 3.9Total $1.4 $8.0(a) Severance, retention bonuses and other benefi ts(b) Leasehold improvements, furniture and equipment and prepaid expenses
The PFH Discontinuance Restructuring Plan charges are included in the line item “Loss from discontinued operations, net of tax” in the consolidated statements of operations.
In mid-2009, PFH transferred the servicing of the loan portfolio of its affi liated company E-LOAN to a third-party servicer and completed the PFH Discontinuance Restructuring Plan. The net loss for the discontinued operations reported for the year ended December 31, 2009 included principally personnel costs associated to severance payments and salaries for employees who serviced the affi liated loan portfolios, legal expenses and collection services. Also, the fi nancial results for the discontinued operations in 2009 included costs for lease cancellations.
STATEMENT OF CONDITION ANALYSIS
AssetsRefer to the consolidated fi nancial statements included in this 2009 Annual Report for the Corporation’s consolidated statements of condition at December 31, 2009 and 2008. Also, refer to the Statistical Summary 2005-2009 in this MD&A for condensed statements of condition for the past fi ve years. At December 31, 2009, total assets were $34.7 billion compared with $38.9 billion at December 31, 2008. During 2008, the Corporation sold substantially all assets of PFH. Total assets at December 31, 2008 included $12.6 million from the discontinued operations. The decline in total assets from December 31, 2008 to December 31, 2009 was primarily refl ected in the portfolios of investment securities and loans. The reduction in investment securities was principally for deleveraging strategies, while the decline in loans shows a decreasing trend prompted by the economic slowdown, stricter underwriting standards, high levels of charge-offs and the reduction of the U.S. mainland operations.
BOA22177_wo18_Popular.indd 36 3/3/2010 10:46:51 AM

37
Investment securitiesThe following table provides a breakdown of the Corporation’s investment securities available-for-sale and held-to-maturity on a combined basis at December 31, 2009 and 2008. Also, Notes 7 and 8 to the consolidated fi nancial statements provide additional information by contractual maturity categories and gross unrealized gains / losses with respect to the Corporation’s available-for-sale (“AFS”) and held-to-maturity (“HTM”) investment securities.
Table - AFS and HTM Securities(In millions) 2009 2008U.S. Treasury securities $56.2 $502.1Obligations of U.S. government sponsored entities 1,647.9 4,808.5Obligations of Puerto Rico, States and political subdivisions 262.8 385.7Collateralized mortgage obligations 1,718.0 1,656.0Mortgage-backed securities 3,210.2 848.5Equity securities 7.8 10.1Other 4.8 8.3 Total $6,907.7 $8,219.2
The decline in the Corporation’s available-for-sale and held-to-maturity investment portfolios from December 31, 2008 to the end of 2009 was mainly associated with sales of securities in early 2009 and the repayment of maturing securities. As previously indicated in this MD&A, during the fi rst quarter of 2009, the Corporation sold $3.4 billion of investment securities available-for-sale, principally U.S. agency securities (FHLB notes) and U.S. Treasury securities. From the proceeds received from this sale, approximately $2.9 billion were later reinvested, primarily in GNMA mortgage-backed securities. As indicated in the Overview section of this MD&A, the sale and reinvestment was performed primarily to strengthen common equity by realizing a gain and improving the Corporation’s regulatory capital ratios.
The Corporation holds investment securities principally for liquidity, yield enhancement and interest rate risk management. The AFS and HTM investment securities portfolio primarily includes very liquid, high quality debt securities. The vast majority of these investment securities, or approximately 96%, are rated the equivalent of AAA by the major rating agencies. The mortgage-backed securities (“MBS”) and collateralized mortgage obligations (“CMOs”) are investment grade securities, most of all are rated AAA by at least one of the three major rating agencies at December 31, 2009. All MBS held by the Corporation and approximately 93% of the CMOs held at December 31, 2009 are guaranteed by government sponsored entities.
At December 31, 2009, there were investment securities available-for-sale with a fair value of $1.7 billion in an unrealized loss position. The unrealized losses on these particular securities approximated $27.6 million at December 31, 2009 and corresponded principally to mortgage-backed securities and collateralized mortgage obligations.
Management evaluates investment securities for other-than-temporary (“OTTI”) declines in fair value on a quarterly basis. Once a decline in value is determined to be other-than-temporary, the value of a debt security is reduced and a corresponding charge to earnings is recognized for anticipated credit losses. Also, for equity securities that are considered other-than-temporarily impaired, the excess of the security’s carrying value over its fair value at the evaluation date is accounted for as a loss in the results of operations. The OTTI analysis requires management to consider various factors, which include, but are not limited to: (1) the length of time and the extent to which fair value has been less than the amortized cost basis, (2) the fi nancial condition of the issuer or issuers, (3) actual collateral attributes, (4) the payment structure of the debt security and the likelihood of the issuer being able to make payments, (5) any rating changes by a rating agency, (6) adverse conditions specifi cally related to the security, industry, or a geographic area, and (7) management’s intent to sell the security or whether it is more likely than not that the Corporation would be required to sell the security before a forecasted recovery occurs.
At December 31, 2009, management performed its quarterly analysis of all debt securities in an unrealized loss position to determine if any securities were other-than-temporarily impaired. Based on the analyses performed, management concluded that no material individual debt security was other-than-temporarily impaired as of such date. At December 31, 2009, the Corporation does not have the intent to sell debt securities in an unrealized loss position and it is not more likely than not that the Corporation will have to sell the investment securities prior to recovery of their amortized cost basis. Also, management evaluated the Corporation’s portfolio of equity securities at December 31, 2009. During the twelve-month period ended December 31, 2009, the Corporation recorded $10.9 million in losses on certain equity securities considered other-than-temporarily impaired. Management has the intent and ability to hold the investments in equity securities that are at a loss position at December 31, 2009 for a reasonable period of time for a forecasted recovery of fair value up to (or beyond) the cost of these investments.
Loan portfolioA breakdown of the loan portfolio, the principal category of earning assets, is presented in Table G. Included in Table G are $91 million of loans held-for-sale at December 31, 2009, compared with $536 million at December 31, 2008.
The decrease of $1.5 billion, or 9%, in the commercial and construction loan portfolios from December 31, 2008 to December 31, 2009 refl ected the slowdown in origination activity and the dramatic increase in loan charge-offs as a result of the downturn in the real estate market, along with a deteriorated economic environment and credit quality. On a combined basis, commercial and construction loans net charge-offs amounted to $573 million in
BOA22177_wo18_Popular.indd 37 3/3/2010 10:46:51 AM
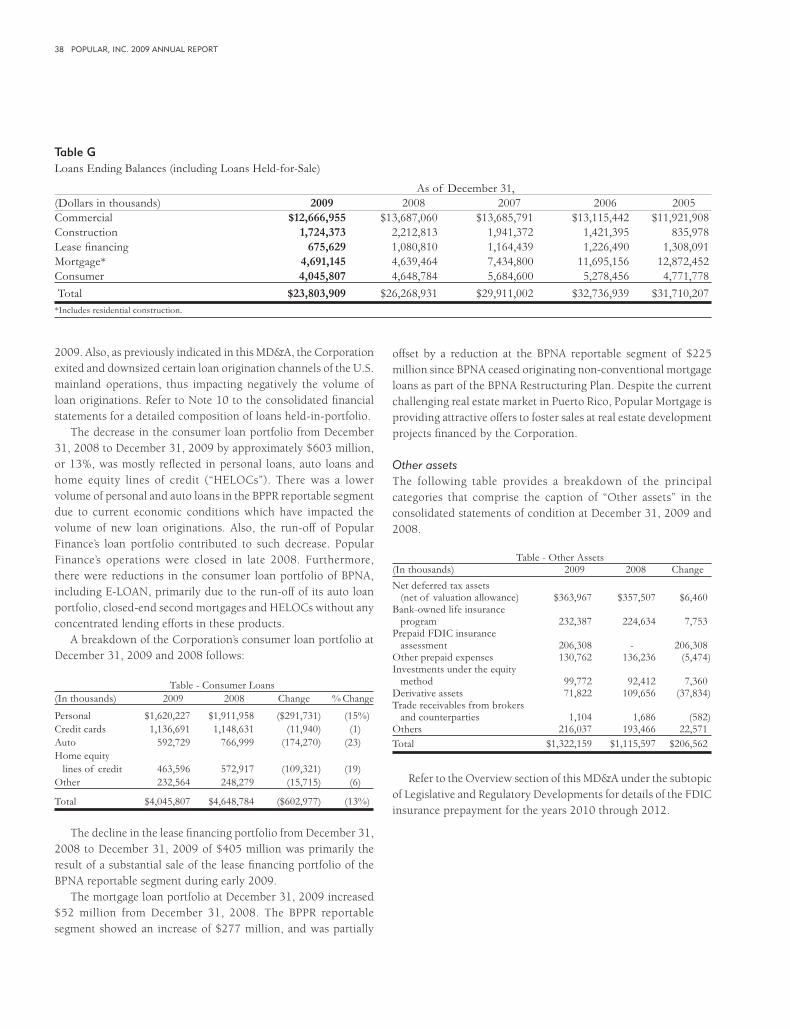
38 POPULAR, INC. 2009 ANNUAL REPORT
2009. Also, as previously indicated in this MD&A, the Corporation exited and downsized certain loan origination channels of the U.S. mainland operations, thus impacting negatively the volume of loan originations. Refer to Note 10 to the consolidated fi nancial statements for a detailed composition of loans held-in-portfolio.
The decrease in the consumer loan portfolio from December 31, 2008 to December 31, 2009 by approximately $603 million, or 13%, was mostly refl ected in personal loans, auto loans and home equity lines of credit (“HELOCs”). There was a lower volume of personal and auto loans in the BPPR reportable segment due to current economic conditions which have impacted the volume of new loan originations. Also, the run-off of Popular Finance’s loan portfolio contributed to such decrease. Popular Finance’s operations were closed in late 2008. Furthermore, there were reductions in the consumer loan portfolio of BPNA, including E-LOAN, primarily due to the run-off of its auto loan portfolio, closed-end second mortgages and HELOCs without any concentrated lending efforts in these products.
A breakdown of the Corporation’s consumer loan portfolio at December 31, 2009 and 2008 follows:
Table - Consumer Loans(In thousands) 2009 2008 Change % Change
Personal $1,620,227 $1,911,958 ($291,731) (15%)Credit cards 1,136,691 1,148,631 (11,940) (1)Auto 592,729 766,999 (174,270) (23)Home equity lines of credit 463,596 572,917 (109,321) (19)Other 232,564 248,279 (15,715) (6)
Total $4,045,807 $4,648,784 ($602,977) (13%)
The decline in the lease fi nancing portfolio from December 31, 2008 to December 31, 2009 of $405 million was primarily the result of a substantial sale of the lease fi nancing portfolio of the BPNA reportable segment during early 2009.
The mortgage loan portfolio at December 31, 2009 increased $52 million from December 31, 2008. The BPPR reportable segment showed an increase of $277 million, and was partially
offset by a reduction at the BPNA reportable segment of $225 million since BPNA ceased originating non-conventional mortgage loans as part of the BPNA Restructuring Plan. Despite the current challenging real estate market in Puerto Rico, Popular Mortgage is providing attractive offers to foster sales at real estate development projects fi nanced by the Corporation.
Other assetsThe following table provides a breakdown of the principal categories that comprise the caption of “Other assets” in the consolidated statements of condition at December 31, 2009 and 2008.
Table - Other Assets(In thousands) 2009 2008 ChangeNet deferred tax assets (net of valuation allowance) $363,967 $357,507 $6,460Bank-owned life insurance program 232,387 224,634 7,753Prepaid FDIC insurance assessment 206,308 - 206,308Other prepaid expenses 130,762 136,236 (5,474)Investments under the equity method 99,772 92,412 7,360Derivative assets 71,822 109,656 (37,834)Trade receivables from brokers and counterparties 1,104 1,686 (582)Others 216,037 193,466 22,571Total $1,322,159 $1,115,597 $206,562
Refer to the Overview section of this MD&A under the subtopic of Legislative and Regulatory Developments for details of the FDIC insurance prepayment for the years 2010 through 2012.
Table GLoans Ending Balances (including Loans Held-for-Sale)
As of December 31,(Dollars in thousands) 2009 2008 2007 2006 2005Commercial $12,666,955 $13,687,060 $13,685,791 $13,115,442 $11,921,908Construction 1,724,373 2,212,813 1,941,372 1,421,395 835,978Lease fi nancing 675,629 1,080,810 1,164,439 1,226,490 1,308,091Mortgage* 4,691,145 4,639,464 7,434,800 11,695,156 12,872,452Consumer 4,045,807 4,648,784 5,684,600 5,278,456 4,771,778 Total $23,803,909 $26,268,931 $29,911,002 $32,736,939 $31,710,207*Includes residential construction.
BOA22177_wo18_Popular.indd 38 3/3/2010 10:46:51 AM
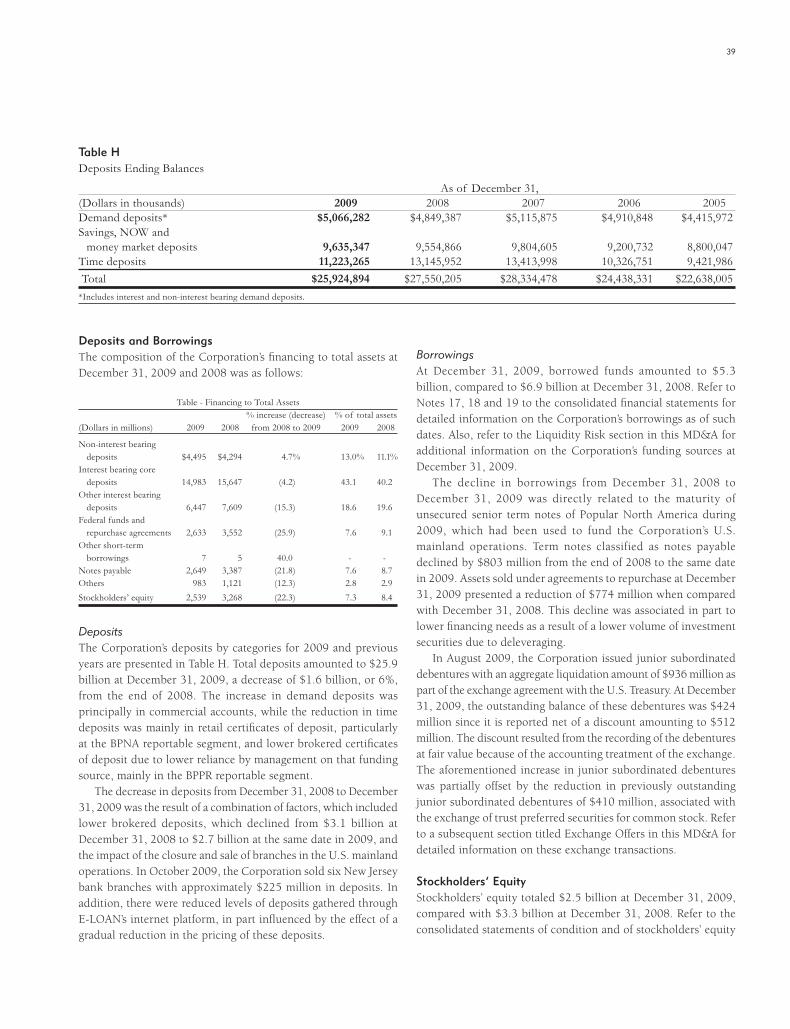
39
Deposits and BorrowingsThe composition of the Corporation’s fi nancing to total assets at December 31, 2009 and 2008 was as follows:
Table - Financing to Total Assets % increase (decrease) % of total assets(Dollars in millions) 2009 2008 from 2008 to 2009 2009 2008
Non-interest bearing deposits $4,495 $4,294 4.7% 13.0% 11.1%Interest bearing core deposits 14,983 15,647 (4.2) 43.1 40.2Other interest bearing deposits 6,447 7,609 (15.3) 18.6 19.6Federal funds and repurchase agreements 2,633 3,552 (25.9) 7.6 9.1Other short-term borrowings 7 5 40.0 - -Notes payable 2,649 3,387 (21.8) 7.6 8.7Others 983 1,121 (12.3) 2.8 2.9Stockholders’ equity 2,539 3,268 (22.3) 7.3 8.4
DepositsThe Corporation’s deposits by categories for 2009 and previous years are presented in Table H. Total deposits amounted to $25.9 billion at December 31, 2009, a decrease of $1.6 billion, or 6%, from the end of 2008. The increase in demand deposits was principally in commercial accounts, while the reduction in time deposits was mainly in retail certifi cates of deposit, particularly at the BPNA reportable segment, and lower brokered certifi cates of deposit due to lower reliance by management on that funding source, mainly in the BPPR reportable segment.
The decrease in deposits from December 31, 2008 to December 31, 2009 was the result of a combination of factors, which included lower brokered deposits, which declined from $3.1 billion at December 31, 2008 to $2.7 billion at the same date in 2009, and the impact of the closure and sale of branches in the U.S. mainland operations. In October 2009, the Corporation sold six New Jersey bank branches with approximately $225 million in deposits. In addition, there were reduced levels of deposits gathered through E-LOAN’s internet platform, in part infl uenced by the effect of a gradual reduction in the pricing of these deposits.
BorrowingsAt December 31, 2009, borrowed funds amounted to $5.3 billion, compared to $6.9 billion at December 31, 2008. Refer to Notes 17, 18 and 19 to the consolidated fi nancial statements for detailed information on the Corporation’s borrowings as of such dates. Also, refer to the Liquidity Risk section in this MD&A for additional information on the Corporation’s funding sources at December 31, 2009.
The decline in borrowings from December 31, 2008 to December 31, 2009 was directly related to the maturity of unsecured senior term notes of Popular North America during 2009, which had been used to fund the Corporation’s U.S. mainland operations. Term notes classified as notes payable declined by $803 million from the end of 2008 to the same date in 2009. Assets sold under agreements to repurchase at December 31, 2009 presented a reduction of $774 million when compared with December 31, 2008. This decline was associated in part to lower fi nancing needs as a result of a lower volume of investment securities due to deleveraging.
In August 2009, the Corporation issued junior subordinated debentures with an aggregate liquidation amount of $936 million as part of the exchange agreement with the U.S. Treasury. At December 31, 2009, the outstanding balance of these debentures was $424 million since it is reported net of a discount amounting to $512 million. The discount resulted from the recording of the debentures at fair value because of the accounting treatment of the exchange. The aforementioned increase in junior subordinated debentures was partially offset by the reduction in previously outstanding junior subordinated debentures of $410 million, associated with the exchange of trust preferred securities for common stock. Refer to a subsequent section titled Exchange Offers in this MD&A for detailed information on these exchange transactions.
Stockholders’ EquityStockholders’ equity totaled $2.5 billion at December 31, 2009, compared with $3.3 billion at December 31, 2008. Refer to the consolidated statements of condition and of stockholders’ equity
Table HDeposits Ending Balances
As of December 31,(Dollars in thousands) 2009 2008 2007 2006 2005Demand deposits* $5,066,282 $4,849,387 $5,115,875 $4,910,848 $4,415,972Savings, NOW and money market deposits 9,635,347 9,554,866 9,804,605 9,200,732 8,800,047Time deposits 11,223,265 13,145,952 13,413,998 10,326,751 9,421,986 Total $25,924,894 $27,550,205 $28,334,478 $24,438,331 $22,638,005*Includes interest and non-interest bearing demand deposits.
BOA22177_wo18_Popular.indd 39 3/3/2010 10:46:52 AM
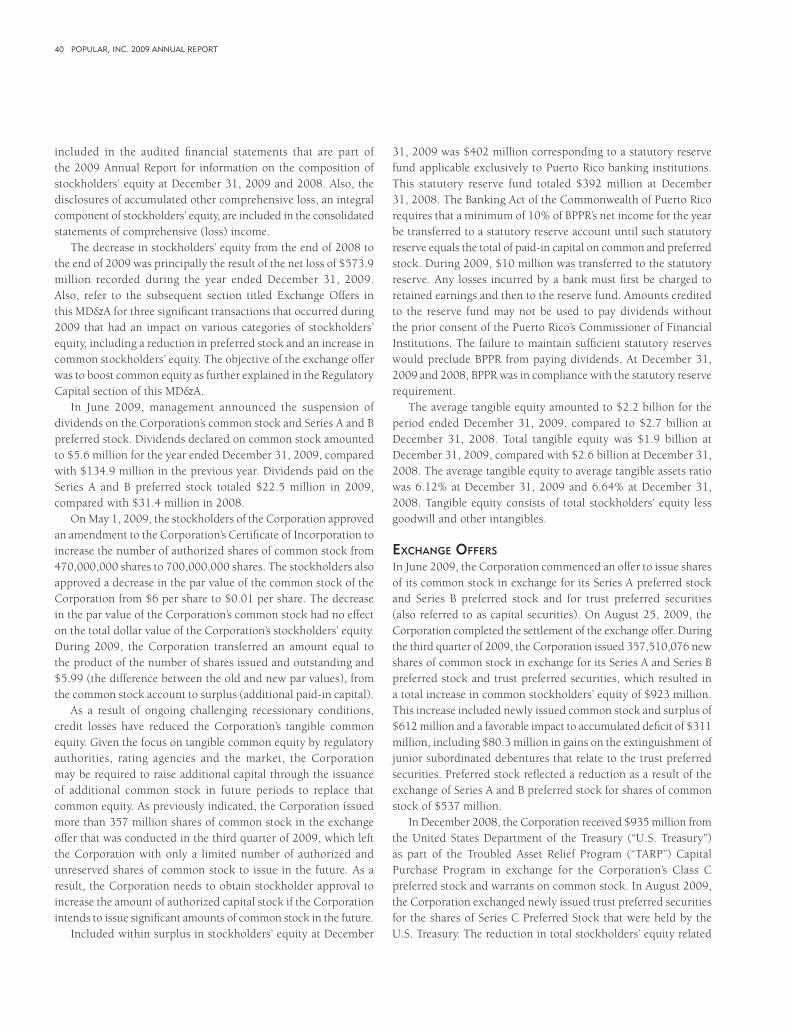
40 POPULAR, INC. 2009 ANNUAL REPORT
included in the audited fi nancial statements that are part of the 2009 Annual Report for information on the composition of stockholders’ equity at December 31, 2009 and 2008. Also, the disclosures of accumulated other comprehensive loss, an integral component of stockholders’ equity, are included in the consolidated statements of comprehensive (loss) income.
The decrease in stockholders’ equity from the end of 2008 to the end of 2009 was principally the result of the net loss of $573.9 million recorded during the year ended December 31, 2009. Also, refer to the subsequent section titled Exchange Offers in this MD&A for three signifi cant transactions that occurred during 2009 that had an impact on various categories of stockholders’ equity, including a reduction in preferred stock and an increase in common stockholders’ equity. The objective of the exchange offer was to boost common equity as further explained in the Regulatory Capital section of this MD&A.
In June 2009, management announced the suspension of dividends on the Corporation’s common stock and Series A and B preferred stock. Dividends declared on common stock amounted to $5.6 million for the year ended December 31, 2009, compared with $134.9 million in the previous year. Dividends paid on the Series A and B preferred stock totaled $22.5 million in 2009, compared with $31.4 million in 2008.
On May 1, 2009, the stockholders of the Corporation approved an amendment to the Corporation’s Certifi cate of Incorporation to increase the number of authorized shares of common stock from 470,000,000 shares to 700,000,000 shares. The stockholders also approved a decrease in the par value of the common stock of the Corporation from $6 per share to $0.01 per share. The decrease in the par value of the Corporation’s common stock had no effect on the total dollar value of the Corporation’s stockholders’ equity. During 2009, the Corporation transferred an amount equal to the product of the number of shares issued and outstanding and $5.99 (the difference between the old and new par values), from the common stock account to surplus (additional paid-in capital).
As a result of ongoing challenging recessionary conditions, credit losses have reduced the Corporation’s tangible common equity. Given the focus on tangible common equity by regulatory authorities, rating agencies and the market, the Corporation may be required to raise additional capital through the issuance of additional common stock in future periods to replace that common equity. As previously indicated, the Corporation issued more than 357 million shares of common stock in the exchange offer that was conducted in the third quarter of 2009, which left the Corporation with only a limited number of authorized and unreserved shares of common stock to issue in the future. As a result, the Corporation needs to obtain stockholder approval to increase the amount of authorized capital stock if the Corporation intends to issue signifi cant amounts of common stock in the future.
Included within surplus in stockholders’ equity at December
31, 2009 was $402 million corresponding to a statutory reserve fund applicable exclusively to Puerto Rico banking institutions. This statutory reserve fund totaled $392 million at December 31, 2008. The Banking Act of the Commonwealth of Puerto Rico requires that a minimum of 10% of BPPR’s net income for the year be transferred to a statutory reserve account until such statutory reserve equals the total of paid-in capital on common and preferred stock. During 2009, $10 million was transferred to the statutory reserve. Any losses incurred by a bank must fi rst be charged to retained earnings and then to the reserve fund. Amounts credited to the reserve fund may not be used to pay dividends without the prior consent of the Puerto Rico’s Commissioner of Financial Institutions. The failure to maintain suffi cient statutory reserves would preclude BPPR from paying dividends. At December 31, 2009 and 2008, BPPR was in compliance with the statutory reserve requirement.
The average tangible equity amounted to $2.2 billion for the period ended December 31, 2009, compared to $2.7 billion at December 31, 2008. Total tangible equity was $1.9 billion at December 31, 2009, compared with $2.6 billion at December 31, 2008. The average tangible equity to average tangible assets ratio was 6.12% at December 31, 2009 and 6.64% at December 31, 2008. Tangible equity consists of total stockholders’ equity less goodwill and other intangibles.
EXCHANGE OFFERS
In June 2009, the Corporation commenced an offer to issue shares of its common stock in exchange for its Series A preferred stock and Series B preferred stock and for trust preferred securities (also referred to as capital securities). On August 25, 2009, the Corporation completed the settlement of the exchange offer. During the third quarter of 2009, the Corporation issued 357,510,076 new shares of common stock in exchange for its Series A and Series B preferred stock and trust preferred securities, which resulted in a total increase in common stockholders’ equity of $923 million. This increase included newly issued common stock and surplus of $612 million and a favorable impact to accumulated defi cit of $311 million, including $80.3 million in gains on the extinguishment of junior subordinated debentures that relate to the trust preferred securities. Preferred stock refl ected a reduction as a result of the exchange of Series A and B preferred stock for shares of common stock of $537 million.
In December 2008, the Corporation received $935 million from the United States Department of the Treasury (“U.S. Treasury”) as part of the Troubled Asset Relief Program (“TARP”) Capital Purchase Program in exchange for the Corporation’s Class C preferred stock and warrants on common stock. In August 2009, the Corporation exchanged newly issued trust preferred securities for the shares of Series C Preferred Stock that were held by the U.S. Treasury. The reduction in total stockholders’ equity related
BOA22177_wo18_Popular.indd 40 3/3/2010 10:46:52 AM

41
to the U.S. Treasury exchange transaction at the exchange date was approximately $416 million, which was principally impacted by the reduction of $935 million of aggregate liquidation preference value of the Series C preferred stock, partially offset by the $519 million discount on the junior subordinated debentures.
The following sections provide further information on the exchange transactions described above. Also, refer to Note 21 to the consolidated fi nancial statements for detailed information on the exchange ratios, relevant price per share and fair value per share used for the exchange computations and accounting impact.
Exchange of preferred stock for common stockThe exchange by holders of shares of the Series A and B non-cumulative preferred stock for shares of common stock resulted in the extinguishment of such shares of preferred stock and an issuance of shares of common stock during 2009. The fi nancial impact at the exchange date of this particular transaction was mainly as follows: (i) reduction in preferred stock by $537 million, which represented the liquidation value of the shares of Series A and B preferred stock; (ii) increase in common stock and surplus by $294 million, which represented the fair value of the common stock issued (the Corporation recorded the par amount of the shares issued as common stock based on $0.01 per common share); (iii) decrease in accumulated defi cit of $230.4 million, which represented the excess of the carrying amount of the shares of preferred stock over the fair value of the shares of common stock; and (iv) recording of issuance costs. The decrease in accumulated defi cit was also considered as an increase in income (loss) for per common share (“EPS”) computations. Refer to the Overview section of this MD&A and Note 24 to the consolidated fi nancial statements for a reconciliation of EPS.
The decrease in total stockholders’ equity related to the exchange of shares of preferred stock for shares of common stock was approximately $4 million, net of issuance costs.
As previously indicated, the Corporation suspended dividends on the Corporation’s common and preferred stock during 2009.
Common stock issued in connection with early extinguishment of debt (exchange of trust preferred securities for common stock)As indicated previously, in August 2009, the Corporation exchanged trust preferred securities issued by different trusts for shares of common stock of the Corporation. The trust preferred securities were delivered to the trusts in return for the junior subordinated debentures (recorded as notes payable in the Corporation’s fi nancial statements) that had been issued by the Corporation to the trusts in the past. This transaction was accounted for as an early extinguishment of debt.
The major fi nancial impact of this debt extinguishment at the date of its occurrence was as follows: (i) the carrying value of
the junior subordinated debentures (notes payable) was reduced and common stock and surplus increased in the amount of the fair value of the common stock issued, which was approximately $318 million; (ii) the excess of the carrying amount of the junior subordinated debentures retired over the fair value of the common stock issued was recorded as a gain on early extinguishment of debt in the consolidated statement of operations for the year ended December 31, 2009, which amounted to $80.3 million; and (iii) recording of issuance costs.
The increase in total stockholders’ equity related to the exchange of trust preferred securities for shares of common stock at the exchange date was approximately $390 million, net of issuance costs, and including the aforementioned gain on the early extinguishment of debt.
The junior subordinated debentures paid interest at rates ranging from 6.125% to 8.327%. As indicated in the Net Interest Income section of this MD&A, the extinguishment of the junior subordinated debentures, in late August 2009, represented a reduction in interest expense of approximately $11.9 million for the year ended December 31, 2009 when compared with the year 2008.
Exchange of preferred stock held by the U.S. Treasury for trust preferred securitiesAs previously indicated, in August 2009, the Corporation and Popular Capital Trust III entered into an exchange agreement with the U.S. Treasury pursuant to which the U.S. Treasury agreed with the Corporation that they would exchange all 935,000 shares of the Corporation’s outstanding Fixed Rate Cumulative Perpetual Preferred Stock, Series C, $1,000 liquidation preference per share (the “Series C Preferred Stock”), owned by the U.S Treasury for 935,000 newly issued trust preferred securities, $1,000 liquidation amount per capital security. In connection with this exchange, the trust used the Series C preferred stock, together with the proceeds of the issuance and sale by the trust to the Corporation of $1 million aggregate liquidation amount of its fi xed rate common securities, to purchase $936 million aggregate principal amount of the junior subordinated debentures (notes payable) issued by the Corporation. The trust preferred securities issued to the U.S. Treasury have a distribution rate of 5% until, but excluding December 5, 2013, and 9% thereafter (which is the same as the dividend rate on the Series C Preferred Stock). The common securities of the trust, in the amount of $1 million, are held by the Corporation.
Under the exchange agreement, the Corporation’s agreement stated that, without the consent of the U.S. Treasury, it would not increase its dividend rate per share of common stock above that in effect as of October 14, 2008 ($0.08 per share) or repurchase shares of its common stock until, in each case, the earlier of December 5, 2011 or such time as all of the new trust preferred
BOA22177_wo18_Popular.indd 41 3/3/2010 10:46:52 AM

42 POPULAR, INC. 2009 ANNUAL REPORT
securities have been redeemed or transferred by the U.S. Treasury, remains in effect.
The warrant to purchase 20,932,836 shares of Popular’s common stock at an exercise price of $6.70 per share that was initially issued to the U.S Treasury in connection with the issuance of the Series C preferred stock on December 5, 2008 remains outstanding without amendment.
The trust preferred securities issued to the U.S. Treasury qualify as Tier 1 regulatory capital subject to the 25% limitation on Tier 1 capital.
The Corporation paid an exchange fee of $13 million to the U.S. Treasury in connection with the exchange of outstanding shares of Series C preferred stock for the new trust preferred securities. This exchange fee will be amortized through interest expense using the interest yield method over the estimated life of the junior subordinated debentures.
This transaction with the U.S. Treasury was accounted for as an extinguishment of previously issued Series C preferred stock. The accounting impact of this transaction included the following: (i) recognition of junior subordinated debentures; (ii) derecognition of the Series C preferred stock; (iii) recognition of a $485 million favorable impact to accumulated defi cit resulting from the excess of (a) the carrying amount of the securities exchanged (the Series C preferred stock) over (b) the fair value of the consideration exchanged (the trust preferred securities); (iv) the reversal of any unamortized discount outstanding on the Series C preferred stock and (v) recognition of issuance costs. The reduction in total stockholders’ equity related to the U.S. Treasury exchange transaction at the exchange date was approximately $416 million, which was principally impacted by the reduction of $935 million of aggregate liquidation preference value of the Series C preferred stock, partially offset by the $519 million discount on the junior subordinated debentures described in item (iii) above. This discount as well as the debt issue costs will be amortized through interest expense using the interest yield method over the estimated life of the junior subordinated debentures. During 2009, the Corporation recognized interest expense amounting to $23.5 million, including $7 million related to the accretion of the discount on these debentures.
This particular exchange resulted in a favorable impact to accumulated defi cit at the exchange date of $485.3 million, which is also considered in the income (loss) per common share computations. Refer to the Overview section and Note 24 to the consolidated fi nancial statements for a reconciliation of EPS.
The fair value of the trust preferred securities (junior subordinated debentures for purposes of the Corporation’s fi nancial statements) at the date of the exchange agreement was determined internally using a discounted cash fl ow model. The main considerations were (1) quarterly interest payment of 5% until, but excluding December 5, 2013, and 9% thereafter; (2)
assumed maturity date of 30 years, and (3) assumed discount rate of 16%. The assumed discount rate used for estimating the fair value was estimated by obtaining the yields at which comparably-rated issuers were trading in the market and considering the amount of trust preferred securities issued to the U.S. Treasury and the credit rating of the Corporation.
REGULATORY CAPITAL
Table I presents the Corporation’s capital adequacy information for the years 2005 through 2009. Note 25 to the consolidated fi nancial statements present further information on the Corporation’s regulatory capital requirements, including the regulatory capital ratios of its depository institutions, BPPR and BPNA.
To meet minimum, adequately-capitalized regulatory requirements, an institution must maintain a Tier 1 Capital ratio of 4% and a Total Capital ratio of 8%. A “well-capitalized” institution must generally maintain capital ratios 200 basis points higher than the minimum guidelines. The risk-based capital rules have been further supplemented by a Tier 1 Leverage ratio, defi ned as Tier 1 Capital divided by adjusted quarterly average total assets, after certain adjustments. “Well-capitalized” bank holding companies must have a minimum Tier 1 Leverage ratio of 5%. At December 31, 2009, the Corporation’s Tier 1 Capital, Total Capital and Tier 1 Leverage ratios were 9.81%, 11.13% and 7.50%, respectively. These ratios compare to 10.81%, 12.08% and 8.46%, respectively, at December 31, 2008. These classify the Corporation as “well-capitalized” for regulatory purposes, the highest classifi cation at both December 31, 2009 and 2008. BPPR and BPNA were also well-capitalized. The Corporation’s regulatory capital ratios for 2009 were negatively impacted by the following principal factors: (i) net loss for the third consecutive year; (ii) higher disallowance for total capital inclusion related to the allowance for loan losses, which is a critical component of the Corporation’s financial condition that management continued to increase during 2009; and (iii) an increase in the deferred tax assets disallowed for Tier 1 capital inclusion.
During 2009, the Corporation made capital contributions amounting to $590 million to its banking subsidiary BPNA to maintain BPNA’s capital ratios at well-capitalized levels.
Under regulatory capital adequacy guidelines, and other regulatory requirements, Popular, Inc. and its banking subsidiaries must meet guidelines that include quantitative measures of assets, liabilities and certain off-balance sheet items, subject to qualitative judgments by regulators regarding components, risk weightings and other factors. If the Corporation and its banking subsidiaries fail to meet these minimum capital guidelines and other regulatory requirements, the Corporation’s business and fi nancial condition will be materially and adversely affected. If the Corporation’s insured depository institution subsidiaries fail to maintain well-capitalized status under the regulatory framework, or are deemed
BOA22177_wo18_Popular.indd 42 3/3/2010 10:46:52 AM
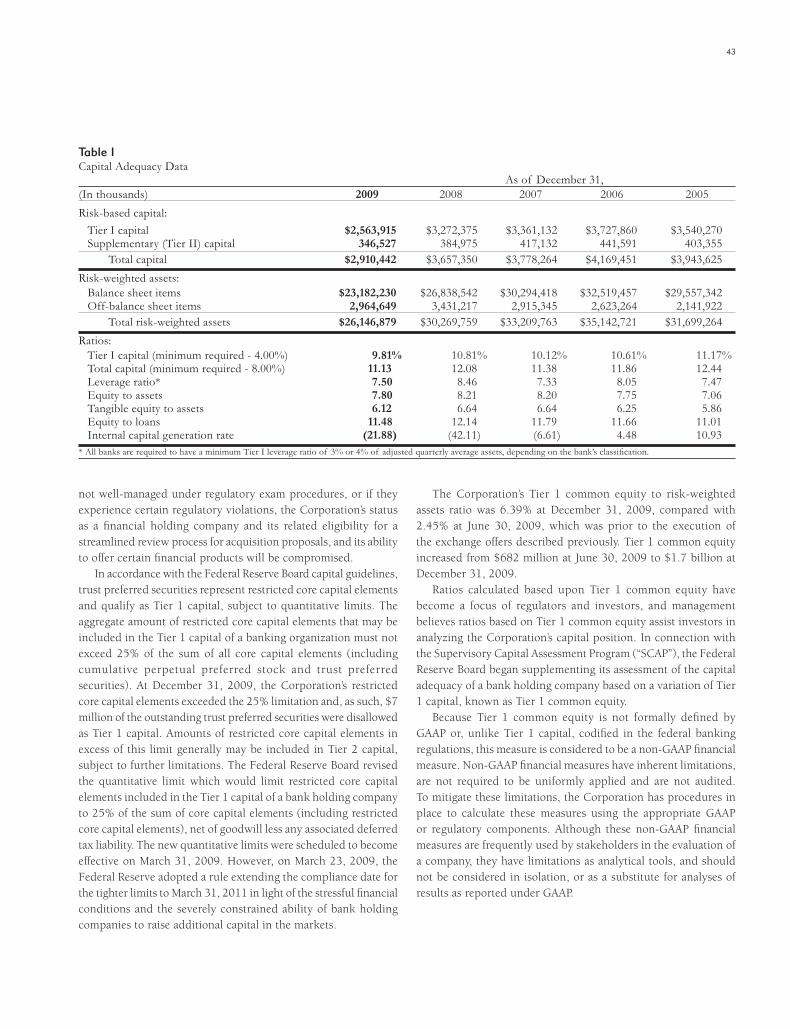
43
not well-managed under regulatory exam procedures, or if they experience certain regulatory violations, the Corporation’s status as a fi nancial holding company and its related eligibility for a streamlined review process for acquisition proposals, and its ability to offer certain fi nancial products will be compromised.
In accordance with the Federal Reserve Board capital guidelines, trust preferred securities represent restricted core capital elements and qualify as Tier 1 capital, subject to quantitative limits. The aggregate amount of restricted core capital elements that may be included in the Tier 1 capital of a banking organization must not exceed 25% of the sum of all core capital elements (including cumulative perpetual preferred stock and trust preferred securities). At December 31, 2009, the Corporation’s restricted core capital elements exceeded the 25% limitation and, as such, $7 million of the outstanding trust preferred securities were disallowed as Tier 1 capital. Amounts of restricted core capital elements in excess of this limit generally may be included in Tier 2 capital, subject to further limitations. The Federal Reserve Board revised the quantitative limit which would limit restricted core capital elements included in the Tier 1 capital of a bank holding company to 25% of the sum of core capital elements (including restricted core capital elements), net of goodwill less any associated deferred tax liability. The new quantitative limits were scheduled to become effective on March 31, 2009. However, on March 23, 2009, the Federal Reserve adopted a rule extending the compliance date for the tighter limits to March 31, 2011 in light of the stressful fi nancial conditions and the severely constrained ability of bank holding companies to raise additional capital in the markets.
The Corporation’s Tier 1 common equity to risk-weighted assets ratio was 6.39% at December 31, 2009, compared with 2.45% at June 30, 2009, which was prior to the execution of the exchange offers described previously. Tier 1 common equity increased from $682 million at June 30, 2009 to $1.7 billion at December 31, 2009.
Ratios calculated based upon Tier 1 common equity have become a focus of regulators and investors, and management believes ratios based on Tier 1 common equity assist investors in analyzing the Corporation’s capital position. In connection with the Supervisory Capital Assessment Program (“SCAP”), the Federal Reserve Board began supplementing its assessment of the capital adequacy of a bank holding company based on a variation of Tier 1 capital, known as Tier 1 common equity.
Because Tier 1 common equity is not formally defi ned by GAAP or, unlike Tier 1 capital, codifi ed in the federal banking regulations, this measure is considered to be a non-GAAP fi nancial measure. Non-GAAP fi nancial measures have inherent limitations, are not required to be uniformly applied and are not audited. To mitigate these limitations, the Corporation has procedures in place to calculate these measures using the appropriate GAAP or regulatory components. Although these non-GAAP fi nancial measures are frequently used by stakeholders in the evaluation of a company, they have limitations as analytical tools, and should not be considered in isolation, or as a substitute for analyses of results as reported under GAAP.
Table ICapital Adequacy Data As of December 31,(In thousands) 2009 2008 2007 2006 2005Risk-based capital: Tier I capital $2,563,915 $3,272,375 $3,361,132 $3,727,860 $3,540,270 Supplementary (Tier II) capital 346,527 384,975 417,132 441,591 403,355 Total capital $2,910,442 $3,657,350 $3,778,264 $4,169,451 $3,943,625Risk-weighted assets: Balance sheet items $23,182,230 $26,838,542 $30,294,418 $32,519,457 $29,557,342 Off-balance sheet items 2,964,649 3,431,217 2,915,345 2,623,264 2,141,922 Total risk-weighted assets $26,146,879 $30,269,759 $33,209,763 $35,142,721 $31,699,264Ratios: Tier I capital (minimum required - 4.00%) 9.81% 10.81% 10.12% 10.61% 11.17% Total capital (minimum required - 8.00%) 11.13 12.08 11.38 11.86 12.44 Leverage ratio* 7.50 8.46 7.33 8.05 7.47 Equity to assets 7.80 8.21 8.20 7.75 7.06 Tangible equity to assets 6.12 6.64 6.64 6.25 5.86 Equity to loans 11.48 12.14 11.79 11.66 11.01 Internal capital generation rate (21.88) (42.11) (6.61) 4.48 10.93* All banks are required to have a minimum Tier I leverage ratio of 3% or 4% of adjusted quarterly average assets, depending on the bank’s classifi cation.
BOA22177_wo18_Popular.indd 43 3/3/2010 10:46:52 AM

44 POPULAR, INC. 2009 ANNUAL REPORT
The table below reconciles the Corporation’s total common stockholders’ equity (GAAP) at December 31, 2009 to Tier 1 common equity as defined by the regulations issued by the Federal Reserve Board, FDIC and other bank regulatory agencies (non-GAAP).
Table - Non-GAAP Reconciliation December 31,(In thousands) 2009Common stockholders' equity $2,488,657Less: Unrealized gains on available for sale securities, net of tax (1) (91,068)Less: Disallowed deferred tax assets (2) (179,655)Less: Intangible assets Goodwill (604,349) Other disallowed intangibles (18,056)Less: Aggregate adjusted carrying value of all non-fi nancial equity investments (2,343)Add: Pension liability adjustment, net of tax and accumulated net gains (losses) on cash fl ow hedges (3) 78,488Total Tier 1 common equity $1,671,674(1) In accordance with regulatory risk-based capital guidelines, Tier 1 capital excludes net unrealized gains (losses) on available-for-sale debt securities and net unrealized gains on available-for-sale equity securities with readily determinable fair values. In arriving at Tier 1 capital, institutions are required to deduct net unrealized losses on available-for-sale equity securities with readily determinable fair values, net of tax.(2) Approximately $186 million of the Corporation’s $364 million net deferred tax assets at December 31, 2009, were included without limitation in regulatory capital pursuant to the risk-based capital guidelines, while approximately $180 million of such assets at December 31, 2009 exceeded the limitation imposed by these guidelines and, as “disallowed deferred tax assets,” were deducted in arriving at Tier 1 capital. The remaining $2 million of the Corporation’s other net deferred tax assets at December 31, 2009 represented primarily the following items (a) the deferred tax effects of unrealized gains and losses on available-for-sale debt securities, which are permitted to be excluded prior to deriving the amount of net deferred tax assets subject to limitation under the guidelines; (b) the deferred tax asset corresponding to the pension liability adjustment recorded as part of accumulated other comprehensive income; and (c) the deferred tax liability associated with goodwill and other intangibles.(3) The Federal Reserve Bank has granted interim capital relief for the impact of pension liability adjustment.
RISK MANAGEMENT
Managing risk is an essential component of the Corporation’s business. Risk identifi cation and monitoring are key elements in overall risk management. The Corporation has identifi ed the following nine principal risks which have been incorporated into the Corporation’s risk management program:
• Interest Rate Risk (“IRR”) – Interest rate risk is the risk to earnings or capital arising from changes in interest rates. The economic perspective focuses on the value of the Corporation in today's interest rate environment and the sensitivity of that value to changes in interest rates. Interest rate risk arises from differences between the timing of rate changes and the timing of cash fl ows (repricing risk); from changing rate relationships among different yield curves
affecting bank activities (basis risk); from changing rate relationships across the spectrum of maturities (yield curve risk); and from interest related options embedded in bank
products (options risk).• Market Risk – Potential for loss resulting from changes in
market factors that affect the value of traded instruments or its volatility in the Corporation’s or in any of its subsidiaries’ portfolio. Market risk arises from market-making, dealing and position-taking activities in interest rate, foreign exchange, equity and commodity markets.
• Liquidity Risk – Potential for loss resulting from the Corporation or its subsidiaries not being able to meet their obligations when they come due. This could be a result of market conditions, the ability of the Corporation to liquidate assets or manage or diversify various funding sources. This risk also encompasses the possibility that an instrument cannot be closed out or sold at its economic value, which might be a result of stress in the market or in a specifi c security type given its volume and maturity.
• Credit Risk – Potential for default or loss resulting from an obligor’s failure to meet the terms of any contract with the Corporation or any of its subsidiaries, or failure otherwise to perform as agreed. Credit risk arises from all activities where success depends on counterparty, issuer, or borrower performance.
• Operational Risk – This risk is the possibility that inadequate internal controls or procedures, human error, system failure or fraud can cause losses.
• Compliance Risk and Legal Risk – Potential for loss resulting from violations of or non-conformance with laws, rules, regulations, prescribed practices, existing contracts or ethical standards.
• Strategic Risk – Potential for loss arising from adverse business decisions or improper implementation of business decisions. Also, it incorporates how management analyzes external factors that impact the strategic direction of the Corporation.
• Reputational Risk – Potential for loss arising from negative public opinion.
The Corporation’s Board of Directors (the “Board”) has established a Risk Management Committee (“RMC”) to undertake the responsibilities of overseeing and approving the Corporation’s Risk Management Program.
The RMC will, as an oversight body, monitor and approve the overall business strategies, policies and procedures to identify, measure, monitor and control risks while maintaining the effectiveness and effi ciency of the business and operational processes. As an approval body, the RMC reviews and approves the Corporation’s risk management policies and critical processes. It also reports periodically to the Board about its activities.
BOA22177_wo18_Popular.indd 44 3/3/2010 10:46:52 AM

45
The Board and RMC have delegated to the Corporation’s management the implementation of the risk management processes. This implementation is split into two separate but coordinated efforts that include (i) business and / or operational units who identify, manage and control the risks resulting from their activities, and (ii) a Risk Management Group (“RMG”). In general, the RMG is mandated with responsibilities such as assessing and reporting to the Corporation’s management and RMC the risk positions of the Corporation, developing and implementing mechanisms, policies and procedures to identify, measure and monitor risks, and monitoring and testing the adequacy of the Corporation’s policies, strategies and guidelines. The RMG is responsible for the overall coordination of risk management efforts throughout the Corporation and is composed of four reporting divisions
(i) Credit Risk Management, (ii) Compliance, (iii) Operational Risk Management, and (iv) Auditing Division. Additionally, a Market Risk Manager was appointed during 2008 to provide an independent oversight of Treasury’s management of the market, interest and liquidity risks, and to evaluate the adequacy of policies and procedures to address and limit such risks.
Moreover, management oversight of the Corporation’s risk-taking and risk management activities is conducted through management committees:
• CRESCO (Credit Strategy Committee) – Manages the Corporation’s overall credit exposure and approves credit policies, standards and guidelines that defi ne, quantify, and monitor credit risk. Through this committee, management reviews asset quality ratios, trends and forecasts, problem
Table JCommon Stock Performance Cash Book Dividends Value Dividend Price/ Market/ Market Price Declared Per Payout Dividend Earnings Book High Low Per Share Share Ratio Yield * Ratio Ratio
2009 $3.89 N.M. 2.55% N.M. 58.10%4th quarter $2.80
$ 2.12
$0.00
3rd quarter 2.83
1.04
0.002nd quarter 3.66 2.19
0.00
1st quarter 5.52 1.47 0.02
2008 6.33 N.M. 6.17 N.M. 81.524th quarter $ 8.61 $ 4.90 $0.08 3rd quarter 11.17 5.12 0.082nd quarter 13.06 6.59 0.161st quarter 14.07 8.90 0.16
2007 12.12 N.M. 4.38 (39.26x) 87.464th quarter $12.51 $ 8.65 $0.163rd quarter 16.18 11.38 0.162nd quarter 17.49 15.82 0.161st quarter 18.94 15.82 0.16
2006 12.32 51.02% 3.26 14.48 145.704th quarter $19.66 $17.23 $0.163rd quarter 20.12 17.41 0.162nd quarter 21.98 18.53 0.161st quarter 21.20 19.54 0.16
2005 11.82 32.31 2.60 10.68 178.934th quarter $24.05 $20.10 $0.163rd quarter 27.52 24.22 0.162nd quarter 25.65 22.94 0.161st quarter 28.03 23.80 0.16
* Based on the average high and low market price for the four quarters. N.M. - Not meaningful.
BOA22177_wo18_Popular.indd 45 3/3/2010 10:46:52 AM

46 POPULAR, INC. 2009 ANNUAL REPORT
loans, establishes the provision for loan losses and assesses the methodology and adequacy of the allowance for loan losses on a quarterly basis.
• ALCO (Asset / Liability Management Committee) – Oversees and approves the policies and processes designed to ensure sound market risk and balance sheet strategies, including the interest rate, liquidity, investment and trading policies. Also, the ALCO monitors the capital position of the Corporation and is briefed on strategies to maintain capital at adequate levels.
• ORCO (Operational Risk Committee) – Monitors operational risk management activities to ensure the development and consistent application of operational risk policies, processes and procedures that measure, limit and manage the Corporation’s operational risks while maintaining the effectiveness and effi ciency of the operating and businesses’ processes.
There are other management committees such as the Fair Lending and the BSA / Anti-Money Laundering Committees that provide oversight of specifi c business risks.
Market / Interest Rate RiskThe financial results and capital levels of Popular, Inc. are constantly exposed to market, interest rate and liquidity risks. The ALCO and the Corporate Finance Group are responsible for planning and executing the Corporation’s market, interest rate risk, funding activities and strategy, and for implementing the policies and procedures approved by the RMC. In addition, a Market Risk Manager, who is part of the risk management group, has been appointed to enhance and strengthen controls surrounding interest, liquidity, and market risks, and independently monitor and report adherence with established policies. The ALCO meets on a monthly basis and reviews various asset and liability sensitivities, ratios and portfolio information, including but not limited to, the Corporation’s liquidity positions, projected sources and uses of funds, interest rate risk positions and economic conditions.
During 2009, the capital and credit markets continued to experience volatility and disruption, although corporate credit spreads declined considerably as general credit market conditions improved due in part to aggressive government intervention to supply liquidity and confi dence to the markets. The economic recession accelerated in late 2008 and continued to deepen into the fi rst half of 2009 but, based on the recent economic indicators, it appears that it has ended and the U.S. economy is expected to expand moderately in 2010. Nevertheless, Puerto Rico’s economy, however, continues in a recession for its fourth consecutive year. In general, during 2009, consumers experienced higher levels of stress as a result of higher unemployment levels as well as further declines in home prices, and businesses further reducing spending. Market instability has led many lenders and institutional investors
to reduce or cease providing funding to borrowers, including other fi nancial institutions. The market turmoil and tightening of credit have led to an increased level of commercial and consumer delinquencies, lack of consumer confi dence, increased market volatility and widespread reduction of business activity in general. A material rebound in economic activity in P.R. is not expected for 2010.
Financial services institutions are interrelated as a result of trading, clearing, counterparty, or other relationships. The Corporation has exposures to many different industries and counterparties, and management routinely executes transactions with counterparties in the fi nancial services industry, including brokers and dealers, commercial banks, and other institutional clients. Many of these transactions expose the Corporation to credit risk in the event of default of the Corporation’s counterparty or client. In addition, the Corporation’s credit risk may be exacerbated when the collateral held by it cannot be realized or is liquidated at prices not suffi cient to recover the full amount of the loan or derivative exposures. There is no assurance that any such losses would not materially and adversely affect the Corporation’s results of operations.
The Board of Governors of the Federal Reserve, which infl uences interest rates, lowered interbank borrowing rates during the year ended December 31, 2008 between 400 and 425 basis points, and, as indicated in the Net Interest Income section of this MD&A, remained at similar low levels during 2009.
The continued weakness in the overall economy and recent and proposed regulatory changes, some of which are described in the Overview section of this MD&A, may continue to affect many of the markets in which the Corporation does business and may adversely impact its fi nancial results for 2010. Although the U.S. is expected to expand modestly during the year, the P.R. economy may continue to contract for a longer period.
Interest Rate Risk Management considers IRR a potentially predominant risk in terms of its potential impact on profi tability or market value. As previously indicated, the Corporation is subject to various categories of IRR, including repricing, basis, yield curve and options risks. In addition, interest rates may have an indirect impact on loan demand, loan origination volume, the value of the Corporation’s investment securities holdings, gains and losses on sales of securities and loans, the value of mortgage servicing rights, and other sources of earnings. In limiting IRR to an acceptable level, management may alter the mix of fl oating and fi xed rate assets and liabilities, change pricing schedules, adjust maturities through sales and purchases of investment securities, and enter into derivative contracts, among other alternatives.
IRR management is an active process that encompasses monitoring loan and deposit fl ows complemented by investment
BOA22177_wo18_Popular.indd 46 3/3/2010 10:46:52 AM

47
and funding activities. Effective management of IRR begins with understanding the dynamic characteristics of assets and liabilities and determining the appropriate rate risk position given line of business forecasts, management objectives, market expectations and policy constraints.
The Corporation’s ALCO utilizes various tools for the management of IRR, including simulation modeling and static gap analysis for measuring short-term IRR. Economic value of equity (“EVE”) sensitivities analysis is used to monitor the level of long-term IRR assumed. The three methodologies complement each other and are used jointly to assist in the assessment of the Corporation’s IRR.
Net interest income simulation analysis performed by legal entity and on a consolidated basis is a tool used by the Corporation in estimating the potential change in net interest income resulting from hypothetical changes in interest rates. Sensitivity analysis is calculated using a simulation model which incorporates actual balance sheet fi gures detailed by maturity and interest yields or costs. It also incorporates assumptions on balance sheet growth and expected changes in its composition, estimated prepayments in accordance with projected interest rates, pricing and maturity expectations on new volumes and other non-interest related data. It is a dynamic process, emphasizing future performance under diverse economic conditions.
Management assesses IRR using various interest rate scenarios that differ in direction of interest rate changes, the degree of change over time, the speed of change and the projected shape of the yield curve. For example, the types of interest rate scenarios processed during the year included most likely economic scenarios, fl at rates, yield curve twists, +/- 200 and + 400 basis points parallel ramps and +/- 200 basis points parallel shocks. Management also performs analyses to isolate and measure basis and yield curve risk exposures, and prepayment risk. The asset and liability management group also performs validation procedures on various assumptions used as part of the sensitivity analysis as well as validations of results on a monthly basis. Due to the importance of critical assumptions in measuring market risk, the risk models incorporate third-party developed data for critical assumptions such as prepayment speeds on mortgage loans and mortgage-backed securities, estimates on the duration of the Corporation’s deposits and interest rate scenarios.
The Corporation runs net interest income simulations under interest rate scenarios in which the yield curve is assumed to rise and decline gradually by the same amount. The rising rate scenarios considered in these market risk disclosures refl ect gradual parallel changes of 200 and 400 basis points during the twelve-month period ending December 31, 2010. Under a 200 basis points rising rate scenario, 2010 projected net interest income increases by $59.8 million, while under a 400 basis points rising rate scenario, 2010 projected net interest income increases
by $103.2 million. These scenarios were compared against the Corporation’s unchanged interest rates forecast. Given the fact that at December 31, 2009 some market interest rates were close to zero, management has focused on measuring the risk on net interest income in rising rate scenarios.
Simulation analyses are based on many assumptions, including relative levels of market interest rates, interest rate spreads, loan prepayments and deposit decay. Thus, they should not be relied upon as indicative of actual results. Further, the estimates do not contemplate actions that management could take to respond to changes in interest rates. By their nature, these forward-looking computations are only estimates and may be different from what may actually occur in the future.
Static gap analysis measures the volume of assets and liabilities maturing or repricing at a future point in time. Static gap reports stratify all of the Corporation’s assets, liabilities and off-balance sheet positions according to the instrument’s maturity, repricing characteristics and optionality, assuming no new business. The repricing volumes typically include adjustments for anticipated future asset prepayments and for differences in sensitivity to market rates. The volume of assets and liabilities repricing during future periods, particularly within one year, is used as one short-term indicator of IRR. Depending on the duration and repricing characteristics, changes in interest rates could either increase or decrease the level of net interest income. For any given period, the pricing structure of the assets and liabilities is matched when an equal amount of such assets and liabilities mature or reprice in that period. Any mismatch of interest earning assets and interest bearing liabilities is known as a gap position. A positive gap denotes asset sensitivity, which means that an increase in interest rates could have a positive effect on net interest income, while a decrease in interest rates could have a negative effect on net interest income. As shown in Table K, at December 31, 2009, the Corporation’s one-year cumulative positive gap was $3.3 billion, or 10.15% of total earning assets. These static measurements do not refl ect the results of any projected activity and are best used as early indicators of potential interest rate exposures. They do not incorporate possible action that could be taken to manage the Corporation’s IRR, nor do they capture the basis risks that might be included within that cumulative gap, given possible changes in the spreads between asset rates and the rates used to fund them.
The Corporation uses EVE (economic value of equity) analysis to estimate the sensitivity of the Corporation’s assets and liabilities to changes in interest rates. EVE is equal to the estimated present value of the Corporation’s assets minus the estimated present value of the liabilities. This sensitivity analysis is a useful tool to measure long-term IRR because it captures the impact of up or down rate changes in expected cash fl ows, including principal and interest, from all future periods.
BOA22177_wo18_Popular.indd 47 3/3/2010 10:46:52 AM

48 POPULAR, INC. 2009 ANNUAL REPORT
EVE is estimated on a monthly basis and shock scenarios are prepared on a quarterly basis. The shock scenarios consist of +/- 200 basis points parallel shocks. Minimum EVE ratio limits, expressed as EVE as a percentage of total assets, have been established for base case and shock scenarios. In addition, management has also defi ned limits for the increases / decreases in EVE resulting from the shock scenarios. At December 31, 2009, the Corporation was in compliance with these limits.
The Corporation’s loan and investment portfolios are subject to prepayment risk, which results from the ability of a third-party to repay debt obligations prior to maturity. At December 31, 2009, net discount associated with loans represented less than 1% of the total loan portfolio, while net premiums associated with portfolios of AFS and HTM securities approximated 1% of these investment securities portfolios. Prepayment risk also could have a signifi cant impact on the duration of mortgage-backed securities and collateralized mortgage obligations, since prepayments could shorten the weighted average life of these portfolios. Table L, which presents the maturity distribution of earning assets, takes into consideration prepayment assumptions.
Trading The Corporation’s trading activities are another source of market risk and are subject to policies and risk guidelines approved by the Board to manage such risks. The objective of trading activity at the Corporation is to realize profi ts by buying or selling acceptable securities based on prudent trading strategies, taking advantage of expected market direction or volatility, or to hedge some type of market risk. This is mostly limited to mortgage banking activities. Popular Securities, the Corporation’s broker-dealer business, also has as an additional objective of maintaining inventory positions for customer resale.
Trading positions in the mortgage banking business, which are mostly agency mortgage-backed securities, are hedged in the agency “to be announced” (“TBA”) market. In anticipation of customer demand, the Corporation carries an inventory of capital market instruments and maintains market liquidity by quoting bid and offer prices and trading with other market makers and clients. Positions are also taken in interest rate sensitive instruments, based on expectations of future market conditions. These activities constitute the proprietary trading business and are conducted by the Corporation to provide customers with securities inventory and liquidity.
Trading instruments are recognized at fair value, with changes resulting from fl uctuations in market prices, interest rates or exchange rates reported in current period income. Further information on the Corporation’s risk management and trading activities is included in Note 31 to the consolidated fi nancial statements.
In the opinion of management, the size and composition of the trading portfolio does not represent a signifi cant source of market risk for the Corporation.
At December 31, 2009, the trading portfolio of the Corporation amounted to $462 million and represented 1% of total assets, compared with $646 million and 2% a year earlier. Mortgage-backed securities represented 93% of the trading portfolio at the end of 2009, compared with 92% in 2008. The mortgage-backed securities are investment grade securities, all of which are rated AAA by at least one of the three major rating agencies at December 31, 2009. A signifi cant portion of the trading portfolio is hedged against market risk by positions that offset the risk assumed. This portfolio was composed of the following at December 31, 2009:
Table - Trading Portfolio
Weighted(Dollars in thousands) Amount Average Yield*
Mortgage-backed securities $431,375 5.73%Collateralized mortgage obligations 3,955 5.32U.S. Treasury and agencies 369 3.57Puerto Rico and U.S. Government obligations 13,427 5.52Interest-only strips 1,551 15.67Other 11,759 6.94
Total $462,436 5.79%
*Not on a taxable equivalent basis.
The level of market risk assumed by trading activities at some subsidiaries of the Corporation is subject to limits, such as those measured by its 7-day value-at-risk (“VAR”) with a confi dence level of 99%. The VAR measures the maximum estimated loss that may occur over a 7-day holding period in the course of its risk taking activities with 99% confi dence. Its purpose is to describe the amount of capital needed to absorb potential losses from adverse market volatility. Additionally, inventory position limits for selected business units are used to manage our exposure to market risk.
At December 31, 2009, the trading portfolio of the Corporation had a 7-day value at risk (VAR) of approximately $3.4 million, assuming a confidence level of 99%. There are numerous assumptions and estimates associated with VAR modeling, and actual results could differ from these assumptions and estimates. Backtesting is performed to compare actual results against maximum estimated losses, in order to evaluate model and assumptions accuracy.
The Corporation enters into forward contracts to sell mortgage-backed securities with terms lasting less than three months, which are accounted for as trading derivatives. These contracts are recognized at fair value with changes directly reported in current period income. Refer to the Derivatives section that follows in this MD&A for additional information. At December 31, 2009, the fair value of these forward contracts was not signifi cant.
BOA22177_wo18_Popular.indd 48 3/3/2010 10:46:52 AM
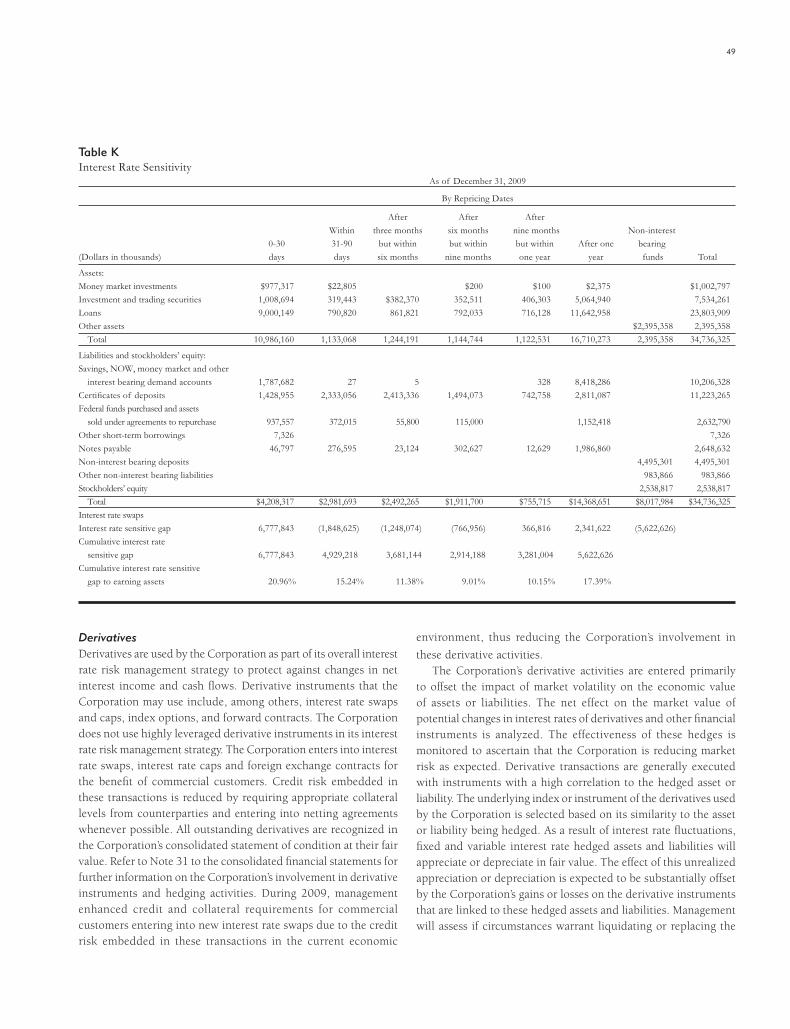
49
DerivativesDerivatives are used by the Corporation as part of its overall interest rate risk management strategy to protect against changes in net interest income and cash fl ows. Derivative instruments that the Corporation may use include, among others, interest rate swaps and caps, index options, and forward contracts. The Corporation does not use highly leveraged derivative instruments in its interest rate risk management strategy. The Corporation enters into interest rate swaps, interest rate caps and foreign exchange contracts for the benefi t of commercial customers. Credit risk embedded in these transactions is reduced by requiring appropriate collateral levels from counterparties and entering into netting agreements whenever possible. All outstanding derivatives are recognized in the Corporation’s consolidated statement of condition at their fair value. Refer to Note 31 to the consolidated fi nancial statements for further information on the Corporation’s involvement in derivative instruments and hedging activities. During 2009, management enhanced credit and collateral requirements for commercial customers entering into new interest rate swaps due to the credit risk embedded in these transactions in the current economic
environment, thus reducing the Corporation’s involvement in
these derivative activities.The Corporation’s derivative activities are entered primarily
to offset the impact of market volatility on the economic value of assets or liabilities. The net effect on the market value of potential changes in interest rates of derivatives and other fi nancial instruments is analyzed. The effectiveness of these hedges is monitored to ascertain that the Corporation is reducing market risk as expected. Derivative transactions are generally executed with instruments with a high correlation to the hedged asset or liability. The underlying index or instrument of the derivatives used by the Corporation is selected based on its similarity to the asset or liability being hedged. As a result of interest rate fl uctuations, fi xed and variable interest rate hedged assets and liabilities will appreciate or depreciate in fair value. The effect of this unrealized appreciation or depreciation is expected to be substantially offset by the Corporation’s gains or losses on the derivative instruments that are linked to these hedged assets and liabilities. Management will assess if circumstances warrant liquidating or replacing the
Table KInterest Rate Sensitivity As of December 31, 2009
By Repricing Dates After After After Within three months six months nine months Non-interest 0-30 31-90 but within but within but within After one bearing(Dollars in thousands) days days six months nine months one year year funds Total
Assets:Money market investments $977,317 $22,805 $200 $100 $2,375 $1,002,797Investment and trading securities 1,008,694 319,443 $382,370 352,511 406,303 5,064,940 7,534,261Loans 9,000,149 790,820 861,821 792,033 716,128 11,642,958 23,803,909Other assets $2,395,358 2,395,358 Total 10,986,160 1,133,068 1,244,191 1,144,744 1,122,531 16,710,273 2,395,358 34,736,325
Liabilities and stockholders’ equity:Savings, NOW, money market and other interest bearing demand accounts 1,787,682 27 5 328 8,418,286 10,206,328Certifi cates of deposits 1,428,955 2,333,056 2,413,336 1,494,073 742,758 2,811,087 11,223,265Federal funds purchased and assets sold under agreements to repurchase 937,557 372,015 55,800 115,000 1,152,418 2,632,790Other short-term borrowings 7,326 7,326Notes payable 46,797 276,595 23,124 302,627 12,629 1,986,860 2,648,632Non-interest bearing deposits 4,495,301 4,495,301Other non-interest bearing liabilities 983,866 983,866Stockholders’ equity 2,538,817 2,538,817 Total $4,208,317 $2,981,693 $2,492,265 $1,911,700 $755,715 $14,368,651 $8,017,984 $34,736,325Interest rate swaps Interest rate sensitive gap 6,777,843 (1,848,625) (1,248,074) (766,956) 366,816 2,341,622 (5,622,626)Cumulative interest rate sensitive gap 6,777,843 4,929,218 3,681,144 2,914,188 3,281,004 5,622,626Cumulative interest rate sensitive gap to earning assets 20.96% 15.24% 11.38% 9.01% 10.15% 17.39%
BOA22177_wo18_Popular.indd 49 3/3/2010 10:46:52 AM
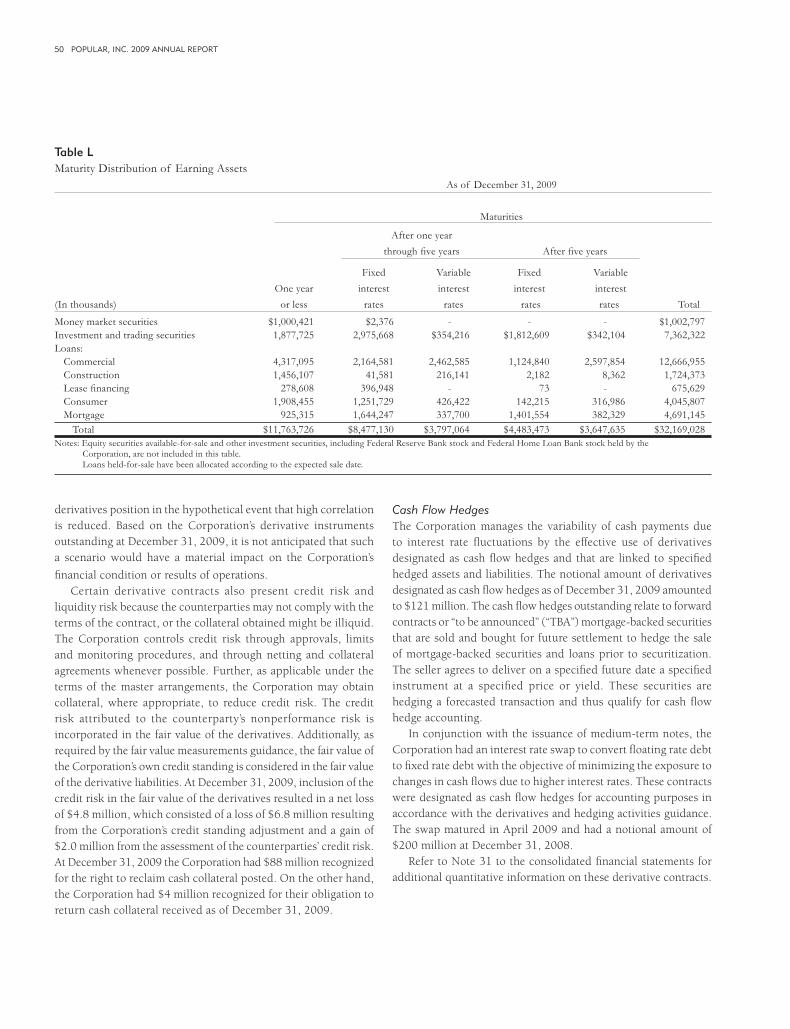
50 POPULAR, INC. 2009 ANNUAL REPORT
derivatives position in the hypothetical event that high correlation is reduced. Based on the Corporation’s derivative instruments outstanding at December 31, 2009, it is not anticipated that such a scenario would have a material impact on the Corporation’s
fi nancial condition or results of operations. Certain derivative contracts also present credit risk and
liquidity risk because the counterparties may not comply with the terms of the contract, or the collateral obtained might be illiquid. The Corporation controls credit risk through approvals, limits and monitoring procedures, and through netting and collateral agreements whenever possible. Further, as applicable under the terms of the master arrangements, the Corporation may obtain collateral, where appropriate, to reduce credit risk. The credit risk attributed to the counterparty’s nonperformance risk is incorporated in the fair value of the derivatives. Additionally, as required by the fair value measurements guidance, the fair value of the Corporation’s own credit standing is considered in the fair value of the derivative liabilities. At December 31, 2009, inclusion of the credit risk in the fair value of the derivatives resulted in a net loss of $4.8 million, which consisted of a loss of $6.8 million resulting from the Corporation’s credit standing adjustment and a gain of $2.0 million from the assessment of the counterparties’ credit risk. At December 31, 2009 the Corporation had $88 million recognized for the right to reclaim cash collateral posted. On the other hand, the Corporation had $4 million recognized for their obligation to return cash collateral received as of December 31, 2009.
Cash Flow HedgesThe Corporation manages the variability of cash payments due to interest rate fl uctuations by the effective use of derivatives designated as cash fl ow hedges and that are linked to specifi ed hedged assets and liabilities. The notional amount of derivatives designated as cash fl ow hedges as of December 31, 2009 amounted to $121 million. The cash fl ow hedges outstanding relate to forward contracts or “to be announced” (“TBA”) mortgage-backed securities that are sold and bought for future settlement to hedge the sale of mortgage-backed securities and loans prior to securitization. The seller agrees to deliver on a specifi ed future date a specifi ed instrument at a specifi ed price or yield. These securities are hedging a forecasted transaction and thus qualify for cash fl ow hedge accounting.
In conjunction with the issuance of medium-term notes, the Corporation had an interest rate swap to convert fl oating rate debt to fi xed rate debt with the objective of minimizing the exposure to changes in cash fl ows due to higher interest rates. These contracts were designated as cash fl ow hedges for accounting purposes in accordance with the derivatives and hedging activities guidance. The swap matured in April 2009 and had a notional amount of $200 million at December 31, 2008.
Refer to Note 31 to the consolidated fi nancial statements for additional quantitative information on these derivative contracts.
Table LMaturity Distribution of Earning Assets As of December 31, 2009
Maturities
After one year through fi ve years After fi ve years
Fixed Variable Fixed Variable One year interest interest interest interest(In thousands) or less rates rates rates rates Total
Money market securities $1,000,421 $2,376 - - - $1,002,797Investment and trading securities 1,877,725 2,975,668 $354,216 $1,812,609 $342,104 7,362,322Loans: Commercial 4,317,095 2,164,581 2,462,585 1,124,840 2,597,854 12,666,955 Construction 1,456,107 41,581 216,141 2,182 8,362 1,724,373 Lease fi nancing 278,608 396,948 - 73 - 675,629 Consumer 1,908,455 1,251,729 426,422 142,215 316,986 4,045,807 Mortgage 925,315 1,644,247 337,700 1,401,554 382,329 4,691,145 Total $11,763,726 $8,477,130 $3,797,064 $4,483,473 $3,647,635 $32,169,028Notes: Equity securities available-for-sale and other investment securities, including Federal Reserve Bank stock and Federal Home Loan Bank stock held by the Corporation, are not included in this table. Loans held-for-sale have been allocated according to the expected sale date.
BOA22177_wo18_Popular.indd 50 3/3/2010 10:46:52 AM
51
Fair Value HedgesThe Corporation did not have any derivatives designated as fair value hedges during December 31, 2009 and 2008.
Trading and Non-Hedging Derivative ActivitiesThe Corporation enters into derivative positions based on market expectations or to benefit from price differentials between fi nancial instruments and markets mostly to economically hedge a related asset or liability. The Corporation also enters into various derivatives to provide these types of derivative products to customers. These free-standing derivatives are carried at fair value with changes in fair value recorded as part of the results of operations for the period.
Following is a description of the most significant of the Corporation’s derivative activities that are not designated for hedge accounting. Refer to Note 31 to the consolidated fi nancial statements for additional quantitative and qualitative information on these derivative instruments.
At December 31, 2009, the Corporation had outstanding $2.0 billion in notional amount of interest rate swap agreements with a net negative fair value of $4.2 million, which were not designated as accounting hedges. These swaps were entered in the Corporation’s capacity as an intermediary on behalf of its customers and their offsetting swap position.
For the year ended December 31, 2009, the impact of the mark-to-market of interest rate swaps not designated as accounting hedges was a net decrease in earnings of approximately $6.5 million, recorded in the other operating income category of the statement of operations, compared with an earnings reduction of approximately $2.5 million in 2008, mainly in the interest expense category.
At December 31, 2009, the Corporation had forward contracts with a notional amount of $165 million and a positive fair value of $1 million not designated as accounting hedges. These forward contracts are considered derivatives and are recorded at fair value. Subsequent changes in the value of these forward contracts are recorded in the statement of operations. For the year ended December 31, 2009, the impact of the mark-to-market of the forward contracts not designated as accounting hedges was a reduction to non-interest income of $12.5 million, which was included in the category of trading account profi t in the consolidated statement of operations. In 2008, the unfavorable impact in non-interest income of $15.3 million was included in the categories of trading account profi t and gain on sale of loans.
Furthermore, the Corporation has over-the-counter option contracts which are utilized in order to limit the Corporation’s exposure on customer deposits whose returns are tied to the S&P 500 or to certain other equity securities or commodity indexes. The Corporation, through its Puerto Rico banking subsidiary, BPPR,
offers certifi cates of deposit with returns linked to these indexes to its retail customers, principally in connection with IRA accounts, and certifi cates of deposit sold through its broker-dealer subsidiary. At December 31, 2009, these deposits amounted to $84 million, or less than 1% of the Corporation’s total deposits. In these certifi cates, the customer’s principal is guaranteed by BPPR and insured by the FDIC to the maximum extent permitted by law. The instruments pay a return based on the increase of these indexes, as applicable, during the term of the instrument. Accordingly, this product gives customers the opportunity to invest in a product that protects the principal invested but allows the customer the potential to earn a return based on the performance of the indexes.
The risk of issuing certifi cates of deposit with returns tied to the applicable indexes is hedged by BPPR. BPPR purchases index options from fi nancial institutions with strong credit standings, whose return is designed to match the return payable on the certifi cates of deposit issued by BPPR. By hedging the risk in this manner, the effective cost of the deposits raised by this product is fi xed. The contracts have a maturity and an index equal to the terms of the pool of client’s deposits they are economically hedging.
The purchased option contracts are initially accounted for at cost (i.e., amount of premium paid) and recorded as a derivative asset. The derivative asset is marked-to-market on a quarterly basis with changes in fair value charged to earnings. The deposits are hybrid instruments containing embedded options that must be bifurcated in accordance with the derivatives and hedging activities guidance. The initial value of the embedded option (component of the deposit contract that pays a return based on changes in the applicable indexes) is bifurcated from the related certifi cate of deposit and is initially recorded as a derivative liability and a corresponding discount on the certifi cate of deposit is recorded. Subsequently, the discount on the deposit is accreted and included as part of interest expense while the bifurcated option is marked-to-market with changes in fair value charged to earnings.
The purchased index options are used to economically hedge the bifurcated embedded option. These option contracts do not qualify for hedge accounting and therefore cannot be designated as accounting hedges. At December 31, 2009, the notional amount of the index options on deposits approximated $111 million with a fair value of $7 million (asset) while the embedded options had a notional value of $84 million with a fair value of $5 million (liability).
Refer to Note 31 to the consolidated fi nancial statements for a description of other non-hedging derivative activities utilized by the Corporation during 2009 and 2008.
Foreign ExchangeThe Corporation conducts business in certain Latin American markets through several of its processing and information technology services and products subsidiaries. Also, it holds
BOA22177_wo18_Popular.indd 51 3/3/2010 10:46:52 AM

52 POPULAR, INC. 2009 ANNUAL REPORT
interests in Consorcio de Tarjetas Dominicanas, S.A. (“CONTADO”) and Centro Financiero BHD, S.A. (“BHD”) in the Dominican Republic. Although not signifi cant, some of these businesses are conducted in the country’s foreign currency. The resulting foreign currency translation adjustment, from operations for which the functional currency is other than the U.S. dollar, is reported in accumulated other comprehensive loss in the consolidated statements of condition, except for highly-infl ationary environments in which the effects would be included in other operating income in the consolidated statements of operations.
At December 31, 2009, the Corporation had approximately $41 million in an unfavorable foreign currency translation adjustment as part of accumulated other comprehensive loss, compared to unfavorable adjustments of $39 million at December 31, 2008 and $35 million at December 31, 2007. During those years, the Corporation did not record any remeasurement gains or losses in its consolidated statements of operations as the economies were not considered highly-infl ationary environments.
EVERTEC operates in Venezuela through its wholly-owned subsidiary EVERTEC – Venezuela. On January 7, 2010, Venezuela’s National Consumer Price Index for December 2009 was released. The cumulative three-year infl ation rates for both of Venezuela’s infl ation indices are over 100 percent. The Corporation calculated the cumulative three-year infl ation rate on a blended basis by using the Consumer Price Index (“CPI”) for 2006 and 2007, and the National Consumer Price Index (“NCPI”) for 2008 and 2009. The blended CPI/NCPI reached cumulative three-year infl ation in excess of 100% at November 30, 2009. Therefore, the Corporation will begin considering Venezuela’s economy to be highly infl ationary as of January 1, 2010, and the fi nancial statements of EVERTEC - Venezuela will need to be remeasured as if the functional currency was the reporting currency as of such date. ASC Section 830-10-45-11 defi nes a highly infl ationary economy as one with a cumulative infl ation rate of approximately 100 percent or more over a three-year period. Under ASC Topic 830, if a country’s economy is classifi ed as highly infl ationary, the functional currency of the foreign entity operating in that country must be remeasured to the functional currency of the reporting entity. The impact of remeasuring the fi nancial statements of EVERTEC – Venezuela at January 1, 2010, using the parallel market rate of Bs6.33/US$1, is estimated at $2 million. Total assets for EVERTEC - Venezuela remeasured at the parallel rate approximated $5 million at January 1, 2010.
LiquidityThe objective of effective liquidity management is to ensure that the Corporation remains suffi ciently liquid to meet all of its fi nancial obligations, fi nance expected future growth and maintains a reasonable safety margin for cash commitments under both normal and stressed market conditions.
An institution’s liquidity may be pressured if, for example, its credit rating is downgraded, it experiences a sudden and unexpected substantial cash outfl ow, or some other event causes counterparties to avoid exposure to the institution. An institution is also exposed to liquidity risk if the markets on which it depends on are subject to temporary disruptions.
The Board is responsible for establishing Popular’s tolerance for liquidity risk, including approving relevant risk limits and policies. The Board has delegated the monitoring of these risks to the RMC and the ALCO. In addition to the risk management activities of ALCO, Popular has a Market Risk Management function that provides independent oversight of market and liquidity risk activities. The management of liquidity risk, on long-term and day-to-day basis, is the responsibility of the Corporate Treasury Division. The Corporation’s Corporate Treasurer is responsible for implementing the policies and procedures approved by the Board and for monitoring the liquidity position on an ongoing basis. Also, the Corporate Treasury Division coordinates corporate wide liquidity management strategies and activities with the reportable segments, oversees policy breaches and manages the escalation process.
After substantial volatility and disruptions in late 2007 and 2008, the credit markets improved substantially in 2009. Credit spreads on non-government obligations contracted materially as they returned to more normalized levels. This was helped by the myriad funding programs introduced by the U.S. Government, which have been helpful in restoring more normal market conditions. However, disrupted market conditions have increased the Corporation’s liquidity risk exposure due primarily to increased risk aversion on the part of traditional credit providers, as well as the material declines in our credit ratings that occurred in 2009. While the Corporation’s management has implemented various strategies in the recent years to reduce liquidity exposure, such as substantially reducing the use of short-term and long-term unsecured borrowings, promoting customer deposit growth through traditional banking and internet channels, diversifying and increasing its contingency funding sources as well as exiting certain non-banking subsidiaries, a resurgence of substantial market stress could negatively influence the availability of credit to the Corporation, as well as its cost. The Corporation’s credit downgrades, as well as the economic conditions in the Corporation’s main market have hindered its ability to issue debt in the capital markets.
The Corporation obtains liquidity from both sides of the balance sheet as well as from off-balance-sheet activities. Liquid assets can be quickly and easily converted to cash at a reasonable cost, or are timed to mature when management anticipates a need for additional liquidity. The Corporation’s investment portfolio, including money markets such as fed funds sold and loans that can be pledged at the FHLBs and the FED, are used to manage
BOA22177_wo18_Popular.indd 52 3/3/2010 10:46:52 AM

53
Popular’s liquidity needs. On the liability side, diversifi ed sources of deposits and secured credit facilities provide liquidity to Popular’s operations. Even if some of these alternatives may not be available temporarily, it is expected that in the normal course of business, the Corporation’s funding sources are adequate.
Deposits, including customer deposits, brokered certifi cates of deposit, and public funds deposits, continue to be the most signifi cant source of funds for the Corporation, totaling $25.9 billion, and funding 75% of the Corporation’s total assets at December 31, 2009.
In addition to traditional deposits, the Corporation maintains borrowing arrangements. These borrowings consisted primarily of FHLB borrowings, securities sold under agreement to repurchase, junior subordinated deferrable interest debentures, and term notes. Refer to Notes 17, 18 and 19 to the consolidated fi nancial statements for the composition of the Corporation’s borrowings at December 31, 2009. Also, refer to Notes 32 and 34 to the consolidated fi nancial statements for the Corporation’s involvement in certain commitments and guarantees at December 31, 2009.
Federal funds purchased and assets sold under agreements to repurchase at December 31, 2009 presented a reduction of $919 million compared with December 31, 2008, principally in repurchase agreements which declined by $774 million. This decline was mostly due to deleverage strategies used by the Corporation, upon the sale of part of the investment securities portfolio earlier in 2009. There were no federal funds purchased at December 31, 2009, compared with $145 million at December 31, 2008.
A summary of the most signifi cant changes in the Corporation’s funding sources during the year ended December 31, 2009, compared with the previous year, follows:
• reduction in time deposits of $1.9 billion, including a decline of $0.4 billion in brokered deposits, the impact of branch closures and branch sales in the U.S. mainland operations, and lower deposit volumes gathered through the internet platform;
• repayment of $803 million in term notes during the year ended December 31, 2009; and
• a reduction in junior subordinated debentures of $410 million that were associated with the four trusts that issued trust preferred securities prior to December 31, 2008 and an increase of $424 million in junior subordinated debentures related to the new trust preferred securities issued to the U.S. Treasury (in exchange for the preferred stock under the TARP). Refer to the Exchange Offers section of this MD&A for further information.
Liquidity is managed by the Corporation at the level of the holding companies that own the banking and non-banking subsidiaries. Also, it is managed at the level of the banking and non-banking subsidiaries. The Corporation has adopted policies
and limits to monitor more effectively the Corporation’s liquidity position and that of the banking subsidiaries. Additionally, contingency funding plans are used to model various stress events of different magnitudes and affecting different time horizons that assist management in evaluating the size of the liquidity buffers needed if those stress events occur. However, such models may not predict accurately how the market and customers might react to every event, and are dependent on many assumptions.
The following sections provide further information on the Corporation’s major funding activities and needs, as well as the risks involved in these activities. A detailed description of the Corporation’s borrowings and available lines of credit, including its terms, is included in Notes 17 through 20 to the consolidated fi nancial statements. Also, the consolidated statements of cash fl ows in the accompanying consolidated fi nancial statements, provide information on the Corporation’s cash inflows and outfl ows.
Banking SubsidiariesPrimary sources of funding for the Corporation’s banking subsidiaries (BPPR and BPNA), or “the banking subsidiaries,” include retail and commercial deposits, brokered deposits, collateralized borrowings and, to a lesser extent, loan sales. Also, as indicated in the Regulatory Capital section of this MD&A, during 2009, BPNA received substantial capital contributions in order to maintain its well-capitalized status. In addition, the Corporation’s banking subsidiaries maintain borrowing facilities with the Federal Home Loan Bank (“FHLB”) and at the discount window of the Federal Reserve Bank of New York (“Fed”), and have a considerable amount of collateral pledged that can be used to quickly raise funds under these facilities. Borrowings from the FHLB or the Fed discount window require the Corporation to pledge securities or whole loans as collateral. The banking subsidiaries must maintain their FHLB memberships to continue accessing this source of funding. The principal uses of funds for the banking subsidiaries include loan originations, investment portfolio purchases, repayment of maturing obligations (including deposits), operational expenses, and in the case of BPPR, dividend payments to the holding company. Also, the banking subsidiaries assume liquidity risk related to collateral posting requirements for some derivative transactions and recourse obligations; off-balance sheet activities mainly in connection with contractual commitments; recourse provisions; servicing advances; derivatives and support to several mutual funds administered by BPPR.
The bank operating subsidiaries maintain suffi cient funding capacity to address large increases in funding requirements such as deposit outfl ows. This capacity is comprised mainly of available liquidity derived from secured funding sources, as well as on-balance sheet liquidity in the form of balances maintained at the FED and FHLB and liquid unpledged securities.
BOA22177_wo18_Popular.indd 53 3/3/2010 10:46:52 AM

54 POPULAR, INC. 2009 ANNUAL REPORT
The Corporation’s ability to compete successfully in the marketplace for deposits, excluding brokered deposits, depends on various factors, including pricing, service, convenience and fi nancial stability as refl ected by operating results, credit ratings (by nationally recognized credit rating agencies), and importantly, FDIC deposit insurance. Although a downgrade in the credit rating of the Corporation may impact its ability to raise retail and commercial deposits or the rate that it is required to pay on such deposits, management does not believe that the impact should be material. Deposits at all of the Corporation’s banking subsidiaries are federally insured (subject to FDIC limits) and this is expected to mitigate the effect of a downgrade in the credit ratings. During 2009, the rating agencies downgraded the ratings of the Corporation and its banking subsidiaries on several occasions. The impact of the downgrades on the Corporation’s ability to attract and retain retail and commercial deposits has not been material to date.
Deposits are a key source of funding as they tend to be less volatile than institutional borrowings and their cost is less sensitive to changes in market rates. Refer to Table H for a breakdown of deposits by major types. Core deposits are generated from a large base of consumer, corporate and institutional customers. As indicated in the glossary, for purposes of defi ning core deposits, the Corporation excludes brokered deposits with denominations under $100,000. Core deposits have historically provided the Corporation with a sizable source of relatively stable and low-cost funds. Core deposits totaled $19.5 billion, or 75% of total deposits, at December 31, 2009, compared to $19.9 billion and 72% at December 31, 2008. Core deposits fi nanced 60% of the Corporation’s earning assets at December 31, 2009, compared to 55% at December 31, 2008.
Certifi cates of deposit with denominations of $100,000 and over at December 31, 2009 totaled $4.7 billion, or 18% of total deposits, compared to $4.7 billion, or 17%, at December 31, 2008. Their distribution by maturity at December 31, 2009 was as follows:
Table - Certifi cates of Deposit by Maturities(In thousands)3 months or less $2,012,6333 to 6 months 1,056,5146 to 12 months 913,220Over 12 months 687,876Total $4,670,243
At December 31, 2009, 8% of the Corporation’s assets were fi nanced by brokered deposits. The Corporation had $2.7 billion in brokered deposits at December 31, 2009, compared with $3.1 billion at December 31, 2008. Brokered certifi cates of deposit, which are typically sold through an intermediary to small retail investors, provide access to longer-term funds and provide the ability to raise additional funds without pressuring retail deposit
pricing. An unforeseen disruption in the brokered deposits market, stemming from factors such as legal, regulatory or fi nancial risks, could adversely affect the Corporation’s ability to fund a portion of the Corporation’s operations and/or meet its obligations.
In the event that any of the Corporation’s banking subsidiaries fall under the regulatory capital ratios of a well-capitalized institution or are subject to capital restrictions by the regulators, that banking subsidiary faces the risk of not being able to raise or maintain brokered deposits and faces limitations on the rate paid on deposits, which may hinder the Corporation’s ability to effectively compete in its retail markets and could affect its deposit raising efforts.
Average deposits, including brokered deposits, for the year ended December 31, 2009 represented 79% of average earning assets, compared with 76% and 70% for the years ended December 31, 2008 and 2007, respectively. Table M summarizes average deposits for the past fi ve years. As it applies to the BPPR reportable segment only, average deposits for the year ended December 31, 2009, funded 79% of its average earning assets, while for BPNA’s reportable segment this ratio stood at 82%.
To the extent that the banking subsidiaries are unable to obtain suffi cient liquidity through core deposits, the Corporation may meet its liquidity needs through short-term borrowings by pledging securities for borrowings under repurchase agreements, by pledging additional loans and securities through the available secured lending facilities, or by selling liquid assets. These measures are subject to availability of collateral.
The Corporation’s banking subsidiaries have the ability to borrow funds from the FHLB at competitive prices. At December 31, 2009, the banking subsidiaries had short-term and long-term credit facilities authorized with the FHLB aggregating $1.9 billion based on assets pledged with the FHLB at that date, compared with $2.2 billion at December 31, 2008. Outstanding borrowings under these credit facilities totaled $1.1 billion at December 31, 2009 and 2008. Such advances are collateralized by mortgage loans and securities, do not have restrictive covenants and do not have any callable features.
At December 31, 2009, the banking subsidiaries had a borrowing capacity at the Fed discount window of approximately $2.9 billion, which remained unused as of that date. This compares to a borrowing capacity at the Fed discount window of $3.4 billion as of December 31, 2008. The facility was unused at said date. This facility is a collateralized source of credit that is highly reliable even under diffi cult market conditions. The amount available under this borrowing facility is dependent upon the balance of loans and securities pledged as collateral. The reduction in the borrowing capacity at the Fed discount window from December 31, 2008 to December 31, 2009 was impacted by reduced volume of commercial loans pledged due to lower availability as the bank’s portfolio has declined, a market-wide reduction by the Fed on the
BOA22177_wo18_Popular.indd 54 3/3/2010 10:46:52 AM

55
lendable values of certain types of loans deposited as collateral based on assumptions regarding their average risk characteristics, revised estimates of market value by the Fed and an increase in delinquent loans. During 2009, the Corporation provided collateral in the form of consumer loans to help replenish the available credit facility.
At December 31, 2009, management believes that the banking subsidiaries had suffi cient current and projected liquidity to meet its expected cash fl ow needs during the foreseeable future, and have suffi cient liquidity buffers to address a stress event.
Although the banking subsidiaries have historically been able to replace maturing deposits and advances if desired, no assurance can be given that they would be able to replace those funds in the future if the Corporation’s fi nancial condition or general market conditions were to change. The Corporation’s fi nancial fl exibility will be severely constrained if its banking subsidiaries are unable to maintain access to funding or if adequate fi nancing is not available to accommodate future growth at acceptable interest rates. Finally, if management is required to rely more heavily on more expensive funding sources to support future growth, revenues may not increase proportionately to cover costs. In this case, profi tability would be adversely affected.
Bank Holding CompaniesThe principal sources of funding for the holding companies include cash on hand, investment securities, dividends received from banking and non-banking subsidiaries (subject to regulatory limits), asset sales, credit facilities available from affi liate banking subsidiaries and proceeds from new borrowings. The principal use of these funds include capitalizing banking subsidiaries, the repayment of maturing debt, and interest payments to holders of senior debt and trust preferred securities (including the payment to the U.S. Treasury amounting to $46.8 million a year based on
an annual rate of 5%). The Corporation suspended the payment of dividends to common and preferred stockholders during 2009 as a result of dividend restrictions imposed by regulators and in order to conserve capital.
Banking laws place certain restrictions on the amount of dividends a bank may pay to its parent company based on its earnings and capital position. At December 31, 2009, BPPR and BPNA were required to obtain the approval of the Federal Reserve Board to declare a dividend. Due to limitations resulting from lower earnings in 2009 in the Puerto Rico operations, management expects that projected dividends from BPPR to the Corporation’s holding company will be signifi cantly lower than those received in previous years. During 2009, BPPR paid $55.6 million in dividends to its parent company, compared with $179.9 million in 2008. The Corporation has never received dividend payments from its U.S. mainland subsidiaries. Refer to Popular, Inc.’s Form 10-K for the year ended December 31, 2009 for further information on dividend restrictions imposed by regulatory requirements and policies on the payment of dividends by BPPR and BPNA. Furthermore, during 2009, the non-banking subsidiaries paid $132.5 million in dividends to the BHCs.
The Corporation’s bank holding companies (“BHCs”, Popular, Inc., Popular North America, Inc. and Popular International Bank, Inc.) have in the past borrowed in the money markets and in the corporate debt market primarily to fi nance their non-banking subsidiaries. However, the cash needs of the Corporation’s non-banking subsidiaries other than to repay indebtedness are now minimal given that the PFH business was discontinued. These sources of funding have become more diffi cult to obtain and costly due to disrupted market conditions and the reductions in the Corporation’s credit ratings. During the fourth quarter of 2009, the Corporation announced a medium term notes issuance. As a result of feedback received during the marketing period, the
Table MAverage Total Deposits For the Year(Dollars in thousands) 2009 2008 2007 2006 2005Non-interest bearing demand deposits $4,293,285 $4,120,280 $4,043,427 $3,969,740 $4,068,397Savings accounts 5,538,077 5,600,377 5,697,509 5,440,101 5,676,452NOW, money market and other interest bearing demand accounts 4,804,023 4,948,186 4,429,448 3,877,678 3,731,905Certifi cates of deposit: Under $100,000 7,166,756 6,955,843 3,949,262 3,768,653 3,382,445 $100,000 and over 4,214,125 4,598,146 5,928,983 4,963,534 4,266,983 Certifi cates of deposit 11,380,881 11,553,989 9,878,245 8,732,187 7,649,428Other time deposits 811,943 1,241,447 1,520,471 1,244,426 1,126,887 Total interest bearing deposits 22,534,924 23,343,999 21,525,673 19,294,392 18,184,672 Total average deposits $26,828,209 $27,464,279 $25,569,100 $23,264,132 $22,253,069
BOA22177_wo18_Popular.indd 55 3/3/2010 10:46:52 AM
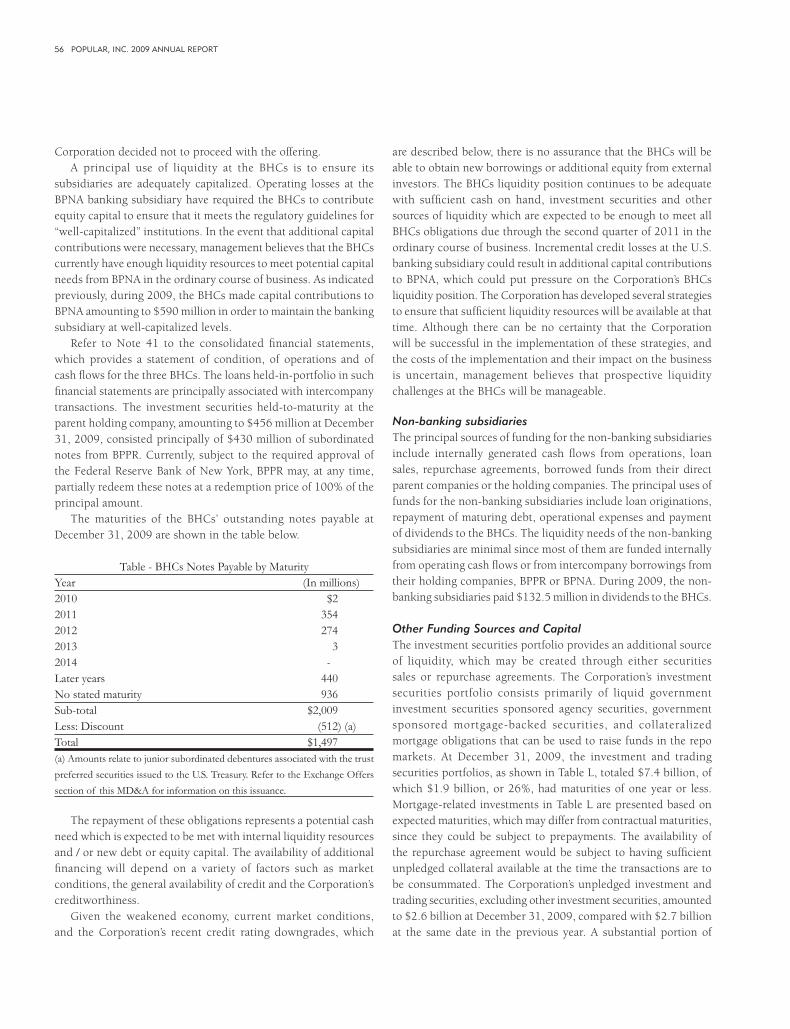
56 POPULAR, INC. 2009 ANNUAL REPORT
Corporation decided not to proceed with the offering.A principal use of liquidity at the BHCs is to ensure its
subsidiaries are adequately capitalized. Operating losses at the BPNA banking subsidiary have required the BHCs to contribute equity capital to ensure that it meets the regulatory guidelines for “well-capitalized” institutions. In the event that additional capital contributions were necessary, management believes that the BHCs currently have enough liquidity resources to meet potential capital needs from BPNA in the ordinary course of business. As indicated previously, during 2009, the BHCs made capital contributions to BPNA amounting to $590 million in order to maintain the banking subsidiary at well-capitalized levels.
Refer to Note 41 to the consolidated fi nancial statements, which provides a statement of condition, of operations and of cash fl ows for the three BHCs. The loans held-in-portfolio in such fi nancial statements are principally associated with intercompany transactions. The investment securities held-to-maturity at the parent holding company, amounting to $456 million at December 31, 2009, consisted principally of $430 million of subordinated notes from BPPR. Currently, subject to the required approval of the Federal Reserve Bank of New York, BPPR may, at any time, partially redeem these notes at a redemption price of 100% of the principal amount.
The maturities of the BHCs’ outstanding notes payable at December 31, 2009 are shown in the table below.
Table - BHCs Notes Payable by MaturityYear (In millions)2010 $22011 3542012 2742013 32014 -Later years 440No stated maturity 936Sub-total $2,009Less: Discount (512) (a)Total $1,497(a) Amounts relate to junior subordinated debentures associated with the trust preferred securities issued to the U.S. Treasury. Refer to the Exchange Offers section of this MD&A for information on this issuance.
The repayment of these obligations represents a potential cash need which is expected to be met with internal liquidity resources and / or new debt or equity capital. The availability of additional fi nancing will depend on a variety of factors such as market conditions, the general availability of credit and the Corporation’s creditworthiness.
Given the weakened economy, current market conditions, and the Corporation’s recent credit rating downgrades, which
are described below, there is no assurance that the BHCs will be able to obtain new borrowings or additional equity from external investors. The BHCs liquidity position continues to be adequate with suffi cient cash on hand, investment securities and other sources of liquidity which are expected to be enough to meet all BHCs obligations due through the second quarter of 2011 in the ordinary course of business. Incremental credit losses at the U.S. banking subsidiary could result in additional capital contributions to BPNA, which could put pressure on the Corporation’s BHCs liquidity position. The Corporation has developed several strategies to ensure that suffi cient liquidity resources will be available at that time. Although there can be no certainty that the Corporation will be successful in the implementation of these strategies, and the costs of the implementation and their impact on the business is uncertain, management believes that prospective liquidity challenges at the BHCs will be manageable.
Non-banking subsidiariesThe principal sources of funding for the non-banking subsidiaries include internally generated cash fl ows from operations, loan sales, repurchase agreements, borrowed funds from their direct parent companies or the holding companies. The principal uses of funds for the non-banking subsidiaries include loan originations, repayment of maturing debt, operational expenses and payment of dividends to the BHCs. The liquidity needs of the non-banking subsidiaries are minimal since most of them are funded internally from operating cash fl ows or from intercompany borrowings from their holding companies, BPPR or BPNA. During 2009, the non-banking subsidiaries paid $132.5 million in dividends to the BHCs.
Other Funding Sources and CapitalThe investment securities portfolio provides an additional source of liquidity, which may be created through either securities sales or repurchase agreements. The Corporation’s investment securities portfolio consists primarily of liquid government investment securities sponsored agency securities, government sponsored mortgage-backed securities, and collateralized mortgage obligations that can be used to raise funds in the repo markets. At December 31, 2009, the investment and trading securities portfolios, as shown in Table L, totaled $7.4 billion, of which $1.9 billion, or 26%, had maturities of one year or less. Mortgage-related investments in Table L are presented based on expected maturities, which may differ from contractual maturities, since they could be subject to prepayments. The availability of the repurchase agreement would be subject to having suffi cient unpledged collateral available at the time the transactions are to be consummated. The Corporation’s unpledged investment and trading securities, excluding other investment securities, amounted to $2.6 billion at December 31, 2009, compared with $2.7 billion at the same date in the previous year. A substantial portion of
BOA22177_wo18_Popular.indd 56 3/3/2010 10:46:52 AM

57
these securities could be used to raise fi nancing quickly in the U.S. money markets or from secured lending sources.
Additional liquidity may be provided through loan maturities, prepayments and sales. The loan portfolio can also be used to obtain funding in the capital markets. In particular, mortgage loans and some types of consumer loans, have secondary markets which the Corporation may use. The maturity distribution of the loan portfolio as of December 31, 2009 is presented in Table L. As of that date, $8.9 billion, or 37% of the loan portfolio was expected to mature within one year, compared with $10.4 billion or 40% of the loan portfolio in the previous year. The contractual maturities of loans have been adjusted to include prepayments based on historical data and prepayment trends.
The Corporation’s debt and preferred stock ratings are currently rated “non-investment” grade by the rating agencies. The market for non-investment grade securities is much smaller and less liquid than for investment grade securities. Therefore, if the company were to attempt to issue preferred stock or debt securities in the capital markets, it is possible that there would not be suffi cient demand to complete a transaction and the cost could be substantially higher than the cost for highly rated securities.
As previously indicated, the Corporation has a limited number of authorized and unreserved shares of common stock to issue in the future. As a result, the Corporation will need to obtain the stockholder’s consent to amend the certifi cate of incorporation to increase the amount of authorized capital stock if the Corporation intends to issue signifi cant amounts of common stock in the future to satisfy liquidity and regulatory needs.
Risks to Liquidity Total lines of credit outstanding are not necessarily a measure of the total credit available on a continuing basis. Some of these lines could be subject to collateral requirements, standards of creditworthiness, leverage ratios and other regulatory requirements, among other factors. Derivatives, such as those embedded in long-term repurchase transactions or interest rate swaps, and off-balance sheet exposures, such as recourse, are subject to collateral requirements. As their fair value increases, the collateral requirements may increase, thereby reducing the balance of unpledged securities.
Reductions of the Corporation’s credit ratings by the rating agencies could also affect its ability to borrow funds, and could substantially raise the cost of our borrowings. Some of the Corporation’s borrowings have “rating triggers” that call for an increase in their interest rate in the event of a rating downgrade. In addition, changes in the Corporation’s ratings could lead creditors and business counterparties to raise the collateral requirements, which could reduce available unpledged securities, reducing excess liquidity. Refer to Part II – Other Information, Item 1A-Risk Factors of the Corporation’s Form 10-K for the year ended December
31, 2009 for additional information on factors that could impact liquidity.
The importance of the Puerto Rico market for the Corporation is an additional risk factor that could affect its fi nancing activities. In the case of a further decay or deepening of the economic recession in Puerto Rico, the credit quality of the Corporation could be further affected and result in higher credit costs. Even though the U.S. economy appears to be in the initial stages of a recovery, it is not certain that the Puerto Rico economy will benefi t materially from a rebound in the U.S. cycle. Puerto Rico economy faces various challenges including the persistent government defi cit and a residential real estate sector under substantial pressures.
Factors that the Corporation does not control, such as the economic outlook of its principal markets and regulatory changes, could also affect its ability to obtain funding. In order to prepare for the possibility of such scenario, management has adopted contingency plans for raising fi nancing under stress scenarios when important sources of funds that are usually fully available are temporarily unavailable. These plans call for using alternate funding mechanisms, such as the pledging of certain asset classes and accessing secured credit lines and loan facilities put in place with the FHLB and the Fed.
Credit ratings of Popular’s debt obligations are an important factor for liquidity because they impact the Corporation’s ability to borrow in the capital markets, its cost and access to funding sources. Credit ratings are based on the fi nancial strength, credit quality and concentrations in the loan portfolio, the level and volatility of earnings, capital adequacy, the quality of management, the liquidity of the balance sheet, the availability of a signifi cant base of core retail and commercial deposits, and the Corporation’s ability to access a broad array of wholesale funding sources, among other factors. The Corporation’s principal credit ratings are at a level below “investment grade” which may affect the Corporation’s ability to raise funds in the capital markets. The Corporation’s counterparties are sensitive to the risk of a rating downgrade. As a result of the recent downgrades, the cost of borrowing funds in the institutional market has increased materially. In addition, the ability of the Corporation to raise new funds or renew maturing debt may be more difficult. Some of the Corporation or its subsidiaries contracts include close-out provisions if the credit ratings fall below certain levels. Subsequent paragraphs provide additional information on these contracts, which principally include derivatives, custodial and mortgage servicing agreements.
BOA22177_wo18_Popular.indd 57 3/3/2010 10:46:52 AM
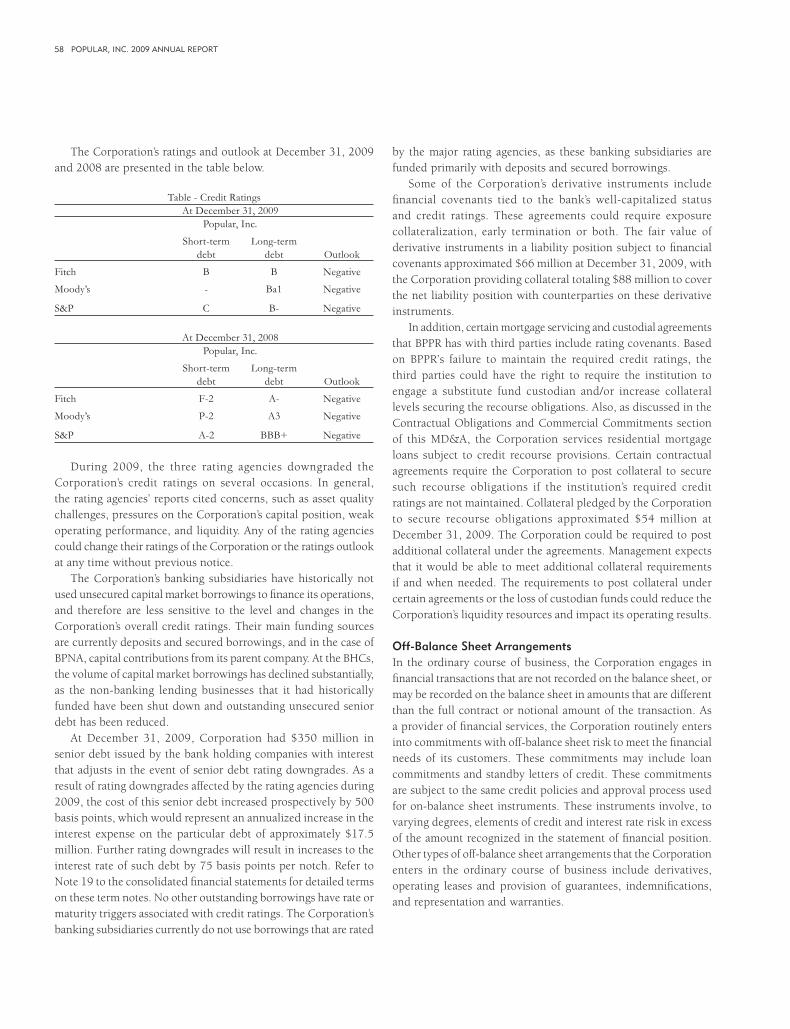
58 POPULAR, INC. 2009 ANNUAL REPORT
The Corporation’s ratings and outlook at December 31, 2009 and 2008 are presented in the table below.
Table - Credit Ratings At December 31, 2009 Popular, Inc.
Short-term Long-term debt debt Outlook
Fitch B B Negative
Moody’s - Ba1 Negative
S&P C B- Negative
At December 31, 2008 Popular, Inc.
Short-term Long-term debt debt Outlook
Fitch F-2 A- Negative
Moody’s P-2 A3 Negative
S&P A-2 BBB+ Negative
During 2009, the three rating agencies downgraded the Corporation’s credit ratings on several occasions. In general, the rating agencies’ reports cited concerns, such as asset quality challenges, pressures on the Corporation’s capital position, weak operating performance, and liquidity. Any of the rating agencies could change their ratings of the Corporation or the ratings outlook at any time without previous notice.
The Corporation’s banking subsidiaries have historically not used unsecured capital market borrowings to fi nance its operations, and therefore are less sensitive to the level and changes in the Corporation’s overall credit ratings. Their main funding sources are currently deposits and secured borrowings, and in the case of BPNA, capital contributions from its parent company. At the BHCs, the volume of capital market borrowings has declined substantially, as the non-banking lending businesses that it had historically funded have been shut down and outstanding unsecured senior debt has been reduced.
At December 31, 2009, Corporation had $350 million in senior debt issued by the bank holding companies with interest that adjusts in the event of senior debt rating downgrades. As a result of rating downgrades affected by the rating agencies during 2009, the cost of this senior debt increased prospectively by 500 basis points, which would represent an annualized increase in the interest expense on the particular debt of approximately $17.5 million. Further rating downgrades will result in increases to the interest rate of such debt by 75 basis points per notch. Refer to Note 19 to the consolidated fi nancial statements for detailed terms on these term notes. No other outstanding borrowings have rate or maturity triggers associated with credit ratings. The Corporation’s banking subsidiaries currently do not use borrowings that are rated
by the major rating agencies, as these banking subsidiaries are funded primarily with deposits and secured borrowings.
Some of the Corporation’s derivative instruments include fi nancial covenants tied to the bank’s well-capitalized status and credit ratings. These agreements could require exposure collateralization, early termination or both. The fair value of derivative instruments in a liability position subject to fi nancial covenants approximated $66 million at December 31, 2009, with the Corporation providing collateral totaling $88 million to cover the net liability position with counterparties on these derivative instruments.
In addition, certain mortgage servicing and custodial agreements that BPPR has with third parties include rating covenants. Based on BPPR’s failure to maintain the required credit ratings, the third parties could have the right to require the institution to engage a substitute fund custodian and/or increase collateral levels securing the recourse obligations. Also, as discussed in the Contractual Obligations and Commercial Commitments section of this MD&A, the Corporation services residential mortgage loans subject to credit recourse provisions. Certain contractual agreements require the Corporation to post collateral to secure such recourse obligations if the institution’s required credit ratings are not maintained. Collateral pledged by the Corporation to secure recourse obligations approximated $54 million at December 31, 2009. The Corporation could be required to post additional collateral under the agreements. Management expects that it would be able to meet additional collateral requirements if and when needed. The requirements to post collateral under certain agreements or the loss of custodian funds could reduce the Corporation’s liquidity resources and impact its operating results.
Off-Balance Sheet Arrangements In the ordinary course of business, the Corporation engages in fi nancial transactions that are not recorded on the balance sheet, or may be recorded on the balance sheet in amounts that are different than the full contract or notional amount of the transaction. As a provider of fi nancial services, the Corporation routinely enters into commitments with off-balance sheet risk to meet the fi nancial needs of its customers. These commitments may include loan commitments and standby letters of credit. These commitments are subject to the same credit policies and approval process used for on-balance sheet instruments. These instruments involve, to varying degrees, elements of credit and interest rate risk in excess of the amount recognized in the statement of fi nancial position. Other types of off-balance sheet arrangements that the Corporation enters in the ordinary course of business include derivatives, operating leases and provision of guarantees, indemnifi cations, and representation and warranties.
BOA22177_wo18_Popular.indd 58 3/3/2010 10:46:52 AM
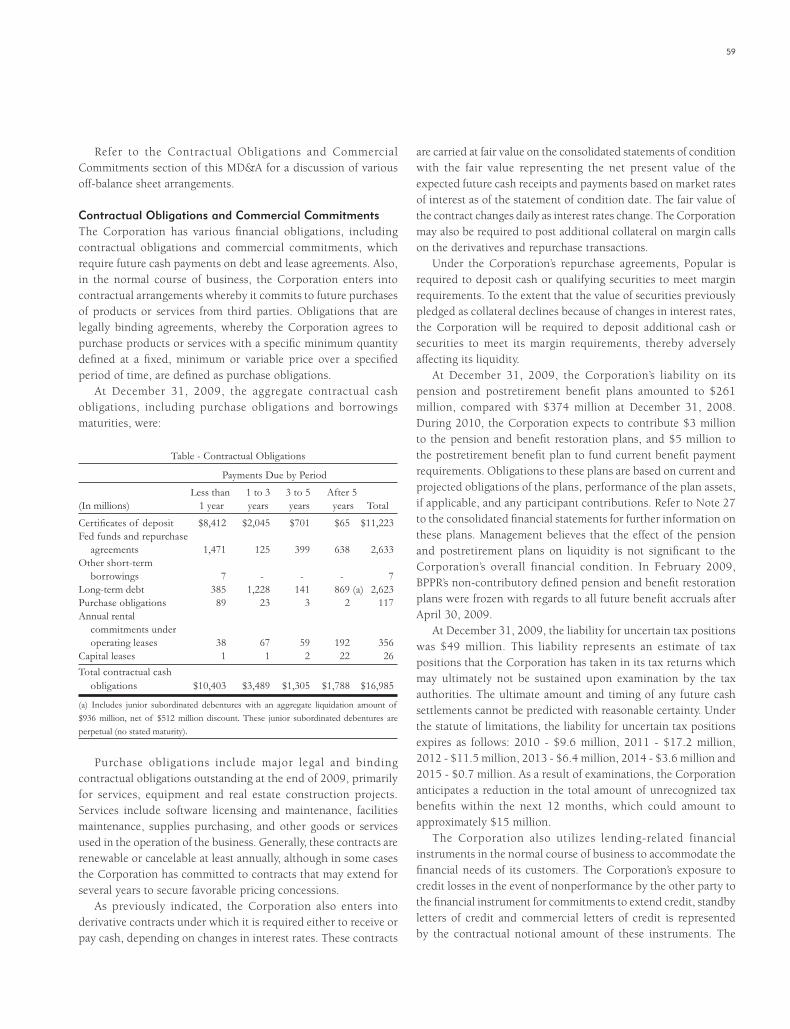
59
Refer to the Contractual Obligations and Commercial Commitments section of this MD&A for a discussion of various off-balance sheet arrangements.
Contractual Obligations and Commercial Commitments The Corporation has various fi nancial obligations, including contractual obligations and commercial commitments, which require future cash payments on debt and lease agreements. Also, in the normal course of business, the Corporation enters into contractual arrangements whereby it commits to future purchases of products or services from third parties. Obligations that are legally binding agreements, whereby the Corporation agrees to purchase products or services with a specifi c minimum quantity defi ned at a fi xed, minimum or variable price over a specifi ed period of time, are defi ned as purchase obligations.
At December 31, 2009, the aggregate contractual cash obligations, including purchase obligations and borrowings maturities, were:
Table - Contractual Obligations
Payments Due by Period
Less than 1 to 3 3 to 5 After 5(In millions) 1 year years years years Total
Certifi cates of deposit $8,412 $2,045 $701 $65 $11,223Fed funds and repurchase agreements 1,471 125 399 638 2,633Other short-term borrowings 7 - - - 7Long-term debt 385 1,228 141 869 (a) 2,623Purchase obligations 89 23 3 2 117Annual rental commitments under operating leases 38 67 59 192 356Capital leases 1 1 2 22 26Total contractual cash obligations $10,403 $3,489 $1,305 $1,788 $16,985
(a) Includes junior subordinated debentures with an aggregate liquidation amount of $936 million, net of $512 million discount. These junior subordinated debentures are perpetual (no stated maturity).
Purchase obligations include major legal and binding contractual obligations outstanding at the end of 2009, primarily for services, equipment and real estate construction projects. Services include software licensing and maintenance, facilities maintenance, supplies purchasing, and other goods or services used in the operation of the business. Generally, these contracts are renewable or cancelable at least annually, although in some cases the Corporation has committed to contracts that may extend for several years to secure favorable pricing concessions.
As previously indicated, the Corporation also enters into derivative contracts under which it is required either to receive or pay cash, depending on changes in interest rates. These contracts
are carried at fair value on the consolidated statements of condition with the fair value representing the net present value of the expected future cash receipts and payments based on market rates of interest as of the statement of condition date. The fair value of the contract changes daily as interest rates change. The Corporation may also be required to post additional collateral on margin calls on the derivatives and repurchase transactions.
Under the Corporation’s repurchase agreements, Popular is required to deposit cash or qualifying securities to meet margin requirements. To the extent that the value of securities previously pledged as collateral declines because of changes in interest rates, the Corporation will be required to deposit additional cash or securities to meet its margin requirements, thereby adversely affecting its liquidity.
At December 31, 2009, the Corporation’s liability on its pension and postretirement benefi t plans amounted to $261 million, compared with $374 million at December 31, 2008. During 2010, the Corporation expects to contribute $3 million to the pension and benefi t restoration plans, and $5 million to the postretirement benefi t plan to fund current benefi t payment requirements. Obligations to these plans are based on current and projected obligations of the plans, performance of the plan assets, if applicable, and any participant contributions. Refer to Note 27 to the consolidated fi nancial statements for further information on these plans. Management believes that the effect of the pension and postretirement plans on liquidity is not signifi cant to the Corporation’s overall financial condition. In February 2009, BPPR’s non-contributory defi ned pension and benefi t restoration plans were frozen with regards to all future benefi t accruals after April 30, 2009.
At December 31, 2009, the liability for uncertain tax positions was $49 million. This liability represents an estimate of tax positions that the Corporation has taken in its tax returns which may ultimately not be sustained upon examination by the tax authorities. The ultimate amount and timing of any future cash settlements cannot be predicted with reasonable certainty. Under the statute of limitations, the liability for uncertain tax positions expires as follows: 2010 - $9.6 million, 2011 - $17.2 million, 2012 - $11.5 million, 2013 - $6.4 million, 2014 - $3.6 million and 2015 - $0.7 million. As a result of examinations, the Corporation anticipates a reduction in the total amount of unrecognized tax benefi ts within the next 12 months, which could amount to approximately $15 million.
The Corporation also utilizes lending-related financial instruments in the normal course of business to accommodate the fi nancial needs of its customers. The Corporation’s exposure to credit losses in the event of nonperformance by the other party to the fi nancial instrument for commitments to extend credit, standby letters of credit and commercial letters of credit is represented by the contractual notional amount of these instruments. The
BOA22177_wo18_Popular.indd 59 3/3/2010 10:46:52 AM
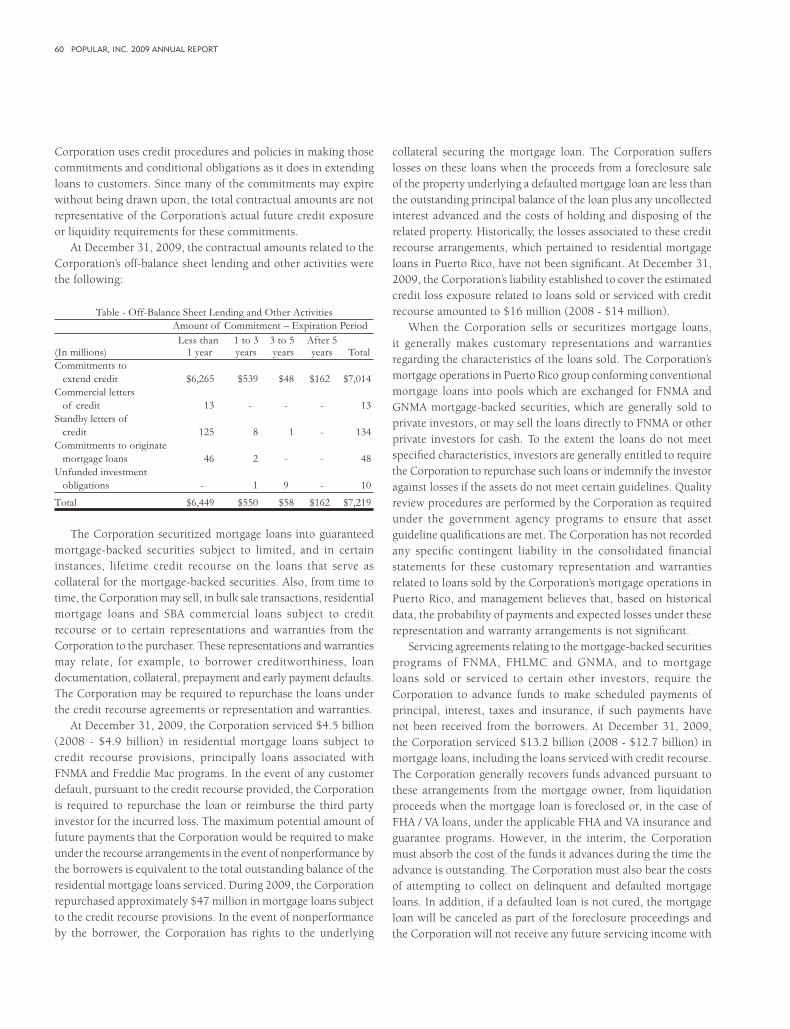
60 POPULAR, INC. 2009 ANNUAL REPORT
Corporation uses credit procedures and policies in making those commitments and conditional obligations as it does in extending loans to customers. Since many of the commitments may expire without being drawn upon, the total contractual amounts are not representative of the Corporation’s actual future credit exposure or liquidity requirements for these commitments.
At December 31, 2009, the contractual amounts related to the Corporation’s off-balance sheet lending and other activities were the following:
Table - Off-Balance Sheet Lending and Other Activities Amount of Commitment – Expiration Period Less than 1 to 3 3 to 5 After 5(In millions) 1 year years years years TotalCommitments to extend credit $6,265 $539 $48 $162 $7,014Commercial letters of credit 13 - - - 13Standby letters of credit 125 8 1 - 134Commitments to originate mortgage loans 46 2 - - 48Unfunded investment obligations - 1 9 - 10
Total $6,449 $550 $58 $162 $7,219
The Corporation securitized mortgage loans into guaranteed mortgage-backed securities subject to limited, and in certain instances, lifetime credit recourse on the loans that serve as collateral for the mortgage-backed securities. Also, from time to time, the Corporation may sell, in bulk sale transactions, residential mortgage loans and SBA commercial loans subject to credit recourse or to certain representations and warranties from the Corporation to the purchaser. These representations and warranties may relate, for example, to borrower creditworthiness, loan documentation, collateral, prepayment and early payment defaults. The Corporation may be required to repurchase the loans under the credit recourse agreements or representation and warranties.
At December 31, 2009, the Corporation serviced $4.5 billion (2008 - $4.9 billion) in residential mortgage loans subject to credit recourse provisions, principally loans associated with FNMA and Freddie Mac programs. In the event of any customer default, pursuant to the credit recourse provided, the Corporation is required to repurchase the loan or reimburse the third party investor for the incurred loss. The maximum potential amount of future payments that the Corporation would be required to make under the recourse arrangements in the event of nonperformance by the borrowers is equivalent to the total outstanding balance of the residential mortgage loans serviced. During 2009, the Corporation repurchased approximately $47 million in mortgage loans subject to the credit recourse provisions. In the event of nonperformance by the borrower, the Corporation has rights to the underlying
collateral securing the mortgage loan. The Corporation suffers losses on these loans when the proceeds from a foreclosure sale of the property underlying a defaulted mortgage loan are less than the outstanding principal balance of the loan plus any uncollected interest advanced and the costs of holding and disposing of the related property. Historically, the losses associated to these credit recourse arrangements, which pertained to residential mortgage loans in Puerto Rico, have not been signifi cant. At December 31, 2009, the Corporation’s liability established to cover the estimated credit loss exposure related to loans sold or serviced with credit recourse amounted to $16 million (2008 - $14 million).
When the Corporation sells or securitizes mortgage loans, it generally makes customary representations and warranties regarding the characteristics of the loans sold. The Corporation’s mortgage operations in Puerto Rico group conforming conventional mortgage loans into pools which are exchanged for FNMA and GNMA mortgage-backed securities, which are generally sold to private investors, or may sell the loans directly to FNMA or other private investors for cash. To the extent the loans do not meet specifi ed characteristics, investors are generally entitled to require the Corporation to repurchase such loans or indemnify the investor against losses if the assets do not meet certain guidelines. Quality review procedures are performed by the Corporation as required under the government agency programs to ensure that asset guideline qualifi cations are met. The Corporation has not recorded any specifi c contingent liability in the consolidated fi nancial statements for these customary representation and warranties related to loans sold by the Corporation’s mortgage operations in Puerto Rico, and management believes that, based on historical data, the probability of payments and expected losses under these representation and warranty arrangements is not signifi cant.
Servicing agreements relating to the mortgage-backed securities programs of FNMA, FHLMC and GNMA, and to mortgage loans sold or serviced to certain other investors, require the Corporation to advance funds to make scheduled payments of principal, interest, taxes and insurance, if such payments have not been received from the borrowers. At December 31, 2009, the Corporation serviced $13.2 billion (2008 - $12.7 billion) in mortgage loans, including the loans serviced with credit recourse. The Corporation generally recovers funds advanced pursuant to these arrangements from the mortgage owner, from liquidation proceeds when the mortgage loan is foreclosed or, in the case of FHA / VA loans, under the applicable FHA and VA insurance and guarantee programs. However, in the interim, the Corporation must absorb the cost of the funds it advances during the time the advance is outstanding. The Corporation must also bear the costs of attempting to collect on delinquent and defaulted mortgage loans. In addition, if a defaulted loan is not cured, the mortgage loan will be canceled as part of the foreclosure proceedings and the Corporation will not receive any future servicing income with
BOA22177_wo18_Popular.indd 60 3/3/2010 10:46:52 AM

61
respect to that loan. At December 31, 2009, the amount of funds advanced by the Corporation under such servicing agreements was approximately $14 million (2008 - $11 million). To the extent the mortgage loans underlying the Corporation’s servicing portfolio experience increased delinquencies, the Corporation would be required to dedicate additional cash resources to comply with its obligation to advance funds as well as incur additional administrative costs related to increases in collection efforts.
At December 31, 2009, the Corporation had established reserves for customary representation and warranties related to loans sold by its U.S. subsidiary E-LOAN. Loans had been sold to investors on a servicing released basis subject to certain representation and warranties. Although the risk of loss or default was generally assumed by the investors, the Corporation is required to make certain representations relating to borrower creditworthiness, loan documentation and collateral, which if not complied, may result in requiring the Corporation to repurchase the loans or indemnify investors for any related losses associated to these loans. The loans had been sold prior to 2009. At December 31, 2009, the Corporation’s reserve for estimated losses from such representation and warranty arrangements amounted to $33 million, which was included as part of other liabilities in the consolidated statement of condition (2008 - $6 million). E-LOAN is no longer originating and selling loans since the subsidiary ceased these activities during 2008. In 2009, the Corporation continued to reassess its estimate for expected losses associated to E-LOAN’s customary representation and warranty arrangements. The analysis incorporates expectations on future disbursements based on quarterly repurchases and make-whole events for the most recent two years, which refl ect the increase in claims resulting from the current deteriorated economic environment, including the real estate market. The analysis also considers factors such as the average time distance between the loan’s funding date and the loan repurchase date as observed in the historical loan data. During 2009, E-LOAN charged-off approximately $14 million against this representation and warranty reserve associated with loan repurchases and indemnifi cations or make-whole payments. Make-whole events are typically defaulted cases which the investor attempts to recover by collateral or guarantees, and the seller is obligated to cover any impaired or unrecovered portion of the loan.
During 2008, the Corporation provided indemnifi cations for the breach of certain representations or warranties in connection with certain sales of assets by the discontinued operations of PFH. The sales were on a non-credit recourse basis. At December 31, 2009, the agreements primarily include indemnifi cation for breaches of certain key representations and warranties, some of which expire within a defi nite time period; others survive until the expiration of the applicable statute of limitations, and others do not expire. Certain of the indemnifi cations are subject to a cap or maximum aggregate liability defi ned as a percentage of the purchase price. The
indemnifi cations agreements outstanding at December 31, 2009 related principally to make-whole arrangements. At December 31, 2009, the Corporation’s reserve related to PFH’s indemnity arrangements amounted to $9 million (2008 - $16 million), and is included as other liabilities in the consolidated statement of condition. During 2009, the Corporation recorded charge-offs with respect to the PFH’s representation and warranty arrangements amounting to approximately $3 million. The reserve balance at December 31, 2009 contemplates historical indemnity payments. Certain indemnifi cation provisions, which included, for example, reimbursement of premiums on early loan payoffs and repurchase obligation for defaulted loans within a short-term timeframe, expired during 2009. Popular, Inc. Holding Company and Popular North America have agreed to guarantee certain obligations of PFH with respect to the indemnifi cation obligations.
During the year ended December 31, 2009, the Corporation sold a lease portfolio of approximately $0.3 billion. At December 31, 2009, the reserve established to provide for any losses on the breach of certain representations and warranties included in the associated sale agreements amounted to $6 million. This reserve is included as part of other liabilities in the consolidated statement of condition. During 2009, the Corporation recorded charge-offs of approximately $1 million related to these representation and warranty arrangements.
Popular, Inc. Holding Company (“PIHC”) fully and unconditionally guarantees certain borrowing obligations issued by certain of its wholly-owned consolidated subsidiaries totaling $0.6 billion at December 31, 2009. In addition, at December 31, 2009, PIHC fully and unconditionally guaranteed, on a subordinated basis, $1.4 billion of capital securities (trust preferred securities) issued by wholly-owned issuing trust entities to the extent set forth in the applicable guarantee agreement. Refer to Note 22 to the consolidated fi nancial statements for information on these trust entities.
The Corporation is a defendant in a number of legal proceedings arising in the ordinary course of business. Based on the opinion of legal counsel, management believes that the fi nal disposition of these matters (except for the matters described in the Legal Proceedings section of this MD&A or Note 33 to the consolidated fi nancial statements which are in very early stages and as to which the actions of which currently cannot be predicted) will not have a material adverse effect on the Corporation’s business, results of operations, fi nancial condition and liquidity.
Refer to the notes to the consolidated fi nancial statements for further information on the Corporation’s contractual obligations, commercial commitments, and derivative contracts.
BOA22177_wo18_Popular.indd 61 3/3/2010 10:46:52 AM
62 POPULAR, INC. 2009 ANNUAL REPORT
Credit Risk Management and Loan QualityCredit risk occurs anytime funds are advanced, committed, invested or otherwise exposed. Credit risk arises primarily from the Corporation’s lending activities, as well as from other on-balance sheet and off-balance sheet credit instruments. Credit risk management is based on analyzing the creditworthiness of the borrower, the adequacy of underlying collateral given current events and conditions, and the existence and strength of any guarantor support.
Business activities that expose the Corporation to credit risk should be managed within the Board’s established limits that consider factors, such as maintaining a prudent balance of risk-taking across diversifi ed risk types and business units (compliance with regulatory guidance, considering factors such as concentrations and loan-to-value ratios), controlling the exposure to lower credit quality assets, and limiting growth in, and overall exposure to, any product or risk segment where the Corporation does not have suffi cient experience and a proven ability to predict credit losses.
The Corporation manages credit risk by maintaining sound underwriting standards, monitoring and evaluating loan portfolio quality, its trends and collectability, and assessing reserves and loan concentrations. Also, credit risk is mitigated by implementing and monitoring lending policies and collateral requirements, and instituting credit review procedures to ensure appropriate actions to comply with laws and regulations. The Corporation’s credit policies require prompt identifi cation and quantifi cation of asset quality deterioration or potential loss in order to ensure the adequacy of the allowance for loan losses. Included in these policies, primarily determined by the amount, type of loan and risk characteristics of the credit facility, are various approval levels and lending limit constraints, ranging from the branch or department level to those that are more centralized. When considered necessary, the Corporation requires collateral to support credit extensions and commitments, which is generally in the form of real estate and personal property, cash on deposit and other highly liquid instruments.
The Corporation’s Credit Strategy Committee (“CRESCO”) is management’s top policy-making body with respect to credit-related matters and credit strategies. CRESCO will review the activities of each subsidiary, in the detail that it may deem appropriate, to ensure a proactive and coordinated management of credit granting, credit exposures and credit procedures. CRESCO’s principal functions include reviewing the adequacy of the allowance for loan losses and periodically approving appropriate provisions, monitoring compliance with charge-off policy, establishing portfolio diversifi cation, yield and quality standards, establishing credit exposure reporting standards, monitoring asset quality, and approving credit policies and amendments thereto for the subsidiaries and / or business lines, including special lending
approval authorities when and if appropriate. The analysis of the allowance adequacy is presented to the Risk Management Committee of the Board of Directors for review, consideration and ratifi cation on a quarterly basis.
The Corporation also has a Corporate Credit Risk Management Division (“CCRMD”). CCRMD is a centralized unit, independent of the lending function. The CCRMD’s functions include identifying, measuring and controlling credit risk independently from the business units, evaluating the credit risk rating system and reviewing the adequacy of the allowance for loan losses in accordance with Generally Accepted Accounting Principles (“GAAP”) and regulatory standards. CCRMD also ensures that the subsidiaries comply with the credit policies and applicable regulations, and monitors credit underwriting standards. Also, the CCRMD performs ongoing monitoring of the portfolio, including potential areas of concern for specifi c borrowers and/or geographic regions.
The Corporation has a Credit Process Review Group within the CCRMD, which performs annual comprehensive credit process reviews of several middle markets, construction, asset-based and corporate banking lending groups in BPPR. This group evaluates the credit risk profi le of each originating unit along with each unit’s credit administration effectiveness, including the assessment of the risk rating representative of the current credit quality of the loans, and the evaluation of collateral documentation. The monitoring performed by this group contributes to assess compliance with credit policies and underwriting standards, determine the current level of credit risk, evaluate the effectiveness of the credit management process and identify control defi ciencies that may arise in the credit-granting process. Based on its fi ndings, the Credit Process Review Group recommends corrective actions, if necessary, that help in maintaining a sound credit process. CCRMD has contracted an outside loan review fi rm to perform the credit process reviews for the portfolios of commercial and construction loans in the U.S. mainland operations. The CCRMD participates in defi ning the review plan with the outside loan review fi rm and actively participates in the discussions of the results of the loan reviews with the business units. The CCRMD may periodically review the work performed by the outside loan review fi rm. CCRMD reports the results of the credit process reviews to the Risk Management Committee of the Corporation’s Board of Directors.
The Corporation has specialized workout offi cers that handle substantially all commercial loans which are past due 90 days and over, borrowers which have fi led bankruptcy, or those that are considered problem loans based on their risk profi le.
At December 31, 2009, the Corporation’s credit exposure was centered in its $23.8 billion total loan portfolio, which represented 74% of its earning assets. The portfolio composition for the last fi ve years is presented in Table G.
The Corporation issues certain credit-related off-balance sheet
BOA22177_wo18_Popular.indd 62 3/3/2010 10:46:52 AM
63
fi nancial instruments including commitments to extend credit, standby letters of credit and commercial letters of credit to meet the fi nancing needs of its customers. For these fi nancial instruments, the contract amount represents the credit risk associated with failure of the counterparty to perform in accordance with the terms and conditions of the contract and the decline in value of the underlying collateral. The credit risk associated with these fi nancial instruments varies depending on the counterparty’s creditworthiness and the value of any collateral held. Refer to Note 32 to the consolidated fi nancial statements and to the Contractual Obligations and Commercial Commitments section of this MD&A for the Corporation’s involvement in these credit-related activities.
At December 31, 2009, the Corporation maintained a reserve of approximately $15 million for potential losses associated with unfunded loan commitments related to commercial and consumer lines of credit, compared to $16 million at December 31, 2008. The estimated reserve is principally based on the expected draws on these facilities using historical trends and the application of the corresponding reserve factors determined under the Corporation’s allowance for loan losses methodology. This reserve for unfunded exposures remains separate and distinct from the allowance for loan losses and is reported as part of other liabilities in the consolidated statement of condition.
The Corporation is also exposed to credit risk by using derivative instruments but manages the level of risk by only dealing with counterparties of good credit standing, entering into master netting agreements whenever possible and, when appropriate, obtaining collateral. Refer to Note 31 to the consolidated fi nancial statements for further information on the Corporation’s involvement in derivative instruments and hedging activities. Also, you may refer to the Derivatives section included under Risk Management in this MD&A.
The Corporation may also encounter risk of default in relation to its investment securities portfolio. Refer to Notes 7 and 8 for the composition of the investment securities available-for-sale and held-to-maturity. The investment securities portfolio held by the Corporation at December 31, 2009 are mostly Obligations of U.S. Government sponsored entities, collateralized mortgage obligations, mortgage-backed securities and U.S. Treasury securities. The vast majority of these securities are rated the equivalent of AAA by the major rating agencies. A substantial portion of these instruments are guaranteed by mortgages, a U.S. government sponsored entity or the full faith and credit of the U.S. Government.
The Corporation’s credit risk exposure is spread among individual consumers, small and medium businesses, as well as corporate borrowers engaged in a wide variety of industries. Only 276 of these commercial lending relationships have credit relations with an aggregate exposure of $10 million or more. At December 31, 2009, highly leveraged transactions and credit facilities to
fi nance speculative real estate ventures amounted to $90 million, and there are no loans to less developed countries. The Corporation limits its exposure to concentrations of credit risk by the nature of its lending limits.
The Corporation has a signifi cant portfolio in construction and commercial loans, mostly secured by commercial and residential real estate properties. Due to their nature, these loans entail a higher credit risk than consumer and residential mortgage loans, since they are larger in size, may have less collateral coverage, higher concentrated risk in a single borrower and are generally more sensitive to economic downturns. Rapidly changing collateral values, general economic conditions and numerous other factors continue to create volatility in the housing markets and have increased the possibility that additional losses may have to be recognized with respect to the Corporation’s current nonperforming assets. Furthermore, given the current slowdown in the real estate market, the properties securing these loans may be diffi cult to dispose of, if foreclosed.
The housing market in the U.S. is undergoing a correction of historic proportions. After a period of several years of booming housing markets, fueled by liberal credit conditions and rapidly rising property values, since early 2007 the sector has been in the midst of a substantial dislocation. This dislocation has had a signifi cant impact on some of the Corporation’s U.S.-based business segments and has affected its ongoing fi nancial results and condition. The general level of property values in the U.S., as measured by several indexes widely followed by the market, has declined signifi cantly. These declines are the result of ongoing market adjustments that are aligning property values with income levels and home inventories. The supply of homes in the market increased substantially, and property value decreases were required to clear the overhang of excess inventory in the U.S. market. Recent indicators suggest that after a material price correction, the U.S. real estate market may be entering a period of relative stability. Nonetheless, further declines in property values could impact the credit quality of the Corporation’s U.S. mortgage loan portfolio because the value of the homes underlying the loans is a primary source of repayment in the event of foreclosure. In the event of foreclosure in a loan from this portfolio, the current market value of the underlying collateral could be insuffi cient to cover the loan amount owed.
The level of real estate prices in Puerto Rico had been more stable than in other U.S. markets, but the current economic environment has accelerated the devaluation of properties when compared with previous periods. Also, additional economic weakness in Puerto Rico and the U.S. mainland could further pressure residential property values. Lower real estate values could increase loan delinquencies, foreclosures and the cost of repossessing and disposing of real estate collateral. The higher end of the housing market in Puerto Rico appears to have suffered
BOA22177_wo18_Popular.indd 63 3/3/2010 10:46:52 AM

64 POPULAR, INC. 2009 ANNUAL REPORT
a substantial slowdown in sales activity in recent quarters, as refl ected in the low absorption rates of projects fi nanced in the Corporation’s construction loan portfolio.
As indicated previously in this MD&A, during 2008, management executed a series of actions to mitigate its credit risk exposure in the U.S. mainland. These actions included the discontinuance of PFH. Also, the Corporation exited the lending business of E-LOAN which also faced high credit losses, particularly in its HELOC and closed-end second mortgage portfolios. In the case of the banking operations, during 2009, the Corporation executed a plan to close, consolidate or sell underperforming branches and exit lending businesses that do not generate deposits or fee income. The Corporation has signifi cantly curtailed the production of non-traditional mortgages as it ceased originating non-conventional mortgage loans in its U.S. mainland operations. This initiative was part of the BPNA Restructuring Plan implemented in the fourth quarter of 2008. The non-conventional mortgage unit is currently focused on servicing the run-off portfolio and restructuring loans that have or show signs of credit deterioration.
Management continues to refine the Corporation’s credit standards to meet the changing economic environment. The Corporation has adjusted its underwriting criteria, as well as enhanced its line management and collection strategies, in an attempt to mitigate losses. The commercial banking group restructured and strengthened several areas to manage more effectively the current scenario, focusing strategies on critical steps in the origination and portfolio management processes to ensure the quality of incoming loans as well as to detect and manage potential problem loans early. The consumer lending area also tightened the underwriting standards across all business lines and reduced its exposure in areas that are more likely to be impacted under the current economic conditions.
Geographical and Government RiskThe Corporation is also exposed to geographical and government risk. The Corporation’s assets and revenue composition by geographical area and by business segment is presented in Note 39 to the consolidated fi nancial statements.
A signifi cant portion of the Corporation’s fi nancial activities and credit exposure is concentrated in Puerto Rico (the “Island”) and the Island’s economy continues to deteriorate.
Since 2006, the Puerto Rico economy has been experiencing recessionary conditions. Based on information published by the Puerto Rico Planning Board (the “Planning Board”), the Puerto Rico real gross national product decreased 3.7% during the fi scal year ended June 30, 2009.
In 2010, the Puerto Rico economy should benefi t from the disbursement of approximately $2.5 billion from the American Recovery and Reinvestment Act of 2009 (“ARRA”) and $280.3
million from the Commonwealth’s local stimulus package.The Commonwealth of Puerto Rico government is currently
addressing a fi scal defi cit which has been estimated at approximately $3.2 billion or over 30% of its annual budget. It is implementing a multi-year budget plan for reducing the defi cit, as its access to the municipal bond market and its credit ratings depend, in part, on achieving a balanced budget. Measures that the government has implemented have included reducing expenses, including public-sector employment layoffs. Since the government is an important source of employment on the Island, these measures could have the effect of intensifying the current recessionary cycle. The Puerto Rico Labor Department reported an unemployment rate of 14.3% for December 2009 compared with 13.1% for December 2008.
This decline in the Island’s economy has resulted in, among other things, a downturn in the Corporation’s loan originations; an increase in the level of its non-performing assets, loan loss provisions and charge-offs, particularly in the Corporation’s construction and commercial loan portfolios; an increase in the rate of foreclosures on mortgage loans; and a reduction in the value of the Corporation’s loans and loan servicing portfolio, all of which have adversely affected its profi tability. If the decline in economic activity continues, there could be further adverse effects on the Corporation’s profi tability.
The current state of the economy and uncertainty in the private and public sectors has had an adverse effect on the credit quality of the Corporation’s loan portfolios. The persistent economic slowdown would cause those adverse effects to continue, as delinquency rates may increase in the short-term, until sustainable growth resumes. Also, a potential reduction in consumer spending may also impact growth in the Corporation’s other interest and non-interest revenues.
At December 31, 2009, the Corporation had $1.1 billion of credit facilities granted to or guaranteed by the Puerto Rico Government and its political subdivisions, of which $215 million are uncommitted lines of credit. Of these total credit facilities granted, $994 million were outstanding at December 31, 2009. A substantial portion of the Corporation’s credit exposure to the Government of Puerto Rico is either collateralized loans or obligations that have a specifi c source of income or revenues identifi ed for their repayment. Some of these obligations consist of senior and subordinated loans to public corporations that obtain revenues from rates charged for services or products, such as water and electric power utilities. Public corporations have varying degrees of independence from the central Government and many receive appropriations or other payments from it. The Corporation also has loans to various municipalities in Puerto Rico for which the good faith, credit and unlimited taxing power of the applicable municipality has been pledged to their repayment. These municipalities are required by law to levy special property taxes in such amounts as shall be required for the payment of all of its
BOA22177_wo18_Popular.indd 64 3/3/2010 10:46:52 AM
65
general obligation bonds and loans. Another portion of these loans consists of special obligations of various municipalities that are payable from the basic real and personal property taxes collected within such municipalities.
Furthermore, at December 31, 2009, the Corporation had outstanding $263 million in Obligations of Puerto Rico, States and Political Subdivisions as part of its investment securities portfolio. Refer to Notes 7 and 8 to the consolidated fi nancial statements for additional information. Of that total, $258 million was exposed to the creditworthiness of the Puerto Rico Government and its municipalities. Of this portfolio, $55 million are in the form of Puerto Rico Commonwealth Appropriation Bonds, of which $45 million are rated Ba1, one notch below investment grade, by Moody’s, while Standard & Poor’s Rating Services rates them as investment grade. As of December 31, 2009, the Puerto Rico Commonwealth Appropriation Bonds represented approximately $0.6 million in unrealized losses in the investment securities available-for-sale and held-to-maturity portfolios. The Corporation continues to closely monitor the political and economic situation of the Island and evaluates the portfolio for any declines in value that management may consider being other-than-temporary.
As further detailed in Notes 7 and 8 to the consolidated fi nancial statements, a substantial portion of the Corporation’s investment securities represented exposure to the U.S. Government in the form of U.S. Treasury securities and obligations of U.S. Government sponsored entities, as well as mortgage-backed securities guaranteed by Ginnie Mae. In addition, $302 million of residential mortgages and $350 million in commercial loans were insured or guaranteed by the U.S. Government or its agencies at December 31, 2009.
Non-Performing AssetsNon-performing assets include past-due loans that are no longer accruing interest, renegotiated loans and real estate property acquired through foreclosure. A summary of non-performing assets by loan categories, including certain credit quality metrics, is presented in Table N. For a summary of the Corporation’s policy for placing loans on non-accrual status, refer to the Critical Accounting Policies / Estimates section in this MD&A.
Non-performing assets attributable to the continuing operations totaled $2.4 billion at December 31, 2009, compared with $1.3 billion at December 31, 2008 and $852 million at December 31, 2007. The increase from December 31, 2008 to December 31, 2009 was concentrated in portfolios secured by real estate. At December 31, 2009, non-performing loans secured by real estate amounted to $1.3 billion or 14.92% of total loans secured by real estate in the Puerto Rico operations and $697 million or 10.69%, respectively, in the U.S. mainland operations. These figures compare to $704 million or 7.64% in Puerto Rico and $338 million or 4.72% in the U.S. mainland operations at December 31, 2008.
At the end of 2007, these fi gures were $330 million and 3.61% in Puerto Rico and $303 million and 4.41% in the U.S. mainland operations. The increase in non-performing assets from December 31, 2008 to December 31, 2009 was primarily related to increases in construction, commercial, and mortgage loans. Non-performing commercial and construction loans increased from the end of 2008 to December 31, 2009 primarily in the BPPR reportable segment by $579 million and in the BPNA reportable segment by $328 million. In terms of reserves, the total allowance for loan losses to non-performing loans represented 55.40% at December 31, 2009, compared to 73.40% at December 31, 2008 and 71.21% at December 31, 2007.
Non-performing construction loans increased $535 million from the end of 2008 to December 31, 2009 primarily in the BPPR reportable segment by $389 million and in the BPNA reportable segment by $146 million. The ratio of construction non-performing loans to construction loans held-in-portfolio increased from 14.44% at December 31, 2008 to 49.58% at December 31, 2009. There were 22 construction loan relationships greater than $10 million in non-accrual status with an outstanding debt of $544 million at December 31, 2009, mostly related to the Puerto Rico operations, compared with 6 construction loan relationships with an outstanding debt of $152 million at December 31, 2008. The construction non-performing loans to construction loans held-in-portfolio ratios were 55.86% for the BPPR reportable segment and 38.99% for the BPNA reportable segment at December 31, 2009. At December 31, 2008, these ratios were 15.02% and 13.37% for BPPR and BPNA reportable segments, respectively. The construction loans in non-performing status for both reportable segments are primarily residential real estate construction loans which have been adversely impacted by general market conditions, decreases in property values, oversupply in certain areas and reduced absorption rates. For the year 2009, the housing market in Puerto Rico reported nearly 22,000 residential units constructed or under construction, which represented approximately 3.7 years of estimated inventory according to the demand of such year. Historically, the Corporation’s loss experience with real estate construction loans has been relatively low due to the suffi ciency of the underlying real estate collateral. In the current stressed housing market, the value of the collateral securing the loan has become one of the most important factors in determining the amount of loss incurred and the appropriate level of the allowance for loan losses. As further described in the Allowance for Loan Losses section of this MD&A, management has increased the allowance for loan losses through specifi c reserves for the construction loans considered impaired. Construction loans considered specifi cally impaired amounted to $841 million at December 31, 2009, compared to $375 million at the same date in 2008. The specifi c reserves for impaired construction loans amounted to $163 million at December 31, 2009, compared to $120 million at December 31,
BOA22177_wo18_Popular.indd 65 3/3/2010 10:46:53 AM
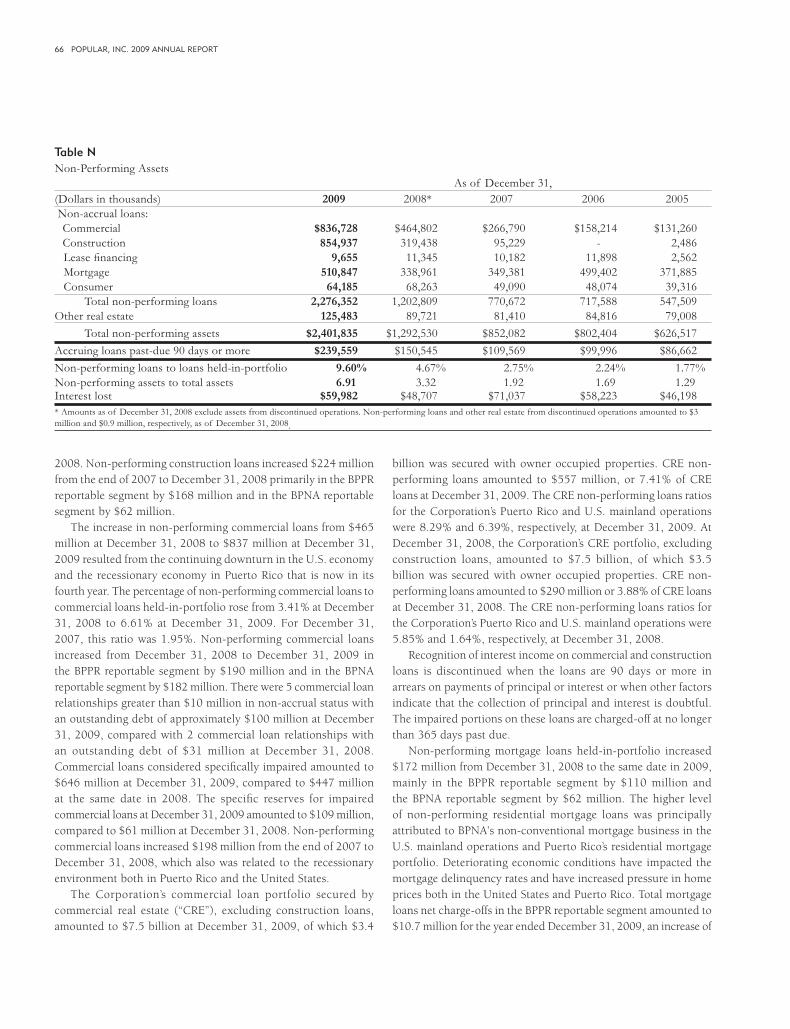
66 POPULAR, INC. 2009 ANNUAL REPORT
2008. Non-performing construction loans increased $224 million from the end of 2007 to December 31, 2008 primarily in the BPPR reportable segment by $168 million and in the BPNA reportable segment by $62 million.
The increase in non-performing commercial loans from $465 million at December 31, 2008 to $837 million at December 31, 2009 resulted from the continuing downturn in the U.S. economy and the recessionary economy in Puerto Rico that is now in its fourth year. The percentage of non-performing commercial loans to commercial loans held-in-portfolio rose from 3.41% at December 31, 2008 to 6.61% at December 31, 2009. For December 31, 2007, this ratio was 1.95%. Non-performing commercial loans increased from December 31, 2008 to December 31, 2009 in the BPPR reportable segment by $190 million and in the BPNA reportable segment by $182 million. There were 5 commercial loan relationships greater than $10 million in non-accrual status with an outstanding debt of approximately $100 million at December 31, 2009, compared with 2 commercial loan relationships with an outstanding debt of $31 million at December 31, 2008. Commercial loans considered specifi cally impaired amounted to $646 million at December 31, 2009, compared to $447 million at the same date in 2008. The specifi c reserves for impaired commercial loans at December 31, 2009 amounted to $109 million, compared to $61 million at December 31, 2008. Non-performing commercial loans increased $198 million from the end of 2007 to December 31, 2008, which also was related to the recessionary environment both in Puerto Rico and the United States.
The Corporation’s commercial loan portfolio secured by commercial real estate (“CRE”), excluding construction loans, amounted to $7.5 billion at December 31, 2009, of which $3.4
billion was secured with owner occupied properties. CRE non-performing loans amounted to $557 million, or 7.41% of CRE loans at December 31, 2009. The CRE non-performing loans ratios for the Corporation’s Puerto Rico and U.S. mainland operations were 8.29% and 6.39%, respectively, at December 31, 2009. At December 31, 2008, the Corporation’s CRE portfolio, excluding construction loans, amounted to $7.5 billion, of which $3.5 billion was secured with owner occupied properties. CRE non-performing loans amounted to $290 million or 3.88% of CRE loans at December 31, 2008. The CRE non-performing loans ratios for the Corporation’s Puerto Rico and U.S. mainland operations were 5.85% and 1.64%, respectively, at December 31, 2008.
Recognition of interest income on commercial and construction loans is discontinued when the loans are 90 days or more in arrears on payments of principal or interest or when other factors indicate that the collection of principal and interest is doubtful. The impaired portions on these loans are charged-off at no longer than 365 days past due.
Non-performing mortgage loans held-in-portfolio increased $172 million from December 31, 2008 to the same date in 2009, mainly in the BPPR reportable segment by $110 million and the BPNA reportable segment by $62 million. The higher level of non-performing residential mortgage loans was principally attributed to BPNA’s non-conventional mortgage business in the U.S. mainland operations and Puerto Rico’s residential mortgage portfolio. Deteriorating economic conditions have impacted the mortgage delinquency rates and have increased pressure in home prices both in the United States and Puerto Rico. Total mortgage loans net charge-offs in the BPPR reportable segment amounted to $10.7 million for the year ended December 31, 2009, an increase of
Table NNon-Performing Assets As of December 31,(Dollars in thousands) 2009 2008* 2007 2006 2005 Non-accrual loans: Commercial $836,728 $464,802 $266,790 $158,214 $131,260 Construction 854,937 319,438 95,229 - 2,486 Lease fi nancing 9,655 11,345 10,182 11,898 2,562 Mortgage 510,847 338,961 349,381 499,402 371,885 Consumer 64,185 68,263 49,090 48,074 39,316 Total non-performing loans 2,276,352 1,202,809 770,672 717,588 547,509Other real estate 125,483 89,721 81,410 84,816 79,008 Total non-performing assets $2,401,835 $1,292,530 $852,082 $802,404 $626,517Accruing loans past-due 90 days or more $239,559 $150,545 $109,569 $99,996 $86,662Non-performing loans to loans held-in-portfolio 9.60% 4.67% 2.75% 2.24% 1.77%Non-performing assets to total assets 6.91 3.32 1.92 1.69 1.29Interest lost $59,982 $48,707 $71,037 $58,223 $46,198* Amounts as of December 31, 2008 exclude assets from discontinued operations. Non-performing loans and other real estate from discontinued operations amounted to $3 million and $0.9 million, respectively, as of December 31, 2008.
BOA22177_wo18_Popular.indd 66 3/3/2010 10:46:53 AM

67
$7.8 million compared to the same period of 2008. BPPR reportable segment’s mortgage loan portfolio averaged approximately $2.8 billion for the year ended December 31, 2009. Total mortgage loans net charge-offs in the BPNA reportable segment amounted to $109.9 million for the year ended December 31, 2009, an increase of $59.9 million compared to the previous year. BPNA’s non-conventional mortgage loan portfolio outstanding at December 31, 2009 approximated $1.1 billion with a related allowance for loan losses of $118 million or 11.16%. As indicated in the Restructuring Plans section of this MD&A, the Corporation is no longer originating non-conventional mortgage loans at BPNA. Net charge-offs for BPNA’s non-conventional mortgage loan portfolio totaled $97.1 million with a ratio of 8.50% of net charge-offs to average non-conventional mortgage loans held-in-portfolio for the year ended December 31, 2009. Recognition of interest income on mortgage loans is discontinued when 90 days or more in arrears on payments of principal or interest. The impaired portions on mortgage loans are charged-off at 180 days past due. Non-performing mortgage loans decreased by $10 million from December 31, 2007 to the same date in 2008. The decline was associated in part to the reclassifi cation of $2 million in non-performing mortgage loans of PFH to “Assets from discontinued operations” in the consolidated statement of condition at December 31, 2008. PFH had $179 million in non-performing mortgage loans at December 31, 2007.
The decrease of $4 million in non-performing consumer loans from December 31, 2008 to the same period in 2009 was primarily associated with the BPNA reportable segment which decreased by $13 million. This decrease is mainly attributed to E-LOAN home equity lines of credit and closed-end second mortgages, which reported improvements in delinquency levels during the fourth quarter of 2009. With the downsizing of E-LOAN in late 2007, this subsidiary ceased originating these types of loans. Home equity lending includes both home equity loans and lines of credit. This type of lending, which is secured by a fi rst or second mortgage on the borrower’s residence, allows a customer to borrow against the equity in their home. Real estate market values as of the time the loan or line is granted directly affect the amount of credit extended and, in addition, changes in these values impact the severity of losses. E-LOAN’s portfolio of home equity lines of credit and closed-end second mortgages outstanding at December 31, 2009 totaled $538.8 million with a related allowance for loan losses of $94.8 million or 17.59%. Recognition of interest income on closed-end consumer loans and home equity lines of credit is discontinued when the loans are 90 days or more in arrears on payments of principal or interest. Income is generally recognized on open-end consumer loans, except for home equity lines of credit, until the loans are charged-off. Closed-end consumer loans and leases are charged-off when they are 120 days in arrears. Open-end consumer loans are charged-off when 180 days in arrears.
The favorable variance mentioned above was partially offset by an increase of $9 million from December 31, 2008 to December 31, 2009 in non-performing consumer loans for the BPPR reportable segment. This increase was primarily related to the auto loans portfolio as a result of the recessionary economic conditions. Non-performing consumer loans increased by $19 million from December 31, 2007 to the same date in 2008, due principally to the BPNA reportable segment which increased by $24 million, with an increase of $18 million attributed to E-LOAN. Partially offsetting this increase from the end of 2007 to the end of 2008 was a reduction in PFH of $6 million due to the sale of its portfolio and the discontinuance of the business.
Other real estate, which represents real estate property acquired through foreclosure, increased by $36 million from December 31, 2008 to the same date in 2009. This increase was principally due to an increase in the BPPR reportable segment by $44 million, including both commercial and residential properties. This increase includes a residential real estate construction project in the Virgin Islands repossessed by BPPR with a carrying value of $10.5 million at December 31, 2009. The increase in the BPPR reportable segment was partially offset by a decrease of $9 million in other real estate pertaining to the BPNA reportable segment mainly driven by sales of properties. With the slowdown in the housing market caused by a continued economic deterioration in certain geographical areas, there has been a softening effect on the market for resale of repossessed real estate properties. As a result, defaulted loans have increased, and these loans move through the default process to the other real estate classifi cation. The combination of increased fl ow of defaulted loans from the loan portfolio to other real estate owned and the slowing of the liquidation market has resulted in an increase in the number of other real estate units on hand. Other real estate increased by $8 million from December 31, 2007 to the same date in 2008. This increase was principally due to an increase in the BPNA reportable segment by $28 million and BPPR reportable segment by $12 million, which was partially offset by $32 million in other real estate pertaining to PFH at December 31, 2007.
Once a loan is placed in non-accrual status, the interest previously accrued and uncollected is charged against current earnings and thereafter income is recorded only to the extent of any interest collected. Refer to Table N for information on the interest income that would have been realized had these loans been performing in accordance with their original terms.
In addition to the non-performing loans included in Table N, there were $248 million of loans at December 31, 2009, which in management’s opinion are currently subject to potential future classifi cation as non-performing and are considered specifi cally impaired, compared to $206 million at December 31, 2008 and $50 million at December 31, 2007.
BOA22177_wo18_Popular.indd 67 3/3/2010 10:46:53 AM

68 POPULAR, INC. 2009 ANNUAL REPORT
Another key measure used to evaluate and monitor the Corporation’s asset quality is loan delinquencies. Loans delinquent 30 days or more and delinquencies as a percentage of their related portfolio category at December 31, 2009 and 2008 are presented below.
Table - Loan Delinquencies(Dollars in millions) 2009 2008Loans delinquent 30 days or more $3,685 $2,547Total delinquencies as a percentage of total loans: Commercial 10.17% 6.74% Construction 57.72 19.33 Lease fi nancing 4.49 4.95 Mortgage 23.96 18.51 Consumer 6.09 6.12Total 15.48% 9.69%
Accruing loans past due 90 days or more are composed primarily of credit cards, FHA / VA and other insured mortgage loans, and delinquent mortgage loans included in the Corporation’s financial statements pursuant to GNMA’s buy-back option program. Servicers of loans underlying GNMA mortgage-backed securities must report as their own assets the defaulted loans that they have the option to purchase, even when they elect not to exercise that option. Also, accruing loans past due 90 days or more include residential conventional loans purchased from other fi nancial institutions that, although delinquent, the Corporation has received timely payment from the sellers / servicers, and, in some instances, have partial guarantees under recourse agreements.
Allowance for Loan LossesThe allowance for loan losses, which represents management’s estimate of credit losses inherent in the loan portfolio, is maintained at a suffi cient level to provide for estimated credit losses on individually evaluated loans as well as estimated credit losses inherent in the remainder of the loan portfolio. The Corporation’s management evaluates the adequacy of the allowance for loan losses on a quarterly basis. In this evaluation, management considers current economic conditions and the resulting impact on Popular’s loan portfolio, the composition of the portfolio by loan type and risk characteristics, historical loss experience, results of periodic credit reviews of individual loans, regulatory requirements and loan impairment measurement, among other factors.
The Corporation must rely on estimates and exercise judgment regarding matters where the ultimate outcome is unknown such as economic developments affecting specifi c customers, industries or markets. Other factors that can affect management’s estimates are the years of historical data when estimating losses, changes in underwriting standards, fi nancial accounting standards and loan impairment measurements, among others. Changes in the fi nancial
condition of individual borrowers, in economic conditions, in historical loss experience and in the condition of the various markets in which collateral may be sold may all affect the required level of the allowance for loan losses. Consequently, the business fi nancial condition, liquidity, capital and results of operations could also be affected.
The Corporation’s assessment of the allowance for loan losses is determined in accordance with accounting guidance, specifi cally guidance of loss contingencies in ASC Subtopic 450-20 and loan impairment guidance in ASC Section 310-10-35. Refer to the Critical Accounting Policies / Estimates section of this MD&A for a description of the Corporation’s allowance for loan losses methodology.
Refer to Table O for a summary of the activity in the allowance for loan losses and selected loan losses statistics for the past 5 years.
Table P details the breakdown of the allowance for loan losses by loan categories. The breakdown is made for analytical purposes, and it is not necessarily indicative of the categories in which future loan losses may occur.
The following table presents net charge-offs to average loans held-in-portfolio (“HIP”) by loan category for the years ended December 31, 2009, 2008 and 2007:
Table - Net Charge-Offs to Average Loans HIP 2009 2008 2007Commercial 2.00% 1.24% 0.58%Construction 15.30 5.81 (0.10)Lease fi nancing 2.46 1.72 1.28Mortgage 2.75 1.17 0.35Consumer 7.28 4.95 3.25Total 4.17% 2.29% 1.01%
Credit quality performance continued to be under pressure during 2009 and has continued into 2010. Generally, all of the Corporation’s loan portfolios have been affected by the sustained deterioration of the economic conditions affecting the markets in which the Corporation operates.
The increase in construction loans net charge-offs for the year ended December 31, 2009, compared with 2008, was related to the Corporation’s Puerto Rico and U.S. operations. The construction loan portfolio is currently considered one of the higher-risk portfolios by the Corporation. Management has identifi ed construction loans considered specifi cally impaired and has established specifi c reserves based on the value of the collateral. The allowance for loan losses corresponding to construction loans represented 19.79% of that portfolio at December 31, 2009, compared with 7.70% in 2008 and 4.31% in 2007. The ratio of allowance to non-performing loans in the construction loan category was 39.92% at the end of 2009, compared with 53.32% in 2008 and 87.86% in 2007. Construction credits, which have been adversely impacted by depressed economic conditions and
BOA22177_wo18_Popular.indd 68 3/3/2010 10:46:53 AM
69
decreases in property values, are primarily residential real estate construction loans.
The BPPR reportable segment construction loan portfolio totaled $1.1 billion at December 31, 2009, compared with $1.4 billion at December 31, 2008 and $1.2 billion at December 31, 2007. The construction loans net charge-offs for the BPPR reportable segment amounted to $195.8 million for the year ended December 31, 2009, compared with net charge-offs of $64.0 million for 2008 and net recoveries of $1.6 million for 2007. The ratio of construction loans net charge-offs to average construction loans held-in-portfolio in the BPPR reportable segment was 14.96% for the year ended December 31, 2009, compared with 4.83% for the same period in 2008. At December 31, 2009, approximately $605 million or 55.86% of the segment’s construction loans were in non-performing status.
The BPNA reportable segment construction loan portfolio totaled $642 million at December 31, 2009, compared with $778 million at December 31, 2008 and $700 million at December 31, 2007. BPNA reportable segment construction loans net charge-offs totaled $114.2 million for 2009 and $56.4 million for 2008. The BPNA reportable segment construction loans net charge-offs to average construction loans held-in-portfolio ratio experienced an increase from 7.54% for the year 2008 to 15.92% for the year 2009. There were no construction loans net charge-offs at BPNA during 2007. At December 31, 2009, approximately $250 million or 38.99% of the segment’s construction loans were in non-performing status.
The increase in commercial loans net charge-offs for the year ended December 31, 2009, compared to the previous year, was mostly associated with the deteriorated economic conditions reflected across all industry sectors. The BPNA reportable segment had a ratio of commercial loans net charge-offs to average commercial loans held-in-portfolio of 2.38% for the year ended December 31, 2009, compared to 0.76% for 2008, and 0.35% for 2007. The U.S. commercial segments which continue to report higher net charge-offs in 2009 were primarily small businesses and commercial real estate as a result of depressed economic conditions. The ratio of commercial loans net charge-offs to average commercial loans held-in-portfolio in the BPPR reportable segment was 1.69% for the year ended December 31, 2009, compared to 1.60% for 2008 and 0.72% for 2007. The allowance for loan losses corresponding to commercial loans held-in-portfolio represented 3.46% of that portfolio at December 31, 2009, compared with 2.16% in 2008 and 1.02% in 2007. The ratio of allowance to non-performing loans in the commercial loan category was 52.31% at the end of 2009, compared with 63.39% in 2008 and 52.10% in 2007. At December 31, 2009, commercial loans in non-performing status amounted to approximately $516 million, or 7.25% of commercial loans held-in-portfolio at the BPPR reportable segment, and $320 million, or 5.79% at the BPNA reportable segment.
The Corporation’s allowance for loan losses for mortgage loans held-in-portfolio represented 3.36% of that portfolio at December 31, 2009, compared with 2.38% in 2008 and 1.15% in 2007. Mortgage loans net charge-offs as a percentage of average mortgage loans held-in-portfolio increased primarily in the U.S. mainland operations, particularly due to non-conventional mortgage loans, which are considered by management as another of the Corporation’s higher-risk portfolios.
The BPNA reportable segment mortgage loan portfolio totaled $1.5 billion at December 31, 2009, compared with $1.7 billion at December 31, 2008 and $1.9 billion at December 31, 2007. The mortgage loans net charge-offs for the BPNA reportable segment amounted to $109.9 million for the year ended December 31, 2009, compared with $50.0 million for 2008 and $14.2 million for 2007. The BPNA reportable segment reported a ratio of mortgage loans net charge-offs to average mortgage loans held-in-portfolio of 6.93% for the year ended December 31, 2009, compared with 2.91% for 2008 and 0.89% for 2007. At December 31, 2009, approximately $198 million or 13.49% of the reportable segment’s mortgage loans were in non-performing status. Deteriorating economic conditions in the U.S. mainland housing market have impacted the mortgage industry delinquency rates. As a result of higher delinquency and net charge-offs, BPNA recorded a higher provision for loan losses in 2009 to cover for inherent losses in this portfolio. The general level of property values in the U.S. mainland, as measured by several indexes widely followed by the market, has declined. These declines are the result of ongoing market adjustments that are aligning property values with income levels and home inventories. The supply of homes in the market has increased substantially, and additional property value decreases may be required to clear the overhang of excess inventory in the U.S. market. Declining property values affect the credit quality of the Corporation’s U.S. mainland mortgage loan portfolio because the value of the homes underlying the loans is a primary source of repayment in the event of foreclosure. As indicated in the Restructuring Plans section of this MD&A, the Corporation is no longer originating non-conventional mortgage loans at BPNA.
Mortgage loans net charge-offs in the BPPR reportable segment amounted to $10.7 million for 2009, compared to $2.9 million in 2008 and $1.2 million in 2007. The slowdown in the housing sector in Puerto Rico has put pressure on home prices and reduced sales activity. The ratio of mortgage loans net charge-offs to average mortgage loans held-in-portfolio for the BPPR reportable segment was 0.38% for the year ended December 31, 2009, compared to 0.10% for 2008. BPPR’s mortgage loans are primarily fi xed-rate fully amortizing, full-documentation loans that do not have the level of layered risk associated with subprime loans offered by certain major U.S. mortgage loan originators. As in the U.S. mainland, the continued recessionary environment in Puerto Rico has negatively impacted property values, thus increasing the level
BOA22177_wo18_Popular.indd 69 3/3/2010 10:46:53 AM
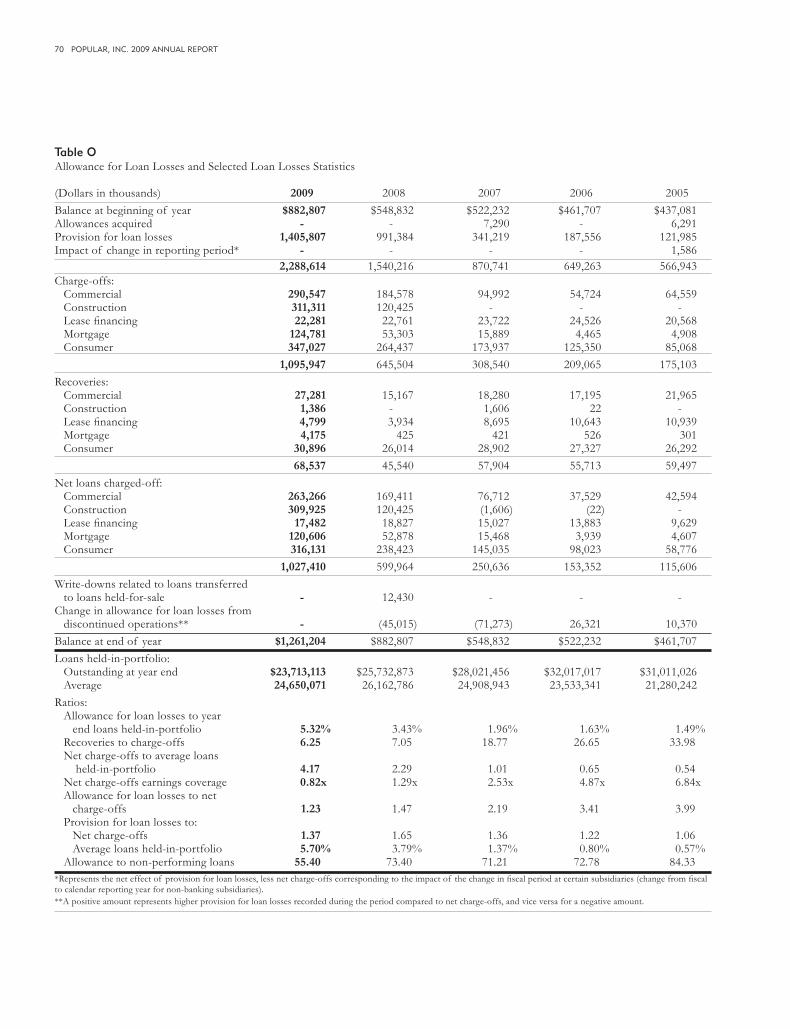
70 POPULAR, INC. 2009 ANNUAL REPORT
Table OAllowance for Loan Losses and Selected Loan Losses Statistics
(Dollars in thousands) 2009 2008 2007 2006 2005Balance at beginning of year $882,807 $548,832 $522,232 $461,707 $437,081Allowances acquired - - 7,290 - 6,291Provision for loan losses 1,405,807 991,384 341,219 187,556 121,985Impact of change in reporting period* - - - - 1,586 2,288,614 1,540,216 870,741 649,263 566,943Charge-offs: Commercial 290,547 184,578 94,992 54,724 64,559 Construction 311,311 120,425 - - - Lease fi nancing 22,281 22,761 23,722 24,526 20,568 Mortgage 124,781 53,303 15,889 4,465 4,908 Consumer 347,027 264,437 173,937 125,350 85,068 1,095,947 645,504 308,540 209,065 175,103Recoveries: Commercial 27,281 15,167 18,280 17,195 21,965 Construction 1,386 - 1,606 22 - Lease fi nancing 4,799 3,934 8,695 10,643 10,939 Mortgage 4,175 425 421 526 301 Consumer 30,896 26,014 28,902 27,327 26,292 68,537 45,540 57,904 55,713 59,497Net loans charged-off: Commercial 263,266 169,411 76,712 37,529 42,594 Construction 309,925 120,425 (1,606) (22) - Lease fi nancing 17,482 18,827 15,027 13,883 9,629 Mortgage 120,606 52,878 15,468 3,939 4,607 Consumer 316,131 238,423 145,035 98,023 58,776 1,027,410 599,964 250,636 153,352 115,606Write-downs related to loans transferred to loans held-for-sale - 12,430 - - -Change in allowance for loan losses from discontinued operations** - (45,015) (71,273) 26,321 10,370Balance at end of year $1,261,204 $882,807 $548,832 $522,232 $461,707Loans held-in-portfolio: Outstanding at year end $23,713,113 $25,732,873 $28,021,456 $32,017,017 $31,011,026 Average 24,650,071 26,162,786 24,908,943 23,533,341 21,280,242Ratios: Allowance for loan losses to year end loans held-in-portfolio 5.32% 3.43% 1.96% 1.63% 1.49% Recoveries to charge-offs 6.25 7.05 18.77 26.65 33.98 Net charge-offs to average loans held-in-portfolio 4.17 2.29 1.01 0.65 0.54 Net charge-offs earnings coverage 0.82x 1.29x 2.53x 4.87x 6.84x Allowance for loan losses to net charge-offs 1.23 1.47 2.19 3.41 3.99 Provision for loan losses to: Net charge-offs 1.37 1.65 1.36 1.22 1.06 Average loans held-in-portfolio 5.70% 3.79% 1.37% 0.80% 0.57% Allowance to non-performing loans 55.40 73.40 71.21 72.78 84.33*Represents the net effect of provision for loan losses, less net charge-offs corresponding to the impact of the change in fi scal period at certain subsidiaries (change from fi scal to calendar reporting year for non-banking subsidiaries).**A positive amount represents higher provision for loan losses recorded during the period compared to net charge-offs, and vice versa for a negative amount.
BOA22177_wo18_Popular.indd 70 3/3/2010 10:46:53 AM

71
of losses. Deteriorating economic conditions have impacted the mortgage delinquency rates in Puerto Rico increasing the levels of non-accruing mortgage loans.
Consumer loans net charge-offs as a percentage of average consumer loans held-in-portfolio rose due to higher delinquencies in the U.S. mainland and in Puerto Rico. Consumer loans net charge-offs in the BPNA reportable segment increased to $147.6 million for the year ended December 31, 2009, compared with $91.6 million for 2008 and $20.7 million for 2007. E-LOAN represented approximately $50.8 million of the increase in the net charge-offs in consumer loans held-in-portfolio for the BPNA reportable segment between 2008 and 2009. The ratio of consumer loans net charge-offs to average consumer loans held-in-portfolio in the BPNA reportable segment was 13.31% for 2009, compared with 6.89% for 2008 and 1.83% for 2007. This increase in net charge-offs in consumer loans held-in-portfolio for the BPNA reportable segment was mainly related to E-LOAN’s home equity lines of credit and closed-end second mortgages, also considered by management as higher-risk portfolios. E-LOAN has ceased originating these types of loans. A home equity line of credit is a loan secured by a primary residence or second home. The deterioration in the delinquency profi le and the declines in property values have negatively impacted charge-offs. E-LOAN’s home equity lines of credit and closed-end second mortgages loan portfolio totaled $538.8 million at December 31, 2009 and had a current loan-to-value ratio of approximately 113% and 106%, respectively. The current loan-to-value ratios of these portfolios resulted from appraisals mostly updated during the year ended December 31, 2009. As of such date, approximately $15.6 million or 2.89% of these particular loan portfolios was in non-performing status. Combined net charge-offs for E-LOAN’s home equity lines of credit and second mortgages totaled $106.7 million or 16.99% for the year ended December 31, 2009.
Consumer loans net charge-offs in the BPPR reportable segment rose for the year ended December 31, 2009, when compared with the previous year, by $21.7 million. The ratio of consumer loans net charge-offs to average consumer loans held-in-portfolio in the BPPR reportable segment was 5.21% for 2009, compared with 4.21% for 2008 and 3.73% for 2007. The increase was mainly attributed to BPPR’s credit cards portfolio as a result of the current recessionary environment in Puerto Rico. The allowance for loan losses for consumer loans held-in-portfolio represented 7.64% of that portfolio at December 31, 2009, compared with 6.23% in 2008 and 4.39% in 2007. The increase in this ratio was the result of increased levels of delinquencies and charge-offs.
The allowance for loan losses increased from December 31, 2008 to December 31, 2009 by $378 million. The allowance for loan losses represented 5.32% of loans held-in-portfolio at December 31, 2009, compared with 3.43% at December 31, 2008 and 1.96% at December 31, 2007. The increase from December
31, 2008 to December 31, 2009 was mainly attributed to reserves for commercial and construction loans due to the continued deterioration of the economic and housing market conditions in Puerto Rico and in the U.S. mainland. Also, the Corporation recorded higher reserves to cover inherent losses in the home equity lines of credit and closed-end second mortgages loan portfolios of the U.S. mainland operations. The persistent declines in residential real estate values, combined with the reduced ability of certain homeowners to refi nance or repay their residential real estate obligations, have resulted in higher delinquencies and losses in these U.S. mainland portfolios.
The following table sets forth information concerning the composition of the Corporation's allowance for loan losses (“ALLL”) at December 31, 2009 by loan category and by whether the allowance and related provisions were calculated individually pursuant the requirements for specifi c impairment or through a general valuation allowance:
Table - ALLL - General and Specifi c Reserves December 31, 2009 Lease(In thousands) Commercial Construction Financing Mortgage Consumer TotalSpecifi c allowance for loan losses $108,769 $162,907 - $52,211 - $323,887Impaired loans 645,513 841,361 - 186,747 - 1,673,621Specifi c allowance for loan losses to impaired loans 16.85% 19.36% - 27.96% - 19.35%General allowance for loan losses $328,940 $178,412 $18,558 $102,400 $309,007 $937,317Loans held-in- portfolio, excluding impaired loans 12,018,546 883,012 675,629 4,416,498 4,045,807 22,039,492General allowance for loans losses to loans held-in- portfolio, excluding impaired loans 2.74% 20.20% 2.75% 2.32% 7.64% 4.25%Total allowance for loan losses $437,709 $341,319 $18,558 $154,611 $309,007 $1,261,204Total loans held- in-portfolio 12,664,059 1,724,373 675,629 4,603,245 4,045,807 23,713,113Allowance for loan losses to loans held-in- portfolio 3.46% 19.79% 2.75% 3.36% 7.64% 5.32%
BOA22177_wo18_Popular.indd 71 3/3/2010 10:46:53 AM
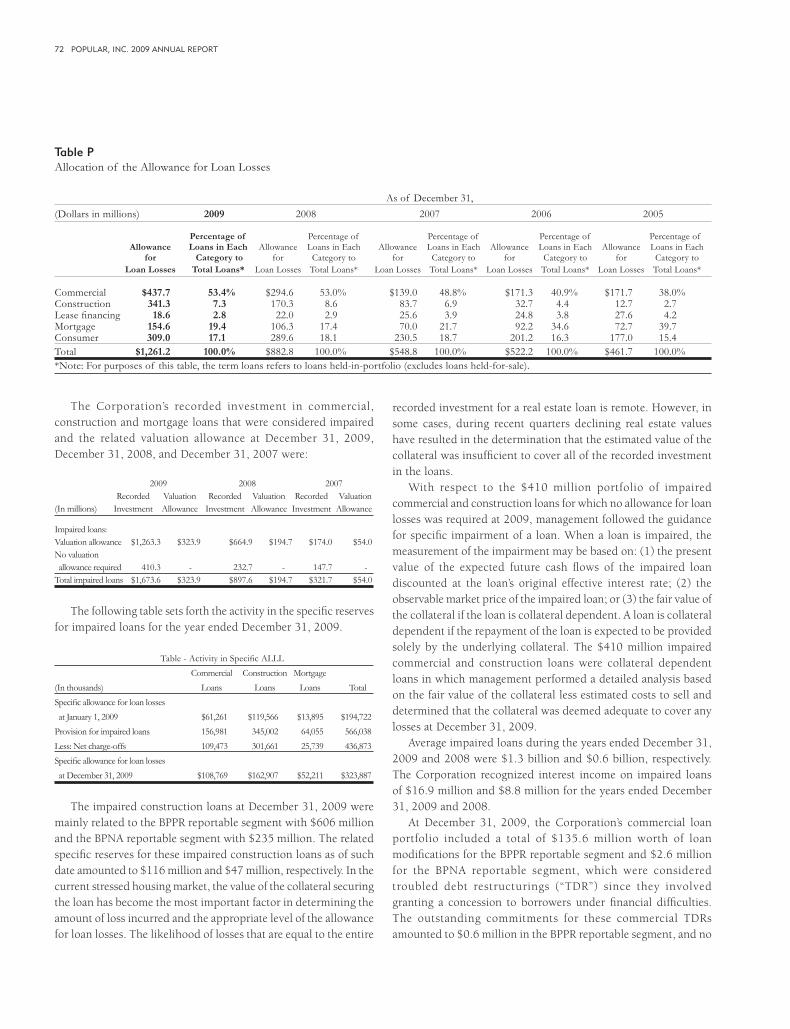
72 POPULAR, INC. 2009 ANNUAL REPORT
The Corporation’s recorded investment in commercial, construction and mortgage loans that were considered impaired and the related valuation allowance at December 31, 2009, December 31, 2008, and December 31, 2007 were:
2009 2008 2007 Recorded Valuation Recorded Valuation Recorded Valuation(In millions) Investment Allowance Investment Allowance Investment Allowance
Impaired loans: Valuation allowance $1,263.3 $323.9 $664.9 $194.7 $174.0 $54.0No valuation allowance required 410.3 - 232.7 - 147.7 -Total impaired loans $1,673.6 $323.9 $897.6 $194.7 $321.7 $54.0
The following table sets forth the activity in the specifi c reserves for impaired loans for the year ended December 31, 2009.
Table - Activity in Specifi c ALLL Commercial Construction Mortgage(In thousands) Loans Loans Loans TotalSpecifi c allowance for loan losses at January 1, 2009 $61,261 $119,566 $13,895 $194,722Provision for impaired loans 156,981 345,002 64,055 566,038Less: Net charge-offs 109,473 301,661 25,739 436,873Specifi c allowance for loan losses at December 31, 2009 $108,769 $162,907 $52,211 $323,887
The impaired construction loans at December 31, 2009 were mainly related to the BPPR reportable segment with $606 million and the BPNA reportable segment with $235 million. The related specifi c reserves for these impaired construction loans as of such date amounted to $116 million and $47 million, respectively. In the current stressed housing market, the value of the collateral securing the loan has become the most important factor in determining the amount of loss incurred and the appropriate level of the allowance for loan losses. The likelihood of losses that are equal to the entire
recorded investment for a real estate loan is remote. However, in some cases, during recent quarters declining real estate values have resulted in the determination that the estimated value of the collateral was insuffi cient to cover all of the recorded investment in the loans.
With respect to the $410 million portfolio of impaired commercial and construction loans for which no allowance for loan losses was required at 2009, management followed the guidance for specifi c impairment of a loan. When a loan is impaired, the measurement of the impairment may be based on: (1) the present value of the expected future cash fl ows of the impaired loan discounted at the loan’s original effective interest rate; (2) the observable market price of the impaired loan; or (3) the fair value of the collateral if the loan is collateral dependent. A loan is collateral dependent if the repayment of the loan is expected to be provided solely by the underlying collateral. The $410 million impaired commercial and construction loans were collateral dependent loans in which management performed a detailed analysis based on the fair value of the collateral less estimated costs to sell and determined that the collateral was deemed adequate to cover any losses at December 31, 2009.
Average impaired loans during the years ended December 31, 2009 and 2008 were $1.3 billion and $0.6 billion, respectively. The Corporation recognized interest income on impaired loans of $16.9 million and $8.8 million for the years ended December 31, 2009 and 2008.
At December 31, 2009, the Corporation’s commercial loan portfolio included a total of $135.6 million worth of loan modifi cations for the BPPR reportable segment and $2.6 million for the BPNA reportable segment, which were considered troubled debt restructurings (“TDR”) since they involved granting a concession to borrowers under fi nancial diffi culties. The outstanding commitments for these commercial TDRs amounted to $0.6 million in the BPPR reportable segment, and no
Table PAllocation of the Allowance for Loan Losses
As of December 31,(Dollars in millions) 2009 2008 2007 2006 2005
Percentage of Percentage of Percentage of Percentage of Percentage of Allowance Loans in Each Allowance Loans in Each Allowance Loans in Each Allowance Loans in Each Allowance Loans in Each for Category to for Category to for Category to for Category to for Category to Loan Losses Total Loans* Loan Losses Total Loans* Loan Losses Total Loans* Loan Losses Total Loans* Loan Losses Total Loans* Commercial $437.7 53.4% $294.6 53.0% $139.0 48.8% $171.3 40.9% $171.7 38.0%Construction 341.3 7.3 170.3 8.6 83.7 6.9 32.7 4.4 12.7 2.7Lease fi nancing 18.6 2.8 22.0 2.9 25.6 3.9 24.8 3.8 27.6 4.2Mortgage 154.6 19.4 106.3 17.4 70.0 21.7 92.2 34.6 72.7 39.7Consumer 309.0 17.1 289.6 18.1 230.5 18.7 201.2 16.3 177.0 15.4Total $1,261.2 100.0% $882.8 100.0% $548.8 100.0% $522.2 100.0% $461.7 100.0%*Note: For purposes of this table, the term loans refers to loans held-in-portfolio (excludes loans held-for-sale).
BOA22177_wo18_Popular.indd 72 3/3/2010 10:46:53 AM

73
outstanding commitments in the BPNA reportable segment. The TDR commercial loans were evaluated for impairment resulting in a reserve of $24.2 million for the BPPR reportable segment and $0.8 million for the BPNA reportable segment at December 31, 2009. The construction loan portfolio included a total of $179.1 million worth of loan modifi cations for the BPPR reportable segment and $96.5 million for the BPNA reportable segment, which were considered TDRs at December 31, 2009. The outstanding commitments for these TDR construction loans amounted to $59.2 million in the BPPR reportable segment, and $0.8 million in the BPNA reportable segment. These TDR construction loans were evaluated for impairment resulting in a reserve of $25.9 million for the BPPR reportable segment and $14.9 million for the BPNA reportable segment at December 31, 2009.
BPNA’s non-conventional mortgage loan portfolio reported a total of $187 million worth of loan modifi cations considered TDRs at December 31, 2009, compared with $76 million at December 31, 2008. Although the criteria for specifi c impairment excludes large groups of smaller-balance homogeneous loans that are collectively evaluated for impairment (e.g. mortgage loans), it specifi cally requires its application to modifi cations considered TDRs. These TDR mortgage loans were evaluated for impairment resulting in a reserve of $52 million at December 31, 2009, compared with a reserve of $14 million at December 31, 2008.
The existing adverse economic conditions are expected to persist through 2010, thus it is likely that the Corporation will continue to experience heightened credit losses, additional signifi cant provisions for loan losses, an increased allowance for loan losses and higher levels of non-performing assets. While management believes that the Corporation’s allowance for loan losses was adequate at December 31, 2009, there is no certainty that it will be suffi cient to cover future credit losses in the portfolio due to continued adverse changes in the economy, market conditions or events negatively affecting particular customers, industries or markets, both in Puerto Rico and the United States.
Management has implemented the following initiatives to manage the deterioration of the loan portfolios and to help mitigate future credit costs:
• increased and reorganized the resources at the commercial and construction loan divisions;
• strengthened the workout units through enhanced collection tools and strategies to mitigate losses focusing on early detection;
• adjusted underwriting criteria and reduced risk exposures;
• launched marketing campaigns with discounted offers and incentives to promote the sales of residential units;
• enhanced critical credit risk management processes;
• modifi ed approximately $187 million in non-conventional
mortgages in the U.S. mainland operations (at December 31, 2009); and
• consolidated the Puerto Rico consumer fi nance operations into retail business.
There can be no assurances that these initiatives will be successful in mitigating future credit losses.
Operational Risk Management Operational risk can manifest itself in various ways, including errors, fraud, business interruptions, inappropriate behavior of employees, and failure to perform in a timely manner, among others. These events can potentially result in fi nancial losses and other damages to the Corporation, including reputational harm. The successful management of operational risk is particularly important to a diversifi ed fi nancial services company like Popular because of the nature, volume and complexity of its various businesses.
To monitor and control operational risk and mitigate related losses, the Corporation maintains a system of comprehensive policies and controls. The Corporation’s Operational Risk Committee (“ORCO”), which is composed of senior level representatives from the business lines and corporate functions, provides executive oversight to facilitate consistency of effective policies, best practices, controls and monitoring tools for managing and assessing all types of operational risks across the Corporation. The Operational Risk Management Division, within the Corporation’s Risk Management Group, serves as ORCO’s operating arm and is responsible for establishing baseline processes to measure, monitor, limit and manage operational risk. In addition, the Auditing Division provides oversight about policy compliance and ensures adequate attention is paid to correct the identifi ed issues.
Operational risks fall into two major categories: business specific and corporate-wide affecting all business lines. The primary responsibility for the day-to-day management of business specifi c risks relies on business unit managers. Accordingly, business unit managers are responsible for ensuring that appropriate risk containment measures, including corporate-wide or business segment specifi c policies and procedures, controls and monitoring tools, are in place to minimize risk occurrence and loss exposures. Examples of these include personnel management practices, data reconciliation processes, transaction processing monitoring and analysis and contingency plans for systems interruptions. To manage corporate-wide risks, specialized groups such as Legal, Information Security, Business Continuity, Finance and Compliance, assist the business units in the development and implementation of risk management practices specifi c to the needs of the individual businesses.
Operational risk management plays a different role in each category. For business specific risks, the Operational Risk
BOA22177_wo18_Popular.indd 73 3/3/2010 10:46:53 AM

74 POPULAR, INC. 2009 ANNUAL REPORT
Management Group works with the segments to ensure consistency in policies, processes, and assessments. With respect to corporate-wide risks, such as information security, business continuity, legal and compliance, the risks are assessed and a consolidated corporate view is developed and communicated to the business level.
Legal ProceedingsThe Corporation and its subsidiaries are defendants in a number of legal proceedings arising in the ordinary course of business. Based on the opinion of legal counsel, management believes that the fi nal disposition of these matters, except for the matters described below which are in very early stages and management cannot currently predict their outcome, will not have a material adverse effect on the Corporation’s business, results of operations, fi nancial condition and liquidity.
Between May 14, 2009 and March 1, 2010, fi ve putative class actions and two derivative claims were fi led in the United States District Court for the District of Puerto Rico and the Puerto Rico Court of First Instance, San Juan Part, against Popular, Inc. and certain of its directors and offi cers, among others. The fi ve class actions have now been consolidated into two separate actions: a securities class action captioned Hoff v. Popular, Inc., et al. (consolidated with Otero v. Popular, Inc., et al.) and an ERISA class action entitled In re Popular, Inc. ERISA Litigation (comprised of the consolidated cases of Walsh v. Popular, Inc. et al.; Montañez v. Popular, Inc., et al.; and Dougan v. Popular, Inc., et al.). On October 19, 2009, plaintiffs in the Hoff case fi led a consolidated class action complaint which includes as defendants the underwriters in the May 2008 offering of Series B Preferred Stock. The consolidated action purports to be on behalf of purchasers of Popular’s securities between January 24, 2008 and February 19, 2009 and alleges that the defendants violated Section 10(b) of the Exchange Act, and Rule 10b-5 promulgated thereunder, and Section 20(a) of the Exchange Act by issuing a series of allegedly false and/or misleading statements and/or omitting to disclose material facts necessary to make statements made by the Corporation not false and misleading. The consolidated action also alleges that the defendants violated Section 11, Section 12(a)(2) and Section 15 of the Securities Act by making allegedly untrue statements and/or omitting to disclose material facts necessary to make statements made by the Corporation not false and misleading in connection with the May 2008 offering of Series B Preferred Stock. The consolidated securities class action complaint seeks class certifi cation, an award of compensatory damages and reasonable costs and expenses, including counsel fees. On January 11, 2010, Popular and the individual defendants moved to dismiss the consolidated securities class action complaint. On November 30, 2009, plaintiffs in the ERISA case fi led a consolidated class action complaint. The consolidated complaint purports to be on behalf of employees participating in the Popular, Inc. U.S.A.
401(k) Savings and Investment Plan and the Popular, Inc. Puerto Rico Savings and Investment Plan from January 24, 2008 to the date of the Complaint to recover losses pursuant to Sections 409 and 502(a)(2) of the Employee Retirement Income Security Act (ERISA) against Popular, certain directors, offi cers and members of plan committees, each of whom is alleged to be a plan fi duciary. The consolidated complaint alleges that the defendants breached their alleged fi duciary obligations by, among other things, failing to eliminate Popular stock as an investment alternative in the plans. The complaint seeks to recover alleged losses to the plans and equitable relief, including injunctive relief and a constructive trust, along with costs and attorneys fees. On December 21, 2009, and in compliance with a scheduling order issued by the Court, Popular and the individual defendants submitted an answer to the amended complaint. Shortly thereafter, on December 31, 2009, Popular and the individual defendants fi led a motion to dismiss the consolidated class action complaint or, in the alternative, for judgment on the pleadings. The derivative actions (García v. Carrión, et al. and Díaz v. Carrión, et al.) have been brought purportedly for the benefi t of nominal defendant Popular, Inc. against certain executive offi cers and directors and allege breaches of fi duciary duty, waste of assets and abuse of control in connection with our issuance of allegedly false and misleading fi nancial statements and fi nancial reports and the offering of the Series B Preferred Stock. The derivative complaints seek a judgment that the action is a proper derivative action, an award of damages and restitution, and costs and disbursements, including reasonable attorneys’ fees, costs and expenses. On October 9, 2009, the Court coordinated for purposes of discovery the García action and the consolidated securities class action. On October 15, 2009, Popular and the individual defendants moved to dismiss the García complaint for failure to make a demand on the Board of Directors prior to initiating litigation. On November 20, 2009, and pursuant to a stipulation among the parties, plaintiffs fi led an amended complaint, and on December 21, 2009, Popular and the individual defendants moved to dismiss the García amended complaint. The Díaz case, fi led in the Puerto Rico Court of First Instance, San Juan, has been removed to the U.S. District Court for the District of Puerto Rico. On October 13, 2009, Popular and the individual defendants moved to consolidate the García and Díaz actions. On October 26, 2009, plaintiff moved to remand the Díaz case to the Puerto Rico Court of First Instance and to stay defendants’ consolidation motion pending the outcome of the remand proceedings. At a scheduling conference held on January 14, 2010, the Court stayed discovery in both the Hoff and García matters pending resolution of their respective motions to dismiss.
At this early stage, it is not possible for management to assess the probability of an adverse outcome, or reasonably estimate the amount of any potential loss. It is possible that the ultimate resolution of these matters, if unfavorable, may be material to the
BOA22177_wo18_Popular.indd 74 3/3/2010 10:46:53 AM
75
Corporation’s results of operations.
Adoption of New Accounting Standards and Issued But Not Yet Effective Accounting StandardsThe FASB Accounting Standards Codifi cation (“ASC”) Effective July 1, 2009, the ASC became the single source of authoritative U.S. generally accepted accounting principles (“GAAP”) recognized by the Financial Accounting Standards Board (“FASB”) to be applied by non-governmental entities. Rules and interpretive releases of the Securities and Exchange Commission (“SEC”) are also sources of authoritative GAAP for SEC registrants. The ASC superseded all existing non-SEC accounting and reporting standards. All other non-grandfathered non-SEC accounting literature not included in the ASC is non-authoritative. The Corporation’s policies were not affected by the conversion to ASC. However, references to specifi c accounting guidance in the notes of the Corporation’s fi nancial statements have been changed to the appropriate section of the ASC.
Business Combinations (ASC Topic 805) (formerly SFAS No. 141-R) In December 2007, the FASB issued guidance that establishes principles and requirements for how an acquirer recognizes and measures in its fi nancial statements the identifi able assets acquired, the liabilities assumed, and any noncontrolling interest in an acquiree, including the recognition and measurement of goodwill acquired in a business combination. The Corporation is required to apply this guidance to all business combinations completed on or after January 1, 2009. For business combinations in which the acquisition date was before the effective date, these provisions apply to the subsequent accounting for deferred income tax valuation allowances and income tax contingencies and require any changes in those amounts to be recorded in earnings. This guidance on business combinations did not have a material effect on the consolidated fi nancial statements of the Corporation for the year ended December 31, 2009.
Noncontrolling Interests in Consolidated Financial Statements (ASC Subtopic 810-10) (formerly SFAS No. 160) In December 2007, the FASB issued guidance to establish accounting and reporting standards for the noncontrolling interest in a subsidiary and for the deconsolidation of a subsidiary. This guidance requires entities to classify noncontrolling interests as a component of stockholders’ equity on the consolidated fi nancial statements and requires subsequent changes in ownership interests in a subsidiary to be accounted for as an equity transaction. Additionally, it requires entities to recognize a gain or loss upon the loss of control of a subsidiary and to remeasure any ownership interest retained at fair value on that date. This statement also requires expanded disclosures that clearly identify and distinguish between the interests of the parent and the interests
of the noncontrolling owners. This guidance was adopted by the Corporation on January 1, 2009. The adoption of this standard did not have an impact on the Corporation’s consolidated fi nancial statements.
Disclosures about Derivative Instruments and Hedging Activities (ASC Subtopic 815-10) (formerly SFAS No. 161)In March 2008, the FASB issued an amendment for disclosures about derivative instruments and hedging activities. The standard expands the disclosure requirements for derivatives and hedged items and has no impact on how the Corporation accounts for these instruments. The standard was adopted by the Corporation in the fi rst quarter of 2009. Refer to Note 31 to the consolidated fi nancial statements for related disclosures.
Subsequent Events (ASC Subtopic 855-10) (formerly SFAS No. 165)In May 2009, the FASB issued guidance which establishes general standards of accounting for and disclosures of events that occur after the balance sheet date but before fi nancial statements are issued or are available to be issued. Specifi cally, this standard sets forth the period after the balance sheet date during which management of a reporting entity should evaluate events or transactions that may occur for potential recognition or disclosure in the fi nancial statements, the circumstances under which an entity should recognize events or transactions occurring after the balance sheet date in its fi nancial statements, and the disclosures that an entity should make about events or transactions that occurred after the balance sheet date. This guidance was effective for interim or annual fi nancial periods ending after June 15, 2009, and shall be applied prospectively. Refer to Note 2 to the consolidated fi nancial statements and the Subsequent Events section in this MD&A for related disclosures.
Transfers of Financial Assets, (ASC Subtopic 860-10) (formerly SFAS No. 166)In June 2009, the FASB issued a revision which eliminates the concept of a “qualifying special-purpose entity” (“QSPEs”), changes the requirements for derecognizing fi nancial assets, and includes additional disclosures requiring more information about transfers of fi nancial assets in which entities have continuing exposure to the risks related to the transferred fi nancial assets. This guidance must be applied as of the beginning of each reporting entity’s fi rst annual reporting period that begins after November 15, 2009, for interim periods within that fi rst annual reporting period and for interim and annual reporting periods thereafter. Earlier application was prohibited. The Corporation is adopting this guidance for transfers of fi nancial assets commencing on January 1, 2010.
The Corporation is evaluating the impact that this new accounting guidance will have on the guaranteed mortgage securitizations with Fannie Mae (“FNMA”) and Ginnie Mae
BOA22177_wo18_Popular.indd 75 3/3/2010 10:46:53 AM
76 POPULAR, INC. 2009 ANNUAL REPORT
(“GNMA”), which are the principal transactions executed by the Corporation that are subject to the new guidance. The Corporation anticipates that transactions backed by FNMA will meet the criteria for sale accounting since the assets transferred are placed and isolated in an independent trust. However, the transactions backed by GNMA will require additional evaluation since they are isolated without the use of a trust to hold the GNMA pass-through certifi cates. Instead, the pools of mortgage loans are legally isolated through the establishment of custodial pools, whereby all rights, title and interest are conveyed to GNMA. The Corporation will assess these transactions to conclude if they will continue to be considered a sale for accounting purposes. Currently, the Corporation does not anticipate that this guidance will have a material effect on the consolidated fi nancial statements.
Variable Interest Entities, (ASC Subtopic 860-10) (formerly SFAS No. 167) The FASB amended on June 2009 the guidance applicable to variable interest entities (“VIE”) and changed how a reporting entity determines when an entity that is insuffi ciently capitalized or is not controlled through voting (or similar rights) should be consolidated. The determination of whether a reporting entity is required to consolidate another entity is based on, among other things, the other entity’s purpose and design and the reporting entity’s ability to direct the activities of the other entity that most signifi cantly impact the other entity’s economic performance. The amendments to the consolidated guidance affect all entities that were within the scope of the original guidance, as well as qualifying special-purpose entities (“QSPEs”) that were previously excluded from the guidance. The new guidance requires a reporting entity to provide additional disclosures about its involvement with variable interest entities and any signifi cant changes in risk exposure due to that involvement. A reporting entity will be required to disclose how its involvement with a variable interest entity affects the reporting entity’s fi nancial statements. The new guidance requires ongoing evaluation of whether an enterprise is the primary benefi ciary of a variable interest entity. The guidance is effective for the Corporation commencing on January 1, 2010.
Currently, the Corporation issues government sponsored securities backed by GNMA and FNMA. FNMA uses independent trusts to isolate the pass-through certifi cates and therefore, are considered VIEs. On the SEC responses to the Mortgage Banker Association Whitepaper issued on February 10, 2010, the SEC reiterated that the GNMA securities I and II are considered VIEs for the assessment of the new consolidation guidance applicable to VIEs.
After evaluation of these transactions, the Corporation reached the conclusion that it is not the primary benefi ciary of these VIEs.
The Corporation also owns certain equity investments that are not considered VIEs, even in consideration of the new accounting
guidance. Other structures analyzed by management are the trust preferred securities. Even though these trusts are still considered VIEs under the new guidance, the Corporation does not possess a signifi cant variable interest on these trusts. Additionally, the Corporation has variable interests in certain investments that have the attributes of investment companies, as well as limited partnership investments in venture capital companies. However, in January 2010, the FASB decided to make offi cial the deferral of ASC Subtopic 860-10 for certain investment entities. The deferral allows asset managers that have no obligation to fund potentially signifi cant losses of an investment entity to continue to apply the previous accounting guidance to investment entities that have the attributes of entities subject to ASC Topic 946 (the “Investment Company Guide”). The FASB also decided to defer the application of this guidance for money market funds subject to Rule 2a-7 of the Investment Company Act of 1940. Asset managers would continue to apply the applicable existing guidance to those entities that qualify for the deferral.
Management anticipates that the Corporation will not be required to consolidate any existing variable interest entities for which it has a variable interest at December 31, 2009. The adoption of the new accounting guidance on variable interest entities is not expected to have a material effect on the Corporation’s consolidated fi nancial statements.
Accounting for Transfers of Financial Assets and Repurchase Financing Transactions (ASC Subtopic 860-10) (formerly FASB Staff Position FAS 140-3)The FASB provided guidance in February 2008 on whether the security transfer and contemporaneous repurchase fi nancing involving the transferred fi nancial asset must be evaluated as one linked transaction or two separate de-linked transactions. The guidance requires the recognition of the transfer and the repurchase agreement as one linked transaction, unless all of the following criteria are met: (1) the initial transfer and the repurchase fi nancing are not contractually contingent on one another; (2) the initial transferor has full recourse upon default, and the repurchase agreement’s price is fi xed and not at fair value; (3) the fi nancial asset is readily obtainable in the marketplace and the transfer and repurchase fi nancing are executed at market rates; and (4) the maturity of the repurchase fi nancing is before the maturity of the fi nancial asset. The scope of this accounting guidance is limited to transfers and subsequent repurchase fi nancings that are entered into contemporaneously or in contemplation of one another. The Corporation adopted the statement on January 1, 2009. The adoption of this guidance did not have a material impact on the Corporation’s consolidated fi nancial statements for the year ended December 31, 2009.
BOA22177_wo18_Popular.indd 76 3/3/2010 10:46:53 AM

77
Determination of the Useful Life of Intangible Assets (ASC Subtopic 350-30) (formerly FASB Staff Position FAS 142-3)In April 2008, the FASB amended the factors that should be considered in developing renewal or extension assumptions used to determine the useful life of a recognized intangible asset. In developing these assumptions, an entity should consider its own historical experience in renewing or extending similar arrangements adjusted for entity specifi c factors or, in the absence of that experience, the assumptions that market participants would use about renewals or extensions adjusted for the entity specifi c factors. This guidance applies to intangible assets acquired after the adoption date of January 1, 2009. The adoption of this guidance did not have an impact on the Corporation’s consolidated fi nancial statements for the year ended December 31, 2009.
Equity Method Investment Accounting Considerations (ASC Subtopic 323-10) (formerly EITF 08-6)This guidance clarifi es the accounting for certain transactions and impairment considerations involving equity method investments. It applies to all investments accounted for under the equity method and provides guidance on the following: (1) how the initial carrying value of an equity method investment should be determined; (2) how an impairment assessment of an underlying indefi nite-lived intangible asset of an equity method investment should be performed; (3) how an equity method investee’s issuance of shares should be accounted for; and (4) how to account for a change in an investment from the equity method to the cost method. The adoption of this guidance in January 2009 did not have a material impact on the Corporation’s consolidated fi nancial statements.
Employers’ Disclosures about Postretirement Benefi t Plan Assets (ASC Subtopic 715-20) (formerly FASB Staff Position FAS 132(R)-1)This guidance requires additional disclosures in the fi nancial statements of employers who are subject to the disclosure requirements of postretirement benefi t plan assets as follows: (a) the investment allocation decision making process, including the factors that are pertinent to an understanding of investment policies and strategies; (b) the fair value of each major category of plan assets, disclosed separately for pension plans and other postretirement benefit plans; (c) the inputs and valuation techniques used to measure the fair value of plan assets, including the level within the fair value hierarchy in which the fair value measurements in their entirety fall; and (d) signifi cant concentrations of risk within plan assets. Additional detailed information is required for each category above. The Corporation applied the new disclosure requirements commencing with the annual fi nancial statements for the year ended December 31, 2009. Refer to Note 27 to the consolidated fi nancial statements. This guidance impacts disclosures only and did not have an effect on the Corporation’s consolidated statements of condition or results
of operations for the year ended December 31, 2009.
Recognition and Presentation of Other-Than-Temporary Impairments (ASC Subtopic 320-10) (formerly FASB Staff Position FAS 115-2 and FAS 124-2)In April 2009, the FASB issued this guidance which is intended to provide greater clarity to investors about the credit and noncredit component of an other-than-temporary impairment event. It specifi cally amends the other-than-temporary impairment guidance for debt securities. The new guidance improves the presentation and disclosure of other-than-temporary impairments on investment securities and changes the calculation of the other-than-temporary impairment recognized in earnings in the fi nancial statements. However, it does not amend existing recognition and measurement guidance related to other-than-temporary impairments of equity securities.
For debt securities, an entity is required to assess whether (a) it has the intent to sell the debt security, or (b) it is more likely than not that it will be required to sell the debt security before its anticipated recovery. If either of these conditions is met, an other-than-temporary impairment on the security must be recognized.
In instances in which a determination is made that a credit loss (defi ned as the difference between the present value of the cash fl ows expected to be collected and the amortized cost basis) exists but the entity does not intend to sell the debt security and it is not more likely than not that the entity will be required to sell the debt security before the anticipated recovery of its remaining amortized cost basis (i.e., the amortized cost basis less any current-period credit loss), the accounting guidance changed the presentation and amount of the other-than-temporary impairment recognized in the statement of operations. In these instances, the impairment is separated into (a) the amount of the total impairment related to the credit loss, and (b) the amount of the total impairment related to all other factors. The amount of the total other-than-temporary impairment related to the credit loss is recognized in the statement of operations. The amount of the total impairment related to all other factors is recognized in other comprehensive loss. Previously, in all cases, if an impairment was determined to be other-than-temporary, an impairment loss was recognized in earnings in an amount equal to the entire difference between the security’s amortized cost basis and its fair value at the balance sheet date of the reporting period for which the assessment was made.
This guidance was effective and is to be applied prospectively for fi nancial statements issued for interim and annual reporting periods ending after June 15, 2009. At adoption an entity was required to record a cumulative-effect adjustment as of the beginning of the period of adoption to reclassify the noncredit component of a previously recognized other-than-temporary impairment from retained earnings to accumulated other comprehensive loss if the entity did not intend to sell the security and it was not more likely
BOA22177_wo18_Popular.indd 77 3/3/2010 10:46:53 AM

78 POPULAR, INC. 2009 ANNUAL REPORT
than not that the entity would be required to sell the security before the anticipated recovery of its amortized cost basis.
The Corporation adopted this guidance for interim and annual reporting periods commencing with the quarter ended June 30, 2009. The adoption of this new accounting guidance in the second quarter of 2009 did not result in a cumulative-effect adjustment as of the beginning of the period of adoption (April 1, 2009) since there were no previously recognized other-than-temporary impairments related to outstanding debt securities. Refer to Notes 7 and 8 for related disclosures as of December 31, 2009.
Interim Disclosures about Fair Value of Financial Instruments (ASC Subtopic 825-10) (formerly FASB Staff Position FAS 107-1 and APB 28-1)In April 2009, the FASB required providing disclosures on a quarterly basis about the fair value of fi nancial instruments that are not currently refl ected on the statement of condition at fair value. Originally the fair value for these assets and liabilities was only required for year-end disclosures. The Corporation adopted this guidance effective with the fi nancial statement disclosures for the quarter ended June 30, 2009. This guidance only impacts disclosure requirements and therefore did not have an impact on the Corporation’s fi nancial condition or results of operations. Refer to Note 37 to the consolidated fi nancial statements for the Corporation’s disclosures on fair value of fi nancial instruments.
Determining Fair Value When the Volume and Level of Activity for the Asset or Liability Have Signifi cantly Decreased and Identifying Transactions That are Not Orderly (ASC Subtopic 820-10) (formerly FASB Staff Position FAS 157-4)This guidance, issued in April 2009, provides additional guidance for estimating fair value when the volume and level of activity for the asset or liability have signifi cantly decreased. It also includes guidance on identifying circumstances that indicate that a transaction is not orderly. This guidance reaffi rms the need to use judgment to ascertain if an active market has become inactive and in determining fair values when markets have become inactive. Additionally, it also emphasizes that even if there has been a signifi cant decrease in the volume and level of activity for the asset or liability and regardless of the valuation techniques used, the objective of a fair value measurement remains the same. Fair value is the price that would be received from the sale of an asset or paid to transfer a liability in an orderly transaction (that is, not a forced liquidation or distressed sale) between market participants at the measurement date under current market conditions. The adoption of this guidance did not have a material impact on the Corporation’s consolidated fi nancial statements for the year ended December 31, 2009.
FASB Accounting Standards Update 2009-05, Fair Value Measurements
and Disclosures (ASC Topic 820) - Measuring Liabilities at Fair Value FASB Accounting Standards Update 2009-05, issued in August 2009, includes amendments to ASC Subtopic 820-10, Fair Value Measurements and Disclosures, for the fair value measurement of liabilities and provides clarifi cation that in circumstances in which a quoted price in an active market for the identical liability is not available, a reporting entity is required to measure fair value using one or more of the following techniques: a valuation technique that uses (a) the quoted price of the identical liability when traded as an asset, (b) quoted prices for similar liabilities or similar liabilities when traded as assets, or another valuation technique that is consistent with the principles of ASC Topic 820. Examples would be an income approach, such as a present value technique, or a market approach, such as a technique that is based on the amount at the measurement date that the reporting entity would pay to transfer the identical liability or would receive to enter into an identical liability. The adoption of this guidance was effective upon issuance and did not have a material impact on the Corporation’s consolidated fi nancial statements for the year ended December 31, 2009.
FASB Accounting Standards Update 2010-06, Fair Value Measurements and Disclosures (ASC Topic 820) - Improving Disclosures about Fair Value Measurements FASB Accounting Standards Update 2010-06, issued in January 2010, requires new disclosures and clarifies some existing disclosure requirements about fair value measurements as set forth in ASC Subtopic 820-10. This update amends Subtopic 820-10 and now requires a reporting entity to disclose separately the amounts of signifi cant transfers in and out of Level 1 and Level 2 fair value measurements and describe the reasons for the transfer. Also in the reconciliation for fair value measurements using signifi cant unobservable inputs (Level 3), a reporting entity should present separately information about purchases, sales, issuances and settlements. In addition, this update clarifi es existing disclosures as follows: (i) for purposes of reporting fair value measurement for each class of assets and liabilities, a reporting entity needs to use judgment in determining the appropriate classes of assets and liabilities, and (ii) a reporting entity should provide disclosures about the valuation techniques and inputs used to measure fair value for both recurring and nonrecurring fair value measurements. This update is effective for interim and annual reporting periods beginning after December 15, 2009 except for the disclosures about purchases, sales, issuances, and settlements in the roll-forward of activity in Level 3 fair value measurements. Those disclosures are effective for fi scal years beginning after December 15, 2010 and for interim periods within those fi scal years. Early application is permitted. This guidance impacts disclosures only and will not have an effect on the Corporation’s consolidated statements of condition or results of operations.
BOA22177_wo18_Popular.indd 78 3/3/2010 10:46:53 AM

79
Glossary of Selected Financial TermsAccretion of Discount - Accounting process for adjusting the book value of a bond recorded at a discount to the par value at maturity.
Allowance for Loan Losses - The reserve established to cover credit losses inherent in loans held-in-portfolio.
Asset Securitization - The process of converting receivables and other assets that are not readily marketable into securities that can be placed and traded in capital markets.
Basis Point - Equals to one-hundredth of one percent. Used to express changes or differences in interest yields and rates.
Book Value Per Common Share - Total common shareholders’ equity divided by the total number of common shares outstanding.
Brokered Certifi cate of Deposit - Deposit purchased from a broker acting as an agent for depositors. The broker, often a securities broker-dealer, pools CDs from many small investors and markets them to fi nancial institutions and negotiates a higher rate for CDs placed with the purchaser.
Cash Flow Hedge - A derivative designated as hedging the exposure to variable cash fl ows of a forecasted transaction.
Common Shares Outstanding - Total number of shares of common stock issued less common shares held in treasury.
Core Deposits - A deposit category that includes all non-interest bearing deposits, savings deposits and certifi cates of deposit under $100,000, excluding brokered certifi cates of deposit with denominations under $100,000. These deposits are considered a stable source of funds.
Derivative - A contractual agreement between two parties to exchange cash or other assets in response to changes in an external factor, such as an interest rate or a foreign exchange rate.
Dividend Payout Ratio - Dividends paid on common shares divided by net income applicable to shares of common stock.
Duration - Expected life of a fi nancial instrument taking into account its coupon yield / cost, interest payments, maturity and call features. Duration attempts to measure actual maturity, as opposed to fi nal maturity. Duration measures the time required to recover a dollar of price in present value terms (including principal and interest), whereas average life computes the average time needed to collect one dollar of principal.
Earning Assets - Assets that earn interest, such as loans, investment securities, money market investments and trading account securities.
Fair Value Hedge - A derivative designated as hedging the exposure to changes in the fair value of a recognized asset or liability or a fi rm commitment.
Gap - The difference that exists at a specifi c period of time between the maturities or repricing terms of interest-sensitive assets and interest-sensitive liabilities.
Goodwill - The excess of the purchase price of net assets over the fair value of net assets acquired in a business combination.
Interest Rate Caps / Floors - An interest rate cap is a contractual agreement between two counterparties in which the buyer, in return for paying a fee, will receive cash payments from the seller at specifi ed dates if rates go above a specifi ed interest rate level known as the strike rate (cap). An interest rate fl oor is a contractual agreement between two counterparties in which the buyer, in return for paying a fee, will receive cash payments from the seller at specifi ed dates if interest rates go below the strike rate.
Interest Rate Swap – Financial transactions in which two counterparties agree to exchange streams of payments over time according to a pre-determined formula. Swaps are normally used to transform the market exposure associated with a loan or bond borrowing from one interest rate base (fi xed-term or fl oating rate).
Interest-Sensitive Assets / Liabilities - Interest-earning assets / liabilities for which interest rates are adjustable within a specifi ed time period due to maturity or contractual arrangements.
Internal Capital Generation Rate - Rate at which a bank gener-ates equity capital, computed by dividing net income (loss) less dividends by the average balance of stockholders’ equity for a given accounting period.
Letter of Credit - A document issued by the Corporation on behalf of a customer to a third party promising to pay that third party upon presentation of specifi ed documents. A letter of credit effectively substitutes the Corporation’s credit for that of the Corporation’s customer.
Loan-to-value (LTV) - A commonly used credit quality metric that is reported in terms of ending and average loan-to-value. Ending LTV is calculated by taking the outstanding loan balance at the end of the period divided by the appraised value of the property securing the loan. A loan to value of 100 percent refl ects a loan
BOA22177_wo18_Popular.indd 79 3/3/2010 10:46:53 AM

80 POPULAR, INC. 2009 ANNUAL REPORT
that is currently secured by a property valued at an amount that is exactly equal to the loan amount.
Mortgage Servicing Rights (MSR) - The right to service a mortgage loan when the underlying loan is sold or securitized. Servicing includes collections of principal, interest and escrow payments from borrowers and accounting for and remitting principal and interest payments to investors.
Net Charge-Offs - The amount of loans written-off as uncollectible, net of the recovery of loans previously written-off.
Net Income (Loss) Applicable to Common Stock - Net income (loss) adjusted for preferred stock dividends, including undeclared or unpaid dividends if cumulative, and charges or credits related to the extinguishment of preferred stock or induced conversions of preferred stock.
Net Income (Loss) Per Common Share - Basic - Net income (loss) applicable to common stock divided by the number of weighted-average common shares outstanding.
Net Income (Loss) Per Common Share - Diluted - Net income (loss) applicable to common stock divided by the sum of weighted-average common shares outstanding plus the effect of common stock equivalents that have the potential to be converted into common shares.
Net Interest Income - The difference between the revenue generated on earning assets, less the interest cost of funding those assets.
Net Interest Margin - Net interest income divided by total average interest-earning assets.
Net Interest Spread - Difference between the average yield on earning assets and the average rate paid on interest bearing liabilities, and the contribution of non-interest bearing funds supporting earning assets (primarily demand deposits and stockholders’ equity).
Non-Performing Assets - Includes loans on which the accrual of interest income has been discontinued due to default on interest and / or principal payments or other factors indicative of doubtful collection, loans for which the interest rates or terms of repayment have been renegotiated, and real estate which has been acquired through foreclosure.
Option Contract - Conveys a right, but not an obligation, to buy or sell a specifi ed number of units of a fi nancial instrument
at a specifi c price per unit within a specifi ed time period. The instrument underlying the option may be a security, a futures contract (for example, an interest rate option), a commodity, a currency, or a cash instrument. Options may be bought or sold on organized exchanges or over the counter on a principal-to-principal basis or may be individually negotiated. A call option gives the holder the right, but not the obligation, to buy the underlying instrument. A put option gives the holder the right, but not the obligation, to sell the underlying instrument.
Provision For Loan Losses - The periodic expense needed to maintain the level of the allowance for loan losses at a level consistent with management’s assessment of the loan portfolio in light of current economic conditions and market trends, and taking into account loan impairment and net charge-offs.
Return on Assets - Net income as a percentage of average total assets.
Return on Equity - Net income applicable to common stock as a percentage of average common stockholders’ equity.
Servicing Right - A contractual agreement to provide certain billing, bookkeeping and collection services with respect to a pool of loans.
Tangible Equity - Consists of stockholders’ equity less goodwill and other intangible assets.
Tier 1 Common Equity - Tier 1 capital, less non-common elements.
Tier 1 Leverage Ratio - Tier 1 capital divided by average adjusted quarterly total assets. Average adjusted quarterly assets are adjusted to exclude non-qualifying intangible assets and disallowed deferred tax assets.
Tier 1 Capital - Consists generally of common stockholders’ equity (including the related surplus, retained earnings and capital reserves), qualifying noncumulative perpetual preferred stock, senior perpetual preferred stock issued under the TARP Capital Purchase Program, qualifying trust preferred securities and minority interest in the qualifying equity accounts of consolidated subsidiaries, less goodwill and other disallowed intangible assets, disallowed portion of deferred tax assets and the deduction for nonfi nancial equity investments.
To be announced (TBA) - A term used to describe a forward mortgage-backed securities trade. The term TBA is derived from the fact that the actual mortgage-backed security that will be delivered
BOA22177_wo18_Popular.indd 80 3/3/2010 10:46:53 AM

81
to fulfi ll a TBA trade is not designated at the time the trade is made.
Total Risk-Adjusted Assets - The sum of assets and credit equivalent off-balance sheet amounts that have been adjusted according to assigned regulatory risk weights, excluding the non-qualifying portion of allowance for loan and lease losses, goodwill and other intangible assets.
Total Risk-Based Capital - Consists generally of Tier 1 capital plus the allowance for loan losses, qualifying subordinated debt and the allowed portion of the net unrealized gains on available-for-sale equity securities.
Treasury Stock - Common stock repurchased and held by the issuing corporation for possible future issuance.
BOA22177_wo18_Popular.indd 81 3/3/2010 10:46:53 AM
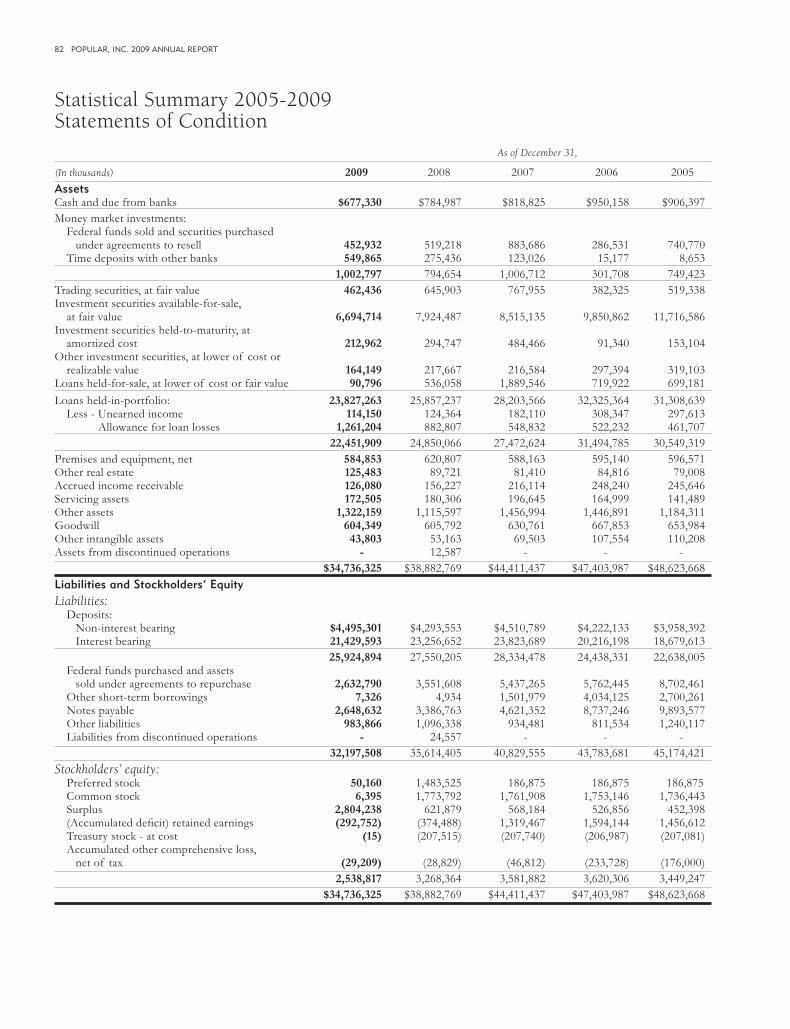
82 POPULAR, INC. 2009 ANNUAL REPORT
Statistical Summary 2005-2009 Statements of Condition As of December 31,
(In thousands) 2009 2008 2007 2006 2005AssetsCash and due from banks $677,330 $784,987 $818,825 $950,158 $906,397Money market investments: Federal funds sold and securities purchased under agreements to resell 452,932 519,218 883,686 286,531 740,770 Time deposits with other banks 549,865 275,436 123,026 15,177 8,653 1,002,797 794,654 1,006,712 301,708 749,423Trading securities, at fair value 462,436 645,903 767,955 382,325 519,338Investment securities available-for-sale, at fair value 6,694,714 7,924,487 8,515,135 9,850,862 11,716,586Investment securities held-to-maturity, at amortized cost 212,962 294,747 484,466 91,340 153,104Other investment securities, at lower of cost or realizable value 164,149 217,667 216,584 297,394 319,103Loans held-for-sale, at lower of cost or fair value 90,796 536,058 1,889,546 719,922 699,181Loans held-in-portfolio: 23,827,263 25,857,237 28,203,566 32,325,364 31,308,639 Less - Unearned income 114,150 124,364 182,110 308,347 297,613 Allowance for loan losses 1,261,204 882,807 548,832 522,232 461,707 22,451,909 24,850,066 27,472,624 31,494,785 30,549,319Premises and equipment, net 584,853 620,807 588,163 595,140 596,571Other real estate 125,483 89,721 81,410 84,816 79,008Accrued income receivable 126,080 156,227 216,114 248,240 245,646Servicing assets 172,505 180,306 196,645 164,999 141,489Other assets 1,322,159 1,115,597 1,456,994 1,446,891 1,184,311Goodwill 604,349 605,792 630,761 667,853 653,984Other intangible assets 43,803 53,163 69,503 107,554 110,208Assets from discontinued operations - 12,587 - - - $34,736,325 $38,882,769 $44,411,437 $47,403,987 $48,623,668Liabilities and Stockholders’ EquityLiabilities: Deposits: Non-interest bearing $4,495,301 $4,293,553 $4,510,789 $4,222,133 $3,958,392 Interest bearing 21,429,593 23,256,652 23,823,689 20,216,198 18,679,613 25,924,894 27,550,205 28,334,478 24,438,331 22,638,005 Federal funds purchased and assets sold under agreements to repurchase 2,632,790 3,551,608 5,437,265 5,762,445 8,702,461 Other short-term borrowings 7,326 4,934 1,501,979 4,034,125 2,700,261 Notes payable 2,648,632 3,386,763 4,621,352 8,737,246 9,893,577 Other liabilities 983,866 1,096,338 934,481 811,534 1,240,117 Liabilities from discontinued operations - 24,557 - - - 32,197,508 35,614,405 40,829,555 43,783,681 45,174,421Stockholders’ equity: Preferred stock 50,160 1,483,525 186,875 186,875 186,875 Common stock 6,395 1,773,792 1,761,908 1,753,146 1,736,443 Surplus 2,804,238 621,879 568,184 526,856 452,398 (Accumulated defi cit) retained earnings (292,752) (374,488) 1,319,467 1,594,144 1,456,612 Treasury stock - at cost (15) (207,515) (207,740) (206,987) (207,081) Accumulated other comprehensive loss, net of tax (29,209) (28,829) (46,812) (233,728) (176,000) 2,538,817 3,268,364 3,581,882 3,620,306 3,449,247 $34,736,325 $38,882,769 $44,411,437 $47,403,987 $48,623,668
BOA22177_wo18_Popular.indd 82 3/3/2010 10:46:53 AM
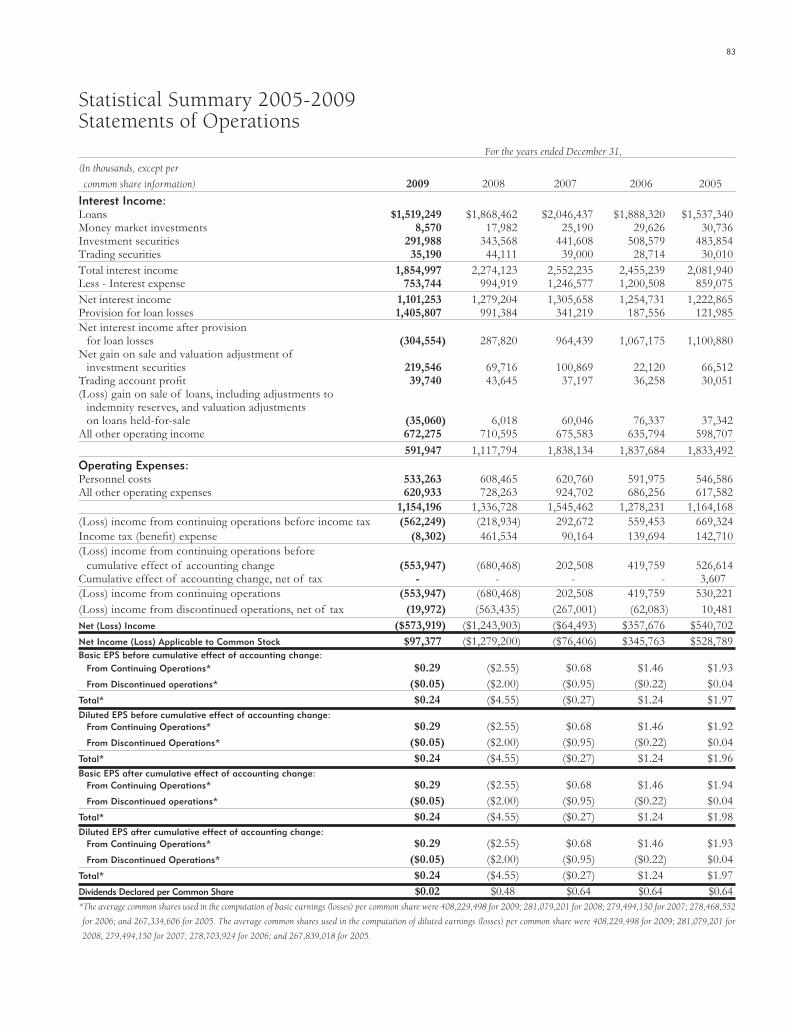
83
Statistical Summary 2005-2009 Statements of Operations For the years ended December 31,
(In thousands, except per
common share information) 2009 2008 2007 2006 2005Interest Income: Loans $1,519,249 $1,868,462 $2,046,437 $1,888,320 $1,537,340Money market investments 8,570 17,982 25,190 29,626 30,736Investment securities 291,988 343,568 441,608 508,579 483,854Trading securities 35,190 44,111 39,000 28,714 30,010Total interest income 1,854,997 2,274,123 2,552,235 2,455,239 2,081,940Less - Interest expense 753,744 994,919 1,246,577 1,200,508 859,075Net interest income 1,101,253 1,279,204 1,305,658 1,254,731 1,222,865Provision for loan losses 1,405,807 991,384 341,219 187,556 121,985Net interest income after provision for loan losses (304,554) 287,820 964,439 1,067,175 1,100,880Net gain on sale and valuation adjustment of investment securities 219,546 69,716 100,869 22,120 66,512Trading account profi t 39,740 43,645 37,197 36,258 30,051(Loss) gain on sale of loans, including adjustments to indemnity reserves, and valuation adjustments on loans held-for-sale (35,060) 6,018 60,046 76,337 37,342All other operating income 672,275 710,595 675,583 635,794 598,707 591,947 1,117,794 1,838,134 1,837,684 1,833,492Operating Expenses:Personnel costs 533,263 608,465 620,760 591,975 546,586All other operating expenses 620,933 728,263 924,702 686,256 617,582 1,154,196 1,336,728 1,545,462 1,278,231 1,164,168(Loss) income from continuing operations before income tax (562,249) (218,934) 292,672 559,453 669,324Income tax (benefi t) expense (8,302) 461,534 90,164 139,694 142,710(Loss) income from continuing operations before cumulative effect of accounting change (553,947) (680,468) 202,508 419,759 526,614Cumulative effect of accounting change, net of tax - - - - 3,607(Loss) income from continuing operations (553,947) (680,468) 202,508 419,759 530,221(Loss) income from discontinued operations, net of tax (19,972) (563,435) (267,001) (62,083) 10,481Net (Loss) Income ($573,919) ($1,243,903) ($64,493) $357,676 $540,702Net Income (Loss) Applicable to Common Stock $97,377 ($1,279,200) ($76,406) $345,763 $528,789Basic EPS before cumulative effect of accounting change: From Continuing Operations* $0.29 ($2.55) $0.68 $1.46 $1.93 From Discontinued operations* ($0.05) ($2.00) ($0.95) ($0.22) $0.04Total* $0.24 ($4.55) ($0.27) $1.24 $1.97Diluted EPS before cumulative effect of accounting change: From Continuing Operations* $0.29 ($2.55) $0.68 $1.46 $1.92 From Discontinued Operations* ($0.05) ($2.00) ($0.95) ($0.22) $0.04Total* $0.24 ($4.55) ($0.27) $1.24 $1.96Basic EPS after cumulative effect of accounting change: From Continuing Operations* $0.29 ($2.55) $0.68 $1.46 $1.94 From Discontinued operations* ($0.05) ($2.00) ($0.95) ($0.22) $0.04Total* $0.24 ($4.55) ($0.27) $1.24 $1.98Diluted EPS after cumulative effect of accounting change: From Continuing Operations* $0.29 ($2.55) $0.68 $1.46 $1.93 From Discontinued Operations* ($0.05) ($2.00) ($0.95) ($0.22) $0.04Total* $0.24 ($4.55) ($0.27) $1.24 $1.97Dividends Declared per Common Share $0.02 $0.48 $0.64 $0.64 $0.64*The average common shares used in the computation of basic earnings (losses) per common share were 408,229,498 for 2009; 281,079,201 for 2008; 279,494,150 for 2007; 278,468,552
for 2006; and 267,334,606 for 2005. The average common shares used in the computation of diluted earnings (losses) per common share were 408,229,498 for 2009; 281,079,201 for
2008, 279,494,150 for 2007; 278,703,924 for 2006; and 267,839,018 for 2005.
BOA22177_wo18_Popular.indd 83 3/3/2010 10:46:53 AM
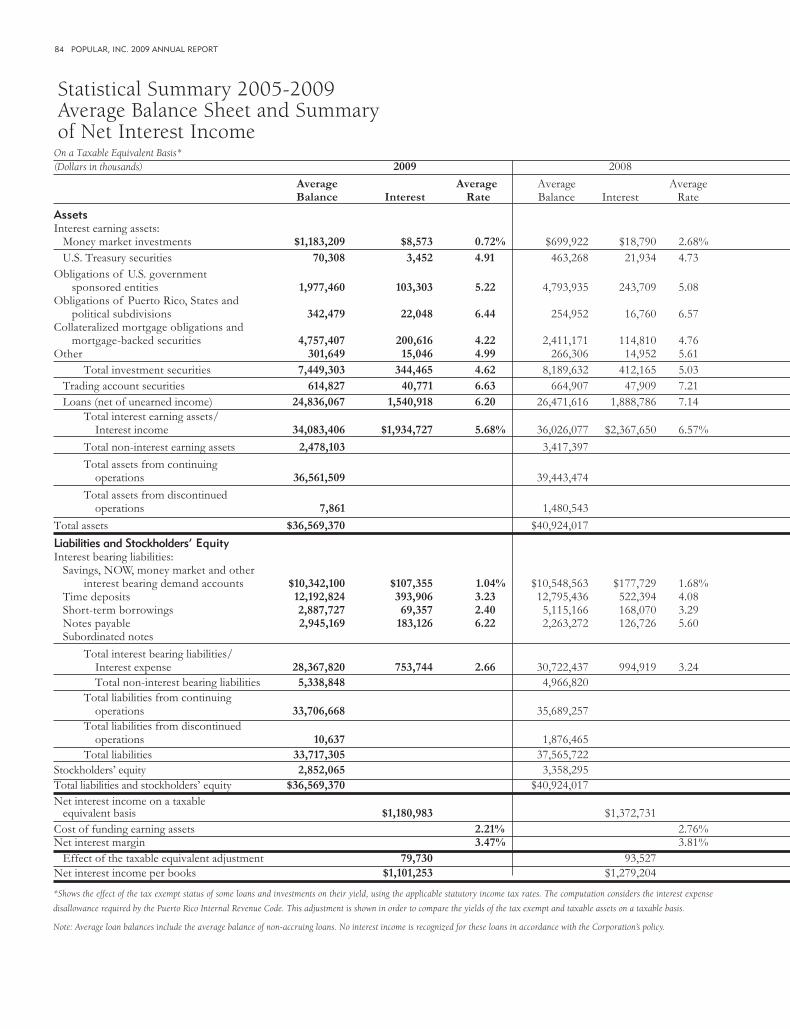
84 POPULAR, INC. 2009 ANNUAL REPORT
Statistical Summary 2005-2009 Average Balance Sheet and Summary of Net Interest Income
On a Taxable Equivalent Basis*(Dollars in thousands) 2009 2008 Average Average Average Average Balance Interest Rate Balance Interest Rate AssetsInterest earning assets: Money market investments $1,183,209 $8,573 0.72% $699,922 $18,790 2.68% U.S. Treasury securities 70,308 3,452 4.91 463,268 21,934 4.73 Obligations of U.S. government sponsored entities 1,977,460 103,303 5.22 4,793,935 243,709 5.08 Obligations of Puerto Rico, States and political subdivisions 342,479 22,048 6.44 254,952 16,760 6.57 Collateralized mortgage obligations and mortgage-backed securities 4,757,407 200,616 4.22 2,411,171 114,810 4.76 Other 301,649 15,046 4.99 266,306 14,952 5.61 Total investment securities 7,449,303 344,465 4.62 8,189,632 412,165 5.03 Trading account securities 614,827 40,771 6.63 664,907 47,909 7.21 Loans (net of unearned income) 24,836,067 1,540,918 6.20 26,471,616 1,888,786 7.14 Total interest earning assets/ Interest income 34,083,406 $1,934,727 5.68% 36,026,077 $2,367,650 6.57%
Total non-interest earning assets 2,478,103 3,417,397
Total assets from continuing operations 36,561,509 39,443,474
Total assets from discontinued operations 7,861 1,480,543
Total assets $36,569,370 $40,924,017
Liabilities and Stockholders’ EquityInterest bearing liabilities: Savings, NOW, money market and other interest bearing demand accounts $10,342,100 $107,355 1.04% $10,548,563 $177,729 1.68% Time deposits 12,192,824 393,906 3.23 12,795,436 522,394 4.08 Short-term borrowings 2,887,727 69,357 2.40 5,115,166 168,070 3.29 Notes payable 2,945,169 183,126 6.22 2,263,272 126,726 5.60 Subordinated notes Total interest bearing liabilities/ Interest expense 28,367,820 753,744 2.66 30,722,437 994,919 3.24 Total non-interest bearing liabilities 5,338,848 4,966,820 Total liabilities from continuing operations 33,706,668 35,689,257 Total liabilities from discontinued operations 10,637 1,876,465 Total liabilities 33,717,305 37,565,722 Stockholders’ equity 2,852,065 3,358,295 Total liabilities and stockholders’ equity $36,569,370 $40,924,017
Net interest income on a taxable equivalent basis $1,180,983 $1,372,731 Cost of funding earning assets 2.21% 2.76% Net interest margin 3.47% 3.81% Effect of the taxable equivalent adjustment 79,730 93,527 Net interest income per books $1,101,253 $1,279,204
*Shows the effect of the tax exempt status of some loans and investments on their yield, using the applicable statutory income tax rates. The computation considers the interest expense
disallowance required by the Puerto Rico Internal Revenue Code. This adjustment is shown in order to compare the yields of the tax exempt and taxable assets on a taxable basis.
Note: Average loan balances include the average balance of non-accruing loans. No interest income is recognized for these loans in accordance with the Corporation’s policy.
BOA22177_wo18_Popular.indd 84 3/3/2010 10:46:53 AM

85
2007 2006 2005Average Average Average Average Average AverageBalance Interest Rate Balance Interest Rate Balance Interest Rate
$513,704 $26,565 5.17% $564,423 $31,382 5.56% $797,166 $33,319 4.18%498,232 21,164 4.25 521,917 22,930 4.39 551,328 25,613 4.65
6,294,489 310,632 4.93 7,527,841 368,738 4.90 7,574,297 364,081 4.81
185,035 12,546 6.78 188,690 13,249 7.02 247,220 14,954 6.05
2,575,941 148,620 5.77 3,063,097 177,206 5.79 3,338,925 163,853 4.91273,558 14,085 5.15 415,131 15,807 3.81 472,425 17,628 3.73
9,827,255 507,047 5.16 11,716,676 597,930 5.10 12,184,195 586,129 4.81652,636 40,408 6.19 491,122 30,593 6.23 487,319 32,427 6.65
25,380,548 2,068,078 8.15 24,123,315 1,910,737 7.92 21,533,294 1,556,552 7.23
36,374,143 $2,642,098 7.26% 36,895,536 $2,570,642 6.97% 35,001,974 $2,208,427 6.31%3,054,948 2,963,092 2,772,410
39,429,091 39,858,628 37,774,384
7,675,844 8,435,938 8,587,945 $47,104,935 $48,294,566 $46,362,329
$10,126,956 $226,924 2.24% $9,317,779 $157,431 1.69% $9,408,358 $125,585 1.33%11,398,715 538,869 4.73 9,976,613 422,663 4.24 8,776,314 305,228 3.488,315,502 424,530 5.11 10,404,667 508,174 4.88 9,806,452 330,254 3.371,041,410 56,254 5.40 2,093,337 112,240 5.36 1,776,842 89,861 5.06
119,178 8,147 6.84
30,882,583 1,246,577 4.04 31,792,396 1,200,508 3.78 29,887,144 859,075 2.874,825,029 4,626,272 4,736,829
35,707,612 36,418,668 34,623,973
7,535,897 8,134,625 8,463,548 43,243,509 44,553,293 43,087,521 3,861,426 3,741,273 3,274,808
$47,104,935 $48,294,566 $46,362,329
$1,395,521 $1,370,134 $1,349,352 3.43% 3.25% 2.45% 3.83% 3.72% 3.86% 89,863 115,403 126,487 $1,305,658 $1,254,731 $1,222,865
BOA22177_wo18_Popular.indd 85 3/3/2010 10:46:53 AM

86 POPULAR, INC. 2009 ANNUAL REPORT
Statistical Summary 2008-2009 Quarterly Financial Data
2009 2008
(In thousands, except per Fourth Third Second First Fourth Third Second First common share information) Quarter Quarter Quarter Quarter Quarter Quarter Quarter QuarterSummary of Operations Interest income $440,296 $454,463 $471,046 $489,192 $541,542 $555,481 $565,258 $611,842Interest expense 170,978 178,074 187,986 216,706 252,676 231,199 234,961 276,083Net interest income 269,318 276,389 283,060 272,486 288,866 324,282 330,297 335,759Provision for loan losses 352,771 331,063 349,444 372,529 388,823 252,160 189,165 161,236Net (loss) gain on sale and valuation adjustment of investment securities (1,246) (9,059) 53,705 176,146 286 (9,132) 28,334 50,228Other non-interest income 177,133 169,103 172,134 158,585 141,211 197,060 207,464 214,523Operating expenses 298,754 220,600 330,645 304,197 360,180 322,915 330,338 323,295(Loss) income from continuing operations before income tax (206,320) (115,230) (171,190) (69,509) (318,640) (62,865) 46,592 115,979Income tax expense (benefi t) 6,907 6,331 5,393 (26,933) 309,067 148,308 (12,581) 16,740(Loss) income from continuing operations (213,227) (121,561) (176,583) (42,576) (627,707) (211,173) 59,173 99,239(Loss) income from discontinued operations, net of tax - (3,427) (6,599) (9,946) (75,193) (457,370) (34,923) 4,051Net (loss) income ($213,227) ($124,988) ($183,182) ($52,522) ($702,900) ($668,543) $24,250 $103,290Net (loss) income applicable to common stock ($213,227) $595,614 ($207,810) ($77,200) ($717,987) ($679,772) $18,247 $100,312Net (loss) income per common share - basic and diluted: (Loss) income from continuing operations ($0.33) $1.41 ($0.71) ($0.24) ($2.28) ($0.79) $0.19 $0.33 (Loss) income from discontinued operations - (0.01) (0.03) (0.03) (0.27) (1.63) (0.13) 0.03Net (loss) income ($0.33) $1.40 ($0.74) ($0.27) ($2.55) ($2.42) $0.06 $0.36Selected Average Balances(In millions)Total assets $35,025 $35,813 $37,048 $38,437 $39,531 $40,634 $40,845 $42,705Loans 24,047 24,453 25,038 25,830 26,346 26,443 26,546 26,554Interest earning assets 32,746 33,457 34,597 35,572 35,762 35,793 35,815 36,739Deposits 26,234 26,681 26,976 27,436 28,046 27,255 26,994 27,557Interest bearing liabilities 27,143 27,734 28,632 30,001 30,935 30,270 30,395 31,292Selected RatiosReturn on assets (2.42%) (1.38%) (1.98%) (0.55%) (7.07%) (6.55%) 0.24% 0.97%Return on equity (34.12) (26.24) (53.48) (19.13) (123.03) (93.32) 2.08 12.83Note: Because each reporting period stands on its own, the sum of the net (loss) income per common share for the quarters is not equal to the net loss per common share for the year ended December 31, 2009. This was principally infl uenced by the issuance of over 357 million new shares of common stock in August 2009 as part of the exchange offers, which impacted signifi cantly the weighted average common shares considered in the computation.
BOA22177_wo18_Popular.indd 86 3/3/2010 10:46:53 AM
87
To Our Stockholders:
Management’s Assessment of Internal Control Over Financial Reporting
The management of Popular, Inc. (the Corporation) is responsible for establishing and maintaining adequate internal control over fi nancial reporting as defi ned in Rules 13a - 15(f) and 15d - 15(f) under the Securities Exchange Act of 1934 and for our assessment of internal control over fi nancial reporting. The Corporation’s internal control over fi nancial reporting is a process designed to provide reasonable assurance regarding the reliability of fi nancial reporting and the preparation of fi nancial statements for external purposes in accordance with accounting principles generally accepted in the United States of America, and includes controls over the preparation of fi nancial statements in accordance with the instructions to the Consolidated Financial Statements for Bank Holding Companies (Form FR Y-9C) to comply with the reporting requirements of Section 112 of the Federal Deposit Insurance Corporation Improvement Act (FDICIA). The Corporation’s internal control over fi nancial reporting includes those policies and procedures that: (i) pertain to the maintenance of records that, in reasonable detail, accurately and fairly refl ect the transactions and dispositions of the assets of the Corporation;
(ii) provide reasonable assurance that transactions are recorded as necessary to permit preparation of fi nancial statements in accordance with accounting principles generally accepted in the United States of America, and that receipts and expenditures of the Corporation are being made only in accordance with authorizations of management and directors of the Corporation; and
(iii) provide reasonable assurance regarding prevention or timely detection of unauthorized acquisition, use or disposition of the Corporation’s assets that could have a material effect on the fi nancial statements.
Because of its inherent limitations, internal control over fi nancial reporting may not prevent or detect misstatements. Also, projections of any evaluation of effectiveness to future periods are subject to the risk that controls may become inadequate because of changes in conditions, or that the degree of compliance with the policies or procedures may deteriorate.
The management of Popular, Inc. has assessed the effectiveness of the Corporation’s internal control over fi nancial reporting as of December 31, 2009. In making this assessment, management used the criteria set forth in the Internal Control-Integrated Framework issued by the Committee of Sponsoring Organizations of the Treadway Commission (COSO).
Based on our assessment, management concluded that the Corporation maintained effective internal control over fi nancial reporting as of December 31, 2009 based on the criteria referred to above.
The Corporation’s independent registered public accounting fi rm, PricewaterhouseCoopers, LLP, has audited the effectiveness of the Corporation’s internal control over fi nancial reporting as of December 31, 2009, as stated in their report dated March 1, 2010 which appears herein.
Richard L. Carrión Jorge A. JunqueraChairman of the Board Senior Executive Vice Presidentand Chief Executive Offi cer and Chief Financial Offi cer
Management’s Report to Stockholders
88 POPULAR, INC. 2009 ANNUAL REPORT
Report of Independent Registered Public Accounting Firm
To the Board of Directors andStockholders of Popular, Inc.
In our opinion, the accompanying consolidated statements of condition and the related consolidated statements of operations, comprehensive (loss) income, changes in stockholders' equity and cash fl ows present fairly, in all material respects, the fi nancial position of Popular, Inc. and its subsidiaries at December 31, 2009 and 2008, and the results of their operations and their cash fl ows for each of the three years in the period ended December 31, 2009 in conformity with accounting principles generally accepted in the United States of America. Also in our opinion, the Corporation maintained, in all material respects, effective internal control over fi nancial reporting as of December 31, 2009, based on criteria established in Internal Control - Integrated Framework issued by the Committee of Sponsoring Organizations of the Treadway Commission (COSO). The Corporation's management is responsible for these fi nancial statements, for maintaining effective internal control over fi nancial reporting and for its assessment of the effectiveness of internal control over fi nancial reporting, included in the accompanying Management's Report to Stockholders. Our responsibility is to express opinions on these fi nancial statements and on the Corporation's internal control over fi nancial reporting based on our integrated audits. We conducted our audits in accordance with the standards of the Public Company Accounting Oversight Board (United States). Those standards require that we plan and perform the audits to obtain reasonable assurance about whether the fi nancial statements are free of material misstatement and whether effective internal control over fi nancial reporting was maintained in all material respects. Our audits of the fi nancial statements included examining, on a test basis, evidence supporting the amounts and disclosures in the fi nancial statements, assessing the accounting principles used and signifi cant estimates made by management, and evaluating the overall fi nancial statement presentation. Our audit of internal control over fi nancial reporting included obtaining an understanding of internal control over fi nancial reporting, assessing the risk that a material weakness exists, and testing and evaluating the design and operating effectiveness of internal control based on the assessed risk. Our audits also included performing such other procedures as we considered necessary in the circumstances. We believe that our audits provide a reasonable basis for our opinions.
As discussed in Note 1 to the consolidated fi nancial statements, the Corporation changed the manner in which it accounts for the fi nancial assets and liabilities at fair value in 2008.
A company’s internal control over fi nancial reporting is a process designed to provide reasonable assurance regarding the reliability of fi nancial reporting and the preparation of fi nancial statements for external purposes in accordance with generally accepted accounting principles. Management's assessment and our audit of Popular, Inc.'s internal control over fi nancial reporting also included controls over the preparation of fi nancial statements in accordance with the instructions to the Consolidated Financial Statements for Bank Holding Companies (Form FR Y-9C) to comply with the reporting requirements of Section 112 of the Federal Deposit Insurance Corporation Improvement Act (FDICIA). A company’s internal control over fi nancial reporting includes those policies and procedures that (i) pertain to the maintenance of records that, in reasonable detail, accurately and fairly refl ect the transactions and dispositions of the assets of the company; (ii) provide reasonable assurance that transactions are recorded as necessary to permit preparation of fi nancial statements in accordance with generally accepted accounting principles, and that receipts and expenditures of the company are being made only in accordance with authorizations of management and directors of the company; and (iii) provide reasonable assurance regarding prevention or timely detection of unauthorized acquisition, use, or disposition of the company’s assets that could have a material effect on the fi nancial statements.
BOA22177_wo18_Popular.indd 88 3/3/2010 10:46:54 AM

89
Because of its inherent limitations, internal control over fi nancial reporting may not prevent or detect misstatements. Also, projections of any evaluation of effectiveness to future periods are subject to the risk that controls may become inadequate because of changes in conditions, or that the degree of compliance with the policies or procedures may deteriorate.
CERTIFIED PUBLIC ACCOUNTANTS (OF PUERTO RICO)License No. 216 Expires December 1, 2010Stamp 2389655 of the P.R.Society of Certifi ed PublicAccountants has been affi xedto the fi le copy of this report.
PRICEWATERHOUSECOOPERS LLPSan Juan, Puerto RicoMarch 1, 2010
BOA22177_wo18_Popular.indd 89 3/3/2010 10:46:54 AM

90 POPULAR, INC. 2009 ANNUAL REPORT
Consolidated Statements of Condition December 31,
(In thousands, except share information) 2009 2008AssetsCash and due from banks $677,330 $784,987Money market investments: Federal funds sold 159,807 214,990 Securities purchased under agreements to resell 293,125 304,228 Time deposits with other banks 549,865 275,436 1,002,797 794,654Trading securities, at fair value: Pledged securities with creditors’ right to repledge 415,653 562,795 Other trading securities 46,783 83,108Investment securities available-for-sale, at fair value: Pledged securities with creditors’ right to repledge 2,330,441 3,031,137 Other securities available-for-sale 4,364,273 4,893,350Investment securities held-to-maturity, at amortized cost (fair value 2009 - $213,146; 2008 - $290,134) 212,962 294,747Other investment securities, at lower of cost or realizable value (fair value 2009 - $165,497; 2008 - $255,830) 164,149 217,667Loans held-for-sale, at lower of cost or fair value 90,796 536,058Loans held-in-portfolio 23,827,263 25,857,237 Less - Unearned income 114,150 124,364 Allowance for loan losses 1,261,204 882,807 22,451,909 24,850,066Premises and equipment, net 584,853 620,807Other real estate 125,483 89,721Accrued income receivable 126,080 156,227Servicing assets (measured at fair value 2009 - $169,747; 2008 - $176,034) 172,505 180,306Other assets (Note 15) 1,322,159 1,115,597Goodwill 604,349 605,792Other intangible assets 43,803 53,163Assets from discontinued operations - 12,587 $34,736,325 $38,882,769
Liabilities and Stockholders’ EquityLiabilities: Deposits: Non-interest bearing $4,495,301 $4,293,553 Interest bearing 21,429,593 23,256,652 25,924,894 27,550,205 Federal funds purchased and assets sold under agreements to repurchase 2,632,790 3,551,608 Other short-term borrowings 7,326 4,934 Notes payable 2,648,632 3,386,763 Other liabilities 983,866 1,096,338 Liabilities from discontinued operations - 24,557 32,197,508 35,614,405 Commitments and contingencies (See Notes 29, 31, 32, 33, 34)Stockholders’ Equity: Preferred stock, 30,000,000 shares authorized; 2,006,391 shares issued and outstanding at December 31, 2009 (2008 - 24,410,000) (aggregate liquidation preference value of $50,160 at December 31, 2009; 2008 - $1,521,875) 50,160 1,483,525 Common stock, $0.01 par value at December 31, 2009 (2008 - $6.00); 700,000,000 shares authorized (2008 - 470,000,000); 639,544,895 shares issued (2008 - 295,632,080) and 639,540,105 outstanding (2008 - 282,004,713) 6,395 1,773,792 Surplus 2,804,238 621,879 Accumulated defi cit (292,752) (374,488) Treasury stock - at cost, 4,790 shares (2008 - 13,627,367) (15) (207,515) Accumulated other comprehensive loss, net of tax of ($33,964) (2008 - ($24,771)) (29,209) (28,829) 2,538,817 3,268,364 $34,736,325 $38,882,769
The accompanying notes are an integral part of the consolidated fi nancial statements.
BOA22177_wo18_Popular.indd 90 3/3/2010 10:46:54 AM
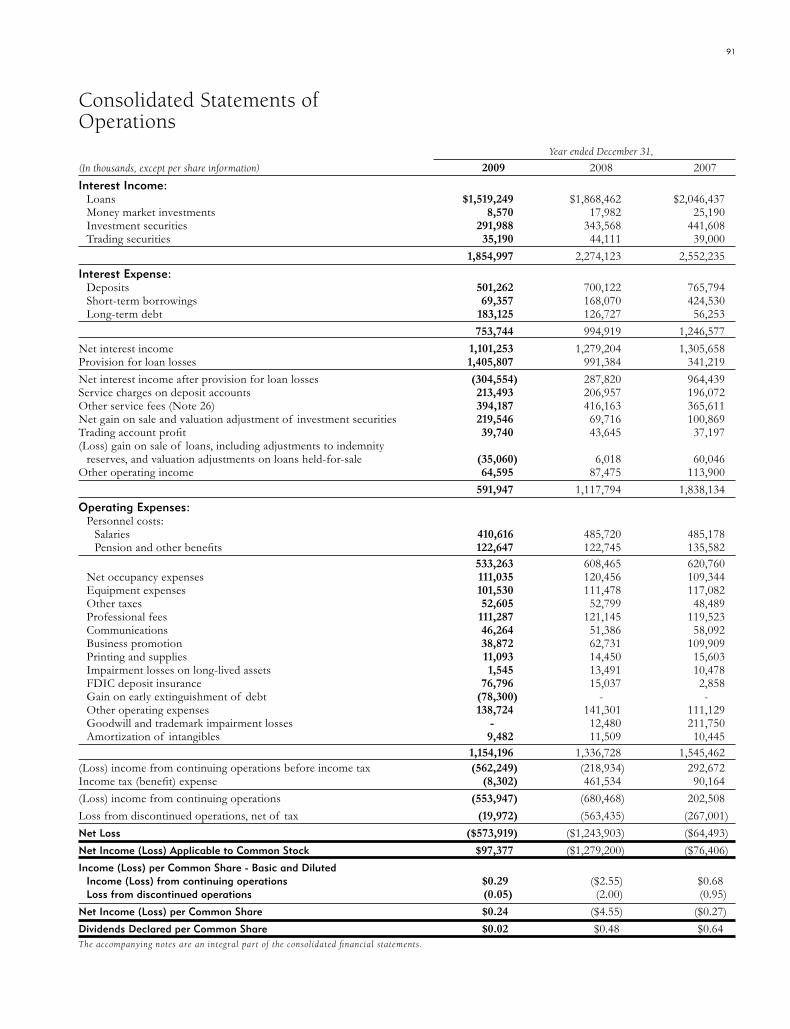
91
Year ended December 31, (In thousands, except per share information) 2009 2008 2007Interest Income: Loans $1,519,249 $1,868,462 $2,046,437 Money market investments 8,570 17,982 25,190 Investment securities 291,988 343,568 441,608 Trading securities 35,190 44,111 39,000 1,854,997 2,274,123 2,552,235Interest Expense: Deposits 501,262 700,122 765,794 Short-term borrowings 69,357 168,070 424,530 Long-term debt 183,125 126,727 56,253 753,744 994,919 1,246,577Net interest income 1,101,253 1,279,204 1,305,658Provision for loan losses 1,405,807 991,384 341,219Net interest income after provision for loan losses (304,554) 287,820 964,439Service charges on deposit accounts 213,493 206,957 196,072Other service fees (Note 26) 394,187 416,163 365,611Net gain on sale and valuation adjustment of investment securities 219,546 69,716 100,869Trading account profi t 39,740 43,645 37,197(Loss) gain on sale of loans, including adjustments to indemnity reserves, and valuation adjustments on loans held-for-sale (35,060) 6,018 60,046Other operating income 64,595 87,475 113,900 591,947 1,117,794 1,838,134Operating Expenses: Personnel costs: Salaries 410,616 485,720 485,178 Pension and other benefi ts 122,647 122,745 135,582 533,263 608,465 620,760 Net occupancy expenses 111,035 120,456 109,344 Equipment expenses 101,530 111,478 117,082 Other taxes 52,605 52,799 48,489 Professional fees 111,287 121,145 119,523 Communications 46,264 51,386 58,092 Business promotion 38,872 62,731 109,909 Printing and supplies 11,093 14,450 15,603 Impairment losses on long-lived assets 1,545 13,491 10,478 FDIC deposit insurance 76,796 15,037 2,858 Gain on early extinguishment of debt (78,300) - - Other operating expenses 138,724 141,301 111,129 Goodwill and trademark impairment losses - 12,480 211,750 Amortization of intangibles 9,482 11,509 10,445 1,154,196 1,336,728 1,545,462(Loss) income from continuing operations before income tax (562,249) (218,934) 292,672Income tax (benefi t) expense (8,302) 461,534 90,164(Loss) income from continuing operations (553,947) (680,468) 202,508Loss from discontinued operations, net of tax (19,972) (563,435) (267,001)Net Loss ($573,919) ($1,243,903) ($64,493)Net Income (Loss) Applicable to Common Stock $97,377 ($1,279,200) ($76,406)Income (Loss) per Common Share - Basic and Diluted Income (Loss) from continuing operations $0.29 ($2.55) $0.68 Loss from discontinued operations (0.05) (2.00) (0.95)Net Income (Loss) per Common Share $0.24 ($4.55) ($0.27)Dividends Declared per Common Share $0.02 $0.48 $0.64The accompanying notes are an integral part of the consolidated fi nancial statements.
Consolidated Statements of Operations
BOA22177_wo18_Popular.indd 91 3/3/2010 10:46:54 AM

92 POPULAR, INC. 2009 ANNUAL REPORT
Consolidated Statements of Cash Flows Year ended December 31,(In thousands) 2009 2008 2007
Cash Flows from Operating Activities: Net loss ($573,919) ($1,243,903) ($64,493) Adjustments to reconcile net loss to net cash provided by operating activities: Depreciation and amortization of premises and equipment 64,451 73,088 78,563 Provision for loan losses 1,405,807 1,010,375 562,650 Goodwill and trademark impairment losses - 12,480 211,750 Impairment losses on long-lived assets 1,545 17,445 12,344 Amortization of intangibles 9,482 11,509 10,445 Amortization and fair value adjustment of servicing assets 32,960 52,174 61,110 Amortization of discount on junior subordinated debentures 7,258 - - Net gain on sale and valuation adjustment of investment securities (219,546) (64,296) (55,159) (Earnings) losses from changes in fair value related to instruments measured at fair value pursuant to the fair value option (1,674) 198,880 - Net gain on disposition of premises and equipment (412) (25,904) (12,296) Net loss on sale of loans, including adjustments to indemnity reserves, and valuation adjustments on loans held-for-sale 40,268 83,056 38,970 Gain on early extinguishment of debt (78,300) - - Net amortization of premiums and accretion of discounts on investments 19,245 19,884 20,238 Net amortization of premiums on loans and deferred loan origination fees and costs 45,031 52,495 90,511 Fair value adjustment of other assets held for sale - 120,789 - Earnings from investments under the equity method (17,695) (8,916) (21,347) Stock options expense 202 1,099 1,763 Net disbursements on loans held-for-sale (1,129,554) (2,302,189) (4,803,927) Acquisitions of loans held-for-sale (354,472) (431,789) (550,392) Proceeds from sale of loans held-for-sale 79,264 1,492,870 4,127,794 Net decrease in trading securities 1,542,470 1,754,100 1,222,585 Net decrease in accrued income receivable 30,601 59,459 11,832 Net (increase) decrease in other assets (182,960) 86,073 (94,215) Net (decrease) increase in interest payable (47,695) (58,406) 5,013 Deferred income taxes (79,890) 379,726 (223,740) Net increase in postretirement benefi t obligation 4,223 3,405 2,388 Net increase (decrease) in other liabilities 32,213 (35,986) 71,575 Total adjustments 1,202,822 2,501,421 768,455 Net cash provided by operating activities 628,903 1,257,518 703,962
Cash Flows from Investing Activities: Net (increase) decrease in money market investments (208,143) 212,058 (638,568) Purchases of investment securities: Available-for-sale (4,193,290) (4,075,884) (160,712) Held-to-maturity (59,562) (5,086,169) (29,320,286) Other (38,913) (193,820) (112,108) Proceeds from calls, paydowns, maturities and redemptions of investment securities: Available-for-sale 1,631,607 2,491,732 1,608,677 Held-to-maturity 141,566 5,277,873 28,935,561 Other 75,101 192,588 44,185 Proceeds from sales of investment securities available-for-sale 3,825,313 2,445,510 58,167 Proceeds from sale of other investment securities 52,294 49,489 246,352 Net repayments (disbursements) on loans 1,053,747 (1,093,437) (1,457,925) Proceeds from sale of loans 328,170 2,426,491 415,256 Acquisition of loan portfolios (72,675) (4,505) (22,312) Net liabilities acquired, net of cash - - 719,604 Mortgage servicing rights purchased (1,364) (42,331) (26,507) Acquisition of premises and equipment (69,640) (146,140) (104,866) Proceeds from sale of premises and equipment 40,243 60,058 63,455 Proceeds from sale of foreclosed assets 149,947 166,683 175,974 Net cash provided by investing activities 2,654,401 2,680,196 423,947
Cash Flows from Financing Activities: Net (decrease) increase in deposits (1,625,598) (754,177) 2,889,524 Net decrease in federal funds purchased and assets sold under agreements to repurchase (918,818) (1,885,656) (325,180) Net increase (decrease) in other short-term borrowings 2,392 (1,497,045) (2,612,801) Payments of notes payable (813,077) (2,016,414) (2,463,277) Proceeds from issuance of notes payable 60,675 1,028,098 1,425,220 Dividends paid (71,438) (188,644) (190,617) Proceeds from issuance of common stock - 17,712 20,414 Proceeds from issuance of preferred stock and associated warrants - 1,324,935 - Issuance costs and fees paid on exchange of preferred stock and trust preferred securities (25,080) - - Treasury stock acquired (17) (361) (2,525)Net cash used in fi nancing activities (3,390,961) (3,971,552) (1,259,242)Net decrease in cash and due from banks (107,657) (33,838) (131,333)Cash and due from banks at beginning of period 784,987 818,825 950,158Cash and due from banks at end of period $677,330 $784,987 $818,825The accompanying notes are an integral part of the consolidated fi nancial statements.Note: The Consolidated Statements of Cash Flows for the year ended December 31, 2009, 2008 and 2007 include the cash fl ows from operating, investing and fi nancing activities associated with discontinued operations.
BOA22177_wo18_Popular.indd 92 3/3/2010 10:46:54 AM
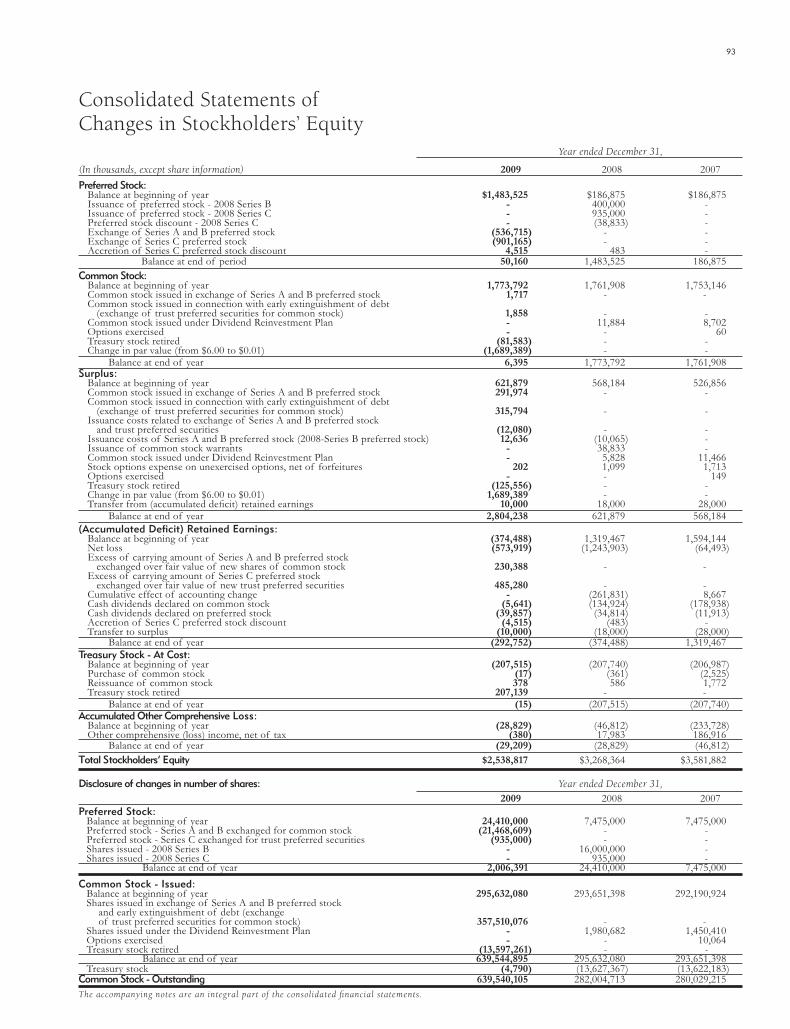
93
Year ended December 31,
(In thousands, except share information) 2009 2008 2007Preferred Stock: Balance at beginning of year $1,483,525 $186,875 $186,875 Issuance of preferred stock - 2008 Series B - 400,000 - Issuance of preferred stock - 2008 Series C - 935,000 - Preferred stock discount - 2008 Series C - (38,833) - Exchange of Series A and B preferred stock (536,715) - - Exchange of Series C preferred stock (901,165) - - Accretion of Series C preferred stock discount 4,515 483 - Balance at end of period 50,160 1,483,525 186,875Common Stock: Balance at beginning of year 1,773,792 1,761,908 1,753,146 Common stock issued in exchange of Series A and B preferred stock 1,717 - - Common stock issued in connection with early extinguishment of debt (exchange of trust preferred securities for common stock) 1,858 - - Common stock issued under Dividend Reinvestment Plan - 11,884 8,702 Options exercised - - 60 Treasury stock retired (81,583) - - Change in par value (from $6.00 to $0.01) (1,689,389) - - Balance at end of year 6,395 1,773,792 1,761,908Surplus: Balance at beginning of year 621,879 568,184 526,856 Common stock issued in exchange of Series A and B preferred stock 291,974 - - Common stock issued in connection with early extinguishment of debt (exchange of trust preferred securities for common stock) 315,794 - - Issuance costs related to exchange of Series A and B preferred stock and trust preferred securities (12,080) - - Issuance costs of Series A and B preferred stock (2008-Series B preferred stock) 12,636 (10,065) - Issuance of common stock warrants - 38,833 - Common stock issued under Dividend Reinvestment Plan - 5,828 11,466 Stock options expense on unexercised options, net of forfeitures 202 1,099 1,713 Options exercised - - 149 Treasury stock retired (125,556) - - Change in par value (from $6.00 to $0.01) 1,689,389 - - Transfer from (accumulated defi cit) retained earnings 10,000 18,000 28,000 Balance at end of year 2,804,238 621,879 568,184(Accumulated Defi cit) Retained Earnings: Balance at beginning of year (374,488) 1,319,467 1,594,144 Net loss (573,919) (1,243,903) (64,493) Excess of carrying amount of Series A and B preferred stock exchanged over fair value of new shares of common stock 230,388 - - Excess of carrying amount of Series C preferred stock exchanged over fair value of new trust preferred securities 485,280 - - Cumulative effect of accounting change - (261,831) 8,667 Cash dividends declared on common stock (5,641) (134,924) (178,938) Cash dividends declared on preferred stock (39,857) (34,814) (11,913) Accretion of Series C preferred stock discount (4,515) (483) - Transfer to surplus (10,000) (18,000) (28,000) Balance at end of year (292,752) (374,488) 1,319,467Treasury Stock - At Cost: Balance at beginning of year (207,515) (207,740) (206,987) Purchase of common stock (17) (361) (2,525) Reissuance of common stock 378 586 1,772 Treasury stock retired 207,139 - - Balance at end of year (15) (207,515) (207,740)Accumulated Other Comprehensive Loss: Balance at beginning of year (28,829) (46,812) (233,728) Other comprehensive (loss) income, net of tax (380) 17,983 186,916 Balance at end of year (29,209) (28,829) (46,812)Total Stockholders’ Equity $2,538,817 $3,268,364 $3,581,882
Disclosure of changes in number of shares: Year ended December 31,
2009 2008 2007Preferred Stock: Balance at beginning of year 24,410,000 7,475,000 7,475,000 Preferred stock - Series A and B exchanged for common stock (21,468,609) - - Preferred stock - Series C exchanged for trust preferred securities (935,000) - - Shares issued - 2008 Series B - 16,000,000 - Shares issued - 2008 Series C - 935,000 - Balance at end of year 2,006,391 24,410,000 7,475,000Common Stock - Issued: Balance at beginning of year 295,632,080 293,651,398 292,190,924 Shares issued in exchange of Series A and B preferred stock and early extinguishment of debt (exchange of trust preferred securities for common stock) 357,510,076 - - Shares issued under the Dividend Reinvestment Plan - 1,980,682 1,450,410 Options exercised - - 10,064 Treasury stock retired (13,597,261) - - Balance at end of year 639,544,895 295,632,080 293,651,398 Treasury stock (4,790) (13,627,367) (13,622,183)Common Stock - Outstanding 639,540,105 282,004,713 280,029,215The accompanying notes are an integral part of the consolidated fi nancial statements.
Consolidated Statements of Changes in Stockholders’ Equity
BOA22177_wo18_Popular.indd 93 3/3/2010 10:46:54 AM
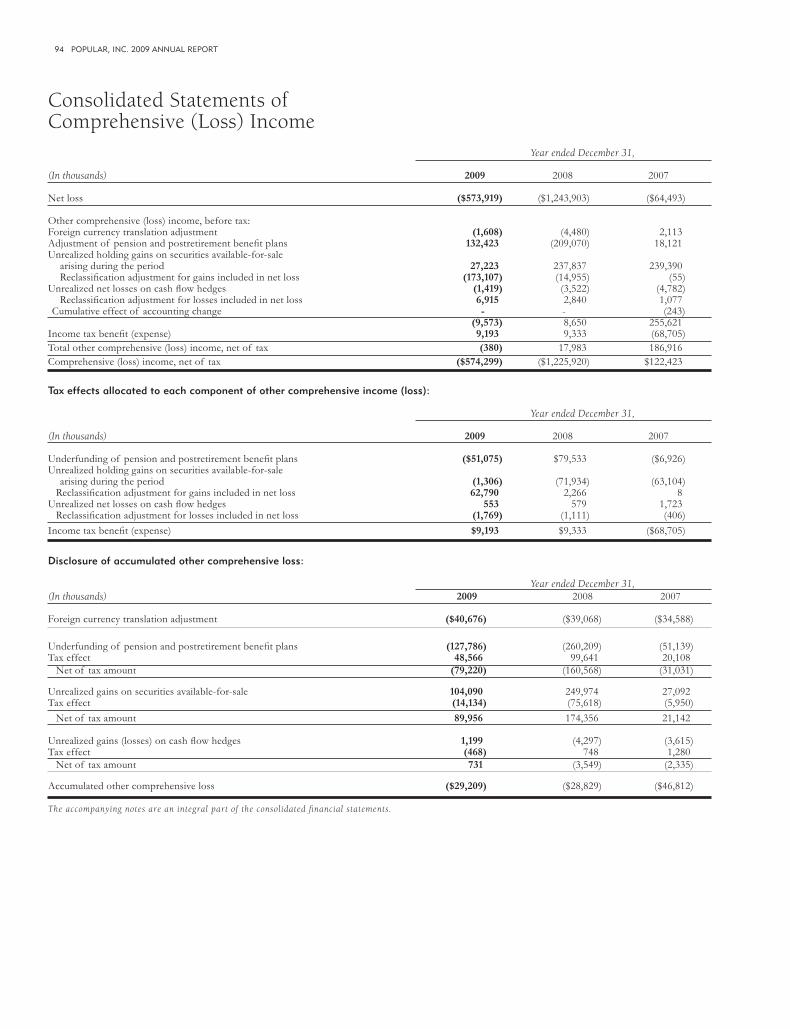
94 POPULAR, INC. 2009 ANNUAL REPORT
Year ended December 31,
(In thousands) 2009 2008 2007
Net loss ($573,919) ($1,243,903) ($64,493) Other comprehensive (loss) income, before tax: Foreign currency translation adjustment (1,608) (4,480) 2,113 Adjustment of pension and postretirement benefi t plans 132,423 (209,070) 18,121 Unrealized holding gains on securities available-for-sale arising during the period 27,223 237,837 239,390 Reclassifi cation adjustment for gains included in net loss (173,107) (14,955) (55) Unrealized net losses on cash fl ow hedges (1,419) (3,522) (4,782) Reclassifi cation adjustment for losses included in net loss 6,915 2,840 1,077 Cumulative effect of accounting change - - (243) (9,573) 8,650 255,621 Income tax benefi t (expense) 9,193 9,333 (68,705)Total other comprehensive (loss) income, net of tax (380) 17,983 186,916 Comprehensive (loss) income, net of tax ($574,299) ($1,225,920) $122,423
Tax effects allocated to each component of other comprehensive income (loss):
Year ended December 31,
(In thousands) 2009 2008 2007 Underfunding of pension and postretirement benefi t plans ($51,075) $79,533 ($6,926)Unrealized holding gains on securities available-for-sale arising during the period (1,306) (71,934) (63,104) Reclassifi cation adjustment for gains included in net loss 62,790 2,266 8 Unrealized net losses on cash fl ow hedges 553 579 1,723 Reclassifi cation adjustment for losses included in net loss (1,769) (1,111) (406)Income tax benefi t (expense) $9,193 $9,333 ($68,705)
Disclosure of accumulated other comprehensive loss:
Year ended December 31,(In thousands) 2009 2008 2007
Foreign currency translation adjustment ($40,676) ($39,068) ($34,588)
Underfunding of pension and postretirement benefi t plans (127,786) (260,209) (51,139)Tax effect 48,566 99,641 20,108 Net of tax amount (79,220) (160,568) (31,031) Unrealized gains on securities available-for-sale 104,090 249,974 27,092Tax effect (14,134) (75,618) (5,950) Net of tax amount 89,956 174,356 21,142
Unrealized gains (losses) on cash fl ow hedges 1,199 (4,297) (3,615)Tax effect (468) 748 1,280 Net of tax amount 731 (3,549) (2,335)
Accumulated other comprehensive loss ($29,209) ($28,829) ($46,812)
The accompanying notes are an integral part of the consolidated fi nancial statements.
Consolidated Statements of Comprehensive (Loss) Income
BOA22177_wo18_Popular.indd 94 3/3/2010 10:46:54 AM
95
Note 1 - Nature of operations and summary of signifi cant accounting policies ............................................... 96
Note 2 - Subsequent events ............................................. 110Note 3 - Discontinued operations .................................... 110Note 4 - Restructuring plans ........................................... 113Note 5 - Restrictions on cash and due from banks and highly liquid securities ...................................... 114Note 6 - Securities purchased under agreements to resell . 115Note 7 - Investment securities available-for-sale ............... 115Note 8 - Investment securities held-to-maturity ............... 119Note 9 - Pledged assets ................................................... 120Note 10 - Loans and allowance for loan losses ................... 120Note 11 - Related party transactions .................................. 121Note 12 - Premises and equipment .................................... 122Note 13 - Servicing assets ................................................. 122Note 14 - Goodwill and other intangible assets .................. 125Note 15 - Other assets ....................................................... 129Note 16 - Deposits ............................................................ 129Note 17 - Federal funds purchased and assets sold under agreements to repurchase .......................... 129Note 18 - Other short-term borrowings .............................. 130Note 19 - Notes payable..................................................... 131Note 20 - Unused lines of credit and other funding sources 131Note 21 - Exchange offers ................................................. 132Note 22 - Trust preferred securities .................................... 134Note 23 - Stockholders’ equity .......................................... 135Note 24 - Net income (loss) per common share ................. 137Note 25 - Regulatory capital requirements ......................... 138Note 26 - Other service fees .............................................. 139Note 27 - Employee benefi ts ............................................. 139Note 28 - Stock-based compensation ................................. 145Note 29 - Rental expense and commitments ...................... 147Note 30 - Income tax ........................................................ 147Note 31 - Derivative instruments and hedging activities ..... 150Note 32 - Off-balance sheet activities and concentration of credit risk .................................. 152Note 33 - Contingent liabilities ......................................... 153Note 34 - Guarantees ........................................................ 154Note 35 - Fair value option ............................................... 156Note 36 - Fair value measurement ..................................... 157Note 37 - Disclosures about fair value of fi nancial instruments ........................................................ 162Note 38 - Supplemental disclosure on the consolidated statements of cash fl ows ..................................... 164Note 39 - Segment reporting ............................................. 165Note 40 - Popular, Inc. (Holding Company only) fi nancial information ........................................................ 168Note 41 - Condensed consolidating fi nancial information of guarantor and issuers of registered guaranteed securities ............................................................ 170
Notes to Consolidated Financial Statements
96 POPULAR, INC. 2009 ANNUAL REPORT
Note 1 - Nature of Operations and Summary of Signifi cant Accounting Policies:The accounting and fi nancial reporting policies of Popular, Inc. and its subsidiaries (the “Corporation”) conform with accounting principles generally accepted in the United States of America and with prevailing practices within the fi nancial services industry.
The following is a description of the most signifi cant of these policies:
Nature of operationsThe Corporation is a diversifi ed, publicly owned fi nancial holding company subject to the supervision and regulation of the Board of Governors of the Federal Reserve System. The Corporation is a fi nancial services provider with operations in Puerto Rico, the United States, the Caribbean and Latin America. As the leading fi nancial institution in Puerto Rico, the Corporation offers retail and commercial banking services through its principal banking subsidiary, Banco Popular de Puerto Rico (“BPPR”), as well as auto and equipment leasing and fi nancing, mortgage loans, investment banking, broker-dealer and insurance services through specialized subsidiaries. In the United States, Popular has established a community-banking franchise, Banco Popular North America (“BPNA”) providing a broad range of financial services and products with branches in New York, New Jersey, Illinois, Florida and California. Popular also offers processing technology services through its subsidiary EVERTEC, Inc. This subsidiary provides transaction processing services throughout the Caribbean and Latin America, as well as internally services many of the Corporation’s subsidiaries’ system infrastructures and transactional processing businesses. Note 39 to the consolidated fi nancial statements present information about the Corporation’s business segments.
Principles of consolidationThe consolidated fi nancial statements include the accounts of Popular, Inc. and its subsidiaries. Intercompany accounts and transactions have been eliminated in consolidation. In accordance with the consolidation guidance for variable interest entities, the Corporation would also consolidate any variable interest entities (“VIEs”) for which it is the primary benefi ciary and, therefore will absorb the majority of the entity’s expected losses, receive a majority of the entity’s expected returns, or both. Assets held in a fi duciary capacity are not assets of the Corporation and, accordingly, are not included in the consolidated statements of condition.
Unconsolidated investments, in which there is at least 20% ownership, are generally accounted for by the equity method, with earnings recorded in other operating income. These investments are included in other assets and the Corporation’s proportionate share of income or loss is included in other operating income. Those investments in which there is less than 20% ownership,
are generally carried under the cost method of accounting, unless signifi cant infl uence is exercised. Under the cost method, the Corporation recognizes income when dividends are received. Limited partnerships are accounted for by the equity method unless the investor’s interest is so “minor” that the limited partner may have virtually no infl uence over partnership operating and fi nancial policies.
Statutory business trusts that are wholly-owned by the Corporation and are issuers of trust preferred securities are not consolidated in the Corporation’s consolidated fi nancial statements.
Business combinationsBusiness combinations are accounted for under the acquisition method. Under this method, assets acquired, liabilities assumed and any noncontrolling interest in the acquiree at the acquisition date are measured at their fair values as of the acquisition date. The acquisition date is the date the acquirer obtains control. Also, assets or liabilities arising from noncontractual contingencies are measured at their acquisition date at fair value only if it is more likely than not that they meet the defi nition of an asset or liability. Adjustments subsequently made to the provisional amounts recorded on the acquisition date will be made retroactively during a measurement period not to exceed one year. Furthermore, acquisition-related restructuring costs that do not meet certain criteria of exit or disposal activities are expensed as incurred. Transaction costs are expensed as incurred. The reversals of deferred income tax valuation allowances and income tax contingencies are recognized in earnings subsequent to the measurement period. There were no signifi cant business combinations during 2009 and 2008.
Discontinued operationsComponents of the Corporation that have been or will be disposed of by sale, where the Corporation does not have a signifi cant continuing involvement in the operations after the disposal, are accounted for as discontinued operations. The fi nancial results of Popular Financial Holdings (“PFH”) are reported as discontinued operations in the consolidated statements of operations for all periods presented and in the consolidated statement of condition for the year ended December 31, 2008. Prior to the discontinuance of the business, PFH was considered a reportable segment. Refer to Note 3 to the consolidated fi nancial statements for additional information on PFH’s discontinued operations.
The results of operations of the discontinued operations exclude allocations of corporate overhead. The interest expense allocated to the discontinued operations is based on legal entity, which considers a transfer pricing allocation for intercompany funding.
BOA22177_wo18_Popular.indd 96 3/3/2010 10:46:54 AM
97
Use of estimates in the preparation of fi nancial statementsThe preparation of financial statements in conformity with accounting principles generally accepted in the United States of America requires management to make estimates and assumptions that affect the reported amounts of assets and liabilities and contingent assets and liabilities at the date of the financial statements, and the reported amounts of revenues and expenses during the reporting period. Actual results could differ from those estimates.
Fair Value MeasurementsEffective January 1, 2008, the Corporation determines the fair values of its fi nancial instruments based on the fair value framework established in the guidance for Fair Value Measurements in ASC Subtopic 820-10, which requires an entity to maximize the use of observable inputs and minimize the use of unobservable inputs when measuring fair value. Fair value is defi ned as the exchange price that would be received for an asset or paid to transfer a liability (an exit price) in the principal or most advantageous market for the asset or liability in an orderly transaction between market participants on the measurement date. The standard describes three levels of inputs that may be used to measure fair value which are (1) quoted market prices for identical assets or liabilities in active markets, (2) observable market-based inputs or unobservable inputs that are corroborated by market data, and (3) unobservable inputs that are not corroborated by market data. The fair value hierarchy ranks the quality and reliability of the information used to determine fair values. In January 2009, the Corporation adopted the provisions of fair value measurements and disclosures for nonfi nancial assets and nonfi nancial liabilities that are recognized or disclosed at fair value on a nonrecurring basis. Refer to Note 36 to these consolidated fi nancial statements for the fair value measurement disclosures required for the year ended December 31, 2009.
The guidance in ASC Subtopic 820-10 also addresses measuring fair value in situations where markets are inactive and transactions are not orderly. Transactions or quoted prices for assets and liabilities may not be determinative of fair value when transactions are not orderly, and thus, may require adjustments to estimate fair value. Price quotes based on transactions that are not orderly should be given little, if any, weight in measuring fair value. Price quotes based on transactions that are orderly shall be considered in determining fair value, and the weight given is based on facts and circumstances. If suffi cient information is not available to determine if price quotes are based on orderly transactions, less weight should be given to the price quote relative to other transactions that are known to be orderly.
Fair value optionIn January 2008, the Corporation adopted the guidance in ASC Subtopic 825-10, which provides companies with an option to report selected fi nancial assets and liabilities at fair value. The election to measure a fi nancial asset or liability at fair value can be made on an instrument-by-instrument basis and is irrevocable. The difference between the carrying amount and the fair value at the adoption date was recorded as a transition adjustment to beginning retained earnings. Subsequent changes in fair value are recognized in earnings. After the initial adoption, the fair value election is made at the acquisition of a fi nancial asset, fi nancial liability, or a fi rm commitment and it may not be revoked.
Refer to Note 35 to these consolidated fi nancial statements for the impact of the initial adoption of the fair value option to beginning retained earnings as of January 1, 2008. There were no fi nancial assets or liabilities from continuing operations measured pursuant to the fair value option at December 31, 2009 and 2008.
Investment securitiesInvestment securities are classifi ed in four categories and accounted for as follows:
• Debt securities that the Corporation has the intent and ability to hold to maturity are classifi ed as securities held-to-maturity and reported at amortized cost. The Corporation may not sell or transfer held-to-maturity securities without calling into question its intent to hold other debt securities to maturity, unless a nonrecurring or unusual event that could not have been reasonably anticipated has occurred.
• Debt and equity securities classifi ed as trading securities are reported at fair value, with unrealized gains and losses included in non-interest income.
• Debt and equity securities not classifi ed as either securities held-to-maturity or trading securities, and which have a readily available fair value, are classifi ed as securities available-for-sale and reported at fair value, with unrealized gains and losses excluded from earnings and reported, net of taxes, in accumulated other comprehensive income or loss. The specific identification method is used to determine realized gains and losses on securities available-for-sale, which are included in net gains or losses on sale and valuation adjustment of investment securities in the consolidated statements of operations. Declines in the value of debt and equity securities that are considered other-than-temporary reduce the value of the asset, and the estimated loss is recorded in non-interest income. In April 2009, the Corporation adopted the new guidance for other-than-temporary impairment for debt securities. For debt securities, the Corporation is required to assess whether (a) it has the intent to sell the debt security, or (b) it is more
BOA22177_wo18_Popular.indd 97 3/3/2010 10:46:54 AM

98 POPULAR, INC. 2009 ANNUAL REPORT
likely than not that it will be required to sell the debt security before its anticipated recovery. If either of these conditions is met, an other-than-temporary impairment on the security must be recognized. In instances in which a determination is made that a credit loss (defi ned as the difference between the present value of the cash fl ows expected to be collected and the amortized cost basis) exists but the entity does not intend to sell the debt security and it is not more likely than not that the entity will be required to sell the debt security before the anticipated recovery of its remaining amortized cost basis (i.e., the amortized cost basis less any current-period credit loss), the impairment is separated into (a) the amount of the total impairment related to the credit loss, and (b) the amount of the total impairment related to all other factors. The amount of the total other-than-temporary impairment related to the credit loss is recognized in the statement of operations. The amount of the total impairment related to all other factors is recognized in other comprehensive loss. Previously, in all cases, if an impairment was determined to be other-than-temporary, an impairment loss was recognized in earnings in an amount equal to the entire difference between the security’s amortized cost basis and its fair value at the balance sheet date of the reporting period for which the assessment was made. This guidance does not amend the existing recognition and measurement guidance related to other-than-temporary impairments for equity securities. The other-than-temporary impairment analysis for both debt and equity securities are performed on a quarterly basis.
• Investments in equity or other securities that do not have readily available fair values are classifi ed as other investment securities in the consolidated statements of condition, and are subject to impairment testing if applicable. These securities are stated at the lower of cost or realizable value. The source of this value varies according to the nature of the investment, and is primarily obtained by the Corporation from valuation analyses prepared by third-parties or from information derived from fi nancial statements available for the corresponding venture capital and mutual funds. Stock that is owned by the Corporation to comply with regulatory requirements, such as Federal Reserve Bank and Federal Home Loan Bank (“FHLB”) stock, is included in this category, and their realizable value equals their cost.
The amortization of premiums is deducted and the accretion of discounts is added to net interest income based on the interest method over the outstanding period of the related securities, except for a small portfolio of mortgage-backed securities for which the Corporation utilizes a method which approximates the interest method, but which incorporates factors such as actual prepayments. The results of the alternative method do not differ materially from those obtained using the interest
method. The cost of securities sold is determined by specifi c identifi cation. Net realized gains or losses on sales of investment securities and unrealized loss valuation adjustments considered other-than-temporary, if any, on securities available-for-sale, held-to-maturity and other investment securities are determined using the specifi c identifi cation method and are reported separately in the consolidated statements of operations. Purchases and sales of securities are recognized on a trade date basis.
Derivative fi nancial instrumentsThe Corporation uses derivative fi nancial instruments as part of its overall interest rate risk management strategy to minimize signifi cant unplanned fl uctuations in earnings and cash fl ows caused by interest rate volatility.
All derivatives are recognized on the statement of condition at fair value. The Corporation’s policy is not to offset the fair value amounts recognized for multiple derivative instruments executed with the same counterparty under a master netting arrangement nor to offset the fair value amounts recognized for the right to reclaim cash collateral (a receivable) or the obligation to return cash collateral (a payable) arising from the same master netting arrangement as the derivative instruments.
When the Corporation enters into a derivative contract, the derivative instrument is designated as either a fair value hedge, cash fl ow hedge or as a free-standing derivative instrument. For a fair value hedge, changes in the fair value of the derivative instrument and changes in the fair value of the hedged asset or liability or of an unrecognized fi rm commitment attributable to the hedged risk are recorded in current period earnings. For a cash fl ow hedge, changes in the fair value of the derivative instrument, to the extent that it is effective, are recorded net of taxes in accumulated other comprehensive income and subsequently reclassifi ed to net income (loss) in the same period(s) that the hedged transaction impacts earnings. The ineffective portion of cash fl ow hedges is immediately recognized in current earnings. For free-standing derivative instruments, changes in the fair values are reported in current period earnings.
Prior to entering a hedge transaction, the Corporation formally documents the relationship between hedging instruments and hedged items, as well as the risk management objective and strategy for undertaking various hedge transactions. This process includes linking all derivative instruments that are designated as fair value or cash fl ow hedges to specifi c assets and liabilities on the statement of condition or to specifi c forecasted transactions or fi rm commitments along with a formal assessment, at both inception of the hedge and on an ongoing basis, as to the effectiveness of the derivative instrument in offsetting changes in fair values or cash fl ows of the hedged item. Hedge accounting is discontinued when the derivative instrument is not highly effective as a hedge, a derivative expires, is sold, terminated, when it is unlikely that a
BOA22177_wo18_Popular.indd 98 3/3/2010 10:46:54 AM

99
forecasted transaction will occur or when it is determined that is no longer appropriate. When hedge accounting is discontinued the derivative continues to be carried at fair value with changes in fair value included in earnings.
For non-exchange traded contracts, fair value is based on dealer quotes, pricing models, discounted cash fl ow methodologies, or similar techniques for which the determination of fair value may require signifi cant management judgment or estimation.
The fair value of derivative instruments considers the risk of nonperformance by the counterparty or the Corporation, as applicable.
The Corporation obtains or pledges collateral in connection with its derivative activities when applicable under the agreement.
Loans Loans are classifi ed as loans held-in-portfolio when management has the intent and ability to hold the loan for the foreseeable future, or until maturity or payoff. The foreseeable future is a management judgment which is determined based upon the type of loan, business strategies, current market conditions, balance sheet management and liquidity needs. Management’s view of the foreseeable future may change based on changes in these conditions. When a decision is made to sell or securitize a loan that was not originated or initially acquired with the intent to sell or securitize, the loan is reclassifi ed from held-in-portfolio into held-for-sale. Due to changing market conditions or other strategic initiatives, management’s intent with respect to the disposition of the loan may change, and accordingly, loans previously classifi ed as held-for-sale may be reclassifi ed into held-in-portfolio. Loans transferred between loans held-for-sale and held-in-portfolio classifi cations are recorded at the lower of cost or fair value at the date of transfer.
Loans held-for-sale are stated at the lower of cost or fair value, cost being determined based on the outstanding loan balance less unearned income, and fair value determined, generally in the aggregate. Fair value is measured based on current market prices for similar loans, outstanding investor commitments, bids received from potential purchasers, prices of recent sales or discounted cash fl ow analyses which utilize inputs and assumptions which are believed to be consistent with market participants’ views. The cost basis also includes consideration of deferred origination fees and costs, which are recognized in earnings at the time of sale. The amount, by which cost exceeds fair value, if any, is accounted for as a valuation allowance with changes therein included in the determination of net income (loss) for the period in which the change occurs.
Loans held-in-portfolio are reported at their outstanding principal balances net of any unearned income, charge-offs, unamortized deferred fees and costs on originated loans, and premiums or discounts on purchased loans. Fees collected
and costs incurred in the origination of new loans are deferred and amortized using the interest method or a method which approximates the interest method over the term of the loan as an adjustment to interest yield.
Non-accrual loans are those loans on which the accrual of interest is discontinued. When a loan is placed on non-accrual status, any interest previously recognized and not collected is generally reversed from current earnings.
Recognition of interest income on commercial and construction loans is discontinued when the loans are 90 days or more in arrears on payments of principal or interest or when other factors indicate that the collection of principal and interest is doubtful. The impaired portions on these loans are charged-off at no longer than 365 days past due. Recognition of interest income on mortgage loans is discontinued when 90 days or more in arrears on payments of principal or interest. The impaired portions on mortgage loans are charged-off at 180 days past due. Recognition of interest income on closed-end consumer loans and home equity lines of credit is discontinued when the loans are 90 days or more in arrears. Income is generally recognized on open-end consumer loans, except for home equity lines of credit, until the loans are charged-off. Recognition of interest income for lease fi nancing is ceased when loans are 90 days or more in arrears. Closed-end consumer loans and leases are charged-off when they are 120 days in arrears. Open-end (revolving credit) consumer loans are charged-off when 180 days in arrears.
Certain loans which would be treated as non-accrual loans pursuant to the foregoing policy are treated as accruing loans if they are considered well-secured and in the process of collection. Also, unsecured retail loans to borrowers who declare bankruptcy are charged-off within 60 days of receipt of notifi cation of fi ling from the bankruptcy court.
Once a loan is placed on non-accrual status, the interest previously accrued and uncollected is charged against current earnings and thereafter income is recorded only to the extent of any interest collected. Loans designated as non-accruing are not returned to an accrual status until interest is received on a current basis and those factors indicative of doubtful collection cease to exist. Special guidelines exist for troubled debt restructurings.
Lease fi nancingThe Corporation leases passenger and commercial vehicles and equipment to individual and corporate customers. The fi nance method of accounting is used to recognize revenue on lease contracts that meet the criteria specifi ed in the guidance for leases in ASC Topic 840. Aggregate rentals due over the term of the leases less unearned income are included in fi nance lease contracts receivable. Unearned income is amortized using a method which results in approximate level rates of return on the principal amounts outstanding. Finance lease origination fees and costs are
BOA22177_wo18_Popular.indd 99 3/3/2010 10:46:54 AM
100 POPULAR, INC. 2009 ANNUAL REPORT
deferred and amortized over the average life of the lease as an adjustment to the interest yield.
Revenue for other leases is recognized as it becomes due under the terms of the agreement.
Allowance for loan lossesThe Corporation follows a systematic methodology to establish and evaluate the adequacy of the allowance for loan losses to provide for inherent losses in the loan portfolio. This methodology includes the consideration of factors such as current economic conditions, portfolio risk characteristics, prior loss experience and results of periodic credit reviews of individual loans. The provision for loan losses charged to current operations is based on such methodology. Loan losses are charged and recoveries are credited to the allowance for loan losses.
The allowance for loan losses excludes loans measured pursuant to the fair value option since fair value adjustments related to these fi nancial instruments already refl ect a credit component.
The Corporation’s assessment of the allowance for loan losses is determined in accordance with accounting guidance, specifi cally guidance of loss contingencies in ASC Subtopic 450-20 and loan impairment guidance in ASC Section 310-10-35.
The accounting guidance provides for the recognition of a loss allowance for groups of homogeneous loans. During 2009, the Corporation enhanced the reserve assessment of homogeneous loans by establishing a more granular segmentation of loans with similar risk characteristics, reducing the historical base loss periods employed, and strengthening the analysis pertaining to the environmental factors considered. The revised segmentation considers business segments and product types, which are further segregated based on their secured or unsecured status. The determination for general reserves of the allowance for loan losses is based on historical net loss rates (including losses from impaired loans) by loan type and by legal entity adjusted for recent net charge-off trends and environmental factors. The base net loss rates are based on the moving average of annualized net charge-offs computed over a three-year historical loss window for commercial and construction loan portfolios, and an 18-month period for consumer loan portfolios. The net charge-off trend factors are applied to adjust the base loss rates based on recent loss trends. The environmental factors, which include credit and macroeconomic indicators, are assessed to account for current market conditions that are likely to cause estimated credit losses to differ from historical loss experience. The Corporation refl ects the effect of these environmental factors on a loan group as an adjustment that, as appropriate, increases or decreases the historical loss rate applied to each group. Correlation and regression analyses are used to select and weight these indicators.
According to the accounting guidance criteria for specifi c impairment of a loan, up to December 31, 2008, the Corporation
defi ned as impaired loans those commercial borrowers with outstanding debt of $250,000 or more and with interest and /or principal 90 days or more past due. Also, specifi c commercial borrowers with outstanding debt of $500,000 and over were deemed impaired when, based on current information and events, management considered that it was probable that the debtor would be unable to pay all amounts due according to the contractual terms of the loan agreement. Effective January 1, 2009, the Corporation continues to apply the same defi nition except that it prospectively increased the threshold of outstanding debt to $1,000,000 for the identifi cation of newly impaired commercial and construction loans. Although the accounting codification guidance for specifi c impairment of a loan excludes large groups of smaller balance homogeneous loans that are collectively evaluated for impairment (e.g. mortgage loans), it specifi cally requires that loan modifi cations considered troubled debt restructurings (“TDRs”) be analyzed under its provisions. An allowance for loan impairment is recognized to the extent that the carrying value of an impaired loan exceeds the present value of the expected future cash fl ows discounted at the loan’s effective rate, the observable market price of the loan, if available, or the fair value of the collateral if the loan is collateral dependent. The fair value of the collateral is generally obtained from appraisals. The Corporation periodically requires updated appraisal reports for loans that are considered impaired. As a general procedure, the Corporation internally reviews appraisals as part of the underwriting and approval process and also for credits considered impaired.
Cash payments received on impaired loans are recorded in accordance with the contractual terms of the loan. The principal portion of the payment is used to reduce the principal balance of the loan, whereas the interest portion is recognized as interest income. However, when management believes the ultimate collectability of principal is in doubt, the interest portion is applied to principal.
Troubled debt restructurings (“TDR”)TDRs represent loans where concessions have been granted to borrowers experiencing fi nancial diffi culties that the creditor would not otherwise consider. These concessions could include a reduction in the interest rate on the loan, payment extensions, forgiveness of principal, forbearance or other actions intended to maximize collection. These concessions stem from an agreement between the creditor and the debtor or are imposed by law or a court. Classifi cation of loan modifi cations as TDRs involves a degree of judgment. Indicators that the debtor is experiencing fi nancial diffi culties include, for example: (i) the debtor is currently in default on any of its debt; (ii) the debtor has declared or is in the process of declaring bankruptcy; (iii) there is signifi cant doubt as to whether the debtor will continue to be a going concern; (iv) currently, the debtor has securities that have been delisted, are in
BOA22177_wo18_Popular.indd 100 3/3/2010 10:46:54 AM
101
the process of being delisted, or are under threat of being delisted from an exchange; (v) based on estimates and projections that only encompass the current business capabilities, the debtor forecasts that its entity-specifi c cash fl ows will be insuffi cient to service the debt (both interest and principal) in accordance with the contractual terms of the existing agreement through maturity; and absent the current modifi cation, the debtor cannot obtain funds from sources other than the existing creditors at an effective interest rate equal to the current market interest rate for similar debt for a nontroubled debtor. The identifi cation of TDRs is critical in the determination of the adequacy of the allowance for loan losses. Loans classifi ed as TDRs are reported in non-accrual status if the loan was in non-accruing status at the time of the modifi cation. The TDR loan should continue in non-accrual status until the borrower has demonstrated a willingness and ability to make the restructured loan payments (at least six months of sustained performance after classifi ed as TDR). Loans classifi ed as TDRs are excluded from TDR status if performance under the restructured terms exists for a reasonable period (at least twelve months of sustained performance) and the loan yields a market rate.
Transfers and servicing of fi nancial assets and extinguishment of liabilitiesThe transfer of fi nancial assets in which the Corporation surrenders control over the assets is accounted for as a sale to the extent that consideration other than benefi cial interests is received in exchange. The guidance for transfer of fi nancial assets in ASC Topic 860 sets forth the criteria that must be met for control over transferred assets to be considered to have been surrendered, which includes, among others: (1) the assets must be isolated from creditors of the transferor, (2) the transferee must obtain the right (free of conditions that constrain it from taking advantage of that right) to pledge or exchange the transferred assets, and (3) the transferor cannot maintain effective control over the transferred assets through an agreement to repurchase them before their maturity. When the Corporation transfers fi nancial assets and the transfer fails any one of these criteria, the Corporation is prevented from derecognizing the transferred fi nancial assets and the transaction is accounted for as a secured borrowing. For federal and Puerto Rico income tax purposes, the Corporation treats the transfers of loans which do not qualify as “true sales” under the applicable accounting guidance, as sales, recognizing a deferred tax asset or liability on the transaction.
For transfers of fi nancial assets that satisfy the conditions to be accounted for as sales, the Corporation derecognizes all assets sold; recognizes all assets obtained and liabilities incurred in consideration as proceeds of the sale, including servicing assets and servicing liabilities, if applicable; initially measures at fair value assets obtained and liabilities incurred in a sale; and recognizes in earnings any gain or loss on the sale.
The guidance on transfer of fi nancial assets requires a true sale analysis of the treatment of the transfer under state law as if the Corporation was a debtor under the bankruptcy code. A true sale legal analysis includes several legally relevant factors, such as the nature and level of recourse to the transferor, and the nature of retained interests in the loans sold. The analytical conclusion as to a true sale is never absolute and unconditional, but contains qualifi cations based on the inherent equitable powers of a bankruptcy court, as well as the unsettled state of the common law. Once the legal isolation test has been met, other factors concerning the nature and extent of the transferor’s control over the transferred assets are taken into account in order to determine whether derecognition of assets is warranted.
The Corporation sells mortgage loans to the Government National Mortgage Association (“GNMA”) in the normal course of business and retains the servicing rights. The GNMA programs under which the loans are sold allow the Corporation to repurchase individual delinquent loans that meet certain criteria. At the Corporation’s option, and without GNMA’s prior authorization, the Corporation may repurchase the delinquent loan for an amount equal to 100% of the remaining principal balance of the loan. Once the Corporation has the unconditional ability to repurchase the delinquent loan, the Corporation is deemed to have regained effective control over the loan and recognizes the loan on its balance sheet as well as an offsetting liability, regardless of the Corporation’s intent to repurchase the loan.
Servicing assetsThe Corporation periodically sells or securitizes loans while retaining the obligation to perform the servicing of such loans. In addition, the Corporation may purchase or assume the right to service loans originated by others. Whenever the Corporation undertakes an obligation to service a loan, management assesses whether a servicing asset or liability should be recognized. A servicing asset is recognized whenever the compensation for servicing is expected to more than adequately compensate the servicer for performing the servicing. Likewise, a servicing liability would be recognized in the event that servicing fees to be received are not expected to adequately compensate the Corporation for its expected cost. Servicing assets are separately presented on the consolidated statement of condition.
All separately recognized servicing assets are initially recognized at fair value. For subsequent measurement of servicing rights, the Corporation has elected the fair value method for mortgage loans servicing rights (“MSRs”) while all other servicing assets, particularly related to Small Business Administration (“SBA”) commercial loans, follow the amortization method. Under the fair value measurement method, MSRs are recorded at fair value each reporting period, and changes in fair value are reported in other service fees in the consolidated statement of operations.
BOA22177_wo18_Popular.indd 101 3/3/2010 10:46:54 AM
102 POPULAR, INC. 2009 ANNUAL REPORT
Under the amortization method, servicing assets are amortized in proportion to, and over the period of, estimated servicing income, and assessed for impairment based on fair value at each reporting period. Contractual servicing fees including ancillary income and late fees, as well as fair value adjustments, and impairment losses, if any, are reported in other service fees in the consolidated statement of operations. Loan servicing fees, which are based on a percentage of the principal balances of the loans serviced, are credited to income as loan payments are collected.
The fair value of servicing rights is estimated by using a cash fl ow valuation model which calculates the present value of estimated future net servicing cash fl ows, taking into consideration actual and expected loan prepayment rates, discount rates, servicing costs, and other economic factors, which are determined based on current market conditions.
For purposes of evaluating and measuring impairment of capitalized servicing assets that are accounted under the amortization method, the amount of impairment recognized, if any, is the amount by which the capitalized servicing assets per stratum exceed their estimated fair value. Temporary impairment is recognized through a valuation allowance with changes included in results of operations for the period in which the change occurs. If it is later determined that all or a portion of the temporary impairment no longer exists for a particular stratum, the valuation allowance is reduced through a recovery in earnings. Any fair value in excess of the cost basis of the servicing asset for a given stratum is not recognized. Servicing rights subsequently accounted under the amortization method are also reviewed for other-than-temporary impairment. When the recoverability of an impaired servicing asset accounted under the amortization method is determined to be remote, the unrecoverable portion of the valuation allowance is applied as a direct write-down to the carrying value of the servicing rights, precluding subsequent recoveries.
Refer to Note 13 to the consolidated fi nancial statements for information on the classes of servicing assets defi ned by the Corporation.
Premises and equipment Premises and equipment are stated at cost less accumulated depreciation and amortization. Depreciation is computed on a straight-line basis over the estimated useful life of each type of asset. Amortization of leasehold improvements is computed over the terms of the respective leases or the estimated useful lives of the improvements, whichever is shorter. Costs of maintenance and repairs which do not improve or extend the life of the respective assets are expensed as incurred. Costs of renewals and betterments are capitalized. When assets are disposed of, their cost and related accumulated depreciation are removed from the accounts and any gain or loss is refl ected in earnings as realized or incurred, respectively.
The Corporation capitalizes interest cost incurred in the construction of signifi cant real estate projects, which consist primarily of facilities for its own use or intended for lease. The amount of interest cost capitalized is to be an allocation of the interest cost incurred during the period required to substantially complete the asset. The interest rate for capitalization purposes is to be based on a weighted average rate on the Corporation’s outstanding borrowings, unless there is a specifi c new borrowing associated with the asset. Interest cost capitalized for the years ended December 31, 2009, 2008 and 2007 was not signifi cant.
The Corporation has operating lease arrangements primarily associated with the rental of premises to support the branch network or for general offi ce space. Certain of these arrangements are non-cancelable and provide for rent escalations and renewal options. Rent expense on non-cancelable operating leases with scheduled rent increases are recognized on a straight-line basis over the lease term.
Impairment on long-lived assetsThe Corporation evaluates for impairment its long-lived assets to be held and used, and long-lived assets to be disposed of, whenever events or changes in circumstances indicate that the carrying amount of an asset may not be recoverable.
Restructuring costsA liability for a cost associated with an exit or disposal activity is recognized and measured initially at its fair value in the period in which the liability is incurred. If future service is required for employees to receive the one-time termination benefi t, the liability is initially measured at its fair value as of the termination date and recognized over the future service period.
Other real estateOther real estate, received in satisfaction of debt, is recorded at the lower of cost (carrying value of the loan) or the appraised value less estimated costs of disposal of the real estate acquired, by charging the allowance for loan losses. Subsequent to foreclosure, any losses in the carrying value arising from periodic reevaluations of the properties, and any gains or losses on the sale of these properties are credited or charged to expense in the period incurred and are included as a component of other operating expenses. The cost of maintaining and operating such properties is expensed as incurred.
Goodwill and other intangible assetsGoodwill is recognized when the purchase price is higher than the fair value of net assets acquired in business combinations under the purchase method of accounting. Goodwill is not amortized, but is tested for impairment at least annually or more frequently if events or circumstances indicate possible impairment using a two-step process at each reporting unit level. The fi rst step of the
BOA22177_wo18_Popular.indd 102 3/3/2010 10:46:54 AM

103
goodwill impairment test, used to identify potential impairment, compares the fair value of a reporting unit with its carrying amount, including goodwill. If the fair value of a reporting unit exceeds its carrying amount, the goodwill of the reporting unit is not considered impaired and the second step of the impairment test is unnecessary. If needed, the second step consists of comparing the implied fair value of the reporting unit goodwill with the carrying amount of that goodwill. In determining the fair value of a reporting unit, the Corporation generally uses a combination of methods, which include market price multiples of comparable companies and the discounted cash fl ow analysis. Goodwill impairment losses are recorded as part of operating expenses in the consolidated statement of operations.
Other intangible assets deemed to have an indefi nite life are not amortized, but are tested for impairment using a one-step process which compares the fair value with the carrying amount of the asset. In determining that an intangible asset has an indefi nite life, the Corporation considers expected cash infl ows and legal, regulatory, contractual, competitive, economic and other factors, which could limit the intangible asset’s useful life.
Other identifi able intangible assets with a fi nite useful life, mainly core deposits, are amortized using various methods over the periods benefi ted, which range from 3 to 11 years. These intangibles are evaluated periodically for impairment when events or changes in circumstances indicate that the carrying amount may not be recoverable. Impairments on intangible assets with a fi nite useful life are evaluated under the guidance for impairment or disposal of long-lived assets and are included as part of “Impairment losses on long-lived assets” in the category of operating expenses in the consolidated statements of operations.
For further disclosures required by goodwill and other intangibles guidance, refer to Note 14 to the consolidated fi nancial statements.
Bank-Owned Life InsuranceBank-owned life insurance represents life insurance on the lives
of certain employees who have provided positive consent allowing the Corporation to be the benefi ciary of the policy. Bank-owned life insurance policies are carried at their cash surrender value. The Corporation recognizes income from the periodic increases in the cash surrender value of the policy, as well as insurance proceeds received, which are recorded as other operating income, and are not subject to income taxes.
The cash surrender value and any additional amounts provided by the contractual terms of the bank-owned insurance policy that are realizable at the balance sheet date are considered in determining the amount that could be realized, and any amounts that are not immediately payable to the policyholder in cash are discounted to their present value. In determining “the amount that could be realized,” it is assumed that policies will be surrendered
on an individual-by-individual basis.
Assets sold / purchased under agreements to repurchase / resellRepurchase and resell agreements are treated as collateralized fi nancing transactions and are carried at the amounts at which the assets will be subsequently reacquired or resold as specifi ed in the respective agreements.
It is the Corporation’s policy to take possession of securities purchased under agreements to resell. However, the counterparties to such agreements maintain effective control over such securities, and accordingly those securities are not refl ected in the Corporation’s consolidated statements of condition. The Corporation monitors the fair value of the underlying securities as compared to the related receivable, including accrued interest. It is the Corporation’s policy to maintain effective control over assets sold under agreements to repurchase; accordingly, such securities continue to be carried on the consolidated statements of condition.
The Corporation may require counterparties to deposit additional collateral or return collateral pledged, when appropriate.
SoftwareCapitalized software is stated at cost, less accumulated amortization. Capitalized software includes purchased software and capitalizable application development costs associated with internally-developed software. Amortization, computed on a straight-line method, is charged to operations over the estimated useful life of the software. Capitalized software is included in “Other assets” in the consolidated statement of condition.
Guarantees, including indirect guarantees of indebtedness of othersThe Corporation, as a guarantor, recognizes at the inception of a guarantee, a liability for the fair value of the obligation undertaken in issuing the guarantee. Refer to Note 34 to the consolidated fi nancial statements for further disclosures.
Accounting considerations related to the cumulative preferred stock and warrant to purchase shares of common stockThe value of the warrant to purchase shares of common stock was determined by allocating the proceeds received by the Corporation based on the relative fair values of the instruments issued (preferred stock and warrant). The transaction was recorded when it was consummated and proceeds were received. Refer to Note 23 to the consolidated fi nancial statements for information on the warrant issued in 2008.
Warrants issued are included in the calculation of average diluted shares in determining income (loss) per common share using the treasury stock method.
The discount on increasing rate preferred stock was amortized
BOA22177_wo18_Popular.indd 103 3/3/2010 10:46:54 AM

104 POPULAR, INC. 2009 ANNUAL REPORT
over the period preceding commencement of the perpetual dividend by charging an imputed dividend cost against retained earnings. The amortization of the discount on the preferred shares also reduced the income (or increased the loss) applicable to common stockholders in the computation of basic and diluted net income (loss) per share.
Income (loss) applicable to common stockholders considers the deduction of both the dividends declared in the period on cumulative preferred stock (whether or not paid) and the dividends accumulated for the period on cumulative preferred stock (whether or not earned) from income (loss) from continuing operations and also from net income (loss).
Accounting considerations related to the redemption of cumulative preferred stock and redemption of the trust preferred securities
The Corporation applied the guidance in ASC Subsection 260-10-S99 (formerly EITF Topic D-42 “The effect on the calculation of Earnings per Share for the Redemption or Induced Conversion of Preferred Stock”) for the redemption of the Corporation’s cumulative preferred stock, which indicates that the difference between (1) the fair value of the consideration transferred to the holders of the preferred stock and (2) the carrying amount of the preferred stock in the registrant's balance sheet (net of issuance costs) be subtracted from (or added to) net income to arrive at income available to common stockholders in the calculation of net income (loss) per common share.
The Corporation treated the redemption of the trust preferred securities as an extinguishment of debt pursuant to the guidance in ASC Subsection 470-50-40 which indicates that the difference between the reacquisition price and the net carrying amount of the extinguished debt be recognized as gain or loss on extinghishment in the results of operations.
Treasury stockTreasury stock is recorded at cost and is carried as a reduction of stockholders’ equity in the consolidated statements of condition. At the date of retirement or subsequent reissue, the treasury stock account is reduced by the cost of such stock. At retirement, the excess of the cost of the treasury stock over its par value is recorded entirely to surplus. At reissuance, the difference between the consideration received upon issuance and the specifi c cost is charged or credited to surplus.
Income and expense recognition – Processing business Revenue from information processing and other services is recognized at the time services are rendered. Rental and maintenance service revenue is recognized ratably over the corresponding contractual periods. Revenue from software and hardware sales and related costs is recognized at the time
software and equipment is installed or delivered depending on the contractual terms. Revenue from contracts to create data processing centers and the related cost is recognized as project phases are completed and accepted. Operating expenses are recognized as incurred. Project expenses are deferred and recognized when the related income is earned. The Corporation applies the guidance in ASC Subtopic 605-35 as the guidance to determine what project expenses must be deferred until the related income is earned on certain long-term projects that involve the outsourcing of technological services.
Income Recognition – Insurance agency businessCommissions and fees are recognized when related policies are effective. Additional premiums and rate adjustments are recorded as they occur. Contingent commissions are recorded on the accrual basis when the amount to be received is notifi ed by the insurance company. Commission income from advance business is deferred. An allowance is created for expected adjustments to commissions earned relating to policy cancellations.
Income Recognition – Investment banking revenuesInvestment banking revenue is recorded as follows: underwriting fees at the time the underwriting is completed and income is reasonably determinable; corporate finance advisory fees as earned, according to the terms of the specifi c contracts; and sales commissions on a trade-date basis.
Foreign exchangeAssets and liabilities denominated in foreign currencies are translated to U.S. dollars using prevailing rates of exchange at the end of the period. Revenues, expenses, gains and losses are translated using weighted average rates for the period. The resulting foreign currency translation adjustment from operations for which the functional currency is other than the U.S. dollar is reported in accumulated other comprehensive income (loss), except for highly infl ationary environments in which the effects are included in other operating income.
The Corporation conducts business in certain Latin American markets through several of its processing and information technology services and products subsidiaries. Also, it holds interests in Consorcio de Tarjetas Dominicanas, S.A. (“CONTADO”) and Centro Financiero BHD, S.A. (“BHD”) in the Dominican Republic. Although not signifi cant, some of these businesses are conducted in the country’s foreign currency.
The Corporation monitors the infl ation levels in the foreign countries where it operates to evaluate whether they meet the “highly infl ationary economy” test prescribed by the guidance for functional currency in highly infl ationary economies in ASC Subsection 830-10-45. Such statement defi nes highly infl ationary as a “cumulative infl ation of approximately 100 percent or more
BOA22177_wo18_Popular.indd 104 3/3/2010 10:46:54 AM
105
over a three-year period”. In accordance with the provisions of this guidance, the fi nancial statements of a foreign entity in a highly infl ationary economy are remeasured as if the functional currency was the reporting currency.
Refer to the disclosure of accumulated other comprehensive income (loss) included in the accompanying consolidated statements of comprehensive income (loss) for the outstanding balances of unfavorable foreign currency translation adjustments at December 31, 2009, 2008 and 2007.
Income taxesThe Corporation recognizes deferred tax assets and liabilities for the expected future tax consequences of events that have been recognized in the Corporation’s fi nancial statements or tax returns. Deferred income tax assets and liabilities are determined for differences between fi nancial statement and tax bases of assets and liabilities that will result in taxable or deductible amounts in the future. The computation is based on enacted tax laws and rates applicable to periods in which the temporary differences are expected to be recovered or settled.
The guidance for income taxes requires a reduction of the carrying amounts of deferred tax assets by a valuation allowance if, based on the available evidence, it is more likely than not (defi ned as a likelihood of more than 50 percent) that such assets will not be realized. Accordingly, the need to establish valuation allowances for deferred tax assets are assessed periodically by the Corporation based on the more likely than not realization threshold criterion. In the assessment for a valuation allowance, appropriate consideration is given to all positive and negative evidence related to the realization of the deferred tax assets. This assessment considers, among other matters, all sources of taxable income available to realize the deferred tax asset, including the future reversal of existing temporary differences, the future taxable income exclusive of reversing temporary differences and carryforwards, taxable income in carryback years and tax-planning strategies. In making such assessments, signifi cant weight is given to evidence that can be objectively verifi ed.
The valuation of deferred tax assets requires judgment in assessing the likely future tax consequences of events that have been recognized in the Corporation’s fi nancial statements or tax returns and future profi tability. The Corporation’s accounting for deferred tax consequences represents management’s best estimate of those future events.
Positions taken in the Corporation’s tax returns may be subject to challenge by the taxing authorities upon examination. Uncertain tax positions are initially recognized in the fi nancial statements when it is more likely than not the position will be sustained upon examination by the tax authorities. Such tax positions are both initially and subsequently measured as the largest amount of tax benefi t that is greater than 50% likely of being realized upon
settlement with the tax authority, assuming full knowledge of the position and all relevant facts. Interest on income tax uncertainties is classified within income tax expense in the statement of operations; while the penalties, if any, are accounted for as other operating expenses.
The Corporation accounts for the taxes collected from customers and remitted to governmental authorities on a net basis (excluded from revenues).
Income tax expense or benefi t for the year is allocated among continuing operations, discontinued operations, and other comprehensive income, as applicable. The amount allocated to continuing operations is the tax effect of the pretax income or loss from continuing operations that occurred during the year, plus or minus income tax effects of (a) changes in circumstances that cause a change in judgment about the realization of deferred tax assets in future years, (b) changes in tax laws or rates, (c) changes in tax status, and (d) tax-deductible dividends paid to shareholders, subject to certain exceptions.
Employees’ retirement and other postretirement benefi t plansPension costs are computed on the basis of accepted actuarial methods and are charged to current operations. Net pension costs are based on various actuarial assumptions regarding future experience under the plan, which include costs for services rendered during the period, interest costs and return on plan assets, as well as deferral and amortization of certain items such as actuarial gains or losses. The funding policy is to contribute to the plan as necessary to provide for services to date and for those expected to be earned in the future. To the extent that these requirements are fully covered by assets in the plan, a contribution may not be made in a particular year.
The cost of postretirement benefi ts, which is determined based on actuarial assumptions and estimates of the costs of providing these benefi ts in the future, is accrued during the years that the employee renders the required service.
The guidance for compensation retirement benefi ts of ASC Topic 715 requires the recognition of the funded status of each defined pension benefit plan, retiree health care and other postretirement benefi t plans on the statement of condition.
Stock-based compensationThe Corporation opted to use the fair value method of recording stock-based compensation as described in the guidance for employee share plans in ASC Subtopic 718-50. Comprehensive income (loss)Comprehensive income (loss) is defi ned as the change in equity of a business enterprise during a period from transactions and other events and circumstances, except those resulting from investments by owners and distributions to owners. The presentation of
BOA22177_wo18_Popular.indd 105 3/3/2010 10:46:54 AM
106 POPULAR, INC. 2009 ANNUAL REPORT
comprehensive income (loss) is included in separate consolidated statements of comprehensive income (loss).
Net income (loss) per common shareBasic income (loss) per common share is computed by dividing net income (loss) adjusted for preferred stock dividends, including undeclared or unpaid dividends if cumulative, and charges or credits related to the extinguishment of preferred stock or induced conversions of preferred stock, by the weighted average number of common shares outstanding during the year. Diluted income per common share take into consideration the weighted average common shares adjusted for the effect of stock options, restricted stock and warrants on common stock, using the treasury stock method.
Statement of cash fl owsFor purposes of reporting cash fl ows, cash includes cash on hand and amounts due from banks.
Adoption of New Accounting Standards and Issued But Not Yet Effective Accounting Standards
The FASB Accounting Standards Codifi cation (“ASC”) Effective July 1, 2009, the ASC became the single source of authoritative U.S. generally accepted accounting principles (“GAAP”) recognized by the Financial Accounting Standards Board (“FASB”) to be applied by non-governmental entities. Rules and interpretive releases of the Securities and Exchange Commission (“SEC”) are also sources of authoritative GAAP for SEC registrants. The ASC superseded all existing non-SEC accounting and reporting standards. All other non-grandfathered non-SEC accounting literature not included in the ASC is non-authoritative. The Corporation’s policies were not affected by the conversion to ASC. However, references to specifi c accounting guidance in the notes of the Corporation’s fi nancial statements have been changed to the appropriate section of the ASC.
Business Combinations (ASC Topic 805) (formerly SFAS No. 141-R) In December 2007, the FASB issued guidance that establishes principles and requirements for how an acquirer recognizes and measures in its fi nancial statements the identifi able assets acquired, the liabilities assumed, and any noncontrolling interest in an acquiree, including the recognition and measurement of goodwill acquired in a business combination. The Corporation is required to apply this guidance to all business combinations completed on or after January 1, 2009. For business combinations in which the acquisition date was before the effective date, these provisions apply to the subsequent accounting for deferred income tax valuation allowances and income tax contingencies and require
any changes in those amounts to be recorded in earnings. This guidance on business combinations did not have a material effect on the consolidated fi nancial statements of the Corporation for the year ended December 31, 2009.
Noncontrolling Interests in Consolidated Financial Statements (ASC Subtopic 810-10) (formerly SFAS No. 160) In December 2007, the FASB issued guidance to establish accounting and reporting standards for the noncontrolling interest in a subsidiary and for the deconsolidation of a subsidiary. This guidance requires entities to classify noncontrolling interests as a component of stockholders’ equity on the consolidated fi nancial statements and requires subsequent changes in ownership interests in a subsidiary to be accounted for as an equity transaction. Additionally, it requires entities to recognize a gain or loss upon the loss of control of a subsidiary and to remeasure any ownership interest retained at fair value on that date. This statement also requires expanded disclosures that clearly identify and distinguish between the interests of the parent and the interests of the noncontrolling owners. This guidance was adopted by the Corporation on January 1, 2009. The adoption of this standard did not have an impact on the Corporation’s consolidated fi nancial statements.
Disclosures about Derivative Instruments and Hedging Activities (ASC Subtopic 815-10) (formerly SFAS No. 161)In March 2008, the FASB issued an amendment for disclosures about derivative instruments and hedging activities. The standard expands the disclosure requirements for derivatives and hedged items and has no impact on how the Corporation accounts for these instruments. The standard was adopted by the Corporation in the fi rst quarter of 2009. Refer to Note 31 to the consolidated fi nancial statements for related disclosures.
Subsequent Events (ASC Subtopic 855-10) (formerly SFAS No. 165)In May 2009, the FASB issued guidance which establishes general standards of accounting for and disclosures of events that occur after the balance sheet date but before fi nancial statements are issued or are available to be issued. Specifi cally, this standard sets forth the period after the balance sheet date during which management of a reporting entity should evaluate events or transactions that may occur for potential recognition or disclosure in the fi nancial statements, the circumstances under which an entity should recognize events or transactions occurring after the balance sheet date in its fi nancial statements, and the disclosures that an entity should make about events or transactions that occurred after the balance sheet date. This guidance was effective for interim or annual fi nancial periods ending after June 15, 2009, and shall be applied prospectively. Refer to Note 2 to the
BOA22177_wo18_Popular.indd 106 3/3/2010 10:46:54 AM

107
consolidated fi nancial statements for related disclosures.
Transfers of Financial Assets, (ASC Subtopic 860-10) (formerly SFAS No. 166)In June 2009, the FASB issued a revision which eliminates the concept of a “qualifying special-purpose entity” (“QSPEs”), changes the requirements for derecognizing fi nancial assets, and includes additional disclosures requiring more information about transfers of fi nancial assets in which entities have continuing exposure to the risks related to the transferred fi nancial assets. This guidance must be applied as of the beginning of each reporting entity’s fi rst annual reporting period that begins after November 15, 2009, for interim periods within that fi rst annual reporting period and for interim and annual reporting periods thereafter. Earlier application was prohibited. The Corporation is adopting this guidance for transfers of fi nancial assets commencing on January 1, 2010.
The Corporation is evaluating the impact that this new accounting guidance will have on the guaranteed mortgage securitizations with Fannie Mae (“FNMA”) and Ginnie Mae (“GNMA”), which are the principal transactions executed by the Corporation that are subject to the new guidance. The Corporation anticipates that transactions backed by FNMA will meet the criteria for sale accounting since the assets transferred are placed and isolated in an independent trust. However, the transactions backed by GNMA will require additional evaluation since they are isolated without the use of a trust to hold the GNMA pass-through certifi cates. Instead, the pools of mortgage loans are legally isolated through the establishment of custodial pools, whereby all rights, title and interest are conveyed to GNMA. The Corporation will assess these transactions to conclude if they will continue to be considered a sale for accounting purposes. Currently, the Corporation does not anticipate that this guidance will have a material effect on the consolidated fi nancial statements.
Variable Interest Entities, (ASC Subtopic 860-10) (formerly SFAS No. 167) The FASB amended on June 2009 the guidance applicable to variable interest entities (“VIE”) and changed how a reporting entity determines when an entity that is insuffi ciently capitalized or is not controlled through voting (or similar rights) should be consolidated. The determination of whether a reporting entity is required to consolidate another entity is based on, among other things, the other entity’s purpose and design and the reporting entity’s ability to direct the activities of the other entity that most signifi cantly impact the other entity’s economic performance. The amendments to the consolidated guidance affect all entities that were within the scope of the original guidance, as well as qualifying special-purpose entities (“QSPEs”) that were previously excluded from the guidance. The new guidance requires a reporting entity to provide additional disclosures about its involvement
with variable interest entities and any signifi cant changes in risk exposure due to that involvement. A reporting entity will be required to disclose how its involvement with a variable interest entity affects the reporting entity’s fi nancial statements. The new guidance requires ongoing evaluation of whether an enterprise is the primary benefi ciary of a variable interest entity. The guidance is effective for the Corporation commencing on January 1, 2010.
Currently, the Corporation issues government sponsored securities backed by GNMA and FNMA. FNMA uses independent trusts to isolate the pass-through certifi cates and therefore, are considered VIEs. On the SEC responses to the Mortgage Banker Association Whitepaper issued on February 10, 2010, the SEC reiterated that the GNMA securities I and II are considered VIEs for the assessment of the new consolidation guidance applicable to VIEs.
After evaluation of these transactions, the Corporation reached the conclusion that it is not the primary benefi ciary of these VIEs.
The Corporation also owns certain equity investments that are not considered VIEs, even in consideration of the new accounting guidance. Other structures analyzed by management are the trust preferred securities. Even though these trusts are still considered VIEs under the new guidance, the Corporation does not possess a signifi cant variable interest on these trusts. Additionally, the Corporation has variable interests in certain investments that have the attributes of investment companies, as well as limited partnership investments in venture capital companies. However, in January 2010, the FASB decided to make offi cial the deferral of ASC Subtopic 860-10 for certain investment entities. The deferral allows asset managers that have no obligation to fund potentially signifi cant losses of an investment entity to continue to apply the previous accounting guidance to investment entities that have the attributes of entities subject to ASC Topic 946 (the "Investment Company Guide"). The FASB also decided to defer the application of this guidance for money market funds subject to Rule 2a-7 of the Investment Company Act of 1940. Asset managers would continue to apply the applicable existing guidance to those entities that qualify for the deferral.
Management anticipates that the Corporation will not be required to consolidate any existing variable interest entities for which it has a variable interest at December 31, 2009. The adoption of the new accounting guidance on variable interest entities is not expected to have a material effect on the Corporation’s consolidated fi nancial statements.
Accounting for Transfers of Financial Assets and Repurchase Financing Transactions (ASC Subtopic 860-10) (formerly FASB Staff Position FAS 140-3)The FASB provided guidance in February 2008 on whether the security transfer and contemporaneous repurchase fi nancing involving the transferred fi nancial asset must be evaluated as
BOA22177_wo18_Popular.indd 107 3/3/2010 10:46:54 AM

108 POPULAR, INC. 2009 ANNUAL REPORT
one linked transaction or two separate de-linked transactions. The guidance requires the recognition of the transfer and the repurchase agreement as one linked transaction, unless all of the following criteria are met: (1) the initial transfer and the repurchase fi nancing are not contractually contingent on one another; (2) the initial transferor has full recourse upon default, and the repurchase agreement’s price is fi xed and not at fair value; (3) the fi nancial asset is readily obtainable in the marketplace and the transfer and repurchase fi nancing are executed at market rates; and (4) the maturity of the repurchase fi nancing is before the maturity of the fi nancial asset. The scope of this accounting guidance is limited to transfers and subsequent repurchase fi nancings that are entered into contemporaneously or in contemplation of one another. The Corporation adopted the statement on January 1, 2009. The adoption of this guidance did not have a material impact on the Corporation’s consolidated fi nancial statements for the year ended December 31, 2009.
Determination of the Useful Life of Intangible Assets (ASC Sub-topic 350-30) (formerly FASB Staff Position FAS 142-3)In April 2008, the FASB amended the factors that should be considered in developing renewal or extension assumptions used to determine the useful life of a recognized intangible asset. In developing these assumptions, an entity should consider its own historical experience in renewing or extending similar arrangements adjusted for entity specifi c factors or, in the absence of that experience, the assumptions that market participants would use about renewals or extensions adjusted for the entity specifi c factors. This guidance applies to intangible assets acquired after the adoption date of January 1, 2009. The adoption of this guidance did not have an impact on the Corporation’s consolidated fi nancial statements for the year ended December 31, 2009.
Equity Method Investment Accounting Considerations (ASC Subtopic 323-10) (formerly EITF 08-6)This guidance clarifi es the accounting for certain transactions and impairment considerations involving equity method investments. It applies to all investments accounted for under the equity method and provides guidance on the following: (1) how the initial carrying value of an equity method investment should be determined; (2) how an impairment assessment of an underlying indefi nite-lived intangible asset of an equity method investment should be performed; (3) how an equity method investee’s issuance of shares should be accounted for; and (4) how to account for a change in an investment from the equity method to the cost method. The adoption of this guidance in January 2009 did not have a material impact on the Corporation’s consolidated fi nancial statements.
Employers’ Disclosures about Postretirement Benefi t Plan As-sets (ASC Subtopic 715-20) (formerly FASB Staff Position FAS 132(R)-1)This guidance requires additional disclosures in the fi nancial statements of employers who are subject to the disclosure requirements of postretirement benefi t plan assets as follows: (a) the investment allocation decision making process, including the factors that are pertinent to an understanding of investment policies and strategies; (b) the fair value of each major category of plan assets, disclosed separately for pension plans and other postretirement benefit plans; (c) the inputs and valuation techniques used to measure the fair value of plan assets, including the level within the fair value hierarchy in which the fair value measurements in their entirety fall; and (d) signifi cant concentrations of risk within plan assets. Additional detailed information is required for each category above. The Corporation applied the new disclosure requirements commencing with the annual fi nancial statements for the year ended December 31, 2009. Refer to Note 27 to the consolidated fi nancial statements. This guidance impacts disclosures only and did not have an effect on the Corporation’s consolidated statements of condition or results of operations for the year ended December 31, 2009.
Recognition and Presentation of Other-Than-Temporary Impair-ments (ASC Subtopic 320-10) (formerly FASB Staff Position FAS 115-2 and FAS 124-2)In April 2009, the FASB issued this guidance which is intended to provide greater clarity to investors about the credit and noncredit component of an other-than-temporary impairment event. It specifi cally amends the other-than-temporary impairment guidance for debt securities. The new guidance improves the presentation and disclosure of other-than-temporary impairments on investment securities and changes the calculation of the other-than-temporary impairment recognized in earnings in the fi nancial statements. However, it does not amend existing recognition and measurement guidance related to other-than-temporary impairments of equity securities.
For debt securities, an entity is required to assess whether (a) it has the intent to sell the debt security, or (b) it is more likely than not that it will be required to sell the debt security before its anticipated recovery. If either of these conditions is met, an other-than-temporary impairment on the security must be recognized.
In instances in which a determination is made that a credit loss (defi ned as the difference between the present value of the cash fl ows expected to be collected and the amortized cost basis) exists but the entity does not intend to sell the debt security and it is not more likely than not that the entity will be required to sell the debt security before the anticipated recovery of its remaining amortized cost basis (i.e., the amortized cost basis less any current-period credit loss), the accounting guidance changed the presentation
BOA22177_wo18_Popular.indd 108 3/3/2010 10:46:55 AM
109
and amount of the other-than-temporary impairment recognized in the statement of operations. In these instances, the impairment is separated into (a) the amount of the total impairment related to the credit loss, and (b) the amount of the total impairment related to all other factors. The amount of the total other-than-temporary impairment related to the credit loss is recognized in the statement of operations. The amount of the total impairment related to all other factors is recognized in other comprehensive loss. Previously, in all cases, if an impairment was determined to be other-than-temporary, an impairment loss was recognized in earnings in an amount equal to the entire difference between the security’s amortized cost basis and its fair value at the balance sheet date of the reporting period for which the assessment was made.
This guidance was effective and is to be applied prospectively for fi nancial statements issued for interim and annual reporting periods ending after June 15, 2009. At adoption an entity was required to record a cumulative-effect adjustment as of the beginning of the period of adoption to reclassify the noncredit component of a previously recognized other-than-temporary impairment from retained earnings to accumulated other comprehensive loss if the entity did not intend to sell the security and it was not more likely than not that the entity would be required to sell the security before the anticipated recovery of its amortized cost basis.
The Corporation adopted this guidance for interim and annual reporting periods commencing with the quarter ended June 30, 2009. The adoption of this new accounting guidance in the second quarter of 2009 did not result in a cumulative effect adjustment as of the beginning of the period of adoption (April 1, 2009) since there were no previously recognized other-than-temporary impairments related to outstanding debt securities. Refer to Notes 7 and 8 for related disclosures at December 31, 2009.
Interim Disclosures about Fair Value of Financial Instruments (ASC Subtopic 825-10) (formerly FASB Staff Position FAS 107-1 and APB 28-1)In April 2009, the FASB required providing disclosures on a quarterly basis about the fair value of fi nancial instruments that are not currently refl ected on the statement of condition at fair value. Originally the fair value for these assets and liabilities was only required for year-end disclosures. The Corporation adopted this guidance effective with the fi nancial statement disclosures for the quarter ended June 30, 2009. This guidance only impacts disclosure requirements and therefore did not have an impact on the Corporation’s fi nancial condition or results of operations. Refer to Note 37 to the consolidated fi nancial statements for the Corporation’s disclosures about fair value of fi nancial instruments.
Determining Fair Value When the Volume and Level of Activ-ity for the Asset or Liability Have Signifi cantly Decreased and Identifying Transactions That are Not Orderly (ASC Subtopic 820-10) (formerly FASB Staff Position FAS 157-4)This guidance, issued in April 2009, provides additional guidance for estimating fair value when the volume and level of activity for the asset or liability have signifi cantly decreased. It also includes guidance on identifying circumstances that indicate that a transaction is not orderly. This guidance reaffi rms the need to use judgment to ascertain if an active market has become inactive and in determining fair values when markets have become inactive. Additionally, it also emphasizes that even if there has been a signifi cant decrease in the volume and level of activity for the asset or liability and regardless of the valuation techniques used, the objective of a fair value measurement remains the same. Fair value is the price that would be received from the sale of an asset or paid to transfer a liability in an orderly transaction (that is, not a forced liquidation or distressed sale) between market participants at the measurement date under current market conditions. The adoption of this guidance did not have a material impact on the Corporation’s consolidated fi nancial statements for the year ended December 31, 2009.
FASB Accounting Standards Update 2009-05, Fair Value Measurements and Disclosures (ASC Topic 820) - Measuring Liabilities at Fair Value FASB Accounting Standards Update 2009-05, issued in August 2009, includes amendments to ASC Subtopic 820-10, Fair Value Measurements and Disclosures, for the fair value measurement of liabilities and provides clarifi cation that in circumstances in which a quoted price in an active market for the identical liability is not available, a reporting entity is required to measure fair value using one or more of the following techniques: a valuation technique that uses (a) the quoted price of the identical liability when traded as an asset, (b) quoted prices for similar liabilities or similar liabilities when trade as assets, or another valuation technique that is consistent with the principles of ASC Topic 820. Examples would be an income approach, such as a present value technique, or a market approach, such as a technique that is based on the amount at the measurement date that the reporting entity would pay to transfer the identical liability or would receive to enter into an identical liability. The adoption of this guidance was effective upon issuance and did not have a material impact on the Corporation’s consolidated fi nancial statements for the year ended December 31, 2009.
BOA22177_wo18_Popular.indd 109 3/3/2010 10:46:55 AM

110 POPULAR, INC. 2009 ANNUAL REPORT
FASB Accounting Standards Update 2010-06, Fair Value Measurements and Disclosures (ASC Topic 820) - Improving Disclosures about Fair Value Measurements FASB Accounting Standards Update 2010-06, issued in January 2010, requires new disclosures and clarifies some existing disclosure requirements about fair value measurements as set forth in ASC Subtopic 820-10. This update amends Subtopic 820-10 and now requires a reporting entity to disclose separately the amounts of signifi cant transfers in and out of Level 1 and Level 2 fair value measurements and describe the reasons for the transfer. Also in the reconciliation for fair value measurements using signifi cant unobservable inputs (Level 3), a reporting entity should present separately information about purchases, sales, issuances and settlements. In addition, this update clarifi es existing disclosures as follows: (i) for purposes of reporting fair value measurement for each class of assets and liabilities, a reporting entity needs to use judgment in determining the appropriate classes of assets and liabilities, and (ii) a reporting entity should provide disclosures about the valuation techniques and inputs used to measure fair value for both recurring and nonrecurring fair value measurements. This update is effective for interim and annual reporting periods beginning after December 15, 2009 except for the disclosures about purchases, sales, issuances, and settlements in the roll-forward of activity in Level 3 fair value measurements. Those disclosures are effective for fi scal years beginning after December 15, 2010 and for interim periods within those fi scal years. Early application is permitted. This guidance impacts disclosures only and will not have an effect on the Corporation’s consolidated statements of condition or results of operations.
Note 2 - Subsequent events:Management has evaluated the effects of subsequent events that have occurred subsequent to December 31, 2009. There are no material events that would require recognition or disclosure in the consolidated fi nancial statements for the year ended December 31, 2009.
Note 3 - Discontinued operations:For fi nancial reporting purposes, the results of the discontinued operations of PFH are presented as “Assets / Liabilities from discontinued operations” in the consolidated statements of condition and “Loss from discontinued operations, net of tax” in the consolidated statements of operations.
Total assets of the PFH discontinued operations amounted to $13 million at December 31, 2008.
The following table provides fi nancial information for the discontinued operations for the years ended December 31, 2009, 2008 and 2007.
(In millions) 2009 2008 2007Net interest income $0.9 $30.8 $143.7Provision for loan losses - 19.0 221.4Non-interest loss, including fair value adjustments on loans and MSRs (3.2) (266.9) (89.3)Lower of cost or fair value adjustments on reclassifi cation of loans to held-for- sale prior to recharacterization - - (506.2)Gain upon completion of recharacterization - - 416.1Operating expenses, including reductions in value of servicing advances and other real estate, and restructuring costs 10.9 213.5 159.1Loss on disposition during the period (a) - (79.9) -Pre-tax loss from discontinued operations ($13.2) ($548.5) ($416.2)Income tax expense (benefi t) (b) 6.8 14.9 (149.2)Loss from discontinued operations, net of tax ($20.0) ($563.4) ($267.0)(a) Loss on disposition for 2008 includes the loss associated to the sale of manufactured housing loans in September 2008, including lower of cost or market adjustments at reclassifi cation from loans held-in-portfolio to loans held-for-sale. Also, it includes the impact of fair value adjustments and other losses incurred during the fourth quarter of 2008 specifi cally related to the sale of loans, residual interests and servicing related assets to the third-party buyer in November 2008. These events led the Corporation to classify PFH’s operations as discontinued operations.(b) Income tax for 2008 included the impact of recording a valuation allowance on deferred tax assets of $209.0 million.
In 2007, PFH began downsizing its operations and shutting down certain loan origination channels. During that year, the Corporation executed the “PFH Restructuring and Integration Plan”, which called for PFH to exit the wholesale subprime mortgage loan origination business in early 2007 and to shut down the wholesale broker, retail and call center business divisions. This plan was substantially completed in 2007 and resulted in restructuring costs amounting to $14.7 million in that year. PFH began 2008 with a signifi cantly reduced asset base due to lower loan volume as it shut down those loan origination channels, and due to the recharacterization, in December 2007, of certain on-balance sheet securitizations as sales that involved approximately $3.2 billion in unpaid principal balance (“UPB”) of loans. Additional information on the recharacterization transaction is provided in a subsection of this note to the consolidated fi nancial
BOA22177_wo18_Popular.indd 110 3/3/2010 10:46:55 AM

111
statements. During the third and fourth quarters of 2008, the Corporation
executed a series of signifi cant asset sale transactions and a restructuring plan that led to the discontinuance of PFH’s operations, which prior to September 30, 2008, were defi ned as a reportable segment for managerial reporting. The discontinuance included the sale of a substantial portion of PFH’s loan portfolio, servicing related assets, residual interests and other real estate assets. Also, the discontinuance included exiting the loan servicing functions related to portfolios from non-affi liated parties.
In March 2008, the Corporation sold approximately $1.4 billion of consumer and mortgage loans that were originated through Equity One’s (a subsidiary of PFH) consumer branch network and recognized a gain upon sale of approximately $54.5 million. The loan portfolio buyer retained certain branch locations. Equity One closed all consumer service branches not assumed by the buyer, thus exiting PFH’s consumer fi nance business in early 2008.
In September 2008, the Corporation sold PFH’s portfolio of manufactured housing loans with a UPB of approximately $309 million for cash proceeds of $198 million. The Corporation recognized a loss on disposition of $53.5 million.
During the third quarter of 2008, the Corporation also entered into an agreement to sell substantially all of PFH’s outstanding loan portfolio, residual interests and servicing related assets. This transaction, which was consummated in November 2008, involved the sale of approximately $748 million in assets, which for the most part were measured at fair value. The Corporation recognized a loss of approximately $26.4 million in the fourth quarter of 2008 related to this disposition. Proceeds from this sale amounted to $731 million. During the third quarter of 2008, the Corporation recognized fair value adjustments on these assets held-for-sale of approximately $360 million.
Also, in conjunction with the November 2008 sale, the Corporation sold the implied residual interests associated to certain on-balance sheet securitizations, thus transferring all rights and obligations to the third party with no continuing involvement whatsoever on the Corporation with the transferred assets. The Corporation derecognized the secured debt related to these securitizations of approximately $164 million, as well as the loans that served as collateral for approximately $158 million. The on-balance sheet secured debt as well as the related loans were measured at fair value pursuant to the fair value option.
As part of the actions to exit PFH’s business, the Corporation executed two restructuring plans. These were the “PFH Branch Network Restructuring Plan” and the “PFH Discontinuance Restructuring Plan”. The PFH Branch Network Restructuring Plan resulted in the sale of a substantial portion of PFH’s loan portfolio in the fi rst quarter of 2008 and the closure of Equity One’s consumer service branches, which represented, at the time, the only signifi cant channel for PFH to continue originating loans. The
PFH Branch Network Restructuring Plan resulted in restructuring costs amounting to $17.4 million in 2008 and impairment losses on long-lived assets of $1.9 million in 2007. The accrual balance of $1.9 million at December 31, 2008, mostly related to severance and lease contracts, was substantially settled during 2009.
The following table details the expenses recorded by the Corporation that were associated with the PFH Branch Network Restructuring Plan.
(In millions) 2008 2007 TotalPersonnel costs (a) $8.9 - $8.9Net occupancy expenses (b) 6.7 - 6.7Equipment expenses 0.7 - 0.7Communications 0.2 - 0.2Other operating expenses 0.9 - 0.9Total restructuring costs $17.4 - $17.4Impairment losses on long-lived assets (c) - $1.9 1.9 $17.4 $1.9 $19.3(a) Severance, retention bonuses and other benefi ts(b) Lease terminations(c) Leasehold improvements, furniture and equipment
The PFH Discontinuance Restructuring Plan commenced in the second half of 2008 and was completed in 2009. This restructuring plan included the elimination of all employment positions and termination of contracts with the objective of discontinuing PFH’s operations. This restructuring plan resulted in charges, on a pre-tax basis, broken down as follows:
(In millions) 2009 2008 TotalPersonnel costs (a) $1.1 $4.1 $5.2Professional fees 0.1 - 0.1Other operating expenses 0.2 - 0.2Total restructuring costs $1.4 $4.1 $5.5Impairment losses on long-lived assets (b) - 3.9 3.9Total $1.4 $8.0 $9.4(a) Severance, retention bonuses and other benefi ts(b) Leasehold improvements, furniture and equipment and prepaid expenses
The PFH Discontinuance Restructuring Plan charges are included in the line item “Loss from discontinued operations, net of tax” in the consolidated statements of operations.
BOA22177_wo18_Popular.indd 111 3/3/2010 10:46:55 AM

112 POPULAR, INC. 2009 ANNUAL REPORT
The following table presents the activity in the accrued balances for the PFH Discontinuance Restructuring Plan.
(In thousands) Restructuring CostsBalance at January 1, 2008 -Charges expensed during 2008 $4.1Payments made during 2008 (0.7)Balance at December 31, 2008 $3.4Charges expensed during 2009 1.4Payments made during 2009 (4.4)Balance at December 31, 2009 $0.4
PFH’s Recharacterization TransactionFrom 2001 through 2006, the Corporation, particularly PFH or its subsidiary Equity One, conducted 21 mortgage loan securitizations that were sales for legal purposes but did not qualify for sale accounting treatment at the time of inception because the securitization trusts did not meet the criteria for qualifying special purpose entities (“QSPEs”) required by accounting standards. As a result, the transfers of the mortgage loans pursuant to these securitizations were initially accounted for as secured borrowings with the mortgage loans continuing to be refl ected as assets on the Corporation’s consolidated statements of condition with appropriate footnote disclosure indicating that the mortgage loans were, for legal purposes, sold to the securitization trusts.
As part of the Corporation’s strategy of exiting the subprime business at PFH, on December 19, 2007, PFH and the trustee for each of the related securitization trusts amended the provisions of the related pooling and servicing agreements to delete the discretionary provisions that prevented the transactions from qualifying for sale treatment. The Corporation obtained a legal opinion, which among other considerations, indicated that each amendment (a) was authorized or permitted under the pooling and servicing agreement related to such amendment, and (b) will not adversely affect in any material respect the interests of any certifi cateholders covered by the related pooling and servicing agreement. The amendments to the pooling and servicing agreement allowed the Corporation to recognize 16 out of the 21 transactions as sales for accounting purposes.
The net impact of the recharacterization transaction was a pre-tax loss of $90.1 million in 2007, which is included as part of the “Net loss from discontinued operations, net of tax” in these consolidated fi nancial statements. The net loss on the recharacterization included a loss of $506.2 million in lower of cost or market adjustment associated with the reclassifi cation of loans held-in-portfolio to loans held-for-sale, and a $416.1 million gain upon completion of the recharacterization.
The recharacterization involved a series of steps, which included the following:
(i) reclassifying the loans as held-for-sale with the corresponding
lower of cost or market adjustment as of the date of the transfer;
(ii) removing from the Corporation’s books approximately $2.6 billion in mortgage loans recognized at fair value after reclassifi cation to the held-for-sale category (UPB of $3.2 billion) and $3.1 billion in related liabilities representing secured borrowings;
(iii) recognizing assets referred to as residual interests, which represented the fair value of residual interest certifi cates that were issued by the securitization trusts and retained by PFH; and
(iv) recognizing mortgage servicing rights, which represented the fair value of PFH’s right to continue to service the mort-gage loans transferred to the securitization trusts.
After reclassifying the loans to held-for-sale at fair value, the Corporation proceeded to simultaneously account for the transfers as sales upon recharacterization. The accounting entries at recharacterization entailed the removal from the Corporation’s books of the $2.6 billion in mortgage loans measured at fair value, the $3.1 billion in secured borrowings (which represent the bond certifi cates due to investors in the securitizations that are collateralized by the mortgage loans), and other assets and liabilities related to the securitization, including for example, accrued interest. Upon sale accounting, the Corporation also recognized residual interests of $38 million and MSRs of $18 million, which represented the Corporation’s retained interests. The residual interests represented the fair value at recharacterization date of residual interest certifi cates that were issued by the securitization trusts and retained by PFH, and the MSRs represented the fair value of PFH’s right to continue to service the mortgage loans transferred to the securitization trusts.
In November 2008, the Corporation sold all residual interests and mortgage servicing rights related to all securitization transactions completed by PFH. Therefore, the Corporation did not retain any interest on the securitizations’ trust assets from a legal or accounting standpoint at the end of 2008.
BOA22177_wo18_Popular.indd 112 3/3/2010 10:46:55 AM

113
Note 4 - Restructuring plans:In 2008, the Corporation determined to reduce the size of its banking operations in the U.S. mainland to a level better suited to present economic conditions and to focus on core banking activities. As indicated in the 2008 Annual Report, on October 17, 2008, the Board of Directors of Popular, Inc. approved two restructuring plans for the BPNA reportable segment. The objective of the restructuring plans was to improve profi tability in the short-term, increase liquidity and lower credit costs, and, over time, achieve a greater integration with corporate functions in Puerto Rico.
BPNA Restructuring PlanThe restructuring plan for BPNA’s banking operations (“the BPNA Restructuring Plan”) contemplated the following measures: closing, consolidating or selling approximately 40 underperforming branches in all existing markets; the shutting down, sale or downsizing of lending businesses that do not generate deposits or fee income; and the reduction of general expenses associated with functions supporting the branch and balance sheet initiatives. The BPNA Restructuring Plan also contemplated greater integration with the corporate functions in Puerto Rico. The BPNA Restructuring Plan was substantially complete at December 31, 2009. Management continues to evaluate branch actions and business lending opportunities as part of its business plans.
As part of the BPNA Restructuring Plan, the Corporation exited certain businesses including, among the principal ones, those related to the origination of non-conventional mortgages, equipment lease fi nancing, loans to professionals, multifamily lending, mixed-used commercial loans and credit cards. The Corporation holds the existing portfolios of the exited businesses in a run-off mode. Also, the Corporation downsized certain businesses related to its U.S. mainland banking, including: business banking, SBA lending, and consumer / mortgage lending.
The following table details the expenses recorded by the Corporation related with the BPNA Restructuring Plan:
December 31,(In millions) 2009 2008 TotalPersonnel costs (a) $6.0 $5.3 $11.3Net occupancy expenses (b) 0.3 8.9 9.2Other operating expenses 0.4 - 0.4Total restructuring costs $6.7 $14.2 $20.9Impairment losses on long-lived assets (c) 0.4 5.5 5.9Total $7.1 $19.7 $26.8(a) Severance, retention bonuses and other benefi ts(b) Lease terminations(c) Leasehold improvements, furniture and equipment
The following table presents the activity in the reserve for restructuring costs associated with the BPNA Restructuring Plan.
(In millions) Restructuring CostsBalance at January 1, 2008 -Charges expensed during 2008 $14.2Payments made during 2008 (3.3)Balance at December 31, 2008 $10.9Charges expensed during 2009 8.5Reversals during 2009 (1.8)Payments made during 2009 (10.5)Balance at December 31, 2009 $7.1
The reserve balance at December 31, 2009 was mostly related
to lease contracts.The costs related to the BPNA Restructuring Plan are included
in the BPNA Reportable Segment.
E-LOAN 2007 and 2008 Restructuring PlansIn November 2007, the Corporation approved an initial restructuring plan for E-LOAN (the “E-LOAN 2007 Restructuring Plan”). This plan included a substantial reduction of marketing and personnel costs at E-LOAN and changes in E-LOAN’s business model. At that time, the changes included concentrating marketing investment toward the Internet and the origination of fi rst mortgage loans. Also, as a result of escalating credit costs and lower liquidity in the secondary markets for mortgage related products, in the fourth quarter of 2007, the Corporation determined to hold back the origination by E-LOAN of home equity lines of credit, closed-end second lien mortgage loans and auto loans.
The following table details the expenses recognized during the years ended December 31, 2008 and 2007 that were associated with the E-LOAN 2007 Restructuring Plan.
December 31,(In millions) 2008 2007 TotalPersonnel costs (a) ($0.3) $4.6 $4.3Net occupancy expenses (b) 0.1 4.2 4.3Equipment expenses (c) - 0.4 0.4Professional fees (c) - 0.4 0.4Other operating expenses - - -Total restructuring charges ($0.2) $9.6 $9.4Impairment losses on long-lived assets (d) - 10.5 10.5Goodwill and trademark impairment losses (e) - 211.8 211.8Total ($0.2) $231.9 $231.7(a) Severance, retention bonuses and other benefi ts(b) Lease terminations(c) Service contract terminations(d) Consists mostly of leasehold improvements, equipment and intangible assets with defi nite lives(e) Goodwill impairment of $164.4 million and trademark impairment of $47.4 million
BOA22177_wo18_Popular.indd 113 3/3/2010 10:46:55 AM

114 POPULAR, INC. 2009 ANNUAL REPORT
These series of actions executed during 2007 and early 2008 proved not to be suffi cient given the unprecedented market conditions and disappointing financial results. In October 2008, the Corporation’s Board of Directors approved another restructuring plan for E-LOAN (the “E-LOAN 2008 Restructuring Plan”), which involved E-LOAN to cease operating as a direct lender, an event that occurred in late 2008. E-LOAN continues to market deposit accounts under its name for the benefi t of BPNA. The E-LOAN 2008 Restructuring Plan was completed during 2009 since all operational and support functions were transferred to BPNA and EVERTEC and loan servicing was transferred to a third-party provider. The E-LOAN 2008 Restructuring Plan resulted in a reduction in FTEs of 270 between December 31, 2008 and the end of 2009. Refer to Note 39 to the consolidated fi nancial statements for information on the results of operations of E-LOAN, which are part of BPNA’s reportable segment
The following table details the expenses recognized during the years ended December 31, 2009 and 2008 that were associated with the E-LOAN 2008 Restructuring Plan.
December 31,(In millions) 2009 2008 TotalPersonnel costs (a) $2.4 $3.0 $5.4Other operating expenses - 0.1 0.1Total restructuring charges $2.4 $3.1 $5.5Impairment losses on long-lived assets (b) - 8.0 8.0Trademark impairment losses - 10.9 10.9Total $2.4 $22.0 $24.4(a) Severance, retention bonuses and other benefi ts(b) Consists mostly of leasehold improvements, equipment and intangible assets with defi nite lives
The following table presents the activity in the reserve for restructuring costs associated with the E-LOAN 2008 Restructuring Plan for the years ended December 31, 2009 and 2008.
(In millions) Restructuring CostsBalance at January 1, 2008 -Charges expensed during 2008 $3.1Payments made during 2008 (0.1)Balance at December 31, 2008 $3.0Charges expensed during 2009 2.9Payments made during 2009 (5.4)Reversals made during 2009 (0.5) (a)Balance at December 31, 2009 $ -(a) Severance, retention bonuses and other benefi ts
Note 5 - Restrictions on cash and due from banks and highly liquid securities:Restricted assets include cash and other highly liquid securities whereby the Corporation’s ability to withdraw funds at any time is contractually limited. Restricted assets are generally designated for specifi c purposes arising out of certain contractual or other obligations.
The Corporation’s subsidiary banks are required by federal and state regulatory agencies to maintain average reserve balances with the Federal Reserve Bank or other banks. Those required average reserve balances were approximately $721 million at December 31, 2009 (2008 - $684 million). Cash and due from banks, as well as other short-term, highly liquid securities, are used to cover the required average reserve balances.
In compliance with rules and regulations of the Securities and Exchange Commission, the Corporation may be required to establish a special reserve account for the benefi t of brokerage customers of its broker-dealer subsidiary, which may consist of securities segregated in the special reserve account. There were no reserve requirements at December 31, 2009. At December 31, 2008 the Corporation had securities with a market value of $0.3 million. These securities were classifi ed in the consolidated statement of condition within the other trading securities category.
As required by the Puerto Rico International Banking Center Law, at December 31, 2009 and 2008, the Corporation maintained separately for its two international banking entities (“IBEs”), $0.6 million in time deposits, equally split for the two IBEs, which were considered restricted assets.
As part of a line of credit facility with a fi nancial institution, at December 31, 2009 and 2008, the Corporation maintained restricted cash of $2 million as collateral for the line of credit. The cash is being held in certifi cates of deposit, which mature in less than 90 days. The line of credit is used to support letters of credit.
At December 31, 2009, the Corporation maintained restricted cash of $3 million to support a letter of credit. The cash is being held in an interest-bearing money market account.
At December 31, 2009, the Corporation had restricted cash of $1 million (2008 - $3 million) to support a letter of credit related to a service settlement agreement.
At December 31, 2008, as part of a loan sales agreement, the Corporation was required to have $10 million in cash equivalents restricted as to usage for potential payment of obligations. This restriction expired on November 3, 2009.
BOA22177_wo18_Popular.indd 114 3/3/2010 10:46:55 AM

115
Note 6 - Securities purchased under agreements to resell:The securities purchased underlying the agreements to resell were delivered to, and are held by, the Corporation. The counterparties to such agreements maintain effective control over such securities. The Corporation is permitted by contract to repledge the securities, and has agreed to resell to the counterparties the same or substantially similar securities at the maturity of the agreements.
The fair value of the collateral securities held by the Corporation on these transactions at December 31, was as follows:
(In thousands) 2009 2008Repledged $167,602 $199,558Not repledged 155,072 122,871Total $322,674 $322,429
The repledged securities were used as underlying securities for repurchase agreement transactions.
Note 7 - Investment securities available-for-sale:The amortized cost, gross unrealized gains and losses, approximate fair value, weighted average yield and contractual maturities of investment securities available-for-sale at December 31, 2009 and 2008 (2007 - only fair value is presented) were as follows:
2009 Gross Gross Weighted Amortized unrealized unrealized Fair average cost gains losses value yield (Dollars in thousands)U.S. Treasury securities After 5 to 10 years $29,359 $1,093 - $30,452 3.80%
Obligations of U.S. government sponsored entities Within 1 year 349,424 7,491 - 356,915 3.67 After 1 to 5 years 1,177,318 58,151 - 1,235,469 3.79 After 5 to 10 years 27,812 680 - 28,492 4.96 After 10 years 26,884 176 - 27,060 5.68 1,581,438 66,498 - 1,647,936 3.82Obligations of Puerto Rico, States and political subdivisions After 1 to 5 years 22,311 7 $15 22,303 6.92 After 5 to 10 years 50,910 249 632 50,527 5.08 After 10 years 7,840 - 61 7,779 5.26
81,061 256 708 80,609 5.60
Collateralized mortgage obligations - federal agencies Within 1 year 41 - - 41 3.78 After 1 to 5 years 4,875 120 - 4,995 4.44 After 5 to 10 years 125,397 2,105 404 127,098 2.85 After 10 years 1,454,833 19,060 5,837 1,468,056 3.03
1,585,146 21,285 6,241 1,600,190 3.02
Collateralized mortgage obligations - private label After 5 to 10 years 20,885 - 653 20,232 2.00 After 10 years 105,669 109 8,452 97,326 2.59
126,554 109 9,105 117,558 2.50
Mortgage-backed securities Within 1 year 26,878 512 - 27,390 3.61 After 1 to 5 years 30,117 823 - 30,940 3.94 After 5 to 10 years 205,480 8,781 - 214,261 4.80 After 10 years 2,915,689 32,102 10,203 2,937,588 4.40
3,178,164 42,218 10,203 3,210,179 4.42
Equity securities (without contractual maturity) 8,902 233 1,345 7,790 3.65
$6,590,624 $131,692 $27,602 $6,694,714 3.91%
BOA22177_wo18_Popular.indd 115 3/3/2010 10:46:55 AM

116 POPULAR, INC. 2009 ANNUAL REPORT
2008 2007 Gross Gross Weighted Amortized unrealized unrealized Fair average Fair cost gains losses value yield value (Dollars in thousands)U.S. Treasury securities Within 1 year - - - - - $9,996 After 5 to 10 years $456,551 $45,567 - $502,118 3.83% 461,100 456,551 45,567 - 502,118 3.83 471,096Obligations of U.S. government sponsored entities Within 1 year 123,315 2,855 - 126,170 4.46 1,310,599 After 1 to 5 years 4,361,775 262,184 - 4,623,959 4.07 3,641,774 After 5 to 10 years 27,811 1,097 - 28,908 4.96 472,270 After 10 years 26,877 1,094 - 27,971 5.68 72,471 4,539,778 267,230 - 4,807,008 4.09 5,497,114Obligations of Puerto Rico, States and political subdivisions Within 1 year 4,500 66 - 4,566 6.10 12,431 After 1 to 5 years 2,259 4 $6 2,257 4.95 7,960 After 5 to 10 years 67,975 232 3,269 64,938 4.77 24,114 After 10 years 29,423 46 240 29,229 5.20 56,987 104,157 348 3,515 100,990 4.95 101,492
Collateralized mortgage obligations - federal agencies Within 1 year 179 - - 179 5.36 190 After 1 to 5 years 6,837 52 12 6,877 5.20 6,589 After 5 to 10 years 156,240 784 994 156,030 3.38 123,982 After 10 years 1,363,705 9,090 28,913 1,343,882 3.11 1,027,660 1,526,961 9,926 29,919 1,506,968 3.15 1,158,421
Collateralized mortgage obligations - private label Within 1 year 443 - 3 440 4.96 - After 1 to 5 years - - - - - 871 After 5 to 10 years 30,914 - 2,909 28,005 2.30 3,269 After 10 years 158,667 - 38,364 120,303 3.52 233,979
190,024 - 41,276 148,748 3.32 238,119
Mortgage-backed securities Within 1 year 18,673 46 8 18,711 3.94 27,116 After 1 to 5 years 67,570 237 150 67,657 3.86 93,351 After 5 to 10 years 116,059 3,456 226 119,289 4.85 68,906 After 10 years 635,159 11,127 3,438 642,848 5.47 820,755 837,461 14,866 3,822 848,505 5.22 1,010,128
Equity securities (without contractual maturity) 19,581 61 9,492 10,150 5.01 33,953
Other After 1 to 5 years - - - - - 23 After 5 to 10 years - - - - - 68 After 10 years - - - - - 4,721
- - - - - 4,812
$7,674,513 $337,998 $88,024 $7,924,487 4.01% $8,515,135
The weighted average yield on investment securities available-for-sale is based on amortized cost; therefore, it does not give effect to changes in fair value.
Securities not due on a single contractual maturity date, such as mortgage-backed securities and collateralized mortgage
obligations, are classifi ed in the period of fi nal contractual maturity. The expected maturities of collateralized mortgage obligations, mortgage-backed securities and certain other securities may differ from their contractual maturities because they may be subject to prepayments or may be called by the issuer.
The aggregate amortized cost and fair value of investment securities available-for-sale at December 31, 2009, by contractual maturity, are shown below:
(In thousands) Amortized cost Fair value
Within 1 year $376,343 $384,346After 1 to 5 years 1,234,621 1,293,707After 5 to 10 years 459,843 471,062After 10 years 4,510,915 4,537,809
Total 6,581,722 6,686,924Equity securities 8,902 7,790
Total investment securities available-for-sale $6,590,624 $6,694,714
Proceeds from the sale of investment securities available-for-sale during 2009 were $3.8 billion (2008 - $2.4 billion; 2007 - $58.2 million). Gross realized gains and losses on securities available-for-sale during 2009 were $184.7 million and $0.4 million, respectively (2008 - $29.6 million and $0.1 million; 2007 - $8.0 million and $4.3 million).
The following table shows the Corporation’s amortized cost, gross unrealized losses and fair value of investment securities available-for-sale, aggregated by investment category and length of time that individual securities have been in a continuous unrealized loss position, at December 31, 2009 and 2008:
December 31, 2009 Less than 12 months Gross Amortized Unrealized Fair (In thousands) Cost Losses ValueObligations of Puerto Rico, States and political subdivisions $2,395 $8 $2,387Collateralized mortgage obligations - federal agencies 302,584 3,667 298,917Collateralized mortgage obligations - private label 6,734 18 6,716Mortgage-backed securities 915,158 10,130 905,028Equity securities 3,328 981 2,347
$1,230,199 $14,804 $1,215,395
BOA22177_wo18_Popular.indd 116 3/3/2010 10:46:55 AM

117
12 months or more Gross Amortized Unrealized Fair (In thousands) Cost Losses ValueObligations of Puerto Rico, States and political subdivisions $64,129 $700 $63,429Collateralized mortgage obligations - federal agencies 361,788 2,574 359,214Collateralized mortgage obligations - private label 106,991 9,087 97,904Mortgage-backed securities 3,639 73 3,566Equity securities 4,262 364 3,898
$540,809 $12,798 $528,011 Total Gross Amortized Unrealized Fair (In thousands) Cost Losses ValueObligations of Puerto Rico, States and political subdivisions $66,524 $708 $65,816Collateralized mortgage obligations - federal agencies 664,372 6,241 658,131Collateralized mortgage obligations - private label 113,725 9,105 104,620Mortgage-backed securities 918,797 10,203 908,594Equity securities 7,590 1,345 6,245
$1,771,008 $27,602 $1,743,406
December 31, 2008 Less than 12 months Gross Amortized Unrealized Fair (In thousands) Cost Losses ValueObligations of Puerto Rico, States and political subdivisions $34,795 $303 $34,492Collateralized mortgage obligations - federal agencies 485,140 13,274 471,866Collateralized mortgage obligations - private label 59,643 15,315 44,328Mortgage-backed securities 109,298 676 108,622Equity securities 19,541 9,480 10,061
$708,417 $39,048 $669,369 12 months or more Gross Amortized Unrealized Fair (In thousands) Cost Losses ValueObligations of Puerto Rico, States and political subdivisions $44,011 $3,212 $40,799Collateralized mortgage obligations - federal agencies 423,137 16,645 406,492Collateralized mortgage obligations - private label 130,065 25,961 104,104Mortgage-backed securities 206,472 3,146 203,326Equity securities 29 12 17
$803,714 $48,976 $754,738
Total Gross Amortized Unrealized Fair (In thousands) Cost Losses ValueObligations of Puerto Rico, States and political subdivisions $78,806 $3,515 $75,291Collateralized mortgage obligations - federal agencies 908,277 29,919 878,358Collateralized mortgage obligations - private label 189,708 41,276 148,432Mortgage-backed securities 315,770 3,822 311,948Equity securities 19,570 9,492 10,078
$1,512,131 $88,024 $1,424,107
Management evaluates investment securities for other-than-temporary (“OTTI”) declines in fair value on a quarterly basis. Once a decline in value is determined to be other-than- temporary, the value of a debt security is reduced and a corresponding charge to earnings is recognized for anticipated credit losses. Also, for equity securities that are considered other-than-temporarily impaired, the excess of the security’s carrying value over its fair value at the evaluation date is accounted for as a loss in the results of operations. The OTTI analysis requires management to consider various factors, which include, but are not limited to: (1) the length of time and the extent to which fair value has been less than the amortized cost basis, (2) the fi nancial condition of the issuer or issuers, (3) actual collateral attributes, (4) the payment structure of the debt security and the likelihood of the issuer being able to make payments, (5) any rating changes by a rating agency, (6) adverse conditions specifi cally related to the security, industry, or a geographic area, and (7) management’s intent to sell the security or whether it is more likely than not that the Corporation would be required to sell the security before a forecasted recovery occurs.
At December 31, 2009, management performed its quarterly analysis of all debt securities in an unrealized loss position. Based on the analyses performed, management concluded that no material individual debt security was other-than-temporarily impaired as of such date. At December 31, 2009, the Corporation does not have the intent to sell debt securities in an unrealized loss position and it is not more likely than not that the Corporation will have to sell the investment securities prior to recovery of their amortized cost basis. Also, management evaluated the Corporation’s portfolio of equity securities at December 31, 2009. During the year ended December 31, 2009, the Corporation recorded $10.9 million in losses on certain equity securities considered other-than-temporarily impaired. Management has the intent and ability to hold the investments in equity securities that are at a loss position at December 31, 2009 for a reasonable period of time for a forecasted recovery of fair value up to (or beyond) the cost of these investments.
The unrealized losses associated with “Obligations of Puerto Rico, States and political subdivisions” are primarily associated to approximately $55 million in Commonwealth of Puerto Rico
BOA22177_wo18_Popular.indd 117 3/3/2010 10:46:55 AM

118 POPULAR, INC. 2009 ANNUAL REPORT
Appropriation Bonds (“Appropriation Bonds”). Of this total, $45 million are rated Ba1, one notch below investment grade, by Moody’s Investors Service (“Moody’s”), while Standard & Poor’s (“S&P”) rates them as investment grade. During early June, S&P Rating Services affi rmed its BBB- rating on the Commonwealth of Puerto Rico general obligations and appropriation debt outstanding, which indicates S&P’s opinion that Puerto Rico’s appropriation credit profi le is not speculative grade. The outlook indicated by S&P is stable. These securities will continue to be monitored as part of management’s ongoing OTTI assessments. Management expects to receive cash fl ows suffi cient to recover the entire amortized cost basis of the securities.
The unrealized losses reported for “Collateralized mortgage obligations - federal agencies” are principally associated to CMOs that were issued by U.S. government-sponsored entities and agencies, primarily Federal National Mortgage Association (“FNMA”) and Federal Home Loan Mortgage Corporation (“FHLMC”), institutions which the government has affi rmed its commitment to support, and Government National Mortgage Association (“GNMA”), which has the full faith and credit of the U.S. Government. These collateralized mortgage obligations are rated AAA by the major rating agencies and are backed by residential mortgages. The unrealized losses in this portfolio were primarily attributable to changes in interest rates and levels of market liquidity relative to when the investment securities were purchased and not due to credit quality of the securities.
The unrealized losses associated with private-label collateralized mortgage obligations are primarily related to securities backed by residential mortgages. In addition to verifying the credit ratings for the private label CMOs, management analyzed the underlying mortgage loan collateral for these bonds. Various statistics or metrics were reviewed for each private-label CMO, including among others, the weighted average loan-to-value, FICO score, and delinquency and foreclosure rates of the underlying assets in the securities. At December 31, 2009, there were no “sub-prime” or “Alt-A” securities in the Corporation’s private-label CMO portfolios. For private-label CMOs with unrealized losses as of December 31, 2009, credit impairment was assessed using a cash fl ow model that estimates the cash fl ows on the underlying mortgages, using the security-specifi c collateral and transaction structure. The model estimates cash fl ows from the underlying mortgage loans and distributes those cash fl ows to various tranches of securities, considering the transaction structure and any subordination and credit enhancements that exist in that structure. The cash fl ow model incorporates actual cash fl ows through the current period and then projects the expected cash fl ows using a number of assumptions, including default rates, loss severity and prepayment rates. Management’s assessment also considered tests using more stressful parameters. Based on the assessments, management concluded that the tranches of the private-label CMOs held by
the Corporation were not other-than-temporarily impaired at December 31, 2009, thus management expects to recover the amortized cost basis of the securities.
All of the Corporation’s securities classifi ed as mortgage-backed securities were issued by U.S. government-sponsored entities and agencies, primarily GNMA and FNMA, thus as previously expressed, have the guarantee or support of the U.S. government. These mortgage-backed securities are rated AAA by the major rating agencies and are backed by residential mortgages. Most of the mortgage-backed securities held at December 31, 2009 with unrealized losses had been purchased at a premium during 2009 and although their fair values have declined, they continue to exceed the par value of the securities. The unrealized losses in this portfolio were generally attributable to changes in interest rates relative to when the investment securities were purchased and not due to credit quality of the securities.
The following table states the name of issuers, and the aggregate amortized cost and market value of the securities of such issuer (includes available-for-sale and held-to-maturity securities), in which the aggregate amortized cost of such securities exceeds 10% of stockholders’ equity. This information excludes securities of the U.S. Government agencies and corporations. Investments in obligations issued by a state of the U.S. and its political subdivisions and agencies, which are payable and secured by the same source of revenue or taxing authority, other than the U.S. Government, are considered securities of a single issuer.
2009 2008
Amortized Fair Amortized Fair(In thousands) cost Value cost Value
FNMA $970,744 $991,825 $1,198,645 $1,197,648FHLB 1,385,535 1,449,454 4,389,271 4,651,249Freddie Mac 959,316 971,556 884,414 875,493
BOA22177_wo18_Popular.indd 118 3/3/2010 10:46:55 AM
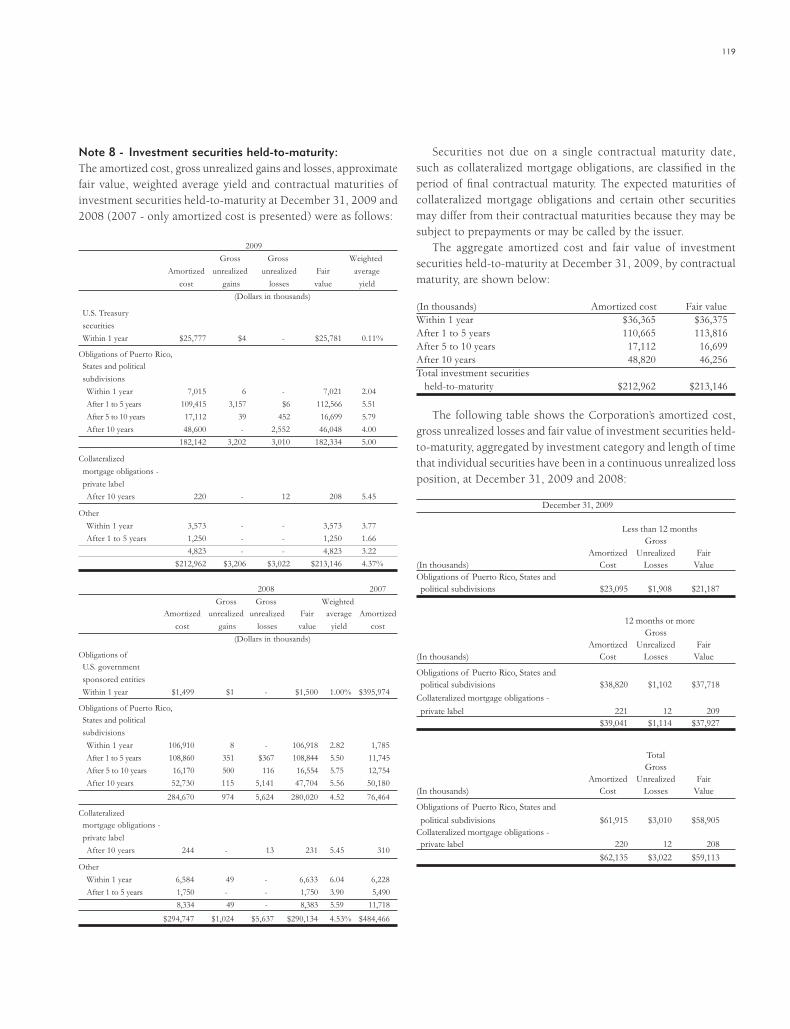
119
Note 8 - Investment securities held-to-maturity:The amortized cost, gross unrealized gains and losses, approximate fair value, weighted average yield and contractual maturities of investment securities held-to-maturity at December 31, 2009 and 2008 (2007 - only amortized cost is presented) were as follows: 2009 Gross Gross Weighted Amortized unrealized unrealized Fair average cost gains losses value yield (Dollars in thousands)
U.S. Treasury securities Within 1 year $25,777 $4 - $25,781 0.11%
Obligations of Puerto Rico, States and political subdivisions Within 1 year 7,015 6 - 7,021 2.04 After 1 to 5 years 109,415 3,157 $6 112,566 5.51 After 5 to 10 years 17,112 39 452 16,699 5.79 After 10 years 48,600 - 2,552 46,048 4.00 182,142 3,202 3,010 182,334 5.00
Collateralized mortgage obligations - private label After 10 years 220 - 12 208 5.45
Other Within 1 year 3,573 - - 3,573 3.77 After 1 to 5 years 1,250 - - 1,250 1.66 4,823 - - 4,823 3.22 $212,962 $3,206 $3,022 $213,146 4.37% 2008 2007 Gross Gross Weighted Amortized unrealized unrealized Fair average Amortized cost gains losses value yield cost (Dollars in thousands)
Obligations of U.S. government sponsored entities Within 1 year $1,499 $1 - $1,500 1.00% $395,974
Obligations of Puerto Rico, States and political subdivisions Within 1 year 106,910 8 - 106,918 2.82 1,785 After 1 to 5 years 108,860 351 $367 108,844 5.50 11,745 After 5 to 10 years 16,170 500 116 16,554 5.75 12,754 After 10 years 52,730 115 5,141 47,704 5.56 50,180 284,670 974 5,624 280,020 4.52 76,464
Collateralized mortgage obligations - private label After 10 years 244 - 13 231 5.45 310
Other Within 1 year 6,584 49 - 6,633 6.04 6,228 After 1 to 5 years 1,750 - - 1,750 3.90 5,490 8,334 49 - 8,383 5.59 11,718 $294,747 $1,024 $5,637 $290,134 4.53% $484,466
Securities not due on a single contractual maturity date, such as collateralized mortgage obligations, are classifi ed in the period of fi nal contractual maturity. The expected maturities of collateralized mortgage obligations and certain other securities may differ from their contractual maturities because they may be subject to prepayments or may be called by the issuer.
The aggregate amortized cost and fair value of investment securities held-to-maturity at December 31, 2009, by contractual maturity, are shown below:
(In thousands) Amortized cost Fair valueWithin 1 year $36,365 $36,375After 1 to 5 years 110,665 113,816After 5 to 10 years 17,112 16,699After 10 years 48,820 46,256Total investment securities held-to-maturity $212,962 $213,146
The following table shows the Corporation’s amortized cost, gross unrealized losses and fair value of investment securities held-to-maturity, aggregated by investment category and length of time that individual securities have been in a continuous unrealized loss position, at December 31, 2009 and 2008:
December 31, 2009 Less than 12 months Gross Amortized Unrealized Fair (In thousands) Cost Losses ValueObligations of Puerto Rico, States and political subdivisions $23,095 $1,908 $21,187
12 months or more Gross Amortized Unrealized Fair (In thousands) Cost Losses Value
Obligations of Puerto Rico, States and political subdivisions $38,820 $1,102 $37,718Collateralized mortgage obligations - private label 221 12 209 $39,041 $1,114 $37,927
Total Gross Amortized Unrealized Fair (In thousands) Cost Losses Value
Obligations of Puerto Rico, States and political subdivisions $61,915 $3,010 $58,905Collateralized mortgage obligations - private label 220 12 208 $62,135 $3,022 $59,113
BOA22177_wo18_Popular.indd 119 3/3/2010 10:46:55 AM

120 POPULAR, INC. 2009 ANNUAL REPORT
December 31, 2008 Less than 12 months Gross Amortized Unrealized Fair (In thousands) Cost Losses ValueObligations of Puerto Rico, States and political subdivisions $135,650 $5,452 $130,198Other 250 - 250 $135,900 $5,452 $130,448
12 months or more Gross Amortized Unrealized Fair (In thousands) Cost Losses Value
Obligations of Puerto Rico, States and political subdivisions $9,535 $172 $9,363Collateralized mortgage obligations - private label 244 13 231Other 250 - 250 $10,029 $185 $9,844
Total Gross Amortized Unrealized Fair (In thousands) Cost Losses Value
Obligations of Puerto Rico, States and political subdivisions $145,185 $5,624 $139,561Collateralized mortgage obligations - private label 244 13 231Other 500 - 500 $145,929 $5,637 $140,292
As indicated in Note 7 to these consolidated financial statements, management evaluates investment securities for other-than-temporary (“OTTI”) declines in fair value on a quarterly basis.
The “Obligations of Puerto Rico, States and political subdivisions” classified as held-to-maturity as of December 31, 2009 are primarily associated with securities issued by municipalities of Puerto Rico and are generally not rated by a credit rating agency. The Corporation performs periodic credit quality reviews on these issuers. The decline in fair value as of December 31, 2009 was attributable to changes in interest rates and not credit quality, thus no other-than-temporary decline in value was necessary to be recorded in these held-to-maturity securities at December 31, 2009. At December 31, 2009, the Corporation does not have the intent to sell securities held-to-maturity and it is not more likely than not that the Corporation will have to sell these investment securities prior to recovery of their amortized cost basis.
Note 9 - Pledged assets:At December 31, 2009 and 2008, certain securities and loans were pledged to secure public and trust deposits, assets sold under agreements to repurchase, other borrowings and credit facilities available, derivative positions and loan servicing agreements. The classifi cation and carrying amount of the Corporation’s pledged assets, in which the secured parties are not permitted to sell or repledge the collateral, were as follows:
(In thousands) 2009 2008Investment securities available-for-sale, at fair value $1,923,338 $2,470,591Investment securities held-to-maturity, at amortized cost 125,769 100,000Loans held-for-sale measured at lower of cost or fair value 2,254 35,764Loans held-in-portfolio 8,993,967 8,101,999 $11,045,328 $10,708,354
Pledged securities and loans that the creditor has the right by custom or contract to repledge are presented separately on the consolidated statements of condition.
Note 10 - Loans and allowance for loan losses: The composition of loans held-in-portfolio at December 31, was as follows:
(In thousands) 2009 2008Loans secured by real estate: Insured or guaranteed by the U.S. Government or its agencies $301,611 $185,796 Guaranteed by the Commonwealth of Puerto Rico 184,853 131,418 Commercial loans secured by real estate 7,983,486 7,973,500 Residential conventional mortgages 4,092,526 4,110,953 Construction and land development 1,796,577 2,400,230 Consumer loans secured by real estate 1,029,534 1,251,206 15,388,587 16,053,103Depository institutions 6,705 10,061Commercial, industrial and agricultural 3,706,087 4,605,815Lease fi nancing 785,659 872,653Consumer for household, credit cards and other consumer expenditures 3,021,717 3,403,822Obligations of states and political subdivisions 613,127 507,188Other 305,381 404,595 $23,827,263 $25,857,237
At December 31, 2009, loans on which the accrual of interest income had been discontinued amounted to $2.3 billion (2008 - $1.2 billion; 2007 - $771 million). If these loans had been accruing interest, the additional interest income realized would have been approximately $60.0 million (2008 - $48.7 million;
BOA22177_wo18_Popular.indd 120 3/3/2010 10:46:55 AM

121
2007 - $71.0 million). Non-accruing loans at December 31, 2009 include $64 million (2008 - $68 million; 2007 - $49 million) in consumer loans.
The commercial, construction and mortgage loans that were considered impaired based on ASC Section 310-10-35 at December 31, 2009 and 2008, and the related disclosures are as follows:
December 31,(In thousands) 2009 2008Impaired loans with a related allowance $1,263,298 $664,852Impaired loans that do not require allowance 410,323 232,712 Total impaired loans $1,673,621 $897,564Allowance for impaired loans $323,887 $194,722Average balance of impaired loans during the year $1,339,438 $619,073Interest income recognized on impaired loans during the year $16,939 $8,834
Troubled debt restructurings amounted to $601 million at December 31, 2009, which included commercial, construction and mortgage loans which had been renegotiated at below-market interest rates or which other concessions were granted. The amount of outstanding commitments to lend additional funds to debtors owing receivables whose terms have been modifi ed in troubled debt restructurings amounted to $61 million at December 31, 2009, which consisted of $1 million for commercial loans and $60 million for construction loans.
The changes in the allowance for loan losses for the year ended December 31, were as follows:
(In thousands) 2009 2008 2007Balance at beginning of year $882,807 $548,832 $522,232Net allowances acquired - - 7,290Provision for loan losses 1,405,807 991,384 341,219Recoveries 68,537 45,540 57,904Charge-offs (1,095,947) (645,504) (308,540)Write-downs related to loans transferred to loans held-for-sale - (12,430) -Change in allowance for loan losses from discontinued operations (a) - (45,015) (71,273)Balance at end of year $1,261,204 $882,807 $548,832(a) A positive amount represents higher provision for loan losses recorded during the period compared to net charge-offs, and vice versa for a negative amount.
The components of the net fi nancing leases receivable at December 31, were:
(In thousands) 2009 2008Total minimum lease payments $613,347 $677,926Estimated residual value of leased property 165,097 188,526Deferred origination costs, net of fees 7,216 6,201 Less - Unearned fi nancing income 110,031 119,450Net minimum lease payments 675,629 753,203 Less - Allowance for loan losses 18,558 21,976 $657,071 $731,227
At December 31, 2009, future minimum lease payments are expected to be received as follows:
(In thousands) 2010 $202,958 2011 159,526 2012 119,552 2013 81,806 2014 and thereafter 49,505 $613,347
Note 11 - Related party transactions:The Corporation grants loans to its directors, executive offi cers and certain related individuals or organizations in the ordinary course of business. The movement and balance of these loans were as follows: Executive(In thousands) Offi cers Directors TotalBalance at December 31, 2007 $4,597 $32,819 $37,416New loans 2,740 27,955 30,695Payments (2,831) (19,435) (22,266)Other changes (24) - (24)Balance at December 31, 2008 $4,482 $41,339 $45,821New loans 4,944 54,639 59,583Payments (3,717) (43,409) (47,126)Other changes (417) - (417)Balance at December 31, 2009 $5,292 $52,569 $57,861
The amounts reported as “other changes” include changes in the status of those who are considered related parties.
Management believes these loans have been consummated on terms no less favorable to the Corporation than those that would have been obtained if the transactions had been with unrelated parties and do not involve more than the normal risk of collection.
At December 31, 2009, the Corporation’s banking subsidiaries held deposits from related parties amounting to $38 million (2008 - $37 million).
From time to time, the Corporation, in the ordinary course of business, obtains services from related parties or makes
BOA22177_wo18_Popular.indd 121 3/3/2010 10:46:55 AM

122 POPULAR, INC. 2009 ANNUAL REPORT
contributions to non-profit organizations that have some association with the Corporation. Management believes the terms of such arrangements are consistent with arrangements entered into with independent third parties.
During 2009, the Corporation engaged, in the ordinary course of business, the legal services of certain law fi rms in Puerto Rico, in which the Secretary of the Board of Directors of Popular, Inc. and immediate family members of a former executive offi cer of the Corporation acted as Senior Counsel or as partners. The fees paid to these law fi rms for fi scal year 2009 amounted to approximately $3.2 million (2008 - $2.4 million). These fees included $0.6 million (2008 - $0.2 million) paid by the Corporation’s clients in connection with commercial loan transactions and $41 thousand (2008 - $27 thousand) paid by mutual funds managed by BPPR. In addition, one of these law fi rms leases offi ce space in the Corporation’s headquarters building, which is owned by BPPR. During 2009, this law fi rm made lease payments of approximately $1 million (2008 - $0.7 million). It also engages BPPR as trustee of its retirement plan and paid approximately $31 thousand for these services in 2009 (2008 - $64 thousand).
For the year ended December 31, 2009, the Corporation made contributions of approximately $0.6 million to Banco Popular Foundations, which are not-for-profi t corporations dedicated to philanthropic work (2008 - $1.8 million). Also, during 2009, the Corporation contributed $135 thousand to a non-profit organization in which a director of the Corporation is the president and trustee (2008 - $150 thousand).
In August 2009, BPPR sold part of the real estate assets and related construction permits, which had been received from a bank commercial customer as part of a workout agreement, to a limited liability corporation (the “LLC”) that is 33.3% owned by a director of the Corporation for $13.5 million. The Bank received two offers from reputable developers and builders, and the LLC offered the higher bid amount. The sale price represented the value of the real estate according to an appraisal report. The transaction was approved by the appropriate committee of the Corporation’s Board of Directors.
Note 12 - Premises and equipment:Premises and equipment are stated at cost less accumulated depreciation and amortization as follows:
Useful life (In thousands) in years 2009 2008 Land $97,260 $97,639Buildings 10-50 440,107 433,986Equipment 3-10 474,606 509,887Leasehold improvements 1-10 95,481 100,901 1,010,194 1,044,774Less - Accumulated depreciation and amortization 578,143 574,264 432,051 470,510Construction in progress 55,542 52,658 $584,853 $620,807
Depreciation and amortization of premises and equipment for the year 2009 was $64.4 million (2008 - $72.4 million; 2007 - $76.2 million), of which $24.1 million (2008 - $26.2 million; 2007 - $26.4 million) was charged to occupancy expense and $40.3 million (2008 - $46.2 million; 2007 - $49.7 million) was charged to equipment, communications and other operating expenses. Occupancy expense is net of rental income of $26.6 million (2008 - $32.1 million; 2007 - $27.5 million).
Note 13 - Servicing assets:The Corporation recognizes as assets the rights to service loans for others, whether these rights are purchased or result from asset transfers such as sales and securitizations.
Classes of mortgage servicing rights were determined based on the different markets or types of assets being serviced. The Corporation recognizes the servicing rights of its banking subsidiaries that are related to residential mortgage loans as a class of servicing rights. These mortgage servicing rights (“MSRs”) are measured at fair value. Prior to November 2008, PFH also held servicing rights to residential mortgage loan portfolios. The MSRs were segregated between loans serviced by the Corporation’s banking subsidiaries and by PFH. PFH no longer services third-party loans due to the discontinuance of the business. The PFH servicing rights were sold in the fourth quarter of 2008. Fair value determination is performed on a subsidiary basis, with assumptions varying in accordance with the types of assets or markets served.
The Corporation uses a discounted cash flow model to estimate the fair value of MSRs. The discounted cash fl ow model incorporates assumptions that market participants would use in estimating future net servicing income, including estimates of prepayment speeds, discount rate, cost to service, escrow account earnings, contractual servicing fee income, prepayment and late
BOA22177_wo18_Popular.indd 122 3/3/2010 10:46:55 AM

123
fees, among other considerations. Prepayment speeds are adjusted for the Corporation’s loan characteristics and portfolio behavior.
The following tables present the changes in MSRs measured using the fair value method for the years ended December 31, 2009 and 2008.
Residential MSRs - 2009 (In thousands) TotalFair value at January 1, 2009 $176,034Purchases 1,364Servicing from securitizations or asset transfers 23,795Changes due to payments on loans (1) (13,293)Changes in fair value due to changes in valuation model inputs or assumptions (18,153)Fair value at December 31, 2009 $169,747(1) Represents changes due to collection / realization of expected cash fl ows over time.
Residential MSRs - 2008 (In thousands) Banking subsidiaries PFH TotalFair value at January 1, 2008 $110,612 $81,012 $191,624Purchases 62,907 - 62,907Servicing from securitizations or asset transfers 28,919 - 28,919Changes due to payments on loans (1) (10,851) (20,298) (31,149)Changes in fair value due to changes in valuation model inputs or assumptions (15,553) (23,896) (39,449)Rights sold - (36,818) (36,818)Fair value at December 31, 2008 $176,034 - $176,034(1) Represents changes due to collection / realization of expected cash fl ows over time.
Residential mortgage loans serviced for others were $17.7 billion at December 31, 2009 (2008 - $17.6 billion).
Net mortgage servicing fees, a component of other service fees in the consolidated statements of operations, include the changes from period to period in the fair value of the MSRs, which may result from changes in the valuation model inputs or assumptions (principally refl ecting changes in discount rates and prepayment speed assumptions) and other changes, including changes due to collection / realization of expected cash fl ows. Mortgage servicing fees, excluding fair value adjustments, for the year ended December 31, 2009 amounted to $46.5 million (2008 - $31.8 million; 2007 - $26.0 million). The banking subsidiaries receive servicing fees based on a percentage of the outstanding loan balance. At December 31, 2009 and December 31, 2008, those weighted average mortgage servicing fees were 0.26%. Under these servicing agreements, the banking subsidiaries do not generally earn signifi cant prepayment penalty fees on the underlying loans serviced.
The section below includes information on assumptions used in the valuation model of the MSRs, originated and purchased.
Banking subsidiariesThe Corporation’s banking subsidiaries retain servicing responsibilities on the sale of wholesale mortgage loans and under pooling / selling arrangements of mortgage loans into mortgage-backed securities, primarily GNMA and FNMA securities. Substantially all mortgage loans securitized by the banking subsidiaries have fi xed rates.
During the year ended December 31, 2009, the Corporation retained servicing rights on guaranteed mortgage securitizations (FNMA and GNMA) and whole loan sales involving approximately $1.4 billion (2008 - $1.8 billion) in principal balance outstanding. Gains of approximately $24.6 million were realized on these transactions during the year ended December 31, 2009 (2008 - $58.9 million).
Key economic assumptions used in measuring the servicing rights retained at the date of the residential mortgage loan securitizations and whole loan sales by the banking subsidiaries during the years ended December 31, were as follows:
Residential Mortgage SBA Loans Loans 2009 2008 2009 2008Prepayment speed 7.8% 11.6% - 18.1% to 18.6%Weighted average life 12.8 years 8.6 years - 2.8 yearsDiscount rate (annual rate) 11.0% 11.3% - 13.0%
Key economic assumptions used to estimate the fair value of MSRs derived from sales and securitizations of mortgage loans performed by the banking subsidiaries and the sensitivity to immediate changes in those assumptions at December 31, 2009 and 2008 were as follows:
Originated MSRs December 31, December 31,
(In thousands) 2009 2008Fair value of retained interests $97,870 $104,614Weighted average life 8.8 years 10.2 yearsWeighted average prepayment speed (annual rate) 11.4% 9.9% Impact on fair value of 10% adverse change ($3,182) ($4,734) Impact on fair value of 20% adverse change ($7,173) ($8,033)Weighted average discount rate (annual rate) 12.41% 11.46% Impact on fair value of 10% adverse change ($2,715) ($3,769) Impact on fair value of 20% adverse change ($6,240) ($6,142)
BOA22177_wo18_Popular.indd 123 3/3/2010 10:46:55 AM
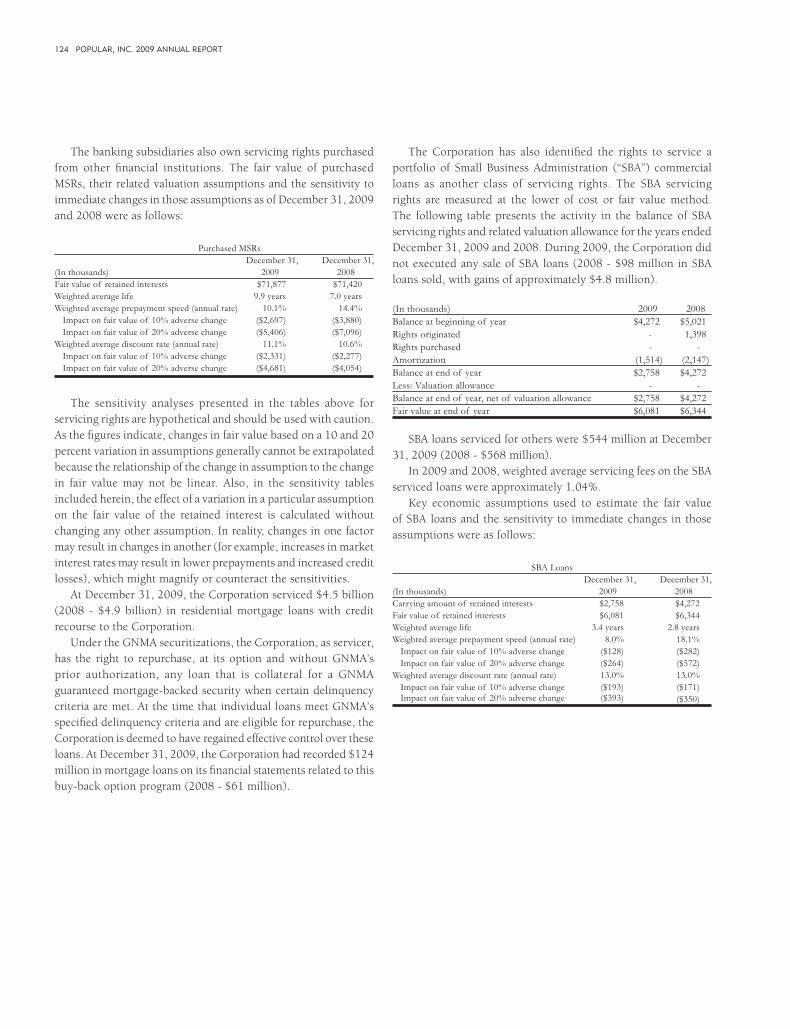
124 POPULAR, INC. 2009 ANNUAL REPORT
The banking subsidiaries also own servicing rights purchased from other fi nancial institutions. The fair value of purchased MSRs, their related valuation assumptions and the sensitivity to immediate changes in those assumptions as of December 31, 2009 and 2008 were as follows:
Purchased MSRs December 31, December 31,
(In thousands) 2009 2008Fair value of retained interests $71,877 $71,420Weighted average life 9.9 years 7.0 yearsWeighted average prepayment speed (annual rate) 10.1% 14.4% Impact on fair value of 10% adverse change ($2,697) ($3,880) Impact on fair value of 20% adverse change ($5,406) ($7,096)Weighted average discount rate (annual rate) 11.1% 10.6% Impact on fair value of 10% adverse change ($2,331) ($2,277) Impact on fair value of 20% adverse change ($4,681) ($4,054)
The sensitivity analyses presented in the tables above for servicing rights are hypothetical and should be used with caution. As the fi gures indicate, changes in fair value based on a 10 and 20 percent variation in assumptions generally cannot be extrapolated because the relationship of the change in assumption to the change in fair value may not be linear. Also, in the sensitivity tables included herein, the effect of a variation in a particular assumption on the fair value of the retained interest is calculated without changing any other assumption. In reality, changes in one factor may result in changes in another (for example, increases in market interest rates may result in lower prepayments and increased credit losses), which might magnify or counteract the sensitivities.
At December 31, 2009, the Corporation serviced $4.5 billion (2008 - $4.9 billion) in residential mortgage loans with credit recourse to the Corporation.
Under the GNMA securitizations, the Corporation, as servicer, has the right to repurchase, at its option and without GNMA’s prior authorization, any loan that is collateral for a GNMA guaranteed mortgage-backed security when certain delinquency criteria are met. At the time that individual loans meet GNMA’s specifi ed delinquency criteria and are eligible for repurchase, the Corporation is deemed to have regained effective control over these loans. At December 31, 2009, the Corporation had recorded $124 million in mortgage loans on its fi nancial statements related to this buy-back option program (2008 - $61 million).
The Corporation has also identifi ed the rights to service a portfolio of Small Business Administration (“SBA”) commercial loans as another class of servicing rights. The SBA servicing rights are measured at the lower of cost or fair value method. The following table presents the activity in the balance of SBA servicing rights and related valuation allowance for the years ended December 31, 2009 and 2008. During 2009, the Corporation did not executed any sale of SBA loans (2008 - $98 million in SBA loans sold, with gains of approximately $4.8 million).
(In thousands) 2009 2008Balance at beginning of year $4,272 $5,021Rights originated - 1,398Rights purchased - -Amortization (1,514) (2,147)Balance at end of year $2,758 $4,272Less: Valuation allowance - -Balance at end of year, net of valuation allowance $2,758 $4,272Fair value at end of year $6,081 $6,344
SBA loans serviced for others were $544 million at December 31, 2009 (2008 - $568 million).
In 2009 and 2008, weighted average servicing fees on the SBA serviced loans were approximately 1.04%.
Key economic assumptions used to estimate the fair value of SBA loans and the sensitivity to immediate changes in those assumptions were as follows:
SBA Loans December 31, December 31,
(In thousands) 2009 2008Carrying amount of retained interests $2,758 $4,272Fair value of retained interests $6,081 $6,344Weighted average life 3.4 years 2.8 yearsWeighted average prepayment speed (annual rate) 8.0% 18.1% Impact on fair value of 10% adverse change ($128) ($282) Impact on fair value of 20% adverse change ($264) ($572)Weighted average discount rate (annual rate) 13.0% 13.0% Impact on fair value of 10% adverse change ($193) ($171) Impact on fair value of 20% adverse change ($393) ($350)
BOA22177_wo18_Popular.indd 124 3/3/2010 10:46:55 AM

125
Quantitative information about delinquencies, net credit losses, and components of securitized fi nancial assets and other assets managed together with them by the Corporation, including its own loan portfolio, for the years ended December 31, 2009 and 2008, were as follows:
2009 Total principal Principal amount amount of loans, 60 days or more Net credit (In thousands) net of unearned past due lossesLoans (owned and managed): Commercial and
construction $14,391,328 $1,861,569 $573,191 Lease fi nancing 675,629 12,416 17,482 Mortgage 9,133,494 1,233,717 121,564 Consumer 4,045,807 149,535 316,131Less: Loans securitized / sold (4,442,349) (401,257) (958) Loans held-for-sale (90,796) - -Loans held-in-portfolio $23,713,113 $2,855,980 $1,027,410
2008 Total principal Principal amount amount of loans, 60 days or more Net credit (In thousands) net of unearned past due lossesLoans (owned and managed): Commercial and
construction $15,909,532 $907,078 $289,836 Lease fi nancing 1,080,810 19,311 18,827 Mortgage 9,524,463 831,950 52,968 Consumer 4,648,784 170,205 238,423Less: Loans securitized / sold (4,894,658) (276,426) (90) Loans held-for-sale (536,058) - -
Loans held-in-portfolio $25,732,873 $1,652,118 $599,964
Note 14 - Goodwill and other intangible assets:The changes in the carrying amount of goodwill for the years ended December 31, 2009 and 2008, allocated by reportable segments, were as follows (refer to Note 39 for the defi nition of the Corporation’s reportable segments):
2009 Balance at Purchase Balance at January 1, Goodwill Impairment accounting December 31,(In thousands) 2009 acquired losses adjustments Other 2009Banco Popular de Puerto Rico: Commercial Banking $31,729 - - - - $31,729 Consumer and Retail Banking 117,000 - - - - 117,000 Other Financial Services 8,330 - - ($34) - 8,296Banco Popular North America: Banco Popular North America 404,237 - - - ($2,159) 402,078 E-LOAN - - - - - -EVERTEC 44,496 - - 750 - 45,246Total Popular, Inc. $605,792 - - $716 ($2,159) $604,349
2008 Balance at Purchase Balance at January 1, Goodwill Impairment accounting December 31,(In thousands) 2008 acquired losses adjustments Other 2008Banco Popular de Puerto Rico: Commercial Banking $35,371 - - ($3,631) ($11) $31,729 Consumer and Retail Banking 136,407 - - (17,794) (1,613) 117,000 Other Financial Services 8,621 $153 - (444) - 8,330Banco Popular North America: Banco Popular North America 404,237 - - - - 404,237 E-LOAN - - - - - -EVERTEC 46,125 - - 785 (2,414) 44,496Total Popular, Inc. $630,761 $153 - ($21,084) ($4,038) $605,792
The gross amount of goodwill and accumulated impairment losses at the beginning and the end of the year by reportable segment were as follows:
2009 Balance at Balance at Balance at Balance at January 1, January 1, December 31, December 31, 2009 Accumulated 2009 2009 Accumulated 2009 (gross impairment (net (gross impairment (net(In thousands) amounts) losses amounts) amounts) losses amounts)Banco Popular de Puerto Rico: Commercial Banking $31,729 - $31,729 $31,729 - $31,729 Consumer and Retail Banking 117,000 - 117,000 117,000 - 117,000 Other Financial Services 8,330 - 8,330 8,296 - 8,296Banco Popular North America: Banco Popular North America 404,237 - 404,237 402,078 - 402,078 E-LOAN 164,411 $164,411 - 164,411 $164,411 -EVERTEC 44,679 183 44,496 45,429 183 45,246Total Popular, Inc. $770,386 $164,594 $605,792 $768,943 $164,594 $604,349
2008 Balance at Balance at Balance at Balance at January 1, January 1, December 31, December 31, 2008 Accumulated 2008 2008 Accumulated 2008 (gross impairment (net (gross impairment (net(In thousands) amounts) losses amounts) amounts) losses amounts)Banco Popular de Puerto Rico: Commercial Banking $35,371 - $35,371 $31,729 - $31,729 Consumer and Retail Banking 136,407 - 136,407 117,000 - 117,000 Other Financial Services 8,621 - 8,621 8,330 - 8,330Banco Popular North America: Banco Popular North America 404,237 - 404,237 404,237 - 404,237 E-LOAN 164,411 $164,411 - 164,411 $164,411 -EVERTEC 46,308 183 46,125 44,679 183 44,496Total Popular, Inc. $795,355 $164,594 $630,761 $770,386 $164,594 $605,792
BOA22177_wo18_Popular.indd 125 3/3/2010 10:46:55 AM
126 POPULAR, INC. 2009 ANNUAL REPORT
For the year ended December 31, 2009, the purchase accounting adjustments in the EVERTEC reportable segment consisted of contingent consideration paid during the contractual contingency period. The $2.2 million included in the “other” category at the BPNA reportable segment represented the assigned goodwill associated with the six New Jersey branches of BPNA that was written-off upon their sale in October 2009.
Purchase accounting adjustments for the year ended December 31, 2008 consisted of adjustments to the value of the assets acquired and liabilities assumed resulting from the completion of appraisals or other valuations, adjustments to initial estimates recorded for transaction costs, if any, and contingent consideration paid during a contractual contingency period. The purchase accounting adjustments at the BPPR reportable segment were mostly related to the acquisition of Citibank’s retail branches in Puerto Rico (acquisition completed in December 2007). The amount included in the “other” category at the BPPR reportable segment was mainly associated with the write-off of Popular Finance’s goodwill since the subsidiary ceased originating loans during the fourth quarter of 2008. The reduction in goodwill in the EVERTEC reportable segment during 2008 was mainly the result of the sale of substantially all assets of EVERTEC’s health processing division during the third quarter of 2008.
The Corporation’s goodwill and other identifi able intangible assets having an indefi nite useful life are tested for impairment. Intangibles with indefi nite lives are evaluated for impairment at least annually and on a more frequent basis if events or circumstances indicate impairment could have taken place. Such events could include, among others, a signifi cant adverse change in the business climate, an adverse action by a regulator, an unanticipated change in the competitive environment and a decision to change the operations or dispose of a reporting unit.
Under applicable accounting standards, goodwill impairment analysis is a two-step test. The fi rst step of the goodwill impairment test involves comparing the fair value of the reporting unit with its carrying amount, including goodwill. If the fair value of the reporting unit exceeds its carrying amount, goodwill of the reporting unit is considered not impaired; however, if the carrying amount of the reporting unit exceeds its fair value, the second step must be performed. The second step involves calculating an implied fair value of goodwill for each reporting unit for which the fi rst step indicated possible impairment. The implied fair value of goodwill is determined in the same manner as the amount of goodwill recognized in a business combination, which is the excess of the fair value of the reporting unit, as determined in the fi rst step, over the aggregate fair values of the individual assets, liabilities and identifi able intangibles (including any unrecognized intangible assets, such as unrecognized core deposits and trademark) as if the reporting unit was being acquired in a business combination and the fair value of the reporting unit was the price paid to
acquire the reporting unit. The Corporation estimates the fair values of the assets and liabilities of a reporting unit, consistent with the requirements of the fair value measurements accounting standard, which defi nes fair value as the price that would be received to sell an asset or paid to transfer a liability in an orderly transaction between market participants at the measurement date. The fair value of the assets and liabilities refl ects market conditions, thus volatility in prices could have a material impact on the determination of the implied fair value of the reporting unit goodwill at the impairment test date. The adjustments to measure the assets, liabilities and intangibles at fair value are for the purpose of measuring the implied fair value of goodwill and such adjustments are not refl ected in the consolidated statement of condition. If the implied fair value of goodwill exceeds the goodwill assigned to the reporting unit, there is no impairment. If the goodwill assigned to a reporting unit exceeds the implied fair value of the goodwill, an impairment charge is recorded for the excess. An impairment loss recognized cannot exceed the amount of goodwill assigned to a reporting unit, and the loss establishes a new basis in the goodwill. Subsequent reversal of goodwill impairment losses is not permitted under applicable accounting standards.
The Corporation performed the annual goodwill impairment evaluation for the entire organization during the third quarter of 2009 using July 31, 2009 as the annual evaluation date. The reporting units utilized for this evaluation were those that are one level below the business segments, which basically are the legal entities that compose the reportable segment. The Corporation follows push-down accounting, as such all goodwill is assigned to the reporting units when carrying out a business combination.
In determining the fair value of a reporting unit, the Corporation generally uses a combination of methods, including market price multiples of comparable companies and transactions, as well as discounted cash fl ow analysis. Management evaluates the particular circumstances of each reporting unit in order to determine the most appropriate valuation methodology. The Corporation evaluates the results obtained under each valuation methodology to identify and understand the key value drivers in order to ascertain that the results obtained are reasonable and appropriate under the circumstances. Elements considered include current market and economic conditions, developments in specifi c lines of business, and any particular features in the individual reporting units.
The computations require management to make estimates and assumptions. Critical assumptions that are used as part of these evaluations include:
• a selection of comparable publicly traded companies, based on nature of business, location and size;
• a selection of comparable acquisition and capital raising transactions;
BOA22177_wo18_Popular.indd 126 3/3/2010 10:46:55 AM
127
• the discount rate applied to future earnings, based on an estimate of the cost of equity;
• the potential future earnings of the reporting unit; and
• the market growth and new business assumptions.For purposes of the market comparable approach, valuations
were determined by calculating average price multiples of relevant value drivers from a group of companies that are comparable to the reporting unit being analyzed and applying those price multiples to the value drivers of the reporting unit. Multiples used are minority based multiples and thus, no control premium adjustment is made to the comparable companies market multiples. While the market price multiple is not an assumption, a presumption that it provides an indicator of the value of the reporting unit is inherent in the valuation. The determination of the market comparables also involves a degree of judgment.
For purposes of the discounted cash fl ows (“DCF”) approach, the valuation is based on estimated future cash fl ows. The fi nancial projections used in the DCF valuation analysis for each reporting unit are based on the most recent (as of the valuation date) fi nancial projections presented to the Corporation’s Asset / Liability Management Committee (“ALCO”). The growth assumptions included in these projections are based on management’s expectations for each reporting unit’s financial prospects considering economic and industry conditions as well as particular plans of each entity (i.e. restructuring plans, de-leveraging, etc.). The cost of equity used to discount the cash fl ows was calculated using the Ibbotson Build-Up Method and ranged from 11.24% to 17.78% for the 2009 analysis. The Ibbottson Build-Up Model builds up a cost of equity starting with the rate of return of a “riskless” asset (10 year U.S. Treasury note) and adds to it additional risk elements such as equity risk premium, size premium, and industry risk premium. The resulting discount rates were analyzed in terms of reasonability given the current market conditions and adjustments were made when necessary.
For BPNA, the only reporting unit that failed Step 1, the Corporation determined the fair value of Step 1 utilizing a market value approach based on a combination of price multiples from comparable companies and multiples from capital raising transactions of comparable companies. The market multiples used included “price to book” and “price to tangible book”. Additionally, the Corporation determined the reporting unit fair value using a DCF analysis based on BPNA’s fi nancial projections, but assigned no weight to it given that the current market approaches provide a more meaningful measure of fair value considering the reporting unit’s fi nancial performance and current market conditions. The Step 1 fair value for BPNA under both valuation approaches (market and DCF) was below the carrying amount of its equity book value as of the valuation date (July 31), requiring the completion of Step 2. In accordance with accounting standards,
the Corporation performed a valuation of all assets and liabilities of BPNA, including any recognized and unrecognized intangible assets, to determine the fair value of BPNA’s net assets. To complete Step 2, the Corporation subtracted from BPNA’s Step 1 fair value the determined fair value of the net assets to arrive at the implied fair value of goodwill. The results of the Step 2 indicated that the implied fair value of goodwill exceeded the goodwill carrying value of $404 million at July 31, 2009, resulting in no goodwill impairment. The reduction in BPNA’s Step 1 fair value was offset by a reduction in the fair value of its net assets, resulting in an implied fair value of goodwill that exceeds the recorded book value of goodwill.
The analysis of the results for Step 2 indicates that the reduction in the fair value of the reporting unit was mainly attributed to the deteriorated fair value of the loan portfolios and not to the fair value of the reporting unit as a going concern entity. The negative performance of the reporting unit is principally related to deteriorated credit quality in its loan portfolio, which agrees with the results of the Step 2 analysis. BPNA’s provision for loan losses, as a stand-alone legal entity, which is the reporting unit level used for the goodwill impairment analysis, amounted to $633.4 million for the year ended December 31, 2009, which represented 115% of BPNA legal entity’s net loss of $552.0 million for that period.
If the Step 1 fair value of BPNA declines further in the future without a corresponding decrease in the fair value of its net assets or if loan discounts improve without a corresponding increase in the Step 1 fair value, the Corporation may be required to record a goodwill impairment charge. The Corporation engaged a third-party valuator to assist management in the annual evaluation of BPNA’s goodwill (including Step 1 and Step 2) as well as BPNA’s loan portfolios as of the July 31, 2009 valuation date. Management discussed the methodologies, assumptions and results supporting the relevant values for conclusions and determined they were reasonable.
Furthermore, as part of the analyses, management performed a reconciliation of the aggregate fair values determined for the reporting units to the market capitalization of Popular, Inc. concluding that the fair value results determined for the reporting units in the July 31, 2009 annual assessment were reasonable.
The goodwill impairment evaluation process requires the Corporation to make estimates and assumptions with regard to the fair value of the reporting units. Actual values may differ signifi cantly from these estimates. Such differences could result in future impairment of goodwill that would, in turn, negatively impact the Corporation’s results of operations and the reporting units where the goodwill is recorded. Declines in the Corporation’s market capitalization increase the risk of goodwill impairment in the future.
Management monitors events or changes in circumstances between annual tests to determine if these events or changes in
BOA22177_wo18_Popular.indd 127 3/3/2010 10:46:55 AM
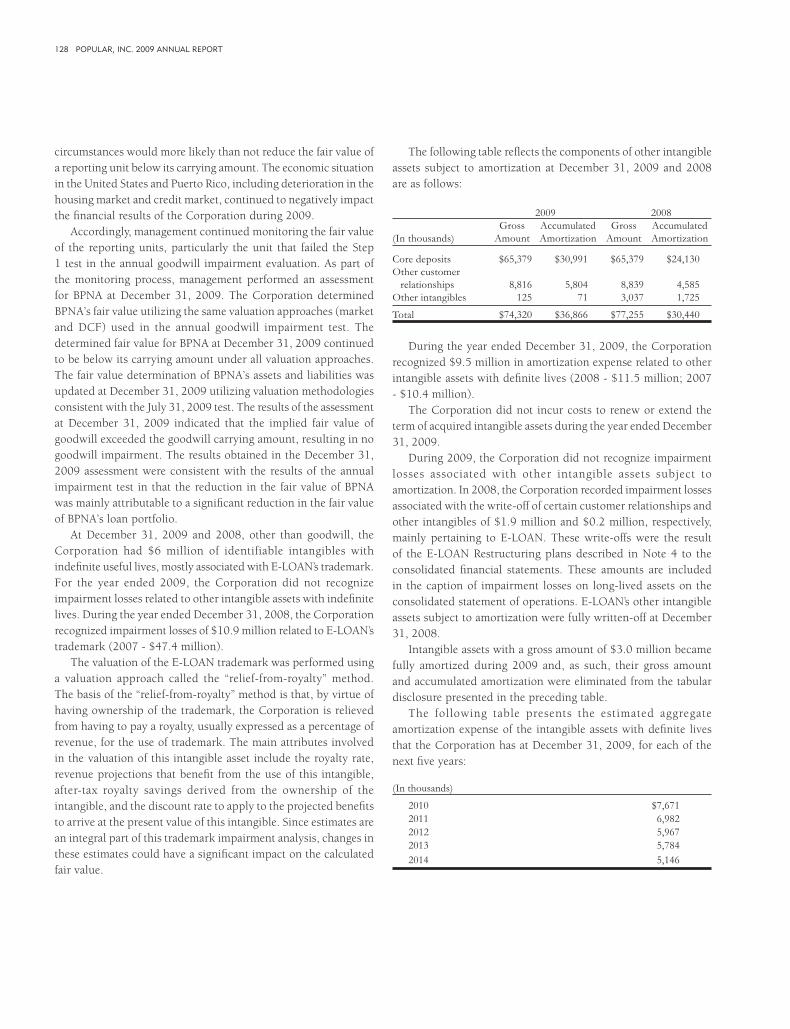
128 POPULAR, INC. 2009 ANNUAL REPORT
circumstances would more likely than not reduce the fair value of a reporting unit below its carrying amount. The economic situation in the United States and Puerto Rico, including deterioration in the housing market and credit market, continued to negatively impact the fi nancial results of the Corporation during 2009.
Accordingly, management continued monitoring the fair value of the reporting units, particularly the unit that failed the Step 1 test in the annual goodwill impairment evaluation. As part of the monitoring process, management performed an assessment for BPNA at December 31, 2009. The Corporation determined BPNA’s fair value utilizing the same valuation approaches (market and DCF) used in the annual goodwill impairment test. The determined fair value for BPNA at December 31, 2009 continued to be below its carrying amount under all valuation approaches. The fair value determination of BPNA’s assets and liabilities was updated at December 31, 2009 utilizing valuation methodologies consistent with the July 31, 2009 test. The results of the assessment at December 31, 2009 indicated that the implied fair value of goodwill exceeded the goodwill carrying amount, resulting in no goodwill impairment. The results obtained in the December 31, 2009 assessment were consistent with the results of the annual impairment test in that the reduction in the fair value of BPNA was mainly attributable to a signifi cant reduction in the fair value of BPNA’s loan portfolio.
At December 31, 2009 and 2008, other than goodwill, the Corporation had $6 million of identifiable intangibles with indefi nite useful lives, mostly associated with E-LOAN’s trademark. For the year ended 2009, the Corporation did not recognize impairment losses related to other intangible assets with indefi nite lives. During the year ended December 31, 2008, the Corporation recognized impairment losses of $10.9 million related to E-LOAN’s trademark (2007 - $47.4 million).
The valuation of the E-LOAN trademark was performed using a valuation approach called the “relief-from-royalty” method. The basis of the “relief-from-royalty” method is that, by virtue of having ownership of the trademark, the Corporation is relieved from having to pay a royalty, usually expressed as a percentage of revenue, for the use of trademark. The main attributes involved in the valuation of this intangible asset include the royalty rate, revenue projections that benefi t from the use of this intangible, after-tax royalty savings derived from the ownership of the intangible, and the discount rate to apply to the projected benefi ts to arrive at the present value of this intangible. Since estimates are an integral part of this trademark impairment analysis, changes in these estimates could have a signifi cant impact on the calculated fair value.
The following table refl ects the components of other intangible assets subject to amortization at December 31, 2009 and 2008 are as follows:
2009 2008 Gross Accumulated Gross Accumulated
(In thousands) Amount Amortization Amount Amortization
Core deposits $65,379 $30,991 $65,379 $24,130Other customer relationships 8,816 5,804 8,839 4,585Other intangibles 125 71 3,037 1,725
Total $74,320 $36,866 $77,255 $30,440
During the year ended December 31, 2009, the Corporation recognized $9.5 million in amortization expense related to other intangible assets with defi nite lives (2008 - $11.5 million; 2007 - $10.4 million).
The Corporation did not incur costs to renew or extend the term of acquired intangible assets during the year ended December 31, 2009.
During 2009, the Corporation did not recognize impairment losses associated with other intangible assets subject to amortization. In 2008, the Corporation recorded impairment losses associated with the write-off of certain customer relationships and other intangibles of $1.9 million and $0.2 million, respectively, mainly pertaining to E-LOAN. These write-offs were the result of the E-LOAN Restructuring plans described in Note 4 to the consolidated fi nancial statements. These amounts are included in the caption of impairment losses on long-lived assets on the consolidated statement of operations. E-LOAN’s other intangible assets subject to amortization were fully written-off at December 31, 2008.
Intangible assets with a gross amount of $3.0 million became fully amortized during 2009 and, as such, their gross amount and accumulated amortization were eliminated from the tabular disclosure presented in the preceding table.
The following table presents the estimated aggregate amortization expense of the intangible assets with defi nite lives that the Corporation has at December 31, 2009, for each of the next fi ve years:
(In thousands)
2010 $7,6712011 6,9822012 5,9672013 5,7842014 5,146
BOA22177_wo18_Popular.indd 128 3/3/2010 10:46:55 AM
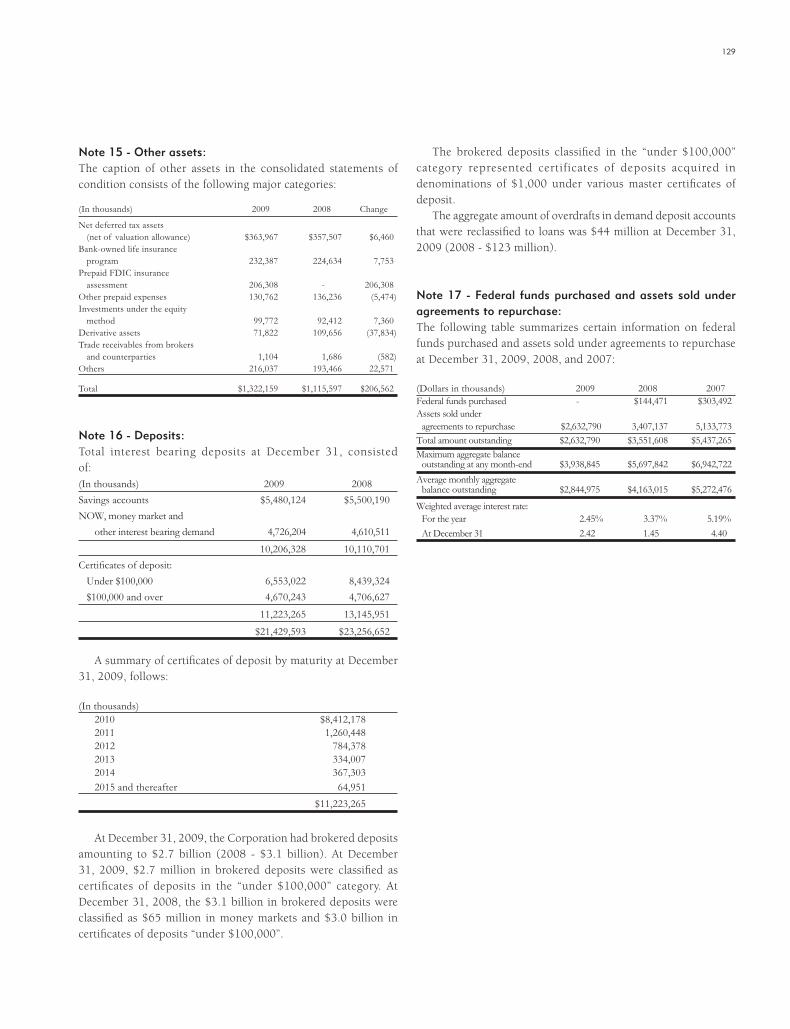
129
Note 15 - Other assets:The caption of other assets in the consolidated statements of condition consists of the following major categories:
(In thousands) 2009 2008 Change
Net deferred tax assets (net of valuation allowance) $363,967 $357,507 $6,460Bank-owned life insurance program 232,387 224,634 7,753Prepaid FDIC insurance assessment 206,308 - 206,308Other prepaid expenses 130,762 136,236 (5,474)Investments under the equity method 99,772 92,412 7,360Derivative assets 71,822 109,656 (37,834)Trade receivables from brokers and counterparties 1,104 1,686 (582)Others 216,037 193,466 22,571
Total $1,322,159 $1,115,597 $206,562
Note 16 - Deposits:Total interest bearing deposits at December 31, consisted of: (In thousands) 2009 2008Savings accounts $5,480,124 $5,500,190NOW, money market and other interest bearing demand 4,726,204 4,610,511
10,206,328 10,110,701Certifi cates of deposit: Under $100,000 6,553,022 8,439,324 $100,000 and over 4,670,243 4,706,627
11,223,265 13,145,951
$21,429,593 $23,256,652
A summary of certifi cates of deposit by maturity at December 31, 2009, follows:
(In thousands)2010 $8,412,1782011 1,260,4482012 784,3782013 334,0072014 367,3032015 and thereafter 64,951 $11,223,265
At December 31, 2009, the Corporation had brokered deposits amounting to $2.7 billion (2008 - $3.1 billion). At December 31, 2009, $2.7 million in brokered deposits were classifi ed as certifi cates of deposits in the “under $100,000” category. At December 31, 2008, the $3.1 billion in brokered deposits were classifi ed as $65 million in money markets and $3.0 billion in certifi cates of deposits “under $100,000”.
The brokered deposits classifi ed in the “under $100,000” category represented certificates of deposits acquired in denominations of $1,000 under various master certifi cates of deposit.
The aggregate amount of overdrafts in demand deposit accounts that were reclassifi ed to loans was $44 million at December 31, 2009 (2008 - $123 million).
Note 17 - Federal funds purchased and assets sold under agreements to repurchase:The following table summarizes certain information on federal funds purchased and assets sold under agreements to repurchase at December 31, 2009, 2008, and 2007:
(Dollars in thousands) 2009 2008 2007Federal funds purchased - $144,471 $303,492 Assets sold under agreements to repurchase $2,632,790 3,407,137 5,133,773Total amount outstanding $2,632,790 $3,551,608 $5,437,265Maximum aggregate balance outstanding at any month-end $3,938,845 $5,697,842 $6,942,722Average monthly aggregate balance outstanding $2,844,975 $4,163,015 $5,272,476
Weighted average interest rate: For the year 2.45% 3.37% 5.19% At December 31 2.42 1.45 4.40
BOA22177_wo18_Popular.indd 129 3/3/2010 10:46:55 AM
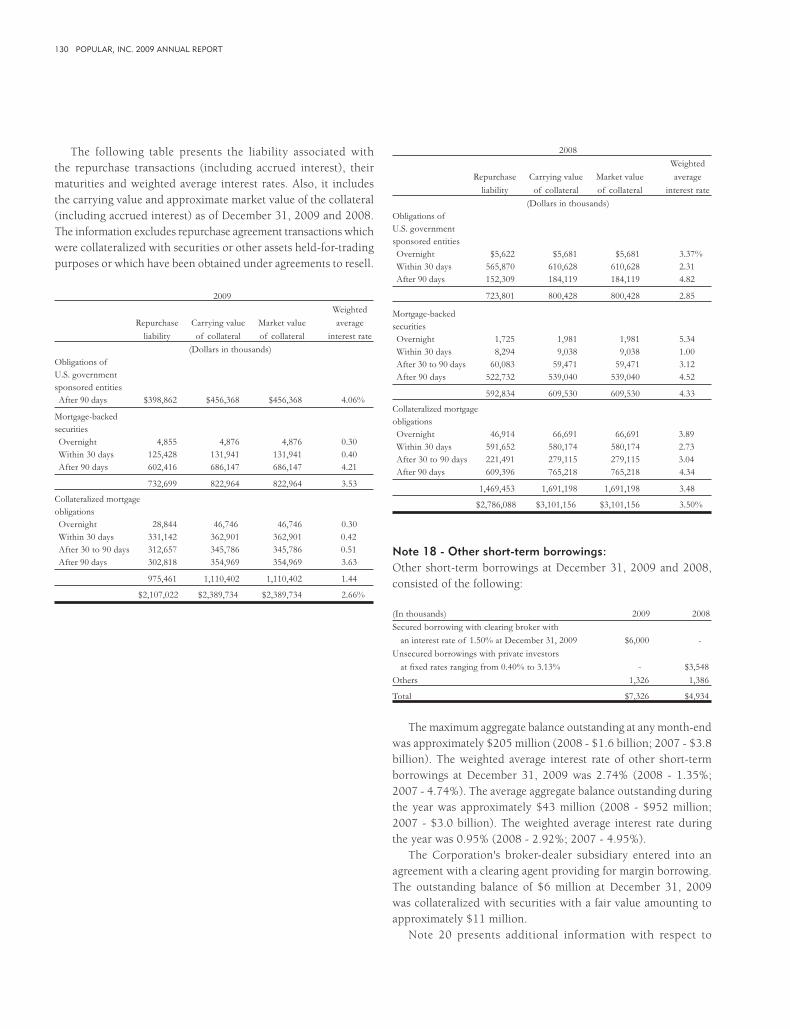
130 POPULAR, INC. 2009 ANNUAL REPORT
The following table presents the liability associated with the repurchase transactions (including accrued interest), their maturities and weighted average interest rates. Also, it includes the carrying value and approximate market value of the collateral (including accrued interest) as of December 31, 2009 and 2008. The information excludes repurchase agreement transactions which were collateralized with securities or other assets held-for-trading purposes or which have been obtained under agreements to resell.
2009 Weighted Repurchase Carrying value Market value average liability of collateral of collateral interest rate (Dollars in thousands)Obligations ofU.S. governmentsponsored entities After 90 days $398,862 $456,368 $456,368 4.06%
Mortgage-backed securities Overnight 4,855 4,876 4,876 0.30 Within 30 days 125,428 131,941 131,941 0.40 After 90 days 602,416 686,147 686,147 4.21
732,699 822,964 822,964 3.53
Collateralized mortgageobligations Overnight 28,844 46,746 46,746 0.30 Within 30 days 331,142 362,901 362,901 0.42 After 30 to 90 days 312,657 345,786 345,786 0.51 After 90 days 302,818 354,969 354,969 3.63
975,461 1,110,402 1,110,402 1.44
$2,107,022 $2,389,734 $2,389,734 2.66%
2008 Weighted Repurchase Carrying value Market value average liability of collateral of collateral interest rate (Dollars in thousands)Obligations ofU.S. governmentsponsored entities Overnight $5,622 $5,681 $5,681 3.37% Within 30 days 565,870 610,628 610,628 2.31 After 90 days 152,309 184,119 184,119 4.82
723,801 800,428 800,428 2.85
Mortgage-backed securities Overnight 1,725 1,981 1,981 5.34 Within 30 days 8,294 9,038 9,038 1.00 After 30 to 90 days 60,083 59,471 59,471 3.12 After 90 days 522,732 539,040 539,040 4.52
592,834 609,530 609,530 4.33
Collateralized mortgageobligations Overnight 46,914 66,691 66,691 3.89 Within 30 days 591,652 580,174 580,174 2.73 After 30 to 90 days 221,491 279,115 279,115 3.04 After 90 days 609,396 765,218 765,218 4.34
1,469,453 1,691,198 1,691,198 3.48
$2,786,088 $3,101,156 $3,101,156 3.50%
Note 18 - Other short-term borrowings:Other short-term borrowings at December 31, 2009 and 2008, consisted of the following:
(In thousands) 2009 2008Secured borrowing with clearing broker with an interest rate of 1.50% at December 31, 2009 $6,000 -Unsecured borrowings with private investors at fi xed rates ranging from 0.40% to 3.13% - $3,548Others 1,326 1,386
Total $7,326 $4,934
The maximum aggregate balance outstanding at any month-end was approximately $205 million (2008 - $1.6 billion; 2007 - $3.8 billion). The weighted average interest rate of other short-term borrowings at December 31, 2009 was 2.74% (2008 - 1.35%; 2007 - 4.74%). The average aggregate balance outstanding during the year was approximately $43 million (2008 - $952 million; 2007 - $3.0 billion). The weighted average interest rate during the year was 0.95% (2008 - 2.92%; 2007 - 4.95%).
The Corporation's broker-dealer subsidiary entered into an agreement with a clearing agent providing for margin borrowing. The outstanding balance of $6 million at December 31, 2009 was collateralized with securities with a fair value amounting to approximately $11 million.
Note 20 presents additional information with respect to
BOA22177_wo18_Popular.indd 130 3/3/2010 10:46:55 AM
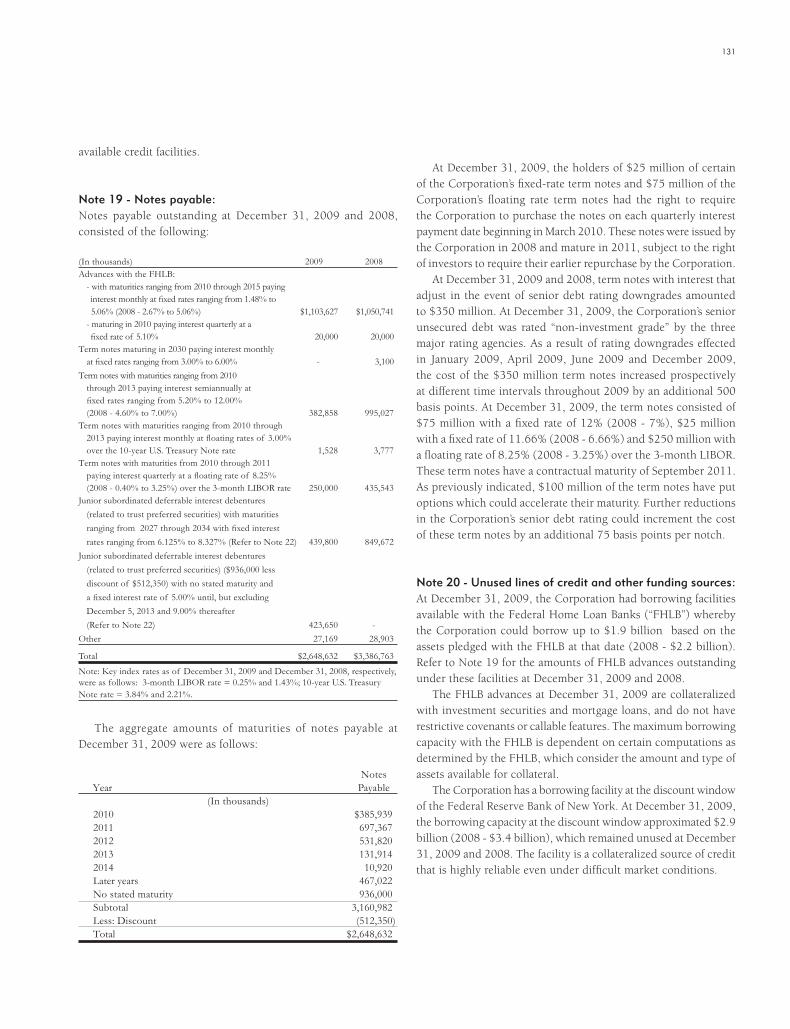
131
available credit facilities.
Note 19 - Notes payable:Notes payable outstanding at December 31, 2009 and 2008, consisted of the following:
(In thousands) 2009 2008Advances with the FHLB: - with maturities ranging from 2010 through 2015 paying interest monthly at fi xed rates ranging from 1.48% to 5.06% (2008 - 2.67% to 5.06%) $1,103,627 $1,050,741 - maturing in 2010 paying interest quarterly at a fi xed rate of 5.10% 20,000 20,000Term notes maturing in 2030 paying interest monthly at fi xed rates ranging from 3.00% to 6.00% - 3,100Term notes with maturities ranging from 2010 through 2013 paying interest semiannually at fi xed rates ranging from 5.20% to 12.00% (2008 - 4.60% to 7.00%) 382,858 995,027Term notes with maturities ranging from 2010 through 2013 paying interest monthly at fl oating rates of 3.00% over the 10-year U.S. Treasury Note rate 1,528 3,777Term notes with maturities from 2010 through 2011 paying interest quarterly at a fl oating rate of 8.25% (2008 - 0.40% to 3.25%) over the 3-month LIBOR rate 250,000 435,543Junior subordinated deferrable interest debentures (related to trust preferred securities) with maturities ranging from 2027 through 2034 with fi xed interest rates ranging from 6.125% to 8.327% (Refer to Note 22) 439,800 849,672Junior subordinated deferrable interest debentures (related to trust preferred securities) ($936,000 less discount of $512,350) with no stated maturity and a fi xed interest rate of 5.00% until, but excluding December 5, 2013 and 9.00% thereafter (Refer to Note 22) 423,650 -Other 27,169 28,903
Total $2,648,632 $3,386,763
Note: Key index rates as of December 31, 2009 and December 31, 2008, respectively, were as follows: 3-month LIBOR rate = 0.25% and 1.43%; 10-year U.S. Treasury Note rate = 3.84% and 2.21%.
The aggregate amounts of maturities of notes payable at December 31, 2009 were as follows:
Notes Year Payable (In thousands) 2010 $385,939 2011 697,367 2012 531,820 2013 131,914 2014 10,920 Later years 467,022 No stated maturity 936,000 Subtotal 3,160,982 Less: Discount (512,350) Total $2,648,632
At December 31, 2009, the holders of $25 million of certain of the Corporation’s fi xed-rate term notes and $75 million of the Corporation’s fl oating rate term notes had the right to require the Corporation to purchase the notes on each quarterly interest payment date beginning in March 2010. These notes were issued by the Corporation in 2008 and mature in 2011, subject to the right of investors to require their earlier repurchase by the Corporation.
At December 31, 2009 and 2008, term notes with interest that adjust in the event of senior debt rating downgrades amounted to $350 million. At December 31, 2009, the Corporation’s senior unsecured debt was rated “non-investment grade” by the three major rating agencies. As a result of rating downgrades effected in January 2009, April 2009, June 2009 and December 2009, the cost of the $350 million term notes increased prospectively at different time intervals throughout 2009 by an additional 500 basis points. At December 31, 2009, the term notes consisted of $75 million with a fi xed rate of 12% (2008 - 7%), $25 million with a fi xed rate of 11.66% (2008 - 6.66%) and $250 million with a fl oating rate of 8.25% (2008 - 3.25%) over the 3-month LIBOR. These term notes have a contractual maturity of September 2011. As previously indicated, $100 million of the term notes have put options which could accelerate their maturity. Further reductions in the Corporation’s senior debt rating could increment the cost of these term notes by an additional 75 basis points per notch.
Note 20 - Unused lines of credit and other funding sources:At December 31, 2009, the Corporation had borrowing facilities available with the Federal Home Loan Banks (“FHLB”) whereby the Corporation could borrow up to $1.9 billion based on the assets pledged with the FHLB at that date (2008 - $2.2 billion). Refer to Note 19 for the amounts of FHLB advances outstanding under these facilities at December 31, 2009 and 2008.
The FHLB advances at December 31, 2009 are collateralized with investment securities and mortgage loans, and do not have restrictive covenants or callable features. The maximum borrowing capacity with the FHLB is dependent on certain computations as determined by the FHLB, which consider the amount and type of assets available for collateral.
The Corporation has a borrowing facility at the discount window of the Federal Reserve Bank of New York. At December 31, 2009, the borrowing capacity at the discount window approximated $2.9 billion (2008 - $3.4 billion), which remained unused at December 31, 2009 and 2008. The facility is a collateralized source of credit that is highly reliable even under diffi cult market conditions.
BOA22177_wo18_Popular.indd 131 3/3/2010 10:46:55 AM

132 POPULAR, INC. 2009 ANNUAL REPORT
Note 21 - Exchange Offers:In June 2009, the Corporation commenced an offer to issue shares of its common stock in exchange for its Series A preferred stock and Series B preferred stock and for trust preferred securities (also referred as capital securities). On August 25, 2009, the Corporation completed the settlement of the exchange offer and issued over 357 million new shares of common stock.
Exchange of preferred stock for common stockThe exchange by holders of shares of the Series A and B non-
cumulative preferred stock for shares of common stock resulted in the extinguishment of such shares of preferred stock and an issuance of shares of common stock.
In accordance with the terms of the exchange offer, the Corporation used a relevant price of $2.50 per share of its common stock and an exchange ratio of 80% of the preferred stock liquidation value to determine the number of shares of its common stock issued in exchange for the tendered shares of Series A and B preferred stock. The fair value of the common stock was $1.71 per share, which was the price at August 20, 2009, the expiration date of the exchange offer. The carrying (liquidation) value of each share of Series A and B preferred stock exchanged was reduced and common stock and surplus increased in the amount of the fair value of the common stock issued. The Corporation recorded the par amount of the shares issued as common stock ($0.01 per common share). The excess of the common stock fair value over the par amount was recorded in surplus. The excess of the carrying amount of the shares of preferred stock over the fair value of the shares of common stock was recorded as a reduction to accumulated defi cit and an increase in income (loss) per common share (“EPS”) computations.
The results of the exchange offer with respect to the Series A and B preferred stock were as follows:
Aggregate Shares of Shares of liquidation preferred preferred preference Shares Per security stock Shares of stock amount of liquidation outstanding preferred outstanding after commonTitle of preference prior to stock after exchange stocksecurities amount exchange exchanged exchange (in thousands) issued6.375%Non-cumulativemonthlyincomepreferredstock, 2003Series A $25 7,475,000 6,589,274 885,726 $22,143 52,714,1928.25%Non-cumulativemonthlyincomepreferredstock,Series B $25 16,000,000 14,879,335 1,120,665 $28,017 119,034,680
The exchange of shares of preferred stock for shares of common stock resulted in a favorable impact to accumulated defi cit of $230.4 million, which is also considered in the income (loss) per common share computations. Refer to Note 24 to the consolidated fi nancial statements for a reconciliation of EPS.
Common stock issued in connection with early extinguishment of debt (exchange of trust preferred securities for common stock)
Also, during the third quarter of 2009, the Corporation exchanged trust preferred securities (also referred to as capital securities) issued by different trusts for shares of common stock of the Corporation. Refer to the table that follows for a list of such securities and trusts. The trust preferred securities were delivered to the trusts in return for the junior subordinated debentures (recorded as notes payable in the Corporation’s fi nancial statements) that had been issued by the Corporation to the trusts in the past. The junior subordinated debentures were submitted for cancellation by the indenture trustee under the applicable indenture. The Corporation recognized a pre-tax gain of $80.3 million on the extinguishment of the applicable junior subordinated debentures, which was included in the consolidated statement of operations for the year ended December 31, 2009. This transaction was accounted for as an early extinguishment of debt.
In accordance with the terms of the exchange offer, the Corporation used a relevant price of $2.50 per share of its common stock and the exchange ratios referred to in the table that follows to determine the number of shares of its common stock issued in exchange for the validly tendered trust preferred securities. The fair value of the common stock was $1.71 per share, which was the price at August 20, 2009, the expiration date of the exchange offer. The carrying value of the junior subordinated debentures was reduced and common stock and surplus increased in the amount of the fair value of the common stock issued. The Corporation recorded the par amount of the shares issued as common stock ($0.01 per common share). The excess of the common stock fair
BOA22177_wo18_Popular.indd 132 3/3/2010 10:46:56 AM

133
value over the par amount was recorded in surplus. The excess of the carrying amount of the junior subordinated debentures retired over the fair value of the common stock issued was recorded as a gain on early extinguishment of debt in the consolidated statement of operations for the year ended December 31, 2009.
6.564% TRUPS 6.70% (issued by) 6.125% 8.327% TRUPS Popular TRUPS TRUPS (issued by North (issued by (issued by Popular America Popular BanPonce Capital Capital Capital Trust I) Trust I) Trust I) Trust II)Liquidation preference amount per TRUPS $1,000 $25 $1,000 $25TRUPS exchange value $1,150 $30 $1,150 $30 or 115% or 120% or 115% or 120%TRUPS outstanding prior to exchange 144,000 12,000,000 250,000 5,200,000TRUPS exchanged for common stock 91,135 4,757,480 158,349 1,159,080TRUPS outstanding after exchange 52,865 7,242,520 91,651 4,040,920Aggregate liquidation preference amount of TRUPS after exchange (In thousands) $52,865 $181,063 $91,651 $101,023Aggregate liquidation preference amount of junior subordinated debentures after exchange (In thousands) $54,502 $186,664 $94,486 $104,148
The increase in stockholders’ equity related to the exchange of trust preferred securities for shares of common stock was approximately $390 million, net of issuance costs, and including the aforementioned gain on the early extinguishment of debt.
Exchange of preferred stock held by the U.S. Treasury for trust preferred securities
Also, on August 21, 2009, the Corporation and Popular Capital Trust III entered into an exchange agreement with the United States Department of the Treasury (“U.S. Treasury”) pursuant to which the U.S. Treasury agreed with the Corporation that the U.S. Treasury would exchange all 935,000 shares of the Corporation’s outstanding Fixed Rate Cumulative Perpetual Preferred Stock, Series C, $1,000 liquidation preference per share (the “Series C Preferred Stock”), owned by the U.S Treasury for 935,000 newly issued trust preferred securities, $1,000 liquidation amount per capital security. The trust preferred securities were issued to the U.S. Treasury on August 24, 2009. In connection with this exchange, the trust used the Series C preferred stock, together with the proceeds of the issuance and sale by the trust to the Corporation of $1 million aggregate liquidation amount of its fi xed rate common securities, to purchase $936 million aggregate principal amount of the junior subordinated debentures issued by the Corporation.
The trust preferred securities issued to the U.S. Treasury have
a distribution rate of 5% until, but excluding December 5, 2013, and 9% thereafter (which is the same as the dividend rate on the Series C Preferred Stock). The common securities of the trust, in the amount of $1 million, are held by the Corporation.
The sole asset and only source of funds to make payments on the trust preferred securities and the common securities of the trust is $936 million of Popular’s Fixed Rate Perpetual Junior Subordinated Debentures, Series A, issued by the Corporation to the trust. These debentures have an interest rate of 5% until, but excluding December 5, 2013, and 9% thereafter. The debentures are perpetual and may be redeemed by the Corporation at any time, subject to the consent of the Board of Governors of the Federal Reserve System.
Under the guarantee agreement dated as of August 24, 2009, the Corporation irrevocably and unconditionally agrees to pay in full to the holders of the trust preferred securities the guarantee payments, as and when due. The Corporation’s obligation to make the guaranteed payment may be satisfi ed by direct payment of the required amounts to the holders of the trust preferred securities or by causing the issuer trust to pay such amounts to the holders. The obligations of the Corporation under the guarantee agreement constitute unsecured obligations and rank subordinate and junior in right of payment to all senior debt. The obligations of the Corporation under the guarantee agreement rank pari passu with the obligations of Popular under any similar guarantee agreements issued by the Corporation on behalf of the holders of preferred or capital securities issued by any statutory trust, among others stated in the guarantee agreement. Under the guarantee agreement, the Corporation has guaranteed the payment of the liquidation amount of the trust preferred securities upon liquidation of the trust, but only to the extent that the trust has funds available to make such payments.
Under the exchange agreement, the Corporation’s agreement stated that, without the consent of the U.S. Treasury, it would not increase its dividend rate per share of common stock above that in effect as of October 14, 2008 or repurchase shares of its common stock until, in each case, the earlier of December 5, 2011 or such time as all of the new trust preferred securities have been redeemed or transferred by the U.S. Treasury, remains in effect.
The warrant to purchase 20,932,836 shares of Popular’s common stock at an exercise price of $6.70 per share that was initially issued to the U.S Treasury in connection with the issuance of the Series C preferred stock on December 5, 2008 remains outstanding without amendment.
The trust preferred securities issued to the U.S. Treasury qualify as Tier 1 regulatory capital subject to the 25% limitation on Tier 1 capital.
The Corporation paid an exchange fee of $13 million to the U.S. Treasury in connection with the exchange of outstanding shares of Series C preferred stock for the new trust preferred securities.
BOA22177_wo18_Popular.indd 133 3/3/2010 10:46:56 AM

134 POPULAR, INC. 2009 ANNUAL REPORT
This exchange fee will be amortized through interest expense using the interest yield method over the estimated life of the junior subordinated debentures.
This transaction with the U.S. Treasury was accounted for as an extinguishment of previously issued Series C preferred stock. The accounting impact of this transaction included (1) recognition of junior subordinated debentures and derecognition of the Series C preferred stock; (2) recognition of a favorable impact to accumulated defi cit resulting from the excess of (a) the carrying amount of the securities exchanged (the Series C preferred stock) over (b) the fair value of the consideration exchanged (the trust preferred securities); (3) the reversal of any unamortized discount outstanding on the Series C preferred stock; and (4) recognition of issuance costs. The reduction in total stockholders’ equity related to the U.S. Treasury exchange transaction at the exchange rate was approximately $416 million, which was principally impacted by the reduction of $935 million of aggregate liquidation preference value of the Series C preferred stock, partially offset by the $519 million discount on the junior subordinated debentures described in item (2) above. This discount as well as the debt issue costs will be amortized through interest expense using the interest yield method over the estimated life of the junior subordinated debentures. During 2009, the Corporation recognized $7 million in interest expense associated with the accretion of the discount on these debentures.
This particular exchange resulted in a favorable impact to accumulated defi cit on the exchange date of $485.3 million, which is also considered in the income (loss) per common share computations. Refer to Note 24 to the consolidated fi nancial statements for a reconciliation of EPS.
The fair value of the trust preferred securities (junior subordinated debentures for purposes of the Corporation’s fi nancial statements) at the date of the exchange agreement was determined internally using a discounted cash fl ow model. The main considerations were (1) quarterly interest payment of 5% until, but excluding December 5, 2013, and 9% thereafter; (2) assumed maturity date of 30 years; and (3) assumed discount rate of 16%. The assumed discount rate used for estimating the fair value was estimated by obtaining the yields at which comparably-rated issuers were trading in the market and considering the amount of trust preferred securities issued to the U.S. Treasury and the credit rating of the Corporation.
Note 22 – Trust preferred securities: At December 31, 2009 and 2008, the Corporation had established four trusts (BanPonce Trust I, Popular Capital Trust I, Popular North America Capital Trust I and Popular Capital Trust II) for the purpose of issuing trust preferred securities (also referred to as “capital securities”) to the public. The proceeds from such
issuances, together with the proceeds of the related issuances of common securities of the trusts (the “common securities”), were used by the trusts to purchase junior subordinated deferrable interest debentures (the “junior subordinated debentures”) issued by the Corporation. The amounts outstanding in each of the four trusts at December 31, 2009 were impacted by the exchange offers described in Note 21 to the consolidated fi nancial statements.
Also, as described in Note 21, in August 2009, the Corporation established the Popular Capital Trust III for the purpose of exchanging the shares of Popular, Inc.’s Series C preferred stock held by the U.S. Treasury for trust preferred securities issued by this trust. In connection with this exchange, the trust used the Series C preferred stock, together with the proceeds of the issuance and sale of common securities of the trust (the “common securities”), to purchase junior subordinated deferrable interest debentures (the “junior subordinated debentures”) issued by the Corporation.
Refer to Note 21 to the consolidated fi nancial statements for further information on the impact of the exchange transactions on the trust preferred securities.
The sole assets of the five trusts consisted of the junior subordinated debentures of the Corporation and the related accrued interest receivable. These trusts are not consolidated by the Corporation pursuant to accounting principles generally accepted in the United States of America.
The junior subordinated debentures are included by the Corporation as notes payable in the consolidated statements of condition, while the common securities issued by the issuer trusts are included as other investment securities. The common securities of each trust are wholly-owned, or indirectly wholly-owned, by the Corporation.
Financial data pertaining to the trusts at December 31, 2009 was as follows:
(Dollars in thousands) Popular North BanPonce Popular Capital America Capital Popular Capital Popular CapitalIssuer Trust I Trust I Trust I Trust II Trust III Capital securities $52,865 $181,063 $91,651 $101,023 $935,000Distribution rate 8.327% 6.700% 6.564% 6.125% 5.000% until, but excluding December 5, 2013 and 9.000% thereafterCommon securities $1,637 $5,601 $2,835 $3,125 $1,000Junior subordinated debentures aggregate liquidation amount $54,502 $186,664 $94,486 $104,148 $936,000Stated maturity date February 2027 November 2033 September 2034 December 2034 PerpetualReference notes (a),(c),(f),(g) (b),(d),(f) (a),(c),(f) (b),(d),(f) (b), (d), (h), (i)
BOA22177_wo18_Popular.indd 134 3/3/2010 10:46:56 AM
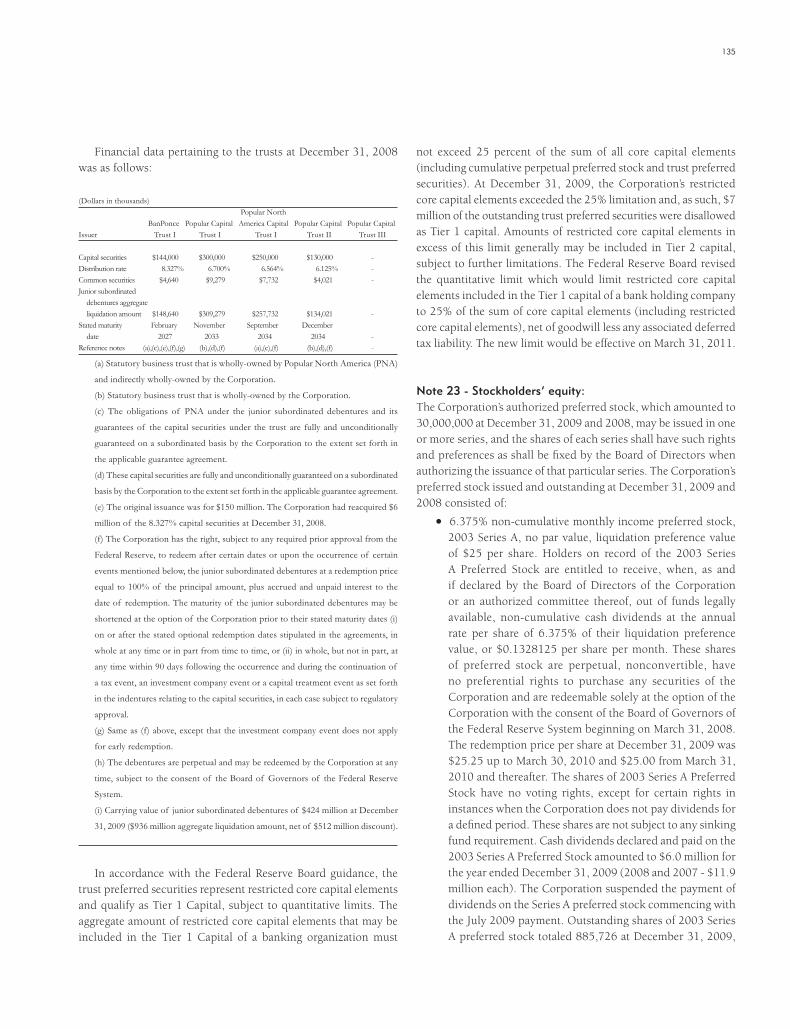
135
Financial data pertaining to the trusts at December 31, 2008 was as follows:
(Dollars in thousands) Popular North BanPonce Popular Capital America Capital Popular Capital Popular CapitalIssuer Trust I Trust I Trust I Trust II Trust III Capital securities $144,000 $300,000 $250,000 $130,000 -Distribution rate 8.327% 6.700% 6.564% 6.125% -Common securities $4,640 $9,279 $7,732 $4,021 -Junior subordinated debentures aggregate liquidation amount $148,640 $309,279 $257,732 $134,021 -Stated maturity February November September December date 2027 2033 2034 2034 -Reference notes (a),(c),(e),(f),(g) (b),(d),(f) (a),(c),(f) (b),(d),(f) -
(a) Statutory business trust that is wholly-owned by Popular North America (PNA)
and indirectly wholly-owned by the Corporation.
(b) Statutory business trust that is wholly-owned by the Corporation.
(c) The obligations of PNA under the junior subordinated debentures and its
guarantees of the capital securities under the trust are fully and unconditionally
guaranteed on a subordinated basis by the Corporation to the extent set forth in
the applicable guarantee agreement.
(d) These capital securities are fully and unconditionally guaranteed on a subordinated
basis by the Corporation to the extent set forth in the applicable guarantee agreement.
(e) The original issuance was for $150 million. The Corporation had reacquired $6
million of the 8.327% capital securities at December 31, 2008.
(f) The Corporation has the right, subject to any required prior approval from the
Federal Reserve, to redeem after certain dates or upon the occurrence of certain
events mentioned below, the junior subordinated debentures at a redemption price
equal to 100% of the principal amount, plus accrued and unpaid interest to the
date of redemption. The maturity of the junior subordinated debentures may be
shortened at the option of the Corporation prior to their stated maturity dates (i)
on or after the stated optional redemption dates stipulated in the agreements, in
whole at any time or in part from time to time, or (ii) in whole, but not in part, at
any time within 90 days following the occurrence and during the continuation of
a tax event, an investment company event or a capital treatment event as set forth
in the indentures relating to the capital securities, in each case subject to regulatory
approval.
(g) Same as (f) above, except that the investment company event does not apply
for early redemption.
(h) The debentures are perpetual and may be redeemed by the Corporation at any
time, subject to the consent of the Board of Governors of the Federal Reserve
System.
(i) Carrying value of junior subordinated debentures of $424 million at December
31, 2009 ($936 million aggregate liquidation amount, net of $512 million discount).
In accordance with the Federal Reserve Board guidance, the trust preferred securities represent restricted core capital elements and qualify as Tier 1 Capital, subject to quantitative limits. The aggregate amount of restricted core capital elements that may be included in the Tier 1 Capital of a banking organization must
not exceed 25 percent of the sum of all core capital elements (including cumulative perpetual preferred stock and trust preferred securities). At December 31, 2009, the Corporation’s restricted core capital elements exceeded the 25% limitation and, as such, $7 million of the outstanding trust preferred securities were disallowed as Tier 1 capital. Amounts of restricted core capital elements in excess of this limit generally may be included in Tier 2 capital, subject to further limitations. The Federal Reserve Board revised the quantitative limit which would limit restricted core capital elements included in the Tier 1 capital of a bank holding company to 25% of the sum of core capital elements (including restricted core capital elements), net of goodwill less any associated deferred tax liability. The new limit would be effective on March 31, 2011.
Note 23 - Stockholders’ equity:The Corporation’s authorized preferred stock, which amounted to 30,000,000 at December 31, 2009 and 2008, may be issued in one or more series, and the shares of each series shall have such rights and preferences as shall be fi xed by the Board of Directors when authorizing the issuance of that particular series. The Corporation’s preferred stock issued and outstanding at December 31, 2009 and 2008 consisted of:
• 6.375% non-cumulative monthly income preferred stock, 2003 Series A, no par value, liquidation preference value of $25 per share. Holders on record of the 2003 Series A Preferred Stock are entitled to receive, when, as and if declared by the Board of Directors of the Corporation or an authorized committee thereof, out of funds legally available, non-cumulative cash dividends at the annual rate per share of 6.375% of their liquidation preference value, or $0.1328125 per share per month. These shares of preferred stock are perpetual, nonconvertible, have no preferential rights to purchase any securities of the Corporation and are redeemable solely at the option of the Corporation with the consent of the Board of Governors of the Federal Reserve System beginning on March 31, 2008. The redemption price per share at December 31, 2009 was $25.25 up to March 30, 2010 and $25.00 from March 31, 2010 and thereafter. The shares of 2003 Series A Preferred Stock have no voting rights, except for certain rights in instances when the Corporation does not pay dividends for a defi ned period. These shares are not subject to any sinking fund requirement. Cash dividends declared and paid on the 2003 Series A Preferred Stock amounted to $6.0 million for the year ended December 31, 2009 (2008 and 2007 - $11.9 million each). The Corporation suspended the payment of dividends on the Series A preferred stock commencing with the July 2009 payment. Outstanding shares of 2003 Series A preferred stock totaled 885,726 at December 31, 2009,
BOA22177_wo18_Popular.indd 135 3/3/2010 10:46:56 AM
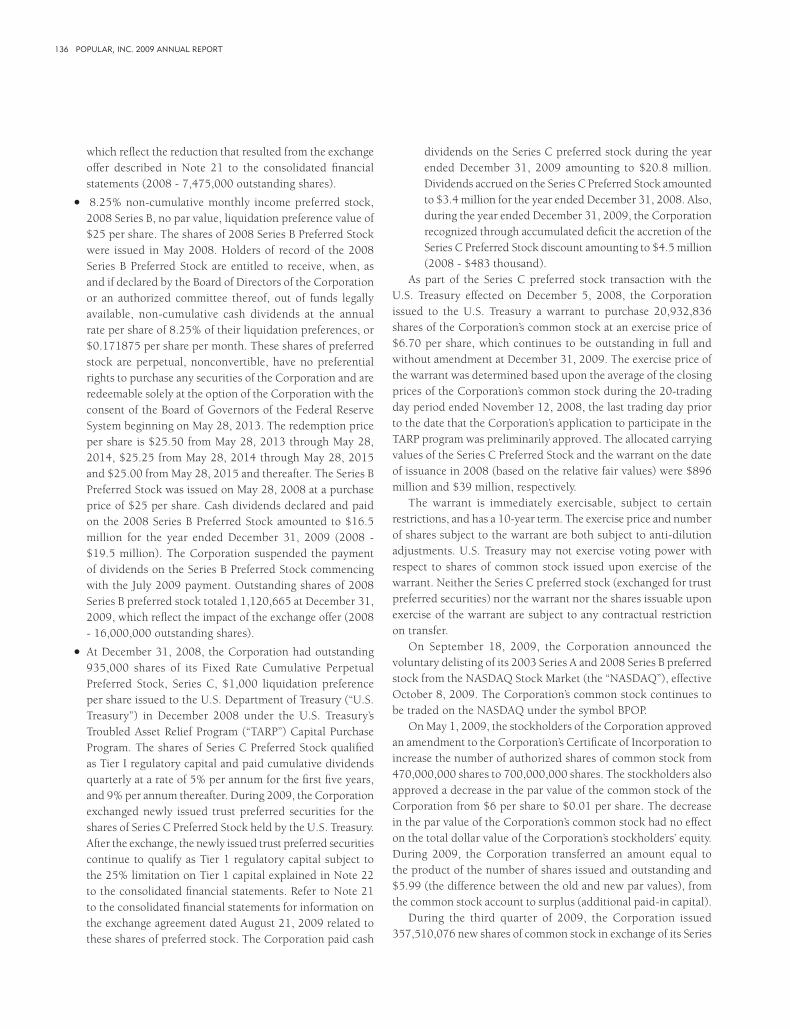
136 POPULAR, INC. 2009 ANNUAL REPORT
which refl ect the reduction that resulted from the exchange offer described in Note 21 to the consolidated fi nancial statements (2008 - 7,475,000 outstanding shares).
• 8.25% non-cumulative monthly income preferred stock, 2008 Series B, no par value, liquidation preference value of $25 per share. The shares of 2008 Series B Preferred Stock were issued in May 2008. Holders of record of the 2008 Series B Preferred Stock are entitled to receive, when, as and if declared by the Board of Directors of the Corporation or an authorized committee thereof, out of funds legally available, non-cumulative cash dividends at the annual rate per share of 8.25% of their liquidation preferences, or $0.171875 per share per month. These shares of preferred stock are perpetual, nonconvertible, have no preferential rights to purchase any securities of the Corporation and are redeemable solely at the option of the Corporation with the consent of the Board of Governors of the Federal Reserve System beginning on May 28, 2013. The redemption price per share is $25.50 from May 28, 2013 through May 28, 2014, $25.25 from May 28, 2014 through May 28, 2015 and $25.00 from May 28, 2015 and thereafter. The Series B Preferred Stock was issued on May 28, 2008 at a purchase price of $25 per share. Cash dividends declared and paid on the 2008 Series B Preferred Stock amounted to $16.5 million for the year ended December 31, 2009 (2008 - $19.5 million). The Corporation suspended the payment of dividends on the Series B Preferred Stock commencing with the July 2009 payment. Outstanding shares of 2008 Series B preferred stock totaled 1,120,665 at December 31, 2009, which refl ect the impact of the exchange offer (2008 - 16,000,000 outstanding shares).
• At December 31, 2008, the Corporation had outstanding 935,000 shares of its Fixed Rate Cumulative Perpetual Preferred Stock, Series C, $1,000 liquidation preference per share issued to the U.S. Department of Treasury (“U.S. Treasury”) in December 2008 under the U.S. Treasury’s Troubled Asset Relief Program (“TARP”) Capital Purchase Program. The shares of Series C Preferred Stock qualifi ed as Tier I regulatory capital and paid cumulative dividends quarterly at a rate of 5% per annum for the fi rst fi ve years, and 9% per annum thereafter. During 2009, the Corporation exchanged newly issued trust preferred securities for the shares of Series C Preferred Stock held by the U.S. Treasury. After the exchange, the newly issued trust preferred securities continue to qualify as Tier 1 regulatory capital subject to the 25% limitation on Tier 1 capital explained in Note 22 to the consolidated fi nancial statements. Refer to Note 21 to the consolidated fi nancial statements for information on the exchange agreement dated August 21, 2009 related to these shares of preferred stock. The Corporation paid cash
dividends on the Series C preferred stock during the year ended December 31, 2009 amounting to $20.8 million. Dividends accrued on the Series C Preferred Stock amounted to $3.4 million for the year ended December 31, 2008. Also, during the year ended December 31, 2009, the Corporation recognized through accumulated defi cit the accretion of the Series C Preferred Stock discount amounting to $4.5 million (2008 - $483 thousand).
As part of the Series C preferred stock transaction with the U.S. Treasury effected on December 5, 2008, the Corporation issued to the U.S. Treasury a warrant to purchase 20,932,836 shares of the Corporation’s common stock at an exercise price of $6.70 per share, which continues to be outstanding in full and without amendment at December 31, 2009. The exercise price of the warrant was determined based upon the average of the closing prices of the Corporation’s common stock during the 20-trading day period ended November 12, 2008, the last trading day prior to the date that the Corporation’s application to participate in the TARP program was preliminarily approved. The allocated carrying values of the Series C Preferred Stock and the warrant on the date of issuance in 2008 (based on the relative fair values) were $896 million and $39 million, respectively.
The warrant is immediately exercisable, subject to certain restrictions, and has a 10-year term. The exercise price and number of shares subject to the warrant are both subject to anti-dilution adjustments. U.S. Treasury may not exercise voting power with respect to shares of common stock issued upon exercise of the warrant. Neither the Series C preferred stock (exchanged for trust preferred securities) nor the warrant nor the shares issuable upon exercise of the warrant are subject to any contractual restriction on transfer.
On September 18, 2009, the Corporation announced the voluntary delisting of its 2003 Series A and 2008 Series B preferred stock from the NASDAQ Stock Market (the “NASDAQ”), effective October 8, 2009. The Corporation’s common stock continues to be traded on the NASDAQ under the symbol BPOP.
On May 1, 2009, the stockholders of the Corporation approved an amendment to the Corporation’s Certifi cate of Incorporation to increase the number of authorized shares of common stock from 470,000,000 shares to 700,000,000 shares. The stockholders also approved a decrease in the par value of the common stock of the Corporation from $6 per share to $0.01 per share. The decrease in the par value of the Corporation’s common stock had no effect on the total dollar value of the Corporation’s stockholders’ equity. During 2009, the Corporation transferred an amount equal to the product of the number of shares issued and outstanding and $5.99 (the difference between the old and new par values), from the common stock account to surplus (additional paid-in capital).
During the third quarter of 2009, the Corporation issued 357,510,076 new shares of common stock in exchange of its Series
BOA22177_wo18_Popular.indd 136 3/3/2010 10:46:56 AM

137
A and Series B preferred stock and trust preferred securities, which resulted in an increase in common stockholders’ equity of $923 million. This increase included newly issued common stock and surplus of $612.4 million and a favorable impact to accumulated defi cit of $311 million, including $80.3 million in gains on the extinguishment of junior subordinated debentures that relate to the trust preferred securities. Refer to Note 21 for information on the exchange offers.
On February 19, 2009, the Board of Directors of the Corporation resolved to retire 13,597,261 shares of the Corporation’s common stock that were held by the Corporation as treasury shares. It is the Corporation’s accounting policy to account, at retirement, for the excess of the cost of the treasury stock over its par value entirely to surplus. The impact of the retirement is refl ected in the accompanying Consolidated Statement of Changes in Stockholders’ Equity.
The Corporation’s common stock ranks junior to all series of preferred stock as to dividend rights and / or as to rights on liquidation, dissolution or winding up of the Corporation. Dividends on each series of preferred stock are payable if declared. The Corporation’s ability to declare or pay dividends on, or purchase, redeem or otherwise acquire, its common stock is subject to certain restrictions in the event that the Corporation fails to pay or set aside full dividends on the preferred stock for the latest dividend period. The ability of the Corporation to pay dividends in the future is limited by regulatory requirements, legal availability of funds, recent and projected fi nancial results, capital levels and liquidity of the Corporation, general business conditions and other factors deemed relevant by the Corporation’s Board of Directors.
During the year 2009, cash dividends of $0.02 (2008 - $0.48; 2007 - $0.64) per common share outstanding amounting to $5.6 million (2008 - $134.9 million; 2007 - $178.9 million) were declared. There were no dividends payable to shareholders of common stock at December 31, 2009 (2008 - $23 million and 2007 - $45 million). The Corporation suspended the payment of dividends to shareholders of common stock during 2009.
The Banking Act of the Commonwealth of Puerto Rico requires that a minimum of 10% of BPPR’s net income for the year be transferred to a statutory reserve account until such statutory reserve equals the total of paid-in capital on common and preferred stock. Any losses incurred by a bank must fi rst be charged to retained earnings and then to the reserve fund. Amounts credited to the reserve fund may not be used to pay dividends without the prior consent of the Puerto Rico Commissioner of Financial Institutions. The failure to maintain suffi cient statutory reserves would preclude BPPR from paying dividends. BPPR’s statutory reserve fund totaled $402 million at December 31, 2009 (2008 - $392 million; 2007 - $374 million). During 2009, $10 million (2008 - $18 million; 2007 - $28 million) was transferred to the statutory reserve account. At December 31, 2009, 2008 and 2007,
BPPR was in compliance with the statutory reserve requirement.
Note 24 - Net income (loss) per common share:The following table sets forth the computation of net income (loss) per common share (“EPS”), basic and diluted, for the years ended December 31:
(In thousands, except share information) 2009 2008 2007Net (loss) income from continuing operations ($553,947) ($680,468) $202,508Net loss from discontinued operations (19,972) (563,435) (267,001)Preferred stock dividends (39,857) (34,815) (11,913)Preferred stock discount accretion (4,515) (482) -Favorable impact from exchange of shares of Series A and B preferred stock for common stock, net of issuance costs (Refer to Note 21) 230,388 - -Favorable impact from exchange of Series C preferred stock for trust preferred securities (Refer to Note 21) 485,280 - -Net income (loss) applicable to common stock $97,377 ($1,279,200) ($76,406)
Average common shares outstanding 408,229,498 281,079,201 279,494,150Average potential common shares - - 58,352Average common shares outstanding - assuming dilution 408,229,498 281,079,201 279,552,502
Basic and diluted EPS from continuing operations $0.29 ($2.55) $0.68Basic and diluted EPS from discontinued operations (0.05) (2.00) (0.95)
Basic and diluted EPS $0.24 ($4.55) ($0.27)
Potential common shares consist of common stock issuable under the assumed exercise of stock options and under restricted stock awards, using the treasury stock method. This method assumes that the potential common shares are issued and the proceeds from exercise, in addition to the amount of compensation cost attributed to future services, are used to purchase common stock at the exercise date. The difference between the number of potential shares issued and the shares purchased is added as incremental shares to the actual number of shares outstanding to compute diluted earnings per share. Warrants and stock options that result in lower potential shares issued than shares purchased under the treasury stock method are not included in the computation of dilutive earnings per share since their inclusion would have an antidilutive effect in earnings per share.
For year 2009, there were 2,715,852 weighted average antidilutive stock options outstanding (2008 - 3,036,843; 2007 - 2,431,830). Additionally, the Corporation has outstanding a warrant to purchase 20,932,836 shares of common stock, which have an antidilutive effect as of December 31, 2009.
BOA22177_wo18_Popular.indd 137 3/3/2010 10:46:56 AM
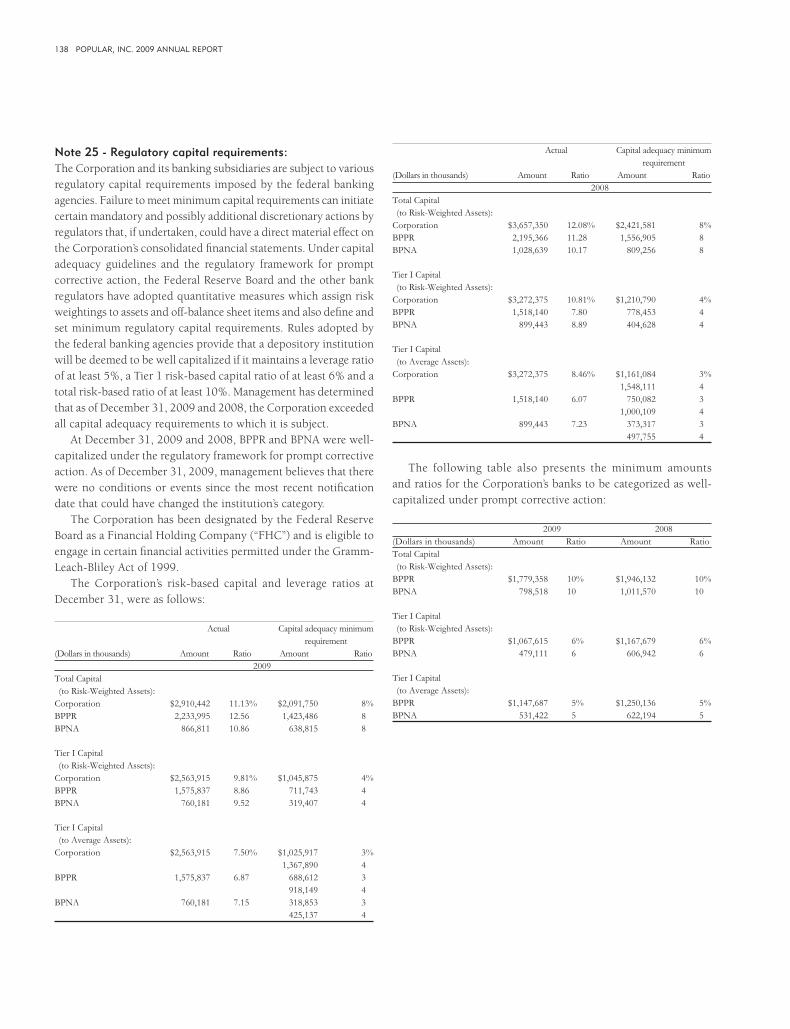
138 POPULAR, INC. 2009 ANNUAL REPORT
Note 25 - Regulatory capital requirements:The Corporation and its banking subsidiaries are subject to various regulatory capital requirements imposed by the federal banking agencies. Failure to meet minimum capital requirements can initiate certain mandatory and possibly additional discretionary actions by regulators that, if undertaken, could have a direct material effect on the Corporation’s consolidated fi nancial statements. Under capital adequacy guidelines and the regulatory framework for prompt corrective action, the Federal Reserve Board and the other bank regulators have adopted quantitative measures which assign risk weightings to assets and off-balance sheet items and also defi ne and set minimum regulatory capital requirements. Rules adopted by the federal banking agencies provide that a depository institution will be deemed to be well capitalized if it maintains a leverage ratio of at least 5%, a Tier 1 risk-based capital ratio of at least 6% and a total risk-based ratio of at least 10%. Management has determined that as of December 31, 2009 and 2008, the Corporation exceeded all capital adequacy requirements to which it is subject.
At December 31, 2009 and 2008, BPPR and BPNA were well-capitalized under the regulatory framework for prompt corrective action. As of December 31, 2009, management believes that there were no conditions or events since the most recent notifi cation date that could have changed the institution’s category.
The Corporation has been designated by the Federal Reserve Board as a Financial Holding Company (“FHC”) and is eligible to engage in certain fi nancial activities permitted under the Gramm-Leach-Bliley Act of 1999.
The Corporation’s risk-based capital and leverage ratios at December 31, were as follows:
Actual Capital adequacy minimum requirement(Dollars in thousands) Amount Ratio Amount Ratio 2009 Total Capital (to Risk-Weighted Assets): Corporation $2,910,442 11.13% $2,091,750 8%BPPR 2,233,995 12.56 1,423,486 8BPNA 866,811 10.86 638,815 8
Tier I Capital (to Risk-Weighted Assets):Corporation $2,563,915 9.81% $1,045,875 4%BPPR 1,575,837 8.86 711,743 4BPNA 760,181 9.52 319,407 4
Tier I Capital (to Average Assets): Corporation $2,563,915 7.50% $1,025,917 3% 1,367,890 4BPPR 1,575,837 6.87 688,612 3 918,149 4BPNA 760,181 7.15 318,853 3 425,137 4
Actual Capital adequacy minimum requirement(Dollars in thousands) Amount Ratio Amount Ratio 2008 Total Capital (to Risk-Weighted Assets): Corporation $3,657,350 12.08% $2,421,581 8%BPPR 2,195,366 11.28 1,556,905 8BPNA 1,028,639 10.17 809,256 8
Tier I Capital (to Risk-Weighted Assets):Corporation $3,272,375 10.81% $1,210,790 4%BPPR 1,518,140 7.80 778,453 4BPNA 899,443 8.89 404,628 4
Tier I Capital (to Average Assets): Corporation $3,272,375 8.46% $1,161,084 3% 1,548,111 4BPPR 1,518,140 6.07 750,082 3 1,000,109 4BPNA 899,443 7.23 373,317 3 497,755 4
The following table also presents the minimum amounts and ratios for the Corporation’s banks to be categorized as well-capitalized under prompt corrective action:
2009 2008(Dollars in thousands) Amount Ratio Amount RatioTotal Capital (to Risk-Weighted Assets): BPPR $1,779,358 10% $1,946,132 10%BPNA 798,518 10 1,011,570 10
Tier I Capital (to Risk-Weighted Assets):BPPR $1,067,615 6% $1,167,679 6%BPNA 479,111 6 606,942 6
Tier I Capital (to Average Assets): BPPR $1,147,687 5% $1,250,136 5%BPNA 531,422 5 622,194 5
BOA22177_wo18_Popular.indd 138 3/3/2010 10:46:56 AM
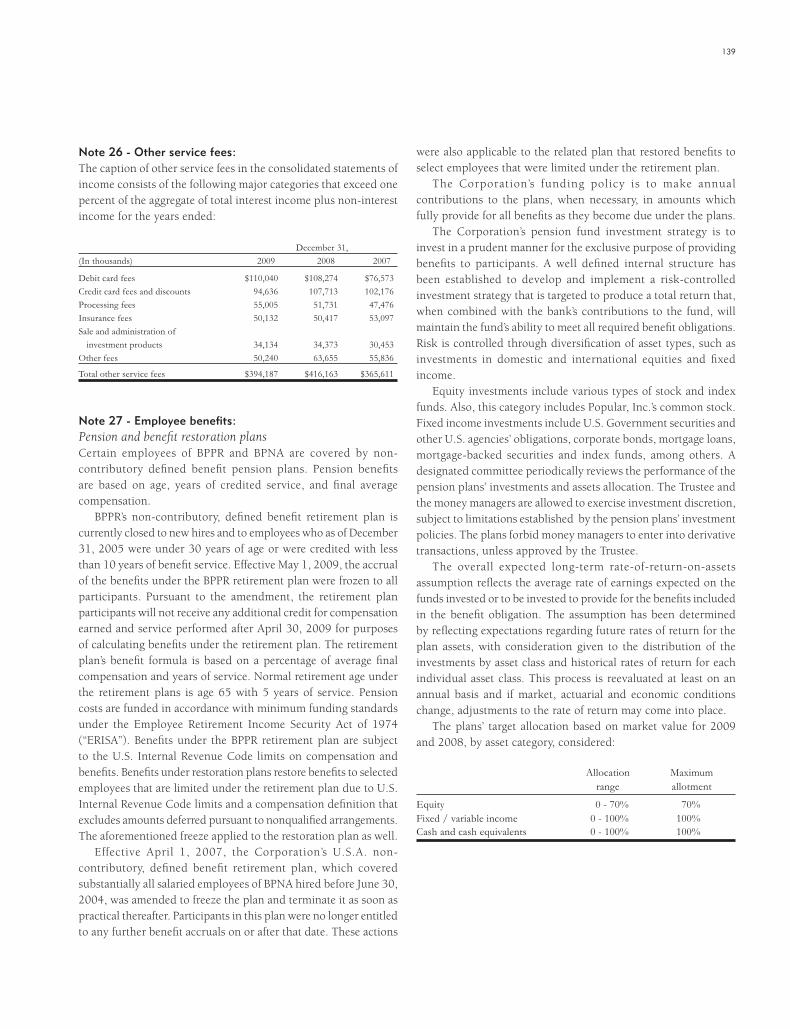
139
Note 26 - Other service fees:The caption of other service fees in the consolidated statements of income consists of the following major categories that exceed one percent of the aggregate of total interest income plus non-interest income for the years ended:
December 31,(In thousands) 2009 2008 2007
Debit card fees $110,040 $108,274 $76,573Credit card fees and discounts 94,636 107,713 102,176Processing fees 55,005 51,731 47,476Insurance fees 50,132 50,417 53,097Sale and administration of investment products 34,134 34,373 30,453 Other fees 50,240 63,655 55,836
Total other service fees $394,187 $416,163 $365,611
Note 27 - Employee benefi ts:Pension and benefi t restoration plansCertain employees of BPPR and BPNA are covered by non-contributory defi ned benefi t pension plans. Pension benefi ts are based on age, years of credited service, and fi nal average compensation.
BPPR’s non-contributory, defi ned benefi t retirement plan is currently closed to new hires and to employees who as of December 31, 2005 were under 30 years of age or were credited with less than 10 years of benefi t service. Effective May 1, 2009, the accrual of the benefi ts under the BPPR retirement plan were frozen to all participants. Pursuant to the amendment, the retirement plan participants will not receive any additional credit for compensation earned and service performed after April 30, 2009 for purposes of calculating benefi ts under the retirement plan. The retirement plan’s benefi t formula is based on a percentage of average fi nal compensation and years of service. Normal retirement age under the retirement plans is age 65 with 5 years of service. Pension costs are funded in accordance with minimum funding standards under the Employee Retirement Income Security Act of 1974 (“ERISA”). Benefi ts under the BPPR retirement plan are subject to the U.S. Internal Revenue Code limits on compensation and benefi ts. Benefi ts under restoration plans restore benefi ts to selected employees that are limited under the retirement plan due to U.S. Internal Revenue Code limits and a compensation defi nition that excludes amounts deferred pursuant to nonqualifi ed arrangements. The aforementioned freeze applied to the restoration plan as well.
Effective April 1, 2007, the Corporation’s U.S.A. non-contributory, defi ned benefi t retirement plan, which covered substantially all salaried employees of BPNA hired before June 30, 2004, was amended to freeze the plan and terminate it as soon as practical thereafter. Participants in this plan were no longer entitled to any further benefi t accruals on or after that date. These actions
were also applicable to the related plan that restored benefi ts to select employees that were limited under the retirement plan.
The Corporation’s funding policy is to make annual contributions to the plans, when necessary, in amounts which fully provide for all benefi ts as they become due under the plans.
The Corporation’s pension fund investment strategy is to invest in a prudent manner for the exclusive purpose of providing benefi ts to participants. A well defi ned internal structure has been established to develop and implement a risk-controlled investment strategy that is targeted to produce a total return that, when combined with the bank’s contributions to the fund, will maintain the fund’s ability to meet all required benefi t obligations. Risk is controlled through diversifi cation of asset types, such as investments in domestic and international equities and fi xed income.
Equity investments include various types of stock and index funds. Also, this category includes Popular, Inc.’s common stock. Fixed income investments include U.S. Government securities and other U.S. agencies’ obligations, corporate bonds, mortgage loans, mortgage-backed securities and index funds, among others. A designated committee periodically reviews the performance of the pension plans’ investments and assets allocation. The Trustee and the money managers are allowed to exercise investment discretion, subject to limitations established by the pension plans’ investment policies. The plans forbid money managers to enter into derivative transactions, unless approved by the Trustee.
The overall expected long-term rate-of-return-on-assets assumption refl ects the average rate of earnings expected on the funds invested or to be invested to provide for the benefi ts included in the benefi t obligation. The assumption has been determined by refl ecting expectations regarding future rates of return for the plan assets, with consideration given to the distribution of the investments by asset class and historical rates of return for each individual asset class. This process is reevaluated at least on an annual basis and if market, actuarial and economic conditions change, adjustments to the rate of return may come into place.
The plans’ target allocation based on market value for 2009 and 2008, by asset category, considered:
Allocation Maximum range allotment
Equity 0 - 70% 70%Fixed / variable income 0 - 100% 100%Cash and cash equivalents 0 - 100% 100%
BOA22177_wo18_Popular.indd 139 3/3/2010 10:46:56 AM

140 POPULAR, INC. 2009 ANNUAL REPORT
Assets of the pension and benefi t restoration plans at December 31, consisted of:
2009 2008Investments, at fair value: Allocated share of Master Trust net assets $414,775 $361,575 Popular, Inc. common stock 6,206 14,168 Private equity investment 884 1,247 Total investments 421,865 376,990
Receivables: Accrued interest and dividends 55 219 Total receivables 55 219
Cash and cash equivalents 12,212 12,416 Total assets $434,132 $389,625
Certain assets of the plans are maintained, for investment purposes only, on a commingled basis with the assets of the Popular Savings Plan in a Master Trust (the “Master Trust”). Neither the pension or benefi t restoration plan has any interest in the specifi c assets of the Master Trust, but maintains benefi cial interests in such assets. The Master Trust is managed by the Trust Division of BPPR and by several investment managers.
At December 31, 2009, the pension and restoration plans’ interest in the net assets of the Master Trust was approximately 87.8% (2008 – 87.7%).
The following table sets forth by level, within the fair value hierarchy, the plans’ assets at fair value at December 31, 2009 and 2008. The following table does not include the plans’ interests in the Master Trust because that information is presented in a separate table.
December 31, 2009(In thousands) Level 1 Level 2 Level 3 TotalCommon stock $6,206 - - $6,206Private equity investment - - $884 884Cash and cash equivalents 12,212 - - 12,212Accrued interest and dividends - 55 55Total assets, excluding interests in Master Trust $18,418 - $939 $19,357
December 31, 2008(In thousands) Level 1 Level 2 Level 3 TotalCommon stock $14,168 - - $14,168Private equity investment - - $1,247 1,247Cash and cash equivalents 12,416 - - 12,416Accrued interest and dividends - - 219 219Total assets, excluding interests in Master Trust $26,584 - $1,466 $28,050
Following is a description of the plans’ valuation methodologies used for assets measured at fair value:
• Common stock - Equity securities with quoted market prices obtained from an active exchange market are classifi ed as
Level 1.
• Private equity investments - Private equity investments include an investment in a private equity fund. This fund value is recorded at the net asset value (NAV) of the fund which is affected by the changes of the fair value of the investments held in the fund. This fund is classifi ed as Level 3.
• Cash and cash equivalents - The carrying amount of cash and cash equivalents are reasonable estimates of their fair value since they are available on demand or due to their short-term maturity.
• Accrued interest and dividends - Given the short-term nature of these assets, their carrying amount approximates fair value. Since there is a lack of observable inputs related to instrument specifi c attributes, these are reported as Level 3.
The changes in Level 3 assets measured at fair value for the years ended December 31, were as follows:
(In thousands) 2009 2008Balance at January 1 $1,466 $2,011Actual return on plan assets: Change in unrealized gain (loss) relating to instruments still held at the reporting date (363) (323) Actual return on plan assets (gain (loss)) relating to instruments sold during the year - -Purchases, sales, issuances, settlements, paydowns and maturities (net) (164) (222)Transfers in and/or out of Level 3 - -Balance at December 31 $939 $1,466
Master TrustInvestments held in the Master Trust at December 31, 2009 and 2008 were as follows:
(In thousands) 2009 2008Obligations of the U.S. Government and its agencies $25,733 $18,121Corporate bonds and debentures 47,792 43,157Common stock 207,747 161,981Index fund - equity 78,520 58,483Index fund - fi xed income 7,868 28,572Mortgage-backed securities - agencies 85,921 84,585Private equity investments 894 1,338Cash 16,440 14,484Accrued investment income 1,719 1,611 Total assets $472,634 $412,332
The closing prices reported in the active markets in which the securities are traded are used to value the investments in the Master Trust. The following table sets forth by level, within the fair value hierarchy, the Master Trust’s investments at fair value at December 31, 2009 and 2008.
BOA22177_wo18_Popular.indd 140 3/3/2010 10:46:56 AM
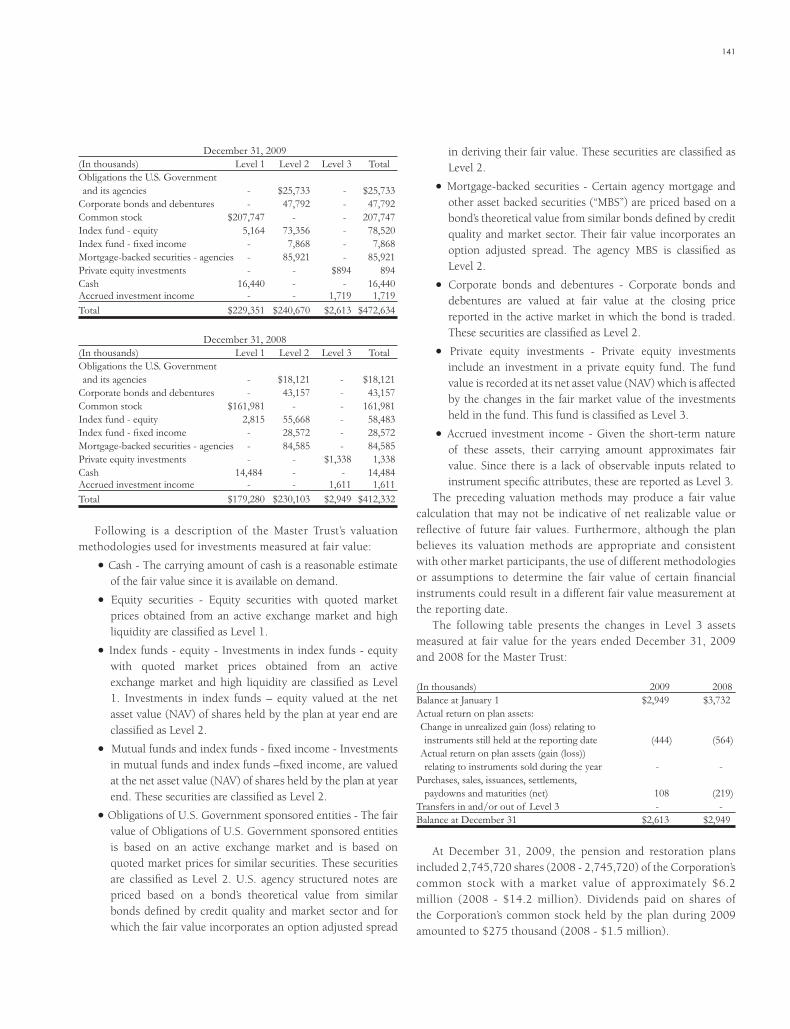
141
December 31, 2009(In thousands) Level 1 Level 2 Level 3 TotalObligations the U.S. Government and its agencies - $25,733 - $25,733Corporate bonds and debentures - 47,792 - 47,792Common stock $207,747 - - 207,747Index fund - equity 5,164 73,356 - 78,520Index fund - fi xed income - 7,868 - 7,868Mortgage-backed securities - agencies - 85,921 - 85,921Private equity investments - - $894 894Cash 16,440 - - 16,440Accrued investment income - - 1,719 1,719Total $229,351 $240,670 $2,613 $472,634
December 31, 2008(In thousands) Level 1 Level 2 Level 3 TotalObligations the U.S. Government and its agencies - $18,121 - $18,121Corporate bonds and debentures - 43,157 - 43,157Common stock $161,981 - - 161,981Index fund - equity 2,815 55,668 - 58,483Index fund - fi xed income - 28,572 - 28,572Mortgage-backed securities - agencies - 84,585 - 84,585Private equity investments - - $1,338 1,338Cash 14,484 - - 14,484Accrued investment income - - 1,611 1,611Total $179,280 $230,103 $2,949 $412,332
Following is a description of the Master Trust’s valuation methodologies used for investments measured at fair value:
• Cash - The carrying amount of cash is a reasonable estimate of the fair value since it is available on demand.
• Equity securities - Equity securities with quoted market prices obtained from an active exchange market and high liquidity are classifi ed as Level 1.
• Index funds - equity - Investments in index funds - equity with quoted market prices obtained from an active exchange market and high liquidity are classifi ed as Level 1. Investments in index funds – equity valued at the net asset value (NAV) of shares held by the plan at year end are classifi ed as Level 2.
• Mutual funds and index funds - fi xed income - Investments in mutual funds and index funds –fi xed income, are valued at the net asset value (NAV) of shares held by the plan at year end. These securities are classifi ed as Level 2.
• Obligations of U.S. Government sponsored entities - The fair value of Obligations of U.S. Government sponsored entities is based on an active exchange market and is based on quoted market prices for similar securities. These securities are classifi ed as Level 2. U.S. agency structured notes are priced based on a bond’s theoretical value from similar bonds defi ned by credit quality and market sector and for which the fair value incorporates an option adjusted spread
in deriving their fair value. These securities are classifi ed as Level 2.
• Mortgage-backed securities - Certain agency mortgage and other asset backed securities (“MBS”) are priced based on a bond’s theoretical value from similar bonds defi ned by credit quality and market sector. Their fair value incorporates an option adjusted spread. The agency MBS is classifi ed as Level 2.
• Corporate bonds and debentures - Corporate bonds and debentures are valued at fair value at the closing price reported in the active market in which the bond is traded. These securities are classifi ed as Level 2.
• Private equity investments - Private equity investments include an investment in a private equity fund. The fund value is recorded at its net asset value (NAV) which is affected by the changes in the fair market value of the investments held in the fund. This fund is classifi ed as Level 3.
• Accrued investment income - Given the short-term nature of these assets, their carrying amount approximates fair value. Since there is a lack of observable inputs related to instrument specifi c attributes, these are reported as Level 3.
The preceding valuation methods may produce a fair value calculation that may not be indicative of net realizable value or refl ective of future fair values. Furthermore, although the plan believes its valuation methods are appropriate and consistent with other market participants, the use of different methodologies or assumptions to determine the fair value of certain fi nancial instruments could result in a different fair value measurement at the reporting date.
The following table presents the changes in Level 3 assets measured at fair value for the years ended December 31, 2009 and 2008 for the Master Trust:
(In thousands) 2009 2008Balance at January 1 $2,949 $3,732Actual return on plan assets: Change in unrealized gain (loss) relating to instruments still held at the reporting date (444) (564) Actual return on plan assets (gain (loss)) relating to instruments sold during the year - -Purchases, sales, issuances, settlements, paydowns and maturities (net) 108 (219)Transfers in and/or out of Level 3 - -Balance at December 31 $2,613 $2,949
At December 31, 2009, the pension and restoration plans included 2,745,720 shares (2008 - 2,745,720) of the Corporation’s common stock with a market value of approximately $6.2 million (2008 - $14.2 million). Dividends paid on shares of the Corporation’s common stock held by the plan during 2009 amounted to $275 thousand (2008 - $1.5 million).
BOA22177_wo18_Popular.indd 141 3/3/2010 10:46:56 AM
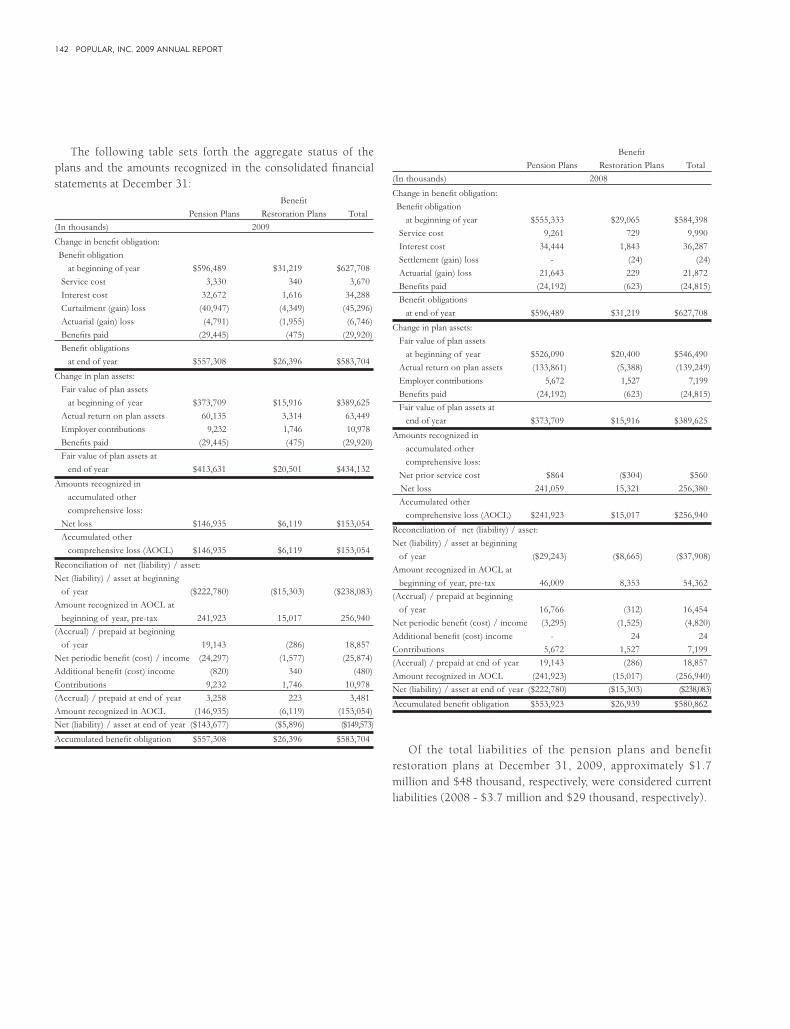
142 POPULAR, INC. 2009 ANNUAL REPORT
The following table sets forth the aggregate status of the plans and the amounts recognized in the consolidated fi nancial statements at December 31:
Benefi t Pension Plans Restoration Plans Total(In thousands) 2009 Change in benefi t obligation: Benefi t obligation at beginning of year $596,489 $31,219 $627,708 Service cost 3,330 340 3,670 Interest cost 32,672 1,616 34,288 Curtailment (gain) loss (40,947) (4,349) (45,296) Actuarial (gain) loss (4,791) (1,955) (6,746) Benefi ts paid (29,445) (475) (29,920) Benefi t obligations at end of year $557,308 $26,396 $583,704Change in plan assets: Fair value of plan assets at beginning of year $373,709 $15,916 $389,625 Actual return on plan assets 60,135 3,314 63,449 Employer contributions 9,232 1,746 10,978 Benefi ts paid (29,445) (475) (29,920) Fair value of plan assets at end of year $413,631 $20,501 $434,132Amounts recognized in accumulated other comprehensive loss: Net loss $146,935 $6,119 $153,054 Accumulated other comprehensive loss (AOCL) $146,935 $6,119 $153,054Reconciliation of net (liability) / asset: Net (liability) / asset at beginning of year ($222,780) ($15,303) ($238,083)Amount recognized in AOCL at beginning of year, pre-tax 241,923 15,017 256,940(Accrual) / prepaid at beginning of year 19,143 (286) 18,857Net periodic benefi t (cost) / income (24,297) (1,577) (25,874)Additional benefi t (cost) income (820) 340 (480)Contributions 9,232 1,746 10,978(Accrual) / prepaid at end of year 3,258 223 3,481Amount recognized in AOCL (146,935) (6,119) (153,054)Net (liability) / asset at end of year ($143,677) ($5,896) ($149,573)Accumulated benefi t obligation $557,308 $26,396 $583,704
Benefi t Pension Plans Restoration Plans Total(In thousands) 2008Change in benefi t obligation: Benefi t obligation at beginning of year $555,333 $29,065 $584,398 Service cost 9,261 729 9,990 Interest cost 34,444 1,843 36,287 Settlement (gain) loss - (24) (24) Actuarial (gain) loss 21,643 229 21,872 Benefi ts paid (24,192) (623) (24,815) Benefi t obligations at end of year $596,489 $31,219 $627,708Change in plan assets: Fair value of plan assets at beginning of year $526,090 $20,400 $546,490 Actual return on plan assets (133,861) (5,388) (139,249) Employer contributions 5,672 1,527 7,199 Benefi ts paid (24,192) (623) (24,815) Fair value of plan assets at end of year $373,709 $15,916 $389,625Amounts recognized in accumulated other comprehensive loss: Net prior service cost $864 ($304) $560 Net loss 241,059 15,321 256,380 Accumulated other comprehensive loss (AOCL) $241,923 $15,017 $256,940Reconciliation of net (liability) / asset: Net (liability) / asset at beginning of year ($29,243) ($8,665) ($37,908)Amount recognized in AOCL at beginning of year, pre-tax 46,009 8,353 54,362(Accrual) / prepaid at beginning of year 16,766 (312) 16,454Net periodic benefi t (cost) / income (3,295) (1,525) (4,820)Additional benefi t (cost) income - 24 24Contributions 5,672 1,527 7,199(Accrual) / prepaid at end of year 19,143 (286) 18,857Amount recognized in AOCL (241,923) (15,017) (256,940)Net (liability) / asset at end of year ($222,780) ($15,303) ($238,083)Accumulated benefi t obligation $553,923 $26,939 $580,862
Of the total liabilities of the pension plans and benefit restoration plans at December 31, 2009, approximately $1.7 million and $48 thousand, respectively, were considered current liabilities (2008 - $3.7 million and $29 thousand, respectively).
BOA22177_wo18_Popular.indd 142 3/3/2010 10:46:56 AM
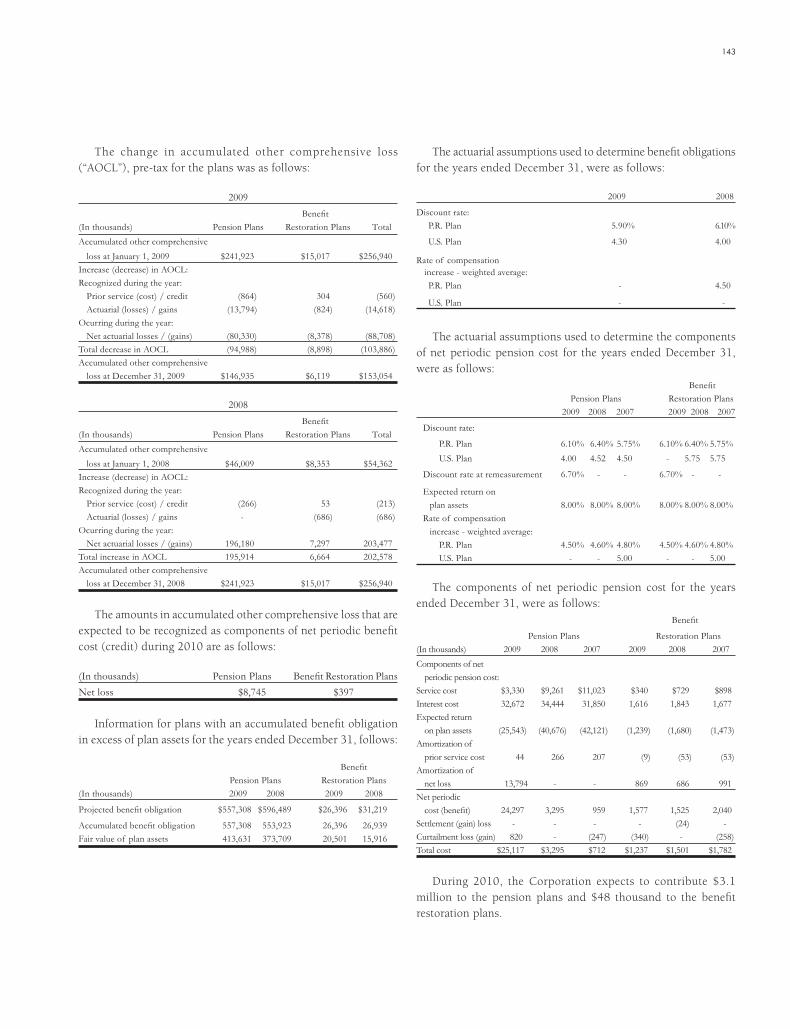
143
The change in accumulated other comprehensive loss (“AOCL”), pre-tax for the plans was as follows:
2009 Benefi t
(In thousands) Pension Plans Restoration Plans TotalAccumulated other comprehensive loss at January 1, 2009 $241,923 $15,017 $256,940Increase (decrease) in AOCL:Recognized during the year: Prior service (cost) / credit (864) 304 (560) Actuarial (losses) / gains (13,794) (824) (14,618)Ocurring during the year: Net actuarial losses / (gains) (80,330) (8,378) (88,708)Total decrease in AOCL (94,988) (8,898) (103,886)Accumulated other comprehensive loss at December 31, 2009 $146,935 $6,119 $153,054
2008 Benefi t
(In thousands) Pension Plans Restoration Plans TotalAccumulated other comprehensive loss at January 1, 2008 $46,009 $8,353 $54,362Increase (decrease) in AOCL:Recognized during the year: Prior service (cost) / credit (266) 53 (213) Actuarial (losses) / gains - (686) (686)Ocurring during the year: Net actuarial losses / (gains) 196,180 7,297 203,477Total increase in AOCL 195,914 6,664 202,578Accumulated other comprehensive loss at December 31, 2008 $241,923 $15,017 $256,940
The amounts in accumulated other comprehensive loss that are expected to be recognized as components of net periodic benefi t cost (credit) during 2010 are as follows:
(In thousands) Pension Plans Benefi t Restoration PlansNet loss $8,745 $397
Information for plans with an accumulated benefi t obligation in excess of plan assets for the years ended December 31, follows:
Benefi t Pension Plans Restoration Plans(In thousands) 2009 2008 2009 2008
Projected benefi t obligation $557,308 $596,489 $26,396 $31,219
Accumulated benefi t obligation 557,308 553,923 26,396 26,939Fair value of plan assets 413,631 373,709 20,501 15,916
The actuarial assumptions used to determine benefi t obligations for the years ended December 31, were as follows: 2009 2008
Discount rate:
P.R. Plan 5.90% 6.10%
U.S. Plan 4.30 4.00
Rate of compensation increase - weighted average:
P.R. Plan - 4.50
U.S. Plan - -
The actuarial assumptions used to determine the components of net periodic pension cost for the years ended December 31, were as follows:
Benefi t Pension Plans Restoration Plans
2009 2008 2007 2009 2008 2007
Discount rate:
P.R. Plan 6.10% 6.40% 5.75% 6.10% 6.40% 5.75%
U.S. Plan 4.00 4.52 4.50 - 5.75 5.75
Discount rate at remeasurement 6.70% - - 6.70% - -
Expected return on plan assets 8.00% 8.00% 8.00% 8.00% 8.00% 8.00% Rate of compensation increase - weighted average: P.R. Plan 4.50% 4.60% 4.80% 4.50% 4.60% 4.80% U.S. Plan - - 5.00 - - 5.00
The components of net periodic pension cost for the years ended December 31, were as follows: Benefi t
Pension Plans Restoration Plans(In thousands) 2009 2008 2007 2009 2008 2007Components of net periodic pension cost: Service cost $3,330 $9,261 $11,023 $340 $729 $898Interest cost 32,672 34,444 31,850 1,616 1,843 1,677Expected return on plan assets (25,543) (40,676) (42,121) (1,239) (1,680) (1,473)Amortization of prior service cost 44 266 207 (9) (53) (53)Amortization of net loss 13,794 - - 869 686 991Net periodic cost (benefi t) 24,297 3,295 959 1,577 1,525 2,040Settlement (gain) loss - - - - (24) -Curtailment loss (gain) 820 - (247) (340) - (258)Total cost $25,117 $3,295 $712 $1,237 $1,501 $1,782
During 2010, the Corporation expects to contribute $3.1 million to the pension plans and $48 thousand to the benefi t restoration plans.
BOA22177_wo18_Popular.indd 143 3/3/2010 10:46:56 AM

144 POPULAR, INC. 2009 ANNUAL REPORT
The following benefi t payments are expected to be paid:
Benefi t (In thousands) Pension Restoration Plans2010 $42,868 $6972011 29,719 9082012 30,785 1,1112013 31,844 1,2802014 32,832 1,4492015 - 2019 177,634 9,763
Postretirement health care benefi tsIn addition to providing pension benefi ts, BPPR provides certain health care benefi ts for retired employees. Regular employees of BPPR, except for employees hired after February 1, 2000, may become eligible for health care benefi ts, provided they reach retirement age while working for BPPR.
The amounts in accumulated other comprehensive loss that are expected to be recognized as components of net periodic benefi t cost for the postretirement health care benefi t plan during 2010 are as follows:
(In thousands) 2010Net prior service cost (credit) ($1,046)Net loss (1,175)
The status of the Corporation’s unfunded postretirement benefi t plan at December 31, was as follows:
(In thousands) 2009 2008
Change in benefi t obligation: Benefi t obligation at beginning of the year $135,943 $126,046 Service cost 2,195 2,142 Interest cost 8,105 8,219 Benefi ts paid (5,031) (5,910) Actuarial loss (gain) (29,584) 5,446 Benefi t obligation at end of year $111,628 $135,943
Funded status at end of year: Benefi t obligation at end of year ($111,628) ($135,943) Fair value of plan assets - - Funded status at end of year ($111,628) ($135,943)Amounts recognized in accumulated other comprehensive loss: Net prior service cost ($2,207) ($3,253) Net (gain) loss (23,061) 6,522 Accumulated other comprehensive loss ( income) ($25,268) $3,269Reconciliation of net (liability) / asset:Net (liability) / asset at beginning of year ($135,943) ($126,046)Amount recognized in accumulated other comprehensive loss at beginning of year, pre-tax 3,269 (3,223)(Accrual) / prepaid at beginning of year (132,674) (129,269)Net periodic benefi t (cost) / income (9,254) (9,315)Contributions 5,031 5,910(Accrual) / prepaid at end of year (136,897) (132,674)Amount recognized in accumulated other comprehensive (loss) income 25,268 (3,269)Net (liability) / asset at end of year ($111,629) ($135,943)
Of the total postretirement liabilities as of December 31, 2009, approximately $5.2 million were considered current liabilities (2008 - $6.1 million).
The change in accumulated other comprehensive income, pre-tax for the postretirement plan was as follows:
(In thousands) 2009 2008Accumulated other comprehensive (income) loss at beginning of year $3,269 ($3,223)Increase (decrease) in accumulated other comprehensive income (loss):Recognized during the year: Prior service (cost) / credit 1,046 1,046Ocurring during the year: Net actuarial losses (gains) (29,583) 5,446Total decrease in accumulated other comprehensive loss ($28,537) 6,492Accumulated other comprehensive loss (income) at end of year ($25,268) $3,269
The weighted average discount rate used in determining the accumulated postretirement benefi t obligation at December 31,
BOA22177_wo18_Popular.indd 144 3/3/2010 10:46:56 AM

145
2009 was 5.90% (2008 - 6.10%).The weighted average discount rate used to determine the
components of net periodic postretirement benefi t cost for the year ended December 31, 2009 was 6.10% (2008 - 6.40%; 2007 - 5.75%).
The components of net periodic postretirement benefi t cost for the year ended December 31, were as follows:
(In thousands) 2009 2008 2007
Service cost $2,195 $2,142 $2,312Interest cost 8,105 8,219 7,556Amortization of prior service benefi t (1,046) (1,046) (1,046)Total net periodic benefi t cost $9,254 $9,315 $8,822
The assumed health care cost trend rates at December 31, were as follows:
To determine postretirement benefi t obligation: 2009 2008
Initial health care cost trend rate 7.00% 7.50%Ultimate health care cost trend rate 5.00 5.00Year that the ultimate trend rate is reached 2014 2014
To determine net periodic benefi t cost: 2009 2008
Initial health care cost trend rate 7.50% 8.00%Ultimate health care cost trend rate 5.00 5.00Year that the ultimate trend rate is reached 2014 2011
The Plan provides that the cost will be capped to 3% of the annual health care cost increase affecting only those employees retiring after February 1, 2001.
Assumed health care trend rates generally have a signifi cant effect on the amounts reported for a health care plan. A one-percentage-point change in assumed health care cost trend rates would have the following effects: 1-Percentage 1-Percentage(In thousands) Point Increase Point Decrease
Effect on total service cost and interest cost components $414 ($366)Effect on postretirement benefi t obligation 6,880 (9,172)
The Corporation expects to contribute $5.2 million to the postretirement benefit plan in 2010 to fund current benefit payment requirements.
The following benefi t payments are expected to be paid: (In thousands) 2010 $5,165 2011 5,397 2012 5,589 2013 5,791 2014 6,067 2015 - 2019 34,580
Savings plansThe Corporation also provides defined contribution savings plans pursuant to Section 1165(e) of the Puerto Rico Internal Revenue Code and Section 401(k) of the U.S. Internal Revenue Code, as applicable, for substantially all the employees of the Corporation. Investments in the plans are participant-directed, and employer matching contributions are determined based on the specifi c provisions of each plan. Employees are fully vested in the employer’s contribution after fi ve years of service. Effective March 20, 2009, the savings plans were amended to suspend the employer matching contribution to the plan. The cost of providing these benefi ts in 2009 was $2.9 million (2008 - $18.8 million; 2007 - $17.4 million).
The plans held 22,239,167 (2008 - 17,254,175; 2007 - 14,972,919) shares of common stock of the Corporation with a market value of approximately $50.3 million at December 31, 2009 (2008 - $89.0 million; 2007 - $158.7 million).
Note 28 - Stock-based compensation:The Corporation maintained a Stock Option Plan (the “Stock Option Plan”), which permitted the granting of incentive awards in the form of qualifi ed stock options, incentive stock options, or non-statutory stock options of the Corporation. In April 2004, the Corporation’s shareholders adopted the Popular, Inc. 2004 Omnibus Incentive Plan (the “Incentive Plan”), which replaced and superseded the Stock Option Plan. Nevertheless, all outstanding award grants under the Stock Option Plan continue to remain in effect as of December 31, 2009 under the original terms of the Stock Option Plan.
Stock Option PlanEmployees and directors of the Corporation or any of its subsidiaries were eligible to participate in the Stock Option Plan. The Board of Directors or the Compensation Committee of the Board had the absolute discretion to determine the individuals that were eligible to participate in the Stock Option Plan. This plan provides for the issuance of Popular, Inc.’s common stock at a price equal to its fair market value at the grant date, subject to certain plan provisions. The shares are to be made available from
BOA22177_wo18_Popular.indd 145 3/3/2010 10:46:56 AM

146 POPULAR, INC. 2009 ANNUAL REPORT
authorized but unissued shares of common stock or treasury stock. The Corporation’s policy has been to use authorized but unissued shares of common stock to cover each grant. The maximum option term is ten years from the date of grant. Unless an option agreement provides otherwise, all options granted are 20% exercisable after the fi rst year and an additional 20% is exercisable after each subsequent year, subject to an acceleration clause at termination of employment due to retirement.
The following table presents information on stock options outstanding at December 31, 2009:
Weighted- Weighted- Weighted- Average Average Average Exercise Exercise Remaining Exercise Price Price of Life of Options Options Price of Range Options Options Outstanding Exercisable Options per Share Outstanding Outstanding in Years (fully vested) Exercisable$14.39 - $18.50 1,245,277 $15.85 2.75 1,245,277 $15.85$19.25 - $27.20 1,307,386 $25.21 4.48 1,220,999 $25.07
$14.39 - $27.20 2,552,663 $20.64 3.63 2,466,276 $20.41
The aggregate intrinsic value of options outstanding as of December 31, 2009 was $0.2 million (2008 - $1.6 million; 2007 - $7.3 million). There was no intrinsic value of options exercisable at December 31, 2009, 2008 and 2007.
The following table summarizes the stock option activity and related information: Options Weighted-Average Outstanding Exercise PriceOutstanding at January 1, 2007 3,144,799 $20.65Granted - -Exercised (10,064) 15.83Forfeited (19,063) 25.50Expired (23,480) 20.08Outstanding at December 31, 2007 3,092,192 $20.64Granted - -Exercised - -Forfeited (40,842) 26.29Expired (85,507) 19.67Outstanding at December 31, 2008 2,965,843 $20.59Granted - -Exercised - -Forfeited (59,631) 26.42Expired (353,549) 19.25
Outstanding at December 31, 2009 2,552,663 $20.64
The stock options exercisable at December 31, 2009 totaled 2,466,276 (2008 - 2,653,114; 2007 - 2,402,481). There were no stock options exercised during the years ended December 31, 2009 and 2008 (2007 - 10,064). Thus, there was no intrinsic value of options exercised during the years ended December 31, 2009 and 2008 (2007 - $28 thousand). There was no cash received from stock options exercised during the years ended December 31, 2009 and 2008 (2007 - $0.2 million).
There were no new stock option grants issued by the Corporation under the Stock Option Plan during 2009, 2008
and 2007. During the year ended December 31, 2009, the Corporation
recognized $0.2 million in stock options expense, with a tax benefi t of $92 thousand (2008 - $1.1 million, with a tax benefi t of $0.4 million; 2007 - $1.8 million, with a tax benefi t of $0.7 million).
Incentive PlanThe Incentive Plan permits the granting of incentive awards in the form of Annual Incentive Awards, Long-term Performance Unit Awards, Stock Options, Stock Appreciation Rights, Restricted Stock, Restricted Units or Performance Shares. Participants in the Incentive Plan are designated by the Compensation Committee of the Board of Directors (or its delegate as determined by the Board). Employees and directors of the Corporation and/or any of its subsidiaries are eligible to participate in the Incentive Plan. The shares may be made available from common stock purchased by the Corporation for such purpose, authorized but unissued shares of common stock or treasury stock. The Corporation’s policy with respect to the shares of restricted stock has been to purchase such shares in the open market to cover each grant.
Under the Incentive Plan, the Corporation has issued restricted shares, which become vested based on the employees’ continued service with Popular. Unless otherwise stated in an agreement, the compensation cost associated with the shares of restricted stock is determined based on a two-prong vesting schedule. The fi rst part is vested ratably over fi ve years commencing at the date of grant and the second part is vested at termination of employment after attainment of 55 years of age and 10 years of service. The fi ve-year vesting part is accelerated at termination of employment
after attaining 55 years of age and 10 years of service. The following table summarizes the restricted stock activity
under the Incentive Plan for members of management:
Restricted Weighted-Average Stock Grant Date Fair ValueNonvested at January 1, 2007 611,470 $22.55Granted - -Vested (304,003) 22.76Forfeited (3,781) 19.95Nonvested at December 31, 2007 303,686 $22.37Granted - -Vested (50,648) 20.33Forfeited (4,699) 19.95Nonvested at December 31, 2008 248,339 $22.83Granted - -Vested (104,791) 21.93Forfeited (5,036) 19.95Nonvested at December 31, 2009 138,512 $23.62
During the years ended December 31, 2009, 2008 and 2007, no shares of restricted stock were awarded to management under
the Incentive Plan.
BOA22177_wo18_Popular.indd 146 3/3/2010 10:46:56 AM

147
Beginning in 2007, the Corporation authorized the issuance of performance shares, in addition to restricted shares, under the Incentive Plan. The performance shares award consists of the opportunity to receive shares of Popular Inc.’s common stock provided that the Corporation achieves certain performance goals during a three-year performance cycle. The compensation cost associated with the performance shares will be recorded ratably over a three-year performance period. The performance shares will be granted at the end of the three-year period and will be vested at grant date, except when the participant’s employment is terminated by the Corporation without cause. In such case, the participant will receive a pro-rata amount of shares calculated as if the Corporation would have met the performance goal for the performance period. As of December 31, 2009, 35,397 shares have been granted under this plan (2008 - 7,106).
During the year ended December 31, 2009, the Corporation recognized $1.5 million of restricted stock expense related to management incentive awards, with a tax benefi t of $0.6 million (2008 - $2.2 million, with a tax benefi t of $0.9 million; 2007 - $2.4 million, with a tax benefi t of $0.9 million). The fair market value of the restricted stock vested was $1.8 million at grant date and $0.3 million at vesting date. This triggers a shortfall of $1.5 million that was recorded as an additional income tax expense at the applicable income tax rate net of deferred tax asset valuation allowance since the Corporation does not have any surplus due to windfalls. During the year ended December 31, 2009, the Corporation recognized $0.6 million of performance shares expense, with a tax benefi t of $0.1 million (2008 - $0.9 million, with a tax benefi t of $0.4 million). The total unrecognized compensation cost related to non-vested restricted stock awards and performance shares to members of management as of December 31, 2009 was $5.0 million and is expected to be recognized over a weighted-average period of 2.32 years.
The following table summarizes the restricted stock activity under the Incentive Plan for members of the Board of Directors:
Restricted Weighted-Average Stock Grant Date Fair ValueNon-vested at January 1, 2007 76,614 $22.02Granted 38,427 15.89Vested (115,041) 19.97Forfeited - -Non-vested at December 31, 2007 - -Granted 56,025 $10.75Vested (56,025) 10.75Forfeited - -Non-vested at December 31, 2008 - -Granted 270,515 $2.62Vested (270,515) 2.62Forfeited - -Non-vested at December 31, 2009 - -
During the year ended December 31, 2009, the Corporation granted 270,515 (2008 - 56,025; 2007 - 38,427) shares of restricted stock to members of the Board of Directors of Popular, Inc. and BPPR, which became vested at grant date. During this period, the Corporation recognized $0.5 million of restricted stock expense related to these restricted stock grants, with a tax benefi t of $0.2 million (2008 - $0.5 million, with a tax benefi t of $0.2 million; 2007 - $0.5 million, with a tax benefi t of $0.2 million). The fair value at vesting date of the restricted stock vested during the year ended December 31, 2009 for directors was $0.7 million.
Note 29 - Rental expense and commitments:At December 31, 2009, the Corporation was obligated under a number of non-cancelable leases for land, buildings, and equipment which require rentals (net of related sublease rentals) as follows:
Minimum Sublease Year payments rentals Net (In thousands)2010 $39,001 $1,184 $37,8172011 35,136 741 34,3952012 33,615 701 32,9142013 31,678 701 30,9772014 28,380 581 27,799Later years 193,446 913 192,533
$361,256 $4,821 $356,435
Total rental expense for the year ended December 31, 2009 was $65.6 million (2008 - $79.5 million; 2007 - $71.1 million), which is included in net occupancy, equipment and communication expenses, according to their nature.
Note 30 - Income tax:The components of income tax expense for the continuing operations for the years ended December 31, are summarized below.
(In thousands) 2009 2008 2007
Current income tax expense:Puerto Rico $75,368 $91,609 $157,436Federal and States 3,012 5,106 7,302 Subtotal 78,380 96,715 164,738
Deferred income tax (benefi t) expense:Puerto Rico (67,098) (70,403) (11,982)Federal and States (19,584) 2,507 (62,592)Valuation allowance - initial recognition - 432,715 - Subtotal (86,682) 364,819 (74,574)
Total income tax (benefi t) expense ($8,302) $461,534 $90,164
BOA22177_wo18_Popular.indd 147 3/3/2010 10:46:56 AM

148 POPULAR, INC. 2009 ANNUAL REPORT
The reasons for the difference between the income tax (benefi t) expense applicable to income before provision for income taxes and the amount computed by applying the statutory tax rate in Puerto Rico, were as follows:
2009 2008 2007 % of % of % of pre-tax pre-tax pre-tax(Dollars in thousands) Amount loss Amount income Amount incomeComputed income tax at statutory rates ($230,241) 41% ($85,384) 39% $114,142 39%Benefi ts of net tax-exempt interest income (50,261) 9 (62,600) 29 (60,304) (21)Effect of income subject to capital gain tax rate (59,843) 10 (17,905) 8 (24,555) (9)Non deductible goodwill impairment - - - - 57,544 20Deferred tax asset valuation allowance 282,933 (50) 643,011 (294) - -Adjustment in deferred tax due to change in tax rate (12,351) 2 - - - -Difference in tax rates due to multiple jurisdictions 40,625 (7) 16,398 (8) 10,391 4 States taxes and other 20,836 (4) (31,986) 15 (7,054) (2)Income tax (benefi t) expense ($8,302) 1% $461,534 (211%) $90,164 31%
Deferred income taxes refl ect the net tax effects of temporary differences between the carrying amounts of assets and liabilities for fi nancial reporting purposes and their tax bases. Signifi cant components of the Corporation’s deferred tax assets and liabilities at December 31, were as follows:
(In thousands) 2009 2008Deferred tax assets:Tax credits available for carryforward $11,026 $74,676Net operating loss and donation carryforward available 843,968 670,326Postretirement and pension benefi ts 103,979 149,027Fair value option - 13,132Deferred loan origination fees 7,880 8,603Allowance for loan losses 536,277 368,690Deferred gains 14,040 18,307Accelerated depreciation 2,418 -Intercompany deferred gains 7,015 11,263Other temporary differences 39,096 37,951 Total gross deferred tax assets 1,565,699 1,351,975
Deferred tax liabilities:Differences between the assigned values and the tax bases of assets and liabilities recognized in purchase business combinations 25,896 21,017Unrealized net gain on trading and available-for-sale securities 30,323 78,761Deferred loan origination costs 9,708 11,228Accelerated depreciation - 9,348Other temporary differences 5,923 13,232 Total gross deferred tax liabilities 71,850 133,586 Valuation allowance 1,129,882 861,018
Net deferred tax asset $363,967 $357,371
The net deferred tax asset shown in the table above at December 31, 2009 is refl ected in the consolidated statements of condition as $364 million in net deferred tax assets (in the “other assets” caption) (2008 - $357.5 million in deferred tax asset in the “other assets” caption and $136 thousand in deferred tax liabilities in the “other liabilities” caption), refl ecting the aggregate deferred tax assets or liabilities of individual tax-paying subsidiaries of the Corporation.
At December 31, 2009, the Corporation had total tax credits of $11 million that will reduce the regular income tax liability in future years expiring in annual installments through the year 2015.
BOA22177_wo18_Popular.indd 148 3/3/2010 10:46:56 AM
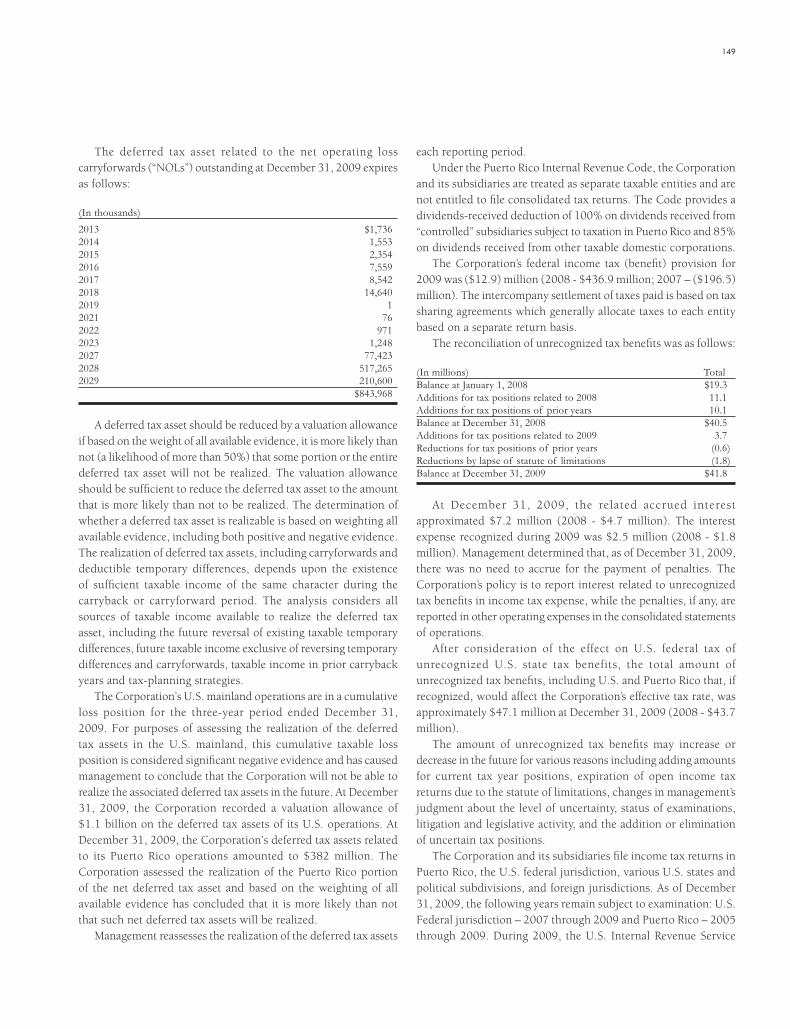
149
The deferred tax asset related to the net operating loss carryforwards (“NOLs”) outstanding at December 31, 2009 expires as follows:
(In thousands)2013 $1,7362014 1,5532015 2,3542016 7,5592017 8,5422018 14,6402019 12021 762022 9712023 1,2482027 77,4232028 517,2652029 210,600 $843,968
A deferred tax asset should be reduced by a valuation allowance if based on the weight of all available evidence, it is more likely than not (a likelihood of more than 50%) that some portion or the entire deferred tax asset will not be realized. The valuation allowance should be suffi cient to reduce the deferred tax asset to the amount that is more likely than not to be realized. The determination of whether a deferred tax asset is realizable is based on weighting all available evidence, including both positive and negative evidence. The realization of deferred tax assets, including carryforwards and deductible temporary differences, depends upon the existence of suffi cient taxable income of the same character during the carryback or carryforward period. The analysis considers all sources of taxable income available to realize the deferred tax asset, including the future reversal of existing taxable temporary differences, future taxable income exclusive of reversing temporary differences and carryforwards, taxable income in prior carryback years and tax-planning strategies.
The Corporation’s U.S. mainland operations are in a cumulative loss position for the three-year period ended December 31, 2009. For purposes of assessing the realization of the deferred tax assets in the U.S. mainland, this cumulative taxable loss position is considered signifi cant negative evidence and has caused management to conclude that the Corporation will not be able to realize the associated deferred tax assets in the future. At December 31, 2009, the Corporation recorded a valuation allowance of $1.1 billion on the deferred tax assets of its U.S. operations. At December 31, 2009, the Corporation’s deferred tax assets related to its Puerto Rico operations amounted to $382 million. The Corporation assessed the realization of the Puerto Rico portion of the net deferred tax asset and based on the weighting of all available evidence has concluded that it is more likely than not that such net deferred tax assets will be realized.
Management reassesses the realization of the deferred tax assets
each reporting period. Under the Puerto Rico Internal Revenue Code, the Corporation
and its subsidiaries are treated as separate taxable entities and are not entitled to fi le consolidated tax returns. The Code provides a dividends-received deduction of 100% on dividends received from “controlled” subsidiaries subject to taxation in Puerto Rico and 85% on dividends received from other taxable domestic corporations.
The Corporation’s federal income tax (benefi t) provision for 2009 was ($12.9) million (2008 - $436.9 million; 2007 – ($196.5) million). The intercompany settlement of taxes paid is based on tax sharing agreements which generally allocate taxes to each entity based on a separate return basis.
The reconciliation of unrecognized tax benefi ts was as follows:
(In millions) TotalBalance at January 1, 2008 $19.3Additions for tax positions related to 2008 11.1Additions for tax positions of prior years 10.1Balance at December 31, 2008 $40.5Additions for tax positions related to 2009 3.7Reductions for tax positions of prior years (0.6)Reductions by lapse of statute of limitations (1.8)Balance at December 31, 2009 $41.8
At December 31, 2009, the related accrued interest approximated $7.2 million (2008 - $4.7 million). The interest expense recognized during 2009 was $2.5 million (2008 - $1.8 million). Management determined that, as of December 31, 2009, there was no need to accrue for the payment of penalties. The Corporation’s policy is to report interest related to unrecognized tax benefi ts in income tax expense, while the penalties, if any, are reported in other operating expenses in the consolidated statements of operations.
After consideration of the effect on U.S. federal tax of unrecognized U.S. state tax benefits, the total amount of unrecognized tax benefi ts, including U.S. and Puerto Rico that, if recognized, would affect the Corporation’s effective tax rate, was approximately $47.1 million at December 31, 2009 (2008 - $43.7 million).
The amount of unrecognized tax benefi ts may increase or decrease in the future for various reasons including adding amounts for current tax year positions, expiration of open income tax returns due to the statute of limitations, changes in management’s judgment about the level of uncertainty, status of examinations, litigation and legislative activity, and the addition or elimination of uncertain tax positions.
The Corporation and its subsidiaries fi le income tax returns in Puerto Rico, the U.S. federal jurisdiction, various U.S. states and political subdivisions, and foreign jurisdictions. As of December 31, 2009, the following years remain subject to examination: U.S. Federal jurisdiction – 2007 through 2009 and Puerto Rico – 2005 through 2009. During 2009, the U.S. Internal Revenue Service
BOA22177_wo18_Popular.indd 149 3/3/2010 10:46:56 AM
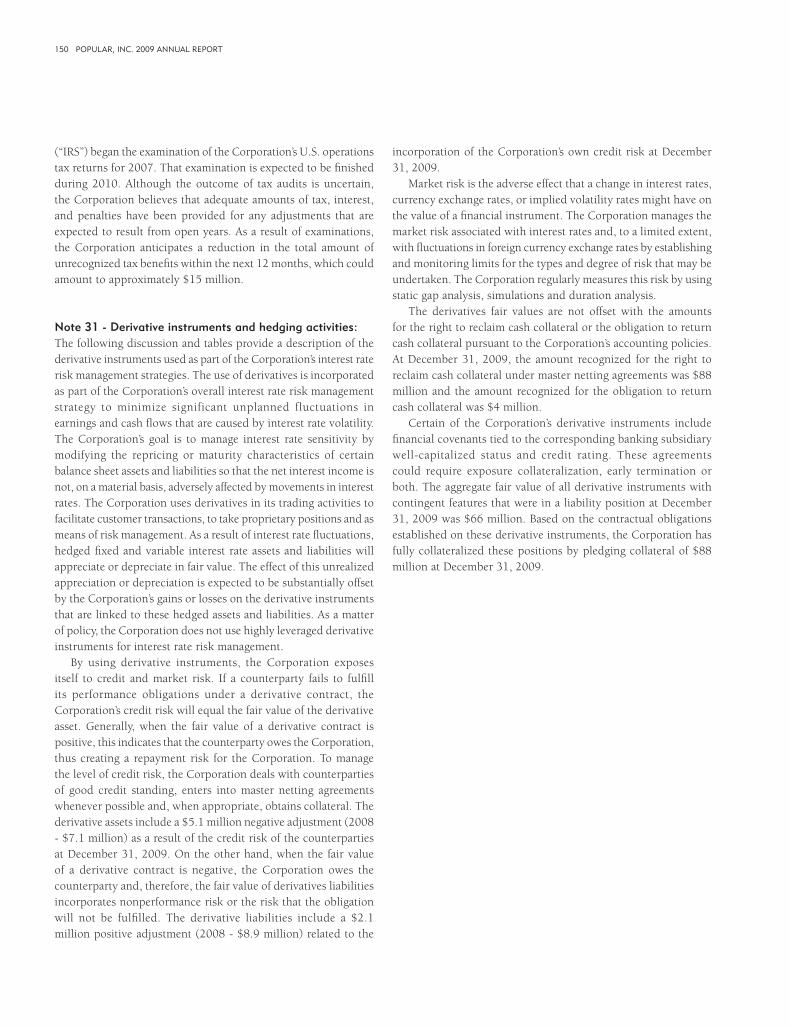
150 POPULAR, INC. 2009 ANNUAL REPORT
(“IRS”) began the examination of the Corporation’s U.S. operations tax returns for 2007. That examination is expected to be fi nished during 2010. Although the outcome of tax audits is uncertain, the Corporation believes that adequate amounts of tax, interest, and penalties have been provided for any adjustments that are expected to result from open years. As a result of examinations, the Corporation anticipates a reduction in the total amount of unrecognized tax benefi ts within the next 12 months, which could amount to approximately $15 million.
Note 31 - Derivative instruments and hedging activities:The following discussion and tables provide a description of the derivative instruments used as part of the Corporation’s interest rate risk management strategies. The use of derivatives is incorporated as part of the Corporation’s overall interest rate risk management strategy to minimize significant unplanned fluctuations in earnings and cash fl ows that are caused by interest rate volatility. The Corporation’s goal is to manage interest rate sensitivity by modifying the repricing or maturity characteristics of certain balance sheet assets and liabilities so that the net interest income is not, on a material basis, adversely affected by movements in interest rates. The Corporation uses derivatives in its trading activities to facilitate customer transactions, to take proprietary positions and as means of risk management. As a result of interest rate fl uctuations, hedged fi xed and variable interest rate assets and liabilities will appreciate or depreciate in fair value. The effect of this unrealized appreciation or depreciation is expected to be substantially offset by the Corporation’s gains or losses on the derivative instruments that are linked to these hedged assets and liabilities. As a matter of policy, the Corporation does not use highly leveraged derivative instruments for interest rate risk management.
By using derivative instruments, the Corporation exposes itself to credit and market risk. If a counterparty fails to fulfi ll its performance obligations under a derivative contract, the Corporation’s credit risk will equal the fair value of the derivative asset. Generally, when the fair value of a derivative contract is positive, this indicates that the counterparty owes the Corporation, thus creating a repayment risk for the Corporation. To manage the level of credit risk, the Corporation deals with counterparties of good credit standing, enters into master netting agreements whenever possible and, when appropriate, obtains collateral. The derivative assets include a $5.1 million negative adjustment (2008 - $7.1 million) as a result of the credit risk of the counterparties at December 31, 2009. On the other hand, when the fair value of a derivative contract is negative, the Corporation owes the counterparty and, therefore, the fair value of derivatives liabilities incorporates nonperformance risk or the risk that the obligation will not be fulfi lled. The derivative liabilities include a $2.1 million positive adjustment (2008 - $8.9 million) related to the
incorporation of the Corporation’s own credit risk at December 31, 2009.
Market risk is the adverse effect that a change in interest rates, currency exchange rates, or implied volatility rates might have on the value of a fi nancial instrument. The Corporation manages the market risk associated with interest rates and, to a limited extent, with fl uctuations in foreign currency exchange rates by establishing and monitoring limits for the types and degree of risk that may be undertaken. The Corporation regularly measures this risk by using static gap analysis, simulations and duration analysis.
The derivatives fair values are not offset with the amounts for the right to reclaim cash collateral or the obligation to return cash collateral pursuant to the Corporation’s accounting policies. At December 31, 2009, the amount recognized for the right to reclaim cash collateral under master netting agreements was $88 million and the amount recognized for the obligation to return cash collateral was $4 million.
Certain of the Corporation’s derivative instruments include fi nancial covenants tied to the corresponding banking subsidiary well-capitalized status and credit rating. These agreements could require exposure collateralization, early termination or both. The aggregate fair value of all derivative instruments with contingent features that were in a liability position at December 31, 2009 was $66 million. Based on the contractual obligations established on these derivative instruments, the Corporation has fully collateralized these positions by pledging collateral of $88 million at December 31, 2009.
BOA22177_wo18_Popular.indd 150 3/3/2010 10:46:56 AM
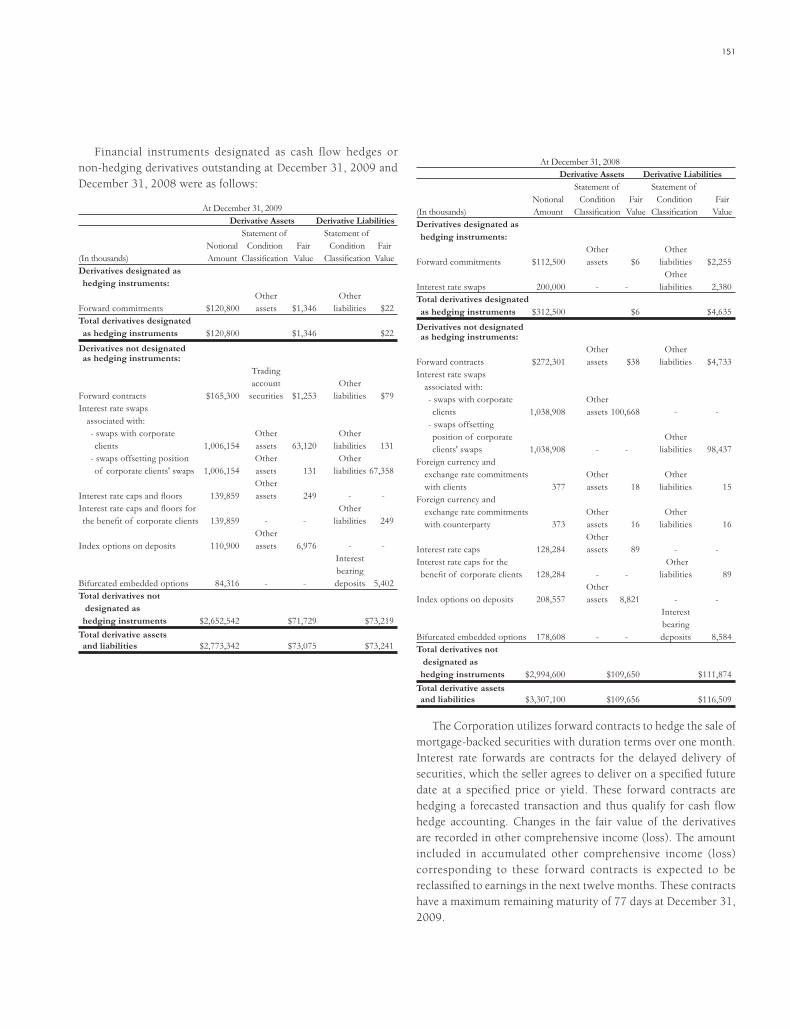
151
Financial instruments designated as cash flow hedges or non-hedging derivatives outstanding at December 31, 2009 and December 31, 2008 were as follows:
At December 31, 2009 Derivative Assets Derivative Liabilities Statement of Statement of Notional Condition Fair Condition Fair(In thousands) Amount Classifi cation Value Classifi cation ValueDerivatives designated as hedging instruments: Other OtherForward commitments $120,800 assets $1,346 liabilities $22Total derivatives designated as hedging instruments $120,800 $1,346 $22
Derivatives not designated as hedging instruments: Trading account OtherForward contracts $165,300 securities $1,253 liabilities $79Interest rate swaps associated with: - swaps with corporate Other Other clients 1,006,154 assets 63,120 liabilities 131 - swaps offsetting position Other Other of corporate clients' swaps 1,006,154 assets 131 liabilities 67,358 OtherInterest rate caps and fl oors 139,859 assets 249 - -Interest rate caps and fl oors for Other the benefi t of corporate clients 139,859 - - liabilities 249 OtherIndex options on deposits 110,900 assets 6,976 - - Interest bearingBifurcated embedded options 84,316 - - deposits 5,402Total derivatives not designated as hedging instruments $2,652,542 $71,729 $73,219Total derivative assets and liabilities $2,773,342 $73,075 $73,241
At December 31, 2008 Derivative Assets Derivative Liabilities Statement of Statement of Notional Condition Fair Condition Fair(In thousands) Amount Classifi cation Value Classifi cation ValueDerivatives designated as hedging instruments: Other OtherForward commitments $112,500 assets $6 liabilities $2,255 OtherInterest rate swaps 200,000 - - liabilities 2,380Total derivatives designated as hedging instruments $312,500 $6 $4,635
Derivatives not designated as hedging instruments: Other OtherForward contracts $272,301 assets $38 liabilities $4,733Interest rate swaps associated with: - swaps with corporate Other clients 1,038,908 assets 100,668 - - - swaps offsetting position of corporate Other clients' swaps 1,038,908 - - liabilities 98,437Foreign currency and exchange rate commitments Other Other with clients 377 assets 18 liabilities 15Foreign currency and exchange rate commitments Other Other with counterparty 373 assets 16 liabilities 16 OtherInterest rate caps 128,284 assets 89 - -Interest rate caps for the Other benefi t of corporate clients 128,284 - - liabilities 89 OtherIndex options on deposits 208,557 assets 8,821 - - Interest bearingBifurcated embedded options 178,608 - - deposits 8,584Total derivatives not designated as hedging instruments $2,994,600 $109,650 $111,874Total derivative assets and liabilities $3,307,100 $109,656 $116,509
The Corporation utilizes forward contracts to hedge the sale of mortgage-backed securities with duration terms over one month. Interest rate forwards are contracts for the delayed delivery of securities, which the seller agrees to deliver on a specifi ed future date at a specifi ed price or yield. These forward contracts are hedging a forecasted transaction and thus qualify for cash fl ow hedge accounting. Changes in the fair value of the derivatives are recorded in other comprehensive income (loss). The amount included in accumulated other comprehensive income (loss) corresponding to these forward contracts is expected to be reclassifi ed to earnings in the next twelve months. These contracts have a maximum remaining maturity of 77 days at December 31, 2009.
BOA22177_wo18_Popular.indd 151 3/3/2010 10:46:56 AM

152 POPULAR, INC. 2009 ANNUAL REPORT
For cash fl ow hedges, gains and losses on derivative contracts that are reclassifi ed from accumulated other comprehensive income (loss) to current period earnings are included in the line item in which the hedged item is recorded and in the same period in which the forecasted transaction affects earnings, as presented in the table below.
Year ended December 31, 2009 Classifi cation Amount of of gain (loss) gain (loss) Classifi cation recognized in recognized in in the income on income on Amount of statement of Amount of derivatives derivatives gain (loss) operations of gain (loss) (ineffective (ineffective recognized in the gain reclassifi ed portion and portion and OCI on (loss) reclassifi ed from AOCI amount amount derivatives from AOCI into into income excluded from excluded from (effective income (effective (effective effectiveness effectiveness(In thousands) portion) portion) portion) testing) testing)Forward commitments ($1,419) Trading account ($4,535) Trading account $125 profi t profi tInterest rate swaps - Interest expense (2,380) - -Total cash fl ow hedges ($1,419) ($6,915) $125OCI - "Other Comprehensive Income"AOCI - "Accumulated Other Comprehensive Income"
Fair Value HedgesAt December 31, 2009 and 2008, there were no derivatives designated as fair value hedges.
Non-Hedging ActivitiesFor the year ended December 31, 2009, the Corporation recognized a loss of $19.5 million related to its non-hedging derivatives, as detailed in the table below.
Classifi cation of gain Amount of gain (loss) recognized in (loss) recognized in(In thousands) income on derivatives income on derivativesForward contracts Trading account profi t ($12,485)Interest rate swap contracts Other operating income (6,468)Credit derivatives Other operating income (2,599)Foreign currency and exchange rate commitments Interest expense (4)Foreign currency and exchange rate commitments Other operating income 25Indexed options Interest expense 1,209Bifurcated embedded options Interest expense 788Total ($19,534)
Forward ContractsThe Corporation has forward contracts to sell mortgage-backed securities with terms lasting less than a month, which are accounted for as trading derivatives. Changes in their fair value are recognized in trading gains and losses.
Interest Rates Swaps and Foreign Currency and Exchange Rate CommitmentsIn addition to using derivative instruments as part of its interest rate risk management strategy, the Corporation also utilizes derivatives, such as interest rate swaps and foreign exchange contracts, in its capacity as an intermediary on behalf of its customers. The Corporation minimizes its market risk and credit risk by taking offsetting positions under the same terms and conditions with credit limit approvals and monitoring procedures. Market value changes on these swaps and other derivatives are recognized in income in the period of change.
Interest Rate CapsThe Corporation enters into interest rate caps as an intermediary on behalf of its customers and simultaneously takes offsetting positions under the same terms and conditions thus minimizing its market and credit risks.
Note 32 - Off-balance sheet activities and concentration of credit risk:Off-balance sheet riskThe Corporation is a party to fi nancial instruments with off-balance sheet credit risk in the normal course of business to meet the fi nancial needs of its customers. These fi nancial instruments include loan commitments, letters of credit, and standby letters of credit. These instruments involve, to varying degrees, elements of credit and interest rate risk in excess of the amount recognized in the consolidated statements of condition.
The Corporation’s exposure to credit loss in the event of nonperformance by the other party to the fi nancial instrument for commitments to extend credit, standby letters of credit and fi nancial guarantees written is represented by the contractual notional amounts of those instruments. The Corporation uses the same credit policies in making these commitments and conditional obligations as it does for those refl ected on the consolidated statements of condition.
Financial instruments with off-balance sheet credit risk at December 31, whose contract amounts represent potential credit risk were as follows:
(In thousands) 2009 2008Commitments to extend credit: Credit card lines $3,787,587 $3,571,404 Commercial lines of credit 2,826,762 2,960,174 Other unused credit commitments 398,799 585,399Commercial letters of credit 13,366 18,572Standby letters of credit 134,281 181,223Commitments to originate mortgage loans 47,941 71,297
BOA22177_wo18_Popular.indd 152 3/3/2010 10:46:56 AM
153
Commitments to extend creditContractual commitments to extend credit are legally binding agreements to lend money to customers for a specifi ed period of time. To extend credit, the Corporation evaluates each customer’s creditworthiness. The amount of collateral obtained, if deemed necessary, is based on management’s credit evaluation of the counterparty. Collateral held varies but may include cash, accounts receivable, inventory, property, plant and equipment and investment securities, among others. Since many of the loan commitments may expire without being drawn upon, the total commitment amount does not necessarily represent future cash requirements.
Letters of creditThere are two principal types of letters of credit: commercial and standby letters of credit. The credit risk involved in issuing letters of credit is essentially the same as that involved in extending loan facilities to customers.
In general, commercial letters of credit are short-term instruments used to fi nance a commercial contract for the shipment of goods from a seller to a buyer. This type of letter of credit ensures prompt payment to the seller in accordance with the terms of the contract. Although the commercial letter of credit is contingent upon the satisfaction of specifi ed conditions, it represents a credit exposure if the buyer defaults on the underlying transaction.
Standby letters of credit are issued by the Corporation to disburse funds to a third party benefi ciary if the Corporation’s customer fails to perform under the terms of an agreement with the benefi ciary. These letters of credit are used by the customer as a credit enhancement and typically expire without being drawn upon.
Other commitmentsAt December 31, 2009, the Corporation also maintained other non-credit commitments for $10 million, primarily for the acquisition of other investments (2008 - $10 million).
Geographic concentrationAt December 31, 2009, the Corporation had no significant concentrations of credit risk and no signifi cant exposure to highly leveraged transactions in its loan portfolio. Note 39 provides further information on the asset composition of the Corporation by geographical area at December 31, 2009 and 2008.
Included in total assets of Puerto Rico are investments in obligations of the U.S. Treasury and U.S. Government agencies amounting to $1.5 billion at December 31, 2009 (2008 - $4.7 billion).
Note 33 - Contingent liabilities:Legal ProceedingsThe Corporation and its subsidiaries are defendants in a number of legal proceedings arising in the ordinary course of business. Based on the opinion of legal counsel, management believes that the fi nal disposition of these matters, except for the matters described below which are in very early stages and management cannot currently predict their outcome, will not have a material adverse effect on the Corporation’s business, results of operations, fi nancial condition and liquidity.
Between May 14, 2009 and March 1, 2010, fi ve putative class actions and two derivative claims were fi led in the United States District Court for the District of Puerto Rico and the Puerto Rico Court of First Instance, San Juan Part, against Popular, Inc. and certain of its directors and offi cers, among others. The fi ve class actions have now been consolidated into two separate actions: a securities class action captioned Hoff v. Popular, Inc., et al. (consolidated with Otero v. Popular, Inc., et al.) and an ERISA class action entitled In re Popular, Inc. ERISA Litigation (comprised of the consolidated cases of Walsh v. Popular, Inc. et al.; Montañez v. Popular, Inc., et al.; and Dougan v. Popular, Inc., et al.). On October 19, 2009, plaintiffs in the Hoff case fi led a consolidated class action complaint which includes as defendants the underwriters in the May 2008 offering of Series B Preferred Stock. The consolidated action purports to be on behalf of purchasers of Popular’s securities between January 24, 2008 and February 19, 2009 and alleges that the defendants violated Section 10(b) of the Exchange Act, and Rule 10b-5 promulgated thereunder, and Section 20(a) of the Exchange Act by issuing a series of allegedly false and/or misleading statements and/or omitting to disclose material facts necessary to make statements made by the Corporation not false and misleading. The consolidated action also alleges that the defendants violated Section 11, Section 12(a)(2) and Section 15 of the Securities Act by making allegedly untrue statements and/or omitting to disclose material facts necessary to make statements made by the Corporation not false and misleading in connection with the May 2008 offering of Series B Preferred Stock. The consolidated securities class action complaint seeks class certifi cation, an award of compensatory damages and reasonable costs and expenses, including counsel fees. On January 11, 2010, Popular and the individual defendants moved to dismiss the consolidated securities class action complaint. On November 30, 2009, plaintiffs in the ERISA case fi led a consolidated class action complaint. The consolidated complaint purports to be on behalf of employees participating in the Popular, Inc. U.S.A. 401(k) Savings and Investment Plan and the Popular, Inc. Puerto Rico Savings and Investment Plan from January 24, 2008 to the date of the Complaint to recover losses pursuant to Sections 409 and 502(a)(2) of the Employee Retirement Income Security Act (ERISA) against Popular, certain directors, offi cers and members
BOA22177_wo18_Popular.indd 153 3/3/2010 10:46:56 AM
154 POPULAR, INC. 2009 ANNUAL REPORT
of plan committees, each of whom is alleged to be a plan fi duciary. The consolidated complaint alleges that the defendants breached their alleged fi duciary obligations by, among other things, failing to eliminate Popular stock as an investment alternative in the plans. The complaint seeks to recover alleged losses to the plans and equitable relief, including injunctive relief and a constructive trust, along with costs and attorneys’ fees. On December 21, 2009, and in compliance with a scheduling order issued by the Court, Popular and the individual defendants submitted an answer to the amended complaint. Shortly thereafter, on December 31, 2009, Popular and the individual defendants fi led a motion to dismiss the consolidated class action complaint or, in the alternative, for judgment on the pleadings. The derivative actions (García v. Carrión, et al. and Díaz v. Carrión, et al.) have been brought purportedly for the benefi t of nominal defendant Popular, Inc. against certain executive offi cers and directors and allege breaches of fi duciary duty, waste of assets and abuse of control in connection with our issuance of allegedly false and misleading fi nancial statements and fi nancial reports and the offering of the Series B Preferred Stock. The derivative complaints seek a judgment that the action is a proper derivative action, an award of damages and restitution, and costs and disbursements, including reasonable attorneys’ fees, costs and expenses. On October 9, 2009, the Court coordinated for purposes of discovery the García action and the consolidated securities class action. On October 15, 2009, Popular and the individual defendants moved to dismiss the García complaint for failure to make a demand on the Board of Directors prior to initiating litigation. On November 20, 2009, and pursuant to a stipulation among the parties, plaintiffs fi led an amended complaint, and on December 21, 2009, Popular and the individual defendants moved to dismiss the García amended complaint. The Díaz case, fi led in the Puerto Rico Court of First Instance, San Juan, has been removed to the U.S. District Court for the District of Puerto Rico. On October 13, 2009, Popular and the individual defendants moved to consolidate the García and Díaz actions. On October 26, 2009, plaintiff moved to remand the Díaz case to the Puerto Rico Court of First Instance and to stay defendants’ consolidation motion pending the outcome of the remand proceedings. At a scheduling conference held on January 14, 2010, the Court stayed discovery in both the Hoff and García matters pending resolution of their respective motions to dismiss.
At this early stage, it is not possible for management to assess the probability of an adverse outcome, or reasonably estimate the amount of any potential loss. It is possible that the ultimate resolution of these matters, if unfavorable, may be material to the Corporation’s results of operations.
Note 34 - Guarantees: The Corporation has obligations upon the occurrence of certain events under fi nancial guarantees provided in certain contractual agreements. These various arrangements are summarized below.
The Corporation issues fi nancial standby letters of credit and has risk participation in standby letters of credit issued by other fi nancial institutions, in each case to guarantee the performance of various customers to third parties. If the customer fails to meet its fi nancial or performance obligation to the third party under the terms of the contract, then, upon their request, the Corporation would be obligated to make the payment to the guaranteed party. At December 31, 2009 and 2008, the Corporation recorded a liability of $0.7 million, which represents the unamortized balance of the obligations undertaken in issuing the guarantees under the standby letters of credit issued or modifi ed after December 31, 2002. In accordance with the provisions of ASC Topic 460, the Corporation recognizes at fair value the obligation at inception of the standby letters of credit. The fair value approximates the fee received from the customer for issuing such commitments. These fees are deferred and are recognized over the commitment period. The contract amounts in standby letters of credit outstanding at December 31, 2009 and 2008, shown in Note 32, represent the maximum potential amount of future payments the Corporation could be required to make under the guarantees in the event of nonperformance by the customers. These standby letters of credit are used by the customer as a credit enhancement and typically expire without being drawn upon. The Corporation’s standby letters of credit are generally secured, and in the event of nonperformance by the customers, the Corporation has rights to the underlying collateral provided, which normally includes cash and marketable securities, real estate, receivables and others. Management does not anticipate any material losses related to these instruments.
The Corporation securitized mortgage loans into guaranteed mortgage-backed securities subject to limited, and in certain instances, lifetime credit recourse on the loans that serve as collateral for the mortgage-backed securities. Also, from time to time, the Corporation may sell, in bulk sale transactions, residential mortgage loans and SBA commercial loans subject to credit recourse or to certain representations and warranties from the Corporation to the purchaser. These representations and warranties may relate, for example, to borrower creditworthiness, loan documentation, collateral, prepayment and early payment defaults. The Corporation may be required to repurchase the loans under the credit recourse agreements or representation and warranties.
At December 31, 2009, the Corporation serviced $4.5 billion (2008 - $4.9 billion) in residential mortgage loans subject to credit recourse provisions, principally loans associated with FNMA and Freddie Mac programs. In the event of any customer default, pursuant to the credit recourse provided, the Corporation
BOA22177_wo18_Popular.indd 154 3/3/2010 10:46:56 AM

155
is required to repurchase the loan or reimburse the third party investor for the incurred loss. The maximum potential amount of future payments that the Corporation would be required to make under the recourse arrangements in the event of nonperformance by the borrowers is equivalent to the total outstanding balance of the residential mortgage loans serviced. During 2009, the Corporation repurchased approximately $47 million in mortgage loans subject to the credit recourse provisions. In the event of nonperformance by the borrower, the Corporation has rights to the underlying collateral securing the mortgage loan. The Corporation suffers losses on these loans when the proceeds from a foreclosure sale of the property underlying a defaulted mortgage loan are less than the outstanding principal balance of the loan plus any uncollected interest advanced and the costs of holding and disposing of the related property. Historically, the losses associated to these credit recourse arrangements, which pertained to residential mortgage loans in Puerto Rico, have not been signifi cant. At December 31, 2009, the Corporation’s liability established to cover the estimated credit loss exposure related to loans sold or serviced with credit recourse amounted to $16 million (2008 - $14 million).
When the Corporation sells or securitizes mortgage loans, it generally makes customary representations and warranties regarding the characteristics of the loans sold. The Corporation’s mortgage operations in Puerto Rico group conforming conventional mortgage loans into pools which are exchanged for FNMA and GNMA mortgage-backed securities, which are generally sold to private investors, or may sell the loans directly to FNMA or other private investors for cash. To the extent the loans do not meet specifi ed characteristics, investors are generally entitled to require the Corporation to repurchase such loans or indemnify the investor against losses if the assets do not meet certain guidelines. Quality review procedures are performed by the Corporation as required under the government agency programs to ensure that asset guideline qualifi cations are met. The Corporation has not recorded any specifi c contingent liability in the consolidated fi nancial statements for these customary representation and warranties related to loans sold by the Corporation’s mortgage operations in Puerto Rico, and management believes that, based on historical data, the probability of payments and expected losses under these representation and warranty arrangements is not signifi cant.
Servicing agreements relating to the mortgage-backed securities programs of FNMA, FHLMC and GNMA, and to mortgage loans sold or serviced to certain other investors, require the Corporation to advance funds to make scheduled payments of principal, interest, taxes and insurance, if such payments have not been received from the borrowers. At December 31, 2009, the Corporation serviced $17.7 billion (2008 - $17.6 billion) in mortgage loans, including the loans serviced with credit recourse. The Corporation generally recovers funds advanced pursuant to these arrangements from the mortgage owner, from liquidation
proceeds when the mortgage loan is foreclosed or, in the case of FHA/VA loans, under the applicable FHA and VA insurance and guarantee programs. However, in the interim, the Corporation must absorb the cost of the funds it advances during the time the advance is outstanding. The Corporation must also bear the costs of attempting to collect on delinquent and defaulted mortgage loans. In addition, if a defaulted loan is not cured, the mortgage loan will be canceled as part of the foreclosure proceedings and the Corporation will not receive any future servicing income with respect to that loan. At December 31, 2009, the amount of funds advanced by the Corporation under such servicing agreements was approximately $14 million (2008 - $11 million). To the extent the mortgage loans underlying the Corporation’s servicing portfolio experience increased delinquencies, the Corporation would be required to dedicate additional cash resources to comply with its obligation to advance funds as well as incur additional administrative costs related to increases in collection efforts.
At December 31, 2009, the Corporation established reserves for customary representation and warranties related to loans sold by its U.S. subsidiary E-LOAN. Loans had been sold to investors on a servicing released basis subject to certain representation and warranties. Although the risk of loss or default was generally assumed by the investors, the Corporation is required to make certain representations relating to borrower creditworthiness, loan documentation and collateral, which if not complied, may result in requiring the Corporation to repurchase the loans or indemnify investors for any related losses associated to these loans. The loans had been sold prior to 2009. At December 31, 2009, the Corporation’s reserve for estimated losses from such representation and warranty arrangements amounted to $33 million, which was included as part of other liabilities in the consolidated statement of condition (2008 - $6 million). E-LOAN is no longer originating and selling loans since the subsidiary ceased these activities during 2008. In 2009, the Corporation continued to reassess its estimate for expected losses associated to E-LOAN’s customary representation and warranty arrangements. The analysis incorporates expectations on future disbursements based on quarterly repurchases and make-whole events for the most recent two years, which refl ect the increase in claims resulting from the current deteriorated economic environment, including the real estate market. The analysis also considers factors such as the average time distance between the loan’s funding date and the loan repurchase date as observed in the historical loan data. During 2009, E-LOAN charged-off approximately $14 million to this representation and warranty reserve associated with loan repurchases and indemnifi cation or make-whole payments. Make-whole events are typically defaulted cases which the investor attempts to recover by collateral or guarantees, and the seller is obligated to cover any impaired or unrecovered portion of the loan.
BOA22177_wo18_Popular.indd 155 3/3/2010 10:46:56 AM
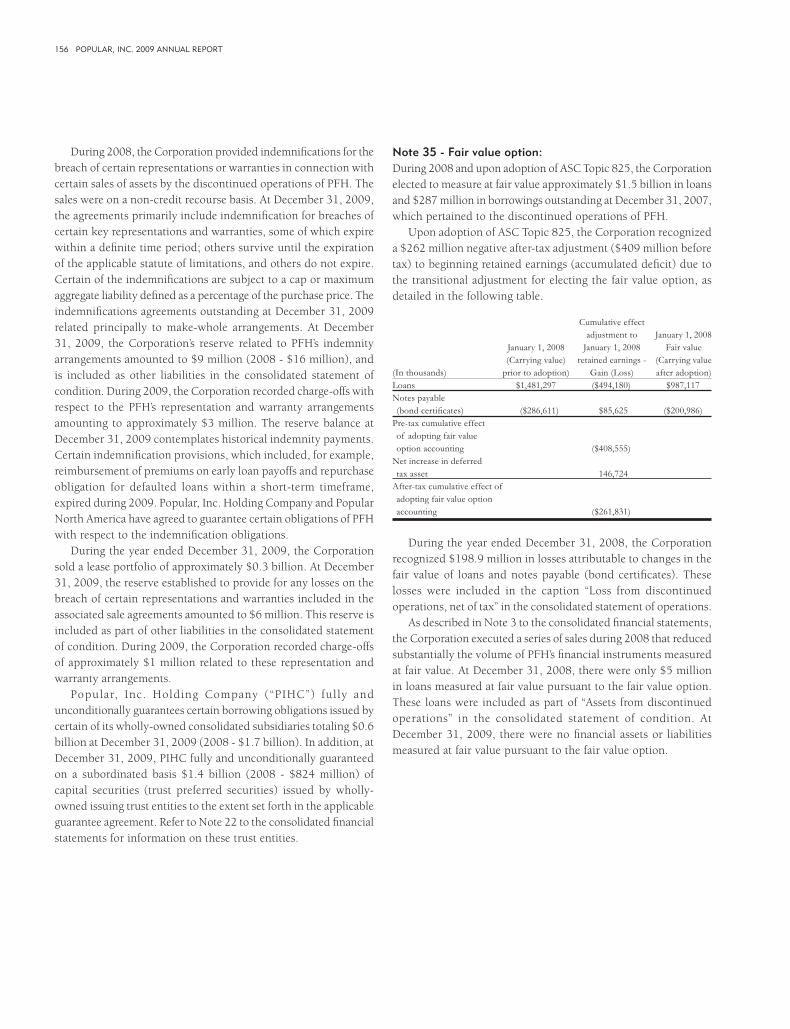
156 POPULAR, INC. 2009 ANNUAL REPORT
During 2008, the Corporation provided indemnifi cations for the breach of certain representations or warranties in connection with certain sales of assets by the discontinued operations of PFH. The sales were on a non-credit recourse basis. At December 31, 2009, the agreements primarily include indemnifi cation for breaches of certain key representations and warranties, some of which expire within a defi nite time period; others survive until the expiration of the applicable statute of limitations, and others do not expire. Certain of the indemnifi cations are subject to a cap or maximum aggregate liability defi ned as a percentage of the purchase price. The indemnifi cations agreements outstanding at December 31, 2009 related principally to make-whole arrangements. At December 31, 2009, the Corporation’s reserve related to PFH’s indemnity arrangements amounted to $9 million (2008 - $16 million), and is included as other liabilities in the consolidated statement of condition. During 2009, the Corporation recorded charge-offs with respect to the PFH’s representation and warranty arrangements amounting to approximately $3 million. The reserve balance at December 31, 2009 contemplates historical indemnity payments. Certain indemnifi cation provisions, which included, for example, reimbursement of premiums on early loan payoffs and repurchase obligation for defaulted loans within a short-term timeframe, expired during 2009. Popular, Inc. Holding Company and Popular North America have agreed to guarantee certain obligations of PFH with respect to the indemnifi cation obligations.
During the year ended December 31, 2009, the Corporation sold a lease portfolio of approximately $0.3 billion. At December 31, 2009, the reserve established to provide for any losses on the breach of certain representations and warranties included in the associated sale agreements amounted to $6 million. This reserve is included as part of other liabilities in the consolidated statement of condition. During 2009, the Corporation recorded charge-offs of approximately $1 million related to these representation and warranty arrangements.
Popular, Inc. Holding Company (“PIHC”) fully and unconditionally guarantees certain borrowing obligations issued by certain of its wholly-owned consolidated subsidiaries totaling $0.6 billion at December 31, 2009 (2008 - $1.7 billion). In addition, at December 31, 2009, PIHC fully and unconditionally guaranteed on a subordinated basis $1.4 billion (2008 - $824 million) of capital securities (trust preferred securities) issued by wholly-owned issuing trust entities to the extent set forth in the applicable guarantee agreement. Refer to Note 22 to the consolidated fi nancial statements for information on these trust entities.
Note 35 - Fair value option:During 2008 and upon adoption of ASC Topic 825, the Corporation elected to measure at fair value approximately $1.5 billion in loans and $287 million in borrowings outstanding at December 31, 2007, which pertained to the discontinued operations of PFH.
Upon adoption of ASC Topic 825, the Corporation recognized a $262 million negative after-tax adjustment ($409 million before tax) to beginning retained earnings (accumulated defi cit) due to the transitional adjustment for electing the fair value option, as detailed in the following table. Cumulative effect adjustment to January 1, 2008 January 1, 2008 January 1, 2008 Fair value (Carrying value) retained earnings - (Carrying value(In thousands) prior to adoption) Gain (Loss) after adoption)Loans $1,481,297 ($494,180) $987,117Notes payable (bond certifi cates) ($286,611) $85,625 ($200,986)Pre-tax cumulative effect of adopting fair value option accounting ($408,555)Net increase in deferred tax asset 146,724After-tax cumulative effect of adopting fair value option accounting ($261,831)
During the year ended December 31, 2008, the Corporation recognized $198.9 million in losses attributable to changes in the fair value of loans and notes payable (bond certifi cates). These losses were included in the caption “Loss from discontinued operations, net of tax” in the consolidated statement of operations.
As described in Note 3 to the consolidated fi nancial statements, the Corporation executed a series of sales during 2008 that reduced substantially the volume of PFH’s fi nancial instruments measured at fair value. At December 31, 2008, there were only $5 million in loans measured at fair value pursuant to the fair value option. These loans were included as part of “Assets from discontinued operations” in the consolidated statement of condition. At December 31, 2009, there were no fi nancial assets or liabilities measured at fair value pursuant to the fair value option.
BOA22177_wo18_Popular.indd 156 3/3/2010 10:46:56 AM

157
Note 36 - Fair value measurement:ASC Subtopic 820-10 “Fair Value Measurements and Disclosures” establishes a fair value hierarchy that prioritizes the inputs to valuation techniques used to measure fair value into three levels in order to increase consistency and comparability in fair value measurements and disclosures. The hierarchy is broken down into three levels based on the reliability of inputs as follows:
• Level 1- Unadjusted quoted prices in active markets for identical assets or liabilities that the Corporation has the ability to access at the measurement date. Valuation on these instruments does not necessitate a significant degree of judgment since valuations are based on quoted prices that are readily available in an active market.
• Level 2- Quoted prices other than those included in Level 1 that are observable either directly or indirectly. Level 2 inputs include quoted prices for similar assets or liabilities in active markets, quoted prices for identical or similar assets or liabilities in markets that are not active, or other inputs that are observable or that can be corroborated by observable market data for substantially the full term of the fi nancial instrument.
• Level 3- Inputs are unobservable and significant to the fair value measurement. Unobservable inputs refl ect the Corporation’s own assumptions about assumptions that
market participants would use in pricing the asset or liability.The Corporation maximizes the use of observable inputs and
minimizes the use of unobservable inputs by requiring that the observable inputs be used when available. Fair value is based upon quoted market prices when available. If listed price or quotes are not available, the Corporation employs internally-developed models that primarily use market-based inputs including yield curves, interest rates, volatilities, and credit curves, among others. Valuation adjustments are limited to those necessary to ensure that the fi nancial instrument’s fair value is adequately representative of the price that would be received or paid in the marketplace. These adjustments include amounts that refl ect counterparty credit quality, the Corporation’s credit standing, constraints on liquidity
and unobservable parameters that are applied consistently. The estimated fair value may be subjective in nature and
may involve uncertainties and matters of signifi cant judgment for certain fi nancial instruments. Changes in the underlying assumptions used in calculating fair value could signifi cantly affect the results.
The Corporation adopted the provisions of ASC Subtopic 820-10 for nonfi nancial assets and nonfi nancial liabilities that are recognized or disclosed at fair value on nonrecurring basis on January 1, 2009.
Fair Value on a Recurring BasisThe following fair value hierarchy tables present information about the Corporation’s assets and liabilities measured at fair value on a recurring basis as of December 31, 2009 and 2008:
At December 31, 2009 Balance at December 31,(In millions) Level 1 Level 2 Level 3 2009AssetsContinuing Operations Investment securities available-for-sale: U.S. Treasury securities - $30 - $30 Obligations of U.S. Government sponsored entities - 1,648 - 1,648 Obligations of Puerto Rico, States and political subdivisions - 81 - 81 Collateralized mortgage obligations - federal agencies - 1,600 - 1,600 Collateralized mortgage obligations - private label - 118 - 118 Mortgage-backed securities - 3,176 $34 3,210 Equity securities $3 5 - 8Total investment securities available-for-sale $3 $6,658 $34 $6,695 Trading account securities, excluding derivatives: Obligations of Puerto Rico, States and political subdivisions - $13 - $13 Collateralized mortgage obligations 1 $3 4 Residential mortgage-backed securities - federal agencies - 208 224 432 Other - 9 3 12Total trading account securities - $231 $230 $461Mortgage servicing rights - - $170 $170Derivatives - $73 - 73Total $3 $6,962 $434 $7,399
LiabilitiesContinuing Operations Derivatives - ($73) - ($73)Total - ($73) - ($73)
BOA22177_wo18_Popular.indd 157 3/3/2010 10:46:56 AM

158 POPULAR, INC. 2009 ANNUAL REPORT
At December 31, 2008 Balance at December 31,(In millions) Level 1 Level 2 Level 3 2008AssetsContinuing Operations Investment securities available-for-sale: U.S. Treasury securities - $502 - $502 Obligations of U.S. Government sponsored entities - 4,807 - 4,807 Obligations of Puerto Rico, States and political subdivisions - 101 - 101 Collateralized mortgage obligations - federal agencies - 1,507 - 1,507 Collateralized mortgage obligations - private label - 149 - 149 Mortgage-backed securities - 812 $37 849 Equity securities $5 5 - 10Total investment securities available-for-sale $5 $7,883 $37 $7,925 Trading account securities, excluding derivatives: U.S. Treasury securities and obligations of U.S. Government sponsored entities - $3 - $3 Obligations of Puerto Rico, States and political subdivisions - 28 - 28 Collateralized mortgage obligations - 2 $3 5 Residential mortgage-backed securities - federal agencies - 296 292 588 Commercial paper - 5 - 5 Other - 12 5 17Total trading account securities - $346 $300 $646Mortgage servicing rights - - $176 $176Derivatives - $110 - 110Discontinued OperationsLoans measured at fair value pursuant to fair value option - - $5 $5Total $5 $8,339 $518 $8,862
LiabilitiesContinuing Operations Derivatives - ($117) - ($117)Total - ($117) - ($117)
The following tables present the changes in Level 3 assets and liabilities measured at fair value on a recurring basis for the years ended December 31, 2009 and 2008.
BOA22177_wo18_Popular.indd 158 3/3/2010 10:46:57 AM

159
Year ended December 31, 2009
(In millions)
Balance at
January 1, 2009
Gains (losses) included
in earnings
Gains (losses) included in
other comprehensive
income
Increase (decrease) in accrued
interest receivable
Purchases, sales,
issuances, settlements, paydowns
and maturities (net)
Balance at
December 31, 2009
Changes in unrealized
gains (losses) included in
earnings related to assets still held as of
December 31, 2009
Assets
Continuing Operations Investment securities available-for-sale:
Mortgage-backed securities $37 - - - ($3) $34 -
Total investment securities available-for-sale $37 - - - ($3) $34 -
Trading account securities:
Collateralized mortgage obligations Residential mortgage-backed securities-federal agencies Other
$3292
5
- $3 (1)
---
---
- ($71) (1)
$3 224 3
- $6
-(a)
Total trading account securities $300 $2 - - ($72) $230 $6
Mortgage servicing rights $176 ($31) - - $25 $170 ($18) (c)
Discontinued OperationsLoans measured at fair value pursuant to fair value option $5 $1 - - ($6) - - (b)
Total $518 ($28) - - ($56) $434 ($12)
a) Gains (losses) are included in “Trading account profi t” in the statement of operationsb) Gains (losses) are included in “Loss from discontinued operations, net of tax” in the statement of operationsc) Gains (losses) are included in “Other service fees” in the statement of operations
BOA22177_wo18_Popular.indd 159 3/3/2010 10:46:57 AM

160 POPULAR, INC. 2009 ANNUAL REPORT
Year ended December 31, 2008
(In millions)
Balance at
January 1, 2008
Gains (losses)included
in earnings
Gains (losses) included in
other comprehensive
income
Increase (decrease) in accrued
interest receivable /payable
Purchases, sales,
issuances, settlements, paydowns
and maturities
(net)
Balance at
December 31, 2008
Changes in unrealized gains (losses) included
in earnings related to assets
and liabilities still held as of December 31,
2008
Assets
Continuing Operations Investment securities available-for-sale:
Mortgage-backed securities $39 - $1 - ($3) $37 -
Total investment securities available-for-sale $39 - $1 - ($3) $37 -
Trading account securities:
Collateralized mortgage obligations Residential mortgage-backed securities-federal agencies Other
$3227
3
- $7
-
---
---
- $58 2
$3 292 5
- $5
-(a)
Total trading account securities $233 $7 - - $60 $300 $5
Mortgage servicing rights $111 ($27) - - $92 $176 ($16) (c)
Discontinued Operations Residual interests available-for-sale Residual interests-trading Mortgage servicing rights Loans measured at fair value pursuant to fair value option
$44081
987
($4) (32) (44) (188)
----
---
($13)
- ($8) (37) (781)
---
$5
---
($38)
(b)(b)(b)(b)
Total $1,495 ($288) $1 ($13) ($677) $518 ($49)
Liabilities
Discontinued Operations Notes payable measured at fair value pursuant to fair value option ($201) ($11) - - $212 - - (b)
Total ($201) ($11) - - $212 - -
a) Gains (losses) are included in “Trading account profi t” in the statement of operationsb) Gains (losses) are included in “Loss from discontinued operations, net of tax” in the statement of operationsc) Gains (losses) are included in “Other service fees” in the statement of operations
BOA22177_wo18_Popular.indd 160 3/3/2010 10:46:57 AM
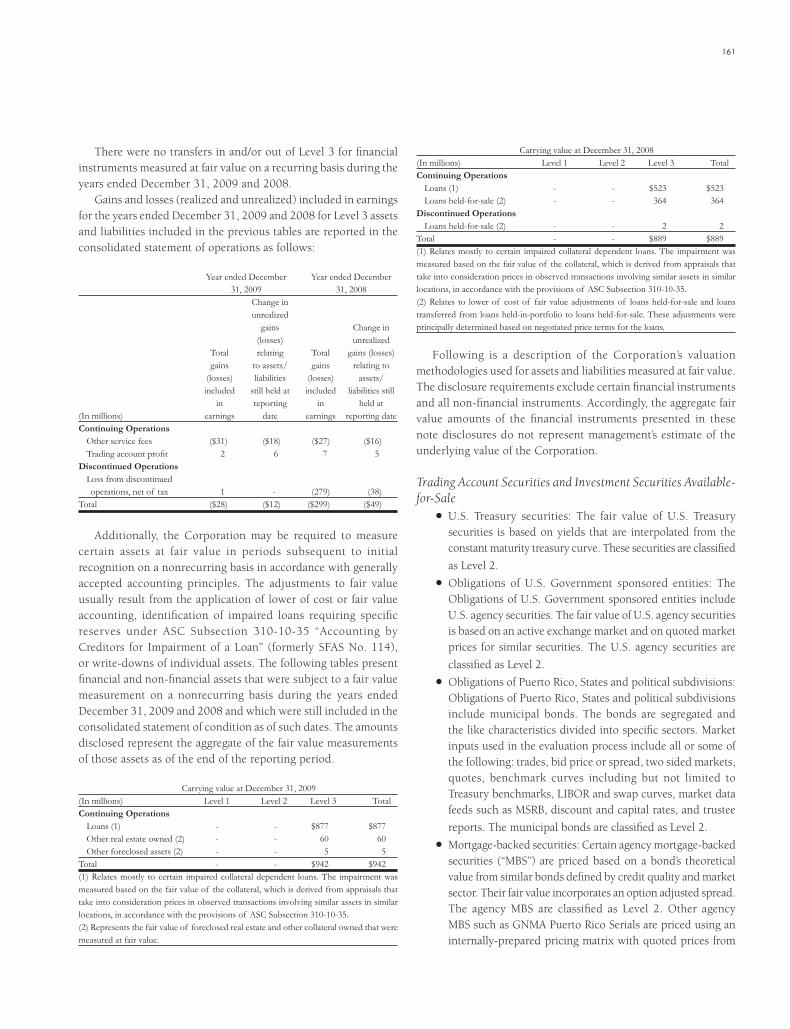
161
There were no transfers in and/or out of Level 3 for fi nancial instruments measured at fair value on a recurring basis during the years ended December 31, 2009 and 2008.
Gains and losses (realized and unrealized) included in earnings for the years ended December 31, 2009 and 2008 for Level 3 assets and liabilities included in the previous tables are reported in the consolidated statement of operations as follows:
Year ended December Year ended December 31, 2009 31, 2008 Change in unrealized gains Change in (losses) unrealized Total relating Total gains (losses) gains to assets/ gains relating to (losses) liabilities (losses) assets/ included still held at included liabilities still in reporting in held at(In millions) earnings date earnings reporting dateContinuing Operations Other service fees ($31) ($18) ($27) ($16) Trading account profi t 2 6 7 5Discontinued Operations Loss from discontinued operations, net of tax 1 - (279) (38)Total ($28) ($12) ($299) ($49)
Additionally, the Corporation may be required to measure certain assets at fair value in periods subsequent to initial recognition on a nonrecurring basis in accordance with generally accepted accounting principles. The adjustments to fair value usually result from the application of lower of cost or fair value accounting, identifi cation of impaired loans requiring specifi c reserves under ASC Subsection 310-10-35 “Accounting by Creditors for Impairment of a Loan” (formerly SFAS No. 114), or write-downs of individual assets. The following tables present fi nancial and non-fi nancial assets that were subject to a fair value measurement on a nonrecurring basis during the years ended December 31, 2009 and 2008 and which were still included in the consolidated statement of condition as of such dates. The amounts disclosed represent the aggregate of the fair value measurements of those assets as of the end of the reporting period.
Carrying value at December 31, 2009(In millions) Level 1 Level 2 Level 3 TotalContinuing Operations Loans (1) - - $877 $877 Other real estate owned (2) - - 60 60 Other foreclosed assets (2) - - 5 5Total - - $942 $942(1) Relates mostly to certain impaired collateral dependent loans. The impairment was measured based on the fair value of the collateral, which is derived from appraisals that take into consideration prices in observed transactions involving similar assets in similar locations, in accordance with the provisions of ASC Subsection 310-10-35.(2) Represents the fair value of foreclosed real estate and other collateral owned that were measured at fair value.
Carrying value at December 31, 2008(In millions) Level 1 Level 2 Level 3 TotalContinuing Operations Loans (1) - - $523 $523 Loans held-for-sale (2) - - 364 364Discontinued Operations Loans held-for-sale (2) - - 2 2Total - - $889 $889(1) Relates mostly to certain impaired collateral dependent loans. The impairment was measured based on the fair value of the collateral, which is derived from appraisals that take into consideration prices in observed transactions involving similar assets in similar locations, in accordance with the provisions of ASC Subsection 310-10-35.(2) Relates to lower of cost of fair value adjustments of loans held-for-sale and loans transferred from loans held-in-portfolio to loans held-for-sale. These adjustments were principally determined based on negotiated price terms for the loans.
Following is a description of the Corporation’s valuation methodologies used for assets and liabilities measured at fair value. The disclosure requirements exclude certain fi nancial instruments and all non-fi nancial instruments. Accordingly, the aggregate fair value amounts of the fi nancial instruments presented in these note disclosures do not represent management’s estimate of the underlying value of the Corporation.
Trading Account Securities and Investment Securities Available-for-Sale
• U.S. Treasury securities: The fair value of U.S. Treasury securities is based on yields that are interpolated from the constant maturity treasury curve. These securities are classifi ed
as Level 2.
• Obligations of U.S. Government sponsored entities: The Obligations of U.S. Government sponsored entities include U.S. agency securities. The fair value of U.S. agency securities is based on an active exchange market and on quoted market prices for similar securities. The U.S. agency securities are
classifi ed as Level 2.
• Obligations of Puerto Rico, States and political subdivisions: Obligations of Puerto Rico, States and political subdivisions include municipal bonds. The bonds are segregated and the like characteristics divided into specifi c sectors. Market inputs used in the evaluation process include all or some of the following: trades, bid price or spread, two sided markets, quotes, benchmark curves including but not limited to Treasury benchmarks, LIBOR and swap curves, market data feeds such as MSRB, discount and capital rates, and trustee
reports. The municipal bonds are classifi ed as Level 2.
• Mortgage-backed securities: Certain agency mortgage-backed securities (“MBS”) are priced based on a bond’s theoretical value from similar bonds defi ned by credit quality and market sector. Their fair value incorporates an option adjusted spread. The agency MBS are classifi ed as Level 2. Other agency MBS such as GNMA Puerto Rico Serials are priced using an internally-prepared pricing matrix with quoted prices from
BOA22177_wo18_Popular.indd 161 3/3/2010 10:46:57 AM

162 POPULAR, INC. 2009 ANNUAL REPORT
local brokers dealers. These particular MBS are classifi ed as
Level 3.
• Collateralized mortgage obligations: Agency and private collateralized mortgage obligations (“CMOs”) are priced based on a bond’s theoretical value from similar bonds defi ned by credit quality and market sector and for which fair value incorporates an option adjusted spread. The option adjusted spread model includes prepayment and volatility assumptions, ratings (whole loans collateral) and spread adjustments. These
investment securities are classifi ed as Level 2.
• Equity securities: Equity securities with quoted market prices obtained from an active exchange market are classifi ed as Level 1. Other equity securities that do not trade in highly liquid
markets are classifi ed as Level 2.
• Corporate securities and mutual funds (included as “other” in the “trading account securities” category): Quoted prices for these security types are obtained from broker dealers. Given that the quoted prices are for similar instruments or do not trade in highly liquid markets, the corporate securities and mutual funds are classifi ed as Level 2. The important variables in determining the prices of Puerto Rico tax-exempt mutual fund shares are net asset value, dividend yield and type of assets in the fund. All funds trade based on a relevant dividend yield taking into consideration the aforementioned variables. In addition, demand and supply also affect the price. Corporate securities that trade less frequently or are in
distress are classifi ed as Level 3.
Derivatives Interest rate swaps, interest rate caps and index options are traded in over-the-counter active markets. These derivatives are indexed to an observable interest rate benchmark, such as LIBOR or equity indexes, and are priced using an income approach based on present value and option pricing models using observable inputs. Other derivatives are liquid and have quoted prices, such as forward contracts or “to be announced securities” (“TBAs”). All of these derivatives are classifi ed as Level 2. The nonperformance risk is determined using internally-developed models that consider the collateral held, the remaining term, and the creditworthiness of the entity that bears the risk, and uses available public data or internally-developed data related to current spreads that denote their probability of default.
Mortgage servicing rightsMortgage servicing rights (“MSRs”) do not trade in an active market with readily observable prices. MSRs are priced internally using a discounted cash fl ow model. The valuation model considers servicing fees, portfolio characteristics, prepayments assumptions, delinquency rates, late charges, other ancillary revenues, cost to
service and other economic factors. Due to the unobservable nature of certain valuation inputs, the MSRs are classifi ed as Level 3.
Loans held-in-portfolio considered impaired under ASC Subsection 310-10-35 that are collateral dependentThe impairment is measured based on the fair value of the collateral, which is derived from appraisals that take into consideration prices in observed transactions involving similar assets in similar locations, in accordance with the provisions of ASC Subsection 310-10-35. Currently, the associated loans considered impaired are classifi ed as Level 3.
Loans measured at fair value pursuant to lower of cost or fair value adjustmentsLoans measured at fair value on a nonrecurring basis pursuant to lower of cost or fair value were priced based on bids received from potential buyers, secondary market prices, and discounting cash fl ow models which incorporate internally-developed assumptions for prepayments and credit loss estimates. These loans were classifi ed as Level 3.
Other real estate owned and other foreclosed assets Other real estate owned includes real estate properties securing mortgage, consumer, and commercial loans. Other foreclosed assets include automobiles securing auto loans. The fair value of foreclosed assets may be determined using an external appraisal, broker price opinion or an internal valuation. These foreclosed assets are classifi ed as Level 3 given certain internal adjustments that may be made to external appraisals.
Note 37 - Disclosures about fair value of financial instruments:The fair value of fi nancial instruments is the amount at which an asset or obligation could be exchanged in a current transaction between willing parties, other than in a forced or liquidation sale. Fair value estimates are made at a specifi c point in time based on the type of fi nancial instrument and relevant market information. Many of these estimates involve various assumptions and may vary signifi cantly from amounts that could be realized in actual transactions.
The information about the estimated fair values of fi nancial instruments presented hereunder excludes all nonfinancial instruments and certain other specifi c items.
Derivatives are considered fi nancial instruments and their carrying value equals fair value. For disclosures about the fair value of derivative instruments refer to Note 31 to the consolidated fi nancial statements.
For those fi nancial instruments with no quoted market prices available, fair values have been estimated using present value
BOA22177_wo18_Popular.indd 162 3/3/2010 10:46:57 AM

163
calculations or other valuation techniques, as well as management’s best judgment with respect to current economic conditions, including discount rates, estimates of future cash fl ows, and prepayment assumptions.
The fair values refl ected herein have been determined based on the prevailing interest rate environment as of December 31, 2009 and 2008, respectively. In different interest rate environments, fair value estimates can differ signifi cantly, especially for certain fi xed rate fi nancial instruments. In addition, the fair values presented do not attempt to estimate the value of the Corporation’s fee generating businesses and anticipated future business activities, that is, they do not represent the Corporation’s value as a going concern. Accordingly, the aggregate fair value amounts presented do not represent the underlying value of the Corporation. The methods and assumptions used to estimate the fair values of signifi cant fi nancial instruments at December 31, 2009 and 2008 are described in the paragraphs below.
Short-term fi nancial assets and liabilities have relatively short maturities, or no defi ned maturities, and little or no credit risk. The carrying amounts reported in the consolidated statements of condition approximate fair value because of the short-term maturity of those instruments or because they carry interest rates which approximate market. Included in this category are cash and due from banks, federal funds sold and securities purchased under agreements to resell, time deposits with other banks, bankers acceptances, federal funds purchased, assets sold under agreements to repurchase and short-term borrowings. Resell and repurchase agreements with long-term maturities are valued using discounted cash fl ows based on market rates currently available for agreements with similar terms and remaining maturities.
Trading and investment securities, except for investments classified as other investment securities in the consolidated statement of condition, are fi nancial instruments that regularly trade on secondary markets. The estimated fair value of these securities was determined using either market prices or dealer quotes, if available, or quoted market prices of fi nancial instruments with similar characteristics. Trading account securities and securities available-for-sale are reported at their respective fair values in the consolidated statements of condition. These instruments are detailed in the consolidated statements of condition and in Notes 7, 8 and 31.
The estimated fair value for loans held-for-sale was based on secondary market prices. The fair value of loans held-in-portfolio was determined for groups of loans with similar characteristics. Loans were segregated by type such as commercial, construction, residential mortgage, consumer and credit cards. Each loan category was further segmented based on loan characteristics, including interest rate terms, credit quality and vintage. Generally, the fair values were estimated based on an exit price by discounting scheduled cash fl ows for the segmented groups of loans using a
discount rate that considers interest, credit and expected return by market participants under current market conditions. Additionally, prepayment, default and recovery assumptions have been applied in the mortgage loan portfolio valuations. Generally accepted accounting principles do not require a fair valuation of the lease fi nancing portfolio, therefore it is included in the loans total at the carrying amount.
The fair value of deposits with no stated maturity, such as non-interest bearing demand deposits, savings, NOW, and money market accounts is, for purposes of this disclosure, equal to the amount payable on demand as of the respective dates. The fair value of certifi cates of deposit is based on the discounted value of contractual cash fl ows using interest rates being offered on certifi cates with similar maturities. The value of these deposits in a transaction between willing parties is in part dependent of the buyer’s ability to reduce the servicing cost and the attrition that sometimes occurs. Therefore, the amount a buyer would be willing to pay for these deposits could vary signifi cantly from the presented fair value.
Long-term borrowings were valued using discounted cash fl ows, based on market rates currently available for debt with similar terms and remaining maturities and in certain instances using quoted market rates for similar instruments at December 31, 2009 and 2008, respectively.
As part of the fair value estimation procedures of certain liabilities, including repurchase agreements (regular and structured) and FHLB advances, the Corporation considered, when applicable, the collateralization levels as part of its evaluation of nonperformance risk. Also, for certifi cates of deposit, the nonperformance risk was determined using internally-developed models that consider, when applicable, the collateral held, amounts insured, the remaining term and the credit premium of the institution.
Commitments to extend credit were valued using the fees currently charged to enter into similar agreements. For those commitments where a future stream of fees is charged, the fair value was estimated by discounting the projected cash fl ows of fees on commitments. The fair value of letters of credit is based on fees currently charged on similar agreements.
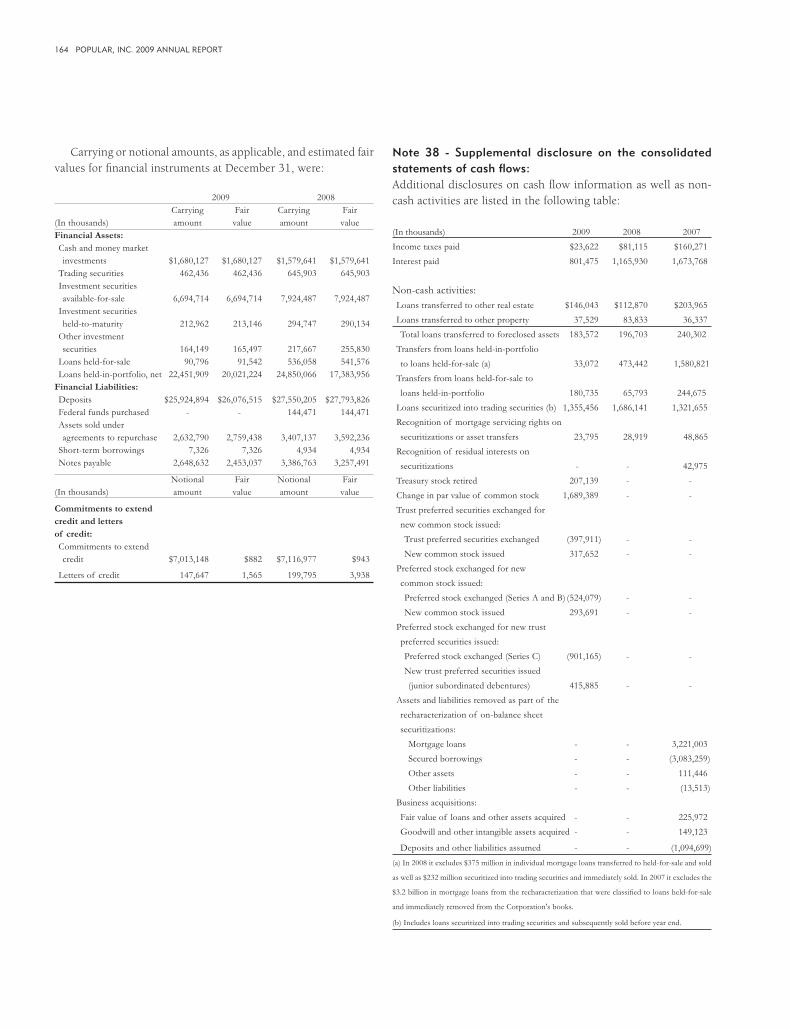
164 POPULAR, INC. 2009 ANNUAL REPORT
Carrying or notional amounts, as applicable, and estimated fair values for fi nancial instruments at December 31, were:
2009 2008 Carrying Fair Carrying Fair(In thousands) amount value amount valueFinancial Assets: Cash and money market investments $1,680,127 $1,680,127 $1,579,641 $1,579,641 Trading securities 462,436 462,436 645,903 645,903 Investment securities available-for-sale 6,694,714 6,694,714 7,924,487 7,924,487 Investment securities held-to-maturity 212,962 213,146 294,747 290,134 Other investment securities 164,149 165,497 217,667 255,830 Loans held-for-sale 90,796 91,542 536,058 541,576 Loans held-in-portfolio, net 22,451,909 20,021,224 24,850,066 17,383,956Financial Liabilities: Deposits $25,924,894 $26,076,515 $27,550,205 $27,793,826 Federal funds purchased - - 144,471 144,471 Assets sold under agreements to repurchase 2,632,790 2,759,438 3,407,137 3,592,236 Short-term borrowings 7,326 7,326 4,934 4,934 Notes payable 2,648,632 2,453,037 3,386,763 3,257,491
Notional Fair Notional Fair(In thousands) amount value amount value
Commitments to extendcredit and lettersof credit: Commitments to extend credit $7,013,148 $882 $7,116,977 $943
Letters of credit 147,647 1,565 199,795 3,938
Note 38 - Supplemental disclosure on the consolidated statements of cash fl ows: Additional disclosures on cash fl ow information as well as non-cash activities are listed in the following table:
(In thousands) 2009 2008 2007Income taxes paid $23,622 $81,115 $160,271Interest paid 801,475 1,165,930 1,673,768
Non-cash activities: Loans transferred to other real estate $146,043 $112,870 $203,965 Loans transferred to other property 37,529 83,833 36,337 Total loans transferred to foreclosed assets 183,572 196,703 240,302 Transfers from loans held-in-portfolio to loans held-for-sale (a) 33,072 473,442 1,580,821 Transfers from loans held-for-sale to loans held-in-portfolio 180,735 65,793 244,675 Loans securitized into trading securities (b) 1,355,456 1,686,141 1,321,655 Recognition of mortgage servicing rights on securitizations or asset transfers 23,795 28,919 48,865 Recognition of residual interests on securitizations - - 42,975 Treasury stock retired 207,139 - - Change in par value of common stock 1,689,389 - - Trust preferred securities exchanged for new common stock issued: Trust preferred securities exchanged (397,911) - - New common stock issued 317,652 - - Preferred stock exchanged for new common stock issued: Preferred stock exchanged (Series A and B) (524,079) - - New common stock issued 293,691 - - Preferred stock exchanged for new trust preferred securities issued: Preferred stock exchanged (Series C) (901,165) - - New trust preferred securities issued (junior subordinated debentures) 415,885 - - Assets and liabilities removed as part of the recharacterization of on-balance sheet securitizations: Mortgage loans - - 3,221,003 Secured borrowings - - (3,083,259) Other assets - - 111,446 Other liabilities - - (13,513) Business acquisitions: Fair value of loans and other assets acquired - - 225,972 Goodwill and other intangible assets acquired - - 149,123
Deposits and other liabilities assumed - - (1,094,699)(a) In 2008 it excludes $375 million in individual mortgage loans transferred to held-for-sale and sold
as well as $232 million securitized into trading securities and immediately sold. In 2007 it excludes the
$3.2 billion in mortgage loans from the recharacterization that were classifi ed to loans held-for-sale
and immediately removed from the Corporation's books.
(b) Includes loans securitized into trading securities and subsequently sold before year end.

165
Note 39 - Segment reporting:The Corporation’s corporate structure consists of three reportable segments – Banco Popular de Puerto Rico, Banco Popular North America and EVERTEC. These reportable segments pertain only to the continuing operations of Popular, Inc. The operations of Popular Financial Holdings, which were considered a reportable segment prior to 2008, were classifi ed as discontinued operations in 2008 through September 30, 2009. A corporate group has been defi ned to support the reportable segments. The Corporation retrospectively adjusted the 2007 information in the statements of operations to exclude the results from discontinued operations
to conform to the 2008 and 2009 presentation.Management determined the reportable segments based on
the internal reporting used to evaluate performance and to assess where to allocate resources. The segments were determined based on the organizational structure, which focuses primarily on the markets the segments serve, as well as on the products and services offered by the segments.
Banco Popular de Puerto Rico: Given that Banco Popular de Puerto Rico constitutes a signifi cant portion of the Corporation’s results of operations and total assets as of December 31, 2009, additional disclosures are provided for the business areas included in this reportable segment, as described below:
• Commercial banking represents the Corporation’s banking operations conducted at BPPR, which are targeted mainly to corporate, small and middle size businesses. It includes aspects of the lending and depository businesses, as well as other fi nance and advisory services. BPPR allocates funds across segments based on duration matched transfer pricing at market rates. This area also incorporates income related with the investment of excess funds, as well as a proportionate share of the investment function of BPPR.
• Consumer and retail banking represents the branch banking operations of BPPR which focus on retail clients. It includes the consumer lending business operations of BPPR, as well as the lending operations of Popular Auto and Popular Mortgage. Popular Auto focuses on auto and lease fi nancing, while Popular Mortgage focuses principally in residual mortgage loan originations. The consumer and retail banking area also incorporates income related with the investment of excess funds from the branch network, as well as a proportionate share of the investment function of BPPR.
• Other financial services include the trust and asset management service units of BPPR, the brokerage and
investment banking operations of Popular Securities, and the insurance agency and reinsurance businesses of Popular Insurance, Popular Insurance V.I., Popular Risk Services, and Popular Life Re. Most of the services that are provided by these
subsidiaries generate profi ts based on fee income.
Banco Popular North America: Banco Popular North America’s reportable segment consists of the banking operations of BPNA, E-LOAN, Popular Equipment Finance, Inc. and Popular Insurance Agency, U.S.A. Popular Equipment Finance, Inc. sold a substantial portion of its lease fi nancing portfolio during 2009 and also ceased originations as part of BPNA’s strategic plan. BPNA operates through a retail branch network in the U.S. mainland, while E-LOAN supports BPNA’s deposit gathering through its online platform. All direct lending activities at E-LOAN were ceased during the fourth quarter of 2008. Popular Insurance Agency, U.S.A. offers investment and insurance
services across the BPNA branch network. Due to the signifi cant losses in the E-LOAN operations during
2008 and 2009, and given the discontinuance of E-LOAN’s loan origination unit, its core business, management has determined to provide as additional disclosure the results of E-LOAN apart from the other BPNA subsidiaries.
EVERTEC: This reportable segment includes the financial transaction processing and technology functions of the Corporation, including EVERTEC, with offi ces in Puerto Rico, Florida, the Dominican Republic and Venezuela; and ATH Costa Rica, S.A., EVERTEC LATINOAMERICA, SOCIEDAD ANONIMA and T.I.I. Smart Solutions Inc. located in Costa Rica. In addition, this reportable segment includes the equity investments in Consorcio de Tarjetas Dominicanas, S.A. (“CONTADO”) and Servicios Financieros, S.A. de C.V. (“Serfi nsa”), which operate in the Dominican Republic and El Salvador, respectively. This segment provides processing and technology services to other units of the Corporation as well as to third parties, principally other fi nancial institutions in Puerto
Rico, the Caribbean and Central America. The Corporate group consists primarily of the holding
companies: Popular, Inc., Popular North America and Popular International Bank, excluding the equity investments in CONTADO and Serfi nsa, which due to the nature of their operations are included as part of the EVERTEC segment. The Corporate group also includes the expenses of the certain corporate areas that are identifi ed as critical for the organization, such as Finance, Risk
Management and Legal. For segment reporting purposes, the impact of recording the
valuation allowance on deferred tax assets of the U.S. operations was assigned to each legal entity within PNA (including PNA holding company as an entity) based on each entity’s net deferred

166 POPULAR, INC. 2009 ANNUAL REPORT
tax asset at December 31, 2009 and 2008, except for PFH. The impact of recording the valuation allowance at PFH was allocated among continuing and discontinued operations. The portion attributed to the continuing operations was based on PFH’s net deferred tax asset balance at January 1, 2008. The valuation allowance on deferred taxes as it relates to the operating losses of PFH for the year 2008 was assigned to the discontinued operations.
The tax impact in results of operations for PFH attributed to the recording of the valuation allowance assigned to continuing operations was included as part of the Corporate group for segment reporting purposes since it does not relate to any of the legal entities of the BPNA reportable segment. PFH is no longer considered a reportable segment.
The accounting policies of the individual operating segments are the same as those of the Corporation described in Note 1. Transactions between reportable segments are primarily conducted at market rates, resulting in profi ts that are eliminated for reporting consolidated results of operations.
The results of operations included in the tables below for the years ended December 31, 2009, 2008 and 2007 exclude the results of operations of the discontinued business of PFH. Segment assets as of December 31, 2008 also exclude the assets of the discontinued operations.
2009At December 31, 2009
Popular, Inc. Banco Popular Banco Popular Intersegment(In thousands) de Puerto Rico North America EVERTEC Eliminations
Net interest income (loss) $866,971 $315,469 ($1,059)Provision for loan losses 623,532 782,275Non-interest income 753,214 30,231 258,156 ($146,310)Amortization of intangibles 5,031 3,641 810Depreciation expense 39,092 10,811 12,994 (22)Other operating expenses 775,964 299,726 167,503 (146,076)Income tax expense 6,565 (24,896) 25,653 (84)Net income (loss) $170,001 ($725,857) $50,137 ($128)Segment assets $23,615,042 $10,846,748 $245,680 ($67,730)
At December 31, 2009 Total Reportable Total(In thousands) Segments Corporate Eliminations Popular, Inc.
Net interest income (loss) $1,181,381 ($81,140) $1,012 $1,101,253Provision for loan losses 1,405,807 1,405,807Non-interest income 895,291 15,265 (14,055) 896,501Amortization of intangibles 9,482 9,482Depreciation expense 62,875 1,576 64,451Other operating expenses 1,097,117 (7,026) (9,828) 1,080,263Income tax expense 7,238 (16,231) 691 (8,302)Net loss ($505,847) ($44,194) ($3,906) ($553,947)Segment assets $34,639,740 $5,439,842 ($5,343,257) $34,736,325
2008At December 31, 2008
Popular, Inc. Banco Popular Banco Popular Intersegment(In thousands) de Puerto Rico North America EVERTEC Eliminations
Net interest income (loss) $959,215 $351,519 ($723)Provision for loan losses 519,045 472,299 Non-interest income 620,685 141,006 263,258 ($150,620)Goodwill and trademark impairment losses 1,623 10,857Amortization of intangibles 4,975 5,643 891Depreciation expense 41,825 14,027 14,286 (73)Other operating expenses 751,930 399,867 184,264 (149,139)Income tax expense 21,375 114,670 19,450 (549)Net income (loss) $239,127 ($524,838) $43,644 ($859)Segment assets $25,931,855 $12,441,612 $270,524 ($64,850)
At December 31, 2008 Total Reportable Total(In thousands) Segments Corporate Eliminations Popular, Inc.
Net interest income (loss) $1,310,011 ($32,013) $1,206 $1,279,204Provision for loan losses 991,344 40 991,384Non-interest income (loss) 874,329 (32,630) (11,725) 829,974Goodwill and trademark impairment losses 12,480 12,480Amortization of intangibles 11,509 11,509Depreciation expense 70,065 2,325 72,390Other operating expenses 1,186,922 62,774 (9,347) 1,240,349Income tax expense 154,946 305,619 969 461,534Net loss ($242,926) ($435,401) ($2,141) ($680,468)Segment assets $38,579,141 $6,295,760 ($6,004,719) $38,870,182
2007At December 31, 2007
Popular, Inc. Banco Popular Banco Popular Intersegment(In thousands) de Puerto Rico North America EVERTEC Eliminations
Net interest income (loss) $957,822 $370,605 ($823)Provision for loan losses 243,727 95,486 Non-interest income 485,548 185,962 241,627 ($141,498)Goodwill and trademark impairment losses 211,750Amortization of intangibles 1,909 7,602 934 Depreciation expense 41,684 16,069 16,162 (72)Other operating expenses 714,457 450,576 174,877 (141,159)Income tax expense (benefi t) 114,311 (29,477) 17,547 (105)Net income (loss) $327,282 ($195,439) $31,284 ($162)Segment assets $27,102,493 $13,364,306 $228,746 ($367,835)
At December 31, 2007 Total Reportable Total(In thousands) Segments Corporate Eliminations Popular, Inc.
Net interest income (loss) $1,327,604 ($26,444) $4,498 $1,305,658Provision for loan losses 339,213 2,006 341,219Non-interest income 771,639 117,981 (15,925) 873,695Goodwill and trademark impairment losses 211,750 211,750Amortization of intangibles 10,445 10,445Depreciation expense 73,843 2,368 76,211Other operating expenses 1,198,751 55,944 (7,639) 1,247,056Income tax expense (benefi t) 102,276 (10,569) (1,543) 90,164Net income $162,965 $41,788 ($2,245) $202,508Segment assets $40,327,710 $10,456,031 (a) ($6,372,304) $44,411,437(a) Includes $3.9 billion in assets from PFH.

167
Additional disclosures with respect to the Banco Popular de Puerto Rico reportable segment are as follows:
2009At December 31, 2009
Banco Popular de Puerto Rico Consumer Total Commercial and Retail Other Financial Banco Popular(In thousands) Banking Banking Services Eliminations de Puerto Rico
Net interest income $299,668 $555,059 $11,716 $528 $866,971Provision for loan losses 427,501 196,031 623,532Non-interest income 159,242 493,962 100,698 (688) 753,214Amortization of intangibles 162 4,177 692 5,031Depreciation expense 16,187 21,649 1,256 39,092Other operating expenses 213,892 500,135 62,211 (274) 775,964Income tax (benefi t) expense (105,470) 95,154 16,831 50 6,565Net (loss) income ($93,362) $231,875 $31,424 $64 $170,001
Segment assets $9,679,767 $17,288,825 $467,645 ($3,821,195) $23,615,042
2008At December 31, 2008
Banco Popular de Puerto Rico Consumer Total Commercial and Retail Other Financial Banco Popular(In thousands) Banking Banking Services Eliminations de Puerto Rico
Net interest income $347,952 $598,622 $12,097 $544 $959,215Provision for loan losses 348,998 170,047 519,045Non-interest income 114,844 406,547 99,502 (208) 620,685Goodwill impairment losses 1,623 1,623Amortization of intangibles 212 4,113 650 4,975Depreciation expense 17,805 22,742 1,278 41,825Other operating expenses 194,589 492,995 64,642 (296) 751,930Income tax (benefi t) expense (60,769) 66,674 15,158 312 21,375Net (loss) income ($38,039) $246,975 $29,871 $320 $239,127
Segment assets $11,148,150 $18,903,624 $579,463 ($4,699,382) $25,931,855
2007At December 31, 2007
Banco Popular de Puerto Rico Consumer Total Commercial and Retail Other Financial Banco Popular(In thousands) Banking Banking Services Eliminations de Puerto Rico
Net interest income $379,673 $566,635 $10,909 $605 $957,822Provision for loan losses 79,810 163,917 243,727Non-interest income 91,596 303,945 90,969 (962) 485,548Amortization of intangibles 565 860 484 1,909Depreciation expense 14,457 26,001 1,226 41,684Other operating expenses 178,193 470,184 66,466 (386) 714,457Income tax expense 56,613 46,812 10,860 26 114,311Net income $141,631 $162,806 $22,842 $3 $327,282
Segment assets $11,601,186 $19,407,327 $478,252 ($4,384,272) $27,102,493
Additional disclosures with respect to the Banco Popular North America reportable segment are as follows:
2009At December 31, 2009
Banco Popular North America Total Banco Popular Banco Popular(In thousands) North America E-LOAN Eliminations North America
Net interest income $303,700 $10,593 $1,176 $315,469Provision for loan losses 641,668 140,607 782,275Non-interest income (loss) 70,059 (39,706) (122) 30,231Amortization of intangibles 3,641 3,641Depreciation expense 9,627 1,184 10,811Other operating expenses 283,113 16,610 3 299,726Income tax benefi t (7,665) (17,231) (24,896)Net loss ($556,625) ($170,283) $1,051 ($725,857)Segment assets $11,478,201 $560,885 ($1,192,338) $10,846,748
2008At December 31, 2008
Banco Popular North America Total Banco Popular Banco Popular(In thousands) North America E-LOAN Eliminations North America
Net interest income $328,713 $21,458 $1,348 $351,519Provision for loan losses 346,000 126,299 472,299Non-interest income 127,903 13,915 (812) 141,006Goodwill and trademark impairment losses 10,857 10,857Amortization of intangibles 4,144 1,499 5,643Depreciation expense 12,172 1,855 14,027Other operating expenses 327,736 72,117 14 399,867Income tax expense 57,521 56,618 531 114,670Net loss ($290,957) ($233,872) ($9) ($524,838)Segment assets $12,913,337 $759,082 ($1,230,807) $12,441,612
2007At December 31, 2007
Banco Popular North America Total Banco Popular Banco Popular(In thousands) North America E-LOAN Eliminations North America
Net interest income $348,728 $20,925 $952 $370,605Provision for loan losses 77,832 17,654 95,486Non-interest income 112,954 74,270 (1,262) 185,962Goodwill and trademark impairment losses 211,750 211,750Amortization of intangibles 4,810 2,792 7,602Depreciation expense 12,835 3,234 16,069Other operating expenses 287,831 162,706 39 450,576Income tax expense (benefi t) 27,863 (57,218) (122) (29,477)Net income (loss) $50,511 ($245,723) ($227) ($195,439)Segment assets $13,595,461 $1,178,438 ($1,409,593) $13,364,306

168 POPULAR, INC. 2009 ANNUAL REPORT
Intersegment revenues*(In thousands) 2009 2008 2007Banco Popular de Puerto Rico: P.R. Commercial Banking $1 $820 $1,532 P.R. Consumer and Retail Banking 2 1,932 3,339 P.R. Other Financial Services (269) (230) (449)EVERTEC (146,080) (149,784) (140,949)Banco Popular North America: Banco Popular North America 36 (2,730) (4,971) E-LOAN (628)Total intersegment revenues from continuing operations ($146,310) ($150,620) ($141,498)* For purposes of the intersegment revenues disclosure, revenues include interest income (expense) related to internal funding and other non-interest income derived from intercompany transactions, mainly related to gain on sales of loans and processing / information technology services.
Geographic Information(In thousands) 2009 2008 2007Revenues*: Puerto Rico $1,566,081 $1,568,837 $1,567,276 United States 306,667 432,008 523,685 Other 125,006 108,333 88,392Total consolidated revenues from continuing operations $1,997,754 $2,109,178 $2,179,353
* Total revenues include net interest income, service charges on deposit accounts, other service fees, net gain on sale and valuation adjustment of investment securities, trading account (loss) profi t, (loss) gain on sale of loans and valuation adjustments on loans held-for-sale and other operating income.
Selected Balance Sheet Information:**(In thousands) 2009 2008 2007Puerto Rico Total assets $22,480,832 $24,886,736 $26,017,716 Loans 14,176,793 15,160,033 15,679,181 Deposits 16,634,123 16,737,693 17,341,601United States Total assets $11,033,114 $12,713,357 $17,093,929 Loans 8,825,559 10,417,840 13,517,728 Deposits 8,242,604 9,662,690 9,737,996Other Total assets $1,222,379 $1,270,089 $1,299,792 Loans 801,557 691,058 714,093 Deposits 1,048,167 1,149,822 1,254,881* *Does not include balance sheet information of the discontinued operations as of December 31, 2008.
Note 40 - Popular, Inc. (Holding Company only) fi nancial information:The following condensed financial information presents the fi nancial position of Holding Company only at December 31, 2009 and 2008, and the results of its operations and cash fl ows for each of the three years in the period ended December 31, 2009.
Statements of Condition December 31,(In thousands) 2009 2008
ASSETS
Cash $1,174 $2Money market investments 51 89,694Investments securities available-for-sale, at market value 188,893Investments securities held-to-maturity, at amortized cost (includes $430,000 in subordinated notes from BPPR) 455,777 431,499Other investment securities, at lower of cost or realizable value 10,850 14,425Investment in BPPR and subsidiaries, at equity 1,910,695 1,899,839Investment in Popular International Bank and subsidiaries, at equity 867,275 436,234Investment in other subsidiaries, at equity 268,372 274,980Advances to subsidiaries 100,600 814,600Loans to affi liates 6,666 10,000Loans 2,366 2,684 Less - Allowance for loan losses 60 60Premises and equipment 2,907 22,057Other assets 34,576 37,298 Total assets $3,661,249 $4,222,145
LIABILITIES AND STOCKHOLDERS’ EQUITY
Federal funds purchased $44,471Other short-term borrowings $24,225 42,769Notes payable 1,064,462 793,300Accrued expenses and other liabilities 33,745 73,241Stockholders’ equity 2,538,817 3,268,364 Total liabilities and stockholders’ equity $3,661,249 $4,222,145
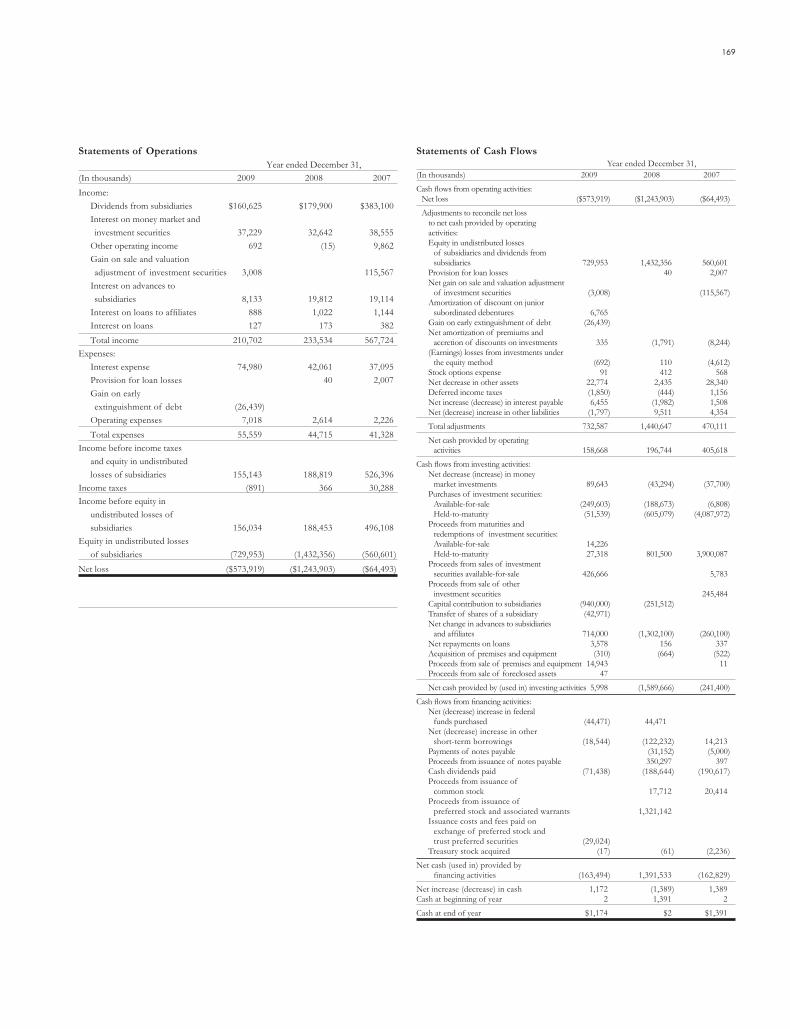
169
Statements of Operations Year ended December 31,(In thousands) 2009 2008 2007Income: Dividends from subsidiaries $160,625 $179,900 $383,100 Interest on money market and investment securities 37,229 32,642 38,555 Other operating income 692 (15) 9,862 Gain on sale and valuation adjustment of investment securities 3,008 115,567 Interest on advances to subsidiaries 8,133 19,812 19,114 Interest on loans to affi liates 888 1,022 1,144 Interest on loans 127 173 382 Total income 210,702 233,534 567,724Expenses: Interest expense 74,980 42,061 37,095 Provision for loan losses 40 2,007 Gain on early extinguishment of debt (26,439) Operating expenses 7,018 2,614 2,226 Total expenses 55,559 44,715 41,328Income before income taxes and equity in undistributed losses of subsidiaries 155,143 188,819 526,396Income taxes (891) 366 30,288Income before equity in undistributed losses of subsidiaries 156,034 188,453 496,108Equity in undistributed losses of subsidiaries (729,953) (1,432,356) (560,601)Net loss ($573,919) ($1,243,903) ($64,493)
Statements of Cash Flows
Year ended December 31,(In thousands) 2009 2008 2007Cash fl ows from operating activities: Net loss ($573,919) ($1,243,903) ($64,493) Adjustments to reconcile net loss to net cash provided by operating activities: Equity in undistributed losses of subsidiaries and dividends from subsidiaries 729,953 1,432,356 560,601 Provision for loan losses 40 2,007 Net gain on sale and valuation adjustment of investment securities (3,008) (115,567) Amortization of discount on junior subordinated debentures 6,765 Gain on early extinguishment of debt (26,439) Net amortization of premiums and accretion of discounts on investments 335 (1,791) (8,244) (Earnings) losses from investments under the equity method (692) 110 (4,612) Stock options expense 91 412 568 Net decrease in other assets 22,774 2,435 28,340 Deferred income taxes (1,850) (444) 1,156 Net increase (decrease) in interest payable 6,455 (1,982) 1,508 Net (decrease) increase in other liabilities (1,797) 9,511 4,354 Total adjustments 732,587 1,440,647 470,111 Net cash provided by operating activities 158,668 196,744 405,618Cash fl ows from investing activities: Net decrease (increase) in money market investments 89,643 (43,294) (37,700) Purchases of investment securities: Available-for-sale (249,603) (188,673) (6,808) Held-to-maturity (51,539) (605,079) (4,087,972) Proceeds from maturities and redemptions of investment securities: Available-for-sale 14,226 Held-to-maturity 27,318 801,500 3,900,087 Proceeds from sales of investment securities available-for-sale 426,666 5,783 Proceeds from sale of other investment securities 245,484 Capital contribution to subsidiaries (940,000) (251,512) Transfer of shares of a subsidiary (42,971) Net change in advances to subsidiaries and affi liates 714,000 (1,302,100) (260,100) Net repayments on loans 3,578 156 337 Acquisition of premises and equipment (310) (664) (522) Proceeds from sale of premises and equipment 14,943 11 Proceeds from sale of foreclosed assets 47 Net cash provided by (used in) investing activities 5,998 (1,589,666) (241,400)Cash fl ows from fi nancing activities: Net (decrease) increase in federal funds purchased (44,471) 44,471 Net (decrease) increase in other short-term borrowings (18,544) (122,232) 14,213 Payments of notes payable (31,152) (5,000) Proceeds from issuance of notes payable 350,297 397 Cash dividends paid (71,438) (188,644) (190,617) Proceeds from issuance of common stock 17,712 20,414 Proceeds from issuance of preferred stock and associated warrants 1,321,142 Issuance costs and fees paid on exchange of preferred stock and trust preferred securities (29,024) Treasury stock acquired (17) (61) (2,236)Net cash (used in) provided by fi nancing activities (163,494) 1,391,533 (162,829)Net increase (decrease) in cash 1,172 (1,389) 1,389Cash at beginning of year 2 1,391 2Cash at end of year $1,174 $2 $1,391

170 POPULAR, INC. 2009 ANNUAL REPORT
Notes payable at December 31, 2009 mature as follows: Notes Year Payable (In thousands) 2010 - 2011 $350,000 2012 - 2013 - 2014 - Later years 290,812 No stated maturity 936,000 Subtotal 1,576,812 Less: Discount (512,350) Total $1,064,462
A source of income for the Holding Company consists of dividends from BPPR. As members subject to the regulations of the Federal Reserve System, BPPR and BPNA must obtain the approval of the Federal Reserve Board for any dividend if the total of all dividends declared by each entity during the calendar year would exceed the total of its net income for that year, as defi ned by the Federal Reserve Board, combined with its retained net income for the preceding two years, less any required transfers to surplus or to a fund for the retirement of any preferred stock. The payment of dividends by BPPR may also be affected by other regulatory requirements and policies, such as the maintenance of certain minimum capital levels described in Note 25. At December 31, 2009, BPPR was required to obtain the approval of the Federal Reserve Board to declare a dividend. At December 31, 2008 and 2007, BPPR could have declared a dividend of approximately $31.6 million and $45.0 million, respectively, without the approval of the Federal Reserve Board. At December 31, 2009, 2008 and 2007, BPNA was required to obtain the approval of the Federal Reserve Board to declare a dividend.
Note 41 - Condensed consolidating fi nancial information of guarantor and issuers of registered guaranteed securities:The following condensed consolidating fi nancial information presents the fi nancial position of Popular, Inc. Holding Company (“PIHC”) (parent only), Popular International Bank, Inc. (“PIBI”), Popular North America, Inc. (“PNA”) and all other subsidiaries of the Corporation at December 31, 2009 and 2008, and the results of their operations and cash fl ows for each of the years ended December 31, 2009, 2008 and 2007, respectively.
PIBI is an operating subsidiary of PIHC and is the holding company of its wholly-owned subsidiaries ATH Costa Rica S.A., EVERTEC LATINOAMERICA, SOCIEDAD ANONIMA, T.I.I. Smart Solutions Inc., Popular Insurance V.I., Inc. and PNA.
PNA is an operating subsidiary of PIBI and is the holding company of its wholly-owned subsidiary BPNA, including its wholly-owned subsidiaries Popular Equipment Finance, Inc., Popular Insurance Agency, U.S.A., and E-LOAN, Inc.
PIHC fully and unconditionally guarantees all registered debt securities issued by PNA.
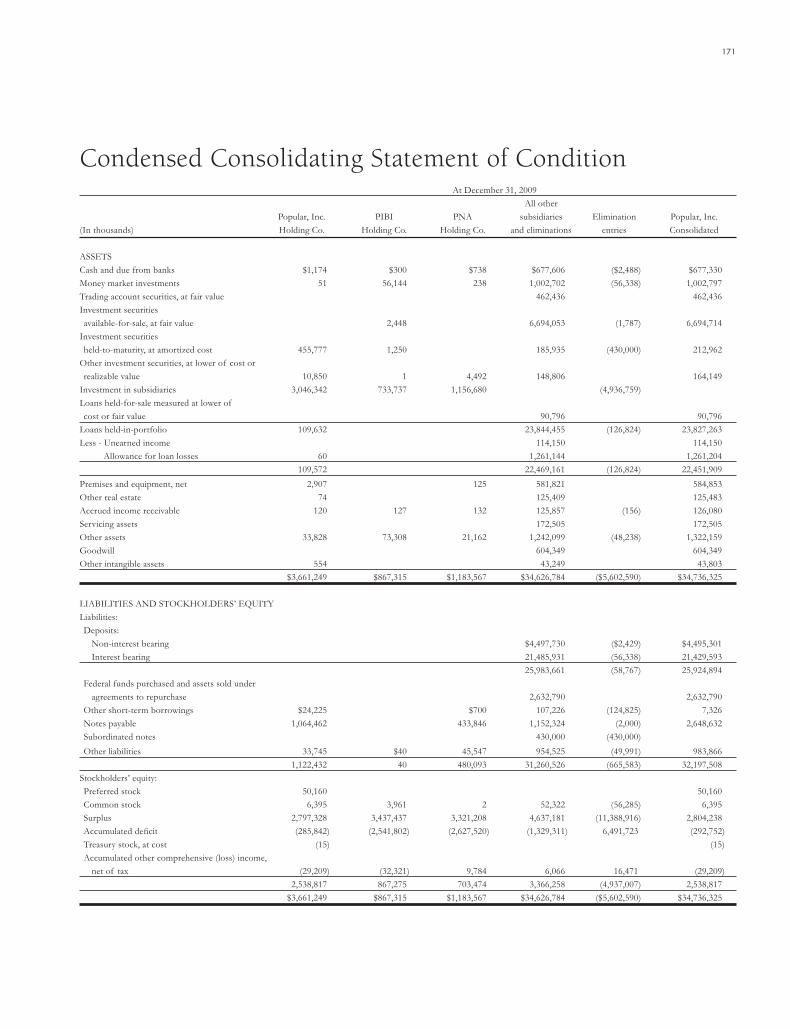
171
Condensed Consolidating Statement of Condition At December 31, 2009 All other Popular, Inc. PIBI PNA subsidiaries Elimination Popular, Inc.(In thousands) Holding Co. Holding Co. Holding Co. and eliminations entries Consolidated
ASSETSCash and due from banks $1,174 $300 $738 $677,606 ($2,488) $677,330Money market investments 51 56,144 238 1,002,702 (56,338) 1,002,797Trading account securities, at fair value 462,436 462,436Investment securities available-for-sale, at fair value 2,448 6,694,053 (1,787) 6,694,714Investment securities held-to-maturity, at amortized cost 455,777 1,250 185,935 (430,000) 212,962Other investment securities, at lower of cost or realizable value 10,850 1 4,492 148,806 164,149Investment in subsidiaries 3,046,342 733,737 1,156,680 (4,936,759) Loans held-for-sale measured at lower of cost or fair value 90,796 90,796Loans held-in-portfolio 109,632 23,844,455 (126,824) 23,827,263Less - Unearned income 114,150 114,150 Allowance for loan losses 60 1,261,144 1,261,204 109,572 22,469,161 (126,824) 22,451,909Premises and equipment, net 2,907 125 581,821 584,853Other real estate 74 125,409 125,483Accrued income receivable 120 127 132 125,857 (156) 126,080Servicing assets 172,505 172,505Other assets 33,828 73,308 21,162 1,242,099 (48,238) 1,322,159Goodwill 604,349 604,349Other intangible assets 554 43,249 43,803 $3,661,249 $867,315 $1,183,567 $34,626,784 ($5,602,590) $34,736,325
LIABILITIES AND STOCKHOLDERS’ EQUITYLiabilities: Deposits: Non-interest bearing $4,497,730 ($2,429) $4,495,301 Interest bearing 21,485,931 (56,338) 21,429,593 25,983,661 (58,767) 25,924,894 Federal funds purchased and assets sold under agreements to repurchase 2,632,790 2,632,790 Other short-term borrowings $24,225 $700 107,226 (124,825) 7,326 Notes payable 1,064,462 433,846 1,152,324 (2,000) 2,648,632 Subordinated notes 430,000 (430,000) Other liabilities 33,745 $40 45,547 954,525 (49,991) 983,866 1,122,432 40 480,093 31,260,526 (665,583) 32,197,508Stockholders’ equity: Preferred stock 50,160 50,160 Common stock 6,395 3,961 2 52,322 (56,285) 6,395 Surplus 2,797,328 3,437,437 3,321,208 4,637,181 (11,388,916) 2,804,238 Accumulated defi cit (285,842) (2,541,802) (2,627,520) (1,329,311) 6,491,723 (292,752) Treasury stock, at cost (15) (15) Accumulated other comprehensive (loss) income, net of tax (29,209) (32,321) 9,784 6,066 16,471 (29,209) 2,538,817 867,275 703,474 3,366,258 (4,937,007) 2,538,817 $3,661,249 $867,315 $1,183,567 $34,626,784 ($5,602,590) $34,736,325
BOA22177_wo18_Popular.indd 171 3/3/2010 10:46:57 AM

172 POPULAR, INC. 2009 ANNUAL REPORT
Condensed Consolidating Statement of Condition At December 31, 2008 All other Popular, Inc. PIBI PNA subsidiaries Elimination Popular, Inc.(In thousands) Holding Co. Holding Co. Holding Co. and eliminations entries Consolidated
ASSETSCash and due from banks $2 $89 $7,668 $777,994 ($766) $784,987Money market investments 89,694 40,614 450,246 794,521 (580,421) 794,654Trading account securities, at fair value 645,903 645,903Investment securities available-for-sale, at fair value 188,893 5,243 7,730,351 7,924,487Investment securities held-to-maturity, at amortized cost 431,499 1,250 291,998 (430,000) 294,747Other investment securities, at lower of cost or realizable value 14,425 1 12,392 190,849 217,667Investment in subsidiaries 2,611,053 324,412 1,348,241 (4,283,706)Loans held-for-sale measured at lower of cost or fair value 536,058 536,058Loans held-in-portfolio 827,284 12,800 25,885,773 (868,620) 25,857,237Less - Unearned income 124,364 124,364 Allowance for loan losses 60 882,747 882,807 827,224 12,800 24,878,662 (868,620) 24,850,066Premises and equipment, net 22,057 128 598,622 620,807Other real estate 47 89,674 89,721Accrued income receivable 1,033 474 1,861 204,955 (52,096) 156,227Servicing assets 180,306 180,306Other assets 35,664 64,881 21,532 995,550 (2,030) 1,115,597Goodwill 605,792 605,792Other intangible assets 554 52,609 53,163 Assets from discontinued operations 12,587 12,587 $4,222,145 $436,964 $1,854,868 $38,586,431 ($6,217,639) $38,882,769
LIABILITIES AND STOCKHOLDERS’ EQUITYLiabilities: Deposits: Non-interest bearing $4,294,221 ($668) $4,293,553 Interest bearing 23,747,393 (490,741) 23,256,652 28,041,614 (491,409) 27,550,205 Federal funds purchased and assets sold under agreements to repurchase $44,471 3,596,817 (89,680) 3,551,608 Other short-term borrowings 42,769 $500 828,285 (866,620) 4,934 Notes payable 793,300 1,488,942 1,106,521 (2,000) 3,386,763 Subordinated notes 430,000 (430,000) Other liabilities 73,241 $117 68,490 1,008,427 (53,937) 1,096,338 Liabilities from discontinued operations 24,557 24,557 953,781 117 1,557,932 35,036,221 (1,933,646) 35,614,405Stockholders’ equity: Preferred stock 1,483,525 1,483,525 Common stock 1,773,792 3,961 2 52,318 (56,281) 1,773,792 Surplus 613,085 2,301,193 2,184,964 4,050,514 (8,527,877) 621,879 Accumulated defi cit (365,694) (1,797,175) (1,865,418) (585,705) 4,239,504 (374,488) Treasury stock, at cost (207,515) (377) 377 (207,515) Accumulated other comprehensive (loss) income, net of tax (28,829) (71,132) (22,612) 33,460 60,284 (28,829) 3,268,364 436,847 296,936 3,550,210 (4,283,993) 3,268,364 $4,222,145 $436,964 $1,854,868 $38,586,431 ($6,217,639) $38,882,769
BOA22177_wo18_Popular.indd 172 3/3/2010 10:46:57 AM

173
Condensed Consolidating Statement of Operations Year ended December 31, 2009 All other Popular, Inc. PIBI PNA subsidiaries Elimination Popular, Inc.(In thousands) Holding Co. Holding Co. Holding Co. and eliminations entries Consolidated
INTEREST AND DIVIDEND INCOME: Dividend income from subsidiaries $160,625 $7,500 $20,000 ($188,125) Loans 9,148 44 $1,518,431 (8,374) $1,519,249 Money market investments 109 1,306 2,156 8,573 (3,574) 8,570 Investment securities 37,120 70 703 281,887 (27,792) 291,988 Trading account securities 35,190 35,190 207,002 8,876 22,903 1,844,081 (227,865) 1,854,997
INTEREST EXPENSE: Deposits 504,732 (3,470) 501,262 Short-term borrowings 169 45 77,548 (8,405) 69,357 Long-term debt 74,811 58,581 78,609 (28,876) 183,125 74,980 58,626 660,889 (40,751) 753,744Net interest income (loss) 132,022 8,876 (35,723) 1,183,192 (187,114) 1,101,253Provision for loan losses 1,405,807 1,405,807Net interest income (loss) after provision for loan losses 132,022 8,876 (35,723) (222,615) (187,114) (304,554)Service charges on deposit accounts 213,493 213,493Other service fees 401,934 (7,747) 394,187Net gain (loss) on sale and valuation adjustments of investment securities 3,008 (10,934) 229,530 (2,058) 219,546Trading account profi t 39,740 39,740Loss on sale of loans, including adjustments to indemnity reserves, and valuation adjutments on loans held-for-sale (35,060) (35,060)Other operating income (loss) 692 16,558 (1,184) 52,778 (4,249) 64,595 135,722 14,500 (36,907) 679,800 (201,168) 591,947
OPERATING EXPENSES: Personnel costs: Salaries 24,238 368 387,004 (994) 410,616 Pension, profi t sharing and other benefi ts 3,918 59 118,694 (24) 122,647 28,156 427 505,698 (1,018) 533,263Net occupancy expenses 2,613 30 3 108,389 111,035Equipment expenses 3,683 4 97,843 101,530Other taxes 3,544 49,061 52,605Professional fees 15,676 14 (55) 100,831 (5,179) 111,287Communications 443 20 23 45,778 46,264Business promotion 1,182 37,690 38,872Printing and supplies 74 11,019 11,093Impairment losses on long-lived assets 1,545 1,545FDIC deposit insurance 76,796 76,796Gain on early extinguishment of debt (26,439) (51,897) 1,959 (1,923) (78,300)Other operating expenses (48,353) (400) 238 188,947 (1,708) 138,724Amortization of intangibles 9,482 9,482 (19,421) 91 (51,684) 1,235,038 (9,828) 1,154,196Income (loss) before income tax and equity in losses of subsidiaries 155,143 14,409 14,777 (555,238) (191,340) (562,249)Income tax (benefi t) expense (891) 26 21,601 (29,729) 691 (8,302)Income (loss) before equity in losses of subsidiaries 156,034 14,383 (6,824) (525,509) (192,031) (553,947)Equity in undistributed losses of subsidiaries (709,981) (739,039) (735,305) 2,184,325Loss from continuing operations (553,947) (724,656) (742,129) (525,509) 1,992,294 (553,947)Loss from discontinued operations, net of income tax (19,972) (19,972)Equity in undistributed losses of discontinued operations (19,972) (19,972) (19,972) 59,916
NET LOSS ($573,919) ($744,628) ($762,101) ($545,481) $2,052,210 ($573,919)
BOA22177_wo18_Popular.indd 173 3/3/2010 10:46:57 AM

174 POPULAR, INC. 2009 ANNUAL REPORT
Condensed Consolidating Statement of Operations Year ended December 31, 2008 All other Popular, Inc. PIBI PNA subsidiaries Elimination Popular, Inc.(In thousands) Holding Co. Holding Co. Holding Co. and eliminations entries Consolidated
INTEREST AND DIVIDEND INCOME: Dividend income from subsidiaries $179,900 ($179,900) Loans 21,007 $219 $89,167 $1,868,717 (110,648) $1,868,462 Money market investments 1,730 1,073 1,918 19,056 (5,795) 17,982 Investment securities 30,912 766 894 339,059 (28,063) 343,568 Trading account securities 44,111 44,111 233,549 2,058 91,979 2,270,943 (324,406) 2,274,123
INTEREST EXPENSE: Deposits 702,858 (2,736) 700,122 Short-term borrowings 2,943 18,818 181,059 (34,750) 168,070 Long-term debt 39,118 120,605 75,178 (108,174) 126,727 42,061 139,423 959,095 (145,660) 994,919Net interest income (loss) 191,488 2,058 (47,444) 1,311,848 (178,746) 1,279,204Provision for loan losses 40 991,344 991,384Net interest income (loss) after provision for loan losses 191,448 2,058 (47,444) 320,504 (178,746) 287,820Service charges on deposit accounts 206,957 206,957 Other service fees 424,971 (8,808) 416,163 Net (loss) gain on sale and valuation adjustments of investment securities (9,147) 78,863 69,716Trading account profi t 43,645 43,645 Gain on sale of loans, including adjustments to indemnity reserves, and valuation adjustments on loans held-for-sale 6,018 6,018Other operating (loss) income (15) 11,844 (31,447) 111,360 (4,267) 87,475 191,433 4,755 (78,891) 1,192,318 (191,821) 1,117,794
OPERATING EXPENSES: Personnel costs: Salaries 22,363 395 464,971 (2,009) 485,720 Pension, profi t sharing and other benefi ts 4,816 75 117,927 (73) 122,745 27,179 470 582,898 (2,082) 608,465Net occupancy expenses 2,582 29 3 117,842 120,456 Equipment expenses 3,697 107,781 111,478 Other taxes 2,590 50,209 52,799Professional fees 19,573 12 (24) 107,253 (5,669) 121,145Communications 314 19 37 51,016 51,386 Business promotion 1,621 61,110 62,731 Printing and supplies 70 14,380 14,450Impairment losses on long-lived assets 13,491 13,491FDIC deposit insurance 15,037 15,037Other operating expenses (55,012) (401) (954) 199,264 (1,596) 141,301Goodwill and trademark impairment losses 12,480 12,480Amortization of intangibles 11,509 11,509 2,614 129 (938) 1,344,270 (9,347) 1,336,728Income (loss) before income tax and equity in losses of subsidiaries 188,819 4,626 (77,953) (151,952) (182,474) (218,934)Income tax expense 366 12,962 447,730 476 461,534Income (loss) before equity in losses of subsidiaries 188,453 4,626 (90,915) (599,682) (182,950) (680,468)Equity in undistributed losses of subsidiaries (868,921) (929,637) (849,432) 2,647,990Loss from continuing operations (680,468) (925,011) (940,347) (599,682) 2,465,040 (680,468)Loss from discontinued operations, net of income tax (563,435) (563,435)Equity in undistributed losses of discontinued operations (563,435) (563,435) (563,435) 1,690,305
NET LOSS ($1,243,903) ($1,488,446) ($1,503,782) ($1,163,117) $4,155,345 ($1,243,903)
BOA22177_wo18_Popular.indd 174 3/3/2010 10:46:57 AM
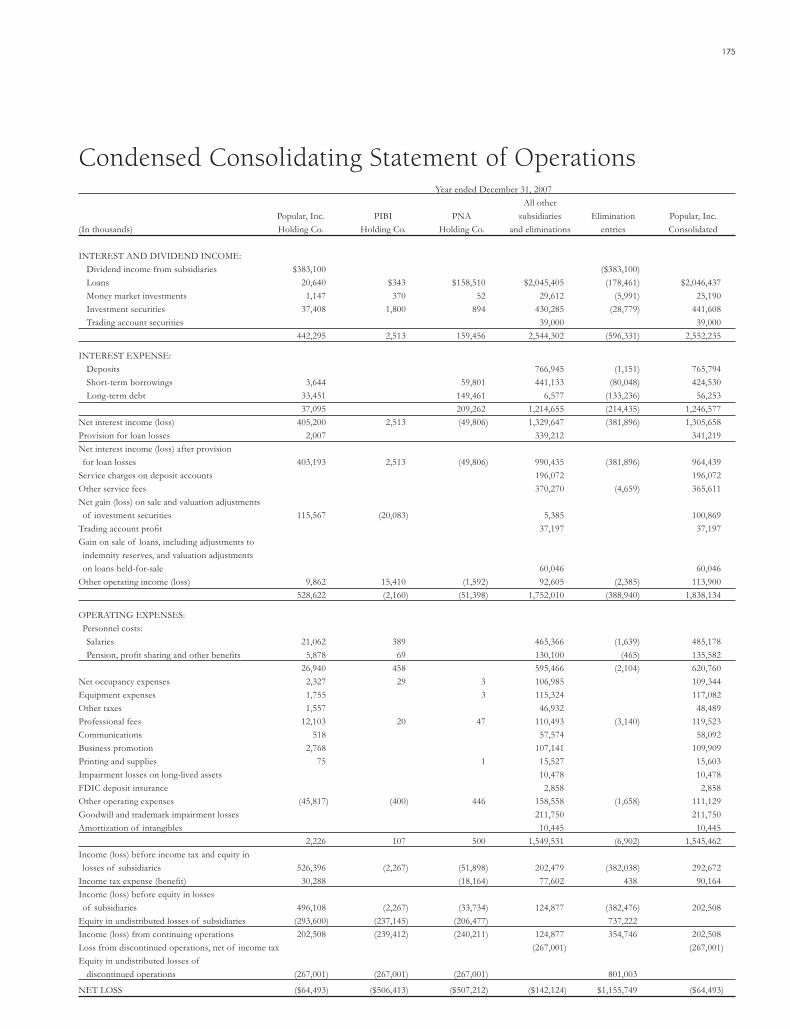
175
Condensed Consolidating Statement of Operations Year ended December 31, 2007 All other Popular, Inc. PIBI PNA subsidiaries Elimination Popular, Inc.(In thousands) Holding Co. Holding Co. Holding Co. and eliminations entries Consolidated
INTEREST AND DIVIDEND INCOME: Dividend income from subsidiaries $383,100 ($383,100) Loans 20,640 $343 $158,510 $2,045,405 (178,461) $2,046,437 Money market investments 1,147 370 52 29,612 (5,991) 25,190 Investment securities 37,408 1,800 894 430,285 (28,779) 441,608 Trading account securities 39,000 39,000 442,295 2,513 159,456 2,544,302 (596,331) 2,552,235
INTEREST EXPENSE: Deposits 766,945 (1,151) 765,794 Short-term borrowings 3,644 59,801 441,133 (80,048) 424,530 Long-term debt 33,451 149,461 6,577 (133,236) 56,253 37,095 209,262 1,214,655 (214,435) 1,246,577Net interest income (loss) 405,200 2,513 (49,806) 1,329,647 (381,896) 1,305,658Provision for loan losses 2,007 339,212 341,219Net interest income (loss) after provision for loan losses 403,193 2,513 (49,806) 990,435 (381,896) 964,439Service charges on deposit accounts 196,072 196,072 Other service fees 370,270 (4,659) 365,611 Net gain (loss) on sale and valuation adjustments of investment securities 115,567 (20,083) 5,385 100,869Trading account profi t 37,197 37,197 Gain on sale of loans, including adjustments to indemnity reserves, and valuation adjustments on loans held-for-sale 60,046 60,046Other operating income (loss) 9,862 15,410 (1,592) 92,605 (2,385) 113,900 528,622 (2,160) (51,398) 1,752,010 (388,940) 1,838,134
OPERATING EXPENSES: Personnel costs: Salaries 21,062 389 465,366 (1,639) 485,178 Pension, profi t sharing and other benefi ts 5,878 69 130,100 (465) 135,582 26,940 458 595,466 (2,104) 620,760Net occupancy expenses 2,327 29 3 106,985 109,344 Equipment expenses 1,755 3 115,324 117,082 Other taxes 1,557 46,932 48,489Professional fees 12,103 20 47 110,493 (3,140) 119,523Communications 518 57,574 58,092 Business promotion 2,768 107,141 109,909 Printing and supplies 75 1 15,527 15,603Impairment losses on long-lived assets 10,478 10,478FDIC deposit insurance 2,858 2,858Other operating expenses (45,817) (400) 446 158,558 (1,658) 111,129Goodwill and trademark impairment losses 211,750 211,750Amortization of intangibles 10,445 10,445 2,226 107 500 1,549,531 (6,902) 1,545,462Income (loss) before income tax and equity in losses of subsidiaries 526,396 (2,267) (51,898) 202,479 (382,038) 292,672Income tax expense (benefi t) 30,288 (18,164) 77,602 438 90,164Income (loss) before equity in losses of subsidiaries 496,108 (2,267) (33,734) 124,877 (382,476) 202,508Equity in undistributed losses of subsidiaries (293,600) (237,145) (206,477) 737,222 Income (loss) from continuing operations 202,508 (239,412) (240,211) 124,877 354,746 202,508Loss from discontinued operations, net of income tax (267,001) (267,001)Equity in undistributed losses of discontinued operations (267,001) (267,001) (267,001) 801,003
NET LOSS ($64,493) ($506,413) ($507,212) ($142,124) $1,155,749 ($64,493)
BOA22177_wo18_Popular.indd 175 3/3/2010 10:46:57 AM

176 POPULAR, INC. 2009 ANNUAL REPORT
Condensed Consolidating Statement of Cash Flows Year ended December 31, 2009 Popular, Inc. PIBI PNA Other Elimination Popular, Inc.(In thousands) Holding Co. Holding Co. Holding Co. Subsidiaries Entries ConsolidatedCash fl ows from operating activities: Net loss ($573,919) ($744,628) ($762,101) ($545,481) $2,052,210 ($573,919) Adjustments to reconcile net loss to net cash provided by (used in) operating activities: Equity in undistributed losses of subsidiaries 729,953 759,011 755,277 (2,244,241) Depreciation and amortization of premises and equipment 1,573 3 62,875 64,451 Provision for loan losses 1,405,807 1,405,807 Impairment losses on long-lived assets 1,545 1,545 Amortization of intangibles 9,482 9,482 Amortization and fair value adjustment of servicing assets 32,960 32,960 Amortization of discount on junior subordinated debentures 6,765 493 7,258 Net (gain) loss on sale and valuation adjustment of investment securities (3,008) 10,934 (229,530) 2,058 (219,546) Earnings from changes in fair value related to instruments measured at fair value pursuant to the fair value option (1,674) (1,674) Net loss (gain) on disposition of premises and equipment 3,006 (3,418) (412) Net loss on sale of loans and valuation adjustments on loans held-for-sale 40,268 40,268 (Gain) loss on early extinguishment of debt (26,439) (51,898) 1,959 (1,922) (78,300) Net amortization of premiums and accretion of discount on investments 335 19,181 (271) 19,245 Net amortization of premiums on loans and deferred loan origination fees and costs 45,031 45,031 (Earnings) losses from investments under the equity method (692) (16,558) 1,184 90 (1,719) (17,695) Stock options expense 91 111 202 Net disbursements on loans held-for-sale (1,129,554) (1,129,554) Acquisitions of loans held-for-sale (354,472) (354,472) Proceeds from sale of loans held-for-sale 79,264 79,264 Net decrease in trading securities 1,542,470 1,542,470 Net decrease (increase) in accrued income receivable 913 347 1,728 29,553 (1,940) 30,601 Net decrease (increase) in other assets 17,282 6,712 1,020 (194,668) (13,306) (182,960) Net increase (decrease) in interest payable 6,455 (11,605) (44,485) 1,940 (47,695) Deferred income taxes (1,850) (2,601) (100,308) 24,869 (79,890) Net decrease in postretirement benefi t obligation 4,223 4,223 Net (decrease) increase in other liabilities (1,797) (77) 3,796 39,999 (9,708) 32,213Total adjustments 732,587 760,369 697,397 1,256,709 (2,244,240) 1,202,822Net cash provided by (used in) operating activities 158,668 15,741 (64,704) 711,228 (192,030) 628,903Cash fl ows from investing activities: Net decrease (increase) in money market investments 89,643 (15,530) 450,008 (208,181) (524,083) (208,143) Purchases of investment securities: Available-for-sale (249,603) (4,135,171) 191,484 (4,193,290) Held-to-maturity (51,539) (8,023) (59,562) Other (38,913) (38,913) Proceeds from calls, paydowns, maturities and redemptions of investment securities: Available-for-sale 14,226 1,617,381 1,631,607 Held-to-maturity 27,318 114,248 141,566 Other 75,101 75,101 Proceeds from sales of investment securities available-for-sale 426,666 3,590,131 (191,484) 3,825,313 Proceeds from sale of other investment securities 52,294 52,294 Net repayments on loans 717,578 12,800 1,065,164 (741,795) 1,053,747 Proceeds from sale of loans 328,170 328,170 Acquisition of loan portfolios (72,675) (72,675) Capital contribution to subsidiary (940,000) (940,000) (590,000) 2,470,000 Transfer of shares of a subsidiary (42,971) 42,971 Mortgage servicing rights purchased (1,364) (1,364) Acquisition of premises and equipment (310) (69,330) (69,640) Proceeds from sale of premises and equipment 14,943 25,300 40,243 Proceeds from sale of foreclosed assets 47 149,900 149,947Net cash provided by (used in) investing activities 5,998 (955,530) (84,221) 2,484,032 1,204,122 2,654,401Cash fl ows from fi nancing activities: Net decrease in deposits (2,058,240) 432,642 (1,625,598) Net decrease in federal funds purchased and assets sold under agreements to repurchase (44,471) (964,027) 89,680 (918,818) Net (decrease) increase in other short-term borrowings (18,544) 200 (721,059) 741,795 2,392 Payments of notes payable (798,880) (14,197) (813,077) Proceeds from issuance of notes payable 675 60,000 60,675 Dividens paid to parent company (188,125) 188,125 Dividends paid (71,438) (71,438) lssuance costs and fees paid on exchange of preferred stock and trust preferred securities (29,024) 3,944 (25,080) Treasury stock acquired (17) (17) Capital contribution from parent 940,000 940,000 590,000 (2,470,000)Net cash (used in) provided by fi nancing activities (163,494) 940,000 141,995 (3,295,648) (1,013,814) (3,390,961)Net increase (decrease) in cash and due from banks 1,172 211 (6,930) (100,388) (1,722) (107,657)Cash and due from banks at beginning of period 2 89 7,668 777,994 (766) 784,987Cash and due from banks at end of period $1,174 $300 $738 $677,606 ($2,488) $677,330
BOA22177_wo18_Popular.indd 176 3/3/2010 10:46:57 AM
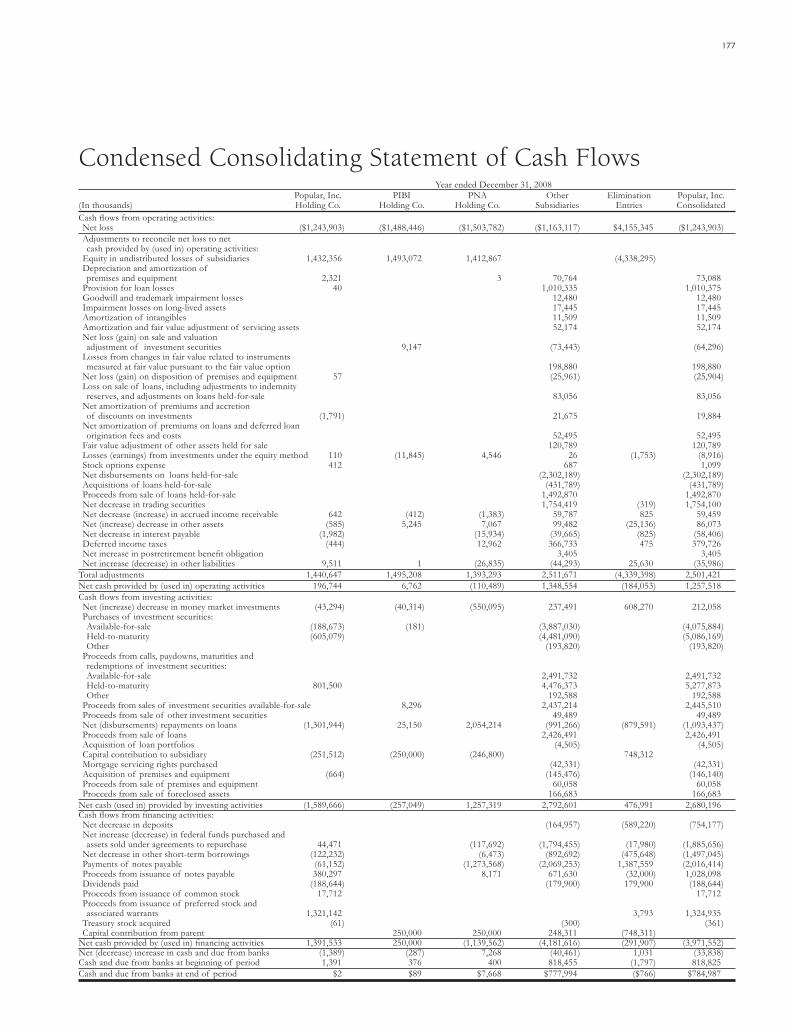
177
Condensed Consolidating Statement of Cash Flows Year ended December 31, 2008 Popular, Inc. PIBI PNA Other Elimination Popular, Inc.(In thousands) Holding Co. Holding Co. Holding Co. Subsidiaries Entries ConsolidatedCash fl ows from operating activities: Net loss ($1,243,903) ($1,488,446) ($1,503,782) ($1,163,117) $4,155,345 ($1,243,903) Adjustments to reconcile net loss to net cash provided by (used in) operating activities: Equity in undistributed losses of subsidiaries 1,432,356 1,493,072 1,412,867 (4,338,295) Depreciation and amortization of premises and equipment 2,321 3 70,764 73,088 Provision for loan losses 40 1,010,335 1,010,375 Goodwill and trademark impairment losses 12,480 12,480 Impairment losses on long-lived assets 17,445 17,445 Amortization of intangibles 11,509 11,509 Amortization and fair value adjustment of servicing assets 52,174 52,174 Net loss (gain) on sale and valuation adjustment of investment securities 9,147 (73,443) (64,296) Losses from changes in fair value related to instruments measured at fair value pursuant to the fair value option 198,880 198,880 Net loss (gain) on disposition of premises and equipment 57 (25,961) (25,904) Loss on sale of loans, including adjustments to indemnity reserves, and adjustments on loans held-for-sale 83,056 83,056 Net amortization of premiums and accretion of discounts on investments (1,791) 21,675 19,884 Net amortization of premiums on loans and deferred loan origination fees and costs 52,495 52,495 Fair value adjustment of other assets held for sale 120,789 120,789 Losses (earnings) from investments under the equity method 110 (11,845) 4,546 26 (1,753) (8,916) Stock options expense 412 687 1,099 Net disbursements on loans held-for-sale (2,302,189) (2,302,189) Acquisitions of loans held-for-sale (431,789) (431,789) Proceeds from sale of loans held-for-sale 1,492,870 1,492,870 Net decrease in trading securities 1,754,419 (319) 1,754,100 Net decrease (increase) in accrued income receivable 642 (412) (1,383) 59,787 825 59,459 Net (increase) decrease in other assets (585) 5,245 7,067 99,482 (25,136) 86,073 Net decrease in interest payable (1,982) (15,934) (39,665) (825) (58,406) Deferred income taxes (444) 12,962 366,733 475 379,726 Net increase in postretirement benefi t obligation 3,405 3,405 Net increase (decrease) in other liabilities 9,511 1 (26,835) (44,293) 25,630 (35,986)Total adjustments 1,440,647 1,495,208 1,393,293 2,511,671 (4,339,398) 2,501,421Net cash provided by (used in) operating activities 196,744 6,762 (110,489) 1,348,554 (184,053) 1,257,518Cash fl ows from investing activities: Net (increase) decrease in money market investments (43,294) (40,314) (550,095) 237,491 608,270 212,058 Purchases of investment securities: Available-for-sale (188,673) (181) (3,887,030) (4,075,884) Held-to-maturity (605,079) (4,481,090) (5,086,169) Other (193,820) (193,820) Proceeds from calls, paydowns, maturities and redemptions of investment securities: Available-for-sale 2,491,732 2,491,732 Held-to-maturity 801,500 4,476,373 5,277,873 Other 192,588 192,588 Proceeds from sales of investment securities available-for-sale 8,296 2,437,214 2,445,510 Proceeds from sale of other investment securities 49,489 49,489 Net (disbursements) repayments on loans (1,301,944) 25,150 2,054,214 (991,266) (879,591) (1,093,437) Proceeds from sale of loans 2,426,491 2,426,491 Acquisition of loan portfolios (4,505) (4,505) Capital contribution to subsidiary (251,512) (250,000) (246,800) 748,312 Mortgage servicing rights purchased (42,331) (42,331) Acquisition of premises and equipment (664) (145,476) (146,140) Proceeds from sale of premises and equipment 60,058 60,058 Proceeds from sale of foreclosed assets 166,683 166,683Net cash (used in) provided by investing activities (1,589,666) (257,049) 1,257,319 2,792,601 476,991 2,680,196Cash fl ows from fi nancing activities: Net decrease in deposits (164,957) (589,220) (754,177) Net increase (decrease) in federal funds purchased and assets sold under agreements to repurchase 44,471 (117,692) (1,794,455) (17,980) (1,885,656) Net decrease in other short-term borrowings (122,232) (6,473) (892,692) (475,648) (1,497,045) Payments of notes payable (61,152) (1,273,568) (2,069,253) 1,387,559 (2,016,414) Proceeds from issuance of notes payable 380,297 8,171 671,630 (32,000) 1,028,098 Dividends paid (188,644) (179,900) 179,900 (188,644) Proceeds from issuance of common stock 17,712 17,712 Proceeds from issuance of preferred stock and associated warrants 1,321,142 3,793 1,324,935 Treasury stock acquired (61) (300) (361) Capital contribution from parent 250,000 250,000 248,311 (748,311)Net cash provided by (used in) fi nancing activities 1,391,533 250,000 (1,139,562) (4,181,616) (291,907) (3,971,552)Net (decrease) increase in cash and due from banks (1,389) (287) 7,268 (40,461) 1,031 (33,838)Cash and due from banks at beginning of period 1,391 376 400 818,455 (1,797) 818,825Cash and due from banks at end of period $2 $89 $7,668 $777,994 ($766) $784,987
BOA22177_wo18_Popular.indd 177 3/3/2010 10:46:57 AM

178 POPULAR, INC. 2009 ANNUAL REPORT
Condensed Consolidating Statement of Cash Flows Year ended December 31, 2007 Popular, Inc. PIBI PNA Other Elimination Popular, Inc.(In thousands) Holding Co. Holding Co. Holding Co. Subsidiaries Entries ConsolidatedCash fl ows from operating activities: Net loss ($64,493) ($506,413) ($507,212) ($142,124) $1,155,749 ($64,493) Adjustments to reconcile net loss to net cash provided by (used in ) operating activities: Equity in undistributed losses of subsidiaries 560,601 504,146 473,478 (1,538,225) Depreciation and amortization of premises and equipment 2,365 3 76,195 78,563 Provision for loan losses 2,007 560,643 562,650 Goodwill and trademark impairment losses 211,750 211,750 Impairment losses on long-lived assets 12,344 12,344 Amortization of intangibles 10,445 10,445 Amortization and fair value adjustment of servicing assets 61,110 61,110 Net (gain) loss on sale and valuation adjustment of investment securities (115,567) 20,083 40,325 (55,159) Net loss (gain) on disposition of premises and equipment 1 (12,297) (12,296) Loss on sale of loans, including adjustments to indemnity reserves, and valuation adjustments on loans held-for-sale 38,970 38,970 Net amortization of premiums and accretion of discounts on investments (8,244) 7 28,468 7 20,238 Net amortization of premiums on loans and deferred loan origination fees and costs 90,511 90,511 (Earnings) losses from investments under the equity method (4,612) (15,410) 1,592 (1,293) (1,624) (21,347) Stock options expense 568 1,195 1,763 Net disbursements on loans held-for-sale (4,803,927) (4,803,927) Acquisitions of loans held-for-sale (550,392) (550,392) Proceeds from sale of loans held-for-sale 4,127,794 4,127,794 Net decrease in trading securities 1,222,266 319 1,222,585 Net (increase) decrease in accrued income receivable (617) (51) (2,690) 11,630 3,560 11,832 Net decrease (increase) in other assets 26,591 4,005 (8,339) (116,729) 257 (94,215) Net increase (decrease) in interest payable 1,508 (7,762) 14,827 (3,560) 5,013 Deferred income taxes 1,156 (18,164) (195,283) (11,449) (223,740) Net increase in postretirement benefi t obligation 2,388 2,388 Net increase in other liabilities 4,354 55 8,180 46,795 12,191 71,575Total adjustments 470,111 512,835 446,298 877,735 (1,538,524) 768,455Net cash provided by (used in) operating activities 405,618 6,422 (60,914) 735,611 (382,775) 703,962Cash fl ows from investing activities: Net (increase) decrease in money market investments (37,700) 775 2,402 (664,268) 60,223 (638,568) Purchases of investment securities: Available-for-sale (6,808) (2) (886,267) 732,365 (160,712) Held-to-maturity (4,087,972) (25,232,314) (29,320,286) Other (928) (111,180) (112,108) Proceeds from calls, paydowns, maturities and redemptions of investment securities: Available-for-sale 2,344,225 (735,548) 1,608,677 Held-to-maturity 3,900,087 900 25,034,574 28,935,561 Other 44,185 44,185 Proceeds from sales of investment securities available-for-sale 5,783 17,572 34,812 58,167 Proceeds from sale of other investment securities 245,484 2 865 1 246,352 Net disbursements on loans (259,763) (25,150) (129,969) (954,507) (88,536) (1,457,925) Proceeds from sale of loans 415,256 415,256 Acquisition of loan portfolios (22,312) (22,312) Capital contribution to subsidiary (300) 300 Net liabilities assumed, net of cash 719,604 719,604 Mortgage servicing rights purchased (26,507) (26,507) Acquisition of premises and equipment (522) (104,344) (104,866) Proceeds from sale of premises and equipment 11 63,444 63,455 Proceeds from sale of foreclosed assets 175,974 175,974Net cash (used in) provided by investing activities (241,400) (6,203) (127,630) 830,376 (31,196) 423,947Cash fl ows from fi nancing activities: Net increase in deposits 2,887,952 1,572 2,889,524 Net increase (decrease) in federal funds purchased and assets sold under agreements to repurchase 9,063 (270,843) (63,400) (325,180) Net increase (decrease) in other short-term borrowings 14,213 260,815 (2,776,773) (111,056) (2,612,801) Payments of notes payable (5,000) (444,583) (2,216,143) 202,449 (2,463,277) Proceeds from issuance of notes payable 397 363,327 1,061,496 1,425,220 Dividends paid to parent company (383,100) 383,100 Dividends paid (190,617) (190,617) Proceeds from issuance of common stock 20,414 20,414 Treasury stock acquired (2,236) (289) (2,525) Capital contribution from parent 300 (300) Net cash (used in) provided by fi nancing activities (162,829) 188,622 (1,697,400) 412,365 (1,259,242)Net increase (decrease) in cash and due from banks 1,389 219 78 (131,413) (1,606) (131,333)Cash and due from banks at beginning of period 2 157 322 949,868 (191) 950,158Cash and due from banks at end of period $1,391 $376 $400 $818,455 ($1,797) $818,825
BOA22177_wo18_Popular.indd 178 3/3/2010 10:46:57 AM

INTENTIONALLY LEFT BLANK
BOA22177_wo18_Popular.indd 179 3/3/2010 10:46:57 AM

BOA22177_wo18_Popular.indd 180 3/3/2010 10:46:57 AM


p.o. box 362708
san Juan, puerto rico
00936-2708