ANNUAL REPORT FOR THE FINANCIAL YEAR ENDED 31 … · 4 1.2 Performance for the Financial Year Ended...
61
MANAGER: BIMB INVESTMENT MANAGEMENT BERHAD (276246-X) BIMB i DIVIDEND FUND ANNUAL REPORT FOR THE FINANCIAL YEAR ENDED 31 OCTOBER 2017 LAPORAN TAHUNAN BAGI TAHUN KEWANGAN BERAKHIR 31 OKTOBER 2017
Transcript of ANNUAL REPORT FOR THE FINANCIAL YEAR ENDED 31 … · 4 1.2 Performance for the Financial Year Ended...
MANAGER:BIMB INVESTMENT MANAGEMENT BERHAD (276246-X)
BIMB i DIVIDEND FUND
ANNUAL REPORT FOR THE FINANCIAL YEAR ENDED 31 OCTOBER 2017
LAPORAN TAHUNAN BAGI TAHUN KEWANGAN BERAKHIR 31 OKTOBER 2017
2
TABLE OF CONTENT
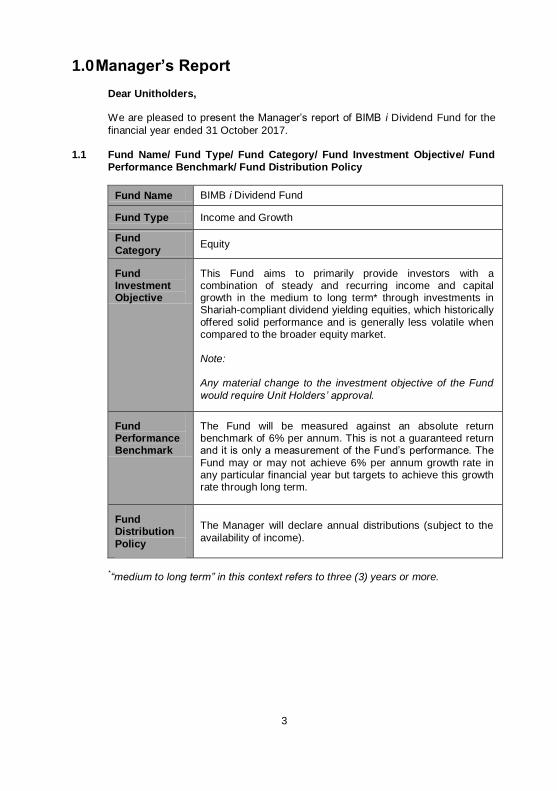
1.0 Manager’s Report 3
1.1 Fund Name/ Fund Type/ Fund Category/ Fund Investment Objective
3
1.2 Performance for the Financial Year Ended 31 October 2017
4
1.3 Economic and Market Review 7
1.4 Market Outlook and Strategy 9
1.5 Asset Allocation as at 31 October 2017 10
1.6 Other Performance Data for the Financial Year Ended 31 October 2017
11
1.7 Unit Holdings as at 31 October 2017 12
1.8 Policy on Rebate and Soft Commission 12
2.0 Trustee’s Report 24
3.0 Shariah Committee’s Report 25
4.0 Directors’ Declaration Report 26
5.0 Independent Auditors’ Report 27
6.0 Financial Statements (Audited) 31
7.0 Corporate Directory 59
3
1.0 Manager’s Report
Dear Unitholders, We are pleased to present the Manager’s report of BIMB i Dividend Fund for the
financial year ended 31 October 2017.
1.1 Fund Name/ Fund Type/ Fund Category/ Fund Investment Objective/ Fund
Performance Benchmark/ Fund Distribution Policy
Fund Name BIMB i Dividend Fund
Fund Type Income and Growth
Fund
Category Equity
Fund Investment Objective
This Fund aims to primarily provide investors with a combination of steady and recurring income and capital growth in the medium to long term* through investments in Shariah-compliant dividend yielding equities, which historically
offered solid performance and is generally less volatile when compared to the broader equity market. Note: Any material change to the investment objective of the Fund
would require Unit Holders’ approval.
Fund Performance Benchmark
The Fund will be measured against an absolute return benchmark of 6% per annum. This is not a guaranteed return and it is only a measurement of the Fund’s performance. The
Fund may or may not achieve 6% per annum growth rate in any particular financial year but targets to achieve this growth rate through long term.
Fund Distribution
Policy
The Manager will declare annual distributions (subject to the
availability of income).
*“medium to long term” in this context refers to three (3) years or more.

4
1.2 Performance for the Financial Year Ended 31 October 2017
1.2.1 Performance review for BIMB i Dividend Fund
For the financial year under review, BIMB i Dividend Fund (the Fund) declared a
net income distribution of 1.54 sen per unit, equivalent to a yield of 7.54% per
annum. The selected performance benchmark for this Fund is an absolute return
benchmark of 6.00% per annum. The Fund registered a return of 9.50% as
compared to its Benchmark’s return of 6.00%. For the financial year under review,
the FTSE Bursa Malaysia EMAS Shariah Index registered a gain of 5.64% as
foreign investors returned to Malaysia to increase their holdings in local equities.
Our strategy has consistently remained to focus on investing in stocks with
consistent track record of dividend distribution and potential capital growth over
medium to long term.
During the financial year ended 31 October 2017, the Fund was able to deliver
higher than its historical dividend yield as better market conditions and stronger
than expected GDP growth for Malaysia had help shore up local stocks’ share
price performance in 2017. Hence, for the financial year under review, the Fund
has met its objectives of providing investors with a steady annual income stream
and capital growth through investments in dividend yielding equities that
historically tends to offer good returns during equity market recovery periods. As at
31 October 2017, the fund had 97.40% exposure to equities and continues to be
managed in line with its stated objective by investing in dividend yielding equities.
For the year ended 31 October 2017, there were no significant changes to the
state of affairs of the Fund and no circumstances that materially affect the interest
of Unit Holders that have taken place up to the date of this Manager’s Report.
5
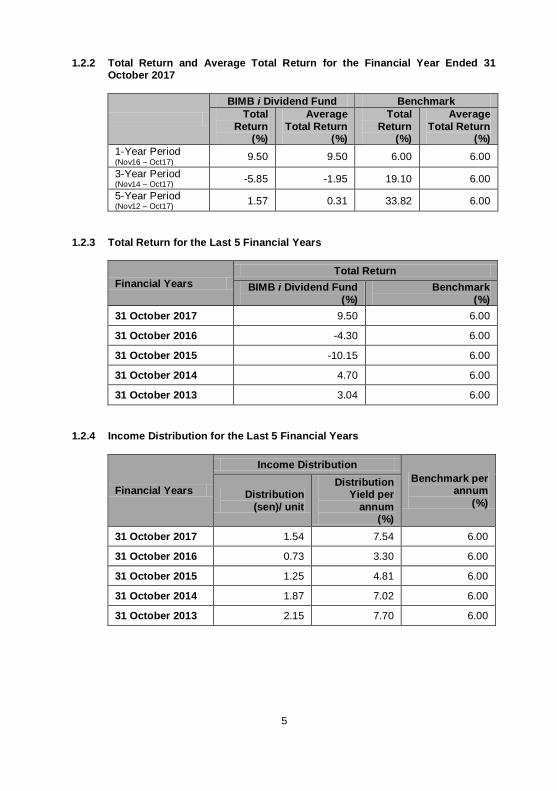
1.2.2 Total Return and Average Total Return for the Financial Year Ended 31 October 2017
BIMB i Dividend Fund Benchmark
Total
Return (%)
Average
Total Return (%)
Total
Return (%)
Average
Total Return (%)
1-Year Period (Nov16 – Oct17) 9.50 9.50 6.00 6.00
3-Year Period (Nov14 – Oct17) -5.85 -1.95 19.10 6.00
5-Year Period (Nov12 – Oct17) 1.57 0.31 33.82 6.00
1.2.3 Total Return for the Last 5 Financial Years
Financial Years
Total Return
BIMB i Dividend Fund
(%)
Benchmark
(%)
31 October 2017 9.50 6.00
31 October 2016 -4.30 6.00
31 October 2015 -10.15 6.00
31 October 2014 4.70 6.00
31 October 2013 3.04 6.00
1.2.4 Income Distribution for the Last 5 Financial Years
Financial Years
Income Distribution
Benchmark per annum
(%) Distribution
(sen)/ unit
Distribution Yield per
annum (%)
31 October 2017 1.54 7.54 6.00
31 October 2016 0.73 3.30 6.00
31 October 2015 1.25 4.81 6.00
31 October 2014 1.87 7.02 6.00
31 October 2013 2.15 7.70 6.00

6
Figure 1: Performance of the Fund versus the Benchmark
3.04%4.70%
-10.15%
-4.30%
9.50%
6.00%6.00%
6.00%6.00% 6.00%
-12.0%
-7.0%
-2.0%
3.0%
8.0%
13.0%
31-Oct-13 31-Oct-14 31-Oct-15 31-Oct-16 31-Oct-17
BIMB I-Dividend Benchmark
FUNDAND BENCHMARK TOTAL RETURNTOTAL RETURN
Note: Data Source : BIMB Investment Management Berhad
Data verified by : Novagni Analytics & Advisory Sdn. Bhd. Benchmark : Absolute return of 6% per annum
Notes:
1. Total Return of the Fund has been verified by Novagni Analytics & Advisory
Sdn. Bhd.
2. Average Total return is derived by this formula:
Total Return Number of Years under Review
Past performance is not necessarily indicative of future performance and unit prices and investment returns may go down, as well as up.

7
1.3 Economic and Market Review
Economy a) Global
United States (US) Gross Domestic Product (GDP) grew by 3.3% in the
third quarter of 2017 as compared to 3.1% growth in the second quarter of
2017 and 1.2% in the first quarter of 2017. US inflation rate remains healthy
at 2.0% in October 2017 while US unemployment rate continues to improve
to 4.1% in October 2017 as compared to 4.6% in November 2016. Moving
forward, the Fed intends to execute more potential rate hikes and
quantitative tightening for the US in the near term.
The Euro zone economy grew by 0.6% in the third quarter of 2017 as
compared to 0.7% in the second quarter 2017 and 0.6% in the first quarter
of 2017. The Euro zone economic recovery has gained momentum while
unemployment has fallen against a backdrop of ultra-low interest rates
which are among the measures implemented by the European Central
Bank (ECB) to boost economic activity.
The Chinese economy grew by 6.8% for the third quarter of 2017, as
compared to 6.9% in the second quarter of 2017 following improved
industrial output and private consumption, aided by a robust property
market and recovery in the exports sector. Overall, major global economies
appear to be recovering in tandem while market sentiment for the emerging
markets improved during the period under review.
(Source: Bloomberg, CIMB Research and RHB Research Institute Sdn Bhd)
b) Local
The Malaysian economy grew faster at 6.2% in the third quarter of 2017 as
compared to 5.8% in the second quarter 2017 and 5.6% in the first quarter
2017. The stronger GDP growth for the period was due to improvements in
private consumption and exports. Malaysia’s inflation on the other hand rose
to 3.7% in October 2017, up from 1.8% in November 2016 driven by higher
oil prices and stronger GDP performance.
Despite the higher inflationary pressure faced by the local economy, Bank
Negara Malaysia’s Monetary Policy Committee (MPC) had decided to
maintain the Overnight Policy Rate (OPR) at 3.00% during its September
meeting to accommodate and support growth prospect for the country.
Bank Negara’s international reserve rose to USD 101.5 billion as at 31
October 2017 as compared to USD 96.4 billion in November 2016 that is
sufficient to finance 7.6 months of retained imports and is 1.1 times the
short-term external debt.
(Source: Bank Negara Malaysia, Bloomberg, CIMB Research and RHB
Research Institute Sdn Bhd)

8
Market Review
Equity
FTSE Bursa Malaysia EMAS Shariah Index (“FBM Shariah”) commenced the year
under review at 12,384.01 points and declined to 11,845.46 points on 30
November 2016. The FBM Shariah subsequently rose to 13,126.04 on 16 May
2017 and closed at 13,082.72 points on 31 October 2017. For the year under
review, the FBM Shariah was up 698.71 points or 5.64% while the FBM KLCI was
up by 75.46 points or 4.51% to close at 1,747.92 points. Among the key factors
that contributed to the movement of the index are highlighted below:
In November 2016, Donald Trump’s victory in the U.S. presidential election
caught the general markets off-guard as investors flock to safe heaven assets
like gold, bond and the Japanese yen, perceiving Trump’s administration
would bring uncertainty to the markets. The Asian markets reacted with a
sharp selldown, however subsequently, global investors rebalanced their
portfolio to take advantage of the perceived stronger US growth and higher
US bond yields.
In April 2017, a historic meeting between US President Donald Trump and
China’s leader Xi Jinping signaled more understanding between the two
countries after a summit held in Florida, USA and appears to have
successfully defused a potential trade war between the world’s two largest
economies. A stabilizing US-China trade relationship will allow the US Federal
Reserve to conduct its third rate hike of the year by 25bps to 1.50% on the
back of stronger economic fundamentals in the US.
In August 2017, the North Korea and US dispute escalated to new heights
post of North Korea’s missile testing exercise that had prompted US President
Trump to issue a retaliation warning. However, markets were quick to
discount the negative news and sentiment recovered subsequently as the US
Federal Reserve announced of its quantitative tightening measures. The Fed
intends to retire USD3.6 trillion or 50% of its Quantitative easing money in the
market in three years time along with more rate hikes in the short to medium
term horizon.
(Source: Bloomberg, CIMB Research and RHB Research Institute Sdn Bhd)

9
1.4 Market Outlook and Strategy
For the rest of 2017, the equity market is expected to be volatile. External
factors may likely influence the domestic market sentiment, which includes
the OPEC and Non-OPEC commitment to stabilize the oil glut, US President
Trump’s stance on North Korea’s nuclear ambition and potential military
strike. With potential interest on selective sector to support the domestic
market, the local bourse should be able to withstand external shocks given
the ample domestic liquidity and buying interest from foreign and local
institutional investors.
While the global economy continues to expand at a moderate pace, there has
been increasing divergence in the growth momentum among the major
economies. For most of Asia, growth is supported by the continued expansion
of domestic demand. Looking ahead, the global economy is expected to
continue on a moderate recovery path.
For Malaysia, the resilience of domestic consumption remains the support for
growth. With higher spending on infrastructure projects underway, higher
public sector wages adjustments, improved outlook for crude palm oil
production volume and a rebound in government consumption and
expenditure will help to improve corporate earnings and consumer spending
for the year.

10
1.5 Asset Allocation as at 31 October 2017
BIMB i Dividend Fund 2017 (%)
2016 (%)
2015 (%)
Investment In Quoted Securities
Construction 1.3 2.9 3.6
Consumer Products 2.2 4.1 2.6
Finance - 2.7 2.8
Industrial Products 25.0 17.8 1.7
Infrastructure 7.0 6.7 10.6
Plantation 4.0 2.1 9.6
Properties 3.0 15.6 13.9
REITs - - 0.1
Technology 19.1 9.4 0.5
Trading and Services 34.8 34.9 44.7
Warrant 1.0 0.2 0.3
97.4 96.4 90.4
CASH AND SHORT TERM INVESTMENTS:
2.6 3.6 9.6
100.0 100.0 100.0

11
1.6 Other Performance Data for the Financial Year Ended 31 October 2017
BIMB i Dividend Fund 2017 2016 2015
Unit Prices (MYR)
Highest net asset value (“NAV”) per unit for the year*
0.2229 0.2242 0.2600
Lowest NAV per unit for the year* 0.1934 0.2021 0.2060
Net Asset Value (NAV) and Units in Circulation (UIC) as at the End of the Year
Total NAV (MYR) 173,998,986 183,152,705 218,658,890
Units in Circulation (UIC) 835,418,744 896,618,385 988,832,925
NAV per unit (MYR)* 0.2083 0.2043 0.2211
Return of Fund (%)(a)
Capital Growth (%)(b)
1.96 (7.60) (14.96)
Income Return (%)(c)
7.54 3.30 4.81
Return of Fund (%) 9.50 (4.30) (10.15)
Gross Distribution per Unit (Sen) 1.54 0.73 1.2500
Net Distribution per Unit (Sen) 1.54 0.73 1.2500
NAV per Unit before Distribution (MYR) 0.2237 0.2116 0.2336
NAV per Unit after Distribution (MYR) 0.2083 0.2043 0.2211
Date of Distribution 31 October 31 October 31 October
Management Expense Ratio (MER) (%)
(d)
1.71 1.70 1.65
Portfolio Turnover Ratio (PTR) (times)
(e)
1.13 0.95 3.34
*The price and NAV per unit are ex-distribution
Note:
a) Return of the Fund = NAV per unit (end of financial year) - 1 NAV per unit (beginning of financial year)
b) Capital Growth = Total Return of the Fund – Income Return
c) Income Return =
{Income Distribution per Unit / NAV per Unit on beginning of financial year} x 100
d) Management Expenses =
Ratio
It is the total management expenses expressed as an annual percentage of the Fund’s average NAV
12
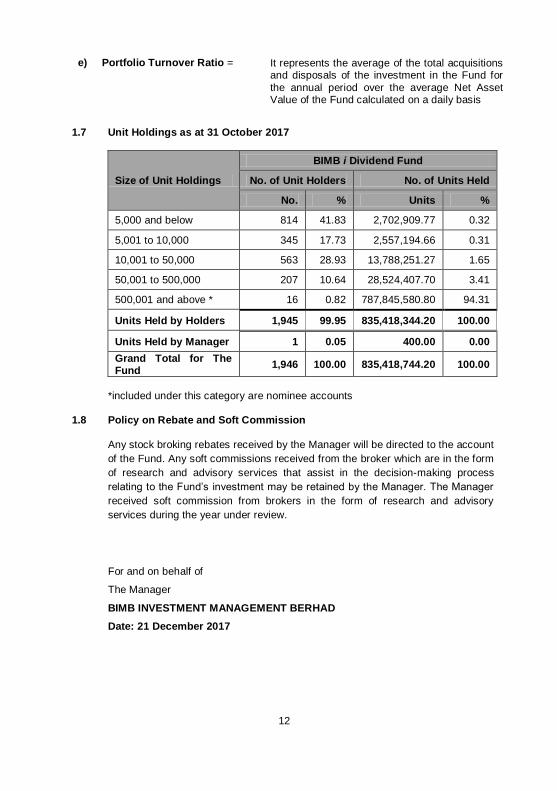
e) Portfolio Turnover Ratio =
It represents the average of the total acquisitions and disposals of the investment in the Fund for
the annual period over the average Net Asset Value of the Fund calculated on a daily basis
1.7 Unit Holdings as at 31 October 2017
Size of Unit Holdings
BIMB i Dividend Fund
No. of Unit Holders No. of Units Held
No. % Units %
5,000 and below 814 41.83 2,702,909.77 0.32
5,001 to 10,000 345 17.73 2,557,194.66 0.31
10,001 to 50,000 563 28.93 13,788,251.27 1.65
50,001 to 500,000 207 10.64 28,524,407.70 3.41
500,001 and above * 16 0.82 787,845,580.80 94.31
Units Held by Holders 1,945 99.95 835,418,344.20 100.00
Units Held by Manager 1 0.05 400.00 0.00
Grand Total for The Fund
1,946 100.00 835,418,744.20 100.00
*included under this category are nominee accounts 1.8 Policy on Rebate and Soft Commission
Any stock broking rebates received by the Manager will be directed to the account
of the Fund. Any soft commissions received from the broker which are in the form
of research and advisory services that assist in the decision-making process
relating to the Fund’s investment may be retained by the Manager. The Manager
received soft commission from brokers in the form of research and advisory
services during the year under review.
For and on behalf of
The Manager
BIMB INVESTMENT MANAGEMENT BERHAD
Date: 21 December 2017

13
1.0 Laporan Pengurus
Para Pemegang Unit yang dihormati, Kami dengan sukacitanya membentangkan Laporan Pengurus BIMB i Dividend
Fund bagi tahun kewangan berakhir 31 Oktober 2017.
1.1 Nama Dana/ Jenis Dana/ Kategori Dana/ Objektif Pelaburan Dana/ Penanda
Aras Dana/ Polisi Agihan Dana
Nama Dana BIMB i Dividend Fund
Jenis Dana Dana Pendapatan dan Pertumbuhan
Kategori Dana Ekuiti
Objektif Pelaburan Dana
Tujuan utama Dana ini adalah untuk mewujudkan peluang kepada pelabur, kombinasi pendapatan yang stabil dan berulang serta pertumbuhan modal dalam
jangka sederhana hingga jangka panjang* melalui pelaburan dalam ekuiti patuh Syariah yang menghasilkan dividen, yang mana mengikut sejarah
menawarkan prestasi yang kukuh dan secara amnya lebih stabil berbanding pasaran ekuiti secara keseluruhan.
Nota:
Sebarang perubahan ketara pada objektif pelaburan Dana memerlukan kelulusan Pemegang Unit.
Penanda Aras Dana
Dana akan diukur berdasarkan penanda aras pulangan mutlak 6% setahun. Ini bukanlah satu pulangan yang dijamin dan ia hanyalah ukuran prestasi Dana. Dana ini mungkin atau mungkin tidak mencapai kadar
pertumbuhan 6% setahun pada mana-mana tahun kewangan tertentu tetapi mempunyai sasaran untuk mencapai pulangan ini menerusi pertumbuhan jangka
panjang.
Polisi Agihan
Dana
Pengurus akan mengisytiharkan agihan tahunan
(tertakluk kepada pendapatan diperolehi).
*“jangka sederhana hingga jangka panjang” dalam konteks ini merujuk kepada
tiga (3) tahun atau lebih.

14
1.2 Pencapaian bagi Tahun Kewangan Berakhir 31 Oktober 2017
1.2.1 Kajian Pencapaian bagi BIMB i Dividend Fund
Bagi tahun kewangan dalam kajian, BIMB i Dividend Fund (Dana) telah
mengumumkan agihan pendapatan bersih sebanyak 1.54 sen seunit, bersamaan
dengan hasil pulangan sebanyak 7.54% setahun. Penanda aras terpilih prestasi
Dana adalah penanda aras pulangan mutlak sebanyak 6.00% setahun. Dana
mencatatkan pulangan sebanyak 9.50% berbanding pulangan penanda aras
sebanyak 6.00%. Bagi tahun kewangan dalam kajian, Indeks Syariah EMAS
FTSE Bursa Malaysia mencatatkan keuntungan sebanyak 5.64% berikutan para
pelabur asing kembali ke Malaysia untuk meningkatkan pegangan mereka dalam
pasaran ekuiti tempatan.
Strategi kami secara konsisten menumpukan kepada pelaburan dalam saham-
saham yang mempunyai rekod pencapaian yang berterusan dalam pengagihan
dividen dan berpotensi untuk mencatatkan pertumbuhan modal dalam jangka
sederhana dan panjang.
Dalam tahun kewangan berakhir pada 31 Oktober 2017, Dana telah berjaya
meraih hasil dividen lebih tinggi berbanding sejarahnya berikutan keadaan
pasaran lebih baik dan pertumbuhan keluaran dalam negara kasar (KDNK)
Malaysia yang lebih kukuh telah menyokong melonjakkan lagi prestasi harga-
harga saham tempatan pada 2017. Sehubungan itu, untuk tahun kewangan dalam
kajian, Dana telah mencapai objektifnya untuk membolehkan para pelabur
menikmati aliran pendapatan tahunan yang stabil dan pertumbuhan modal
melalui pelaburan ekuiti yang menawarkan hasil dividen yang berdasarkan
sejarahnya memberikan pulangan yang baik ketika tempoh pemulihan pasaran
ekuiti. Setakat 31 Oktober 2017, Dana mempunyai pendedahan dalam pasaran
ekuiti sebanyak 97.40% dan kekal diuruskan sejajar dengan objektifnya yang
dinyatakan iaitu melabur dalam ekuiti yang memberikan hasil pulangan dividen.
Bagi tahun berakhir 31 Oktober 2017, tidak terdapat sebarang perubahan ketara
dalam hal ehwal pengurusan Dana dan tiada berlakunya sebarang keadaan yang
menjejaskan kepentingan para Pemegang Unit sehingga tarikh Laporan Pengurus
ini disediakan.

15
1.2.2 Jumlah Pulangan dan Purata Jumlah Pulangan Bagi Tempoh Kewangan Berakhir Pada 31 Oktober 2017
BIMB i Dividend Fund Penanda Aras
Jumlah Pulangan
(%)
Purata
Jumlah Pulangan
(%)
Jumlah Pulangan
(%)
Purata
Jumlah Pulangan
(%)
Jangkamasa 1-
Tahun (Nov16 – Okt17)
9.50 9.50 6.00 6.00
Jangkamasa 3-
Tahun (Nov14 – Okt17)
-5.85 -1.95 19.10 6.00
Jangkamasa 5 –
Tahun (Nov12 – Okt17)
1.57 0.31 33.82 6.00
1.2.3 Jumlah Pulangan Bagi 5 Tahun Kewangan Terakhir
Tahun Kewangan
Jumlah Pulangan
BIMB i Dividend Fund
(%)
Penanda Aras
(%)
31 Oktober 2017 9.50 6.00
31 Oktober 2016 -4.30 6.00
31 Oktober 2015 -10.15 6.00
31 Oktober 2014 4.70 6.00
31 Oktober 2013 3.04 6.00
1.2.4 Agihan Pendapatan Bagi 5 Tahun Kewangan Terakhir
Tahun Kewangan
Pengagihan Pendapatan Penanda
Aras Tahunan
(%)
Pengagihan
(sen)/ unit
Pengagihan
KeuntuganTahunan (%)
31 Oktober 2017 1.54 7.54 6.00
31 Oktober 2016 0.73 3.30 6.00
31 Oktober 2015 1.25 4.81 6.00
31 Oktober 2014 1.87 7.02 6.00
31 Oktober 2013 2.15 7.70 6.00

16
Rajah 1: Prestasi Dana Berbanding Pulangan Penanda Aras
Nota: Sumber Data : BIMB Investment Management Berhad
Data disahkan oleh : Novagni Analytics & Advisor Sdn. Bhd. Penanda Aras : Pulangan mutlak sebanyak 6% setahun
Nota: 1. Jumlah Pulangan telah disahkan oleh Novagni Analytics & Advisor Sdn.
Bhd.
2. Jumlah Pulangan Purata adalah berpandukan formula berikut:
Jumlah Pulangan Bilangan Tahun Bawah Kajian
Prestasi tahun-tahun sebelum ini tidak semestinya menjadi petunjuk prestasi masa depan dan harga unit serta pulangan pelaburan mungkin turun dan naik.

17
1.3 Ekonomi dan Kajian Pasaran
Ekonomi a) Global
Keluaran Dalam Negara Kasar (KDNK) Amerika Syarikat (AS)
berkembang sebanyak 3.3% pada suku ketiga 2017 berbanding
pertumbuhan 3.1% pada suku kedua 2017 dan 1.2% pada suku
pertama 2017. Kadar inflasi AS kekal sihat iaitu sekitar 2.0% pada
Oktober 2017 sementara kadar pengangguran AS terus menurun
kepada 4.1% pada Oktober 2017 daripada 4.6% pada November 2016.
Bergerak kehadapan, pihak Rizab Persekutuan AS bercadang untuk
menaikan kadar faedah dan pengetatan kuantitatif di AS dalam tempoh
terdekat.
Ekonomi zon Euro berkembang sebanyak 0.6% pada suku ketiga 2017
berbanding 0.7% pada suku kedua 2017 dan 0.6% pada suku pertama
2017. Pemulihan ekonomi zon Euro menyaksikan berlakunya
peningkatan momentum dengan kadar pengangguran telah menurun di
sebalik kejatuhan kadar faedah yang teramat rendah, iaitu di antara
langkah-langkah yang telah dilaksanakan oleh Bank Pusat Eropah
(ECB) untuk meningkatkan aktiviti ekonomi.
Ekonomi China berkembang sebanyak 6.8% pada suku ketiga 2017
berbanding 6.9% pada suku pertama 2017 berikutan peningkatan
dalam pengeluaran perindustrian dan penggunaan swasta yang
dibantu oleh pasaran hartanah yang kukuh dan pemulihan sektor
eksport. Secara keseluruhan, ekonomi utama dunia kelihatan semakin
pulih dengan kadar yang sejajar, dan sentimen untuk prestasi pasaran
saham untuk pasaran-pasaran baru telah meningkat pada tempoh
dalam kajian.
(Sumber: Bloomberg, CIMB Research dan RHB Research Institute Sdn Bhd)

18
b) Dalam Negara
Ekonomi Malaysia berkembang lebih pantas sebanyak 6.2% pada suku
ketiga 2017 berbanding 5.8% pada suku kedua 2017 dan 5.6% pada
suku pertama 2017. KDNK yang lebih kukuh dalam tempoh berkenaan
adalah hasil peningkatan dalam penggunaan swasta dan eksport.
Kadar inflasi Malaysia pada Oktobar 2017 meningkat kepada 3.7%
daripada 1.8% pada November 2016, didorong oleh kenaikan harga
minyak dan prestasi pertumbuhan KDNK yang lebih kukuh.
Meskipun terdapat tekanan inflasi yang lebih tinggi yang dihadapi oleh
ekonomi tempatan, Jawatankuasa Dasar Monetari Bank Negara
Malaysia (MPC) mengekalkan Kadar Dasar Semalaman (OPR) pada
paras 3.00% dalam mesyuaratnya yang diadakan pada September
bagi menampung dan menyokong prospek pertumbuhan negara. Rizab
antarabangsa Bank Negara meningkat kepada AS$101.5 bilion setakat
pada 31 Oktober 2017 berbanding AS$96.4 bilion pada November
2016 yang memadai untuk membiayai 7.6 bulan import tertangguh dan
mewakili 1.1 kali hutang jangka pendek luar negara.
(Sumber: Bank Negara Malaysia, Bloomberg, CIMB Research dan RHB
Research Institute Sdn Bhd)
Kajian Pasaran
Ekuiti
Indeks Syariah EMAS FTSE Bursa Malaysia (Syariah FBM) memasuki tempoh
dalam kajian pada paras 12,384.01 mata dan jatuh ke paras terendah 11,845.46
mata pada 30 November 2016. Indeks Syariah FBM kemudianya naik mencecah
ke paras tertinggi 13,126.04 mata pada 16 Mei 2017 dan ditutup pada paras
13,082.72 mata pada 31 Oktober 2017. Bagi tahun dalam kajian, FBM Syariah
meningkat sebanyak 698.71 mata atau 5.64% manakala FBM KLCI naik sebanyak
75.46 mata atau 4.51% untuk ditutup pada paras 1,747.92 mata. Antara faktor-
faktor utama yang menyumbang kepada pergerakan indeks adalah seperti berikut:
Pada November 2016, kemenangan Donald Trump dalam pilihan raya
Presiden AS adalah di luar jangkaan dan mengejutkan pasaran amnya
apabila para pelabur berpusu-pusu mencari aset pelaburan yang selamat
seperti emas, bon dan yen Jepun kerana mempercayai bahawa pentadbiran
Trump akan menyebabkan berlakunya ketidaktentuan dalam pasaran.
Pasaran Asia pula mengalami kegiatan jualan secara besar-besaran sebelum
para pelabur sejagat kemudiannya mengimbangi semula portfolio mereka
untuk mengambil faedah daripada pertumbuhan lebih kukuh dalam ekonomi
AS dan kadar hasil bon AS yang lebih tinggi.

19
Pada April 2017, pertemuan bersejarah antara Presiden AS Donald Trump
dan pemimpin China, Xi Jinping telah menunjukkan persefahaman yang
lebih di antara kedua-dua negara itu selepas sidang kemuncak diadakan
di Florida, AS yang mungkin dapat melenyapkan potensi berlakunya
perang perdagangan antara dua kuasa ekonomi terbesar dunia. Hubungan
perdagangan AS-China yang stabil juga telah membolehkan Rizab
Persekutuan AS menaikkan kadar faedah ketiga pada tahun ini sebanyak
25bps kepada 1.50% berasaskan fundamental ekonomi yang lebih kukuh
dalam ekonomi AS.
Pada Ogos 2017, pertikaian antara Korea Utara dengan AS semakin
memuncak selepas Korea Utara melakukan ujian peluru berpandu
sehingga Presiden Trump mengeluarkan amaran untuk bertindak balas.
Walau bagaimanapun, pasaran bertindak cepat untuk tidak mengendahkan
berita buruk tersebut dan sentimen kemudiannya pulih berikutan
pengumuman Rizab Persekutuan Amerika Syarikat akan memulakan
langkah pengetatan kuantitatifnya. Rizab Persekutuan Amerika Syarikat
bercadang untuk menghentikan program kelonggaran kuantitatif sebanyak
AS$3.6 trilion atau 50% daripada wangnya dalam pasaran bagi tempoh
tiga tahun akan datang selain melakukan lebih banyak kenaikan kadar
faedah dalam jangka masa pendek ke sederhana.
(Sumber: Bloomberg, CIMB Research dan RHB Research Institute Sdn Bhd)
1.4 Tinjauan Pasaran dan Strategi
Untuk baki tahun 2017, pasaran ekuiti dijangka akan terus berada dalam
keadaan tidak menentu. Faktor luaran berkemungkinan mempengaruhi
sentimen pasaran domestik termasuklah komitmen negara-negara
anggota OPEC dan bukan OPEC untuk menstabilkan pasaran minyak
yang mengalami lebihan pengeluaran, pendirian Presiden Trump terhadap
cita-cita nuklear Korea Utara dan kemungkinan tindakan ketenteraan.
Dengan potensi minat terhadap sektor terpilih untuk menyokong pasaran
domestik, bursa tempatan seharusnya berupaya menahan kejutan luaran
memandangkan terdapat mudah tunai yang mencukupi dalam negara dan
minat belian daripada para pelabur institusi asing dan tempatan.
Ketika ekonomi global terus berkembang pada kadar yang sederhana,
pencapahan didapati meningkat dalam momentum pertumbuhan
dikalangan kuasa-kuasa ekonomi yang utama. Bagi sebahagian besar
negara Asia, pertumbuhan ekonomi disokong oleh pengembangan
permintaan domestik yang berterusan. Melangkah ke hadapan, ekonomi
global dijangka akan terus berada pada landasan pemulihan yang
sederhana.

20
Pengukuhan penggunaan domestik kekal menyokong pertumbuhan
ekonomi Malaysia. Dengan jumlah perbelanjaan lebih besar diperuntukkan
kepada projek-projek infrastruktur yang sedang dijalankan, gaji sektor
awam yang lebih tinggi, tinjauan jumlah pengeluaran minyak sawit mentah
yang bertambah baik dan terdapat lonjakan dalam penggunaan dan
perbelanjaan kerajaan akan membantu menambah baik pendapatan
korporat dan perbelanjaan pengguna pada tahun ini.
1.5 Peruntukan Aset Setakat 31 Oktober 2017
BIMB i Dividend Fund 2017
(%) 2016
(%) 2015
(%)
Pelaburan Sekuriti Tersiarharga
Pembinaan 1.3 2.9 3.6
Barangan Pengguna 2.2 4.1 2.6
Kewangan - 2.7 2.8
Barangan Industri 25.0 17.8 1.7
Infrastruktur 7.0 6.7 10.6
Perladangan 4.0 2.1 9.6
Hartanah 3.0 15.6 13.9
REITs - - 0.1
Teknologi 19.1 9.4 0.5
Perdagangan dan Perkhidmatan 34.8 34.9 44.7
Waran 1.0 0.2 0.3
97.4 96.4
90.4
TUNAI DAN PELABURAN JANGKA PENDEK:
2.6 3.6 9.6
100.0 100.0 100.0
21
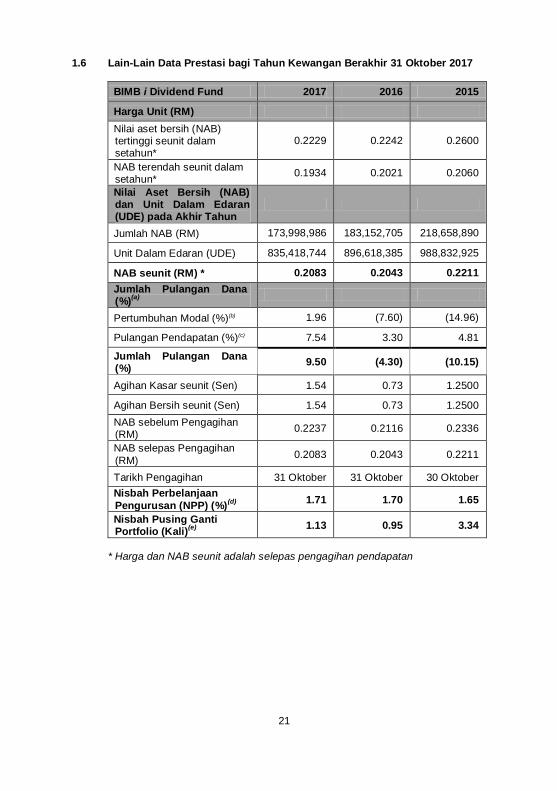
1.6 Lain-Lain Data Prestasi bagi Tahun Kewangan Berakhir 31 Oktober 2017
BIMB i Dividend Fund 2017 2016 2015
Harga Unit (RM)
Nilai aset bersih (NAB) tertinggi seunit dalam setahun*
0.2229 0.2242 0.2600
NAB terendah seunit dalam setahun*
0.1934 0.2021 0.2060
Nilai Aset Bersih (NAB) dan Unit Dalam Edaran (UDE) pada Akhir Tahun
Jumlah NAB (RM) 173,998,986 183,152,705 218,658,890
Unit Dalam Edaran (UDE) 835,418,744 896,618,385 988,832,925
NAB seunit (RM) * 0.2083 0.2043 0.2211
Jumlah Pulangan Dana (%)
(a)
Pertumbuhan Modal (%)(b) 1.96 (7.60) (14.96)
Pulangan Pendapatan (%)(c) 7.54 3.30 4.81
Jumlah Pulangan Dana (%)
9.50 (4.30) (10.15)
Agihan Kasar seunit (Sen) 1.54 0.73 1.2500
Agihan Bersih seunit (Sen) 1.54 0.73 1.2500
NAB sebelum Pengagihan (RM)
0.2237 0.2116 0.2336
NAB selepas Pengagihan
(RM) 0.2083 0.2043 0.2211
Tarikh Pengagihan 31 Oktober 31 Oktober 30 Oktober
Nisbah Perbelanjaan
Pengurusan (NPP) (%)(d) 1.71 1.70 1.65
Nisbah Pusing Ganti Portfolio (Kali)
(e) 1.13 0.95 3.34
* Harga dan NAB seunit adalah selepas pengagihan pendapatan

22
Nota:-
a) Pulangan ke atas Dana = Harga seunit (pada akhir tahun kewangan) - 1
Harga seunit (pada awal tahun kewangan)
b) Pertumbuhan Modal = Jumlah Pulangan Dana - Pulangan Pendapatan
c) Pulangan Pendapatan =
{Pengagihan Pendapatan per Unit / NAB per unit pada awal tahun kewangan} x 100
d) Nisbah Perbelanjaan =
Pengurusan
Ia dikira dengan mengambil jumlah perbelanjaan
pengurusan sepertimana yang dinyatakan
sebagai peratusan tahunan daripada jumlah
purata NAB Dana
e) Nisbah Pusing Ganti =
Portfolio
Ia dikira dengan mengambil purata jumlah
perolehan dan pelupusan pelaburan dalam Dana
bagi tempoh tahunan dibahagi dengan purata
NAB Dana yang dikira pada asas harian
1.7 Pecahan Pegangan Unit Setakat 31 Oktober 2017
Saiz Pegangan Unit
BIMB i Dividend Fund
Bilangan
Pemegang Unit Jumlah Pegangan Unit
Bilangan % Unit %
5,000 dan ke bawah 814 41.83 2,702,909.77 0.32
5,001 hingga 10,000 345 17.73 2,557,194.66 0.31
10,001 hingga 50,000 563 28.93 13,788,251.27 1.65
50,001 hingga 500,000 207 10.64 28,524,407.70 3.41
500,001 dan ke atas * 16 0.82 787,845,580.80 94.31
Unit yang dipegang oleh Pemegang Unit
1,945 99.95 835,418,344.20 100.00
Unit yang dipegang oleh Pengurus
1 0.05 400.00 0.00
Jumlah Keseluruhan Dana 1,946 100.00 835,418,744.20 100.00
*Akaun penama juga termasuk dibawah kategori ini.

23
1.8 Polisi Rebat dan Komisyen Bukan Tunai
Sebarang rebat broker saham yang diterima oleh Pengurus akan dimasukkan
ke akaun Dana. Apa-apa komisyen bukan tunai yang diterima daripada broker
dalam bentuk perkhidmatan penyelidikan dan nasihat yang membantu dalam
proses membuat keputusan yang berkaitan dengan pelaburan Dana boleh
disimpan oleh Pengurus. Pengurus menerima komisen bukan tunai daripada
broker dalam bentuk perkhidmatan penyelidikan dan khidmat nasihat bagi
tahun dalam kajian.
Untuk dan bagi pihak Pengurus
BIMB INVESTMENT MANAGEMENT BERHAD
Tarikh: 21 Disember 2017
Nota:
Laporan ini telah diterjemahkan daripada laporan asal (dalam Bahasa
Inggeris). Jika terdapat perbezaan, sila rujuk kepada laporan Bahasa
Inggeris.

24
2.0 Trustee’s Report
CIMB ISLAMIC TRUSTEE BERHAD ANNUAL REPORT
FOR THE FINANCIAL YEAR ENDED 31 OCTOBER 2017
To the unitholders of BIMB i DIVIDEND FUND
We, CIMB Islamic Trustee Berhad being the Trustee of BIMB i Dividend Fund
(“the Fund”) are of the opinion that BIMB Investment Management Berhad (“the
Manager”), acting in the capacity as Manager of the Fund, has fulfilled its duties in
the following manner for the financial year ended 31 October 2017.
1. The Fund has been managed in accordance with the limitations imposed on
the investment powers of the Manager under the Deed, the Securities
Commission Malaysia’s Guidelines on Unit Trust Funds, the Capital Markets
and Services Act 2007 (as amended from time to time) and other applicable
laws;
2. Valuation and pricing for the Fund has been carried out in accordance with the
relevant regulatory requirements;
3. Creation and cancellation of units have been carried out in accordance with
the relevant regulatory requirements; and
4. The distribution of returns by the Fund is relevant and reflect the investment
objective of the Fund.
For and on behalf of CIMB ISLAMIC TRUSTEE BERHAD (Company No. 167913-M)
………………………
LEE KOOI YOKE
Chief Operating Officer
Kuala Lumpur, Malaysia
Date: 21 December 2017

25
3.0 Shariah Committee’s Report
ANNUAL REPORT
FOR THE FINANCIAL YEAR ENDED 31 OCTOBER 2017
حيم ن ٱلر ـ حم بسم ٱهلل ٱلر
To the Unitholders of BIMB i Dividend Fund
We have acted as the Shariah Committee of BIMB i Dividend Fund.
Our responsibilities are to ensure that the procedures and processes employed by
BIMB Investment Management Berhad and that the provisions of the Deed dated
23 June 2010 and any supplemental deed issued thereafter are in accordance
with Shariah principles.
In our opinion, BIMB Investment Management Berhad has managed BIMB i
Dividend Fund in accordance with Shariah principles and complied with applicable
guidelines, rulings or decisions issued by the Securities Commission pertaining to
Shariah matters for the financial year ended 31 October 2017.
In addition, we also confirm that the investment portfolio of BIMB i Dividend Fund
comprises securities which have been classified as Shariah-compliant by the
Shariah Advisory Council (SAC) of the Securities Commission, as the case may
be and that all deposits and money market instruments placed by the Funds are
Shariah-compliant.
أعلم وهللا For and on behalf of the Shariah Committee
………………………………………………..
USTAZ DR. AHMAD SHAHBARI@SOBRI SALAMON (Chairman)
……………………………………………….. USTAZ DR. YUSOF RAMLI (Committee Member)
……………………………………………….. USTAZAH DR. ASMAK AB. RAHMAN
(Committee Member) Date: 21 December 2017

26
4.0 Directors’ Declaration Report
ANNUAL REPORT
FOR THE FINANCIAL YEAR ENDED 31 OCTOBER 2017
To the Unitholders of
BIMB i Dividend Fund
We, Dr. Mohd Hatta Bin Dagap and Najmuddin Bin Mohd Lutfi, being two of the
directors of the Manager, BIMB Investment Management Berhad, for BIMB i
Dividend Fund, do hereby state that in our opinion, the accompanying Statement
of Financial Position, Statement of Profit or Loss and other Comprehensive
Income, Statement of Changes in Net Asset Value and Statement of Cash Flows
are drawn up so as to give true and fair view of the Statement of Financial
Position of the Fund as at 31 October 2017 and Statement of Profit or Loss and
other Comprehensive Income, Statement of Changes in Net Asset Value and
Statement of Cash Flows for the year ended on that date.
For and on behalf on the Board of Directors,
…………………………………
DR. MOHD HATTA BIN DAGAP
(Non Executive Independent Director)
…………………………………
NAJMUDDIN BIN MOHD LUTFI
(Chief Executive Officer)
Date: 21 December 2017

27
5.0 Independent Auditors’ Report
Independent Auditors’ Report to the Unitholders of BIMB i Dividend Fund
(Established in Malaysia)
Report on the Audit of the Financial Statements
Opinion
We have audited the financial statements of BIMB i Dividend Fund (“the Fund”),
which comprise the statement of financial position as at 31 October 2017, and the
statement of profit or loss and other comprehensive income, statement of changes
in net asset value and cash flows for the year then ended, and notes to the
financial statements, including a summary of significant accounting policies, as set
out on pages 31 to 58.
In our opinion, the accompanying financial statements give a true and fair view of
the financial position of the Fund as at 31 October 2017, and of its financial
performance and its cash flows for the year then ended in accordance with
Malaysian Financial Reporting Standards, International Financial Reporting
Standards and Securities Commission’s Guidelines on Unit Trust Funds in
Malaysia.
Basis for Opinion
We conducted our audit in accordance with approved standards on auditing in
Malaysia and International Standards on Auditing. Our responsibilities under those
standards are further described in the Auditors’ Responsibilities for the Audit of
the Financial Statements section of our report. We believe that the audit evidence
we have obtained is sufficient and appropriate to provide a basis for our opinion.
Independence and Other Ethical Responsibilities
We are independent of the Fund in accordance with the By-Laws (on Professional
Ethics, Conduct and Practice) of the Malaysian Institute of Accountants (“By-
Laws”) and the International Ethics Standards Board for Accountants’ Code of
Ethics for Professional Accountants (“IESBA Code”), and we have fulfilled our
other ethical responsibilities in accordance with the By-Laws and the IESBA Code.

28
Information Other than the Financial Statements and Auditors’ Report
Thereon
The Manager of the Fund is responsible for the other information. The other
information comprises the information included in the annual report, but does not
include the financial statements of the Fund and our auditors’ report thereon.
Our opinion on the financial statements of the Fund does not cover the annual
report and we do not express any form of assurance conclusion thereon.
In connection with our audit of the financial statements of the Fund, our
responsibility is to read the annual report and, in doing so, consider whether
annual report is materially inconsistent with the financial statements of the Fund or
our knowledge obtained in the audit or otherwise appears to be materially
misstated.
If, based on the work we have performed, we conclude that there is a material
misstatement of the annual report, we are required to report that fact. We have
nothing to report in this regard.
Responsibilities of the Manager and Trustee for the Financial Statements
The Manager of the Fund is responsible for the preparation of financial statements
of the Fund that give a true and fair view in accordance with Malaysian Financial
Reporting Standards, International Financial Reporting Standards and Securities
Commission’s Guidelines on Unit Trust Funds in Malaysia. The Manager is also
responsible for such internal control as the Manager determine is necessary to
enable the preparation of financial statements of the Fund that are free from
material misstatement, whether due to fraud or error.
In preparing the financial statements of the Fund, the Manager is responsible for
assessing the ability of the Fund to continue as a going concern, disclosing, as
applicable, matters related to going concern and using the going concern basis of
accounting unless the Manager either intend to liquidate the Fund or to cease
operations, or have no realistic alternative but to do so.
The Trustee is responsible for ensuring that the Manager maintains proper
accounting and other records as necessary to enable true and fair presentations
of these financial statements.
29
Auditors’ Responsibilities for the Audit of the Financial Statements
Our objectives are to obtain reasonable assurance about whether the financial
statements of the Fund as a whole are free from material misstatement, whether
due to fraud or error, and to issue an auditors’ report that includes our opinion.
Reasonable assurance is a high level of assurance, but is not a guarantee that an
audit conducted in accordance with approved standards on auditing in Malaysia
and International Standards on Auditing will always detect a material
misstatement when it exists. Misstatements can arise from fraud or error and are
considered material if, individually or in the aggregate, they could reasonably be
expected to influence the economic decisions of users taken on the basis of these
financial statements.
As part of an audit conducted in accordance with approved standards on auditing
in Malaysia and International Standards on Auditing, we exercise professional judgement and maintain professional scepticism throughout the audit. We also:
Identify and assess the risk of material misstatement of the financial
statements of the Fund, whether due to fraud or error, design and perform
audit procedures responsive to those risks, and obtain audit evidence that is
sufficient and appropriate to provide a basis for our opinion. The risk of not
detecting a material misstatement resulting from fraud is higher than for one
resulting from error, as fraud may involve collusion, forgery, intentional
omissions, misrepresentations, or the override of internal control.
Obtain an understanding of internal control relevant to the audit in order to
design audit procedures that are appropriate in the circumstances, but not for
the purpose of expressing an opinion on the effectiveness of the Fund’s
internal control.
Evaluate the appropriateness of accounting policies used and the
reasonableness of accounting estimates and related disclosures made by
the Manager.
Conclude on the appropriateness of the Manager’s use of the going concern
basis of accounting and, based on the audit evidence obtained, whether a
material uncertainty exists related to events or conditions that may cast
significant doubt on the ability of the Fund to continue as a going concern. If
we conclude that a material uncertainty exists, we are required to draw
attention in our auditors’ report to the related disclosures in the financial
statements of the Fund or, if such disclosures are inadequate, to modify our
opinion. Our conclusions are based on the audit evidence obtained up to the
date of our auditors’ report. However, future events or conditions may cause
the Fund to cease to continue as a going concern.

30
Auditors’ Responsibilities for the Audit of the Financial Statements
(continued)
Evaluate the overall presentation, structure and content of the financial
statements of the Fund, including the disclosures, and whether the financial
statements of the Fund represent the underlying transactions and events in a
manner that gives a true and fair view.
We communicate with the Manager regarding, among other matters, the planned scope and timing of the audit and significant audit findings, including any
significant deficiencies in internal control that we identify during our audit. Other matter
This report is made solely to the unitholders of the Fund, as a body, in accordance with Securities Commission’s Guidelines on Unit Trust Funds in Malaysia and for
no other purpose. We do not assume responsibility to any other person for the content of this report.
KPMG Desa Megat PLT (LLP0010082-LCA & AF 0759)
Chartered Accountants
Adrian Lee Lye Wang Approval Number: 2679/11/2019(J)
Chartered Accountant Petaling Jaya, Selangor
Date: 21 December 2017

31
6.0 Financial Statements (Audited)
6.1 Statement of Financial Position as at 31 October 2017
Note 2017 2016 RM RM
Assets
Quoted securities 4 169,395,939 176,592,975 Amount due from stockbroker 9,096,720 5,892,351 Amount due from Manager 1,144,615 -
Other receivables 136,641 235,954 Current tax assets - 13,367 Cash and cash equivalents 5 6,446,506 3,452,203
Total assets 186,220,421 186,186,850
Liabilities Amount due to stockbroker 11,483,363 - Amount due to Manager 48,786 2,526,123
Other payables 270,796 286,847 Distribution payables 418,490 221,175
Total liabilities 12,221,435 3,034,145
Net asset value 173,998,986 183,152,705
Unitholders’ fund Unitholders’ capital 6 228,263,244 240,659,900 Accumulated losses (54,264,258) (57,507,195)
Net asset value attributable to unitholders
173,998,986
183,152,705
Number of units in circulation 6 835,418,744 896,618,385
Net asset value per unit - Ex distribution (sen) 20.83 20.43
The notes on pages 35 to 58 are an integral part of these financial statements.

32
6.2 Statement of Profit or Loss and Other Comprehensive Income for the
financial year ended 31 October 2017
Note 2017 2016
RM RM Income Gain on sale of quoted shares 9,688,154 4,045,604
Gross dividends from shares quoted in Malaysia 5,123,095 5,323,214 Income from short term investments 146,030 189,588 Hibah from Al-Wadiah account 1,997 2,362
Net unrealised gain/(loss) from financial instruments at fair value through profit or loss
3,242,807
(14,962,726)
Gross income/(loss) 18,202,083 (5,401,958)
Expenses
Manager’s fee 7 2,589,933 2,854,323 Trustee’s fee 8 103,597 114,173 Audit fee 13,000 11,000
Tax agent’s fee 3,000 3,000 Administrative expenses 241,044 252,240
2,950,574 3,234,736
Net income/(loss) before taxation 15,251,509 (8,636,694) Taxation 9 - -
Net income/(loss) after taxation 15,251,509 (8,636,694)
Other comprehensive income for the year - -
Total comprehensive income/(loss) for the year 15,251,509 (8,636,694)
Total comprehensive income/(loss) for the year
consist of:
Realised amount 12,008,702 6,326,032 Unrealised amount 3,242,807 (14,962,726)
15,251,509 (8,636,694)
The notes on pages 35 to 58 are an integral part of these financial statements.

33
6.3 Statement of Changes in Net Asset Value for the financial year ended 31
October 2017
Unitholders’
capital
Accumulated
losses
Total Note RM RM RM
As at 1 November 2015 261,202,257 (42,543,367) 218,658,890
Creation of units via cash 58,179,976 - 58,179,976 Reinvestment of distributions 6,105,959 - 6,105,959
Cancellation of units (84,828,292) - (84,828,292) Distributions 12 - (6,327,134) (6,327,134)
Total attributable to unitholders (20,542,357) (6,327,134) (26,869,491) Total comprehensive loss for the year - (8,636,694) (8,636,694)
As at 31 October 2016/ 1 November 2016
240,659,900 (57,507,195) 183,152,705
Creation of units via cash 25,468,429 - 25,468,429 Reinvestment of distributions 11,590,082 - 11,590,082 Cancellation of units (49,455,167) - (49,455,167)
Distributions 12 - (12,008,572) (12,008,572)
Total attributable to unitholders (12,396,656) (12,008,572) (24,405,228)
Total comprehensive income for the year
- 15,251,509 15,251,509
As at 31 October 2017 228,263,244 (54,264,258) 173,998,986
The notes on pages 35 to 58 are an integral part of these financial statements.

34
6.4 Statement of Cash Flows for the financial year ended 31 October 2017
2017 2016 RM RM
Cash flows from operating activities Proceed from sale of quoted investments 206,200,498 200,337,044 Purchase of quoted investments (177,793,506) (179,647,123)
Dividend received 5,222,956 5,552,334 Income from short term investments 145,483 189,402 Hibah from Al-Wadiah account 1,997 2,362
Management fee paid (2,603,640) (2,883,713) Trustee fee paid (104,145) (115,348) Audit fee paid (11,000) (11,000)
Tax agent fee paid (6,000) (3,000) Payment for administrative expenses (241,840) (257,679)
Cash generated from operations 30,810,803 23,163,279
Tax Refund 13,367 -
Net cash generated operating activities 30,824,170 23,163,279
Cash flows from financing activities Cash receipt for creation of units 24,323,813 58,221,302 Cash payment for cancellation of units (51,932,504) (82,722,849)
Payment of distributions (221,176) (119,119)
Net cash used in financing activities (27,829,867) (24,620,666)
Net increase/(decrease) in cash and cash equivalents 2,994,303 (1,457,387) Cash and cash equivalents at 1 November 3,452,203 4,909,590
Cash and cash equivalents at 31 October 6,446,506 3,452,203
Cash and cash equivalents comprise: Short term placements 5,946,553 2,736,494 Cash at bank 499,953 715,709
6,446,506 3,452,203
The notes on pages 35 to 58 are an integral part of these financial statements.

35
Notes to the financial statements
1. Information on the Fund
BIMB i Dividend (hereinafter referred to as “the Fund”) was constituted pursuant to
the execution of a Deed dated 23 June 2010 between the Manager - BIMB
Investment Management Berhad, the Trustee - HSBC (Malaysia) Trustee Berhad
and the registered unitholders of the Fund. Effective 1 November 2013, the Trustees
has changed from HSBC (Malaysia) Trustee Berhad to CIMB Islamic Trustees
Berhad. A Supplemental Deed was executed on 23 September 2013 to reflect the
changes.
The principal activity of the Fund is to invest in authorised investments as defined in
the Deed, which include investments in stocks and shares of companies quoted on
Bursa Malaysia, and short term placements.
The Manager, BIMB Investment Management Berhad, a company incorporated in
Malaysia, is a subsidiary of Bank Islam Malaysia Berhad.
The financial statements were approved by the Board of Directors of the Manager
on 21 December 2017.
2. Basis of preparation
(a) Statement of compliance
The financial statements of the Fund have been prepared in accordance with
Malaysian Financial Reporting Standards (“MFRS”), International Financial
Reporting Standards (“IFRS”), the Deed and Securities Commission’s
Guidelines on Unit Trust Funds (“Guidelines”) in Malaysia.
The following are accounting standards, amendments and interpretations that
have been issued by the Malaysian Accounting Standards Board (“MASB”) but
have not been adopted by the Fund:
MFRSs, Interpretations and amendments effective for annual periods
beginning on or after 1 January 2017
Amendments to MFRS 12, Disclosure of Interests in Other Entities (Annual
Improvements to MFRS Standards 2014-2016 Cycle)
Amendments to MFRS 107, Statement of Cash Flows – Disclosure
Initiative
Amendments to MFRS 112, Income Taxes – Recognition of Deferred Tax
Assets for Unrealised Losses

36
2. Basis of preparation (continued)
(a) Statement of compliance (continued)
MFRSs, Interpretations and amendments effective for annual periods
beginning on or after 1 January 2018
MFRS 9, Financial Instruments (2014)
MFRS 15, Revenue from Contracts with Customers
Clarifications to MFRS 15, Revenue from Contracts with Customers
IC Interpretation 22, Foreign Currency Transactions and Advance
Consideration
Amendments to MFRS 1, First-time Adoption of Malaysian Financial
Reporting Standards (Annual Improvements to MFRS Standards 2014-
2016 Cycle)
Amendments to MFRS 2, Share-based Payment – Classification and
Measurement of Share-based Payment Transactions
Amendments to MFRS 4, Insurance Contracts – Applying MFRS 9
Financial Instruments with MFRS 4 Insurance Contracts
Amendments to MFRS 128, Investments in Associates and Joint Ventures
(Annual Improvements to MFRS Standards 2014-2016 Cycle)
Amendments to MFRS 140, Investment Property – Transfers of Investment
Property
MFRSs, Interpretations and amendments effective for annual periods
beginning on or after 1 January 2019
MFRS 16, Leases
IC Interpretation 23, Uncertainty over Income Tax Treatments
Amendments to MFRS 128, Long-term Interests in Associates and Joint
Ventures
Amendments to MFRS 9, Prepayment Features with Negative
Compensation
MFRSs, Interpretations and amendments effective for annual periods
beginning on or after 1 January 2021
MFRS 17, Insurance Contracts
MFRSs, Interpretations and amendments effective for a date yet to be
confirmed
Amendments to MFRS 10, Consolidated Financial Statements and MFRS
128, Investments in Associates and Joint Ventures – Sale or Contribution
of Assets between an Investor and its Associate or Joint Venture
The Fund plans to apply the abovementioned accounting standards,
amendments and interpretations, where applicable:

37
2. Basis of preparation (continued)
(a) Statement of compliance (continued)
from the annual period beginning on 1 November 2017 for those
amendments that are effective for annual periods beginning on or after 1
January 2017;
from the annual period beginning on 1 November 2018 for those
accounting standards, amendments and interpretations that are effective
for annual periods beginning on or after 1 January 2018;
from the annual period beginning on 1 November 2019 for the accounting
standard that is effective for annual periods beginning on or after 1
January 2019;
from the annual period beginning on 1 November 2021 for the accounting
standard that is effective for annual periods beginning on or after 1
January 2021.
The initial application of the accounting standards, amendments or
interpretations are not expected to have any material financial impact to the
current year and prior year financial statements of the Fund, except as
mentioned below:
MFRS 15, Revenue from Contracts with Customers
MFRS 15 replaces the guidance in MFRS 111, Construction Contracts, MFRS
118, Revenue, IC Interpretation 13, Customer Loyalty Programmes, IC
Interpretation 15, Agreements for Construction of Real Estate, IC Interpretation
18, Transfers of Assets from Customers and IC Interpretation 131, Revenue -
Barter Transactions Involving Advertising Services.
MFRS 9, Financial Instruments
MFRS 9 replaces the guidance in MFRS 139, Financial Instruments:
Recognition and Measurement on the classification and measurements of
financial assets and financial liabilities, and on hedge accounting.
MFRS 16, Leases
MFRS 16 replaces the guidance in MFRS 117, Leases, IC Interpretation 4,
Determining whether an Arrangement contains a Lease, IC Interpretation 115,
Operating Leases – Incentives and IC Interpretation 127, Evaluating the
Substance of Transactions Involving the Legal Form of a Lease.
The Fund is currently assessing the financial impact that may arise from the
adoption of MFRS 15, MFRS 9 and MFRS 16.

38
2. Basis of preparation (continued)
(b) Basis of measurement
The financial statements are prepared on the historical cost basis except as
disclosed in Note 3(a)(ii).
(c) Functional and presentation currency
These financial statements are presented in Ringgit Malaysia (“RM”), which is
the Fund’s functional currency.
(d) Use of estimates and judgements
The preparation of financial statements in conformity with MFRSs requires
management to make judgements, estimates and assumptions that affect the
application of accounting policies and the reported amounts of assets, liabilities,
income and expenses. Actual results may differ from these estimates.
Estimates and underlying assumptions are reviewed on an ongoing basis.
Revisions to accounting estimates are recognised in the period in which the
estimate is revised and in any future years affected.
There are no significant areas of estimation uncertainty and critical judgements
in applying accounting policies that have significant effect on the amounts
recognised in the financial statements.
3. Significant accounting policies
The accounting policies set out below have been applied consistently to the periods
presented in these financial statements, unless otherwise stated.
(a) Financial instruments
(i) Initial recognition and measurement
A financial instrument is recognised in the statement of financial position
when, and only when, the Fund becomes a party to the contractual
provisions of the instrument.
A financial instrument is recognised initially, at its fair value plus, in the
case of a financial instrument not at fair value through profit or loss,
transaction costs that are directly attributable to the acquisition or issue of
the financial instrument.
(ii) Financial instrument categories and subsequent measurement
The Fund categorises financial instruments as follows:

39
3. Significant accounting policies (continued)
(a) Financial instruments (continued)
(ii) Financial instrument categories and subsequent measurement (continued)
Financial assets
(a) Financial assets at fair value through profit or loss
Fair value through profit or loss category comprises financial assets
that are held for trading, or financial assets that are specifically
designated into this category upon initial recognition.
Financial assets categorised as fair value through profit or loss are
subsequently measured at their fair values with the gain or loss
recognised in the statement of profit or loss.
(b) Financing and receivables
Financing and receivables category are debt instruments that are not
quoted in an active market and these comprises of amount due from
stockbroker, Manager, other receivables, cash and cash equivalents
and short term investments.
Financial assets categorised as financing and receivables are
subsequently measured at amortised cost using the effective profit
method.
All financial assets except for those measured at fair value through profit
or loss, are subject to review for impairment, Note 3(d).
Financial liabilities
Financial liabilities measured at amortised cost comprises of amount due
to stockbroker, Manager, other payables and distribution payable.
(iii) Derecognition
A financial asset or part of it is derecognised when, and only when, the
contractual rights to the cash flows from the financial asset expire or the
financial asset is transferred to another party without retaining control or
substantially all risks and rewards of the asset. On derecognition of a
financial asset, the difference between the carrying amount and the sum of
the consideration received (including any new asset obtained less any
new liability assumed) and any cumulative gain or loss that had been
recognised in equity is recognised in profit or loss.

40
3. Significant accounting policies (continued)
(a) Financial instruments (continued)
(iii) Derecognition (continued)
A financial liability or a part of it is derecognised when, and only when, the
obligation specified in the contract is discharged or cancelled or expires.
On derecognition of a financial liability, the difference between the carrying
amount of the financial liability extinguished or transferred to another party
and the consideration paid, including any non-cash assets transferred or
liabilities assumed, is recognised in profit or loss.
(b) Income recognition
(i) Dividend income
Dividend income is recognised in profit or loss on the date that the Fund’s
right to receive payment is established, which in the case of quoted shares
is the entitlement date.
(ii) Income from short term investments
Income from short term investments is recognised as it accrues, using the
effective profit method in profit or loss.
(iii) Gain on sale of investments
The realised gain on sale of investments is measured as the difference
between the net disposal proceeds and the carrying amount of the
investments. The carrying amount for determining the realised gain on sale
of investments is based on the weighted average cost method and where
applicable adjusted for accretion for discount and amortisation of premium.
(c) Cash and cash equivalents
Cash and cash equivalents consist of cash at bank and short term placements
with licensed financial institutions which have insignificant risk of changes in
fair value with original maturities of less than 30 days, and are used by the
Fund in the management of its short term commitments.
Cash and cash equivalents are categorised and measured as financing and
receivables in accordance with policy Note 3(a)(ii)(b).
41
3. Significant accounting policies (continued)
(d) Impairment
Financial assets
All financial assets (except for financial assets categorised as fair value through
profit or loss) are assessed at each reporting date whether there is any
objective evidence of impairment as a result of one or more events having an
impact on the estimated future cash flows of the asset. Losses expected as a
result of future events, no matter how likely, are not recognised.
An impairment loss in respect of financing and receivables is recognised in
profit or loss and is measured as the difference between the asset’s carrying
amount and the present value of estimated future cash flows discounted at the
asset’s original effective profit rate. The carrying amount of the asset is
reduced through the use of an allowance account.
(e) Income tax
Income tax expense comprises current tax. Current tax is recognised in profit or
loss except to the extent that it relates to items recognised directly in equity or
other comprehensive income.
Current tax is the expected tax payable or receivable on the taxable income for
the year, using tax rates enacted or substantively enacted at the statement of
financial position date, and any adjustment to tax payable in respect of previous
years.
(f) Unitholders’ capital
The Fund issues cancellable units, which are cancelled at the unitholder’s
option and are classified as equity. Cancellable units can be put back to the
Fund at any time for cash equal to a proportionate share of the Fund’s net asset
value. The outstanding units is carried at the redemption amount that is payable
at the financial position date if the unitholder exercises the right to put the unit
back to the Fund.
Units are created and cancelled at the unitholder’s option at prices based on the
Fund’s net asset value per unit at the time of creation or cancellation. The
Fund’s net asset value per unit is calculated by dividing the net asset
attributable to unitholders with the total number of outstanding units. In
accordance with the Securities Commission’s Guidelines on Unit Trust Funds in
Malaysia, investment positions are valued based on the last traded market price
for the purpose of determining the net asset value per unit for creations and
cancellations.

42
3. Significant accounting policies (continued)
(f) Unitholders’ capital (continued)
The units in the Fund are puttable instruments, classified as equity, which entitle
the unitholders to a pro-rata share of the net asset of the Fund. The units are
subordinated and have identical features. There is no contractual obligation to
deliver cash or another financial asset other than the obligation on the Fund to
repurchase the units. The total expected cash flows from the units are based on
the change in the net asset of the Fund.
(g) Distribution
Distribution is at the discretion of the Fund. A distribution to the Fund’s
unitholders is accounted for as a deduction from realised reserves. A proposed
distribution is recognised as a liability or equity in the year in which they are
declared.
(h) Net Asset Value
The Net Asset Value is calculated after deducting the retained profits allocated
for distribution.
(i) Fair value measurement
The Fund adopted MFRS 13, Fair Value Measurement which prescribed that
fair value of an asset or a liability, except for share-based payment and lease
transactions, is determined as the price that would be received to sell an asset
or paid to transfer a liability in an orderly transaction between market
participants at the measurement date. The measurement assumes that the
transaction to sell the asset or transfer the liability takes place either in the
principal market or in the absence of a principal market, in the most
advantageous market.
For non-financial asset, the fair value measurement takes into account a
market participant’s ability to generate economic benefits by using the asset in
its highest and best use or by selling it to another market participant that would
use the asset in its highest and best use.
When measuring the fair value of an asset or a liability, the Fund uses
observable market data as far as possible. Fair value are categorised into
different levels in a fair value hierarchy based on the input used in the valuation
technique as follows:

43
3. Significant accounting policies (continued)
(i) Fair value measurement (continued)
Level 1: quoted prices (unadjusted) in active markets for identical assets
or liabilities that the Fund can access at the measurement date.
Level 2: inputs other than quoted prices included within Level 1 that are
observable for the asset or liability, either directly or indirectly.
Level 3: unobservable inputs for the asset or liability.
The Fund recognises transfers between levels of the fair value hierarchy as of
the date of the event or change in circumstances that caused the transfers.

44
4. Quoted securities
As at 31 October 2017
Company’s Name
Number of shares
held
Cost
RM
Market value
RM
Percentage
of value of funds at
2017
% Main Market
(i) Construction Mudajaya Group Bhd. 1,814,400 4,716,475 2,177,280 1.25
(ii) Consumer products
Bonia Corporation Bhd. 1,702,700 1,874,114 1,123,782 0.64
Power Root Bhd. 300,000 645,105 630,000 0.36 UMW Holdings Bhd. 384,000 4,528,147 2,012,160 1.16
2,386,700 7,047,366 3,765,942 2.16
(iii) Industrial products
Boon Koon Group Bhd. 7,152,000 4,024,650 3,719,040 2.14 Coastal Contracts Bhd. 206,000 621,772 261,620 0.15 Evergreen Fibreboard Bhd. 5,550,000 6,205,225 4,273,500 2.46
Hartalega Holdings Bhd. 500,000 3,414,510 3,810,000 2.19 Hengyuan Refining
Company Bhd. (formerly
known as Shell Refining Company Bhd.) * 60,000 622,991 508,200 0.29
Heveaboard Bhd. 2,900,000 4,567,767 4,843,000 2.78
Jaya Tiasa Holdings Bhd. 2,518,000 4,024,818 2,946,060 1.69 Kossan Rubber Industries
Bhd. 180,000 1,302,997 1,299,600 0.75
Mieco Chipboard Bhd. 256,000 311,218 302,080 0.17 Seacera Group Bhd. 1,815,000 2,498,855 1,615,350 0.93 SKP Resources Bhd. 950,000 1,516,135 1,681,500 0.97
Supermax Corporation Bhd. 980,000 2,469,161 1,734,600 1.00
Ta Ann Holdings Bhd. 1,259,500 5,054,399 4,647,555 2.67
Top Glove Corporation Bhd. 700,000 4,395,247 4,480,000 2.57
Versatile Creative Bhd. 2,100,000 1,770,584 1,963,500 1.13
V.S Industry Bhd. 1,000,000 2,459,393 3,080,000 1.77 WTK Holdings Bhd. 3,064,000 4,504,392 2,481,840 1.43
31,190,500 49,764,114 43,647,445 25.09
(iv) Infrastructure
DiGi.Com Bhd. 2,354,000 14,124,979 11,770,000 6.76 YTL Power International Bhd.* 270,963 543,915 352,252 0.20
2,624,963 14,668,894 12,122,252 6.96

45
4. Quoted securities (continued)
As at 31 October 2017 Company’s Name
Number of shares
held Cost
RM
Market value
RM
Percentage of value
of funds at 2017
%
Main Market (continued)
(v) Plantation Felda Global Ventures
Holdings Bhd 1,400,000 2,957,419 2,674,000 1.54
Hap Seng Plantation Holdings Bhd. 1,569,100 4,405,243 4,189,497 2.41
2,969,100 7,362,662 6,863,497 3.95
(vi) Properties
Glomac Bhd. 2,656,600 3,108,246 1,740,073 1.00 UEM Sunrise Bhd. 2,445,500 6,264,057 2,714,505 1.56 Yong Tai Bhd. 500,000 822,759 805,000 0.46
5,602,100 10,195,062 5,259,578 3.02
(vii) Technology Dagang Nexchange Bhd. 14,890,000 7,339,086 7,221,650 4.15 Elsoft Research Bhd. 800,000 2,143,407 2,072,000 1.19
GHL Systems Bhd. 1,000,000 1,715,706 1,570,000 0.90 Globetronics Technology
Bhd. 405,000 2,585,968 2,668,950 1.53
Inari Amerton Bhd. 560,000 1,347,260 1,573,600 0.91 JHM Consolidation Bhd. 771,000 2,315,069 2,297,580 1.32 Malaysian Pacific Industries
Bhd. 140,000 1,545,501 1,948,800 1.12 Notion Vtec Bhd. 1,630,000 1,851,182 1,165,450 0.67 Pentamaster Corporation
Bhd. 150,000 732,016 717,000 0.41 Perak Transit Bhd. 14,500,000 4,441,560 4,640,000 2.67 Unisem (M) Bhd. 1,000,000 3,901,763 4,000,000 2.30
Vitrox Corporation Bhd. 350,000 1,615,450 1,760,500 1.01 Vivocom Intl Holdings Bhd. 11,790,000 2,982,702 1,650,600 0.95
47,986,000 34,516,670 33,286,130 19.13

46
4. Quoted securities (continued)
As at 31 October 2017 Company’s Name
Number of shares
held Cost
RM
Market value
RM
Percentage of value
of funds at 2017
%
Main Market (continued)
(viii) Trading and services Axiata Group Bhd. 2,194,815 15,208,810 11,830,053 6.80 Brahims Holdings Bhd. 1,919,800 2,759,783 1,036,692 0.60
Dayang Enterprise Holdings Bhd. 1,198,000 3,808,341 1,036,270 0.60
E.A Technique (M) Bhd. 1,394,100 1,768,470 676,139 0.39
Malakoff Corporation Bhd. 2,914,100 5,255,219 3,001,523 1.73 Maxis Bhd. 1,465,500 10,027,594 8,719,725 5.01 Media Chinese
International Limited. 3,810,300 5,110,622 1,638,429 0.94 My E.G. Services Bhd. 2,700,000 5,933,969 5,913,000 3.40 Parkson Holdings Bhd. 1,652,585 4,537,676 1,074,180 0.62
Pos Malaysia Bhd. 150,000 825,563 823,500 0.47 Salutica Bhd. 360,000 534,671 529,200 0.30 Sapura Energy Bhd. 1,422,100 5,476,762 2,275,360 1.31
Star Media Group Bhd. 1,814,100 5,325,310 3,065,829 1.76 Taliworks Corporation Bhd. 400,000 605,828 500,000 0.29 Telekom Malaysia Bhd. 1,560,187 11,094,884 9,907,187 5.69
TH Heavy Engineering Bhd.** 6,412,000 5,200,259 737,380 0.42 UMW Oil & Gas
Corporation Bhd. 1,514,870 4,524,538 484,758 0.28 Xin Hwa Holdings Bhd. 6,051,000 7,049,458 7,261,200 4.17
38,933,457 95,047,757 60,510,425 34.78
(ix) Warrant
Mah Sing Group Bhd. - Warrant B 1,103,896 430,812 110,390 0.06
Perak Transit Bhd.
- Warrant A 8,700,000 - 1,653,000 0.95
9,803,896 430,812 1,763,390 1.01
Total portfolio investment as at 31 October 2017 223,749,812 169,395,939 97.35
* YTL Power International Bhd. and Hengyuan Refining Company Bhd. (formerly
known as Shell Refining Company Bhd.) had been reclassified as Shariah non-
compliant securities by the Shariah Advisory Council (SAC) of the Securities
Commission on 29 November 2013 and 28 November 2014 respectively. Holding
or disposal of the securities will be made in accordance with the SAC guidance.
** The Fund holds investments in companies which are related to the Manager.

47
4. Quoted securities (continued)
As at 31 October 2016 Company’s Name
Number of shares
held Cost
RM
Market value
RM
Percentage of value
of funds at 2016
%
Main Market (i) Construction
Mudajaya Group Bhd. 1,814,400 4,716,475 1,759,968 0.96 WCT Holdings Bhd. 2,073,616 4,273,072 3,525,147 1.92
3,888,016 8,989,547 5,285,115 2.88
(ii) Consumer products
Bonia Corporation Bhd. 1,629,700 1,829,418 1,010,414 0.55 Fraser & Neave Holdings
Bhd. 80,000 2,070,743 1,958,400 1.07
Kawan Food Bhd. 615,100 2,243,073 2,331,229 1.27 UMW Holdings Bhd. 384,000 4,694,459 2,288,640 1.25
2,708,800 10,837,693 7,588,683 4.14
(iii) Finance
BIMB Holdings Bhd.** 1,107,100 4,881,356 4,871,240 2.66
(iv) Industrial products Coastal Contracts Bhd. 206,000 621,772 315,180 0.17 Evergreen Fibreboard Bhd. 5,265,000 5,954,750 5,528,250 3.02
Hartalega Holdings Bhd. 405,000 2,257,853 1,984,500 1.08 Jaya Tiasa Holdings Bhd. 2,434,000 3,906,573 3,383,260 1.85 Kossan Rubber Industries
Bhd. 816,300 5,604,608 5,510,025 3.01 Petronas Chemicals Group
Bhd. 462,000 3,398,899 3,234,000 1.77
Hengyuan Refining Company Bhd. (formerly known as Shell Refining
Company Bhd.) * 60,000 622,991 183,000 0.10 SKP Resources Bhd. 1,072,000 1,540,114 1,447,200 0.79 Supermax Corporation
Bhd. 749,000 1,987,670 1,625,330 0.89 Ta Ann Holdings Bhd. 556,400 2,364,972 1,964,092 1.07 Top Glove Corporation
Bhd. 834,000 5,344,074 4,128,300 2.25 WTK Holdings Bhd. 3,064,000 4,504,393 3,309,120 1.81
15,923,700 38,108,669 32,612,257 17.81

48
4. Quoted securities (continued)
As at 31 October 2016
Company’s Name
Number of shares
held
Cost
RM
Market value
RM
Percentage
of value of funds at
2016
%
Main Market (continued)
(v) Infrastructure
DiGi.Com Bhd. 2,354,000 14,124,979 11,840,620 6.46
YTL Power International Bhd.* 265,650 543,914 406,445 0.22
2,619,650 14,668,893 12,247,065 6.68
(vi) Plantation
Hap Seng Plantation Holdings Bhd. 1,569,100 4,405,243 3,797,222 2.07
(vii) Properties Glomac Bhd. 2,656,600 3,108,246 2,045,582 1.12 Matrix Concepts Holdings
Bhd. 929,833 2,604,718 2,408,267 1.31 S P Setia Bhd. 1,179,700 4,328,472 4,128,950 2.25 Sunway Bhd. 5,510,000 19,363,776 17,191,200 9.39
UEM Sunrise Bhd. 2,445,500 6,264,057 2,738,960 1.50
12,721,633 35,669,269 28,512,959 15.57
(viii) Technology
Globetronics Technology
Bhd. 573,000 3,437,836 2,091,450 1.14 Inari Amerton Bhd. 407,400 1,357,046 1,364,790 0.75 Malaysian Pacific Industries
Bhd. 578,800 4,826,101 4,578,308 2.50 Unisem (M) Bhd. 2,874,100 7,715,642 7,328,955 4.00 Vivocom Intl Holdings Bhd. 11,790,000 2,982,702 1,945,350 1.06
16,223,300 20,319,327 17,308,853 9.45

49
4. Quoted securities (continued)
As at 31 October 2016 Company’s Name
Number of shares held
Cost RM
Market value
RM
Percentage of value
of funds at 2016
%
Main Market (continued)
(ix) Trading and services Axiata Group Bhd. 2,194,815 15,208,810 10,798,490 5.89 Brahims Holdings Bhd. 1,919,800 2,759,783 1,430,251 0.78
Dayang Enterprise Holdings Bhd. 1,198,000 3,808,341 1,030,280 0.56
E.A Technique (M) Bhd. 1,394,100 1,768,470 1,024,664 0.56
Malakoff Corporation Bhd. 2,914,100 5,255,219 4,516,855 2.47 Maxis Bhd. 1,465,500 10,027,594 8,734,380 4.77 Media Chinese
International Limited. 3,810,300 5,110,622 2,610,055 1.43 Parkson Holdings Bhd. 1,652,585 4,537,676 1,247,702 0.68 Petronas Dagangan Bhd. 124,500 3,145,051 2,908,320 1.59
Sapura Kencana Petroleum Bhd. 1,422,100 5,476,762 2,303,802 1.26
Sime Darby Bhd. 1,285,186 12,080,414 10,525,673 5.75
Star Media Group Bhd. 1,814,100 5,325,310 4,571,532 2.50 Telekom Malaysia Bhd. 1,560,187 11,094,884 10,203,623 5.57 TH Heavy Engineering
Bhd.** 6,412,000 5,200,259 929,740 0.51 UMW Oil & Gas
Corporation Bhd. 1,291,100 4,853,668 1,097,435 0.60
30,458,373 95,652,863 63,932,802 34.92
(x) Warrant LBS Bina Group Bhd. - Warrant A 300,000 225,983 216,000 0.12
Mah Sing Group Bhd. - Warrant B 1,103,896 430,812 220,779 0.12
1,403,896 656,795 436,779 0.24
Total portfolio investment as at 31 October 2016 234,189,655 176,592,975 96.42
* YTL Power International Bhd. and Hengyuan Refining Company Bhd. (formerly
known as Shell Refining Company Bhd.) had been reclassified as Shariah non-
compliant securities by the Shariah Advisory Council (SAC) of the Securities
Commission on 29 November 2013 and 28 November 2014 respectively.
Holding or disposal of the securities will be made in accordance with the SAC
guidance.
** The Fund holds investments in companies which are related to the Manager.

50
5. Cash and cash equivalents
2017 2016 RM RM Short term investments with maturity less than 30 days
Commodity Murabahah 2,614,461 2,736,494
Wafiyah Investment Account* 3,332,092 -
5,946,553 2,736,494 Cash at bank 499,953 715,709
6,446,506 3,452,203
* Wafiyah Investment Account is placed with the holding company of the
Manager, Bank Islam Malaysia Berhad.
6. Unitholders’ capital
No of units RM
1 November 2015 988,832,925 261,202,257 Creation of units 298,254,665 64,285,935 Cancellation of units (390,469,205) (84,828,292)
As at 31 October 2016/ 1 November 2016 896,618,385 240,659,900 Creation of units 175,840,518 37,058,511 Cancellation of units (237,040,159) (49,455,167)
As at 31 October 2017 835,418,744 228,263,244
7. Manager’s fee
The manager’s fee payable to the Manager is based on 1.50% (2016: 1.50%) per
annum of the net asset value of the Fund calculated on a daily basis.
8. Trustee’s fee
The trustee’s fee payable to the trustee is based on 0.06% (2016: 0.06%) per annum
of the net asset value of the Fund calculated on a daily basis.
9. Taxation
2017 2016 RM RM Taxation
- Current year - -
Reconciliation of effective tax expense
Net income/(loss) before taxation 15,251,509 (8,636,694)
Income tax using Malaysian tax rate @ 24% 3,660,362 (2,072,807) Non-assessable income (4,368,500) (2,294,584) Non-deductible expenses 25,583 3,619,176
Restrictions on the tax deductible expenses for unit trust funds
682,555
748,215
- -

51
10. Units held by related party
The number and value of units held legally or beneficially by a related party of the
Manager is as follows:
2017 2016
Units RM Units RM BIMB Investment Management
Berhad 400
83
400
82
11. Transactions with related parties
Other than as disclosed in Note 4, 5 and 10 of the financial statements, other
transaction with related parties are as follows:
Transactions as at Balance as at 2017 2016 2017 2016
RM RM RM RM The Manager BIMB Investment Management
Berhad - Amount due from Manager - - 1,144,615 - - Amount due to Manager - - (48,786) (2,526,123)
- Management fee 2,589,933 2,854,323 (226,252) (239,183)
Holding company of the Manager Bank Islam Malaysia Berhad
- Income from short term
placement (114,071) (55,799) 1,158 -
Related company of the Manager BIMB Securities Sdn. Bhd.
- Sales 35,244,153 11,230,563 5,131,466 -
- Purchase 13,648,809 15,400,080 - - - Brokerage fee 154,159 79,931 14,209 -
The Trustee CIMB Islamic Trustee Berhad
- Trustee fee 103,597 114,173 (9,050) (9,567)

52
12. Distribution
2017 2016 RM RM
Distribution to unitholders is from the following sources:
Gain on sale of quoted shares 9,688,154 4,045,604
Gross dividends from shares quoted in Malaysia 5,123,095 5,323,214 Income from short term investments 146,030 189,588 Previous years undistributed income (129) 1,102
Hibah from Al-Wadiah account 1,997 2,362
14,959,147 9,561,870 Less:
Expenses (2,950,575) (3,234,736) Tax expense - -
Net distribution 12,008,572 6,327,134
The Manager has declared a net distribution of 1.54 sen (2016: 0.73 sen) per unit
based on units in circulation as at date of distribution amounting to RM12,008,572
(2016: RM6,327,134) in respect of the current financial year.
13. Transactions with related and other stockbroking companies
Value of
trade
Percentage
of total trade
%
Brokerage fee
Percentage of total
brokerage fee % 2017 RM RM
RHB Investment Bank Bhd. 70,925,743 17.79 193,584 16.40 TA Securities Holdings Bhd. 56,916,324 14.27 162,230 13.74
BIMB Securities Sdn. Bhd.* 52,168,699 13.08 154,159 13.06 Maybank Investment Bank Bhd. 40,896,383 10.26 120,822 10.24
CIMB Investment Bank Bhd. 27,141,741 6.81 77,545 6.57 Public Investment Bank Bhd. 26,399,130 6.62 82,878 7.02 Macquarie Capital Securities
(Malaysia) Sdn. Bhd. 26,163,441 6.56 82,881 7.02 MIDF Amanah Investment
Bank Bhd. 25,840,478 6.48 77,021 6.53
Hong Leong Investment Bank Bhd. 24,287,401 6.09 75,806 6.42
KAF Seagroatt & Campbell
Securities Sdn. Bhd. 16,789,881 4.21 53,625 4.54 Others 31,237,536 7.83 99,797 8.46
398,766,757 100.00 1,180,348 100.00
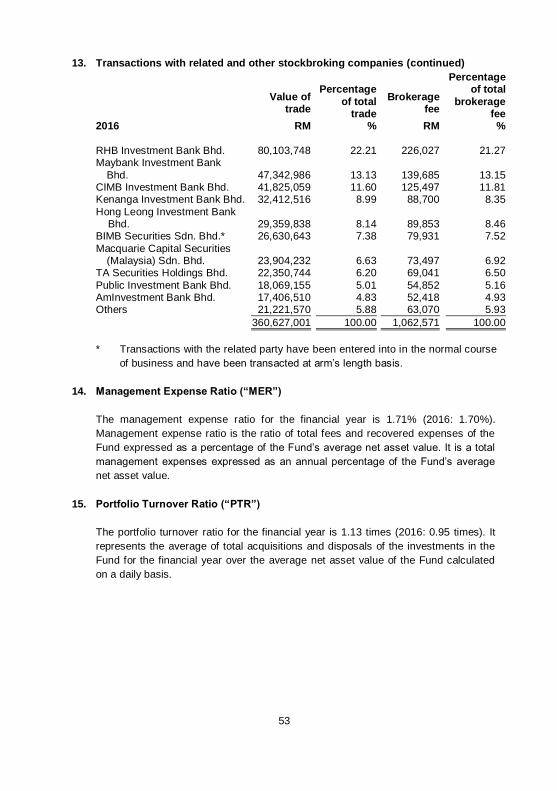
53
13. Transactions with related and other stockbroking companies (continued)
Value of
trade
Percentage
of total trade
%
Brokerage
fee
Percentage of total
brokerage fee % 2016 RM RM
RHB Investment Bank Bhd. 80,103,748 22.21 226,027 21.27 Maybank Investment Bank
Bhd. 47,342,986 13.13 139,685 13.15 CIMB Investment Bank Bhd. 41,825,059 11.60 125,497 11.81 Kenanga Investment Bank Bhd. 32,412,516 8.99 88,700 8.35
Hong Leong Investment Bank Bhd. 29,359,838 8.14 89,853 8.46
BIMB Securities Sdn. Bhd.* 26,630,643 7.38 79,931 7.52
Macquarie Capital Securities (Malaysia) Sdn. Bhd. 23,904,232 6.63 73,497 6.92 TA Securities Holdings Bhd. 22,350,744 6.20 69,041 6.50
Public Investment Bank Bhd. 18,069,155 5.01 54,852 5.16 AmInvestment Bank Bhd. 17,406,510 4.83 52,418 4.93 Others 21,221,570 5.88 63,070 5.93
360,627,001 100.00 1,062,571 100.00
* Transactions with the related party have been entered into in the normal course
of business and have been transacted at arm’s length basis.
14. Management Expense Ratio (“MER”)
The management expense ratio for the financial year is 1.71% (2016: 1.70%).
Management expense ratio is the ratio of total fees and recovered expenses of the
Fund expressed as a percentage of the Fund’s average net asset value. It is a total
management expenses expressed as an annual percentage of the Fund’s average
net asset value.
15. Portfolio Turnover Ratio (“PTR”)
The portfolio turnover ratio for the financial year is 1.13 times (2016: 0.95 times). It
represents the average of total acquisitions and disposals of the investments in the
Fund for the financial year over the average net asset value of the Fund calculated
on a daily basis.

54
16. Financial instruments
16.1 Categories of financial instruments
The table below provides an analysis of financial instruments categorised as
follows:
(a) Financing and receivables (“F&R”);
(b) Fair value through profit or loss (“FVTPL”);
(c) Financial liabilities measured at amortised cost (“FL”).
Carrying amount
F&R/ (FL)
FVTPL
RM RM RM
2017 Financial assets Quoted securities 169,395,939 - 169,395,939
Other receivables 10,377,976 10,377,976 - Cash and cash equivalents 6,446,506 6,446,506 -
186,220,421 16,824,482 169,395,939
Financial liabilities
Other payables (11,802,945) (11,802,945) - Distribution payable (418,490) (418,490) -
(12,221,435) (12,221,435) -
2016
Carrying
amount RM
F&R/
(FL) RM
FVTPL RM
Financial assets Quoted securities 176,592,975 - 176,592,975 Other receivables 6,128,305 6,128,305 -
Cash and cash equivalents 3,452,203 3,452,203 -
186,173,483 9,580,508 176,592,975
Financial liabilities Other payables (2,812,970) (2,812,970) -
Distribution payable (221,175) (221,175) -
(3,034,145) (3,034,145) -
16.2 Net gains and losses arising from financial instruments
2017 2016 RM RM
Net gains/(losses) on: Fair value through profit or loss: - Designated upon initial recognition Realised profit 14,811,249 9,368,818
Unrealised profit/(loss) 3,242,807 (14,962,726) Financing and receivables 148,027 191,950
18,202,083 (5,401,958)

55
16. Financial instruments (continued)
16.3 Financial risk management
The Fund has exposure to the following risks from its use of financial
instruments:
Credit risk
Liquidity risk
Market risk
Investment risk
16.4 Credit risk
Credit risk is the risk of a financial loss to the Fund if counterparty to a
financial instrument fails to meet its contractual obligations. The Fund’s
exposure to credit risk arises principally from its investment securities,
receivables and cash and cash equivalents.
Risk management objectives, policies and processes for managing the risk
The Manager manages the credit risk by setting counterparty limits and
undertaking credit evaluation to minimise the risk. The exposure to credit risk
is monitored on an ongoing basis.
Exposure to credit risk
The Fund’s maximum credit risk exposure at the reporting date is
represented by the respective carrying amounts of the relevant financial
assets in the statement of financial position.
No financial assets carried at amortised cost were past due or impaired as at
date of statement of financial position.
16.5 Liquidity risk
Liquidity risk is the risk that the Fund will not be able to meet its financial
obligations as they fall due. The Fund’s exposure to liquidity risk arises
principally from its various payables which are due within one year.
The Fund maintains sufficient level of liquid assets, after consultation with the
Trustee, to meet anticipated payments and cancellation of units by
unitholders. Liquid assets comprise cash and other instruments, which are
capable of being converted into cash within 7 days.

56
16. Financial instruments (continued)
16.6 Market risk
Market risk is the risk that changes in market prices, such as profit rates and
market prices will affect the Fund’s financial position or cash flows.
Profit rate risk
The profit rate profile of the Fund’s significant profit-bearing financial
instruments, based on carrying amounts as at the end of reporting period
was:
Effective profit rate
per annum 2017
Effective profit rate
per annum 2016
% RM % RM Fixed rate instruments Cash and cash equivalents
- Short term investments with maturity less than 30 days
3.00-3.20
5,946,553
2.97
2,736,494
Fair value sensitivity analysis for fixed rate instruments
The Fund accounts for the deposits with licensed financial institutions at
amortised cost. Therefore a change in profit rates at the end of the reporting
year would not affect profit or loss. The deposits with licensed financial
institutions will mature within 1 month from the date of financial position.
Market price risk
Equity price risk arises from the Fund’s investments in quoted securities.
Risk management objectives, policies and processes for managing the risk
The Fund is restricted to invest in securities issued by any issuer of not more
than 10% of its net asset value. Under such restriction, the exposure risk to
the securities of any issuer is mitigated.
Equity price risk sensitivity analysis
This analysis assumes that all other variables remain constant and the
Fund’s equity investments are positively correlated to each other.
A 10% (2016: 10%) strengthening in the equity prices at the end of the
reporting year would have increased the net asset value and unitholders’
fund by RM16,939,594 (2016: RM17,659,298). A 10% weakening in equity
prices would have had equal but opposite effect on the net asset value and
unitholders’ fund respectively.

57
16. Financial instruments (continued)
16.7 Investment risk
Investments are bound by Deed and prospectus that govern the maximum
securities holdings and maximum liquid assets holdings.
Investment risks for equity funds consist primarily of market risk, specific
stock risk and liquidity risk. The mechanism employed to control investment
risk for equity funds is by placing acceptable stock limits.
Risk management objectives, policies and processes for managing the risk
The Manager has written policies and guidelines on risk management, which
set out the overall investment risks strategies and general risk management
philosophies. These processes monitor, measure and control risks
associated with the business. Matters relating to investment risks in respect
of Funds portfolio are discussed during the Investment Committee meetings
of the Manager held at least 6 (2016: 5) times a year.
16.8 Fair value of financial instruments
The carrying amounts of cash and cash equivalents, short term receivables and
payables approximate fair values due to the relatively short term nature of these
financial instruments.
The table below analyses financial instruments carried at fair value and carrying
amounts shown in the statement of financial position.
Fair value of financial instruments carried at
fair value
Carrying
Level 1 Level 2 Level 3 Total amount
RM RM RM RM RM
2017
Financial assets
Quoted securities 169,395,939 - - 169,395,939 169,395,939
2016
Financial assets
Quoted securities 176,592,975 - - 176,592,975 176,592,975
Policy on transfer between levels
The fair value of an asset to be transferred between levels is determined as of
the date of the event or change in circumstances that caused the transfer.

58
16. Financial instruments (continued)
16.8 Fair value of financial instruments (continued)
Level 1 fair value
Level 1 fair value is derived from quoted price (unadjusted) in active markets for
identical financial assets or liabilities that the entity can access at the
measurement date.
Quoted equities
Quoted equities in Malaysia are valued at a closing market price quoted on the
Bursa Malaysia at the date of the statement of financial position, in accordance
with the Deed. Unrealised gain or loss is taken to statement of profit or loss and
other comprehensive income.
Level 2 fair value
Level 2 fair value is estimated using inputs other than quoted prices included
within Level 1 that are observable for the financial assets or liabilities, either
directly or indirectly.
Transfers between Level 1 and Level 2 fair values
There has been no transfer between Level 1 and 2 fair values during the
financial year (2016: no transfer in either direction).
Level 3 fair value
Level 3 fair value is estimated using unobservable inputs for the financial assets
and liabilities.
17. Capital management
The Fund’s capital is represented by the unitholders’ fund in the statement of
financial position. The Manager of the Fund monitors the adequacy of capital on an
ongoing basis. There is no external capital requirement imposed on the Fund.

59
7.0 Corporate Directory
Manager BIMB Investment Management Berhad
Registered Office
Level 32, Menara Bank Islam, No. 22, Jalan Perak
50450, Kuala Lumpur
Business Office
Level 19, Menara Bank Islam, No. 22, Jalan Perak
50450, Kuala Lumpur
Board of
Directors
Nik Mohd Hasyudeen Yusoff (Chairman – Non-Executive
Independent Director – Appointed w.e.f. 13 September 2017)
Khairul Kamarudin (Chairman – Non-Executive Non Independent
Director – Resigned w.e.f. 13 September 2017)
Dato’ Ghazali Awang (Non-Executive Independent Director)
Datuk Noripah Kamso (Non-Executive Independent Director)
Dr. Mohd Hatta Dagap (Non-Executive Independent Director)
Malkiat Singh @ Malkit Singh Maan (Non-Executive Non
Independent Director)
Najmuddin Mohd Lutfi (Chief Executive Officer)
Shariah
Committee
Ustaz Dr. Ahmad Shahbari @ Sobri Salamon
Ustaz Dr. Yusof Ramli
Ustazah Dr. Asmak Ab. Rahman
Investment
Committee
Khairul Muzamel Perera Abdullah (Chairman – Non Independent
Member)
Datuk Noripah Kamso (Independent Member)
Dato’ Darawati Hussain (Independent Member)
Audit Committee Dato’ Ghazali Awang (Chairman – Independent Member)
Dr. Mohd Hatta Dagap (Independent Member)
Malkiat Singh @ Malkit Singh Maan (Non Independent Member)
Company
Secretary
Aidil Haznul Zulkifli (MACS 01638)
Level 32, Menara Bank Islam, No.22 Jalan Perak,
50450 Kuala Lumpur
Norhidayati Mohamat Salim (MIA 27364)
Level 32, Menara Bank Islam, No. 22, Jalan Perak 50450, Kuala
Lumpur

60
Key
Management
Najmuddin Mohd Lutfi (Chief Executive Officer)
Badrol Ahmad Fathan (Head of Investment)
Mohd Hamidullah Che Hassan (Manager, Compliance)
Noor Rose Mona Aziz (Head of Finance and Operations)
Principal Banker CIMB Islamic Bank Berhad
P. Ramlee Branch, Lot 1-01
Menara Hap Seng
Jalan P.Ramlee
Kuala Lumpur
Trustee CIMB Islamic Trustee Berhad (167913-M)
Level 21, Menara CIMB,
Jalan Stesen Sentral 2,
Kuala Lumpur Sentral,
50470 Kuala Lumpur.
Auditors KPMG Desa Megat PLT (LLP0010082-LCA & AF 0759)
Level 10, KPMG Tower
8, First Avenue, Bandar Utama
47800 Petaling Jaya, Selangor
Federation of
Investment
Managers
Malaysia (FIMM)
19-06-1, 6th Floor, Wisma Tune
No.19, Lorong Dungun
Damansara Heights
50490 Kuala Lumpur
Distributors Bank Islam Malaysia Berhad Branches
IFast Capital Sdn Bhd
Phillip Mutual Berhad
Johor Bharu Agency Office
Bank Simpanan Nasional
Registered Unit Trust Consultant with BIMB Investment
Management Berhad
Toll Free Number: 1-800-88-1196