ANNUAL REPORT FOR THE FINANCIAL YEAR ENDED 31 …...manager: bimb investment management berhad...
65
MANAGER: BIMB INVESTMENT MANAGEMENT BERHAD (276246-X) BIMB i FLEXI FUND ANNUAL REPORT FOR THE FINANCIAL YEAR ENDED 31 MARCH 2017 LAPORAN TAHUNAN BAGI TAHUN KEWANGAN BERAKHIR 31 MAC 2017
Transcript of ANNUAL REPORT FOR THE FINANCIAL YEAR ENDED 31 …...manager: bimb investment management berhad...

MANAGER:BIMB INVESTMENT MANAGEMENT BERHAD (276246-X)
BIMB i FLEXI FUND
ANNUAL REPORT FOR THE FINANCIAL YEAR ENDED 31 MARCH 2017
LAPORAN TAHUNAN BAGI TAHUNKEWANGAN BERAKHIR 31 MAC 2017

2
TABLE OF CONTENT
No. Particulars Page
1.0 Manager’s Report 3
1.1 Fund Name/ Fund Type/ Fund Category/ Fund Investment Objective/
Fund Performance Benchmark/ Fund Distribution Policy 3
1.2 Performance for the Financial Year Ended 31 March 2017 4
1.3 Economic and Market Review 7
1.4 Market Outlook and Strategy 12
1.5 Asset Allocation as at 31 March 2017 13
1.6 Other Performance Data for the Financial Year Ended 31 March 2017 14
1.7 Unit Holdings as at 31 March 2017 15
1.8 Policy on Rebate and Soft Commission 15
2.0 Trustee’s Report 31
3.0 Shariah Committee’s Report 32
4.0 Directors’ Declaration Report 33
5.0 Independent Auditors’ Report 34
6.0 Financial Statements (Audited) 38
7.0 Corporate Directory 63

3
1.0 Manager’s Report
Dear Unit Holders,
We are pleased to present the Manager’s report of BIMB i Flexi Fund for the financial year
ended 31 March 2017.
1.1 Fund Name/ Fund Type/ Fund Category/ Fund Investment Objective/ Fund
Performance Benchmark/ Fund Distribution Policy
Fund Name BIMB i Flexi Fund
Fund Type Growth
Fund Category Shariah-compliant mixed asset
Fund Investment
Objective
The Fund seeks to achieve long term1 capital growth by
investing in a diversified portfolio of Shariah-compliant
securities.
Note:
Any material change to the investment objective of the
Fund would require Unit Holders’ approval.
Fund Performance Benchmark
The selected performance benchmark for this Fund is based on 50:50 ratio of the FBM Emas Shariah Index and
12-month Term Deposit-i Tawarruq (TDT-i) rate of Bank Islam Malaysia Berhad.
Note: The benchmark reflects the investment and asset allocation strategies of the Fund, where the Fund is allowed to invest
its asset in Shariah-compliant equities as well as Sukuk and Islamic money market instruments, depending on the outlook of the market. The risk profile of the Fund is not the
same as the risk profile of the performance benchmark.
Fund Distribution
Policy The distribution of income is incidental.
1 Long term in this context refers to a period of more than five (5) years.

4
1.2 Performance for the financial year ended 31 March 2017
1.2.1 Performance review
For the financial year under review, BIMB i Flexi Fund (“the Fund”) registered a return of
7.58% as compared to its benchmark’s return of 3.00%. The Fund had met its objective of
achieving capital growth following the Fund’s investment strategy to overweigh export
oriented sector.
The selected performance benchmark for the Fund is 50:50 ratio of the FBM Emas Shariah
Index and 12-month Bank Islam Term Deposit-i Tawarruq (TDT-i) rates.
Our strategy has consistently been to remain focus on well-established companies that have
better prospects for earnings growth and capital appreciation. Moving forward, more
attention will be given to sector allocation and rotational play to capitalize on Net Asset
Value (NAV) appreciation.
As at 31 March 2017, the Fund has 88.97% exposure to equities and 11.03% to cash and
money market instruments. The total NAV of the Fund is RM6.1 million whereas the NAV
per unit of the Fund is RM0.2256.
For the financial year under review, there were no significant changes to the state of affairs
of the Fund and no circumstances that materially affect the interest of unit holders that have
taken place up to the date of this Manager’s Report.

5
1.2.2 Total return and average total return for the financial year ended 31 March 2017
BIMB i Flexi Fund Benchmark
Total
Return
(%)
Average
Total Return
(%)
Total Return
(%)
Average
Total Return
(%)
1-Year Period 7.58 7.58 3.00 3.00
2-Year Period -9.03 -4.52 2.42 1.21
3-Year Period -9.76 -3.25 4.07 1.36
1.2.3 Total return for the financial years
Financial Year
Total Return
BIMB i Flexi Fund
(%)
Benchmark
(%)
31 March 2017 7.58 3.00
31 March 2016 -15.44 -0.56
31 March 2015 -0.80 1.61

6
Figure 1: Movement of the Fund versus the Benchmark
Note:
Data Source : BIMB Investment Management Berhad
Data verified by : Novagni Analytics & Advisory Sdn. Bhd. (formerly known
as Perkasa Normandy Advisers Sdn. Bhd.)
Benchmark : 50: 50 FBM Emas Shariah Index &
12-month Term Deposit-i Tawarruq (TDT-i) rate of Bank
Islam Malaysia Berhad
Notes:
1. Total Return of the Fund has been verified by Novagni Analytics & Advisory Sdn. Bhd.
(formerly known as Perkasa Normandy Advisers Sdn. Bhd.) (363145-W)
2. Average Total Return is derived by this formula:
Total Return
Number of Years under Review
Past performance is not necessarily indicative of future performance and unit prices and
investment returns may go down, as well as up.

7
1.3 Economic and Market Review
Economy
a) Global
US Gross Domestic Product (GDP) grew at 2.1% in the last quarter of 2016, bringing full
year GDP growth to 1.6% versus 2.6% in 2015.
US headline inflation rose to 2.5% in March 2017 from 1.1% in April 2016 contributed by
the improving US economic conditions on better job market.
US unemployment rate in March 2017 fell to 4.5% from 5.0% in April 2016 as the US
economy continues the pace of robust hiring.
Euro zone’s GDP grew by 0.5% in the fourth quarter of 2016, bringing full year GDP
growth to 1.7% and was slightly lower than 2% GDP growth achieved in 2015.
Euro zone’s inflation rate stood at 1.5% in March 2017 from -0.2% in April 2016 as a
result of sharp rebound in oil and energy price during the first quarter of 2017 to above
USD50/bbl.
Euro zone’s unemployment rate fell to 9.5% in March 2017 from 10.2% in April 2016,
driven by higher employment in Spain and Portugal. Germany retains the lowest jobless
rate of 3.9% within the region.
China’s GDP growth was 6.9% in the first quarter of 2017, supported by government
infrastructure spending and a rebound in housing market activities. The GDP Growth for
China seems to have bottomed out from its low of 6.7% achieved in Q1 of 2016.
(Source: Bloomberg, Eurostats, RHB Investment Bank and Maybank Investment Bank)
b) Local
Malaysia’s real GDP growth was 4.5% in the fourth quarter of 2016, underpinned by the
expansion of manufacturing and services sector. This has brought full year GDP growth
of 4.2% for 2016.
Malaysia’s annual inflation rate rose to 5.1% in March 2017 from 2.1% in April 2016 as
hikes in RON95 fuel prices in January and February 2017 had pushed transport and
related cost higher for the local economy.

8
Bank Negara Malaysia decided to maintain the Overnight Policy Rate (OPR) at 3.00%
at the Monetary Policy Committee (MPC) meeting on 2 March 2017. The monetary
policy will remain accommodative and supportive to the domestic economy as
heightened risks in the global economic and financial environment persist.
Bank Negara Malaysia's (BNM) international reserves stood at USD94.9 billion as at 31
March 2017 from USD97.2 billion as at 15 April 2016. The reserves position as at 31
March 2017 were sufficient to finance 8.3 months of retained imports and is 1.1 times
the short-term external debt.
(Source: Bloomberg, Department of Statistics Malaysia and Bank Negara Malaysia)
Market Review
Equity
FTSE Bursa Malaysia Emas Shariah Index (“FBM Shariah”) commenced the period under
review at 12,482.39 points on 1 April 2016 and rose to the highest level of 12,880.42 points
on 29 March 2017 and hit a low of 11,775.69 points on 16 May 2016. It closed the year
under review at 12,811.34 points on 31 March 2017. For the year under review, the FBM
Shariah was up 328.95 points or 2.64%. Among the key factors that contributed to the
movement of the index are highlighted below:
In May 2016, MSCI announced the reduction of Malaysia’s index weightage within its
index, prompting a sell down in the domestic market and further weakening the Ringgit
to USD/MYR 4.15.
In June 2016, the global equities and currency market were hit by a shocking Brexit vote
result that sent shockwaves across European Union as United Kingdom citizens opted
to leave the European Union due to frustration over the union’s multiple policies that are
perceived to be not in favor of the UK economy.
Bank Negara Malaysia had cut the Overnight Policy Rate (OPR) unexpectedly by 25bps
to 3.00% in July 2016 as a preventive measure to cushion the negative impact from the
Brexit referendum outcome on the back of a slowing domestic economy.
Statement from Janet Yellen after meeting at Jackson Hole in late August 2016 points to
a strengthening case for possible rate hike ahead, while global oil prices and Ringgit
remain weak as oversupply concerns continues to weigh on commodity prices across
the globe.
The U.S. Federal Reserve declined to raise interest rates in September 2016 ahead of
the US presidential election in November 2016 and reckons that the US economy still
have room to improve before it run the risk of overheating.

9
Malaysia’s Prime Minister unveiled the country’s budget for 2017 on 21 October 2016
with the aim of capping the federal budget deficit at 3.0% versus 3.1% for 2016 with a
GDP growth target of between 4% to 5% for 2017. An average crude oil price of USD45
per barrel is being used for Federal government’s 2017 budget.
In November 2016, Donald Trump’s victory in the U.S. presidential election caught the
general markets off-guard as investors flock to safe heaven assets like gold, bond and
the Japanese yen, perceiving Trump’s administration would bring uncertainty to the
markets. The Asian markets reacted with a sharp selldown, however subsequently,
global investors rebalanced their portfolio to take advantage of the perceived stronger
US growth and higher US bond yields.
In December 2016, the Federal Reserve raise the widely anticipated interest rate hike
by 0.25% to 0.75% in light of the healthy expansion pace of the US economy while
counteracting the President elect’s goal to further stimulate a recovering economy.
During the month, OPEC members agreed to cut oil production to reduce the global oil
supply glut which caused oil prices to rise to a 16-month high above $55 on 5 December
2016.
In January 2017, Mr. Donald Trump’s inauguration as the new president for United
States of America had brought more policy uncertainty to the world from the new
president with regards to US-Mexico cross border trade and potential new restriction on
immigration and travelling into US. Nonetheless, the Dow Jones Index and global
financial market remains steady during the month.
The global equities market welcomed another surprise 25bps rate hike from US Federal
Reserve on the back of stronger than expected US economic data and also more
hawkish interest rate stance by the new administration, bringing the Fed fund rates to
1.00% post rate hike on 15th March 2017.
(Source: Bloomberg and Bank Negara Malaysia)

10
Bond Market and Money Market
a) Global
US Treasury yields increased across the yield curve during the year under review with
10-year bond yields increased by 50 basis points to 2.28% and the 20-year bond yields
also increased by 45 basis points to 2.65%.
Figure 2: US Treasury Yields
Source: US Treasury Department, 31 March 2017
b) Local
The Malaysian Government Securities (MGS) and Government Investment Issue (GII)
dominated the local bond market activities with traded volume of RM1,027.13 billion for
the year under review. The government bond yields increased due to the Donald
Trump’s victory in the U.S. presidential election caught the general markets off-guard
as investors flock to safe heaven assets.

11
Table 1: Sukuk/ Islamic Bond Yields
Tenure/Date 31 March 2017
(%)
31 March 2016
(%)
Change
* (bps)
3-Year Bonds
GII 3.75 3.20 55.0
AAA Corporate 4.19 4.09 10.0
5-Year Bonds
GII 3.97 3.66 31.0
AAA Corporate 4.32 4.24 8.0
7-Year Bonds
GII 4.10 3.90 20.0
AAA Corporate 4.46 4.40 6.0
10-Year Bonds
GII 4.13 4.03 10.0
AAA Corporate 4.66 4.56 10.0
Source: Bond Pricing Agency Malaysia (BPAM), 31 March 2017
Figure 3: Overnight Policy Rate (OPR)
Source: Bank Negara Malaysia (BNM), 31 March 2017

12
1.4 Market Outlook and Strategy
a) Equity
The equity market outlook for 2017 is expected to be another volatile year. External
factors may likely influence the domestic market sentiment, which includes OPEC
and Non-OPEC commitment to stabilize the oil glut, President Trump’s stance on
trade policy and economic growth, ramifications of US interest rate hikes and
currency movement, political sentiment in the Euro zone, China’s economic
development, monetary policies employed by central banks and possible global
recession fears that may cause volatility in the domestic market. With potential
interest on selective sector to support the domestic market, the local bourse should
be able to withstand external shocks given the ample domestic liquidity and buying
interest of foreign and local institutional investors.
Global economy outlook continues to remain sluggish as growth across economies
has been uneven. While the US economic recovery path is on track, the Euro zone,
Japan and China’s growth remain weak. In Asia, growth is being continuously
sustained by the expansion in domestic demand and exports.
For Malaysia, the resilience of domestic consumption remains the support for growth.
With higher spending on infrastructure projects underway, higher public sector
wages, improve outlook for crude palm oil (CPO) price and a rebound in government
consumption and expenditure will help to improve corporate earnings and consumer
spending for the year. Going forward, domestic demand will still remain the key driver
of growth as the Malaysian economy is still projected to grow between 4.2% to 4.7%.
The strategy is to invest in companies with good earnings visibility, strong balance
sheet, reasonable valuation and good growth prospects. We have a long term
approach to investment with the objective to outperform the benchmark.
b) Sukuk Market & Money Market
The Sukuk market is expected to see positive flow, but gains were pretty mild amid
the tight levels. Despite the tighter levels, it is expected to see two-way flows going
forward, while profit-taking pressure should be well-absorbed, underpinned by
prevailing investor demand.
Looking forward, changes in OPR will depend on economic data on growth and
inflation. The money market deposit rates are expected to remain stable at current
levels over the medium-term.

13
Our Sukuk strategy is to invest in good quality Sukuk with minimum AA3/AA-rating by
Rating Agency Malaysia (RAM)/Malaysian Rating Corporation Berhad (MARC) and
attractive profit rate. Our money market strategy is to invest in money market
investments to maximize return while providing liquidity and regular income for
investors.
1.5 Asset Allocation as at 31 March
BIMB i Flexi Fund 2017
(%) 2016
(%)
Investment in Quoted Securities
Construction - 2.69
Consumer Products 2.17 4.74
Industrial Products 47.58 27.97
Infrastructure 5.38 8.52
Plantation 2.37 3.20
Technology 30.47 19.24
Trading and Services 1.00 16.73
88.97 83.09
CASH AND SHORT TERM INVESTMENTS: 11.03 16.91
100.00 100.00

14
1.6 Other Performance Data for the Financial Year Ended 31 March
BIMB i Flexi Fund 2017 2016
Unit Prices (MYR)
Highest NAV per unit for the year 0.2275 0.2547
Lowest NAV per unit for the year 0.1923 0.2052
Net Asset Value (NAV) and Units in Circulation (UIC) as at the End of the Year
Total NAV (MYR) 6,165,178 7,648,688
Units in Circulation (UIC) 27,328,980 36,478,527
NAV per unit (MYR) 0.2256 0.2097
Return of Fund (%)
Capital Growth (%)(b)
7.58 -15.44
Income Return (%)(c)
- -
Return of Fund (%)(a)
7.58 -15.44
Management Expense Ratio (MER) (%)(d)
2.05 1.99
Portfolio Turnover Ratio (PTR) (times)(e)
3.33 2.75
Note:
a) Return of the
Fund
= NAV per unit (end of year) - 1
NAV per unit (beginning of year)
b) Capital Growth = Total Return of the Fund – Income Return
c) Income Return = {Income Distribution per Unit / NAV per Unit on beginning
of year} x 100
d) Management
Expenses Ratio
= It is the total management expenses expressed as an
annual percentage of the Fund’s average Net Asset Value.
e) Portfolio Turnover
Ratio
= It represents the average of the total acquisitions and
disposals of the investment in the Fund for the annual
period over the average Net Asset Value of the Fund
calculated on a daily basis.

15
1.7 Unit Holdings as at 31 March 2017
Size of Holdings
BIMB i Flexi Fund
No. of Unit Holders No. of Units Held
No. % Units %
5,000 and below 19 32.20 71,935.81 0.26
5,001 to 10,000 5 8.48 34,839.10 0.13
10,001 to 50,000 27 45.76 693,700.56 2.54
50,001 to 500,000 7 11.86 1,054,828.14 3.86
500,001 and above * 1 1.70 25,473,675.91 93.21
Units Held by Holders 59 100.00 27,328,979.52 100.00
Units Held by Manager 0 0.00 0.00 0.00
Grand Total for the Fund 59 100.00 27,328,979.52 100.00
*included under this category are nominee accounts.
1.8 Policy on Rebate and Soft Commission
Any stock broking rebates received by the Manager will be directed to the account of the
Fund. Any soft commissions received from the broker which are in the form of research and
advisory services that assist in the decision-making process relating to the Fund’s
investment may be retained by the Manager.
The Manager received soft commission from brokers in the form of research and advisory
services during the financial year.
For and on behalf of
The Manager
BIMB INVESTMENT MANAGEMENT BERHAD
Date: 30 May 2017

16
1.0 Laporan Pengurus
Para Pemegang Unit,
Kami dengan sukacitanya membentangkan laporan Pengurus BIMB i Flexi Fund bagi tahun
berakhir pada 31 Mac 2017.
1.1 Nama Dana/ Jenis Dana/ Kategori Dana/ Objektif Pelaburan Dana/ Penanda Aras
Dana/ Polisi Agihan Dana
Nama Dana BIMB i Flexi Fund
Jenis Dana Dana Pertumbuhan
Kategori Dana Aset Campuran berlandaskan Shariah
Objektif
Pelaburan Dana
Tujuan utama Dana ini adalah untuk mencapai pertumbuhan
modal dalam jangkamasa panjang1 dengan melabur dalam
pelbagai portfolio sekuriti patuh Shariah.
Nota:
Sebarang perubahan ketara kepada objektif pelaburan Dana
memerlukan kelulusan daripada Pemegang Unit.
Penanda Aras Dana
Penanda aras prestasi terpilih bagi Dana ini adalah berdasarkan
kepada nisbah 50:50 Indeks FBM Emas Shariah dan pulangan 12
bulan Deposit Bertempoh-i Tawarruq (TDT-i) Bank Islam Malaysia
Berhad.
Nota:
Penanda aras ini mencerminkan strategi pelaburan dan
peruntukan aset Dana, di mana Dana dibenarkan untuk
melaburkan asetnya ke dalam ekuiti patuh Shariah, Sukuk dan
instrumen pasaran wang Islam, bergantung kepada prospek
pasaran. Profil risiko Dana tidak sama dengan profil risiko
penanda aras prestasi.
1 Jangkamasa panjang dalam konteks ini merujuk kepada tempoh lebih dari lima (5) tahun.

17
1.2 Pencapaian bagi tahun kewangan berakhir pada 31 Mac 2017
1.2.1 Kajian Pencapaian
Bagi tahun kewangan dalam kajian, BIMB i Flexi Fund ("Dana") mencatatkan pulangan
sebanyak 7.58% berbanding penanda aras yang memperoleh 3.00%. Dana telah memenuhi
objektifnya untuk mencapai pertumbuhan modal berikutan strategi pelaburan Dana yang
memberikan tumpuan kepada sektor pengeksportan.
Penanda aras prestasi terpilih Dana adalah nisbah 50:50 Indeks Syariah Emas FBM dan
kadar 12-bulan Deposit Bertempoh-i Tawarruq (TDT-i).
Strategi kami adalah secara konsistennya mengekalkan tumpuan terhadap syarikat-syarikat
terkemuka yang mempunyai prospek lebih baik dalam menawarkan pertumbuhan
pendapatan dan peningkatan modal. Dalam melangkah ke hadapan, perhatian lebih akan
diberikan kepada peruntukan mengikut sektor dan pelaburan secara kitaran atau berubah-
ubah (rotational play) untuk mengambil kesempatan daripada peningkatan Nilai Aset Bersih
(NAB).
Sehingga 31 Mac 2017, Dana mempunyai pendedahan sebanyak 88.97% dalam pasaran
ekuiti, dan 11.03% pegangan tunai dan pasaran wang instrumen. Jumlah Nilai Aset Bersih
(NAB) Dana adalah sebanyak RM6.1 juta manakala NAB seunit Dana adalah RM0.2256.
Bagi tahun kewangan dalam kajian, tidak terdapat sebarang perubahan ketara dalam hal
ehwal pengurusan Dana dan tidak juga berlaku sebarang keadaan yang boleh menjejaskan
kepentingan para pemegang unit sehingga tarikh Laporan Pengurus disediakan.

18
1.2.2 Jumlah Pulangan dan Purata Jumlah Pulangan bagi tahun kewangan berakhir 31 Mac
BIMB i Flexi Fund Penanda Aras
Jumlah
Pulangan (%)
Purata Jumlah
Pulangan (%)
Jumlah
Pulangan (%)
Purata Jumlah
Pulangan (%)
Jangkamasa 1 Tahun 7.58 7.58 3.00 3.00
Jangkamasa 2 Tahun -9.03 -4.52 2.42 1.21
Jangkamasa 3 Tahun -9.76 -3.25 4.07 1.36
1.2.3 Jumlah Pulangan Tahunan
Tahun Kewangan
Jumlah Pulangan
BIMB i Flexi Fund
(%)
BIMB i Flexi Fund
(%)
31 Mac 2017 7.58 3.00
31 Mac 2016 -15.44 -0.56
31 Mac 2015 -0.80 1.61
19
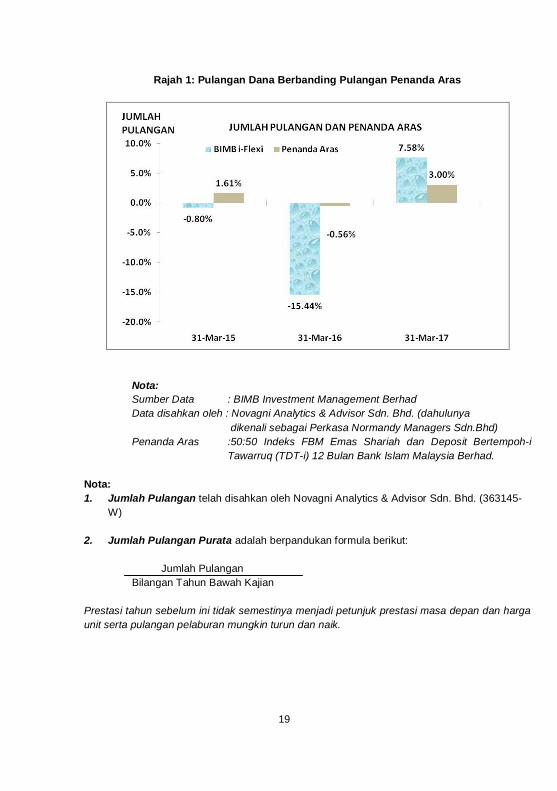
Rajah 1: Pulangan Dana Berbanding Pulangan Penanda Aras
Nota:
Sumber Data : BIMB Investment Management Berhad
Data disahkan oleh : Novagni Analytics & Advisor Sdn. Bhd. (dahulunya
dikenali sebagai Perkasa Normandy Managers Sdn.Bhd)
Penanda Aras :50:50 Indeks FBM Emas Shariah dan Deposit Bertempoh-i
Tawarruq (TDT-i) 12 Bulan Bank Islam Malaysia Berhad.
Nota:
1. Jumlah Pulangan telah disahkan oleh Novagni Analytics & Advisor Sdn. Bhd. (363145-
W)
2. Jumlah Pulangan Purata adalah berpandukan formula berikut:
Jumlah Pulangan
Bilangan Tahun Bawah Kajian
Prestasi tahun sebelum ini tidak semestinya menjadi petunjuk prestasi masa depan dan harga
unit serta pulangan pelaburan mungkin turun dan naik.
20
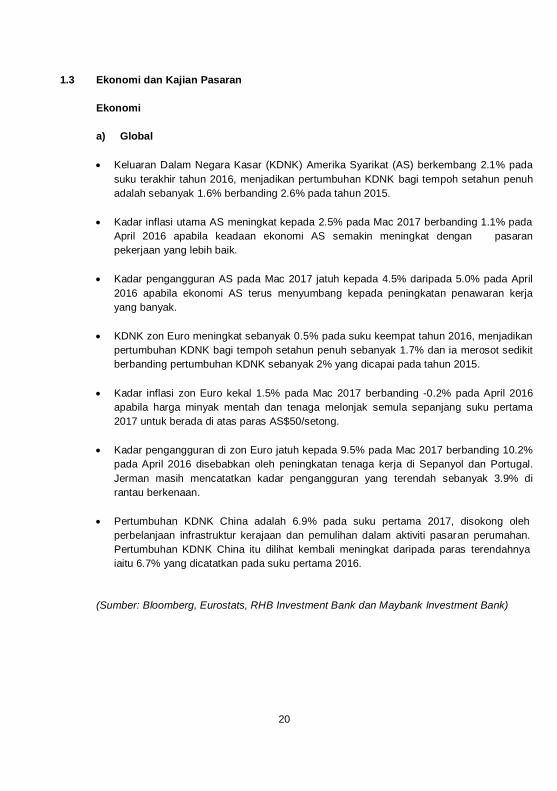
1.3 Ekonomi dan Kajian Pasaran
Ekonomi
a) Global
Keluaran Dalam Negara Kasar (KDNK) Amerika Syarikat (AS) berkembang 2.1% pada
suku terakhir tahun 2016, menjadikan pertumbuhan KDNK bagi tempoh setahun penuh
adalah sebanyak 1.6% berbanding 2.6% pada tahun 2015.
Kadar inflasi utama AS meningkat kepada 2.5% pada Mac 2017 berbanding 1.1% pada
April 2016 apabila keadaan ekonomi AS semakin meningkat dengan pasaran
pekerjaan yang lebih baik.
Kadar pengangguran AS pada Mac 2017 jatuh kepada 4.5% daripada 5.0% pada April
2016 apabila ekonomi AS terus menyumbang kepada peningkatan penawaran kerja
yang banyak.
KDNK zon Euro meningkat sebanyak 0.5% pada suku keempat tahun 2016, menjadikan
pertumbuhan KDNK bagi tempoh setahun penuh sebanyak 1.7% dan ia merosot sedikit
berbanding pertumbuhan KDNK sebanyak 2% yang dicapai pada tahun 2015.
Kadar inflasi zon Euro kekal 1.5% pada Mac 2017 berbanding -0.2% pada April 2016
apabila harga minyak mentah dan tenaga melonjak semula sepanjang suku pertama
2017 untuk berada di atas paras AS$50/setong.
Kadar pengangguran di zon Euro jatuh kepada 9.5% pada Mac 2017 berbanding 10.2%
pada April 2016 disebabkan oleh peningkatan tenaga kerja di Sepanyol dan Portugal.
Jerman masih mencatatkan kadar pengangguran yang terendah sebanyak 3.9% di
rantau berkenaan.
Pertumbuhan KDNK China adalah 6.9% pada suku pertama 2017, disokong oleh
perbelanjaan infrastruktur kerajaan dan pemulihan dalam aktiviti pasaran perumahan.
Pertumbuhan KDNK China itu dilihat kembali meningkat daripada paras terendahnya
iaitu 6.7% yang dicatatkan pada suku pertama 2016.
(Sumber: Bloomberg, Eurostats, RHB Investment Bank dan Maybank Investment Bank)

21
b) Dalam Negara
Malaysia mencatatkan pertumbuhan KDNK benar sebanyak 4.5% pada suku keempat
2016, disokong oleh sektor perkembangan pembuatan dan perkhidmatan. Ini
menjadikan pertumbuhan KDNK bagi tempoh setahun penuh adalah sebanyak 4.2%
untuk 2016.
Kadar inflasi tahunan Malaysia meningkat kepada 5.1% pada Mac 2017, daripada 2.1%
pada April 2016 berikutan kenaikan harga runcit minyak RON95 pada Januari dan
Februari 2017 menjadikan kos pengangkutan dan kos berkaitan dalam ekonomi
tempatan lebih tinggi.
Bank Negara Malaysia memutuskan untuk mengekalkan Kadar Dasar Semalaman
(OPR) pada 3.00% dalam mesyuarat Jawatankuasa Dasar Monetari (MPC) yang
diadakan pada 2 Mac 2017. Dasar monetari akan kekal akomodatif dan menyokong
ekonomi domestik berikutan memuncaknya risiko secara berterusan dalam ekonomi
global dan persekitaran kewangan.
Rizab Bank Negara Malaysia (BNM) berjumlah AS$94.9 bilion setakat 31 Mac 2017
berbanding AS$97.2 bilion pada 15 April 2016. Paras rizab pada 31 Mac 2017 adalah
memadai untuk membiayai 8.3 bulan import tertangguh dan mewakili 1.1 kali hutang
jangka pendek luar negara.
(Sumber: Bloomberg, Jabatan Perangkaan dan Bank Negara Malaysia)
Kajian Pasaran
Ekuiti
Indeks Syariah Emas FTSE Bursa Malaysia ("FBM Shariah") berada dalam tempoh kajian
pada 1 April 2016 dengan catatan 12,482.39 mata sebelum meningkat ke paras tertinggi
12,880.42 mata pada 29 Mac 2017 dan berada paras rendah 11,775.69 mata pada 16 Mei
2016. Indeks mengakhiri tahun kajian pada paras 12,811.34 mata pada 31 Mac 2017.
Dalam tempoh kajian, FBM Syariah meningkat 328.95 mata atau 2.64%. Antara faktor
utama yang menyumbang kepada pergerakan indeks dinyatakan di bawah:
Pada Mei 2016, MSCI mengumumkan pengurangan wajaran indeks Malaysia dalam
indeksnya, menyebabkan berlakunya penjualan secara besar-besaran dalam pasaran
domestik dan melemahkan lagi nilai Ringgit berbanding dolar Amerika kepada
AS$/MYR 4.15.

22
Pada Jun 2016, pasaran ekuiti dan mata wang global dikejutkan oleh keputusan
pungutan suara Brexit yang turut menggemparkan seluruh Kesatuan Eropah (EU)
apabila rakyat United Kingdom (UK) memilih untuk meninggalkan Kesatuan itu kerana
kecewa dengan pelbagai dasarnya yang dianggap tidak memihak kepada ekonomi
negara itu.
Bank Negara Malaysia secara di luar jangkaan telah mengurangkan Kadar Dasar
Semalaman (OPR) sebanyak 25 mata asas kepada 3.00% pada Julai 2016 sebagai
langkah pencegahan untuk mengurangkan impak negatif daripada keputusan pungutan
suara atau referendum Brexit dengan keadaan ekonomi dalam negara yang perlahan.
Kenyataan Janet Yellen selepas mesyuarat di Jackson Hole pada akhir Ogos 2016
menunjukkan terdapat asas kukuh tentang kemungkinan kenaikan kadar faedah yang
seterusnya manakala harga minyak mentah dunia dan nilai mata wang Ringgit kekal
rendah kerana kebimbangan berterusan terhadap lebihan bekalan terus menekan harga
komoditi itu di seluruh dunia.
Rizab Persekutuan AS enggan menaikkan kadar faedah pada September 2016 lebih
awal daripada Pilihan Raya Presiden Amerika Syarikat yang diadakan pada November
2016 dan menganggap ekonomi AS masih mempunyai ruang untuk meningkat sebelum
berdepan dengan risiko mengalami pertumbuhan yang terlalu tinggi.
Perdana Menteri Malaysia membentangkan Bajet 2017 pada 21 Oktober 2016 bertujuan
mengekang defisit bajet persekutuan pada paras 3.0% berbanding 3.1% pada tahun
2016 dengan menyasarkan pertumbuhan KDNK antara 4% hingga 5% bagi tahun 2017.
Bajet 2017 itu disediakan berdasarkan harga purata minyak mentah pada paras AS$45
setong.
Pada November 2016, kemenangan Donald Trump di luar jangkaan dalam Pilihan Raya
Presiden AS mengejutkan pasaran amnya, apabila para pelabur berpusu-pusu mencari
aset pelaburan yang selamat seperti emas, bon dan yen Jepun, kerana mempercayai
bahawa pentadbiran Trump akan menyebabkan berlakunya ketidaktentuan dalam
pasaran. Pasaran Asia pula mengalami kegiatan jualan secara besar-besaran sebelum
para pelabur sejagat kemudiannya mengimbangi semula portfolio mereka untuk
mengambil faedah daripada pertumbuhan lebih kukuh dalam ekonomi AS dan kadar
hasil bon AS yang lebih tinggi.
Pada Disember 2016, Rizab Persekutuan menaikkan kadar faedah sebanyak 0.25%
kepada 0.75% seperti dijangkakan oleh banyak pihak berikutan berlakunya
pengembangan yang menggalakkan dalam ekonomi AS sambil mengimbangi matlamat
Presiden yang baru dipilih untuk terus merangsang ekonomi negara itu. Pada bulan ini,
negara-negara anggota OPEC bersetuju mengurangkan pengeluaran minyak mentah
dalam usaha menangani lebihan komoditi berkenaan yang mengakibatkan harga minyak
mentah global meningkat ke paras tertinggi dalam tempoh 16-bulan iaitu di atas paras
AS$55 setong pada 5 Disember 2016.

23
Pada Januari 2017, Donald Trump secara rasminya menjadi presiden baharu Amerika
Syarikat namun beliau lebih banyak memperkenalkan dasar-dasar tidak jelas kepada
dunia berkaitan perdagangan melangkaui sempadan AS-Mexico dan potensi halangan
baharu imigresen dan perjalanan warga asing ke AS. Bagaimanapun, Indeks Dow
Jones dan pasaran kewangan global kekal stabil pada bulan itu.
Pasaran ekuiti global mengalu-alukan kenaikan mengejut kadar faedah AS sebanyak 25
mata asas oleh Rizab Persekutuan AS berikutan data ekonomi negara itu yang lebih
kukuh berbanding jangkaan dan juga pendirian terhadap kadar faedah yang lebih
agresif oleh pentadbiran baharu, menyebabkan kadar dana Persekutuan meningkat
kepada 1.00% selepas kenaikan kadar faedah pada 15 Mac 2017.
(Sumber: Bloomberg dan Bank Negara Malaysia)
Pasaran Bon dan Pasaran Wang
a) Global
Hasil Perbendaharaan AS meningkat di seluruh keluk hasil sepanjang tahun dalam
kajian dengan kadar hasil bon 10 tahun meningkat sebanyak 50 mata asas kepada
2.28% dan kadar hasil bon 20 tahun juga meningkat sebanyak 45 mata asas kepada
2.65%.

24
Rajah 2: Kadar Perbendaharaan AS
Sumber: Jabatan Perbendaharaan AS, 31 Mac 2017

25
b) Dalam Negara
Sekuriti Kerajaan Malaysia (MGS) dan Terbitan Pelaburan Kerajaan (GII) mendominasi
aktiviti pasaran bon tempatan dengan jumlah dagangan sebanyak RM1,027.13 bilion
bagi tahun dalam kajian. Kadar hasil bon kerajaan kebanyakannya meningkat berikutan
kemenangan Donald Trump dalam pilihanraya Presiden AS yang menyebabkan
pelabur di pasaran am cenderung ke aset yang lebih selamat.
Jadual 1: Kadar Pulangan Sukuk/ Bon Islam
Tempoh/ Tarikh 31 Mac 2017
(%)
31 Mac 2016
(%)
Pertukaran
* (bps)
Bon 3 Tahun
GII 3.75 3.20 55.0
Korporat AAA 4.19 4.09 10.0
Bon 5 Tahun
GII 3.97 3.66 31.0
Korporat AAA 4.32 4.24 8.0
Bon 7 Tahun
GII 4.10 3.90 20.0
Korporat AAA 4.46 4.40 6.0
Bon 10 Tahun
GII 4.13 4.03 10.0
Korporat AAA 4.66 4.56 10.0
Sumber: Agensi Penetapan Harga Bon Malaysia (BPAM), 31 Mac 2017

26
Rajah 3: Kadar Polisi Semalaman (OPR)
Sumber: Bank Negara Malaysia (BNM), 31 Mac 2017
1.4 Tinjauan Pasaran dan Strategi
a) Ekuiti
Tinjauan menunjukkan pasaran ekuiti bagi tahun 2017 dijangka menjadi satu lagi
tahun tidak menentu. Faktor-faktor luaran yang mungkin mempengaruhi sentimen
pasaran domestik termasuklah komitmen OPEC dan negara-negara bukan anggota
OPEC untuk menstabilkan lebihan minyak mentah dalam pasaran, pendirian
Presiden Trump terhadap dasar perdagangan dan pertumbuhan ekonomi, kesan
kenaikan kadar faedah AS dan pergerakan mata wang, sentimen politik di zon Euro,
pembangunan ekonomi China, dasar kewangan yang digunakan oleh bank pusat
dan kebimbangan terhadap kemungkinan berlakunya kemelesetan global yang boleh
menyebabkan keadaan turun naik dalam pasaran domestik. Dengan terdapat
potensi sektor-sektor terpilih untuk menyokong pasaran tempatan, bursa tempatan
seharusnya dapat menghadapi kejutan luar kerana terdapatnya kecairan atau
mudah tunai yang besar dalam negara dan minat belian pelabur asing dan pelabur
institusi tempatan.

27
Prospek ekonomi global kekal tidak bermaya memandangkan pertumbuhan yang
tidak sekata dalam ekonomi seluruh negara dunia. Ketika pemulihan ekonomi AS
berada pada landasannya, pertumbuhan zon Euro, Jepun dan China masih lemah.
Di Asia, pertumbuhan berlaku secara berterusan disebabkan oleh peningkatan
permintaan domestik dan eksport.
Bagi Malaysia, daya tahan penggunaan dalam negara kekal menjadi penyokong
kepada pertumbuhan. Dengan perbelanjaan lebih tinggi terhadap projek-projek
infrastruktur yang sedang dijalankan, gaji sektor awam yang lebih tinggi, tinjauan
lebih baik dalam harga minyak sawit mentah dan lonjakan semula dalam
penggunaan dan perbelanjaan kerajaan akan membantu meningkatkan pendapatan
korporat dan perbelanjaan pengguna bagi tahun ini. Melangkah ke hadapan,
permintaan dalam negeri kekal menjadi pemacu utama pertumbuhan ekonomi
Malaysia yang masih dijangka berkembang antara 4.2% kepada 4.7%.
Strategi kami adalah melabur dalam syarikat-syarikat yang dilihat mempunyai
pendapatan yang baik, lembaran kira-kira yang kukuh, penilaian yang munasabah
dan prospek pertumbuhan yang baik. Kami mempunyai pendekatan jangka panjang
untuk pelaburan dengan objektif untuk mengatasi pencapaian penanda aras.
b) Pasaran Sukuk & Pasaran Wang
Pasaran Sukuk dijangka menyaksikan aliran positif, tetapi keuntungannya agak
sederhana di tengah-tengah paras urus niaga yang ketat. Walaupun lebih ketat, ia
dijangka menyaksikan aliran dua hala pada masa depan, manakala tekanan
pengambilan untung dapat diserap dengan baik disokong oleh permintaan pelabur.
Untuk masa hadapan, perubahan dalam kadar polisi semalaman bergantung kepada
data ekonomi mengenai pertumbuhan dan inflasi. Kadar deposit pasaran wang
dijangka stabil pada peringkat semasa berbanding peringkat pertengahan.
Strategi Sukuk kami adalah melabur dalam Sukuk berkualiti sekurang-kurangnya
bertaraf AA3/AA-oleh Rating Agency Malaysia (RAM)/Malaysian Rating Corporation
Berhad (MARC) dan menawarkan kadar keuntungan yang menarik. Strategi pasaran
wang kami adalah melabur dalam pelaburan pasaran wang untuk memaksimumkan
pulangan di samping menyediakan kecairan atau mudah tunai dan pendapatan tetap
kepada pelabur.

28
1.5 Peruntukan Aset pada 31 Mac
BIMB i Flexi Fund 2017
(%) 2016
(%)
Pelaburan Sekuriti Tersiarharga:
Pembinaan - 2.69
Barangan Pengguna 2.17 4.74
Barangan Industri 47.58 27.97
Infrastruktur 5.38 8.52
Perladangan 2.37 3.20
Teknologi 30.47 19.24
Perdagangan dan Perkhidmatan 1.00 16.73
88.97 83.09
TUNAI DAN PELABURAN JANGKA PENDEK: 11.03 16.91
100.00 100.00

29
1.6 Lain-Lain Data Prestasi Bagi Tahun Kewangan Berakhir 31 Mac
BIMB i Flexi Fund 2017 2016
Harga Unit (RM)
NAB tertinggi seunit bagi tahun 0.2275 0.2547
NAB terendah seunit bagi tahun 0.1923 0.2052
Nilai Aset Bersih (NAB) dan Unit Dalam Edaran (UDE) pada Akhir Tahun
Jumlah NAB (RM) 6,165,178 7,648,688
Unit Dalam Edaran (UDE) 27,328,980 36,478,527
NAB seunit (RM) 0.2256 0.2097
Jumlah Pulangan Dana (%)
Pertumbuhan Modal (%)( (%)
(b) 7.58 -15.44
Pulangan Pendapatan (%)(c)
- -
Pulangan Dana (%)(a)
7.58 -15.44
Nisbah Perbelanjaan Pengurusan (NPP) (%)(d)
2.05 1.99
Nisbah Pusing Ganti Portfolio (Kali)(e)
3.33 2.75
Nota:-
a) Pulangan ke atas Dana
= Harga seunit (pada akhir tahun) - 1 Harga seunit (pada awal tahun)
b) Penambahan Modal = Pulangan Ke atas Dana – Pulangan Pendapatan
c) Pulangan Pendapatan = {Pengagihan Pendapatan Se Unit / NAB se unit
pada awal tahun} x 100
d) Nisbah Perbelanjaan Pengurusan
= Ia dikira dengan mengambil jumlah perbelanjaan pengurusan sepertimana yang dinyatakan sebagai peratusan tahunan daripada jumlah purata Nilai Aset
Bersih Dana
e) Nisbah Pusing Ganti Portfolio
= Ia dikira dengan mengambil purata jumlah perolehan dan pelupusan pelaburan dalam Dana bagi tempoh
tahunan dibahagi dengan purata Nilai Aset Bersih Dana yang dikira pada asas harian

30
1.7 Unit Holdings as at 31 March 2017
Saiz Dipegang
BIMB i Flexi Fund
Bilangan Pemegang Unit Jumlah Pegangan Unit
Bilangan % Bilangan %
5,000 dan ke bawah 19 32.20 71,935.81 0.26
5,001 hingga 10,000 5 8.48 34,839.10 0.13
10,001 hingga 50,000 27 45.76 693,700.56 2.54
50,001 hingga 500,000 7 11.86 1,054,828.14 3.86
500,001 dan ke atas* 1 1.70 25,473,675.91 93.21
Unit yang dipegang oleh
Pemegang Unit 59 100.00 27,328,979.52 100.00
Unit yang dipegang oleh
Pengurus 0 0.00 0.00 0.00
Jumlah Keseluruhan bagi Dana
59 100.00 27,328,979.52 100.00
*Akaun Penama juga termasuk di bawah kategori ini.
1.8 Polisi Rebat dan Komisyen Bukan Tunai
Sebarang rebat broker saham yang diterima oleh Pengurus akan dimasukkan ke dalam
akaun Dana. Mana-mana komisen ringan (bukan tunai) yang diterima daripada broker dalam
bentuk perkhidmatan penyelidikan dan perundingan bertujuan membantu proses membuat
keputusan berkaitan dengan pelaburan Dana boleh disimpan oleh Pengurus.
Pengurus menerima komisen ringan daripada para broker dalam bentuk perkhidmatan
penyelidikan dan khidmat nasihat sepanjang tahun kewangan.
Bagi dan bagi pihak
Pengurus
BIMB INVESTMENT MANAGEMENT BERHAD
Tarikh: 30 Mei 2017
Nota:
Laporan ini telah diterjemahkan daripada laporan asal (dalam Bahasa Inggeris). Jika
terdapat perbezaan, sila rujuk kepada laporan Bahasa Inggeris.

31
2.0 Trustee’s Report
To the Unit Holders of
BIMB i FLEXI FUND
We, AMANAHRAYA TRUSTEES BERHAD, have acted as Trustee of BIMB i FLEXI FUND
for the financial year ended 31 March 2017. In our opinion, BIMB INVESTMENT
MANAGEMENT BERHAD, the Manager, has operated and managed BIMB i FLEXI FUND
in accordance with the limitations imposed on the investment powers of the management
company under the Deed, securities laws and the applicable Guidelines on Unit Trust Funds
during the financial year then ended.
We are also of the opinion that:
(a) Valuation and pricing is carried out in accordance with the Deed and any regulatory
requirement; and
(b) Creation and cancellation of units are carried out in accordance with the Deed and any
regulatory requirement.
Yours faithfully
AMANAHRAYA TRUSTEES BERHAD
____________________
HABSAH BINTI BAKAR
Chief Executive Officer
Kuala Lumpur, Malaysia
Date: 30 May 2017

32
3.0 Shariah Committee’s Report
ANNUAL REPORT FOR THE FINANCIAL YEAR ENDED 31 MARCH 2017
حيم ن ٱلر ـ حم بسم ٱهلل ٱلر
To the Unit Holders of
BIMB i FLEXI FUND
We have acted as the Shariah Committee of BIMB i Flexi Fund.
Our responsibilities are to ensure that the procedures and processes employed by BIMB
Investment Management Berhad and that the provisions of the Deed dated 27 March 2013 are
in accordance with Shariah principles.
In our opinion, BIMB Investment Management Berhad has managed BIMB i Flexi Fund in
accordance with Shariah principles and complied with applicable guidelines, rulings or
decisions issued by the Securities Commission pertaining to Shariah matters for the financial
year ended 31 March 2017.
In addition, we also confirm that the investment portfolio of BIMB i Flexi Fund comprises
securities which have been classified as Shariah-compliant by the Shariah Advisory Council
(SAC) of the Securities Commission, as the case may be and that all deposits and money
market instruments placed by the Fund are Shariah-compliant.
أعلم واهللا
For and on behalf of the Shariah Committee
………………………………………………..
USTAZ DR. AHMAD SHAHBARI@SOBRI SALAMON
(Chairman)
………………………………………………..
USTAZ DR. YUSOF RAMLI
(Committee Member)
………………………………………………..
USTAZAH DR. ASMAK AB. RAHMAN
(Committee Member)
Date: 30 May 2017

33
4.0 Directors’ Declaration
ANNUAL REPORT FOR THE FINANCIAL YEAR ENDED 31 MARCH 2017
To the Unit Holders of
BIMB i Flexi Fund
We, Dato’ Ghazali Bin Awang and Najmuddin Bin Mohd Lutfi, being two of the directors of the
Manager, BIMB Investment Management Berhad, for BIMB i Flexi Fund do hereby state that in
our opinion, the accompanying Statement of Financial Position, Statement of Profit or Loss
and Other Comprehensive Income, Statement of Changes in Net Asset Value and Statement
of Cash Flows are drawn up so as to give a true and fair view of the Statement of Financial
Position of the Fund as at 31 March 2017 and Statement of Profit or Loss and Other
Comprehensive Income, Statement of Changes in Net Asset Value and Statement of Cash
Flows for the year ended on that date.
For and on behalf on the Board of Directors,
……………………………………………
Dato’ Ghazali Bin Awang
(Non-Executive Independent Director)
…………………………………………..
Najmuddin Bin Mohd Lutfi
(Chief Executive Officer)
Date: 30 May 2017

34
5.0 Independent Auditors’ Report
(Established in Malaysia)
Report on the Audit of the Financial Statements Opinion
We have audited the financial statements of BIMB i Flexi Fund (“the Fund”), which comprise
the statement of financial position as at 31 March 2017, and the statement of profit or loss
and other comprehensive income, statement of changes in net asset value and cash flows for the year then ended, and notes to the financial statements, including a summary of significant accounting policies, as set out on pages 38 to 62.
In our opinion, the accompanying financial statements give a true and fair view of the financial position of the Fund as at 31 March 2017, and of its financial performance and its
cash flows for the year then ended in accordance with Malaysian Financial Reporting Standards, International Financial Reporting Standards and Securities Commission’s Guidelines on Unit Trust Funds in Malaysia.
Basis for Opinion
We conducted our audit in accordance with approved standards on auditing in Malaysia and International Standards on Auditing. Our responsibilities under those standards are further described in the Auditors’ Responsibilities for the Audit of the Financial Statements section of
our auditors’ report. We believe that the audit evidence we have obtained is sufficient and appropriate to provide a basis for our opinion.
Independence and Other Ethical Responsibilities We are independent of the Fund in accordance with the By-Laws (on Professional Ethics,
Conduct and Practice) of the Malaysian Institute of Accountants (“By-Laws”) and the International Ethics Standards Board for Accountants’ Code of Ethics for Professional Accountants (“IESBA Code”), and we have fulfilled our other ethical responsibilities in
accordance with the By-Laws and the IESBA Code. Information Other than the Financial Statements and Auditors’ Report Thereon
The Manager of the Fund is responsible for the other information. The other information comprises the information included in the annual report, but does not include the financial
statements of the Fund and our auditors’ report thereon. Our opinion on the financial statements of the Fund does not cover the annual report and we
do not express any form of assurance conclusion thereon.

35
Information Other than the Financial Statements and Auditors’ Report Thereon (continued)
In connection with our audit of the financial statements of the Fund, our responsibility is to read the annual report and, in doing so, consider whether annual report is materially
inconsistent with the financial statements of the Fund or our knowledge obtained in the audit or otherwise appears to be materially misstated.
If, based on the work we have performed, we conclude that there is a material misstatement of the annual report, we are required to report that fact. We have nothing to report in this regard.
Responsibilities of the Manager and Trustee for the Financial Statements
The Manager of the Fund is responsible for the preparation of financial statements of the Fund that give a true and fair view in accordance with Malaysian Financial Reporting Standards, International Financial Reporting Standards and Securities Commission’s
Guidelines on Unit Trust Funds in Malaysia. The Manager is also responsible for such internal control as the Manager determine is necessary to enable the preparation of financial statements of the Fund that are free from material misstatement, whether due to fraud or
error. In preparing the financial statements of the Fund, the Manager is responsible for assessing
the Fund’s ability to continue as a going concern, disclosing, as applicable, matters related to going concern and using the going concern basis of accounting unless the Manager either intend to liquidate the Fund or to cease operations, or have no realistic alternative but to do
so. The Trustee is responsible for ensuring that the Manager maintains proper accounting and
other records as necessary to enable true and fair presentations of these financial statement. Auditors’ Responsibilities for the Audit of the Financial Statements
Our objectives are to obtain reasonable assurance about whether the financial statements of the Fund as a whole are free from material misstatement, whether due to fraud or error, and
to issue an auditors’ report that includes our opinion. Reasonable assurance is a high level of assurance, but is not a guarantee that an audit conducted in accordance with approved standards on auditing in Malaysia and International Standards on Auditing will always detect
a material misstatement when it exists. Misstatements can arise from fraud or error and are considered material if, individually or in the aggregate, they could reasonably be expected to influence the economic decisions of users taken on the basis of these financial statements.
36
Auditors’ Responsibilities for the Audit of the Financial Statements (continued)
As part of an audit conducted in accordance with approved standards on auditing in Malaysia and International Standards on Auditing, we exercise professional judgement and maintain professional scepticism throughout the audit. We also:
Identify and assess the risk of material misstatement of the financial statements of the
Fund, whether due to fraud or error, design and perform audit procedures responsive
to those risks, and obtain audit evidence that is sufficient and appropriate to provide a basis for our opinion. The risk of not detecting a material misstatement resulting from fraud is higher than for one resulting from error, as fraud may involve collusion,
forgery, intentional omissions, misrepresentations, or the override of internal control. Obtain an understanding of internal control relevant to the audit in order to design
audit procedures that are appropriate in the circumstances, but not for the purpose of expressing an opinion on the effectiveness of the Fund’s internal control.
Evaluate the appropriateness of accounting policies used and the reasonableness of accounting estimates and related disclosures made by the Manager.
Conclude on the appropriateness of the Manager’s use of the going concern basis of accounting and, based on the audit evidence obtained, whether a material uncertainty exists related to events or conditions that may cast significant doubt on the ability of
the Fund to continue as a going concern. If we conclude that a material uncertainty exists, we are required to draw attention in our auditors’ report to the related disclosures in the financial statements of the Fund or, if such disclosures are
inadequate, to modify our opinion. Our conclusions are based on the audit evidence obtained up to the date of our auditors’ report. However, future events or conditions may cause the Fund to cease to continue as a going concern.
Evaluate the overall presentation, structure and content of the financial statements of
the Fund, including the disclosures, and whether the financial statements of the Fund
represents the underlying transactions and events in a manner that gives true and fair view.
We communicate with the Manager regarding, among other matters, the planned scope and timing of the audit and significant audit findings, including any significant deficiencies in internal control that we identify during our audit.

37
Other matter
This report is made solely to the members of the Fund, as a body, in accordance with Securities Commission’s Guidelines on Unit Trust Funds in Malaysia and for no other purpose. We do not assume responsibility to any other person for the content of this report.
KPMG Desa Megat PLT Adrian Lee Lye Wang
(LLP0010082-LCA & AF 0759) Approval Number: 2679/11/17(J)
Chartered Accountants Chartered Accountant
Petaling Jaya, Selangor
Date: 30 May 2017

38
6.0 Financial Statements (Audited)
6.1 Statement of Financial Position as at 31 March 2017
Note 2017 2016 RM RM
Assets Quoted securities 4 5,485,399 6,355,667
Amount due from stockbroker 539,419 -
Amount due from Manager - 19,164 Other receivables 13,549 7,839 Cash and cash equivalents 5 432,556 1,357,144
Total assets 6,470,923 7,739,814
Liabilities Amount due to stockbroker 270,316 -
Amount due to Manager - 49,147 Other payables 35,429 41,979
Total liabilities 305,745 91,126
Net asset value 6,165,178 7,648,688
Unitholders’ fund Unitholders’ capital 6 7,938,526 9,814,234 Accumulated losses (1,773,348) (2,165,546)
Net asset value attributable to unitholders 6,165,178 7,648,688
Number of units in circulation 27,328,980 36,478,527
Net asset value per unit (sen) 22.56 20.97
The notes on pages 42 to 62 are an integral part of these financial statements.

39
6.2 Statement of Profit or Loss and Other Comprehensive Income for the financial year
ended 31 March 2017
Note 2017 2016 RM RM
Income Gain/(loss) on sale of quoted shares 79,484 (2,054,564) Income from Islamic debt securities - 24,085
Gain on sale of Islamic debt securities - 1,564 Gross dividends from shares quoted in Malaysia 148,648 356,057 Income from short term investments 1,669 33,167
Hibah from Al-Wadiah account 597 730 Net unrealised gain/(loss) from financial instruments at fair value through profit or loss
293,257
(13,241)
523,655 (1,652,202) Less: Amortisation of premium - (5,964)
Gross income/(loss) 523,655 (1,658,166)
Expenses Manager’s fee 7 96,166 166,204 Trustee’s fee 8 3,206 5,540
Audit fee 11,000 11,000 Tax agent’s fee 3,000 3,000 Administrative expenses 18,085 34,718
131,457 220,462
Net income/(loss) before taxation 392,198 (1,878,628) Tax expense 9 - -
Net income/(loss) after taxation 392,198 (1,878,628) Other comprehensive income for the year - -
Total comprehensive income/(loss) for the year 392,198 (1,878,628)
Total comprehensive income/(loss) for the year consist of:
Realised amount 98,941 (1,865,387) Unrealised amount 293,257 (13,241)
392,198 (1,878,628)
The notes on pages 42 to 62 are an integral part of these financial statements.

40
6.3 Statement of Changes in Net Asset Value for the financial year ended 31 March 2017
Unitholders’
capital
Accumulated
losses
Total Note RM RM RM
At 1 April 2015 16,088,950 (286,918) 15,802,032 Movement in unitholders’
contribution or distribution
Creation of units 135,810 - 135,810
Cancellation of units (6,410,526) - (6,410,526)
Total attributable to unitholders
(6,274,716) - (6,274,716) Total comprehensive loss for the
year
- (1,878,628) (1,878,628)
As at 31 March 2016 / 1 April 2016 6 9,814,234 (2,165,546) 7,648,688
Movement in unitholders’ contribution or distribution
Creation of units 53,225 - 53,225 Cancellation of units (1,928,933) - (1,928,933)
Total attributable to unitholders
(1,875,708) - (1,875,708)
Total comprehensive income for the year
- 392,198 392,198
As at 31 March 2017 6 7,938,526 (1,773,348) 6,165,178
The notes on pages 42 to 62 are an integral part of these financial statements.

41
6.4 Statement of Cash Flows for the financial year ended 31 March 2017
2017 2016 RM RM Cash flows from operating activities
Proceed from sale of Islamic debt securities - 1,014,200 Purchase of Islamic debt securities - (1,018,600) Proceed from sale of quoted investments 21,447,177 31,900,013
Purchase of quoted investments (20,473,272) (25,499,541) Dividend received 142,854 361,152 Income from Islamic debt securities and short term
investments 2,351 58,138 Management fee paid (98,803) (177,028) Trustee fee paid (3,293) (5,901)
Audit fee paid (11,000) (11,000) Tax agent fee paid (3,000) (3,000) Payment for other administrative (21,911) (27,453)
Net cash generated from operating activities 981,103 6,590,980
Cash flows from financing activities
Cash receipt for creation of units 72,389 116,646 Cash payment for cancellation of units (1,978,080) (6,609,035)
Net cash used in financing activities (1,905,691) (6,492,389)
Net (decrease)/increase in cash and cash equivalents (924,588) 98,591
Cash and cash equivalents at 1 April
1,357,144
1,258,553
Cash and cash equivalents at 31 March 432,556 1,357,144
Cash and cash equivalents comprise:
Short term placements 324,673 1,300,103 Cash at bank 107,883 57,041
432,556 1,357,144
The notes on pages 42 to 62 are an integral part of these financial statements.

42
6.5 Notes to the financial statements
1. Information on the Fund
BIMB i Flexi Fund (hereinafter referred to as “the Fund”) was constituted pursuant to the
execution of a Deed dated 27 March 2013 between the Manager - BIMB Investment Management
Berhad, the Trustee – AmanahRaya Trustees Berhad and the registered unitholders of the Fund.
The principal activity of the Fund is to invest in authorised investments as defined in the Deed,
which include stocks and shares of companies quoted on Bursa Malaysia and short term
placements.
The Manager, BIMB Investment Management Berhad, a company incorporated in Malaysia, is a
subsidiary of Bank Islam Malaysia Berhad.
The financial statements were approved by the Board of Directors of the Manager on 30 May
2017.
2. Basis of preparation
(a) Statement of compliance
The financial statements of the Fund have been prepared in accordance with
Malaysian Financial Reporting Standards (“MFRS”), International Financial Reporting
Standards (“IFRS”), the Deed and Securities Commissions Guidelines on Unit Trust
Funds in Malaysia.
The following are accounting standards, amendments and interpretations that have
been issued by the Malaysian Accounting Standards Board (“MASB”) but have not
been adopted by the Fund:
MFRSs, Interpretations and amendments effective for annual periods
beginning on or after 1 January 2017
Amendments to MFRS 12, Disclosure of Interests in Other Entities (Annual
Improvements to MFRS Standards 2014-2016 Cycle)
Amendments to MFRS 107, Statement of Cash Flows – Disclosure Initiative
Amendments to MFRS 112, Income Taxes – Recognition of Deferred Tax
Assets for Unrealised Losses

43
2. Basis of preparation (continued)
(a) Statement of compliance (continued)
MFRSs, Interpretations and amendments effective for annual periods beginning on or after 1 January 2018
MFRS 9, Financial Instruments (2014)
MFRS 15, Revenue from Contracts with Customers
Clarifications to MFRS 15, Revenue from Contracts with Customers
IC Interpretation 22, Foreign Currency Transactions and Advance
Consideration
Amendments to MFRS 1, First-time Adoption of Malaysian Financial
Reporting Standards (Annual Improvements to MFRS Standards 2014-2016
Cycle)
Amendments to MFRS 2, Share-based Payment – Classification and
Measurement of Share-based Payment Transactions
Amendments to MFRS 4, Insurance Contracts – Applying MFRS 9 Financial
Instruments with MFRS 4 Insurance Contracts
Amendments to MFRS 128, Investments in Associates and Joint Ventures
(Annual Improvements to MFRS Standards 2014-2016 Cycle)
Amendments to MFRS 140, Investment Property – Transfers of Investment
Property
MFRSs, Interpretations and amendments effective for annual periods
beginning on or after 1 January 2019
MFRS 16, Leases
MFRSs, Interpretations and amendments effective for a date yet to be
confirmed
Amendments to MFRS 10, Consolidated Financial Statements and MFRS
128, Investments in Associates and Joint Ventures – Sale or Contribution of
Assets between an Investor and its Associate or Joint Venture
The Fund plans to apply the abovementioned accounting standards, amendments
and interpretations, where applicable:
from the annual period beginning on 1 April 2017 for those amendments that
are effective for annual periods beginning on or after 1 January 2017.
from the annual period beginning on 1 April 2018 for those accounting
standards, amendments or interpretations that are effective for annual periods
beginning on or after 1 January 2018.
from the annual period beginning on 1 April 2019 for the accounting standard
that is effective for annual periods beginning on or after 1 January 2019.

44
2. Basis of preparation (continued)
(a) Statement of compliance (continued)
The initial application of the accounting standards, amendments or interpretations
are not expected to have any material financial impact to the current year and prior
year financial statements of the Fund, except as mentioned below:
(i) MFRS 9, Financial Instruments
MFRS 9 replaces the guidance in MFRS 139, Financial Instruments:
Recognition and Measurement on the classification and measurements of
financial assets and financial liabilities, and on hedge accounting.
The Fund is currently assessing the financial impact that may arise from the
adoption of MFRS 9.
(b) Basis of measurement
The financial statements are prepared on the historical cost basis except as
disclosed in note 3(a)(ii).
(c) Functional and presentation currency
These financial statements are presented in Ringgit Malaysia (RM), which is the
Fund’s functional currency.
(d) Use of estimates and judgements
The preparation of the financial statements in conformity with MFRSs requires
management to make judgements, estimates and assumptions that affect the
application of accounting policies and the reported amounts of assets, liabilities,
income and expenses. Actual results may differ from these estimates.
Estimates and underlying assumptions are reviewed on an ongoing basis. Revisions
to accounting estimates are recognised in the year in which the estimate is revised
and in any future years affected.
There are no significant areas of estimation uncertainty and critical judgements in
applying accounting policies that have significant effect on the amounts recognised
in the financial statements.

45
3. Significant accounting policies
The accounting policies set out below have been applied consistently to the periods presented in these financial statements, unless otherwise stated.
(a) Financial instruments
(i) Initial recognition and measurement
A financial instrument is recognised in the statement of financial position when,
and only when, the Fund becomes a party to the contractual provisions of the
instrument.
A financial instrument is recognised initially, at its fair value plus, in the case of
a financial instrument not at fair value through profit or loss, transaction costs
that are directly attributable to the acquisition or issue of the financial
instrument.
(ii) Financial instrument categories and subsequent measurement
The Fund categorises financial instruments as follows:
Financial assets
(a) Financial assets at fair value through profit or loss
Fair value through profit or loss category comprises financial assets that are held for trading, or financial assets that are specifically designated into this category upon initial recognition.
Financial assets categorised as fair value through profit or loss are subsequently measured at their fair values with the gain or loss
recognised in the statement of profit or loss.
(b) Financing and receivables
Financing and receivables category are debt instruments that are not quoted in an active market and these comprises amount due from
Managers, stockbroker, other receivables, cash and cash equivalents.
Financial assets categorised as financing and receivables are
subsequently measured at amortised cost using the effective profit method.
All financial assets except for those measured at fair value through profit or loss, are subject to review for impairment, see note 3(d).

46
3. Significant accounting policies (continued)
(a) Financial instruments (continued)
(ii) Financial instrument categories and subsequent measurement
(continued)
Financial liabilities
All financial liabilities are subsequently measured at amortised cost.
Financial liabilities measured at amortised cost comprises amount due to
stockbroker, amount due to Manager and other payables.
(iii) Derecognition
A financial asset or part of it is derecognised when, and only when, the
contractual rights to the cash flows from the financial asset expire or the
financial asset is transferred to another party without retaining control or
substantially all risks and rewards of the asset. On derecognition of a financial
asset, the difference between the carrying amount and the sum of the
consideration received (including any new asset obtained less any new liability
assumed) and any cumulative gain or loss that had been recognised in equity is
recognised in profit or loss.
A financial liability or a part of it is derecognised when, and only when, the
obligation specified in the contract is discharged or cancelled or expires. On
derecognition of a financial liability, the difference between the carrying amount
of the financial liability extinguished or transferred to another party and the
consideration paid, including any non-cash assets transferred or liabilities
assumed, is recognised in profit or loss.
(b) Income recognition
(i) Dividend income
Dividend income is recognised in profit or loss on the date that the Fund’s right
to receive payment is established, which in the case of quoted shares is the
entitlement date.
(ii) Income from short term investments
Income from short term investments is recognised as it accrues using the
effective profit method in profit or loss.

47
3. Significant accounting policies (continued)
(b) Income recognition (continued)
(iii) Gain on sale of investments
The realised gain on sale of investments is measured as the difference between
the net disposal proceeds and the carrying amount of the investments. The
carrying amount for determining the realised gain on sale of investments is
based on the weighted average cost method and where applicable adjusted for
accretion for discount and amortisation of premium.
(c) Cash and cash equivalents
Cash and cash equivalents consist of cash at bank and short term placements with
licensed financial institutions which have insignificant risk of changes in fair value
with original maturities of three months or less, and are used by the Fund in the
management of its short term commitments.
Cash and cash equivalents are categorised and measured as financing and
receivables in accordance with Note 3(a)(ii)(b).
(d) Impairment
Financial assets
All financial assets (except for financial assets categorised as fair value through profit
or loss) are assessed at each reporting date whether there is any objective evidence
of impairment as a result of one or more events having an impact on the estimated
future cash flows of the asset. Losses expected as a result of future events, no
matter how likely, are not recognised.
An impairment loss in respect of financing and receivables is recognised in profit or
loss and is measured as the difference between the asset’s carrying amount and the
present value of estimated future cash flows discounted at the asset’s original
effective profit rate. The carrying amount of the asset is reduced through the use of
an allowance account.

48
3. Significant accounting policies (continued)
(e) Income tax
Income tax expense comprises current tax. Current tax is recognised in profit or loss
except to the extent that it relates to items recognised directly in equity or other
comprehensive income.
Current tax is the expected tax payable or receivable on the taxable income for the
year, using tax rates enacted or substantively enacted at the statement of financial
position date, and any adjustment to tax payable in respect of previous years.
(f) Unitholders’ capital
The Fund issues cancellable units, which are cancelled at the unitholder’s option and
are classified as equity. Cancellable units can be put back to the Fund at any time for
cash equal to a proportionate share of the Fund’s net asset value. The outstanding
units is carried at the redemption amount that is payable at the financial position date
if the holder exercises the right to put the unit back to the Fund.
Units are created and cancelled at the unitholder’s option at prices based on the
Fund’s net assets value per unit at the time of creation or cancellation. The Fund’s
net assets value per unit is calculated by dividing the net assets attributable to
unitholders with the total number of outstanding units. In accordance with the
Securities Commission’s Guidelines on Unit Trust Funds in Malaysia, investment
positions are valued based on the last traded market price for the purpose of
determining the net assets value per unit for creations and cancellations.
The units in the Fund are puttable instruments, classified as equity, which entitle the
unitholders to a pro-rata share of the net asset of the Fund. The units are
subordinated and have identical features. There is no contractual obligation to deliver
cash or another financial asset other than the obligation on the Fund to repurchase
the units. The total expected cash flows from the units are based on the change in
the net asset of the Fund.
(g) Distribution
Distribution is at discretion of the Fund. A distribution to the Fund’s unitholders is
accounted for as a deduction from realised reserves. A proposed distribution is
recognised as a liability in the year in which they are declared.
(h) Net Asset Value
The Net Asset Value is calculated after deducting the retained profits allocated for
distribution.

49
3. Significant accounting policies (continued)
(i) Fair value measurement
The Fund adopted MFRS 13, Fair Value Measurement which prescribed that fair
value of an asset or a liability, except for share-based payment and lease
transactions, is determined as the price that would be received to sell an asset or
paid to transfer a liability in an orderly transaction between market participants at the
measurement date. The measurement assumes that the transaction to sell the asset
or transfer the liability takes place either in the principal market or in the absence of a
principal market, in the most advantageous market.
For non-financial asset, the fair value measurement takes into account a market
participant’s ability to generate economic benefits by using the asset in its highest
and best use or by selling it to another market participant that would use the asset in
its highest and best use.
When measuring the fair value of an asset or a liability, the Fund uses observable
market data as far as possible. Fair value are categorised into different levels in a fair
value hierarchy based on the input used in the valuation technique as follows:
Level 1: quoted prices (unadjusted) in active markets for identical assets or
liabilities that the Fund can access at the measurement date.
Level 2: inputs other than quoted prices included within Level 1 that are observable
for the asset or liability, either directly or indirectly.
Level 3: unobservable inputs for the asset or liability.
The Fund recognises transfers between levels of the fair value hierarchy as of the
date of the event or change in circumstances that caused the transfers.

50
4. Quoted securities
As at 31 March 2017
Number of shares
held Cost
RM
Market value
RM
Percentage of value of
funds at 2017
%
Company’s Name Main Market
(i) Consumer products
Kawan Food Bhd. 32,000 135,197 133,760 2.17
(ii) Industrial products
Evergreen Fibreboard Bhd. 356,000 348,490 302,600 4.91 Hartalega Holdings Bhd. 91,500 483,522 453,840 7.36
Hevea Board Bhd. 282,000 427,817 397,620 6.45 Kossan Rubber Industries Bhd. 61,500 411,071 383,145 6.21
SKP Resources Bhd. 227,000 322,559 288,290 4.68 Supermax Corporation Bhd. 169,000 459,645 336,310 5.45
Ta Ann Holdings Bhd. 32,000 120,557 119,360 1.94 Top Glove Corporation Bhd. 97,400 536,222 479,208 7.77
V.S Industry Bhd. 100,000 173,657 173,000 2.81
1,416,400 3,283,540 2,933,373 47.58
(iii) Infrastructure Time Dotcom Bhd. 38,100 326,445 331,470 5.38
(iv) Plantation
Felda Global Ventures
Holdings Bhd. 70,000 146,991 146,300 2.37
(iv) Technology
Globetronics Technology Bhd. 91,100 427,613 470,076 7.62
Inari Amertron Bhd. 258,000 451,819 526,320 8.54
Malaysian Pacific Industries Bhd. 41,200 356,035 473,800 7.68
Unisem (M) Bhd. 39,000 111,695 122,460 1.99
Vivocom Intl Holdings Bhd. 1,788,750 447,086 286,200 4.64
2,218,050 1,794,248 1,878,856 30.47
(vi) Trading and services
E.A. Technique (M) Bhd. 92,000 120,678 61,640 1.00
Total portfolio investment as at 31 March 2017 5,807,099 5,485,399 88.97

51
4. Quoted securities (continued)
As at 31 March 2016
Number
of shares held
Cost RM
Market
value RM
Percentage of value of
funds at
2016 %
Company’s Name
Main Market
(i) Construction IJM Corporation Bhd. 22,000 76,471 77,660 1.02 WCT Holdings Bhd. 75,711 149,243 127,952 1.67
97,711 225,714 205,612 2.69
(ii) Consumer products Kawan Food Bhd. 72,000 259,907 249,840 3.26 QL Resources Bhd. 26,000 112,118 113,100 1.48
98,000 372,025 362,940 4.74
(iii) Industrial products Evergreen Fibreboard Bhd. 140,000 168,012 141,400 1.85
Hartalega Holdings Bhd. 56,500 311,133 274,025 3.58
Jaya Tiasa Holdings Bhd. 122,000 193,883 183,000 2.39
Kossan Rubber Industries Bhd. 61,500 415,561 372,075 4.86 Petronas Chemicals Group
Bhd. 23,500 169,765 157,685 2.06
Petronas Gas Bhd. 9,100 210,117 200,200 2.62
SKP Resources Bhd. 124,000 178,336 159,960 2.09 Top Glove Corporation Bhd. 71,400 399,456 358,428 4.69
WTK Holdings Bhd. 220,000 323,922 292,600 3.83
828,000 2,370,185 2,139,373 27.97

52
4. Quoted securities (continued)
As at 31 March 2016
Number of shares
held
Cost
RM
Market value
RM
Percentage
of value of funds at
2016
% Company’s Name
Main Market (continued) (iv) Infrastructure
DiGi.Com Bhd. 84,100 484,634 415,454 5.43 Time Dotcom Bhd. 32,500 242,564 236,600 3.09
116,600 727,198 652,054 8.52
(v) Plantation
Felda Global Ventures Holdings Bhd. 162,000 274,878 244,620 3.20
(vi) Technology
Globetronics Technology
Bhd. 63,100 374,199 341,371 4.46 Inari Amertron Bhd. 108,750 363,728 350,175 4.58 Malaysian Pacific
Industries Bhd. 50,500 397,770 376,225 4.92 Unisem (M) Bhd. 85,000 191,140 188,700 2.47 Vivocom Intl Holdings
Bhd. 796,000 239,551 214,920 2.81
1,103,350 1,566,388 1,471,391 19.24
(vii) Trading and services
Axiata Group Bhd. 81,957 558,655 482,727 6.31 DKSH Holdings (Malaysia) Bhd. 16,000 64,218 64,000 0.84
E.A. Technique (M) Bhd. 137,000 179,705 163,030 2.13 MY E.G. Services Bhd. 48,000 108,842 102,720 1.34 Petronas Dagangan Bhd. 8,500 215,645 204,850 2.68
Sime Darby Bhd. 33,000 307,171 262,350 3.43
324,457 1,434,236 1,279,677 16.73
Total portfolio investment as at 31 March 2016 6,970,624 6,355,667 83.09

53
5. Cash and cash equivalents
2017 2016
RM RM Short term investments in a licensed financial institution
Commodity Murabahah 324,673 - Term Deposit-i Tawarruq * - 1,300,103 Cash at bank* 107,883 57,041
432,556 1,357,144
* Term Deposit-i Tawarruq and cash at bank is placed with Bank Islam Malaysia Berhad,
the holding company of the Manager.
6. Unitholders’ capital
No. of units RM
At 1 April 2015 63,707,317 16,088,950 Creation of units 632,793 135,810 Cancellation of units (27,861,583) (6,410,526)
As at 31 March 2016 36,478,527 9,814,234 Creation of units 251,487 53,225 Cancellation of units (9,401,034) (1,928,933)
As at 31 March 2017 27,328,980 7,938,526
7. Manager’s fee
The manager’s fee payable to the Manager of the Fund is based on 1.50% (2016: 1.50%)
per annum of the net asset value of the Fund calculated on a daily basis.
8. Trustee’s fee
The trustee’s fee payable to the trustee of the Fund is based on 0.05% (2016: 0.05%) per
annum of the net asset value of the Fund calculated on a daily basis.
54
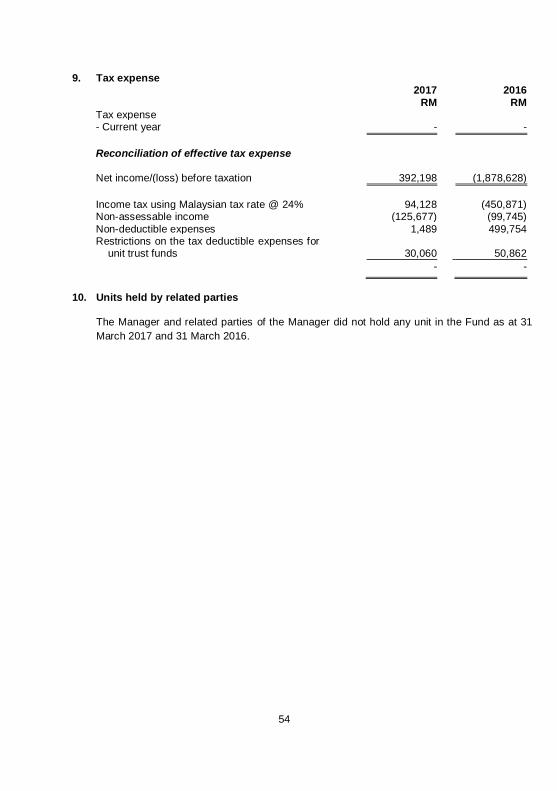
9. Tax expense
2017 2016
RM RM Tax expense - Current year - -
Reconciliation of effective tax expense
Net income/(loss) before taxation 392,198 (1,878,628)
Income tax using Malaysian tax rate @ 24% 94,128 (450,871) Non-assessable income (125,677) (99,745)
Non-deductible expenses 1,489 499,754 Restrictions on the tax deductible expenses for
unit trust funds
30,060
50,862
- -
10. Units held by related parties
The Manager and related parties of the Manager did not hold any unit in the Fund as at 31
March 2017 and 31 March 2016.

55
11. Transactions with related parties
Other than as disclosed in Note 5 of the financial statements, other transactions with related
parties are as follow:
Transactions from Balance as at 2017 2016 2017 2016
RM RM RM RM The Manager BIMB Investment Management
Berhad
- Amount due from Manager - - - 19,164 - Amount due to Manager - - - (49,147)
- Management fee 96,166 166,204 (7,780) (10,417)
Holding company of the Manager
Bank Islam Malaysia Berhad - Income from short term placements (1,543) (14,391)
- 1,300,103
Related company of the Manager
BIMB Securities Sdn. Bhd. - Sales 2,514,605 5,804,044 - - - Purchases 2,517,363 2,650,294 - -
- Brokerage fee 17,957 29,788 - -
The Trustee AmanahRaya Trustees Berhad
- Trustee fee 3,206 5,540 (259) (347)

56
12. Transactions with related and other stockbroking companies
Value of
trade
Percentage of total
trade Brokerage
Percentage of total
brokerage
fee RM % RM % 2017
RHB Investment Bank Berhad 5,350,205 12.52 18,990 12.49 BIMB Securities Sdn. Bhd.* 5,031,967 11.78 17,957 11.81 TA Securities Holdings Berhad 4,408,651 10.32 15,757 10.37
Kenanga Investment Bank Berhad 4,078,538 9.54 14,384 9.46 Hong Leong Investment Bank Berhad 3,854,514 9.02 13,487 8.87
MIDF Amanah Investment Bank Berhad 3,516,566 8.23 12,419 8.17 KAF Seagroatt & Campbell
Securities 2,820,506 6.60 10,201 6.71 Macquarie Capital Securities (Malaysia) Berhad 2,699,871 6.32 9,659 6.35
Maybank Investment Bank Berhad 2,639,183 6.17 9,413 6.19 Public Investment Bank Berhad 2,447,645 5.73 8,763 5.77 Others 5,884,012 13.77 20,990 13.81
42,731,658 100.00 152,020 100.00
2016 BIMB Securities Sdn. Bhd.* 8,454,338 14.44 29,788 14.85
RHB Investment Bank Berhad 8,230,223 14.06 28,686 14.30 TA Securities Holdings Berhad 7,814,134 13.35 27,247 13.58 Public Investment Bank Berhad 5,985,928 10.22 21,058 10.50
Hong Leong Investment Bank Berhad 5,914,533 10.10 20,478 10.21 Maybank Investment Bank Berhad 4,970,349 8.49 18,418 9.18
Kenanga Investment Bank Berhad 3,526,976 6.02 12,512 6.24 CIMB Investment Bank Berhad 3,074,421 5.25 11,993 5.98 MIDF Amanah Investment Bank
Berhad 3,044,729 5.20 10,665 5.32 AmInvestment Bank Berhad 2,958,035 5.05 10,726 5.34 Others 4,579,144 7.82 9,023 4.50
58,552,810 100.00 200,594 100.00
* Transactions with the related party have been entered into in the normal course of business
and have been transacted at arm’s length basis.

57
13. Management Expense Ratio (“MER”)
The management expense ratio for the financial year is 2.05% (2016: 1.99%). Management
expense ratio is the ratio of total fees and recovered expenses of the Fund expressed as a
percentage of the Fund’s average net asset value. It is a total management expenses
expressed as an annual percentage of the Fund’s average net asset value.
14. Portfolio Turnover Ratio (“PTR”)
The portfolio turnover ratio for the financial year is 3.33 times (2016: 2.75 times). It
represents the average of total acquisitions and disposals of the investments in the Fund for
the financial year over the average net asset value of the Fund calculated on a daily basis.
15. Financial instruments
15.1 Categories of financial instruments
The table below provides an analysis of financial instruments categorised as follows:
(a) Financing and receivables (“F&R”); (b) Fair value through profit or loss (“FVTPL”); (c) Financial liabilities measured at amortised cost (“FL”).
Carrying
amount F&R/ (FL)
FVTPL
RM RM RM 2017 Financial assets
Quoted securities 5,485,399 - 5,485,399 Receivables 552,968 552,968 - Cash and cash equivalents 432,556 432,556 -
6,470,923 985,524 5,485,399
Financial liabilities Payables (305,745) (305,745) -
2016 Financial assets Quoted securities 6,355,667 - 6,355,667
Receivables 27,003 27,003 - Cash and cash equivalents 1,357,144 1,357,144 -
7,739,814 1,384,147 6,355,667
Financial liabilities Payables (91,126) (91,126) -
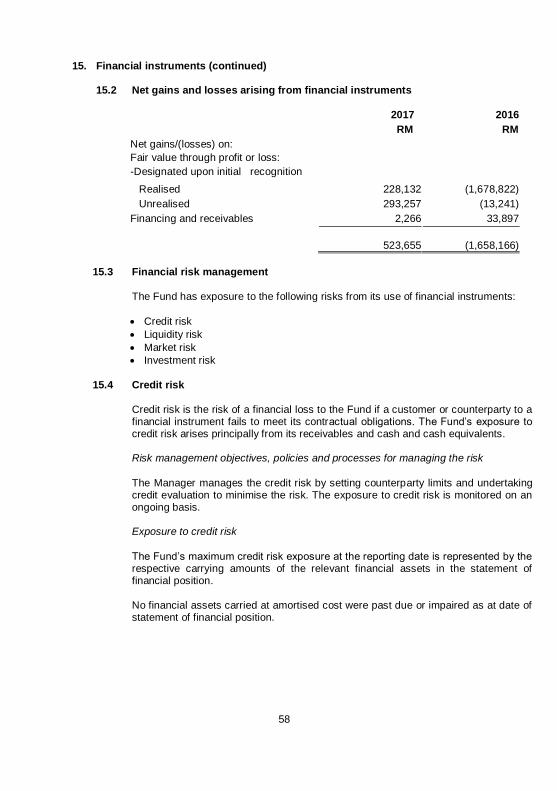
58
15. Financial instruments (continued)
15.2 Net gains and losses arising from financial instruments
2017 2016
RM RM
Net gains/(losses) on:
Fair value through profit or loss:
-Designated upon initial recognition
Realised 228,132 (1,678,822)
Unrealised 293,257 (13,241)
Financing and receivables 2,266 33,897
523,655 (1,658,166)
15.3 Financial risk management
The Fund has exposure to the following risks from its use of financial instruments:
Credit risk
Liquidity risk
Market risk
Investment risk
15.4 Credit risk
Credit risk is the risk of a financial loss to the Fund if a customer or counterparty to a financial instrument fails to meet its contractual obligations. The Fund’s exposure to credit risk arises principally from its receivables and cash and cash equivalents.
Risk management objectives, policies and processes for managing the risk
The Manager manages the credit risk by setting counterparty limits and undertaking credit evaluation to minimise the risk. The exposure to credit risk is monitored on an ongoing basis.
Exposure to credit risk
The Fund’s maximum credit risk exposure at the reporting date is represented by the respective carrying amounts of the relevant financial assets in the statement of financial position.
No financial assets carried at amortised cost were past due or impaired as at date of statement of financial position.

59
15. Financial instruments (continued)
15.5 Liquidity risk
Liquidity risk is the risk that the Fund will not be able to meet its financial obligations
as they fall due. The Fund’s exposure to liquidity risk arises principally from its
various payables which are due within one year.
The Fund maintains sufficient level of liquid assets, after consultation with the
Trustee, to meet anticipated payments and cancellation of units by unitholders.
Liquid assets comprise cash and other instruments, which are capable of being
converted into cash within 7 days.
15.6 Market risk
Market risk is the risk that changes in market prices, such as profit rates and market
prices will affect the Fund’s financial position or cash flows.
Profit rate risk
The profit rate profile of the Fund’s significant profit-bearing financial instruments,
based on carrying amounts as at the end of reporting period was:
Effective
interest rate
per annum
2017
Effective interest rate
per annum
2016 % RM % RM Fixed rate instruments
Term Deposit-i Tawarruq - - 3.00 1,300,103 Commodity Murabahah 3.15 324,673 - -
Fair value sensitivity analysis for fixed rate instruments
The Fund accounts for the deposits with licensed financial institutions at amortised
cost. Therefore a change in profit rates at the end of the reporting year would not
affect profit or loss. The deposits with licensed financial institutions will mature within
1 month from the date of financial position.
Market price risk
Equity price risk arises from the Fund’s investments in quoted securities.
Risk management objectives, policies and processes for managing the risk
The Fund is restricted to invest in securities issued by any issuer of not more than
10% its net asset value. Under such restriction, the exposure risk to the securities of
any issuer is mitigated.

60
15. Financial instruments (continued)
15.6 Market risk (continued)
Market price risk (continued)
Equity price risk sensitivity analysis
This analysis assumes that all other variables remain constant and the Fund’s equity
investments are positively correlated to each other. A 5% strengthening in the equity
prices at the end of the reporting year would have increased the net asset value and
unitholders’ fund by RM274,270 (2016: RM317,783). A 5% weakening in equity
prices would have had equal but opposite effect on the net asset value and
unitholders’ fund respectively.
15.7 Investment risk
Investments are bound by Deed and prospectus that govern the maximum securities
holdings and maximum liquid assets holdings.
Investment risks for equity funds consist primarily of market risk, specific stock risk
and liquidity risk. The mechanism employed to control investment risk for equity
funds is by placing acceptable stock limits.
Risk management objectives, policies and processes for managing the risk
The Manager has written policies and guidelines on risk management, which set out
the overall investment risks strategies and general risk management philosophies.
These processes monitor, measure and control risks associated with the business.
Matters relating to investment risks in respect of Funds portfolio are discussed during
the Investment Committee meetings of the Manager held at least 6 (2016: 6) times a
year.
15.8 Fair value of financial instruments
The carrying amounts of cash and cash equivalents, short term receivables and
payables approximate fair values due to the relatively short term nature of these
financial instruments.

61
15. Financial instruments (continued)
15.8 Fair value of financial instruments (continued)
The table below analyses financial instruments carried at fair value and their carrying
amounts shown in the statement of financial position.
Fair value of financial instruments carried at
fair value
Carrying
Level 1 Level 2 Level 3 Total amount RM RM RM RM RM 2017
Financial assets Quoted securities 5,485,399 - - 5,485,399 5,485,399
2016 Financial assets Quoted securities 6,355,667 - - 6,355,667 6,355,667
Policy on transfer between levels
The fair value of an asset to be transferred between levels is determined as of the
date of the event or change in circumstances that caused the transfer.
Level 1 fair value
Level 1 fair value is derived from quoted price (unadjusted) in active markets for
identical financial assets or liabilities that the entity can access at the measurement
date.
Quoted equities
Quoted equities in Malaysia are valued at closing market prices quoted on the Bursa
Malaysia at the date of the statement of financial position, in accordance with the
Deed. Unrealised gain or loss is taken to statement of profit or loss and other
comprehensive income.
Level 2 fair value
Level 2 fair value is estimated using inputs other than quoted prices included within
Level 1 that are observable for the financial assets or liabilities, either directly or
indirectly.
Transfers between Level 1 and Level 2 fair values
There has been no transfer between Level 1 and 2 fair values during the financial
year (2016: no transfer in either direction).

62
15. Financial instruments (continued)
15.8 Fair value of financial instruments (continued)
Level 3 fair value
Level 3 fair value is estimated using unobservable inputs for the financial assets and
liabilities.
16. Capital management
The Fund’s capital is represented by the unitholders’ fund in the statement of financial
position. The Manager of the Fund monitors the adequacy of capital on an ongoing basis.
There is no external capital requirement imposed on the Fund.

63
7.0 Corporate Directory
Manager
BIMB Investment Management Berhad
Registered Office Level 32, Menara Bank Islam, No. 22, Jalan Perak 50450, Kuala Lumpur
Business Office Level 19, Menara Bank Islam, No. 22, Jalan Perak
50450, Kuala Lumpur
Board of Directors
Khairul Kamarudin (Chairman - Non-Executive Non
Independent Director) Dato’ Ghazali Awang (Non-Executive Independent Director) Datuk Noripah Kamso (Non-Executive Independent Director)
Dr. Mohd Hatta Dagap (Non-Executive Independent Director) Malkiat Singh @ Malkit Singh Maan (Non-Executive Non Independent Director)
Najmuddin Mohd Lutfi (Chief Executive Officer)
Shariah Committee
Ustaz Dr. Ahmad Shahbari @ Sobri Salamon Ustaz Dr. Yusof Ramli Ustazah Dr. Asmak Ab. Rahman
Investment Committee
Khairul Muzamel Perera Abdullah (Chairman - Non Independent Member) Datuk Noripah Kamso (Independent Member) Darawati Hussain (Independent Member)
Audit Committee
Dato’ Ghazali Awang (Chairman - Independent Member)
Dr. Mohd Hatta Dagap (Independent Member) Malkiat Singh @ Malkit Singh Maan (Non-Executive Non Independent Member)
Company Secretaries
Aidil Haznul Zulkifli (MACS 01638)
Level 32, Menara Bank Islam, No. 22 Jalan Perak, 50450 Kuala Lumpur.
Norhidayati Mohamat Salim (MIA 27364) Level 32, Menara Bank Islam, No. 22, Jalan Perak, 50450 Kuala Lumpur.
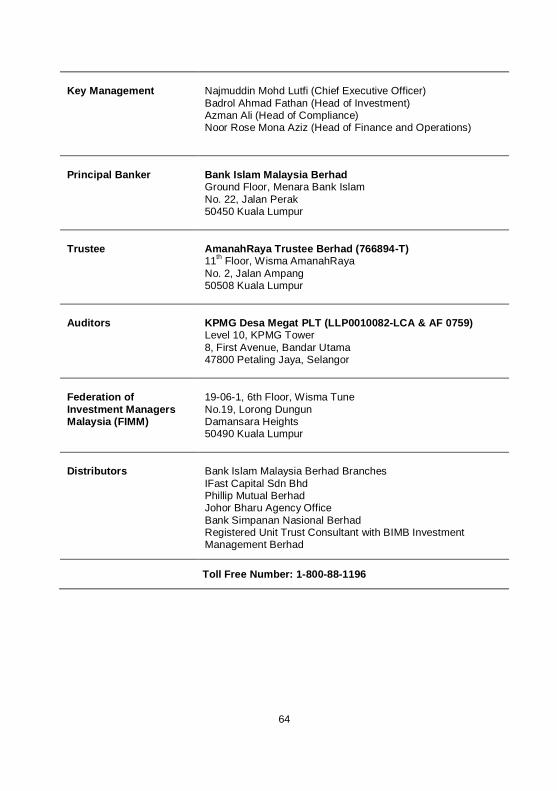
64
Key Management
Najmuddin Mohd Lutfi (Chief Executive Officer)
Badrol Ahmad Fathan (Head of Investment) Azman Ali (Head of Compliance) Noor Rose Mona Aziz (Head of Finance and Operations)
Principal Banker
Bank Islam Malaysia Berhad Ground Floor, Menara Bank Islam
No. 22, Jalan Perak 50450 Kuala Lumpur
Trustee
AmanahRaya Trustee Berhad (766894-T) 11
th Floor, Wisma AmanahRaya
No. 2, Jalan Ampang 50508 Kuala Lumpur
Auditors
KPMG Desa Megat PLT (LLP0010082-LCA & AF 0759) Level 10, KPMG Tower
8, First Avenue, Bandar Utama 47800 Petaling Jaya, Selangor
Federation of
Investment Managers Malaysia (FIMM)
19-06-1, 6th Floor, Wisma Tune
No.19, Lorong Dungun Damansara Heights 50490 Kuala Lumpur
Distributors
Bank Islam Malaysia Berhad Branches
IFast Capital Sdn Bhd Phillip Mutual Berhad Johor Bharu Agency Office
Bank Simpanan Nasional Berhad Registered Unit Trust Consultant with BIMB Investment Management Berhad
Toll Free Number: 1-800-88-1196


![Three months ended December 31, Year ended December 31, … · 2016-01-27 · Three months ended December 31, Year ended December 31, 2015 2014 Change ~¦u]oo]}v 2015 2014 Change](https://static.fdocuments.us/doc/165x107/5f05bacd7e708231d41469d5/three-months-ended-december-31-year-ended-december-31-2016-01-27-three-months.jpg)