annual report - Customer Service · 2019-06-26 · Mine Subsidence Board Annual Report 2017-18 We...
56
annual report 2017/2018 Subsidence Advisory NSW
Transcript of annual report - Customer Service · 2019-06-26 · Mine Subsidence Board Annual Report 2017-18 We...
annual report2017/2018
Subsidence Advisory NSW
2
The Hon Victor Dominello, MP Minister for Finance, Services and Property GPO Box 5341 SYDNEY NSW 2001
Dear Minister
Mine Subsidence Board Annual Report 2017-18
We are pleased to submit the annual report for the Mine Subsidence Board, trading as Subsidence Advisory NSW, for the year ended 30 June 2018, for presentation to Parliament.
This report has been prepared in accordance with the Annual Reports (Statutory Bodies) Act 1984, the Public Finance and Audit Act 1983 and regulations under those Acts.
Yours sincerely
Laura Christie Chairperson, Mine Subsidence Board John Brannon Mine Subsidence Board member

3
Page intentionally left blank
4
Contents
Contents 4
Director’s message 6
1. About Subsidence Advisory NSW 7
What we do 7 Access 7
2. Management and structure 8
Structure of the Board 8 Board meetings 8 Board members and attendance 8 Senior officers 9 Organisation chart 9
3. Highlights and achievements 10
4. Management and activities 11
Mine subsidence compensation system reforms 11 Online portal and applications management system 12 Prequalification scheme for independent claim assessments 12 Newcastle Mines Grouting Fund investigation program 13 Development regulation 13 New mine subsidence surface development guidelines 14 Merit assessment policies established 15 Certificates of compliance 15 Compensation 16
Elimination of danger reports 17
5. Corporate performance 18
Performance indicators 18 Transaction volumes 19
6. Appendices 20
Research and development 20 Risk management and insurance activities 20 Internal audit and risk management policy attestation 20 Digital information security policy attestation 22 Legal Change 22 Land disposal 22 Human Resources 22 Workforce Diversity 23 Payment of Accounts 23
5
Time for Payment of Accounts 23 Investment Performance 24 Consultants 24 Government Information (Public Access) Act 2009 24 Privacy and Personal Information Protection Act (PPIPA) 25 Public Interest Disclosures 25 Nil or NA to report 25 Events after the reporting period 25
7. Audited Financial Statements 26
6
Director’s message
Subsidence Advisory NSW (SA NSW) delivered wholesale reforms to the mine subsidence compensation
system during the year. The Coal Mine Subsidence Compensation Act 2017 took effect on 1 January
2018 following two years of extensive operational reform.
The new legislative framework provides a fairer framework for compensating the impacts of mine
subsidence and better positions SA NSW to support communities living in mine subsidence areas across
NSW.
To ensure readiness for the new legislative framework, SA NSW made a range of operational reforms
during the year including:
▪ The launch of a new online portal for end-to-end management of development applications and
compensation claims for mine subsidence damage
▪ Establishing a new prequalification scheme for independent mine subsidence claims assessments
▪ Roll out of new mine subsidence development guidelines to simplify and streamline assessments
for low risk building proposals in mine subsidence districts
▪ Publication of SA NSW’s surface development guidelines on the NSW Planning Portal, making it
easier for property owners to find out the development guideline that applies
▪ Developing two policies for the assessment of large and complex development and subdivision
applications, providing a transparent and consistent assessment methodology
▪ Removing approximately 50,000 properties from mine subsidence districts to better align
development controls with subsidence risks and remove unnecessary red tape.
I would like to thank Brendan Killen for his time leading the agency during a year of extensive reform. I am
excited to build on these reforms and continue improving our services to deliver the best outcomes for
communities in mine subsidence areas.
Joseph D'Ermilio Director, SA NSW
7
1. About Subsidence Advisory NSW
What we do
SA NSW is an agency of the NSW Department of Finance, Services & Innovation (DFSI).
SA NSW administers the Coal Mine Subsidence Compensation Act 2017 to support communities living in
areas of NSW where there is the possibility of mine subsidence.
We keep communities safe, manage compensation claims where homes and other improvements are
damaged by subsidence following extraction of coal, and help mitigate the risk of mine subsidence
damage by regulating development in mine subsidence districts.
Access
Two public offices located in Newcastle and Picton service surrounding areas where there is active or
non-active mining close to development. Both offices are open to the public between 8:30am and 4:30pm,
Monday to Friday.
SA NSW office locations
Newcastle Address: 117 Bull Street
Newcastle West NSW 2302
Telephone: (02) 4908 4300
Picton Address: 99 Menangle Street
Picton NSW 2571
Telephone: (02) 4677 6500
Website:
Email:
www.subsidenceadvisory.nsw.gov.au
SA NSW also provides a 24 hour, free call service for emergency mine subsidence matters. Emergency
telephone: 1800 248 083
8
2. Management and structure
Structure of the Board
SA NSW is governed and overseen by the Mine Subsidence Board (the Board) which consists of six
members:
▪ the Chairperson who is the Secretary of DFSI or a nominee of the Secretary
▪ a person nominated with appropriate expertise in coal mine operations
▪ a Colliery Proprietors’ nominee
▪ a representative of Local Government
▪ a representative of owners of improvements (the community)
▪ an officer of NSW Public Works Advisory who is eligible to be a corporate member of The Institution
of Engineers, Australia.
In the exercise of its duties and functions, the Board is subject to the provisions of the NSW Government
Boards and Committees Guidelines. Certain duties and functions are delegated to SA NSW employees
through the Coal Mine Subsidence Compensation Act 2017.
The oversight of the Mine Subsidence Board will come to an end on 31 December 2018 when it is
disbanded following 12 month transitional arrangements under the Coal Mine Subsidence Compensation
Act 2017.
Board meetings
The Board met formally on six occasions during the year with all meetings held in Newcastle. The
A/Director, Commercial Manager and Executive Assistant also attended the meetings.
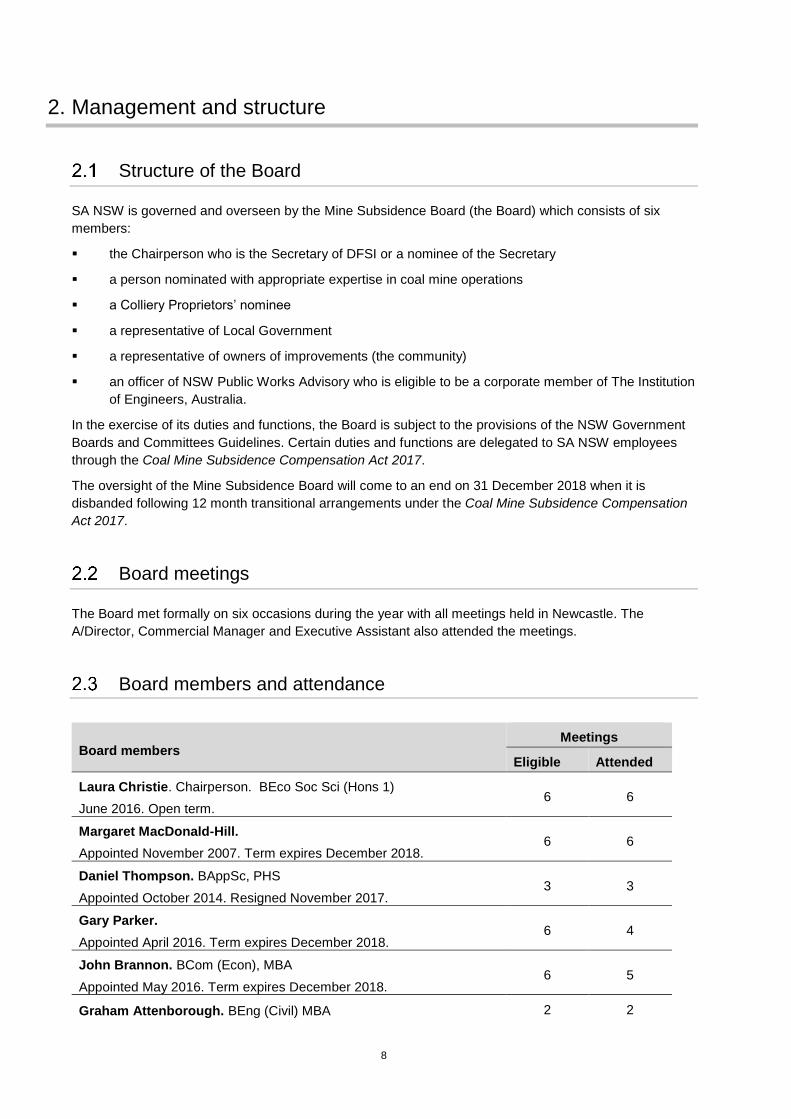
Board members and attendance
Board members Meetings
Eligible Attended
Laura Christie. Chairperson. BEco Soc Sci (Hons 1)
June 2016. Open term. 6 6
Margaret MacDonald-Hill.
Appointed November 2007. Term expires December 2018. 6 6
Daniel Thompson. BAppSc, PHS
Appointed October 2014. Resigned November 2017. 3 3
Gary Parker.
Appointed April 2016. Term expires December 2018. 6 4
John Brannon. BCom (Econ), MBA
Appointed May 2016. Term expires December 2018. 6 5
Graham Attenborough. BEng (Civil) MBA 2 2
9
Changes to Board membership during the year
Mr Graham Attenborough, Director, Water Solutions, was appointed to the Board as NSW Public Works
Advisory representative in March 2018.
Mr Daniel Thompson resigned from the Board in November 2017. Due to the planned disbandment of the
Board on 31 December 2018, the position was not filled and was vacant at 30 June 2018. The Board
invited Ms Melanie Dagg, Cessnock City Councillor to attend the Board meetings and provide comment
on matters from a local government perspective. Ms Dagg attended two meetings during the year.
Senior officers
Name Role
Brendan Killen A/Director
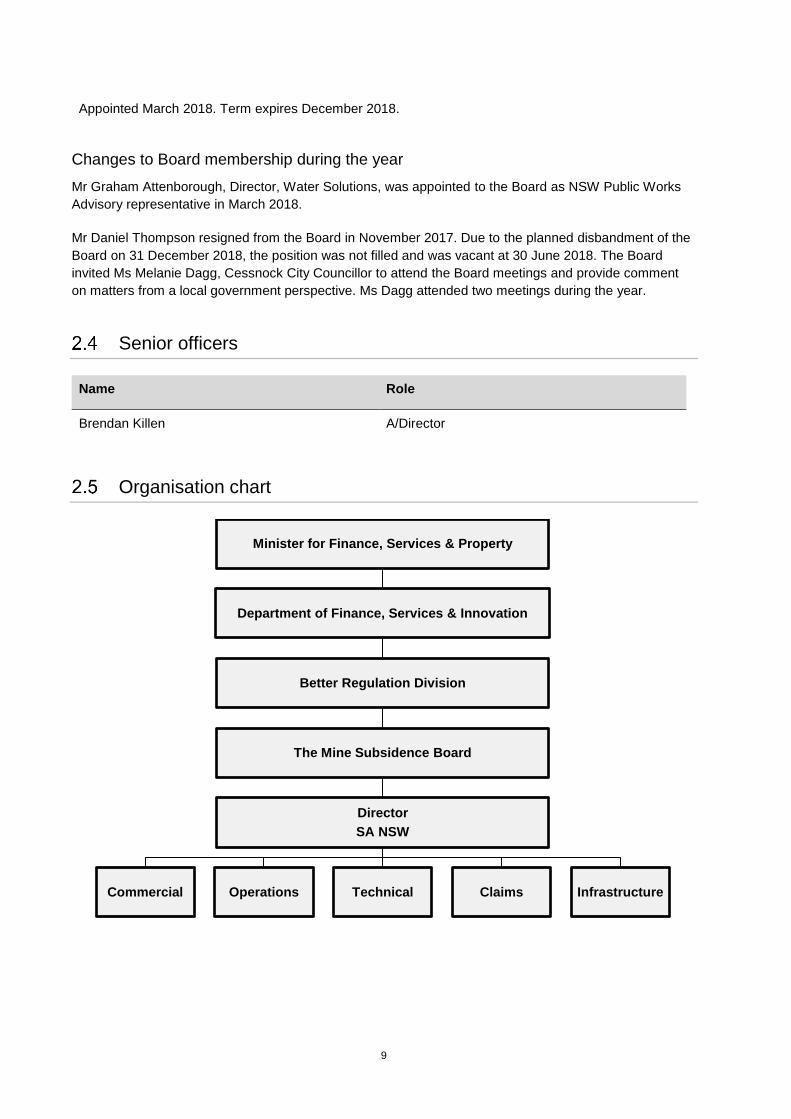
Organisation chart
Minister for Finance, Services & Property
Department of Finance, Services & Innovation
Better Regulation Division
The Mine Subsidence Board
Director
SA NSW
Commercial Operations Technical Claims Infrastructure
Appointed March 2018. Term expires December 2018.
10
3. Highlights and achievements
Mine subsidence compensation system reforms
The Coal Mine Subsidence Compensation Act 2017 took effect on 1 January 2018, bringing about
wholesale changes to the mine subsidence compensation system. The changes provide a fairer
compensation framework by making coal mine operators financially responsible for subsidence damage
arising from their operations. SA NSW continues to provide compensation for damage from historical
mines and manage all claims, providing dedicated support to property owners throughout the process.
New online portal for end-to-end application management
SA NSW launched an online portal for end-to-end management of development applications and
compensation claims for mine subsidence damage during the year. The portal facilitates quicker
assessments and provides applicants with improved oversight of their claim or development application
throughout the process through its integration with SA NSW’s internal operating systems. The portal also
facilitates mine operator involvement at key points of the claims process – a key reform stemming from
the review of the mine subsidence compensation system in 2016.
New mine subsidence development guidelines introduced
New mine subsidence development guidelines took effect in January 2018 with one of eight guidelines
applied to each property in a mine subsidence district. The guidelines specify SA NSW’s conditions for
standard residential development on a property based on applicable subsidence risks. SA NSW also
published new interactive guideline maps on the NSW Planning Portal during the year, making it easier for
property owners to find the development guideline that applies to their property.
Merit-based development and subdivision assessment policies
SA NSW established two policies for the assessment of large and complex development and subdivision
applications in mine subsidence districts during the year. The policies create transparent and consistent
assessment methodology for large and complex development applications and increase certainty around
requirements for applications that do not comply with SA NSW’s development guidelines.
Prequalification scheme for independent claim assessments
SA NSW launched a prequalification scheme for suppliers interested in participating in mine subsidence
claims assessments during the year. The scheme streamlines the independent claim assessment process
by replacing lengthy and expensive tender processes with simplified terms to help small to medium
enterprises increase opportunities and reduce costs of doing business with government.
11
4. Management and activities
Mine subsidence compensation system reforms
The Coal Mine Subsidence Compensation Act 2017 took effect on 1 January 2018, repealing the Mine
Subsidence Compensation Act 1961. The new legislation makes significant improvements to the way
subsidence damage is compensated to make the process fairer, faster and more community responsive.
The Coal Mine Subsidence Compensation Act 2017 makes mine operators directly accountable for
subsidence damage caused by their mining operations. The industry funded Mine Subsidence
Compensation Fund (the Fund) has been returned to its intended purpose – dealing with subsidence
impacts from historical mining. The levy on coal mine operators was significantly reduced during the year
as the fund will no longer be drawn upon to subsidise the cost of damage caused by active mining
operators.
SA NSW continues to manage all claims for compensation, irrespective of whether damage is caused by
subsidence from an active or non-active mine. SA NSW’s case advisory function, established in 2016/17
to address a backlog of claims, has been strengthened to provide greater support and advocacy to
property owners. All claims are managed by a dedicated SA NSW case advisor who guides and supports
property owners throughout the claim process. The case advisors oversee the claim management
process, coordinating assessment of damage and facilitating mine operator involvement at key points of
the process where damage is the result of an active mining operation.
New approved procedures have been developed, clearly setting out the process for claiming
compensation for mine subsidence damage. The approved procedures provide property owners with
assurance about how claims are assessed and applicable timeframes. Mine operators are required to
comply with the approved procedures, which have statutory weight under the new legislative framework,
ensuring property owners are treated fairly and consistently irrespective of whether their claim relates to
subsidence from an active or non-active mine.
SA NSW has established a panel of independent technical assessors to assess claims in active mining
areas or where specialist technical expertise is required. SA NSW and mine operators must determine
claims and provide compensation in accordance with the findings of these independent assessments. A
new robust dispute resolution process gives property owners the option of an independent review from the
Secretary of DFSI if they disagree with the outcome of their claim, without having to resort to expensive
litigation.
The changes follow a review of the Mine Subsidence Compensation Act 1961 in 2016 and over 12
months of extensive consultation with community and industry stakeholders. The review found that the
1961 Act was no longer fit for purpose with over 90% of claim costs relating to damage from a small
number of active longwall mining operations in 2016. This meant that the coal mining industry was
effectively subsidising the cost of mine subsidence generated by a handful of operators, with
compensation for subsidence damage funded through an industry levy paid into the Fund.
The new legislation includes five year transitional arrangements to support the three mine operators
deemed worse off under the reforms. For these mine operators, future compensation costs will outweigh
any savings the operations will realise from the reduced levy.
The Mine Subsidence Board is being disbanded on 31 December 2018 following a 12-month transitional
period. This is largely due to the changes in the operating framework and liability for claims, as well as the
reduced quantum of funds SA NSW will be required to manage under the new legislation. SA NSW will
continue to report through to DFSI as part of the Better Regulation Division.
12
Online portal and applications management system
In January 2018, SA NSW launched a new applications management system, including an online portal,
to support reforms to the mine subsidence compensation framework. The system facilitates a quicker,
improved application process for claims and development applications.
Members of the public can log in to the portal at any time to lodge a claim or development application with
SA NSW. After lodging a claim or development proposal with SA NSW, the applicant can return to the
portal to check the status and view or upload associated documents.
The portal digitises SA NSW’s transactions and streamlines business processes through its integration
with SA NSW’s internal operating system. Applications lodged through the portal are received in SA
NSW’s new customer relationship management system where automated workflows allocate applications
to the relevant business area. The system also includes new customisable dashboard reports to provide
management with real time oversight of performance across all service areas.
The new system represents a major milestone in the agency’s reform process initiated following the
review of the Mine Subsidence Compensation Act 1961 in 2016.
Prequalification scheme for independent claim assessments
The SA NSW Independent Assessment Prequalification Scheme was launched in October 2017. The
scheme provides streamlined opportunities for suppliers to carry out independent assessments as part of
the mine subsidence claims process.
The scheme was launched ahead of legislative reforms on 1 January 2018 which saw mine operators
made financially accountable for subsidence damage caused by their operations. To ensure property
owners are treated fairly under the new system, mine operators are required to provide compensation in
accordance with the findings of independent assessments.
SA NSW engages independent experts for claims assessments through the scheme, providing easy
access to a pool of diverse, quality service providers with relevant expertise. New suppliers can be added
regularly, giving SA NSW continual access to new service providers and emerging technologies.
The scheme removes often lengthy and expensive tender processes and replaces them with a single,
simplified online registration. This facilitates timely and efficient assessment of compensation claims,
benefiting both claimants and suppliers. The scheme offers a range of other benefits including:
▪ Promotes increased competition to enable the NSW Government to get value for money services
▪ New opportunities for suppliers to deliver services to communities in areas impacted by mine
subsidence
▪ Significant reduction in red tape and cost of doing business with government through simplified
contract terms
▪ Streamlined categories enabling suppliers to align their offerings and maximise opportunities to
provide services to SA NSW
▪ Opportunities for private sector to contribute to corporate social responsibility
▪ Suppliers can be engaged by other NSW Government agencies.
At 30 June 2018, SA NSW had approved 35 suppliers on the scheme. Suppliers were spread across eight
different categories for different types of claim assessments including building inspectors, civil engineers,
geotechnical engineers, property valuers, and quantity surveyors. There were 66 separate engagements
through the scheme from 1 January 2018 to 30 June 2018.
13
The scheme builds on SA NSW’s overhaul of procurement processes in 2016/17, to further safeguard the
agency from potential corruption risks.
Newcastle Mines Grouting Fund investigation program
SA NSW led the Newcastle Mines Grouting Fund (NMGF) investigation program during the year,
overseeing works to better understand the condition of historical mine workings beneath Newcastle CBD
and explore cost effective and sustainable remediation strategies. The investigation program forms part of
the $17 million NMGF, established by the NSW Government in 2015 to address legacy subsidence issues
impacting property development in Newcastle CBD.
Engineering consultants, WSP Parsons Brinckerhoff (WSP), were engaged to complete the first phase of
the investigation program. WSP analysed all existing data on mine workings beneath the Newcastle CBD
to produce 3D modelling of the mine workings. The modelling provides a holistic view of the subsidence
risks in the CBD. Existing borehole data indicates mine record tracings for the area are reasonably
accurate, increasing certainty around likely grouting requirements for specific CBD sites.
The investigation findings have resulted in less conservative requirements for grouting plans in certain
areas of the CBD and more effective use of NMGF funding. This benefits the existing NMGF model where
funding is provided to grout sites in the CBD through an on-application basis. The funding model has been
successful in providing increased certainty for prospective developments in the CBD and assisting
developers to secure the required finances to progress projects.
Development regulation
SA NSW regulates development within mine subsidence districts to help protect homes and other
structures from potential subsidence damage. Under section 21 of the Coal Mine Subsidence
Compensation Act 2017, persons intending on building or subdividing within a district must apply to SA
NSW for approval. Applications for building and subdivision proposals within districts must be submitted to
SA NSW and approved before work can commence. SA NSW has the authority to enforce conditions as
part of any development approval.
Overview of building applications received during 2017-18
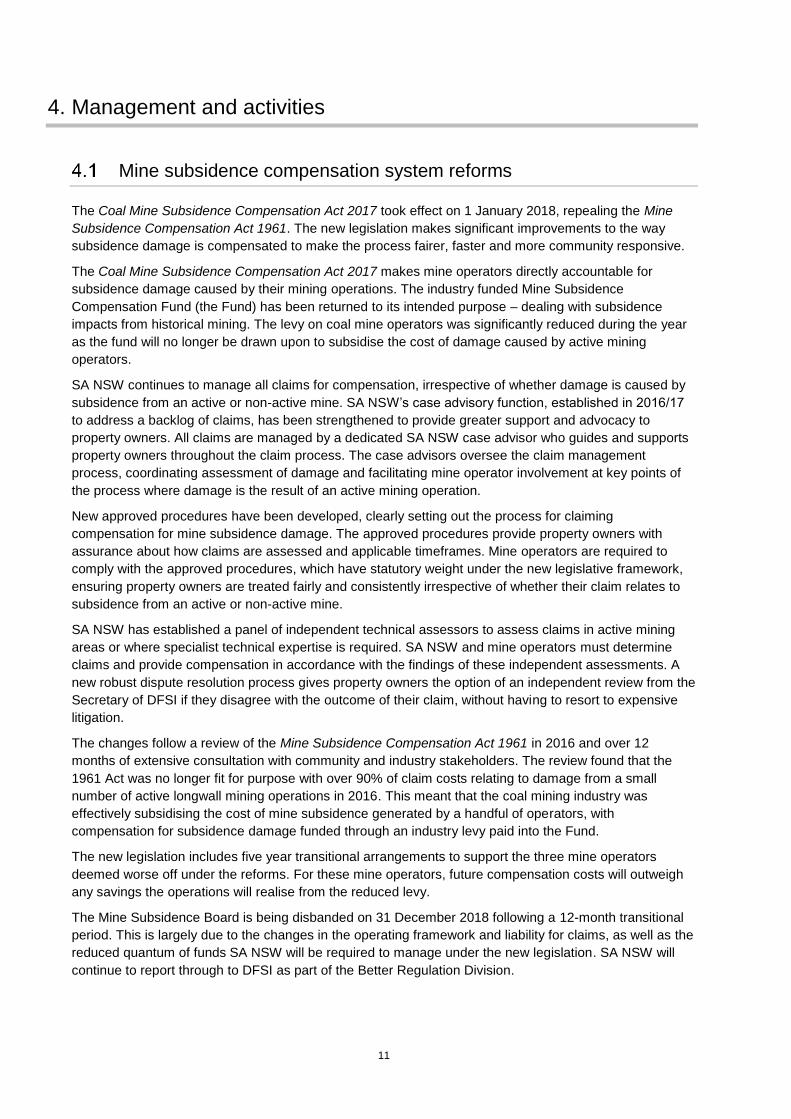
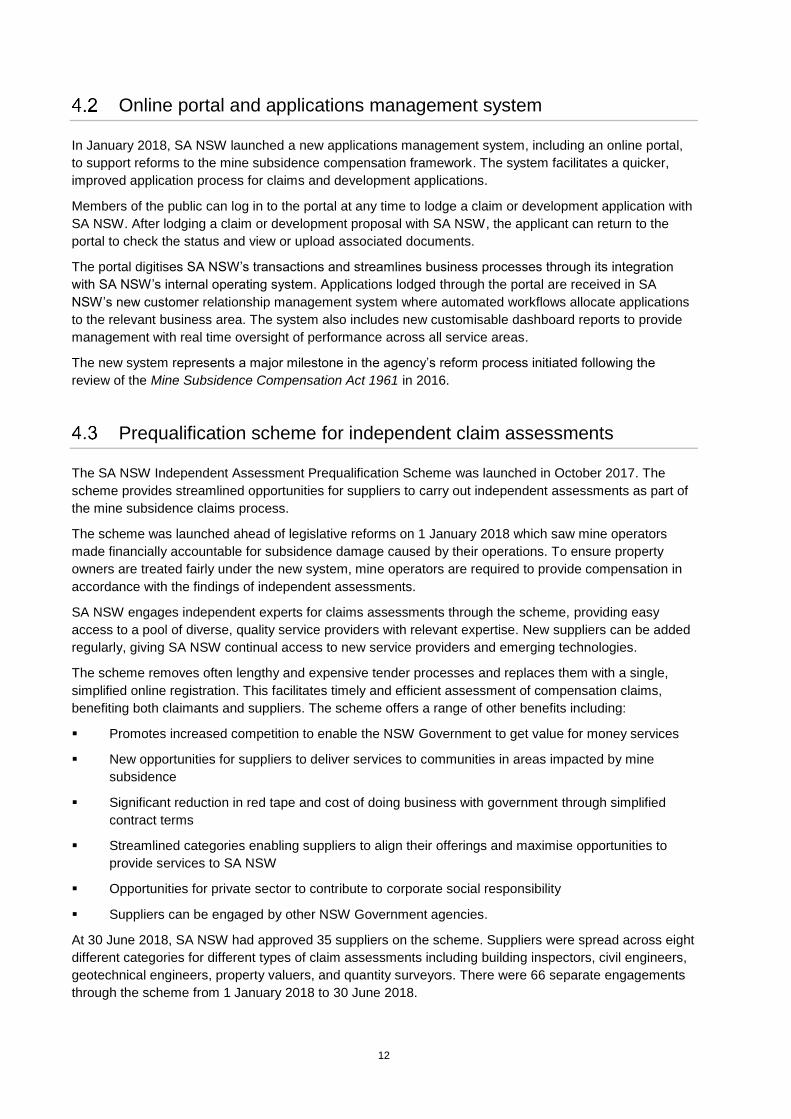
SA NSW processed 4,088 development applications and 455 subdivision applications during the year, a
decrease of approximately 29% and 21% respectively from 2016-17. This decrease follows changes to
mine subsidence districts on 1 July 2017 which saw an approximate 25% reduction in the total number of
properties within districts. Refer to Figures 1 and 2.
Figure 1 Number of building applications received over time
14
Figure 2 Number of subdivision applications received over time
New mine subsidence surface development guidelines
New mine subsidence development guidelines took effect on 1 January 2018 following the first
comprehensive review in over 15 years. The guidelines have been updated to reflect the most up to date
building practices and ensure 95% of guideline compliant properties would remain safe, serviceable and
repairable should mine subsidence occur. The new guidelines also facilitate a simplified approval process
for low risk developments in mine subsidence districts.
The number of guidelines has been reduced from 19 to eight, removing unnecessary complexities and
duplication and effectively mitigating the risk of subsidence damage without imposing unreasonable costs
and restrictions on the landowner.
The guidelines set out SA NSW’s requirements for proposed development on a property depending on the
subsidence risks. Due to the differing subsidence risks arising from active and non-active mining, there
are different guidelines for properties in these areas. SA NSW applied one of the eight new surface
development guidelines listed below to each property in a mine subsidence district based on an
assessment of the type of mining beneath the property and the risk of subsidence.
Guideline 1. Non-active mine workings - risk of pothole subsidence
Guideline 2. Non-active mine workings - possible subsidence risk
Guideline 3. Non-active mine workings - remote subsidence risk
Guideline 4. Active mining areas - high predicted subsidence impact
Guideline 5. Active mining areas - moderate predicted subsidence impact
Guideline 6. Active mining areas - minimal predicted subsidence impact
Guideline 7. On application
Guideline 8. No restrictions
SA NSW developed the guidelines in consultation with an expert reference group comprising
representatives from government, the property and mining industries, and academics specialising in
structural, geotechnical or mining engineering. The group was established following a review of the Mine
Subsidence Compensation Act 1961 which identified opportunities to streamline development approval
processes in mine subsidence districts.
Approximately 95% of building applications received by SA NSW comply with the relevant development
guideline. The review focused on ensuring the guidelines could be quickly and easily administered without
requiring engineering expertise. This facilitates a streamlined assessment process as applications that
comply with the guideline are fast-tracked and processed within five working days. Applications that do
15
not comply with the applicable guideline for the property must be assessed by SA NSW risk engineers on
merit and SA NSW may impose conditions to reduce the risk of damage should subsidence occur.
To further streamline assessment of low risk development, SA NSW issued an exemption order for low
risk developments during the year. The exemption order, issued under section 24 of the Coal Mine
Subsidence Compensation Act 2017, allows certain development proposals that comply with SA NSW’s
guidelines to be certified as compliant by the relevant local council or accredited certifiers without a
separate assessment by SA NSW.
SA NSW has published the development guidelines on the NSW Planning Portal allowing property
owners, developers and certifiers to easily identify the guideline assigned to a property online. Previously,
this information was only available upon application to SA NSW.
Merit assessment policies established
SA NSW established two policies for the assessment of subdivision applications and complex
development proposals that sit outside SA NSW’s standard guidelines during the year. These applications
are assessed by SA NSW risk engineers on merit and are generally approved with conditions to reduce
the risk of mine subsidence damage.
SA NSW development conditions vary depending on the size and complexity of the proposal and mine
subsidence risks at the site. The conditions can include requirements related to the nature and class of
any development, the size, height and location of new structures, and the use of certain building materials
and construction methods. For large and complex proposals, SA NSW may require applicants to remove
the risk of subsidence or confirm the stability of the mine workings through geotechnical investigations.
The new policies formalise the assessment framework used by SA NSW when assessing large and
complex developments, ensuring consistency and reducing the timeframe taken to assess. The policies
also provide transparency and a greater level of certainty to prospective developers and engineering
professionals on the factors SA NSW considers when assessing applications and the likely conditions for
different types of development on a property prior to formal applications being lodged. The Subdivision
policy and Merit-based assessment policy are public documents available online via SA NSW’s website.
SA NSW developed the policies in consultation with an expert reference group which included
government technical experts, technical consultants, representatives from the development and mining
industries, and academics. The group was convened following the review of the Mine Subsidence
Compensation Act 1961 and feedback the development industry about the need for more transparent
information around SA NSW’s assessment processes.
Certificates of compliance
The review of the Mine Subsidence Compensation Act 1961 revealed that the process for certifying
compliance under Section 15B was inadequate. The Coal Mine Subsidence Compensation Act 2017 does
not contain a comparable provision. However, section 15B certificates have been continued for a
transitional period under Schedule 1 of the Coal Mine Subsidence Compensation Act 2017. The
transitional period will continue until June 2019.
A certificate issued under section 15B of the Mine Subsidence Compensation Act 1961 provides
assurance that the improvements or subdivision on a property comply with SA NSW surface development
guidelines and are therefore eligible for compensation in the event of mine subsidence damage to the
property. Certificates issued under section 15C disclose whether or not a claim for mine subsidence
damage has previously been approved on a property.
16
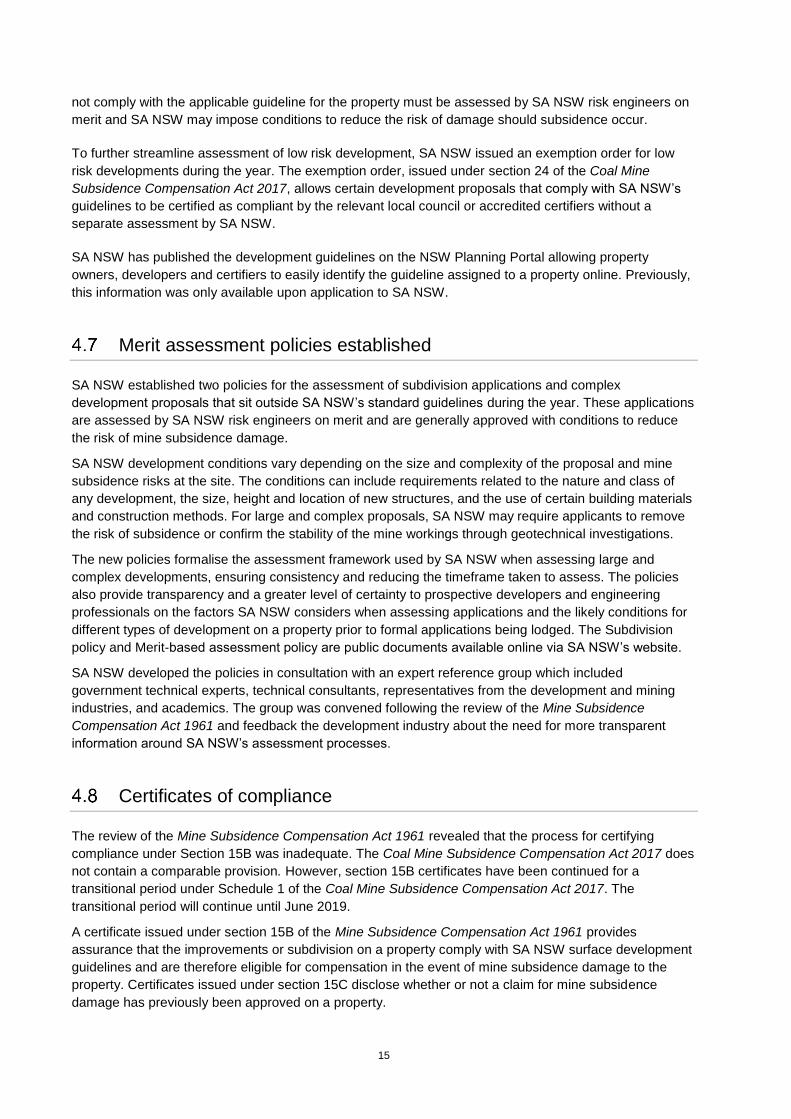
Overview of certificate applications during 2017-18
SA NSW received a total of 8,565 certificate applications during the year. Applications fell by 2,172, a
decrease of 20% on the previous year. The decrease in certificates received correlates with an
approximate 25% reduction in the number of properties within mine subsidence districts on 1 July 2017.
Refer to Figure 3.
Figure 3 Number of certificate applications received over time
Compensation
SA NSW provides compensation to the owners of developments, such as homes, that are damaged by
mine subsidence following the extraction of coal or shale. Properties are eligible for compensation
provided that, if located within a district, the improvements have been constructed in accordance with SA
NSW’s approval, or existed prior to proclamation of the district. The owners of buildings and other
structures that are damaged by mine subsidence can lodge claims for compensation with SA NSW. SA
NSW then assesses the damage to determine appropriate compensation.
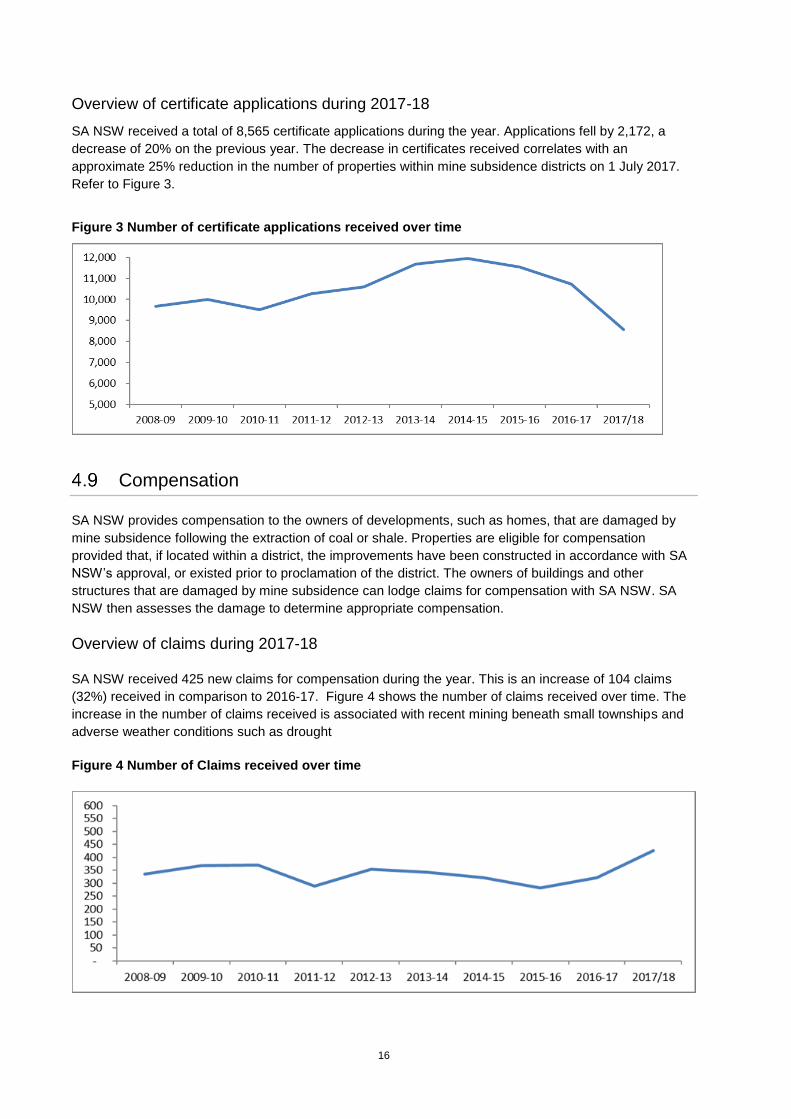
Overview of claims during 2017-18
SA NSW received 425 new claims for compensation during the year. This is an increase of 104 claims
(32%) received in comparison to 2016-17. Figure 4 shows the number of claims received over time. The
increase in the number of claims received is associated with recent mining beneath small townships and
adverse weather conditions such as drought
Figure 4 Number of Claims received over time
17
During the review of the Mine Subsidence Compensation Act 1961 and its administration in 2016, a
backlog of approximately 200 longstanding claims was identified. Some claims had been open for more
than 10 years. All outstanding claims identified through the review have been assessed and 80% were
closed at 30 June 2018. Dedicated SA NSW Case Advisors are working with property owners to resolve
and close out the remaining claims.
Major infrastructure claims
SA NSW provided approximately $7.7 million compensation to remediate damage to infrastructure during
the year. Major infrastructure claims approved or managed during the year include:
▪ Australian Rail Track Corporation assets including the Main Southern Rail Line, culverts and over-
bridges
▪ Emergency repairs to the M31 Freeway (Hume motorway)
▪ Cataract Tunnel and Upper Canal (Water NSW)
▪ Final rehabilitation to Jemena Gas pipelines
▪ Blackhill Road, Blackhill
▪ Telstra optical fibre telecommunication lines.
Elimination of danger reports
Safety is the highest priority for SA NSW. A 24 hour emergency hotline is available for the public to report
danger arising from mine subsidence. All reports made to this hotline must be responded to within twenty-
four hours.
These emergency events generally involve holes caused by historical mine workings at a shallow depth.
These holes can present a significant safety risk to the community.
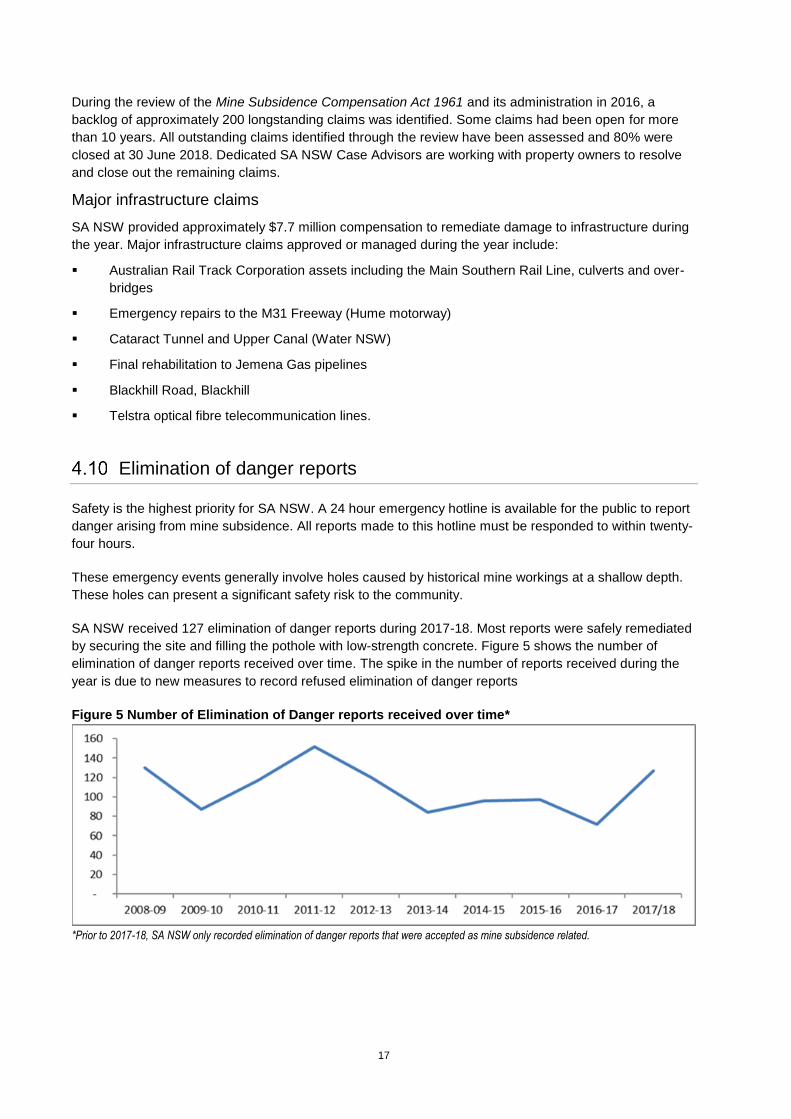
SA NSW received 127 elimination of danger reports during 2017-18. Most reports were safely remediated
by securing the site and filling the pothole with low-strength concrete. Figure 5 shows the number of
elimination of danger reports received over time. The spike in the number of reports received during the
year is due to new measures to record refused elimination of danger reports
Figure 5 Number of Elimination of Danger reports received over time*
*Prior to 2017-18, SA NSW only recorded elimination of danger reports that were accepted as mine subsidence related.
18
Proactive remediation of high risk sites
SA NSW continued work on a project to explore proactive remediation of known subsidence risk areas
during the year. SA NSW identified close to 50 problematic sites where more than five subsidence hole
events had occurred and there is a high likelihood of recurrence.
A risk assessment model was developed to rate each site from low to very-high risk with weight given to
public safety. SA NSW established an action plan detailing the recommended treatment options for each
site and addressed them in order of risk. All sites classified as ‘very-high’ and ‘high’ were addressed
during the year. Actions taken to reduce risks include:
▪ Grouting historical mine workings to eliminate the risk of subsidence
▪ Relocating community facilities to minimise public safety risks
▪ Implementing subsidence management plans for private sites
▪ Training councils on how to quickly identify and respond to mine subsidence potholes.
5. Corporate performance
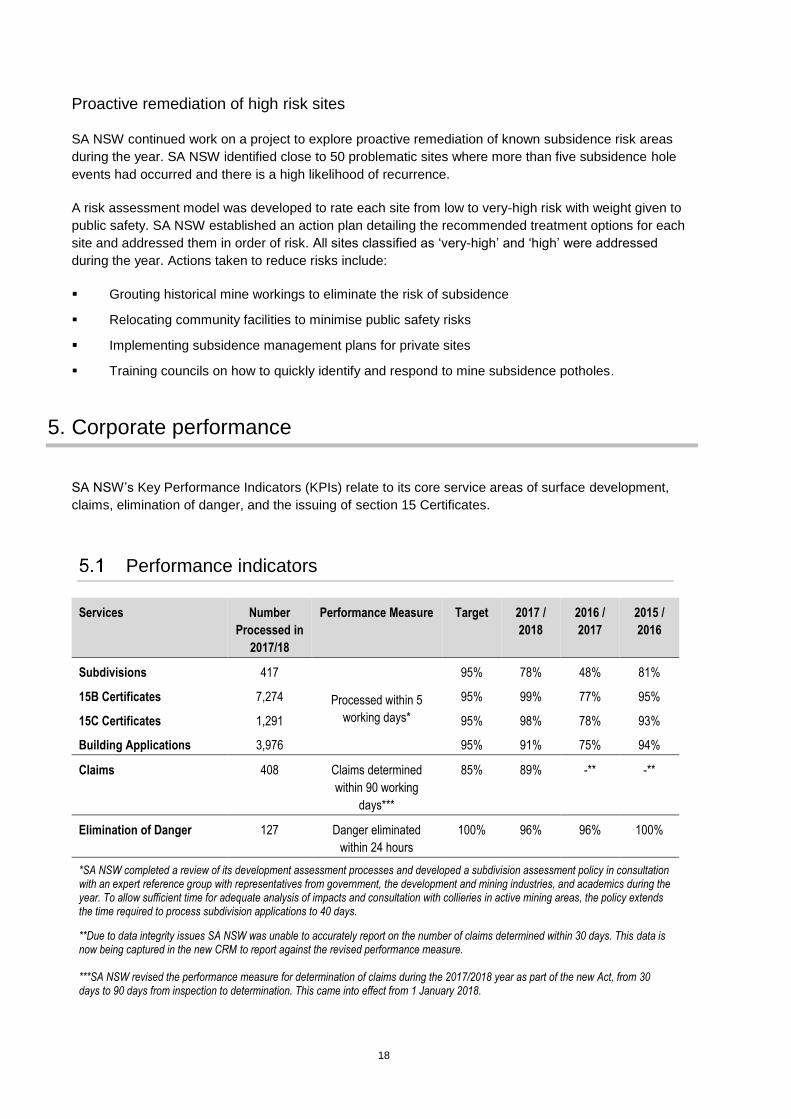
SA NSW’s Key Performance Indicators (KPIs) relate to its core service areas of surface development,
claims, elimination of danger, and the issuing of section 15 Certificates.
Performance indicators
Services Number
Processed in
2017/18
Performance Measure Target 2017 /
2018
2016 /
2017
2015 /
2016
Subdivisions 417
Processed within 5
working days*
95% 78% 48% 81%
15B Certificates 7,274 95% 99% 77% 95%
15C Certificates 1,291 95% 98% 78% 93%
Building Applications 3,976 95% 91% 75% 94%
Claims 408 Claims determined
within 90 working
days***
85% 89% -** -**
Elimination of Danger 127 Danger eliminated
within 24 hours
100% 96% 96% 100%
*SA NSW completed a review of its development assessment processes and developed a subdivision assessment policy in consultation with an expert reference group with representatives from government, the development and mining industries, and academics during the year. To allow sufficient time for adequate analysis of impacts and consultation with collieries in active mining areas, the policy extends the time required to process subdivision applications to 40 days.
**Due to data integrity issues SA NSW was unable to accurately report on the number of claims determined within 30 days. This data is now being captured in the new CRM to report against the revised performance measure. ***SA NSW revised the performance measure for determination of claims during the 2017/2018 year as part of the new Act, from 30 days to 90 days from inspection to determination. This came into effect from 1 January 2018.
19
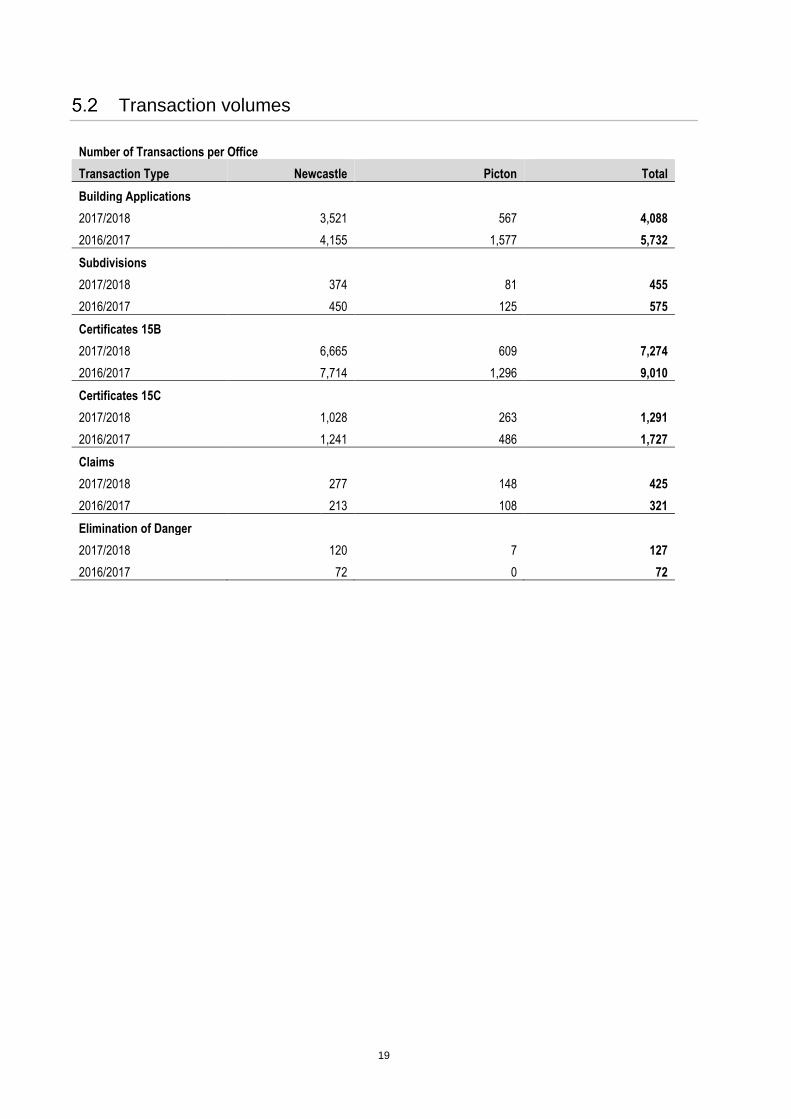
Transaction volumes
Number of Transactions per Office
Transaction Type Newcastle Picton Total
Building Applications
2017/2018 3,521 567 4,088
2016/2017 4,155 1,577 5,732
Subdivisions
2017/2018 374 81 455
2016/2017 450 125 575
Certificates 15B
2017/2018 6,665 609 7,274
2016/2017 7,714 1,296 9,010
Certificates 15C
2017/2018 1,028 263 1,291
2016/2017 1,241 486 1,727
Claims
2017/2018 277 148 425
2016/2017 213 108 321
Elimination of Danger
2017/2018 120 7 127
2016/2017 72 0 72
20
6. Appendices
Research and development
SA NSW presented at the tenth triennial Mine Subsidence Technological Society (MSTS) conference in
November 2017. The MSTS promotes and supports the exchange of technical information and ideas on
mine subsidence between government, academics and leaders from the building, construction, and
mining industries. The conference provided an opportunity for SA NSW to share details of the mine
subsidence compensation system reforms with key industry stakeholders.
SA NSW also commenced two new research and development initiatives during the year:
1. SA NSW has commissioned a study by the University of Newcastle into soil reactivity in the
Tahmoor region to support determination of claims for mine subsidence damage in the area.
2. SA NSW is reviewing existing subsidence records to improve understanding of areas that are at
risk of coal-pillar failure. The most widely used formulae was primarily developed using coal pillar
geometries that are different to those that underlie much of the Newcastle and Hunter region.
These initiatives were ongoing at 30 June 2018.
Risk management and insurance activities
SA NSW is insured with the NSW Treasury Managed Fund. This insurance covers public liability, motor
vehicles, property, workers compensation, fidelity guarantee, burglary, fire and miscellaneous.
Internal audit and risk management policy attestation
Internal Audit and Risk Management Attestation Statement for the 2017-2018 Financial Year for
Subsidence Advisory
I, Laura Christie, Chairperson, am of the opinion that Subsidence Advisory has internal audit and risk
management processes in operation that are compliant with the eight (8) core requirements set out in the
Internal Audit and Risk Management Policy for the NSW Public Sector, specifically:
Core Requirements
For each requirement, please
specify whether compliant,
non-compliant, or
in transition
Risk Management Framework
1.1 The agency head is ultimately responsible and
accountable for risk management in the agency
Compliant
1.2 A risk management framework that is appropriate to the
agency has been established and maintained and the
framework is consistent with AS/NZS ISO 31000:2009
Compliant
Internal Audit Function
21
2.1 An internal audit function has been established and
maintained
Compliant
2.2 The operation of the internal audit function is consistent
with the International Standards for the Professional
Practice of Internal Auditing
Compliant
2.3 The agency has an Internal Audit Charter that is
consistent with the content of the ‘model charter’
Compliant
Audit and Risk Committee
3.1 An independent Audit and Risk Committee with
appropriate expertise has been established
Compliant
3.2 The Audit and Risk Committee is an advisory committee
providing assistance to the agency head on the agency’s
governance processes, risk management and control
frameworks, and its external accountability obligations
Compliant
3.3 The Audit and Risk Committee has a Charter that is
consistent with the content of the ‘model charter’
Compliant
Membership
The chair and members of the Audit and Risk Committee are:
▪ Carol Holley, Independent Chair, from 2 December 2015 to 1 December 2020;
▪ Dianne Hill, Independent Member, from 1 February 2016 to 31 January 2019;
▪ Nirmal Hansra, Independent Member, from 20 December 2018 to 19 December 2021;
▪ Bruce Turner AM, Independent Member, from 22 January 2016 to 21 January 2019.
This Audit and Risk Committee has been established under a Treasury approved shared arrangement with
the following departments/statutory bodies:
▪ DFSI
▪ Rental Bond Board
▪ Fair Trading Administration Corporation
▪ Building Professionals Board
▪ Subsidence Advisory
▪ NSW Government Telecommunications Authority
▪ State Archives and Records Authority
_______________________________________
Laura Christie
Chairperson
Mine Subsidence Board
Date: 6/9/2018
22
Digital information security policy attestation
Digital Information Security Annual Attestation Statement for the 2017-2018 Financial Year for the
Mine Subsidence Board
I, Laura Christie, am of the opinion that the Mine Subsidence Board had an Information Security
Management System in place during the 2017-18 financial year that is consistent with the Core
Requirements set out in the NSW Government Digital Information Security Policy.
The controls in place to mitigate identified risks to the digital information and digital information systems of
the Mine Subsidence Board are adequate.
There is no agency under the control of the Mine Subsidence Board which is required to develop an
independent ISMS in accordance with the NSW Government Digital Information Security Policy.
Laura Christie Chairperson Mine Subsidence Board
Legal Change
The Coal Mine Subsidence Compensation Act 2017 and Coal Mine Subsidence Compensation
Regulation 2017 took effect on 1 January 2018, repealing the former Mine Subsidence Compensation Act
1961 and Mine Subsidence Compensation Regulation 2012. Refer to 4.1 for detail on the legislative
changes.
Land disposal
SA NSW did not dispose of any land greater than $5 million in value during the year. Documents relating
to land disposal can be obtained under the Government Information (Public Access) Act 2009.
Human Resources
There were 35 full-time employees of DFSI and an additional six temporary staff employed through casual
labour working at SA NSW at 30 June 2018.
Table 1 Number of full-time employees over time
Number of full-time employees working at SANSW over time
2015-16 2016-17 2017-18
29 35 35
Staff working at SA NSW are employed by DFSI, and as such are subject to all of its employment
conditions. For information related to personnel and industrial relations policies and practices, please refer
to DFSI’s 2017-18 Annual Report.
23
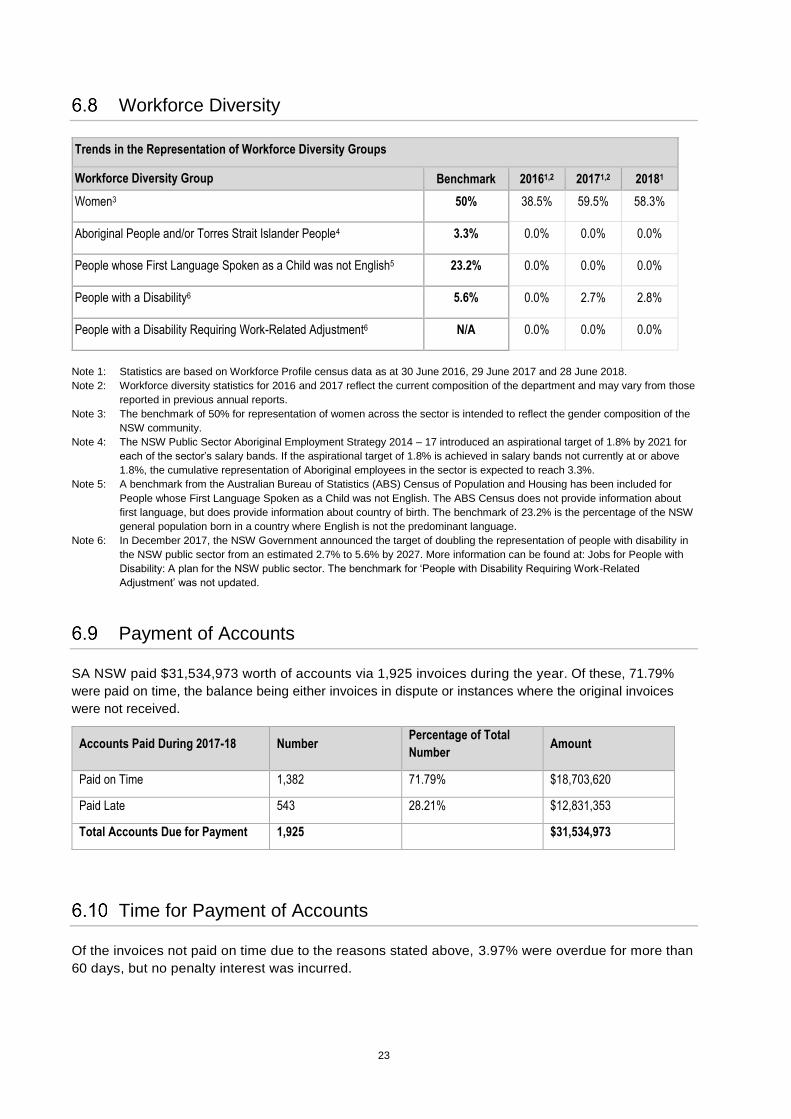
Workforce Diversity
Trends in the Representation of Workforce Diversity Groups
Workforce Diversity Group Benchmark 20161,2 20171,2 20181
Women3 50% 38.5% 59.5% 58.3%
Aboriginal People and/or Torres Strait Islander People4 3.3% 0.0% 0.0% 0.0%
People whose First Language Spoken as a Child was not English5 23.2% 0.0% 0.0% 0.0%
People with a Disability6 5.6% 0.0% 2.7% 2.8%
People with a Disability Requiring Work-Related Adjustment6 N/A 0.0% 0.0% 0.0%
Note 1: Statistics are based on Workforce Profile census data as at 30 June 2016, 29 June 2017 and 28 June 2018.
Note 2: Workforce diversity statistics for 2016 and 2017 reflect the current composition of the department and may vary from those
reported in previous annual reports.
Note 3: The benchmark of 50% for representation of women across the sector is intended to reflect the gender composition of the
NSW community.
Note 4: The NSW Public Sector Aboriginal Employment Strategy 2014 – 17 introduced an aspirational target of 1.8% by 2021 for
each of the sector’s salary bands. If the aspirational target of 1.8% is achieved in salary bands not currently at or above
1.8%, the cumulative representation of Aboriginal employees in the sector is expected to reach 3.3%.
Note 5: A benchmark from the Australian Bureau of Statistics (ABS) Census of Population and Housing has been included for
People whose First Language Spoken as a Child was not English. The ABS Census does not provide information about
first language, but does provide information about country of birth. The benchmark of 23.2% is the percentage of the NSW
general population born in a country where English is not the predominant language.
Note 6: In December 2017, the NSW Government announced the target of doubling the representation of people with disability in
the NSW public sector from an estimated 2.7% to 5.6% by 2027. More information can be found at: Jobs for People with
Disability: A plan for the NSW public sector. The benchmark for ‘People with Disability Requiring Work-Related
Adjustment’ was not updated.
Payment of Accounts
SA NSW paid $31,534,973 worth of accounts via 1,925 invoices during the year. Of these, 71.79%
were paid on time, the balance being either invoices in dispute or instances where the original invoices
were not received.
Accounts Paid During 2017-18 Number Percentage of Total
Number Amount
Paid on Time 1,382 71.79% $18,703,620
Paid Late 543 28.21% $12,831,353
Total Accounts Due for Payment 1,925 $31,534,973
Time for Payment of Accounts
Of the invoices not paid on time due to the reasons stated above, 3.97% were overdue for more than
60 days, but no penalty interest was incurred.
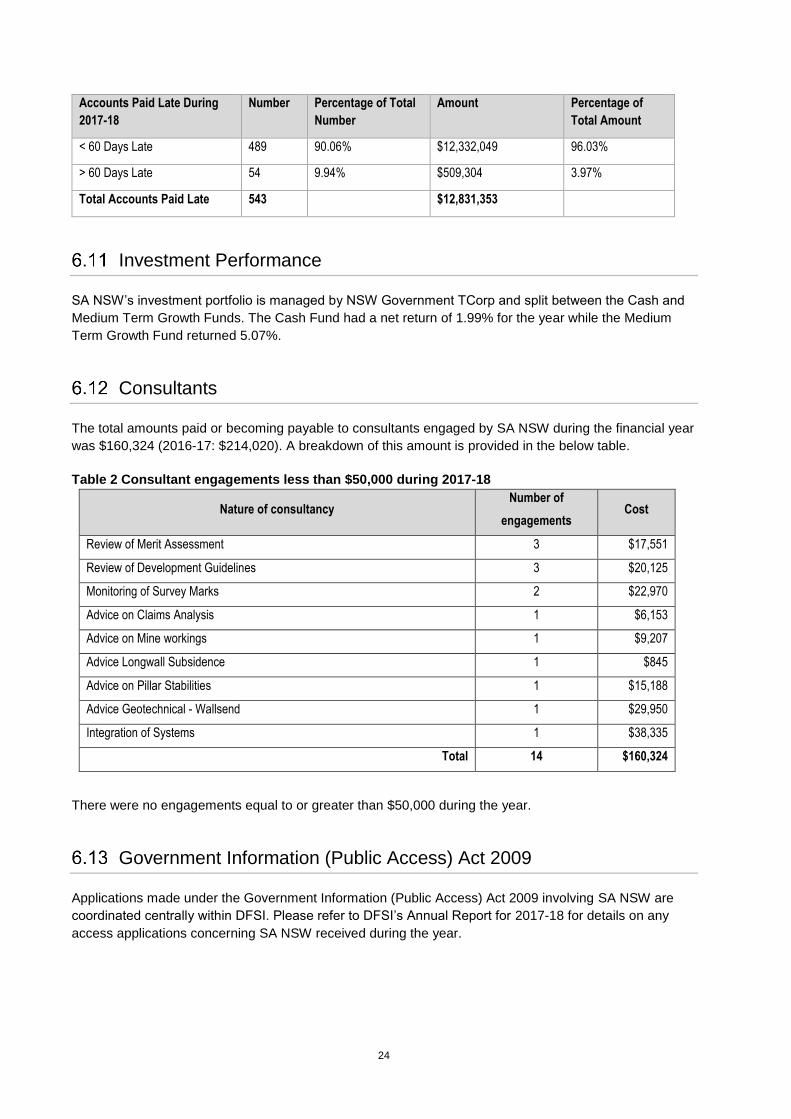
24
Accounts Paid Late During
2017-18
Number Percentage of Total
Number
Amount Percentage of
Total Amount
< 60 Days Late 489 90.06% $12,332,049 96.03%
> 60 Days Late 54 9.94% $509,304 3.97%
Total Accounts Paid Late 543 $12,831,353
Investment Performance
SA NSW’s investment portfolio is managed by NSW Government TCorp and split between the Cash and
Medium Term Growth Funds. The Cash Fund had a net return of 1.99% for the year while the Medium
Term Growth Fund returned 5.07%.
Consultants
The total amounts paid or becoming payable to consultants engaged by SA NSW during the financial year
was $160,324 (2016-17: $214,020). A breakdown of this amount is provided in the below table.
Table 2 Consultant engagements less than $50,000 during 2017-18
Nature of consultancy Number of
engagements Cost
Review of Merit Assessment 3 $17,551
Review of Development Guidelines 3 $20,125
Monitoring of Survey Marks 2 $22,970
Advice on Claims Analysis 1 $6,153
Advice on Mine workings 1 $9,207
Advice Longwall Subsidence 1 $845
Advice on Pillar Stabilities 1 $15,188
Advice Geotechnical - Wallsend 1 $29,950
Integration of Systems 1 $38,335
Total 14 $160,324
There were no engagements equal to or greater than $50,000 during the year.
Government Information (Public Access) Act 2009
Applications made under the Government Information (Public Access) Act 2009 involving SA NSW are
coordinated centrally within DFSI. Please refer to DFSI’s Annual Report for 2017-18 for details on any
access applications concerning SA NSW received during the year.
25
Privacy and Personal Information Protection Act (PPIPA)
SA NSW adopted DFSI’s privacy management plan during the year. Please refer to DFSI’s 2017-18
Annual Report for detail on actions taken to comply with the Privacy and Personal Information Protection
Act 1998 during the year.
There were no reviews conducted by or on behalf of SA NSW under Part 5 of the PPIPA during the
reporting period.
Public Interest Disclosures
As staff were employees of DFSI, SA NSW adopted the Department’s Public Interest Disclosures
Reporting Policy and Procedure during the reporting period. Please refer to DFSI’s 2017-18 Annual
Report for details on actions taken to ensure staff awareness of responsibilities under s6E (1)(B) of the
Public Interest Disclosures Act 1994
No public officials made a Public Interest Disclosure to SA NSW during the reporting period. SA NSW did
not receive or finalise any Public Interest Disclosures during the year.
Nil or NA to report
SA NSW had nil or NA to report on the following statutory requirements during the year:
▪ Promotion
▪ Disclosure of Controlled Entities
▪ Disclosure of Subsidiaries
▪ Funds granted to non-government community organisations
▪ Agreements with Multicultural NSW
▪ Numbers and remuneration of senior executives
▪ Implementation of Price Determination
▪ Liability management performance
As staff working at SA NSW are all employed by DFSI, please refer to DFSI’s 2017-18 Annual Report for
information regarding:
▪ Disability Inclusion Action Plan
▪ Multicultural policies and services program
▪ Work Health and Safety (WHS)
Events after the reporting period
There were no events occurring after the end of the reporting period to be disclosed.
26
7. Audited Financial Statements
Mine Subsidence Board
trading as
Subsidence Advisory NSW
Financial Statements
for the year ended 30 June 2018
27
Table of Contents
Independent Auditor’s Report ………....……………………………………………………………………....... 28
Statement by Members of the Board………....…………………….…………………………………………… 31
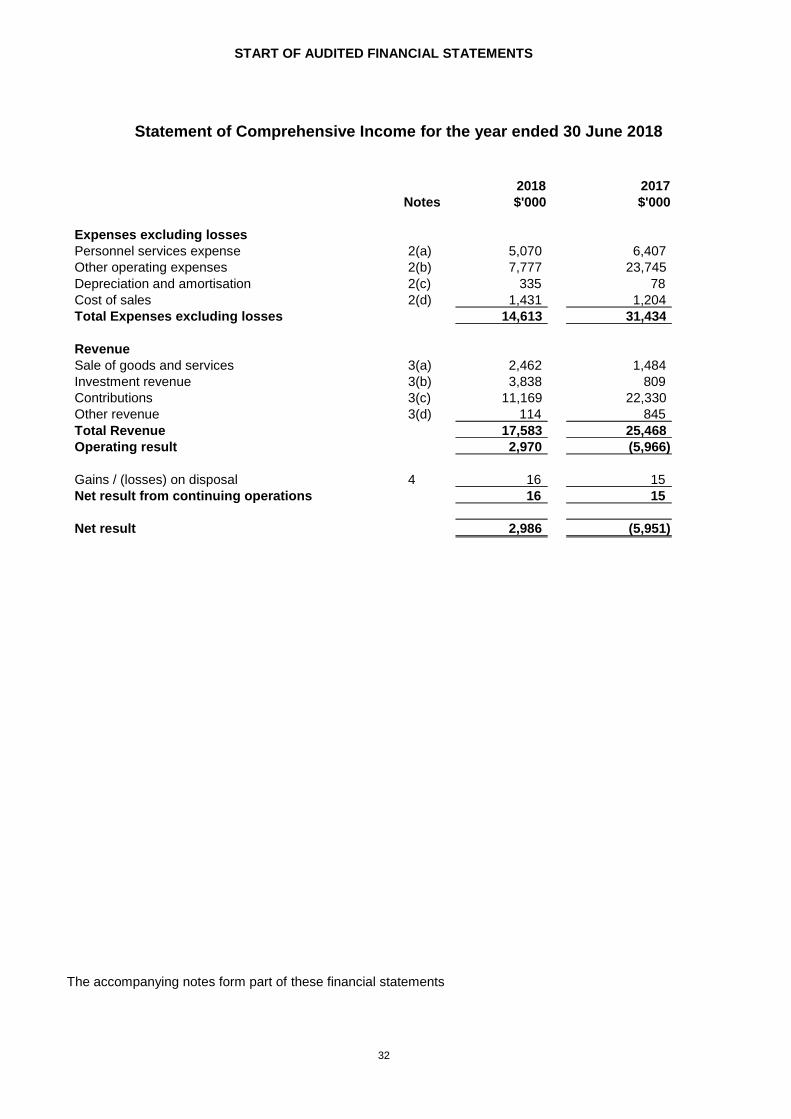
Statement of Comprehensive Income…..………………………………………………………………………. 32
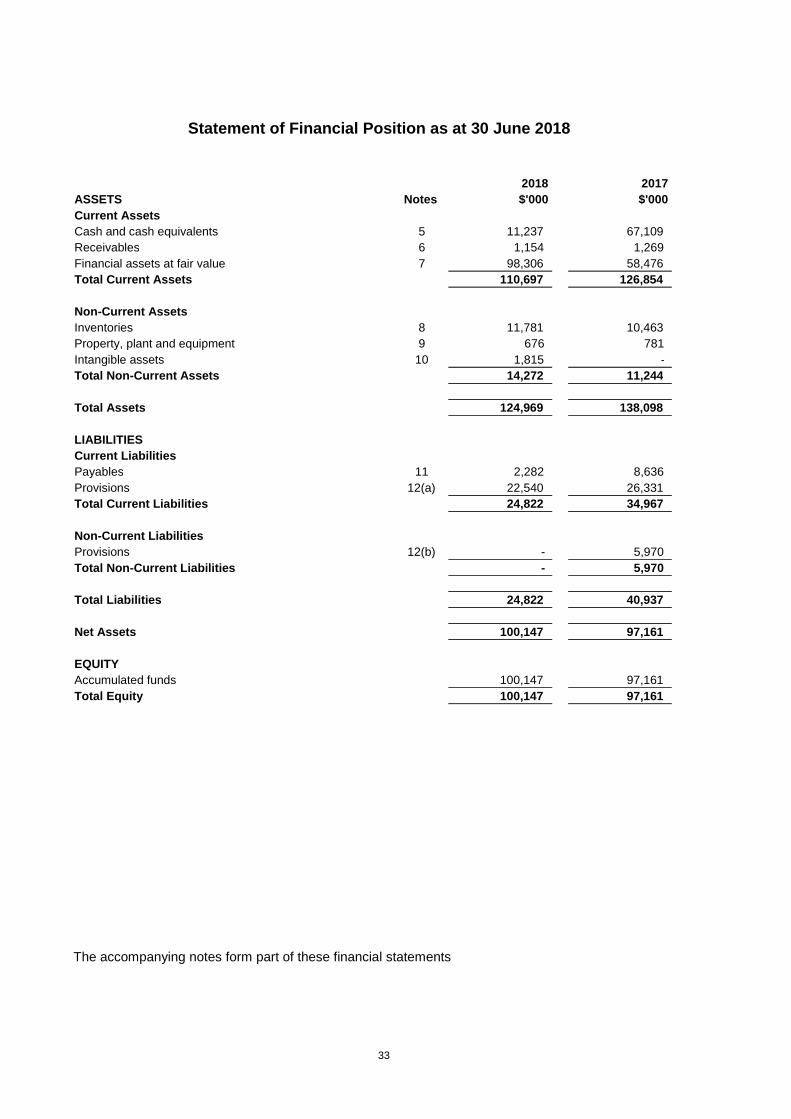
Statement of Financial Position………………………………………………………………..………………… 33
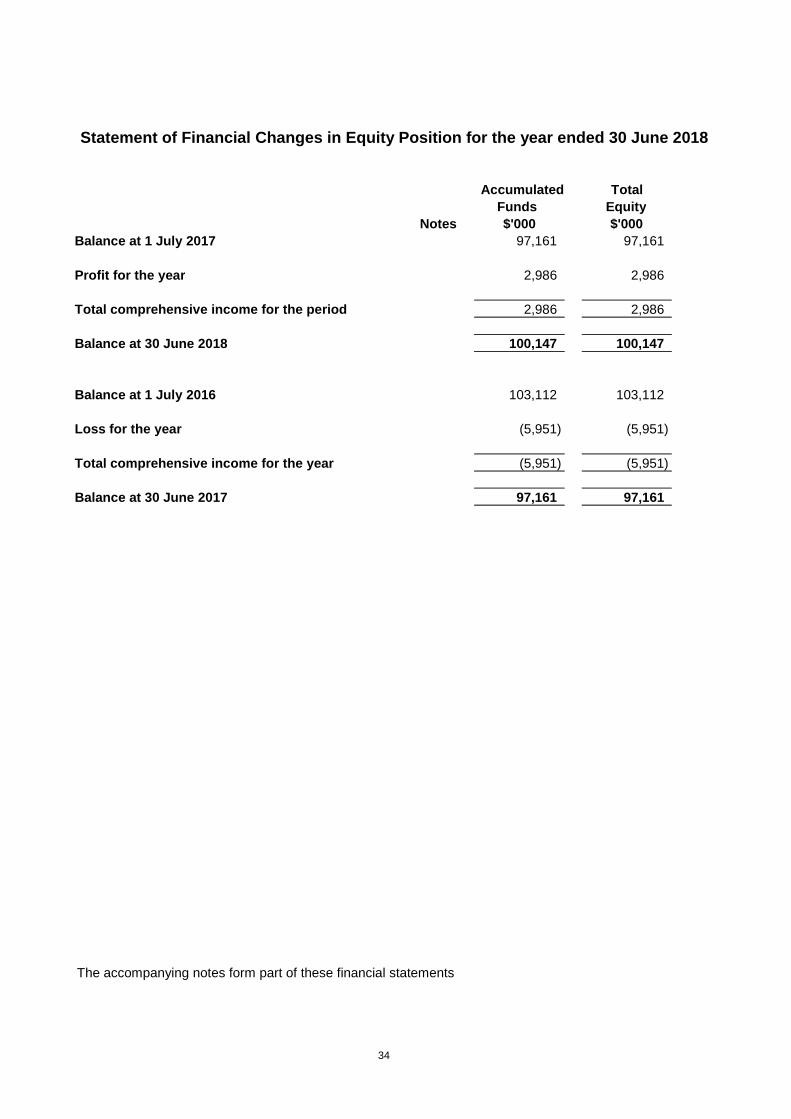
Statement of Changes in Equity…………………………………………………………………………………. 34
Statement of Cash Flows…………………………………………………………………………………………. 35
Notes to the Financial Statements……………………………………………………………….. ……………... 36
28
29
30
31
START OF AUDITED FINANCIAL STATEMENTS
32
Notes
2018
$'000
2017
$'000
Expenses excluding losses
Personnel services expense 2(a) 5,070 6,407
Other operating expenses 2(b) 7,777 23,745
Depreciation and amortisation 2(c) 335 78
Cost of sales 2(d) 1,431 1,204
Total Expenses excluding losses 14,613 31,434
Revenue
Sale of goods and services 3(a) 2,462 1,484
Investment revenue 3(b) 3,838 809
Contributions 3(c) 11,169 22,330
Other revenue 3(d) 114 845
Total Revenue 17,583 25,468
Operating result 2,970 (5,966)
Gains / (losses) on disposal 4 16 15
Net result from continuing operations 16 15
Net result 2,986 (5,951)
Statement of Comprehensive Income for the year ended 30 June 2018
The accompanying notes form part of these financial statements
33
ASSETS Notes
2018
$'000
2017
$'000
Current Assets
Cash and cash equivalents 5 11,237 67,109 Receivables 6 1,154 1,269 Financial assets at fair value 7 98,306 58,476 Total Current Assets 110,697 126,854
Non-Current Assets
Inventories 8 11,781 10,463 Property, plant and equipment 9 676 781 Intangible assets 10 1,815 - Total Non-Current Assets 14,272 11,244
Total Assets 124,969 138,098
LIABILITIES
Current Liabilities
Payables 11 2,282 8,636 Provisions 12(a) 22,540 26,331 Total Current Liabilities 24,822 34,967
Non-Current Liabilities
Provisions 12(b) - 5,970 Total Non-Current Liabilities - 5,970
Total Liabilities 24,822 40,937
Net Assets 100,147 97,161
EQUITY
Accumulated funds 100,147 97,161 Total Equity 100,147 97,161
Statement of Financial Position as at 30 June 2018
The accompanying notes form part of these financial statements
34
Notes
Accumulated
Funds
$'000
Total
Equity
$'000
Balance at 1 July 2017 97,161 97,161
Profit for the year 2,986 2,986
Total comprehensive income for the period 2,986 2,986
Balance at 30 June 2018 100,147 100,147
Balance at 1 July 2016 103,112 103,112
Loss for the year (5,951) (5,951)
Total comprehensive income for the year (5,951) (5,951)
Balance at 30 June 2017 97,161 97,161
Statement of Financial Changes in Equity Position for the year ended 30 June 2018
The accompanying notes form part of these financial statements
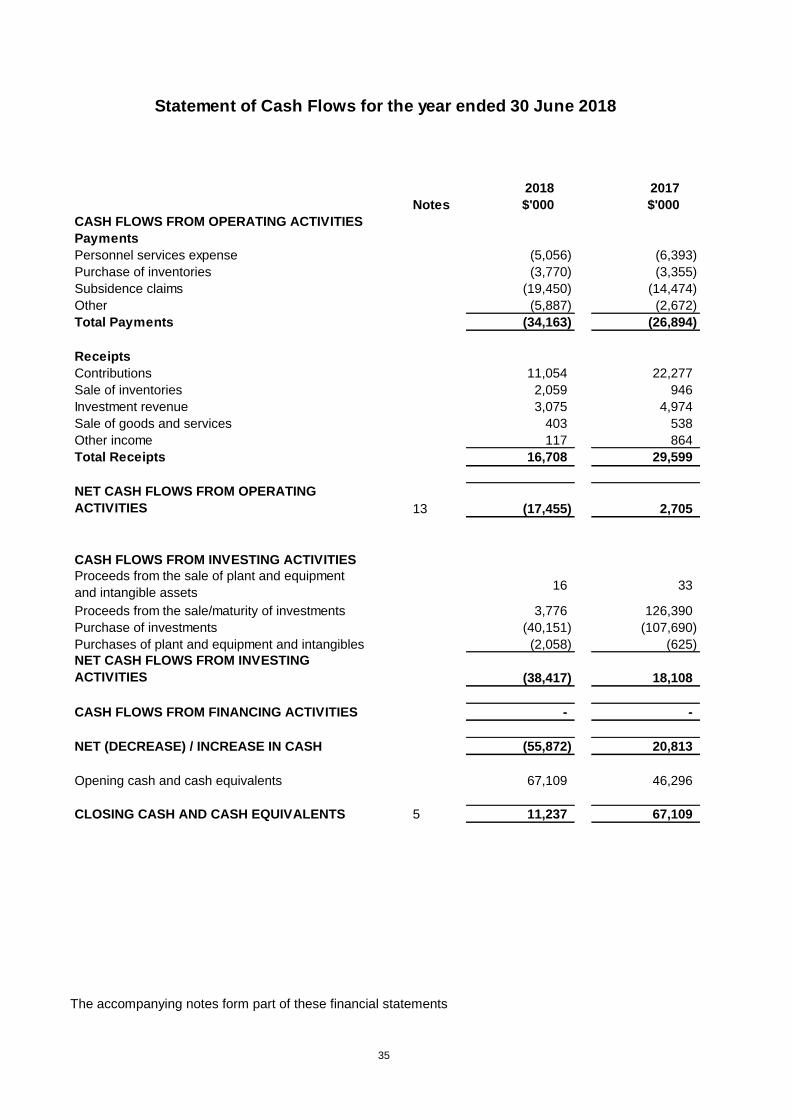
35
Notes
2018
$'000
2017
$'000
CASH FLOWS FROM OPERATING ACTIVITIES
Payments
Personnel services expense (5,056) (6,393)
Purchase of inventories (3,770) (3,355)
Subsidence claims (19,450) (14,474)
Other (5,887) (2,672)
Total Payments (34,163) (26,894)
Receipts
Contributions 11,054 22,277
Sale of inventories 2,059 946
Investment revenue 3,075 4,974
Sale of goods and services 403 538
Other income 117 864
Total Receipts 16,708 29,599
NET CASH FLOWS FROM OPERATING
ACTIVITIES 13 (17,455) 2,705
CASH FLOWS FROM INVESTING ACTIVITIES
Proceeds from the sale of plant and equipment
and intangible assets16 33
Proceeds from the sale/maturity of investments 3,776 126,390
Purchase of investments (40,151) (107,690)
Purchases of plant and equipment and intangibles (2,058) (625)
NET CASH FLOWS FROM INVESTING
ACTIVITIES (38,417) 18,108
CASH FLOWS FROM FINANCING ACTIVITIES - -
NET (DECREASE) / INCREASE IN CASH (55,872) 20,813
Opening cash and cash equivalents 67,109 46,296
CLOSING CASH AND CASH EQUIVALENTS 5 11,237 67,109
Statement of Cash Flows for the year ended 30 June 2018
The accompanying notes form part of these financial statements
Notes to the Financial Statements for the year ended 30 June 2018
36
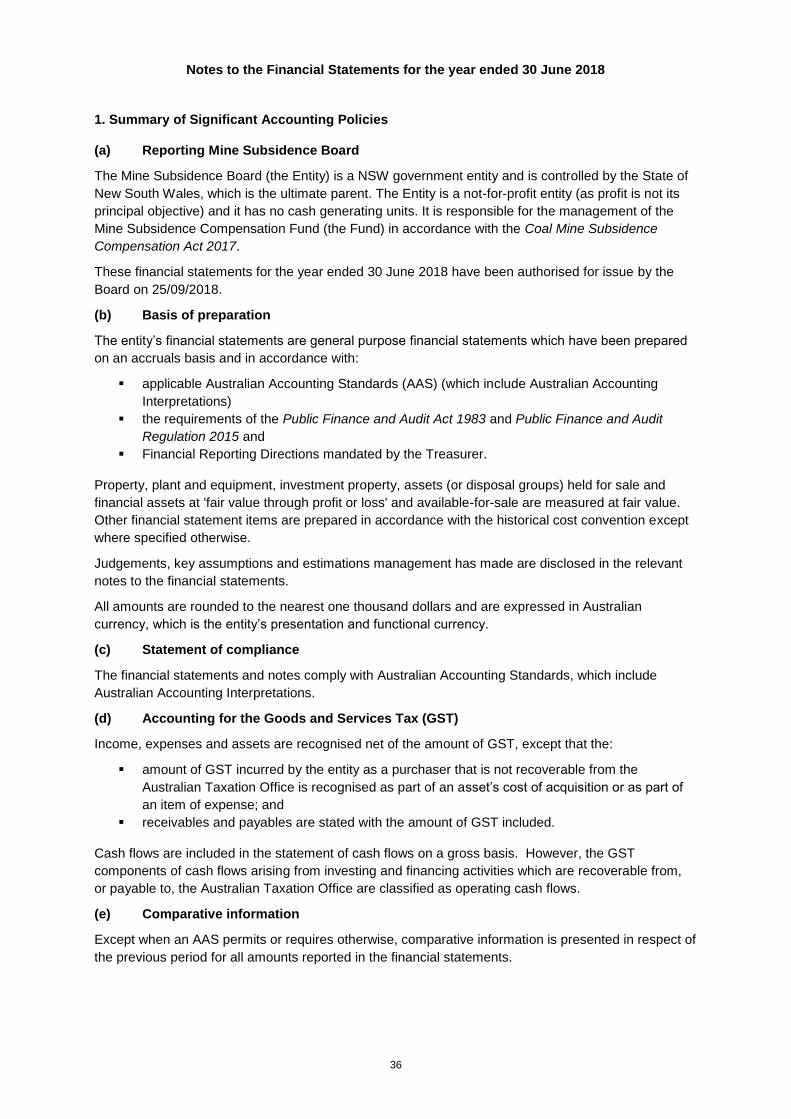
1. Summary of Significant Accounting Policies
(a) Reporting Mine Subsidence Board
The Mine Subsidence Board (the Entity) is a NSW government entity and is controlled by the State of
New South Wales, which is the ultimate parent. The Entity is a not-for-profit entity (as profit is not its
principal objective) and it has no cash generating units. It is responsible for the management of the
Mine Subsidence Compensation Fund (the Fund) in accordance with the Coal Mine Subsidence
Compensation Act 2017.
These financial statements for the year ended 30 June 2018 have been authorised for issue by the
Board on 25/09/2018.
(b) Basis of preparation
The entity’s financial statements are general purpose financial statements which have been prepared
on an accruals basis and in accordance with:
▪ applicable Australian Accounting Standards (AAS) (which include Australian Accounting
Interpretations)
▪ the requirements of the Public Finance and Audit Act 1983 and Public Finance and Audit
Regulation 2015 and
▪ Financial Reporting Directions mandated by the Treasurer.
Property, plant and equipment, investment property, assets (or disposal groups) held for sale and
financial assets at 'fair value through profit or loss' and available-for-sale are measured at fair value.
Other financial statement items are prepared in accordance with the historical cost convention except
where specified otherwise.
Judgements, key assumptions and estimations management has made are disclosed in the relevant
notes to the financial statements.
All amounts are rounded to the nearest one thousand dollars and are expressed in Australian
currency, which is the entity’s presentation and functional currency.
(c) Statement of compliance
The financial statements and notes comply with Australian Accounting Standards, which include
Australian Accounting Interpretations.
(d) Accounting for the Goods and Services Tax (GST)
Income, expenses and assets are recognised net of the amount of GST, except that the:
▪ amount of GST incurred by the entity as a purchaser that is not recoverable from the
Australian Taxation Office is recognised as part of an asset’s cost of acquisition or as part of
an item of expense; and
▪ receivables and payables are stated with the amount of GST included.
Cash flows are included in the statement of cash flows on a gross basis. However, the GST
components of cash flows arising from investing and financing activities which are recoverable from,
or payable to, the Australian Taxation Office are classified as operating cash flows.
(e) Comparative information
Except when an AAS permits or requires otherwise, comparative information is presented in respect of
the previous period for all amounts reported in the financial statements.
Notes to the Financial Statements for the year ended 30 June 2018
37
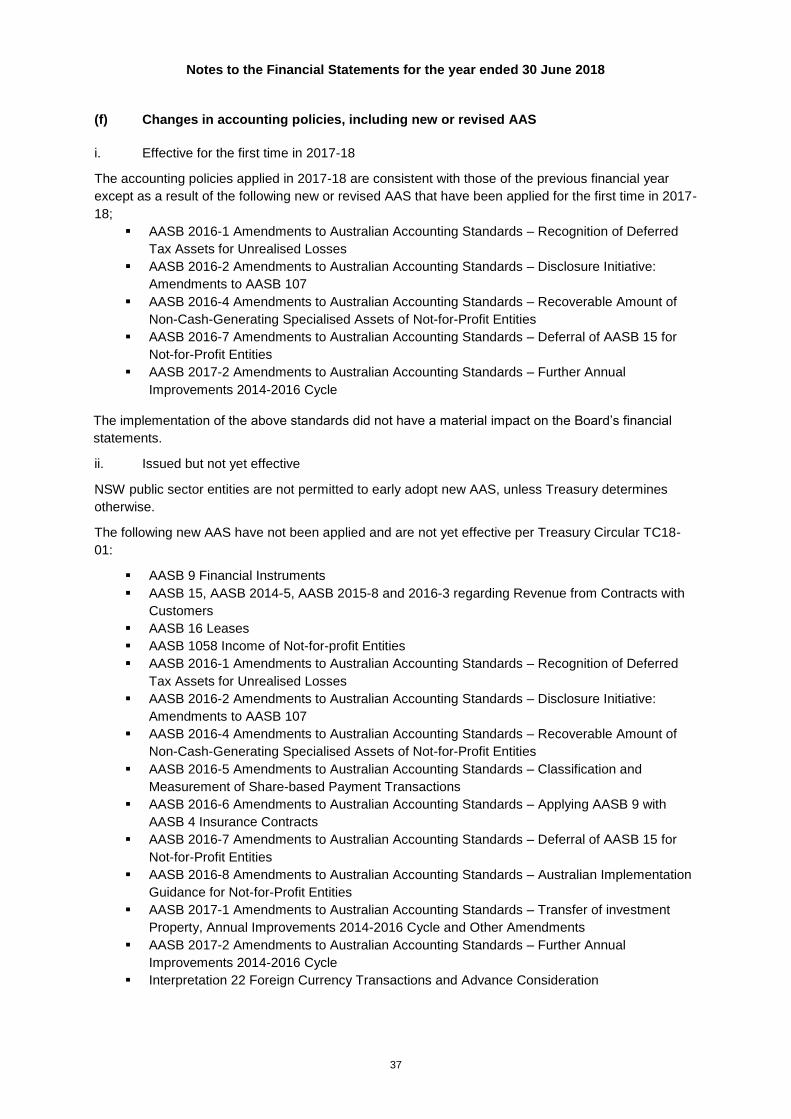
(f) Changes in accounting policies, including new or revised AAS
i. Effective for the first time in 2017-18
The accounting policies applied in 2017-18 are consistent with those of the previous financial year
except as a result of the following new or revised AAS that have been applied for the first time in 2017-
18;
▪ AASB 2016-1 Amendments to Australian Accounting Standards – Recognition of Deferred
Tax Assets for Unrealised Losses
▪ AASB 2016-2 Amendments to Australian Accounting Standards – Disclosure Initiative:
Amendments to AASB 107
▪ AASB 2016-4 Amendments to Australian Accounting Standards – Recoverable Amount of
Non-Cash-Generating Specialised Assets of Not-for-Profit Entities
▪ AASB 2016-7 Amendments to Australian Accounting Standards – Deferral of AASB 15 for
Not-for-Profit Entities
▪ AASB 2017-2 Amendments to Australian Accounting Standards – Further Annual
Improvements 2014-2016 Cycle
The implementation of the above standards did not have a material impact on the Board’s financial
statements.
ii. Issued but not yet effective
NSW public sector entities are not permitted to early adopt new AAS, unless Treasury determines
otherwise.
The following new AAS have not been applied and are not yet effective per Treasury Circular TC18-
01:
▪ AASB 9 Financial Instruments
▪ AASB 15, AASB 2014-5, AASB 2015-8 and 2016-3 regarding Revenue from Contracts with
Customers
▪ AASB 16 Leases
▪ AASB 1058 Income of Not-for-profit Entities
▪ AASB 2016-1 Amendments to Australian Accounting Standards – Recognition of Deferred
Tax Assets for Unrealised Losses
▪ AASB 2016-2 Amendments to Australian Accounting Standards – Disclosure Initiative:
Amendments to AASB 107
▪ AASB 2016-4 Amendments to Australian Accounting Standards – Recoverable Amount of
Non-Cash-Generating Specialised Assets of Not-for-Profit Entities
▪ AASB 2016-5 Amendments to Australian Accounting Standards – Classification and
Measurement of Share-based Payment Transactions
▪ AASB 2016-6 Amendments to Australian Accounting Standards – Applying AASB 9 with
AASB 4 Insurance Contracts
▪ AASB 2016-7 Amendments to Australian Accounting Standards – Deferral of AASB 15 for
Not-for-Profit Entities
▪ AASB 2016-8 Amendments to Australian Accounting Standards – Australian Implementation
Guidance for Not-for-Profit Entities
▪ AASB 2017-1 Amendments to Australian Accounting Standards – Transfer of investment
Property, Annual Improvements 2014-2016 Cycle and Other Amendments
▪ AASB 2017-2 Amendments to Australian Accounting Standards – Further Annual
Improvements 2014-2016 Cycle
▪ Interpretation 22 Foreign Currency Transactions and Advance Consideration
Notes to the Financial Statements for the year ended 30 June 2018
38
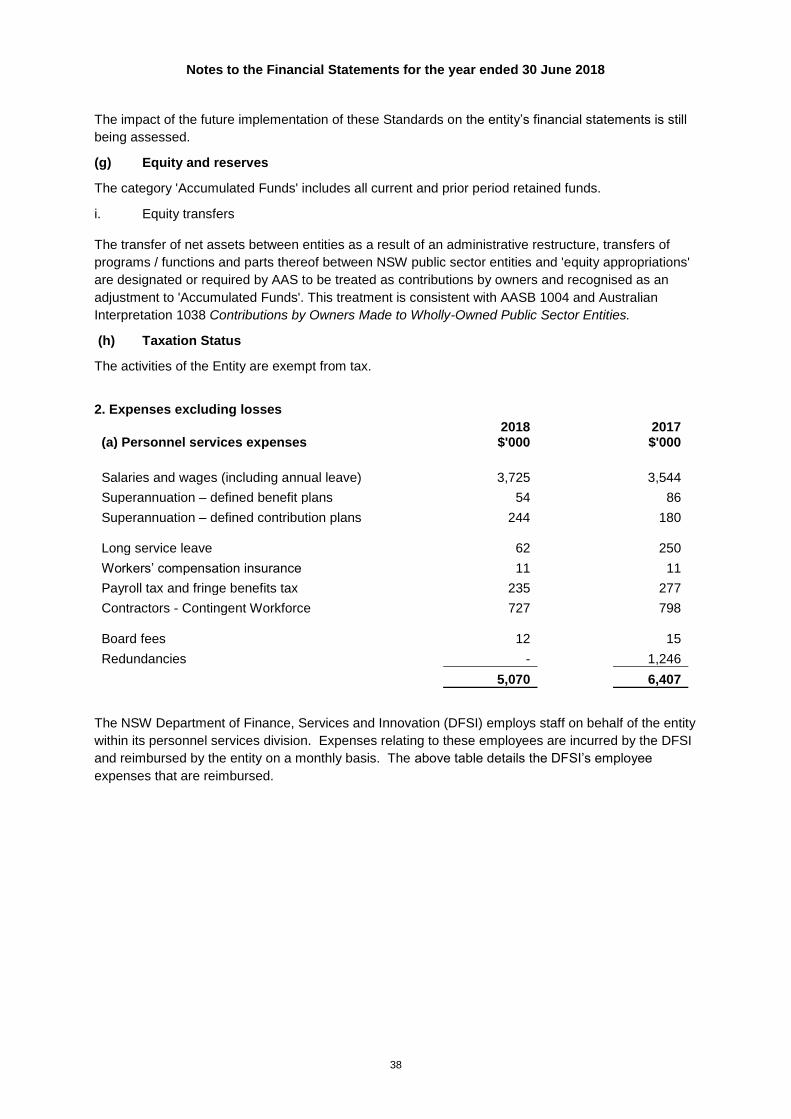
The impact of the future implementation of these Standards on the entity’s financial statements is still
being assessed.
(g) Equity and reserves
The category 'Accumulated Funds' includes all current and prior period retained funds.
i. Equity transfers
The transfer of net assets between entities as a result of an administrative restructure, transfers of
programs / functions and parts thereof between NSW public sector entities and 'equity appropriations'
are designated or required by AAS to be treated as contributions by owners and recognised as an
adjustment to 'Accumulated Funds'. This treatment is consistent with AASB 1004 and Australian
Interpretation 1038 Contributions by Owners Made to Wholly-Owned Public Sector Entities.
(h) Taxation Status
The activities of the Entity are exempt from tax.
2. Expenses excluding losses
(a) Personnel services expenses
2018 $'000
2017 $'000
Salaries and wages (including annual leave) 3,725 3,544
Superannuation – defined benefit plans 54 86
Superannuation – defined contribution plans 244 180
Long service leave
62 250
Workers’ compensation insurance 11 11
Payroll tax and fringe benefits tax 235 277
Contractors - Contingent Workforce 727 798
Board fees
12 15
Redundancies - 1,246
5,070 6,407
The NSW Department of Finance, Services and Innovation (DFSI) employs staff on behalf of the entity
within its personnel services division. Expenses relating to these employees are incurred by the DFSI
and reimbursed by the entity on a monthly basis. The above table details the DFSI’s employee
expenses that are reimbursed.
Notes to the Financial Statements for the year ended 30 June 2018
39
2018 2017
$'000 $'000
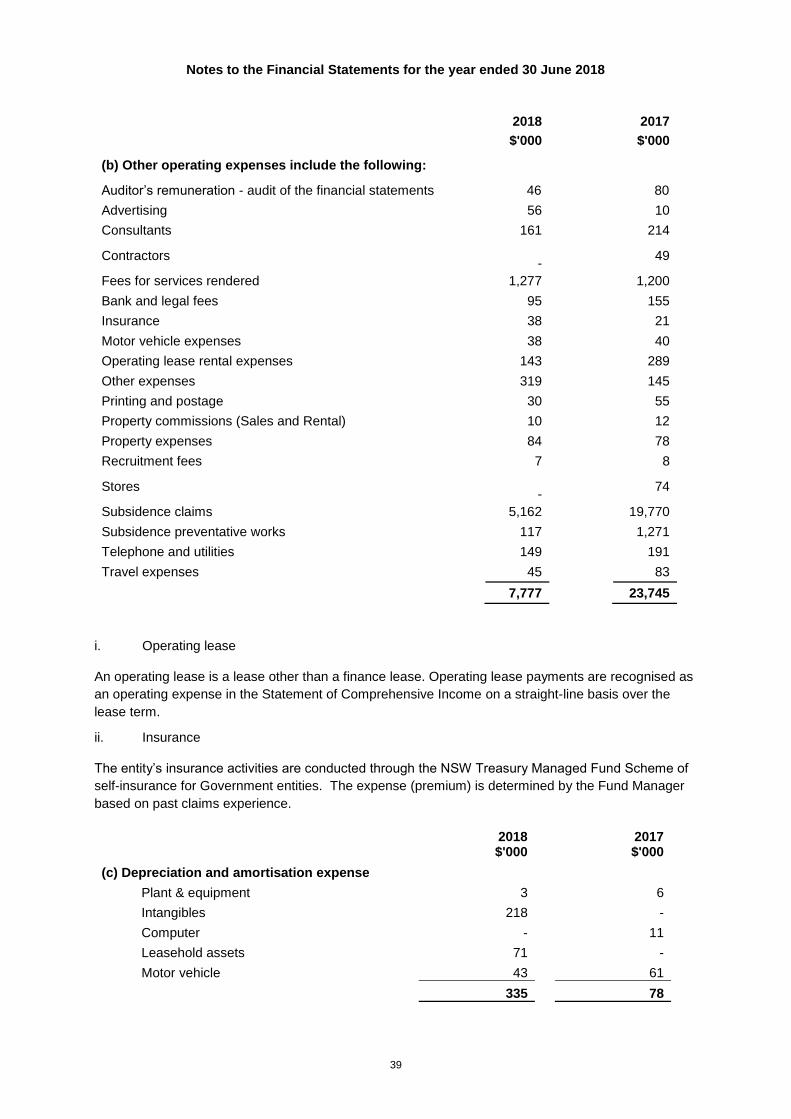
(b) Other operating expenses include the following:
Auditor’s remuneration - audit of the financial statements 46 80
Advertising 56 10
Consultants 161 214
Contractors
-
49
Fees for services rendered 1,277 1,200
Bank and legal fees 95 155
Insurance 38 21
Motor vehicle expenses 38 40
Operating lease rental expenses 143 289
Other expenses 319 145
Printing and postage 30 55
Property commissions (Sales and Rental) 10 12
Property expenses 84 78
Recruitment fees 7 8
Stores
-
74
Subsidence claims 5,162 19,770
Subsidence preventative works 117 1,271
Telephone and utilities 149 191
Travel expenses 45 83
7,777 23,745
i. Operating lease
An operating lease is a lease other than a finance lease. Operating lease payments are recognised as
an operating expense in the Statement of Comprehensive Income on a straight-line basis over the
lease term.
ii. Insurance
The entity’s insurance activities are conducted through the NSW Treasury Managed Fund Scheme of
self-insurance for Government entities. The expense (premium) is determined by the Fund Manager
based on past claims experience.
2018 $'000
2017 $'000
(c) Depreciation and amortisation expense
Plant & equipment 3 6
Intangibles 218 -
Computer - 11
Leasehold assets 71 -
Motor vehicle 43 61
335 78
Notes to the Financial Statements for the year ended 30 June 2018
40
2018 $'000
2017 $'000
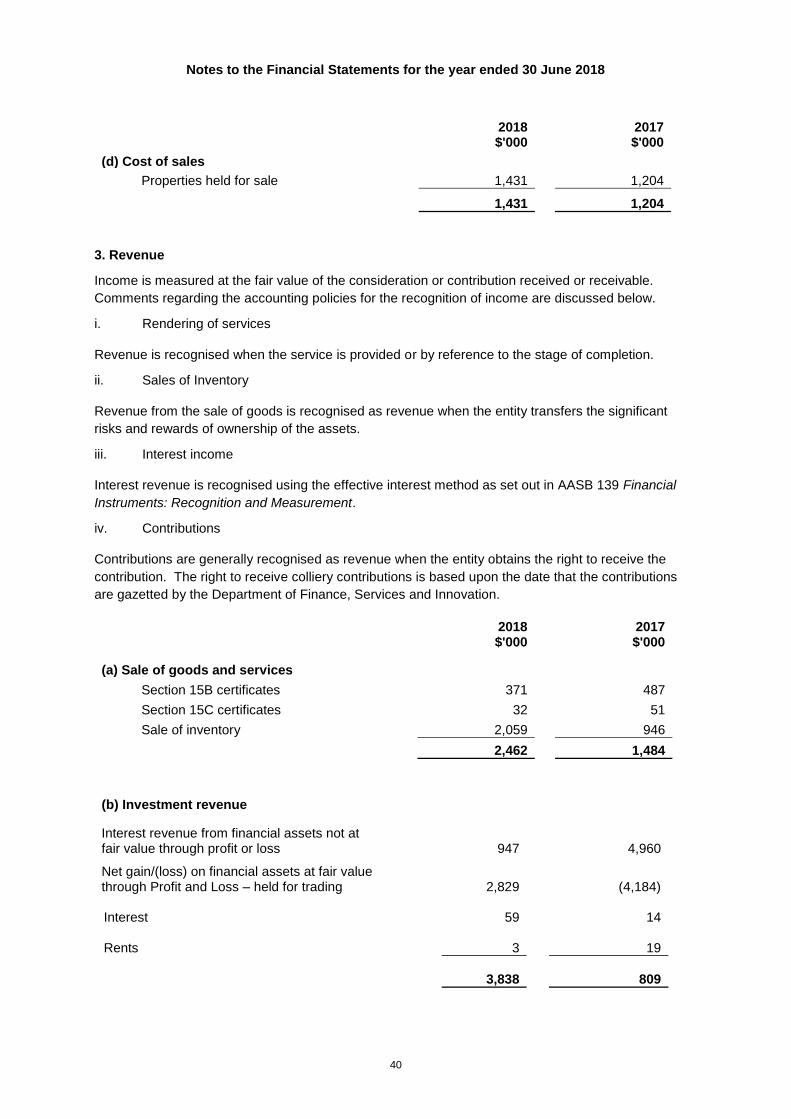
(d) Cost of sales
Properties held for sale 1,431
1,204
1,431 1,204
3. Revenue
Income is measured at the fair value of the consideration or contribution received or receivable.
Comments regarding the accounting policies for the recognition of income are discussed below.
i. Rendering of services
Revenue is recognised when the service is provided or by reference to the stage of completion.
ii. Sales of Inventory
Revenue from the sale of goods is recognised as revenue when the entity transfers the significant
risks and rewards of ownership of the assets.
iii. Interest income
Interest revenue is recognised using the effective interest method as set out in AASB 139 Financial
Instruments: Recognition and Measurement.
iv. Contributions
Contributions are generally recognised as revenue when the entity obtains the right to receive the
contribution. The right to receive colliery contributions is based upon the date that the contributions
are gazetted by the Department of Finance, Services and Innovation.
2018 $'000
2017 $'000
(a) Sale of goods and services
Section 15B certificates 371 487
Section 15C certificates 32 51
Sale of inventory 2,059 946
2,462 1,484
(b) Investment revenue
Interest revenue from financial assets not at fair value through profit or loss
947 4,960
Net gain/(loss) on financial assets at fair value through Profit and Loss – held for trading
2,829 (4,184)
Interest
59 14
Rents
3 19
3,838 809
Notes to the Financial Statements for the year ended 30 June 2018
41
2018 $'000
2017 $'000
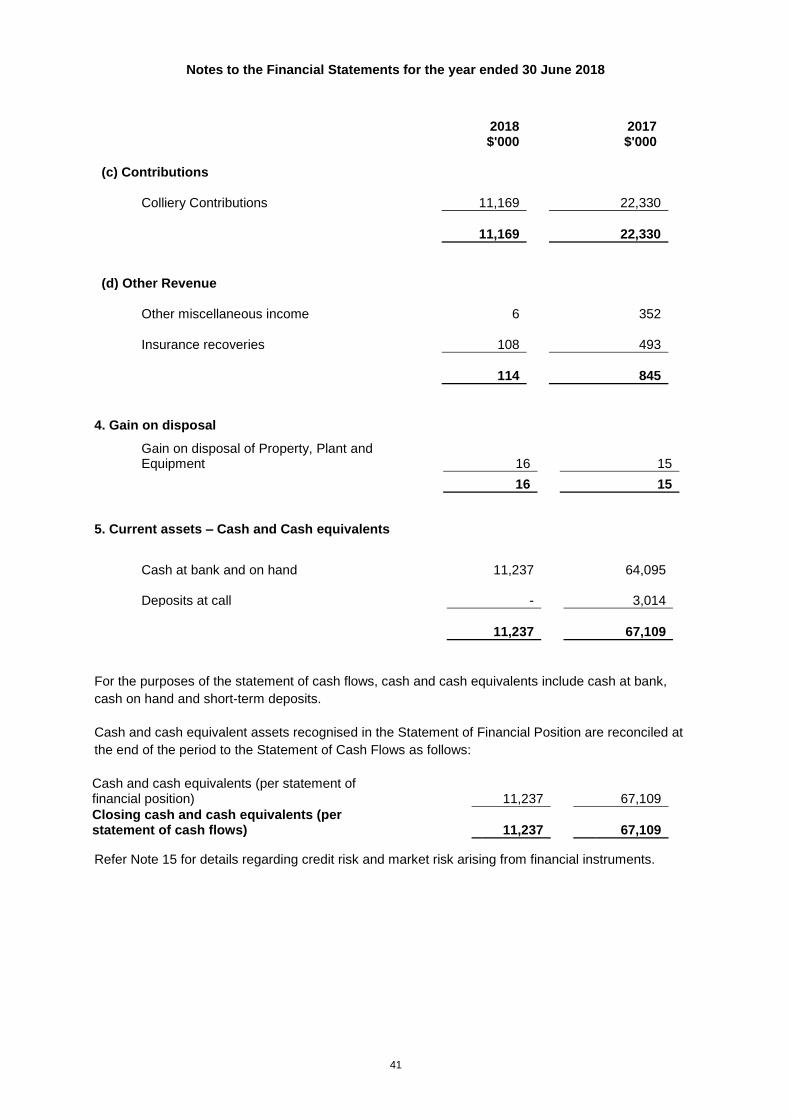
(c) Contributions
Colliery Contributions
11,169 22,330
11,169 22,330
(d) Other Revenue
Other miscellaneous income
6 352
Insurance recoveries
108 493
114 845
4. Gain on disposal
Gain on disposal of Property, Plant and Equipment 16 15
16 15
5. Current assets – Cash and Cash equivalents
Cash at bank and on hand
11,237
64,095
Deposits at call
-
3,014
11,237
67,109
For the purposes of the statement of cash flows, cash and cash equivalents include cash at bank,
cash on hand and short-term deposits.
Cash and cash equivalent assets recognised in the Statement of Financial Position are reconciled at
the end of the period to the Statement of Cash Flows as follows:
Cash and cash equivalents (per statement of financial position)
11,237
67,109
Closing cash and cash equivalents (per statement of cash flows)
11,237
67,109
Refer Note 15 for details regarding credit risk and market risk arising from financial instruments.
Notes to the Financial Statements for the year ended 30 June 2018
42
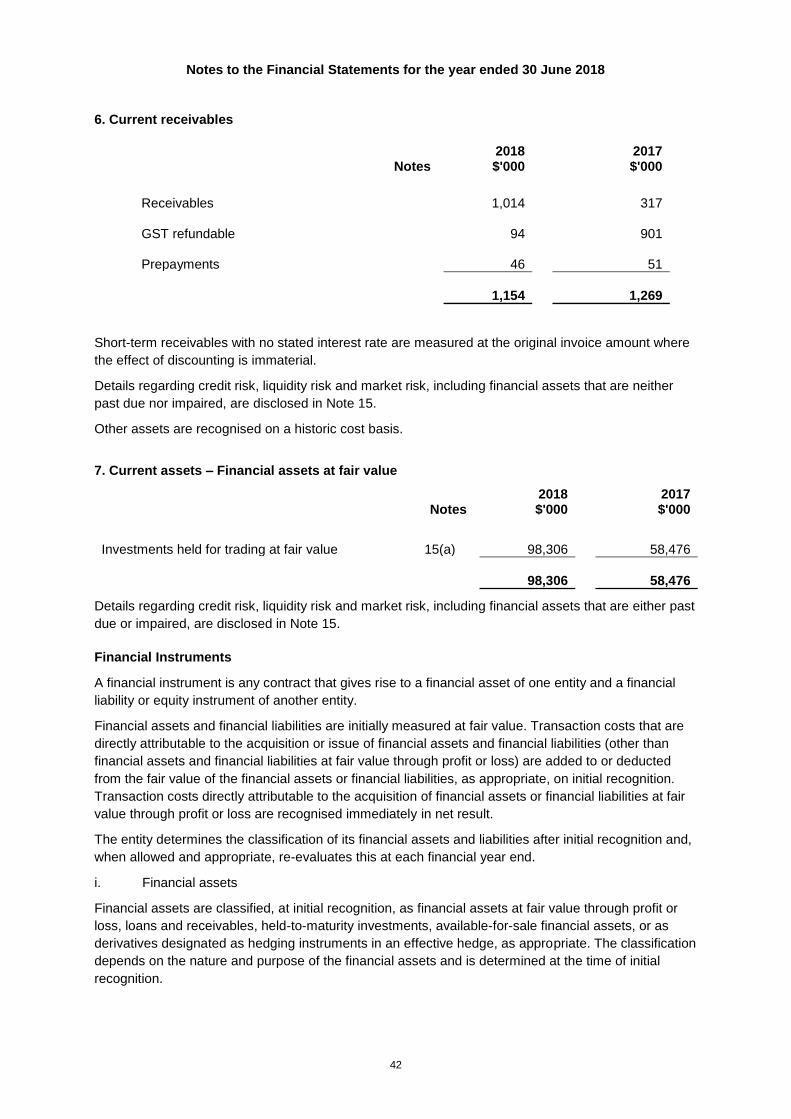
6. Current receivables
Notes 2018 $'000
2017 $'000
Receivables
1,014 317
GST refundable
94 901
Prepayments
46 51
1,154 1,269
Short-term receivables with no stated interest rate are measured at the original invoice amount where
the effect of discounting is immaterial.
Details regarding credit risk, liquidity risk and market risk, including financial assets that are neither
past due nor impaired, are disclosed in Note 15.
Other assets are recognised on a historic cost basis.
7. Current assets – Financial assets at fair value
Notes 2018 $'000
2017 $'000
Investments held for trading at fair value 15(a)
98,306
58,476
98,306
58,476
Details regarding credit risk, liquidity risk and market risk, including financial assets that are either past
due or impaired, are disclosed in Note 15.
Financial Instruments
A financial instrument is any contract that gives rise to a financial asset of one entity and a financial
liability or equity instrument of another entity.
Financial assets and financial liabilities are initially measured at fair value. Transaction costs that are
directly attributable to the acquisition or issue of financial assets and financial liabilities (other than
financial assets and financial liabilities at fair value through profit or loss) are added to or deducted
from the fair value of the financial assets or financial liabilities, as appropriate, on initial recognition.
Transaction costs directly attributable to the acquisition of financial assets or financial liabilities at fair
value through profit or loss are recognised immediately in net result.
The entity determines the classification of its financial assets and liabilities after initial recognition and,
when allowed and appropriate, re-evaluates this at each financial year end.
i. Financial assets
Financial assets are classified, at initial recognition, as financial assets at fair value through profit or
loss, loans and receivables, held-to-maturity investments, available-for-sale financial assets, or as
derivatives designated as hedging instruments in an effective hedge, as appropriate. The classification
depends on the nature and purpose of the financial assets and is determined at the time of initial
recognition.
Notes to the Financial Statements for the year ended 30 June 2018
43
All ‘regular way’ purchases or sales of financial assets are recognised and derecognised on a trade
date basis. Regular way purchases or sales are purchases or sales of financial assets that require
delivery of assets within the time frame established by regulation or convention in the marketplace.
▪ Financial assets at fair value through profit or loss
The entity subsequently measures financial assets classified as 'held-for-trading' or designated
upon initial recognition 'at fair value through profit or loss' at fair value. Gains or losses on these
assets are recognised in the net result for the year. Financial assets are classified as 'held-for-
trading' if they are acquired for the purpose of selling or repurchasing in the near term. Derivatives
are also classified as held-for-trading unless they are designated as effective hedging instruments
under AASB 139 Financial Instruments: Recognition and Measurement.
▪ Held-to-maturity investments
Non-derivative financial assets with fixed or determinable payments and fixed maturity that the
entity has the positive intention and ability to hold to maturity are classified as 'held-to-maturity'
investments. These financial assets are measured at amortised cost using the effective interest
method, less any impairment. Changes are recognised in the net result for the year when
impaired, derecognised or though the amortisation process.
▪ Available-for-sale financial assets
Financial assets that do not fall into any other category are accounted for as available-for-sale
investments and measured at fair value. Gains or losses on available-for-sale financial assets are
recognised in other comprehensive income until disposed or impaired, at which time the
cumulative gain or loss previously recognised in other comprehensive income is recognised in the
net result for the year. However, interest calculated using the effective interest method and
dividends are recognised in the net result for the year.
▪ Impairment of financial assets
All financial assets, except those at fair value through profit and loss, are subject to an annual
review for impairment. Financial assets are considered to be impaired when there is objective
evidence that, as a result of one or more events that occurred after the initial recognition of the
financial asset, the estimated future cash flows have been affected.
For certain categories of financial assets, such as trade receivables, the entity first assesses
whether impairment exists individually for financial assets that are individually significant, or
collectively for financial assets that are not individually significant. Assets are assessed for
impairment on a collective basis if they were assessed not to be impaired individually.
For financial assets carried at amortised cost, the amount of the allowance is the difference
between the asset’s carrying amount and the present value of estimated future cash flows,
discounted at the original effective interest rate. The amount of the impairment loss is recognised
in the net result for the year.
Any reversals of impairment losses are reversed through the net result for the year, where there is
objective evidence. However, reversals of impairment losses on an investment in an equity
instrument classified as 'available-for-sale' must be made through the revaluation surplus.
Reversals of impairment losses of financial assets carried at amortised cost cannot result in a
carrying amount that exceeds what the carrying amount would have been had there not been an
impairment loss.
ii. De-recognition of financial assets and financial liabilities
A financial asset is derecognised when the contractual rights to the cash flows from the financial
assets expire; or if the entity transfers the financial asset:
Notes to the Financial Statements for the year ended 30 June 2018
44
▪ where substantially all the risks and rewards have been transferred; or
▪ where the entity has not transferred substantially all the risks and rewards, if the entity has not
retained control.
Where the entity has neither transferred nor retained substantially all the risks and rewards or
transferred control, the asset continues to be recognised to the extent of the entity’s continuing
involvement in the asset. In that case, the entity also recognises an associated liability. The
transferred asset and the associated liability are measured on a basis that reflects the rights and
obligations that the entity has retained.
Continuing involvement that takes the form of a guarantee over the transferred asset is measured at
the lower of the original carrying amount of the asset and the maximum amount of consideration that
the entity could be required to repay.
A financial liability is derecognised when the obligation specified in the contract is discharged or
cancelled or expires. When an existing financial liability is replaced by another from the same lender
on substantially different terms, or the terms of an existing liability are substantially modified, such an
exchange or modification is treated as the derecognition of the original liability and the recognition of a
new liability. The difference in the respective carrying amounts is recognised in the net result.
iii. Offsetting financial instruments
Financial assets and financial liabilities are offset and the net amount is reported in the Statement of
Financial Position if there is a currently enforceable legal right to offset the recognised amounts and
there is an intention to settle on a net basis, or to realise the assets and settle the liabilities
simultaneously.
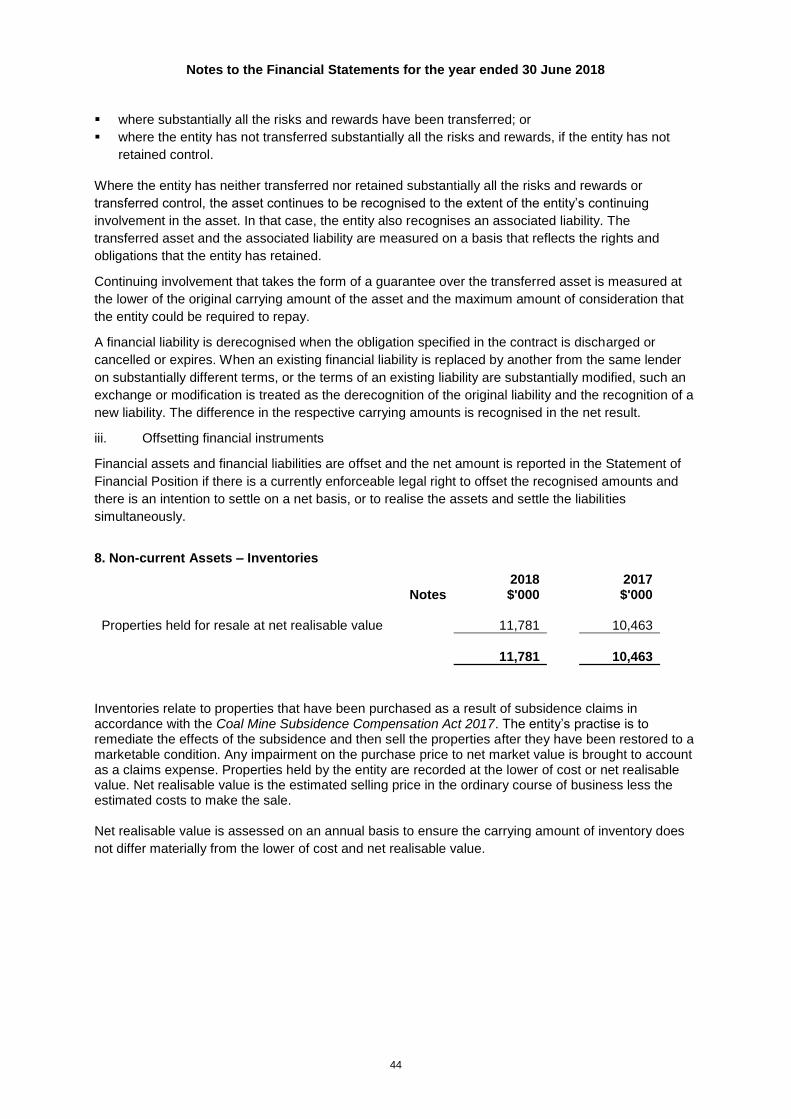
8. Non-current Assets – Inventories
Notes 2018 $'000
2017 $'000
Properties held for resale at net realisable value
11,781
10,463
11,781
10,463
Inventories relate to properties that have been purchased as a result of subsidence claims in accordance with the Coal Mine Subsidence Compensation Act 2017. The entity’s practise is to remediate the effects of the subsidence and then sell the properties after they have been restored to a marketable condition. Any impairment on the purchase price to net market value is brought to account as a claims expense. Properties held by the entity are recorded at the lower of cost or net realisable value. Net realisable value is the estimated selling price in the ordinary course of business less the estimated costs to make the sale. Net realisable value is assessed on an annual basis to ensure the carrying amount of inventory does
not differ materially from the lower of cost and net realisable value.
Notes to the Financial Statements for the year ended 30 June 2018
45
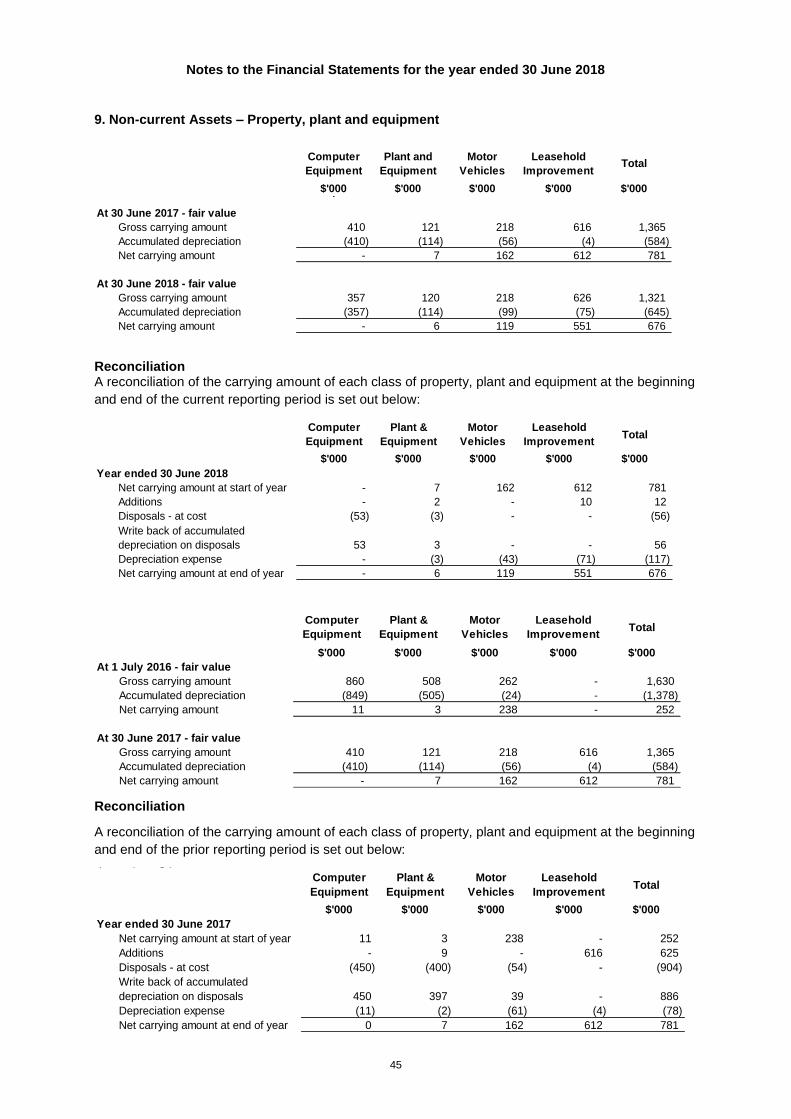
9. Non-current Assets – Property, plant and equipment
Reconciliation A reconciliation of the carrying amount of each class of property, plant and equipment at the beginning
and end of the current reporting period is set out below:
Reconciliation
A reconciliation of the carrying amount of each class of property, plant and equipment at the beginning
and end of the prior reporting period is set out below:
Computer
Equipment
Plant and
Equipment
Motor
Vehicles
Leasehold
ImprovementTotal
$'000 $'000 $'000 $'000 $'000Computer Plant and Motor Leasehold
At 30 June 2017 - fair value
Gross carrying amount 410 121 218 616 1,365
Accumulated depreciation (410) (114) (56) (4) (584)
Net carrying amount - 7 162 612 781
At 30 June 2018 - fair value
Gross carrying amount 357 120 218 626 1,321
Accumulated depreciation (357) (114) (99) (75) (645)
Net carrying amount - 6 119 551 676
Computer
Equipment
Plant &
Equipment
Motor
Vehicles
Leasehold
ImprovementTotal
$'000 $'000 $'000 $'000 $'000
Year ended 30 June 2018
Net carrying amount at start of year - 7 162 612 781
Additions - 2 - 10 12
Disposals - at cost (53) (3) - - (56)
Write back of accumulated
depreciation on disposals 53 3 - - 56
Depreciation expense - (3) (43) (71) (117)
Net carrying amount at end of year - 6 119 551 676
Computer
Equipment
Plant &
Equipment
Motor
Vehicles
Leasehold
ImprovementTotal
$'000 $'000 $'000 $'000 $'000
At 1 July 2016 - fair value
Gross carrying amount 860 508 262 - 1,630
Accumulated depreciation (849) (505) (24) - (1,378)
Net carrying amount 11 3 238 - 252
At 30 June 2017 - fair value
Gross carrying amount 410 121 218 616 1,365
Accumulated depreciation (410) (114) (56) (4) (584)
Net carrying amount - 7 162 612 781
Computer
Equipment
Plant &
Equipment
Motor
Vehicles
Leasehold
ImprovementTotal
$'000 $'000 $'000 $'000 $'000
Year ended 30 June 2017
Net carrying amount at start of year 11 3 238 - 252
Additions - 9 - 616 625
Disposals - at cost (450) (400) (54) - (904)
Write back of accumulated
depreciation on disposals 450 397 39 - 886
Depreciation expense (11) (2) (61) (4) (78)
Net carrying amount at end of year 0 7 162 612 781
prior reporting period is set out below:
Notes to the Financial Statements for the year ended 30 June 2018
46
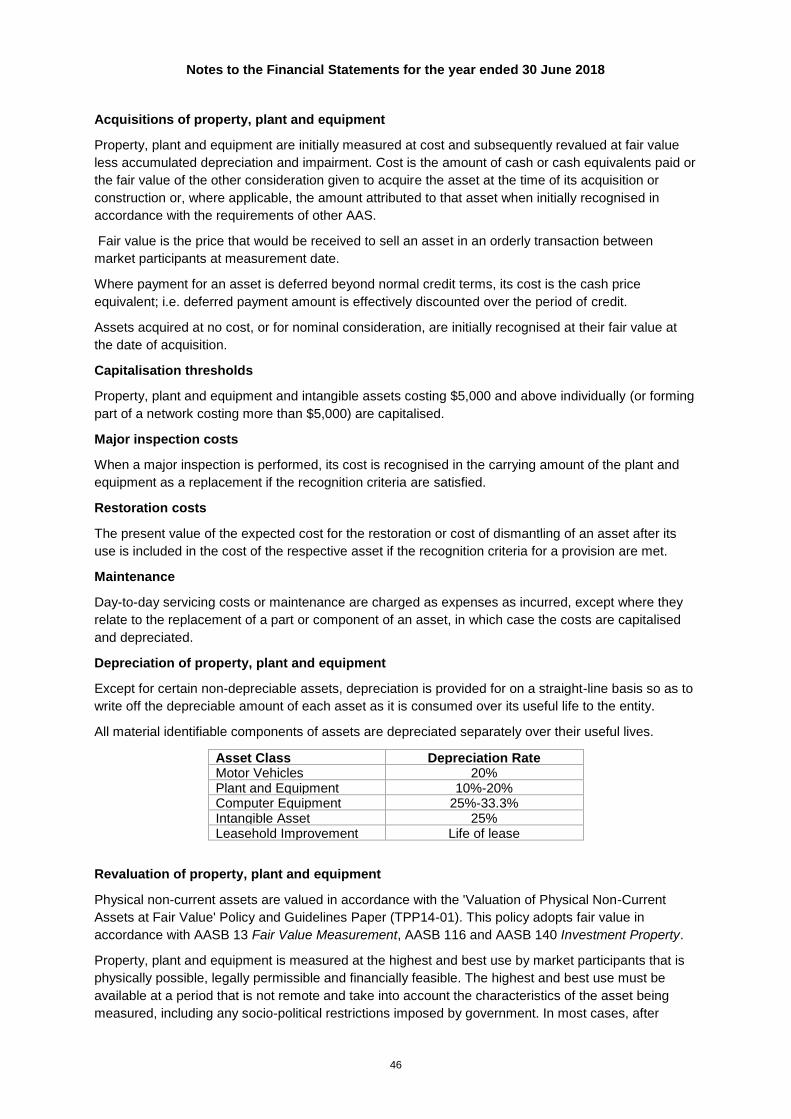
Acquisitions of property, plant and equipment
Property, plant and equipment are initially measured at cost and subsequently revalued at fair value
less accumulated depreciation and impairment. Cost is the amount of cash or cash equivalents paid or
the fair value of the other consideration given to acquire the asset at the time of its acquisition or
construction or, where applicable, the amount attributed to that asset when initially recognised in
accordance with the requirements of other AAS.
Fair value is the price that would be received to sell an asset in an orderly transaction between
market participants at measurement date.
Where payment for an asset is deferred beyond normal credit terms, its cost is the cash price
equivalent; i.e. deferred payment amount is effectively discounted over the period of credit.
Assets acquired at no cost, or for nominal consideration, are initially recognised at their fair value at
the date of acquisition.
Capitalisation thresholds
Property, plant and equipment and intangible assets costing $5,000 and above individually (or forming
part of a network costing more than $5,000) are capitalised.
Major inspection costs
When a major inspection is performed, its cost is recognised in the carrying amount of the plant and
equipment as a replacement if the recognition criteria are satisfied.
Restoration costs
The present value of the expected cost for the restoration or cost of dismantling of an asset after its
use is included in the cost of the respective asset if the recognition criteria for a provision are met.
Maintenance
Day-to-day servicing costs or maintenance are charged as expenses as incurred, except where they
relate to the replacement of a part or component of an asset, in which case the costs are capitalised
and depreciated.
Depreciation of property, plant and equipment
Except for certain non-depreciable assets, depreciation is provided for on a straight-line basis so as to
write off the depreciable amount of each asset as it is consumed over its useful life to the entity.
All material identifiable components of assets are depreciated separately over their useful lives.
Asset Class Depreciation Rate Motor Vehicles 20% Plant and Equipment 10%-20% Computer Equipment 25%-33.3% Intangible Asset 25% Leasehold Improvement Life of lease
Revaluation of property, plant and equipment
Physical non-current assets are valued in accordance with the 'Valuation of Physical Non-Current
Assets at Fair Value' Policy and Guidelines Paper (TPP14-01). This policy adopts fair value in
accordance with AASB 13 Fair Value Measurement, AASB 116 and AASB 140 Investment Property.
Property, plant and equipment is measured at the highest and best use by market participants that is
physically possible, legally permissible and financially feasible. The highest and best use must be
available at a period that is not remote and take into account the characteristics of the asset being
measured, including any socio-political restrictions imposed by government. In most cases, after
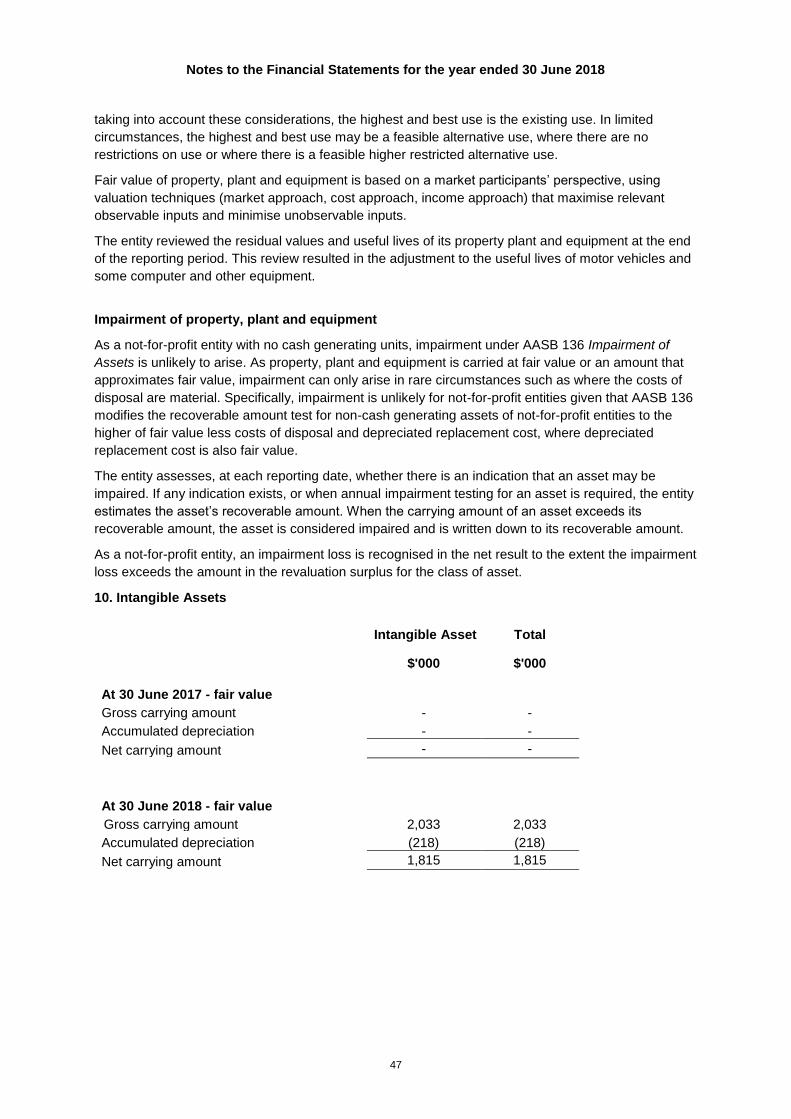
Notes to the Financial Statements for the year ended 30 June 2018
47
taking into account these considerations, the highest and best use is the existing use. In limited
circumstances, the highest and best use may be a feasible alternative use, where there are no
restrictions on use or where there is a feasible higher restricted alternative use.
Fair value of property, plant and equipment is based on a market participants’ perspective, using
valuation techniques (market approach, cost approach, income approach) that maximise relevant
observable inputs and minimise unobservable inputs.
The entity reviewed the residual values and useful lives of its property plant and equipment at the end
of the reporting period. This review resulted in the adjustment to the useful lives of motor vehicles and
some computer and other equipment.
Impairment of property, plant and equipment
As a not-for-profit entity with no cash generating units, impairment under AASB 136 Impairment of
Assets is unlikely to arise. As property, plant and equipment is carried at fair value or an amount that
approximates fair value, impairment can only arise in rare circumstances such as where the costs of
disposal are material. Specifically, impairment is unlikely for not-for-profit entities given that AASB 136
modifies the recoverable amount test for non-cash generating assets of not-for-profit entities to the
higher of fair value less costs of disposal and depreciated replacement cost, where depreciated
replacement cost is also fair value.
The entity assesses, at each reporting date, whether there is an indication that an asset may be
impaired. If any indication exists, or when annual impairment testing for an asset is required, the entity
estimates the asset’s recoverable amount. When the carrying amount of an asset exceeds its
recoverable amount, the asset is considered impaired and is written down to its recoverable amount.
As a not-for-profit entity, an impairment loss is recognised in the net result to the extent the impairment
loss exceeds the amount in the revaluation surplus for the class of asset.
10. Intangible Assets
Intangible Asset Total
$'000 $'000
At 30 June 2017 - fair value
Gross carrying amount - -
Accumulated depreciation - -
Net carrying amount - -
At 30 June 2018 - fair value
Gross carrying amount 2,033 2,033
Accumulated depreciation (218) (218)
Net carrying amount 1,815 1,815
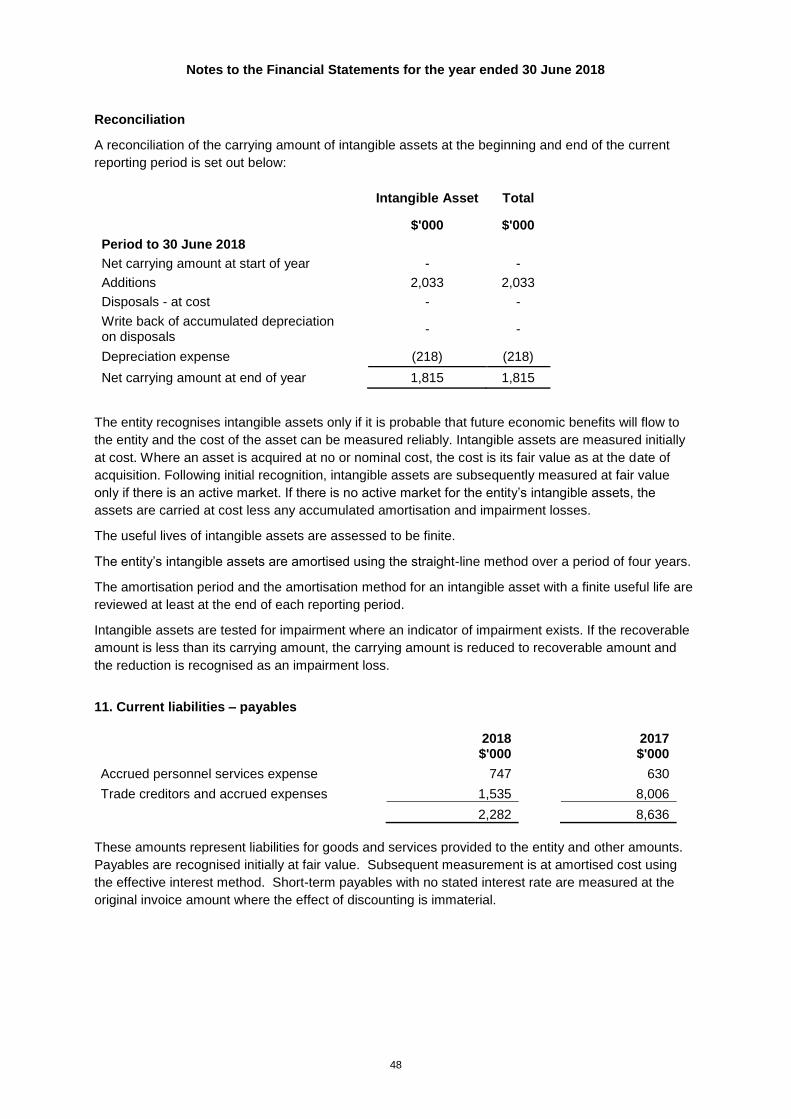
Notes to the Financial Statements for the year ended 30 June 2018
48
Reconciliation
A reconciliation of the carrying amount of intangible assets at the beginning and end of the current
reporting period is set out below:
Intangible Asset Total
$'000 $'000
Period to 30 June 2018
Net carrying amount at start of year - -
Additions 2,033 2,033
Disposals - at cost - -
Write back of accumulated depreciation on disposals
- -
Depreciation expense (218) (218)
Net carrying amount at end of year 1,815 1,815
The entity recognises intangible assets only if it is probable that future economic benefits will flow to
the entity and the cost of the asset can be measured reliably. Intangible assets are measured initially
at cost. Where an asset is acquired at no or nominal cost, the cost is its fair value as at the date of
acquisition. Following initial recognition, intangible assets are subsequently measured at fair value
only if there is an active market. If there is no active market for the entity’s intangible assets, the
assets are carried at cost less any accumulated amortisation and impairment losses.
The useful lives of intangible assets are assessed to be finite.
The entity’s intangible assets are amortised using the straight-line method over a period of four years.
The amortisation period and the amortisation method for an intangible asset with a finite useful life are
reviewed at least at the end of each reporting period.
Intangible assets are tested for impairment where an indicator of impairment exists. If the recoverable
amount is less than its carrying amount, the carrying amount is reduced to recoverable amount and
the reduction is recognised as an impairment loss.
11. Current liabilities – payables
2018 $'000
2017 $'000
Accrued personnel services expense 747 630
Trade creditors and accrued expenses 1,535 8,006
2,282 8,636
These amounts represent liabilities for goods and services provided to the entity and other amounts.
Payables are recognised initially at fair value. Subsequent measurement is at amortised cost using
the effective interest method. Short-term payables with no stated interest rate are measured at the
original invoice amount where the effect of discounting is immaterial.
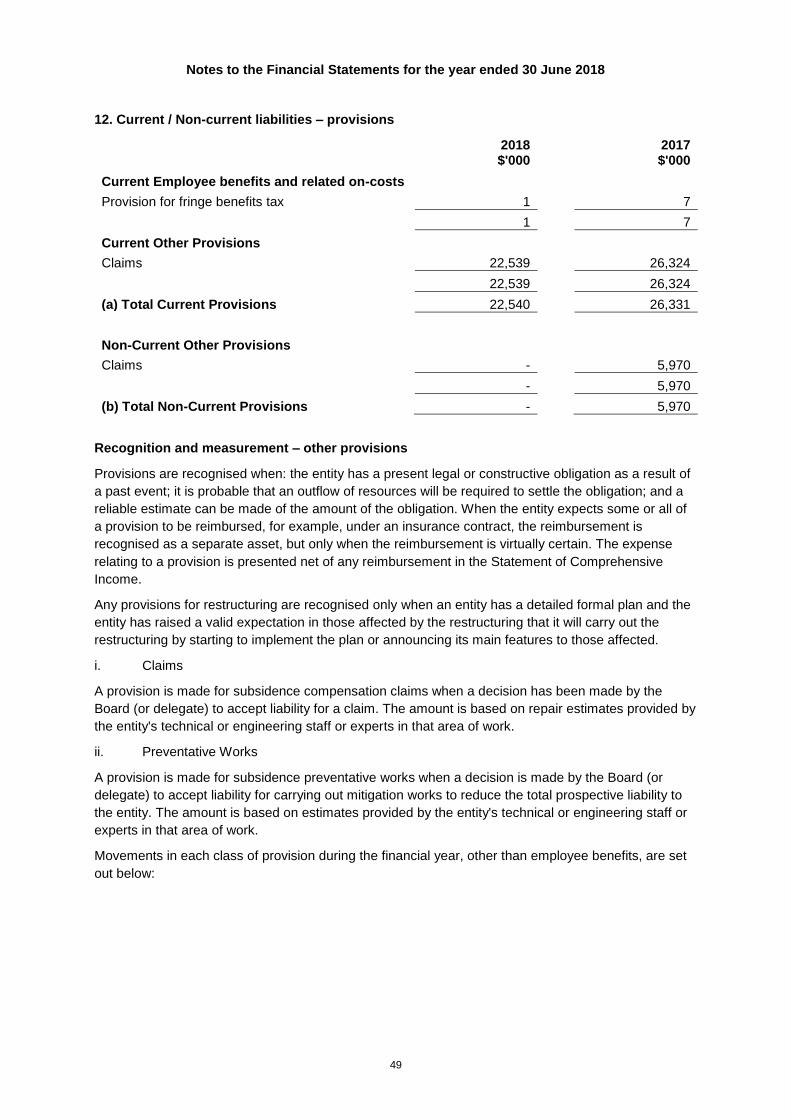
Notes to the Financial Statements for the year ended 30 June 2018
49
12. Current / Non-current liabilities – provisions
2018 $'000
2017 $'000
Current Employee benefits and related on-costs
Provision for fringe benefits tax 1 7
1 7
Current Other Provisions
Claims 22,539 26,324
22,539 26,324
(a) Total Current Provisions 22,540 26,331
Non-Current Other Provisions
Claims - 5,970
- 5,970
(b) Total Non-Current Provisions - 5,970
Recognition and measurement – other provisions
Provisions are recognised when: the entity has a present legal or constructive obligation as a result of
a past event; it is probable that an outflow of resources will be required to settle the obligation; and a
reliable estimate can be made of the amount of the obligation. When the entity expects some or all of
a provision to be reimbursed, for example, under an insurance contract, the reimbursement is
recognised as a separate asset, but only when the reimbursement is virtually certain. The expense
relating to a provision is presented net of any reimbursement in the Statement of Comprehensive
Income.
Any provisions for restructuring are recognised only when an entity has a detailed formal plan and the
entity has raised a valid expectation in those affected by the restructuring that it will carry out the
restructuring by starting to implement the plan or announcing its main features to those affected.
i. Claims
A provision is made for subsidence compensation claims when a decision has been made by the
Board (or delegate) to accept liability for a claim. The amount is based on repair estimates provided by
the entity's technical or engineering staff or experts in that area of work.
ii. Preventative Works
A provision is made for subsidence preventative works when a decision is made by the Board (or
delegate) to accept liability for carrying out mitigation works to reduce the total prospective liability to
the entity. The amount is based on estimates provided by the entity's technical or engineering staff or
experts in that area of work.
Movements in each class of provision during the financial year, other than employee benefits, are set
out below:
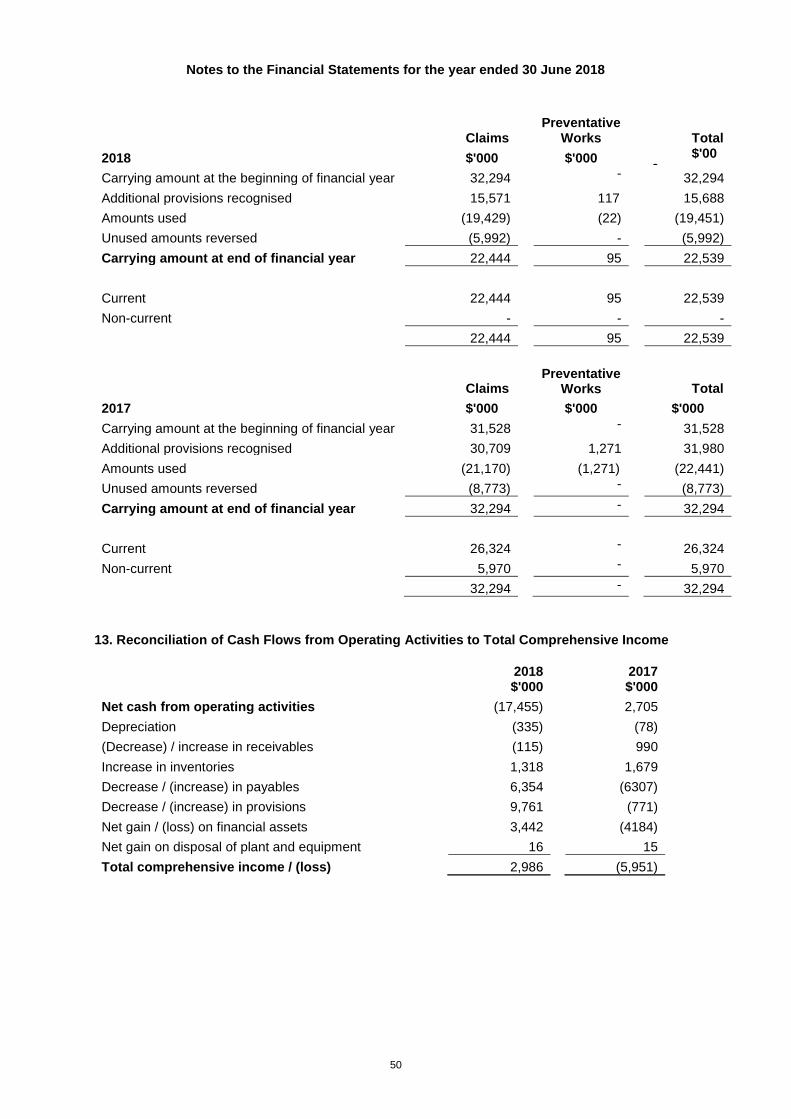
Notes to the Financial Statements for the year ended 30 June 2018
50
Claims
Preventative Works
Total
2018 $'000 $'000 $'00
0 Carrying amount at the beginning of financial year 32,294
- -
32,294
Additional provisions recognised 15,571 117 15,688
Amounts used (19,429) (22) (19,451)
Unused amounts reversed (5,992) - (5,992)
Carrying amount at end of financial year 22,444 95
22,539
Current 22,444 95 22,539
Non-current - - -
22,444 95
22,539
Claims
Preventative Works
Total
2017 $'000 $'000 $'000
Carrying amount at the beginning of financial year 31,528 - -
31,528
Additional provisions recognised 30,709 1,271 31,980
Amounts used (21,170) (1,271) (22,441)
Unused amounts reversed (8,773) - -
(8,773)
Carrying amount at end of financial year 32,294 - -
32,294
Current 26,324 - -
26,324
Non-current 5,970 - -
5,970
32,294 - -
32,294
13. Reconciliation of Cash Flows from Operating Activities to Total Comprehensive Income
2018 $'000
2017 $'000
Net cash from operating activities (17,455) 2,705
Depreciation (335) (78)
(Decrease) / increase in receivables (115) 990
Increase in inventories 1,318 1,679
Decrease / (increase) in payables 6,354 (6307)
Decrease / (increase) in provisions 9,761 (771)
Net gain / (loss) on financial assets 3,442 (4184)
Net gain on disposal of plant and equipment 16 15
Total comprehensive income / (loss) 2,986 (5,951)
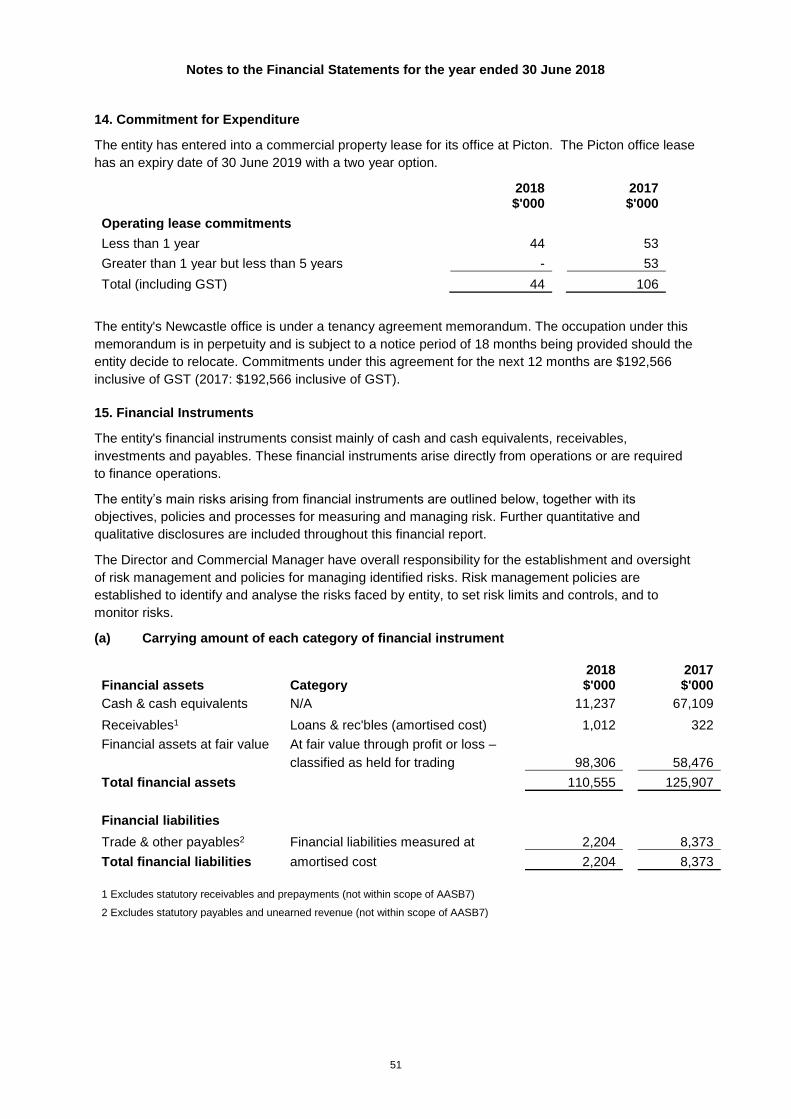
Notes to the Financial Statements for the year ended 30 June 2018
51
14. Commitment for Expenditure
The entity has entered into a commercial property lease for its office at Picton. The Picton office lease
has an expiry date of 30 June 2019 with a two year option.
2018 $'000
2017 $'000
Operating lease commitments
Less than 1 year 44 53
Greater than 1 year but less than 5 years - 53
Total (including GST) 44 106
The entity's Newcastle office is under a tenancy agreement memorandum. The occupation under this
memorandum is in perpetuity and is subject to a notice period of 18 months being provided should the
entity decide to relocate. Commitments under this agreement for the next 12 months are $192,566
inclusive of GST (2017: $192,566 inclusive of GST).
15. Financial Instruments
The entity's financial instruments consist mainly of cash and cash equivalents, receivables,
investments and payables. These financial instruments arise directly from operations or are required
to finance operations.
The entity’s main risks arising from financial instruments are outlined below, together with its
objectives, policies and processes for measuring and managing risk. Further quantitative and
qualitative disclosures are included throughout this financial report.
The Director and Commercial Manager have overall responsibility for the establishment and oversight
of risk management and policies for managing identified risks. Risk management policies are
established to identify and analyse the risks faced by entity, to set risk limits and controls, and to
monitor risks.
(a) Carrying amount of each category of financial instrument
Financial assets Category
2018 $'000
2017 $'000
Cash & cash equivalents N/A 11,237 67,109
Receivables1 Loans & rec'bles (amortised cost) 1,012 322
Financial assets at fair value At fair value through profit or loss –
classified as held for trading 98,306 58,476
Total financial assets 110,555 125,907
Financial liabilities
Trade & other payables2 Financial liabilities measured at 2,204 8,373
Total financial liabilities amortised cost 2,204 8,373
1 Excludes statutory receivables and prepayments (not within scope of AASB7)
2 Excludes statutory payables and unearned revenue (not within scope of AASB7)
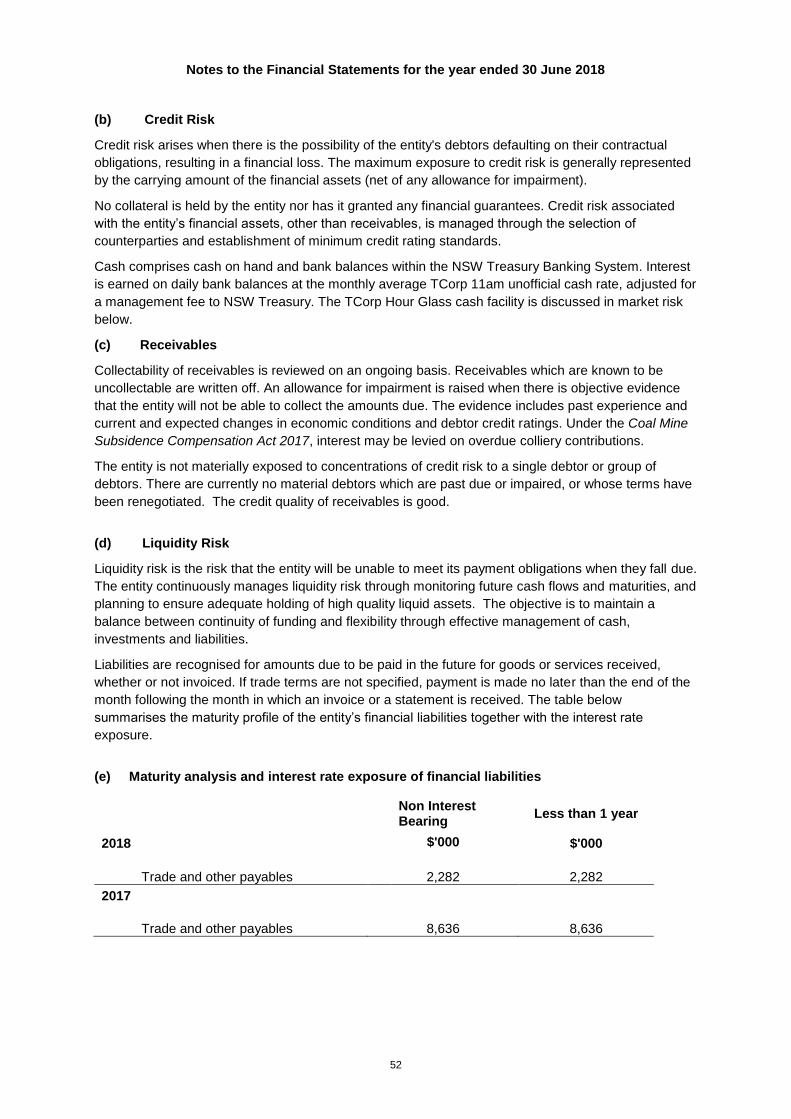
Notes to the Financial Statements for the year ended 30 June 2018
52
(b) Credit Risk
Credit risk arises when there is the possibility of the entity's debtors defaulting on their contractual
obligations, resulting in a financial loss. The maximum exposure to credit risk is generally represented
by the carrying amount of the financial assets (net of any allowance for impairment).
No collateral is held by the entity nor has it granted any financial guarantees. Credit risk associated
with the entity’s financial assets, other than receivables, is managed through the selection of
counterparties and establishment of minimum credit rating standards.
Cash comprises cash on hand and bank balances within the NSW Treasury Banking System. Interest
is earned on daily bank balances at the monthly average TCorp 11am unofficial cash rate, adjusted for
a management fee to NSW Treasury. The TCorp Hour Glass cash facility is discussed in market risk
below.
(c) Receivables
Collectability of receivables is reviewed on an ongoing basis. Receivables which are known to be
uncollectable are written off. An allowance for impairment is raised when there is objective evidence
that the entity will not be able to collect the amounts due. The evidence includes past experience and
current and expected changes in economic conditions and debtor credit ratings. Under the Coal Mine
Subsidence Compensation Act 2017, interest may be levied on overdue colliery contributions.
The entity is not materially exposed to concentrations of credit risk to a single debtor or group of
debtors. There are currently no material debtors which are past due or impaired, or whose terms have
been renegotiated. The credit quality of receivables is good.
(d) Liquidity Risk
Liquidity risk is the risk that the entity will be unable to meet its payment obligations when they fall due.
The entity continuously manages liquidity risk through monitoring future cash flows and maturities, and
planning to ensure adequate holding of high quality liquid assets. The objective is to maintain a
balance between continuity of funding and flexibility through effective management of cash,
investments and liabilities.
Liabilities are recognised for amounts due to be paid in the future for goods or services received,
whether or not invoiced. If trade terms are not specified, payment is made no later than the end of the
month following the month in which an invoice or a statement is received. The table below
summarises the maturity profile of the entity’s financial liabilities together with the interest rate
exposure.
(e) Maturity analysis and interest rate exposure of financial liabilities
Non Interest Bearing
Less than 1 year
2018 $'000 $'000
Trade and other payables 2,282 2,282
2017
Trade and other payables 8,636 8,636
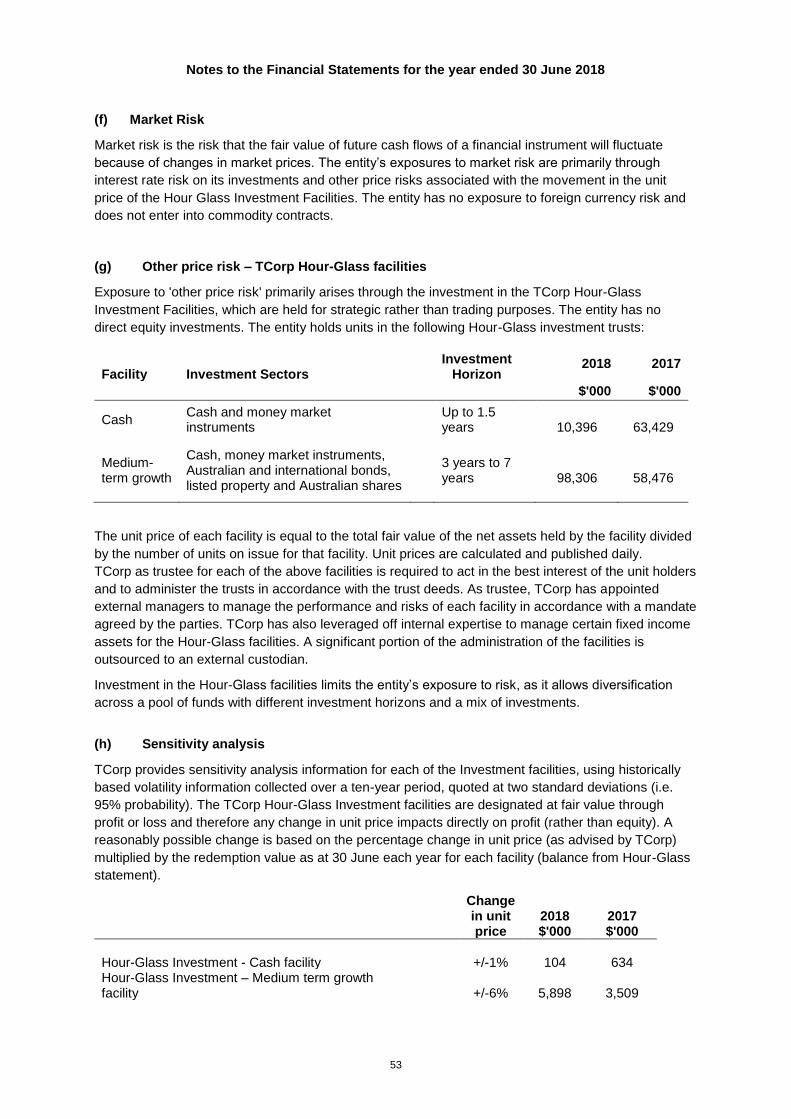
Notes to the Financial Statements for the year ended 30 June 2018
53
(f) Market Risk
Market risk is the risk that the fair value of future cash flows of a financial instrument will fluctuate
because of changes in market prices. The entity’s exposures to market risk are primarily through
interest rate risk on its investments and other price risks associated with the movement in the unit
price of the Hour Glass Investment Facilities. The entity has no exposure to foreign currency risk and
does not enter into commodity contracts.
(g) Other price risk – TCorp Hour-Glass facilities
Exposure to 'other price risk' primarily arises through the investment in the TCorp Hour-Glass
Investment Facilities, which are held for strategic rather than trading purposes. The entity has no
direct equity investments. The entity holds units in the following Hour-Glass investment trusts:
Facility Investment Sectors
Investment Horizon
2018 2017
$'000 $'000
Cash Cash and money market instruments
Up to 1.5 years
10,396
63,429
Medium-term growth
Cash, money market instruments, Australian and international bonds, listed property and Australian shares
3 years to 7 years
98,306
58,476
The unit price of each facility is equal to the total fair value of the net assets held by the facility divided
by the number of units on issue for that facility. Unit prices are calculated and published daily.
TCorp as trustee for each of the above facilities is required to act in the best interest of the unit holders
and to administer the trusts in accordance with the trust deeds. As trustee, TCorp has appointed
external managers to manage the performance and risks of each facility in accordance with a mandate
agreed by the parties. TCorp has also leveraged off internal expertise to manage certain fixed income
assets for the Hour-Glass facilities. A significant portion of the administration of the facilities is
outsourced to an external custodian.
Investment in the Hour-Glass facilities limits the entity’s exposure to risk, as it allows diversification
across a pool of funds with different investment horizons and a mix of investments.
(h) Sensitivity analysis
TCorp provides sensitivity analysis information for each of the Investment facilities, using historically
based volatility information collected over a ten-year period, quoted at two standard deviations (i.e.
95% probability). The TCorp Hour-Glass Investment facilities are designated at fair value through
profit or loss and therefore any change in unit price impacts directly on profit (rather than equity). A
reasonably possible change is based on the percentage change in unit price (as advised by TCorp)
multiplied by the redemption value as at 30 June each year for each facility (balance from Hour-Glass
statement).
Change in unit price
2018 $'000
2017 $'000
Hour-Glass Investment - Cash facility +/-1%
104
634 Hour-Glass Investment – Medium term growth facility +/-6% 5,898 3,509
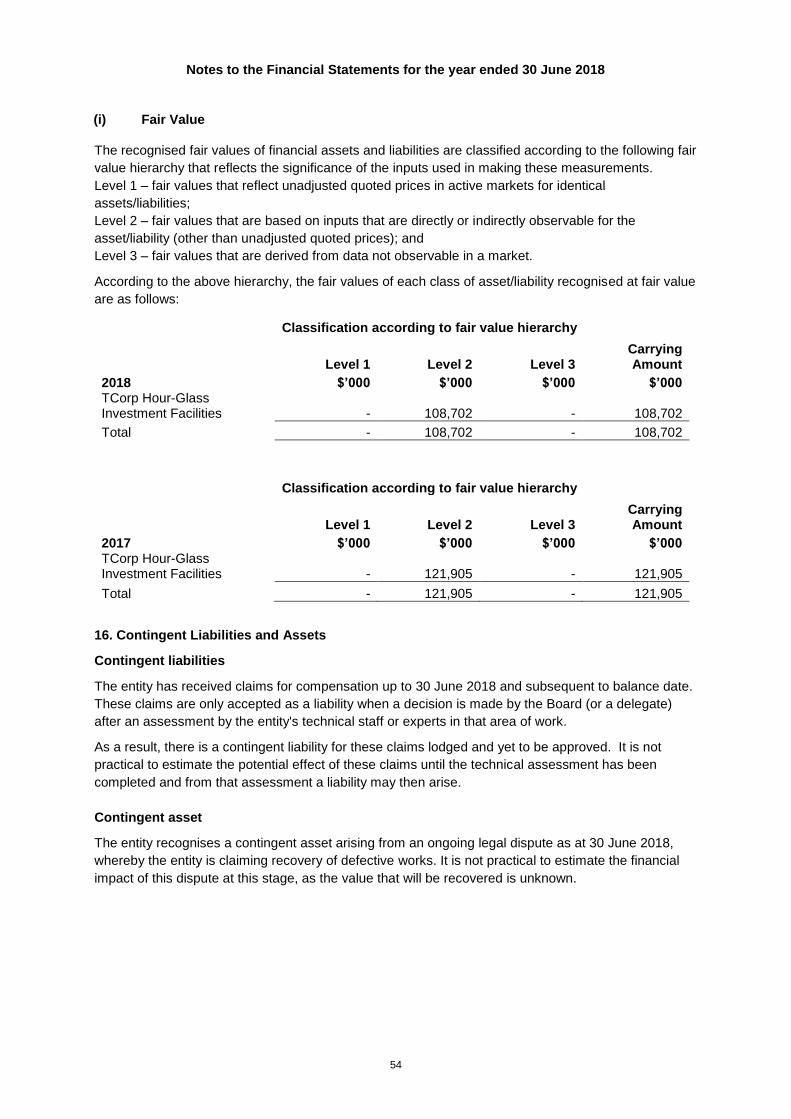
Notes to the Financial Statements for the year ended 30 June 2018
54
(i) Fair Value
The recognised fair values of financial assets and liabilities are classified according to the following fair
value hierarchy that reflects the significance of the inputs used in making these measurements.
Level 1 – fair values that reflect unadjusted quoted prices in active markets for identical
assets/liabilities;
Level 2 – fair values that are based on inputs that are directly or indirectly observable for the
asset/liability (other than unadjusted quoted prices); and
Level 3 – fair values that are derived from data not observable in a market.
According to the above hierarchy, the fair values of each class of asset/liability recognised at fair value
are as follows:
Classification according to fair value hierarchy
Level 1 Level 2 Level 3 Carrying Amount
2018 $’000 $’000 $’000 $’000 TCorp Hour-Glass Investment Facilities - 108,702 - 108,702
Total - 108,702 - 108,702
Classification according to fair value hierarchy
Level 1 Level 2 Level 3 Carrying Amount
2017 $’000 $’000 $’000 $’000 TCorp Hour-Glass Investment Facilities - 121,905 - 121,905
Total - 121,905 - 121,905
16. Contingent Liabilities and Assets
Contingent liabilities
The entity has received claims for compensation up to 30 June 2018 and subsequent to balance date.
These claims are only accepted as a liability when a decision is made by the Board (or a delegate)
after an assessment by the entity's technical staff or experts in that area of work.
As a result, there is a contingent liability for these claims lodged and yet to be approved. It is not
practical to estimate the potential effect of these claims until the technical assessment has been
completed and from that assessment a liability may then arise.
Contingent asset
The entity recognises a contingent asset arising from an ongoing legal dispute as at 30 June 2018,
whereby the entity is claiming recovery of defective works. It is not practical to estimate the financial
impact of this dispute at this stage, as the value that will be recovered is unknown.
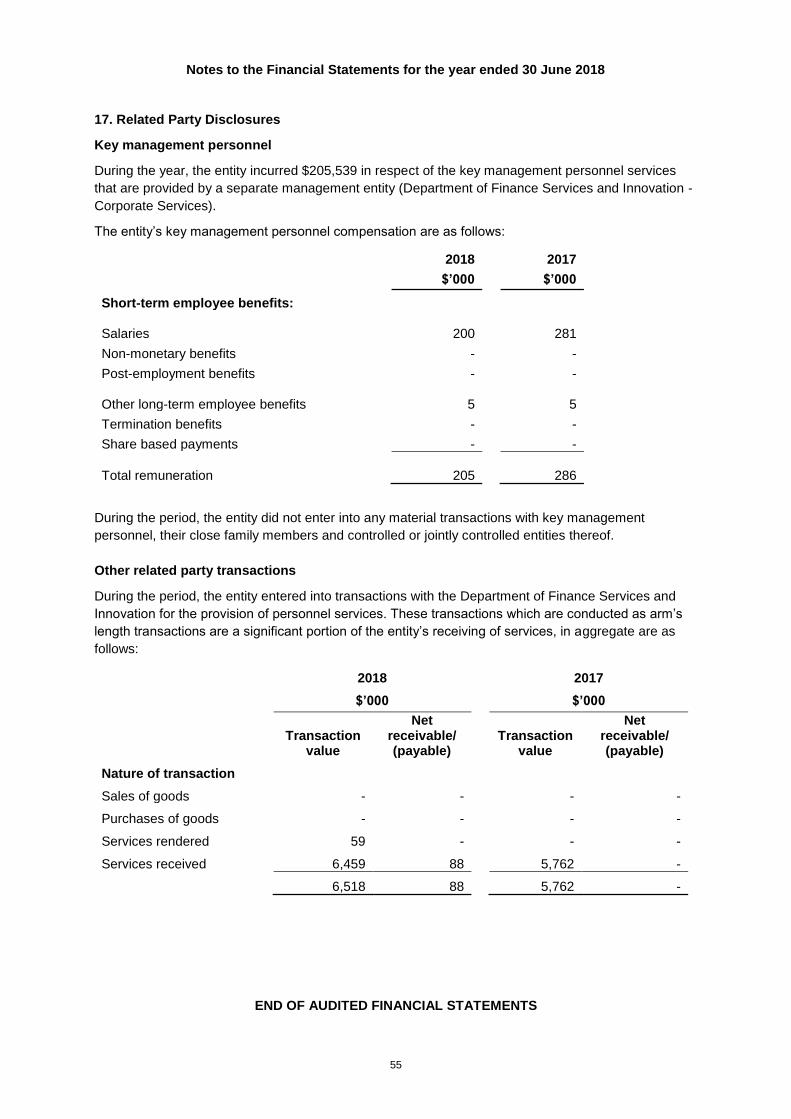
Notes to the Financial Statements for the year ended 30 June 2018
55
17. Related Party Disclosures
Key management personnel
During the year, the entity incurred $205,539 in respect of the key management personnel services
that are provided by a separate management entity (Department of Finance Services and Innovation -
Corporate Services).
The entity’s key management personnel compensation are as follows:
2018 2017
$’000 $’000
Short-term employee benefits:
Salaries 200
281
Non-monetary benefits - -
Post-employment benefits - -
Other long-term employee benefits 5
5
Termination benefits - -
Share based payments - -
Total remuneration 205
286
During the period, the entity did not enter into any material transactions with key management
personnel, their close family members and controlled or jointly controlled entities thereof.
Other related party transactions
During the period, the entity entered into transactions with the Department of Finance Services and
Innovation for the provision of personnel services. These transactions which are conducted as arm’s
length transactions are a significant portion of the entity’s receiving of services, in aggregate are as
follows:
2018
2017
$’000
$’000
Transaction value
Net receivable/ (payable)
Transaction value
Net receivable/ (payable)
Nature of transaction
Sales of goods - - - -
Purchases of goods - - - -
Services rendered 59 - - -
Services received 6,459 88 5,762 -
6,518 88 5,762 -
END OF AUDITED FINANCIAL STATEMENTS

Subsidence Advisory NSWwww.subsidenceadvisory.nsw.gov.au


![Study of land subsidence around the city of Shirazscientiairanica.sharif.edu/article_2167_b3bb54f3fcf13e2c...tectonic subsidence, and etc. [2]. Land subsidence, as a serious crisis,](https://static.fdocuments.us/doc/165x107/5f81603bf7f7323e190f6f7c/study-of-land-subsidence-around-the-city-of-s-tectonic-subsidence-and-etc.jpg)