ANNUAL REPORT COMPREHENSIVE RESEARCH ON RICE PROJECT … Spencer RP-14.pdf · 2008-01-11 ·...
24
PROJECT NO. RP-14 ANNUAL REPORT COMPREHENSIVE RESEARCH ON RICE January 1, 2007 - December 31, 2007 PROJECT TITLE: Assessing alternative methods for managing algae in California rice fields. PROJECT LEADER (include address): David F. Spencer, USDA-ARS, Associate in the A.E.S., Plant Science Department, Mail Stop 4, One Shields Ave, Davis, CA 95616 COOPERATORS: Carole A. Lembi, Professor, Department of Botany and Plant Pathology, Purdue University, West Lafayette, IN 47907 LEVEL OF 2007 FUNDING: $24,760 OBJECTIVES AND EXPERIMENTS CONDUCTED, BY LOCATION, TO ACCOMPLISH OBJECTIVES: Objective 1. Determine the effects of experimental compounds used for algae control and zinc sulfate on growth of Nostoc isolated from California rice fields under laboratory conditions We now have Nostoc from rice fields growing in a unialgal liquid culture in flasks at Dr. Lembi’s laboratory at Purdue University. It will be used in the following types of experiments. Experiment 1 : Nostoc will be exposed to a range of concentrations of flumioxazin and zinc sulfate that has been shown to be effective against this alga in 2006 tests. We will conduct additional laboratory experiments at Purdue University and outdoor experiments at Davis, California to determine the effectiveness of these compounds. Experiment 2: Once we have determined effective dosages of flumioxazin and zinc for killing Nostoc, we will set up experiments in which various amounts of rice straw are added incrementally to the cultures containing a known killing dose of either flumioxazin or zinc. If as we hypothesize flumioxazin or zinc are bound by the rice straw, we expect to see reduced efficacy of either as the amount of rice straw added increases. This type of experiment will answer questions about the relative binding capacity of rice straw residue for flumioxazin and zinc and may help predict/explain field responses. Experiment 3: We will set up experiments in which 0.25 g of rice straw and various amounts of calcium or magnesium are added incrementally to the cultures containing a known killing dose of copper. This will allow us to determine if the ameliorating influence of rice straw on copper toxicity can be reduced by adding additional positively charged ions. This experiment will answer questions about the relative binding capacity of rice straw residue for copper in the presence of competing cations and may help predict/explain field responses. The basic conditions for all of these experiments will be as follows. After treatment, the culture flasks (polycarbonate) will be placed in a controlled environment chamber at 100 μmol photons m -2 sec -1 , 25 C, and a 16:8 h light:dark photoperiod. After a two-week period, algae will be harvested, dried, and
Transcript of ANNUAL REPORT COMPREHENSIVE RESEARCH ON RICE PROJECT … Spencer RP-14.pdf · 2008-01-11 ·...
PROJECT NO. RP-14
ANNUAL REPORT COMPREHENSIVE RESEARCH ON RICE
January 1, 2007 - December 31, 2007
PROJECT TITLE: Assessing alternative methods for managing algae in California rice fields. PROJECT LEADER (include address): David F. Spencer, USDA-ARS, Associate in the A.E.S., Plant Science Department, Mail Stop 4, One Shields Ave, Davis, CA 95616 COOPERATORS: Carole A. Lembi, Professor, Department of Botany and Plant Pathology, Purdue University, West Lafayette, IN 47907 LEVEL OF 2007 FUNDING: $24,760 OBJECTIVES AND EXPERIMENTS CONDUCTED, BY LOCATION, TO ACCOMPLISH OBJECTIVES:
Objective 1. Determine the effects of experimental compounds used for algae control and zinc sulfate on growth of Nostoc isolated from California rice fields under laboratory conditions
We now have Nostoc from rice fields growing in a unialgal liquid culture in flasks at Dr. Lembi’s laboratory at Purdue University. It will be used in the following types of experiments. Experiment 1: Nostoc will be exposed to a range of concentrations of flumioxazin and zinc sulfate that has been shown to be effective against this alga in 2006 tests. We will conduct additional laboratory experiments at Purdue University and outdoor experiments at Davis, California to determine the effectiveness of these compounds. Experiment 2: Once we have determined effective dosages of flumioxazin and zinc for killing Nostoc, we will set up experiments in which various amounts of rice straw are added incrementally to the cultures containing a known killing dose of either flumioxazin or zinc. If as we hypothesize flumioxazin or zinc are bound by the rice straw, we expect to see reduced efficacy of either as the amount of rice straw added increases. This type of experiment will answer questions about the relative binding capacity of rice straw residue for flumioxazin and zinc and may help predict/explain field responses. Experiment 3: We will set up experiments in which 0.25 g of rice straw and various amounts of calcium or magnesium are added incrementally to the cultures containing a known killing dose of copper. This will allow us to determine if the ameliorating influence of rice straw on copper toxicity can be reduced by adding additional positively charged ions. This experiment will answer questions about the relative binding capacity of rice straw residue for copper in the presence of competing cations and may help predict/explain field responses. The basic conditions for all of these experiments will be as follows. After treatment, the culture flasks (polycarbonate) will be placed in a controlled environment chamber at 100 µmol photons m-2 sec-1, 25 C, and a 16:8 h light:dark photoperiod. After a two-week period, algae will be harvested, dried, and
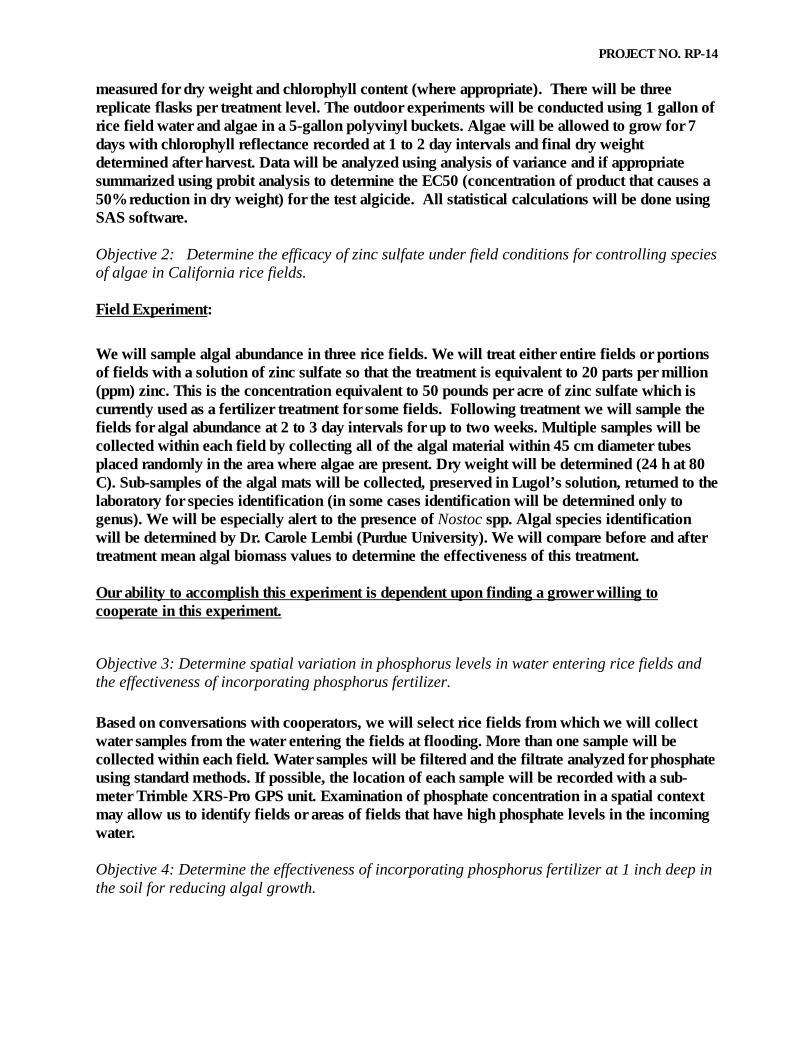
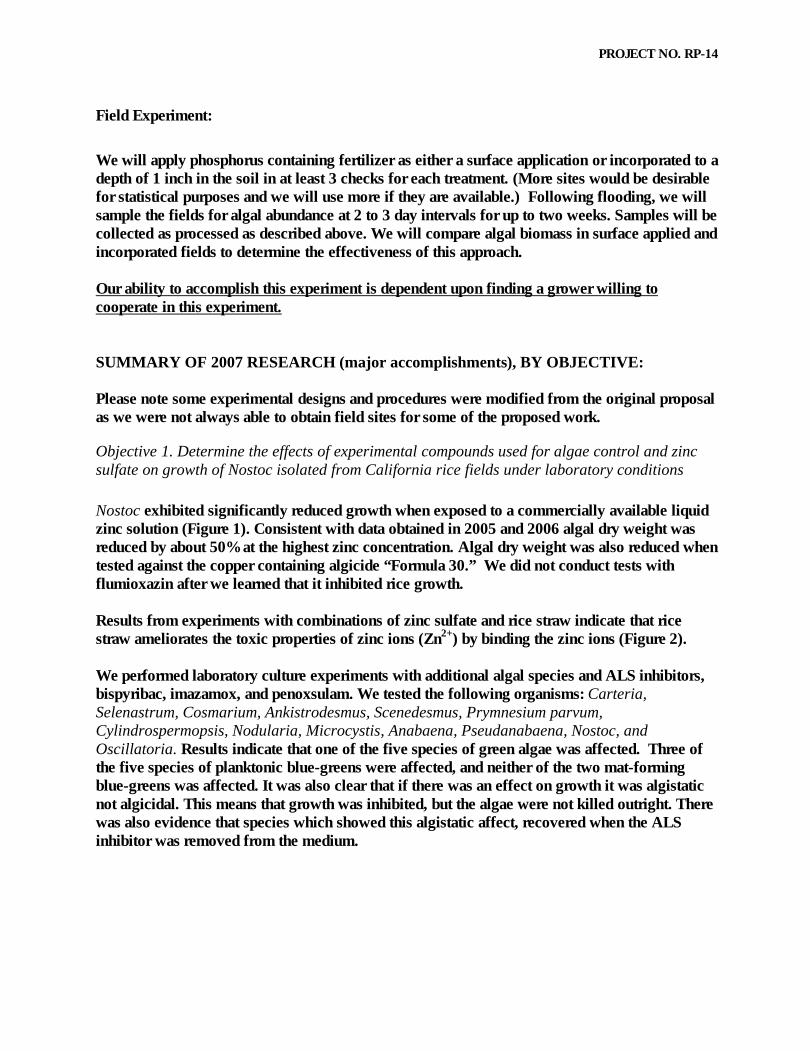
PROJECT NO. RP-14 measured for dry weight and chlorophyll content (where appropriate). There will be three replicate flasks per treatment level. The outdoor experiments will be conducted using 1 gallon of rice field water and algae in a 5-gallon polyvinyl buckets. Algae will be allowed to grow for 7 days with chlorophyll reflectance recorded at 1 to 2 day intervals and final dry weight determined after harvest. Data will be analyzed using analysis of variance and if appropriate summarized using probit analysis to determine the EC50 (concentration of product that causes a 50% reduction in dry weight) for the test algicide. All statistical calculations will be done using SAS software. Objective 2: Determine the efficacy of zinc sulfate under field conditions for controlling species of algae in California rice fields. Field Experiment:
We will sample algal abundance in three rice fields. We will treat either entire fields or portions of fields with a solution of zinc sulfate so that the treatment is equivalent to 20 parts per million (ppm) zinc. This is the concentration equivalent to 50 pounds per acre of zinc sulfate which is currently used as a fertilizer treatment for some fields. Following treatment we will sample the fields for algal abundance at 2 to 3 day intervals for up to two weeks. Multiple samples will be collected within each field by collecting all of the algal material within 45 cm diameter tubes placed randomly in the area where algae are present. Dry weight will be determined (24 h at 80 C). Sub-samples of the algal mats will be collected, preserved in Lugol’s solution, returned to the laboratory for species identification (in some cases identification will be determined only to genus). We will be especially alert to the presence of Nostoc spp. Algal species identification will be determined by Dr. Carole Lembi (Purdue University). We will compare before and after treatment mean algal biomass values to determine the effectiveness of this treatment. Our ability to accomplish this experiment is dependent upon finding a grower willing to cooperate in this experiment.
Objective 3: Determine spatial variation in phosphorus levels in water entering rice fields and the effectiveness of incorporating phosphorus fertilizer.
Based on conversations with cooperators, we will select rice fields from which we will collect water samples from the water entering the fields at flooding. More than one sample will be collected within each field. Water samples will be filtered and the filtrate analyzed for phosphate using standard methods. If possible, the location of each sample will be recorded with a sub-meter Trimble XRS-Pro GPS unit. Examination of phosphate concentration in a spatial context may allow us to identify fields or areas of fields that have high phosphate levels in the incoming water. Objective 4: Determine the effectiveness of incorporating phosphorus fertilizer at 1 inch deep in the soil for reducing algal growth.
PROJECT NO. RP-14
Field Experiment:
We will apply phosphorus containing fertilizer as either a surface application or incorporated to a depth of 1 inch in the soil in at least 3 checks for each treatment. (More sites would be desirable for statistical purposes and we will use more if they are available.) Following flooding, we will sample the fields for algal abundance at 2 to 3 day intervals for up to two weeks. Samples will be collected as processed as described above. We will compare algal biomass in surface applied and incorporated fields to determine the effectiveness of this approach. Our ability to accomplish this experiment is dependent upon finding a grower willing to cooperate in this experiment. SUMMARY OF 2007 RESEARCH (major accomplishments), BY OBJECTIVE: Please note some experimental designs and procedures were modified from the original proposal as we were not always able to obtain field sites for some of the proposed work.
Objective 1. Determine the effects of experimental compounds used for algae control and zinc sulfate on growth of Nostoc isolated from California rice fields under laboratory conditions
Nostoc exhibited significantly reduced growth when exposed to a commercially available liquid zinc solution (Figure 1). Consistent with data obtained in 2005 and 2006 algal dry weight was reduced by about 50% at the highest zinc concentration. Algal dry weight was also reduced when tested against the copper containing algicide “Formula 30.” We did not conduct tests with flumioxazin after we learned that it inhibited rice growth.
Results from experiments with combinations of zinc sulfate and rice straw indicate that rice straw ameliorates the toxic properties of zinc ions (Zn2+) by binding the zinc ions (Figure 2).
We performed laboratory culture experiments with additional algal species and ALS inhibitors, bispyribac, imazamox, and penoxsulam. We tested the following organisms: Carteria, Selenastrum, Cosmarium, Ankistrodesmus, Scenedesmus, Prymnesium parvum, Cylindrospermopsis, Nodularia, Microcystis, Anabaena, Pseudanabaena, Nostoc, and Oscillatoria. Results indicate that one of the five species of green algae was affected. Three of the five species of planktonic blue-greens were affected, and neither of the two mat-forming blue-greens was affected. It was also clear that if there was an effect on growth it was algistatic not algicidal. This means that growth was inhibited, but the algae were not killed outright. There was also evidence that species which showed this algistatic affect, recovered when the ALS inhibitor was removed from the medium.

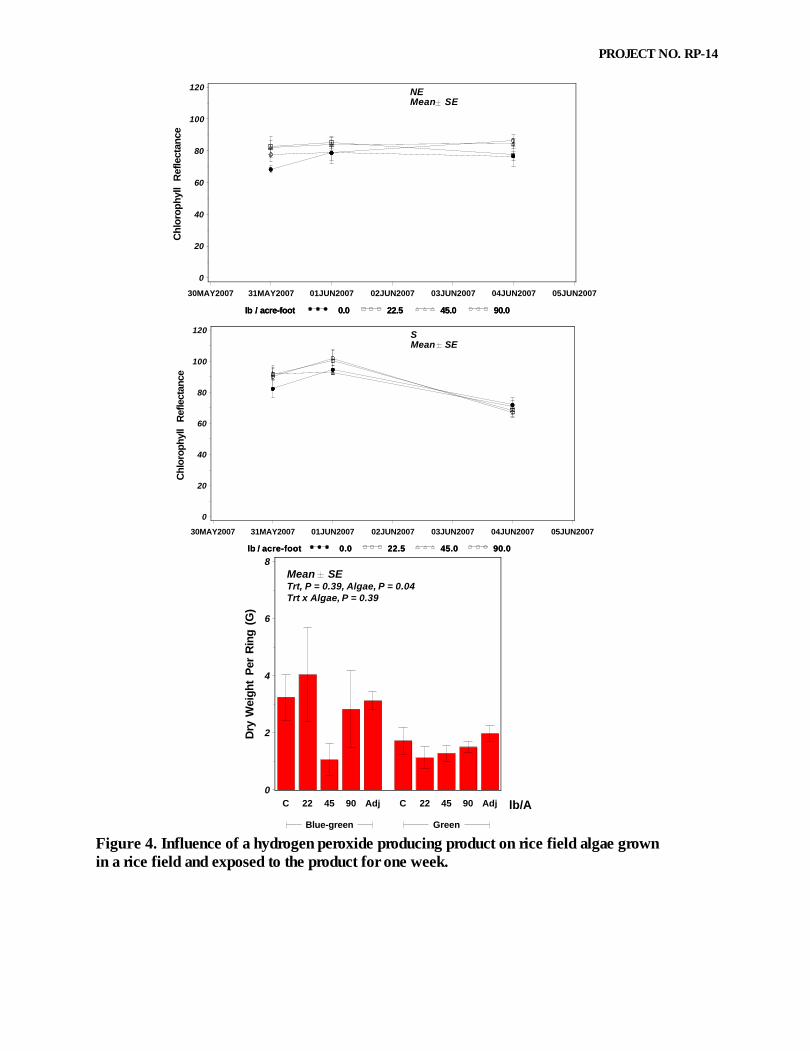
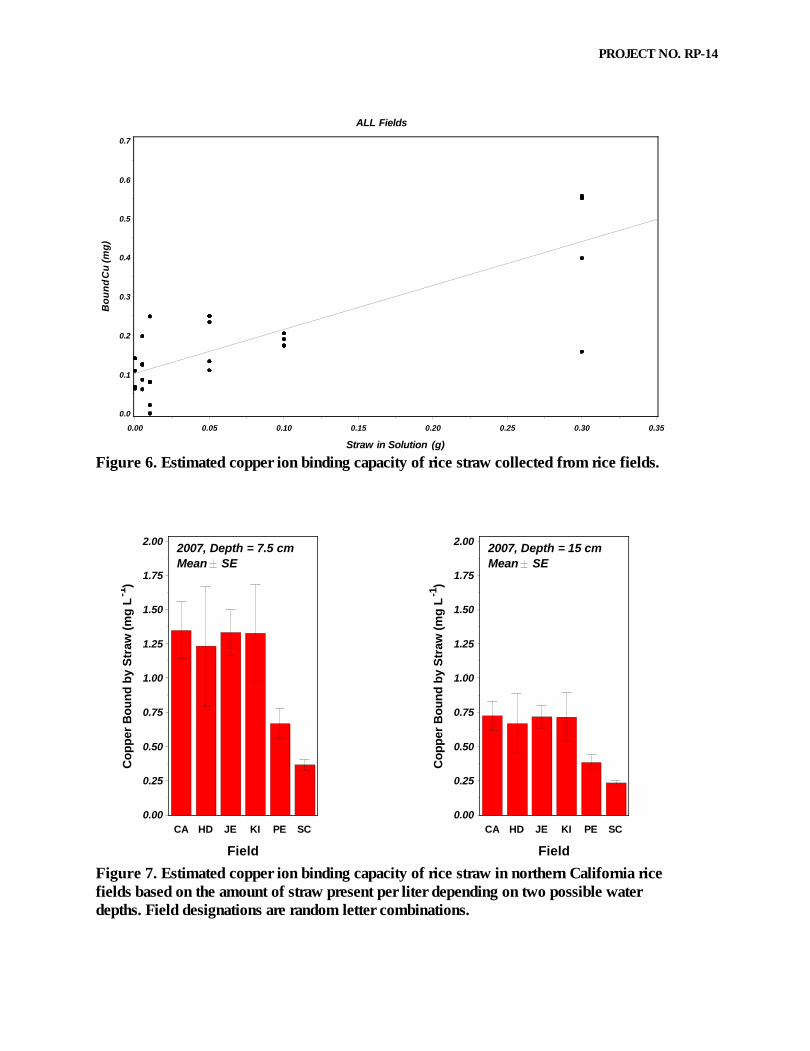
PROJECT NO. RP-14 Nostoc spongiaeforme was grown at 25 C, 13:11 h light:dark cycle, 400 �mM m-2 s-1 for one week. There were four replicate flasks at each of the following Londax-Shark Mix (L-S) concentrations: 0, 0.9, 2.25, 4.5, and 9 ounces acre-1. These rates were chosen because 9 ounces acre-1 is the normal use rate for this product and because we were especially interested in knowing if lower rates would be effective. They would presumably reduce injury to rice when applied early in the season for algal control. The initial pH of the culture medium was adjusted to either 6.7 or 7.1 using 1 N NaOH or 1 N HCl. After one week 10 ml of culture medium was collected and the chlorophyll content determined. The logarithms (base 2) of starting and ending chlorophyll concentrations were used in linear regression versus time to determine the growth rate yielding growth rates which have units of doublings day-1. Results are shown in Figure 3. In three of the four experiments there was no statistically detectable influence on Nostoc spongiaeforme growth rates. In experiment 4 there was a statistically significant effect. However, there was only a 12% decrease in growth rate at the highest level of L-S examined. On May 30, 2007 we deployed twelve, 18-inch diameter PVC rings that were 10 inches tall, at two locations in an active rice field. At one location green algae were the dominant forms and at a second location blue-green algae (cyanobacteria) were the dominant species. The rings were randomly assigned to one of the following treatments: 0 (control), 22.5, 45, or 90 lbs acre-1 of sodium carbonate peroxyhydrate. This algicide releases hydrogen peroxide which has been shown to kill algae. There were three rings per treatment. On the day of treatment and on two subsequent dates we measured the chlorophyll reflectance with a CM-1000 chlorophyll meter, and determined algal dry weight one week after treatment. Results from this experiment are shown in Figure 4. There was no significant effect of the treatment on either chlorophyll reflectance or algal dry weight at either of the locations. We repeated this experiment in this field with similar results. These results confirm our previously reported findings with sodium carbonate peroxyhydrate in smaller scale tests. In April, 2007, we collected ten rice straw samples at equidistant points along diagonal transects across each of six rice fields. The samples consisted of all of the rice straw on the surface of the field within a randomly placed 9 inch by 12 inch quadrat. Rice straw was return to the laboratory and weighed. This material was later used to measure the potential of rice straw to bind copper ions. We did this by titrating de-ionized water with a standard solution of copper sulfate and at the same time determining the concentration of copper ion in solution in the water with a copper selective ion electrode. This procedure was repeated except that weighed amounts of rice straw were added to the de-ionized water prior to the copper sulfate. Results for straw from two fields are shown in Figure 5. The difference between the copper ion concentration with and without rice straw in the solution was taken as a measure of the amount of copper bound by the rice straw. We summarized results from the rice field straw measurements by plotting copper binding capacity against the amount of straw in the solution (Figure 6). There was a significant linear relationship between these two variables (Copper bound (mg) = 0.102 + 1.126 x rice straw (g), P < 0.0001, N=90, R2=0.34). The regression equation was used to estimate the total amount of copper that could be bound by the straw present in each of the six fields at the beginning of the growing season. The amount of straw per liter of water will depend on the depth of water in the rice field so we based the calculations on

PROJECT NO. RP-14 the field being flooded to a depth of 15 cm (6 inches) or 30 cm (12 inches). The predicted binding capacity for rice straw present in the fields examined, given these conditions are shown in Figure 7. These results suggest that from 0.7 to 1.25 mg L-1 of copper can be bound by the straw present in a rice field. This is a significant portion of the copper that may be applied during a normal application of CuSO4 for algae control.

PROJECT NO. RP-14
Mean SE Tukey's HSDAlpha = 0.05
5/22/07A
B B
C C C
Alg
ae
Dry
We
igh
t (g
)
0.0
0.1
0.2
0.3
0.4
0.5
0.6
Treatment
Control
1CS
2CS
0.4F
30
0.8F
30
1.6F
30
Mean SE Tukey's HSDAlpha = 0.05
5/22/07A
AB B AB AB B
C
Alg
ae
Dry
We
igh
t (g
)
0.0
0.1
0.2
0.3
0.4
0.5
0.6
Treatment
Control
1CS
2CS
ZN3.96
ZN7.9
ZN15.9
ZN31.7
Mean SE Tukey's HSDAlpha = 0.05
6/26/07A
BC BC B BC
C
Alg
ae
Dry
We
igh
t (g
)
0.0
0.1
0.2
0.3
0.4
0.5
0.6
0.7
0.8
Treatment
Contro
l
1CS
2CS
0.4F
30
0.8F
30
1.6F
30
Mean SE Tukey's HSDAlpha = 0.05
6/26/07A
BC C
ABC ABC
AB
BC
Alg
ae D
ry W
eig
ht
(g)
0.0
0.1
0.2
0.3
0.4
0.5
0.6
0.7
0.8
Treatment
Control
1CS
2CS
ZN3.96
ZN7.9
ZN15.9
ZN31.7
Figure 1. Response of field collected mixed algae (including Nostoc spongiaeforme) to treatment with the algicide, Formula 30 (F30) and zinc sulfate (Zn). The number that is part of the label is the concentration in parts per million of the particular treatment. The bars with ‘CS’ in the label are from copper sulfate treatments at either 1 or 2 parts per million. They were included as references as they represent the “standard” treatment.

PROJECT NO. RP-14
Zinc, P = 0.10Rice Straw, P < 0.0001Zinc x Rice Straw, P = 0.0001
-1C
hlo
rop
hyl
l A
(
g L
)
0
100
200
300
400
500
Zn (ppm)
Rice Straw0.00 0.10 0.25 0.50
0.0 0.4 0.0 0.4 0.0 0.4 0.0 0.4
Figure 2. Interaction between rice straw and zinc (applied as zinc sulfate) in laboratory cultures. Values are the mean + 1 standard error.
-1
GR = 0.67 + 0.0035 x LS, P = 0.51, N = 20Experiment 1, pH = 6.7
Mean SE
Do
ub
lin
gs
Day
0.00
0.25
0.50
0.75
1.00
1.25
L-S Mix (ounces / acre)
0 1 2 3 4 5 6 7 8 9 10
-1
GR = 0.73 - 0.0043 x LS, P = 0.27, N = 20Experiment 2, pH = 7.1
Mean SE
Do
ub
lin
gs
Da
y
0.00
0.25
0.50
0.75
1.00
1.25
L-S Mix (ounces / acre)
0 1 2 3 4 5 6 7 8 9 10
-1
GR = 0.68 + 0.001 x LS, P = 0.82, N = 20Experiment 3, pH = 6.7
Mean SE
Do
ub
lin
gs
Day
0.00
0.25
0.50
0.75
1.00
1.25
L-S Mix (ounces / acre)
0 1 2 3 4 5 6 7 8 9 10
-1
GR = 0.76 - 0.011 x LS, P = 0.01, N = 20Experiment 4, pH = 7.1
Mean SE
Do
ub
lin
gs
Day
0.00
0.25
0.50
0.75
1.00
1.25
L-S Mix (ounces / acre)
0 1 2 3 4 5 6 7 8 9 10
Figure 3. Response of Nostoc spongiaeforme (aka “black algae”) to different concentrations of a Londax-Shark mixture.
PROJECT NO. RP-14
NEMean SE
lb / acre-foot 0.0 22.5 45.0 90.0lb / acre-foot 0.0 22.5 45.0 90.0
Ch
loro
ph
yll
Ref
lect
ance
0
20
40
60
80
100
120
30MAY2007 31MAY2007 01JUN2007 02JUN2007 03JUN2007 04JUN2007 05JUN2007
SMean SE
lb / acre-foot 0.0 22.5 45.0 90.0lb / acre-foot 0.0 22.5 45.0 90.0
Ch
loro
ph
yll
Ref
lect
ance
0
20
40
60
80
100
120
30MAY2007 31MAY2007 01JUN2007 02JUN2007 03JUN2007 04JUN2007 05JUN2007
Mean SETrt, P = 0.39, Algae, P = 0.04Trt x Algae, P = 0.39
Dry
Wei
gh
t P
er R
ing
(G
)
0
2
4
6
8
lb/A
Blue-green Green
C 22 45 90 Adj C 22 45 90 Adj
Figure 4. Influence of a hydrogen peroxide producing product on rice field algae grown in a rice field and exposed to the product for one week.

PROJECT NO. RP-14
Field HD-1
Straw in Solution (g) 0.000 0.005 0.010 0.050 0.100 0.300Straw in Solution (g) 0.000 0.005 0.010 0.050 0.100 0.300
Co
pp
er
Me
as
ure
d in
So
luti
on
(pp
m)
0.0
0.2
0.4
0.6
0.8
1.0
Copper Added to Solution (ppm)
0.0 0.1 0.2 0.3 0.4 0.5 0.6 0.7 0.8 0.9 1.0
Field C3
Straw in Solution (g) 0.000 0.005 0.010 0.050 0.100 0.300Straw in Solution (g) 0.000 0.005 0.010 0.050 0.100 0.300
Co
pp
er
Me
as
ure
d in
So
luti
on
(pp
m)
0.0
0.2
0.4
0.6
0.8
1.0
Copper Added to Solution (ppm)
0.0 0.1 0.2 0.3 0.4 0.5 0.6 0.7 0.8 0.9 1.0
Figure 5. Influence of rice straw on the availability of copper ion (Cu2+) in solution as determined by a copper specific ion electrode. Straw in these determinations was collected in April, 2007 from rice fields.
PROJECT NO. RP-14
ALL Fields
Bo
un
d C
u (
mg
)
0.0
0.1
0.2
0.3
0.4
0.5
0.6
0.7
Straw in Solution (g)
0.00 0.05 0.10 0.15 0.20 0.25 0.30 0.35
Figure 6. Estimated copper ion binding capacity of rice straw collected from rice fields.
-1
2007, Depth = 7.5 cmMean SE
Co
pp
er B
ou
nd
by
Str
aw (
mg
L
)
0.00
0.25
0.50
0.75
1.00
1.25
1.50
1.75
2.00
Field
CA HD JE KI PE SC
-1
2007, Depth = 15 cm Mean SE
Co
pp
er B
ou
nd
by
Str
aw (
mg
L
)
0.00
0.25
0.50
0.75
1.00
1.25
1.50
1.75
2.00
Field
CA HD JE KI PE SC
Figure 7. Estimated copper ion binding capacity of rice straw in northern California rice fields based on the amount of straw present per liter depending on two possible water depths. Field designations are random letter combinations.
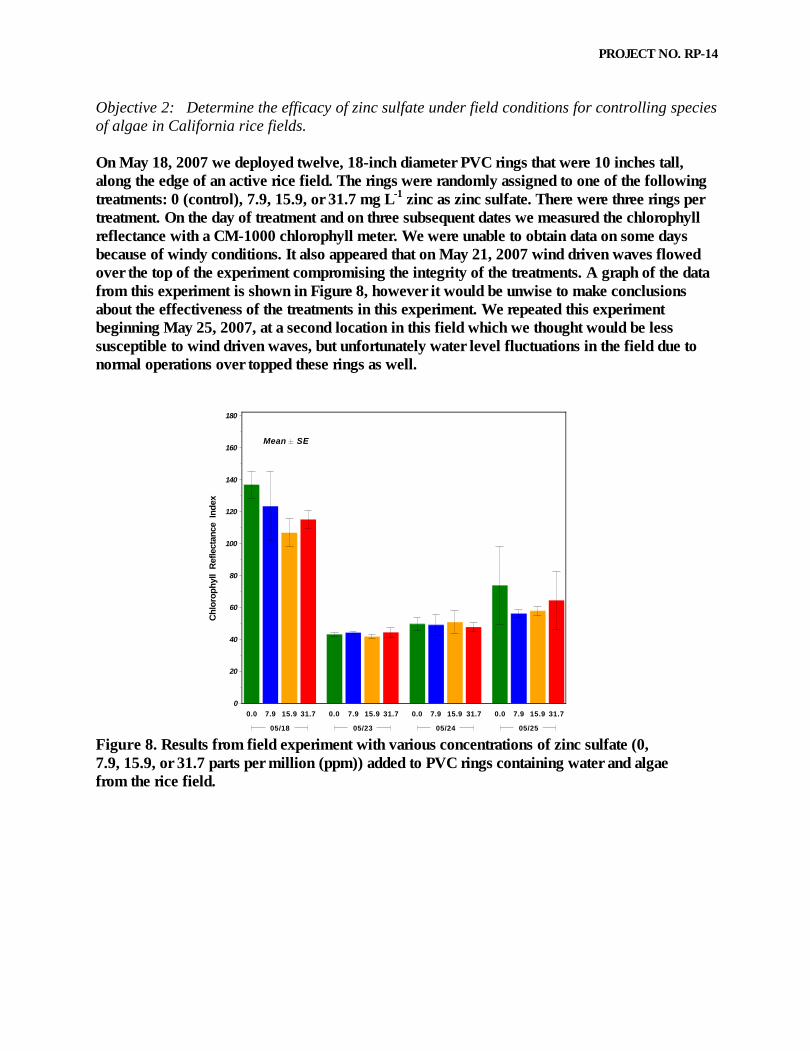
PROJECT NO. RP-14 Objective 2: Determine the efficacy of zinc sulfate under field conditions for controlling species of algae in California rice fields. On May 18, 2007 we deployed twelve, 18-inch diameter PVC rings that were 10 inches tall, along the edge of an active rice field. The rings were randomly assigned to one of the following treatments: 0 (control), 7.9, 15.9, or 31.7 mg L-1 zinc as zinc sulfate. There were three rings per treatment. On the day of treatment and on three subsequent dates we measured the chlorophyll reflectance with a CM-1000 chlorophyll meter. We were unable to obtain data on some days because of windy conditions. It also appeared that on May 21, 2007 wind driven waves flowed over the top of the experiment compromising the integrity of the treatments. A graph of the data from this experiment is shown in Figure 8, however it would be unwise to make conclusions about the effectiveness of the treatments in this experiment. We repeated this experiment beginning May 25, 2007, at a second location in this field which we thought would be less susceptible to wind driven waves, but unfortunately water level fluctuations in the field due to normal operations over topped these rings as well.
NE
Mean SE
Ch
loro
ph
yll
Ref
lect
ance
In
dex
0
20
40
60
80
100
120
140
160
180
05/18 05/23 05/24 05/25
0.0 7.9 15.9 31.7 0.0 7.9 15.9 31.7 0.0 7.9 15.9 31.7 0.0 7.9 15.9 31.7
Figure 8. Results from field experiment with various concentrations of zinc sulfate (0, 7.9, 15.9, or 31.7 parts per million (ppm)) added to PVC rings containing water and algae from the rice field.

PROJECT NO. RP-14
Objective 3: Determine spatial variation in phosphorus levels in water entering rice fields and the effectiveness of incorporating phosphorus fertilizer.
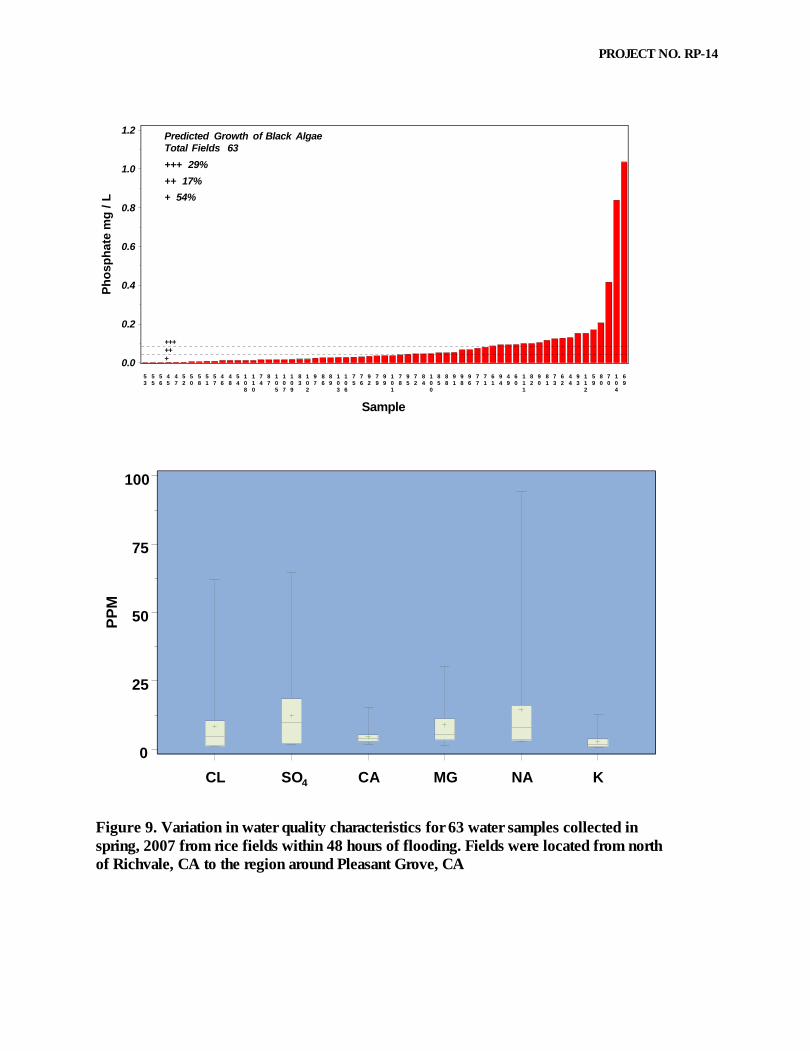
With the help of cooperators, we collected water samples (ca 60) from fields. The samples were usually collected within 48 hours or less of the initiation of flooding and thus represent the initial levels of phosphate in rice field water. The levels of soluble reactive phosphorus (PO4) and the range of concentrations for additional important algal nutrients are shown in Figure 9. The lower horizontal line in the upper graph indicates the PO4 level which supports ½ maximum growth of Nostoc spongiaeforme and the upper line indicates the PO4 level which supports maximum growth (see below for additional information). Of the sixty-three samples thirteen were from ground water sources and fifty from surface water. The mean PO4 level for ground water samples was 0.182 mg L-1, while the mean for the samples from surface water sources was 0.061 mg L-1. These means were significantly different based on a t-test (t = 3.36, P = 0.02, DF = 61).
The box plots for the other algal nutrients show the mean, quartiles, and minimum and maximum values for chloride (Cl), sulfate (SO4), calcium (Ca), magnesium (Mg), sodium (Na), and potassium (K).
These data show that about 54% of the water samples had PO4 levels that would limit the growth of Nostoc spongiaeforme. The information of the levels of other algal nutrients can be used to determine how their levels influence growth of this species.
PROJECT NO. RP-14
Figure 9. Variation in water quality characteristics for 63 water samples collected in spring, 2007 from rice fields within 48 hours of flooding. Fields were located from north of Richvale, CA to the region around Pleasant Grove, CA
++++++
+++ 29%
++ 17%
+ 54%
Total Fields 63Predicted Growth of Black Algae
Ph
osp
hat
e m
g /
L
0.0
0.2
0.4
0.6
0.8
1.0
1.2
Sample
53
55
56
45
47
52
50
58
51
57
46
48
54
108
110
74
87
105
107
109
83
102
97
86
89
103
106
75
76
92
79
99
101
78
95
72
84
100
85
88
91
98
96
77
71
61
94
49
60
111
82
90
81
73
62
44
93
112
59
80
70
104
69
CL SO CA MG NA K
0
25
50
75
100
PP
M
4

PROJECT NO. RP-14
Objective 4: Determine the effectiveness of incorporating phosphorus fertilizer at 1 inch deep in the soil for reducing algal growth.
On May 9, 2007 we collected water samples from a rice field within a few hours of the initiation of flooding. Water had entered the field, but had not yet been transferred other fields. This field had phosphorus applied to the surface, but it was not incorporated into the soil. Dissolved reactive phosphorus (PO4, mg L-1) increased as the water moved across the field, from south to north, (Figure 10). These results show that applying inorganic phosphorus to the field surface without incorporating it into the soil results in much higher phosphorus levels in the water, up to five times that of the incoming water. This inorganic phosphorus would support algal growth, especially mat-forming blue-green algae (cyanobacteria) capable of fixing atmospheric nitrogen.
Nostoc spongiaeforme was grown at 25 C, 13:11 h light:dark cycle, 400 �mM m-2 s-1 for one week. Prior to use in the experiment, algae was grown in phosphate-free culture medium for 48 hours in order to deplete internal reserves. There were four replicate flasks at each of the following phosphate concentrations: 0, 0.062, 0.125, 0.25, 0.50, 1, 2, 11 (only used in one of the eight experiments performed), and 22 mg L-1. The initial pH of the culture medium was adjusted to 7.1 using 1 N sodium hydroxide. After one week 10 ml of culture medium was collected and the chlorophyll content determined. The logarithms (base 2) of starting and ending chlorophyll concentrations were used in linear regression versus time to determine the growth rate, yielding growth rates which have units of doublings day-1. Results are shown in Figure 11. We fit the Monod equation to the resulting growth rates using non-linear regression methods. This equation is widely used to summarize this type of data because it produces the parameter, Ks, which is defined as the concentration of phosphate which produces one-half of the maximum growth rate (Vmax). This parameter has been used to determine levels of nutrients which limit growth of an organism. Combined results from all eight experiments are shown in Figure 11. They indicate that Ks for Nostoc spongiaeforme is 0.043 mg L-1. This number can be used to evaluate the level of phosphate that would need to be achieved in order to reduce the growth of Nostoc spongiaeforme in California rice fields.
When this number is compared to phosphate levels in rice field water samples (Figure 9), it is clear that 54% of these samples had phosphate levels that were lower than the Ks for Nostoc spongiaeforme. Thus, we would expect that Nostoc spongiaeforme would not grow abundantly in these fields.
The combined results of the Nostoc spongiaeforme phosphorus-limited growth experiments, the measurements of phosphate levels in initial rice field water samples, and the data showing that phosphate levels in rice field water increased in a field where the phosphorus fertilizer was surface applied but not incorporated, provide strong evidence to support the notion that incorporating phosphorus fertilizer would lead to reduced phosphate levels in rice field water and subsequent reduced growth of algae, especially the so-called “black algae,” Nostoc spongiaeforme.

PROJECT NO. RP-14
Figure 10. Phosphate concentrations at locations within a rice field that had surface applied phosphorus without incorporation. Water from a well entered the field at the location indicated by the arrow and moved toward the north. Water depth was from 7.5 to 12.5 cm (3 – 5 inches).
0.12
0.78
0.09
0.56
0.15
0.10
0.51
0.57
There was 0.107 P mg/L in the water entering the field.
N

PROJECT NO. RP-14
-1
-1
V = 0.71 Doublings Day (95% C.I. = 0.64 to 0.77)max-1
K = 0.043 mg L (95% C.I. = 0.016 to 0.069)s-1
N = 130
Do
ub
lin
gs
Da
y
0.00
0.25
0.50
0.75
1.00
1.25
1.50
Phosphate (mg L )
0 10 20 30
Figure 11. Influence of external phosphate on growth of Nostoc spongiaeforme.
PUBLICATIONS OR REPORTS:
• Spencer, D. F. and C. A. Lembi. 2007. Evaluation of barley straw as an alternative algae control method in a northern California rice field. Journal of Aquatic Plant Management (in press).
• D. Spencer and C. Lembi, 2007. Evaluation of barley straw as an alternative algae control
method in a northern California rice field. Western Aquatic Plant Management Society, Inc. Annual Meeting, March 25-27, Coeur d’Alene, Idaho (oral presentation)
• D. Spencer and C. Lembi, 2007. Evaluation of barley straw as an alternative algae control
method in a northern California rice field. The Aquatic Plant Management Society, Inc. 47th Annual Meeting, July 15-18, Nashville, Tennessee (poster presentation)
• Oral Reports at UC Cooperative Extension 2007 Annual Rice Grower Meeting
– Feb. 12, 8:30 am, Evangelical Church, 5219 Church St., Richvale – Feb 12, 1:30 pm, Glenn Pheasant Hall, 1522 Highway 45, south of Glenn – Feb 13, 8:30 am, Cachil Dehe Tribal Village Community Center, South of Colusa
Casino, 3730 Highway 45, Colusa – Feb 13, 1:30 pm, Sutter Co. Agricultural Bldg., 142-A Garden Highway, Yuba
City

PROJECT NO. RP-14 CONCISE GENERAL SUMMARY OF CURRENT YEAR’S RESULTS: Nostoc exhibited significantly reduced growth when exposed to a commercially available liquid zinc solution. Algal dry weight was reduced by about 50% at the highest zinc concentration (31.7 ppm). Algal dry weight was also reduced by the copper containing algicide “Formula 30.” We did not conduct tests with flumioxazin after we learned that it inhibited rice growth. Results from experiments with combinations of zinc sulfate and rice straw indicate that rice straw ameliorates the toxic properties of zinc by binding the zinc ions. When we tested additional algal species and ALS inhibitors, bispyribac, imazamox, and penoxsulam, we observed that only some of the thirteen species tested were affected by these herbicides. We also observed that if there was an effect on growth it was algistatic not algicidal. There was also evidence that species which showed this algistatic affect, recovered when the ALS inhibitor was removed from the medium. In three of the four experiments there was no statistically detectable influence of a Londax-Shark mixture on Nostoc spongiaeforme growth rates. In one experiment there was a 12% decrease in growth rate at the highest level.
The copper binding capacity of the rice straw present in rice fields may affect the efficacy of subsequent copper sulfate treatments for algae control. We found that the copper binding capacity of rice straw in the solution could be summarized by the equation; copper bound (mg) = 0.102 + 1.126 x rice straw (g) (P < 0.0001, N=90, R2=0.34). We applied this equation to estimate the total amount of copper that could be bound by the straw present in each of the six fields at the beginning of the growing season. The predicted binding capacity for rice straw present in the fields depends on the water depth, but calculations for fields with 6 or 12 inches of water suggest that from 0.75 to 1.25 mg L-1 of copper can be bound by the straw present in four of the six fields examined. This is a significant portion of the copper that may be applied during a normal application of copper sulfate for algae control. To date we have not found an algicide that can give the results that growers would anticipate, and it appears that residual rice straw may present a significant problem for the standard approach which is the use of copper sulfate.
Another approach to managing excessive algal growth is to alter environmental conditions that support this growth. Once approach involves reducing abundance of what is often the limiting nutrient for algae in freshwater systems, phosphorus (phosphate). With the help of cooperators, we collected 63 water samples from rice fields. We analyzed the samples for phosphate (PO4), chloride (Cl), sulfate (SO4), calcium (Ca), magnesium (Mg), sodium (Na), and potassium (K). These data show that about 54% of the water samples had PO4 levels that would limit the growth of the so-called black algae, Nostoc spongiaeforme. The information of the levels of other algal nutrients can be used to determine how their levels influence growth of this species in rice fields. On May 9, 2007 we collected water samples from a rice field within 48 hours of flooding. Water had entered the field, but had not yet been transferred out. This field had phosphorus applied to

PROJECT NO. RP-14 the surface, but it was not incorporated into the soil. Phosphate levels in the water increased (up to five times that of the incoming water) as the water
moved across a field, from south to north. These results show that applying inorganic phosphorus to the field surface without incorporating it into the soil results in much higher phosphate levels in the water. This inorganic phosphorus would directly support algal growth.
Using algal cultures of Nostoc spongiaeforme, we determined a parameter (Ks) that has been used to determine levels of nutrients which limit growth. The value of this parameter for Nostoc spongiaeforme is 0.043 mg L-1. This number can be used to evaluate the level of phosphate that would need to be achieved in order to reduce the growth of Nostoc spongiaeforme in California rice fields. It is clear that 54% of rice field water samples had phosphate levels that were lower than this.
The combined results of this experiment, the measurements of phosphate levels in initial rice field water samples, and the data showing that phosphate levels in rice field water increased in a field where the phosphorus fertilizer was surface applied but not incorporated, provide strong evidence to support the notion that incorporating phosphorus fertilizer would lead to reduced phosphate levels in rice field water and subsequent reduced growth of algae, especially the so-called “black algae,” Nostoc spongiaeforme.

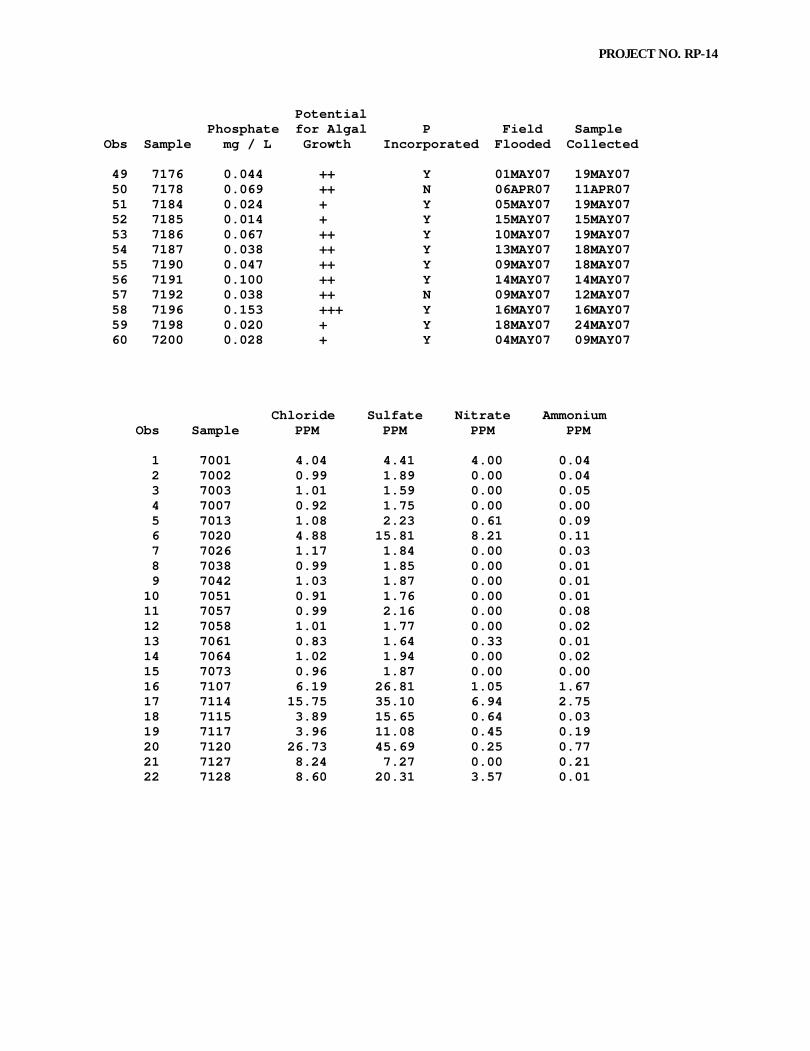
PROJECT NO. RP-14 APPENDIX Data from rice field water samples collected in spring, 2007 from fields located north of Richvale, CA to the Pleasant Grove, CA region. In the tables that follow the units of measure are either mg/L (milligrams per liter) or ppm (parts per million). The potential for algal growth was estimated based on the relationship between algal biomass and phosphate in lakes. One “+” indicates the lowest estimated growth potential and three “+++” indicates the highest.

PROJECT NO. RP-14 Potential Phosphate for Algal P Field Sample Obs Sample mg / L Growth Incorporated Flooded Collected 1 7001 0.132 +++ Y 30APR07 30APR07 2 7002 0.004 + Y 18APR07 19APR07 3 7003 0.014 + Y 26APR07 28APR07 4 7007 0.004 + Y 20APR07 21APR07 5 7013 0.014 + N 20APR07 21APR07 6 7020 0.094 ++ Y 20APR07 21APR07 7 7026 0.006 + Y 26APR07 28APR07 8 7038 0.008 + Y 20APR07 21APR07 9 7042 0.004 + Y 26APR07 28APR07 10 7051 0.002 + Y 24APR07 28APR07 11 7057 0.014 + Y 27APR07 28APR07 12 7058 0.002 + Y 27APR07 28APR07 13 7061 0.002 + Y 21APR07 23APR07 14 7064 0.008 + Y 14APR07 16APR07 15 7073 0.006 + Y 18APR07 19APR07 16 7107 1.036 +++ Y 17MAY07 19MAY07 17 7114 0.416 +++ Y 10MAY07 12MAY07 18 7115 0.081 ++ Y 17MAY07 19MAY07 19 7117 0.046 ++ Y 10MAY07 12MAY07 20 7120 0.125 +++ N 17MAY07 19MAY07 21 7127 0.016 + Y 05MAY07 18MAY07 22 7128 0.839 +++ N 23MAY07 25MAY07 23 7131 0.016 + Y 12MAY07 12MAY07 24 7134 0.028 + Y 21MAY07 24MAY07 25 7135 0.016 + Y 14MAY07 14MAY07 26 7136 0.014 + Y 24MAY07 26MAY07 27 7138 0.096 ++ N 07MAY07 07MAY07 28 7141 0.087 ++ Y 07MAY07 07MAY07 29 7142 0.030 + Y 09MAY07 19MAY07 30 7144 0.128 +++ Y 27MAY07 27MAY07 31 7145 0.032 ++ Y 13MAY07 18MAY07 32 7146 0.075 ++ Y 02MAY07 19MAY07 33 7148 0.042 ++ N 04MAY07 09MAY07 34 7149 0.018 + Y 17MAY07 25MAY07 35 7153 0.036 ++ Y 01MAY07 19MAY07 36 7155 0.206 +++ Y 17APR07 18APR07 37 7156 0.117 +++ Y 21MAY07 23MAY07 38 7157 0.101 +++ Y 29APR07 02MAY07 39 7158 0.020 + Y 27APR07 01MAY07 40 7160 0.053 ++ Y 18MAY07 24MAY07 41 7162 0.026 + Y 01MAY07 09MAY07 42 7164 0.016 + Y 21MAY07 23MAY07 43 7166 0.053 ++ Y 23MAY07 25MAY07 44 7167 0.026 + Y 16APR07 18APR07 45 7168 0.105 +++ Y 19MAY07 24MAY07 46 7169 0.055 ++ Y 07MAY07 19MAY07 47 7171 0.034 ++ Y 23MAY07 25MAY07 48 7175 0.093 ++ Y 02MAY07 19MAY07
PROJECT NO. RP-14
Potential Phosphate for Algal P Field Sample Obs Sample mg / L Growth Incorporated Flooded Collected 49 7176 0.044 ++ Y 01MAY07 19MAY07 50 7178 0.069 ++ N 06APR07 11APR07 51 7184 0.024 + Y 05MAY07 19MAY07 52 7185 0.014 + Y 15MAY07 15MAY07 53 7186 0.067 ++ Y 10MAY07 19MAY07 54 7187 0.038 ++ Y 13MAY07 18MAY07 55 7190 0.047 ++ Y 09MAY07 18MAY07 56 7191 0.100 ++ Y 14MAY07 14MAY07 57 7192 0.038 ++ N 09MAY07 12MAY07 58 7196 0.153 +++ Y 16MAY07 16MAY07 59 7198 0.020 + Y 18MAY07 24MAY07 60 7200 0.028 + Y 04MAY07 09MAY07 Chloride Sulfate Nitrate Ammonium Obs Sample PPM PPM PPM PPM 1 7001 4.04 4.41 4.00 0.04 2 7002 0.99 1.89 0.00 0.04 3 7003 1.01 1.59 0.00 0.05 4 7007 0.92 1.75 0.00 0.00 5 7013 1.08 2.23 0.61 0.09 6 7020 4.88 15.81 8.21 0.11 7 7026 1.17 1.84 0.00 0.03 8 7038 0.99 1.85 0.00 0.01 9 7042 1.03 1.87 0.00 0.01 10 7051 0.91 1.76 0.00 0.01 11 7057 0.99 2.16 0.00 0.08 12 7058 1.01 1.77 0.00 0.02 13 7061 0.83 1.64 0.33 0.01 14 7064 1.02 1.94 0.00 0.02 15 7073 0.96 1.87 0.00 0.00 16 7107 6.19 26.81 1.05 1.67 17 7114 15.75 35.10 6.94 2.75 18 7115 3.89 15.65 0.64 0.03 19 7117 3.96 11.08 0.45 0.19 20 7120 26.73 45.69 0.25 0.77 21 7127 8.24 7.27 0.00 0.21 22 7128 8.60 20.31 3.57 0.01
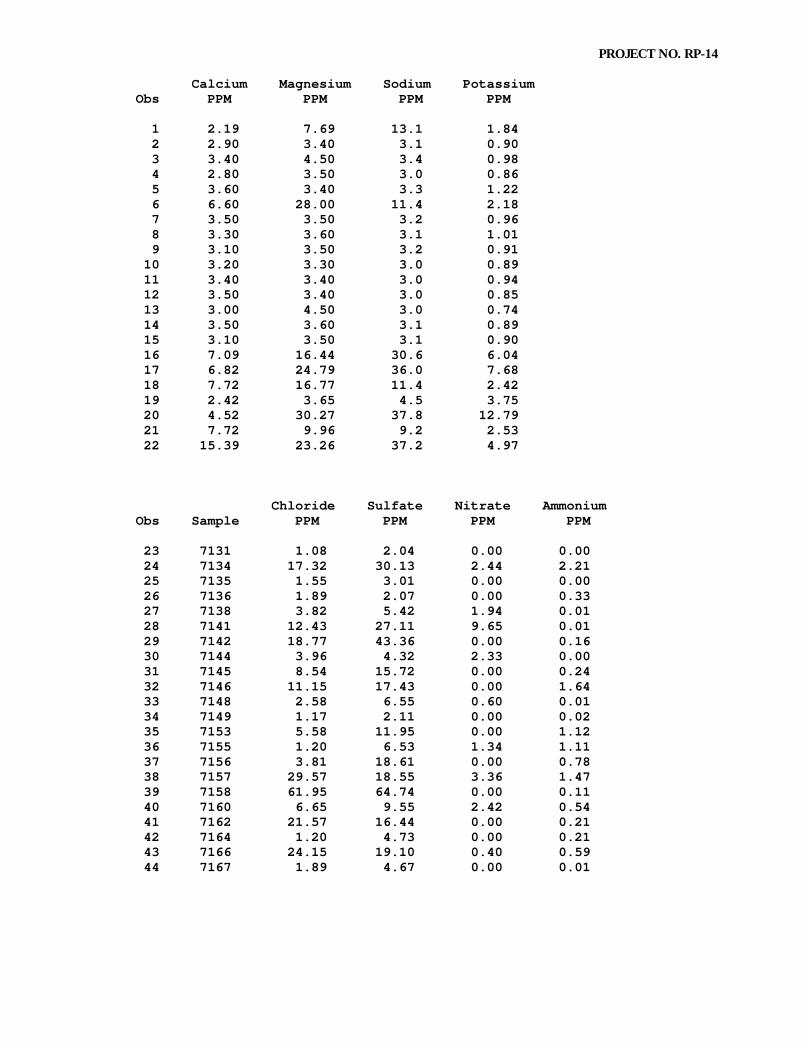
PROJECT NO. RP-14 Calcium Magnesium Sodium Potassium Obs PPM PPM PPM PPM 1 2.19 7.69 13.1 1.84 2 2.90 3.40 3.1 0.90 3 3.40 4.50 3.4 0.98 4 2.80 3.50 3.0 0.86 5 3.60 3.40 3.3 1.22 6 6.60 28.00 11.4 2.18 7 3.50 3.50 3.2 0.96 8 3.30 3.60 3.1 1.01 9 3.10 3.50 3.2 0.91 10 3.20 3.30 3.0 0.89 11 3.40 3.40 3.0 0.94 12 3.50 3.40 3.0 0.85 13 3.00 4.50 3.0 0.74 14 3.50 3.60 3.1 0.89 15 3.10 3.50 3.1 0.90 16 7.09 16.44 30.6 6.04 17 6.82 24.79 36.0 7.68 18 7.72 16.77 11.4 2.42 19 2.42 3.65 4.5 3.75 20 4.52 30.27 37.8 12.79 21 7.72 9.96 9.2 2.53 22 15.39 23.26 37.2 4.97 Chloride Sulfate Nitrate Ammonium Obs Sample PPM PPM PPM PPM 23 7131 1.08 2.04 0.00 0.00 24 7134 17.32 30.13 2.44 2.21 25 7135 1.55 3.01 0.00 0.00 26 7136 1.89 2.07 0.00 0.33 27 7138 3.82 5.42 1.94 0.01 28 7141 12.43 27.11 9.65 0.01 29 7142 18.77 43.36 0.00 0.16 30 7144 3.96 4.32 2.33 0.00 31 7145 8.54 15.72 0.00 0.24 32 7146 11.15 17.43 0.00 1.64 33 7148 2.58 6.55 0.60 0.01 34 7149 1.17 2.11 0.00 0.02 35 7153 5.58 11.95 0.00 1.12 36 7155 1.20 6.53 1.34 1.11 37 7156 3.81 18.61 0.00 0.78 38 7157 29.57 18.55 3.36 1.47 39 7158 61.95 64.74 0.00 0.11 40 7160 6.65 9.55 2.42 0.54 41 7162 21.57 16.44 0.00 0.21 42 7164 1.20 4.73 0.00 0.21 43 7166 24.15 19.10 0.40 0.59 44 7167 1.89 4.67 0.00 0.01

PROJECT NO. RP-14 Calcium Magnesium Sodium Potassium Obs PPM PPM PPM PPM 23 3.54 3.39 3.7 0.95 24 5.27 3.04 8.1 7.21 25 3.88 4.48 4.5 1.16 26 3.71 3.31 94.1 1.69 27 1.79 16.02 15.7 1.24 28 2.23 25.34 30.7 2.30 29 2.83 27.04 33.6 2.29 30 4.97 8.04 13.5 4.09 31 2.38 7.10 13.3 1.76 32 5.15 8.05 9.4 3.24 33 7.28 11.09 16.9 4.15 34 4.76 12.21 6.6 1.51 35 3.36 3.44 3.8 1.04 36 5.94 9.12 11.6 2.60 37 2.30 1.50 4.2 3.68 38 2.77 2.41 3.0 0.84 39 5.60 9.47 65.4 5.28 40 4.68 5.50 7.5 1.40 41 11.24 13.29 16.0 5.16 42 4.65 3.21 3.2 1.17 43 4.40 7.20 53.8 3.06 44 3.36 3.28 3.7 0.85 Chloride Sulfate Nitrate Ammonium Obs Sample PPM PPM PPM PPM 45 7168 18.50 20.67 4.76 0.01 46 7169 2.64 5.07 0.00 0.30 47 7171 19.35 13.60 0.00 0.19 48 7175 20.31 8.03 0.00 1.66 49 7176 9.56 18.01 0.00 0.77 50 7178 10.40 10.53 3.46 0.00 51 7184 5.92 11.60 0.00 0.22 52 7185 5.92 16.57 0.00 0.01 53 7186 27.66 20.41 0.00 0.39 54 7187 4.69 10.35 0.00 0.18 55 7190 9.42 18.39 0.00 0.26 56 7191 6.03 18.96 3.15 0.27 57 7192 5.33 10.80 1.11 0.50 58 7196 11.26 0.75 0.85 0.00 59 7198 4.92 6.56 1.54 0.16 60 7200 3.07 2.09 0.00 0.00
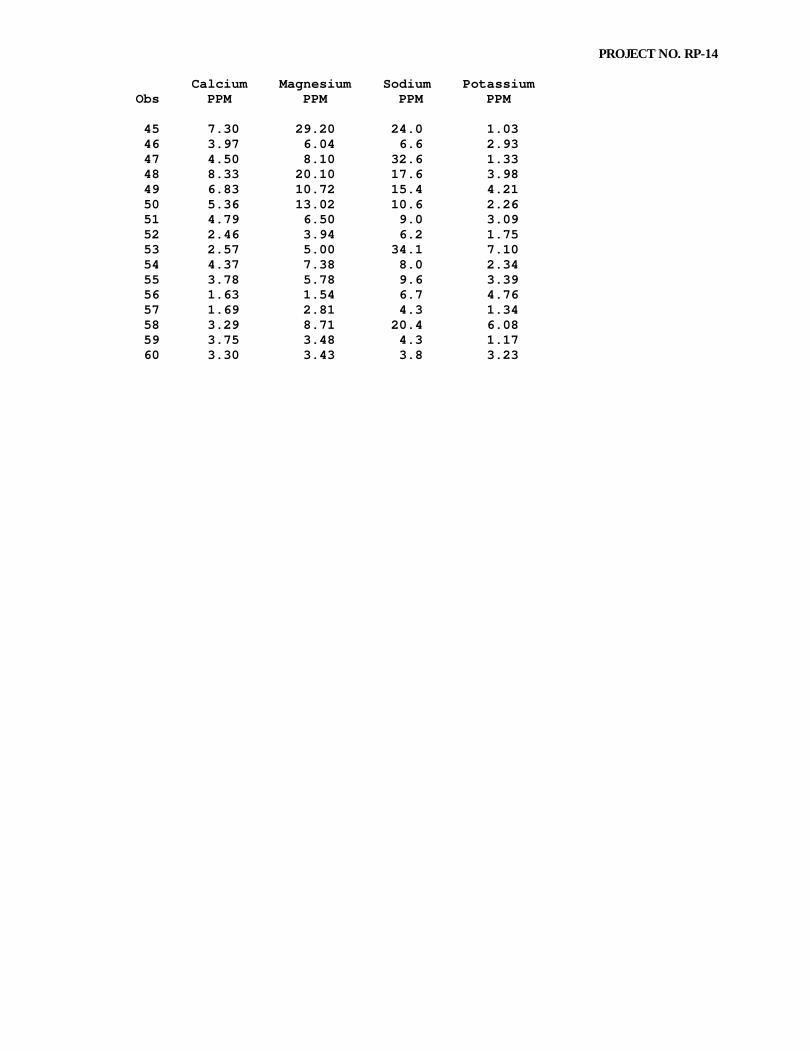
PROJECT NO. RP-14 Calcium Magnesium Sodium Potassium Obs PPM PPM PPM PPM 45 7.30 29.20 24.0 1.03 46 3.97 6.04 6.6 2.93 47 4.50 8.10 32.6 1.33 48 8.33 20.10 17.6 3.98 49 6.83 10.72 15.4 4.21 50 5.36 13.02 10.6 2.26 51 4.79 6.50 9.0 3.09 52 2.46 3.94 6.2 1.75 53 2.57 5.00 34.1 7.10 54 4.37 7.38 8.0 2.34 55 3.78 5.78 9.6 3.39 56 1.63 1.54 6.7 4.76 57 1.69 2.81 4.3 1.34 58 3.29 8.71 20.4 6.08 59 3.75 3.48 4.3 1.17 60 3.30 3.43 3.8 3.23