ANNUAL REPORT AND FINANCIAL STATEMENTS - … · 2013-05-08 · career, he has been a long serving...
72
ANNUAL REPORT AND FINANCIAL STATEMENTS 2012
Transcript of ANNUAL REPORT AND FINANCIAL STATEMENTS - … · 2013-05-08 · career, he has been a long serving...

Longonot Place,Kijabe Street, 7th FloorP O Box 42334-00100 GPO, Nairobi, Kenya.Tel: +254 20 224 53 50/ 224 52 32Fax: +254 20 224 52 53Email : [email protected]
ANNUAL REPORT AND FINANCIAL STATEMENTS
2012


REPORT AND FINANCIAL STATEMENTS FOR THE YEAR ENDED 31 DECEMBER 2012
Investing in Africa
1
Contents
Pages
Notice of the annual general meeting 2
Directors, officers and administration 3
Board of directors 4-5
Corporate governance 6-7
Chairman’s statement 8-9
Chief executive’s statement 10-13
Report of the directors 14
Statement of directors’ responsibilities 15
Report of the independent auditors 16
Consolidated statement of comprehensive income 17
Consolidated statement of financial position 18
Company statement of financial position 19
Consolidated statement of cash flows 20
Consolidated statement of changes in equity 21-22
Company statement of changes in equity 23-24
Notes to the consolidated financial statements 25-64
Principal Shareholders and Distribution of Shareholding 65
Notes 66-67
Proxy Form 68

REPORT AND FINANCIAL STATEMENTS FOR THE YEAR ENDED 31 DECEMBER 20122
Investing in Africa
Notice of the Annual General Meeting
NOTICE IS HEREBY GIVEN that an Annual General Meeting of the Company will be held at Strathmore University Auditorium, Madaraka,Nairobi on Thursday 30th May, 2013 at 10a.m. to conduct the following business:
AGENDA
ORDINARY BUSINESS
1. To read the notice convening the meeting and determine if a quorum is present;
2. To receive, consider and if approved, adopt the Chairman’s statement, reports of the Directors and Auditors and audited financial statements for year ended 31st December, 2012;
3. To declare payment of a first and final Dividend recommended by the Board of Kshs 0.40/= per share for the year ended 31st December, 2012 to the shareholders in the Register of Members as at 2nd May, 2013;
4. To elect Directors in accordance with the Company’s Articles of Association;
In accordance with the Company’s Articles of Association, Mr. Peter T. Kanyago and Mr.Robin Kimotho retire by rotation from the office as Directors of the Company and, being eligible, offer themselves for re-election;
5. To approve the Directors’ Remuneration;
6. To note that KPMG Kenya Certified Public Accountants having expressed willingness continue in office as the Auditors by virtue of section 159 (2) of the Companies’ Act (Cap 486) and to authorise the Directors to fix their remuneration.
SPECIAL BUSINESS
To consider and if approved, pass the following Special Resolution to amend the Company’s Articles of Association:
(i) That the Articles of Association of the Company be amended by adding a new Article to read as follows:
UNCLAIMED FINANCIAL ASSETS ACT
“The Company may, if required by law, deliver or pay to any prescribed regulatory authority any unclaimed assets includ-ing but not limited to shares in the Company presumed to be abandoned or unclaimed in law and any dividends or inter-est thereon remaining unclaimed beyond prescribed statutory periods. Upon such delivery or payment, the unclaimed assets shall cease to remain owing by the Company and the Company shall no longer be responsible to the owner or holder of his or estate, for the relevant unclaimed assets.”
BY ORDER OF THE BOARDVirginia NdungeSecretaryP.O Box 6112000200 City SquareNairobi
Date: 10th April, 2013
Note:A member entitled to attend is entitled to appoint a proxy to attend and vote on his/her behalf and such a proxy need not be a member of the Company. To be valid, proxy forms must be deposited at the Registered Office of the Company not less than 48 hours before the appointed time of the meeting.

REPORT AND FINANCIAL STATEMENTS FOR THE YEAR ENDED 31 DECEMBER 2012
Investing in Africa
3
Directors, Officers and Administration
DIRECTORSZephaniah Mbugua (Chairman)Joseph Karago Peter KanyagoRobin KimothoNgugi Kiuna Njeru Kirira Gachao Kiuna Carol Musyoka
SECRETARYVirginia NdungeEmu Registrars3rd Floor, Suite 8, East wingThe GreenhouseNgong RoadP.O Box 6112000200 Nairobi City Square
AUDITORS KPMG Kenya16th Floor, Lonrho HouseStandard StreetP.O Box 40612 00100 Nairobi GPO
REGISTERED OFFICE Emu Registrars 3rd Floor, Suite 8, East wing The Greenhouse Ngong Road P.O Box 61120 00200 Nairobi City Square
PRINCIPAL PLACE OF BUSINESS 7th Floor, Longonot PlaceKijabe Street P.O Box 42334 00100 Nairobi GPO
ADVOCATESMuthaura Mugambi Ayugi & Njonjo Advocates4th floor, West Wing, Capitol Hill Square Upperhill, Off Chyulu Road. P.O Box 8418 00200 Nairobi City Square Nairobi
Kaplan & Stratton Advocates 9th Floor, Williamson HouseP.O Box 4011100100 Nairobi GPO
SHARE REGISTRARS Cooperative Bank of Kenya LimitedShare Registration Services13th Floor, Cooperative Bank HouseHaile Selassie AvenueP.O Box 4823100100 Nairobi GPO
BANKERSNational Industrial Credit Bank Limited P.O Box 44599 00100 Nairobi GPO
Commercial Bank of Africa Limited P.O Box 30437 00100 Nairobi GPO
Kenya Commercial Bank LimitedChase BankP.O Box 66015-00800Nairobi, Kenya Equity BankP.O Box 75104-00200,Nairobi, Kenya Standard Chartered Bank48 Westlands Road,Nairobi, Kenya P.O Box 30081 00100 Nairobi GPO
Co-operative Bank of Kenya LimitedP.O Box 48231 00100 Nairobi GPOStandard Bank (Mauritius) Limited6th Floor, Medine Mews BuildingLa Chaussee StreetPort Louis, Mauritius
Citi Bank NAP.O Box 3071100100 Nairobi GPO
Chase Bank Kenya LimitedRiverside clauseJunction of Ring Road RiversideWestlandsPO Box 66015 - 00800Nairobi
UBA Kenya Bank LimitedApollo Centre1st Floor Ring RoadPO Box 3415400100 Nairobi GPO

REPORT AND FINANCIAL STATEMENTS FOR THE YEAR ENDED 31 DECEMBER 20124
Investing in Africa
Dr. Gachao Kiuna, Chief Executive Officer and Managing DirectorGachao joined Trans-Century from McKinsey & Company in Johannesburg, where he was a member of the Office Leadership Group leading McKinsey’s Sub-Saharan Africa Practice. He was involved in advising corporate clients in emerging markets on corporate finance and strategy. He was also the principal consultant that led the McKinsey assignment to develop the Vision 2030 project for the Government of Kenya.
Gachao Joined McKinsey in 2003 after completing his PhD at the University of Cambridge, Corpus Christi College in the United Kingdom. Additionally he holds a First Class Honours BSc degree from Imperial College, London in Biochemistry and a PhD in Biotechnology from the Institute of Biotechnology in Cambridge.
Joseph Karago, DirectorMr. Karago holds a Bachelor of Architecture from the University of Nairobi. In his professional background, he has worked for Symbion International Architects (1987- 1991) and later joined Plence International as Partner-in-charge of Design and Technical Co-ordination (1992-1995). His entrepreneurial interest saw him leave Plence International to set up his own practice, Karago & Associates Architects that he manages to date. Mr. Karago is chairman of Sajo Ltd and Mcensal Ltd and is very active in corporate social responsibility including acting as a member of the board of governors of Thomas Barnados Home and Chairman of the Adoptions Committee, Kenya Children’s Home.
Mr. Zephaniah Gitau Mbugua, Chairman of the BoardMr. Mbugua is a graduate of Makerere University with a BSc in Chemistry and Mathematics. He is a successful serial entrepreneur, developing businesses and partnerships across Africa for the last 30 years. He is a founder member and Chief Executive Officer of Abcon Group of Companies, a leading distributor of industrial chemicals. He is also a director of Proctor & Allan EA Ltd, Real Insurance and Zeniki Investment Ltd.
Peter Kanyago, MBS, DirectorMr. Kanyago is a fellow of the Institute of Certified Public Accountants of Kenya, member of the Institute of Certified Public Secretaries of Kenya and holds an MBA in Industrial Management. As an entrepreneur, he holds directorships in companies he has built, including East Africa Courier Ltd and East Africa Elevator Company (OTIS). He is the Chairman of Ecobank Kenya Ltd and Kenya Tea Development Authority (KTDA) Ltd, and also holds directorships at Kenya Tea Packers (KETEPA), Express Kenya Ltd, KEMSA, Corporate Insurance Company Ltd and East African Cables Ltd. His contribution to the nation has been recognised in his being awarded Moran of the order of the Burning Spear (MBS) of the Republic of Kenya. He is a Fellow of Kenya Institute of Management(KIM).
Board of Directors

REPORT AND FINANCIAL STATEMENTS FOR THE YEAR ENDED 31 DECEMBER 2012
Investing in Africa
5
Njeru Kirira, DirectorMr. Kirira graduated with a Masters degree in Public Administration (MPA) from the University of Pittsburgh and BA (Hons) from Makerere University in Economics and Agricultural Economics. He is trained and experienced in Fiscal Affairs and Tax Administration and is currently a Managing Consultant with Global Economic Investment and Financial Consultancy Limited (GEIFIC Limited). In his professional career, he has been a long serving tax and fiscal policy administrator. He served in various capacities in the Treasury including, the Director of Fiscal & Monetary Affairs, and Economic Advisor to the Central Bank of Kenya before his appointment as the Financial Secretary to the Treasury. He has consulted with various local and regional organisations on economics and public administration, and He is also serves as a council member for Inoorero University in Nairobi.
Carol Musyoka, DirectorMs. Carol Musyoka has over 10 years of financial leadership including deal origination, structuring and execution, as well as credit risk and treasury management. She has extensive senior-level experience in banking and corporate finance, having previously been Chief Operating Officer of K-Rep Bank, Corporate Director of Barclays Bank and a Corporate Manager with Citibank Kenya. Carol received her Masters of Law degree from Cornell University, USA and holds a Bachelor of Law degree from the University of Nairobi. She is currently a director of BAT Kenya Ltd, BOC Gases Ltd and Alliance Capital Partners as well as a Trustee at SOS Children’s Villages.
Ngugi Kiuna, DirectorMr. Kiuna graduated with a BSc Hons in Mechanical Engineering from the University of Portsmouth in the United Kingdom. He is currently the Managing Director of Maxam Limited, the distributor of Heineken across East Africa. His professional experience has involved working as a Managing Director of Unilever East Africa. His other directorships include BOC Gases Kenya Ltd, Proctor & Allan (EA) Ltd, UBA Kenya Bank Limited and X & R Technologies (Xerox).
Robin Kimotho, DirectorMr. Kimotho graduated from Makerere University with BA (Econ) First Class Honours and an MBA (Finance Major) from the University of Alberta. In 1986 he obtained a diploma in Investment Planning and Appraisal from the University of Bradford. In his professional career he has been a lecturer at the Faculty of Business Administration, Papua New Guinea University of Technology (1974 – 1979). Between 1979 and 1987 he worked for Kenya Commercial Bank as a consultant in the Business Advisory Services division, and as manager of the Economics and Planning division. In 1987, he moved to the Africa Project Development Facility (APDF) as an Investment Officer, where he worked in various countries in eastern and southern Africa up to 1995. Since then, he has worked as an independent financial consultant and manages his own farming and real estate enterprises.
Board of Directors continued

REPORT AND FINANCIAL STATEMENTS FOR THE YEAR ENDED 31 DECEMBER 20126
Investing in Africa
Corporate Governance
The Board of Directors of Trans-Century Limited is responsible for the governance of the company and is accountable to the shareholders, ensuring that the company complies with the law, the highest standards of corporate governance, and business ethics.
BOARD OF DIRECTORS
The Board consists of eight directors of which seven are non executive (including the board chairman) and one is executive (the chief executive officer). All non-executive directors on Trans-Century’s board are independent of management and have diverse skills, experience and competencies appropriate for effective management of the company’s business.
The board meets at least four times a year, with additional meetings when required. The directors are given appropriate and timely information so that they can maintain full and effective control over strategic, financial, operational and compliance issues. Except for the direction and guidance on general policy, the board has delegated authority for conduct of day-to-day business to the CEO.
The Board nonetheless retains responsibility in maintaining the company’s overall internal control on financial, operational and compliance issues. All our directors have also attended various corporate governance courses organized by accredited institutions. All non-executive directors are subject to periodic reappointment in accordance with company’s Articles of Association.
BUSINESS ETHICS
The directors attach great importance to the need to conduct the business and operations of the company with integrity and in accordance with internationally developed principles on good governance. The company adopts the best principles of good corporate culture that requires the directors and all employees to maintain the highest personal and ethical standards and to act in good faith and in the interest of the company. The company has developed and implemented a code of conduct that sets out guidelines and rules, which are based on good governance principles of:
• Full compliance with the law• Application of best accounting practices• Application of best business practices
EQUAL EMPLOYMENT OPPORTUNITIES AND COMMITMENT TO OUR PEOPLE
The company is committed to provide equal opportunity to all employees and applicants on the basis of merit. Our practice is to create a meritocratic culture in all our businesses across the African continent.
COMMITTEES OF THE BOARD
The board has three standing committees which meet regularly under the terms of reference set by the board.
Audit and Risk Committee
The board has constituted an audit committee which meets at least quarterly. It includes four non-executive directors Ngugi Kiuna, Peter Kanyago, Robin Kimotho and Carol Musyoka and the CEO. Its responsibilities include review of financial information, in particular half year and annual financial statements, compliance with accounting standards, liaison with external auditors, remuneration of external auditors and maintaining oversight on internal control systems. Other responsibilities are to receive and consider the company’s annual budget. The committee is guided by a charter from the board which outlines its mandate. The head of corporate finance and strategy, head of finance and group internal auditor are regularly invited.
Strategy and Investment Committee
The committee meets regularly, typically bi-monthly, and it includes two non-executive directors Zephaniah Gitau Mbugua and Ngugi Kiuna and the CEO. The main responsibility of the committee is to chart the strategy of the company and to oversee implementation of strategic decisions of the board. The head of corporate finance and strategy, and head of finance are regularly invited.
REPORT AND FINANCIAL STATEMENTS FOR THE YEAR ENDED 31 DECEMBER 2012
Investing in Africa
7
Corporate Governance continued
Nominations and Remuneration Committee
The committee meets at least quarterly and includes, three non-executive directors Zephaniah Gitau Mbugua, Joseph Karago and Njeru Kirira and the CEO. The main responsibilities of the committee are to nominate TCL and subsidiary companies’ board members, appointment of TCL and subsidiary CEO’s, and succession planning. The committee also determines the company’s remuneration policy for employees, management and non-executive directors. The committees submit their findings and recommendations at the quarterly board meetings.
DIRECTORS EMOLUMENTS AND LOANS
The aggregate amounts of emoluments paid to the directors for services rendered during this financial year ended 31 December 2012 are disclosed in the financial statements. Neither at the end of the financial year nor at any time during the year did there exist any arrangement to which the company is a party, whereby a director might acquire benefits by means of acquisition of the company’s shares. All business transactions with the directors or related parties are carried out at arm’s length. Such transactions have been disclosed.
RISK MANAGEMENT AND CONTROLS
The board recognizes that managing risk to ensure an optimal mix between risk and return is an integral part of achieving corporate goals. The board has put in place processes for identifying, assessing, managing and monitoring risks to ensure that the company’s business objectives are achieved and risks mitigated. The company has defined procedures and financial controls to ensure the reporting of complete and accurate accounting information. They cover systems for obtaining authority for major transactions and for ensuring compliance with the laws and regulations that have significant financial implications. The Board approves company policies and procedures whereas the management implements the Board’s risk management policy. Procedures are also in place to mitigate investment risks and manage the risk profile of the investment portfolio.
A comprehensive management accounting system is in place providing financial and operational performance measurement indicators. Regular senior management meetings are held to monitor performance and to agree on measures to drive improvement.

REPORT AND FINANCIAL STATEMENTS FOR THE YEAR ENDED 31 DECEMBER 20128
Investing in Africa
Chairman’s Statement
Zephaniah Gitau MbuguaChairman of the Board
Dear Investors,
On behalf of the entire Board of Directors, it is my pleasure to
present to you the audited financial statements for the financial
year ended December 2012.
Overview of Group Performance
Group revenues increased by 26% to KES 13.5 billion while our
Profit before tax increased by 41% to KES 1.2 billion in 2012.
Overview of the Business Environment
The Group was able to achieve the significant growth even in
a financial year that began with inflation rate as high as 18%,
pushing interest rates to increase to record highs, above 20% for
most of the regional lenders. The actions from regional central
banks were able to stabilise the Inflation rates, which decreased
steadily throughout the year. By end of 2012, inflation rates
for Kenya, Uganda and Tanzania were at 3.2%, 5.5% and 12.1%
respectively, and interest rates were at more manageable levels
across the region.
Despite the volatile interest rate environment, the regional
economies showed resilience and recorded impressive growth in
GDP. The best performing member of the East African Community
was Rwanda, which according to the IMF, had a GDP growth rate
of 7.7% as at December 2012. Tanzania also showed impressive
GDP growth rates growing at 6.8% in the same period. However,
Uganda’s economy slowed to 2.6% during the year 2012. Kenya’s
GDP growth rate of 4.7% in 2012 was a slight improvement to the
4.4% growth rate recorded in 2011.
Though not part of the East African Community, Southern Sudan
continues to act as an important contributor of economic growth
for the region and continued its rapid transformation since
gaining independence in early 2011. The new nation creates
many opportunities for regional expansion of all our Divisions, as
the country builds its Infrastructure, including roads, the electric
grid and construction sectors.
The Upstream Oil and Gas activity also continues to be a catalyst
for economic growth in East Africa. In Kenya and Uganda, the Oil
companies moved closer to the beginning of the oil extraction
phase which will result in large sums of capital investment in
preparation of the extraction of the oil reserves. In Tanzania,
new gas finds in 2012 resulted in nearly a tripling of the total
size of estimated gas reserves, which will fuel economic growth
in Tanzania in the future. East Africa’s development into an
important Oil & Gas hub will create numerous opportunities
across the economic spectrum, including the engineering and
construction, logistics and services sectors.
On the Political scene, we are encouraged by the recent peaceful
election held in Kenya. The election was also a testament to
the importance of Kenya’s young institutions created by the
new constitution. The smooth transition will increase investor
confidence in the region and lay a foundation for strong
economic growth for the future.
Outlook
The growth outlook across our three key Divisions remains
positive, driven by strong fundamentals within the Power,
Transport & Logistics, and Engineering & Construction sectors:
• PowerDivision:
- Our Power Division benefits from investment by
regional utilities in expansion of the national grids,
through urban and rural electrification programs
- With the stabilisation of regional interest rates,
growth in the resilient construction sector is expected
to increase, which should act as a driver for our market
leading cable products
• TransportDivision:
- Strong demand for imports, specifically for
containerised cargo which grew by 12.5% to 770,000
TEU’s

REPORT AND FINANCIAL STATEMENTS FOR THE YEAR ENDED 31 DECEMBER 2012
Investing in Africa
9
Chairman’s Statement continued
• EngineeringDivision:
- Development of power generation capacity by
KenGen as well as Independent Power Producers (IPP’s)
in line with regional push for more affordable baseload
power generation capacity
- The developing upstream Oil & Gas industry in the
region requires local engineering and construction
capacity
- The construction of new mines across the region to
exploit the rich set of natural resources in a historically
under explored region
We expect that our Divisions will continue to grow, and in doing
so, contribute to improving the regional infrastructure across
the region and driving long-term value creation for our Investors.
Appreciation
I would like to thank the shareholders of TransCentury for their
continued support and commitment throughout the year. Our
shareholder base continues to grow each year, and we welcome
the new shareholders who joined the TransCentury family
during the year.
I continue to benefit from the wise counsel of my fellow directors,
for which I owe much gratitude. I would also like to thank
all our stakeholders, including our hard-working and highly
talented members of staff as well as our business partners who
contributed towards delivering the stellar earnings performance.
Zephaniah Gitau Mbugua
Chairman

REPORT AND FINANCIAL STATEMENTS FOR THE YEAR ENDED 31 DECEMBER 201210
Investing in Africa
Chief Executive’s Statement
Dear Shareholders,
The 2012 financial year saw TransCentury continue with its
strong growth momentum arising from organic growth in our
Power and Engineering Divisions as well as a positive impact of
the consolidation of the Group’s recent strategic acquisitions.
The growth also resulted in a reduced reliance in our Power
Division, with revenues and profitability now equally distributed
across our Divisions.
During the year, the Rift Valley Railways (‘RVR’) capital
expenditure program kicked off successfully in early 2012,
after the first successful drawdown of debt, which occurred
in December 2011. Since then, over USD 100 million has been
invested in rehabilitating the track, modernising operations
through innovative IT systems and overhauling of locomotives
and wagons. The capital expenditure program will result in a total
of USD 287 million being invested towards the rehabilitation of
the railway assets quadrupling current freight rail capacity from
the Port of Mombasa.
TransCentury also continued investment in our brown-field
operations in Zambia and DRC. The Zambian operations are
a strategic investment that continues to open access to the
copper-belt region of Zambia and southern DRC. TCL is also
excited about our DRC copper plant which has shown continued
progress.
The year also witnessed TransCentury continue to refocus its
strategy on infrastructure and engineering. As such, in December
2012 the Company divested of its Consumer business “Chai Bora”,
Tanzania’s leading packaged tea manufacturer. The proceeds of
the sale were redeployed into TransCentury’s core Divisions –
Power, Transport and Engineering.
Group Performance
The Group recorded strong growth in business activity, which
resulted in an uptick in revenues and earnings driven by organic
growth in our Power Division as well as a positive impact of
the consolidation of the Group’s recent strategic engineering
acquisition. TCL revenues grew by 26%, increasing from KES 10.7
billion in 2011 to KES 13.5 billion in 2012 while TCL’s operating
profit rose by 22%, from KES 1.6 billion in 2011 to KES 2.0 billion
in 2012. This resulted in a Profit before tax increase of 41%, from
KES 869 million in 2011 to KES 1.2 billion in 2012.
REVENUE
10.7bn
2011 2012
13.5bn26%
OPERATING PROFIT
1.6bn2.0bn
2011 2012
22%
PROFIT BEFORE TAX
2011 2012
869m
1.2b
41%

REPORT AND FINANCIAL STATEMENTS FOR THE YEAR ENDED 31 DECEMBER 2012
Investing in Africa
11
The growth in revenues and earnings was despite the difficult macro-economic environment at the beginning of the year which
resulted in a high interest rate environment across East Africa, with borrowing costs of +20%. The impact was felt across all industries,
and specifically in the construction industry. The situation then stabilized in the latter half of 2012, with a reduction of inflation rates
and the resulting easing of interest rates across the region.
1 The NAV includes TC Mauritius Convertible Bond
The Group also experienced a reduction in the Asset Base, from KES 22.4 billion in 2011 to KES 21.8 billion in 2012. However, this was
driven by a reduction in the Group’s working capital in line with the Group’s strategy to improve working capital management in the
operating Divisions. Fixed assets grew from KES 12.9 billion in 2011 to KES 14.3 billion in 2012, as the Group invested capital across the
three core Divisions.
Performance by Division
Power
Power: Business Overview
TransCentury’s Power Division is the leading quality provider of power solutions across the grid including: electrical equipment solutions, industrial products and turnkey projects.
• Cables: Low and medium voltage cables, Copper winding wires, Overhead conductors, Data & Communication cables & Specialty
Cables
• Transformers: Distribution transformers, Power transformers, Special transformers as well as Onsite repair and maintenance
• Switchgear: Low and medium voltage switchgear, as well as installation and commissioning and maintenance
• Generators: SDMO generators, Yor Power and Power Pro generators
• Turnkey Projects: substations, distribution & transmission lines as well as other turnkey solutions
Power: Financial Performance
The Division had 13% reduction in revenues, from KES 7.7 billion to KES 6.7 billion in 2012, as copper and aluminium prices stabilised downwards. Despite this, the Division experienced an uptick in profitability, with an increase in operating profit from KES 123 million to KES 521 million, as the Division recovered from high metal prices that depressed margins in 2011.
Volumes within the Division remained relatively flat in 2012, impacted by the slowdown of growth in the construction sector within the region. However, the stabilisation of interest rates during the year has improved outlook for the construction industry in 2013.
Chief Executive’s Statement continued
2011 2012
TOTAL ASSETS
21.8bn22.4bn-2.6%
2011
NAV1
2012
11.1bn12.1bn
8.9%
2011 2012
REVENUE
6.7bn7.7bn-13%
2011
OPERATING PROFIT
2012
123m
521m
325%
REPORT AND FINANCIAL STATEMENTS FOR THE YEAR ENDED 31 DECEMBER 201212
Investing in Africa
Chief Executive’s Statement continued
The Division’s operating margins recovered from 2011 depressed levels also benefitting from renewed focus on new and innovative products within the Division, including XLPE insulated cables and Arial Bundled Conductors. The products will help differentiate our product offering and validate our market leadership in the region. Management also improved profitability by installing a cost cutting programme aimed at increasing efficiency across the Division.
Power: Investing for Growth
In 2012, the Division invested KES 277 million in capital expenditure, up from KES 111 million in 2011, aimed towards increasing efficiency in our production plants. Investment in efficiency will aid our production facilities to continue growing into the new capacity that we have installed.
Profitability of the Division continues to be impacted by our brown field investment activities. Continued investment in our Zambian operations as well our DRC cable plant impacted our operating margins. However, the Division continues to benefit from the improved geographic expansion into the resource rich copper-belt region in Zambia and DRC. We also expect opportunities to emerge for our other Power products as well as for our other Divisions.
Transport
Transport: Business Overview
The Transport Division comprises TransCentury’s 34% shareholding in Rift Valley Railways (RVR), the 25-year concession to operate the Kenya-Uganda railway. The railway line begins at the port of Mombasa, and runs along the Northern Corridor, through most key urban areas in Kenya including Nairobi and onwards to Uganda’s capital city of Kampala and then to the west of Uganda, where the oil fields are situated.
Transport: Financial Performance
In 2012, RVR Kicked off the planned turnaround plan after receiving its first debt drawdown in December 2011. During the 2012 financial year, over USD 100 million was invested as part of the capital expenditure programme, and the following has been achieved to date:
• Rehabilitation of the dilapidated track: over 50% complete
• Refurbishment and overhaul of wagons: over 350 wagons refurbished or overhauled
• Launch of the locomotive rehabilitation and overhaul programme
• Installation of a new ERP system and electronic train monitoring system
Transport: Investing for Growth
The progress of the capital expenditure has been encouraging albeit delayed due to the timing of the debt funding, and has resulted in a steady increase in capacity of the railway as well as improvement in the permanent way. The next phase of the capital expenditure programme began with the 2nd draw down of the debt package, which took place in the beginning of 2013.
With the successful 2nd draw down, RVR will look to achieve the following:
• Completion of rehabilitation of rails, culverts and bridges
• Improvement of track geometry with new tamping machine and welding of rails
• Overhaul of locomotives and installation of onboard computers in locos to increase efficiency and traction capacity, as loco
availability still remains a key gating item
• Realisation of the cost reduction program following implementation of technology to manage fuel and labour costs
Engineering
Engineering: Business Overview
TransCentury’s Engineering Division is the regions leading Mechanical and Civil Engineering and Contracting Firm in East and Central Africa.

REPORT AND FINANCIAL STATEMENTS FOR THE YEAR ENDED 31 DECEMBER 2012
Investing in Africa
13
Chief Executive’s Statement continued
Products and Services provided include the following:
• Mechanical Engineering
• Civil Engineering
• Logistics
• Cranage & Erection
• Industrial Equipment
Engineering: Financial Performance
Revenues for the Engineering Division grew by 233% from KES 2.0 billion in 2011 to KES 6.8 billion in 2012, driven by the full year consolidation of Civicon, which augmented Avery’s contribution to the Engineering Division.
The Engineering Division continued to be very active in infrastructure projects across the region in 2012. Key projects that the Engineering Division was engaged in during the year were in the following sectors:• Sale of large weighbridges
• Sale of large Generators
• Power generation projects
• Oil and gas; upstream and downstream
• Mining services
• Transport infrastructure projects
• Specialised logistics and lifting
The operating profit of the Division grew from KES 655 million to KES 771 million in 2012. The growth did not keep up with the growth in revenues as a large number of key projects were in their start up phase requiring significant amounts of upfront mobilization costs.
Engineering: Investing for growth
The Engineering Division invested over KES 1 billion, which went towards new heavy equipment to support new projects predominantly in Kenya and DRC. The investment has been targeted to the Division’s growth areas, including mining services.
Appreciation
I would to thank the board of directors of TransCentury for their guidance and strategic support throughout the year. I would also like to thank our dedicated management and staff across all our Divisions who were integral in helping to deliver our strong growth.
I look forward to a successful and prosperous 2013.
Yours Sincerely,
Dr. Gachao KiunaChief Executive Officer
2011 2012
REVENUE
6.8bn
2.0bn233%
2011
OPERATING PROFIT
2012
655m771m
18%

REPORT AND FINANCIAL STATEMENTS FOR THE YEAR ENDED 31 DECEMBER 201214
Investing in Africa
Report of the Directors
The directors have pleasure in submitting their report together with the audited group annual financial statements for the year ended 31 December 2012, which disclose the state of affairs of the company and the group.
1. Activities
The group’s principal activity is that of power, transport, infrastructure and engineering industries across Africa.
2. Results The results for the year are set out on page 17.
3. Dividends The directors recommend the payment of a first and final dividend of KShs 0.40 (2011 - KShs 0.25) per share which amounts to
KShs 109,580,114 (2011 – KShs 68,487,571).
4. Directors
The directors who served since 1 January 2012 are set out on page 3.
5. Auditors
The auditors, KPMG Kenya, continue in office in accordance with Section 159(2) of the Kenyan Companies Act.
6. Approval of financial statements
The financial statements were approved at a meeting of the directors held on 10 April 2013
BY ORDER OF THE BOARD
Secretary
Date: 10 April 2013

REPORT AND FINANCIAL STATEMENTS FOR THE YEAR ENDED 31 DECEMBER 2012
Investing in Africa
15
The Directors are responsible for the preparation and fair presentation of the group and company annual financial statements of Trans-Century Limited set out on pages 17 to 64 which comprise the group and company statements of financial position at 31 December 2012, the group statement of comprehensive income, group and company statements of changes in equity and group statement of cash flows for the year then ended, and a summary of significant accounting policies and other explanatory notes.
The Directors’ responsibilities include: determining that the basis of accounting described in Note 2 is an acceptable basis for preparing and presenting the financial statements in the circumstances, preparation and presentation of financial statements in accordance with International Financial Reporting Standards and in the manner required by the Kenyan Companies Act and for such internal control as the directors determine is necessary to enable the preparation of financial statements that are free from material misstatements, whether due to fraud or error.
Under the Kenyan Companies Act the Directors are required to prepare financial statements for each financial year which give a true and fair view of the state of affairs of the group and the company as at the end of the financial year and of the operating results of the group for that year. It also requires the Directors to ensure the group keeps proper accounting records which disclose with reasonable accuracy the financial position of the group and the company.
The Directors accept responsibility for the annual financial statements, which have been prepared using appropriate accounting policies supported by reasonable and prudent judgements and estimates, in compliance with International Financial Reporting Standards and in the manner required by the Kenyan Companies Act. The Directors are of the opinion that the financial statements give a true and fair view of the state of the financial affairs of the group and the company and of the group operating results.
The Directors further accept responsibility for the maintenance of accounting records which may be relied upon in the preparation of financial statements, as well as adequate systems of internal financial control.
The Directors have made an assessment of the group, the company and its subsidiaries ability to continue as a going concern and have no reason to believe the group, company and its subsidiaries will not be a going concern for at least the next twelve months from the date of this statement.
Approval of the financial statements
The consolidated and separate financial statements, as indicated above, were approved by the Board of Directors on 10 April 2013 and were signed on its behalf by:
____________________________ ____________________________Director DirectorZephaniah Mbugua Gachao Kiuna
Statement of Directors’ Responsibilities

16
Report of the Independent Auditorsto the members of TransCentury Limited
We have audited the group and company financial statements of Trans-Century Limited set out on pages 17 to 64 which comprise the group and company statements of financial position at 31 December 2012, the group statement of comprehensive income, group and company statements of changes in equity and group statement of cash flows for the year then ended, and a summary of significant accounting policies and other explanatory notes.
Directors’ responsibility for the financial statements
As stated on page 15, the directors are responsible for the preparation and fair presentation of these financial statements in accordance with International Financial Reporting Standards and in the manner required by the Kenyan Companies Act and for such internal control as the directors determine is necessary to enable the preparation of financial statements that are free from material misstatements, whether due to fraud or error.
Auditor’s responsibility
Our responsibility is to express an opinion on these financial statements based on our audit. We conducted our audit in accordance with International Standards on Auditing. Those standards require that we comply with relevant ethical requirements and plan and perform the audit to obtain reasonable assurance whether the financial statements are free from material misstatement.
An audit involves performing procedures to obtain audit evidence about the amounts and disclosures in the financial statements. The procedures selected depend on our judgement, including the assessment of the risks of material misstatement of the financial statements, whether due to fraud or error. In making those risk assessments, we consider internal control relevant to the entity’s preparation and fair presentation of the financial statements in order to design audit procedures that are appropriate in the circumstances, but not for the purpose of expressing an opinion on the effectiveness of the entity’s internal control. An audit also includes evaluating the appropriateness of accounting policies used and the reasonableness of accounting estimates made by management, as well as evaluating the overall presentation of the financial statements.
We believe that the audit evidence we have obtained is sufficient and appropriate to provide a basis for our opinion.
Opinion
In our opinion, the financial statements give a true and fair view of consolidated and company financial position of Trans-Century Limited at 31 December 2012, and its consolidated and company financial performance and consolidated and company cash flows for the year then ended in accordance with International Financial Reporting Standards and the Kenyan Companies Act.
Report on other legal requirements
As required by the Kenyan Companies Act we report to you, based on our audit, that:
(i) We have obtained all the information and explanations, which to the best of our knowledge and belief were necessary for the purpose of our audit;
(ii) In our opinion, proper books of account have been kept by the company, so far as appears from our examination of those books; and
(iii) The statement of financial position of the company is in agreement with the books of account.
Date: 10 April 2013
KPMG Kenya Telephone +254 20 2806000 Certified Public Accountants Fax: +254 20 2215695 16th Floor, Lonrho House Email: [email protected] Standard Street Website: www.kpmg.co.ke P.O. Box 40612 00100 GPO Nairobi Kenya

REPORT AND FINANCIAL STATEMENTS FOR THE YEAR ENDED 31 DECEMBER 2012 17
Consolidated Statement of Comprehensive Incomefor the year ended 31 December 2012 2012 2011 Note KShs’000 KShs’000
Revenue 13,487,229 10,701,621Cost of sales (9,814,036) (7,676,422)
Gross profit 3,673,193 3,025,199Net other income 5 1,233,280 953,743Distribution, administration andoperating expenses (2,293,137) ( 2,036,391)
Profit before depreciation, impairment and finance cost 2,613,336 1,942,551Depreciation and amortisation 6 (643,904) ( 336,478)Impairment losses 6 - 11,990
Results from operating activities 6 1,969,432 1,618,063Finance income 7 159,167 59,875Finance cost 7 (902,126) (808,673)
Net finance cost (742,959) (748,798)
Profit before income tax 1,226,473 869,265Income tax expense 8 (490,368) ( 253,165)
Profit from continuing operations 736,105 616,100
Discontinued operationsProfit from discontinued operations (net of tax) 29 4,542 -
Profit from the year 740,647 616,100
Other comprehensive incomeRevaluation of property, plantand equipment, net of deferred tax 352,815 196,859Net change in fair value ofavailable-for-sale financial assets 10,913 (183,220)Available-for-sale reserve released ondisposal of quoted shares (47,979) (29,803)Exchange differences on translationof foreign subsidiaries (45,122) (139,162)
Other comprehensive incomenet of income tax 270,627 (155,326)
Total comprehensive income for the year 1,011,274 460,774
Profit after tax is attributable to:Equity holders of the company 455,056 356,665Non-controlling interest 285,591 259,435
Profit for the year 740,647 616,100
Total comprehensive income for theyear attributable to:Equity holders of the company 532,484 210,367Non-controlling interest 478,790 250,407
1,011,274 460,774
BASIC EARNINGS PER SHARE - (KShs) 22(a) 1.66 1.32
DILUTED EARNINGS PER SHARE - (KShs) 22(a) 1.66 1.23
DIVIDEND PER SHARE - (KShs) 22(b) 0.40 0.25
The notes set out on pages 25 to 64 form an integral part of these financial statements.

REPORT AND FINANCIAL STATEMENTS FOR THE YEAR ENDED 31 DECEMBER 201218
Consolidated Statement of Financial Positionas at 31 December 2012 2012 2011 RestatedASSETS Note KShs’000 KShs’000Non current assetsProperty, plant and equipment 9 6,865,850 5,818,209Investment property 10 285,125 474,003Prepaid operating lease rentals 11 149,918 157,904Intangible assets 12 2,429,592 2,661,410Quoted investments 13(a) 281 50,135Unquoted investments 13(b) 4,210,650 3,034,588Investments in funds 14 393,996 767,553Deferred tax asset 24(a) 575 74
14,335,987 12,963,876
Current assetsInventory 16 1,593,541 1,709,228Trade and other receivables 17 5,603,701 4,949,262Tax receivable 38,109 42,542Cash and cash equivalents 18 274,416 2,759,356 7,509,767 9,460,388
TOTAL ASSETS 21,845,754 22,424,264
EQUITY AND LIABILITIES
Capital and reserves (Pages 21 - 22)Share capital 19 136,975 136,975Share premium 20 379,717 379,717Revenue reserves 21(a) 3,102,831 2,757,355Translation reserve 21(b) 182,489 241,201Available-for-sale reserve 21(c) 197,593 234,659Revaluation reserve 21(d) 793,778 620,572Proposed dividends 22(b) 109,580 68,488
Total equity attributable toequity holders of the company 4,902,963 4,438,967Non-controlling interest 2,591,078 2,193,659Convertible bond 23 4,574,554 4,452,798
Total equity 12,068,595 11,085,424
LiabilitiesNon current liabilitiesDeferred tax liability 24(b) 717,438 618,213Provision for staff gratuity 34,402 29,477Long term loan – non-current portion 25 3,179,169 2,965,304
3,931,009 3,612,994Current liabilitiesBank overdraft 18 335,405 263,953Long term loan – current portion 25 1,397,958 1,337,928Trade and other payables 26 3,883,406 5,715,174Tax payable 194,127 379,335Unclaimed dividends 324 101Aureos Fund – other members 14 34,930 29,355
5,846,150 7,725,846
Total liabilities 9,777,159 11,338,840
TOTAL EQUITY AND LIABILITIES 21,845,754 22,424,264
The financial statements on pages 17 to 64 were approved by the Board of Directors on 10 April 2013 and were signed on its behalf by:
____________________________ ____________________________Director: Zephaniah Mbugua Director: Gachao Kiuna
The notes set out on pages 25 to 64 form an integral part of these financial statements.

REPORT AND FINANCIAL STATEMENTS FOR THE YEAR ENDED 31 DECEMBER 2012 19
Company Statement of Financial Positionas at 31 December 2012 2012 2011ASSETS Note KShs’000 KShs’000Non current assetsProperty, plant and equipment 9 6,622 9,026Investment property 10 - 265,000Intangible assets 12 - 31Quoted investments 13(a) 281 50,135Unquoted investments 13(b) 253,200 213,751Investment in subsidiaries 13(c) 9,138,670 8,766,455Investments in funds 14 393,996 767,553Loans to subsidiaries 15 493,275 632,658Deferred tax asset 24(a) 575 74
10,286,619 10,704,683
Current assetsTrade and other receivables 17 1,252,356 469,649Tax receivables 4,329 4,147Loans to subsidiaries 15 - 116,724
1,256,685 590,520
TOTAL ASSETS 11,543,304 11,295,203
EQUITY AND LIABILITIESCapital and reserves (Pages 23 - 24)Share capital 19 136,975 136,975Share premium 20 379,717 379,717Revenue reserves 21(a) 342,436 577,831Available-for-sale reserve 21(c) 7,865,416 7,530,266Proposed dividends 22(b) 109,580 68,488
Total equity attributable toequity holders of the company 8,834,124 8,693,277
Total equity 8,834,124 8,693,277
Non current liabilities
Long term loan – non-current portion 25 1,853,113 2,309,995
Current liabilities Bank overdraft 18 100,245 41,899
Long term loan – current portion 25 576,073 145,913
Trade and other payables 26 144,496 74,663
Unclaimed dividends 323 101
Aureos Fund – other members 14 34,930 29,355
856,067 291,931
Total liabilities 2,709,180 2,601,926
TOTAL EQUITY AND LIABILITIES 11,543,304 11,295,203
The financial statements on pages 17 to 64 were approved by the Board of Directors on 10 April 2013 and were signed on its behalf by:
____________________________ ____________________________Director: Zephaniah Mbugua Director: Gachao KiunaThe notes set out on pages 25 to 64 form an integral part of these financial statements.

REPORT AND FINANCIAL STATEMENTS FOR THE YEAR ENDED 31 DECEMBER 201220
Consolidated Statement of Cash Flowsfor the year ended 31 December 2012
2012 2011 Note KShs’000 KShs’000Net cash flows from operating activities
Profit before taxation 1,226,473 869,265Adjustment for non-cash items (81,525) (217,627)
Operating profit before working capital changes 1,144,948 651,638
Increase in trade and other receivables (869,682) (1,384,693)Decrease in inventories (50,326) 260,910Decrease in Aureos Fund - Other member 5,575 (1,933)Increase in trade and other payables (1,759,713) 2,735,898Increase in provision for staff gratuity 15,710 3,944
Cash generated from operations (1,513,488) 2,265,764
Income tax paid ( 689,919) (250,694)Dividends paid to shareholders of the company (68,488) (53,408)Dividend paid to non-controlling interest ( 81,371) (109,090)
Net cash flows from operating activities (2,353,266) 1,852,572
Cash flows from investing activities
Purchase of property, plant and equipment (1,464,306) (147,849)Purchase of intangible assets (6,975) (3,022)Interest refund on the convertible bond 121,756 -Investments in subsidiaries, funds and other investments (797,413) (4,051,122)Proceeds from disposal of investments 1,315,579 -Proceeds from disposal of property, plantand equipment 203,517 9,739Proceeds from disposal of quoted shares 83,657 14,258
Net cash flows from investing activities (544,185) (4,177,996)
Cash flows from financing activities
Net movement in loans and borrowing 341,059 118,960Net proceeds from issue of convertible bond - 4,452,798Issue of additional shares - 276,489
Net cash flows from financing activities 341,059 4,848,247
Net increase in cash and cash equivalents (2,556,392) 2,522,823
Cash and cash equivalents at the end of the year 18 (60,989) 2,495,403Cash and cash equivalents at the beginning of the year 18 2,495,403 (27,420)
Net increase in cash and cash equivalents (2,556,392) 2,522,823
The notes set out on pages 25 to 64 form an integral part of these financial statements.

REPORT AND FINANCIAL STATEMENTS FOR THE YEAR ENDED 31 DECEMBER 2012 21
Consolidated Statement of Changes in Equityfor the year ended 31 December 2011
Avai
labl
e
Shar
e Sh
are
Reva
luat
ion
Tran
slat
ion
for s
ale
Reve
nue
Prop
osed
N
on-c
ontr
ollin
g20
11
capi
tal
prem
ium
re
serv
es
rese
rve
rese
rve
rese
rves
di
vide
nds
Tota
l in
tere
st
Tota
l
KShs
‘000
KS
hs ‘0
00
KShs
‘000
KS
hs ‘0
00
KShs
‘000
KS
hs ‘0
00
KShs
’000
KS
hs’0
00
KShs
‘000
KS
hs’0
00
Bala
nce
at 1
Janu
ary
2011
13
3,51
9
106
,684
4
34,9
89
367
,556
4
47,6
82
2,4
07,6
42
53,4
08
3,95
1,48
0 1,
341,
974
5,2
93,4
54
Tota
l com
preh
ensi
ve in
com
e fo
r the
yea
r net
of t
axN
et p
rofit
aft
er ta
x
-
- -
- -
356,
665
- 35
6,66
5 25
9,43
5 61
6,10
0
Oth
er c
ompr
ehen
sive
inco
me
Reva
luat
ion
of p
rope
rty,
pla
nt a
ndeq
uipm
ent n
et o
f def
erre
d ta
x -
- 19
2,83
2 -
- -
- 19
2,83
2 4,
027
196,
859
Exch
ange
adj
ustm
ent
- -
- (1
26,1
07)
- -
- (1
26,1
07)
(13,
055)
(1
39,1
62)
Net
cha
nge
in fa
ir va
lue
for
avai
labl
e-fo
r-sa
le fi
nanc
ial a
sset
s -
- -
- (1
83,2
20)
- -
(183
,220
) -
(183
,220
)Re
leas
e on
dis
posa
l of q
uote
d sh
ares
-
- -
- (2
9,80
3)
- -
(29,
803)
-
(29,
803)
Tota
l oth
er c
ompr
ehen
sive
inco
me
-
-
192,
832
(126
,107
) (2
13,0
23)
- -
(146
,298
) (9
,028
) (1
55,3
26)
Tota
l com
preh
ensi
ve in
com
e
-
- 19
2,83
2 (1
26,1
07)
(213
,023
) 35
6,66
5 -
210,
367
250,
407
460,
774
Tran
sact
ions
with
ow
ners
of t
hegr
oup,
reco
rded
dire
ctly
in e
quit
yCo
ntri
butio
ns b
y an
d di
stri
butio
nsto
ow
ners
of t
he g
roup
Div
iden
d pa
id
- -
- -
- -
(53,
408)
(5
3,40
8)
(109
,090
) (1
62,4
98)
Prop
osed
div
iden
ds
- -
- -
- (6
8,48
8)
68,4
88
- -
-Is
sue
of a
dditi
onal
sha
res
3,45
6 -
- -
- -
- 3,
456
- 3,
456
Shar
e pr
emiu
m fr
om is
sue
of s
hare
s -
273,
033
- -
- -
- 27
3,03
3 -
273,
033
Tran
sfer
from
non
-con
trol
ling
inte
rest
-
- ( 7
,249
) (2
48)
- 61
,536
-
54,0
39
(54,
039)
-
Tota
l tra
nsac
tions
with
ow
ners
, re
cord
ed d
irect
ly in
equ
ity
3,4
56
273,
033
(7,2
49)
(248
) -
(6,9
52)
15,0
80
277,
120
(163
,129
) 11
3,99
1
Acqu
isiti
on o
f sub
sidi
ary
with
non-
cont
rolli
ng in
tere
stdu
ring
the
year
– R
esta
ted
(Not
e 28
)
-
- -
- -
- -
- 76
4,40
7 76
4,40
7
Bala
nce
at 3
1 D
ecem
ber 2
011
136,
975
379,
717
620,
572
241,
201
234,
659
2,75
7,35
5 68
,488
4,
438,
967
2,19
3,65
9 6,
632,
626
The
note
s se
t out
on
page
s 25
to 6
4 fo
rm a
n in
tegr
al p
art o
f the
fina
ncia
l sta
tem
ents
.

REPORT AND FINANCIAL STATEMENTS FOR THE YEAR ENDED 31 DECEMBER 201222
Consolidated Statement of Changes in Equityfor the year ended 31 December 2012
Av
aila
ble
N
on-
Sh
are
Shar
e Re
valu
atio
n Tr
ansl
atio
n fo
r sal
e Re
venu
e Pr
opos
ed
co
ntro
lling
2012
: ca
pita
l pr
emiu
m
rese
rves
re
serv
e re
serv
e re
serv
es
divi
dend
s To
tal
inte
rest
To
tal
KS
hs ‘0
00
KShs
‘000
KS
hs ‘0
00
KShs
‘000
KS
hs ‘0
00
KShs
‘000
KS
hs’0
00
KShs
’000
KS
hs ‘0
00
KShs
’000
Bala
nce
at 1
Janu
ary
2012
– A
s pr
evio
usly
sta
ted
136,
975
379,
717
620,
572
241,
201
234,
659
2,75
7,35
5 68
,488
4,
438,
967
2,58
0,70
2 7,
019,
669
Prio
r per
iod
adju
stm
ents
:- P
rior y
ear a
djus
tmen
t (N
ote
28)
-
-
- -
- -
- -
(387
,043
) (3
87,0
43)
Bala
nce
at 1
Janu
ary
2012
- As
rest
ated
13
6,97
5 37
9,71
7 62
0,57
2 24
1,20
1 23
4,65
9 2,
757,
355
68,4
88
4,43
8,96
7 2,
193,
659
6,63
2,62
6
Tota
l com
preh
ensi
ve in
com
e fo
r the
yea
r net
of t
axN
et p
rofit
aft
er ta
x
-
- -
- -
455,
056
- 45
5,05
6 28
5,59
1 74
0,64
7
Oth
er c
ompr
ehen
sive
inco
me
Reva
luat
ion
of p
rope
rty,
pla
nt a
ndeq
uipm
ent n
et o
f def
erre
d ta
x -
- 17
3,20
6 -
- -
- 17
3,20
6 17
9,60
9 35
2,81
5Ex
chan
ge a
djus
tmen
t -
- -
(58,
960)
-
- -
(58,
960)
13
,838
(4
5,12
2)N
et c
hang
e in
fair
valu
e of
avai
labl
e-fo
r-sa
le fi
nanc
ial a
sset
s -
- -
- 10
,913
-
- 10
,913
-
10,9
13Re
leas
e on
dis
posa
l of q
uote
d sh
ares
-
- -
- (4
7,97
9)
- -
(47,
979)
-
(47,
979)
Tran
sfer
from
tran
slat
ion
rese
rves
-
- -
248
- -
- 24
8 (2
48)
-
Tota
l oth
er c
ompr
ehen
sive
inco
me
-
-
173,
206
(58,
712)
(3
7,06
6)
- -
77,4
28
193,
199
270,
627
Tota
l com
preh
ensi
ve in
com
e
-
- 17
3,20
6 (5
8,71
2)
(37,
066)
45
5,05
6 -
532,
484
478,
790
1,01
1,27
4
Tran
sact
ions
with
ow
ners
of t
he g
roup
, rec
orde
d di
rect
ly in
equ
ity
Cont
ribu
tions
by
and
dist
ribu
tions
to o
wne
rs o
f the
gro
upD
ivid
end
paid
-
- -
- -
- (6
8,48
8)
(68,
488)
(8
1,37
1)
(149
,859
)Pr
opos
ed d
ivid
ends
-
- -
- -
(109
,580
) 10
9,58
0 -
- -
Tota
l tra
nsac
tions
with
ow
ners
, re
cord
ed d
irect
ly in
equ
ity
-
-
- -
- (1
09,5
80)
41,0
92
(68,
488)
(8
1,37
1)
(149
,859
)
Bala
nce
at 3
1 D
ecem
ber 2
012
136
,975
37
9,71
7 79
3,77
8 18
2,48
9 19
7,59
3 3,
102,
831
109,
580
4,90
2,96
3 2,
591,
078
7,49
4,04
1
The
note
s se
t out
on
page
s 25
to 6
4 fo
rm a
n in
tegr
al p
art o
f the
fina
ncia
l sta
tem
ents
.

REPORT AND FINANCIAL STATEMENTS FOR THE YEAR ENDED 31 DECEMBER 2012 23
Company Statement of Changes in Equityfor the year ended 31 December 2011
Share Share Available for Revenue Proposed capital premium sale reserve reserves dividends Total2011: KShs ‘000 KShs ‘000 KShs ‘000 KShs ‘000 KShs’000 KShs’000
Balance at 1 January 2011 133,519 106,684 6,010,514 628,754 53,408 6,932,879
Total comprehensive income for the year net of tax
Profit for the year - - - 17,565 - 17,565
Other comprehensive income for the year
Net change in fair value of available-for-sale financial assets - - 1,549,555 - - 1,549,555Available-for-sale reserve released on disposal ofquoted shares - - (29,803) - - (29,803)
Total other comprehensive expense - - 1,519,752 - - 1,519,752
Total comprehensive income - - 1,519,752 17,565 - 1,537,317
Transactions with owners, recorded directly in equityContributions by and distributionsto owners of the companyNew shares issued during the year 3,456 273,033 - - - 276,489 Dividend paid - - - - (53,408) (53,408)Proposed dividends - - - (68,488) 68,488 -
Total transactions with owners for the year 3,456 273,033 - (68,488) 15,080 223,081
Balance as at 31 December 2011 136,975 379,717 7,530,266 577,831 68,488 8,693,277
The notes set out on pages 25 to 64 form an integral part of the financial statements.

REPORT AND FINANCIAL STATEMENTS FOR THE YEAR ENDED 31 DECEMBER 201224
Company Statement of Changes in Equityfor the year ended 31 December 2012
Share Share Available for Retained Proposed capital premium sale reserve reserves dividends Total2012: KShs ‘000 KShs ‘000 KShs ‘000 KShs ‘000 KShs’000 KShs’000
Balance at 1 January 2012 136,975 379,717 7,530,266 577,831 68,488 8,693,277
Total comprehensive income for the year net of taxProfit for the year - - - (125,815) - (125,815)
Other comprehensive income for the year
Net change in fair value of available-for-sale financial assets - - 383,176 - - 383,176Available-for-sale reserve released on disposal ofquoted shares - - 34,678 - - 34,678Available-for-sale reserve released on disposal ofFunds of funds investments - - (82,704) - - (82,704)
Total other comprehensive expense - - 335,150 - - 335,150
Total comprehensive income - - 335,150 (125,815) - 209,335
Transactions with owners, recorded directly in equityContributions by and distributionsto owners of the companyNew shares issued during the year Dividend paid - - - - (68,488) (68,488)Proposed dividends - - - (109,580) 109,580 -
Total transactions with owners for the year - - - (109,580) 109,580 -
Balance as at 31 December 2012 136,975 379,717 7,865,416 342,436 109,580 8,834,124
The notes set out on pages 25 to 64 form an integral part of the financial statements.

25REPORT AND FINANCIAL STATEMENTS FOR THE YEAR ENDED 31 DECEMBER 2012
Notes to the Consolidated Financial Statements
1. REPORTING ENTITY
Trans-Century Limited is a limited liability company incorporated in Kenya under the Kenyan Companies Act, and is domiciled in Kenya. The consolidated financial statements of the company as at and for the year ended 31 December 2012 comprise the company and its subsidiaries (together referred to as the “Group”). The address of its registered office is as follows:
Emu Registrars 3rd Floor, Suite 8, East wing The Greenhouse Ngong Road PO Box 61120 00200 Nairobi City Square
Where reference is made in the accounting policies to Group it should be interpreted as being applicable to the consolidated or separate financial statements as the context requires.
2. BASIS OF PREPARATION
(a) Statement of compliance
The consolidated and separate financial statements have been prepared in accordance with International Financial Reporting Standards (IFRSs) and the requirements of the Kenyan Companies Act.
For Kenyan Companies Act reporting purposes in these financial statements, the balance sheet is presented by the statement of financial position and the profit and loss account is presented by the statement of comprehensive income.
(b) Basis of measurement
The consolidated and company financial statements have been prepared on the historical cost basis except for the following:
• Available-for-salefinancialassetsaremeasuredatfairvalue; • Investmentpropertyismeasuredatfairvalue;and • Propertyandequipmentaremeasuredatrevaluedamounts. • Investmentsinsubsidiaries(companyfinancialstatements)aremeasuredatfairvalue
(c) Functional and presentation currency
These consolidated financial statements are presented in Kenya shillings (KShs), which is the company’s functional currency. All financial information presented has been rounded to the nearest thousand except where otherwise indicated.
(d) Use of estimates and judgments
The preparation of financial statements in conformity with International Financial Reporting Standards requires management to make judgments, estimates and assumptions that affect the application of accounting policies and the reported amounts of assets, liabilities and disclosures of contingent assets and liabilities at the date of the financial statements and the reported amounts of income and expenses during the period. The estimates and assumptions are based on the directors’ best knowledge of current events, actions, historical experience and various other factors that are believed to be reasonable under the circumstances, the results of which form the basis of making the judgments about the carrying values of assets and liabilities are not readily apparent from other sources. Actual results may differ from these estimates.
Estimates and underlying assumptions are reviewed on an ongoing basis. Revisions to accounting estimates are recognised in the period in which the estimate is revised and in any future periods affected.
The key areas of judgement in applying the entities accounting policies are dealt with in the respective accounting policy note or/and disclosure note.

26 REPORT AND FINANCIAL STATEMENTS FOR THE YEAR ENDED 31 DECEMBER 2012
Notes to the Consolidated Financial Statements
2. BASIS OF PREPARATION (continued) (e) Determination of fair value
A number of the Group’s accounting policies and disclosures require the determination of fair value for both financial and non-financial assets and liabilities. Fair values have been determined for measurement and/or disclosure purposes based on the following methods. Where applicable, further information about the assumptions made in determining fair values is disclosed in the notes specific to that asset or liability.
Valuationofunquotedinvestmentsandsubsidiaries For equity instruments for which no active market exists, the Group uses the price of a recent investment or the
earnings multiple to estimate the fair value of these investments. Management uses estimates based on historical data relating to earnings of the investee company and other market based multiples in arriving at the fair value.
The primary assumption in employing the earnings multiple method is that the market has assigned an appropriate value to the benchmark company. The methodology and assumptions used for arriving at the market based multiples are reviewed and compared with other methodologies to ensure there are no material variances.
Valuationofquotedinvestments For quoted instruments, the fair value is determined by reference to their value weighted average price at the
reporting date.
Valuationofinvestmentproperty An external, independent valuation company, having appropriate recognised professional qualifications and recent
experience in the location and category of property being valued, values the Group’s investment property. The fair values are based on market values, being the estimated amount for which a property could be exchanged on the date of the valuation between a willing buyer and a willing seller in an arm’s length transaction after proper marketing wherein the parties had each acted knowledgeably, prudently and without compulsion. The values adopted in the financial statements are based on professional valuation, performed on a regular basis, by registered valuers.
Valuationofproperty,plantandequipment The fair value of property, plant and equipment recognised as a result of a business combination is based on market
values. The market value of property is the estimated amount for which a property could be exchanged on the date of valuation between a willing buyer and a willing seller in an arm’s length transaction after proper marketing wherein the parties had each acted knowledgeably, prudently and without compulsion. The market value of items of plant, equipment, fixtures and fittings is based on the professional valuation on the acquisition date performed by registered valuers on an open market value basis.
3. SIGNIFICANT ACCOUNTING POLICIES
The principal accounting policies adopted in the preparation of these consolidated financial statements are set out below and have been consistently applied to all periods presented in these financial statements and have been consistently applied by Group entities, except where indicated otherwise:
(a) Revenue income recognition
(i) Goodssoldandservices Sale of goods is recognised when the significant risks and rewards of ownership have been transferred to the buyer,
recovery of the consideration is probable, the associated costs and possible return of goods can be estimated reliably and there is no continuing management involvement with the goods.
Revenue from services rendered is recognised in the statement of comprehensive income in proportion to the stage of completion of the transaction at the reporting date.
The revenue is stated net of Value Added Tax (VAT).

27REPORT AND FINANCIAL STATEMENTS FOR THE YEAR ENDED 31 DECEMBER 2012
Notes to the Consolidated Financial Statements
3. SIGNIFICANT ACCOUNTING POLICIES (continued) (a) Revenue income recognition
(ii) Dividends Dividend income is recognised in the statement of comprehensive income on the date that the Group’s right to
receive payment is established.
(iii) Interestondepositswithfinancialinstitutions IInterest on deposits with financial institutions is accounted for on a time proportion basis in profit or loss using the
effective interest method.
(iv) Discountontreasurybills Discount on treasury bills is credited to profit or loss on a straight line basis over the maturity period of the investment.
(b) Basis of consolidation
(i) Subsidiaries Subsidiaries are entities controlled by the Group. Control exists when the Group has the power to govern the
financial and operating policies of an entity so as to obtain benefits from its activities. In assessing control, potential voting rights that currently are exercisable are taken into account. The financial statements of subsidiaries are included in the consolidated financial statements from the date that control commences until the date that control ceases. The accounting policies of subsidiaries have been changed when necessary to align them with the policies adopted by the Group.
The consolidated financial statements include the company and its subsidiaries. The significant subsidiaries are as follows:
In the company financial statements, investments in subsidiaries are measured at fair value.
Subsidiary Country of incorporation 2012%
2011%
Cable Holdings Limited Kenya 94.8 94.8
East African Cables Limited Kenya 64.3 64.3
East African Cables Tanzania Limited Tanzania 34.8 34.8
Avery (East Africa) Limited Kenya 94.4 94.4
Trans-Century Holdings (Pty) Limited South Africa 100.0 100.0
Tanelec Limited Tanzania 70.0 70.0
Crystal Limited Tanzania 100.0 95.0
TC Mauritius Holdings Limited Mauritius 100.0 100.0
Cable Holdings Mauritius Limited Mauritius 100.0 100.0
TC Engineering and Contracting Limited Mauritius 100.0 100.0
TC Railway Holdings Limited Mauritius 100.0 100.0
Safari Rail Company Limited Mauritius 100.0 100.0
Civicon Africa Group Limited Mauritius 62.0 62.0
Civicon DRC Holdings Limited Mauritius 69.6 62.0
Cableries du Congo Sprl Democratic Republic of Congo 100.0 100.0

28 REPORT AND FINANCIAL STATEMENTS FOR THE YEAR ENDED 31 DECEMBER 2012
Notes to the Consolidated Financial Statements
3. SIGNIFICANT ACCOUNTING POLICIES (continued) (b) Basis of consolidation (continued)
(ii) Associates Associates are those entities in which the Group has significant influence, but not control, over the financial and
operating policies. Significant influence is presumed to exist when the Group holds between 20 and 50 percent of the voting power of another entity. Investments in associates are accounted for using the equity method and are recognised initially at cost. The cost of the investments includes transaction costs.
(iii) Venturecapital Investment in Rift Valley Railways Investments Pty Limited (“RVR”) has been accounted for as a financial asset with its
fair value gains/losses being recognised in profit or loss in the period in which they occur. The investment in RVR is held through Safari Rail Company Limited, a company incorporated in Mauritius.
(iv) Transactionseliminatedonconsolidation Intra-group balances and transactions, and any unrealised income and expenses arising from intra-group transactions,
are eliminated in preparing the consolidated financial statements.
(c) Translation of foreign currencies (i) Foreigncurrencytransactions Transactions in foreign currencies are translated to the respective functional currencies of Group entities at exchange
rates at the dates of the transactions. Monetary assets and liabilities denominated in foreign currencies at the reporting date are retranslated to the functional currency at the exchange rate at that date. The foreign currency gain or loss on monetary items is the difference between amortised cost in the functional currency at the beginning of the period, adjusted for effective interest and payments during the period, and the amortised cost in foreign currency translated at the exchange rate at the end of the period. Non-monetary assets and liabilities denominated in foreign currencies that are measured at fair value are retranslated to the functional currency at the exchange rate at the date that the fair value was determined. Foreign currency differences arising on retranslation are recognised in profit or loss, except for differences arising on the retranslation of available-for-sale equity instruments.
(ii) Foreignoperations The assets and liabilities of foreign operations, including goodwill and fair value adjustments arising on acquisition,
are translated to Kenya Shillings at exchange rates at the reporting date. Foreign currency differences are recognised directly in equity.
Foreign exchange gains and losses arising from a monetary item receivable from or payable to a foreign operation, the settlement of which is neither planned nor likely in the foreseeable future, are considered to form part of a net investment in a foreign operation and are recognised directly in equity.
(d) Property, plant and equipment
Items of property, plant and equipment are stated at historical cost or valuation less accumulated depreciation and impairment.
Cost includes expenditure that is directly attributable to acquisition of the asset. When parts of an item of property, plant and equipment have different useful lives, they are accounted for as separate items (major components) of property, plant and equipment.
Any gain or loss on disposal of an item of property, plant and equipment (calculated as the difference between the net proceeds from disposal and the carrying amount of the item) is recognised in profit or loss.
Subsequent expenditure is only capitalised when it is probable that the future economic associated with the expenditure will flow to the Group. Ongoing repairs and maintenance is expensed as incurred.

29REPORT AND FINANCIAL STATEMENTS FOR THE YEAR ENDED 31 DECEMBER 2012
Notes to the Consolidated Financial Statements
3. SIGNIFICANT ACCOUNTING POLICIES (continued) (d) Property, plant and equipment (continued)
Depreciation is charged on a straight-line basis over the estimated useful lives of the assets. Land is not depreciated. The annual rates of depreciation used for the current and comparative periods are as follows:
• Freeholdbuildings 2%–5% • Leaseholdbuildings 2%orovertheleaseperiodifshorterthan50yearsonacquisition • Plant,machineryandequipment 5%-13% • Furniture,fixtures,fittings,motorvehicles andcomputers 12.5%-33% • Heavycommercialvehicles 12.5%
The assets’ residual values, depreciation methods and useful lives are re-assessed and adjusted as appropriate at each reporting date.
(e) Investment property
Investment property is property held either to earn rental income or for capital appreciation or for both, but not for sale in the ordinary course of business, use in the production or supply of goods or services or for administrative purposes. Investment property is measured at fair value with any change therein recognised in profit or loss.
Any gain or loss on disposal of an investment property (calculated as the difference between the net proceeds from
disposal and the carrying amount of the item) is recognised in profit or loss. When an investment property that was previously classified as property, plant and equipment is sold, any related amount included in the revaluation reserve is transferred to retained earnings.
When the use of a property changes such that it is reclassified as property, plant and equipment, its fair value at the date of reclassification becomes its cost for subsequent accounting.
(f) Operating leases
Leases where a significant portion of the risks and rewards of ownership are retained by the lessor, are classified as operating leases. Payments made under operating leases are charged to the statement of comprehensive income on a straight-line basis over the period of the lease.
(g) Impairment (i) Financialassets A financial asset is considered to be impaired if objective evidence indicates that one or more events have had a
negative effect on the estimated future cash flows of that asset.
An impairment loss in respect of a financial asset measured at amortised cost is calculated as the difference between its carrying amount, and the present value of the estimated future cash flows discounted at the original effective interest rate.
Individually significant financial assets are tested for impairment on an individual basis. The remaining financial assets are assessed collectively in groups that share similar credit risk characteristics.
All impairment losses are recognised in profit or loss. Impairment losses on available-for-sale financial assets are recognised by reclassifying the losses accumulated in the fair value reserve in equity to profit or loss. The cumulative loss that is reclassified from equity to profit or loss is the difference between the acquisition cost, net of any principal repayment and amortisation, and the current fair value, less any impairment loss recognised previously in profit or loss.
An impairment loss is reversed if the reversal can be related objectively to an event occurring after the impairment loss was recognised.
30 REPORT AND FINANCIAL STATEMENTS FOR THE YEAR ENDED 31 DECEMBER 2012
Notes to the Consolidated Financial Statements
3. SIGNIFICANT ACCOUNTING POLICIES (continued)
(g) Impairment (continued)
(ii) Non-financialassets
The carrying amounts of the Group’s non-financial assets, other than investment property, inventories and deferred tax assets, are reviewed at each reporting date to determine whether there is any indication of impairment. If any such indication exists then the asset’s recoverable amount is estimated. Goodwill is tested annually for impairment.
An impairment loss is recognised if the carrying amount of an asset or its cash-generating unit exceeds its recoverable amount. A cash-generating unit is the smallest identifiable asset group that generates cash flows that largely are independent from other assets and groups. Impairment losses are recognised in profit or loss. Impairment losses recognised in respect of cash-generating units reduce the carrying amount of the other assets in the unit (group of units) on a pro rata basis.
The recoverable amount of an asset or cash-generating unit is the greater of its value in use and its fair value less costs to sell. In assessing value in use, the estimated future cash flows are discounted to their present value using a pre-tax discount rate that reflects current market assessments of the time value of money and the risks specific to the asset.
Impairment losses recognised in prior periods are assessed at each reporting date for any indications that the loss has decreased or no longer exists. An impairment loss is reversed if there has been a change in the estimates used to determine the recoverable amount. An impairment loss is reversed only to the extent that the asset’s carrying amount does not exceed the carrying amount that would have been determined, net of depreciation or amortisation, if no impairment loss had been recognised. An impairment loss in respect of goodwill is not reversed.
(h) Inventories
Cost of inventories includes expenditure incurred in acquiring the inventories, production or conversion costs and other costs incurred in bringing them to their existing location and condition.
Work in progress and manufactured finished goods are valued at production cost including direct production costs (cost
of materials and labour) and an appropriate proportion of production overheads and factory depreciation. The cost of inventory is based on the weighted average principle.
If the purchase or production cost is higher than net realisable value, inventories are written down to net realisable
value. Net realisable value is the estimated selling price in the ordinary course of business less the estimated costs of completion and selling expenses.
(i) Trade and other receivables
Trade and other receivables are stated at amortised cost less an estimate made for doubtful receivables based on a review of all outstanding amounts at year end.
(j) Employee benefits
(i) Definedcontributionplans Some employees of the Group are eligible for retirement benefits under defined contribution plans provided through
separate fund arrangements.
Contributions to the defined contribution plan are charged to the profit or loss as incurred.
(ii) Staffgratuity Unionisable staff for one of the subsidiaries are eligible to a gratuity upon retirement based on 23 days pay for each
completed year of service at current salary. A provision is made in the financial statements for the estimated liability of such gratuity payable. Movements in the provision are accounted for in profit or loss.

31REPORT AND FINANCIAL STATEMENTS FOR THE YEAR ENDED 31 DECEMBER 2012
Notes to the Consolidated Financial Statements
3. SIGNIFICANT ACCOUNTING POLICIES (continued) (j) Employee benefits (continued) (iii) Leaveaccrual The monetary value of the unutilised leave by staff as at year end is recognised as an expense in the year and carried
in the accruals as a payable.
(iv) Terminationbenefits Termination benefits are recognised as an expense when the Group is demonstrably committed, without realistic
possibility of withdrawal, to a formal detailed plan to either terminate employment before the normal retirement date, or to provide termination benefits as a result of an offer made to encourage voluntary redundancy. Termination benefits for voluntary redundancies are recognised as an expense if the Group has made an offer encouraging voluntary redundancy, it is probable that the offer will be accepted, and the number of acceptances can be estimated reliably.
(k) Taxation
Tax on the operating results for the year comprises current tax and change in deferred tax. Current tax and deferred tax is recognised in profit or loss except to the extent that it relates to items recognised directly in equity or other comprehensive income. Current tax is provided on the results in the year as shown in the financial statements adjusted in accordance with tax legislation.
Deferred tax is recognised in respect of temporary differences between carrying amounts of assets and liabilities for financial reporting purposes and the amounts used for taxation purposes. Deferred tax is not recognised for:
• temporarydifferencesrelatingtotheinitialrecognitionofassetsorliabilitieswhichaffectneitheraccounting nortaxableprofitorloss;
• temporarydifferencesrelatedtoinvestmentsinsubsidiariesandassociatestotheextentthatitisprobablethattheywillnotreverseintheforeseeablefuture;and
• taxabletemporarydifferencesarisingontheinitialrecognitionofgoodwill. A deferred tax asset is recognised only to the extent that it is probable that future taxable profit will be available against
which the tax asset can be utilised. Deferred tax assets are reviewed at each reporting date and are reduced to the extent that it is no longer probable that the related tax benefit will be realised. Deferred tax is measured at the tax rates that are expected to apply to temporary differences when they reverse, on the basis of the tax rates enacted or substantively enacted at the reporting date.
(l) Cash and cash equivalents For the purposes of the statement of cash flows, cash and cash equivalents comprise of cash in hand, bank balances, and
short term deposits net of bank overdrafts. (m) Related party transactions The group discloses the nature, volume and amounts outstanding at the end of each financial year from transactions with
related parties, which include transactions with the directors, executive officers and group or related companies.
(n) Dividends Dividends are recognised as a liability in the period in which they are declared. Proposed dividends are treated as a
separate component of equity.

32 REPORT AND FINANCIAL STATEMENTS FOR THE YEAR ENDED 31 DECEMBER 2012
Notes to the Consolidated Financial Statements
3. SIGNIFICANT ACCOUNTING POLICIES (continued)
(o) Financial instruments
(i) Classification A financial instrument is a contract that gives rise to both a financial asset of one enterprise and a financial liability of
another enterprise. These are classified as follows:
Financialassetsat fairvalue throughprofitor loss:Thiscategoryhas twosubcategories;financialassetsheld fortrading, and those designated at fair value through profit or loss at inception. Financial instruments reclassified in this category are those that the Group holds principally for the purpose of short-term profit taking.
Loans and receivables are non-derivative financial assets with fixed or determinable payments that are not quoted in an active market other than those that the Group intends to sell in the short term or that it has designated as at fair value through profit or loss or available-for-sale. Loans and receivables comprise trade and other receivables, cash and cash equivalents and balances due from Group companies.
Held-to-maturity assets are financial assets with fixed or determinable payments and fixed maturity that the Group
has positive intent and ability to hold to maturity. Were the Group to sell other than an insignificant amount of held-to-maturity assets, the entire category would be tainted and reclassified as available-for-sale.
Available-for-sale assets are the non-derivative financial assets that are designated as available for sale or are not classified as held for trading purposes, loans and receivables or held to maturity. These include quoted and unquoted investments and investments in funds.
The Group classifies non-derivative financial liabilities into the other financial liabilities category. Such financial liabilities are recognised initially at fair value less any directly attributable transaction costs. Subsequent to initial recognition, these financial liabilities are measured at amortised cost using the effective interest method. Other financial liabilities include loans, bank overdrafts, trade and other payables and Aureos Fund.
(ii) Recognition The Group recognises financial assets held for trading and available-for-sale assets on the date it commits to purchase
the assets. From this date any gains and losses arising from changes in fair value of the assets are recognised.
Held-to-maturity, loans and receivables are recognised on the date they are transferred to the Group. (iii) Measurement Financial instruments are measured initially at fair value, including transaction costs.
Subsequent to initial recognition all trading instruments and all available-for-sale assets are measured at fair value, except that any instrument that does not have a quoted market price in an active market and whose fair value cannot be reliably measured is stated at cost, including transaction costs, less impairment losses.
Loans and receivables and held-to-maturity assets are measured at amortised cost less impairment losses. Amortised cost is calculated on the effective interest method. Premiums and discounts, including initial transaction costs, are included in the carrying amount of the related instrument and amortised based on the effective interest rate of the instrument.
Gains and losses arising from a change in the fair value of available-for-sale assets are recognised in other
comprehensive income and presented within equity until the instrument is derecognised or impaired, at which time the cumulative gain or loss is recognised in profit or loss and trading instrument gains or losses are recognised in profit or loss in the period they arise.

33REPORT AND FINANCIAL STATEMENTS FOR THE YEAR ENDED 31 DECEMBER 2012
Notes to the Consolidated Financial Statements
3. SIGNIFICANT ACCOUNTING POLICIES (continued)
(o) Financial instruments (Continued)
(iv) Derecognition A financial asset is derecognised when the Group loses control over the contractual rights that comprise that asset.
This occurs when the rights are realised, expire or are surrendered. A financial liability is derecognised when it is extinguished.
(p) Intangible assets (i) Goodwill/Premiumonacquisition All business combinations are accounted for by applying the purchase method. Goodwill represents the difference
between the cost of acquisition and the fair value of the net identifiable assets acquired.
Goodwill is measured at cost less any accumulated impairment losses. Goodwill is allocated to cash-generating units and is tested annually for impairment.
Negative goodwill arising on an acquisition is recognised directly in profit or loss.
(ii) Computersoftware Acquired computer software licences are capitalised on the basis of the costs incurred to acquire and bring to use the
specific software. These costs are amortised on the basis of the expected useful lives.
(iii) Brand Acquired assets are capitalised and are measured at cost less accumulated amortisation and impairment. Amortisation
is calculated using the straight-line method over estimated useful life. The estimated useful life of the brand for the current and comparative periods is 20 years.
Amortisation methods, useful lives and residual values are reviewed at each reporting date and adjusted if appropriate.
(q) Offsetting
Financial assets and liabilities are offset and the net amount reported on the statement of financial position when there is a legally enforceable right to offset the recognised amounts and there is an intention to settle on a net basis, or to realise the asset and settle the liability simultaneously.
(r) Provisions A provision is recognised in the statement of financial position when the company has a legal or constructive obligation
as a result of a past event and it is probable that an outflow of economic benefits will be required to settle the obligation. If the effect is material, provisions are determined by discounting the expected future cashflows at a pre-tax rate that reflects current market assessments of the time value of money and, where appropriate, the risks specifics to the liability.
(s) Comparatives Where necessary, comparative figures have been adjusted to conform to changes in presentation in the current year and
changes in accounting policy.

34 REPORT AND FINANCIAL STATEMENTS FOR THE YEAR ENDED 31 DECEMBER 2012
Notes to the Consolidated Financial Statements
3. SIGNIFICANT ACCOUNTING POLICIES (continued)
(t) New standards and interpretations not yet adopted
A number of new standards, amendments to standards and interpretations are not yet effective for the year ended 31 December 2012, and have not been applied in preparing these consolidated financial statements. These are summarised below and are not expected to have a significant impact on the consolidated financial statements of the Group:
• IFRS9‘FinancialInstruments’.IFRS9willbecomemandatoryfortheGroup’s2015consolidatedfinancialstatements. • IFRS10‘ConsolidatedFinancialStatements’(effectiveforannualperiodsbeginningonorafter1January2013). • IFRS11‘JointArrangements’(effectiveforannualperiodsbeginningonorafter1January2013). • IFRS12‘DisclosureofInterestsinOtherEntities’(effectiveforannualperiodsbeginningonorafter1January2013). • IFRS13‘FairValueMeasurement’(effectiveforannualperiodsbeginningonorafter1January2013). • IAS19‘EmployeeBenefits(Amended)’(effectiveforannualperiodsbeginningonorafter1January2013). • IAS27(2011)SeparateFinancialStatements(effective1January2013). • IAS28(2011)InvestmentsinAssociatesandJointVentures(effective1January2013). • AmendmentstoIAS1‘Presentationofitemsofothercomprehensiveincome’(effective1July2012). • AmendmentstoIFRS7andIAS32onoffsettingfinancialassetsandfinancialliabilities(2011)–effective1January
2013. 4. FINANCIAL RISK MANAGEMENT OBJECTIVES AND POLICIES
Overview The Group and company has exposure to the following risks from its use of financial instruments: (a) Creditrisk; (b) Liquidityrisk;and (c) Market risk.
This note presents information about the Group and company’s exposure to each of the above risks, the Group and company’s objectives, policies and processes for measuring and managing risk, and the Group and company’s management of capital. Further quantitative disclosures are included throughout these consolidated financial statements.
The board of directors has overall responsibility for the establishment and oversight of the Group and company’s risk management framework. The finance department identifies, evaluates and hedges financial risks.
The Board of Directors oversees how management monitors compliance with the Group and company’s risk management policies and procedures and reviews the adequacy of the risk management framework in relation to the risks faced by the Group and company.
(a) Credit risk
Credit risk is the risk of financial loss to the Group and company if a customer or counterparty to a financial instrument fails to meet its contractual obligations, and arises principally from the Group and company’s receivables from customers.
The carrying amount of financial assets represents the maximum exposure to credit risk:

35REPORT AND FINANCIAL STATEMENTS FOR THE YEAR ENDED 31 DECEMBER 2012
Notes to the Consolidated Financial Statements
4. FINANCIAL RISK MANAGEMENT OBJECTIVES AND POLICIES (continued) (a) Credit risk (Continued) 2012 2011 KShs‘000 KShs‘000
Trade receivables 3,944,987 3,832,356 Cash and bank balances 274,416 2,759,356
Impairment losses The ageing of trade receivables at the reporting date was:
Not past due 1,148,465 1,720,301 Past due 0-90 days 965,083 1,022,752 Past due 90-365 days 1,044,648 1,004,302 More than one year 1,078,234 289,745
4,236,430 4,037,100 Net impairment (291,443) (204,744)
3,944,987 3,832,356
(b) Liquidity risk
Liquidity risk is the risk that the Group will not be able to meet its financial obligations as they fall due. Liquidity risk arises in the general funding of the company’s activities and in the management of positions. It includes both the risk of being unable to fund assets at appropriate maturities and rates and the risk of being unable to liquidate an asset at a reasonable price and in an appropriate time frame.
The Group does not have access to a diverse funding base. Funds are raised mainly from its shareholders, banks and its own internal resources.
The Group strives to maintain a balance between continuity of funding and flexibility through the use of liabilities with a range of maturities.
The Group continually assesses liquidity risk by identifying and monitoring changes in funding required to meet business goals and targets set in terms of the overall company strategy.
In addition, the Group holds a portfolio of liquid assets as part of its liquidity risk management strategy.
The table below shows the contractual maturity of financial liabilities:
2012:
KShs’000 Due on demand 1 - 3 months 3 - 12 months 1 - 5 years Total Liabilities: Long term loans 9,601 492,418 895,939 3,179,169 4,577,127 Bank overdraft 172,243 163,162 - - 335,405 Trade and other payables 2,165,497 1,731,960 43,230 7,205 3,947,892 Aureos Fund – other members 34,930 - - - 34,930
Total financial liabilities 2,382,271 2,387,540 939,169 3,186,374 8,895,354
2011: Liabilities: Long term loans - 1,337,928 - 2,965,304 4,303,232 Bank overdraft 263,953 - - - 263,953 Trade and other payables - - 5,715,174 - 5,715,174 Aureos Fund – other members - - 29,355 - 29,355
Total financial liabilities 263,953 1,337,928 5,744,529 2,965,304 10,311,714

36 REPORT AND FINANCIAL STATEMENTS FOR THE YEAR ENDED 31 DECEMBER 2012
Notes to the Consolidated Financial Statements
4. FINANCIAL RISK MANAGEMENT OBJECTIVES AND POLICIES (Continued)
(c) Market risk
Market risk is the risk that changes in market prices, such as foreign exchange rates and interest rates will affect the Group’s income. The objective of market risk management is to manage and control market risk exposures within acceptable parameters, while optimising the return.
(i) Currencyrisk The Group is exposed to currency risk through transactions in foreign currencies. The company’s transactional
exposures give rise to foreign currency gains and losses that are recognised in profit or loss.
In respect of monetary assets and liabilities in foreign currencies, the Group ensures that its net exposure is kept to an acceptable level by buying foreign currencies at spot rates to enable the Group to meet its obligations. The Group’s exposure to foreign currency risk was as follows based on notional amounts in US dollars:
2012 2011 KShs’000 KShs’000
Cash and bank balances 209,985 2,734,100 Investments in funds 393,996 767,553 Unquoted investments 3,957,450 2,820,837 Bank overdraft ( 335,405) ( 53,304) Bank loan (3,699,378) (1,814,697)
Net statement of financial position exposure 526,648 4,454,489
The following significant exchange rates applied during the year: Closing rate Average rate 2012 2011 2012 2011 KShs KShs KShs KShs
USD 86.03 85.07 84.52 88.87 TShs 18.42 18.81 18.78 17.89
ZAR 10.14 10.39 10.31 12.27
Sensitivity analysis
A 10 percent strengthening of the Kenya shilling against the following currency would have decreased profit or (loss) by amounts shown below. This analysis assumes that all other variables, in particular interest rates, remain constant. The analysis is performed on the same basis for 2011:
Profit or loss KShs’000
At 31 December 2012: (52,685)
At 31 December 2011: (445,449)
(ii) Interestraterisk
The Group’s operations are subject to the risk of interest rate fluctuations to the extent that interest earning assets (including investments) and interest bearing liabilities mature or reprice at different times or in differing amounts. Risk management activities are aimed at optimising net interest income, given market interest rates levels consistent with the company’s business strategies. The company does not have any significant interest rate risk exposures as currently all interest bearing borrowings and advances are at a fixed rate.

37REPORT AND FINANCIAL STATEMENTS FOR THE YEAR ENDED 31 DECEMBER 2012
Notes to the Consolidated Financial Statements
4. FINANCIAL RISK MANAGEMENT OBJECTIVES AND POLICIES (Continued) (c) Market risk (continued)
(ii) Interestraterisk
The table below summarizes the contractual maturity periods and interest rate profile of the Group’s financial assets and liabilities:
As at 31 December 2012: Due between Due between Effective 3 and 12 1 and 5 Non interest interest rate On demand months years bearing Total % KShs ‘000 KShs ‘000 KShs ‘000 KShs ‘000 KShs ‘000 Assets Quoted investments - - - - 281 281 Unquoted investments - - - - 4,210,650 4,210,650 Investments in funds - - - - 393,996 393,996 Trade and other receivables - - - - 3,944,987 3,944,987 Cash and cash equivalents - - - - 274,416 274,416
- - - 8,824,330 8,824,330
Liabilities: Bank loans - 502,019 895,939 3,179,169 - 4,577, 127 Bank overdraft - 335,405 - - - 335,405 Trade and other payables - - - - 3,883,406 3,883,406 Aureos Fund – other members - - - - 34,930 34,930
837,424 895,939 3,179,169 3,918,336 8,830,868
Interest rate sensitivity gap (837,424) (895,939) (3,179,169) 4,905,994 (6,538)
As at 31 December 2011: Due between Due between Effective 3 and 12 1 and 5 Non interest interest rate On demand months years bearing Total % KShs ‘000 KShs ‘000 KShs ‘000 KShs ‘000 KShs ‘000 Assets Quoted investments - - - - 50,135 50,135 Unquoted investments - - - - 3,034,588 3,034,588 Investments in funds - - - - 767,553 767,553 Trade and other receivables - - - - 3,832,356 3,832,356 Cash and cash equivalents - - - - 2,759,356 2,759,356
- - - 10,443,988 10,443,988
Liabilities: Bank loans 10-23% - 1,337,928 2,965,304 - 4,303,232 Bank overdraft 8-17% 263,953 - - - 263,953 Trade and other payables - - - - 5,715,174 5,715,174 Aureos Fund – other members - - - - 29,355 29,355 263,953 1,337,928 2,965,304 5,744,529 10,311,714
Interest rate sensitivity gap (263,953) (1,337,928) (2,965,304) 4,699,459 132,274
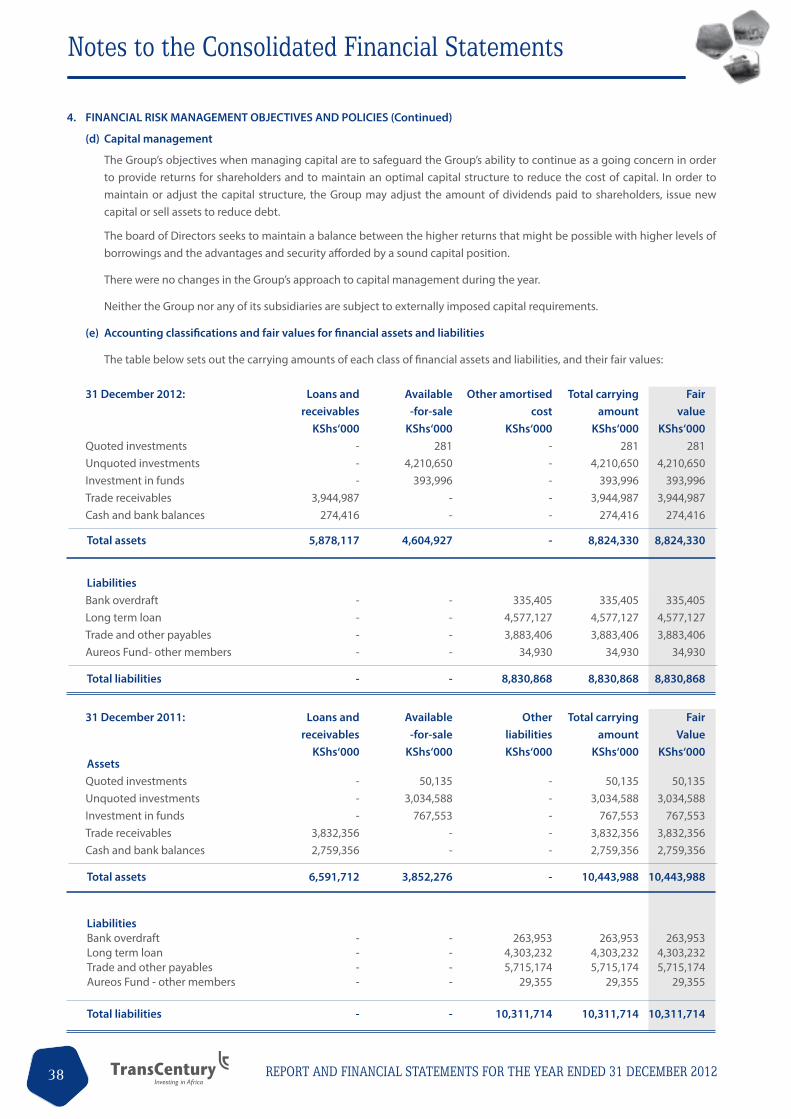
38 REPORT AND FINANCIAL STATEMENTS FOR THE YEAR ENDED 31 DECEMBER 2012
Notes to the Consolidated Financial Statements
4. FINANCIAL RISK MANAGEMENT OBJECTIVES AND POLICIES (Continued)
(d) Capital management
The Group’s objectives when managing capital are to safeguard the Group’s ability to continue as a going concern in order to provide returns for shareholders and to maintain an optimal capital structure to reduce the cost of capital. In order to maintain or adjust the capital structure, the Group may adjust the amount of dividends paid to shareholders, issue new capital or sell assets to reduce debt.
The board of Directors seeks to maintain a balance between the higher returns that might be possible with higher levels of borrowings and the advantages and security afforded by a sound capital position.
There were no changes in the Group’s approach to capital management during the year.
Neither the Group nor any of its subsidiaries are subject to externally imposed capital requirements.
(e) Accounting classifications and fair values for financial assets and liabilities
The table below sets out the carrying amounts of each class of financial assets and liabilities, and their fair values:
31 December 2012: Loans and Available Other amortised Total carrying Fair receivables -for-sale cost amount value KShs‘000 KShs‘000 KShs‘000 KShs‘000 KShs‘000 Quoted investments - 281 - 281 281 Unquoted investments - 4,210,650 - 4,210,650 4,210,650 Investment in funds - 393,996 - 393,996 393,996 Trade receivables 3,944,987 - - 3,944,987 3,944,987 Cash and bank balances 274,416 - - 274,416 274,416 Total assets 5,878,117 4,604,927 - 8,824,330 8,824,330
Liabilities Bank overdraft - - 335,405 335,405 335,405 Long term loan - - 4,577,127 4,577,127 4,577,127 Trade and other payables - - 3,883,406 3,883,406 3,883,406 Aureos Fund- other members - - 34,930 34,930 34,930
Total liabilities - - 8,830,868 8,830,868 8,830,868
31 December 2011: Loans and Available Other Total carrying Fair receivables -for-sale liabilities amount Value KShs‘000 KShs‘000 KShs‘000 KShs‘000 KShs‘000 Assets Quoted investments - 50,135 - 50,135 50,135 Unquoted investments - 3,034,588 - 3,034,588 3,034,588 Investment in funds - 767,553 - 767,553 767,553 Trade receivables 3,832,356 - - 3,832,356 3,832,356 Cash and bank balances 2,759,356 - - 2,759,356 2,759,356
Total assets 6,591,712 3,852,276 - 10,443,988 10,443,988
Liabilities Bank overdraft - - 263,953 263,953 263,953 Long term loan - - 4,303,232 4,303,232 4,303,232 Trade and other payables - - 5,715,174 5,715,174 5,715,174 Aureos Fund - other members - - 29,355 29,355 29,355
Total liabilities - - 10,311,714 10,311,714 10,311,714

39REPORT AND FINANCIAL STATEMENTS FOR THE YEAR ENDED 31 DECEMBER 2012
Notes to the Consolidated Financial Statements
4. FINANCIAL RISK MANAGEMENT OBJECTIVES AND POLICIES (Continued)
(f) Valuation hierarchy
The valuation hierarchy, and types of instruments classified into each level within that hierarchy, is set out below:
LEVEL 1 LEVEL 2 LEVEL 3
Fair value determined using: Unadjusted quoted prices in an active market for identical assets and liabilities
Valuation models with directly or indirectly market observable inputs
Valuation models using significant non-market observable inputs
Types of financial assets: Actively traded government and other agency securities
Listed derivative instruments
Listed equities
Corporate and other government bonds and loans
Over-the-counter (OTC) derivatives
Highly structured OTC derivatives with unobservable parameters
Corporate bonds in illiquid markets
Types of financial liabilities: Listed derivative instruments
Over-the-counter (OTC) derivatives
Highly structured OTC derivatives with unobservable parameters
The table below shows the classification of financial instruments held at fair value into the valuation hierarchy set out below as at 31 December 2012 and 31 December 2011:
31 December 2012: Level 1 Level 2 Level 3 Total KShs‘000 KShs‘000 KShs‘000 KShs‘000 Assets Quoted investments 281 - - 281 Unquoted investments - 4,210,650 - 4,210,650 Investments in funds - 393,996 - 393,996 Total assets 281 4,604,646 - 4,604,927
31 December 2011: Assets Quoted investments 50,135 - - 50,135 Unquoted investments - 3,034,588 - 3,034,588 Investments in funds - 767,553 - 767,553
Total assets 50,135 3,802,141 - 3,852,276

40 REPORT AND FINANCIAL STATEMENTS FOR THE YEAR ENDED 31 DECEMBER 2012
Notes to the Consolidated Financial Statements
5. NET OTHER INCOME Group:
2012 2011 KShs ‘000 KShs ‘000
Group: Gain/(loss) on sale of other quoted securities and dividend from other investments 17,755 (1,298) Gain on sale of property 97,036 3,289 Change in fair value of investment property 102,430 100,000 Sale of scraps 4,803 9,368 Other income 1,011,256 842,384
1,233,280 953,743
6. RESULTS FROM OPERATING ACTIVITIES Group 2012 2011
KShs ‘000 KShs‘000 Results from operating activities are arrived at after charging/(crediting): Depreciation 630,231 322,684 Amortisation of prepaid operating lease rentals 4,617 4,661 Amortisation of intangible assets 9,056 9,133 643,904 336,478 Impairment of goodwill 15,146 - Provision for inventory 10,298 - Debtors impairment loss/(gain) 86,699 (11,990)
Directors’ emoluments -Fees – Group 29,708 36,277 - Others – Group 7,857 3,411 - Company – Fees 7,863 7,844
Auditors’ remuneration - Group and subsidiaries 16,664 19,782 - Company – Current year 3,342 2,800 (Gain)/loss on sale of other quoted securities and dividends from other investments (52,524) 1,298 Loss/(profit) on disposal of property, plant and equipment 97,036 (3,289)
7. NET FINANCE COSTS Group 2012 2011 KShs ‘000 KShs ‘000 (a) Finance income
Interest income 74,902 13,735 Gain on exchange 84,265 46,140
159,167 59,875
(b) Finance costs Interest paid (893,088) (690,122) Loss on exchange (9,038) (118,551)
(902,126) (808,673)
Net finance cost (742,959) (748,798)

41REPORT AND FINANCIAL STATEMENTS FOR THE YEAR ENDED 31 DECEMBER 2012
Notes to the Consolidated Financial Statements
8. INCOME TAX 2012 2011 KShs ‘000 KShs ‘000 Current tax: Chargefortheyear@30% 477,842 314,289 Prior years under provision 6,805 21,389
484,647 335,678
Deferred tax credit: Current year (Note 24) 5,190 (83,334) Prior year under provision (Note 24) 531 821
5,721 (82,513)
490,368 253,165
The tax on the consolidated results differs from the theoretical amount using the basic tax rate as follows:
2012 2011 KShs‘000 KShs ‘000
Accounting profit before tax 1,226,473 869,265
Taxatthedomesticrateof30% 367,942 260,780 Previous years under provision - Current tax 7,456 22,607 - Deferred tax 531 821 Effect of taxes in foreign jurisdictions* (95,327) 169,159 Deferred tax not recognised 23,638 15,606 Tax effect of non-deductible expenses and non-taxable income 186,128 (215,808)
Income tax expense 490,368 253,165
* Trans-CenturyHoldingsProprietaryLimitedoperatesinSouthAfricawherecorporatetaxesare28%,Trans-CenturyMauritiusLimited, Cable Holding Mauritius Limited, TC Railway Holdings Limited and Safari Rail Company Limited operate in Mauritius wherethecorporatetaxrateis15%.

42 REPORT AND FINANCIAL STATEMENTS FOR THE YEAR ENDED 31 DECEMBER 2012
Notes to the Consolidated Financial Statements 9.
PR
OPE
RTY,
PLA
NT
AN
D E
QU
IPM
ENT
G
roup
H
eavy
Fr
eeho
ld
Leas
ehol
d
Fu
rnitu
re,
Com
mer
cial
la
nd a
nd
land
and
Pl
ant a
nd
Mot
or
fittin
gs a
nd
Wor
k in
20
12:
vehi
cles
bu
ildin
gs
build
ings
m
achi
nery
ve
hicl
es
equi
pmen
t pr
ogre
ss
Tota
l
KS
hs‘0
00
KShs
‘000
KS
hs‘0
00
KShs
‘000
KS
hs‘0
00
KShs
‘000
KS
hs‘0
00
KShs
‘000
Co
st :
A
t 1 Ja
nuar
y 20
12
1,32
6,68
9
573,
665
2,43
6,59
4
3,18
1,48
0 37
8,68
1
208,
318
11
0,03
4 8,
215,
461
Re
clas
sific
atio
ns
77,8
30
- (7
6,15
6)
(3,9
96)
(3,0
56)
3,41
1 1,
967
-
Addi
tions
30
9,62
0 -
7,04
8 85
0,13
6 87
,620
46
,613
16
3,26
9 1,
464,
306
Tr
ansf
ers
26
1,20
9 -
59,1
76
(205
,255
) (1
,310
) -
(83,
055)
30
,765
D
ispo
sals
(1
96,6
58)
- (1
,393
) (5
,510
) (1
5,00
8)
(1,4
93)
(2,4
42)
(222
,504
)
Rele
ased
on
disp
osal
of s
ubsi
diar
y -
- (5
3,14
0)
(63,
104)
(4
6,46
8)
- -
(162
,712
)
Reva
luat
ion
- sub
sidi
arie
s -
- 27
9,51
6 (1
88,6
16)
501
(441
) -
90,9
60
Exch
ange
diff
eren
ces
1
3,36
1 (4
,893
) 23
,284
19
,122
5,
106
1,26
2 1,
147
58,3
89
A
t 31
Dec
embe
r 201
2
1,7
92,0
51
568,
772
2,67
4,92
9 3,
584,
257
406,
066
257,
670
190,
920
9,47
4,66
5
Co
mpr
isin
g:
Cost
1
,792
,051
38
3,12
4 40
8,40
8 1,
519,
153
100,
709
105,
023
181,
932
4,49
0,40
0
Valu
atio
n
- 18
5,64
8 2,
266,
521
2,06
5,10
4 30
5,35
7 15
2,64
7 8,
988
4,98
4,26
5
1,79
2,05
1 56
8,77
2 2,
674,
929
3,58
4,25
7 40
6,06
6 25
7,67
0 19
0,92
0 9,
474,
665
D
epre
ciat
ion:
At 1
Janu
ary
2012
9
22,3
18
59,5
01
162,
297
907,
556
216,
728
128,
852
- 2,
397,
252
Re
clas
sific
atio
ns
19,6
34
(4,9
92)
(14,
451)
(1
2,06
1)
10,7
22
337
811
-
Char
ge fo
r the
yea
r 20
7,65
0 13
,764
58
,799
27
3,58
9 54
,334
22
,095
-
630,
231
D
ispo
sals
/ w
rite
offs
(102
,648
) -
(76)
(6
11)
(12,
268)
(4
20)
- (1
16,0
23)
Re
leas
ed o
n di
spos
al o
f sub
sidi
ary
- -
(8,0
32)
(30,
491)
(2
4,75
9)
- -
(63,
282)
Re
valu
atio
n - s
ubsi
diar
ies
- -
(96,
684)
(2
86,8
91)
(15,
053)
(1
,576
) -
(400
,204
)
Exch
ange
diff
eren
ces
8
7,49
7 (1
,986
) 31
,562
28
,301
10
,762
5,
357
(652
) 16
0,84
1
A
t 31
Dec
embe
r 201
2 1,
134,
451
66,2
87
133,
415
879,
392
240,
466
154,
645
159
2,60
8,81
5
Carr
ying
val
ue:
A
t 31
Dec
embe
r 201
2 6
57,6
00
502,
485
2,54
1,51
4 2,
704,
865
165,
600
103,
025
190,
761
6,86
5,85
0

43REPORT AND FINANCIAL STATEMENTS FOR THE YEAR ENDED 31 DECEMBER 2012
Notes to the Consolidated Financial Statements 9.
PR
OPE
RTY,
PLA
NT
AN
D E
QU
IPM
ENT
(Con
tinue
d)
Gro
up
Hea
vy
Free
hold
Le
aseh
old
Furn
iture
,
Co
mm
erci
al
land
and
la
nd a
nd
Plan
t and
M
otor
fit
tings
and
W
ork
in
2011
: ve
hicl
es
build
ings
bu
ildin
gs
mac
hine
ry
vehi
cles
eq
uipm
ent
prog
ress
To
tal
KShs
‘000
KS
hs‘0
00
KShs
‘000
KS
hs‘0
00
KShs
‘000
KS
hs‘0
00
KShs
‘000
KS
hs‘0
00
Cost
:
At 1
Janu
ary
2011
-
438
,301
1,
437,
793
2
,158
,277
1
05,4
39
87,
872
1
17,6
18
4,3
45,3
00
A
sset
s ac
quire
d on
acq
uisi
tion
of
sub
sidi
arie
s
1,3
26,6
89
- 9
54,0
10
947
,176
2
43,2
14
100
,356
2
5,96
8
3,5
97,4
13
Ad
ditio
ns
- -
11,
433
6
1,52
8 3
3,27
1
22,
830
1
8,78
7
147
,849
Tran
sfer
s
- 1
98
47,
445
-
- -
(47,
445)
1
98
D
ispo
sals
-
- ( 4
14)
( 6,8
19)
(3,1
33)
( 335
) -
(10,
701)
Re
valu
atio
n - s
ubsi
diar
ies
- 1
69,9
11
- 7
1,72
8
- -
- 2
41,6
39
Ex
chan
ge d
iffer
ence
s
-
(34,
745)
(1
3,67
3)
(50,
410)
(1
10)
(2,4
05)
(4,8
94)
(106
,237
)
A
t 31
Dec
embe
r 201
1
1,3
26,6
89
573,
665
2,43
6,59
4
3,18
1,48
0 37
8,68
1
208,
318
11
0,03
4 8,
215,
461
Co
mpr
isin
g:
Cost
1,
326,
689
3
53,4
70
558
,481
9
28,0
64
100
,797
7
8,73
1
69,
451
3
,415
,683
Valu
atio
n
-
220
,195
1
,878
,113
2
,253
,416
2
77,8
84
129
,587
4
0,58
3
4,7
99,7
78
1,
326,
689
5
73,6
65
2,4
36,5
94
3,1
81,4
80
378
,681
2
08,3
18
110
,034
8
,215
,461
Dep
reci
atio
n:
A
t 1 Ja
nuar
y 20
11
- 5
5,29
4
32,
175
4
29,6
66
41,
293
5
3,49
4
- 6
11,9
22
Ac
cum
ulat
ed d
epre
ciat
ion
on
ass
ets
acqu
ired
87
7,09
4 -
93,
823
3
30,2
48
147
,027
6
2,66
5
- 1
,510
,857
Char
ge fo
r the
yea
r 45
,224
9
,951
4
9,49
2
171
,014
3
2,41
5 1
4,58
8 -
322
,684
D
ispo
sals
-
- -
(1,1
36)
(2,9
23)
(192
) -
(4,2
51)
Re
valu
atio
n - s
ubsi
diar
ies
- -
(11,
464)
(9
,236
) -
- -
(20,
700)
Ex
chan
ge d
iffer
ence
s
-
(5,7
44)
(1,7
29)
(13,
000)
(1
,084
) (1
,703
) -
(23,
260)
A
t 31
Dec
embe
r 201
1
92
2,31
8
59,5
01
162,
297
907,
556
21
6,72
8 12
8,85
2
- 2,
397,
252
Ca
rryi
ng v
alue
:
At 3
1 D
ecem
ber 2
011
404,
371
5
14,1
64
2,2
74,2
97
2,2
73,9
24
161
,953
7
9,46
6
110
,034
5
,818
,209

44 REPORT AND FINANCIAL STATEMENTS FOR THE YEAR ENDED 31 DECEMBER 2012
Notes to the Consolidated Financial Statements
9. PROPERTY, PLANT AND EQUIPMENT (Continued) Company - Furniture, fittings and equipment 2012 2011 KShs‘000 KShs‘000 Cost or valuation: At 1 January 2012 17,386 14,153 Additions 959 3,233 Disposals/write offs (1,175) - At 31 December 2012 17,170 17,386 Depreciation: At 1 January 2012 8,360 6,188 Charge for the year 3,084 2,172 Disposals/write offs (896) - At 31 December 2012 10,548 8,360 At 31 December 2012 6,622 9,026
Revaluation
The buildings of one of the subsidiaries, East African Cables Limited, were revalued in December 2009 by Lloyd Masika Limited, a firm of professional valuers on the basis of open market value for existing use. The increase in net carrying value as a result of the revaluation was credited to a revaluation reserve account.
All the property, plant and equipment of a subsidiary, East African Cables (Tanzania) Limited, were revalued in December 2010 by Lloyd Masika Limited, a firm of professional valuers on the basis of open market value for existing use.
The property, plant and equipment of a subsidiary, Tanelec Limited – Tanzania were revalued in August 2007 by Lloyd Jones Limited, a firm of professional valuers on the basis of open market value for existing use and were used to determine fair values of these assets at the date of acquisition.
The land and buildings of one of the subsidiaries, Avery (East Africa) Limited were revalued in December 2011 by an independent valuer from a firm of professional valuers on the basis of open market value for existing use. The resulting surplus was credited to revaluation reserve.
The property, plant and equipment of one of the subsidiaries, Kewberg Cables & Braids Proprietary Limited were revalued on 1 August 2011 and 13 October 2011, respectively, by an independent valuer, Chris van Rooyen, a professional valuer of Chris van Rooyen Property Valuers CC. The property valuation was performed using the income capitalisation method assuming (a)acapitalisationrateof11.50%and(b)marketrelatedrentals.Theplantandmachineryvaluationwasperformedusingthereplacement value approach assuming (a) A willing seller and a willing buyer exists, (b) the equipment will be freely exposed to the market, (c) a reasonable time would be allowed for the sale at a static price and (d) all values as indicated are net of removal costs, to determine the current value.
Security
At 31 December 2011, properties of subsidiaries have been charged to secured banking facilities per Note 18.

45REPORT AND FINANCIAL STATEMENTS FOR THE YEAR ENDED 31 DECEMBER 2012
Notes to the Consolidated Financial Statements
10. INVESTMENT PROPERTY Consolidated Consolidated Company Company 2012 2011 2012 2011 KShs ‘000 KShs ‘000 KShs ‘000 KShs ‘000 Valuation At 1 January 474,003 345,502 265,000 165,000 Acquired on acquisition of subsidiary - 30,422 - - Transfer from property, plant and equipment (Note 9) (30,765) - - - Fair value changes 102,430 100,000 - 100,000 Disposals (265,000) - (265,000) - Currency changes 4,457 (1,921) - -
At 31 December 285,125 474,003 - 265,000
Revaluation
The company acquired a piece of freehold land in 2006 at KShs 46,309,000 for investment purposes. The land was carried at Directors valuation of KShs 265 million based on prevailing market prices at 31 December 2011. The investment property was disposed during the year ended 31 December 2012.
The investment property of the subsidiary, East African Cables Limited, comprises of residential properties that have been leased to a third party which were revalued by Lloyd Masika Limited (Kenya and Tanzania) in 2012.
The properties are leased on a renewable annual lease.
11. PREPAID OPERATING LEASE RENTALS
Consolidated Consolidated Company Company 2012 2011 2012 2011 KShs ‘000 KShs ‘000 KShs ‘000 KShs ‘000
At 1 January 157,904 160,200 - - Amortisation for the year ( 4,617) (4,661) - - Transfer to property and equipment - (198) - - Exchange adjustment (3,369) 2,563 - -
At 31 December 149,918 157,904 - -
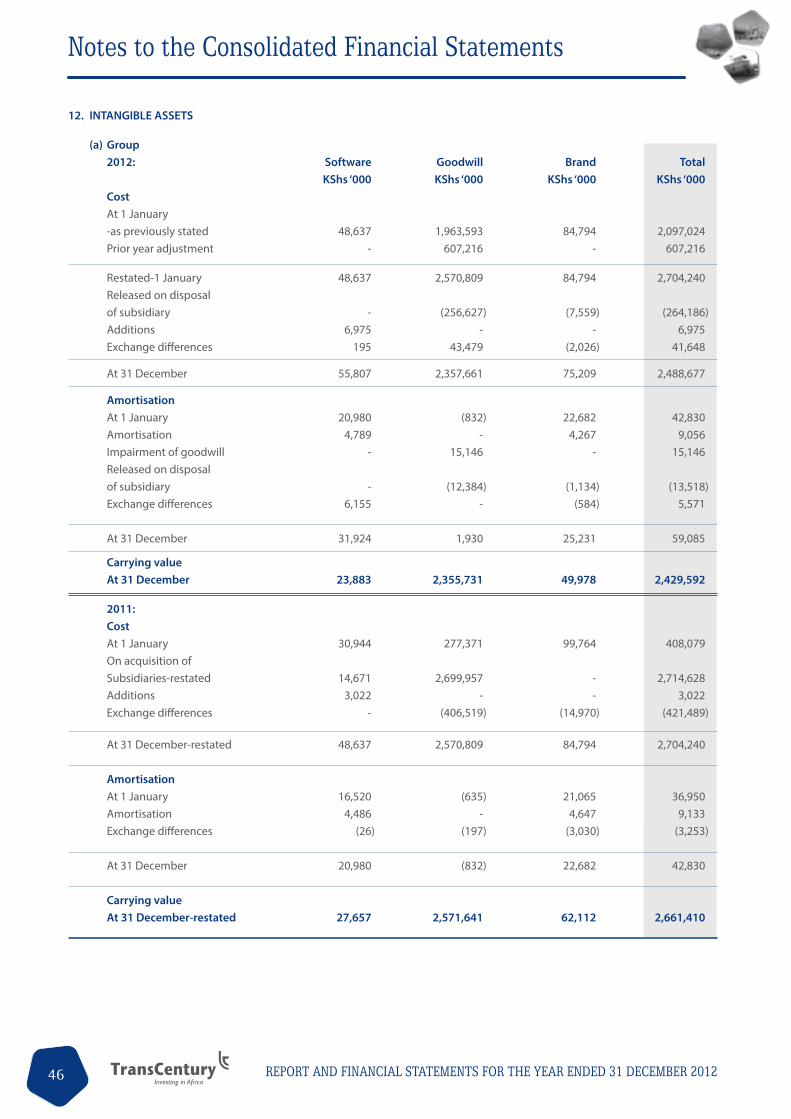
46 REPORT AND FINANCIAL STATEMENTS FOR THE YEAR ENDED 31 DECEMBER 2012
Notes to the Consolidated Financial Statements
12. INTANGIBLE ASSETS
(a) Group 2012: Software Goodwill Brand Total KShs ‘000 KShs ‘000 KShs ‘000 KShs ‘000 Cost At 1 January -as previously stated 48,637 1,963,593 84,794 2,097,024 Prior year adjustment - 607,216 - 607,216
Restated-1 January 48,637 2,570,809 84,794 2,704,240 Released on disposal of subsidiary - (256,627) (7,559) (264,186) Additions 6,975 - - 6,975 Exchange differences 195 43,479 (2,026) 41,648
At 31 December 55,807 2,357,661 75,209 2,488,677
Amortisation At 1 January 20,980 (832) 22,682 42,830 Amortisation 4,789 - 4,267 9,056 Impairment of goodwill - 15,146 - 15,146 Released on disposal of subsidiary - (12,384) (1,134) (13,518) Exchange differences 6,155 - (584) 5,571
At 31 December 31,924 1,930 25,231 59,085
Carrying value At 31 December 23,883 2,355,731 49,978 2,429,592
2011: Cost At 1 January 30,944 277,371 99,764 408,079 On acquisition of Subsidiaries-restated 14,671 2,699,957 - 2,714,628 Additions 3,022 - - 3,022 Exchange differences - (406,519) (14,970) (421,489)
At 31 December-restated 48,637 2,570,809 84,794 2,704,240
Amortisation At 1 January 16,520 (635) 21,065 36,950 Amortisation 4,486 - 4,647 9,133 Exchange differences (26) (197) (3,030) (3,253)
At 31 December 20,980 (832) 22,682 42,830
Carrying value At 31 December-restated 27,657 2,571,641 62,112 2,661,410

47REPORT AND FINANCIAL STATEMENTS FOR THE YEAR ENDED 31 DECEMBER 2012
Notes to the Consolidated Financial Statements
12 INTANGIBLE ASSETS (Continued)
(b) Company – Software 2012 2011 KShs ‘000 KShs ‘000 Cost At 1 January and 31 December 337 337
Amortisation At 1 January 306 237 Amortisation during the year 31 69
At 31 December 337 306
Carrying value at 31 December - 31
(c) Goodwill on acquisition of Trans-Century Holdings Pty Limited The goodwill recognised represents the excess of the business combination over the acquired business’ fair value of the
identifiable assets and liabilities.
The business was acquired at 7 September 2007 and the fair values determined at that date were relied upon to support the carrying value of the goodwill recognised due to the proximity of the year end to the acquisition date. The carrying amount of the goodwill is reviewed annually on the basis of forecast profits of the cash generating assets and forecast sales of the products.
(d) Goodwill on acquisition of Crystal Limited
The goodwill recognised represents the excess of the business combination over the acquired business fair value of the identifiable assets and liabilities.
Given the proximity of the year end to the acquisition of the business at 31 July 2008, the fair values determined at that date were relied upon to support the carrying value of the goodwill recognised. The carrying amount of the goodwill is reviewed annually on the basis of forecast profits of the cash generating assets and forecast sales of the products.
The goodwill has been released at 31December 2012 on disposal of Chai Bora Limited per Note 29 below.
(e) Goodwill on acquisition of Civicon Group and Pende Group
The goodwill recognised represents the excess of the business combination over the acquired business’ fair value of the identifiable assets and liabilities. The businesses were acquired on 30 September 2011 and 31 May 2011 for Civicon Group and Pende group respectively and the fair values determined at that date were relied upon to support the carrying value of the goodwill recognised due to the proximity of the year end to the acquisition date. The carrying amount of the goodwill is reviewed annually on the basis of forecast profits of the cash generating assets and forecast sales of the products.
(f) Brand
In accordance with IFRS 3 – Business Combinations, a valuation of the brand acquired was performed. This valuation was calculatedasthepresentvalueofprofitsandKShs1.122billion(120millionRand)turnoverfor2008andusing5%growthinrevenuesfrom2009.Theusefullifeofthebrandhasbeenassessedover20years.Thediscountrateof20.6%wasused.

48 REPORT AND FINANCIAL STATEMENTS FOR THE YEAR ENDED 31 DECEMBER 2012
Notes to the Consolidated Financial Statements
13. INVESTMENTS Consolidated Consolidated Company Company 2012 2011 2012 2011 KShs ‘000 KShs ‘000 KShs ‘000 KShs ‘000 (a) Quoted shares
Movement during the year: At 1 January 50,135 93,625 50,135 93,625 Disposals (49,854) (13,687) (49,854) (13,687) Fair value loss in the year - (29,803) - (29,803)
At 31 December 281 50,135 281 50,135
Comprising: Cost 18,006 102,586 18,006 102,586 Cumulative fair value change (17,725) (52,451) ( 17,725) (52,451)
281 50,135 281 50,135
(b) Unquoted shares
RVR Investments (PTY) Limited (RVR) (Registered in Mauritius): 3,855,686 2,820,837 - -
Development Bank of Kenya Limited Cost 78,689 78,689 78,689 78,689 Cumulative fair value gain 174,511 135,062 174,511 135,062
253,200 213,751 253,200 213,751
Mwangaza Limited Cost 101,764 - - - Cumulative fair value gain - - - -
101,764 - - -
4,210,650 3,034,588 253,200 213,751
Trans-Century Limited initially entered into a subscription agreement to acquire 20% of shares in RVR Investments(Proprietary) Limited (RVR) in 2006, a company organised under the Laws of Mauritius. The total investment for the initial 20%stakeinRVRwasUS$9millionthathasbeenpaidinfull.By2011thecompanyhasmadeadditionalinvestmentsinRVRbeyondtheinitialUS$9milliontherebyincreasingitsshareholdinginRVRfromitsinitial20%to34%.
In 2010, a new lead investment Company was established, named KU Railways Holdings (KURH) in place of the initial lead investor Sheltam Rail Company (SRC) and under the amended concession agreements, the shareholders of RVR swopped their shares in RVR for shares in KURH in order to take up shareholding in the new lead investor. The Company therefore owns34%ofKURH,throughitssubsidiaryundertakingSafariRailCompanyLimited,acompanyorganisedundertheLawsofMauritiuswhichisawhollyownedsubsidiaryoftheCompany.KURH(newleadinvestor)currentlyowns100%ofRVR(Concession Holding Company, through which the Company initially invested).

49REPORT AND FINANCIAL STATEMENTS FOR THE YEAR ENDED 31 DECEMBER 2012
Notes to the Consolidated Financial Statements
13. INVESTMENTS (Continued)
(b) Unquoted shares (continued)
In 2011, RVR kicked off the turnaround effort aimed at increasing capacity of the railway, with the following being the keymilestones;(a)SigningandfirstdrawdownbyRVRof the$164milliondebtpackage inDecember2011 (b) Injectionof USD82 million capital injection by the shareholders and (c) Final appointments of key management positions. The key activities are on course with the first projects being track improvement, wagon refurbishment, locomotive refurbishment and systems upgrades.
In 2012, RVR embarked on its planned turnaround plan after receiving its first debt drawdown in December 2011. By end of 2012,overUSD100millionhasbeeninvestedintheturnaroundprogrammewiththefollowingimpact;(a)Rehabilitationof over 50% of the dilapidated track betweenMombasa and Nairobi and replaced 5 out of 9 culverts in Uganda (b)Refurbishment and overhaul of over 350 wagons (c) Launch of the locomotive rehabilitation and overhaul programme (d) Installation of a new ERP system.
The investment in KURH/RVR is carried at fair value through profit or loss. The fair value as at 31 December 2011 and 31 December 2012 was estimated through a valuation technique designed by the directors which assumed a blended average ofvariousvaluationmethodsnamely;thePrecedenttransactionsanalysis,DiscountedCashFlows(DCF)analysis,InternalRate of Return (IRR) analysis and the comparable companies analysis. The concession agreement signed between RVR and the Governments of Kenya and Uganda remains in place and forms the basis of operation of RVR. Based on the foregoing factors, the directors believe that the value of the investment in RVR is fairly stated.
(c) Investment in subsidiaries – Fair value/cost
Consolidated Consolidated Company Company 2012 2011 2012 2011 Cable Holdings (Kenya) Limited KShs ‘000 KShs ‘000 KShs ‘000 KShs ‘000 94.8113% (2010 – 94.8113%): Cost - - 271,681 271,681 Cumulative fair value gain - - 2,212,973 2,026,972
- - 2,484,654 2,298,653
Avery Kenya Limited 94.4058% (2011 – 94.4058%): Cost - - 49,853 49,853 Cumulative fair value gain - - 602,496 606,651
- - 652,349 656,504
Tanelec Limited 70% (2011 – 70%): Cost - - 78,720 78,720 Cumulative fair value gain - - 876,742 853,043
- - 955,462 931,763
Trans-Century Holdings Pty Limited 100%(2011–100%): Cost - - 122,167 122,167 Cumulative fair value gain - - 791,453 771,568
- - 913,620 893,735
Crystal Limited 100% (2011 – 95%): Cost - - 52 52 Cumulative fair value gain - - - 854,175
- - 52 854,227

50 REPORT AND FINANCIAL STATEMENTS FOR THE YEAR ENDED 31 DECEMBER 2012
Notes to the Consolidated Financial Statements
13. INVESTMENTS (Continued) (c) Investment in subsidiaries – Fair value/cost (continued)
Consolidated Consolidated Company Company 2012 2011 2012 2011 KShs ‘000 KShs ‘000 KShs ‘000 KShs ‘000
Trans-Century Mauritius Holdings Limited(100%) Cost - - 973,103 973,103 Cumulative fair value gain - - 3,159,430 2,158,470
- - 4,132,533 3,131,573
Total investment in subsidiaries - - 9,138,670 8,766,455
The company holds 94.8113% (2011 – 94.8113%) shareholding in Cable Holdings Limited which leads to an effective
shareholdingof 64.3614% (2011 – 64.3614%) of EastAfricaCables Limited (A company listedon theNairobi SecuritiesExchange).
Intheyear2005,thecompanyacquired94.4058%shareholdinginAvery(EastAfrica)Limited.
Inyear2007,thecompanyacquired70%shareholdinginTanelecLimited.Thecompanyholds100%shareholdinginCrystalLimitedwhichwasacquiredin2008.CrystalLimitedinturnhasashareholdingof95%inChaiBoraLimited.Crystallimiteddisposedoffits95%shareholdingofChaiBoralimitedon31December2012.
The companyholds100% shareholding inTrans-CenturyMauritiusHoldings, a company incorporated inMauritius.Thecompany was set up in 2009.
Fair value determined based on fair value policy per Note 2(e)
14. INVESTMENT IN FUNDS
Group and Company The fund value has been disclosed at its fair value at the year end and fair value gains and losses have been accounted for
through other comprehensive income. 2012 2011 KShs ‘000 KShs ‘000 Aureos East Africa (AEAF) 38,684 35,485 Aureos South Asia (ASAF) 180,180 172,196 Aureos China (ACF) 107,959 137,138 Business Partners International (BPI) 67,173 62,156 Helios Investors LP (Helios) - 194,447 Helios Investors Kili Parallel LLP (KILI LLP) - 166,131
393,996 767,553
Aureos East Africa Fund:
ThecompanyhascommittedtoinvestUS$500,000inthefund.
2012 2011 KShs ‘000 KShs ‘000 The investment at cost is allocated as follows: Total calls 38,684 35,485 Company portion (3,754) (6,130)
Attributable to other members 34,930 29,355
Callsmadeto31December2012amountedtoUS$230,925(2011-US$230,925).
The fair value of the investment is KShs 38,684,000 (2011- KShs 35,485,000).

51REPORT AND FINANCIAL STATEMENTS FOR THE YEAR ENDED 31 DECEMBER 2012
Notes to the Consolidated Financial Statements 14
. IN
VEST
MEN
T IN
FU
ND
S (C
ontin
ued)
A
SAF
AEA
F A
CF
BPI
Hel
ios
KI
LI L
LP
TOTA
L
USD
’000
U
SD’0
00
USD
’000
U
SD’0
00
USD
’000
U
SD’0
00
USD
’000
C
omm
itmen
t :
-3
1 D
ecem
ber 2
012
2,50
0 50
0 2,
000
1,50
0 -
- 6,
500
-3
1 D
ecem
ber 2
011
2,
500
500
2,00
0 1,
500
2,50
0 2,
000
11,0
00
%holding
:
-31Decem
ber2
012
2.94
%
1.25
%
5.48
%
10.64%
-
-
-31Decem
ber2
011
2.94
%
1.25
%
5.48
%
10.64%
1.00
%
1.56
%
O
utst
andi
ng c
omm
itmen
t:
At 3
1 D
ecem
ber 2
012
30
2 5
560
427
- -
1,29
4
At 3
1 D
ecem
ber 2
011
93
0 26
9 58
2 42
7 40
5 -
2,61
3
20
12
KS
hs’0
00
KShs
’000
KS
hs’0
00
KShs
’000
KS
hs’0
00
KShs
’000
KS
hs’0
00
Valu
atio
n:
A
t 1 Ja
nuar
y 20
12
17
2,19
6 35
,485
13
7,13
8 62
,156
19
4,44
7 16
6,13
1 76
7,55
3
Addi
tions
/(re
dem
ptio
ns) d
urin
g th
e ye
ar
27,1
66
- 1,
845
(13,
455)
10
,500
-
26,0
56
Fair
valu
e ga
in/(
loss
)
(19,
182)
3,
199
(31,
024)
18
,472
2,
286
1,87
6 (2
4,37
3)
Dis
posa
ls d
urin
g th
e ye
ar
-
- -
- (2
07,2
33)
(168
,007
) (3
75,2
40)
At 3
1 D
ecem
ber 2
012
18
0,18
0 38
,684
10
7,95
9 67
,173
-
- 39
3,99
6
20
11
KS
hs’0
00
KShs
’000
KS
hs’0
00
KShs
’000
KS
hs’0
00
KShs
’000
KS
hs’0
00
Valu
atio
n:
A
t 1 Ja
nuar
y 20
11
19
4,69
2 45
,218
13
4,45
2 59
,419
20
9,21
4 27
1,27
3 91
4,26
8
Addi
tions
/(re
dem
ptio
ns) d
urin
g th
e ye
ar
(785
) (1
0,49
0)
22,4
52
12,8
35
22,3
09
- 46
,321
Fa
ir va
lue
gain
/(lo
ss)
(2
1,71
1)
757
(19,
766)
(1
0,09
8)
(37,
076)
(1
05,1
42)
(193
,036
) A
t 31
Dec
embe
r 201
1
172,
196
35,4
85
137,
138
62,1
56
194,
447
166,
131
767,
553

52 REPORT AND FINANCIAL STATEMENTS FOR THE YEAR ENDED 31 DECEMBER 2012
Notes to the Consolidated Financial Statements
Consolidated Consolidated Company Company 2012 2011 2012 201115. LOANS TO SUBSIDIARIES KShs ‘000 KShs ‘000 KShs ‘000 KShs ‘000
Payable after 12 months: Trans-Century Holdings Proprietary Limited - South Africa - - 380,985 196,487 Crystal Ltd – Tanzania - - 91,038 436,171 Cable Holdings (Kenya) Limited - - 21,252 -
- - 493,275 632,658
Payable within 12 months: Chai Bora Ltd – Tanzania - - - 73,710 Trans-Century Holdings Proprietary Limited - - - 43,014
- - - 116,724
16. INVENTORIES
Raw materials 581,059 642,159 - - Finished goods 569,663 551,598 - - Work in progress 228,995 201,299 - - Goods in transit 48,991 79,013 - - Spares and lubricants 89,707 172,310 - - Machines 73,030 40,981 - - Consumables 25,618 35,004 - - Containers 1,499 1,587 - - Provision for obsolete and slow moving stocks (25,021) (14,723) - -
1,593,541 1,709,228 - -
17. TRADE AND OTHER RECEIVABLES
Trade receivables 4,236,430 4,037,100 - - Bad debts provision 291,443) (204,744) - -
3,944,987 3,832,356 - - Sundry receivables and prepayments 1,654,256 1,112,688 249,100 117,268 Staff receivables 4,458 4,218 5,629 - Due from related parties (Note 27(h)) - - 997,627 352,381
5,603,701 4,949,262 1,252,356 469,649
18. CASH AND CASH EQUIVALENTS
Cash and bank balances 274,416 2,759,356 - - Bank overdraft (335,405) (263,953) (100,245) (41,899)
Total cash and cash equivalents (60,989) 2,495,403 (100,245) ( 41,899)
Bank facilities
The Group has entered into facilities with various banks which are secured by pledge over various marketable listed stock exchange shares including East African Cables Limited shares equivalent to KShs.1.9 billion (2011 – KShs 4.7 billion).

53REPORT AND FINANCIAL STATEMENTS FOR THE YEAR ENDED 31 DECEMBER 2012
Notes to the Consolidated Financial Statements
18. CASH AND CASH EQUIVALENTS (Continued)
A subsidiary, East African Cables Limited, has entered into a facility with a bank and is secured over certain land and buildings for KShs 870 million (2011 - KShs 870 million) and a debenture over all assets of the company for KShs 2.1 billion (2011 - KShs 2.1 billion). The bank facility comprises overdraft, term loan, letters of credit, bonds/guarantee and forex dealing.
A subsidiary, East African Cables (Tanzania) Limited, has a bank overdraft for working capital management and a short term post-import financing loan with Standard Bank (Tanzania) Limited. The facility is charged against the leasehold land and moveable assets of the subsidiary. The subsidiary also has a long term facility of KShs 44 million equivalent (2011 - KShs 44 million) with Kenya Commercial Bank Tanzania Limited for the purchase of machinery. The loan is secured by the machinery purchased.
A subsidiary of Trans-Century Holdings (Proprietary) Limited, Kewberg Cables & Braids (Proprietary) Limited, has ceded and pledged to the Standard Bank of South Africa, all its rights in and to book debts and other debts and any claim, due or to become due to it of KShs 72.5 million equivalent (2011 - Nil) . The loans at the subsidiary are secured over property, plant, equipment and current assets.
AsubsidiaryofCrystalLimited,ChaiBoraLimited,securedtwomediumtermfacilitiesfromCRDBBankLimitedin2012and2007;a Shs 500 million and USD 1,150,000 term loan respectively. The facility obtained in 2012 was used to finance asset purchases while the 2007 facility was used to repay existing borrowings with Standard Chartered Bank Tanzania Limited. The loan and bank overdraft facility is secured by legal mortgage over industrial buildings, fixed and floating debentures over all the assets of the company and cross company guarantee and indemnity from Trans-Century Limited but later taken on by Catalyst Principals on 31 December 2012.
A subsidiary, Tanelec Limited, has a bank loan facility with Stanbic Bank Tanzania Limited which is due on December 2013 and attractsinterestat9%p.a.andafinanceleasewithrespecttoassetfinancingattherateof8.5%.Thefacilityissecuredwithfirstcharge over certain company assets, with a carrying value of TShs 9,256,056,000 (KShs 72.5 million equivalent) and a corporate guaranteebyTrans-CenturyLimitedtocoverthecreditfacilityby125%.
A subsidiary, Avery (East Africa) Limited, has a bank overdraft facility with Chase Bank (Kenya) Limited for KShs 100 million securedbyitsleaseholdlandandbuilding.Interestischargedatbaselendingrateminus1%.
A subsidiary, Safari Rail Company Limited, has entered into an interest free loan facility agreement of USD 6 million with Ambience Rail Company (Pty) Limited. This loan can only be used for the purpose of meeting capital requirements in Rift Valley Railways Company Limited. The loan is unsecured and repayable only out of dividends received or from the proceeds of sale of the company’s interest in the investee company
19. SHARE CAPITAL 2012 2011 KShs ‘000 KShs ‘000 Group and Company Authorised 600,000,000 (2011 - 600,000,000) Ordinary shares of KShs 0.50 each 300,000 300,000
Issued and fully paid At 1 January 273,950,284 (2011 - 267,038,090) Ordinary shares of KShs 0.50 (2011 - KShs 0.50) each 136,975 133,519 2012 - Nil (2011 - 6,912,194) Ordinary shares of KShs 0.50 each (2011 – KShs 0.50) each - 3,456
At 31 December 273,950,284 (2011 - 273,950,284) Ordinary shares of KShs 0.50 (2011 - 0.50) each 136,975 136,975
Conversion of bond in 2011 The company issued a convertible bond in 2011 as detailed in Note 23. The 6,912,194 additional shares in the year relates to
conversionofbondvaluedatUS$3,435,000.
All shares rank equally with regard to the company’s residual assets. The holders of shares are entitled to receive dividends declared from time to time and are entitled to one vote per share at annual and general meetings of the company.

54 REPORT AND FINANCIAL STATEMENTS FOR THE YEAR ENDED 31 DECEMBER 2012
Notes to the Consolidated Financial Statements
20. SHARE PREMIUM Consolidated Consolidated Company Company 2012 2011 2012 2011 KShs ‘000 KShs ‘000 KShs ‘000 KShs ‘000
At 1 January 379,717 106,684 379,717 106,684 Conversion of convertible bond of 6,912,194 shares at conversion price of KShs 40 - 273,033 - 273,033
At 31 December 379,717 379,717 379,717 379,717
21. RESERVES
(a) Revenue Reserves Revenue reserves relate to accumulated profits over the years.
(b) Translation reserve
The translation reserve comprises all foreign currency differences arising from the translation of the financial statements of foreign operations.
(c) Available for sale reserve
The available for sale reserve comprises the cumulative net change in the fair value of available-for-sale financial assets until the investment is derecognised.
(d) Revaluation reserve
The revaluation reserve relates to the revaluation of property, plant and equipment prior to its reclassification as investment property.
22. PROPOSED DIVIDENDS AND EARNINGS
(a) Basic and diluted earnings per share The calculation of basic earnings per share at 31 December 2012 was based on the profit attributable to ordinary shareholders
of KShs 455,056,000 (2011 – KShs 356,665,000) and a weighted average number of ordinary shares outstanding during the year of 273,950,284 (2011 – 269,342,155).
2012 2011 KShs ‘000 KShs ‘000 Profit attributable to ordinary shareholders 455,056 356,665
Diluted earnings per share is calculated by adjusting the earnings and weighted average number of ordinary shares outstanding during the year for the effects of dilutive options and other dilutive potential ordinary shares.
The calculation of diluted earnings per share at 31 December 2012 was based on the profit attributable to ordinary shareholders of KShs 712,859,000 (2011 – KShs 430,840,000) and a weighted average number of ordinary shares outstanding after adjustment for all the effects of all dilutive potential ordinary shares of 370,454,478 (2011 – 348,943,069).

55REPORT AND FINANCIAL STATEMENTS FOR THE YEAR ENDED 31 DECEMBER 2012
Notes to the Consolidated Financial Statements
22. PROPOSED DIVIDENDS AND EARNINGS (continued) (b) Proposed dividends 2012 2011 KShs ‘000 KShs ‘000
Balance brought forward 68,488 53,408 Final proposed for the year 109,580 68,488 Paid or transferred to liabilities in the year (68,488) (53,408)
109,580 68,488
Proposed dividends are accounted for as a separate component of equity until they have been ratified at an Annual General Meeting. During the year the directors paid the 2011 final dividend of KShs 68,487,571 and recommend a final dividend of KShs 0.40 per share amounting to KShs 109,580,114
23. CONVERTIBLE BOND
During the year ended 31 December 2011 the group issued a United States Dollar (USD) denominated convertible bond through one of its subsidiary, TC Mauritius Holdings Limited. The total amount of the convertible bond issued was USD 54,270,000 and some of the bond holders converted their portion of the bond to ordinary shares during the year ended 31 December 2011 amounting to USD 3,435,000. The movement in the bond during the year is as follows:
2012 2011 KShs ‘000 KShs ‘000 At 1 January 4,452,798 - Issued during the year - 4,368,266 Interest accrued 188,334 121,455 Interest paid (121,455) - Forex gains/(losses) 54,877 239,566 Conversion during the year - (276,489)
At 31 December 4,574,554 4,452,798
The terms of the convertible bond are as follows:
• Termofbond:5year,maturingon25March2016;
• Interestrate:6%perannumcashcouponpaidannuallyand6%perannumpaymentinkindtobepaidattheendof5thyearshould the Bond not be converted. The payment in kind interest not accrued in the books amount to Kshs 129m (2011: Nil).
• Thecompanyhasreserved150,929,616ordinarysharestocaterforconversionofthebondintoshares,ofwhich6,912,194was issued on conversion during the year ended 31 December 2011.
• Theconvertiblebondisconvertedatafixedconversionforeignexchangerateof80.49135toUS$1.00.

56 REPORT AND FINANCIAL STATEMENTS FOR THE YEAR ENDED 31 DECEMBER 2012
Notes to the Consolidated Financial Statements 24
. D
EFER
RED
TA
X (A
SSET
)/LI
ABI
LITY
(a
) D
efer
red
tax
asse
t
Re
cogn
ised
thro
ugh
Reco
gnis
ed
(i)G
roup
st
atem
ent o
f in
oth
er
At
co
mpr
ehen
sive
co
mpr
ehen
sive
Ex
chan
ge
At
1
Janu
ary
Recl
assi
ficat
ion
inco
me
inco
me
diff
eren
ce
31 D
ecem
ber
2012
: KS
hs’0
00
KShs
’000
KS
hs’0
00
KShs
‘000
KS
hs’0
00
KShs
’000
Pr
oper
ty, p
lant
and
equ
ipm
ent
7
4
-
501
-
-
575
2011
:
Prop
erty
, pla
nt a
nd e
quip
men
t (1
,006
) 1,
131
- (5
1)
- 74
Prov
isio
ns
3,59
8 (3
,598
) -
- -
-
U
nrea
lised
exc
hang
e lo
sses
128
(128
)
-
-
-
-
2,
720
(2,5
95)
-
(5
1)
-
74
(ii)C
ompa
ny
20
12:
Pr
oper
ty, p
lant
and
equ
ipm
ent
7
4
-
501
-
-
575
2011
:
Prop
erty
, pla
nt a
nd e
quip
men
t 1
25
- (5
1)
-
-
7
4

57REPORT AND FINANCIAL STATEMENTS FOR THE YEAR ENDED 31 DECEMBER 2012
Notes to the Consolidated Financial Statements 24
. D
EFER
RED
TA
X (A
SSET
)/LI
ABI
LITY
(Con
tinue
d)
(b) D
efer
red
tax
liabi
lity
Reco
gnis
ed
(i) G
roup
A
cqui
red
on
thro
ugh
Prio
r yea
r
At
ac
quis
ition
in
com
e (o
ver)
/und
er
Reco
gnis
ed
Exch
ange
A
t
1 Ja
nuar
y Re
clas
sific
atio
n of
sub
sidi
ary
stat
emen
t pr
ovis
ion
in e
quit
y d
iffer
ence
31
Dec
embe
r
20
12:
KShs
’000
KS
hs’0
00
KShs
’000
KS
hs ‘0
00
KS
hs’0
00
KShs
’000
KS
hs’0
00
Staff
gra
tuity
pro
visi
on
(6,5
19)
-
-
2,
239
- -
44
( 4
,236
)
O
ther
pro
visi
ons
and
accr
uals
(1
05,5
93)
- 5,
975
(30,
546)
-
- 48
,194
(8
1,97
0)
U
nrea
lised
exc
hang
e ga
in
45,2
15
-
-
65
5 -
- (1
9,50
4)
26,3
66
Pr
oper
ty, p
lant
and
mac
hine
ry
685,
110
-
(15,
266)
3
3,34
3
531
13
8,34
9 (6
4,78
9)
777,
278
Def
erre
d ta
x lia
bilit
y 61
8,21
3
- (9
,291
)
5,6
91
5
31
138,
349
(36,
055)
71
7,43
8
2011
:
Staff
gra
tuity
pro
visi
on
(5,7
89)
- -
(773
) -
- 43
( 6
,519
)
O
ther
pro
visi
ons
and
accr
uals
(1
10,2
91)
(3,5
98)
(4,9
66)
11,1
22
780
- 1,
360
(105
,593
)
U
nrea
lised
exc
hang
e ga
in
64,5
26
(128
) 2,
279
22
,751
-
- (4
4,21
3)
45,2
15
Pr
oper
ty, p
lant
and
mac
hine
ry
642,
300
1,13
1 34
,693
(1
16,4
34)
41
71,6
66
51,7
13
685,
110
Def
erre
d ta
x lia
bilit
y 59
0,74
6 (2
,595
) 32
,006
(8
3,33
4)
821
71,6
66
8,
903
618,
213

58 REPORT AND FINANCIAL STATEMENTS FOR THE YEAR ENDED 31 DECEMBER 2012
Notes to the Consolidated Financial Statements
Consolidated Consolidated Company Company 2012 2011 2012 201125. LOANS KShs ‘000 KShs ‘000 KShs ‘000 KShs ‘000
Bank loans -Long term 2,252,075 2,965,304 1,853,113 1,709,699 -Short term 2,325,052 1,337,928 - - Loans from subsidiaries (Note 27(g)) - - 576,073 746,209
4,577,127 4,303,232 2,429,186 2,455,908
Payable after 12 months 3,179,169 2,965,304 1,853,113 2,309,995 Payable within 12 months 1,397,958 1,337,928 576,073 145,913
4,577,127 4,303,232 2,429,186 2,455,908
The bank loans are granted under the bank facilities per Note 18 above.
26. TRADE AND OTHER PAYABLES Consolidated Consolidated Company Company 2012 2011 2012 2011 KShs ‘000 KShs ‘000 KShs ‘000 KShs ‘000
Trade payables 3,251,594 1,904,611 - - Sundry creditors 631,812 2,741,514 144,496 74,663
3,883,406 4,646,125 144,496 74,663
27. RELATED PARTIES TRANSACTIONS
The following transactions were carried out with related parties: 2012 2011 (a) Directors and executive officers KShs’000 KShs’000 Group and Company Directors emoluments – Group 29,708 36,277 Others 7,857 3,411 Company fees 7,863 7,844
45,428 47,532
(b) Inter-company sales – Group From East African Cables Limited to Tanelec Limited 30,286 33,927 From Avery (East Africa) Limited to East African Cables Limited 327 8,662 From Chai Bora Limited to Avery (EA) Limited - 307
30,613 42,896
(c) Interest income - Company Chai Bora Limited 12,565 11,154 Crystal Limited 3,509 4,191
16,074 15,345
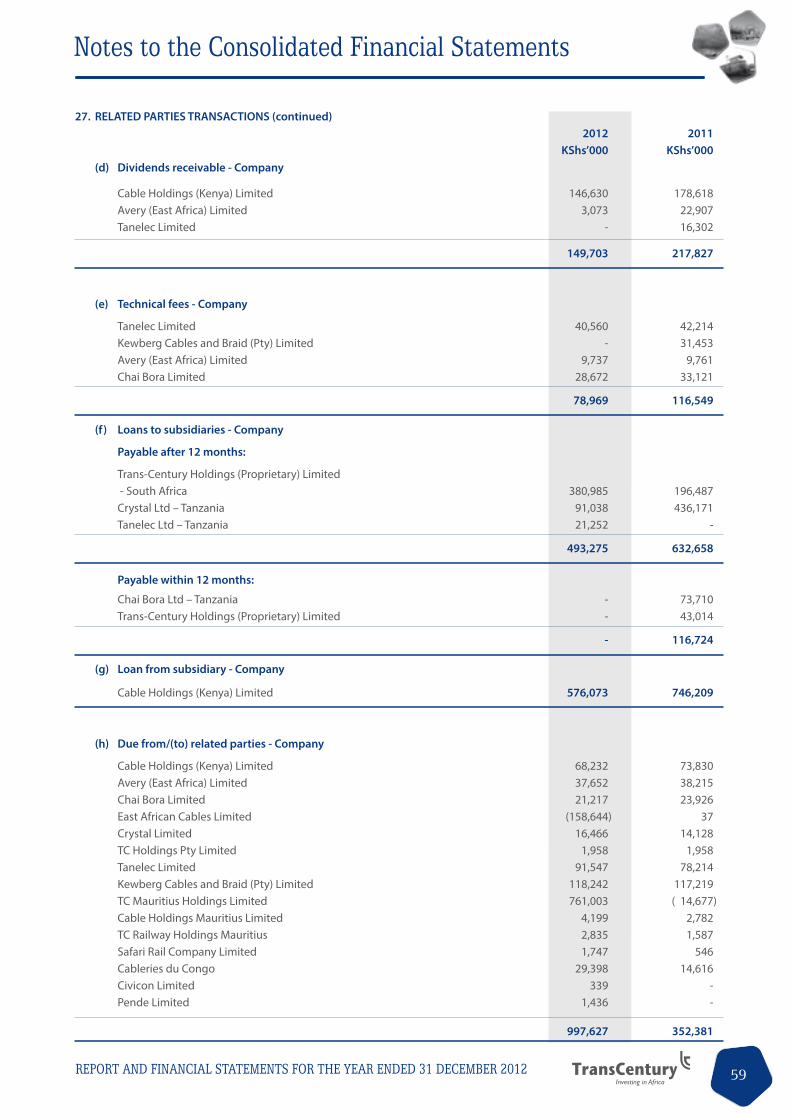
59REPORT AND FINANCIAL STATEMENTS FOR THE YEAR ENDED 31 DECEMBER 2012
Notes to the Consolidated Financial Statements
27. RELATED PARTIES TRANSACTIONS (continued) 2012 2011 KShs’000 KShs’000 (d) Dividends receivable - Company
Cable Holdings (Kenya) Limited 146,630 178,618 Avery (East Africa) Limited 3,073 22,907 Tanelec Limited - 16,302
149,703 217,827
(e) Technical fees - Company
Tanelec Limited 40,560 42,214 Kewberg Cables and Braid (Pty) Limited - 31,453 Avery (East Africa) Limited 9,737 9,761 Chai Bora Limited 28,672 33,121
78,969 116,549
(f) Loans to subsidiaries - Company
Payable after 12 months:
Trans-Century Holdings (Proprietary) Limited - South Africa 380,985 196,487 Crystal Ltd – Tanzania 91,038 436,171 Tanelec Ltd – Tanzania 21,252 -
493,275 632,658
Payable within 12 months:
Chai Bora Ltd – Tanzania - 73,710 Trans-Century Holdings (Proprietary) Limited - 43,014
- 116,724
(g) Loan from subsidiary - Company
Cable Holdings (Kenya) Limited 576,073 746,209
(h) Due from/(to) related parties - Company
Cable Holdings (Kenya) Limited 68,232 73,830 Avery (East Africa) Limited 37,652 38,215 Chai Bora Limited 21,217 23,926 East African Cables Limited (158,644) 37 Crystal Limited 16,466 14,128 TC Holdings Pty Limited 1,958 1,958 Tanelec Limited 91,547 78,214 Kewberg Cables and Braid (Pty) Limited 118,242 117,219 TC Mauritius Holdings Limited 761,003 ( 14,677) Cable Holdings Mauritius Limited 4,199 2,782 TC Railway Holdings Mauritius 2,835 1,587 Safari Rail Company Limited 1,747 546 Cableries du Congo 29,398 14,616 Civicon Limited 339 - Pende Limited 1,436 -
997,627 352,381

60 REPORT AND FINANCIAL STATEMENTS FOR THE YEAR ENDED 31 DECEMBER 2012
Notes to the Consolidated Financial Statements
28. BUSINESS COMBINATIONS
On 30 September 2011 the group through its subsidiary TC Holdings Mauritius obtained the control of Civicon Limited, a companyinvolvedintheprovisionofcivilandmechanicalengineeringandtransportationservicesbyacquiring62%oftheshares and voting interests of the company.
On31May2011thegroupthroughitssubsidiaryTanelecLimitedalsoobtainedthecontrolofPendeGroupbyacquiring80%of the shares and voting interest of the company. Pende Group is incorporated in Zambia and involved in the sale of electrical hardware and provision of engineering services as well as the manufacturing of transformers.
Taking control of the two companies is driven by the Group’s belief in the long term growth prospects of the East, Central and Southern African regional infrastructure opportunity. The investment also positions the group to actively participate in infrastructure development across the region going forward. The above businesses acquired in prior year contributed revenue of KShs 1.75 billion and Earnings Before Interest and Tax (EBIT) of KShs 677.6 million to the group results in 2011.
As previously Total stated in 2011 Adjustments As restated KShs’000 KShs’000 KShs’000
Property, plant and equipment 2,086,556 - 2,086,556 Intangible assets 14,671 - 14,671 Investment property 30,422 - 30,422 Inventories 27,672 - 27,672 Related party assets and liabilities 36,597 - 36,597 Trade and other receivables 1,499,973 86,993 1,586,966 Tax recoverable 77,008 - 77,008 Deferred tax liability (32,006) - (32,006) Tax payable (254,278) - (254,278) Trade and other payables (523,411) - (523,411) Borrowings (614,296) - (614,296) Other liabilities - (1,247,459) (1,247,459)
Total net assets acquired during the year 2,348,908 (1,160,466) 1,188,442
Non controlling interest at acquisition 889,098 (387,043) 502,055 Majority interest at acquisition 1,459,810 (773,423) 686,387
Total net assets acquired during the year 2,348,908 (1,160,466) 1,188,442
2011 During the year ended 31 December 2011, the fair value of property, plant and equipment, leases, intangible assets and
liabilities had been determined provisionally pending completion of an independent verification exercise. The process of fair valuing the other assets and liabilities of the company is also still ongoing and if new information obtained within one year from the acquisition date about facts and circumstances that existed at the acquisition date identifies any adjustments to the above amounts, or any additional provisions that existed at the acquisition date, then the acquisition accounting will be revised in the following financial year.
2012 The above exercise was completed and new information gathered indicating an increase in trade and other receivables and
other liabilities as above. 29. DISCONTINUED OPERATIONS
InDecember2012thegroupsoldChaiBoraLimitedwhichwasa95%ownedsubsidiaryofTranscenturyLimited.Thesubsidiarywas not a discontinued operation or classified as held for sale as at 31 December 2011 and the comparative statement of comprehensive income has been re-presented to show the discontinued operation separately from continuing operations. Management committed to a plan to sell this segment early in 2012 following a strategic decision to place greater focus on the group’s key competencies, being the power, transport and infrastructure industries.

61REPORT AND FINANCIAL STATEMENTS FOR THE YEAR ENDED 31 DECEMBER 2012
Notes to the Consolidated Financial Statements
29. DISCONTINUED OPERATIONS (Continued) 2012 2011 KShs’000 KShs’000 (a) Results of discontinued operation Revenues 925,462 983,249 Expenses (870,787) (910,318)
Results from operating activities 54,675 72,931
Tax - (25,099)
Results from operating activities, net of tax 54,675 47,832
Gain on sale of discontinued operation (21,255) - Tax on gain on sale of discontinued operation (28,877) -
Profit for the year 4,542 47,832
(b) Effect of disposal on the financial position of the group:
Property and equipment (99,430) Goodwill and trade marks (250,668) Inventories (166,013) Corporation tax recoverable (24,497) Trade and other receivables (195,940) Bank balances and cash (22,294) Borrowings 45,628 Retirement benefit obligations 10,786 Deferred tax liability 9,291 Trade and other payables 71,835 Bank overdraft 91,523 Intercompany balances 82,462 Borrowings – Current portion 21,537
Net assets and liabilities (425,781)

62 REPORT AND FINANCIAL STATEMENTS FOR THE YEAR ENDED 31 DECEMBER 2012
Notes to the Consolidated Financial Statements 30
. SE
GM
ENT
INFO
RMAT
ION
Th
e G
roup
has
four
repo
rtab
le s
egm
ents
whi
ch a
re th
e st
rate
gic
busi
ness
uni
ts in
the
follo
win
g se
gmen
ts:
•
Power
•
Tran
sport
•
Specialized
eng
inee
ring
•
Consum
er
Fo
r ea
ch o
f the
str
ateg
ic b
usin
ess
units
, the
gro
up C
hief
Exe
cutiv
e O
ffice
r re
view
s in
tern
al m
anag
emen
t re
port
s. In
form
atio
n re
gard
ing
the
resu
lts o
f eac
h re
port
able
seg
men
t is
de
scrib
ed b
elow
. Per
form
ance
is m
easu
red
base
d on
eac
h se
gmen
t pro
fit b
efor
e ta
x as
indi
cate
d in
the
inte
rnal
man
agem
ent r
epor
ts th
at a
re re
view
ed b
y th
e G
roup
Chi
ef E
xecu
tive
Offi
cer.
Ye
ar e
nded
31
Dec
embe
r 201
2
Sp
ecia
lized
A
ffilia
ted
Intr
a-gr
oup
Pow
er
engi
neer
ing
Cons
umer
Tr
ansp
ort
inve
stm
ents
ad
just
men
ts
Tota
l
KS
hs’0
00
KShs
’000
KS
hs’0
00
KShs
’000
KS
hs’0
00
KShs
’000
KS
hs’0
00
Sale
s
6,74
2,01
1 6,
775,
504
- -
- (3
0,28
6)
13,4
87,2
29
O
pera
ting
profi
t
521,
129
770,
848
- 25
8,54
7 41
8,90
8 -
1,96
9,43
2
Fina
nce
cost
s
- -
- -
- -
(742
,959
)
Inco
me
tax
expe
nses
- -
- -
- -
(490
,368
)
Profi
t fro
m d
isco
ntin
ued
oper
atio
ns
- -
4,54
2 -
- -
4,54
2
Pr
ofit f
or th
e ye
ar
-
- -
- -
- 74
0,64
7
Att
ribu
tabl
e to
:
Equi
ty h
olde
rs
-
- -
- -
- 45
5,05
6
Non
-con
trol
ling
inte
rest
- -
- -
- -
285,
591

63REPORT AND FINANCIAL STATEMENTS FOR THE YEAR ENDED 31 DECEMBER 2012
Notes to the Consolidated Financial Statements 30
. SE
GM
ENT
INFO
RMAT
ION
(Con
tinue
d)
Ye
ar e
nded
31
Dec
embe
r 201
2 (C
ontin
ued)
Spec
ializ
ed
Affi
liate
d In
tra-
grou
p
Po
wer
en
gine
erin
g Co
nsum
er
Tran
spor
t in
vest
men
ts
adju
stm
ents
To
tal
KShs
’000
KS
hs’0
00
KShs
’000
KS
hs’0
00
KShs
’000
KS
hs’0
00
KShs
’000
Oth
er in
form
atio
n:
Segm
ent a
sset
s
8,97
7,91
1 5,
933,
738
- 3,
855,
686
3,07
8,41
9 -
21,8
45,7
54
Segm
ent l
iabi
litie
s
5,58
6,35
1 3,
527,
189
- -
663,
619
- 9,
777,
159
Ca
pita
l exp
endi
ture
277,
210
1,18
6,13
3 -
- 96
3 -
1,46
4,30
6
Dep
reci
atio
n an
d ar
mot
isat
ion
25
5,08
9 38
5,10
9 -
- 2,
906
- 64
3,10
4
Ye
ar e
nded
31
Dec
embe
r 201
1
Sa
les
7,
730,
211
2,
034,
609
98
2,64
1
- -
(45,
840)
10
,701
,621
Ope
ratin
g pr
ofit
12
2,72
4
654,
853
10
2,57
0
773,
139
(35,
223)
-
1,61
8,06
3
Fina
nce
cost
s
- -
- -
- -
(748
,798
)
Inco
me
tax
expe
nses
- -
- -
- -
(253
,165
)
Pr
ofit f
or th
e ye
ar
-
- -
- -
- 61
6,10
0
A
ttri
buta
ble
to:
Eq
uity
hol
ders
- -
- -
- -
356,
665
N
on-c
ontr
ollin
g in
tere
st
-
- -
- -
- 25
9,43
5
O
ther
info
rmat
ion:
Res
tate
d
Segm
ent a
sset
s
7,88
2,85
0 4,
773,
915
657,
737
2,82
0,83
7 6,
288,
925
- 22
,424
,264
Se
gmen
t lia
bilit
ies
4,
879,
360
1,68
3,68
4 61
9,25
8 -
4,15
6,53
8 -
11,3
38,8
40
Capi
tal e
xpen
ditu
re
11
1,72
2 27
,195
5,
700
- 3,
232
- 14
7,84
9
Dep
reci
atio
n an
d ar
mot
isat
ion
28
5,62
0 47
,581
1,
105
- 2,
172
- 33
6,47
8
Se
gmen
t ass
ets
com
pris
e pr
imar
ily p
rope
rty,
pla
nt a
nd e
quip
men
t, in
tang
ible
ass
ets,
inve
ntor
ies,
rece
ivab
les
and
oper
atin
g ca
sh. T
hey
excl
ude
defe
rred
tax
and
cert
ain
intr
a gr
oup
rece
ivab
les.
Segm
ent
liabi
litie
s co
mpr
ise
oper
atin
g lia
bilit
ies.
They
exc
lude
tax
and
cer
tain
cor
pora
te b
orro
win
gs. C
apita
l exp
endi
ture
com
pris
es a
dditi
ons
to p
rope
rty,
pla
nt a
nd
equi
pmen
t and
inta
ngib
le a
sset
s.
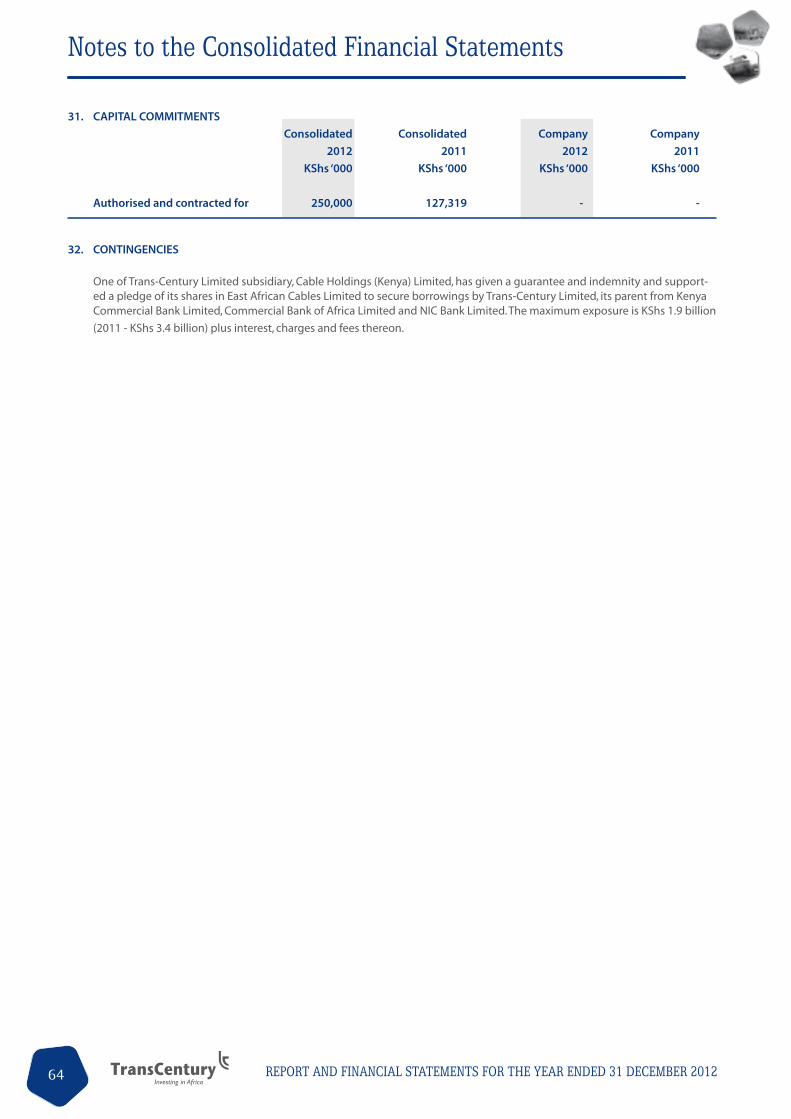
64 REPORT AND FINANCIAL STATEMENTS FOR THE YEAR ENDED 31 DECEMBER 2012
Notes to the Consolidated Financial Statements
31. CAPITAL COMMITMENTS Consolidated Consolidated Company Company 2012 2011 2012 2011 KShs ‘000 KShs ‘000 KShs ‘000 KShs ‘000
Authorised and contracted for 250,000 127,319 - -
32. CONTINGENCIES
One of Trans-Century Limited subsidiary, Cable Holdings (Kenya) Limited, has given a guarantee and indemnity and support-ed a pledge of its shares in East African Cables Limited to secure borrowings by Trans-Century Limited, its parent from Kenya Commercial Bank Limited, Commercial Bank of Africa Limited and NIC Bank Limited. The maximum exposure is KShs 1.9 billion
(2011 - KShs 3.4 billion) plus interest, charges and fees thereon.

REPORT AND FINANCIAL STATEMENTS FOR THE YEAR ENDED 31 DECEMBER 2012 65
Principal Shareholders and Distribution of Shareholding
Principal Shareholders of the Company and their respective Shareholding at 31 December 2012
Name of Shareholder No. of shares held % ANNE PEARL KARIMI GACHUI 21,253,190 7.76 MICHAEL GITAU WAWERU 21,245,080 7.76 PETER TIRAS KANYAGO 18,927,290 6.91 JIMNAH MWANGI MBARU 16,659,490 6.09 GITAU ZEPHANIAH MBUGUA 16,284,952 5.95 EPHRAIM KARIITHI NJOGU 13,520,170 4.93 EDWARD NJOROGE 12,428,626 4.54 STEPHEN NJOROGE WARUHIU 11,362,971 4.15 ROBIN MUNYUA KIMOTHO 10,851,510 3.96 JOSEPH MBUI MAGARI 10,613,530 3.88
SUB-TOTAL 153,146,809 55.93
OTHERS 120,803,475 44.07 TOTAL ISSUED SHARES 273,950,284 100.0
Distribution of Shareholding at 31 December 2012 Shares Range No. of Shareholders No. of shares held % shareholding 1-500 324 69,750 0.03% 501-5,000 332 714,244 0.26% 5,001-10,000 73 587,709 0.21% 10,001-100,000 109 4,520,776 1.65% 100,001-1,000,000 58 15,384,831 5.62% Above1,000,000 38 252,672,974 92.23%
Total 934 273,950,284 100%

REPORT AND FINANCIAL STATEMENTS FOR THE YEAR ENDED 31 DECEMBER 201266
Notes
REPORT AND FINANCIAL STATEMENTS FOR THE YEAR ENDED 31 DECEMBER 2012 67
Notes

Proxy Form
TRANS-CENTURY LIMITED
TO: EMU REGISTRARS Secretaries, P.O. Box 61120 - 00200 NAIROBI
I …………………………………………………………………………….……………………………………………….……………… of ……………………………………………………………………………………………………………………………………………
being a member/members of ……………………………………………………………………………………………………………...
hereby appoint …………………………………………………………………………..………………………………………………… of ………………………………………………………………………………………........….………………………………………..........
or failing him …………………………………………………………………………….………………………………………........…........
of ………………………………………………………………………………………….………………………………………........….....
as my/our proxy to vote for me/us on my/our behalf at the Annual General Meeting 30th May, 2013
Of the Company to be held on …………………………………………………………...………………………………………........….....
And at any adjournment thereof.
Signed/Sealed this …………. Day of ……………………………..………….….., 2013
……………………………………
……………………………………..
NOTE: The proxy form should be completed and returned not later than 48 hours before the meeting or any adjournment thereof. In case of a Corporation, the Proxy must be executed under the Common Seal.
REPORT AND FINANCIAL STATEMENTS FOR THE YEAR ENDED 31 DECEMBER 201168 REPORT AND FINANCIAL STATEMENTS FOR THE YEAR ENDED 31 DECEMBER 201268


Longonot Place,Kijabe Street, 7th FloorP O Box 42334-00100 GPO, Nairobi, Kenya.Tel: +254 20 224 53 50/ 224 52 32Fax: +254 20 224 52 53Email : [email protected]
ANNUAL REPORT AND FINANCIAL STATEMENTS
2012