ANNUAL REPORT 2019 - hapag-lloyd.com · 8 report of the supervisory board 19 corporate governance...
278
ANNUAL REPORT 2019
Transcript of ANNUAL REPORT 2019 - hapag-lloyd.com · 8 report of the supervisory board 19 corporate governance...

ANNUAL REPORT 2019
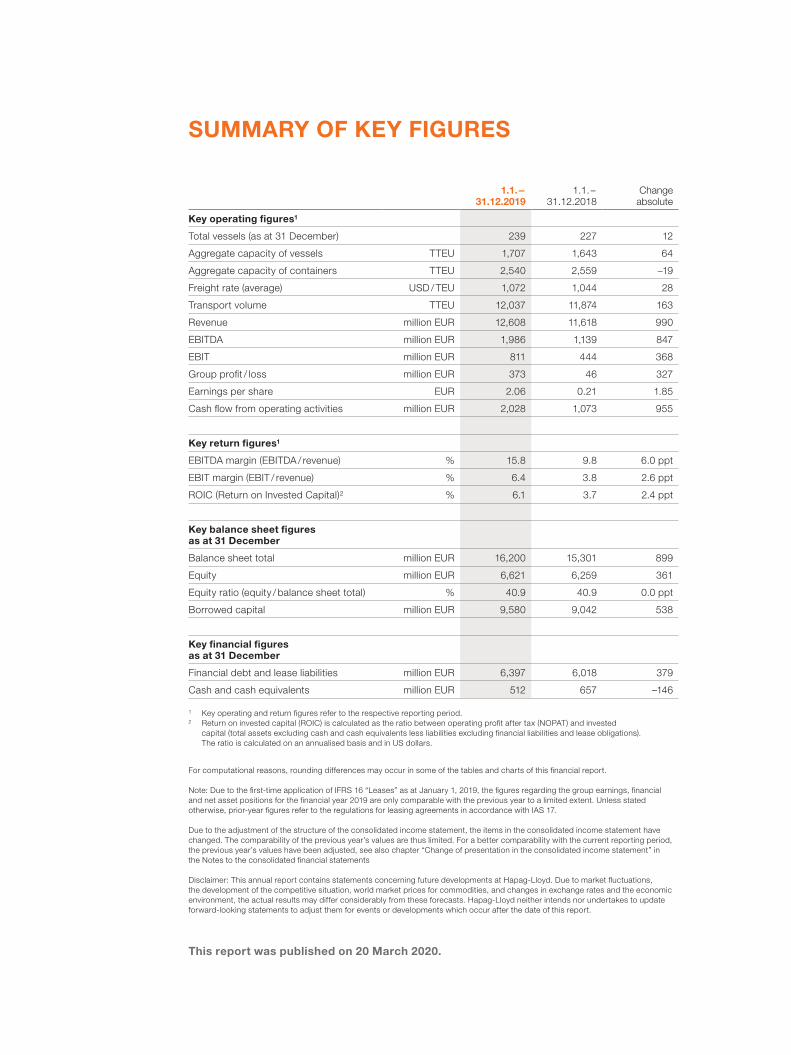
SUMMARY OF KEY FIGURES
1.1.-
31.12.20191.1.-
31.12.2018Change
absolute
Key operating figures1
Total vessels (as at 31 December) 239 227 12
Aggregate capacity of vessels TTEU 1,707 1,643 64
Aggregate capacity of containers TTEU 2,540 2,559 –19
Freight rate (average) USD / TEU 1,072 1,044 28
Transport volume TTEU 12,037 11,874 163
Revenue million EUR 12,608 11,618 990
EBITDA million EUR 1,986 1,139 847
EBIT million EUR 811 444 368
Group profit / loss million EUR 373 46 327
Earnings per share EUR 2.06 0.21 1.85
Cash flow from operating activities million EUR 2,028 1,073 955
Key return figures1
EBITDA margin (EBITDA / revenue) % 15.8 9.8 6.0 ppt
EBIT margin (EBIT / revenue) % 6.4 3.8 2.6 ppt
ROIC (Return on Invested Capital)2 % 6.1 3.7 2.4 ppt
Key balance sheet figures as at 31 December
Balance sheet total million EUR 16,200 15,301 899
Equity million EUR 6,621 6,259 361
Equity ratio (equity / balance sheet total) % 40.9 40.9 0.0 ppt
Borrowed capital million EUR 9,580 9,042 538
Key financial figures as at 31 December
Financial debt and lease liabilities million EUR 6,397 6,018 379
Cash and cash equivalents million EUR 512 657 –146
1 Key operating and return figures refer to the respective reporting period.2 Return on invested capital (ROIC) is calculated as the ratio between operating profit after tax (NOPAT) and invested
capital (total assets excluding cash and cash equivalents less liabilities excluding financial liabilities and lease obligations). The ratio is calculated on an annualised basis and in US dollars.
For computational reasons, rounding differences may occur in some of the tables and charts of this financial report.
Note: Due to the first-time application of IFRS 16 “Leases” as at January 1, 2019, the figures regarding the group earnings, financial and net asset positions for the financial year 2019 are only comparable with the previous year to a limited extent. Unless stated otherwise, prior-year figures refer to the regulations for leasing agreements in accordance with IAS 17.
Due to the adjustment of the structure of the consolidated income statement, the items in the consolidated income statement have changed. The comparability of the previous year’s values are thus limited. For a better comparability with the current reporting period, the previous year’s values have been adjusted, see also chapter “Change of presentation in the consolidated income statement” in the Notes to the consolidated financial statements
Disclaimer: This annual report contains statements concerning future developments at Hapag-Lloyd. Due to market fluctuations, the development of the competitive situation, world market prices for commodities, and changes in exchange rates and the economic environment, the actual results may differ considerably from these forecasts. Hapag-Lloyd neither intends nor undertakes to update forward-looking statements to adjust them for events or developments which occur after the date of this report.
This report was published on 20 March 2020.
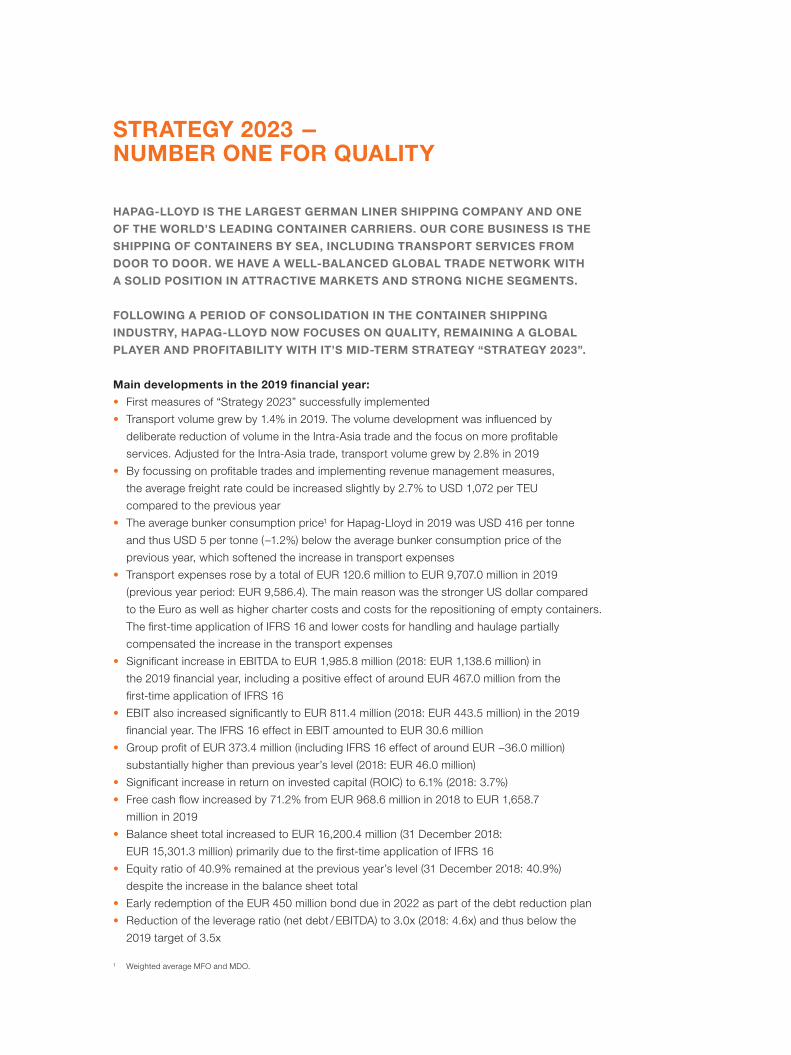
STRATEGY 2023 - NUMBER ONE FOR QUALITY
HAPAG-LLOYD IS THE LARGEST GERMAN LINER SHIPPING COMPANY AND ONE
OF THE WORLD’S LEADING CONTAINER CARRIERS. OUR CORE BUSINESS IS THE
SHIPPING OF CONTAINERS BY SEA, INCLUDING TRANSPORT SERVICES FROM
DOOR TO DOOR. WE HAVE A WELL-BALANCED GLOBAL TRADE NETWORK WITH
A SOLID POSITION IN ATTRACTIVE MARKETS AND STRONG NICHE SEGMENTS.
FOLLOWING A PERIOD OF CONSOLIDATION IN THE CONTAINER SHIPPING
INDUSTRY, HAPAG-LLOYD NOW FOCUSES ON QUALITY, REMAINING A GLOBAL
PLAYER AND PROFITABILITY WITH IT’S MID-TERM STRATEGY “STRATEGY 2023”.
Main developments in the 2019 financial year:
• First measures of “Strategy 2023” successfully implemented
• Transport volume grew by 1.4% in 2019. The volume development was influenced by
deliberate reduction of volume in the Intra-Asia trade and the focus on more profitable
services. Adjusted for the Intra-Asia trade, transport volume grew by 2.8% in 2019
• By focussing on profitable trades and implementing revenue management measures,
the average freight rate could be increased slightly by 2.7% to USD 1,072 per TEU
compared to the previous year
• The average bunker consumption price1 for Hapag-Lloyd in 2019 was USD 416 per tonne
and thus USD 5 per tonne (-1.2%) below the average bunker consumption price of the
previous year, which softened the increase in transport expenses
• Transport expenses rose by a total of EUR 120.6 million to EUR 9,707.0 million in 2019
(previous year period: EUR 9,586.4). The main reason was the stronger US dollar compared
to the Euro as well as higher charter costs and costs for the repositioning of empty containers.
The first-time application of IFRS 16 and lower costs for handling and haulage partially
compensated the increase in the transport expenses
• Significant increase in EBITDA to EUR 1,985.8 million (2018: EUR 1,138.6 million) in
the 2019 financial year, including a positive effect of around EUR 467.0 million from the
first-time application of IFRS 16
• EBIT also increased significantly to EUR 811.4 million (2018: EUR 443.5 million) in the 2019
financial year. The IFRS 16 effect in EBIT amounted to EUR 30.6 million
• Group profit of EUR 373.4 million (including IFRS 16 effect of around EUR -36.0 million)
substantially higher than previous year’s level (2018: EUR 46.0 million)
• Significant increase in return on invested capital (ROIC) to 6.1% (2018: 3.7%)
• Free cash flow increased by 71.2% from EUR 968.6 million in 2018 to EUR 1,658.7
million in 2019
• Balance sheet total increased to EUR 16,200.4 million (31 December 2018:
EUR 15,301.3 million) primarily due to the first-time application of IFRS 16
• Equity ratio of 40.9% remained at the previous year’s level (31 December 2018: 40.9%)
despite the increase in the balance sheet total
• Early redemption of the EUR 450 million bond due in 2022 as part of the debt reduction plan
• Reduction of the leverage ratio (net debt / EBITDA) to 3.0x (2018: 4.6x) and thus below the
2019 target of 3.5x
1 Weighted average MFO and MDO.

CONTENTS
4 INTERVIEW WITH CEO ROLF HABBEN JANSEN
8 REPORT OF THE SUPERVISORY BOARD
19 CORPORATE GOVERNANCE
38 STRATEGY 2023
50 COMBINED MANAGEMENT REPORT
150 CONSOLIDATED FINANCIAL STATEMENTS
262 RESPONSIBILITY STATEMENT
263 INDEPENDENT AUDITOR’S REPORT
274 FINANCIAL CALENDAR
275 IMPRINT
3
H a p a g - L L o y d a g I a n n u a L R e p o R t 2 0 1 9

INTERVIEW WITH CEO ROLF HABBEN JANSEN
HEIKO HOFFMANN, HEAD OF INVESTOR RELATIONS, TALKS TO
THE HAPAG-LLOYD AG CHIEF EXECUTIVE OFFICER ABOUT THE
YEAR 2019 BUSINESS DEVELOPMENT.
Heiko Hoffmann: What is your overall view of the year 2019?
Rolf Habben Jansen: In 2019 we faced quite some geopolitical tensions, more trade
restrictions and trade growth was modest. Even so, we enjoyed financially one of the best years
in our history, as we benefited from higher transport volumes and better freight rates, and we
kept a close eye on our costs. Overall, we have made very good progress with the implemen-
tation of our Strategy 2023, and we have achieved a Group net result that is well above the
prior-year result.
Rolf Habben Jansen Chief Executive Officer
4 I n t e R v I e w w I t H C e o R o L f H a b b e n J a n s e n
H a p a g - L L o y d a g I a n n u a L R e p o R t 2 0 1 9

How has the market environment developed?
Although the global economy tended to slow in 2019, it still grew by nearly 3%. In contrast, the
volume of global trade – which is important for the demand for container transports – only grew
by roughly 1% in the same period. Nevertheless, we increased our transport volume by 1.4%
and focused on more profitable trade lanes at the same time. The latter is also reflected in the
positive development of our average freight rate. What’s more, lower bunker prices resulted in
lower transport expenses, even if they were above the prior-year level particularly due to a
stronger US dollar.
What strategic progress did you make in the year covered by this report?
Our Strategy 2023 comprises three main strategic goals: we want, first, to become the number
one for quality in our industry, second, to remain a global player with a global market share
(excluding Intra-Asia) of roughly 10%, and third, to be profitable across the cycle and achieve a
return that enables us to cover our capital costs. To improve our service quality, we have defined
Quality Promises and associated goals that our customers will be able to use to transparently
measure how we deliver on them. Furthermore, we have opened several Quality Service Centers,
which will allow us to deliver a more consistent level of service quality to our customers. In 2019,
almost 1 million TEU were booked via our Web Channel – a great success! We expanded our
business in profitable niches such as reefer and special containers, and we have launched new
Heiko HoffmannHead of Investor Relations
5I n t e R v I e w w I t H C e o R o L f H a b b e n J a n s e n
H a p a g - L L o y d a g I a n n u a L R e p o R t 2 0 1 9
liner services in growth markets, for example in India and Africa. This allowed us to grow with the
market and retain our global market share (excluding Intra-Asia) of around 10%. Financially, we
have lowered our debt excluding IFRS 16 effects by more than EUR 800 million, thereby further
reduced our financing costs in the second half of the year. Our operating result was up with
about 80% compared to the previous year and we came significantly closer to earning our cap-
ital costs.
Which cost savings did you achieve in 2019?
We have achieved cost savings since we launched our Strategy 2023 in the mid three-digit
million range. This means that we have already realised a large part of our planned savings of
USD 350 to 400 million per year. For this reason, we have decided to explore more potential
opportunities for cost savings, which are building on existing successful initiatives. We are taking
a very close look at this right now, and we will definitively be able to tell you more about it over
the course of 2020.
Regarding the IMO 2020 requirements, how did the switch to low-sulphur
fuel oil go and who will bear the associated costs?
We prepared our vessels in good time and converted our fleet to use the new low-sulphur fuels
right on time for 1 January 2020. With an assumed price difference of USD 250 per tonne com-
pared to conventional fuels with a higher sulphur content, we initially expect additional costs of
roughly USD 1 billion per year. We have to pass the higher fuel prices and the operating costs
resulting from the switchover on to our customers. Most of them have understood very clearly
that we cannot bear these costs by ourselves, and that we will both have to contribute to making
maritime transport more sustainable.
Honestly speaking, how satisfied are you with the price developments of
Hapag-Lloyd shares, and will there be a dividend?
The price of our shares jumped quite a lot last year, but given the small free float one should not
overrate this. At the same time, the interest in our share was certainly also driven by market
participants’ expectations regarding Hapag-Lloyd’s future performance based on the company’s
positive performance the last years. Incidentally, our shareholders should also benefit from this,
which is why the Executive Board and the Supervisory Board will jointly propose to the Annual
General Meeting that a dividend of 1.10 euro per share be paid out.
6 I n t e R v I e w w I t H C e o R o L f H a b b e n J a n s e n
H a p a g - L L o y d a g I a n n u a L R e p o R t 2 0 1 9

Looking ahead, what do you think the rest of this year will be like?
The forecasts for global economic growth and the volume of international trade were, until
recently, higher for 2020 than they were for last year, which should result in more demand for
container transports. With a historically low orderbook, higher scrapping rates and rather moder-
ate growth in supply in the medium term, supply and demand will also remain fairly balanced. In
view of that, we would expect to see an improvement in the market environment. But our busi-
ness continues to be cyclical, and conditions in global markets can change very quickly – some-
thing we have just seen recently at the beginning of 2020 with the outbreak of the coronavirus,
which will certainly impact growth in 2020 even if the magnitude of it is very difficult to assess at
this moment. We got the year under review off to a good start with our Strategy 2023, and we
will continue along this path in the current year. We have set our course for quality, and our
employees at sea and on shore are working day after day to make Hapag-Lloyd even better and
more successful for our customers and for our owners. I would like to thank all of them most
sincerely for their cooperation and confidence.
Many thanks for the interview.
Rolf Habben Jansen Chief Executive Officer
7I n t e R v I e w w I t H C e o R o L f H a b b e n J a n s e n
H a p a g - L L o y d a g I a n n u a L R e p o R t 2 0 1 9

REPORT OF THE SUPERVISORY BOARD
Dear Shareholders,
In the 2019 financial year, the Supervisory Board of Hapag-Lloyd AG properly and conscien-
tiously performed all of the tasks for which it is responsible in accordance with the applicable
laws, articles of association and rules of procedure. The Supervisory Board monitored the
Executive Board as it managed the Company and diligently advised it on a regular basis. Its
main priority at all times was to protect the interests of Hapag-Lloyd AG, the primary operating
unit responsible for the Group’s performance.
Cooperation between the Supervisory Board and the Executive Board
In the last financial year, the Executive Board informed the Supervisory Board regularly, com-
prehensively and promptly about the competitive environment, the planned business policies,
all strategic and fundamental operating decisions and the risk management system. The Ex -
ecutive Board also discussed with the Supervisory Board the most important financial indicators
as a means of assessment for the Company’s economic position. The reports and discussions
focused on corporate planning, the implementation of “Hapag-Lloyd Strategy 2023”, fleet
planning and implications of the International Marine Organization’s new regulations to reduce
marine pollution which came into effect on 1 January 2020 (IMO 2020).
The Executive Board reported both orally and in writing to the Supervisory Board in its meetings,
providing full responses to all of the Supervisory Board’s questions. Outside of the meetings,
regular reports on the Group’s performance and on the most important transactions at Hapag-
Lloyd AG also ensured that the Supervisory Board was kept well informed. Furthermore, frequent
discussions on the current business took place between the Chairman of the Supervisory Board
and the Chief Executive Officer. As a result, the Supervisory Board was fully up to date at all
times. The reports by the Executive Board complied with legal requirements, the Supervisory
Board’s own requirements and the principles of good corporate governance.
The Executive Board involved the Supervisory Board at an early stage in decisions with a
significant influence on the position and performance of the Company. The Supervisory Board
thus monitored the Executive Board’s management of the Company at all times on the basis
of legality, correctness, appropriateness and viability.
8 R e p o R t o f t H e s u p e R v I s o R y b o a R d
H a p a g - L L o y d a g I a n n u a L R e p o R t 2 0 1 9

Meetings of the Supervisory Board and matters addressed
The Supervisory Board met 5 times in the reporting period. These meetings were held on
21 March 2019, 12 June 2019 (2 meetings), 11 September 2019 and 13 November 2019.
All members of the Supervisory Board attended all the Supervisory Board meetings and
more than 90% of the meetings of the committees which they were part of. The average
attendance rate was as follows:
• Meetings of the Supervisory Board: 100%
• Meetings of the Presidential and Personnel Committee: 100%
• Meetings of the Audit and Financial Committee: 94%
The Nomination Committee and the Mediation Committee did not meet in the reporting period.
Michael Behrendt (Chairman of the Supervisory Board)
9R e p o R t o f t H e s u p e R v I s o R y b o a R d
H a p a g - L L o y d a g I a n n u a L R e p o R t 2 0 1 9

Attendance of the Supervisory Board members in the 2019 financial year
Meeting Meetings by the Supervisory Board
Meetings by the Presidential and Personnel Committee
Meetings by the Audit and Financial Committee
Name
21.3
.201
9
12.6
.201
9 I
12.6
.201
9 II
11.9
.201
9
13.1
1.20
19
21.3
.201
9
11.9
.201
9
8.10
.201
9
13.1
1.20
19
20.3
.201
9
8.5.
2019
6.8.
2019
12.1
1.20
19
Albrecht ü ü ü ü ü
Alnowaiser ü ü ü ü ü ü ü ü
Al-Thani ü ü ü ü ü ü ü ü ü
Behrendt ü ü ü ü ü ü ü ü ü
Diekamp ü ü ü ü ü ü ü ü ü
Gehrt ü ü ü ü ü
Gernandt ü ü ü ü ü ü ü ü ü ü ü ü
Hasbún ü ü ü ü ü ü ü ü ü
Klemmt-Nissen ü ü ü ü ü ü ü ü ü ü ü ü ü
Kröger ü ü ü ü ü ü ü ü ü
Lipinski ü ü ü ü ü ü ü ü ü ü ü ü ü
Nieswand ü ü ü ü ü ü ü ü ü
Pérez ü ü ü ü ü ü ü ü ü
Schroeter ü ü ü ü ü ü ü ü ü ü ü ü ü
Schwiegers hausen-Güth ü ü ü ü ü
Zimmermann ü ü ü ü ü ü ü ü ü ü ü ü ü
ü Meeting attendance Did not attend the meeting
Was not a member of the Supervisory Board or the committee at the time of the meeting
Supervisory Board meeting on 21 March 2019
At the start of the meeting, the Supervisory Board welcomed Mr Felix Albrecht who was
appointed by Hamburg district court as a new member of the Supervisory Board with effect
from 11 March 2019 to replace Mr Joachim Kramer who retired from his position. In its meeting
on 21 March 2019, the Supervisory Board focused primarily on the annual financial statements.
Following its own review and the recommendation of the Audit and Financial Committee, it
approved the annual financial statements and management report as well as the consolidated
financial statements and Group management report for the 2018 financial year. The Supervisory
Board then approved the agenda for the Company’s Annual General Meeting on 12 June 2019
and adopted its resolution proposals for the agenda items. In particular, the Supervisory Board
decided to follow the recommendation of the Audit and Financial Committee regarding its pro-
posal for the selection of the external auditors of the annual and consolidated financial state-
ments. It also decided to propose to the Annual General Meeting that Mr Michael Behrendt be
10 R e p o R t o f t H e s u p e R v I s o R y b o a R d
H a p a g - L L o y d a g I a n n u a L R e p o R t 2 0 1 9
re-elected to the Supervisory Board as a shareholder representative since his term as Super-
visory Board member and Chairman of the Supervisory Board expired as scheduled at the end
of the 2019 Annual General Meeting. Furthermore, the Supervisory Board decided to propose to
the Annual General Meeting that a dividend be paid. The Supervisory Board also conducted a
review of the non-financial report prepared in accordance with Sections 289 b (3) and 315 b (3)
of the German Commercial Code (HGB). It adopted this report and then discussed the current
business.
The Supervisory Board passed a resolution outside of a meeting on 18 April 2019 to add
another resolution proposal to the agenda of the Annual General Meeting on 12 June 2019 to
amend Supervisory Board remuneration and modify the articles of association accordingly.
Supervisory Board meeting on 12 June 2019
Before the Annual General Meeting, the Supervisory Board decided to propose Mr Michael
Behrendt as a candidate for the position of Chairman of the Supervisory Board and announce
this to the shareholders in the event of his re-election as a member of the Supervisory Board by
the subsequent Annual General Meeting. Afterwards, the Supervisory Board obtained infor-
mation from the Executive Board about the current business and discussed this with the Exe-
cutive Board. The discussions also focused on the forecast results for the first and second
quarters of 2019 in light of the effects of the first-time application of IFRS 16 as well as cost-
saving targets for the remaining course of business. Fuel alternatives in relation to the new IMO
2020 were also discussed. The Supervisory Board also obtained an overview of the current
status of the process to implement ’Hapag-Lloyd Strategy 2023’. Finally, it focused on prepa-
rations for the Company’s Annual General Meeting, which took place afterwards.
At the Supervisory Board meeting after the Annual General Meeting, Mr Michael Behrendt was
re-elected as Chairman of the Supervisory Board. The Declaration of Conformity in relation to
the German Corporate Governance Code (GCGC) was then adopted.
Supervisory Board meeting on 11 September 2019
In its meeting on 11 September 2019, the Supervisory Board took stock of the Executive Board’s
report on the current business. The Executive Board reported in particular on the performance
factors of cost-cutting programmes and on progress with implementing ’Hapag-Lloyd Strategy
2023’. The remaining discussions focused on the second forecast for 2019 and fleet planning,
particularly in light of the new requirements relating to fuel qualities starting in 2020.
Supervisory Board meeting on 13 November 2019
At the start of the meeting, the Supervisory Board appointed Mr Mark Frese as a new Executive
Board member with effect from 25 November 2019 on the recommendation of the Presidential
and Personnel Committee. Mr Mark Frese succeeded Mr Nicolás Burr as Chief Financial Officer
(CFO), who stepped down on 29 February 2020. This meeting also focused on discussions
about the current business and the annual budget for 2020, including Hapag-Lloyd AG’s busi-
ness plan. The Executive Board gave a precise account of the corresponding planning and went
into detail on the underlying assumptions. On the recommendation of the Audit and Financial
Committee, the Supervisory Board approved the Executive Board’s annual budget for 2020.
11R e p o R t o f t H e s u p e R v I s o R y b o a R d
H a p a g - L L o y d a g I a n n u a L R e p o R t 2 0 1 9

Meetings of the committees and matters addressed
The work of the Supervisory Board was prepared and supported by its committees. The
following committees, with the members listed beside them, were active in the reporting year:
Presidential and Personnel Committee: Michael Behrendt (Chairman), Sheikh Ali bin
Jassim Al-Thani, Jutta Diekamp, Karl Gernandt, Dr Rainer Klemmt-Nissen, Arnold Lipinski,
Sabine Nieswand, José Francisco Pérez Mackenna, Klaus Schroeter, Uwe Zimmermann.
Audit and Financial Committee: Oscar Hasbún Martínez (Chairman), Turqi Alnowaiser,
Karl Gernandt, Dr Rainer Klemmt-Nissen, Annabell Kröger, Arnold Lipinski, Klaus Schroeter,
Uwe Zimmermann.
Mediation Committee pursuant to Section 27 (3) of the German Co-Determination
Act (MitbestG): Michael Behrendt (Chairman), Jutta Diekamp, José Francisco Pérez Mackenna,
Klaus Schroeter.
Nomination Committee: Michael Behrendt (Chairman), Sheikh Ali bin Jassim Al-Thani,
Karl Gernandt, Dr Rainer Klemmt-Nissen, José Francisco Pérez Mackenna.
The responsibilities assigned to these committees are described in detail in the joint Corporate
Governance Report of the Executive Board and the Supervisory Board (Corporate Governance
Report).
The Presidential and Personnel Committee met four times in 2019, on 21 March 2019,
11 September 2019, 8 October 2019 and 13 November 2019. Besides discussing the prepa-
rations for the Supervisory Board’s plenary session on 21 March 2019, the Presidential and
Personnel Committee also focused on the amendment of Supervisory Board remuneration.
In its meeting on 8 October, the Presidential and Personnel Committee dealt in detail with
the appointment of a new CFO, with the position set to become vacant on 1 March 2020. It
decided to recommend to the Supervisory Board that Mr Mark Frese be appointed as a new
Executive Board member and CFO.
The Audit and Financial Committee convened 4 meetings in the financial year 2019.
In the meeting on 20 March 2019, the discussions centred on issues relating to the annual
financial statements, including the external auditors’ report on the annual and consolidated
financial statements for the 2018 financial year (see also “Annual and consolidated financial
statements 2018” in the 2018 annual report). The dependency report and the proposal for
the selection of the external auditors were discussed, and a corresponding proposal to the
Super visory Board was passed (see also “Review of the report by the Executive Board on
relationships with affiliated companies” in the 2018 annual report). The Audit and Financial
Committee also dealt with the implications of the first-time application of IFRS 16 on the 2019
budget as well as with cost-saving targets and fleet planning.
12 R e p o R t o f t H e s u p e R v I s o R y b o a R d
H a p a g - L L o y d a g I a n n u a L R e p o R t 2 0 1 9

The second meeting on 8 May 2019 was dominated by a discussion on the financial report
for the first quarter and the forecast for the second quarter, the internal control and risk
management system (ICS) and the Group’s risk situation.
In the meeting on 6 August 2019, the discussion centred on the half-year financial report and the
forecast for the second half. The Audit and Financial Committee also dealt with the report by the
Corporate Audit department and the report regarding the Group’s hedging transactions.
In the fourth meeting on 12 November 2019, the focus was on the presented 2020 annual
budget, including Hapag-Lloyd AG’s business plan. The committee discussed the targets and
measures with the Executive Board in detail and decided to recommend that the Supervisory
Board approve the Executive Board’s planning. The financial report for the third quarter was
also discussed, as were the audit focal points in the external audit.
The Mediation Committee and the Nomination Committee did not meet in the
reporting period.
Personnel changes in the Supervisory Board and the Executive Board
Mr Joachim Kramer, the employee representative on the Supervisory Board, retired from the
Company on 28 February 2019. Hamburg district court appointed Mr Felix Albrecht as the
Supervisory Board’s new representative for employees with effect from 11 March 2019.
According to a resolution of the Supervisory Board on 17 December 2018, Dr Maximilian
Rothkopf was appointed as a new Executive Board member with effect from 1 May 2019. As
the new Chief Operating Officer (COO), Dr Maximilian Rothkopf succeeded Anthony J. Firmin,
who stepped down from the Executive Board on 30 June 2019.
Mr Mark Frese was appointed as a new Executive Board member with effect from 25 November
2019 as per a resolution passed by the Supervisory Board on 13 November 2019. Mr Mark Frese
succeeded Mr Nicolás Burr as CFO, who stepped down on 29 February 2020.
Corporate governance
The Supervisory Board is committed to the principles of good corporate governance and main-
tained a continuous focus on these principles in the 2019 financial year. One key element of this
is the recognition of the provisions of the German Corporate Governance Code (GCGC) as
amended on 7 February 2017 (since the announcement on 24 April 2017 and in the corrected
version dated 19 May 2017). This does not preclude a deviation from the recommendations of
the code in certain justified cases. As a listed company, Hapag-Lloyd AG is required to issue a
statement in accordance with Section 161 of the German Stock Corporation Act (AktG) indicat-
ing the extent to which it has complied and is complying with the recommendations of the GCGC
or which recommendations it has not followed or is not following, and to provide reasons for
deviating from recommendations (Declaration of Conformity). In June 2019, the Executive Board
and Supervisory Board issued a Declaration of Conformity, which is available on the Company’s
website. Further details on corporate governance can be found in the joint Corporate Govern-
ance Report of the Executive Board and the Supervisory Board (Corporate Governance Report).
13R e p o R t o f t H e s u p e R v I s o R y b o a R d
H a p a g - L L o y d a g I a n n u a L R e p o R t 2 0 1 9

The Supervisory Board members of Hapag-Lloyd AG are required to disclose any conflicts of
interest to the Supervisory Board, in particular those which may occur as a result of providing
advisory or consulting services to customers, suppliers, lenders or other third parties or holding
positions on their corporate bodies. In line with the GCGC’s recommendation, the Supervisory
Board will outline any conflicts of interest that occurred and how they were dealt with in its
report to the Annual General Meeting. There were no indications of actual or potential conflicts
of interest in the 2019 financial year.
Audit of the 2019 annual and consolidated financial statements
The Executive Board submitted the annual financial statements, the consolidated financial
statements and the combined management report of Hapag-Lloyd AG and the proposal on
the appropriation of profits to the Supervisory Board within the specified time.
KPMG AG Wirtschaftsprüfungsgesellschaft, Hamburg, audited the annual financial statements as
at 31 December 2019 prepared by the Executive Board in accordance with the provisions of the
German Commercial Code (HGB), the consolidated financial statements prepared in accordance
with Section 315 e HGB on the basis of the International Financial Reporting Standards (IFRS), as
applicable in the European Union, as well as the combined management report and issued each
of them with an unqualified auditor’s opinion.
Before the Audit and Financial Committee made a decision on its recommendation to the Super-
visory Board regarding the proposal of the external auditors to the Annual General Meeting, the
external auditors declared that there were no business, financial, personal or other relationships
between the auditors, their corporate bodies and their lead auditors on one side and the Com-
pany and the members of its corporate bodies on the other side that could raise doubts about
the auditors’ independence. This declaration also disclosed the extent to which other services
had been provided to the Company in the previous financial year or contractually agreed for the
following year. Within this context, the Audit and Financial Committee verified and confirmed that
the required independence exists. The Supervisory Board was informed of the result of this veri-
fication process before making its decision on the proposal of the external auditors to the Annual
General Meeting.
The audit engagement for the annual financial statements of the Company and the Group was
awarded by the Chairman of the Supervisory Board’s Audit and Financial Committee in accord-
ance with the resolution of the Annual General Meeting on 12 June 2019.
The documents relating to the annual and consolidated financial statements and the appropri-
ation of profits were examined and discussed at length at the meeting of the Audit and Financial
Committee on 18 March 2020 in preparation for the audit and the handling of these documents
by the Supervisory Board in the presence of the external auditors, who gave an account of the
results of their audit, and in the presence of the Executive Board; this included questions to the
external auditors regarding the manner and scope of the audit as well as the audit result. As a
result, the Audit and Financial Committee was convinced of the correctness of the audit and the
audit report. In particular, it was also satisfied that the audit report – as well as the audit
14 R e p o R t o f t H e s u p e R v I s o R y b o a R d
H a p a g - L L o y d a g I a n n u a L R e p o R t 2 0 1 9

performed by the external auditors themselves – complied with all legal requirements. Within
this context, the external auditors also confirmed to the Audit and Financial Committee that no
circumstances existed which would lead to concerns about their impartiality. Furthermore, the
Audit and Financial Committee obtained a report from the external auditors on the audit of the
risk early-warning system. The external auditors stated that the Executive Board had taken the
measures required under Section 91 (2) of the German Stock Corporation Act (AktG) regarding
the establishment of a risk early-warning system in a suitable form and that the risk early-warning
system was suitable for identifying at an early stage any developments that would endanger
the existence of the Company. The Audit and Financial Committee agrees with this assessment.
The Audit and Financial Committee made a recommendation to the Supervisory Board to
acknowledge and approve the result of the audit performed by the external auditors, and since
it had no objections of its own to the documents for the annual financial statements and con-
solidated financial statements along with the combined management report submitted by the
Executive Board, to approve the annual financial statements, the consolidated financial state-
ments and combined management report.
The aforementioned financial statement documents, the Executive Board’s proposal on the
appropriation of profits and the audit reports of the external auditors were provided to all
members of the Supervisory Board in time to prepare for the Supervisory Board’s meeting on
19 March 2020.
In its meeting on 19 March 2020, the Supervisory Board discussed the results of the audit per-
formed by the external auditors and the recommendation of the Audit and Financial Committee
and conducted its own in-depth review of them after the Executive Board had explained the
documents submitted. This meeting was also attended by the external auditors, who reported
on the main results of their audit and answered questions from the Supervisory Board about
the manner and scope of the audit and the audit results. The discussion also included the risk
early-warning system. The Supervisory Board agrees with the Audit and Financial Committee’s
understanding of the effectiveness of this system. It also obtained a report from the Audit and
Financial Committee on its monitoring of the external auditors’ independence, taking into
account the non-audit services provided, and its assessment that the external auditors continue
to have the necessary independence. The Supervisory Board fully observed its increased moni-
toring duties, in particular with regard to the independence of the external auditors, using its
corresponding guideline for the approval of non-audit services provided by the external auditors.
The Supervisory Board was satisfied that the external auditors had correctly performed the audit
and that both the audit and the audit reports complied with the legal requirements. Following its
own thorough review of the annual financial statements, the consolidated financial statements
and the combined management report (including the declaration on corporate governance), the
Supervisory Board declares that it has no objections to the annual financial statements and con-
solidated financial statements or the combined management report. Following the recommen-
dation of the Audit and Financial Committee, the Supervisory Board acknowledged and agreed
with the external auditors’ findings. The Supervisory Board therefore approved the annual finan-
cial statements and the consolidated financial statements in its meeting on 19 March 2020. The
annual financial statements of Hapag-Lloyd AG have thereby been adopted. The Supervisory
15R e p o R t o f t H e s u p e R v I s o R y b o a R d
H a p a g - L L o y d a g I a n n u a L R e p o R t 2 0 1 9

Board agrees with the Executive Board’s assessment of the state of the Company and the Group
as expressed in the combined management report. The Supervisory Board discussed the
Execu tive Board’s proposal on the appropriation of profits, which includes a dividend of EUR 1.10
per dividend-eligible share, from the perspectives of the dividend policy and the shareholders’
interests. The remaining retained earnings of EUR 238.4 million will be carried forward to the
sub sequent year. The Supervisory Board concurred with the Executive Board’s proposal on
the appropriation of profits on 19 March 2020.
Review of the Executive Board report on relationships with affiliates
The Executive Board submitted its report on relationships with affiliated companies in the
2019 financial year (dependency report) to the Supervisory Board in a timely manner.
The external auditors audited the dependency report and issued the following unqualified
auditor’s opinion:
“Following our mandatory audit and assessment, we hereby confirm that:
1. the actual disclosures in this report are accurate,
2. the payments made by the Company for the legal transactions detailed
in the report were not unreasonably high.”
The audit report of the external auditors was also submitted to the Supervisory Board.
The dependency report and the corresponding audit report were sent to all members of the
Super visory Board in a timely manner to enable them to prepare for the discussions in the
Supervisory Board meeting on 19 March 2020.
In preparation for the Supervisory Board’s review and decision-making process, the Audit and
Financial Committee assessed the aforementioned documents in detail. The members of the
Executive Board explained the dependency report to the Audit and Financial Committee in detail
in its meeting on 18 March 2020. They also answered questions from committee members. The
meeting was also attended by the external auditors, who reported on their audit, in particular
their audit focal points and the main results of their audit, and explained their audit report. The
members of the Audit and Financial Committee took note of the audit report and the auditor’s
opinion, critically examined them, and discussed these documents as well as the audit itself with
the external auditors. This included questions about the manner and scope of the audit and the
audit results. Consequently, the Audit and Financial Committee was able to satisfy itself of the
correctness of the audit and the audit report. In particular, it was satisfied that the audit report –
as well as the audit performed by the external auditors themselves – complied with all legal
requirements. The Audit and Financial Committee made a recommendation to the Supervisory
Board to approve the result of the audit performed by the external auditors, and since it has no
objections to the Executive Board’s statement on the dependency report, to decide on a corre-
sponding assessment.
16 R e p o R t o f t H e s u p e R v I s o R y b o a R d
H a p a g - L L o y d a g I a n n u a L R e p o R t 2 0 1 9
The Supervisory Board performed the final review in its meeting on 19 March 2020, taking into
consideration the resolution and recommendation of the Audit and Financial Committee as well
as the audit report of the external auditors. The Executive Board explained the dependency
report in this meeting and answered questions from Supervisory Board members. The external
auditors also attended this meeting, reported on their audit of the dependency report and their
main audit results, explained their audit report, and answered questions from Supervisory Board
members, in particular regarding the manner and scope of the dependency report audit and the
audit results. Based on this, the Supervisory Board reviewed the legal transactions detailed in
the report on the relationships with affiliates to determine whether the payments made by the
Company were not unreasonably high in consideration of the circumstances that were known at
the time they were made or whether disadvantages had been offset. To enable this, the Super-
visory Board obtained an explanation of the most important legal transactions, which formed the
basis for the payments made by the Company and the services received in return. In doing so,
and on the basis of the report provided by the Audit and Financial Committee, the Supervisory
Board was convinced of the correctness of the dependency report audit and the audit report. In
particular, it was satisfied that the audit report – as well as the audit performed by the external
auditors themselves – complied with all legal requirements. The Supervisory Board reviewed the
dependency report with regard to its accuracy in particular and also verified that the affiliates
were identified with the necessary diligence and that all precautions necessary for recording
legal transactions and measures which are subject to reporting requirements were taken. This
review did not identify any reasons for objections to the dependency report. Following the rec-
ommendation of the Audit and Financial Committee, the Supervisory Board agreed with the
result of the dependency report audit by the external auditors. Based on the final results of the
Supervisory Board’s own review of the dependency report, there are no objections to the Ex -
ecutive Board’s statement on the dependency report.
The Supervisory Board thus performed its own review of the Executive Board’s dependency
report and the external auditors’ audit report.
Audit of the non-financial report 2019
The Executive Board submitted the separate non-financial report of Hapag-Lloyd AG to the
members of the Supervisory Board in good time for them to prepare their own audit. The Super-
visory Board commissioned an external audit of the content of the non-financial report within the
context of obtaining limited assurance. PricewaterhouseCoopers GmbH Wirtschaftsprüfungs-
gesellschaft, Frankfurt, performed an external audit of the content of the non-financial report in
accordance with the International Standard on Assurance Engagements (ISAE) 3000 (Revised)
within the context of providing limited assurance and issued an unqualified auditor’s opinion.
After conducting its own independent review of the non-financial report 2019, the Supervisory
Board raised no objections.
17R e p o R t o f t H e s u p e R v I s o R y b o a R d
H a p a g - L L o y d a g I a n n u a L R e p o R t 2 0 1 9

In its meeting on 19 March 2020, the Supervisory Board addressed the result of the audit of the
non-financial report and conducted its own in-depth review of it after the Executive Board had
explained the documents submitted and in the presence of the auditors, who gave an account
of the results of their audit. Consequently, the Supervisory Board was able to satisfy itself of the
correctness of the audit and the audit report. It thus acknowledged and agreed with the auditors’
findings and adopted the non-financial report in its meeting on 19 March 2020.
At the same meeting, the Supervisory Board also awarded the audit engagement for the non-
financial report for the current financial year to PricewaterhouseCoopers GmbH.
Acknowledgement
We would like to sincerely thank the Executive Board and all employees of the Hapag-Lloyd
Group for the services rendered in the last financial year and their great personal commitment
shown.
Adoption of the report
The Supervisory Board adopted this report by a resolution on 19 March 2020 in accordance
with Section 171 (2) AktG.
Hamburg, 19 March 2020
For the Supervisory Board
Michael Behrendt
(Chairman of the Supervisory Board)
18 R e p o R t o f t H e s u p e R v I s o R y b o a R d
H a p a g - L L o y d a g I a n n u a L R e p o R t 2 0 1 9
CORPORATE GOVERNANCE
PRINCIPLES OF CORPORATE GOVERNANCE AND CORPORATE STRUCTURE
Corporate governance comprises all principles relating to the management and monitoring of a
company. Within this meaning, corporate governance is an expression of good and responsible
corporate management and, as such, is an integral part of Hapag-Lloyd’s management philoso-
phy. The principles of corporate governance pertain, in particular, to cooperation within the Ex -
ecutive Board, the Supervisory Board, and between the two boards as well as between the
corporate bodies and the shareholders, in particular in the Annual General Meeting. They also
pertain to the relationship between the Company and other persons and institutions that have
a business relationship with Hapag-Lloyd.
Commitment to the German Corporate Governance Code
Hapag-Lloyd AG is a listed corporation in accordance with German law. For Hapag-Lloyd, the
starting point for ensuring responsible management and control of the Company that is geared
towards sustainable appreciation is, in addition to compliance with the applicable laws, a com-
mitment to the German Corporate Governance Code (GCGC).
The Executive Board and Supervisory Board of Hapag-Lloyd AG have given a great deal of
attention to the corporate governance system of the Company and the recommendations and
suggestions of the Code. The Executive Board and Supervisory Board are committed to respon-
sible corporate governance and identify with the objectives of the GCGC. According to the
preamble of the GCGC, in the interests of good corporate management and an active corporate
governance culture, this does not preclude non-compliance with individual provisions of the
code if the deviations are justified due to the specifics of the Company.
INFORMATION ON CORPORATE MANAGEMENT AND CORPORATE GOVERNANCE
Declaration of conformity with the German Corporate Governance Code
pursuant to Section 161 of the German Stock Corporation Act (AktG)
Section 161 of the German Stock Corporation Act (AktG) requires the Executive Board and
Supervisory Board of Hapag-Lloyd AG to issue an annual statement indicating that the recom-
mendations by the German Corporate Governance Code Commission, published by the Ger-
man Federal Ministry of Justice and Consumer Protection in the official section of the Federal
Gazette (Bundesanzeiger) were and are being complied with, or which recommendations were
not or are not being followed and why. The statement must be made permanently available to
the public on the Company’s website.
19C o R p o R a t e g o v e R n a n C e
H a p a g - L L o y d a g I a n n u a L R e p o R t 2 0 1 9

Statement by the Executive Board and the Supervisory Board of
Hapag-Lloyd Aktiengesellschaft on the recommendations of the German
Corporate Governance Code Commission pursuant to Section 161 of
the German Stock Corporation Act (AktG)
The Executive Board and the Supervisory Board of Hapag-Lloyd Aktiengesellschaft hereby
declare that the Company has, since its last Declaration of Conformity on 10 July 2018, com-
plied with the recommendations of the German Corporate Governance Code Commission in
the version of 7 February 2017 and published in the official section of the Federal Gazette
(Bundesanzeiger) on 24 April 2017 with the following exception.
No. 5.3.2 sentence 5 of the German Corporate Governance Code in the version of
7 February 2017 (published on 24 April 2017 and published in its corrected version on
19 May 2017, GCGC) provides, inter alia, the recommendation that the chairman of the
Audit and Financial Committee shall be independent. Currently, Oscar Hasbún Martínez
is the chairman of the Audit and Financial Committee. Mr Hasbún Martínez is at the
same time CEO of a direct main shareholder of Hapag-Lloyd AG. Therefore, within the
meaning of no. 5.3.2 sentence 5 GCGC, Mr Hasbún Martínez lacks the required inde-
pendence. To the conviction of the Supervisory Board, the exercise of the office as
chairman of the Audit and Financial Committee by Mr Hasbún Martínez is in the best
interest of the Company and its entire shareholders, since Mr Hasbún Martínez is per-
fectly suited as chairman of the Audit and Financial Committee. It is not doubtful that
he is fact serves independently.
Hamburg, 12 June 2019
Executive Board and Supervisory Board
Hapag-Lloyd Aktiengesellschaft
In addition to compliance with the accepted principles of good corporate management,
Hapag-Lloyd’s own guidelines and standards for good and sustainable corporate development
contribute to the good and sustainable development of the Company as well.
In 2010, Hapag-Lloyd introduced a Code of Ethics which expresses Hapag-Lloyd’s commitment
to law-abiding, sustainable conduct that expresses integrity as well as social responsibility.
The Code of Ethics is intended to serve employees as a guideline in performing their respon-
sibilities and defines the basic values of the Company. It serves, in particular, as a guideline on
how to treat customers, suppliers and competitors fairly and also addresses conduct within
the Company.
Hapag-Lloyd believes that it is not only important that its employees are responsible and comply
with the high legal and ethical standards, but also views itself as a company that highly values
environmental protection, high quality standards, economic viability, and the health and safety
of its employees.
20 C o R p o R a t e g o v e R n a n C e
H a p a g - L L o y d a g I a n n u a L R e p o R t 2 0 1 9

This ethos is firmly anchored in the Company’s sustainability policy. The Company’s sustainability
policy can be found at www.hapag-lloyd.com/en/about-us/sustainability/at-a-glance.html
The significant importance of quality and environmental protection at Hapag-Lloyd is also
reflected in the globally applicable integrated quality and environmental management system
(ISO 9001 and 14001). Hapag-Lloyd uses this system to cover all the activities along its global
transportation chain. Detailed information about Hapag-Lloyd’s quality and environmental
protection programmes can be found at www.hapag-lloyd.com
Information on relevant corporate management practices
Corporate governance
Apart from the exception mentioned and justified in the Declaration of Conformity, the Company
follows the recommendations of the German Corporate Governance Code (see above).
Compliance
At Hapag-Lloyd, compliance has top priority, as do high quality standards, proactive environ-
mental protection and sustainability in management and all operational processes. The Company
expressly commits to fair competition as well as compliance with all national and international
laws that apply to Hapag-Lloyd, in particular with regard to corruption, bribery and price fixing.
Any internal or external violations of applicable law are strictly opposed and are not tolerated in
any way. Hapag-Lloyd will not accept any such legal violations under any circumstances and will
legally pursue them. Hapag-Lloyd has a Code of Ethics which clearly spells out the respective
conduct instructions (see above and below).
To prevent breaches of compliance, the Executive Board has implemented a range of measures
as part of the compliance management system. These include mandatory compliance training,
which every employee worldwide must complete, as well as a whistle-blower system, which
allows violations to be reported anonymously.
The compliance programme of Hapag-Lloyd AG, the implementation of which is seen to by
the compliance organisation, primarily consists of anti-competition and antitrust law, combating
corruption, and compliance with embargoes and sanctions.
Compliance organisation
The central Global Compliance team, which reports directly to the Chief Financial Officer of
Hapag-Lloyd AG, as well as the compliance officers in the regional centres and the national
affiliates ensure that the Hapag-Lloyd compliance programme is implemented across the Group,
for example through online and on-site training sessions. The Executive Board and the Super-
visory Board are regularly updated via compliance reports.
The compliance organisation of Hapag-Lloyd makes it possible to fundamentally implement
measures as part of the compliance programme which ensure that the Company complies with
laws and internal and external guidelines.
21C o R p o R a t e g o v e R n a n C e
H a p a g - L L o y d a g I a n n u a L R e p o R t 2 0 1 9

Compliance organisation
Code of Ethics
The Global Code of Ethics reflects the corporate culture of Hapag-Lloyd and defines the basic
values and expectations regarding the conduct of executives and employees, both with regard
to internal and external relationships. This code summarises the principles governing fair dealings
with each other as well as the customers and business partners of Hapag-Lloyd (see above).
Corporate responsibility
Hapag-Lloyd, with its long-standing tradition as a global company, bears a social responsibility
towards its customers, employees, investors and the general public. Hapag-Lloyd therefore
regards compliance with individual rights, laws and internal guidelines as the foundation of its
own corporate and economic activities. The global focus and strategy of profitable growth
require a common system of values and principles which serves as a code of conduct for all
employees.
Hapag-Lloyd’s compliance organisation helps to incorporate and permanently embed the
aforementioned values in the corporate structure. It ensures that the compliance programme
is implemented globally.
The aforementioned important documents that outline the approach of the Hapag-Lloyd Group
can be found online at https://www.hapag-lloyd.com/en/about-us.html
Global Compliance Team
Chief Compliance Officerthomas Mansfeld
Region Latin & North America
Areas & QSCLocal Compliance
Officers
Regional Compliance Officer
Region Asia
Areas & QSCLocal Compliance
Officers
Regional Compliance Officer
Corporate & Region North and
South Europe
AreasLocal Compliance
Officers
Global Compliance Team Hamburg
Region Middle East
Areas & QSCLocal Compliance
Officers
Regional Compliance Officer
Area Africa
Country Office
Area Compliance Officer
22 C o R p o R a t e g o v e R n a n C e
H a p a g - L L o y d a g I a n n u a L R e p o R t 2 0 1 9

Transparency
Informing the general public in a timely and consistent manner is an important element of good
corporate governance for Hapag-Lloyd. For this purpose, extensive information is available in
German and English on the Hapag-Lloyd website under Investor Relations.
A financial calendar provides a quick overview of the key publication dates.
The most up-to-date financial calendar is available at
https://www.hapag-lloyd.com/en/ir/calendar-events/financial-calendar.html
The business development of Hapag-Lloyd is explained in particular in the financial reports,
the annual report and investor relations presentations. In addition, details about Hapag-Lloyd’s
share and the terms and conditions of Hapag-Lloyd’s issued bond are available.
Mandatory publications under capital market law – such as ad-hoc notifications, voting right
notifications and information about managers’ transactions – are immediately posted on the
Investor Relations web page as well.
Explanations about the corporate strategy, shareholder structure and business model complete
the range of information provided.
Executive Board and Supervisory Board
The German Stock Corporation Act (AktG) is the legal basis of the corporate governance
of Hapag-Lloyd AG. It is further enhanced by the Company’s articles of association and the
provisions of the GCGC (see above).
The Executive Board manages the business of Hapag-Lloyd AG and represents the Company.
It manages the Company under its own responsibility for the benefit of the Company, i.e. taking
into consideration the interests of shareholders, its employees and all other groups associated
with the Company (stakeholders), and pursues the goal of sustainable value creation. It also
develops the corporate strategy and controls and manages its implementation. The Executive
Board ensures that the legal provisions and internal guidelines are complied with and that the
Group companies follow them (compliance). It has also implemented an effective internal control
and risk management system. It closely collaborates with the other corporate bodies for the
benefit of the Company.
The Supervisory Board has issued rules of procedure for the Executive Board. These rules
stipulate the division of responsibilities within the Executive Board and the transactions and
measures that require a resolution by the entire Executive Board. The rules of procedure
also include a list of transactions that may only be performed with the approval of the Super-
visory Board.
23C o R p o R a t e g o v e R n a n C e
H a p a g - L L o y d a g I a n n u a L R e p o R t 2 0 1 9
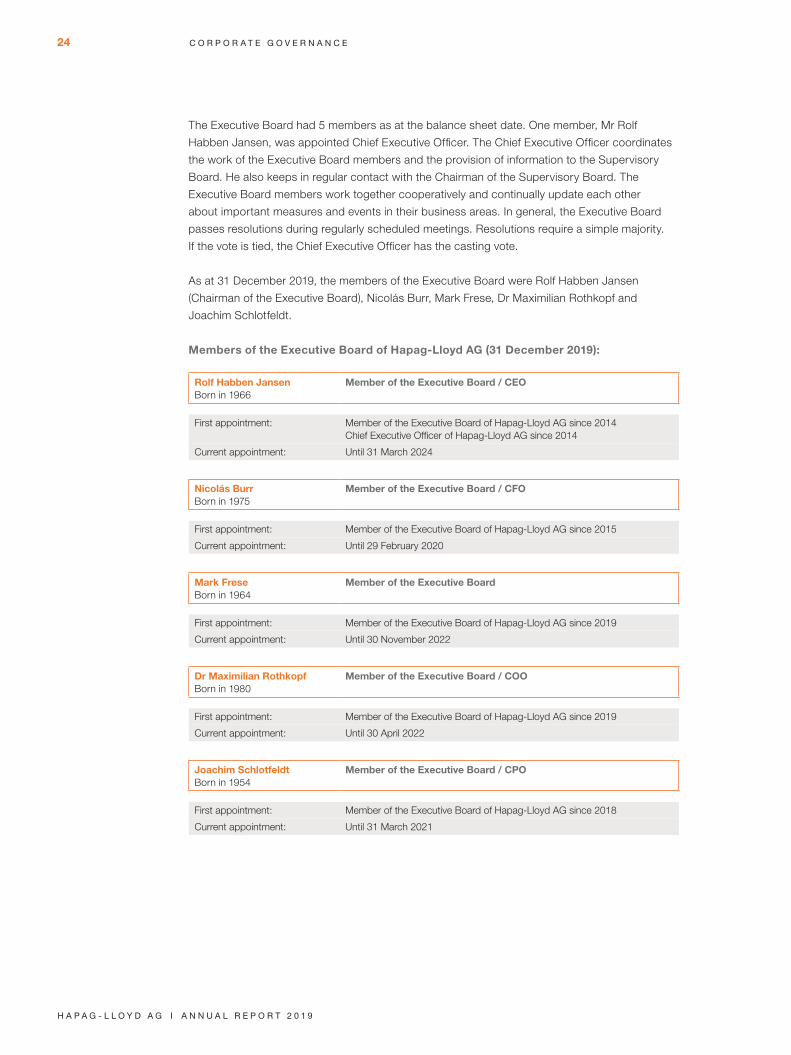
The Executive Board had 5 members as at the balance sheet date. One member, Mr Rolf
Habben Jansen, was appointed Chief Executive Officer. The Chief Executive Officer coordinates
the work of the Executive Board members and the provision of information to the Supervisory
Board. He also keeps in regular contact with the Chairman of the Supervisory Board. The
Executive Board members work together cooperatively and continually update each other
about important measures and events in their business areas. In general, the Executive Board
passes resolutions during regularly scheduled meetings. Resolutions require a simple majority.
If the vote is tied, the Chief Executive Officer has the casting vote.
As at 31 December 2019, the members of the Executive Board were Rolf Habben Jansen
(Chairman of the Executive Board), Nicolás Burr, Mark Frese, Dr Maximilian Rothkopf and
Joachim Schlotfeldt.
Members of the Executive Board of Hapag-Lloyd AG (31 December 2019):
Rolf Habben JansenBorn in 1966
Member of the Executive Board / CEO
First appointment: Member of the Executive Board of Hapag-Lloyd AG since 2014Chief Executive Officer of Hapag-Lloyd AG since 2014
Current appointment: Until 31 March 2024
Nicolás BurrBorn in 1975
Member of the Executive Board / CFO
First appointment: Member of the Executive Board of Hapag-Lloyd AG since 2015
Current appointment: Until 29 February 2020
Mark FreseBorn in 1964
Member of the Executive Board
First appointment: Member of the Executive Board of Hapag-Lloyd AG since 2019
Current appointment: Until 30 November 2022
Dr Maximilian RothkopfBorn in 1980
Member of the Executive Board / COO
First appointment: Member of the Executive Board of Hapag-Lloyd AG since 2019
Current appointment: Until 30 April 2022
Joachim SchlotfeldtBorn in 1954
Member of the Executive Board / CPO
First appointment: Member of the Executive Board of Hapag-Lloyd AG since 2018
Current appointment: Until 31 March 2021
24 C o R p o R a t e g o v e R n a n C e
H a p a g - L L o y d a g I a n n u a L R e p o R t 2 0 1 9
Up until his retirement on 30 June 2019, Mr Anthony J. Firmin was a member of the Executive
Board. According to a resolution of the Supervisory Board on 17 December 2018, Dr Maximilian
Rothkopf was appointed as a new Executive Board member with effect from 1 May 2019 and
succeeded Mr Anthony J. Firmin as the new COO.
According to a resolution of the Supervisory Board on 13 November 2019, Mr Mark Frese
was appointed as a new Executive Board member with effect from 25 November 2019. Mr Mark
Frese is the new CFO and succeeds Mr Nicolás Burr, who left the Company on 29 February 2020.
The Supervisory Board works with the Executive Board to ensure that there is long-term
succession planning for the Executive Board. When examining candidates for an Executive
Board position, the Supervisory Board believes that the key suitability criteria are the candi-
dates’ specialist qualifications for the position in question, leadership qualities, previous per-
formance and knowledge of the Company’s business model. The Supervisory Board has
adopted a diversity concept for the composition of the Executive Board that takes account of
the re commendations of the German Corporate Governance Code and ensures that diversity
is taken into consideration with regard to the composition of the Executive Board.
The diversity concept for the Executive Board comprises the following components:
• The target set by the Supervisory Board for the percentage of women on the Executive Board
in accordance with Section 111 (5) of the German Stock Corporation Act (AktG);
• Appointments as a member of the Executive Board should end one year after the member’s
65th birthday as a rule. However, this age will increase in line with changes to the regulatory
age limit in the statutory retirement pension system, and the Supervisory Board reserves the
right to make exceptions in individual cases;
• Executive Board members should have long-standing managerial experience and,
if possible, experience from a range of different professions;
• At least two Executive Board members should have international managerial experience;
• The Executive Board as a whole should have long-standing experience in the areas of
finance and human resource management.
The Executive Board and the Supervisory Board of Hapag-Lloyd AG work together closely and in
confidence for the benefit of the Company. The Executive Board and the Supervisory Board are
jointly responsible for ensuring that the Supervisory Board is provided with adequate information.
The Executive Board reports to the Supervisory Board pursuant to Section 90 of the German
Stock Corporation Act (AktG) and in accordance with the rules of procedure of the Supervisory
Board / Executive Board. It informs the Supervisory Board regularly, promptly and comprehen-
sively about all questions relevant to the Company and the Group relating to strategy, planning,
business development, the internal control and risk management system, and adherence to
compliance guidelines. If the course of business deviates from the set plans and objectives, the
Executive Board addresses this and provides reasons.
25C o R p o R a t e g o v e R n a n C e
H a p a g - L L o y d a g I a n n u a L R e p o R t 2 0 1 9
The Executive Board agrees the strategic orientation of the Company with the Supervisory
Board and they regularly discuss the status of the strategy implementation. Furthermore, the
Executive Board promptly submits to the Supervisory Board the transactions and measures
that require the approval of the Supervisory Board pursuant to the articles of association or
the rules of procedure of the Supervisory Board / Executive Board such as the Group’s annual
budget. In individual cases, the Supervisory Board may also make other transactions and
measures subject to its approval.
The Executive Board members must act in the interest of the Company. Members of the
Executive Board may not pursue personal interests in their decision-making or use for their
own advantage business opportunities that have arisen for the Company.
Executive Board members are subject to a comprehensive non-compete agreement while
working for the Company. They may only enter into other commitments, especially positions
on supervisory boards at companies that are not associated companies of Hapag-Lloyd AG,
with the approval of the Chairman of the Supervisory Board. If they do accept such offices with
the approval of the Chairman of the Supervisory Board, the Executive Board member in ques-
tion performs the role in a personal capacity – adhering to their strict obligation of confidentiality
and the strict separation of their activities as a member of the Company’s Executive Board.
Each Executive Board member is required to immediately disclose any conflict of interest to the
Chairman of the Supervisory Board and to inform the other Executive Board members as well.
No conflicts of interest arose among members of the Executive Board of Hapag-Lloyd AG in
the 2019 financial year.
All transactions between the Company or one of its Group companies on one side and the
Executive Board members and persons or undertakings close to them on the other side
must adhere to customary industry standards. There were no transactions of this type in the
reporting period.
Hapag-Lloyd AG has taken out pecuniary damage liability insurance (D&O insurance) for the
members of the Executive Board and the Supervisory Board. For the Executive Board members,
an excess of 10% of the damages up to 1.5 times the fixed annual remuneration of the Executive
Board member in question has been agreed. Finally, a D&O insurance policy is in place for the
members of the Supervisory Board. This covers statutory liability arising from their Supervisory
Board activities. In the event of a claim, an excess of 10% of the damages up to 1.5 times the
fixed annual remuneration of the Supervisory Board member is provided for.
The Supervisory Board of Hapag-Lloyd AG advises the Executive Board on the management of
the Company and monitors its business administration. It appoints the members of the Executive
Board and one of its members as the CEO. If necessary, it also removes members from the
Executive Board. It determines the remuneration of the Executive Board members. It reviews the
annual financial statements and the consolidated financial statements and is responsible for their
approval and adoption. It also reviews the Executive Board’s proposal on the appropriation of
profits as well as the respective management reports. The Supervisory Board has issued rules of
procedure that govern its work.
26 C o R p o R a t e g o v e R n a n C e
H a p a g - L L o y d a g I a n n u a L R e p o R t 2 0 1 9
The Executive Board requires the approval of the Supervisory Board for decisions of an impor-
tant and fundamental nature that are specified in a list of business transactions requiring
approval. These include, for example:
• The approval of the business plan and annual budget;
• Investments of over EUR 100 million, unless already included in the annual budget;
• Access to assets with a value of more than EUR 75 million, unless already included
in the annual budget;
• Legal transactions between the Company or a subsidiary of the Company and an
affiliated company within the meaning of Section 15 ff. of the German Stock Corporation
Act (AktG), insofar as these are not part of regular business operations or are not
conducted at arm’s length;
• Borrowing outside of the annual budget with an amount of more than EUR 75 million;
• Acceptance of sureties, guarantees or similar liabilities as well as the provision of collateral,
in each case for third-party liabilities outside of regular business operations, if the value in
individual cases exceeds EUR 2 million;
• Conclusion, amendment or termination of contracts with businesses within the meaning
of Sections 291 ff. of the German Stock Corporation Act (AktG) in which the Company has
an investment.
The Supervisory Board currently consists of 16 members.
The Supervisory Board is subject to the German Co-Determination Act (MitbestG). Accordingly,
the 8 representatives of the shareholders are generally elected by the Annual General Meeting
and the 8 representatives of the employees are elected in accordance with the provisions of the
German Co-Determination Act (MitbestG). As at the reporting date, 3 employee representatives
were court-appointed.
Each member of the Supervisory Board is required to act in the interest of the Company and may
not pursue personal interests in their decision-making or use for their own advantage business
opportunities that have arisen for the Company. Supervisory Board members must disclose any
conflict of interest to the Supervisory Board. This member is excluded from participating in reso-
lutions at Supervisory Board meetings involving the matter where the conflict of interest exists.
The Supervisory Board will outline any conflicts of interest that have arisen and how they were
dealt with in its report to the Annual General Meeting. If a Supervisory Board member has a con-
flict of interest which is significant and not just temporary, this should lead to the termination of
their position.
Any consulting agreements or other service agreements between a Supervisory Board member
and the Company require the approval of the Supervisory Board. There were no such agree-
ments or conflicts of interest among Supervisory Board members of Hapag-Lloyd AG in the 2019
financial year. The Supervisory Board has issued rules of procedure that also govern the forma-
tion and responsibilities of the committees. Two ordinary Supervisory Board meetings are held in
every calendar half-year. In addition, Supervisory Board meetings may be convened as needed
and / or resolutions passed by the Supervisory Board outside of meetings. If voting on the Super-
visory Board is tied and a second vote results in another tie, the Chairman of the Supervisory
Board has the casting vote.
27C o R p o R a t e g o v e R n a n C e
H a p a g - L L o y d a g I a n n u a L R e p o R t 2 0 1 9

Composition goals and diversity concept for the Supervisory Board
The composition of the Supervisory Board must ensure that the body as a whole has the neces-
sary knowledge, abilities and specialist experience to perform its roles properly. Each member of
the Supervisory Board must ensure that they have enough time to perform their Supervisory
Board role.
The Supervisory Board has set itself goals for its composition and drawn up a competence
profile for the body. Together with the statutory gender quota, these composition goals form
the diversity concept, which ensures that the body has a diverse composition. When proposing
resolutions to the Annual General Meeting for regular Supervisory Board elections and the
election of a new Supervisory Board member, the composition goals and the diversity concept
must be taken into consideration:
Goals for the composition of the Supervisory Board
The Supervisory Board has set the following goals for its composition:
• At least 1 seat on the Supervisory Board on the shareholder side for 1 person who
does not have any potential conflicts of interest and is independent within the meaning of
Section 5.4.2 GCGC;
• The Supervisory Board should not have more than 2 former members of the Executive Board
in accordance with Section 5.4.2 GCGC;
• In general, persons who have reached the age of 70 or who have been on the Supervisory
Board of the Company for more than 20 years at the time of the election should not be
considered for nomination.
28 C o R p o R a t e g o v e R n a n C e
H a p a g - L L o y d a g I a n n u a L R e p o R t 2 0 1 9
Competence profile for the supervisory board
The Supervisory Board has drawn up the following competence profile for itself:
• At least 2 Supervisory Board seats for individuals with in-depth knowledge and / or
experience of regions outside of Germany in which the Hapag-Lloyd Group conducts
a substantial volume of business, due to their background or professional experience
with an international relevance;
• At least 1 Supervisory Board seat for an individual who has expert knowledge within the
fields of accounting or auditing and is thus regarded as a financial expert in accordance with
Section 100 (5) of the German Stock Corporation Act (AktG);
• At least 2 Supervisory Board seats for individuals with in-depth knowledge of and
experience in the fields of risk management and controlling;
• At least 2 Supervisory Board seats for individuals with shipping sector knowledge;
• At least 2 Supervisory Board seats for individuals with experience in managing or
controlling a major company;
• At least 2 Supervisory Board seats for individuals with particular knowledge in the fields
of corporate governance and compliance;
• At least 2 Supervisory Board seats for individuals with particular knowledge of
human resources;
• At least 1 Supervisory Board seat for an individual with particular knowledge of
information technology or digitalisation.
diversity concept for the supervisory board
The diversity concept for the Supervisory Board comprises the following components:
• Goals for the composition of the Supervisory Board;
• Competence profile for the Supervisory Board;
• The gender quota of 30%, which is already legally required for the composition of the
Supervisory Board of Hapag-Lloyd AG in accordance with Section 96 (2) of the German
Stock Corporation Act (AktG) and must be complied with accordingly.
As per a self-assessment by the Supervisory Board, it conformed with these goals for its compo-
sition on the reporting date of 31 December 2019. In particular, the Supervisory Board fulfilled
the goal requiring that at least one representative on the shareholder side be independent within
the meaning of GCGC on the reporting date. In this regard, the Supervisory Board member
Ms Gehrt was classified as independent. The Supervisory Board and its Nomination Committee
will ensure that the objective continues to be fulfilled.
29C o R p o R a t e g o v e R n a n C e
H a p a g - L L o y d a g I a n n u a L R e p o R t 2 0 1 9
Members of the Supervisory Board of Hapag-Lloyd AG:
Michael Behrendt
(Chairman of the Supervisory Board)
Klaus Schroeter
Tariff Coordinator, Federal Division Transport,
ver.di – Vereinte Dienstleistungs gewerkschaft
(service workers’ union), Berlin
(First Deputy Chairman of the Supervisory
Board)
Karl Gernandt
Chairman of the Board of Directors
Kühne Holding AG, Schindellegi, Switzerland
(Second Deputy Chairman of the
Supervisory Board)
Felix Albrecht (since 11 March 2019)
Marine Works Council
Hapag-Lloyd AG, Hamburg
H. E. Sheikh Ali bin Jassim Al-Thani
Advisor to the CEO
Qatar Investment Authority, Qatar
Turqi Alnowaiser
Head of International Investments
Public Investment Fund, Kingdom of
Saudi Arabia
Jutta Diekamp
Marine Works Council
Hapag-Lloyd AG, Hamburg
Nicola Gehrt
Director
Head of Group Investor Relations
TUI Group, Hanover
Oscar Eduardo Hasbún Martínez
Chief Executive Officer
Compañía Sud Americana de Vapores S.A.,
Santiago de Chile, Chile
Dr Rainer Klemmt-Nissen
Former Managing Director, HGV Hamburger
Gesellschaft für Vermögens- und Beteiligungs-
management mbH, Hamburg
Joachim Kramer (until 28 February 2019)
Marine Works Council
Hapag-Lloyd AG, Hamburg
Annabell Kröger
Commercial Clerk
Hapag-Lloyd AG, Hamburg
Arnold Lipinski
HR Manager for Shipping Operations
Hapag-Lloyd AG, Hamburg
Sabine Nieswand
Chairwoman of the Works Council
Hapag-Lloyd AG, Hamburg
José Francisco Pérez Mackenna
Chief Executive Officer
Quiñenco S. A., Santiago de Chile, Chile
Maya Schwiegershausen-Güth
Head of Treaty Office of the ITF
“flag of convenience” campaign
Federal Department of Maritime Economy,
ver.di Bundesverwaltung, Berlin
Uwe Zimmermann
Commercial Clerk
Hapag-Lloyd AG, Düsseldorf
30 C o R p o R a t e g o v e R n a n C e
H a p a g - L L o y d a g I a n n u a L R e p o R t 2 0 1 9
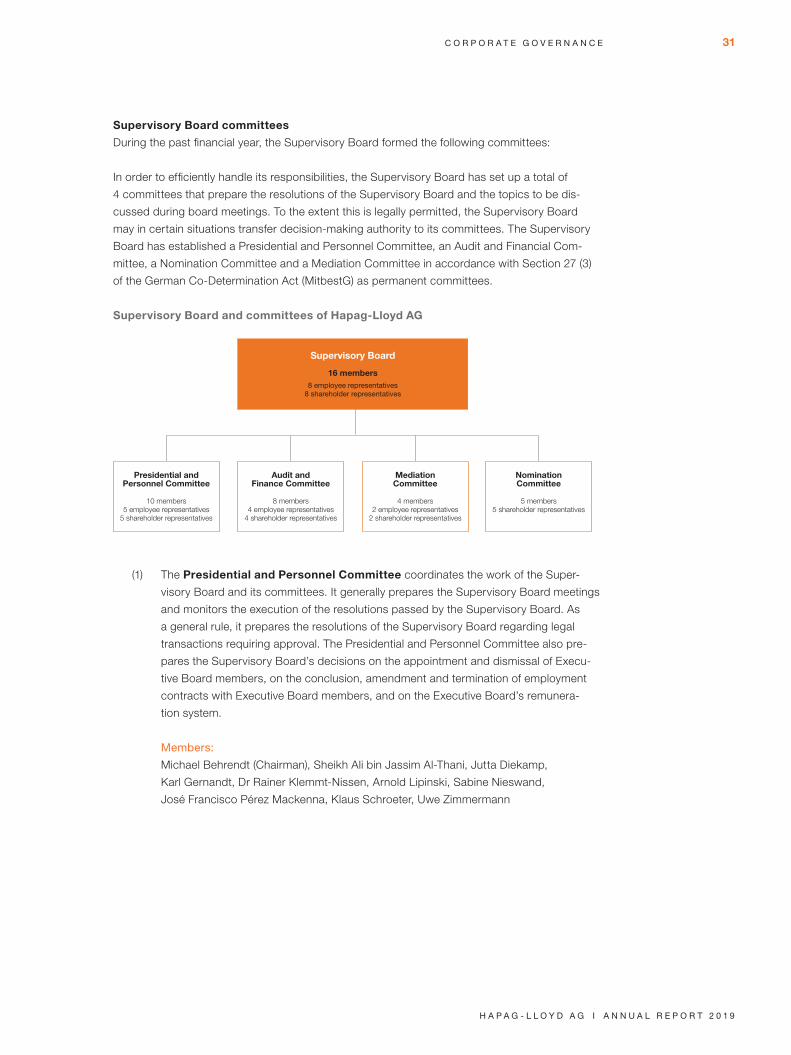
Supervisory Board committees
During the past financial year, the Supervisory Board formed the following committees:
In order to efficiently handle its responsibilities, the Supervisory Board has set up a total of
4 committees that prepare the resolutions of the Supervisory Board and the topics to be dis-
cussed during board meetings. To the extent this is legally permitted, the Supervisory Board
may in certain situations transfer decision-making authority to its committees. The Supervisory
Board has established a Presidential and Personnel Committee, an Audit and Financial Com-
mittee, a Nomination Committee and a Mediation Committee in accordance with Section 27 (3)
of the German Co-Determination Act (MitbestG) as permanent committees.
Supervisory Board and committees of Hapag-Lloyd AG
(1) The Presidential and Personnel Committee coordinates the work of the Super-
visory Board and its committees. It generally prepares the Supervisory Board meetings
and monitors the execution of the resolutions passed by the Supervisory Board. As
a general rule, it prepares the resolutions of the Supervisory Board regarding legal
transactions requiring approval. The Presidential and Personnel Committee also pre-
pares the Supervisory Board’s decisions on the appointment and dismissal of Execu-
tive Board members, on the conclusion, amendment and termination of employment
contracts with Executive Board members, and on the Executive Board’s remunera-
tion system.
Members:
Michael Behrendt (Chairman), Sheikh Ali bin Jassim Al-Thani, Jutta Diekamp,
Karl Gernandt, Dr Rainer Klemmt-Nissen, Arnold Lipinski, Sabine Nieswand,
José Francisco Pérez Mackenna, Klaus Schroeter, Uwe Zimmermann
Supervisory Board
16 members8 employee representatives
8 shareholder representatives
Presidential andPersonnel Committee
10 members5 employee representatives
5 shareholder representatives
NominationCommittee
5 members5 shareholder representatives
MediationCommittee
4 members2 employee representatives
2 shareholder representatives
Audit andFinance Committee
8 members4 employee representatives
4 shareholder representatives
31C o R p o R a t e g o v e R n a n C e
H a p a g - L L o y d a g I a n n u a L R e p o R t 2 0 1 9

(2) The Audit and Financial Committee of the Supervisory Board handles the financial
planning and reviews the investment projects of the Hapag-Lloyd Group. It is respon-
sible for performing the preliminary examination of the documents for the annual finan-
cial statements and the consolidated financial statements, including the respective
management reports and the Executive Board’s proposal on the appropriation of prof-
its. It prepares the adoption of the annual financial statements and the approval of the
consolidated financial statements by the Supervisory Board, as well as its decision on
the Executive Board’s proposed resolution on the appropriation of profits. The Audit
and Financial Committee also submits a substantiated recommendation to the Super-
visory Board for the selection of the external auditors at the Annual General Meeting
and handles the awarding of the audit engagement to the external auditors and the fee
agreement. It also monitors the external auditors’ independence. In addition to the
above, it is responsible for monitoring the effectiveness of the internal control system,
the risk management system, the compliance and the internal auditing system.
Members:
Oscar Eduardo Hasbún Martínez (Chairman), Turqi Alnowaiser, Karl Gernandt, Dr Rainer
Klemmt-Nissen, Annabell Kröger, Arnold Lipinski, Klaus Schroeter, Uwe Zimmermann
(3) The Nomination Committee makes proposals to the Supervisory Board regarding
suitable candidates to act as shareholder representatives on the Supervisory Board.
In turn, the Supervisory Board submits proposals to the Annual General Meeting. In
line with the GCGC’s recommendation, the Nomination Committee consists solely of
shareholder representatives.
Members:
Michael Behrendt (Chairman), Sheikh Ali bin Jassim Al-Thani, Karl Gernandt,
Dr Rainer Klemmt-Nissen, José Francisco Pérez Mackenna
(4) There is also a Mediation Committee, which was established in accordance with
Section 27 (3) of the German Co-Determination Act (MitbestG). This committee submits
proposals to the Supervisory Board for the appointment of Executive Board members
if the necessary two-thirds majority of votes by Supervisory Board members is not
reached in the first round of voting.
Members:
Michael Behrendt (Chairman), Jutta Diekamp, José Francisco Pérez Mackenna,
Klaus Schroeter
The Mediation Committee and the Nomination Committee only meet when needed. All other
committees meet regularly and also on specific occasions in accordance with their respective
responsibilities as per the Supervisory Board’s rules of procedure. The activities of the Super-
visory Board and its committees in the last financial year are detailed in the Report of the
Supervisory Board. It also provides information about the attendance of Supervisory Board
members at meetings.
32 C o R p o R a t e g o v e R n a n C e
H a p a g - L L o y d a g I a n n u a L R e p o R t 2 0 1 9

Share transactions and shareholdings of members of the Executive Board
and the Supervisory Board
In accordance with the Market Abuse Regulation (MAR) (Article 19 MAR), persons who perform
management functions, in other words the members of executive boards and supervisory
boards, as well as persons closely related to them (including spouses, registered partners and
dependent children) are required to report any transactions of their own involving the shares of
Hapag-Lloyd AG or any related financial instruments to Hapag-Lloyd AG, and the German
Federal Financial Supervisory Authority (BaFin) if the total amount of the transactions of an
Executive Board member or Supervisory Board member and persons closely related to them
reaches or exceeds EUR 5,000.00 (EUR 20,000.00 since 1 January 2020) in the calendar year.
The transactions reported have been published on the website of Hapag-Lloyd AG at
https://www.hapag-lloyd.com/en/ir/corporate-governance/managers-transactions.html
As at the reporting date, the total volume of shares in Hapag-Lloyd AG and related financial
instruments held by all members of the Executive Board and Supervisory Board was less than
1% of issued shares.
Executive Board and Supervisory Board remuneration
An important component of responsible corporate governance is a remuneration system
structure for the Executive Board and the Supervisory Board that provides incentives and
rewards good performance.
The basic features of the remuneration system and the Executive Board and Supervisory
Board members’ remuneration are outlined in the remuneration report as part of the manage-
ment report.
Shareholders
The shareholders exercise their rights at the Annual General Meeting. The Annual General Meet-
ing selects the external auditors, elects the shareholder representatives to the Supervisory Board
and passes resolutions on the discharge of the members of the Executive Board and the Super-
visory Board, the appropriation of profits, capital measures and changes to the articles of associ-
ation. The shares are registered. Shareholders who are recorded in the share register and have
registered in time before the Annual General Meeting are entitled to attend the Annual General
Meeting and exercise their voting rights. Shareholders can either exercise their voting right at the
Annual General Meeting themselves or have it exercised by a proxy of their choice or by a voting
representative of the Company who is required to follow their instructions. Each share grants
one vote.
As at 31 December 2019, the shareholders of Hapag-Lloyd AG were:
in % 2019
Kühne Holding AG and Kühne Maritime GmbH 29.6
CSAV Germany Container Holding GmbH 27.8
Qatar Holding Germany GmbH 14.5
HGV Hamburger Gesellschaft für Vermögens- und Beteiligungsmanagement mbH 13.9
Public Investment Fund of the Kingdom of Saudi Arabia 10.2
Free float 4.0
Total 100.0
33C o R p o R a t e g o v e R n a n C e
H a p a g - L L o y d a g I a n n u a L R e p o R t 2 0 1 9

Accounting and auditing
The Executive Board prepares the annual financial statements of Hapag-Lloyd AG in accordance
with the German Commercial Code (HGB) and the German Stock Corporation Act (AktG). The
consolidated financial statements are prepared in accordance with the principles of the Inter-
national Financial Reporting Standards (IFRS), as applicable within the European Union, and the
German legal provisions applicable in accordance with Section 315 e (1) of the German Commer-
cial Code (HGB). The combined management report is prepared in accordance with the pro-
visions of the German Commercial Code (HGB). The annual and consolidated financial state-
ments as well as the combined management report are examined by the external auditors and
by the Supervisory Board.
At the proposal of the Supervisory Board, the Annual General Meeting on 12 June 2019 selected
KPMG AG Wirtschaftsprüfungsgesellschaft, Hamburg (KPMG) as the external auditors of the
annual and consolidated financial statements as well as the respective management reports of
Hapag-Lloyd AG for the 2019 financial year. The Supervisory Board had previously verified the
independence of the external auditors. The signatory auditors of the annual and consolidated
financial statements of Hapag-Lloyd AG are Niels Madsen (since the 2017 financial year) and
Dr Victoria Röhricht (since the 2018 financial year). The audits covered the risk early-warning
system in addition to the accounting system.
Risk management and internal control system (ICS)
The Hapag-Lloyd Group’s risk management system, including the ICS as it relates to the
accounting process, is detailed in the risk report as part of the management report.
Information on statutory diversity requirements
The German Law for the Equal Participation of Women and Men in Leadership Positions in the
Private Sector and the Public Sector is in force. Its provisions apply in addition to existing diver-
sity requirements under the GCGC, which Hapag-Lloyd AG already complies with. Hapag-Lloyd
has addressed the requirements at the various levels and in the responsible committees and
has passed the necessary resolutions.
As a listed company which is also subject to the German Co-Determination Act (MitbestG), a
fixed gender quota applies to the Supervisory Board of Hapag-Lloyd AG and must be observed
for new appointments from 1 January 2016. This means that the Supervisory Board must consist
of at least 30% women and at least 30% men. As at 31 December 2019, there were 5 women on
the Supervisory Board of Hapag-Lloyd AG. This means that 31% of the Supervisory Board mem-
bers were women as at the reporting date. The statutory requirements have thus been fulfilled.
Hapag-Lloyd will also take the statutory regulations into account for new appointments in the
future so that it fulfils the corresponding requirements.
The German Law for the Equal Participation of Women and Men in Leadership Positions in the
Private Sector and the Public Sector also requires that targets be set for the percentage of
women on the Executive Board and at the two management levels below the Executive Board
as well as deadlines for achieving this.
34 C o R p o R a t e g o v e R n a n C e
H a p a g - L L o y d a g I a n n u a L R e p o R t 2 0 1 9
The initial deadline to be set for achieving the target could not be later than 30 June 2017. The
Supervisory Board set a target of 0% for the Executive Board for the period until 30 June 2017
and maintained the status quo at the time. No women had been appointed as Executive Board
members as at the reporting date of 30 June 2017. For the period until 30 June 2022, the Super-
visory Board has decided on a target of 20% for the Executive Board.
For the first two management levels below the Executive Board, the Executive Board at that
time set targets of 0% for the first management level and 14% for the second management level,
taking succession planning into consideration, and also specified 30 June 2017 as the deadline
for reaching these targets. As at the reporting date of 30 June 2017, the percentage of women
at the first management level was 0% and at the second management level it was 14%.
For the period until 30 June 2022, the Executive Board of Hapag-Lloyd AG has set a target of
5% for the percentage of women at the first management level below the Executive Board and
15% at the second management level.
Offices held by members of the Executive Board in supervisory boards and
other comparable supervisory bodies of commercial companies
Rolf Habben Jansen
Stolt-Nielsen Limited
World Shipping Council
Anthony J. Firmin (until 30 June 2019)
HHLA Container Terminal Altenwerder GmbH (until 18 April 2019)
SCA Service Center Altenwerder GmbH (until 18 April 2019)
FRANK Beteiligungsgesellschaft mbH
The Britannia Steam Ship Insurance Association Ltd. – Deputy Chairman
Dr Maximilian Rothkopf
The Britannia Steam Ship Insurance Association Ltd.
Joachim Schlotfeldt
HHLA Container Terminal Altenwerder GmbH (as of 18 April 2019)
35C o R p o R a t e g o v e R n a n C e
H a p a g - L L o y d a g I a n n u a L R e p o R t 2 0 1 9

Offices held by members of the Supervisory Board in other supervisory boards
and other comparable supervisory bodies of commercial companies
H. E. Sheikh Ali bin Jassim Al-Thani
SCI Elysees 26
Libyan Qatari Bank – Deputy Chairman
Qatar Holding LLC
Al Rayan Bank
Turqi Alnowaiser
Lucid Motors (as of 2 April 2019)
Noon Investment
Saudi Information Technology Company (SITCO)
Michael Behrendt
Barmenia Versicherungen a.G. – Deputy Chairman (as of 2 September 2019)
Barmenia Allgemeine Versicherungs-AG – Deputy Chairman
Barmenia Krankenversicherung AG – Deputy Chairman
Barmenia Lebensversicherung a.G. – Deputy Chairman
ESSO Deutschland GmbH (until 30 April 2019)
EXXON Mobil Central Europe Holding GmbH
MAN SE
MAN Energy Solutions SE
MAN Truck & Bus SE
Renk AG
Nicola Gehrt
TUI Deutschland GmbH
Karl Gernandt
Kühne + Nagel International AG – Deputy Chairman
Kühne Holding AG – President / Chairman
Kühne + Nagel (AG & Co.) KG – Chairman
Kühne & Nagel A.G., Luxembourg – Chairman
Kühne Invest AG, Switzerland (until 22 July 2019)
Kühne Holding (Management) AG – Chairman
Kühne Logistics University – Chairman
Kühne Real Estate AG – Chairman
Hochgebirgsklinik Davos AG – President
36 C o R p o R a t e g o v e R n a n C e
H a p a g - L L o y d a g I a n n u a L R e p o R t 2 0 1 9

Oscar Eduardo Hasbún Martínez
Florida International Terminal LLC
Invexans S.A.
Nexans S.A.
San Antonio Terminal Internacíonal S. A.
San Vicente Terminal Internacíonal S. A.
SM-SAAM S.A. – Chairman
Sociedad Portuaria De Caldera (SPC) S. A.
Sociedad Portuaria Granelera De Caldera (SPGC) S. A.
Dr Rainer Klemmt-Nissen
HSH Beteiligungsmanagement GmbH (until 22 January 2019)
José Francisco Pérez Mackenna
Banchile Corredores de Seguros Limitada
Banco de Chile
Compañía Cervecerías Unidas S.A.
Compañía Cervecerías Unidas Argentina S.A.
Cervecera CCU Limitada
Central Cervecera de Colombia SAS
Compañía Pisquera de Chile S.A.
Compañía Sud Americana de Vapores S.A.
Embotelladoras Chilenas Unidas S.A.
Empresa Nacional de Energía ENEX S.A. – Chairman
Invexans S.A. – Chairman
Invexans Ltd.
Inversiones IRSA Limitada
Inversiones LQ-SM Limitada
Inversiones y Rentas S.A.
LQ Inversiones Financieras S.A.
Nexans S.A.
Sociedad Matríz SAAM S.A.
Tech Pack S.A. – Chairman
Viña San Pedro Tarapacá S.A.
Zona Franca Central Cervecera S.A.S
Maya Schwiegershausen-Güth
HHLA Hamburger Hafen und Logistik AG
The Executive Board and Supervisory Board members not listed above do not hold any
offices on other legally required supervisory boards or comparable supervisory bodies of
commercial companies.
37C o R p o R a t e g o v e R n a n C e
H a p a g - L L o y d a g I a n n u a L R e p o R t 2 0 1 9

executive board of Hapag-Lloyd ag
Rolf Habben Jansen (top left)Joachim schlotfeldt (top right)
Mark frese (middle)dr. Maximilian Rothkopf (middle right)
nicolás burr (below)

2019 was a good year for Hapag-Lloyd. Despite geopolitical tensions and trade restrictions, we were able to further increase our profitability in compari-son to previous years. With our 13,000 employees worldwide, we have made very good progress with the implementation of our Strategy 2023.
FIRMLY FOCUSED ON THE FUTURE

three pillars of our strategy 2023 form the core areas in which we aim to become even
stronger and better in the years ahead.
3
2023STRATEGY
BE PR
OFI
TAB
LE
GLO
BA
L
PLA
YE
R
NU
MB
ER
ON
E
FOR
QU
ALI
TY

With our Strategy 2023, we will be focusing on three strategic goals in the coming years. We want to become the number one for quality in our indus-try, to remain an international player with a global market share (excluding Intra-Asia) of roughly 10%, and to become more profitable at the same time while achieving a return that enables us to cover at least our capital costs.
MOVING AHEAD WITH GOOD RESULTS

To become the quality leader in our industry, we have defined Quality Promises and asso-ciated goals that our customers will be able to use to transparently measure how we deli-ver on them. What’s more, our new Quality Service Centers will allow us to deliver a more consistent level of service quality to our customers. More intensive cooperation and communication with terminals is making our customers’ supply chains even more reliable.
MORE QUALITY

Hapag-Lloyd is making great efforts to offer the highest quality.
Hapag-Lloyd is one of the most profitable companies in
the container shipping industry.
debt reduced by more than
2 0 2 3
¤EBIT +80%
€ 800 MILLION

We are meeting our targets in terms of profitability and debt reduction. Last year, we lowered our debt by more than 800 million euros (excluding IFRS 16). At the same time, compared to the previous year, we increased our operating result (EBIT) by more than 80%, to EUR 811 million.
MORE PROFITABILITY

Market position consolidated, services in niche markets expanded –
Hapag-Lloyd is a global player.
we have solidified and further expanded our market share, such as in the reefer segment.
10%

MORE INTER-NATIONALITY
We were able to strengthen our position in attractive markets by offering new services. Our new Region South Europe brings us even closer to our customers in the Mediterranean region. At the same time, we are further expanding our presence and business in growth markets, such as India and Africa. This allowed us to grow with the market and retain our global market share (excluding Intra-Asia) of around 10%.

our engagement is paying off – and our customers are reflecting this, too.

MORE CUSTOMER SATISFACTION
We are very pleased that our customers appreciate all our hard work. We regularly conduct customer surveys to find out exactly where we stand on important issues, such as customer loyalty and customer satisfaction, or how easy it is to do business with us. Last year, we were able to significantly improve in these areas.

COMBINED MANAGEMENT REPORT

52 BASIC PRINCIPLES OF THE GROUP
52 Operating activities
54 Group structure and shareholders
56 Group objectives and strategy
63 Corporate management
67 Principles and performance indicators
73 Research and development
74 Employees
75 ECONOMIC REPORT
75 General economic conditions
76 Sector-specific conditions
81 Earnings, financial and net asset position
82 Group earnings position
89 Group financial position
95 Group net asset position
97 Executive board’s statement on overall economic performance
98 OUTLOOK-, RISK- AND OPPORTUNITY REPORT
98 Outlook
100 Risk and opportunity report
118 NOTES TO THE INDIVIDUAL FINANCIAL STATEMENTS
118 General principles / preliminary remarks
119 Economic report
119 Earnings, financial and net asset position
119 Earnings position
123 Financial and net asset position
125 Outlook, risk and opportunity report
126 Report by the executive board on relationships with affiliated companies
127 REMUNERATION REPORT
143 OTHER DISCLOSURES
51
H a p a g - L L o y d a g I a n n u a L R e p o R t 2 0 1 9

BASIC PRINCIPLES OF THE GROUP
In the 2019 financial year, the management report of Hapag-Lloyd AG and the Group man-
agement report will be combined for the first time in accordance with section 315 sub-section 5
in conjunction with section 298 sub-section 2 of the German Commercial Code (HGB).
As Hapag-Lloyd AG is the most important individual company in the Hapag-Lloyd Group, the
principles applied by Hapag-Lloyd Group and Hapag-Lloyd AG are largely identical. The parti-
cular features of Hapag-Lloyd AG are explained separately, in particular with regard to the
course of business (see “Notes to the individual financial statements”). Where information does
not relate to the Hapag-Lloyd Group, explicit reference is made to Hapag-Lloyd AG.
OPERATING ACTIVITIES
The Hapag-Lloyd Group is Germany’s largest container liner shipping company and is one of
the world’s leading container liner shipping companies in terms of global market coverage. The
Group’s core business is the shipping of containers by sea, but also encompasses transport
services from door to door.
Hapag-Lloyd’s fleet comprised 239 container ships as at 31 December 2019 (previous year: 227)
with a transport capacity of approximately 1.7 million TEU (previous year: 1.6 million TEU).
The Group currently has 392 sales offices in 129 countries (previous year: 407 sales offices in
128 countries) and offers its customers worldwide access to a network of 121 liner services
(previous year: 119). In the 2019 financial year, Hapag-Lloyd served approximately 30,600 cus-
tomers around the world (previous year: approximately 30,200).
Network of Hapag-Lloyd services
Global network with 121 services*Europe – North America(incl. IRT North Europe)
21 Services
Asia / Oceania – N. America
18 Services
Latin America
25 Services
Africa / Med
17 Services
Middle East
9 Services
Europe – Asia
8 Services
Asia IRT(incl. Far East – ME / Indian Ocean; Far East – Oceania)
24 Services
Source: Company data; Note: *FP1 Service counted twice (Asia – North America / Europe – Asia)
52
H a p a g - L L o y d a g I a n n u a L R e p o R t 2 0 1 9
C o M b I n e d M a n a g e M e n t R e p o R t I b a s I C p R I n C I p L e s o f t H e g R o u p

Hapag-Lloyd conducts its container liner shipping business in an international business environ-
ment in which transactions are invoiced mainly in US dollars and payment processes are handled
in US dollars. This relates not only to operating business transactions, but also to investment
activities such as the acquisition, chartering and rental of ships and containers, as well as the
corresponding financing of investments.
The Hapag-Lloyd Group’s functional currency is the US dollar. The reporting currency of the
individual and consolidated financial statements of Hapag-Lloyd AG is, however, the euro. Assets
and liabilities recognised in the consolidated financial statements of Hapag-Lloyd AG are trans-
lated into euros as at the balance sheet date (closing date rate) using the middle rate of that day.
The cash flows listed in the consolidated statement of cash flows and the expenses, income and
result shown in the consolidated income statement are translated at the average exchange rate
for the reporting period. The currency translation differences are recognised directly in the
Group’s other comprehensive income. If required, hedging transactions are conducted in the
Hapag-Lloyd Group to hedge against the USD / EUR exchange rate.
Legal framework
Hapag-Lloyd’s business is subject to multiple regulatory and legal provisions. In order to engage
in business operations, it is necessary to have authorisations, licences and certificates. Compli-
ance with the ISM Code (International Safety Management), which regulates the measures
required for ensuring safety at sea, and the ISPS Code (International Ship and Port Facility
Secur ity) must be given particular emphasis. The latter stipulates what measures are to be taken
to prevent hazards on board ships and in ports, thereby contributing to supply chain security.
There are also numerous country-specific rules, such as “advance manifest rules”, which stipu-
late certain disclosure obligations in relation to the ship’s cargo. Adherence to international
regulations and specifications, such as embargo and sanction stipulations, is a basic requirement
for the provision of service.
53
H a p a g - L L o y d a g I a n n u a L R e p o R t 2 0 1 9
b a s I C p R I n C I p L e s o f t H e g R o u p I C o M b I n e d M a n a g e M e n t R e p o R t

GROUP STRUCTURE AND SHAREHOLDERS
The controlling company of the Hapag-Lloyd Group, Hapag-Lloyd AG, is also the largest single
operating company within the Group. Hapag-Lloyd AG has the following key branch offices
active in the areas of sales and operations: Hapag-Lloyd Rotterdam (Rotterdam, Netherlands),
Hapag-Lloyd Antwerpen (Antwerp, Belgium), Hapag-Lloyd Denmark (Holte, Denmark) and
Hapag-Lloyd Poland (Gdansk, Poland).
In terms of operations, the Group structure of Hapag-Lloyd AG is currently as follows:
1 According to a resolution of the Supervisory Board on 13 November 2019, Mr Mark Frese was appointed as a new Executive Board member with effect from 25 November 2019. Mr Mark Frese is the new CFO and succeeded Mr Nicolás Burr, who left the Company on 29 February 2020.
2 According to a resolution of the Supervisory Board on 17 December 2018, Dr Maximilian Rothkopf was appointed as a new Executive Board member with effect from 1 May 2019 and succeeded Mr Anthony J. Firmin as the new COO.
Shareholder structure of Hapag-Lloyd AG
The shareholder structure of Hapag-Lloyd AG is dominated by its 5 major shareholders, which
together hold around 96.0% of the Company’s share capital. These include CSAV Germany
Container Holding GmbH (CSAV), Kühne Maritime GmbH together with Kühne Holding AG
(Kühne), Hamburger Gesellschaft für Vermögens- und Beteiligungsmanagement mbH (HGV),
and Qatar Holding LLC on behalf of the Qatar Investment Authority (QIA) and Public Investment
Fund Saudi Arabia (PIF). In addition, CSAV, Kühne Maritime GmbH and HGV have agreed under
a shareholders’ agreement to exercise their voting rights from the shares in Hapag-Lloyd AG
by issuing a common voting proxy, thereby making important decisions together.
During 2019, CSAV increased its share in Hapag-Lloyd from 25.8% to 27.8% and Kühne
increased its share from 25.0% to a total of 29.6%. The shareholder structure of Hapag-Lloyd AG
as at 31 December 2019 was as follows:
Trade Management Network
Central Functions
Regions
Exe
cu
tive C
om
mitte
e
CEORolf Habben Jansen
CFOMark frese 1
CPOJoachim schlotfeldt
Executive Board
COOdr Maximilian Rothkopf 2
Europe
HQ Hamburg
South Europe
HQ Genoa
North America
HQ Piscataway
Middle East
HQ Dubai
Latin America
HQ Valparaíso
Asia
HQ Singapur
54
H a p a g - L L o y d a g I a n n u a L R e p o R t 2 0 1 9
C o M b I n e d M a n a g e M e n t R e p o R t I b a s I C p R I n C I p L e s o f t H e g R o u p

Voting rights as at 31 December 2019
in % 2019 2018
Kühne Holding AG and Kühne Maritime GmbH 29.6 25.0
CSAV Germany Container Holding GmbH 27.8 25.8
Qatar Holding Germany GmbH 14.5 14.5
HGV Hamburger Gesellschaft für Vermögens- und Beteiligungsmanagement mbH 13.9 13.9
The Public Investment Fund of the Kingdom of Saudi Arabia 10.2 10.2
Free float 4.0 10.6
Total 100.0 100.0
In January 2020, CSAV acquired a share package from QIA of 3,890,899 shares (corresponding
to approximately 2.2%) and thus holds a nearly 30.0% interest.
Personnel changes on the Supervisory Board and the Executive Board of
Hapag-Lloyd AG
Mr Joachim Kramer, the employee representative on the Supervisory Board, retired from
the Company on 28 February 2019. Hamburg district court appointed Mr Felix Albrecht as the
Supervisory Board’s new employee representative with effect from 11 March 2019.
Mr Michael Behrendt’s term as Supervisory Board member and Chairman of the Supervisory
Board expired at the end of the Annual General Meeting on 12 June 2019. In accordance with a
resolution passed by the Annual General Meeting on 12 June 2019, Mr Behrendt was re-elected
to the Supervisory Board until the end of the Annual General Meeting that will vote to discharge
board members for the 2023 financial year. In the Supervisory Board meeting after the Annual
General Meeting, Mr Behrendt was re-elected as Chairman of the Supervisory Board.
On 17 December 2018, the Supervisory Board passed a resolution to appoint Dr Maximilian
Rothkopf as a new Executive Board member with effect from 1 May 2019. As the new COO,
Dr Maximilian Rothkopf succeeded Anthony J. Firmin, who stepped down from the Executive
Board on 30 June 2019.
Mr Mark Frese was appointed as a new Executive Board member with effect from 25 November
2019 as per a resolution passed by the Supervisory Board on 13 November 2019. Mr Mark Frese
succeeded Mr Nicolás Burr as CFO, who stepped down on 29 February 2020.
55
H a p a g - L L o y d a g I a n n u a L R e p o R t 2 0 1 9
b a s I C p R I n C I p L e s o f t H e g R o u p I C o M b I n e d M a n a g e M e n t R e p o R t

GROUP OBJECTIVES AND STRATEGY
The following comments refer to the Hapag-Lloyd Group. Since Hapag-Lloyd AG is the most
important individual company in the Hapag-Lloyd Group, the objectives and strategies of
Hapag-Lloyd Group and Hapag-Lloyd AG are identical. Where statements do not refer to the
Hapag-Lloyd Group, explicit reference is made to Hapag-Lloyd AG.
The prime strategic objective of the Hapag-Lloyd Group is to achieve long-term profitable growth
measured on the basis of the developments in transport volume, the key performance indicators
EBITDA and EBIT as well as the return on invested capital (ROIC).
In terms of increasing its transport volume, Hapag-Lloyd has achieved growth of more than
100% over the past 5 years. This was due mainly to the takeover of CSAV’s container shipping
activities in December 2014, and to the merger with UASC in May 2017, but also to the rising
global demand for container shipping services.
In a still-competitive industry environment, Hapag-Lloyd recorded a significant increase in its
EBITDA and EBIT in the 2019 financial year.
Earnings before interest, taxes, depreciation and amortisation (EBITDA) for a certain period are
calculated by adding the revenue, the other operating result, the share of profit of equity-
accounted investees and the results from investments and securities less transport and per-
sonnel expenses, not including amortisation of intangible assets and depreciation of property,
plant and equipment. To calculate earnings before interest and taxes (EBIT), depreciation and
amortisation are deducted from EBITDA.
Hapag-Lloyd achieved an EBITDA margin of 15.8% in the 2019 financial year. In addition to a
2.7% increase in average freight rates and a 1.4% rise in transport volumes, the positive develop-
ment of the EBITDA margin was also attributable to a decrease in the average bunker consump-
tion price by USD 5 per tonne. In addition, the first-time application of IFRS 16 ‘Leases’ reporting
standard in the amount of EUR 467.0 million had a positive effect on the EBITDA and therefore on
the EBITDA margin.
Development of key performance indicators
2019 2018 2017 2016 2015
Transport volume (in TTEU) 12,037 11,874 9,803 7,599 7,401
EBITDA (in million EUR)1 1,986 1,139 1,055 607 831
EBIT (in million EUR)1 811 444 411 126 366
EBITDA-margin (in % of revenue)1 15.8 9.8 10.6 7.9 9.4
EBIT-margin (in % of revenue)1 6.4 3.8 4.1 1.6 4.1
1 Due to the adjustment of the structure of the consolidated income statement, the items in the consolidated income statement have changed. The comparability of the previous year’s values are thus limited. For a better comparability with the current reporting period, the previous year’s values have been adjusted, see also chapter “Change of presentation in the consolidated income state-ment” in the Notes to the consolidated financial statements.
56
H a p a g - L L o y d a g I a n n u a L R e p o R t 2 0 1 9
C o M b I n e d M a n a g e M e n t R e p o R t I b a s I C p R I n C I p L e s o f t H e g R o u p
Hapag-Lloyd intends to increase the transport volume in line with market growth. Hapag-Lloyd
wants to further increase its operating result by means of an expected growth in volume,
an improvement in revenue quality and additional cost savings as well as efficiency gains.
The target of achieving transport volume growth equal to market growth was reached in 2019
with an increase in the transport volume of 1.4% compared to market growth of 0.8%. Excluding
the active reduction of transport capacity in the Intra-Asia trade lane, which is part of the strate-
gic realignment under Strategy 2023, transport volume grew by 2.8% in Hapag-Lloyd’s core
markets (excl. Intra-Asia) in 2019 compared with a market growth of 0.9%.
The cost-cutting programme implemented as part of Strategy 2023 has been successfully
launched and will guarantee Hapag-Lloyd’s future cost-competitiveness. Here we aim at a result
contribution in the range of USD 350 - 400 million by the year 2021 (details of the cost-cutting
programme can be found in section “Strategy 2023”).
The current financial key performance indicators of the Hapag-Lloyd Group will remain EBITDA
and EBIT. As part of Strategy 2023 (for details see section “Strategy 2023”), further medium-term
financial targets were also defined: Hapag-Lloyd aims to achieve profitability over the entire eco-
nomic cycle, i. e. a return on invested capital (ROIC) at least equal to the company’s weighted
average cost of capital (WACC). In the 2019 financial year, Hapag-Lloyd generated a return on
invested capital (ROIC) of 6.1% (previous year: 3.7%). The weighted average cost of capital was
6.8% in the 2019 financial year (previous year: 8.2%). The reasons for the decrease in the
weighted average cost of capital include a lower risk-free base interest rate and a change in the
financing structure.
The reduction of debt remains a priority, and the Company’s target is to achieve a ratio of net
debt to EBITDA of 3.0x or less by the end of 2023. Its target for the end of 2019 was a ratio of net
debt to EBITDA of 3.5x. It exceeded this target with a ratio of net debt to EBITDA of 3.0x as at
31 December 2019. Furthermore, Hapag-Lloyd is aiming for an equity ratio of over 45% latest
end of 2023 and a liquidity reserve of around USD 1.1 billion. As at 31 December 2019, its equity
ratio was 40.9% (previous year: 40.9%) and its liquidity reserve was USD 1.2 billion (previous
year: USD 1.3 billion).
57
H a p a g - L L o y d a g I a n n u a L R e p o R t 2 0 1 9
b a s I C p R I n C I p L e s o f t H e g R o u p I C o M b I n e d M a n a g e M e n t R e p o R t

Strategy 2023
The Executive Board of Hapag-Lloyd AG first presented the Group’s medium-term strategy
(“Strategy 2023”) at a Capital Markets Day in November 2018.
Starting point
The liner shipping industry is emerging from the longest downturn in its history. Since the 2008
financial crisis, the industry has been mostly unable to cover its cost of capital. Following a sub-
stantial number of mergers, the world’s 10 biggest liner shipping companies now account for
almost 85% of the global capacity. This consolidation, as well as the use of ever larger ships, has
led to a significant reduction in unit costs. However, Hapag-Lloyd believes that the benefits of
further consolidation would only be relatively small. From Hapag-Lloyd AG’s perspective, the like-
lihood of large mergers is therefore low. There would only be few potential synergies, greater
integration risks and probably stricter controls and conditions from the competition authorities.
As a result, no further significant consolidation is likely at present from Hapag-Lloyd’s perspec-
tive. Given that the largest liner shipping companies are already cost-competitive, the challenge
for them now is to differentiate themselves commercially from one other. As the fifth-largest liner
shipping company in the world by transport capacity and with a modern, efficient fleet, Hapag-
Lloyd is well positioned and well prepared to deal with the changes in the operating environment
and the challenges to safeguard its future competitiveness in the view of the Executive Board of
Hapag-Lloyd AG.
A changed market environment requires a new strategic focus: Strategy 2023
The Executive Board of Hapag-Lloyd AG assumes that the container shipping industry will no
longer be solely determined by unit costs and economies of scale in the future. Instead, it firmly
believes that service quality and reliability will be decisive competitive factors and that customers
are willing to pay for quality, service and greater reliability. With regard to schedule reliability in
particular, there is a need for action by the industry, and therefore also by Hapag-Lloyd.
Hapag-Lloyd has developed its medium-term strategy based on these premises. Successful
implementation of the strategy shall safeguard the future and provide the foundations for further
organic growth.
The three core objectives of Strategy 2023 are:
• Become number one for quality
• Remain a global player
• Profitability throughout the entire economic cycle
58
H a p a g - L L o y d a g I a n n u a L R e p o R t 2 0 1 9
C o M b I n e d M a n a g e M e n t R e p o R t I b a s I C p R I n C I p L e s o f t H e g R o u p
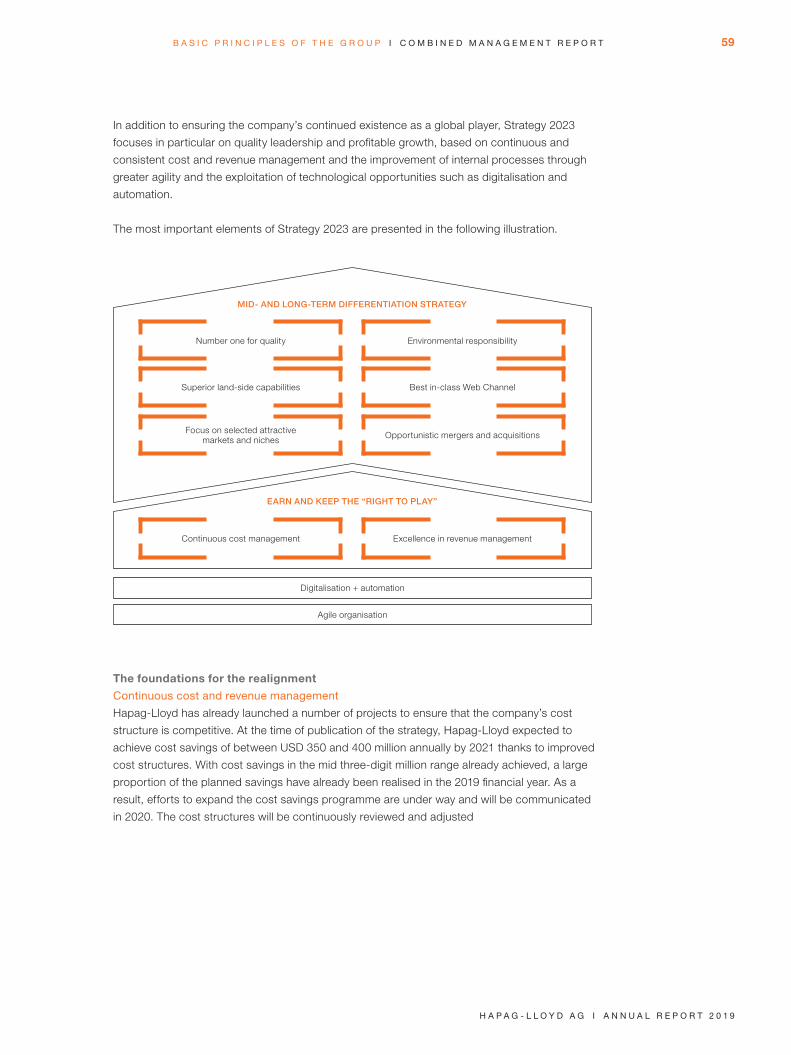
In addition to ensuring the company’s continued existence as a global player, Strategy 2023
focuses in particular on quality leadership and profitable growth, based on continuous and
consistent cost and revenue management and the improvement of internal processes through
greater agility and the exploitation of technological opportunities such as digitalisation and
automation.
The most important elements of Strategy 2023 are presented in the following illustration.
The foundations for the realignment
Continuous cost and revenue management
Hapag-Lloyd has already launched a number of projects to ensure that the company’s cost
structure is competitive. At the time of publication of the strategy, Hapag-Lloyd expected to
achieve cost savings of between USD 350 and 400 million annually by 2021 thanks to improved
cost structures. With cost savings in the mid three-digit million range already achieved, a large
proportion of the planned savings have already been realised in the 2019 financial year. As a
result, efforts to expand the cost savings programme are under way and will be communicated
in 2020. The cost structures will be continuously reviewed and adjusted
Agile organisation
Digitalisation + automation
MID- AND LONG-TERM DIFFERENTIATION STRATEGY
EARN AND KEEP THE “RIGHT TO PLAY”
Number one for quality
Superior land-side capabilities
Focus on selected attractive markets and niches
Continuous cost management
Environmental responsibility
Best in-class Web Channel
Opportunistic mergers and acquisitions
Excellence in revenue management
59
H a p a g - L L o y d a g I a n n u a L R e p o R t 2 0 1 9
b a s I C p R I n C I p L e s o f t H e g R o u p I C o M b I n e d M a n a g e M e n t R e p o R t

The key levers for optimisation in revenue management have also already been identified and
initial measures have been introduced. In 2019, revenue management focused on the implemen-
tation of the new standardised and transparent marine fuel recovery (MFR) surcharge in prepara-
tion for the rising bunker costs as a result of the International Maritime Organization’s (IMO) new
exhaust gas regulations which came into effect on 1 January 2020. Efforts were also made to
improve the cargo mix and to increase the share of automated price quotations.
agile organisation
In the view of the Executive Board of Hapag-Lloyd AG, the development of Hapag-Lloyd’s organ-
isation towards increased agility is a key factor for the success of Strategy 2023. The aim is to
make quicker and better commercial decisions with the help of data-based analysis tools. This
will enable, among other things, a faster and more flexible response to market changes in supply
and demand. Agility also requires the willingness to continuously learn. At the same time, agility
means that Hapag-Lloyd must be more flexible in project development and be open to partner-
ships. Some structural changes were made in the reporting year: Region Europe was divided into
two regions (Northern Europe and Southern Europe) to increase proximity to customers and
benefit from the expected growth in countries along the Mediterranean Sea. The quality offensive
in the area of customer service was driven by the expansion of additional Quality Service Centers
in Kuala Lumpur (Malaysia), Bogotá (Colombia), Viña del Mar (Chile) and Santos (Brazil).
digitalisation and automation
New technologies and automation should contribute to a continuous improvement of internal
processes and systems, and thus reducing time-consuming manual tasks.
Hapag-Lloyd believes that it is well equipped in the area of digitalisation and automation. Our
“single operating system” forms the backbone of our efficient operating processes. This also
means that the Executive Board of Hapag-Lloyd believes that Hapag-Lloyd is in a good starting
position when it comes to implementing and taking advantage of new technologies, as demon-
strated with the introduction and continuous enhancement of the web channel, for example.
To secure additional IT expertise and strengthen the development of new digital products, a
new IT department for product innovation was established in Gdansk (Poland).
60
H a p a g - L L o y d a g I a n n u a L R e p o R t 2 0 1 9
C o M b I n e d M a n a g e M e n t R e p o R t I b a s I C p R I n C I p L e s o f t H e g R o u p

The core of the Strategy 2023
The core of Strategy 2023 is the clear differentiation from competitors through the following
measures and unique selling points:
become number one for quality
Surveys commissioned by Hapag-Lloyd show that proven quality and reliability, such as punctual
delivery, play a significant role for more than half of market participants. As part of its aim to set
industry standards with regard to quality, Hapag-Lloyd has specified pledges on quality that are
being implemented on a gradual basis. A corresponding methodology for recording and measur-
ing this indicator was developed in the reporting year and will be gradually implemented and
communicated in 2020. As a result, customer satisfaction will be one of the targets in future.
In addition to a base product that includes clearly specified pledges on service and quality, we
will offer customised premium products in the future that meet specific customer requirements
and shall cover additional services. For example, the new product “Shipping Guarantee” was
introduced as a pilot project in 2019, whereby Hapag-Lloyd guarantees transportation on a
specific ship or journey. Following the successful close of the pilot project for exports from Asia,
the product will now be rolled out gradually in additional countries.
Customer satisfaction is to be measured using the Net Promoter Score (NPS). The NPS meas-
ures customer loyalty, with a score above zero indicating that the majority of customers would
recommend the company. In October 2019 our customer base was surveyed in relation to this.
The result is that the current NPS for Hapag-Lloyd is a clearly positive figure. In the view of the
Executive Board of Hapag-Lloyd AG this shows that the quality measures already implemented
are delivering initially positive results. Hapag-Lloyd aims to maintain its NPS in a clearly positive
range in future. Additionally, technical specifications shall be created for standardised measure-
ment of and reporting on punctuality. The punctuality promise will be clearly defined, and reli-
ability and punctuality shall be improved.
superior land-side capabilities
Hapag-Lloyd aims to increase the percentage of door-to-door business to over 40% by 2023.
This cargo type requires additional services which Hapag-Lloyd offers customers and which
should result in higher revenue and a higher margin. In the 2019 reporting year, the share of
cargo transported with an inland component was approximately 32%.
61
H a p a g - L L o y d a g I a n n u a L R e p o R t 2 0 1 9
b a s I C p R I n C I p L e s o f t H e g R o u p I C o M b I n e d M a n a g e M e n t R e p o R t

focus on attractive selective markets and niches
Hapag-Lloyd is aiming for a global market share (excl. Intra-Asia) of around 10%. As at
31 December 2019, the market share (excl. Intra-Asia) was 10.4%. Hapag-Lloyd plans to grow
with the market and thereby retain its market share. In addition, Hapag-Lloyd wants to continue
expanding in attractive growth markets and in the area of special container transports. This
includes the transportation of reefer containers, which Hapag-Lloyd sees already today as an
area of strength. It wants to also increase its market share in this segment to around 10%. As at
31 December 2019, Hapag-Lloyd’s share of the global reefer market was approximately 8.6%.
As a measure to achieve the future target in this segment, 13,420 new reefer containers were
ordered and acquired in the reporting year. As a further element of Strategy 2023, Hapag-Lloyd
has identified attractive growth markets. These include Africa, India and South East Asia. Addi-
tional new services were established in these markets in 2019. Furthermore, Area Africa
expanded its presence, opening its own office in Ghana.
environmental responsibility
It is a matter of course that Hapag-Lloyd will comply with the stricter environmental requirements,
such as IMO 2020, and that the Company will implement the necessary technical and organisa-
tional changes with the greatest care and attention. With regard to the new regulations of the
International Maritime Organization (IMO) coming into effect in 2020 to reduce sulphur emissions,
Hapag-Lloyd will predominantly use low-sulphur fuel. On 10 of its own larger vessels and 9 con-
tainer ships chartered on a long-term basis, the Company will install exhaust gas cleaning sys-
tems (EGCS) to filter the sulphur from the exhaust gases. One large vessel will also be retrofitted
to test how it runs on liquefied natural gas (LNG). In view of the Executive Board of Hapag-Lloyd
the conversion to the new exhaust gas thresholds and the associated switch to low-sulphur fuel
went according to plan. Thus, all precautions have been taken to comply with the IMO 2020
regulations as of 1 January 2020.
best in-class web Channel
To measure the success of its digitalisation strategy, Hapag-Lloyd has set a goal of increasing
the volume booked via the web channel to 15% of the total volume by 2023. In the fourth quarter
of the reporting period, the share of containers booked via the web channel was already around
9.4% (previous year period: 5.2%).
Strategy 2023, including the aforementioned targets and goals, will become more granular as the
strategy implementation progresses. When necessary, the strategy will be adapted to a changing
operating environment.
In the 2020 financial year our focus will be on:
• Further implementing Strategy 2023
• Evaluating additional cost-saving potential beyond the original target
of between USD 350 and 400 million p.a.
• Continuing to implement measures to improve revenue quality
• Further developing Hapag-Lloyd’s partnership within THE Alliance,
including the integration of Hyundai Merchant Marine (HMM) into
THE Alliance starting on 1 April 2020
• Implementing the IMO’s new exhaust gas standards smoothly and
efficiently and retrofitting the first ship with LNG
62
H a p a g - L L o y d a g I a n n u a L R e p o R t 2 0 1 9
C o M b I n e d M a n a g e M e n t R e p o R t I b a s I C p R I n C I p L e s o f t H e g R o u p

CORPORATE MANAGEMENT
The Group’s key performance indicators for its operating business are EBITDA and EBIT.
EBITDA is an important indicator of the achievement of sustainable company results and gross
cash flows. Hapag-Lloyd uses EBITDA as an important parameter for investment and financing
decisions. The financial performance indicators, EBITDA and EBIT, are only used to analyse
and manage the operating results of the Group as a whole.
The main factors influencing the development of the operating result indicators are transport
volume, freight rate, the US dollar exchange rate against the euro and operating costs including
bunker price.
Earnings before interest, taxes, depreciation and amortisation (EBITDA) are calculated by adding
the revenue, the other operating income and the earnings from investments and securities of
companies accounted for using the equity method generated within a certain period less trans-
port expenses, personnel expenses and other operating expenses, not including amortisation
of intangible assets and depreciation of property, plant and equipment. To calculate earnings
before interest and taxes (EBIT), depreciation and amortisation are deducted from EBITDA.
The global transport volume is dependent on the prevailing economic developments around the
world and therefore also on the various levels of demand for shipping services. Other factors
influencing Hapag-Lloyd’s transport volume are container ship capacity and the accompanying
change in the competitive situation in the trades.
EBITDA
Expenses
Depreciation
EBIT
Revenue
XtRanspoRt voLuMe fReIgHt Rate
63
H a p a g - L L o y d a g I a n n u a L R e p o R t 2 0 1 9
b a s I C p R I n C I p L e s o f t H e g R o u p I C o M b I n e d M a n a g e M e n t R e p o R t

Freight rates can be managed only to a limited degree because they are heavily dependent on
market capacity and market demand. The Group follows a yield management approach, accord-
ing to which individual container shipments are examined using profitability criteria. It attempts
to continuously reduce the proportion of less profitable cargo through targeted yield manage-
ment. Business operations around the globe have benefited from the deployment of a uniform
IT system covering the entire transport chain.
Efficient cost management provides essential control over the EBITDA and EBIT values. The
system of cost management is supported by an integrated IT solution which provides essential
and up-to-date data required for management and for implementing and maintaining cost
reduction measures. The cost base is, however, largely dependent on external influencing
factors. Due to the global nature of the Group’s business operations, exchange rate fluctuations
can have a considerable influence on costs.
Operating costs are also influenced by bunker price changes. The bunker price correlates with
the development of crude oil prices and is subject to substantial fluctuations. Depending on the
competitive situation, a proportion of the fluctuations can be compensated for via the freight rate
in the form of bunker surcharges. As part of preparations for the new exhaust gas standard
which applies worldwide from 1 January 2020 (“IMO 2020”) and the associated sharp increase
in bunker prices as a result of using low-sulphur bunker, Hapag-Lloyd has restructured and
updated its bunker surcharges. A new transparent price adjustment formula based on market
data was established in 2019 (MFR) and will be applied to contract cargo (i.e. for contracts with
a term of more than 3 months). As a result of the switch to the new fuel and the associated
costs for the operational and technical changes, a surcharge (IMO 2020 Transition Charge –
“ITC”) for spot cargo and short-term contracts (with a term of less than 3 months) will be levied
from 1 December 2019. However, the extent to which bunker surcharges can be implemented
depends in general very much on the prevailing market situation.
Part of the Group’s likely bunker fuel needs are hedged using options in order to lessen the risk
of changes in the bunker price due to rising prices.
In addition to EBITDA and EBIT as operating performance indicators, the return on invested
capital (ROIC) is calculated at Group level as an indicator of the performance within a period.
ROIC compares net operating profit after tax (NOPAT), defined as EBIT less taxes, with invested
capital as at the reporting date. Invested capital is defined as assets excluding cash and cash
equivalents less liabilities excluding financial debt and lease liabilities. To facilitate comparison
with other international shipping companies, the return on invested capital is calculated and
presented exclusively on the basis of the functional currency, the US dollar.
64
H a p a g - L L o y d a g I a n n u a L R e p o R t 2 0 1 9
C o M b I n e d M a n a g e M e n t R e p o R t I b a s I C p R I n C I p L e s o f t H e g R o u p
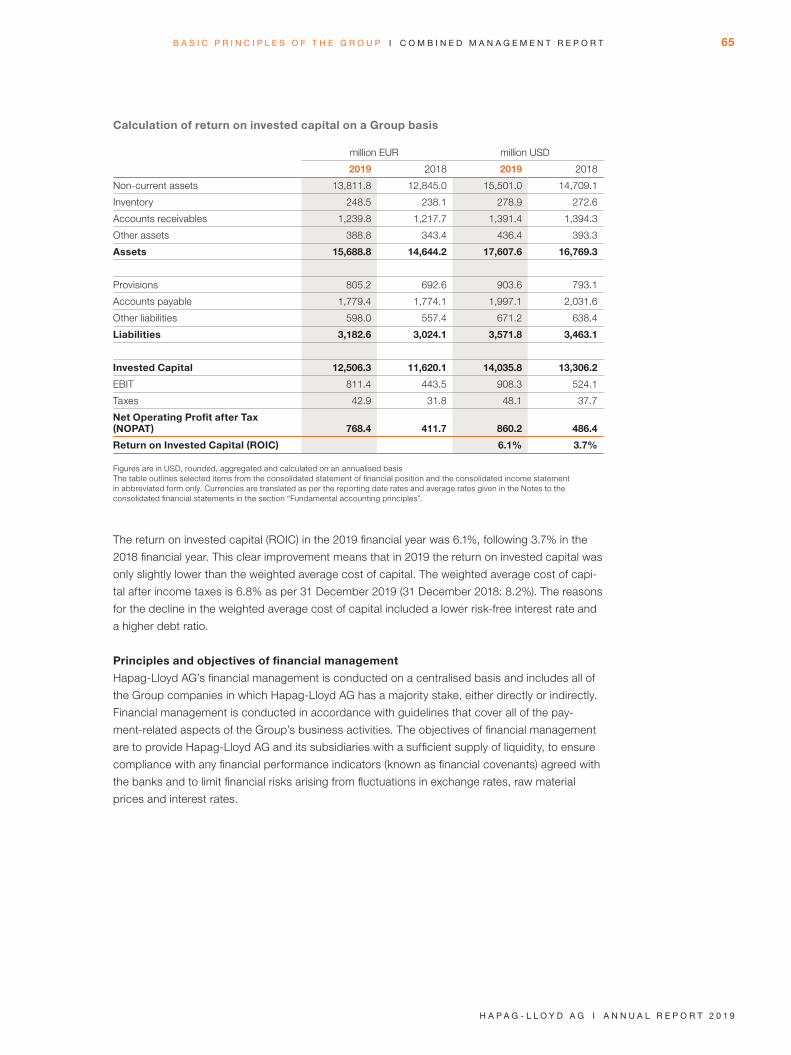
Calculation of return on invested capital on a Group basis
million EUR million USD
2019 2018 2019 2018
Non-current assets 13,811.8 12,845.0 15,501.0 14,709.1
Inventory 248.5 238.1 278.9 272.6
Accounts receivables 1,239.8 1,217.7 1,391.4 1,394.3
Other assets 388.8 343.4 436.4 393.3
Assets 15,688.8 14,644.2 17,607.6 16,769.3
Provisions 805.2 692.6 903.6 793.1
Accounts payable 1,779.4 1,774.1 1,997.1 2,031.6
Other liabilities 598.0 557.4 671.2 638.4
Liabilities 3,182.6 3,024.1 3,571.8 3,463.1
Invested Capital 12,506.3 11,620.1 14,035.8 13,306.2
EBIT 811.4 443.5 908.3 524.1
Taxes 42.9 31.8 48.1 37.7
Net Operating Profit after Tax (NOPAT) 768.4 411.7 860.2 486.4
Return on Invested Capital (ROIC) 6.1% 3.7%
Figures are in USD, rounded, aggregated and calculated on an annualised basisThe table outlines selected items from the consolidated statement of financial position and the consolidated income statement in abbreviated form only. Currencies are translated as per the reporting date rates and average rates given in the Notes to the consolidated financial statements in the section “Fundamental accounting principles”.
The return on invested capital (ROIC) in the 2019 financial year was 6.1%, following 3.7% in the
2018 financial year. This clear improvement means that in 2019 the return on invested capital was
only slightly lower than the weighted average cost of capital. The weighted average cost of capi-
tal after income taxes is 6.8% as per 31 December 2019 (31 December 2018: 8.2%). The reasons
for the decline in the weighted average cost of capital included a lower risk-free interest rate and
a higher debt ratio.
Principles and objectives of financial management
Hapag-Lloyd AG’s financial management is conducted on a centralised basis and includes all of
the Group companies in which Hapag-Lloyd AG has a majority stake, either directly or indirectly.
Financial management is conducted in accordance with guidelines that cover all of the pay-
ment-related aspects of the Group’s business activities. The objectives of financial management
are to provide Hapag-Lloyd AG and its subsidiaries with a sufficient supply of liquidity, to ensure
compliance with any financial performance indicators (known as financial covenants) agreed with
the banks and to limit financial risks arising from fluctuations in exchange rates, raw material
prices and interest rates.
65
H a p a g - L L o y d a g I a n n u a L R e p o R t 2 0 1 9
b a s I C p R I n C I p L e s o f t H e g R o u p I C o M b I n e d M a n a g e M e n t R e p o R t

Securing liquidity
As part of its annual Group planning, Hapag-Lloyd AG develops a multi-year financial plan which
forms the basis for its long-term financing and refinancing needs. By using this information and
monitoring financial markets to identify financing opportunities, the Company makes its decisions
regarding what investments to finance in the long term and what instruments to use for its finan-
cing at an early stage.
Hapag-Lloyd secures its liquidity reserve by means of cash, cash equivalents and syndicated
credit facilities. As at 31 December 2019, there was a liquidity reserve (consisting of cash, cash
equivalents and unused credit facilities) totalling EUR 1,032.8 million (previous year:
EUR 1,133.0 million). As part of the Group-wide provision of finance, the liquidity surpluses of
individual Group companies are pooled at Hapag-Lloyd AG. Arrangements with the banks to
provide lines of credit are based on a rolling liquidity plan. As part of Strategy 2023, Hapag-
Lloyd aims to have a liquidity reserve of around USD 1.1 billion.
Compliance with financial performance indicators
In various loan agreements, Hapag-Lloyd is required to comply with certain financial perfor-
mance indicators known as financial covenants. Essentially, this means maintaining (a) sufficient
liquidity and (b) a minimum level of equity at Group level. The liquidity reserve and equity base
were significantly above the stipulated covenant requirements at all times during the reporting
period. In addition, set loan-to-value ratios are in place for individual loans collateralised by
property, plant and equipment. These ratios were also above the required levels at all times
during the reporting period.
Limiting financial risks
In the container shipping sector, transactions are invoiced mainly in US dollars and payment
procedures are handled in US dollars. However, the reporting currency of Hapag-Lloyd is the
euro. As a European company, Hapag-Lloyd also incurs a significant percentage of its costs in
euros. Currency risks are hedged using derivative financial instruments, insofar as this makes
commercial sense.
Changes in fuel prices have an impact on Hapag-Lloyd AG, particularly with regard to the cost
of procuring fuel (bunker oil). Insofar as it is possible, these price increases are passed on to
customers on the basis of contractual agreements. In addition, some of the price risks arising
from fuel procurement are hedged using derivative hedging transactions.
Interest rate risks which arise as a result of liquidity procurement on the international money and
capital markets are monitored within the scope of interest rate management and will be partly
limited using derivative interest rate hedging instruments.
66
H a p a g - L L o y d a g I a n n u a L R e p o R t 2 0 1 9
C o M b I n e d M a n a g e M e n t R e p o R t I b a s I C p R I n C I p L e s o f t H e g R o u p
Strengthening the equity base
At the balance sheet date, equity came to approximately EUR 6,620.6 million (previous year:
EUR 6,259.3 million). The decision to retain some of the future profits should strengthen Hapag-
Lloyd’s equity base further. As part of Strategy 2023, Hapag-Lloyd aims to have an equity ratio
of over 45%. As at 31 December 2019, its equity ratio was 40.9% (previous year: 40.9%).
Reducing gearing
Net gearing (ratio of net debt to equity) was 88.9% in the 2019 financial year (2018: 85.5%).
The slight year-on-year increase resulted primarily from the first-time application of IFRS 16.
Dynamic gearing, as measured by the ratio of net debt to EBITDA (in USD), has improved signifi-
cantly since the acquisition of UASC in May 2017. Dynamic gearing had been 5.7x at the end of
2017 and reached 4.6x as at 31 December 2018. At the end of 2019, the ratio of net debt to
EBITDA was 3.0x. Achieving and maintaining an optimal level of gearing remains a priority. The
Company’s target is to sustain a ratio of net debt to EBITDA of 3.0x or less by the end of 2023.
Shareholder participation in the Company’s success
Hapag-Lloyd AG’s retained earnings under German commercial law form the basis for deter-
mining the distribution of dividends. Under German law, the Annual General Meeting decides
how the retained earnings are to be used. Against the background of the positive business devel-
opment, the Executive Board of Hapag-Lloyd AG proposes to the Annual General Meeting that
a dividend of EUR 193.3 million, or EUR 1.10 per share, be paid for the 2019 financial year. In
general, Hapag-Lloyd aims to pay a dividend of at least 30% of its consolidated profit for the year
as part of commercial and financial options.
PRINCIPLES AND PERFORMANCE INDICATORS
IMPORTANT FINANCIAL PERFORMANCE INDICATORS
Important financial performance indicators for the Hapag-Lloyd Group include EBITDA, EBIT, the
transport volume and freight rates. Transport volume and freight rates are important factors influ-
encing revenue development. A description and the calculation of the performance indicators
can be found in the “Corporate Management” section. Return on invested capital (ROIC) is also
used as a performance indicator.
67
H a p a g - L L o y d a g I a n n u a L R e p o R t 2 0 1 9
b a s I C p R I n C I p L e s o f t H e g R o u p I C o M b I n e d M a n a g e M e n t R e p o R t

IMPORTANT NON-FINANCIAL PRINCIPLES
In addition to the financial performance indicators, the optimal utilisation of the available ship and
container capacities also has a substantial influence on whether Hapag-Lloyd achieves long-term
profitable growth.
Sustainable and quality-conscious corporate governance and highly qualified and motivated
employees are also important parameters for Hapag-Lloyd’s long-term profitable growth. The fol-
lowing non-financial parameters constitute the most important information at present for under-
standing Hapag-Lloyd as a container liner shipping company. However, they are not used by the
Company as performance indicators. As part of Strategy 2023, further non-financial parameters,
such as quantifiable quality targets in particular, are gradually being implemented.
Productivity and efficiency
Hapag-Lloyd pays special attention to productivity and efficiency. In this respect, important
measures include yield management and continuous cost control. In recent years in particular,
profitability has improved as a result of comprehensive cost-cutting and efficiency-boosting
programmes.
Business operations around the globe have benefited from the deployment of a customised and
uniform IT system covering the whole transport chain.
The globally standardised blueprint organisational structure allows for a standardised exchange
of information between the head office, the various regions and the offices, ensuring that stand-
ardised information is used all over the world. Hapag-Lloyd sees this as an important basis for
achieving a high productivity and ensuring that the ship and container fleets are used efficiently.
Hapag-Lloyd’s membership of alliances and various other collaborative projects makes it possi-
ble to optimise fleet deployment and expand the services provided. The executive board of
Hapag-Lloyd believes that this makes it possible to use the fleet efficiently and keeps the cost
per transport unit low, thereby ensuring increased productivity. The Fleet Support Center (FSC)
department creates an integrated energy management concept for both the Company’s own
ships as well as chartered ships. Its primary aim is to achieve optimum fleet deployment across
all trades and regions. In connection with the preparation and smooth conversion of Hapag-
Lloyd’s entire fleet to the IMO regulations on the reduction of sulphur dioxide emissions applic-
able since 1 January 2020, the FSC has made an important contribution.
Another important factor in connection with the fleet’s capacity utilisation is the turnaround fre-
quency of the containers. Each container was transported on average 4.7 times in 2019 (previous
year: 4.8 times). The average number of deployments per container per year is calculated. The
objective is to increase the turnaround frequency in order to boost productivity and keep the total
number of containers required as low as possible. Hapag-Lloyd also makes beneficial use of
modern IT systems to do this.
In the reporting period, the capacity utilisation of the container ship fleet (as measured by
total TEU capacity on the dominant leg) rose by 1.2 percentage points to 94.2% (previous
year: 93.0%).
68
H a p a g - L L o y d a g I a n n u a L R e p o R t 2 0 1 9
C o M b I n e d M a n a g e M e n t R e p o R t I b a s I C p R I n C I p L e s o f t H e g R o u p
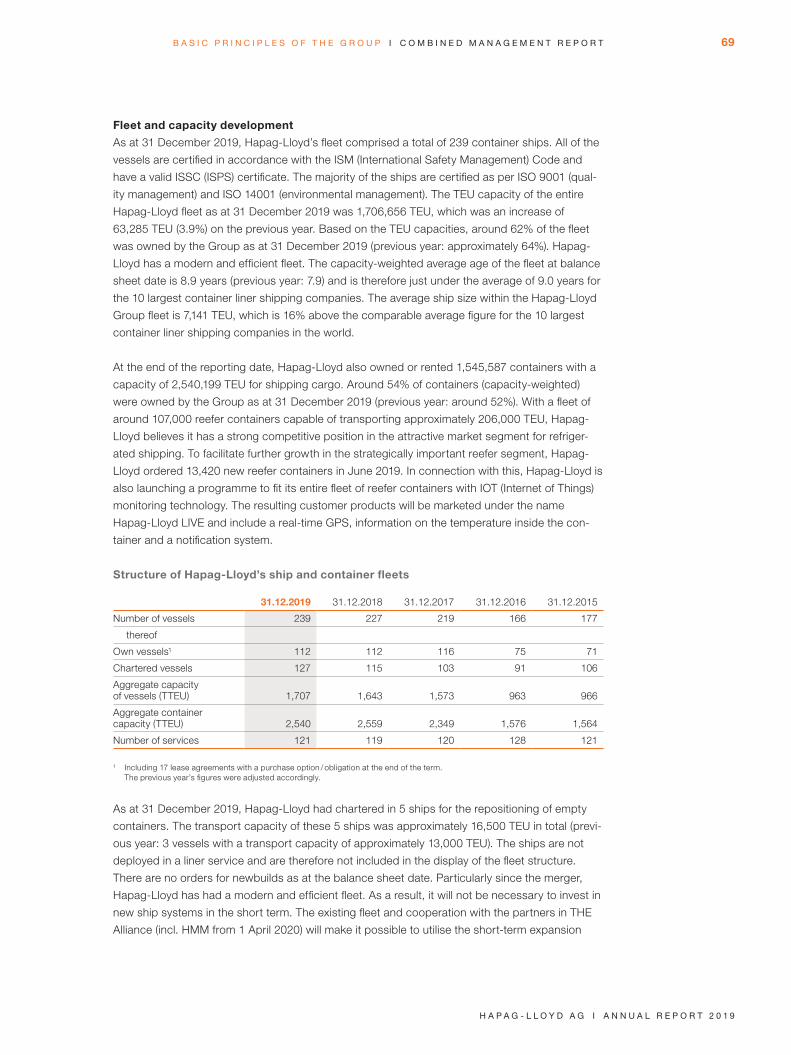
Fleet and capacity development
As at 31 December 2019, Hapag-Lloyd’s fleet comprised a total of 239 container ships. All of the
vessels are certified in accordance with the ISM (International Safety Management) Code and
have a valid ISSC (ISPS) certificate. The majority of the ships are certified as per ISO 9001 (qual-
ity management) and ISO 14001 (environmental management). The TEU capacity of the entire
Hapag-Lloyd fleet as at 31 December 2019 was 1,706,656 TEU, which was an increase of
63,285 TEU (3.9%) on the previous year. Based on the TEU capacities, around 62% of the fleet
was owned by the Group as at 31 December 2019 (previous year: approximately 64%). Hapag-
Lloyd has a modern and efficient fleet. The capacity-weighted average age of the fleet at balance
sheet date is 8.9 years (previous year: 7.9) and is therefore just under the average of 9.0 years for
the 10 largest container liner shipping companies. The average ship size within the Hapag-Lloyd
Group fleet is 7,141 TEU, which is 16% above the comparable average figure for the 10 largest
container liner shipping companies in the world.
At the end of the reporting date, Hapag-Lloyd also owned or rented 1,545,587 containers with a
capacity of 2,540,199 TEU for shipping cargo. Around 54% of containers (capacity-weighted)
were owned by the Group as at 31 December 2019 (previous year: around 52%). With a fleet of
around 107,000 reefer containers capable of transporting approximately 206,000 TEU, Hapag-
Lloyd believes it has a strong competitive position in the attractive market segment for refriger-
ated shipping. To facilitate further growth in the strategically important reefer segment, Hapag-
Lloyd ordered 13,420 new reefer containers in June 2019. In connection with this, Hapag-Lloyd is
also launching a programme to fit its entire fleet of reefer containers with IOT (Internet of Things)
monitoring technology. The resulting customer products will be marketed under the name
Hapag- Lloyd LIVE and include a real-time GPS, information on the temperature inside the con-
tainer and a notification system.
Structure of Hapag-Lloyd’s ship and container fleets
31.12.2019 31.12.2018 31.12.2017 31.12.2016 31.12.2015
Number of vessels 239 227 219 166 177
thereof
Own vessels1 112 112 116 75 71
Chartered vessels 127 115 103 91 106
Aggregate capacity of vessels (TTEU) 1,707 1,643 1,573 963 966
Aggregate container capacity (TTEU) 2,540 2,559 2,349 1,576 1,564
Number of services 121 119 120 128 121
1 Including 17 lease agreements with a purchase option / obligation at the end of the term. The previous year’s figures were adjusted accordingly.
As at 31 December 2019, Hapag-Lloyd had chartered in 5 ships for the repositioning of empty
containers. The transport capacity of these 5 ships was approximately 16,500 TEU in total (previ-
ous year: 3 vessels with a transport capacity of approximately 13,000 TEU). The ships are not
deployed in a liner service and are therefore not included in the display of the fleet structure.
There are no orders for newbuilds as at the balance sheet date. Particularly since the merger,
Hapag-Lloyd has had a modern and efficient fleet. As a result, it will not be necessary to invest in
new ship systems in the short term. The existing fleet and cooperation with the partners in THE
Alliance (incl. HMM from 1 April 2020) will make it possible to utilise the short-term expansion
69
H a p a g - L L o y d a g I a n n u a L R e p o R t 2 0 1 9
b a s I C p R I n C I p L e s o f t H e g R o u p I C o M b I n e d M a n a g e M e n t R e p o R t

opportunities resulting from market growth and to realise economies of scale in ship operations.
However, in order to remain competitive in the medium term, the Executive Board of Hapag-Lloyd
AG believes that the Group will invest in new ship systems again in the foreseeable future.
The efficiency of Hapag-Lloyd’s container ship fleet is reflected in the bunker consumption data.
Despite an increase in the volume transported (+1.4% compared with the previous year), absolute
bunker consumption fell year-on-year by 0.6% to 4,376,544 tonnes. Bunker consumption per
TEU transported therefore decreased again from 0.37 t / TEU in the previous year to 0.36 t / TEU.
Compared with 2009, bunker consumption per TEU has been cut by around 41% (2018: by
around 40%). Bunker consumption per slot (as measured by the average annual container stor-
age space) was also reduced again to 2.59 tonnes / container slot (previous year: 2.75 tonnes /
container slot).
Bunker consumption of the Hapag-Lloyd Group
Tons (t) 2019 2018
MFO (High Sulphur) 3,658,488 3,841,488
MDO, MFO (Low Sulphur) 718,066 562,408
Total bunker consumption 4,376,554 4,403,896
Efficient transport services
In container liner shipping, the flow of goods to and from different regions varies in terms of size
and structure. This is due to volume differences in the import and export of goods. Most trades
therefore have a “dominant leg” with a higher cargo volume and a “non-dominant leg” with a
lower transport volume.
Imbalances in the world’s biggest trades
Cargo value in TTEU 2019 2018
Transatlantic trade
Europe - North America 4,737 4,468
North America - Europe 2,687 2,636
Far East trade
Asia - Europe 14,430 14,121
Europe - Asia 6,319 6,413
Transpacific trade
Asia - North America 17,739 18,030
North America - Asia 7,119 7,415
Source: Seabury, December 2019, figures rounded.
The transport capacities must be planned to meet the volumes on the dominant leg. The return
transport of empty containers also produces costs. The relevant performance indicator here is
the ratio of loaded containers on the dominant leg to the number of loaded containers on the
non-dominant leg. The objective is to keep the number of empty container transport operations
low or balance the ratio to the greatest possible extent. Furthermore, empty containers should be
repositioned into the regions with high demand via the shortest, quickest and cheapest route.
70
H a p a g - L L o y d a g I a n n u a L R e p o R t 2 0 1 9
C o M b I n e d M a n a g e M e n t R e p o R t I b a s I C p R I n C I p L e s o f t H e g R o u p
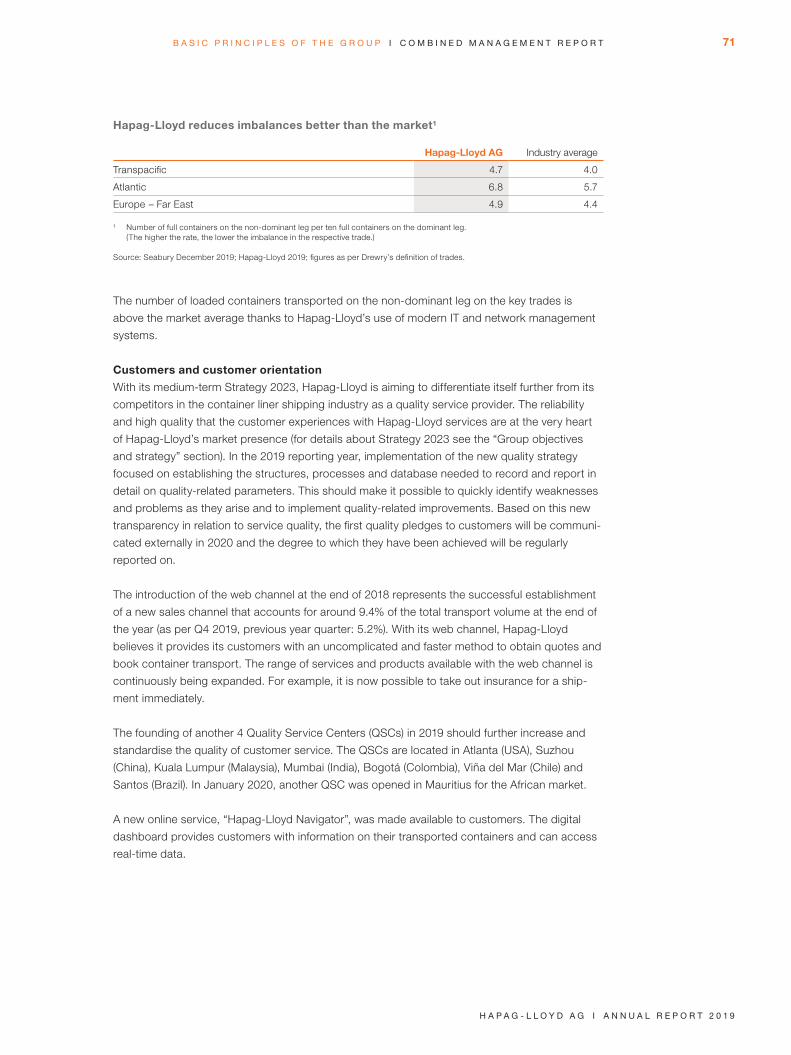
Hapag-Lloyd reduces imbalances better than the market1
Hapag-Lloyd AG Industry average
Transpacific 4.7 4.0
Atlantic 6.8 5.7
Europe - Far East 4.9 4.4
1 Number of full containers on the non-dominant leg per ten full containers on the dominant leg. (The higher the rate, the lower the imbalance in the respective trade.) Source: Seabury December 2019; Hapag-Lloyd 2019; figures as per Drewry’s definition of trades.
The number of loaded containers transported on the non-dominant leg on the key trades is
above the market average thanks to Hapag-Lloyd’s use of modern IT and network management
systems.
Customers and customer orientation
With its medium-term Strategy 2023, Hapag-Lloyd is aiming to differentiate itself further from its
competitors in the container liner shipping industry as a quality service provider. The reliability
and high quality that the customer experiences with Hapag-Lloyd services are at the very heart
of Hapag-Lloyd’s market presence (for details about Strategy 2023 see the “Group objectives
and strategy” section). In the 2019 reporting year, implementation of the new quality strategy
focused on establishing the structures, processes and database needed to record and report in
detail on quality-related parameters. This should make it possible to quickly identify weaknesses
and problems as they arise and to implement quality-related improvements. Based on this new
transparency in relation to service quality, the first quality pledges to customers will be communi-
cated externally in 2020 and the degree to which they have been achieved will be regularly
reported on.
The introduction of the web channel at the end of 2018 represents the successful establishment
of a new sales channel that accounts for around 9.4% of the total transport volume at the end of
the year (as per Q4 2019, previous year quarter: 5.2%). With its web channel, Hapag-Lloyd
believes it provides its customers with an uncomplicated and faster method to obtain quotes and
book container transport. The range of services and products available with the web channel is
continuously being expanded. For example, it is now possible to take out insurance for a ship-
ment immediately.
The founding of another 4 Quality Service Centers (QSCs) in 2019 should further increase and
standardise the quality of customer service. The QSCs are located in Atlanta (USA), Suzhou
(China), Kuala Lumpur (Malaysia), Mumbai (India), Bogotá (Colombia), Viña del Mar (Chile) and
Santos (Brazil). In January 2020, another QSC was opened in Mauritius for the African market.
A new online service, “Hapag-Lloyd Navigator”, was made available to customers. The digital
dashboard provides customers with information on their transported containers and can access
real-time data.
71
H a p a g - L L o y d a g I a n n u a L R e p o R t 2 0 1 9
b a s I C p R I n C I p L e s o f t H e g R o u p I C o M b I n e d M a n a g e M e n t R e p o R t

Top clients are supported globally and locally by the Global Account Management team in Ham-
burg and in the regional head offices. This is suppposed to enable the Company to establish and
maintain long-standing, sustainable customer relationships. The Key Account Programme also
ensures that top regional clients receive particular care and attention. In doing so, Hapag-Lloyd
aims to achieve a high degree of customer satisfaction and on having a diversified portfolio of
customers comprising both direct customers and shipping companies, with the latter ensuring a
permanent regular supply of cargo volumes.
The Global Industry Management team pools expertise and develops customised solutions for
particular market segments, such as the chemical industry. There are also special departments
for the international support of reefer, special cargo and dangerous goods customers.
Contractual relationships of up to 12 months generally exist with direct customers. Direct
customers allow Hapag-Lloyd to plan the required transport capacity better because of the
framework agreements concluded with them. Hapag-Lloyd has a balanced customer base,
as demonstrated by the fact that its 50 largest customers represent considerably less than
50% of its cargo volume. In total, transports were completed for approximately 30,600 cus-
tomers in the 2019 financial year (previous year: approximately 30,200 customers).
A breakdown of the goods shipped according to product category shows a relatively balanced
distribution. No individual product category accounted for a share of over 16% during the past
financial year.
Transport volume by product category in 2019
Product Category Share 2019
in %Share 2018
in %
Food products 16 16
Plastic products 14 14
Chemical products 14 14
Paper and wood products 9 10
Mechanical products 9 9
Raw materials 8 8
Textiles 8 8
Automotive parts 6 6
Electronic products 5 5
Furniture 5 5
Other products 7 5
Total 100 100
This means that the economic cycles affecting individual sectors have relatively little impact on
developments in the transport volume. In a normal economic environment, the volume trans-
ported will therefore increase continuously.
72
H a p a g - L L o y d a g I a n n u a L R e p o R t 2 0 1 9
C o M b I n e d M a n a g e M e n t R e p o R t I b a s I C p R I n C I p L e s o f t H e g R o u p
RESEARCH AND DEVELOPMENT
In the framework of the provisions of the International Maritime Organization (IMO) on the reduc-
tion of sulphur dioxide emissions applicable from 2020, Hapag-Lloyd will test operation with
liquefied natural gas (LNG) by converting a large ship (15,000 TEU vessel “Sajir”). The engine
system will be able to operate with a dual fuel system in future, i.e. operation will be possible with
both LNG and low-sulphur fuel. With the conversion of the “Sajir”, Hapag-Lloyd will be the first
shipping line worldwide to convert a container ship of this size to LNG propulsion. It is a unique
pilot project to date, through which Hapag-Lloyd hopes to gain insights that will pave the way for
future conversions of large ships to this alternative fuel.
The “Sajir” is one of the 17 ships in Hapag-Lloyd’s fleet initially designed for LNG readiness. The
16 sister ships are also technically prepared for retrofitting. By converting the “Sajir”, Hapag-
Lloyd is implementing a technological option to reduce the environmental impact of large ships.
The use of LNG in the shipping industry could reduce CO2 emissions in part and emissions of
sulphur dioxide, nitrogen oxides and particulates to a large extent. In October 2019, Hapag-Lloyd
received a Maritime Standard’s Green Shipping award in Dubai for its project to convert the
“Sajir” to LNG propulsion. With this award, the jury honoured the “trend-setting” contribution to
environmentally compatible shipping and the improvement of environmental protection. After the
necessary conversions, the “Sajir” is expected to start operation in the third quarter of 2020.
Apart from this, Hapag-Lloyd does not pursue any noteworthy research and development activi-
ties of its own. Expenses relating to the modernisation and optimisation of the IT systems and
software components (IT) developed in-house are recorded in operating expenses. The IT sys-
tem developed by the Company is constantly being improved.
The use of modern, networked systems guarantees a swift exchange of data between partners
in the transport chain around the world. This places considerable demands on the IT systems
used. Some examples of how IT systems are used for container shipping are presented here:
operating empty legs as efficiently as possible using modern forecast algorithms as part of the
Company’s equipment deficit action planning, using IT-supported processes in yield manage-
ment to determine the earnings contribution of container shipments, writing quotations, profit-
oriented cargo volume management, and also designing new shipment services. Special IT sys-
tems support the efficient commissioning and invoicing of terminal services. The use of efficient
IT solutions is also particularly important in trans-shipment planning and commissioning.
The IT systems are continuously being enhanced, and new opportunities which are arising as
a particular result of digitalisation are being identified. For example, the Digital Business and
Transformation specialist department was set up in 2017 and works closely with the various
regions, the IT department and other specialist departments to develop new, digitally available
services and business models. Furthermore, a new IT product development unit was estab-
lished in Gdansk in the second half of 2019 to strengthen IT development capacity.
73
H a p a g - L L o y d a g I a n n u a L R e p o R t 2 0 1 9
b a s I C p R I n C I p L e s o f t H e g R o u p I C o M b I n e d M a n a g e M e n t R e p o R t

The security of Hapag-Lloyd AG’s central IT systems is continuously monitored, managed and
improved. In addition, Hapag-Lloyd maintains continuous contact with external security experts.
To minimise potential future financial risks as a result of cyberattacks, corresponding service
agreements with external partners are in place. The systems essential for ship operations are not
connected to the IT system on land, which means that there is currently no risk of cyberattacks
on ships. A separate security review is conducted for the security of the operating systems on
our ships.
EMPLOYEES
The Hapag-Lloyd Group employed 12,996 persons as at 31 December 2019 (previous year:
12,765 persons). 2,072 people were employed in the marine division as at 31 December 2019
(previous year: 1,970). The number of shore-based employees increased by 130, from 10,561 in
the previous year to 10,691 employees. The increase was largely due to the expansion of the
Quality Service Centers. The average period of employment for shore-based staff is around
8.5 years (previous year 8.7 years).
Number of employees1
31.12.2019 31.12.2018 31.12.2017 31.12.2016 31.12.2015
Marine personnel 2,072 1,970 2,007 1,295 1,411
Shore-based personnel 10,691 10,561 10,304 7,895 7,771
Apprentices 233 234 256 223 235
Total 12,996 12,765 12,567 9,413 9,417
1 The figures from 2017 onwards relate to the Hapag-Lloyd Group, including UASC.
There is a strong focus on vocational training and qualifications for both the shore-based and
marine employees. Hapag-Lloyd attaches particular importance to extensive, high-quality train-
ing. The proportion of those offered jobs at the end of their training is generally between 80%
and 90% (2019: 87%). As at 31 December 2019, Hapag-Lloyd employed a total of 132 appren-
tices in shore-based positions and 101 at sea (previous year: 127 shore-based and 107 at sea).
74
H a p a g - L L o y d a g I a n n u a L R e p o R t 2 0 1 9
C o M b I n e d M a n a g e M e n t R e p o R t I b a s I C p R I n C I p L e s o f t H e g R o u p

ECONOMIC REPORT
GENERAL ECONOMIC CONDITIONS
The pace at which the global economy grows and, by extension, at which global trade expands
is a significant factor that influences demand for container shipping services and thus the devel-
opment of the container shipping companies’ cargo volumes. According to the International
Monetary Fund (IMF, World Economic Outlook, January 2020), the global economy grew by 2.9%
in 2019 (previous year: 3.6%), the lowest amount since the financial crisis of 2009. Global eco-
nomic growth was therefore significantly below the original prediction of 3.5% for 2019 (IMF,
World Economic Outlook, January 2019). In its current economic outlook, the IMF expects global
economic growth of 3.3% in 2020 and 3.4% in 2021.
According to the IMF, 2019 was marked by a synchronised slowdown of economic growth in
large industrial nations like the USA, and especially the eurozone and the Asian industrial nations.
It was even more pronounced in the emerging markets of Brazil, China, India, Mexico and Rus-
sia. Industrial production in particular recorded a weak year. In the second half of the year there
were even partial declines in industrial production. The weakness in industrial production was
caused by problems in the automotive industry (such as stricter environmental regulations and
uncertainty regarding new technologies), the poor business climate resulting from US trade con-
flicts (especially with China), and slow structural growth in the People’s Republic of China. In
addition, economic conditions deteriorated in some key developing and emerging markets,
such as Brazil and Turkey.
The volume of global trade, which is key to the demand for container shipping services,
increased by just 1.0% in 2019 (previous year: 3.7%) because of the factors mentioned above.
According to the IMF, however, the volume of global trade will recover again in the next two
years, rising by 2.9% in 2020 and 3.7% in 2021. At the beginning of 2019, the IMF forecast
growth in the volume of global trade of 4.0%. This prediction had to be revised significantly
downwards due to the ongoing trade dispute between the USA and China as well as geopoliti-
cal risks and local problems in individual developing and emerging markets such as India,
Saudi Arabia, Mexico, Chile and South Africa.
Developments in global economic growth (GDP) and world trading volume
in % 2021e 2020e 2019 2018 2017 2016 2015
Global economic growth 3.4 3.3 2.9 3.6 3.8 3.4 3.5
Industrialised countries 1.6 1.6 1.7 2.2 2.5 1.7 2.3
Developing and newly industrialised countries 4.6 4.4 3.7 4.5 4.8 4.6 4.3
World trading volume (goods and services) 3.7 2.9 1.0 3.7 5.7 2.3 2.8
Source: IMF, January 2020
75
H a p a g - L L o y d a g I a n n u a L R e p o R t 2 0 1 9
e C o n o M I C R e p o R t I C o M b I n e d M a n a g e M e n t R e p o R t
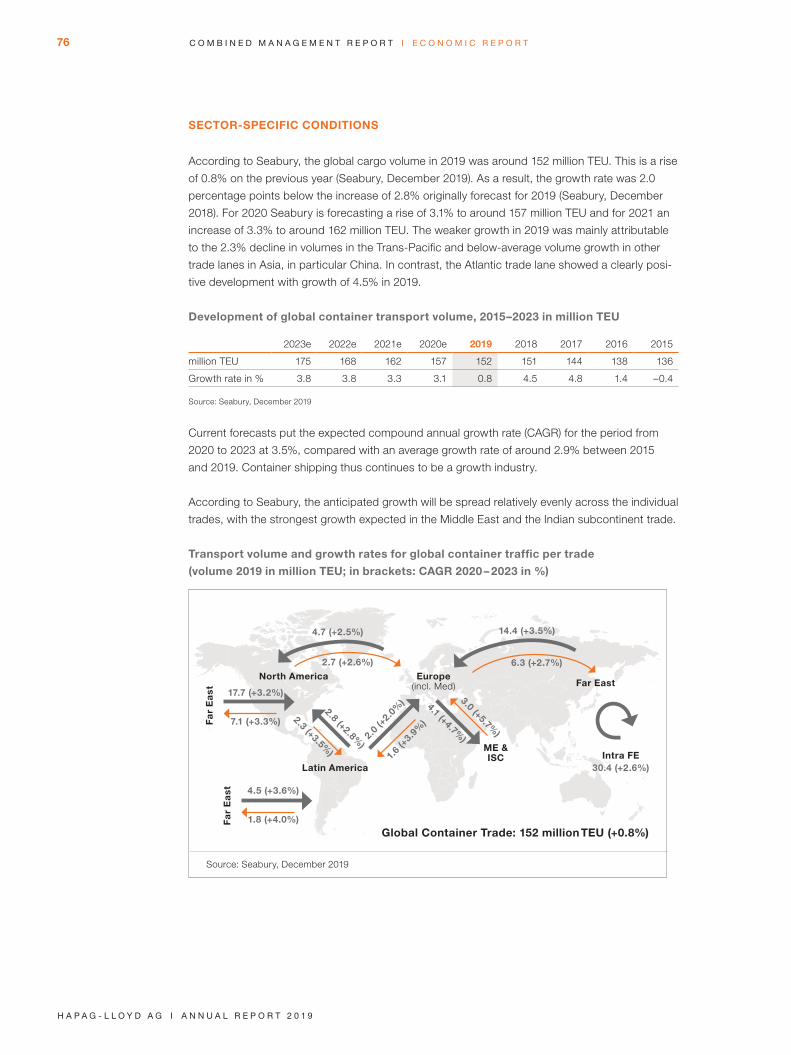
SECTOR-SPECIFIC CONDITIONS
According to Seabury, the global cargo volume in 2019 was around 152 million TEU. This is a rise
of 0.8% on the previous year (Seabury, December 2019). As a result, the growth rate was 2.0
percentage points below the increase of 2.8% originally forecast for 2019 (Seabury, December
2018). For 2020 Seabury is forecasting a rise of 3.1% to around 157 million TEU and for 2021 an
increase of 3.3% to around 162 million TEU. The weaker growth in 2019 was mainly attributable
to the 2.3% decline in volumes in the Trans-Pacific and below-average volume growth in other
trade lanes in Asia, in particular China. In contrast, the Atlantic trade lane showed a clearly posi-
tive development with growth of 4.5% in 2019.
Development of global container transport volume, 2015–2023 in million TEU
2023e 2022e 2021e 2020e 2019 2018 2017 2016 2015
million TEU 175 168 162 157 152 151 144 138 136
Growth rate in % 3.8 3.8 3.3 3.1 0.8 4.5 4.8 1.4 –0.4
Source: Seabury, December 2019
Current forecasts put the expected compound annual growth rate (CAGR) for the period from
2020 to 2023 at 3.5%, compared with an average growth rate of around 2.9% between 2015
and 2019. Container shipping thus continues to be a growth industry.
According to Seabury, the anticipated growth will be spread relatively evenly across the individual
trades, with the strongest growth expected in the Middle East and the Indian subcontinent trade.
Transport volume and growth rates for global container traffic per trade
(volume 2019 in million TEU; in brackets: CAGR 2020 – 2023 in %)
Source: Seabury, December 2019
Fa
r E
ast
Fa
r E
ast
Latin America
North AmericaFar East
Intra FEME & ISC
Europe(incl. Med)
4.7 (+2.5%) 14.4 (+3.5%)
17.7 (+3.2%) 3.0 (+5.7%)2.0
(+2.0
%)
2.8 (+2.8%)
30.4 (+2.6%)
4.5 (+3.6%)
7.1 (+3.3%)
4.1 (+4.7%)
1.6
(+3.9
%)2.3 (+3.5%
)
1.8 (+4.0%)
2.7 (+2.6%) 6.3 (+2.7%)
Global Container Trade: 152 million TEU (+0.8%)
76
H a p a g - L L o y d a g I a n n u a L R e p o R t 2 0 1 9
C o M b I n e d M a n a g e M e n t R e p o R t I e C o n o M I C R e p o R t

While the rate of global trade growth determines the demand for container shipping services,
putting new vessels into service and scrapping inefficient, older ones are the most important
factors influencing the supply of transport capacities. Supply has grown at a faster pace than
demand in recent years as a result of new and particularly large container ships continually
being put into service. Despite the continuous increase in the supply of transport capacity,
freight rates made a strong recovery from the lows recorded in 2016, due to the growing global
demand for container transport services in 2019.
At the end of 2019, the aggregate capacity of the global container ship fleet was approximately
22.9 million TEU (Drewry Container Forecaster Q4 2019, December 2019), a rise of 3.7% on the
previous year. Based on the container ships on order and planned deliveries, the globally availa-
ble transport capacity should see an increase of around 0.8 million TEU in 2020 (+3.7%) (Drewry
Container Forecaster Q4 2019, December 2019). This includes the expected delays of deliver-
ies in 2020 and the expected scrapping. While the scrapping of old ships remained at a very
low level of approximately 200,000 TEU in 2019, scrapping is expected to increase to around
350,000 TEU in 2020. The idle fleet consisted of 133 ships with a capacity of around 1.4 mil-
lion TEU at the end of 2019. The majority of the idle fleet comprised smaller ship sizes of up to
5,100 TEU. The relatively high number of idle ships is due in part to the retrofitting of ships with
exhaust gas cleaning systems (known as scrubbers) as part of the preparations for IMO 2020.
The tonnage of the commissioned container ships under construction of approximately 2.3 mil-
lion TEU (MDS Transmodal, January 2020) is equivalent to around 10% of the present global
container fleet’s capacity (approximately 22.9 million TEU). This is a historically low level and well
below the highest level seen to date, which was around 61% in 2007, and the average over the
last 5 years (around 14%).
In 2019, orders were placed for the construction of 77 container ships with a transport capacity
totalling approximately 0.8 million TEU (Clarksons Research, January 2020). This means that
there was a significant decrease in the number and capacity of newbuilds on order compared
with the previous year with orders for 197 container ships with a capacity of 1.2 million TEU.
Newbuild orders are also below the average of the last 10 years (around 1 million TEU). Measured
in terms of the transport capacity of the newbuilds ordered, approximately 81% of the ships have
a capacity of over 10,000 TEU (MDS Transmodal, January 2020).
In total, 126 container ships with a capacity of 1.0 million TEU were put into service last year.
21 of the ships delivered were bigger than 20,000 TEU (MDS Transmodal, January 2019).
77
H a p a g - L L o y d a g I a n n u a L R e p o R t 2 0 1 9
e C o n o M I C R e p o R t I C o M b I n e d M a n a g e M e n t R e p o R t

Expected development of global container fleet capacity
million TEU 2021 2020 2019 2018
Existing fleet (beginning of the year) 23.7 22.9 22.1 20.9
Planned deliveries 1.3 1.3 1.1 1.5
Scrappings 0.4 0.4 0.2 0.1
Postponed deliveries 0.1 0.1 0.1 0.2
Net capacity growth 0.8 0.8 0.8 1.2
Source: Drewry Container Forecaster Q4 2019, figures rounded
Although the prospects for growth remain positive in the medium term, there may be temporary
imbalances in supply and demand, which could have a substantial impact on the respective
transport volumes and freight rates. For example, according to industry experts (Drewry Con-
tainer Forecaster Q4 2019) as additional larger ships with a transport capacity of more than
20,000 TEU go into service, transport capacities increase sharply and could negatively affect
the development of freight rates in all the trades.
Transport volumes and freight rates in container liner shipping are subject to seasonal fluctua-
tions. Demand for transport services is traditionally higher in the second and particularly the
third quarter of any given year.
The fuel cost level in the shipping industry is largely linked to the development of the crude oil
price. This stood at USD 66.00 / barrel (Bloomberg) as at 31 December 2019 and was therefore
around 23% higher than at the start of the year (31 December 2018: USD 53.80 / barrel). At the
beginning of the year, the crude oil price continued to rise and reached its high point of the year
of USD 74.57 / barrel at the end of April (Bloomberg). During the course of the year, the oil price
fell again and varied between USD 56 / barrel and USD 69 / barrel.
Due to the regulations of the International Maritime Organization (IMO) to reduce sulphur dioxide
emissions coming into effect in 2020, a large part of the world fleet will run on new low-sulphur
fuel with a sulphur content of 0.5% (currently 3.5%). This new fuel had to be bunkered during
the fourth quarter of 2019 to ensure that the thresholds are met starting from 1 January 2020.
This new low-sulphur bunker is significantly more expensive than the bunker used until now. In
December 2019, the average price difference between high and low sulphur bunker was
USD 283 per tonne (price difference based on Rotterdam HSFO 3.5% vs. MFO 0.5%). Shipping
companies therefore face substantial additional costs from the end of 2019. Hapag-Lloyd aims
to pass on these additional costs to customers. Hapag-Lloyd, along with all other large con-
tainer liner shipping companies, has already published new calculation methods for the fuel
surcharges, which were implemented over the course of 2019.
78
H a p a g - L L o y d a g I a n n u a L R e p o R t 2 0 1 9
C o M b I n e d M a n a g e M e n t R e p o R t I e C o n o M I C R e p o R t
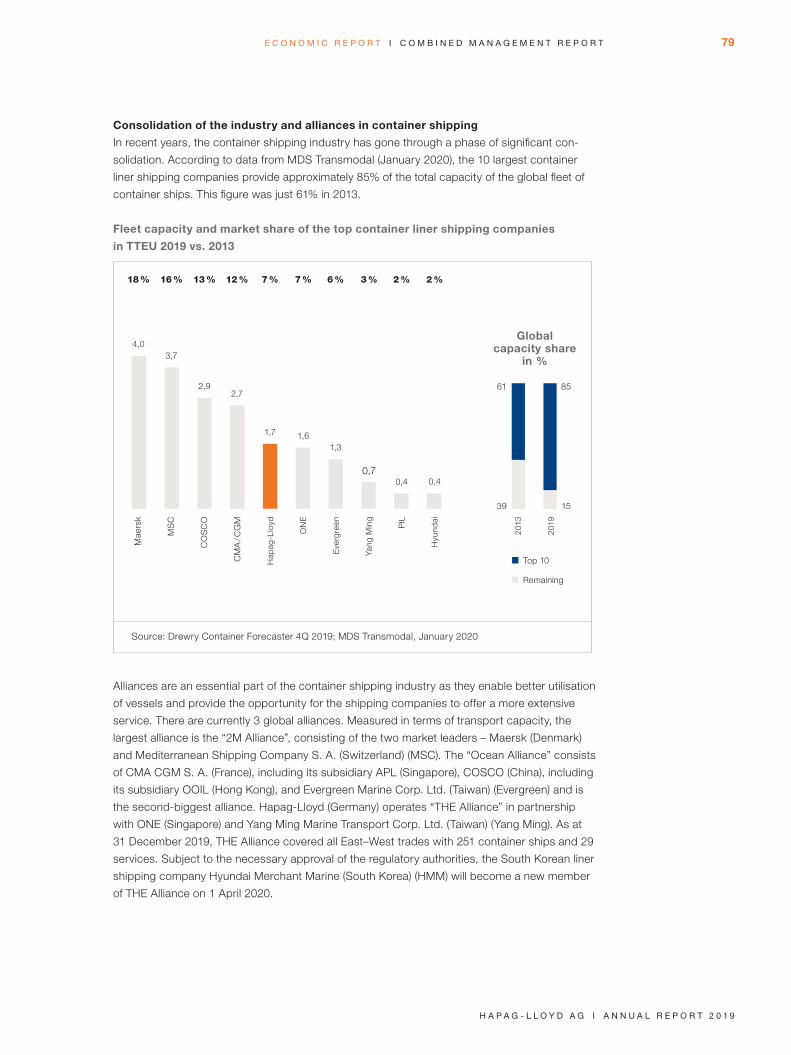
Consolidation of the industry and alliances in container shipping
In recent years, the container shipping industry has gone through a phase of significant con-
solidation. According to data from MDS Transmodal (January 2020), the 10 largest container
liner shipping companies provide approximately 85% of the total capacity of the global fleet of
container ships. This figure was just 61% in 2013.
Fleet capacity and market share of the top container liner shipping companies
in TTEU 2019 vs. 2013
Alliances are an essential part of the container shipping industry as they enable better utilisation
of vessels and provide the opportunity for the shipping companies to offer a more extensive
service. There are currently 3 global alliances. Measured in terms of transport capacity, the
largest alliance is the “2M Alliance”, consisting of the two market leaders – Maersk (Denmark)
and Mediterranean Shipping Company S. A. (Switzerland) (MSC). The “Ocean Alliance” consists
of CMA CGM S. A. (France), including its subsidiary APL (Singapore), COSCO (China), including
its subsidiary OOIL (Hong Kong), and Evergreen Marine Corp. Ltd. (Taiwan) (Evergreen) and is
the second-biggest alliance. Hapag-Lloyd (Germany) operates “THE Alliance” in partnership
with ONE (Singapore) and Yang Ming Marine Transport Corp. Ltd. (Taiwan) (Yang Ming). As at
31 December 2019, THE Alliance covered all East–West trades with 251 container ships and 29
services. Subject to the necessary approval of the regulatory authorities, the South Korean liner
shipping company Hyundai Merchant Marine (South Korea) (HMM) will become a new member
of THE Alliance on 1 April 2020.
Source: Drewry Container Forecaster 4Q 2019; MDS Transmodal, January 2020
4,03,7
2,92,7
1,7 1,61,3
0,70,4 0,4
Mae
rsk
MS
C
CO
SC
O
CM
A /
CG
M
Hap
ag-L
loyd
ON
E
Eve
rgre
en
Yang
Min
g
PIL
Hyu
ndai
2013
2019
18 % 16 % 13 % 12 % 7 % 7 % 6 % 3 % 2 % 2 %
Global capacity share
in %
■ Top 10
■ Remaining
39 15
61 85
79
H a p a g - L L o y d a g I a n n u a L R e p o R t 2 0 1 9
e C o n o M I C R e p o R t I C o M b I n e d M a n a g e M e n t R e p o R t

Capacity share of alliances in East–West trades
Alliance Far East
tradeTranspacific
tradeAtlantic
trade
2M in % 40 22 45
Ocean Alliance in % 36 41 13
THE Alliance in % 24 26 36
Other in % 0 12 6
Source: Alphaliner, December 2019
Report on the Hapag-Lloyd Group’s forecast development in 2019
compared with the forecast
The transport volume rose by 1.4% in the reporting period. It was thus at about the previous
year’s level and did not quite fulfil the expectation of a “slightly increasing” transport volume. The
reason for this deviation was the weaker than expected market development. The volume of
global trade, which is key to the demand for container shipping services, increased by just 1.0%
in 2019. At the beginning of 2019, the International Monetary Fund (IMF) forecast growth in world
trade volume of 4.0% (IMF World Economic Outlook January 2019 and January 2020). Seabury
also significantly lowered its forecast during the year. Whereas at the start of the year, Seabury
expected growth in global freight volume in 2019 to grow by 2.8%, industry experts’ most recent
analyses show projected growth of only 0.8% in 2019 (Seabury, December 2019).
The average bunker consumption price in 2019 was 1.2% below the previous year and therefore
developed differently from the original forecast. This had predicted a moderately increasing
bunker consumption price at the beginning of 2019. The drop in bunker consumption prices in
the fourth quarter of 2019 in particular led to a drop in the average bunker consumption price
for the entire 2019 year. This was at about the level of the previous year’s average.
Hapag-Lloyd’s average freight rate increased slightly by 2.7% and was thus as expected.
Both the EBITDA and the EBIT were at the upper end of the ranges forecast at the beginning
of the year of 1.6 – 2.0 billion EUR (EBITDA) and 0.5 – 0.9 billion EUR (EBIT). The forecast has
therefore been met.
80
H a p a g - L L o y d a g I a n n u a L R e p o R t 2 0 1 9
C o M b I n e d M a n a g e M e n t R e p o R t I e C o n o M I C R e p o R t

Actual Value 2019
Actual Value 2018
Change Forecast in the Group management report as at 31.12.2018
transport volume (tteu)
12,037 11,874 1.4% Increasing slightly
average bunker consumption price (Mfo + Mdo, usd / t)
416 421 -1.2% Increasing moderately
average freight rate Hapag-Lloyd (usd / teu)
1,072 1,044 +2.7% Increasing slightly
ebItda (million euR)1
1,985.7 1,138.6 +847.1 EUR 1.6 - 2.0 billion
ebIt (million euR)1
811.4 443.5 +367.9 EUR 0.5 - 0.9 billion
1 Due to the adjustment of the structure of the consolidated income statement, the items in the consolidated income statement have changed. The comparability of the previous year’s values are thus limited. For a better comparability with the current reporting period, the previous year’s values have been adjusted, see also chapter “Change of presentation in the consolidated income state-ment” in the Notes to the consolidated financial statements
EARNINGS, FINANCIAL AND NET ASSET POSITION
Due to the first-time application of IFRS 16 Leases, the earnings and financial positions are
only comparable with the corresponding prior year period to a limited degree. Unless stated
otherwise, the figures for 2018 refer to the regulations for leases pursuant to IAS 17.
To increase transparency and standardise the externally communicated structure of the income
statement in line with the management perspective, Hapag-Lloyd has changed the presentation
of the consolidated income statement since 1 January 2019. As a result, the previous period’s
values have been adjusted in line with the new presentation. The change in presentation has led
to modifications within the income statement compared to the values reported in the annual
report 2018.
81
H a p a g - L L o y d a g I a n n u a L R e p o R t 2 0 1 9
e C o n o M I C R e p o R t I C o M b I n e d M a n a g e M e n t R e p o R t
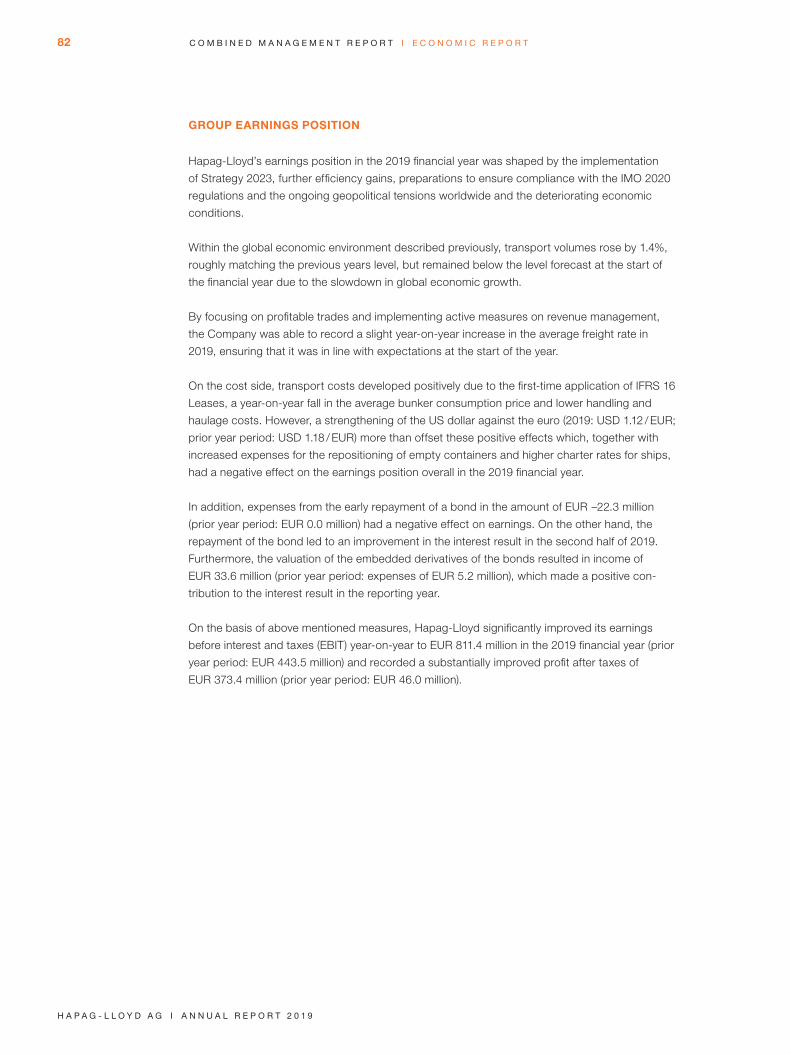
GROUP EARNINGS POSITION
Hapag-Lloyd’s earnings position in the 2019 financial year was shaped by the implementation
of Strategy 2023, further efficiency gains, preparations to ensure compliance with the IMO 2020
regulations and the ongoing geopolitical tensions worldwide and the deteriorating economic
conditions.
Within the global economic environment described previously, transport volumes rose by 1.4%,
roughly matching the previous years level, but remained below the level forecast at the start of
the financial year due to the slowdown in global economic growth.
By focusing on profitable trades and implementing active measures on revenue management,
the Company was able to record a slight year-on-year increase in the average freight rate in
2019, ensuring that it was in line with expectations at the start of the year.
On the cost side, transport costs developed positively due to the first-time application of IFRS 16
Leases, a year-on-year fall in the average bunker consumption price and lower handling and
haulage costs. However, a strengthening of the US dollar against the euro (2019: USD 1.12 / EUR;
prior year period: USD 1.18 / EUR) more than offset these positive effects which, together with
increased expenses for the repositioning of empty containers and higher charter rates for ships,
had a negative effect on the earnings position overall in the 2019 financial year.
In addition, expenses from the early repayment of a bond in the amount of EUR -22.3 million
(prior year period: EUR 0.0 million) had a negative effect on earnings. On the other hand, the
repayment of the bond led to an improvement in the interest result in the second half of 2019.
Furthermore, the valuation of the embedded derivatives of the bonds resulted in income of
EUR 33.6 million (prior year period: expenses of EUR 5.2 million), which made a positive con-
tribution to the interest result in the reporting year.
On the basis of above mentioned measures, Hapag-Lloyd significantly improved its earnings
before interest and taxes (EBIT) year-on-year to EUR 811.4 million in the 2019 financial year (prior
year period: EUR 443.5 million) and recorded a substantially improved profit after taxes of
EUR 373.4 million (prior year period: EUR 46.0 million).
82
H a p a g - L L o y d a g I a n n u a L R e p o R t 2 0 1 9
C o M b I n e d M a n a g e M e n t R e p o R t I e C o n o M I C R e p o R t
Consolidated income statement
million EUR 1.1.-31.12.2019 1.1.-31.12.20181
Revenue 12,607.9 11,617.5
Transport expenses 9,707.0 9,586.4
Personnel expenses 682.5 645.0
Depreciation, amortisation and impairment 1,174.4 695.1
Other operating result –268.8 –290.9
Operating result 775.2 400.1
Share of profit of equity-accounted investees 35.5 30.7
Result from investments and securities 0.7 12.7
Earnings before interest and taxes (EBIT) 811.4 443.5
Interest result –396.7 –365.2
Other financial items 1.6 –0.5
Income taxes 42.9 31.8
Group profit / loss 373.4 46.0
thereof profit / loss attributable to shareholders of Hapag-Lloyd AG 362.0 36.8
thereof profit / loss attributable to non-controlling interests 11.4 9.2
Basic / diluted earnings per share (in EUR) 2.06 0.21
EBITDA 1,985.8 1,138.6
EBITDA margin (%) 15.8 9.8
EBIT 811.4 443.5
EBIT margin (%) 6.4 3.8
1 Due to the adjustment of the structure of the consolidated income statement, the items in the consolidated income statement have changed. The comparability of the previous year’s values are thus limited. For a better comparability with the current reporting period, the previous year’s values have been adjusted, see also chapter “Change of presentation in the consolidated income state-ment” in the Notes to the consolidated financial statements. Due to the first-time application of IFRS 16 Leases, the comparability with the corresponding prior year period is limited.
Transport volume
The transport volume increased by 163 TTEU to 12,037 TTEU in the 2019 financial year
(prior year period: 11,874 TTEU). This equates to a rise of 1.4%.
The continued strength of the domestic economy in the USA enabled a moderate year-on-year
increase in the transport volume on the Atlantic trade. On the Far East trade, the year-on-year
rise was due to a rising market growth and increased vessel capacity. At the same time, the
transport volume on the EMA trade grew significantly as a result of the introduction of new ser-
vices in the 2019 financial year. The decrease in the transport volume on the Transpacific trade
was largely due to the trade dispute between the USA and China. By contrast, the decline in the
transport volume on the Intra-Asia trade was the result of a strategic decision to actively reduce
the transport capacity on this trade and focus instead on profitable services. Adjusted for the
Intra-Asia trade, the transport volume grew by 2.8% year-on-year.
83
H a p a g - L L o y d a g I a n n u a L R e p o R t 2 0 1 9
e C o n o M I C R e p o R t I C o M b I n e d M a n a g e M e n t R e p o R t
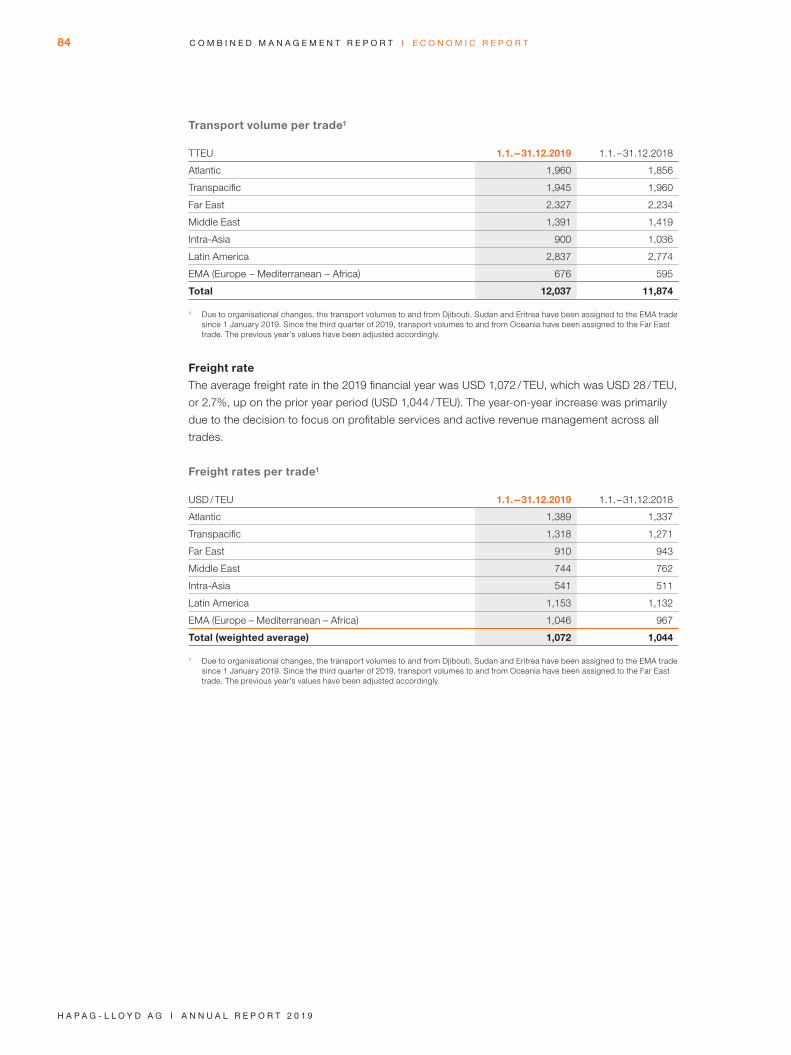
Transport volume per trade1
TTEU 1.1.-31.12.2019 1.1.-31.12.2018
Atlantic 1,960 1,856
Transpacific 1,945 1,960
Far East 2,327 2,234
Middle East 1,391 1,419
Intra-Asia 900 1,036
Latin America 2,837 2,774
EMA (Europe - Mediterranean - Africa) 676 595
Total 12,037 11,874
1 Due to organisational changes, the transport volumes to and from Djibouti, Sudan and Eritrea have been assigned to the EMA trade since 1 January 2019. Since the third quarter of 2019, transport volumes to and from Oceania have been assigned to the Far East trade. The previous year’s values have been adjusted accordingly.
Freight rate
The average freight rate in the 2019 financial year was USD 1,072 / TEU, which was USD 28 / TEU,
or 2.7%, up on the prior year period (USD 1,044 / TEU). The year-on-year increase was primarily
due to the decision to focus on profitable services and active revenue management across all
trades.
Freight rates per trade1
USD / TEU 1.1.-31.12.2019 1.1.-31.12.2018
Atlantic 1,389 1,337
Transpacific 1,318 1,271
Far East 910 943
Middle East 744 762
Intra-Asia 541 511
Latin America 1,153 1,132
EMA (Europe – Mediterranean – Africa) 1,046 967
Total (weighted average) 1,072 1,044
1 Due to organisational changes, the transport volumes to and from Djibouti, Sudan and Eritrea have been assigned to the EMA trade since 1 January 2019. Since the third quarter of 2019, transport volumes to and from Oceania have been assigned to the Far East trade. The previous year’s values have been adjusted accordingly.
84
H a p a g - L L o y d a g I a n n u a L R e p o R t 2 0 1 9
C o M b I n e d M a n a g e M e n t R e p o R t I e C o n o M I C R e p o R t
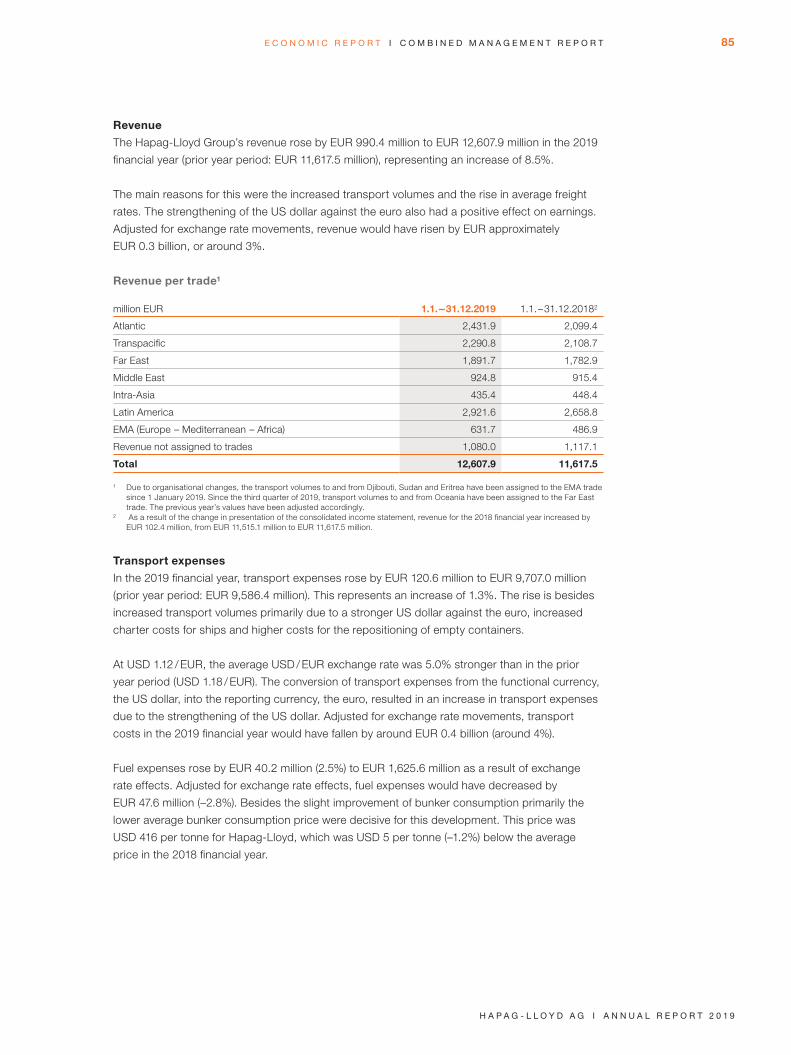
Revenue
The Hapag-Lloyd Group’s revenue rose by EUR 990.4 million to EUR 12,607.9 million in the 2019
financial year (prior year period: EUR 11,617.5 million), representing an increase of 8.5%.
The main reasons for this were the increased transport volumes and the rise in average freight
rates. The strengthening of the US dollar against the euro also had a positive effect on earnings.
Adjusted for exchange rate movements, revenue would have risen by EUR approximately
EUR 0.3 billion, or around 3%.
Revenue per trade1
million EUR 1.1.-31.12.2019 1.1.-31.12.20182
Atlantic 2,431.9 2,099.4
Transpacific 2,290.8 2,108.7
Far East 1,891.7 1,782.9
Middle East 924.8 915.4
Intra-Asia 435.4 448.4
Latin America 2,921.6 2,658.8
EMA (Europe - Mediterranean - Africa) 631.7 486.9
Revenue not assigned to trades 1,080.0 1,117.1
Total 12,607.9 11,617.5
1 Due to organisational changes, the transport volumes to and from Djibouti, Sudan and Eritrea have been assigned to the EMA trade since 1 January 2019. Since the third quarter of 2019, transport volumes to and from Oceania have been assigned to the Far East trade. The previous year’s values have been adjusted accordingly.
2 As a result of the change in presentation of the consolidated income statement, revenue for the 2018 financial year increased by EUR 102.4 million, from EUR 11,515.1 million to EUR 11,617.5 million.
Transport expenses
In the 2019 financial year, transport expenses rose by EUR 120.6 million to EUR 9,707.0 million
(prior year period: EUR 9,586.4 million). This represents an increase of 1.3%. The rise is besides
increased transport volumes primarily due to a stronger US dollar against the euro, increased
charter costs for ships and higher costs for the repositioning of empty containers.
At USD 1.12 / EUR, the average USD / EUR exchange rate was 5.0% stronger than in the prior
year period (USD 1.18 / EUR). The conversion of transport expenses from the functional currency,
the US dollar, into the reporting currency, the euro, resulted in an increase in transport expenses
due to the strengthening of the US dollar. Adjusted for exchange rate movements, transport
costs in the 2019 financial year would have fallen by around EUR 0.4 billion (around 4%).
Fuel expenses rose by EUR 40.2 million (2.5%) to EUR 1,625.6 million as a result of exchange
rate effects. Adjusted for exchange rate effects, fuel expenses would have decreased by
EUR 47.6 million (–2.8%). Besides the slight improvement of bunker consumption primarily the
lower average bunker consumption price were decisive for this development. This price was
USD 416 per tonne for Hapag-Lloyd, which was USD 5 per tonne (–1.2%) below the average
price in the 2018 financial year.
85
H a p a g - L L o y d a g I a n n u a L R e p o R t 2 0 1 9
e C o n o M I C R e p o R t I C o M b I n e d M a n a g e M e n t R e p o R t

The first-time application of IFRS 16 Leases had a positive effect on the development of trans-
port expenses. As a result of the application of the standard, expenses for leases which were
previously classified as operating leases (essentially medium and long-term charter expenses for
vessels and container rental) are no longer recognised within the transport expenses position
but rather as amortisation on right of use of leased assets and interest expenses for lease liabili-
ties. As a result, the transport expenses recognised decreased year-on-year by the amount of
the lease expenses previously reported under IAS 17 totalling around EUR 467.0 million.
Lower handling and haulage costs also reduced the transport expenses in the 2019 financial
year.
Operating expenses
million EUR 1.1.-31.12.2019 1.1.-31.12.2018
Transport expenses 9,707.0 9,586.4
thereof:
Bunker 1,625.6 1,585.3
Handling & haulage 4,922.7 4,744.0
Equipment and repositioning 1,205.0 1,229.8
Vessel & voyage (excluding bunker) 1,967.8 2,006.6
Change in transport expenses for pending voyages1 –14.0 20.6
Personnel expenses 682.5 645.0
Depreciation, amortisation and impairments 1,174.4 695.1
Other operating result –268.8 –290.9
Total operating expenses 11,832.7 11,217.3
1 The amounts shown as transportation expenses for unfinished voyages represent the difference between the expenses for unfinished voyages in the current period and the expenses for unfinished voyages in the previous period. The transportation expenses for unfinished voyages recorded in the previous period are shown in the current financial year as transportation expenses for finished voyages within the expense items bunker, handling & haulage, containers and repositioning as well as ships and voyages (excluding bunker).
The gross profit margin (ratio of revenue less transport expenses to revenue) for the 2019
financial year came to 23.0% (prior year period: 17.5%).
Personnel expenses
Personnel expenses rose by EUR 37.5 million (5.8%) to EUR 682.5 million in the 2019 financial
year (prior year period: EUR 645.0 million). The strengthening of the US dollar against the euro
caused expenses to increase, as did the rise in the number of shore-based employees and a
higher performance based remuneration for employees.
Government assistance was deducted from personnel expenses and not recognised as other
operating income for the first time in the financial year, causing expenses to decrease. Further
details on the assistance received can be found in Note (28) Government assistance in the
Notes to the consolidated financial statements.
The Group employed an annual average of 12,905 people (previous year period: 12,470 people).
The personnel expenses ratio decreased compared to the previous year from 5.6% to 5.4%.
86
H a p a g - L L o y d a g I a n n u a L R e p o R t 2 0 1 9
C o M b I n e d M a n a g e M e n t R e p o R t I e C o n o M I C R e p o R t

Development of personnel expenses
million EUR 1.1.-31.12.2019 1.1.-31.12.2018
Personnel expenses 682.5 645.0
Revenue 12,607.9 11,617.5
Personnel expenses ratio % 5.4 5.6
Depreciation, amortisation and impairment
In the 2019 financial year, depreciation and amortisation came to EUR 1,174.4 million (prior year
period: EUR 695.1 million). The year-on-year increase in depreciation and amortisation was pri-
marily due to the effects of the first-time recognition of leased assets in accordance with IFRS 16.
The amortisation of rights of use relating to leased and first-time recognised assets (essentially
ships, containers, buildings) led to additional amortisation of EUR 436.5 million (prior year period:
EUR 0.0 million).
Other operating result
The other operating result comprised the net balance of other operating expenses and income.
The other operating expenses included in this item totalled EUR 350.0 million in the 2019 financial
year (prior year period: expenses of EUR 364.5 million). This included mainly IT and communica-
tion expenses (EUR 155.7 million; prior year period: EUR 142.1 million), office and administrative
expenses (EUR 41.8 million; prior year period: EUR 65.0 million) and expenses for charges, fees,
consultancy and other professional services (EUR 35.8 million; prior year period: EUR 34.3 mil-
lion). A detailed overview of the other operating result can be found in Note (5) Other operating
result in the Notes to the consolidated financial statements.
Share of profit of equity-accounted investees
The share of the profit of equity-accounted investees rose by EUR 4.8 million to EUR 35.5 million
in the 2019 financial year. The reason for the increase was a higher pro rata result from the
investment in HHLA Container Terminal Altenwerder GmbH.
Operating result
In the 2019 financial year, earnings before interest and taxes (EBIT) amounted to EUR 811.4 mil-
lion (including a positive effect from the first-time application of IFRS 16 in the amount of approxi-
mately EUR 30.6 million). They were therefore well above the corresponding figure in the prior
year period (EUR 443.5 million). Earnings before interest, taxes, depreciation and amortisation
(EBITDA) came in at EUR 1,985.8 million in the 2019 financial year (prior year period:
EUR 1,138.6 million). This includes a positive effect from the first-time application of IFRS 16 in
the amount of approximately EUR 467 million. The annualised return on invested capital (ROIC)
for the 2019 financial year amounted to 6.1% (prior year period: 3.7%). Basic earnings per share
in the reporting period came to EUR 2.06 per share (prior year period: EUR 0.21 per share).
87
H a p a g - L L o y d a g I a n n u a L R e p o R t 2 0 1 9
e C o n o M I C R e p o R t I C o M b I n e d M a n a g e M e n t R e p o R t
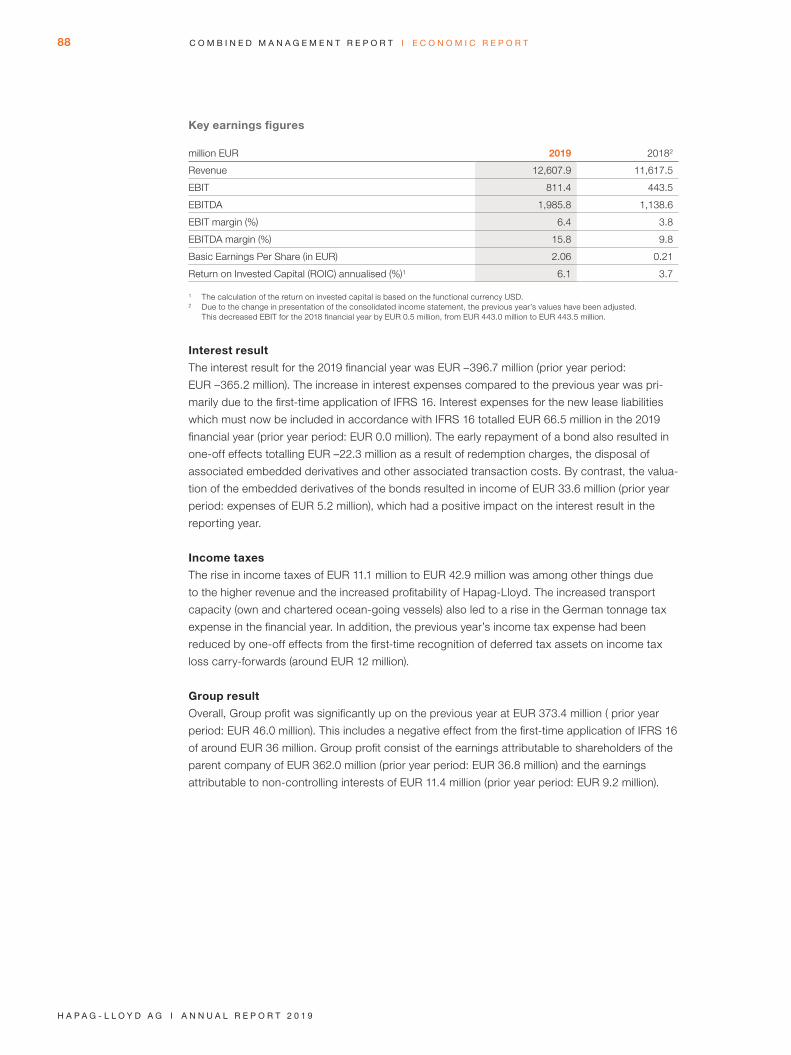
Key earnings figures
million EUR 2019 20182
Revenue 12,607.9 11,617.5
EBIT 811.4 443.5
EBITDA 1,985.8 1,138.6
EBIT margin (%) 6.4 3.8
EBITDA margin (%) 15.8 9.8
Basic Earnings Per Share (in EUR) 2.06 0.21
Return on Invested Capital (ROIC) annualised (%)1 6.1 3.7
1 The calculation of the return on invested capital is based on the functional currency USD. 2 Due to the change in presentation of the consolidated income statement, the previous year’s values have been adjusted.
This decreased EBIT for the 2018 financial year by EUR 0.5 million, from EUR 443.0 million to EUR 443.5 million.
Interest result
The interest result for the 2019 financial year was EUR –396.7 million (prior year period:
EUR –365.2 million). The increase in interest expenses compared to the previous year was pri-
marily due to the first-time application of IFRS 16. Interest expenses for the new lease liabilities
which must now be included in accordance with IFRS 16 totalled EUR 66.5 million in the 2019
financial year (prior year period: EUR 0.0 million). The early repayment of a bond also resulted in
one-off effects totalling EUR –22.3 million as a result of redemption charges, the disposal of
associated embedded derivatives and other associated transaction costs. By contrast, the valua-
tion of the embedded derivatives of the bonds resulted in income of EUR 33.6 million (prior year
period: expenses of EUR 5.2 million), which had a positive impact on the interest result in the
reporting year.
Income taxes
The rise in income taxes of EUR 11.1 million to EUR 42.9 million was among other things due
to the higher revenue and the increased profitability of Hapag-Lloyd. The increased transport
capacity (own and chartered ocean-going vessels) also led to a rise in the German tonnage tax
expense in the financial year. In addition, the previous year’s income tax expense had been
reduced by one-off effects from the first-time recognition of deferred tax assets on income tax
loss carry-forwards (around EUR 12 million).
Group result
Overall, Group profit was significantly up on the previous year at EUR 373.4 million ( prior year
period: EUR 46.0 million). This includes a negative effect from the first-time application of IFRS 16
of around EUR 36 million. Group profit consist of the earnings attributable to shareholders of the
parent company of EUR 362.0 million (prior year period: EUR 36.8 million) and the earnings
attributable to non-controlling interests of EUR 11.4 million (prior year period: EUR 9.2 million).
88
H a p a g - L L o y d a g I a n n u a L R e p o R t 2 0 1 9
C o M b I n e d M a n a g e M e n t R e p o R t I e C o n o M I C R e p o R t

The total Group net result of EUR 406.5 million (prior year period: EUR 320.9 million) comprises
Group profit of EUR 373.4 million and other comprehensive income of EUR 33.1 million (prior year
period: EUR 274.9 million). Other comprehensive income includes other comprehensive income
from currency translation of EUR 121.2 million (prior year period: EUR 272.2 million), effects from
hedging instruments in cash flow hedges of EUR –13.2 million (prior year period: EUR 14.6 mil-
lion), effects from cost of hedging activities of EUR –14.1 million (prior year period: EUR –18.1 mil-
lion) and other comprehensive income from the remeasurement of defined benefit pension plans
of EUR –60.8 million (prior year period: EUR 6.2 million) due to a fall in the market interest rate.
GROUP FINANCIAL POSITION
Principles and objectives of financial management
The Hapag-Lloyd Group’s financial management is conducted on a centralised basis by Hapag-
Lloyd AG and aims to ensure the permanent solvency of the Company and thus its ability to
maintain financial stability at all times. In addition to making sure there is a sufficient supply of
liquidity, financial risks are limited by means of the hedging of net positions in foreign currency,
the use of derivative financial instruments (currencies, interest and bunkers), the implementation
of a cash pooling system and the optimisation of loan conditions.
Maintaining an appropriate minimum liquidity level is a deciding factor. Efficient financial manage-
ment is primarily based on optimising short and medium-term cash outflows. This is based on
budgetary planning for a number of years and a rolling monthly liquidity plan that spans a period
of one year. Hapag-Lloyd AG secures its short-term liquidity reserve by means of syndicated
credit facilities and bilateral bank credit lines, as well as its cash on hand. Financial management
is carried out within the framework of relevant legislation as well as internal principles and
regulations.
The Hapag-Lloyd Group is an international company that is active around the world. It is exposed
to operational financial transaction risks which result from the business operations of Hapag-
Lloyd AG. In particular, these risks include bunker price change risk, currency risk and interest
rate risk.
Changes in commodity prices have an impact on the Hapag-Lloyd Group, particularly with
regard to the cost of procuring fuel such as bunker oil. Insofar as it is possible, the risk of bunker
price changes is passed on to the customer based on contractual agreements. Remaining price
risks arising from fuel procurement are partly hedged using derivative hedging transactions.
The transactions of the Group companies are conducted mainly in US dollars. The euro (EUR),
Indian rupee (INR), Brazilian real (BRL), Chinese renminbi (CNY), British pound sterling (GBP),
Canadian dollar (CAD), United Arab Emirates dirham (AED), Japanese yen (JPY) and Australian
dollar (AUD) are also significant currencies. Transactional risks also exist from the financial debt
denominated in euros (particularly issued bonds).
89
H a p a g - L L o y d a g I a n n u a L R e p o R t 2 0 1 9
e C o n o M I C R e p o R t I C o M b I n e d M a n a g e M e n t R e p o R t
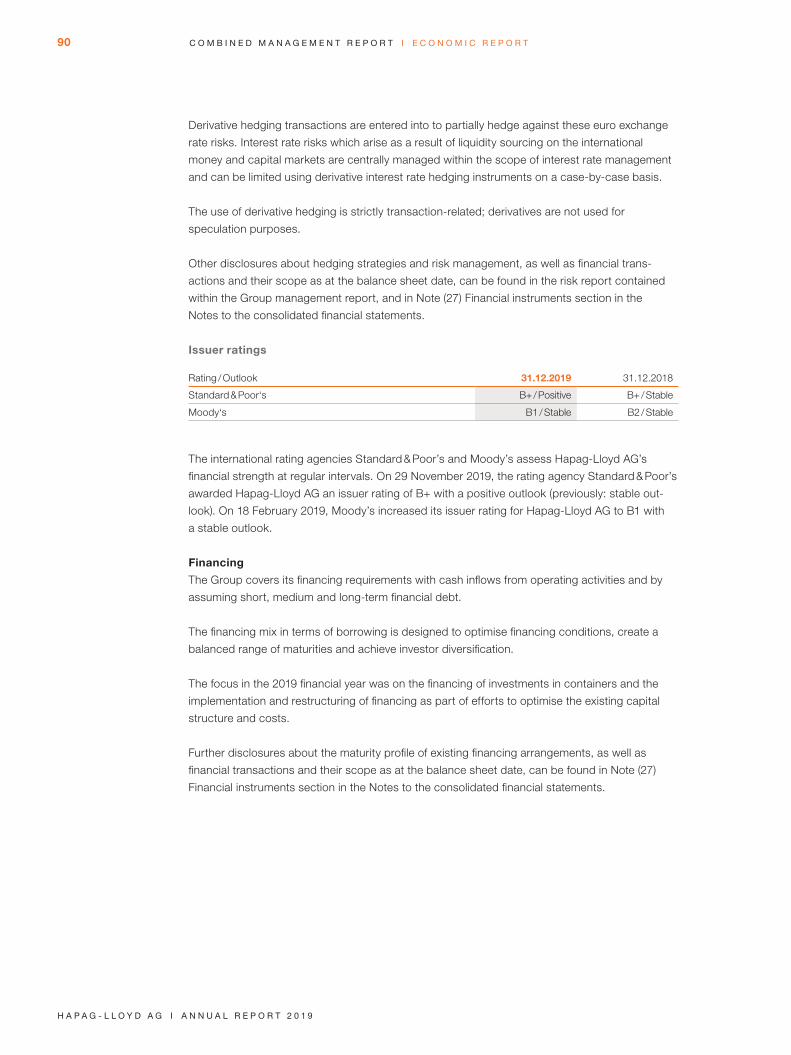
Derivative hedging transactions are entered into to partially hedge against these euro exchange
rate risks. Interest rate risks which arise as a result of liquidity sourcing on the international
money and capital markets are centrally managed within the scope of interest rate management
and can be limited using derivative interest rate hedging instruments on a case-by-case basis.
The use of derivative hedging is strictly transaction-related; derivatives are not used for
speculation purposes.
Other disclosures about hedging strategies and risk management, as well as financial trans-
actions and their scope as at the balance sheet date, can be found in the risk report contained
within the Group management report, and in Note (27) Financial instruments section in the
Notes to the consolidated financial statements.
Issuer ratings
Rating / Outlook 31.12.2019 31.12.2018
Standard & Poor‘s B+ / Positive B+ / Stable
Moody‘s B1 / Stable B2 / Stable
The international rating agencies Standard & Poor’s and Moody’s assess Hapag-Lloyd AG’s
financial strength at regular intervals. On 29 November 2019, the rating agency Standard & Poor’s
awarded Hapag-Lloyd AG an issuer rating of B+ with a positive outlook (previously: stable out-
look). On 18 February 2019, Moody’s increased its issuer rating for Hapag-Lloyd AG to B1 with
a stable outlook.
Financing
The Group covers its financing requirements with cash inflows from operating activities and by
assuming short, medium and long-term financial debt.
The financing mix in terms of borrowing is designed to optimise financing conditions, create a
balanced range of maturities and achieve investor diversification.
The focus in the 2019 financial year was on the financing of investments in containers and the
implementation and restructuring of financing as part of efforts to optimise the existing capital
structure and costs.
Further disclosures about the maturity profile of existing financing arrangements, as well as
financial transactions and their scope as at the balance sheet date, can be found in Note (27)
Financial instruments section in the Notes to the consolidated financial statements.
90
H a p a g - L L o y d a g I a n n u a L R e p o R t 2 0 1 9
C o M b I n e d M a n a g e M e n t R e p o R t I e C o n o M I C R e p o R t
Financing and investing activities
The Group executed the following major financing and investing activities in the 2019
reporting year:
Containers
• During the 2019 financial year, Hapag-Lloyd AG ordered new containers with an invest-
ment amount of USD 310.6 million (EUR 276.8 million). The containers were mostly delivered
to Hapag- Lloyd by the end of the reporting year with the rest expected in the first quarter
of 2020.
• To refinance these investments, Hapag-Lloyd entered into several sale and leaseback trans-
actions with a volume of USD 325.2 million (EUR 290.9 million). The newly acquired containers
were sold to groups of investors on the basis of Japanese operating leases and then leased
back for seven years, with the option of repurchasing the containers upon their respective
maturity. The lease agreements are essentially a form of borrowing, secured by the assign-
ment of containers as collateral.
Vessels
• On two occasions, in April 2019 and May 2019, refinancing was arranged for a container ship
owned by the Company as part of a Japanese operating lease. The container ships were sold
to a group of investors and then leased back for up to 9.5 years, with the option of repurchas-
ing the ships after 7.5 and 8.0 years respectively. The economic substance of these transac-
tions is credit financing secured by the assignment of the ships as collateral. The refinancing
volume associated with these transactions totalled USD 188.1 million (EUR 168.8 million).
The loan liabilities of USD 128.4 million (EUR 115.3 million) previously associated with the ships
were repaid in full. In addition, the Japanese operating lease implemented in May includes
approval to draw down a second tranche of up to USD 22.4 million (EUR 20.0 million). This
second tranche will be made available after the ship is successfully converted into an LNG-
operated ship and will be used to finance the investments associated with the conversion.
• In September 2019, a loan commitment of USD 100.0 million (EUR 89.1 million) was made to
Hapag-Lloyd to finance investments in exhaust gas cleaning systems (scrubbers) on its own
ships and those chartered on a long-term basis. The loan commitment has a term until
31 March 2021. Drawdowns under the loan commitment have a term of up to 4.5 years. As
at the balance sheet date, no drawdowns had been made. Three container ships owned by
the Company were provided as collateral for the financing.
Miscellaneous
• In February 2019, Hapag-Lloyd used its own liquidity to make an early repayment of
EUR 170.0 million for its EUR bond originally scheduled to mature in 2022. In June 2019,
Hapag-Lloyd made another early repayment for the remainder of the EUR bond in the
amount of EUR 280.0 million. The second repayment was largely made using free liquidity.
EUR 100.0 million of the second repayment was obtained by utilising a credit facility based
on credit loss insurance. In the 2019 financial year, the EUR bond scheduled to mature in
2022 for an original amount of EUR 450.0 million was repaid early and in full.
91
H a p a g - L L o y d a g I a n n u a L R e p o R t 2 0 1 9
e C o n o M I C R e p o R t I C o M b I n e d M a n a g e M e n t R e p o R t
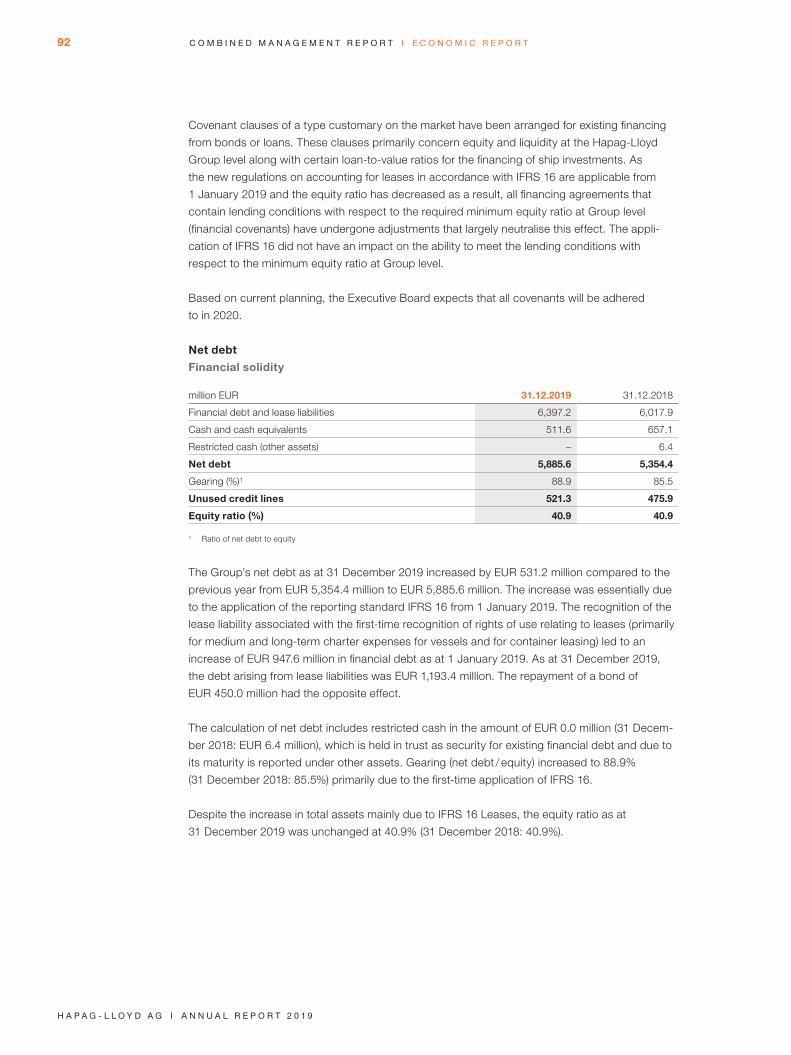
Covenant clauses of a type customary on the market have been arranged for existing financing
from bonds or loans. These clauses primarily concern equity and liquidity at the Hapag-Lloyd
Group level along with certain loan-to-value ratios for the financing of ship investments. As
the new regulations on accounting for leases in accordance with IFRS 16 are applicable from
1 January 2019 and the equity ratio has decreased as a result, all financing agreements that
contain lending conditions with respect to the required minimum equity ratio at Group level
(financial covenants) have undergone adjustments that largely neutralise this effect. The appli-
cation of IFRS 16 did not have an impact on the ability to meet the lending conditions with
respect to the minimum equity ratio at Group level.
Based on current planning, the Executive Board expects that all covenants will be adhered
to in 2020.
Net debt
Financial solidity
million EUR 31.12.2019 31.12.2018
Financial debt and lease liabilities 6,397.2 6,017.9
Cash and cash equivalents 511.6 657.1
Restricted cash (other assets) – 6.4
Net debt 5,885.6 5,354.4
Gearing (%)1 88.9 85.5
Unused credit lines 521.3 475.9
Equity ratio (%) 40.9 40.9
1 Ratio of net debt to equity
The Group’s net debt as at 31 December 2019 increased by EUR 531.2 million compared to the
previous year from EUR 5,354.4 million to EUR 5,885.6 million. The increase was essentially due
to the application of the reporting standard IFRS 16 from 1 January 2019. The recognition of the
lease liability associated with the first-time recognition of rights of use relating to leases (primarily
for medium and long-term charter expenses for vessels and for container leasing) led to an
increase of EUR 947.6 million in financial debt as at 1 January 2019. As at 31 December 2019,
the debt arising from lease liabilities was EUR 1,193.4 million. The repayment of a bond of
EUR 450.0 million had the opposite effect.
The calculation of net debt includes restricted cash in the amount of EUR 0.0 million (31 Decem-
ber 2018: EUR 6.4 million), which is held in trust as security for existing financial debt and due to
its maturity is reported under other assets. Gearing (net debt / equity) increased to 88.9%
(31 December 2018: 85.5%) primarily due to the first-time application of IFRS 16.
Despite the increase in total assets mainly due to IFRS 16 Leases, the equity ratio as at
31 December 2019 was unchanged at 40.9% (31 December 2018: 40.9%).
92
H a p a g - L L o y d a g I a n n u a L R e p o R t 2 0 1 9
C o M b I n e d M a n a g e M e n t R e p o R t I e C o n o M I C R e p o R t
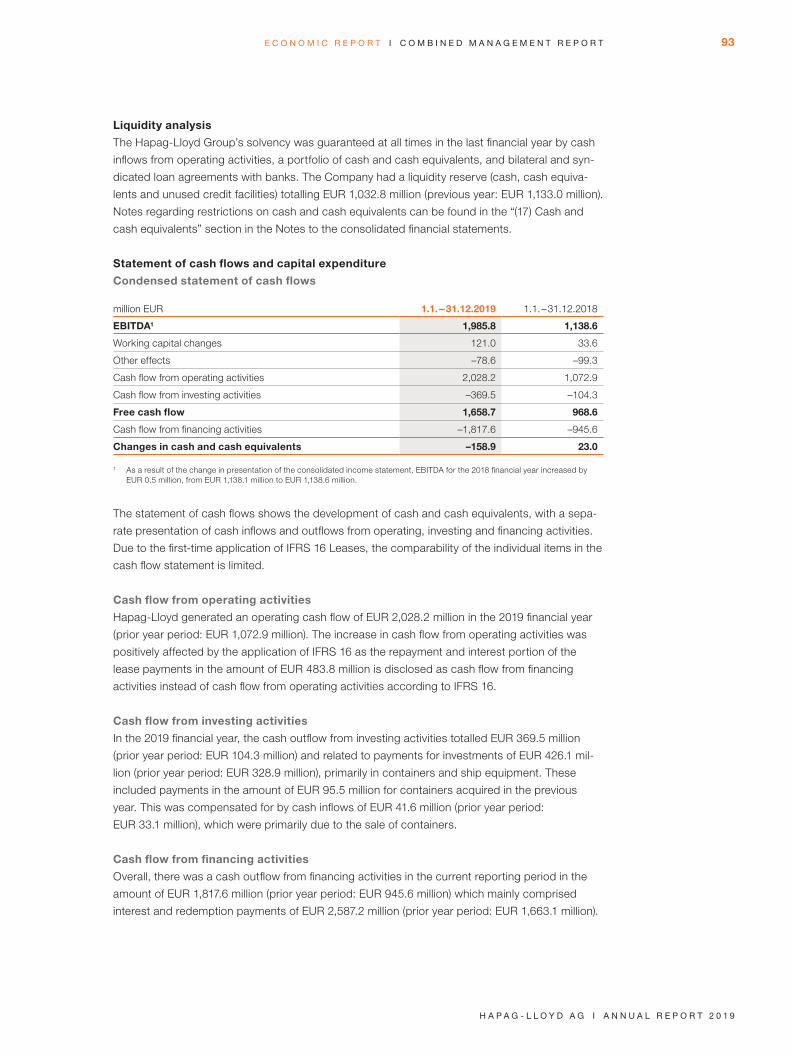
Liquidity analysis
The Hapag-Lloyd Group’s solvency was guaranteed at all times in the last financial year by cash
inflows from operating activities, a portfolio of cash and cash equivalents, and bilateral and syn-
dicated loan agreements with banks. The Company had a liquidity reserve (cash, cash equiva-
lents and unused credit facilities) totalling EUR 1,032.8 million (previous year: EUR 1,133.0 million).
Notes regarding restrictions on cash and cash equivalents can be found in the “(17) Cash and
cash equivalents” section in the Notes to the consolidated financial statements.
Statement of cash flows and capital expenditure
Condensed statement of cash flows
million EUR 1.1.-31.12.2019 1.1.-31.12.2018
EBITDA1 1,985.8 1,138.6
Working capital changes 121.0 33.6
Other effects –78.6 –99.3
Cash flow from operating activities 2,028.2 1,072.9
Cash flow from investing activities –369.5 –104.3
Free cash flow 1,658.7 968.6
Cash flow from financing activities –1,817.6 –945.6
Changes in cash and cash equivalents –158.9 23.0
1 As a result of the change in presentation of the consolidated income statement, EBITDA for the 2018 financial year increased by EUR 0.5 million, from EUR 1,138.1 million to EUR 1,138.6 million.
The statement of cash flows shows the development of cash and cash equivalents, with a sepa-
rate presentation of cash inflows and outflows from operating, investing and financing activities.
Due to the first-time application of IFRS 16 Leases, the comparability of the individual items in the
cash flow statement is limited.
Cash flow from operating activities
Hapag-Lloyd generated an operating cash flow of EUR 2,028.2 million in the 2019 financial year
(prior year period: EUR 1,072.9 million). The increase in cash flow from operating activities was
positively affected by the application of IFRS 16 as the repayment and interest portion of the
lease payments in the amount of EUR 483.8 million is disclosed as cash flow from financing
activities instead of cash flow from operating activities according to IFRS 16.
Cash flow from investing activities
In the 2019 financial year, the cash outflow from investing activities totalled EUR 369.5 million
(prior year period: EUR 104.3 million) and related to payments for investments of EUR 426.1 mil-
lion (prior year period: EUR 328.9 million), primarily in containers and ship equipment. These
included payments in the amount of EUR 95.5 million for containers acquired in the previous
year. This was compensated for by cash inflows of EUR 41.6 million (prior year period:
EUR 33.1 million), which were primarily due to the sale of containers.
Cash flow from financing activities
Overall, there was a cash outflow from financing activities in the current reporting period in the
amount of EUR 1,817.6 million (prior year period: EUR 945.6 million) which mainly comprised
interest and redemption payments of EUR 2,587.2 million (prior year period: EUR 1,663.1 million).
93
H a p a g - L L o y d a g I a n n u a L R e p o R t 2 0 1 9
e C o n o M I C R e p o R t I C o M b I n e d M a n a g e M e n t R e p o R t
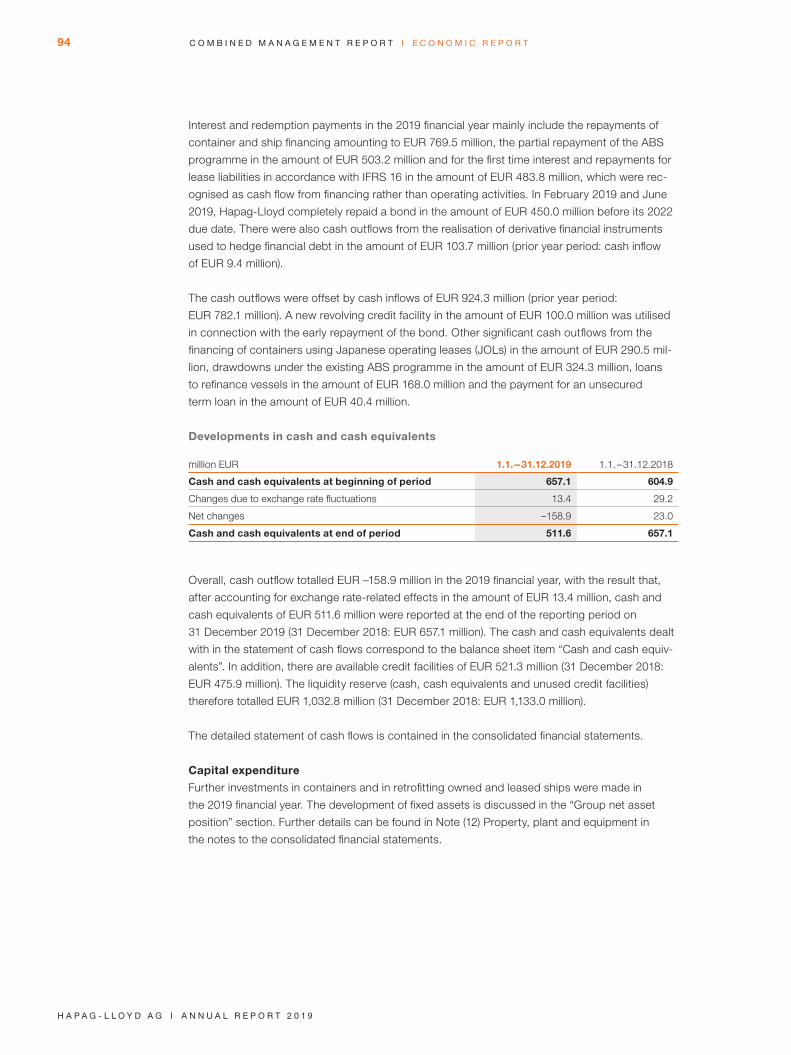
Interest and redemption payments in the 2019 financial year mainly include the repayments of
container and ship financing amounting to EUR 769.5 million, the partial repayment of the ABS
programme in the amount of EUR 503.2 million and for the first time interest and repayments for
lease liabilities in accordance with IFRS 16 in the amount of EUR 483.8 million, which were rec-
ognised as cash flow from financing rather than operating activities. In February 2019 and June
2019, Hapag-Lloyd completely repaid a bond in the amount of EUR 450.0 million before its 2022
due date. There were also cash outflows from the realisation of derivative financial instruments
used to hedge financial debt in the amount of EUR 103.7 million (prior year period: cash inflow
of EUR 9.4 million).
The cash outflows were offset by cash inflows of EUR 924.3 million (prior year period:
EUR 782.1 million). A new revolving credit facility in the amount of EUR 100.0 million was utilised
in connection with the early repayment of the bond. Other significant cash outflows from the
financing of containers using Japanese operating leases (JOLs) in the amount of EUR 290.5 mil-
lion, drawdowns under the existing ABS programme in the amount of EUR 324.3 million, loans
to refinance vessels in the amount of EUR 168.0 million and the payment for an unsecured
term loan in the amount of EUR 40.4 million.
Developments in cash and cash equivalents
million EUR 1.1.-31.12.2019 1.1.-31.12.2018
Cash and cash equivalents at beginning of period 657.1 604.9
Changes due to exchange rate fluctuations 13.4 29.2
Net changes –158.9 23.0
Cash and cash equivalents at end of period 511.6 657.1
Overall, cash outflow totalled EUR –158.9 million in the 2019 financial year, with the result that,
after accounting for exchange rate-related effects in the amount of EUR 13.4 million, cash and
cash equivalents of EUR 511.6 million were reported at the end of the reporting period on
31 December 2019 (31 December 2018: EUR 657.1 million). The cash and cash equivalents dealt
with in the statement of cash flows correspond to the balance sheet item “Cash and cash equiv-
alents”. In addition, there are available credit facilities of EUR 521.3 million (31 December 2018:
EUR 475.9 million). The liquidity reserve (cash, cash equivalents and unused credit facilities)
therefore totalled EUR 1,032.8 million (31 December 2018: EUR 1,133.0 million).
The detailed statement of cash flows is contained in the consolidated financial statements.
Capital expenditure
Further investments in containers and in retrofitting owned and leased ships were made in
the 2019 financial year. The development of fixed assets is discussed in the “Group net asset
position” section. Further details can be found in Note (12) Property, plant and equipment in
the notes to the consolidated financial statements.
94
H a p a g - L L o y d a g I a n n u a L R e p o R t 2 0 1 9
C o M b I n e d M a n a g e M e n t R e p o R t I e C o n o M I C R e p o R t

Off-balance-sheet obligations
At the end of the 2019 financial year, orders were placed for containers in the amount of
EUR 34.0 million (previous year: EUR 33.4 million), for exhaust gas cleaning systems (EGCS)
on container ships in the amount of EUR 33.3 million (previous year: EUR 11.2 million) and the
conversion of container ships to liquefied natural gas in the amount of EUR 13.2 million. As at
31 December 2019, Hapag-Lloyd had further purchase commitments of EUR 11.4 million.
GROUP NET ASSET POSITION
Changes in the asset structure
million EUR 31.12.2019 31.12.2018
Assets
Non-current assets 13,811.8 12,845.0
of which fixed assets 13,716.1 12,789.8
Current assets 2,388.6 2,456.3
of which cash and cash equivalents 511.6 657.1
Total Assets 16,200.4 15,301.3
Equity and liabilities
Equity 6,620.6 6,259.3
Borrowed capital 9,579.8 9,042.0
of which non-current liabilities 5,586.2 5,665.3
of which current liabilities 3,993.6 3,376.7
of which financial debt and finance lease liabilities 6,397.2 6,017.9
of which non-current financial debt and finance lease liabilities 5,156.0 5,301.6
of which current financial debt and finance lease liabilities 1,241.2 716.3
Total equity and liabilities 16,200.4 15,301.3
Net debt 5,885.6 5,354.4
Equity ratio (%) 40.9 40.9
As at 31 December 2019, the Group’s balance sheet total was EUR 16,200.4 million, which
is EUR 899.1 million higher than the figure at the end of 2018 (31 December 2018:
EUR 15,301.3 million). The main reason for the increase in the balance sheet total is the first-
time application of IFRS 16 Leases in the 2019 financial year. The US dollar against the euro
exchange rate was quoted at 1.12 on 31 December 2019 (31 December 2018: 1.15).
95
H a p a g - L L o y d a g I a n n u a L R e p o R t 2 0 1 9
e C o n o M I C R e p o R t I C o M b I n e d M a n a g e M e n t R e p o R t
Within non-current assets, the carrying amounts of fixed assets increased by a total of
EUR 926.3 million to EUR 13,716.1 million (31 December 2018: EUR 12,789.8 million). This rise
was primarily due to the first-time application of IFRS 16 and the associated recognition of the
right of use relating to lease contracts not previously capitalised in the amount of EUR 858.2 mil-
lion as at 1 January 2019 (31 December 2018: EUR 0.0 million). As at 31 December 2019, rights
of use for lease contracts previously capitalised and not previously capitalised totalling
EUR 1,031.1 million were capitalised as part of fixed assets. In addition, non-current assets
increased due to investments of EUR 398.5 million relating primarily to containers as well as
ship equipment and retrofitting of ships to ensure compliance with IMO 2020. Exchange rate
effects of EUR 269.3 million at the reporting date contributed to the increase in fixed assets.
This effect was offset by the amortisation and depreciation of intangible and tangible assets
respectively totalling EUR 1,174.4 million (prior year period: EUR 695.1 million). This figure
includes an amount of EUR 436.5 million for the amortisation of the rights of use relating to lease
assets which were newly capitalised in accordance with IFRS 16.
Current assets fell by EUR 67.7 million to EUR 2,388.6 million compared to the level as at
31 December 2018. The change primarily resulted from a reduction in cash and cash equivalents
due to a wide range of different investments to ensure compliance with the IMO 2020 regulations
and the repayment of a bond in the 2019 financial year.
On the liabilities side, equity (including non-controlling interests) grew by EUR 361.3 million to a
total of EUR 6,620.6 million. This increase is mainly due to the Group profit of EUR 373.4 million
and the unrealised gains from currency translation recognised in other comprehensive income
and amounting to EUR 121.2 million. By contrast, the payment of a dividend by Hapag-Lloyd AG
for the 2018 financial year in the amount of EUR 26.4 million, the measurement of pension
pro visions through other comprehensive income in the amount of EUR –60.8 million due to
the lower interest rate, the changes in the reserves for hedging relationships in the amount of
EUR -15.6 million and the adjustment of opening balance sheet values due to the first-time
application of IFRS 16 as at 1 January 2019 in the amount of EUR –17.4 million had an offsetting
effect. The equity ratio was 40.9% as at 31 December 2019 (31 December 2018: 40.9%).
The borrowed capital has risen by EUR 537.8 million to EUR 9,579.8 million since the 2018 group
financial statements were prepared, which was mainly due to an increase in financial debt and
lease liabilities of EUR 379.3 million to EUR 6,397.2 million. The main reason for the increase in
financial debt and lease liabilities was the first-time application of IFRS 16, which led to the rec-
ognition of additional lease liabilities of EUR 947.6 million as at 1 January 2019. As at 31 Decem-
ber 2019, total lease liabilities were EUR 1,193.4 million. This included lease obligations both
recognised in previous years and not recognised in previous years. Further, payments for new
financing with the amount of EUR 924.3 million had an increasing effect. Exchange rate effects
relating to financial debt and lease liabilities in the amount of EUR 123.4 million also caused
borrowed capital to increase. Redemption payments totalling EUR 2,189.9 million including the
early repayment of a bond in the amount of EUR 450.0 million and repayments for lease liabili-
ties in the amount of EUR 456.7 million reduced financial debt.
96
H a p a g - L L o y d a g I a n n u a L R e p o R t 2 0 1 9
C o M b I n e d M a n a g e M e n t R e p o R t I e C o n o M I C R e p o R t

Taking cash and cash equivalents and financial debt into account, net debt was EUR 5,885.6 mil-
lion as at 31 December 2019 (31 December 2018: EUR 5,354.4 million).
For further information on significant changes to specific balance sheet items and on the extent
of the investment obligations, please refer to the Notes to the consolidated statement of financial
position, sections (11) to (27).
EXECUTIVE BOARD’S STATEMENT ON OVERALL ECONOMIC PERFORMANCE
Earnings developed in line with the Executive Board’s expectations in the 2019 financial year,
although transport volume remained roughly on previous year’s level and thus slightly below the
level forecast at the start of the financial year due to the slowdown in global economic growth.
Both EBITDA and EBIT were at the upper end of the ranges forecast at the start of the year. This
was primarily the result of a slight year-to-year rise in the average freight rate alongside a slight
fall in the bunker consumption price. The increase in freight rates can primarily be attributed to
the decision to focus on profitable trades and implement active measures on revenue manage-
ment. The implementation of initial steps under Strategy 2023 led to increases in revenue as well
as improvements in transport costs. However, these were more than offset by the strengthening
of the US dollar against the euro. There was also a noticeable reduction in transport expenses as
a result of the first-time application of IFRS 16 Leases. The expenses previously reported under
this cost item have been reported under depreciation and amortisation and under interest
expenses since 1 January 2019.
97
H a p a g - L L o y d a g I a n n u a L R e p o R t 2 0 1 9
e C o n o M I C R e p o R t I C o M b I n e d M a n a g e M e n t R e p o R t

OUTLOOK-, RISK- AND OPPORTUNITY REPORT
The outlook, risk and opportunity report explains the expected future development of
Hapag-Lloyd’s key performance indicators and the framework conditions for business
operations. Risks and opportunities that cause a deviation from the forecast developments
are also described.
OUTLOOK
The general economic and sector-specific conditions which are of importance to container
shipping are presented and analysed in detail in the Economic report. A summary of the most
important external factors forming the basis of the outlook is given below.
According to its current economic outlook (January 2020), the International Monetary Fund (IMF)
expects global economic growth of 3.3% for the current year. According to this forecast, the
global economy will again grow slightly faster in 2020 than in the previous year (+2.9%). Accord-
ing to IMF estimates, the global trade volume, which is important for the demand for container
shipping transport services, will increase by 2.9% in 2020 and is thus expected to recover
noticeably compared to the previous year (2019: +1.0%), but will still remain slightly below the
average of the last 5 years (3.1%). The industry research agency Seabury (December 2019) fore-
casts a growth in global container transport volume of 3.1% (2019: 0.8%) to around 157 mil-
lion TEU in 2020. This means that the expected increase in the global transport volume of con-
tainer shipping in 2020 would again be in line with the growth in world trade. Extraordinary
events on a global scale such as the outbreak of the coronavirus COVID-19 could have a
negative impact on the growth expectations. Due to the spread of the coronavirus COVID-19
in the beginning of 2020 negative implications for the trade and financial markets can be ob-
served. Because of potential market movements that occur with time delays as well as un -
certainty regarding the containment of the viral disease a concluding assessment of the effect
of COVID-19 on the global economy during the remainder of the year is not possible.
Following an increase in transport capacities (after scrapping and postponement of deliveries)
in 2019 by approx. 0.8 million TEU to 22.9 million TEU, Drewry’s industry experts also expect a
nominal increase in transport capacities for the current year by approximately 0.8 million TEU to
23.7 million TEU. In relation to the total capacity of the world fleet, this corresponds to an
increase of around 3.7% and is thus at the same level as in the previous year (+3.7%). Although
the overall increase remains moderate, the delivery of large ships in the Far East trade lane
could make it more difficult to implement freight rate increases in this trade lane in 2020.
98
H a p a g - L L o y d a g I a n n u a L R e p o R t 2 0 1 9
C o M b I n e d M a n a g e M e n t R e p o R t I o u t L o o k - , R I s k - a n d o p p o R t u n I t y R e p o R t
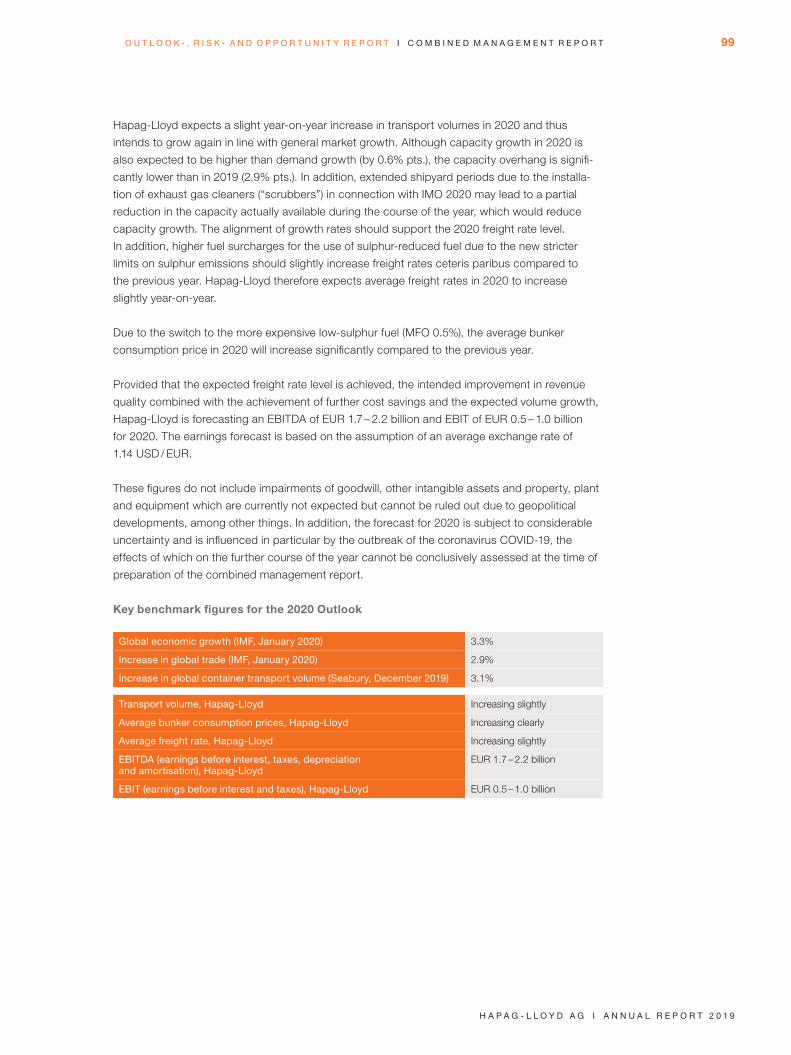
Hapag-Lloyd expects a slight year-on-year increase in transport volumes in 2020 and thus
intends to grow again in line with general market growth. Although capacity growth in 2020 is
also expected to be higher than demand growth (by 0.6% pts.), the capacity overhang is signifi-
cantly lower than in 2019 (2.9% pts.). In addition, extended shipyard periods due to the installa-
tion of exhaust gas cleaners (“scrubbers”) in connection with IMO 2020 may lead to a partial
reduction in the capacity actually available during the course of the year, which would reduce
capacity growth. The alignment of growth rates should support the 2020 freight rate level.
In addition, higher fuel surcharges for the use of sulphur-reduced fuel due to the new stricter
limits on sulphur emissions should slightly increase freight rates ceteris paribus compared to
the previous year. Hapag-Lloyd therefore expects average freight rates in 2020 to increase
slightly year-on-year.
Due to the switch to the more expensive low-sulphur fuel (MFO 0.5%), the average bunker
consumption price in 2020 will increase significantly compared to the previous year.
Provided that the expected freight rate level is achieved, the intended improvement in revenue
quality combined with the achievement of further cost savings and the expected volume growth,
Hapag-Lloyd is forecasting an EBITDA of EUR 1.7 - 2.2 billion and EBIT of EUR 0.5 - 1.0 billion
for 2020. The earnings forecast is based on the assumption of an average exchange rate of
1.14 USD / EUR.
These figures do not include impairments of goodwill, other intangible assets and property, plant
and equipment which are currently not expected but cannot be ruled out due to geopolitical
developments, among other things. In addition, the forecast for 2020 is subject to considerable
uncertainty and is influenced in particular by the outbreak of the coronavirus COVID-19, the
effects of which on the further course of the year cannot be conclusively assessed at the time of
preparation of the combined management report.
Key benchmark figures for the 2020 Outlook
global economic growth (IMf, January 2020) 3.3%
Increase in global trade (IMf, January 2020) 2.9%
Increase in global container transport volume (seabury, december 2019) 3.1% transport volume, Hapag-Lloyd Increasing slightly
average bunker consumption prices, Hapag-Lloyd Increasing clearly
average freight rate, Hapag-Lloyd Increasing slightly
ebItda (earnings before interest, taxes, depreciation and amortisation), Hapag-Lloyd
EUR 1.7 - 2.2 billion
ebIt (earnings before interest and taxes), Hapag-Lloyd EUR 0.5 - 1.0 billion
99
H a p a g - L L o y d a g I a n n u a L R e p o R t 2 0 1 9
o u t L o o k - , R I s k - a n d o p p o R t u n I t y R e p o R t I C o M b I n e d M a n a g e M e n t R e p o R t

The majority of the earnings are expected to be generated in the second half of the year,
particularly in the third quarter, when the peak season occurs. This is because the volume of
global trade fluctuates throughout the year and is usually much higher in the second half of
the year than in the first. In addition, we expect a weaker first half of the year in 2020 due to the
extended Chinese New Year in connection with the outbreak of the coronavirus COVID-19 and
the associated extended closure of factories in China.
The risks and opportunities that could cause business development to deviate from the forecast
are described in detail in the risk and opportunity report below. The relevant risks for the devel-
opment of Group turnover and earnings are in particular a slowdown in the growth of the global
economy and global trade volume, also caused by international crises and geopolitical disputes,
a significant and sustained increase in bunker prices, a significant and sustained rise in the value
of the euro against the US dollar and a sustained decline in average freight rates. In addition,
there is a risk that the higher bunker costs resulting from IMO 2020 cannot be fully passed on to
customers by increasing average freight rates.
The occurrence of one or more of these risks could have a substantial negative impact on the
industry and, by extension, on the business development of Hapag-Lloyd in the 2020 financial
year, which could also lead to impairments on goodwill, other intangible assets and property,
plant and equipment.
RISK AND OPPORTUNITY REPORT
Risk management and the strategic focus on business opportunities are designed to enhance
the Company’s value by providing stable, long-term growth, to contribute to the attainment of
its medium-term financial goals and to ensure its long-term existence as a going concern. The
risk management system comprises risk and opportunity potentials, though it focusses primarily
on risks.
OPPORTUNITIES
At Hapag-Lloyd, recognising and exploiting opportunities are integral elements of strategic man-
agement. The basis for the identification of opportunities is the systematic observation and anal-
ysis of developments on the markets relevant to the Company and general and sector-specific
trends from which opportunities can be derived and assessed. This analysis and assessment
form the basis for the initiation of measures which are geared towards long-term sustainable
growth and are designed to contribute to a sustainable increase in the Company’s value. As one
of the world’s leading container liner shipping companies, Hapag-Lloyd is subject to a wide
range of developments on the domestic and international markets. The general conditions
described in this management report and the information regarding market, competition and
business developments reveal a diversity of potential opportunities.
By utilising and enhancing its own strengths and competitive advantages, Hapag-Lloyd strives
to exploit any potential opportunities that arise to the greatest possible extent. The continuous
identification of potential opportunities is a core element of the strategy described in the chapter
“Group objectives and strategy”.
100
H a p a g - L L o y d a g I a n n u a L R e p o R t 2 0 1 9
C o M b I n e d M a n a g e M e n t R e p o R t I o u t L o o k - , R I s k - a n d o p p o R t u n I t y R e p o R t

RISK MANAGEMENT
The objective of risk management is to recognise, analyse and to develop adequate risk
responses to lower the risk to an acceptable risk level and therefore secure the achievement
of the business objectives. Thanks to monitoring and control systems installed throughout the
Group, business developments and associated risks are regularly recorded, assessed and
monitored with regard to their effects on Hapag-Lloyd. Risk management is decentralised in
accordance with Hapag-Lloyd’s organisational structure.
The principles, roles and responsibilities, processes and thresholds of risk management are
defined in a Group guideline which is valid for the entire organisation. Within the context of the
decentralised structure of risk management, risk managers are appointed across the Group and
are responsible for continuously identifying, assessing, managing and monitoring risks in the
various regions and central departments (e.g. Treasury & Finance). These risk managers assess
and document the risks identified, including the risk responses as part of risk reporting. The risk
assessment is carried out taking into account the potential effects and the probability of occur-
rence according to the net perspective, i.e. after consideration of implemented risk responses.
On this basis, risks are grouped into 3 standardised risk classes and are monitored accordingly.
Risk reports are usually submitted on a quarterly basis to the risk management function in
the central Accounting department. It is mandatory to submit unscheduled reports if risks are
newly identified or newly assessed, with the result that reporting thresholds are exceeded
(ad-hoc reports).
The Executive Board and operational management have integrated multilevel reporting systems
at their disposal for risk management purposes. In addition to the quarterly and ad hoc reporting,
in accordance with legal requirements, the planning and controlling system conducts a monthly
analysis of how actual business developments have deviated from planned developments, and
uses this analysis to identify and report risks early on that may jeopardise the operating result of
the Company.
The risk management function monitors the regular reporting by risk managers and summarises
the significant risks for the Risk Committee on a quarterly basis and, if urgent, on an un -
scheduled basis. The Risk Committee discusses and assesses the risks present and subse-
quently reports on the overall risk situation to the Executive Board. In particular, it reports on the
risk status of significant factors, such as the current development of freight rates and transport
volumes, on the potential effects of significant fluctuations in these factors and on significant
individual risks.
101
H a p a g - L L o y d a g I a n n u a L R e p o R t 2 0 1 9
o u t L o o k - , R I s k - a n d o p p o R t u n I t y R e p o R t I C o M b I n e d M a n a g e M e n t R e p o R t

Risk management system of Hapag-Lloyd
The Corporate Audit department conducts regular checks of the risk management processes
and – in particular – the risk early-warning system, focusing on different aspects each time.
In risk management, the methods, systems and controls are adapted according to the type of
risk and are continuously checked, enhanced and adapted to the constantly changing business
conditions. As part of risk management, risks are hedged by the decentralised companies and
central departments to the greatest extent possible. Insurance policies are concluded to cover
claims and various other risks that arise in everyday business operations, insofar as these are
economically justifiable. The Company also holds a number of insurance policies which are cus-
tomary in the industry and tailored to the requirements of Hapag-Lloyd. These include third-party
liability, property and personal insurance, as well as shipping insurance. The policies are exam-
ined regularly and adjusted if required.
Risk Committee
Risk Management
Divisions
Audit Committee and Supervisory Board
Executive Board of Hapag-Lloyd AG
CEO COO CPO CFO
102
H a p a g - L L o y d a g I a n n u a L R e p o R t 2 0 1 9
C o M b I n e d M a n a g e M e n t R e p o R t I o u t L o o k - , R I s k - a n d o p p o R t u n I t y R e p o R t

Description of the significant characteristics of the accounting ICS / RMS pursuant
to Section 315 (4) of the German Commercial Code (HGB)
Concept and objectives
Hapag-Lloyd has established an internal control system (ICS) on the basis of the internationally
acknowledged framework “COSO (The Committee of Sponsoring Organizations of the Treadway
Commission) Internal Control – Integrated Framework”. The ICS was documented in 2010 and a
verification process was established. A central ICS coordination framework exists for the continu-
ous enhancement and securing of the ICS. A technical platform also exists to monitor processes
globally. This ICS includes the accounting-related ICS.
The primary objectives of the accounting-related ICS are to decrease the risk of significant errors
in accounting, detect substantially incorrect valuations and ensure compliance with applicable
regulations. The principles, processes and measures implemented to this end are regularly
checked and enhanced. Irrespective of its form or structure, however, an ICS cannot provide
absolute assurance that these objectives will be achieved.
Organisation and significant processes in accounting and consolidation
Hapag-Lloyd AG prepares its annual financial statements in accordance with German accounting
standards and its consolidated financial statements in accordance with the requirements of IFRS.
An IFRS accounting guideline is used. This is codified in the form of procedures and regulations.
Changes to the legal provisions and standards are constantly monitored and the accounting
guidelines and procedures are examined promptly for any adjustments that might be required.
The central Accounting department has overall responsibility for the consolidation process,
the preparation of the financial statements and the internal and external Group and individual
reporting. Information is obtained from other departments and processed in the course of pre-
paring the financial statements. This includes information from the central Treasury & Finance
department for the reporting of hedge relationships and financial derivatives, and information
from the central Controlling department pertaining to Company planning in relation to the im -
pairment tests.
Individual items are accounted for based on the input of external specialists and appraisers, such
as actuaries for pension valuation. The process of preparing the financial statements is carried
out in accordance with a detailed time schedule (the financial statements calendar), which is
agreed with the departments and subsidiaries. The central Accounting department is responsible
for ensuring that these time limits are adhered to. Accounting throughout the Group is supported
by means of suitable and standard market accounting systems at Hapag-Lloyd AG and its sub-
sidiaries. The subsidiaries send Group reporting packages needed for the preparation of the
consolidated financial statements. These packages are compiled to form the consolidated finan-
cial statements using the SAP Financial Consolidations (FC) system. The necessary steps to be
taken in the consolidation process are initiated by the central Accounting department.
103
H a p a g - L L o y d a g I a n n u a L R e p o R t 2 0 1 9
o u t L o o k - , R I s k - a n d o p p o R t u n I t y R e p o R t I C o M b I n e d M a n a g e M e n t R e p o R t

General internal control activities
Potential effects on financial reporting are already often taken into consideration in the organisa-
tional environment, e.g. significant investments and financing should already be agreed upon
with the area Accounting department before being approved by the Executive Board, particularly
in light of their presentation in the financial statements, and are critically assessed with regard to
their impact on the annual and consolidated financial statements. Further risks are also identified
and evaluated by having the Head of Accounting preside over the Risk Committee to ensure that
significant circumstances or events within the Group and their potential accounting-related
effects can be identified and assessed at an early stage.
Compliance with accounting and valuation regulations is monitored by internal controls. Some of
these internal controls are integrated into processes, while others are established independently
of them. These internal controls encompass preventive as well as detective activities.
Segregation of duties and a dual control rule have been implemented as fundamental process-
integrated controls to ensure proper accounting. For example, entries are authorised by approval
and release procedures. The controls that have been implemented in the IT systems should also
ensure that the booking systems can only be accessed by authorised employees due to the
presence of an authorisation system. In addition, reports concerning changes and exceptions,
for example, are verified as detective control activities for selected areas.
The Corporate Audit department has a fundamental supervisory role to play in the process-
independent control measures. The Corporate Audit department reports directly to the CEO of
Hapag-Lloyd AG and has a wide range of informational, auditing and access rights to enable it
to fulfil its role as an internal auditor and advisor. The subjects examined by the Corporate Audit
department are systematically selected using a risk-based approach to auditing. They regularly
include processes and internal controls which are relevant to accounting. In 2016, the Corporate
Audit department was subject to an independent quality assessment examining compliance with
the professional regulations issued by the German Institute of Internal Auditors (DIIR).
ICS verification process
Hapag-Lloyd AG has put in place a standard procedure to confirm the establishment of the ICS.
The results of this procedure are summarised in a report on an annual basis (“ICS verification
process”). On this basis, the Executive Board informs the Hapag-Lloyd AG Audit Committee
about the ICS.
104
H a p a g - L L o y d a g I a n n u a L R e p o R t 2 0 1 9
C o M b I n e d M a n a g e M e n t R e p o R t I o u t L o o k - , R I s k - a n d o p p o R t u n I t y R e p o R t
RISKS AND OPPORTUNITIES
The key risks and opportunities and their potential impact on the earnings, financial and net
asset position of Hapag-Lloyd, including their probability of occurrence, are listed at the end of
the risk and opportunity report under “Summarised overview of corporate risks and opportuni-
ties”. Qualitative descriptions of these and other events that are subject to a high degree of
uncertainty are described in the following section, although the probability of their occurrence
and their effects have not been assessed for risk management purposes, unless otherwise
stated.
Economic risks and opportunities
General economic development
Container shipping is heavily dependent on the general prevailing conditions in the world’s
economies and is subject to a high level of uncertainty of being affected to an above-average
degree by fluctuations in the economic climate. The development of freight rates, which have a
significant influence on Hapag-Lloyd’s financial and earnings position, is particularly dependent
on the transport volume and capacity supply on routes and therefore on economic develop-
ments in individual regions.
The pace at which the global economy grows and the resulting increase in global trade is a sig-
nificant factor that influences demand for container shipping services and thus the development
of the container shipping companies’ cargo volumes. Extraordinary events on a global scale
such as the outbreak of the coronavirus COVID-19 could have a negative impact on the growth
expectations. Due to the spread of the coronavirus in the beginning of 2020 negative implications
for the trade and financial markets can be observed. Because of potential market movements
that occur with time delays as well as uncertainty regarding the containment of the viral disease
a concluding assessment of the effect of COVID-19 on the global economy during the remainder
of the year is not possible.
The economic performance of the global economy and the corresponding expected perfor-
mance of container transport volumes continue to be subject to a significant degree of uncer-
tainty in 2020. A detailed forecast can be found in the “General economic conditions” chapter as
well as in the “Forecast”. According to Seabury, the rise in global demand for container shipping
services fell short of the original forecasts in recent years. In contrast to the expectations in the
beginning of 2019 IMF and Seabury significantly reduced the forecasted key figures during the
year. The main reason for this was the modest pace of global economic growth. The lower than
anticipated increase in the transport volume, coupled with the sharp rise in capacity supply, has
led to a marked decline in freight rates in all the main trades in recent years. If the transport vol-
ume remains below expectations and freight rates fall further, this could have a considerable
negative impact on Hapag-Lloyd’s earnings.
Seabury believes that the volume of global container shipments will rise by 3.1% in 2020 and
therefore at a faster rate than in 2019 (0.8%). If the economic recovery and, by extension, the
demand for container shipping services progresses at a faster rate than forecast in the current
year, this would present an opportunity to achieve additional volume growth.
105
H a p a g - L L o y d a g I a n n u a L R e p o R t 2 0 1 9
o u t L o o k - , R I s k - a n d o p p o R t u n I t y R e p o R t I C o M b I n e d M a n a g e M e n t R e p o R t
Trade flows
The utilisation of the Group’s capacities is influenced by the development of the trade flows
between the various regions. In the case of transport between regions comprising net exporters
and regions comprising net importers, capacity utilisation in the two directions is divergent. This
results in empty legs and associated costs. An increase in the imbalances in global trade could
further push up the costs associated with empty legs and therefore have a negative impact on
the earnings position. In 2019, for example, stricter import conditions on materials for recycling
(primarily plastic) as well as the ongoing trade war led to a temporary weakening and relocation
of Asian imports and exports. Uncertainty regarding the consequences of Brexit remains among
others due to the unknown design as well as concerning the vague time horizon for putting the
anticipated trade agreements into force.
The increasing industrialisation of the emerging economic regions in Latin America, Asia and
Africa, and the rising consumption-related demand in these countries may result in more goods
being exchanged between these countries and with industrialised nations. This could offer addi-
tional opportunities for growth in container shipping in 2020. Hapag-Lloyd is endeavouring to
participate in these growth markets with a suitable service network which could have a positive
impact on the transport volume.
With a share of around 23.6% of the container transport volume in 2019, the Latin America trade
is Hapag-Lloyd’s biggest trade. According to the latest IMF forecast (January 2020), economic
growth in the region of Latin America and the Caribbean was 0.1% in 2019 (2018: 1.1%). Eco-
nomic growth is expected to increase by 1.6% in 2020, then by 2.7% until 2024. The expected
recovery in economic growth could, however, quickly come to a halt once again as local econo-
mies are heavily dependent on political developments, commodity prices and exchange rates.
However in the view of Hapag-Lloyd’s Executive Board, the political instability in the region may
have a negative impact on import and export activities and therefore on the demand for con-
tainer transport. This, in turn, could negatively affect Hapag-Lloyd’s revenue and earnings.
Risks caused by general political conditions and protectionism
Hapag-Lloyd is active in many countries around the world. Its commercial activities can be hin-
dered by political tension, wars, terrorism, and economic and social problems. This can result
in disruptions to the production processes of its customers or interruptions in its own liner ser-
vices. The use of ports or other major shipping channels (Panama Canal, Suez Canal) might
be hindered as a further result. Individual countries could react to financial or economic crises
by resorting to protectionist measures, for example by introducing import or foreign exchange
restrictions. Other countries could initiate countermeasures, thereby encouraging protectionism
around the world. This would have a negative impact on the development of container shipping
and thus have a mediate negative impact on Hapag-Lloyd’s revenue and earnings.
106
H a p a g - L L o y d a g I a n n u a L R e p o R t 2 0 1 9
C o M b I n e d M a n a g e M e n t R e p o R t I o u t L o o k - , R I s k - a n d o p p o R t u n I t y R e p o R t

Sector- and company-specific risks and opportunities
Fuel price fluctuations
Hapag-Lloyd’s business activity exposes it to market price risks arising from the procurement
of fuels (bunker fuel) for the container ship fleet. Bunker fuel expenditure accounts for a substan-
tial proportion of overall operating costs. Bunker price fluctuations have a delayed effect on
transport expenses, depending on when the bunker fuel was purchased and subsequently
consumed.
In the 2019 financial year, the cost of the ships’ fuel amounted to 12.9% of the Hapag-Lloyd
Group’s revenue. The bunker consumption price is the most important factor influencing fuel
costs, which is one of the main cost components for the container shipping industry. In 2019,
the average bunker consumption price (MFO and MDO) was USD 416 per tonne (MFO: USD 400
per tonne; MDO: USD 600 per tonne). This was USD 5 per tonne lower than the average for the
previous year. Changes in the price of bunker fuel are aligned with the price of crude oil, which
has been subject to substantial fluctuations and influenced by a number of economic and geo-
political factors in the past. Bunker prices rose slightly in the course of 2019, before temporarily
decreasing slightly in the second half of the year. In the beginning of 2020 a slight decrease of
bunker prices could be observed in comparison to the high price level in the end of 2019. If
this trend reverses, it is likely to lead to an increase in fuel costs in 2020.
With the entry into force of the global marine fuel regulation IMO on 1 January 2020, the sulphur
limit for fuel was lowered from 3.5% to 0.5%. During 2019, Hapag-Lloyd therefore gradually
implemented the Marine Fuel Recovery (MFR) mechanism, which replaces the bunker surcharges
that were previously part of the average freight rate. The higher price of low-sulphur fuel (LSFO
0.5% sulphur) will automatically be included in the MFR as soon as Hapag-Lloyd ships use
low-sulphur fuel. The MFR mechanism captures different parameters such as fuel consumption
per day, fuel type and price (for HSFO, LSFO 0.5% and LSFO 0.1%), sea and port days, and
transported TEU. These parameters are derived from a representative service in the market for a
specific trade. The MFR also takes account of price fluctuations with an optimised coverage of
upward and downward movements in fuel market prices. Fluctuating bunker prices can therefore
have inpart a major impact on average freight rates, depending on the trade in question. To limit
the effect that rising bunker prices have on its shipping costs, Hapag-Lloyd is endeavouring to
offset a large proportion of the fluctuations in raw materials prices by means of the MFR mecha-
nism on freight rates. However, the extent to which this can be implemented depends heavily on
the prevailing market situation. If the cost increases cannot be passed on to customers, or can
only be passed on in part, this will have a negative impact on earnings.
In addition, price risks emanating from fuel procurement are hedged by means of hedging trans-
actions in accordance with the internal strategy. This involves hedging the Company’s anticipated
bunker requirements. Please refer to the “(27) Financial instruments” section of the Notes to the
consolidated financial statements for information on the scope and type of hedging instruments
as at the balance sheet date. By the end of December 2019, approximately 20% of the planned
fuel consumption volumes for the 2020 financial year had been hedged.
The requirement to use marine diesel oil (MDO) as a result of stricter environmental regulations
governing coastal regions may lead to a considerable rise in transport expenses, given the signif-
icantly higher price of MDO. In 2019, around 16% (previous year: around 13%) of total bunker
consumption of approximately 4.4 million tonnes (previous year: approximately 4.4 million tonnes)
was low-sulphur bunker.
107
H a p a g - L L o y d a g I a n n u a L R e p o R t 2 0 1 9
o u t L o o k - , R I s k - a n d o p p o R t u n I t y R e p o R t I C o M b I n e d M a n a g e M e n t R e p o R t

Fluctuations in transport volumes and freight rates
In respect of the development of transport volumes and freight rates, there are differences
between the various trades in which Hapag-Lloyd is active. The development of transport vol-
umes depends heavily on economic activity in the regions linked together by the trades. Freight
rate developments are also largely determined by the available transport capacities within a
trade. In view of the fact that transport capacities are set to increase further in the near future,
intensified competition between the shipping companies may again lead to greater price com-
petition in individual trades in 2020, as has been the case in recent years. Transport volumes
and freight rates in container shipping are traditionally subject to sharp seasonal fluctuations.
The peak season in the third quarter of the calendar year is of particular importance to the
Com pany’s performance and earnings. If the transport volumes and freight rates do not contri-
bute the expected contribution to earnings, this could have a negative effect on Hapag-Lloyd’s
earnings position.
Hapag-Lloyd is working continuously on the further development of IT-based forecast models
in order to minimise empty legs and reduce the costs incurred because of them. This results in
cost advantages if efforts to reduce the empty leg ratio to below the market average prove to be
successful, which could have a positive effect on the earnings position.
Fluctuations in charter rates and ship and container capacities
Within the framework of a charter contract, a ship owner puts a ship at the disposal of a con-
tainer liner shipping company for a contractually agreed period, with the owner usually also pro-
viding the crew, insuring the ship and being responsible for maintenance. As charter rates are
subject to severe fluctuations influenced by how market participants anticipate that supply and
demand will develop in the future – especially for short-term contracts – chartering ships in peri-
ods of increasing demand can be more expensive than operating own ships. It cannot be ruled
out that charter rates could rise sharply in the future and that it might not be possible to pass on
these cost increases to customers in the form of higher freight rates. The effect of this risk on the
earnings position is classified as low.
The proportion of own and leased ships in terms of the total capacity (in TEU) of the Hapag-Lloyd
fleet as at 31 December 2019 was approximately 62% (previous year: approximately 64%). The
remaining 38% are chartered, of which 16 ships are chartered long-term, 40 medium-term and
71 short-term (previous year: 8 ships long-term, 38 medium-term and 69 short-term).
Charter rates are determined by the supply of and demand for ship capacities and by develop-
ments in freight rates. As a rule, charter rates shadow the trend in freight rates, which are
dependent on expectations regarding the future development of the supply of and demand for
transport capacities, with a time lag of several months. This time lag in adjusting charter rates is
caused by the contractual bond between the ship’s owner and the liner shipping company. This
means that in the event of increasing demand, the owner cannot raise their charter rates before
the contract expires. If demand is weakening, on the other hand, the shipping company cannot
reduce its charter rates before existing contracts expire. In this case, falling freight rates accom-
panied by fixed charter rates can lead to a decrease in revenue, particularly after a phase of high
demand for ship chartering. As a result, Hapag-Lloyd may be unable to reduce its portfolio of
chartered ships with above-average charter rates in comparison to the market for several months
as a response to falling freight rates.
108
H a p a g - L L o y d a g I a n n u a L R e p o R t 2 0 1 9
C o M b I n e d M a n a g e M e n t R e p o R t I o u t L o o k - , R I s k - a n d o p p o R t u n I t y R e p o R t

The market fluctuations between the supply of and demand for transport services can lead to
opportunities as a result of the achievement of cost advantages and increasing freight rates. If
there is a large inventory of chartered ships, there may be cost advantages lasting several
months if ships are chartered at favourable rates and the freight rates increase as a result of
higher demand. This could have a positive effect on Hapag-Lloyd’s earnings position.
Earnings contribution of efficiency projects
With Strategy 2023, Hapag-Lloyd is striving for quality leadership while aiming to expand
its business in selected markets.
If the measures specified as part of Strategy 2023 cannot exploit the expected long-term poten-
tial, the resulting discrepancies could have negative effects on its earnings position. The develop-
ment of earnings and the achievement of corporate goals are closely linked to the successful
implementation of efficiency and cost-cutting programmes as part of Strategy 2023. At the time
of publication of the strategy Hapag- Lloyd expected the announced cost-cutting measures to
generate annual cost savings of USD 350 to 400 million from 2021 onwards. If implementation
of these measures does not deliver the expected contribution to earnings, this could have a neg-
ative effect on Hapag-Lloyd’s earnings position and jeopardise its ability to achieve its medi-
um-term financial targets.
If unexpected potential is exploited by the measures planned under Strategy 2023, this could
have a positive impact on Hapag-Lloyd’s earnings position.
Risks resulting from intense competition and state aid for competitors
Global container shipping is characterised by intense competition among the shipping compa-
nies. Some of the competitors are larger than Hapag-Lloyd in terms of business volume, fleet
size, transport volume and capacities. Others have better capital resources. This means that
these competitors can be better positioned on the market to achieve economies of scale and
are able to invest in more efficient ships. They would therefore be able to offer a more cost-
effective service and lower freight rates. This, in turn, might have an adverse effect on Hapag-
Lloyd’s market share and would have a negative impact on the earnings position.
Generally, Hapag-Lloyd does not conclude long-term or exclusive contracts with its customers.
The majority of customers maintain similar business relationships with other shipping companies.
Depending on the market circumstances, customers may partially or solely use other shipping
companies’ services. In global container shipping, there are no restrictions for competitors who
want to expand their service to cover other trades or routes. Each of the competitors might
therefore offer a comparable service on the routes where Hapag-Lloyd maintains a liner service
and try to undercut the Group’s freight rates. In view of the currently low charter rates for ships,
new competitors could also emerge and provide a liner service with particularly low freight rates
and therefore negatively affect the earnings position.
State aid for exports in the form of lower interest rates on ship financing for customers placing
orders at local shipyards as well as the sharp increase in ship financing activities from Chinese
banks and lease companies may result in too many ships being ordered, causing capacity sup-
ply to grow faster than demand, with negative effects on freight rates.
109
H a p a g - L L o y d a g I a n n u a L R e p o R t 2 0 1 9
o u t L o o k - , R I s k - a n d o p p o R t u n I t y R e p o R t I C o M b I n e d M a n a g e M e n t R e p o R t
Membership of alliances
Since 1 April 2017, Hapag-Lloyd has been operating THE Alliance in partnership with Ocean
Network Express Pte. Ltd. (Singapore) (ONE) (formerly Kisen Kaisha Ltd. (Japan), Mitsui O.S.K.
Lines Ltd. (Japan) (MOL), Nippon Yusen Kabushiki Kaisha Ltd. (Japan)) and Yang Ming Marine
Transport Corp. Ltd. (Taiwan) (Yang Ming). In addition, it is planned that the South Korean liner
shipping company Hyundai Merchant Marine (HMM) will join the alliance as a full member. THE
Alliance is the successor organisation to the Grand Alliance and the G6 Alliance. The partnership
is scheduled to last for at least 5 years. Members must remain in the alliance for 36 months and
then give 12 months’ notice if they wish to leave. In the event of a change of control or insolvency,
a member may be excluded from the alliance. The decision to exclude an alliance member must
be taken unanimously by the other members.
Hapag-Lloyd’s membership of alliances is important for it to be able to cover all the key trades
and offer a global service network. The conditions within the alliances could change or other
shipping companies could relinquish or not renew their membership. These various alliances
have different levels of presence in the respective trades. Further cost advantages within an
alliance could result from the expansion of networks and ranges of services for customers.
Cost competition could have a negative impact on Hapag-Lloyd’s profitability.
Hapag-Lloyd’s membership of alliances puts it in a position to offer its own customers a more
comprehensive network of liner services on important trades with regular departure times, which
would not be possible with its own fleet. This means the Company is better able to capitalise on
opportunities arising from developments in transport volumes and ship capacities.
The Block Exemption Regulation for consortia (BER) defines special competition regulations for
consortia and alliances operating within the European Union and remains valid until April 2020.
The work programme of the European Commission provides for an extension of the regulation
of four more years. A final decision regarding this is expected at the end of the first quarter. A
possible withdrawal of the BER would cause the loss of the clear guidance for internal documen-
tation. The legality of alliances would remain the same.
Hapag-Lloyd needs to be a member of an alliance in order to offer a global service network. If
Hapag-Lloyd were to be excluded from an alliance or refused membership of an alliance, this
would have significant negative effects on its competitive situation and therefore its earnings
position. In the event that a member of THE Alliance becomes insolvent, there is an emergency
mechanism in place. It provides funds to continue alliance operations.
A possible expansion of the services and collaboration within THE Alliance, for example into
hinterland transport, could provide additional growth opportunities and therefore have a positive
impact on Hapag-Lloyd’s earnings position.
110
H a p a g - L L o y d a g I a n n u a L R e p o R t 2 0 1 9
C o M b I n e d M a n a g e M e n t R e p o R t I o u t L o o k - , R I s k - a n d o p p o R t u n I t y R e p o R t
Risks from capacity bottlenecks at individual ports
Over the past few years, capacities in container shipping have grown more quickly than the
number of available berths at the ports. This leads to waiting times at the ports in question and
results in a sometimes considerable amount of lost time during loading and unloading of the
ships. If capacities were increased further, the loss of time at the ports concerned could be even
greater. This would make it harder to keep to the timetables and could put pressure on Hapag-
Lloyd’s earnings and financial position. Decisions on whether to expand the ports are the
responsibility of the respective governments and are therefore beyond the influence of Hapag-
Lloyd. Labour disputes at the ports could likewise make it difficult to adhere to timetables and
possibly result in substantial additional costs with negative effects on Hapag-Lloyd’s earnings
position.
Risks from the operation of ships
The operation of ships involves specific risks which include accidents, collisions, total loss of a
ship, environmental damage, fire, explosions, loss of or damage to the cargo, damage caused
by material defects, human error, war, terrorism, piracy, political activities in individual countries,
loss of certification of ships, difficult weather conditions and delays resulting from strikes by the
crews or dock workers.
All of the points listed above can prevent the ships from operating, impede a shipment’s progress
or lead to the death or injury of people as well as to the loss of or damage to property. This could
damage the reputation of the Company and put pressure on customer relationships. As far
as possible, Hapag-Lloyd has concluded economically appropriate insurance policies to counter
these risks. However, it cannot be ruled out that the existing insurance policies do not cover
the full amount of all types of damage. This could have a significant negative impact on Hapag-
Lloyd’s earnings position.
Risks arising from the loss of the US flag business
Hapag-Lloyd is one of three international container liner shipping companies that provide container
transport services for the governmental organisations of the USA (US flag business). If Hapag-Lloyd
no longer meets the requirements for this, it could have a negative impact on its earnings position.
The US flag business is operated through the company Hapag-Lloyd USA LLC.
111
H a p a g - L L o y d a g I a n n u a L R e p o R t 2 0 1 9
o u t L o o k - , R I s k - a n d o p p o R t u n I t y R e p o R t I C o M b I n e d M a n a g e M e n t R e p o R t

Information Technology
Information and communication technologies are indispensable to Hapag-Lloyd for executing,
managing and documenting as well as developing its business processes globally. The availabil-
ity of its IT systems enables continuous processing of data relating to transport volumes, freight
rates, transport costs, container locations and timetables, thereby ensuring the successful
management of its fleet and containers, the efficient management of business processes and
the effectiveness of costs controls.
An IT systems failure for example due to defective hard- and software components or also due
to cyber attacks could hinder business processes and lead to higher costs due to business inter-
ruptions. To reduce these risks the IT systems are protected in several ways. Hapag-Lloyd is
certified in accordance with ISO 27001 as well as ISO 27701 and has a corresponding informa-
tion security management system to respond to information security risk. Accounting for these
and other risk responses to provide cyber security, the probability of occurrence as well as the
negative impact on the financial and earnings position are classified as low.
Financial risks and opportunities
Management of financial risks
Hapag-Lloyd has a worldwide presence through its business activities. Within the scope of its
ordinary business activities, Hapag-Lloyd is primarily exposed to currency risks, interest rate
risks and liquidity risks, which can have a significant impact on its net asset, financial and earn-
ings position.
An element of the corporate strategy is to limit the currency and commodity price risks resulting
from ordinary business operations by using hedging transactions. The individual rules, respon-
sibility assignments and processes as well as the limits for transactions and risk positions are
established in guidelines and implementation rules. Compliance with the guidelines and trans-
action limits is monitored on an ongoing basis. Hedging transactions are only concluded in order
to hedge anticipated underlying transactions or such transactions recognised in the statement
of financial position. Standardised software is used for the recording, valuation and reporting of
the hedging transactions concluded.
US dollar exchange rate fluctuations
In international container shipping, the US dollar is the currency in which the bulk of services are
usually invoiced. This applies to freight and charter rates, fuel, and the financing of containers
and ships. The US dollar is the functional currency within the Hapag-Lloyd Group. However,
the Group is a business which conducts its operations worldwide and is therefore exposed to
the risk of exchange rate fluctuations because various currencies account for its income and
expenses. This also applies to financial debt assumed in euros. In addition to the US dollar and
the euro, the Indian rupee, Brazilian real, Chinese renminbi, British pound sterling, Canadian
dollar, United Arab Emirates dirham, Japanese yen and Australian dollar are also significant
currencies.
112
H a p a g - L L o y d a g I a n n u a L R e p o R t 2 0 1 9
C o M b I n e d M a n a g e M e n t R e p o R t I o u t L o o k - , R I s k - a n d o p p o R t u n I t y R e p o R t

The reporting currency for the Hapag-Lloyd Group and the individual financial statements of
Hapag-Lloyd AG is the euro. Changes in the USD / EUR exchange rate thus have a considerable
impact on the key financial indicators reported in the annual and quarterly financial statements.
As a result, the key financial indicators reported in euros can diverge significantly from the key
financial indicators for the operating activities reported in US dollars.
The materiality of exchange rate fluctuations is monitored on an ongoing basis. If necessary,
the Group hedges a portion of its net cash outflows using a rolling hedge with the aim of limiting
currency risks in the consolidated financial statements. Despite this, fluctuations in exchange
rates can have a significant influence on Hapag-Lloyd’s earnings position.
Liquidity and access to capital markets
Liquidity risk, i.e. the risk of not being able to fulfil existing or future payment obligations, is man-
aged centrally at Hapag-Lloyd. The Company secures an adequate liquidity reserve for itself by
means of syndicated credit facilities and bilateral bank loans, as well as its portfolio of cash and
cash equivalents. The liquidity reserve amounted to EUR 1,032.8 million as at 31 December 2019
(previous year: EUR 1,133.0 million). Arrangements with the banks to provide lines of credit are
based on a rolling liquidity plan.
The shares of Hapag-Lloyd AG have been listed on the Prime Standard segment of the Frankfurt
Stock Exchange since 6 November 2015. Following its successful IPO, Hapag-Lloyd has
strengthened its equity base and improved its access to the capital market. As a listed company,
there is a wider range of financing options available to Hapag-Lloyd if it needs to obtain financing
in the future, e.g. through the increased issuing of corporate bonds.
Any change to the Hapag-Lloyd Group’s rating or that of the bonds it issues could result in modi-
fied conditions for raising new funds and could adversely affect the price and the fungibility of the
securities it has already issued. A downgrade of the rating could therefore have negative effects
on the financing costs of Hapag-Lloyd, which in turn would adversely affect the Groups earnings
position. A rating upgrade would have the opposite effects.
Risks resulting from changes in the lending values of ships
Typically, lending limits (so-called loan-to-value ratios) are agreed in ship loans, which are
reviewed continuously (usually every 6 months) by the lenders. Failure to meet these loan-to-
value ratios usually means that adequate replacement collateral has to be procured or a corres-
ponding unscheduled repayment has to be made under the loan. The risk could have a negative
impact on liquidity and the financial position of Hapag-Lloyd.
As at the balance sheet date, the used-market prices for ships provide a sufficient buffer in the
loan-to-value ratios of the Company’s ship loans.
113
H a p a g - L L o y d a g I a n n u a L R e p o R t 2 0 1 9
o u t L o o k - , R I s k - a n d o p p o R t u n I t y R e p o R t I C o M b I n e d M a n a g e M e n t R e p o R t

Credit default risks
In order to prevent or reduce bad debt losses, Hapag-Lloyd operates a uniform, centrally
controlled receivables management system. Its components include a standardised approval
procedure for granting loans, complete with a creditworthiness risk check by Bisnode (formerly
Dun & Bradstreet, the world’s largest provider of business information and analyses), securing
the customer receivables by means of credit insurance, and a centrally managed monthly
reporting system for monitoring the outstanding amounts, including their age structure and the
guidelines and rules of receivables management. Please refer to the “(14) Trade accounts receiv-
able and other assets” section of the Notes to the consolidated financial statements for infor-
mation on the scope and type of credit risks as at the balance sheet date.
Bank default risk management covers the Hapag-Lloyd Group’s derivative financial instruments
and financial investments. The maximum default risk of the derivative financial instruments con-
cluded is restricted to the sum of the positive market values of all of these instruments because
the financial damages in the event of their non-fulfilment by the contractual partners would not
exceed this amount. No default risks are expected as derivative financial instruments have been
concluded with different borrowers of impeccable credit standing. Nonetheless, the counterparty
risk is managed by means of internal bank limits and monitored constantly to restrict the risk
position by adjusting the limit if necessary.
Interest rate fluctuations
Interest rate fluctuations which arise as a result of raising new funds are reduced with a balanced
portfolio of fixed and variable interest rate structures. Interest rate hedges can be implemented
further, if necessary. The probability of occurrence and the negative impact on the financial pos-
ition are classified as low.
Risks arising from the impairment of goodwill and other intangible assets
As at 31 December 2019, the goodwill recognised in the consolidated statement of financial
position amounted to EUR 1,600.7 million (previous year: EUR 1,568.8 million). Other intangible
assets totalled a further EUR 1,716.9 million as at the balance sheet date of 31 December 2019
(previous year: EUR 1,773.2 million). Together, this represented 20.5% of the balance sheet total
(previous year: 21.9%). In the event that an impairment test identifies the need to recognise
an impairment charge for goodwill or for other intangible assets, this could have a significant
negative effect on Hapag-Lloyd’s earnings position and equity base. An impairment test as at
31 December 2019 did not identify any need for an impairment charge. As a result, the prob-
ability of a potential need for an impairment of goodwill or other intangible assets is classified
as low at the time of reporting.
Risks arising from investments
Hapag-Lloyd has a 25.1% stake in Container Terminal Altenwerder GmbH (“CTA”). CTA operates
Container Terminal Altenwerder in the Port of Hamburg. CTA’s earnings position, and therefore
its dividend distributions and investment value, are dependent on container throughput at the
terminal. This is also dependent on the continuation of the project to dredge and widen the Elbe
shipping channel. A decrease in container throughput would have a negative impact on the
earnings position of CTA and therefore also on the earnings position of Hapag-Lloyd and could
negatively affect CTA’s investment carrying amount.
114
H a p a g - L L o y d a g I a n n u a L R e p o R t 2 0 1 9
C o M b I n e d M a n a g e M e n t R e p o R t I o u t L o o k - , R I s k - a n d o p p o R t u n I t y R e p o R t

Legal risks and opportunities
Legal and regulatory frameworks
As a container shipping company, Hapag-Lloyd is subject to numerous regulations with domestic
and international applicability. The alteration or broadening of such regulations and the necessity
of obtaining further authorisations can be a burden on the course of business and possibly
require a change of procedures.
These regulations include numerous safety, security and customs regulations in the respective
countries of origin, transit and destination. The Company could face considerable fines if it
infringes applicable regulations.
In connection with this, customs duties could be levied or fines imposed on exporters, importers
or the shipping company. Based on current and foreseeable regulatory frameworks, there are no
discernible factors that could lead to restrictions affecting the Group’s commercial activity.
In the age of big data and digitalisation, data protection and data privacy are crucial in maintain-
ing confidence between customers and companies. The introduction of the General Data Protec-
tion Regulation (GDPR) has bolstered the trend towards more stringent data protection regula-
tions and stricter penalties, particularly in Asia and Latin America. In addition to conventional
data protection regulation, various countries and multinational organisations are seeking greater
standardisation in the area of IT security and cybersecurity. Hapag-Lloyd AG attaches particular
importance to the Cybersecurity Law of the People’s Republic of China.
Furthermore, the increasing digitalisation of business processes is altering Hapag-Lloyd AG’s
risk exposure, which means that the additional risks relating to data protection law must be con-
tinuously assessed and managed. Both the probability of occurrence and the net impact of such
risks on Hapag-Lloyd’s earnings before interest and taxes (EBIT) are classified as medium.
Tightening of climate and environmental protection regulations
The International Maritime Organization (IMO) will continue to promote the tightening of existing
regulations and the development of further measures to increase the maritime industry’s contri-
bution to climate protection efforts. From 2020 onwards, the threshold for sulphur content in
marine fuels will be limited to 0.5%. This represents a significant reduction of the original thresh-
old of 3.5%. Hapag-Lloyd has decided to convert the majority of its fleet to low-sulphur fuel in
the future. In light of this, the MFR charge was introduced to compensate for the increased fuel
prices. The risk is quantified within the assessment of risks due to fuel price fluctuations.
Potential further requirements, that in particular focus on the reduction of greenhouse gas
emissions, could long-term result in increased costs and therefore negatively impact the goal
achievement of the Strategy 2023.
115
H a p a g - L L o y d a g I a n n u a L R e p o R t 2 0 1 9
o u t L o o k - , R I s k - a n d o p p o R t u n I t y R e p o R t I C o M b I n e d M a n a g e M e n t R e p o R t

Legal disputes and legal risks
Hapag-Lloyd AG and some of its subsidiaries are currently involved in legal disputes. These
include disputes with foreign tax authorities, claims asserted by former employees and disputes
arising from contractual relationships with suppliers, former agents and customers. Even if the
Company is successful in legal disputes, they can involve higher expenses with a negative
impact on the earning’s position if uninsured and can damage the Company’s reputation.
As at the reporting date, there was also EUR 9.1 million in contingent liabilities from legal
disputes, whereby the probability of occurrence is classified as low overall.
Risks from taxation
In 1999, Hapag-Lloyd AG decided to make use of the possibility of having its commercial
activities taxed on the basis of the transport capacities utilised (“tonnage tax”). There are also
comparable taxation systems in other European countries. Under this system, the tax burden is
determined by the capacity of the fleet, not by the earnings actually achieved. It requires a
certain percentage of the fleet to be registered and managed in Germany and deployed as an
international liner service. Any change in or discontinuation of tonnage tax or any failure of the
Company to meet the prerequisites for continuing to use the tonnage tax option could con-
siderably increase the tax burden, particularly in periods of high earnings.
Hapag-Lloyd is subject to regular tax audits in various countries where the Group conducts
large-scale business-activities (e. g. Germany, India, USA): These tax audits may lead to the
payment of tax arrears. To the extent that the Company can expect to incur charges and these
charges are quantifiable, these were accounted for by creating corresponding provisions.
As at the reporting date, there was also EUR 48.5 million in contingent liabilities from tax risks
(previous year: EUR 40,7 million), whereby the probability of occurrence is classified as low
overall.
SUMMARISED OVERVIEW OF CORPORATE RISKS AND OPPORTUNITIES
In the view of Hapag-Lloyd’s Executive Board, the key risks relate to a possible lower trans-
port volume growth, a noticeably negative trend in average freight rates, a potentially sharp rise
in average bunker prices, a sustained depreciation of the US dollar against the euro, liquidity
developments that were much poorer than expected and the lower earnings contribution of
efficiency projects.
In the opinion of Hapag-Lloyd’s Executive Board, the key opportunities relate to the successful
implementation of the efficiency and cost-cutting programmes as part of Strategy 2023 and the
resulting positive effects on earnings, a noticeably positive trend in average freight rates, a
much sharper than expected increase in transport volume and the appreciation of the US dollar
against the euro.
116
H a p a g - L L o y d a g I a n n u a L R e p o R t 2 0 1 9
C o M b I n e d M a n a g e M e n t R e p o R t I o u t L o o k - , R I s k - a n d o p p o R t u n I t y R e p o R t

These opportunities are regularly analysed and discussed in Hapag-Lloyd’s management bodies.
The Executive Board informs the Supervisory Board about the potential impact of the aforemen-
tioned opportunities on corporate development in its scheduled meetings and in individual dis-
cussions.
Risks are assigned to internally defined risk classes (based on internal sensitivity analyses and
models) according to their probability of occurrence and net impact. The probability of the
potential opportunities occurring and their potential impact on corporate development were
classified on the basis of the system for assessing the Group’s risk situation in internal Group
risk management reports.
In addition, the probability of occurrence of the risk and opportunity situation was compared
with the previous year’s assessment. The details relating to possible effects on the Group net
result are netted, i.e. after the effects of risk responses have been accounted for.
The probability of risks and opportunities occurring based on the planning assumptions for the 2020 financial year as at the time of preparation of the management report is classified as follows:
Probability class Probability range
Low ≤25%
Medium>25% ≤ 50%
High >50%
The assessment of the risk and opportunities situation compared to the previous year results from the change in the probability of occurrence:
Change class Probability change
Low significant lower
Medium unchanged
High significant higher
The impact of risks and opportunities, after considering risk responses, on the Group’s operating result (EBIT) in the financial year is classified as follows:
Impact class Financial impact
Low ≤ USD 100 million
Medium> USD 100 million ≤ USD 250 million
High > USD 250 million
117
H a p a g - L L o y d a g I a n n u a L R e p o R t 2 0 1 9
o u t L o o k - , R I s k - a n d o p p o R t u n I t y R e p o R t I C o M b I n e d M a n a g e M e n t R e p o R t

Key risks and opportunities
Risks and opportunities
Risks Opportunities
Potential impact
Probability of occurence
Probability of occurence in 2020 in com-parison to the previous year
Potential impact
Probability of occurence
Probability of occurence in 2020 in com-parison to the previous year
Fluctuations in transport volumes Medium Medium Equal Low Low Equal
Fluctuations in freight rates High Medium Equal High Medium Equal
US dollar exchange rate fluctuations Low Low Equal Low Medium Lower
Fuel price fluctuations Medium Medium Higher Medium Medium Lower
Liquidity1 High Low Equal - - -
Earnings contri-bution of effi-ciency projects Medium Low Equal Low Low Lower
1 The assessment relates to the impact on the covenants to be complied with and on the liquidity situation.
OVERALL ASSESSMENT OF RISKS AND OPPORTUNITIES
The assessment of Hapag-Lloyd’s overall risk picture is the result of a consolidated analysis of
all of the Group’s significant individual risks and opportunities. After the balance sheet date of
31 December 2019, there are currently no indications of any risks, either alone or in combination
with other risks, which endanger the continued existence of Hapag-Lloyd as a going concern.
The occurrence of one or more of these risks could have a substantial negative impact on the
industry and, by extension, on the business development of Hapag-Lloyd in the 2020 financial
year, which could also lead to impairments on goodwill, other intangible assets and property,
plant and equipment. In light of the continuing macroeconomic and geopolitical uncertainties in
2020, the assessment of overall risk remains unchanged from 2019.
The main risk facing Hapag-Lloyd in 2020 continues to be a market environment characterised
by a strong level of competition, which could lead to renewed pressure on freight rates and, in
turn, to a significant potential impact on the earnings position. The outlook for global economic
performance is stable, and this should lead to increasing global trade and therefore to growing
demand for container transport services. This outlook for the full year is subject to a high degree
of uncertainty due to the consequences of COVID-19 for regional and global economic develop-
ments and therefore also the development of the container transport volume that cannot be
quantified at present.
118
H a p a g - L L o y d a g I a n n u a L R e p o R t 2 0 1 9
C o M b I n e d M a n a g e M e n t R e p o R t I o u t L o o k - , R I s k - a n d o p p o R t u n I t y R e p o R t
NOTES TO THE INDIVIDUAL FINANCIAL STATEMENTS OF HAPAG-LLOYD AG (GERMAN COMMERCIAL CODE (HGB))
GENERAL PRINCIPLES / PRELIMINARY REMARKS
The Hapag-Lloyd Group is essentially defined by the activities of the parent company
Hapag-Lloyd AG, domiciled in Hamburg.
Hapag-Lloyd AG’s performance is fundamentally subject to the same risks and opportunities as
the Hapag-Lloyd Group. The outlook for the Hapag-Lloyd Group largely reflects the expectations
for Hapag-Lloyd AG due to both the interconnectedness of Hapag-Lloyd AG with its subsidiaries
and to the significance of Hapag-Lloyd AG within the Group. For this reason, the preceding com-
ments apply to the Hapag-Lloyd Group as well as to Hapag-Lloyd AG.
The factors influencing Hapag-Lloyd AG’s result before interest and taxes and that of the Group
differ mainly as a result of the accounting principles used (IFRS and HGB) and particularly in
relation to the different functional currencies (euro and US dollar) in this regard. Accordingly,
Hapag-Lloyd AG is subject to exchange rate risks resulting in particular from financial debt
denominated in USD, while currency risks arise within the Group from financial debt obtained
in EUR.
The annual financial statements of Hapag-Lloyd AG were prepared in accordance with the
German Commercial Code (HGB) and in accordance with the supplementary provisions of the
German Stock Corporation Act (AktG) and were audited by the external auditors KPMG AG
Wirtschaftsprüfungsgesellschaft, Hamburg. They are published in the online version of the
German Federal Gazette.
Hapag-Lloyd AG has the following key branch offices active in the areas of sales and operations:
Hapag-Lloyd Rotterdam (Rotterdam, Netherlands), Hapag-Lloyd Antwerpen (Antwerp, Belgium),
Hapag-Lloyd Denmark (Holte, Denmark) and Hapag-Lloyd Poland (Gdansk, Poland).
As at 31 December 2019, Hapag-Lloyd AG’s fleet comprised 231 container ships, 56 of which it
owns (previous year: 220 ships, 56 of which it owned). The number of employees of Hapag-Lloyd
AG was 3,486 on the reporting date (previous year: 3,381).
ECONOMIC REPORT
Report on the Hapag-Lloyd Group’s forecast development in 2019
compared with the forecast
For the 2019 financial year, the forecast report of the annual financial statements and manage-
ment report 2018 of the Hapag-Lloyd AG assumed an improvement in earnings from operating
activities. With a profit from operating activities of EUR 340.8 million in 2019, the result was
significantly higher than the previous year’s result from operating activities of EUR -34.3 milion.
119
H a p a g - L L o y d a g I a n n u a L R e p o R t 2 0 1 9
n o t e s t o t H e I n d I v I d u a L f I n a n C I a L s t a t e M e n t s I C o M b I n e d M a n a g e M e n t R e p o R t

EARNINGS, FINANCIAL AND NET ASSET POSITION
The general economic and sector-specific conditions of Hapag-Lloyd AG are essentially the
same as those of the Group and are described in the Economic report of the combined
management report.
EARNINGS POSITION
In the 2019 financial year, a higher transport volume and a slight increase in freight rates as well
as a higher increase in revenues compared to transport expenses, resulted in a positive effect on
Hapag-Lloyd AG’s earnings. At the same time, the average USD / EUR exchange rate was
stronger than in the previous year (2019: USD 1.12 / EUR, previous year: USD 1.18 / EUR), which
also had a positive effect on earnings. The closing rate of the US dollar on 31 December 2019
was USD 1.12 / EUR (previous year: USD 1.15 / EUR). These developments increased earnings
from operating activities by EUR 375.1 million overall to EUR 340.8 million. In total, Hapag-Lloyd
AG recorded a net profit of EUR 222.9 million in the 2019 financial year (previous year: net loss
of EUR 187.0 million).
Notes to the income statement
million EUR 1.1.-31.12.2019 1.1.-31.12.20181
Revenue 12,525.8 11,587.8
Decrease / increase in capitalised expenses for unfinished voyages –44.1 2.4
Other own work capitalised 6.0 2.8
Other operating income 628.5 812.6
Transport expenses –10,565.4 –10,082.5
Personnel expenses –286.5 –277.4
Depreciation, amortisation and impairment –451.8 –433.8
Other operating expenses –1,471.7 –1,646.2
Operating result 340.8 –34.3
Financial result –77.6 –120.2
thereof interest result –170.6 –198.4
Taxes on income –7.4 –5.3
Result after taxes 255.8 –159.8
Other taxes –32.9 –27.2
Net gain or loss for the year 222.9 –187.0
Retained earnings brought forward 208.8 422.2
Withdrawal from the capital reserve – –
Balance sheet profit 431.7 235.2
EBIT 397.1 12.2
EBIT margin (%) 3.2 0.1
EBITDA 848.9 446.0
EBITDA margin (%) 6.8 3.8
1 The mapping of items within the operating result has been changed. Expenses that were previously netted against revenue have been recognised as transport expenses or other operating expenses. Additionally expenses has been regrouped from other operating expenses to transport expenses. The previous year’s values have been adjusted accordingly.
120
H a p a g - L L o y d a g I a n n u a L R e p o R t 2 0 1 9
C o M b I n e d M a n a g e M e n t R e p o R t I n o t e s t o t H e I n d I v I d u a L f I n a n C I a L s t a t e M e n t s
In the 2019 financial year, revenue rose by 8.1% to EUR 12,525.8 million (previous year:
EUR 11,587.8 million). This was due to higher transport volumes, a slight increase in the aver-
age freight rate as well as rate of exchange effects. Hapag-Lloyd AG transported a total of
11,913 TTEU in the financial year (previous year: 11,750 TTEU), which was an increase of
163 TTEU, or 1.4%. The average freight rate for the 2019 financial year stood at USD 1,067 / TEU
(previous year: USD 1,038 / TEU) and therefore rose by USD 29 / TEU, or 2.8%. In addition,
Hapag-Lloyd AG recorded an increase in income from inland container transport.
Other operating income fell from EUR 812.6 million to EUR 628.5 million in the reporting year.
The main reason for this was lower exchange rate gains compared to the prior year period in the
amount of EUR 495.2 million (previous year: EUR 668.2 million). These primarily resulted from
the measurement of foreign currency receivables and liabilities with affiliated companies due to
the change in the USD / EUR exchange rate. In addition, income from derivatives decreased by
EUR 28.1 million.
In the 2019 financial year, transport expenses rose by EUR 482.9 million to EUR 10,565.4 million
(previous year: EUR 10,082.5 million), representing an increase of 4.8%. Within transport
expenses, expenses for raw materials and supplies decreased by EUR 40.0 million to EUR
1,579.8 million (previous year: EUR 1,619.8 million) in particular as a result of the slight drop in the
average bunker consumption price. By contrast, the slight rise in transport volume as well as
higher terminal costs and costs for chartering of ships increased the cost of purchased services
by EUR 522.9 million to EUR 8,985.6 million.
Personnel expenses rose year-on-year by 3.3% to EUR 286.5 million (previous year: EUR
277.4 million), primarily as a result of growth in the number of employees at Hapag-Lloyd AG and
the associated increase in wages and salaries. As at 31 December 2019, a total of 3,486 people
(including apprentices) were employed at Hapag-Lloyd (previous year: 3,381). At 2.3%, there was
a slight drop in the personnel expenses ratio compared to 2.4% in the 2018 financial year.
Depreciation, amortisation and impairment of EUR 451.8 million was recorded in the 2019
financial year (previous year: EUR 433.8 million). The increase here essentially resulted from
higher depreciation due to investments in containers during the financial year.
The fall in other operating expenses of EUR 174.5 million to EUR 1,471.7 million was mainly
caused by significantly lower exchange rate losses, including bank charges, in the amount of
EUR 628.8 million (previous year: EUR 884.2 million). These were largely due to the valuation
of receivables and liabilities denominated in USD on the reporting date and to lower exchange
rate effects of currency forward contracts. Netted, the exchange rate-related other operating
income and other operating expenses resulted in a decrease in earnings of EUR 133.6 million
(previous year: EUR 216.0 million).
121
H a p a g - L L o y d a g I a n n u a L R e p o R t 2 0 1 9
n o t e s t o t H e I n d I v I d u a L f I n a n C I a L s t a t e M e n t s I C o M b I n e d M a n a g e M e n t R e p o R t

The operating result in the last financial year was EUR 340.8 million (previous year:
EUR –34.3 million). Earnings before interest and taxes also include income from profit transfer
agreements, income from investments, amortisation of financial assets and marketable securi-
ties, expenses from the transfer of losses and other taxes and came to EUR 397.1 million as at
the balance sheet date (previous year: EUR 12.2 million). Compared to the Group’s EBIT of
EUR 811.4 million, the German Commercial Code (HGB) earnings are significantly lower. This
was primarily caused by the inclusion of subsidiary earnings within the Group and negative
exchange rate effects from the translation of financial liabilities due to the development of the
USD/EUR exchange rate. Earnings before interest, taxes, depreciation and amortisation
(EBITDA), defined as EBIT plus depreciation and amortisation, came to EUR 848.9 million (previ-
ous year: EUR 446.0 million) and were likewise significantly lower than the figure for the Group of
EUR 1,985.8 million (previous year: EUR 1,138.6 million). In addition to the primary reasons
detailed above, the accounting for lease contracts according to IFRS 16 increases this difference
between the individual financial statements of Hapag-Lloyd AG and the Group from financial
year 2019 onwards because within the individual financial statements of Hapag-Lloyd AG the
lease expenses are included within the transport expenses.
In the 2019 financial year, the financial result improved by EUR 42.6 million to EUR –77.6 million
(previous year: EUR –120.2 million). The main reason for this was the rise in interest income as a
result of the first-time recognition of a guarantee fee with a company within the Group in 2019 in
the amount of EUR 29.2 million. The early redemption of an EUR bond resulted in one time
effects for redemption costs, the disposal of the associated derivative and premium amounts,
which were recognised in a total of EUR 21.8 million in interest expenses and EUR 6.5 million in
interest income. In addition, income from investments increased from EUR 72.5 million to
EUR 89.5 million.
A net profit for the financial year of EUR 222.9 million was reported in 2019 (previous year: net
loss for the financial year of EUR 187.0 million). Including retained earnings carried forward of
EUR 208.8 million after distribution of a dividend of EUR 26.4 million, the Company recorded
retained earnings of EUR 431.7 million (previous year: EUR 235.2 million).
122
H a p a g - L L o y d a g I a n n u a L R e p o R t 2 0 1 9
C o M b I n e d M a n a g e M e n t R e p o R t I n o t e s t o t H e I n d I v I d u a L f I n a n C I a L s t a t e M e n t s
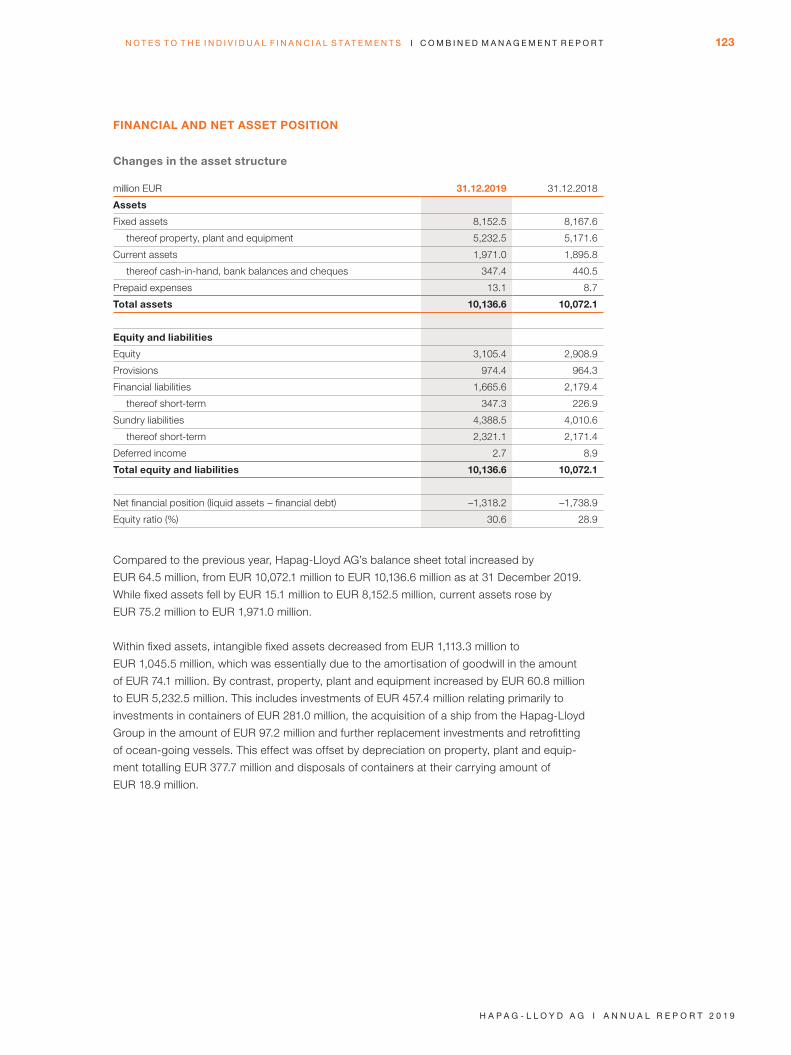
FINANCIAL AND NET ASSET POSITION
Changes in the asset structure
million EUR 31.12.2019 31.12.2018
Assets
Fixed assets 8,152.5 8,167.6
thereof property, plant and equipment 5,232.5 5,171.6
Current assets 1,971.0 1,895.8
thereof cash-in-hand, bank balances and cheques 347.4 440.5
Prepaid expenses 13.1 8.7
Total assets 10,136.6 10,072.1
Equity and liabilities
Equity 3,105.4 2,908.9
Provisions 974.4 964.3
Financial liabilities 1,665.6 2,179.4
thereof short-term 347.3 226.9
Sundry liabilities 4,388.5 4,010.6
thereof short-term 2,321.1 2,171.4
Deferred income 2.7 8.9
Total equity and liabilities 10,136.6 10,072.1
Net financial position (liquid assets - financial debt) –1,318.2 –1,738.9
Equity ratio (%) 30.6 28.9
Compared to the previous year, Hapag-Lloyd AG’s balance sheet total increased by
EUR 64.5 million, from EUR 10,072.1 million to EUR 10,136.6 million as at 31 December 2019.
While fixed assets fell by EUR 15.1 million to EUR 8,152.5 million, current assets rose by
EUR 75.2 million to EUR 1,971.0 million.
Within fixed assets, intangible fixed assets decreased from EUR 1,113.3 million to
EUR 1,045.5 million, which was essentially due to the amortisation of goodwill in the amount
of EUR 74.1 million. By contrast, property, plant and equipment increased by EUR 60.8 million
to EUR 5,232.5 million. This includes investments of EUR 457.4 million relating primarily to
investments in containers of EUR 281.0 million, the acquisition of a ship from the Hapag-Lloyd
Group in the amount of EUR 97.2 million and further replacement investments and retrofitting
of ocean-going vessels. This effect was offset by depreciation on property, plant and equip-
ment totalling EUR 377.7 million and disposals of containers at their carrying amount of
EUR 18.9 million.
123
H a p a g - L L o y d a g I a n n u a L R e p o R t 2 0 1 9
n o t e s t o t H e I n d I v I d u a L f I n a n C I a L s t a t e M e n t s I C o M b I n e d M a n a g e M e n t R e p o R t

The change in current assets resulted primarily from the increase in accounts receivable and
other assets of EUR 173.2 million to EUR 1,255.4 million. In addition to trade accounts receivable
totalling EUR 351.1 million (previous year: EUR 404.0 million), they primarily included accounts
receivable from affiliated companies in the amount of EUR 699.3 million (previous year:
EUR 493.9 million). The increase in intercompany accounts receivable was due to the increase
of the shareholder loan to the subsidiary Hapag-Lloyd Special Finance relating to the pro-
gramme to securitise trade accounts receivable.
Hapag-Lloyd AG’s cash and cash equivalents as at 31 December 2019 were EUR 347.4 million
(previous year: EUR 440.5 million).
As at 31 December 2019, Hapag-Lloyd AG had equity totalling EUR 3,105.4 million (previous
year: EUR 2,908.9 million). The year-on-year change was partly due to a net profit for the year
of EUR 222.9 million (previous year: net loss for the year of EUR 187.0 million) and partly due to
a distribution from the previous year’s retained earnings in the amount of EUR 26.4 million.
Including remaining retained earnings carried forward from the previous year of EUR 208.8 mil-
lion, as at 31 December 2019 there were retained earnings of EUR 431.7 million (previous year:
EUR 235.2 million). The equity ratio was approximately 31% as at 31 December 2019 (previous
year: approximately 29%).
Provisions rose slightly from EUR 964.3 million to EUR 974.4 million in the reporting period. This
included increases in provisions for maintenance for leased containers of EUR 8.0 million, for
personnel expenses of EUR 7.8 million and for outstanding invoices of EUR 21.7 million. The pro-
visions for onerous currency forward contracts have decreased by EUR 52.1 million compared
to previous year.
Financial liabilities came to EUR 1,665.6 million at the balance sheet date (previous year:
EUR 2,179.4 million). They comprise a bond issued by Hapag-Lloyd AG and liabilities to banks.
The sharp decrease in financial debt resulted from debt repayments during the reporting year
totalling EUR 649.3 million. This included the early redemption of a EUR bond issued in 2017 in
the amount of EUR 450.0 million. The utilisation of credit facilities in the amount of EUR 139.7
million had an offsetting effect. More detailed information on individual financing activities is
provided under Group financial position. The balance sheet date valuation effects relating to
financial liabilities denominated in US dollars resulted in a EUR 10.3 million increase in finan-
cial liabilities.
Sundry liabilities increased from EUR 4,010.6 million to EUR 4,388.5 million and essentially
comprise liabilities to affiliated companies in the amount of EUR 2,385.5 million (previous year:
EUR 2,278.3 million), miscellaneous loans and other financial debt in the amount of EUR
1,250.1 million (previous year: EUR 985.3 million) and trade accounts payable in the amount of
EUR 644.4 million (previous year: EUR 600.6 million). The main reasons for the increase of
EUR 377.9 million of sundry liabilities were the payments for the new sale and leaseback transac-
tions for containers and for a ship totalling EUR 373.6 million and an increase of EUR 91.5 million
in intercompany trade accounts payable with various subsidiaries. These were counteracted by
repayments of loans and other financial debt in the amount of EUR 124.1 million, which reduced
sundry liabilities. Regarding further information especially in respect to nature and maturity
structure of the liabilities we refer to note (10) Liabilities within the Notes to the individual financial
statements of Hapag-Lloyd AG.
124
H a p a g - L L o y d a g I a n n u a L R e p o R t 2 0 1 9
C o M b I n e d M a n a g e M e n t R e p o R t I n o t e s t o t H e I n d I v I d u a L f I n a n C I a L s t a t e M e n t s
Hapag-Lloyd AG manages the Hapag-Lloyd Group’s liquidity centrally, based on a Group-wide
liquidity concept. This concept requires that a significant portion of the Group’s liquidity is con-
centrated within Hapag-Lloyd AG. An important instrument of this is the cash pool located at
Hapag-Lloyd AG. The amount of Hapag-Lloyd AG’s liquidity position therefore reflects the global
business activities of Hapag-Lloyd AG and other Group companies.
Hapag-Lloyd AG’s solvency was fully guaranteed at all times in the last financial year by cash
inflows from operating activities, a portfolio of cash and cash equivalents, and syndicated
credit facilities. The Company had a liquidity reserve (consisting of cash, cash equivalents and
unused credit facilities) totalling EUR 868.7 million as at 31 December 2019 (previous year:
EUR 916.4 million). At the balance sheet date, a sum totalling EUR 10.0 million with a term of
up to three months was deposited in pledged accounts (previous year: EUR 10.4 million) and
was therefore subject to a limitation on disposal.
Hapag-Lloyd AG is subject to transaction risks resulting in particular from financial debt
denominated in USD.
To hedge euro exchange rate risks, derivative hedging instruments are concluded, the hedging
effect of which is only felt within the Group. Interest rate risks which arise as a result of liquidity
procurement on the international money and capital markets are centrally managed within the
scope of interest rate management and are partly limited using derivative interest rate hedging
instruments.
The use of derivative hedging is strictly transaction-related; derivatives are not used for
speculation purposes.
The off-balance-sheet obligations of Hapag-Lloyd AG are described in notes (12) Con-
tingencies and (13) Other financial obligations within the Notes to the financial statements
of Hapag-Lloyd AG.
OUTLOOK, RISK AND OPPORTUNITY REPORT
The outlook for the Hapag-Lloyd Group largely reflects the expectations for Hapag-Lloyd AG
due both to the interconnectedness of Hapag-Lloyd AG with its subsidiaries and to the signifi-
cance of Hapag-Lloyd AG within the Group. For this reason, the comments on the outlook for
the Hapag-Lloyd Group presented in the outlook, risk and opportunity report also apply in
principle to Hapag-Lloyd AG. The factors influencing Hapag-Lloyd AG’s operating result and
that of the Group differ mainly as a result of the accounting principles used (IFRS and HGB)
and of the different functional currencies (euro and US dollar).
Due to the development of the operating result of the operating activities of Hapag-Lloyd AG
before effects of foreign currency valuation as at the balance sheet date 2019, earnings by oper-
ating activities should be expected to match the previous year’s level in the 2020 financial year,
assuming an unchanged USD / EUR exchange rate at the balance sheet date of 31 December
2020. This statement is to be considered in connection with the outlook for Hapag-Lloyd Group
for the 2020 financial year.
125
H a p a g - L L o y d a g I a n n u a L R e p o R t 2 0 1 9
n o t e s t o t H e I n d I v I d u a L f I n a n C I a L s t a t e M e n t s I C o M b I n e d M a n a g e M e n t R e p o R t

The performance of Hapag-Lloyd AG largely depends on the Hapag-Lloyd Group’s risks and
opportunities, which are presented in detail in the outlook, risk and opportunity report in the
combined management report. Furthermore, the following deviating or supplementary risks exist:
• From the perspective of the individual financial statements of Hapag-Lloyd AG in accordance
with the German Commercial Code (HGB), any strengthening of the US dollar represents a
further significant risk, in particular for the measurement effects of financial debt denominated
in US dollars on the reporting date. The probability of occurrence of such risks and their
impact on Hapag-Lloyd AG’s earnings before interest and taxes (EBIT) are classified as
medium. By contrast, any weakening of the US dollar represents an opportunity.
• A sustained loss of customer groups that were acquired through taking over the customer
base of CP Ships Limited, CSAV and UASC and a sustained deterioration in the earnings
position of the companies held as financial investments could lead, respectively, to an impair-
ment of capitalised goodwill in Hapag-Lloyd AG’s statement of financial position or an im -
pairment of the investments’ carrying amounts. This could have a significant negative effect on
Hapag-Lloyd AG’s earnings position. The probability of occurrence of such risks is classified
as low.
As a rule, Hapag-Lloyd AG participates in the risks and opportunities of its investments and
subsidiaries in accordance with its respective stake. Hapag-Lloyd AG is included in the Group-
wide risk management system and the internal control system of the Hapag-Lloyd Group. For
more information, please refer to the Section “Description of the significant characteristics of the
accounting ICS / RMS pursuant to Section 315 (4) of the German Commercial Code (HGB)” in
the combined management report.
REPORT BY THE EXECUTIVE BOARD ON RELATIONSHIPS WITH
AFFILIATED COMPANIES
Pursuant to Section 312 of the German Stock Corporation Act (AktG), the Executive Board of
Hapag-Lloyd AG prepared a report on relationships with affiliated companies for the period from
1 January to 31 December 2019, which contains the following conclusion: “Our Company
received appropriate compensation for each legal transaction listed in the report on relationships
with affiliated companies in accordance with the circumstances known to us when the legal
transactions were conducted. No actions required by or in the interests of the controlling com-
panies or their affiliated companies subject to a reporting obligation were taken or omitted.”
126
H a p a g - L L o y d a g I a n n u a L R e p o R t 2 0 1 9
C o M b I n e d M a n a g e M e n t R e p o R t I n o t e s t o t H e I n d I v I d u a L f I n a n C I a L s t a t e M e n t s
REMUNERATION REPORT
The remuneration report is part of the Group management report of Hapag-Lloyd AG and
describes the basic features of the remuneration system for the Executive Board and Super-
visory Board members and the amount and structure of individual remuneration. The report
adheres to the requirements of the German Corporate Governance Code (GCGC), complies with
the legal provisions of the German Stock Corporation Act (AktG) and the German Commercial
Code (HGB) and incorporates the principles of German Accounting Standard 17 (DRS 17).
1. PRINCIPLES AND OBJECTIVES / GENERAL PRINCIPLES
The Supervisory Board regularly reviews the remuneration of the Executive Board and, if neces-
sary, engages the services of external consultants for this purpose. As part of this review, both
the remuneration structure and the amount of Executive Board remuneration are assessed, in
particular by comparing them with the external market (horizontal benchmarking) and other
remuneration within the Company (vertical benchmarking). If the review identifies the need to
change the remuneration system, structure or amount, the Supervisory Board’s Presidential and
Personnel Committee submits appropriate proposals to the Supervisory Board for approval.
The purpose of the remuneration system for the Executive Board is to remunerate the Executive
Board members appropriately in accordance with their duties and responsibilities, while directly
taking into consideration the performance of each Executive Board member and the success of
the Company.
The structure of the remuneration system for the Executive Board of Hapag-Lloyd AG aims to
incentivise successful, long-term corporate governance that increases the value of the Company.
Executive Board remuneration initially comprises fixed basic remuneration, which is paid monthly
and takes into consideration the duties and activities of the Executive Board members, and per-
formance-related short-term variable remuneration in the form of an annual bonus. The Super-
visory Board can also grant additional remuneration in special circumstances, such as for
extraordinary activities and workloads during the financial year. In addition, benefits in kind and
other fringe benefits are granted to the Executive Board members.
In addition, a long-term remuneration element exists for all Executive Board members (long-term
incentive plan – LTIP) which aims to incentivise long-term commitment to the Company.
Short-term variable remuneration was adjusted for the 2019 financial year. For further details,
see section 2.2 a).
127
H a p a g - L L o y d a g I a n n u a L R e p o R t 2 0 1 9
R e M u n e R a t I o n R e p o R t I C o M b I n e d M a n a g e M e n t R e p o R t
1.1 Changes to the Executive Board
In the 2019 financial year, Dr Maximilian Rothkopf was appointed as an Executive Board member
with effect from 1 May 2019. As the new Chief Operating Officer (COO), Dr Rothkopf succeeded
Executive Board member Anthony J. Firmin, who retired on 30 June 2019. In addition, Mark
Frese was appointed as a new Executive Board member with effect from 25 November 2019. As
the new Chief Financial Officer (CFO), he succeeded Nicolás Burr, who stepped down with effect
from 29 February 2020.
On 28 March 2018, the Supervisory Board of Hapag-Lloyd AG approved a reallocation of the
Executive Board’s responsibilities. CEO Rolf Habben Jansen took responsibility for global sales
activities. Joachim Schlotfeldt became a new member of Hapag-Lloyd AG’s Executive Board on
1 April 2018. In addition to other areas of responsibility, he took charge of human resources (prior
to that, the responsibility of the CEO) as Labour Director, as well as global procurement as Chief
Personnel and Global Procurement Officer (CPO). The latter had been the responsibility of the
Chief Operating Officer (COO). The Chief Commercial Officer (CCO) Thorsten Haeser resigned
on 31 March 2018.
2. MAIN REMUNERATION COMPONENTS
The main remuneration components are broken down as follows:
2.1 Non-performance-related components
a) Fixed annual remuneration
Fixed annual remuneration is cash remuneration based on the financial year. In particular, it
reflects the responsibilities and the position of the respective Executive Board member. This fixed
income is set individually and is divided into 12 equal amounts which are paid at the end of each
month. If an employment contract starts or ends during a financial year, the fixed remuneration is
paid pro rata.
b) Non-cash remuneration and other fringe benefits
Non-cash remuneration and other fringe benefits comprise benefits in kind such as the provision
of a company car, use of the company driver service, retirement benefits, funeral allowances
and allowances for surviving dependants, and insurance cover such as accident insurance. Non-
cash remuneration due is detailed in this remuneration report with the amounts stipulated by tax
legislation.
The Company reimburses Mr Burr for living costs at an appropriate amount. It also covers the
school costs of Mr Burr’s children and the cost of one flight per year to Chile for Mr Burr and his
family. Furthermore, the Company covers the language tuition costs of Mr Burr and his wife. If
Mr Burr is required to pay income tax on these benefits, Hapag-Lloyd AG will pay the applicable
income tax and the benefits will increase accordingly.
With regard to Mr Schlotfeldt, the Company covered his expenses for relocating to Hamburg in
the 2018 financial year as well as his living costs for three months. In each case, the costs were
covered at an appropriate amount in return for supporting documentation.
128
H a p a g - L L o y d a g I a n n u a L R e p o R t 2 0 1 9
C o M b I n e d M a n a g e M e n t R e p o R t I R e M u n e R a t I o n R e p o R t

2.2 Performance-related components
a) Short-term variable remuneration
Short-term variable remuneration is granted in the form of an annual bonus which is paid after
the consolidated financial statements have been examined and audited by the external auditors
and subsequently approved.
For the 2018 financial year, the annual bonus of the ordinary Executive Board members was
equal to 0.065% of the Group’s earnings before interest and taxes (EBIT), capped at
EUR 400,000 (gross); the CEO’s annual bonus for the 2018 financial year was equal to 0.1%
of the Group’s EBIT, capped at EUR 600,000 (gross).
In line with the Supervisory Board’s resolution on 6 November 2018, short-term variable remu-
neration was adjusted as and from the 2019 financial year as follows: as a basic principle the
variable bonus of ordinary Executive Board members is 0.05% of the Company’s earnings before
interest and taxes (EBIT). This is capped at EUR 600,000 (gross) per annum. An exemption from
this is the variable bonus of Mr Frese, which is 0.055% of the Company’s earnings before interest
and taxes (EBIT), capped at EUR 660,000 (gross) per year, and the variable bonus of Mr Firmin
for which no adjustment was made. The variable bonus of the CEO is 0.075% of the Company’s
earnings before interest and taxes (EBIT). This is capped at EUR 900,000 (gross) per year.
Mr Schlotfeldt was granted a guaranteed bonus of EUR 25,000 (gross) for every full calendar
month in which he worked for the Company as an Executive Board member in the period from
1 April 2018 to 31 March 2019. It is paid irrespective of the operating result achieved. Similar to
this agreement, Dr Rothkopf has been granted a guaranteed bonus of EUR 25,000 (gross), as
has Mr Mark Frese in the amount of EUR 27,500 (gross), for every full calendar month in which
they work for the Company as Executive Board members in the first year of their contract. If the
Group’s operating result leads to a higher bonus based on the calculation method outlined
above, the higher amount is paid in each case.
b) Long-term variable remuneration
Under long-term variable remuneration (long-term incentive plan – LTIP), a specified euro amount
is granted to the Executive Board members per calendar year. This allocation amount is con-
verted into virtual shares in the Company on a specific date. The relevant share price for the
conversion at the time of allocation is the average share price over the last 60 trading days before
the virtual shares are granted, which happens on the first trading day of the calendar year. The
virtual shares are divided equally into performance share units and retention share units. They
are subject to a four-year vesting period, during which the corresponding values are unavailable
as a basic principle.
The retention share units automatically become non-forfeitable when the vesting period
expires (non-forfeitable retention share units). They then depend entirely on the Executive Board
member’s length of service.
The number of performance share units relevant for the payment depends on the performance
of the Hapag-Lloyd share compared with a specific, industry-based reference index – the DAX-
global Shipping index – over the performance period. The number of performance share units
can be a maximum of 1.5 and a minimum of 0, depending on the performance of the Hapag-
Lloyd share relative to the chosen index as measured by a performance factor. If the perfor-
mance factor is 0, all of the performance share units are forfeited.
129
H a p a g - L L o y d a g I a n n u a L R e p o R t 2 0 1 9
R e M u n e R a t I o n R e p o R t I C o M b I n e d M a n a g e M e n t R e p o R t

If capital measures which affect the value of real shares are carried out during the term of the
LTIP, the conditions of the plan state that the Executive Board members must be treated like
owners of real shares as a basic principle. In the event of an ordinary capital increase, the stake
in the Company held by owners of real shares is diluted. However, they are granted subscription
rights to new shares in return. Under the conditions of the plan, the Executive Board members
are not automatically granted a subscription right in the event of an ordinary capital increase.
To compensate them for being treated differently to owners of real shares, for all LTIP tranches
belonging to Executive Board members which are in existence when a capital increase is carried
out, the number of shares is adjusted by a value equal to the subscription rights that an owner
of real shares with the same number of shares is entitled to. The additional virtual shares here
are valued at the arithmetical share price on the day before trading of the subscription rights
commences (ex-subscription rights). The rule must be applied separately to all LTIP tranches in
existence at the time of the capital measure. The additional virtual shares are based directly on
the existing virtual shares of the respective LTIP tranches. As a result, the additional virtual
shares are given the same parameters as were defined in the conditions of the plan and at the
time the respective tranche was granted. The additional virtual shares are consequently a com-
ponent of the respective tranche.
When the performance period expires, the number of non-forfeitable virtual shares is converted
into a euro amount by multiplying the non-forfeitable virtual shares by the relevant share price.
This share price is equal to the average share price over the last 60 trading days before the per-
formance period ends.
The amount calculated in this way is paid to the respective Executive Board member as a gross
amount up to a specific limit on 31 March of the year following the end of the performance
period. This upper limit is EUR 750,000 (gross) for ordinary Executive Board members and
EUR 1,050,000 (gross) for the CEO.
If an Executive Board member steps down from their position before the performance period
ends without cause or if their employment contract is extraordinarily terminated by Hapag-
Lloyd for cause pursuant to Section 626 of the German Civil Code (BGB) (“bad leaver”), all
entitlements under the long-term incentive programme are forfeited.
If the employment contract of an Executive Board member expires, the participant retires or the
employment contract ends due to the invalidity of the participant, their entitlements under the
LTIP for the tranches which have not yet been paid remain. As a basic principle, the allocation
amount for the financial year in which the participant resigns is granted on a pro rata basis. For
resignations in the aforementioned cases, the performance period ends when the employment
contract ends, and payment is made at the latest at the end of the third calendar month follow-
ing the end of the performance period.
130
H a p a g - L L o y d a g I a n n u a L R e p o R t 2 0 1 9
C o M b I n e d M a n a g e M e n t R e p o R t I R e M u n e R a t I o n R e p o R t

If an employment contract begins during a financial year, as a basic principle the long-term
variable remuneration component is granted on the basis of the pro rata allocation amount for
the corresponding financial year. Exceptions to this can be made on an individual basis.
Share-based remuneration under the 2019 long-term incentive plan (LTIP)
allotment for 2019 financial year
Numbers of shares
on allotment1
Fair value on allotment
in EUR
Total value on allotment
(allotment amount) in EUR
Rolf Habben Jansen (Chairman of the Executive Board) 23,522 29.76 700,000
Nicolás Burr 16,802 29.76 500,000
Anthony J. Firmin (Member of the Executive Board until 30 June 2019) 16,802 29.76 500,000
Mark Frese (Member of the Executive Board since 25 November 2019) 1,682 29.76 50,000
Dr Maximilian Rothkopf (Member of the Executive Board since 1 May 2019) 11,190 29.76 333,333
Joachim Schlotfeldt (Member of the Executive Board since 1 April 2018) 16,802 29.76 500,000
Total 86,800 2,583,333
1 The number of shares allotted is commercially rounded to the nearest whole number in accordance with the terms and conditions of the 2019 LTIP.
Share-based remuneration under the 2018 long-term incentive plan (LTIP)
allotment for 2018 financial year
Number of shares
on allotment1
Fair value on allotment
EUR
Total value on allotment
(allotment amount) in EUR
Rolf Habben Jansen (Chairman of the Executive Board) 20,784 33.68 700,000
Nicolás Burr 14,846 33.68 500,000
Anthony J. Firmin (Member of the Executive Board until 30 June 2019) 14,846 33.68 500,000
Thorsten Haeser (Member of the Executive Board until 31 March 2018) 11,134 33.68 375,000
Joachim Schlotfeldt (Member of the Executive Board since 1 April 2018) 11,134 33.68 375,000
Total 72,744 2,450,000
1 The number of shares allotted is commercially rounded to the nearest whole number in accordance with the terms and conditions of the 2018 LTIP.
131
H a p a g - L L o y d a g I a n n u a L R e p o R t 2 0 1 9
R e M u n e R a t I o n R e p o R t I C o M b I n e d M a n a g e M e n t R e p o R t

Expense recognised for share-based remuneration under
the long-term incentive plan (LTIP)
EUR
LTIP 2016-2019
Total personnel expense recognised
2019 2018
Rolf Habben Jansen (Chairman of the Executive Board) 1,133,994 664,577
Nicolás Burr 1,522,606 845,043
Anthony J. Firmin (Member of the Executive Board until 30 June 2019) 674,104 1,006,939
Mark Frese (Member of the Executive Board since 25 November 2019) 4,834 0
Dr Maximilian Rothkopf (Member of the Executive Board since 1 May 2019) 165,116 0
Thorsten Haeser (Member of the Executive Board until 31 March 2018) 0 1,180,658
Joachim Schlotfeldt (Member of the Executive Board since 1 April 2018) 672,190 36,284
Total 4,172,844 3,733,501
c) Possible additional remuneration in cash (discretionary bonus)
The Executive Board contracts also stipulate that the Supervisory Board may grant additional
remuneration in special circumstances or for extraordinary activities.
2.3 Company pension
For every full calendar year, the Executive Board members receive an annual lump sum equal to
20% of their fixed annual remuneration for the purpose of a pension in the form of a defined con-
tribution payment pursuant to Section 1 (2) (1) of the German Company Pensions Act (BetrAVG).
The payment is financed by annual contributions from the Company to an assistance fund and is
made until the Executive Board members have reached the age of 67 or until their employment
contracts end. If an employment contract starts or ends during a financial year, the amount is
paid pro rata.
An exception to this is the company pensions of Anthony J. Firmin and Joachim Schlotfeldt, who
are due a company pension payment of EUR 72,000 per year and EUR 69,000 per year respec-
tively as a result of their long-standing service prior to their appointment as Executive Board
members. This amount will be paid when their statutory retirement commences. This will be fur-
ther supplemented by the annual conversion of 20% of fixed annual remuneration into pension
entitlements. The entitlements of Mr Firmin and Mr Schlotfeldt under this company pension will
be transferred to their surviving dependants to a limited extent after they are deceased.
132
H a p a g - L L o y d a g I a n n u a L R e p o R t 2 0 1 9
C o M b I n e d M a n a g e M e n t R e p o R t I R e M u n e R a t I o n R e p o R t

2.4 Regulations in the event that Executive Board activities end
a) Severance payment cap in the event that Executive Board activities end prematurely
In accordance with the German Corporate Governance Code (GCGC), the employment contracts
of the Executive Board members provide for a general cap on any severance payments. Accord-
ingly, payments to an Executive Board member whose Executive Board activities end prema-
turely will not exceed two annual remunerations and must not remunerate more than the remain-
ing term of the employment contract. In the event that an Executive Board member’s contract is
terminated for cause pursuant to Section 626 BGB (“bad leaver”), the employment contracts do
not provide for any severance payment or remuneration under the LTIP.
When calculating the severance payment cap, the remuneration in the last full financial year is
used as a basis (including short-term variable remuneration and fringe benefits); if the Executive
Board member has been in office for two full financial years when the contract ends prematurely,
the average remuneration for the last two financial years is used as a basis. The LTIP is not
taken into consideration when calculating the severance payment.
The Chief Commercial Officer Thorsten Haeser resigned on 31 March 2018. In relation to the
early, mutual termination of his employment contract, Mr Haeser received early payment of the
benefits contractually agreed until the original end date of his employment contract in the first
quarter of the financial year. This comprised in particular a bonus of EUR 0.3 million in lieu of all
of his entitlements to short-term variable remuneration for the financial year. Additionally, an
amount of EUR 2.6 million relating to the LTIP tranches from 2015 to 2018 (long-term variable
remuneration) was paid early. Mr Haeser also received a severance payment of EUR 0.2 million
in the first quarter of the financial year for the early termination of his employment contract.
b) Post-contractual non-compete restrictions
No post-contractual non-compete restrictions have been agreed with the Executive Board
members.
c) Change-of-control clause
The employment contracts of the Executive Board members do not contain any change-of-
control clauses.
The LTIP stipulates that the LTIP ceases in the event of a change of control as defined in the
German Securities Acquisition and Takeover Act (WpÜG). The virtual shares granted until then
become non-forfeitable when the change of control occurs and, pursuant to the conditions of
the LTIP, are converted into a euro amount that is to be paid to the respective Executive Board
member in the short term. If this amount falls below the relevant allocation amount for the Ex -
ecutive Board member, the Executive Board member receives a payment equal to the allocation
amount instead.
2.5 Remuneration of the Executive Board in the 2019 financial year
a) Total remuneration of active Executive Board members pursuant to the German
Commercial Code (HGB) and German Accounting Standard 17 (DRS 17)
The total remuneration granted to active Executive Board members in the financial year was
EUR 7.4 million (2018: EUR 6.8 million). This includes share-based payments with a fair value
of EUR 2.6 million (2018: EUR 2.5 million) on the date the remuneration was granted. The active
Executive Board members were granted a total of 86,800 virtual shares in the financial year
(2018: 72,744).
133
H a p a g - L L o y d a g I a n n u a L R e p o R t 2 0 1 9
R e M u n e R a t I o n R e p o R t I C o M b I n e d M a n a g e M e n t R e p o R t

b) Individual remuneration of active Executive Board members pursuant to the
German Commercial Code (HGB) and German Accounting Standard 17 (DRS 17)
Remuneration of the executive board
EUR
Fixed remuneration Variable remunerationTotal
remuneration
Fixed salary Fringe benefits
Components with short-term incentive effect
Components with long-term incentive effect
Bonuses
Share-based remuneration
(LTIP 2018, LTIP 2019)
Rolf Habben Jansen (Chairman of the Executive Board)
2019 750,000 172,078 608,534 700,000 2,230,612
2018 750,000 172,053 443,039 700,000 2,065,092
Nicolás Burr
2019 450,000 389,830 405,689 500,000 1,745,519
2018 450,000 387,694 287,976 500,000 1,625,670
Anthony J. Firmin (Member of the Executive Board until 30 June 2019)
2019 225,000 11,039 200,000 500,000 936,039
2018 450,000 22,053 287,976 500,000 1,260,029
Mark Frese (Member of the Executive Board since 25 November 2019)
2019 60,000 14,404 37,188 50,000 161,592
Dr Maximilian Rothkopf (Member of the Executive Board since 1 May 2019)
2019 300,000 72,816 270,459 333,000 976,275
Joachim Schlotfeldt (Member of the Executive Board since 1 April 2018)
2019 450,000 12,842 405,689 500,000 1,368,531
2018 337,500 29,519 225,000 375,000 967,019
Total 2019 2,235,000 673,009 1,927,559 2,583,000 7,418,568
Total 2018 1,987,500 611,319 1,243,991 2,075,000 5,917,8101
1 In the previous year, the Executive Board’s total emoluments included the emoluments of Thorsten Haeser, who stepped down from the Executive Board on 31 March 2018. As a result, the sum total of the Executive Board’s emoluments for 2018 in this table is different to the figure for the Executive Board’s emoluments in 2018 in section 2.5 (a) of this remuneration report which includes Thorsten Haeser’s emoluments.
134
H a p a g - L L o y d a g I a n n u a L R e p o R t 2 0 1 9
C o M b I n e d M a n a g e M e n t R e p o R t I R e M u n e R a t I o n R e p o R t

In the past financial year, no member of the Executive Board received payments or correspond-
ing commitments from a third party with regard to their activities as an Executive Board member.
In addition, there were no advance payments or loans to members of the Executive Board as at
31 December 2019 or 31 December 2018.
With regard to pension commitments, the following obligations exist:
Pension plans (pension plans and death grants) pursuant to IFRS and HGB
EURPresent value
(IFRS)Service cost
(IFRS)Present value
(HGB)Personnel expenses
(HGB)
Rolf Habben Jansen (Chairman of the Executive Board)
2019 6,920 1,347 6,467 387
2018 5,955 1,550 5,756 666
Nicolás Burr
2019 3,082 636 2,734 352
2018 2,342 767 2,209 322
Anthony J. Firmin (Member of the Executive Board until 30 June 2019)1
2019 2,671,834 105,984 2,114,571 84,766
2018 2,233,636 203,186 1,847,674 170,369
Mark Frese (Member of the Executive Board since 25 November 2019)
2019 522 0 501 501
Dr Maximilian Rothkopf (Member of the Executive Board since 1 May 2019)
2019 567 0 501 501
Joachim Schlotfeldt (Member of the Executive Board since 1 April 2018)1
2019 2,466,003 230,121 1,807,284 157,473
2018 1,869,197 156,395 1,466,629 -50,888
Total 2019 5,148,928 338,088 3,932,058 243,980
Total 2018 4,111,130 361,898 3,322,268 120,469
1 The figures disclosed include amounts resulting from commitments prior to appointment to the Executive Board (cf. the explanations in section 2.3).
135
H a p a g - L L o y d a g I a n n u a L R e p o R t 2 0 1 9
R e M u n e R a t I o n R e p o R t I C o M b I n e d M a n a g e M e n t R e p o R t
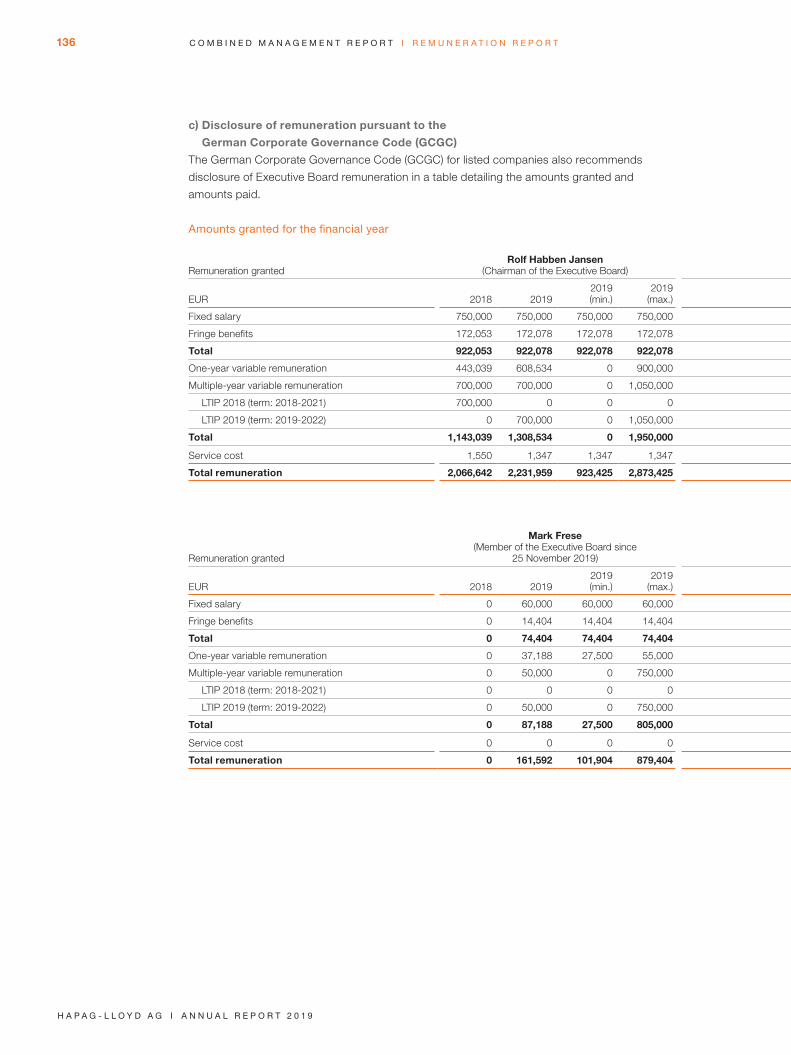
c) Disclosure of remuneration pursuant to the
German Corporate Governance Code (GCGC)
The German Corporate Governance Code (GCGC) for listed companies also recommends
disclosure of Executive Board remuneration in a table detailing the amounts granted and
amounts paid.
amounts granted for the financial year
Remuneration grantedRolf Habben Jansen
(Chairman of the Executive Board)Nicolás Burr Anthony J. Firmin
(Member of the Executive Board until 30 June 2019)
EUR 2018 20192019 (min.)
2019 (max.) 2018 2019
2019 (min.)
2019 (max.) 2018 2019
2019 (min.)
2019 (max.)
Fixed salary 750,000 750,000 750,000 750,000 450,000 450,000 450,000 450,000 450,000 225,000 225,000 225,000
Fringe benefits 172,053 172,078 172,078 172,078 387,694 389,830 389,830 389,830 22,053 11,039 11,039 11,039
Total 922,053 922,078 922,078 922,078 837,694 839,830 839,830 839,830 472,053 236,039 236,039 236,039
One-year variable remuneration 443,039 608,534 0 900,000 287,976 405,689 0 600,000 287,976 200,000 0 200,000
Multiple-year variable remuneration 700,000 700,000 0 1,050,000 500,000 500,000 0 750,000 500,000 500,000 0 750,000
LTIP 2018 (term: 2018-2021) 700,000 0 0 0 500,000 0 0 0 500,000 0 0 0
LTIP 2019 (term: 2019-2022) 0 700,000 0 1,050,000 0 500,000 0 750,000 0 500,000 0 750,000
Total 1,143,039 1,308,534 0 1,950,000 787,976 905,689 0 1,350,000 787,976 700,000 0 950,000
Service cost 1,550 1,347 1,347 1,347 767 636 636 636 203,186 105,984 105,984 105,984
Total remuneration 2,066,642 2,231,959 923,425 2,873,425 1,626,437 1,746,155 840,466 2,190,466 1,463,215 1,042,023 342,023 1,292,023
Remuneration granted
Mark Frese(Member of the Executive Board since
25 November 2019)Dr Maximilian Rothkopf
(Member of the Executive Board since 1 May 2019)Joachim Schlotfeldt
(Member of the Executive Board since 1 April 2018)
EUR 2018 20192019 (min.)
2019 (max.) 2018 2019
2019 (min.)
2019 (max.) 2018 2019
2019 (min.)
2019 (max.)
Fixed salary 0 60,000 60,000 60,000 0 300,000 300,000 300,000 337,500 450,000 450,000 450,000
Fringe benefits 0 14,404 14,404 14,404 0 72,816 72,816 72,816 29,519 12,842 12,842 12,842
Total 0 74,404 74,404 74,404 0 372,816 372,816 372,816 367,019 462,842 462,842 462,842
One-year variable remuneration 0 37,188 27,500 55,000 0 270,459 200,000 400,000 225,000 405,689 75,000 600,000
Multiple-year variable remuneration 0 50,000 0 750,000 0 333,000 0 750,000 375,000 500,000 0 750,000
LTIP 2018 (term: 2018-2021) 0 0 0 0 0 0 0 0 375,000 0 0 0
LTIP 2019 (term: 2019-2022) 0 50,000 0 750,000 0 333,000 0 750,000 0 500,000 0 750,000
Total 0 87,188 27,500 805,000 0 603,459 200,000 1,150,000 600,000 905,689 75,000 1,350,000
Service cost 0 0 0 0 0 0 0 0 156,395 230,121 230,121 230,121
Total remuneration 0 161,592 101,904 879,404 0 976,275 572,816 1,522,816 1,123,414 1,598,652 767,963 2,042,963
136
H a p a g - L L o y d a g I a n n u a L R e p o R t 2 0 1 9
C o M b I n e d M a n a g e M e n t R e p o R t I R e M u n e R a t I o n R e p o R t
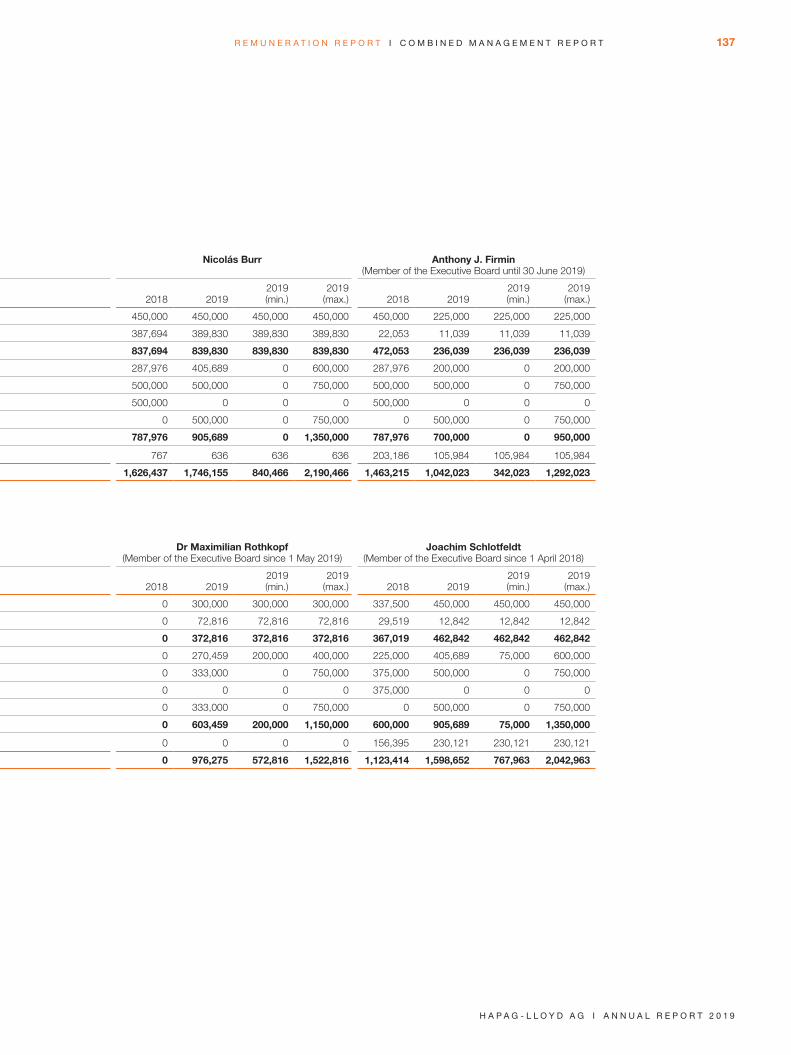
c) Disclosure of remuneration pursuant to the
German Corporate Governance Code (GCGC)
The German Corporate Governance Code (GCGC) for listed companies also recommends
disclosure of Executive Board remuneration in a table detailing the amounts granted and
amounts paid.
amounts granted for the financial year
Remuneration grantedRolf Habben Jansen
(Chairman of the Executive Board)Nicolás Burr Anthony J. Firmin
(Member of the Executive Board until 30 June 2019)
EUR 2018 20192019 (min.)
2019 (max.) 2018 2019
2019 (min.)
2019 (max.) 2018 2019
2019 (min.)
2019 (max.)
Fixed salary 750,000 750,000 750,000 750,000 450,000 450,000 450,000 450,000 450,000 225,000 225,000 225,000
Fringe benefits 172,053 172,078 172,078 172,078 387,694 389,830 389,830 389,830 22,053 11,039 11,039 11,039
Total 922,053 922,078 922,078 922,078 837,694 839,830 839,830 839,830 472,053 236,039 236,039 236,039
One-year variable remuneration 443,039 608,534 0 900,000 287,976 405,689 0 600,000 287,976 200,000 0 200,000
Multiple-year variable remuneration 700,000 700,000 0 1,050,000 500,000 500,000 0 750,000 500,000 500,000 0 750,000
LTIP 2018 (term: 2018-2021) 700,000 0 0 0 500,000 0 0 0 500,000 0 0 0
LTIP 2019 (term: 2019-2022) 0 700,000 0 1,050,000 0 500,000 0 750,000 0 500,000 0 750,000
Total 1,143,039 1,308,534 0 1,950,000 787,976 905,689 0 1,350,000 787,976 700,000 0 950,000
Service cost 1,550 1,347 1,347 1,347 767 636 636 636 203,186 105,984 105,984 105,984
Total remuneration 2,066,642 2,231,959 923,425 2,873,425 1,626,437 1,746,155 840,466 2,190,466 1,463,215 1,042,023 342,023 1,292,023
Remuneration granted
Mark Frese(Member of the Executive Board since
25 November 2019)Dr Maximilian Rothkopf
(Member of the Executive Board since 1 May 2019)Joachim Schlotfeldt
(Member of the Executive Board since 1 April 2018)
EUR 2018 20192019 (min.)
2019 (max.) 2018 2019
2019 (min.)
2019 (max.) 2018 2019
2019 (min.)
2019 (max.)
Fixed salary 0 60,000 60,000 60,000 0 300,000 300,000 300,000 337,500 450,000 450,000 450,000
Fringe benefits 0 14,404 14,404 14,404 0 72,816 72,816 72,816 29,519 12,842 12,842 12,842
Total 0 74,404 74,404 74,404 0 372,816 372,816 372,816 367,019 462,842 462,842 462,842
One-year variable remuneration 0 37,188 27,500 55,000 0 270,459 200,000 400,000 225,000 405,689 75,000 600,000
Multiple-year variable remuneration 0 50,000 0 750,000 0 333,000 0 750,000 375,000 500,000 0 750,000
LTIP 2018 (term: 2018-2021) 0 0 0 0 0 0 0 0 375,000 0 0 0
LTIP 2019 (term: 2019-2022) 0 50,000 0 750,000 0 333,000 0 750,000 0 500,000 0 750,000
Total 0 87,188 27,500 805,000 0 603,459 200,000 1,150,000 600,000 905,689 75,000 1,350,000
Service cost 0 0 0 0 0 0 0 0 156,395 230,121 230,121 230,121
Total remuneration 0 161,592 101,904 879,404 0 976,275 572,816 1,522,816 1,123,414 1,598,652 767,963 2,042,963
137
H a p a g - L L o y d a g I a n n u a L R e p o R t 2 0 1 9
R e M u n e R a t I o n R e p o R t I C o M b I n e d M a n a g e M e n t R e p o R t
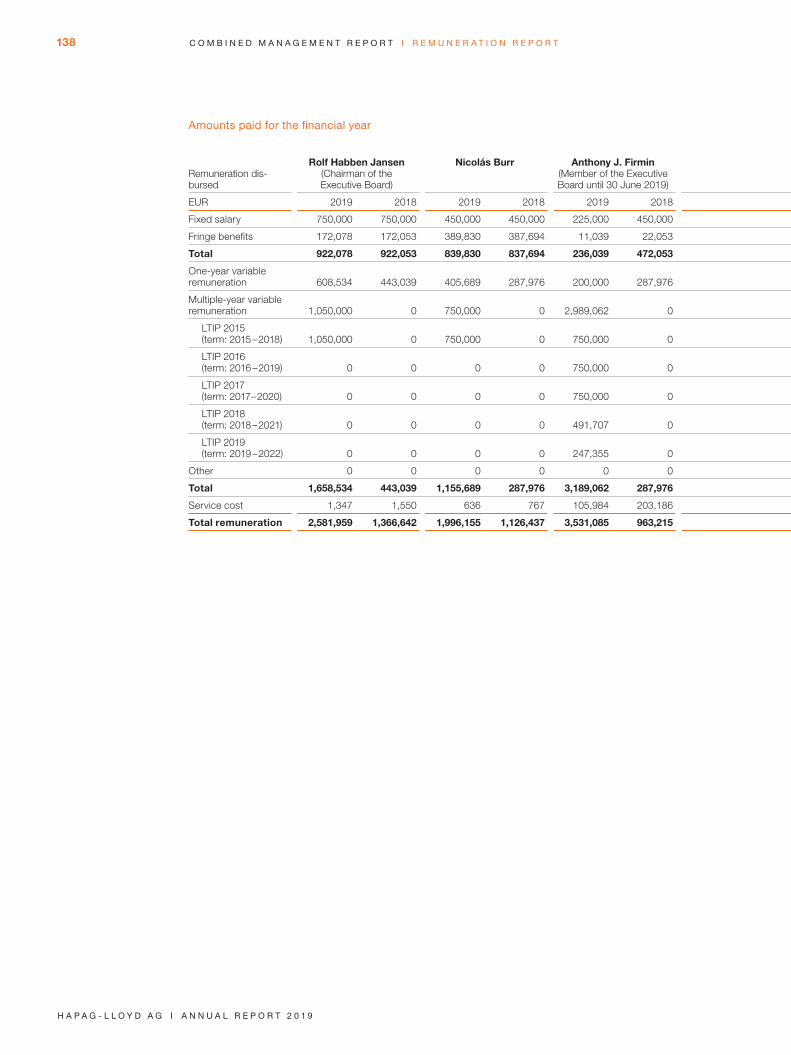
amounts paid for the financial year
Remuneration dis-bursed
Rolf Habben Jansen(Chairman of the Executive Board)
Nicolás Burr Anthony J. Firmin (Member of the Executive Board until 30 June 2019)
Mark Frese (Member of the Executive
Board since 25 November 2019)
Dr Maximilian Rothkopf (Member of the Executive Board since 1 May 2019)
Joachim Schlotfeldt(Member of the Executive Board since 1 April 2018)
EUR 2019 2018 2019 2018 2019 2018 2019 2018 2019 2018 2019 2018
Fixed salary 750,000 750,000 450,000 450,000 225,000 450,000 60,000 0 300,000 0 450,000 337,500
Fringe benefits 172,078 172,053 389,830 387,694 11,039 22,053 14,404 0 72,816 0 12,842 29,519
Total 922,078 922,053 839,830 837,694 236,039 472,053 74,404 0 372,816 0 462,842 367,019
One-year variable remuneration 608,534 443,039 405,689 287,976 200,000 287,976 37,188 0 270,459 0 405,689 225,000
Multiple-year variable remuneration 1,050,000 0 750,000 0 2,989,062 0 0 0 0 0 0 0
LTIP 2015 (term: 2015-2018) 1,050,000 0 750,000 0 750,000 0 0 0 0 0 0 0
LTIP 2016 (term: 2016-2019) 0 0 0 0 750,000 0 0 0 0 0 0 0
LTIP 2017 (term: 2017-2020) 0 0 0 0 750,000 0 0 0 0 0 0 0
LTIP 2018 (term: 2018-2021) 0 0 0 0 491,707 0 0 0 0 0 0 0
LTIP 2019 (term: 2019-2022) 0 0 0 0 247,355 0 0 0 0 0 0 0
Other 0 0 0 0 0 0 0 0 0 0 0 0
Total 1,658,534 443,039 1,155,689 287,976 3,189,062 287,976 37,188 0 270,459 0 405,689 225,000
Service cost 1,347 1,550 636 767 105,984 203,186 0 0 0 0 230,121 156,395
Total remuneration 2,581,959 1,366,642 1,996,155 1,126,437 3,531,085 963,215 111,592 0 643,275 0 1,098,652 748,414
138
H a p a g - L L o y d a g I a n n u a L R e p o R t 2 0 1 9
C o M b I n e d M a n a g e M e n t R e p o R t I R e M u n e R a t I o n R e p o R t
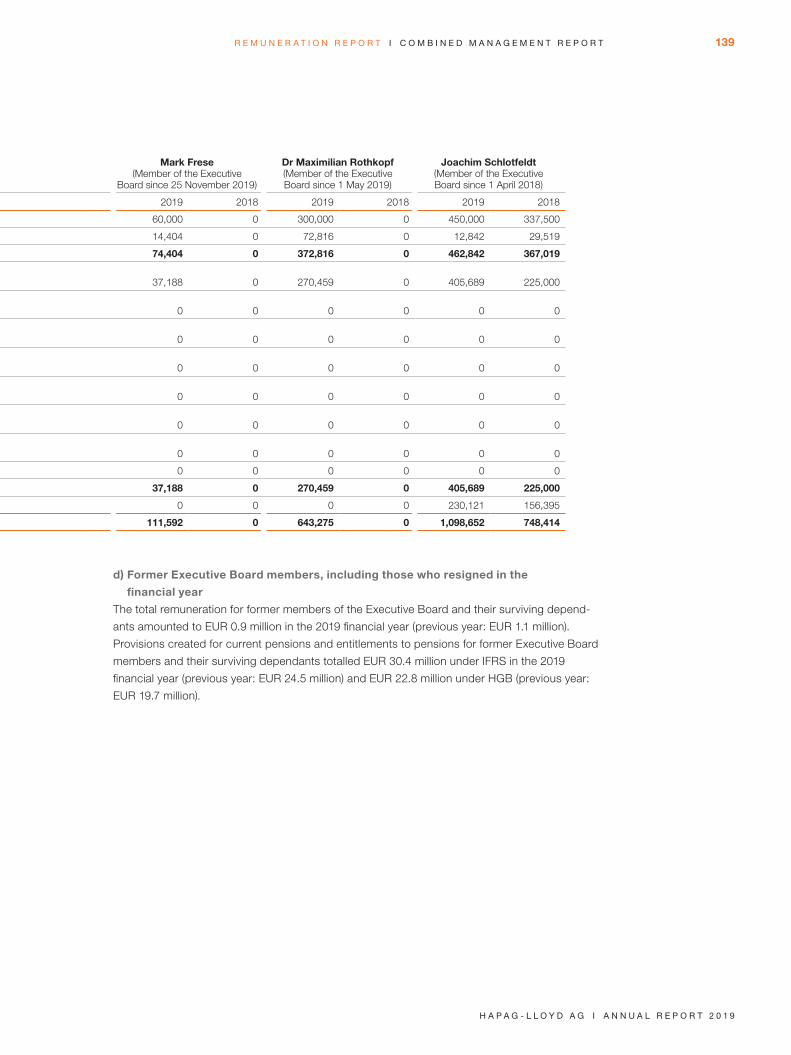
amounts paid for the financial year
Remuneration dis-bursed
Rolf Habben Jansen(Chairman of the Executive Board)
Nicolás Burr Anthony J. Firmin (Member of the Executive Board until 30 June 2019)
Mark Frese (Member of the Executive
Board since 25 November 2019)
Dr Maximilian Rothkopf (Member of the Executive Board since 1 May 2019)
Joachim Schlotfeldt(Member of the Executive Board since 1 April 2018)
EUR 2019 2018 2019 2018 2019 2018 2019 2018 2019 2018 2019 2018
Fixed salary 750,000 750,000 450,000 450,000 225,000 450,000 60,000 0 300,000 0 450,000 337,500
Fringe benefits 172,078 172,053 389,830 387,694 11,039 22,053 14,404 0 72,816 0 12,842 29,519
Total 922,078 922,053 839,830 837,694 236,039 472,053 74,404 0 372,816 0 462,842 367,019
One-year variable remuneration 608,534 443,039 405,689 287,976 200,000 287,976 37,188 0 270,459 0 405,689 225,000
Multiple-year variable remuneration 1,050,000 0 750,000 0 2,989,062 0 0 0 0 0 0 0
LTIP 2015 (term: 2015-2018) 1,050,000 0 750,000 0 750,000 0 0 0 0 0 0 0
LTIP 2016 (term: 2016-2019) 0 0 0 0 750,000 0 0 0 0 0 0 0
LTIP 2017 (term: 2017-2020) 0 0 0 0 750,000 0 0 0 0 0 0 0
LTIP 2018 (term: 2018-2021) 0 0 0 0 491,707 0 0 0 0 0 0 0
LTIP 2019 (term: 2019-2022) 0 0 0 0 247,355 0 0 0 0 0 0 0
Other 0 0 0 0 0 0 0 0 0 0 0 0
Total 1,658,534 443,039 1,155,689 287,976 3,189,062 287,976 37,188 0 270,459 0 405,689 225,000
Service cost 1,347 1,550 636 767 105,984 203,186 0 0 0 0 230,121 156,395
Total remuneration 2,581,959 1,366,642 1,996,155 1,126,437 3,531,085 963,215 111,592 0 643,275 0 1,098,652 748,414
d) Former Executive Board members, including those who resigned in the
financial year
The total remuneration for former members of the Executive Board and their surviving depend-
ants amounted to EUR 0.9 million in the 2019 financial year (previous year: EUR 1.1 million).
Provisions created for current pensions and entitlements to pensions for former Executive Board
members and their surviving dependants totalled EUR 30.4 million under IFRS in the 2019
financial year (previous year: EUR 24.5 million) and EUR 22.8 million under HGB (previous year:
EUR 19.7 million).
139
H a p a g - L L o y d a g I a n n u a L R e p o R t 2 0 1 9
R e M u n e R a t I o n R e p o R t I C o M b I n e d M a n a g e M e n t R e p o R t
3. REMUNERATION OF THE SUPERVISORY BOARD
Remuneration of the Supervisory Board is regulated in Section 12 of the Company’s articles of
association. The remuneration system reflects the responsibilities and activities of the Super-
visory Board members. In addition to a reimbursement of their expenses and the VAT payable on
their remuneration and expenses, the members of the Supervisory Board receive fixed annual
remuneration. There is no variable remuneration component.
A resolution was passed at the Annual General Meeting on 12 June 2019 to adjust the fixed
annual remuneration of the Supervisory Board, the Audit and Financial Committee and the
Presidential and Personnel Committee as well as the attendance fee with effect from 28 June
2019 (change to articles of association entered in the commercial register). The fixed annual
remuneration of the Supervisory Board is EUR 180,000 (previously: EUR 150,000) for the
Chairman, EUR 90,000 (previously: EUR 75,000) for deputies and EUR 60,000 (previously:
EUR 50,000) for other members. The Chairman of the Audit and Financial Committee receives
additional remuneration of EUR 40,000 (previously: EUR 20,000) and the other committee
members each receive EUR 20,000 (previously: EUR 10,000) for every full financial year of their
membership. The Chairman of the Presidential and Personnel Committee receives additional
remuneration of EUR 30,000 (previously: EUR 20,000) and the other committee members each
receive EUR 15,000 (previously: EUR 10,000). If Supervisory Board members receive remune-
ration for activities on the Supervisory Board of a subsidiary of Hapag-Lloyd AG, this remune-
ration is offset against the aforementioned remuneration.
The members of the Supervisory Board also receive an attendance fee of EUR 1,500 (previously:
EUR 300) for every meeting of the Supervisory Board and its committees that they attend.
For Supervisory Board members who are only on the Supervisory Board for part of the financial
year, remuneration is granted pro rata, rounded to full months. This also applies to increases in
remuneration for the Chairman of the Supervisory Board and his deputies as well as to increases
in remuneration for membership and chairmanship of a Supervisory Board committee.
140
H a p a g - L L o y d a g I a n n u a L R e p o R t 2 0 1 9
C o M b I n e d M a n a g e M e n t R e p o R t I R e M u n e R a t I o n R e p o R t

The following table shows the amounts due to the individual members of the Supervisory Board:
EUR
Fixed remuneration
Remuneration for committee service Meeting allowance Total
2019 2018 2019 2018 2019 2018 2019 2018
Felix Albrecht 46,667 0 0 0 3,900 0 50,567 0
Turqi Alnowaiser 55,000 45,833 15,000 9,167 6,000 2,400 76,000 57,400
Sheikh Ali Al-Thani 55,000 50,000 12,500 10,000 5,400 2,100 72,900 62,100
Christine Behle 0 56,250 0 7,500 0 1,500 0 65,250
Michael Behrendt 165,000 150,000 25,000 20,000 5,400 1,800 195,400 171,800
Jutta Diekamp 55,000 50,000 12,500 10,000 5,400 1,800 72,900 61,800
Nicola Gehrt 55,000 50,000 0 0 3,900 1,800 58,900 51,800
Karl Gernandt 82,500 62,500 27,500 25,000 8,700 2,700 118,700 90,200
Oscar Hasbún 55,000 62,500 30,000 15,000 7,500 3,000 92,500 80,500
Dr Rainer Klemmt-Nissen 55,000 50,000 27,500 20,000 9,000 3,000 91,500 73,000
Joachim Kramer 8,333 50,000 0 0 0 1,800 8,333 51,800
Annabell Kröger 55,000 50,000 15,000 10,000 7,500 3,000 77,500 63,000
Arnold Lipinski 55,000 50,000 27,500 20,000 9,000 3,000 91,500 73,000
Sabine Nieswand 55,000 50,000 12,500 10,000 5,400 1,800 72,900 61,800
Francisco Pérez 55,000 50,000 12,500 10,000 5,400 1,800 72,900 61,800
Klaus Schroeter 82,500 54,167 27,500 11,667 9,000 3,000 119,000 68,833
Maya Schwiegers-hausen- Güth 55,000 12,500 0 0 3,900 300 58,900 12,800
Uwe Zimmermann 55,000 50,000 27,500 20,000 9,000 2,400 91,500 72,400
Total 1,045,000 943,750 272,500 198,333 104,400 37,200 1,421,900 1,179,283
141
H a p a g - L L o y d a g I a n n u a L R e p o R t 2 0 1 9
R e M u n e R a t I o n R e p o R t I C o M b I n e d M a n a g e M e n t R e p o R t
The Supervisory Board remuneration and attendance fees have been included in the overview
based on the expense incurred in the respective financial year. For the Supervisory Board mem-
bers who resigned or were appointed, the amounts have been calculated pro rata. The Super-
visory Board members did not receive any ancillary remuneration in the aforementioned period.
The Chairman of the Supervisory Board is provided with an office and assistant and a driver
service so that he can perform his duties. If the Chairman of the Supervisory Board attends
certain appointments and performs certain representative duties on behalf of Hapag-Lloyd AG
to promote the business of the Company and foster a positive public image of the Company
and does so for no fee, he may use the Company’s internal resources to prepare for and perform
these activities for no fee. He is reimbursed for expenses incurred in connection with these
activities at an appropriate amount.
There were no advance payments or loans to members of the Supervisory Board as at
31 December 2019 or 31 December 2018. Furthermore, the Supervisory Board members did
not receive any remuneration in 2019 or the comparative period for their own services pro-
vided, in particular consultation and mediation services.
142
H a p a g - L L o y d a g I a n n u a L R e p o R t 2 0 1 9
C o M b I n e d M a n a g e M e n t R e p o R t I R e M u n e R a t I o n R e p o R t
OTHER DISCLOSURES
DISCLOSURES AND NOTES RELEVANT TO THE TAKEOVER
REPORT PURSUANT TO SECTION 315A (1) OF THE GERMAN COMMERCIAL
CODE (HGB) AND SECTION 289A (1) OF THE GERMAN COMMERCIAL CODE (HGB)
1. Composition of subscribed capital
The Company’s subscribed capital totalled EUR 175,760,293.00 as at the balance sheet date.
It is divided into 175,760,293 no-par registered shares, with each individual share representing
EUR 1.00 of the share capital. The shares are ordinary shares, without exception. Different share
classes are not issued and are not provided for in the articles of association. Each share is eligi-
ble for voting rights and dividends from the time that it is created. Each share grants one vote
at the Annual General Meeting (Section 15 (1) of the articles of association).
2. Restrictions which affect voting rights or the transfer of shares
On 16 April 2014, CSAV Germany Container Holding GmbH, Hamburg (“CG Hold Co”), HGV
Hamburger Gesellschaft für Vermögens- und Beteiligungsmanagement mbH, Hamburg (“HGV”),
and Kühne Maritime GmbH, Hamburg (“Kühne”) (CG Hold Co, HGV and Kühne also jointly
referred to as the “Anchor Shareholders”) entered into a shareholders’ agreement which was
newly formulated in the course of the business combination with United Arab Shipping Company
Ltd. (“New Shareholders’ Agreement”). CG Hold Co, HGV and Kühne agreed under the New
Shareholders’ Agreement to uniformly exercise their voting rights as and from the day following
the 2017 Annual General Meeting by issuing a common voting proxy and giving binding instruc-
tions to an agent. To ensure uniform voting, the Anchor Shareholders intend to pass a resolution
on how the pooled votes shall be cast prior to Annual General Meetings. If the Anchor Share-
holders are unable to pass a unanimous resolution on their voting for any agenda item, the
decision will be transferred to the decision-makers of the Anchor Shareholders’ ultimate share-
holders. If the ultimate shareholders cannot pass a unanimous decision either, the Anchor Share-
holders should cast the votes (a) against the measure with regard to resolutions requiring a 75%
majority of the votes cast or of the subscribed capital present at the time of adoption of the reso-
lution pursuant to mandatory law or the articles of association or (b) each at their own discretion
regarding the respective shares of each of the Anchor Shareholders on resolution proposals
which, pursuant to mandatory law or the articles of association, require a simple majority.
By coordinating their voting rights, the Anchor Shareholders will be in a position to exert a
significant influence on the Annual General Meeting and, consequently, on matters decided by
the Annual General Meeting, including the appointment of the Company’s Supervisory Board,
the distribution of dividends or proposed capital increases.
Although the New Shareholders’ Agreement shall have a fixed term until 30 November 2024, the
Anchor Shareholders are free to dispose of their shares. The parties of the New Shareholders’
Agreement have granted each other a right of first refusal in the event that one party would like
to sell shares representing a certain portion of voting rights (over-the-counter).
143
H a p a g - L L o y d a g I a n n u a L R e p o R t 2 0 1 9
o t H e R d I s C L o s u R e s I C o M b I n e d M a n a g e M e n t R e p o R t

3. Shareholdings that exceed 10% of the voting rights
At the time of preparation of the financial statements, the Company had received the following
information about shareholdings subject to mandatory disclosure pursuant to Section 160 (1) (8)
of the German Stock Corporation Act (AktG). The following voting right notifications from 2015
do not take account of the total number of voting rights at the end of the reporting period:
CSAV Germany Container Holding GmbH, Hamburg, Germany, notified us on 5 November 2015
pursuant to Section 21 (1a) of the German Securities Trading Act (WpHG) that its share of voting
rights in Hapag-Lloyd AG, Ballindamm 25, 20095 Hamburg, Germany, as at 4 November 2015
was 71.56% (corresponding to 84,524,291 voting rights). 31.35% of the voting rights (correspond-
ing to 37,032,743 voting rights) are held directly by the Company. 40.21% of the voting rights (cor-
responding to 47,491,548 voting rights) are attributable to the Company pursuant to Section 22
(2) WpHG through Kühne Maritime GmbH and HGV Hamburger Gesellschaft für Vermögens und
Beteiligungsmanagement mbH.
Compañía Sud Americana de Vapores S.A., Santiago, Chile, notified us on 5 November 2015
pursuant to Section 21 (1a) WpHG that its share of voting rights in Hapag-Lloyd AG, Ballindamm
25, 20095 Hamburg, Germany, as at 4 November 2015 was 71.56% (corresponding to
84,524,291 voting rights). 40.21% of the voting rights (corresponding to 47,491,548 voting rights)
are attributable to the Company pursuant to Section 22 (2) WpHG through Kühne Maritime
GmbH and HGV Hamburger Gesellschaft für Vermögens und Beteiligungsmanagement mbH.
In accordance with Section 22 (1) (1) (1) WpHG, 31.35% of the voting rights (corresponding to
37,032,743 voting rights) are attributable to the Company through CSAV Germany Container
Holding GmbH, of which 3% or more are assigned in each case.
The Luksburg Stiftung, Vaduz, Liechtenstein, notified us on 5 November 2015 pursuant to
Section 21 (1a) WpHG that its share of voting rights in Hapag-Lloyd AG, Ballindamm 25, 20095
Hamburg, Germany, as at 4 November 2015 was 71.56% (corresponding to 84,524,291 voting
rights). 40.21% of the voting rights (corresponding to 47,491,548 voting rights) are attributable
to the Company pursuant to Section 22 (2) WpHG through Kühne Maritime GmbH and HGV
Hamburger Gesellschaft für Vermögens und Beteiligungsmanagement mbH. In accordance
with Section 22 (1) (1) (1) WpHG, 31.35% of the voting rights (corresponding to 37,032,743 voting
rights) are attributable to the Company through CSAV Germany Container Holding GmbH,
Compañía Sud Americana de Vapores S.A., Quiñenco S.A., Andsberg Inversiones Limitada,
Ruana Copper A.G. Agencia Chile and Inversiones Orengo S.A., of which 3% or more are
assigned in each case.
Inversiones Orengo S.A., Santiago, Chile, notified us on 5 November 2015 pursuant to Section
21 (1a) WpHG that its share of voting rights in Hapag-Lloyd AG, Ballindamm 25, 20095 Hamburg,
Germany, as at 4 November 2015 was 71.56% (corresponding to 84,524,291 voting rights).
40.21% of the voting rights (corresponding to 47,491,548 voting rights) are attributable to the
Company pursuant to Section 22 (2) WpHG through Kühne Maritime GmbH and HGV Hamburger
Gesellschaft für Vermögens und Beteiligungsmanagement mbH. In accordance with Section 22
(1) (1) (1) WpHG, 31.35% of the voting rights (corresponding to 37,032,743 voting rights) are at -
tributable to the Company through CSAV Germany Container Holding GmbH, Compañía Sud
Americana de Vapores S.A. and Quiñenco S.A., of which 3% or more are assigned in each case.
144
H a p a g - L L o y d a g I a n n u a L R e p o R t 2 0 1 9
C o M b I n e d M a n a g e M e n t R e p o R t I o t H e R d I s C L o s u R e s

Ruana Copper A.G. Agencia Chile, Santiago, Chile, notified us on 5 November 2015 pursuant to
Section 21 (1a) WpHG that its share of voting rights in Hapag-Lloyd AG, Ballindamm 25, 20095
Hamburg, Germany, as at 4 November 2015 was 71.56% (corresponding to 84,524,291 voting
rights). 40.21% of the voting rights (corresponding to 47,491,548 voting rights) are attributable to
the Company pursuant to Section 22 (2) WpHG through Kühne Maritime GmbH and HGV Ham-
burger Gesellschaft für Vermögens und Beteiligungsmanagement mbH. In accordance with Sec-
tion 22 (1) (1) (1) WpHG, 31.35% of the voting rights (corresponding to 37,032,743 voting rights)
are attributable to the Company through CSAV Germany Container Holding GmbH, Compañía
Sud Americana de Vapores S.A. and Quiñenco S.A., of which 3% or more are assigned in each
case.
Quiñenco S.A., Santiago, Chile, notified us on 5 November 2015 pursuant to Section 21 (1a)
WpHG that its share of voting rights in Hapag-Lloyd AG, Ballindamm 25, 20095 Hamburg, Ger-
many, as at 4 November 2015 was 71.56% (corresponding to 84,524,291 voting rights). 40.21%
of the voting rights (corresponding to 47,491,548 voting rights) are attributable to the Company
pursuant to Section 22 (2) WpHG through Kühne Maritime GmbH and HGV Hamburger
Gesellschaft für Vermögens und Beteiligungsmanagement mbH. In accordance with Section 22
(1) (1) (1) WpHG, 31.35% of the voting rights (corresponding to 37,032,743 voting rights) are attrib-
utable to the Company through CSAV Germany Container Holding GmbH and Compañía Sud
Americana de Vapores S.A., of which 3% or more are assigned in each case.
Andsberg Inversiones Limitada, Santiago, Chile, notified us on 5 November 2015 pursuant to
Section 21 (1a) WpHG that its share of voting rights in Hapag-Lloyd AG, Ballindamm 25, 20095
Hamburg, Germany, as at 4 November 2015 was 71.56% (corresponding to 84,524,291 voting
rights). 40.21% of the voting rights (corresponding to 47,491,548 voting rights) are attributable
to the Company pursuant to Section 22 (2) WpHG through Kühne Maritime GmbH and HGV
Hamburger Gesellschaft für Vermögens und Beteiligungsmanagement mbH. In accordance
with Section 22 (1) (1) (1) WpHG, 31.35% of the voting rights (corresponding to 37,032,743 vot-
ing rights) are attributable to the Company through CSAV Germany Container Holding GmbH,
Compañía Sud Americana de Vapores S.A. and Quiñenco S.A., of which 3% or more are
assigned in each case.
Kühne Maritime GmbH, Hamburg, Germany, notified us on 6 November 2015 pursuant to Sec-
tion 21 (1a) WpHG that its share of voting rights in Hapag-Lloyd AG, Ballindamm 25, 20095 Ham-
burg, Germany, as at 4 November 2015 was 71.56% (corresponding to 84,524,291 voting rights).
19.58% of the voting rights (corresponding to 23,128,073 voting rights) are held directly by the
Company. 51.98% of the voting rights (corresponding to 61,396,218 voting rights) are attributable
to the Company pursuant to Section 22 (2) WpHG through CSAV Germany Container Holding
GmbH and HGV Hamburger Gesellschaft für Vermögens und Beteiligungsmanagement mbH.
Mr Klaus-Michael Kühne, Switzerland, notified us on 6 November 2015 pursuant to Section 21
(1a) WpHG that his share of voting rights in Hapag-Lloyd AG, Ballindamm 25, 20095 Hamburg,
Germany, as at 4 November 2015 was 72.20% (corresponding to 85,274,291 voting rights).
51.98% of the voting rights (corresponding to 61,396,218 voting rights) are attributable to Mr
Kühne pursuant to Section 22 (2) WpHG through CSAV Germany Container Holding GmbH and
HGV Hamburger Gesellschaft für Vermögens und Beteiligungsmanagement mbH. 20.22% of
the voting rights (corresponding to 23,878,073 voting rights) are attributable to him pursuant to
Section 22 (1) (1) (1) WpHG through Kühne Holding AG and Kühne Maritime GmbH, of which 3%
or more are assigned in each case.
145
H a p a g - L L o y d a g I a n n u a L R e p o R t 2 0 1 9
o t H e R d I s C L o s u R e s I C o M b I n e d M a n a g e M e n t R e p o R t

Kühne Holding AG, Schindellegi, Switzerland, notified us on 6 November 2015 pursuant to Sec-
tion 21 (1a) WpHG that its share of voting rights in Hapag-Lloyd AG, Ballindamm 25, 20095
Hamburg, Germany, as at 4 November 2015 was 72.20% (corresponding to 85,274,291 voting
rights). 51.98% of the voting rights (corresponding to 61,396,218 voting rights) are attributable
to the Company pursuant to Section 22 (2) WpHG through CSAV Germany Container Holding
GmbH and HGV Hamburger Gesellschaft für Vermögens und Beteiligungsmanagement mbH.
19.58% of the voting rights (corresponding to 23,128,073 voting rights) are attributable to the
Company through Kühne Maritime GmbH pursuant to Section 22 (1) (1) (1) WpHG, of which 3%
or more are assigned.
HGV Hamburger Gesellschaft für Vermögens und Beteiligungsmanagement mbH, Hamburg,
Germany, notified us on 6 November 2015 pursuant to Section 21 (1a) of the German Securities
Trading Act (WpHG) that its share of voting rights in Hapag-Lloyd AG, Ballindamm 25, 20095
Hamburg, Germany, as at 4 November 2015 was 71.56% (corresponding to 84,524,291 voting
rights). 20.63% of the voting rights (corresponding to 24,363,475 voting rights) are held directly
by the Company. 50.94% of the voting rights (corresponding to 60,160,816 voting rights) are
attributable to the Company pursuant to Section 22 (2) WpHG through CSAV Germany Con-
tainer Holding GmbH and Kühne Maritime GmbH.
The Free and Hanseatic City of Hamburg, Germany, notified us on 6 November 2015 pursuant
to Section 21 (1a) WpHG that its share of voting rights in Hapag-Lloyd AG, Ballindamm 25, 20095
Hamburg, Germany, as at 4 November 2015 was 71.56% (corresponding to 84,524,291 voting
rights). 50.94% of the voting rights (corresponding to 60,160,816 voting rights) are attributable to
the Company pursuant to Section 22 (2) WpHG through Kühne Maritime GmbH and CSAV Ger-
many Container Holding GmbH. 20.63% of the voting rights (corresponding to 24,363,475 voting
rights) are attributable to the Company through HGV Hamburger Gesellschaft für Vermögens und
Beteiligungsmanagement mbH pursuant to Section 22 (1) (1) (1) WpHG, of which 3% or more are
assigned.
The Public Investment Fund of the Kingdom of Saudi Arabia, Riyadh, Saudi Arabia, notified us on
24 May 2017 pursuant to Section 21 (1) WpHG that its share of voting rights in Hapag-Lloyd AG,
Ballindamm 25, 20095 Hamburg, Germany as at 24 May 2017 was 10.14% (corresponding to
16,637,197 voting rights).
The State of Qatar, acting through the Qatar Investment Authority, Doha, Qatar, notified us on
24 May 2017 pursuant to Section 21 (1) WpHG that its share of voting rights in Hapag-Lloyd AG,
Ballindamm 25, 20095 Hamburg, Germany as at 24 May 2017 was 14.43% (corresponding to
23,663,648 voting rights). All of the aforementioned voting rights are attributable to the State of
Qatar, acting through the Qatar Investment Authority, Doha, Qatar, pursuant to Section 22 (1)
of the German Securities Trading Act (WpHG). The companies through which the voting rights
are held are (starting with the top subsidiary): Qatar Holding LLC, Doha, Qatar, Qatar Holding
Luxembourg II S.à.r.l., Luxembourg, Qatar Holding Netherlands B.V., Amsterdam, Netherlands,
Qatar Holding Germany GmbH, Frankfurt am Main, Germany.
146
H a p a g - L L o y d a g I a n n u a L R e p o R t 2 0 1 9
C o M b I n e d M a n a g e M e n t R e p o R t I o t H e R d I s C L o s u R e s
4. Holders of shares with special rights
There are no shares with special rights that confer powers of control.
5. Type of voting right control for employee investments
The Company is not aware of any employees who hold an interest in its capital and do not
exercise their control over voting rights directly.
6. Rules on appointing and discharging members of the Executive Board
and on amending the articles of association
The guidelines on the appointment and discharge of members of the Executive Board are based
on Sections 84 and 85 of the German Stock Corporation Act (AktG) and on Section 31 of the
German Co-Determination Act (MitbestG) in conjunction with Section 7 (1) of the articles of asso-
ciation. Pursuant to Section 7 (1) of the articles of association, the Executive Board shall com-
prise no fewer than two members. The Supervisory Board determines the number of members
of the Executive Board; taking into account the minimum number of members, it may appoint
one member of the Executive Board as the Chairperson and may appoint deputy members of
the Executive Board.
The articles of association can only be amended by a resolution of the Annual General Meeting
in accordance with Section 179 of the German Stock Corporation Act (AktG). The resolution of
the Annual General Meeting requires a majority of at least three quarters of the share capital
represented when the resolution is being adopted; Sections 179 ff. of the German Stock Corpor-
ation Act (AktG) are applicable. In accordance with Section 20 of the articles of association, the
Supervisory Board is authorised to make amendments to the articles of association which only
affect the wording. The Supervisory Board is also entitled to amend the wording of the articles of
association after a share capital increase from the Authorised Capital 2017 and after the authori-
sation period expires, in accordance with the amount of the capital increase.
7. Powers of the Executive Board, in particular regarding the option of
issuing or buying back shares
In accordance with Section 5 (3) of the articles of association, the Executive Board, subject to the
approval of the Supervisory Board, is authorised to increase the Company’s share capital by up
to EUR 11,282,647.00, fully or in partial amounts, on one or more occasion up to 30 April 2022 by
issuing up to 11,282,647 new no-par registered shares against cash contributions and / or contri-
butions in kind (Authorised Capital 2017). As a general rule, subscription rights must be granted
to the shareholders. The new shares can also be taken up by one or more banks, with the obli-
gation to offer them to the shareholders for subscription.
Under certain circumstances and subject to the approval of the Supervisory Board, the Executive
Board is authorised to exclude the subscription rights of the shareholders in order to exclude
fractional amounts from the subscription right.
Section 71 of the German Stock Corporation Act (AktG) includes rules regarding the acquisition
of own shares. Furthermore, there is no authorisation of the Executive Board granted by the
Annual General Meeting to buy back own shares.
147
H a p a g - L L o y d a g I a n n u a L R e p o R t 2 0 1 9
o t H e R d I s C L o s u R e s I C o M b I n e d M a n a g e M e n t R e p o R t
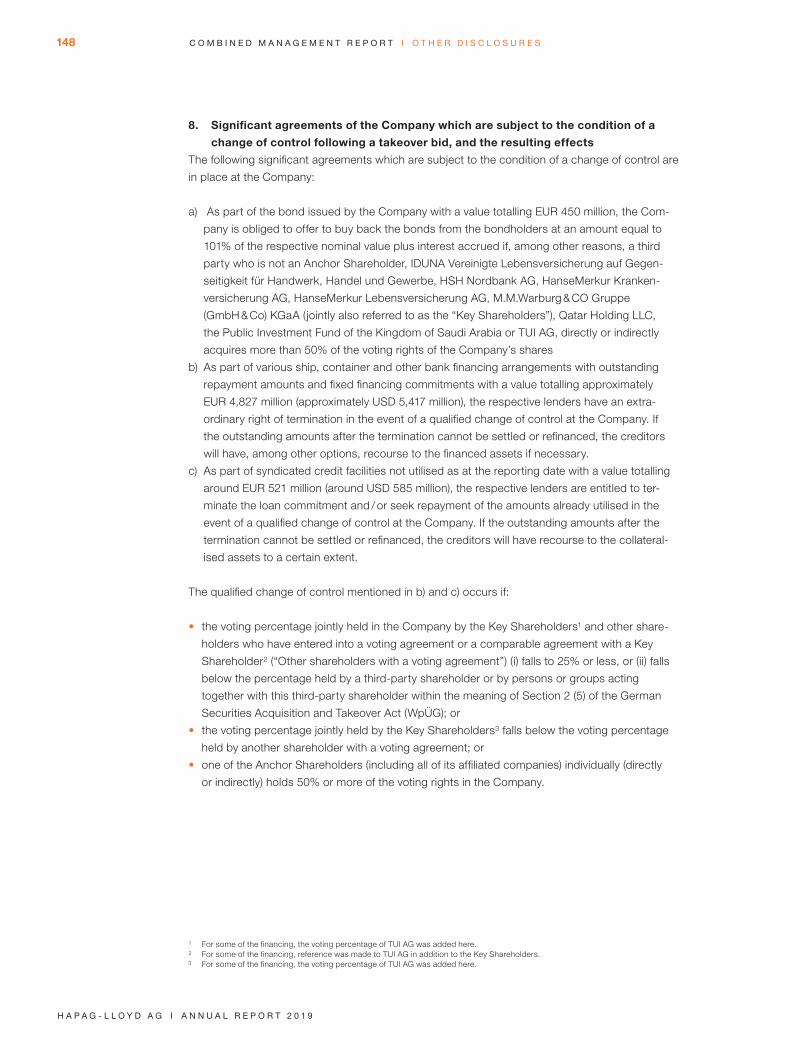
8. Significant agreements of the Company which are subject to the condition of a
change of control following a takeover bid, and the resulting effects
The following significant agreements which are subject to the condition of a change of control are
in place at the Company:
a) As part of the bond issued by the Company with a value totalling EUR 450 million, the Com-
pany is obliged to offer to buy back the bonds from the bondholders at an amount equal to
101% of the respective nominal value plus interest accrued if, among other reasons, a third
party who is not an Anchor Shareholder, IDUNA Vereinigte Lebensversicherung auf Gegen-
seitigkeit für Handwerk, Handel und Gewerbe, HSH Nordbank AG, HanseMerkur Kranken-
versicherung AG, HanseMerkur Lebensversicherung AG, M.M.Warburg & CO Gruppe
(GmbH & Co) KGaA (jointly also referred to as the “Key Shareholders”), Qatar Holding LLC,
the Public Investment Fund of the Kingdom of Saudi Arabia or TUI AG, directly or indirectly
acquires more than 50% of the voting rights of the Company’s shares
b) As part of various ship, container and other bank financing arrangements with outstanding
repayment amounts and fixed financing commitments with a value totalling approximately
EUR 4,827 million (approximately USD 5,417 million), the respective lenders have an extra-
ordinary right of termination in the event of a qualified change of control at the Company. If
the outstanding amounts after the termination cannot be settled or refinanced, the creditors
will have, among other options, recourse to the financed assets if necessary.
c) As part of syndicated credit facilities not utilised as at the reporting date with a value totalling
around EUR 521 million (around USD 585 million), the respective lenders are entitled to ter-
minate the loan commitment and / or seek repayment of the amounts already utilised in the
event of a qualified change of control at the Company. If the outstanding amounts after the
termi nation cannot be settled or refinanced, the creditors will have recourse to the collateral-
ised assets to a certain extent.
The qualified change of control mentioned in b) and c) occurs if:
• the voting percentage jointly held in the Company by the Key Shareholders1 and other share-
holders who have entered into a voting agreement or a comparable agreement with a Key
Shareholder2 (“Other shareholders with a voting agreement”) (i) falls to 25% or less, or (ii) falls
below the percentage held by a third-party shareholder or by persons or groups acting
together with this third-party shareholder within the meaning of Section 2 (5) of the German
Securities Acquisition and Takeover Act (WpÜG); or
• the voting percentage jointly held by the Key Shareholders3 falls below the voting percentage
held by another shareholder with a voting agreement; or
• one of the Anchor Shareholders (including all of its affiliated companies) individually (directly
or indirectly) holds 50% or more of the voting rights in the Company.
1 For some of the financing, the voting percentage of TUI AG was added here.2 For some of the financing, reference was made to TUI AG in addition to the Key Shareholders.3 For some of the financing, the voting percentage of TUI AG was added here.
148
H a p a g - L L o y d a g I a n n u a L R e p o R t 2 0 1 9
C o M b I n e d M a n a g e M e n t R e p o R t I o t H e R d I s C L o s u R e s

9. Company compensation agreements with Executive Board members or
employees in the event of a takeover bid
Company compensation agreements which are entered into with the members of the
Executive Board or employees in the event of a takeover bid are not in place.
DECLARATION ON CORPORATE GOVERNANCE IN ACCORDANCE WITH SECTION
315D IN CONJUNCTION WITH SECTION 289F (1) OF THE GERMAN COMMERCIAL
CODE (HGB) AND DECLARATION OF CONFORMITY IN ACCORDANCE WITH
SECTION 161 OF THE GERMAN STOCK CORPORATION ACT (AKTG)
The declaration on corporate governance in accordance with Section 289 f of the German
Commercial Code (HGB) and the declaration of conformity in accordance with Section 161
of the German Stock Corporation Act (AktG) have been published and made permanently
available in the “Corporate Governance” section under “Investor Relations” on the Company’s
website, https://www.hapag-lloyd.com/en/home.html, at https://www.hapag-lloyd.com/en/ir/
corporate-governance/compliance-statement.html, and are not part of the management report.
COMBINED NON-FINANCIAL DECLARATION AS PER GERMAN CSR GUIDELINE
IMPLEMENTATION ACT (CSR-RICHTLINIE-UMSETZUNGSGESETZ)
In addition to the non-financial principles already outlined, sustainable economic, ecological
and social action is regarded as a basic commercial principle for Hapag-Lloyd.
The combined separate non-financial report as per Section 289 b (3) and Section 315 b (3) of the
German Commercial Code (HGB) is contained in the sustainability report, which can be retrieved
from Hapag-Lloyd AG’s website via the following link: https://www.hapag-lloyd.com/de/about-us/
sustainability/ sustainability-report.html, and is not part of the combined management report.
Hamburg, 10 March 2020
Hapag-Lloyd Aktiengesellschaft
Executive Board
Mark Frese Joachim SchlotfeldtDr Maximilian Rothkopf
Rolf Habben Jansen
149
H a p a g - L L o y d a g I a n n u a L R e p o R t 2 0 1 9
o t H e R d I s C L o s u R e s I C o M b I n e d M a n a g e M e n t R e p o R t

CONSOLIDATEDFINANCIALSTATEMENTS

152 CONSOLIDATED INCOME STATEMENT
153 CONSOLIDATED STATEMENT OF COMPREHENSIVE INCOME
154 CONSOLIDATED STATEMENT OF FINANCIAL POSITION
156 CONSOLIDATED STATEMENT OF CASH FLOWS
158 CONSOLIDATED STATEMENT OF CHANGES IN EQUITY
160 NOTES TO THE CONSOLIDATED FINANCIAL STATEMENTS
160 Fundamental accounting principles
194 Segment reporting
197 Notes to the consolidated income statement
207 Notes to the consolidated statement of financial position
248 Other notes
151
H a p a g - L L o y d a g I a n n u a L R e p o R t 2 0 1 9

CONSOLIDATED INCOME STATEMENT
of Hapag-Lloyd AG for the period 1 January to 31 December 2019
million EUR Notes 1.1.-31.12.2019 1.1.-31.12.20181
Revenue (1) 12,607.9 11,617.5
Transport expenses (2) 9,707.0 9,586.4
Personnel expenses (3) 682.5 645.0
Depreciation, amortisation and impairment (4) 1,174.4 695.1
Other operating result (5) –268.8 –290.9
Operating result 775.2 400.1
Share of profit of equity-accounted investees (13) 35.5 30.7
Result from investments and securities (6) 0.7 12.7
Earnings before interest and taxes (EBIT) 811.4 443.5
Interest income and similar income (7) 12.2 15.8
Interest expenses and similar expenses (7) 408.9 381.0
Other financial items (8) 1.6 –0.5
Earnings before taxes 416.3 77.8
Income taxes (9) 42.9 31.8
Group profit / loss 373.4 46.0
thereof attributable to shareholders of Hapag-Lloyd AG 362.0 36.8
thereof attributable to non-controlling interests (21) 11.4 9.2
Basic / diluted earnings per share (in EUR) (10) 2.06 0.21
1 Due to the adjustment of the structure of the consolidated income statement, the items in the consolidated income statement +have changed. Comparability with the previous year’s values is thus limited. For better comparability with the current reporting period, the previous year’s values have been adjusted (see also “Change of presentation in the consolidated income statement”). Comparability with the previous year’s values is limited due to the first-time application of IFRS 16 Leases.
152
H a p a g - L L o y d a g I a n n u a L R e p o R t 2 0 1 9
C o n s o L I d a t e d f I n a n C I a L s t a t e M e n t s I C o n s o L I d a t e d I n C o M e s t a t e M e n t
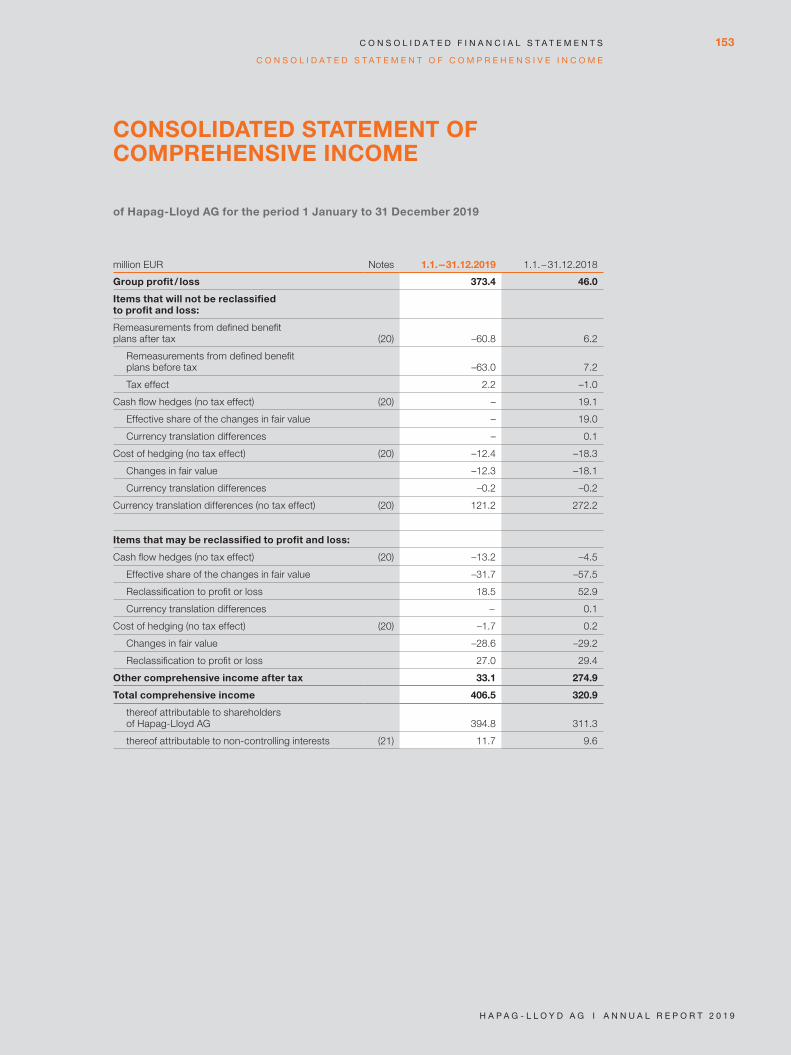
CONSOLIDATED STATEMENT OF COMPREHENSIVE INCOME
of Hapag-Lloyd AG for the period 1 January to 31 December 2019
million EUR Notes 1.1.-31.12.2019 1.1.-31.12.2018
Group profit / loss 373.4 46.0
Items that will not be reclassified to profit and loss:
Remeasurements from defined benefit plans after tax (20) –60.8 6.2
Remeasurements from defined benefit plans before tax –63.0 7.2
Tax effect 2.2 –1.0
Cash flow hedges (no tax effect) (20) – 19.1
Effective share of the changes in fair value – 19.0
Currency translation differences – 0.1
Cost of hedging (no tax effect) (20) –12.4 –18.3
Changes in fair value –12.3 –18.1
Currency translation differences –0.2 –0.2
Currency translation differences (no tax effect) (20) 121.2 272.2
Items that may be reclassified to profit and loss:
Cash flow hedges (no tax effect) (20) –13.2 –4.5
Effective share of the changes in fair value –31.7 –57.5
Reclassification to profit or loss 18.5 52.9
Currency translation differences - 0.1
Cost of hedging (no tax effect) (20) –1.7 0.2
Changes in fair value –28.6 –29.2
Reclassification to profit or loss 27.0 29.4
Other comprehensive income after tax 33.1 274.9
Total comprehensive income 406.5 320.9
thereof attributable to shareholders of Hapag-Lloyd AG 394.8 311.3
thereof attributable to non-controlling interests (21) 11.7 9.6
153
H a p a g - L L o y d a g I a n n u a L R e p o R t 2 0 1 9
C o n s o L I d a t e d f I n a n C I a L s t a t e M e n t s
C o n s o L I d a t e d s t a t e M e n t o f C o M p R e H e n s I v e I n C o M e

CONSOLIDATED STATEMENT OF FINANCIAL POSITION
of Hapag-Lloyd AG as at 31 December 2019
ASSETS
million EUR Notes 31.12.2019 31.12.20181
Goodwill (11) 1,600.7 1,568.8
Other intangible assets (11) 1,716.9 1,773.2
Property, plant and equipment (12) 10,064.9 9,119.7
Investments in equity-accounted investees (13) 333.6 328.1
Other assets (14) 23.7 10.5
Derivative financial instruments (15) 27.6 4.5
Receivables from income taxes (9) 4.7 4.2
Deferred tax assets (9) 39.7 36.0
Non-current assets 13,811.8 12,845.0
Inventories (16) 248.5 238.1
Trade accounts receivable (14) 1,239.8 1,217.7
Other assets (14) 346.9 300.8
Derivative financial instruments (15) 14.5 3.6
Income tax receivables (9) 27.4 39.0
Cash and cash equivalents (17) 511.6 657.1
Current assets 2,388.6 2,456.3
Total assets 16,200.4 15,301.3
1 Comparability with the previous year’s values is limited due to the first-time application of IFRS 16 Leases.
154
H a p a g - L L o y d a g I a n n u a L R e p o R t 2 0 1 9
C o n s o L I d a t e d f I n a n C I a L s t a t e M e n t s
C o n s o L I d a t e d s t a t e M e n t o f f I n a n C I a L p o s I t I o n

EQUITY AND LIABILITIES
million EUR Notes 31.12.2019 31.12.20181
Subscribed capital (18) 175.8 175.8
Capital reserves (18) 2,637.4 2,637.4
Earned consolidated equitty (19) 3,430.8 3,117.4
Cumulative other equity (20) 362.6 318.1
Equity attributable to shareholders of Hapag-Lloyd AG 6,606.6 6,248.7
Non-controlling interests (21) 14.0 10.6
Equity 6,620.6 6,259.3
Provisions for pensions and similar obligations (22) 327.6 265.2
Other provisions (23) 65.7 75.6
Financial debt (24) 4,445.1 5,241.2
Lease liabilities2 (24) 710.9 60.4
Other liabilities (25) 5.3 9.1
Derivative financial instruments (26) 22.8 8.5
Deferred tax liabilities (9) 8.7 5.3
Non-current liabilities 5,586.2 5,665.3
Provisions for pensions and similar obligations (22) 12.6 8.3
Other provisions (23) 399.3 343.5
Income tax liabilities (9) 50.0 52.3
Financial debt (24) 758.7 677.7
Lease liabilities2 (24) 482.4 38.6
Trade accounts payable (25) 1,779.4 1,774.1
Contract liabilities (25) 372.9 260.3
Other liabilities (25) 126.6 157.9
Derivative financial instruments (26) 11.6 64.0
Current liabilities 3,993.6 3,376.7
Total equity and liabilities 16,200.4 15,301.3
1 Comparability with the previous year’s values is limited due to the first-time application of IFRS 16 Leases.2 Under the first-time application of IFRS 16 Leases, from the first half of 2019 lease liabilities are shown as a separate balance sheet
item and no longer as part of financial debt. Financial debt has been reduced accordingly. The previous year’s values reported in the new balance sheet item relate to finance lease liabilities in accordance with IAS 17.
155
H a p a g - L L o y d a g I a n n u a L R e p o R t 2 0 1 9
C o n s o L I d a t e d f I n a n C I a L s t a t e M e n t s
C o n s o L I d a t e d s t a t e M e n t o f f I n a n C I a L p o s I t I o n

CONSOLIDATED STATEMENT OF CASH FLOWS
of Hapag-Lloyd AG for the period 1 January to 31 December 2019
million EUR 1.1.-31.12.2019 1.1.-31.12.20181
Group profit / loss 373.4 46.0
Income tax expenses (+) / income (–) 42.9 31.8
Other finacial Items –1.6 0.5
Interest result 396.7 365.2
Depreciation, amortisation and impairment (+) / write-backs (–) 1,174.4 695.1
Profit (–) / loss (+) from disposals of non-current assets –18.5 –24.5
Income (–) / expenses (+) from equity accounted investees and dividends from other investments –35.7 –30.8
Other non-cash expenses (+) / income (–) –0.8 –21.1
Increase (–) / decrease (+) in inventories –5.6 –41.6
Increase (–) / decrease (+) in receivables and other assets –54.0 –46.6
Increase (+) / decrease (–) in provisions 69.8 1.1
Increase (+) / decrease (–) in liabilities (excl. financial debt) 110.8 120.7
Payments received from (+) / made for (–) income taxes –29.4 –28.7
Payments received for interest 5.8 5.8
Cash inflow (+) / outflow (–) from operating activities 2,028.2 1,072.9
Payments received from disposals of property, plant and equipment and intangible assets 41.6 33.1
Payments received from the disposal of other investments – 142.3
Payments received from dividends 30.2 34.4
Payments received from the disposal of assets held for sale – 15.2
Payments made for investments in property, plant and equipment and intangible assets –426.1 –328.9
Payments made for the issuing of loans –4.7 –
Payments made for investment in financial assets –10.6 –
Net cash Inflow (+) / outflow (–) from acquisition – –0.4
Cash inflow (+) / outflow (–) from investing activities –369.5 –104.3
1 Due to the new structure of the consolidated income statement (see chapter “Change in presentation of the consolidated income statement”) the previous year’s values for 2018 in the consolidated statement of cash flows for other financial items have been adjusted from the previous EUR 0.0 million by EUR 0.5 million and other non-cash expenses (+) / income (–) from the previous EUR 12.7 million by EUR –33.8 million. The item profit (–) / loss (+) from hedging transactions for financial debt is no longer presented (previously EUR –33.3 million) as this is now included in the item other financial items.
156
H a p a g - L L o y d a g I a n n u a L R e p o R t 2 0 1 9
C o n s o L I d a t e d f I n a n C I a L s t a t e M e n t s I C o n s o L I d a t e d s t a t e M e n t o f C a s H f L o w s

million EUR 1.1.-31.12.2019 1.1.-31.12.2018
Payments received from capital increases – 0.2
Payments made for capital increases – –1.9
Payments made for dividends –39.5 –115.7
Payments received from raising financial debt 924.3 782.1
Payments made for the redemption of financial debt –1,733.2 –1,316.0
Payments made for the redemption of lease liabilities2 –456.7 –29.4
Payments made for leasehold improvements –18.1 –
Payments made for interest and fees –397.3 –317.7
Payments received (+) and made (–) from hedges for financial debt –103.7 9.4
Change in restricted cash 6.6 43.4
Cash inflow (+) / outflow (–) from financing activities –1,817.6 –945.6
Net change in cash and cash equivalents –158.9 23.0
Cash and cash equivalents at beginning of period 657.1 604.9
Change in cash and cash equivalents due to exchange rate fluctuations 13.4 29.2
Net change in cash and cash equivalents –158.9 23.0
Cash and cash equivalents at end of period 511.6 657.1
2 Under the first-time application of IFRS 16, since first half of 2019 the payments made for redemption of lease liabilities are shown as a separate item in the consolidated statement of cash flows. The item payments made for the redemption of financial debt has been reduced accordingly. The previous year’s value recognised in the new item relates to payments made for the redemption of finance lease liabilities in accordance with IAS 17.
157
H a p a g - L L o y d a g I a n n u a L R e p o R t 2 0 1 9
C o n s o L I d a t e d s t a t e M e n t o f C a s H f L o w s I C o n s o L I d a t e d f I n a n C I a L s t a t e M e n t s
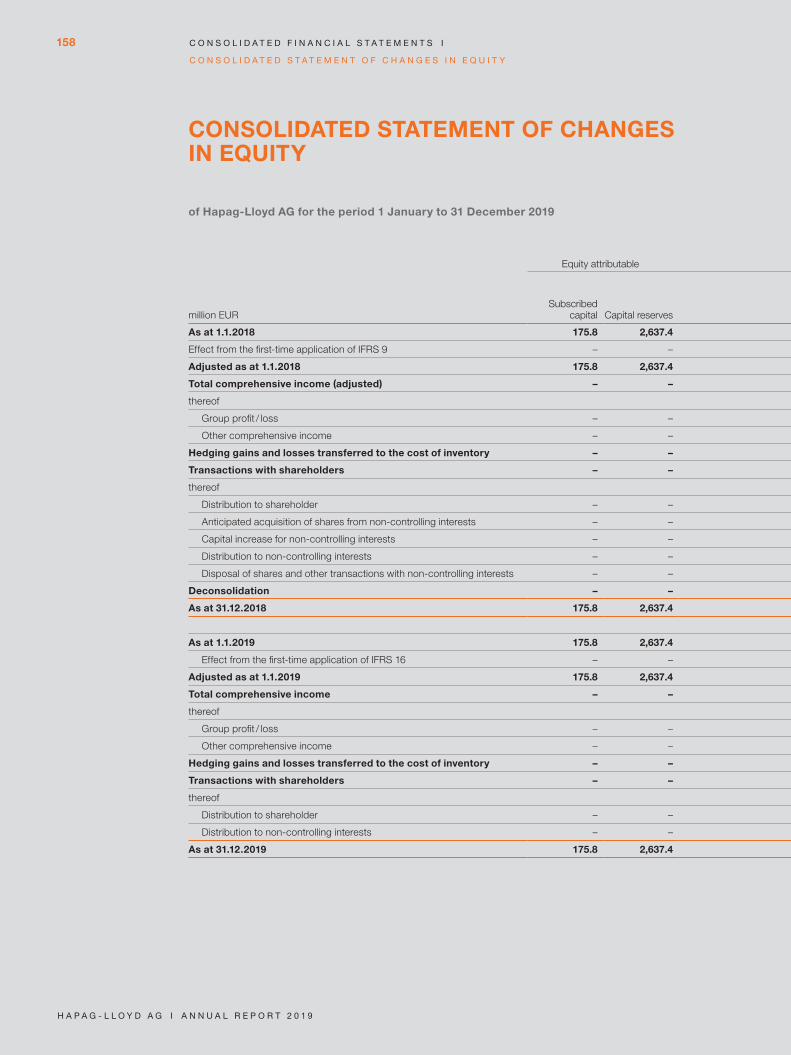
CONSOLIDATED STATEMENT OF CHANGES IN EQUITY
of Hapag-Lloyd AG for the period 1 January to 31 December 2019
million EUR
Equity attributable to shareholders of Hapag-Lloyd AG
Non-con-trolling
interestsTotal
equitySubscribed
capital Capital reserves Retained earnings
Remeasurements from defined ben-efit pension plans
Reserve for cash flow
hedges
Reserve for cost of
hedgingTranslation
reserve
Reserve for put options on
non-controlling interests
Cumulative other equity Total
As at 1.1.2018 175.8 2,637.4 3,174.9 –118.8 11.0 –1.0 167.5 –1.0 57.7 6,045.8 12.5 6,058.3
Effect from the first-time application of IFRS 9 – – 10.3 – – – – – – 10.3 – 10.3
Adjusted as at 1.1.2018 175.8 2,637.4 3,185.2 –118.8 11.0 –1.0 167.5 –1.0 57.7 6,056.1 12.5 6,068.6
Total comprehensive income (adjusted) – – 36.8 6.2 14.6 –18.1 271.8 – 274.5 311.3 9.6 320.9
thereof – –
Group profit / loss – – 36.8 – – – – – – 36.8 9.2 46.0
Other comprehensive income – – – 6.2 14.6 –18.1 271.8 – 274.5 274.5 0.4 274.9
Hedging gains and losses transferred to the cost of inventory – – – – –26.4 11.4 – – –15.0 –15.0 – –15.0
Transactions with shareholders – – –104.2 – – – – 0.5 0.5 –103.7 –11.5 –115.2
thereof – –
Distribution to shareholder – – –100.2 – – – – – – –100.2 – –100.2
Anticipated acquisition of shares from non-controlling interests – – – – – – – 0.5 0.5 0.5 – 0.5
Capital increase for non-controlling interests – – – – – – – – – – 0.2 0.2
Distribution to non-controlling interests – – –4.6 – – – – – – –4.6 –11.6 –16.2
Disposal of shares and other transactions with non-controlling interests – – 0.6 – – – – – – 0.6 –0.1 0.5
Deconsolidation – – –0.4 – – – 0.4 – 0.4 – – –
As at 31.12.2018 175.8 2,637.4 3,117.4 –112.6 –0.8 –7.7 439.7 –0.5 318.1 6,248.7 10.6 6,259.3
–
As at 1.1.2019 175.8 2,637.4 3,117.4 –112.6 –0.8 –7.7 439.7 –0.5 318.1 6,248.7 10.6 6,259.3
Effect from the first-time application of IFRS 16 – – –17.4 – – – – – – –17.4 – –17.4
Adjusted as at 1.1.2019 175.8 2,637.4 3,100.0 –112.6 –0.8 –7.7 439.7 –0.5 318.1 6,231.3 10.6 6,241.9
Total comprehensive income – – 362.0 –60.8 –13.2 –14.1 120.8 – 32.8 394.8 11.7 406.5
thereof –
Group profit / loss – – 362.0 – – – – – – 362.0 11.4 373.4
Other comprehensive income – – – –60.8 –13.2 –14.1 120.8 – 32.8 32.8 0.4 33.1
Hedging gains and losses transferred to the cost of inventory – – – – – 11.7 – – 11.7 11.7 – 11.7
Transactions with shareholders – – –31.2 – – – – – – –31.2 –8.3 –39.5
thereof – –
Distribution to shareholder – – –26.4 – – – – – – –26.4 – –26.4
Distribution to non-controlling interests – – –4.8 – – – – – – –4.8 –8.3 –13.2
As at 31.12.2019 175.8 2,637.4 3,430.8 –173.3 –14.0 –10.2 560.5 –0.5 362.6 6,606.6 14.0 6,620.6
158
H a p a g - L L o y d a g I a n n u a L R e p o R t 2 0 1 9
C o n s o L I d a t e d f I n a n C I a L s t a t e M e n t s I
C o n s o L I d a t e d s t a t e M e n t o f C H a n g e s I n e Q u I t y

of Hapag-Lloyd AG for the period 1 January to 31 December 2019
million EUR
Equity attributable to shareholders of Hapag-Lloyd AG
Non-con-trolling
interestsTotal
equitySubscribed
capital Capital reserves Retained earnings
Remeasurements from defined ben-efit pension plans
Reserve for cash flow
hedges
Reserve for cost of
hedgingTranslation
reserve
Reserve for put options on
non-controlling interests
Cumulative other equity Total
As at 1.1.2018 175.8 2,637.4 3,174.9 –118.8 11.0 –1.0 167.5 –1.0 57.7 6,045.8 12.5 6,058.3
Effect from the first-time application of IFRS 9 – – 10.3 – – – – – – 10.3 – 10.3
Adjusted as at 1.1.2018 175.8 2,637.4 3,185.2 –118.8 11.0 –1.0 167.5 –1.0 57.7 6,056.1 12.5 6,068.6
Total comprehensive income (adjusted) – – 36.8 6.2 14.6 –18.1 271.8 – 274.5 311.3 9.6 320.9
thereof – –
Group profit / loss – – 36.8 – – – – – – 36.8 9.2 46.0
Other comprehensive income – – – 6.2 14.6 –18.1 271.8 – 274.5 274.5 0.4 274.9
Hedging gains and losses transferred to the cost of inventory – – – – –26.4 11.4 – – –15.0 –15.0 – –15.0
Transactions with shareholders – – –104.2 – – – – 0.5 0.5 –103.7 –11.5 –115.2
thereof – –
Distribution to shareholder – – –100.2 – – – – – – –100.2 – –100.2
Anticipated acquisition of shares from non-controlling interests – – – – – – – 0.5 0.5 0.5 – 0.5
Capital increase for non-controlling interests – – – – – – – – – – 0.2 0.2
Distribution to non-controlling interests – – –4.6 – – – – – – –4.6 –11.6 –16.2
Disposal of shares and other transactions with non-controlling interests – – 0.6 – – – – – – 0.6 –0.1 0.5
Deconsolidation – – –0.4 – – – 0.4 – 0.4 – – –
As at 31.12.2018 175.8 2,637.4 3,117.4 –112.6 –0.8 –7.7 439.7 –0.5 318.1 6,248.7 10.6 6,259.3
–
As at 1.1.2019 175.8 2,637.4 3,117.4 –112.6 –0.8 –7.7 439.7 –0.5 318.1 6,248.7 10.6 6,259.3
Effect from the first-time application of IFRS 16 – – –17.4 – – – – – – –17.4 – –17.4
Adjusted as at 1.1.2019 175.8 2,637.4 3,100.0 –112.6 –0.8 –7.7 439.7 –0.5 318.1 6,231.3 10.6 6,241.9
Total comprehensive income – – 362.0 –60.8 –13.2 –14.1 120.8 – 32.8 394.8 11.7 406.5
thereof –
Group profit / loss – – 362.0 – – – – – – 362.0 11.4 373.4
Other comprehensive income – – – –60.8 –13.2 –14.1 120.8 – 32.8 32.8 0.4 33.1
Hedging gains and losses transferred to the cost of inventory – – – – – 11.7 – – 11.7 11.7 – 11.7
Transactions with shareholders – – –31.2 – – – – – – –31.2 –8.3 –39.5
thereof – –
Distribution to shareholder – – –26.4 – – – – – – –26.4 – –26.4
Distribution to non-controlling interests – – –4.8 – – – – – – –4.8 –8.3 –13.2
As at 31.12.2019 175.8 2,637.4 3,430.8 –173.3 –14.0 –10.2 560.5 –0.5 362.6 6,606.6 14.0 6,620.6
159
H a p a g - L L o y d a g I a n n u a L R e p o R t 2 0 1 9
C o n s o L I d a t e d f I n a n C I a L s t a t e M e n t s
C o n s o L I d a t e d s t a t e M e n t o f C H a n g e s I n e Q u I t y

NOTES TO THE CONSOLIDATED FINANCIAL STATEMENTS
FUNDAMENTAL ACCOUNTING PRINCIPLES
General information
Hapag-Lloyd is an international group whose primary purpose is to provide ocean container liner
shipping activities, logistical services and all other associated business operations and services.
Hapag-Lloyd Aktiengesellschaft (Hapag-Lloyd AG), domiciled in Hamburg, Ballindamm 25,
Germany, is the parent company of the Hapag-Lloyd Group and a listed company in accordance
with German law. The Company is registered in commercial register B of the district court in
Hamburg under the number HRB 97937. The Company’s shares are traded on the Frankfurt and
Hamburg Stock Exchanges.
The declaration of conformity with the German Corporate Governance Code (GCGC) required
under Section 161 of the German Stock Corporation Act (AktG) was issued by the Executive
Board and Supervisory Board and has been made permanently available on the Company’s
website (www.hapag-lloyd.com).
The consolidated financial statements are reported and published in euros (EUR). All amounts
recognised for the financial year are reported in million euros (EUR million) unless otherwise
stated. In individual cases, rounding differences may occur in the tables and charts of these
interim consolidated financial statements for computational reasons.
These consolidated financial statements encompass the financial year from 1 January to
31 December 2019 and were approved by the Executive Board of Hapag-Lloyd AG for passing
on to the Supervisory Board on 10 March 2020. The Supervisory Board will review and approve
the Notes to the consolidated financial statements on 19 March 2020.
Accounting principles
The consolidated financial statements of Hapag-Lloyd AG were prepared in accordance with the
International Financial Reporting Standards (IFRS) laid out by the International Accounting Stand-
ards Board (IASB), including the interpretations of the IFRS Interpretations Committee (IFRIC),
as they are to be applied in the European Union (EU). In addition, the German commercial law
provisions that must be observed pursuant to Section 315 e (1) of the German Commercial Code
(HGB) in the version applicable in the financial year have also been taken into consideration. The
consolidated financial statements are published in the online version of the German Federal
Gazette.
These financial statements are the Group’s first financial statements in which IFRS 16 Leases
has been applied. The related changes in the key accounting and measurement principles are
outlined in the “New accounting standards” section.
160
H a p a g - L L o y d a g I a n n u a L R e p o R t 2 0 1 9
C o n s o L I d a t e d f I n a n C I a L s t a t e M e n t s I n o t e s

New accounting standards
The following changes to existing standards published by the IASB, which have already been
endorsed, had to be applied for the first time in the 2019 financial year:
• Amendments to IFRS 9: Prepayment Features with Negative Compensation,
• IFRS 16: Leases,
• Amendments to IAS 19: Plan Amendment, Curtailment or Settlement,
• Amendments to IAS 28: Long-term Interests in Associates and Joint Ventures,
• Annual improvements to the IFRS, 2015–2017 cycle
(amendments to IFRS 3, IFRS 11, IAS 12 and IAS 23),
• IFRIC 23: Uncertainty over Income Tax Treatments.
The following describes the significant changes for the Hapag-Lloyd Group resulting from the
first-time application of standard IFRS 16 in the 2019 financial year. The remaining standards,
which are to be adopted for the first time in the 2019 financial year, have no significant impact
on the net asset, financial and earnings position of the Hapag-Lloyd Group.
IFRS 16 Leases
i. general
IFRS 16 Leases was published by the IASB in January 2016 and adopted by the EU into
European law on 31 October 2017. For companies that report in accordance with IFRS as
applicable in the EU, IFRS 16 establishes the recognition, measurement, presentation and
disclosure requirements of leases. IFRS 16 replaces IAS 17 Leases as well as the associated
interpretations IFRIC 4 Determining Whether an Arrangement Contains a Lease, SIC 15
Operating Leases – Incentives and SIC 27 Evaluating the Substance of Transactions Involving
the Legal Form of a Lease.
IFRS 16 comprises different regulations for lessees and lessors. For lessees, the standard pro-
vides a single accounting model. With regard to leases, rights of use for the leased asset and the
corresponding lease liabilities that represent the payment obligation will be recognised in the
statement of financial position. Lessors will continue to differentiate between finance leases and
operating leases for accounting purposes.
The new regulations significantly affect Hapag-Lloyd as a lessee, in particular in terms of its
recognition and measurement of rented and leased assets which were previously classified as
operating leases. This relates to the following asset classes:
(1) rented container ships
(2) rented containers
(3) rented office buildings, office space and parking spaces
(4) rented vehicles
(5) other rented business equipment.
161
H a p a g - L L o y d a g I a n n u a L R e p o R t 2 0 1 9
n o t e s I C o n s o L I d a t e d f I n a n C I a L s t a t e M e n t s

As with the Group’s own assets, rights of use for the above asset classes are recognised in
the statement of financial position under property, plant and equipment.
Since Hapag-Lloyd only operates as a lessor to a very limited extent, IFRS 16 has no effect on
the Group’s net asset, financial and earnings position.
As at 1 January 2019, Hapag-Lloyd has applied the financial reporting standard IFRS 16 Leases
for the first time in accordance with the modified retrospective approach, without making any
adjustments for the reference period 2018. For this reason, the cumulative effect of the first-time
application of IFRS 16 has been recognised as an adjustment to the opening values for retained
earnings as at 1 January 2019. The figures for 2018 are presented in accordance with the provi-
sions of IAS 17 and the aforementioned interpretations.
Based on the operating lease requirements as at 31 December 2018, the following reconciliation
with the opening value for lease liabilities existed as at 1 January 2019:
million EUR 1.1.2019
Obligations from operating leases reported as at 31 December 2018 (undiscounted) 1,102.9
Discounting –149.5
Obligations from operating leases reported as at 31 December 2018 (discounted) 953.4
Plus liabilities from finance leases recognised as at 31 December 2018 99.0
(less) leases in accordance with IFRS 16.4 for other intangible assets –157.0
(less) short-term leases recognised as an expense on a straight-line basis –146.1
(less) contracts reassessed as service contracts –126.8
(less) leases of low-value assets recognised as an expense on a straight-line basis –0.3
Plus terminable operating leases 291.4
Plus adjustments due to different estimates of contract options 100.2
Plus other adjustments 32.8
Lease liabilities recognised as at 1 January 2019 1,046.6
The lease liabilities were discounted using the incremental borrowing rate as at 1 January 2019.
The weighted average interest rate was 6.0%.
The first-time application of IFRS 16 as at 1 January 2019 has had the following effects on the
following balance sheet items:
million EUR 1.1.2019
Right of use assets reported under property, plant and equipment 858.2
Retained earnings –17.4
Liabilities from lease contracts reported under financial debt 947.6
Other liabilities –41.2
Other provisions –30.7
162
H a p a g - L L o y d a g I a n n u a L R e p o R t 2 0 1 9
C o n s o L I d a t e d f I n a n C I a L s t a t e M e n t s I n o t e s
The reported rights of use assets and lease liabilities do not include any assets and liabilities that
were accounted for under finance leases in accordance with IAS 17 until 31 December 2018.
The finance leases accounted for in accordance with IAS 17 until 31 December 2018 resulted in
carrying amounts of EUR 172.1 million for right of use assets and EUR 99.0 million for lease liabili-
ties as at 1 January 2019.
ii. Main accounting principles
Hapag-Lloyd uses the simplification rule to retain the definition of a lease in the changeover to
IFRS 16. The Group therefore applies IFRS 16 at the point of first-time application to the agree-
ments which were previously classified as leases using IAS 17 and IFRIC 4. The definition of a
lease under IFRS 16 is applied to agreements which were concluded or changed on or after
1 January 2019.
The single accounting model pursuant to IFRS 16 requires that all assets and liabilities relating
to leases be recognised in the statement of financial position unless (in each case an option) (1)
the lease term is 12 months or less or (2) the underlying asset has a low value. If the lessee
makes use of one of the two practical expedients outlined above, the presentation in the state-
ment of financial position is the same as with the previous operating leases.
If the practical expedients are not made use of, the right of use will be measured at the beginning
at cost of acquisition. The subsequent measurement occurs at cost of acquisition less cumula-
tive depreciation, amortisation, impairment and certain remeasurements of the lease liability due
to modifications. The lease liability is measured at the beginning at the fair value of the future
lease payments. The lease payments are discounted using the interest rate implicitly specified in
the leases or, in most cases, the incremental interest rate.
Hapag-Lloyd takes account of unilateral and bilateral rights of prolongation or termination in
accordance with IFRS 16. In the case of unilateral rights of prolongation or termination which
may exist for Hapag-Lloyd, particularly for container ship agreements and rented office build-
ings, office space and parking spaces, the probability of exercising the existing option is
assessed while taking account of economic factors and on an individual basis in order to
determine the term of the agreement.
Bilateral rights of termination essentially exist for a large number of container leases. These rights
of termination can be exercised by both parties on a flexible and independent basis. When deter-
mining the term of these container leases for accounting purposes, Hapag-Lloyd must assess in
accordance with IFRS 16.B34 whether significant penalties may be incurred when containers are
returned or if these container leases are terminated. Hapag-Lloyd also assesses possible eco-
nomic disadvantages in this regard. If Hapag-Lloyd also believes from an economic perspective
that termination of these agreements will not result in any significant disadvantages, the term of
the agreement is determined while taking account of the termination notice period in the respec-
tive agreement and a possible transition period in accordance with IFRS 16. If Hapag-Lloyd
believes that there are significant disadvantages, this is taken into account when assessing the
term of the agreement and the term extended until such time as the disadvantages have been
resolved. This assessment will affect the amount of the lease liabilities and the right of use assets
significantly.
163
H a p a g - L L o y d a g I a n n u a L R e p o R t 2 0 1 9
n o t e s I C o n s o L I d a t e d f I n a n C I a L s t a t e M e n t s

For lease agreements which include a lease, Hapag-Lloyd separates a lease component and
non-lease component and allocates the contractual consideration of each lease and non-lease
component based on their relative stand-alone price. Hapag-Lloyd does not make use of the
practical expedient that removes the obligation to separate the lease and non-lease component.
A portion of the container rental agreements is recognized on the basis of a portfolio approach,
since the individual leases in the portfolio have similar characteristics.
The new rules have not been applied for leases of intangible assets.
iii. transition date
As lessee, Hapag-Lloyd recognises a lease liability for leases in all asset classes which were
previously classified as operating leases under IAS 17 and for which it did not make use of any
practical expedient at the point of first-time application. This lease liability is measured at the
fair value of the remaining lease payments and discounted using the incremental borrowing rate
as at 1 January 2019. As lessee, Hapag-Lloyd also recognises a right of use for leases in all
asset classes which were previously classified as operating leases under IAS 17.
As a rule, Hapag-Lloyd measures the right of use from the lease liability individually and in the
asset classes (1), (2), (3) and (4) at the amount of the lease liability which has been adjusted by
the amount of the lease payments paid in advance or deferred, which in turn were recognised in
the consolidated statement of financial position as at 31 December 2018. For asset classes (1)
and (2), Hapag-Lloyd uses the carrying amount in certain cases to measure the right of use as if
the standard had already been applied since the date of transition and this amount discounted
using the incremental borrowing rate at the point of first-time application. At this stage, there is a
cumulative effect of applying the new standard for the first time, which is offset against retained
earnings directly in equity at the point of first-time application.
On the transition date as at 1 January 2019, Hapag-Lloyd also made use of the following
practical expedients:
Hapag-Lloyd applies IFRS 16 to a portfolio of similarly structured container leases.
164
H a p a g - L L o y d a g I a n n u a L R e p o R t 2 0 1 9
C o n s o L I d a t e d f I n a n C I a L s t a t e M e n t s I n o t e s

At the point of first-time application, Hapag-Lloyd applies a discount rate which is dependent on
the asset class, term and securitisation to a portfolio of similarly structured leases. The discount
rate corresponds to the incremental borrowing rate applicable to the five defined asset classes at
the respective changeover point. In addition to the rented container ships, which are essentially
combined according to a similar remaining term, this assumption affects the container leases
which are combined according to container type and remaining term and the rented office build-
ings, office space and parking spaces as well as the leased vehicles.
Hapag-Lloyd makes use of the practical expedient in the case of leases which are onerous
agreements pursuant to IAS 37 Provisions, Contingent Liabilities and Contingent Assets, and
adjusts the right of use as at 1 January 2019 by the amount which was recognised as a provi-
sion for onerous agreements in the statement of financial position as at 31 December 2018.
At the point of first-time acquisition, Hapag-Lloyd treats leases for all asset classes whose term
ends within 12 months of 1 January 2019 as short-term leases pursuant to IFRS 16. The corre-
sponding expenses, which essentially result from container ship agreements expiring in 2019, are
reported in the disclosures for the expenses for short-term leases for the 2019 financial year.
Initial direct costs were not taken into account at the point of first-time application when
calculating the amount of the right of use.
There are no material effects on the Hapag-Lloyd Group’s existing finance leases. As lessee,
Hapag-Lloyd recognises as at 1 January 2019 the carrying amount of the right of use and of the
lease liability for leases which were previously classified as finance leases under IAS 17 at
the amount of the carrying amount which results from measuring the leased asset and the lease
liability pursuant to IAS 17 as at 31 December 2018. From 1 January 2019, the provisions of
IFRS 16 are applied to these leases.
Adjustments were made to all finance agreements that contain lending conditions as regards
the required minimum equity ratio at Group level (financial covenant). In the Hapag-Lloyd Group,
the application of IFRS 16 will not have any effect on its ability to meet the lending conditions in
terms of the required minimum equity ratio at Group level.
165
H a p a g - L L o y d a g I a n n u a L R e p o R t 2 0 1 9
n o t e s I C o n s o L I d a t e d f I n a n C I a L s t a t e M e n t s

Standards that were not yet mandatory in the financial year
The following amended standards and interpretations that were adopted by the IASB at the
time these consolidated financial statements were prepared were not yet mandatory in the 2019
financial year.
Standard / Interpretation Mandatory
application as perAdopted by EU
Commission
IFRS 3 Amendments to IFRS 3: Definition of a Business 1.1.2020 nein
IFRS 9 IAS 39 IFRS 7
Amendments to IFRS 9, IAS 39 and IFRS 7: Interest Rate Benchmark Reform
1.1.2020 ja
IAS 1 IAS 8
Amendments to IAS 1 and IAS 8: Definition of Material 1.1.2020 ja
Frame-work
Amendments to referrences to the Conceptual Framework in IFRS
1.1.2020 ja
IFRS 17 Insurance Contracts 1.1.2021 nein
IAS 1 Amendments to IAS 1: Classification of Liabilities as Current or Non-current
1.1.2022 nein
IFRS 10 IAS 28
Amendments to IFRS 10 and IAS 28: Sale or Contribution of Assets between an Investor and its Associate or Joint Venture
offen nein
These are regulations which will not be mandatory until the 2020 financial year or later. The
Hapag-Lloyd Group has decided against early adoption of these standards. Only the provisions
which are relevant to the Hapag-Lloyd Group are explained below.
EU endorsement has been given
amendments to IfRs 9, Ias 39 and IfRs 7: Interest Rate benchmark Reform
The amendments to IFRS 9, IAS 39 and IFRS 7 are intended to mitigate effects on financial
reporting resulting from the reform of interest rate benchmarks (known as IBOR reform). The
purpose of these simplification rules is the continuation of hedge accounting which would other-
wise have to be terminated due to the uncertainties associated with the expected replacement
of various interest rate benchmarks. In the Hapag-Lloyd Group, only the hedging relationships
for interest rate risks are directly affected by these amendments. The application of these
amendments means that these hedges will be continued in spite of the uncertainties regarding
the replacement of specific interest rate benchmarks. The Hapag-Lloyd Group has not opted for
early adoption of these amendments. This has likewise not had any effect on the hedging rela-
tionships reported in these consolidated financial statements.
amendments to Ias 1 and Ias 8: definition of Material
The amendments to IAS 1 and IAS 8 create a uniform and precise definition in the IFRS of the
materiality of the information provided in financial statements. This definition is supplemented
by accompanying examples. The definitions in the conceptual framework, IAS 1, IAS 8 and the
IFRS Practice Statement 2: Making Materiality Judgements have been harmonised in this
respect. These amendments are not expected to have any significant effect on the Hapag-Lloyd
consolidated financial statements.
166
H a p a g - L L o y d a g I a n n u a L R e p o R t 2 0 1 9
C o n s o L I d a t e d f I n a n C I a L s t a t e M e n t s I n o t e s
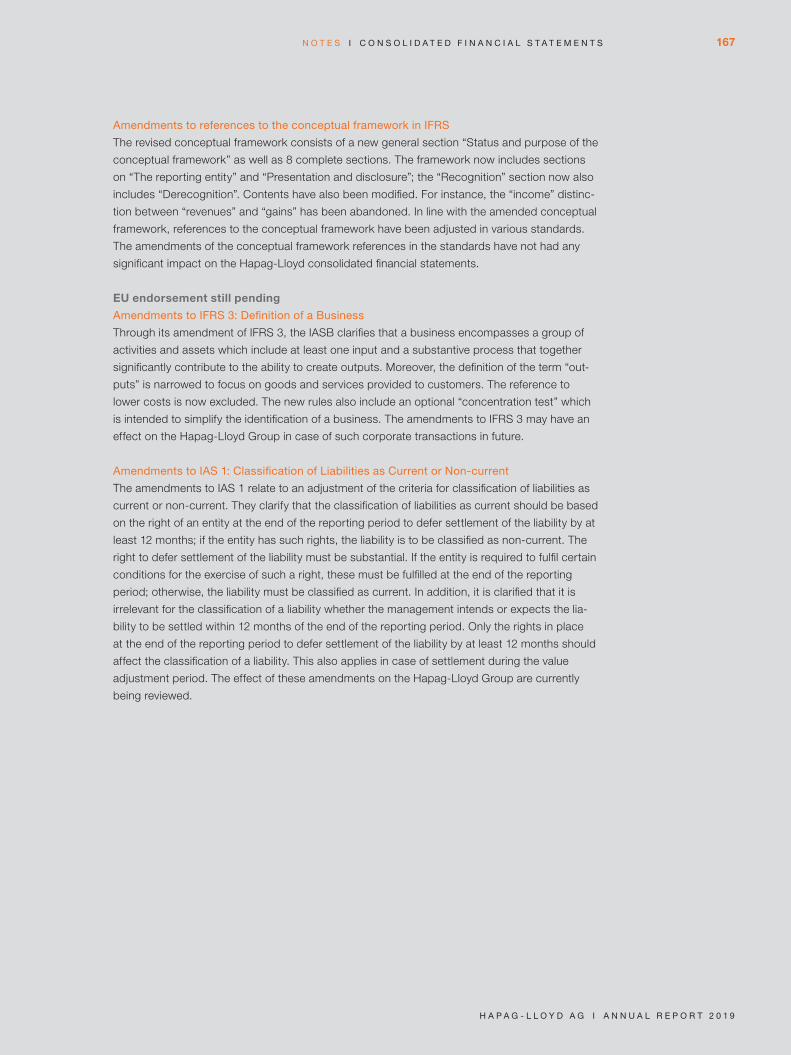
amendments to references to the conceptual framework in IfRs
The revised conceptual framework consists of a new general section “Status and purpose of the
conceptual framework” as well as 8 complete sections. The framework now includes sections
on “The reporting entity” and “Presentation and disclosure”; the “Recognition” section now also
includes “Derecognition”. Contents have also been modified. For instance, the “income” distinc-
tion between “revenues” and “gains” has been abandoned. In line with the amended conceptual
framework, references to the conceptual framework have been adjusted in various standards.
The amendments of the conceptual framework references in the standards have not had any
significant impact on the Hapag-Lloyd consolidated financial statements.
EU endorsement still pending
amendments to IfRs 3: definition of a business
Through its amendment of IFRS 3, the IASB clarifies that a business encompasses a group of
activities and assets which include at least one input and a substantive process that together
significantly contribute to the ability to create outputs. Moreover, the definition of the term “out-
puts” is narrowed to focus on goods and services provided to customers. The reference to
lower costs is now excluded. The new rules also include an optional “concentration test” which
is intended to simplify the identification of a business. The amendments to IFRS 3 may have an
effect on the Hapag-Lloyd Group in case of such corporate transactions in future.
amendments to Ias 1: Classification of Liabilities as Current or non-current
The amendments to IAS 1 relate to an adjustment of the criteria for classification of liabilities as
current or non-current. They clarify that the classification of liabilities as current should be based
on the right of an entity at the end of the reporting period to defer settlement of the liability by at
least 12 months; if the entity has such rights, the liability is to be classified as non-current. The
right to defer settlement of the liability must be substantial. If the entity is required to fulfil certain
conditions for the exercise of such a right, these must be fulfilled at the end of the reporting
period; otherwise, the liability must be classified as current. In addition, it is clarified that it is
irrelevant for the classification of a liability whether the management intends or expects the lia-
bility to be settled within 12 months of the end of the reporting period. Only the rights in place
at the end of the reporting period to defer settlement of the liability by at least 12 months should
affect the classification of a liability. This also applies in case of settlement during the value
adjustment period. The effect of these amendments on the Hapag-Lloyd Group are currently
being reviewed.
167
H a p a g - L L o y d a g I a n n u a L R e p o R t 2 0 1 9
n o t e s I C o n s o L I d a t e d f I n a n C I a L s t a t e M e n t s

Consolidation principles and methods
All significant subsidiaries, joint ventures and associated companies are included in the
consolidated financial statements.
Subsidiaries
Subsidiaries are all companies that are subject to direct or indirect control by Hapag-Lloyd AG.
Control exists if Hapag-Lloyd AG has the power to make decisions due to voting rights or other
rights and is exposed to positive or negative variable returns from the subsidiary and can influ-
ence these returns through its power to make decisions. Significant subsidiaries are fully con-
solidated from the time at which control over the significant subsidiary is acquired. If the control
agreement comes to an end, the companies in question leave the group of consolidated com-
panies.
A subsidiary is consolidated for the first time using the acquisition method. To begin with, a com-
plete fair value measurement of all the subsidiary’s identifiable assets, liabilities and contingent
liabilities at the time of acquisition is performed. The consideration measured at fair value for the
acquisition of the investment share is offset against the equity relating to the share acquired. Any
positive difference is recognised as goodwill and is recorded as an asset. Any negative difference
is recognised directly through profit or loss at the time when it occurs and is reported in other
operating income. The option to capitalise the proportionate goodwill on non-controlling interests
is not applied. Transaction costs incurred in connection with a business combination are recog-
nised as expenses.
Any resulting goodwill is examined for impairment at least once a year at the end of the planning
process or, if there are any indications of a possible impairment in value in the subsequent peri-
ods, is examined for its recoverable amount and, in the event of impairment, is written down to
the lower recoverable amount (impairment test). Any impairments of this kind are recognised
separately in the consolidated income statement as impairment of goodwill.
The individual financial statements of Hapag-Lloyd AG and its subsidiaries form the basis for
the consolidated financial statements, which are prepared using the standard Group accounting
and measurement principles.
Intercompany receivables and liabilities, as well as expenses and income, are eliminated during
the process of consolidation. Intercompany profits and losses are eliminated insofar as they are
not of minor significance for the Group. Deferred taxes are reported for consolidation measures
with an impact on income taxes.
Minority interests in the equity of a subsidiary are recognised as non-controlling interests within
Group’s equity. The share of Group profit which is attributable to non-controlling interests is
reported separately as such in the consolidated income statement and the consolidated state-
ment of comprehensive income. Transactions whereby the Hapag-Lloyd Group acquires addi-
tional shares in or sells shares in an existing subsidiary without prompting a change of control
are recognised as equity transactions between shareholders. The difference between the con-
sideration received / transferred and the shares sold / received is recognised in Group’s equity.
168
H a p a g - L L o y d a g I a n n u a L R e p o R t 2 0 1 9
C o n s o L I d a t e d f I n a n C I a L s t a t e M e n t s I n o t e s
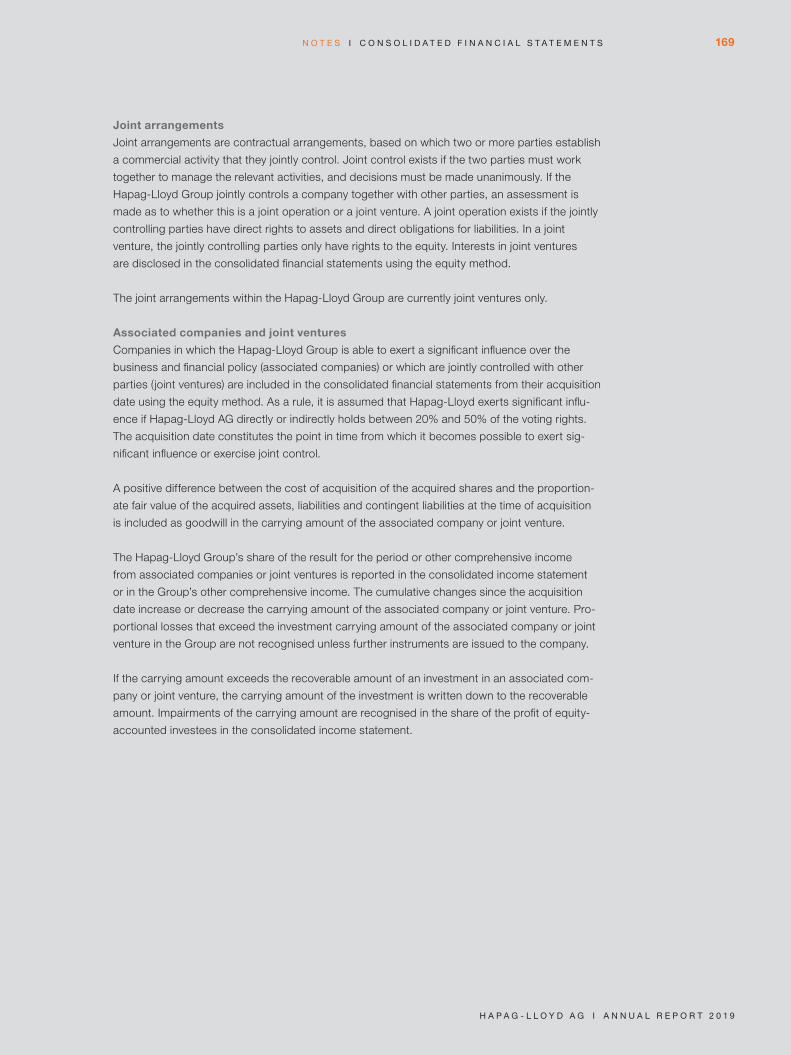
Joint arrangements
Joint arrangements are contractual arrangements, based on which two or more parties establish
a commercial activity that they jointly control. Joint control exists if the two parties must work
together to manage the relevant activities, and decisions must be made unanimously. If the
Hapag-Lloyd Group jointly controls a company together with other parties, an assessment is
made as to whether this is a joint operation or a joint venture. A joint operation exists if the jointly
controlling parties have direct rights to assets and direct obligations for liabilities. In a joint
venture, the jointly controlling parties only have rights to the equity. Interests in joint ventures
are disclosed in the consolidated financial statements using the equity method.
The joint arrangements within the Hapag-Lloyd Group are currently joint ventures only.
Associated companies and joint ventures
Companies in which the Hapag-Lloyd Group is able to exert a significant influence over the
business and financial policy (associated companies) or which are jointly controlled with other
parties (joint ventures) are included in the consolidated financial statements from their acquisition
date using the equity method. As a rule, it is assumed that Hapag-Lloyd exerts significant influ-
ence if Hapag-Lloyd AG directly or indirectly holds between 20% and 50% of the voting rights.
The acquisition date constitutes the point in time from which it becomes possible to exert sig-
nificant influence or exercise joint control.
A positive difference between the cost of acquisition of the acquired shares and the proportion-
ate fair value of the acquired assets, liabilities and contingent liabilities at the time of acquisition
is included as goodwill in the carrying amount of the associated company or joint venture.
The Hapag-Lloyd Group’s share of the result for the period or other comprehensive income
from associated companies or joint ventures is reported in the consolidated income statement
or in the Group’s other comprehensive income. The cumulative changes since the acquisition
date increase or decrease the carrying amount of the associated company or joint venture. Pro-
portional losses that exceed the investment carrying amount of the associated company or joint
venture in the Group are not recognised unless further instruments are issued to the company.
If the carrying amount exceeds the recoverable amount of an investment in an associated com-
pany or joint venture, the carrying amount of the investment is written down to the recoverable
amount. Impairments of the carrying amount are recognised in the share of the profit of equity-
accounted investees in the consolidated income statement.
169
H a p a g - L L o y d a g I a n n u a L R e p o R t 2 0 1 9
n o t e s I C o n s o L I d a t e d f I n a n C I a L s t a t e M e n t s

Group of consolidated companies
In addition to Hapag-Lloyd AG, a total of 141 (previous year: 151) companies are included
in consolidated financial statements for the 2019 financial year:
Fully consolidated Equity method
Totaldomestic foreign domestic foreign
31.12.2018 4 141 1 5 151
Additions 0 2 0 0 2
Disposal 0 12 0 0 12
31.12.2019 4 131 1 5 141
Various subsidiaries which were included in the consolidated financial statements as part of the
integration of CSAV’s container shipping business in 2014 and the integration of the UASC Group
in 2017 have been liquidated. As a result, the group of consolidated companies decreased by
8 companies in the 2019 financial year. In addition, 4 companies were removed from the group
of consolidated companies since they are being wound up and are of minor overall importance
to the Group’s net asset, financial and earnings position. These deconsolidations have not
had any significant impact on the net asset, financial and earnings position of the Hapag-Lloyd
Group. The group of consolidated companies has expanded due to the establishment of 2 new
companies.
The following companies are fully consolidated as Hapag-Lloyd AG has majority voting rights
and therefore exerts full control over them.
Company Registered office Shareholding in %
Aratrans Transport and Logistics Service LLC Dubai 49,0
Hapag-Lloyd Ecuador S.A. Guayaquil 45,0
Hapag-Lloyd (Egypt) Shipping S.A.E. Alexandria 49,0
Hapag-Lloyd Middle East Shipping LLC Dubai 49,0
Hapag-Lloyd Shipping Company – State of Kuwait K.S.C.C. Safat 49,0
Hapag-Lloyd (Thailand) Ltd. Bangkok 49,9
Middle East Container Repair Company LLC Dubai 49,0
United Arab Shipping Agencies Company PJS Amman 50,0
Hapag-Lloyd Bahrain Co. WLL Manama 49,0
United Arab Shipping Agencies Co. LLC (UAE) Dubai 49,0
United Arab Shipping Agency Co. (Qatar) WLL Doha 49,0
United Arab Shipping Agency Co. S.A.E. (Egypt) Alexandria 49,0
United Arab Shipping Co. Holding (Thailand) Ltd. Bangkok 49,945
170
H a p a g - L L o y d a g I a n n u a L R e p o R t 2 0 1 9
C o n s o L I d a t e d f I n a n C I a L s t a t e M e n t s I n o t e s

Although Hapag-Lloyd AG only holds 48.95% of the voting shares in the fully consolidated
CSAV Austral SpA, Valparaíso, it accounts for the majority of the members of the decision-
making body. Hapag-Lloyd AG also holds 100% of the shares entitled to dividend payments.
As such, beneficial ownership is exclusively held by Hapag-Lloyd AG.
Details of non-controlling interests can be found in Note (21) Non-controlling interests.
In the reporting year, 9 fully consolidated companies and one equity-accounted investee had a
financial year that differed from that of the Group. The values carried forward as at 31 December
are used for purposes relating to inclusion in the consolidated financial statements. All other
companies have financial years that correspond with Hapag-Lloyd AG.
A list of the subsidiaries and associated companies in the Hapag-Lloyd Group is provided in
Note (39) List of holdings pursuant to Section 315 a of the German Commercial Code (HGB).
Currency translation
The annual financial statements are prepared in the respective functional currency of the
company. The respective functional currency of a company corresponds to the currency of the
primary economic environment in which the company operates. The Hapag-Lloyd Group’s
functional currency is the US dollar. Its reporting currency, however, is the euro.
For purposes relating to their inclusion in the consolidated financial statements, the assets and
liabilities of the Hapag-Lloyd Group are translated into euros at the average exchange rate appli-
cable as at the balance sheet date (closing rate). The transactions listed in the consolidated
statement of cash flows and the expenses and income shown in the consolidated income state-
ment are translated at the average exchange rate for the reporting period. The resulting differ-
ences are recognised in other comprehensive income.
Transactions in foreign currency are recorded at the applicable exchange rate as at the date of
the transaction. As at the balance sheet date, monetary items are translated at the closing rate at
year-end, while non-monetary items are translated at the historical rate. Any differences arising
during translation are recognised through profit or loss. Exceptions are changes in the value
of derivative financial instruments that are designated as qualified cash flow hedges. These are
recognised in other comprehensive income.
Since the 2019 reporting year, exchange rate-related gains and losses associated with operating
business have been reported under other operating income, while exchange rate-related gains
and losses associated with income taxes have been reported in the income taxes item. Where
exchange rate-related gains and losses result from accounting for financial debt, from the current
financial year on these will be reported under other financial items.
171
H a p a g - L L o y d a g I a n n u a L R e p o R t 2 0 1 9
n o t e s I C o n s o L I d a t e d f I n a n C I a L s t a t e M e n t s
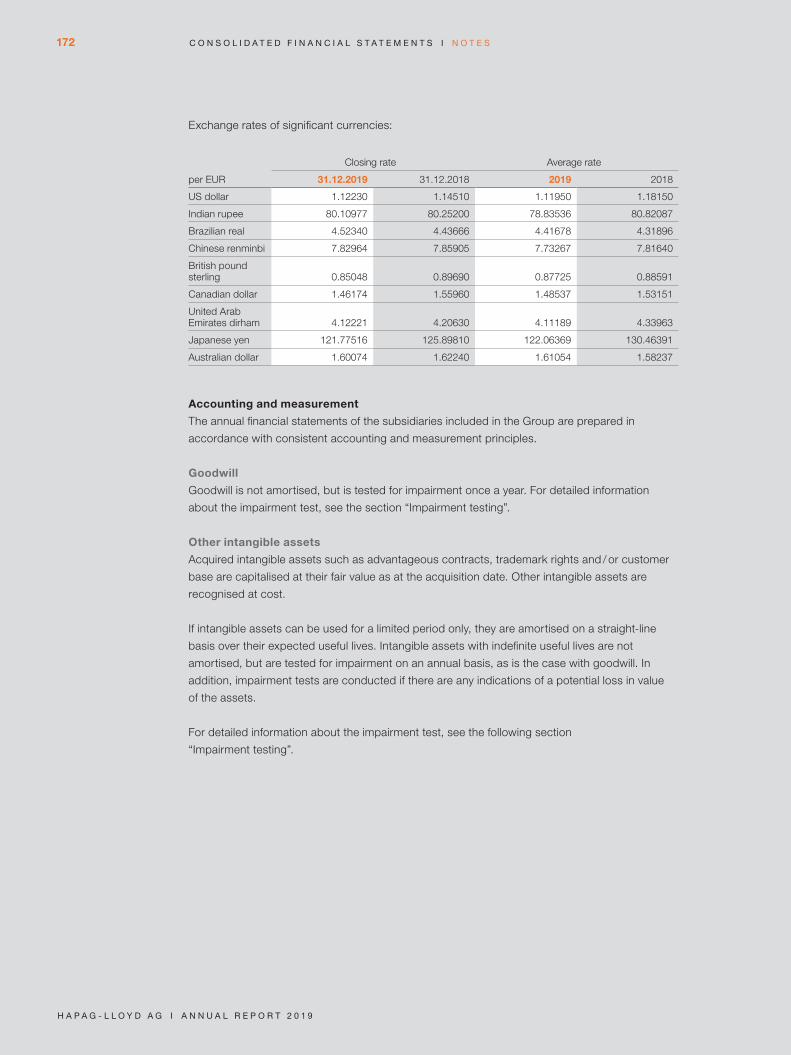
Exchange rates of significant currencies:
per EUR
Closing rate Average rate
31.12.2019 31.12.2018 2019 2018
US dollar 1.12230 1.14510 1.11950 1.18150
Indian rupee 80.10977 80.25200 78.83536 80.82087
Brazilian real 4.52340 4.43666 4.41678 4.31896
Chinese renminbi 7.82964 7.85905 7.73267 7.81640
British pound sterling 0.85048 0.89690 0.87725 0.88591
Canadian dollar 1.46174 1.55960 1.48537 1.53151
United Arab Emirates dirham 4.12221 4.20630 4.11189 4.33963
Japanese yen 121.77516 125.89810 122.06369 130.46391
Australian dollar 1.60074 1.62240 1.61054 1.58237
Accounting and measurement
The annual financial statements of the subsidiaries included in the Group are prepared in
accordance with consistent accounting and measurement principles.
Goodwill
Goodwill is not amortised, but is tested for impairment once a year. For detailed information
about the impairment test, see the section “Impairment testing”.
Other intangible assets
Acquired intangible assets such as advantageous contracts, trademark rights and / or customer
base are capitalised at their fair value as at the acquisition date. Other intangible assets are
recognised at cost.
If intangible assets can be used for a limited period only, they are amortised on a straight-line
basis over their expected useful lives. Intangible assets with indefinite useful lives are not
amortised, but are tested for impairment on an annual basis, as is the case with goodwill. In
addition, impairment tests are conducted if there are any indications of a potential loss in value
of the assets.
For detailed information about the impairment test, see the following section
“Impairment testing”.
172
H a p a g - L L o y d a g I a n n u a L R e p o R t 2 0 1 9
C o n s o L I d a t e d f I n a n C I a L s t a t e M e n t s I n o t e s
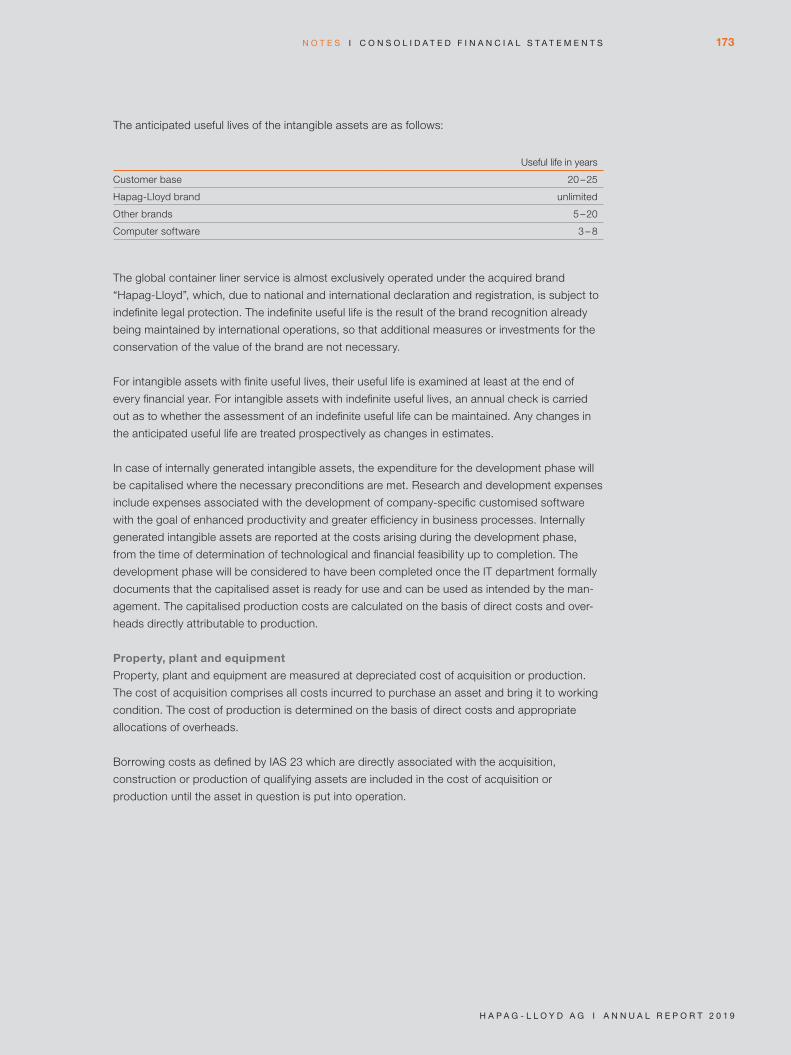
The anticipated useful lives of the intangible assets are as follows:
Useful life in years
Customer base 20-25
Hapag-Lloyd brand unlimited
Other brands 5-20
Computer software 3-8
The global container liner service is almost exclusively operated under the acquired brand
“Hapag-Lloyd”, which, due to national and international declaration and registration, is subject to
indefinite legal protection. The indefinite useful life is the result of the brand recognition already
being maintained by international operations, so that additional measures or investments for the
conservation of the value of the brand are not necessary.
For intangible assets with finite useful lives, their useful life is examined at least at the end of
every financial year. For intangible assets with indefinite useful lives, an annual check is carried
out as to whether the assessment of an indefinite useful life can be maintained. Any changes in
the anticipated useful life are treated prospectively as changes in estimates.
In case of internally generated intangible assets, the expenditure for the development phase will
be capitalised where the necessary preconditions are met. Research and development expenses
include expenses associated with the development of company-specific customised software
with the goal of enhanced productivity and greater efficiency in business processes. Internally
generated intangible assets are reported at the costs arising during the development phase,
from the time of determination of technological and financial feasibility up to completion. The
development phase will be considered to have been completed once the IT department formally
documents that the capitalised asset is ready for use and can be used as intended by the man-
agement. The capitalised production costs are calculated on the basis of direct costs and over -
heads directly attributable to production.
Property, plant and equipment
Property, plant and equipment are measured at depreciated cost of acquisition or production.
The cost of acquisition comprises all costs incurred to purchase an asset and bring it to working
condition. The cost of production is determined on the basis of direct costs and appropriate
allocations of overheads.
Borrowing costs as defined by IAS 23 which are directly associated with the acquisition,
construction or production of qualifying assets are included in the cost of acquisition or
production until the asset in question is put into operation.
173
H a p a g - L L o y d a g I a n n u a L R e p o R t 2 0 1 9
n o t e s I C o n s o L I d a t e d f I n a n C I a L s t a t e M e n t s
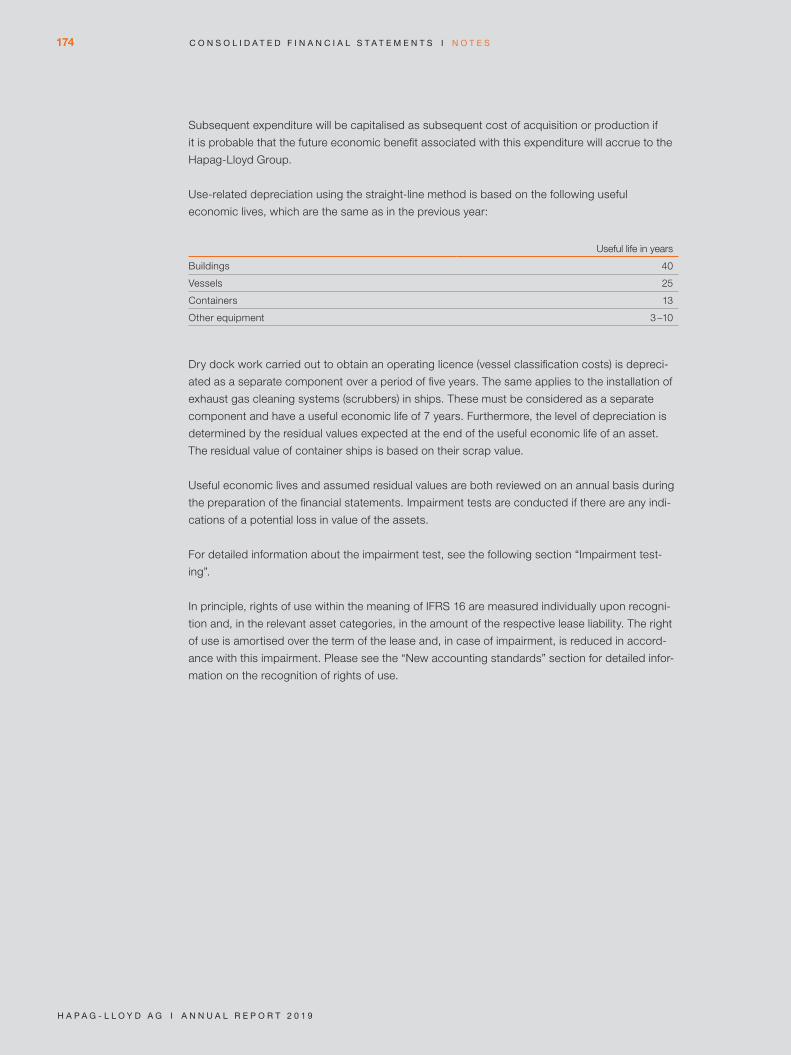
Subsequent expenditure will be capitalised as subsequent cost of acquisition or production if
it is probable that the future economic benefit associated with this expenditure will accrue to the
Hapag-Lloyd Group.
Use-related depreciation using the straight-line method is based on the following useful
economic lives, which are the same as in the previous year:
Useful life in years
Buildings 40
Vessels 25
Containers 13
Other equipment 3-10
Dry dock work carried out to obtain an operating licence (vessel classification costs) is depreci-
ated as a separate component over a period of five years. The same applies to the installation of
exhaust gas cleaning systems (scrubbers) in ships. These must be considered as a separate
component and have a useful economic life of 7 years. Furthermore, the level of depreciation is
determined by the residual values expected at the end of the useful economic life of an asset.
The residual value of container ships is based on their scrap value.
Useful economic lives and assumed residual values are both reviewed on an annual basis during
the preparation of the financial statements. Impairment tests are conducted if there are any indi-
cations of a potential loss in value of the assets.
For detailed information about the impairment test, see the following section “Impairment test-
ing”.
In principle, rights of use within the meaning of IFRS 16 are measured individually upon recogni-
tion and, in the relevant asset categories, in the amount of the respective lease liability. The right
of use is amortised over the term of the lease and, in case of impairment, is reduced in accord-
ance with this impairment. Please see the “New accounting standards” section for detailed infor-
mation on the recognition of rights of use.
174
H a p a g - L L o y d a g I a n n u a L R e p o R t 2 0 1 9
C o n s o L I d a t e d f I n a n C I a L s t a t e M e n t s I n o t e s

Impairment testing
Intangible assets with finite useful lives and property, plant and equipment are tested regularly for
impairment if there are any indications of a possible need for impairment. Intangible assets with
indefinite useful lives are tested for impairment if circumstances require, but at least annually at
the end of the financial year. The recoverable amount of the examined asset is compared with its
carrying amount. If an asset’s carrying amount exceeds its recoverable amount, an impairment is
recognised.
If no recoverable amount can be ascertained for an individual asset, the recoverable amount is
determined for the smallest identifiable group of assets to which the asset in question can be
attributed and which is capable of achieving cash inflows (cash-generating unit, CGU) largely
independently of other assets.
Container shipping in its entirety is defined as a cash-generating unit in the Group, as it is not
possible to allocate the operating cash flows to individual assets due to the complexity of the
transport business (see comments in the “Segment reporting” section).
Goodwill is tested for impairment at least once a year. Impairment testing is also conducted if
events or circumstances occur that indicate that it may no longer be possible to recover the
carrying amount. Goodwill is tested for impairment at the level of the cash-generating unit “con-
tainer shipping”.
An impairment loss is recognised if the recoverable amount is lower than the cash-generating
unit’s carrying amount. If a need for impairment has been ascertained, the goodwill is impaired
first. Any need for impairment over and above this is spread in proportion to the carrying amount
over the remaining non-current assets.
If, at some later date, following an impairment recognised in previous years a higher recoverable
amount is applicable for the asset or for the cash-generating unit, a reversal of the impairment to
no higher than the amortised cost is carried out. Reversals of impairment of goodwill are not per-
mitted.
The recoverable amount is the higher of the fair value less costs of disposal and the value in use
of the cash-generating unit or the individual asset. If one of these amounts is greater than the
carrying amount, it is not necessary to calculate both values.
The fair value is the price that independent market participants would pay at the balance sheet
date under normal market conditions if the asset or cash-generating unit were sold. The value in
use is ascertained by discounting the cash flows anticipated from future operational use.
175
H a p a g - L L o y d a g I a n n u a L R e p o R t 2 0 1 9
n o t e s I C o n s o L I d a t e d f I n a n C I a L s t a t e M e n t s
Leases
A lease is a contract under which the right of use of an asset (the leased asset) is transferred for
an agreed period of time in return for payment of a charge. This mainly relates to rented container
ships, rented containers as well as rented office buildings, office space and parking spaces.
Recognition and measurement principles since 1 January 2019
Lessee
Since 1 January 2019, for all of the leases where it is a lessee Hapag-Lloyd has recognised the
assets for the rights of use for the leased assets and the liabilities for the payment obligations
entered into at their present values in its consolidated statement of financial position. Please see
the comments in the “New accounting standards” section for more detailed information on the
recognition and measurement principles in accordance with IFRS 16.
Lessor
Hapag-Lloyd only operates as a lessor to a very limited extent. In such cases, these leases are
classified as finance leases or operating leases.
As a lessor for an operating lease, Hapag-Lloyd continues to report the leased asset as an asset
carried at amortised cost under property, plant and equipment. The lease payments received in
the period are shown under other operating result.
There are no significant differences between the recognition and measurement principles for
lessor accounting under IFRS 16 (from 1 January 2019) and those under IAS 17 (up to and
including 31 December 2018) in the Hapag-Lloyd Group.
sale and leaseback transactions
Hapag-Lloyd transfers assets such as container ships and containers to other companies and
subsequently leases these assets back from the other company in question (these are known as
sale and leaseback transactions). Since Hapag-Lloyd is entitled on the basis of the relevant con-
tracts to repurchase the asset, the requirements of IFRS 15 regarding the reporting of an asset
as a sale are generally not fulfilled. Hapag-Lloyd thus continues to recognise the transferred
assets in its consolidated statement of financial position and a financial liability in the amount
of the revenue resulting from the transfer in accordance with IFRS 9.
Recognition and measurement principles up to 31 december 2018
Until 31 December 2018, a lease was defined as an agreement under which the lessor transfers
the right of use for an asset to the lessee for a specific period of time in return for a payment or a
series of payments. On the basis of the commercial opportunities and risks inherent in a leased
asset, an assessment was made of whether beneficial ownership of the leased asset is attribut-
able to the lessee (finance lease) or the lessor (operating lease).
176
H a p a g - L L o y d a g I a n n u a L R e p o R t 2 0 1 9
C o n s o L I d a t e d f I n a n C I a L s t a t e M e n t s I n o t e s
Lessee – finance leases
Provided that the Hapag-Lloyd Group as lessee bears all of the substantial risks and rewards
associated with the lease, the leased assets are capitalised in the consolidated statement of
financial position upon commencement of the lease at the leased asset’s fair value or the present
value of the minimum lease payments, whichever is lower. They are subject to straight-line depre-
ciation throughout the term of the lease or the useful life of the asset (whichever is longer), pro-
vided that it is sufficiently certain at the beginning of the lease that legal ownership of the asset
will be transferred to the Company once the contractual term expires.
At the same time, a lease liability was entered which was equivalent to the carrying amount of
the leased asset upon recognition. Each lease payment was divided into an interest portion and
a repayment element. The interest portion was recognised as an expense in the consolidated
income statement; the repayment element reduced the lease liability recognised.
Lessee – operating leases
Rental expenses from operating lease contracts were recorded in the consolidated income state-
ment using the straight-line method over the terms of the respective contracts. One-off costs
arising at the end of the period were amortised on a straight-line basis over the period.
Lessor – operating leases
If the Hapag-Lloyd Group acts as a lessor in the context of operating leases, the respective
leased asset is still recorded and depreciated in the consolidated statement of financial position.
Lease income from operating leases was recorded in revenue or other operating result, using the
straight-line method over the term of the respective contracts.
sale and leaseback transactions
Profits or losses from sale and leaseback transactions that result in operating lease contracts are
recognised immediately if the transactions were effected at market values. If a loss is offset by
future lease instalments being below the market price, this loss is deferred and amortised over
the term of the lease agreement. If the agreed sales price exceeds the fair value, the profit from
the difference between these two values is also deferred and amortised.
177
H a p a g - L L o y d a g I a n n u a L R e p o R t 2 0 1 9
n o t e s I C o n s o L I d a t e d f I n a n C I a L s t a t e M e n t s

Financial instruments
Financial instruments are contractually agreed rights or obligations that will lead to an inflow or
outflow of financial assets or the issue of equity rights. They also encompass derivative rights or
obligations derived from primary financial instruments.
IFRS 9 classifies financial instruments in terms of the measurement categories “measured at
amortised cost” (AC), “measured at fair value through other comprehensive income” (FVOCI)
and “measured at fair value through profit or loss” (FVTPL).
A debt instrument is measured at amortised cost if the following two conditions are fulfilled:
• It is held as part of a business model, the purpose of which is to hold assets in order to collect
contractual cash flows.
• The contractual terms of the financial asset give rise on specified dates to cash flows that are
exclusively repayments and interest payments on the outstanding capital amount (cash flow
criterion).
A debt instrument will be measured at fair value through other comprehensive income if the
following two conditions are fulfilled:
• It is held as part of a mixed business model in which both contractual cash flows
are collected and the financial assets are sold.
• The contractual terms of the financial asset give rise on specified dates to cash flows
that are exclusively repayments and interest payments on the outstanding capital amount
(cash flow criterion).
If the above-mentioned criteria for classification at amortised cost or fair value through other
comprehensive income are not met, the debt instruments are measured at fair value through
profit or loss.
Regardless of the classification criteria described above for debt instruments in categories AC
or FVOCI, a company may irrevocably categorise its financial assets upon initial recognition as
“measured at fair value through profit and loss” if this will avoid or significantly reduce an
accounting mismatch (fair value option).
Equity instruments are always classified and measured at fair value through profit or loss. How-
ever, for primary equity instruments not held for trading, there is an irrevocable option upon initial
recognition to recognise the fair value changes in other comprehensive income (OCI option).
178
H a p a g - L L o y d a g I a n n u a L R e p o R t 2 0 1 9
C o n s o L I d a t e d f I n a n C I a L s t a t e M e n t s I n o t e s

In the Hapag-Lloyd Group, in view of its business model and the cash flow criterion, financial
assets are classified as “measured at amortised cost” and “measured at fair value through profit
or loss”. Neither the fair value option nor the OCI option is made use of.
Primary financial liabilities are measured either at amortised cost or at fair value through profit or
loss. They will be measured at fair value through profit or loss if they are held for trading or, upon
initial recognition, they have been designated – subject to certain preconditions – as “at fair value
through profit or loss” (FV option). In the Hapag-Lloyd Group, primary financial liabilities only exist
in the category “financial liabilities measured at amortised cost”.
Derivative financial instruments that are not part of an effective hedging relationship in accord-
ance with IFRS 9 (Hedge Accounting) and which are “held for trading” must be allocated to the
category “measured at fair value through profit or loss”.
Non-derivative host contracts which are not financial assets within the scope of IFRS 9 are
analysed in terms of whether embedded derivatives exist. Embedded derivatives are to be
recognised separately from the host contract as an independent financial instrument if, among
other features, the two components have different economic characteristics which are not
closely linked to each other. In case of an obligation to separate them, embedded derivatives
are to be measured at fair value through profit or loss.
In the 2019 financial year, as in the previous financial year, there were no reclassifications within
the individual measurement categories.
primary financial assets
Primary financial assets are reported at fair value upon initial recognition. In case of primary
financial assets which are not allocated to the “fair value through profit or loss” category, trans-
action costs directly attributable to the purchase are also included in the initial measurement.
Trade accounts receivable without a significant financing component are measured at their trans-
action price upon initial recognition. They are initially recognised when the unconditional right to
payment arises, starting from the handover of the goods to the transport agent.
Trade accounts receivable, most other financial receivables and cash and cash equivalents are
subsequently measured at amortised cost using the effective interest method.
Expected credit losses on financial assets measured at amortised cost are recognised as loss
allowances. For trade accounts receivable without a significant financing component, loss allow-
ances are always measured in the amount of the credit losses expected over the term.
179
H a p a g - L L o y d a g I a n n u a L R e p o R t 2 0 1 9
n o t e s I C o n s o L I d a t e d f I n a n C I a L s t a t e M e n t s

To measure the expected credit losses from trade accounts receivable that are not credit-
impaired, they are grouped according to the common credit risk characteristics of “geographic
region” and “customer rating” using provision matrices. The probabilities of default used are
forward-looking and are verified using historical credit losses. Trade accounts receivable are
assumed to be credit-impaired if it is unlikely that the customer will fulfil its obligations or if trade
accounts receivable are more than 90 days overdue. To measure the expected credit losses
from these receivables, maturity structures, credit standing, geographic region and historical
defaults are considered, while taking into account predicted future economic conditions.
A financial asset is deemed to be in default if it has not been possible to collect the contractual
payments and it is assumed that they cannot be recovered.
Some other financial receivables of Hapag-Lloyd are recognised at fair value through profit
or loss. These are securities and investments. The measurement gains and losses on such
financial instruments are recognised in the income statement under earnings from investments
and securities.
Primary financial assets are derecognised if the contractual rights in relation to the cash flows
from the financial asset expire or if the rights to receive the cash flows are transferred by means
of a transaction through which all of the key risks and opportunities associated with ownership
of the financial asset are likewise transferred. If all the key risks and opportunities associated
with ownership of a financial asset are neither transferred nor retained and if control over the
transferred asset is not retained, the asset will likewise be derecognised. In addition, financial
assets which are deemed to be in default will be derecognised if all of the collection measures
have proved unsuccessful.
Transactions in which reported assets are transferred but all or substantially all of the risks and
rewards of ownership, resulting from the transferred assets are retained will not result in any
derecognition of the transferred assets.
Cash and cash equivalents
Cash and cash equivalents encompass cash in hand, bank balances and other financial
investments that can be converted into defined cash amounts at any time and are only subject
to minor changes in value. These transactions are recognised at the cost of acquisition.
Fully utilised overdraft facilities are not netted, but are shown as liabilities to banks under
current financial debt.
Due to the short-term nature of bank balances and other cash investments and the strong
credit standing of the banks involved, the expected credit losses in relation to bank balances
and other cash investments are low (low default risk at the end of the reporting period) and
are not recognised.
180
H a p a g - L L o y d a g I a n n u a L R e p o R t 2 0 1 9
C o n s o L I d a t e d f I n a n C I a L s t a t e M e n t s I n o t e s
primary financial liabilities
The initial recognition of a primary financial liability is carried out at fair value, taking account of
directly allocable transaction costs. In subsequent measurements, primary financial liabilities are
measured at amortised cost using the effective interest method.
Primary financial liabilities are written off if contractual obligations have been settled, annulled
or expired. If a review of changes in contractual conditions using quantitative and qualitative
criteria leads to the assessment that both contracts are substantially the same, the old liability
will continue to exist subject to the new conditions, by adjusting the carrying amount in profit or
loss. The new carrying amount of the liability is calculated on the basis of the present value of
the modified cash flows, which are discounted using the original effective interest rate.
derivative financial instruments and hedge accounting
Derivative financial instruments are initially measured at their fair values on the day when the
agreement was concluded. Subsequent measurement is also carried out at the fair value
applicable on the respective balance sheet date. The method used to record gains and losses
depends on whether the derivative financial instrument is designated as a hedge and on the
type of hedging relationship.
Derivative financial instruments are classified either as fair value hedges of assets or liabilities
(fair value hedges), or as cash flow hedges to hedge against the risks of future cash flows from
recorded assets and liabilities or the risks of highly probable future transactions (cash flow
hedges). Hedging relationships in accordance with IFRS 9 (Hedge Accounting) were exclusively
shown as cash flow hedges in the year under review.
Upon conclusion of the transaction in accordance with IFRS 9, the hedging relationships
between the hedging instrument and the hedged item and between the risk management goal
and the underlying strategy are documented. In addition, an assessment is made and docu-
mented both at the beginning of the hedging relationship and on a continual basis as to the
extent to which the derivatives used in the hedging relationship compensate for the changes in
the fair values or cash flows of the hedged items.
The effective portion of changes in the fair value of derivatives which are designated as cash flow
hedges is recognised in the reserve for cash flow hedges in other comprehensive income. The
ineffective portion of such changes in fair value is recognised immediately in profit or loss. The
non-designated portion of the derivative is recognised in a separate reserve for cost of hedging
under other comprehensive income. In the Hapag-Lloyd Group, the changes in the time values
of commodity options and the changes in the value of the forward component of currency for-
ward contracts are excluded from the hedging relationship.
If the hedged transaction later leads to the recognition of a non-financial item, the accumulated
amount recognised under equity is reclassified from the separate equity component and is
recognised with the initial costs or other carrying amount for the hedged asset or liability as a
basis adjustment.
For all other cash flow hedges, however, the accumulated amount recognised under equity
for the period or periods where the hedged cash flows affect profit and loss is reclassified as
reclassification amounts in profit and loss.
181
H a p a g - L L o y d a g I a n n u a L R e p o R t 2 0 1 9
n o t e s I C o n s o L I d a t e d f I n a n C I a L s t a t e M e n t s

If a hedge expires, is sold or no longer meets the criteria for hedge accounting, the cumulative
gain or loss remains in other comprehensive income and is not recognised through profit or
loss in the consolidated income statement until the underlying transaction occurs. If the future
transaction is no longer expected to occur, the cumulative gains or losses recognised outside
the scope of the consolidated income statement must immediately be recognised through
profit or loss.
Changes in the fair values of derivative financial instruments not meeting the criteria for hedge
accounting, including embedded derivatives which must be separated, are recognised directly
through profit or loss in the consolidated income statement.
Inventories
Inventories are measured at the lower of cost of acquisition or net realisable value. The
measurement method applied to similar inventory items is the weighted average cost formula.
The net realisable value is the estimated selling price in the ordinary course of business.
Inventories mainly comprise fuel.
Pensions and similar obligations
The valuation of defined benefit plans from pension obligations and other post-employment
benefits upon termination of the employment position (e.g. healthcare benefits) is carried out in
accordance with IAS 19 Employee Benefits using the projected unit credit method. The actuarial
obligation (defined benefit obligation, DBO) is calculated annually by an independent actuarial
expert. The present value of the DBO is calculated by discounting the expected future outflows
at the interest rate of first-rate corporate bonds. The corporate bonds are issued in the currency
of the payment to be made and have matching maturities with the pension obligations.
Differences between the assumptions made and the actual developments, as well as changes
in the actuarial assumptions for the valuation of defined benefit pension plans and similar obliga-
tions, lead to actuarial gains and losses. As with the difference between calculated interest
income and the actual return on plan assets, these are reported in full in other comprehensive
income, i.e. not in the consolidated income statement.
If the benefits accruing from a plan are changed or cut, both the part of the change in benefits
which relates to previous periods (past service cost) and the gains or losses arising from the
plan cuts are immediately recognised through profit or loss. Gains or losses arising from a
defined benefit plan being cut or paid out are recognised at the time at which the cut or pay-
ment is made.
If individual pension obligations are financed using external assets (e.g. through qualified insur-
ance policies), provisions for pension benefits and similar obligations which match the present
value of defined benefit obligations on the balance sheet date are recorded after deducting the
fair value of the plan assets.
A negative net pension obligation resulting from advance payments for future contributions is
included as an asset only insofar as it leads to a reimbursement from the plan or a reduction
in future contributions.
182
H a p a g - L L o y d a g I a n n u a L R e p o R t 2 0 1 9
C o n s o L I d a t e d f I n a n C I a L s t a t e M e n t s I n o t e s
With defined benefit contribution plans, the Group makes contributions to statutory or private
pension insurance plans on the basis of a legal, contractual or voluntary obligation. The Group
does not have any further payment obligations on top of the payment of the contributions. The
contributions are recorded as personnel expenses when they fall due.
Other provisions
Provisions are recognised for all legal or factual obligations resulting from a past event and
impending losses from pending transactions insofar as their utilisation is probable and their
amount and date can be reliably determined. Provisions are recorded at the best commercial
estimate of their repayable amount and take account of cost and price increases. The pres-
ent value is assessed for provisions with terms exceeding one year. Over the course of time,
the provisions are adjusted on the basis of new knowledge gained.
Releases of provisions are generally recorded in the same consolidated income statement
position that was originally used for the expense. Exceptions to this rule are significant releases
of provisions, which are recorded under other operating result.
If there are many similar obligations, the probability of utilisation is determined on the basis of
this group of obligations. A provision is also recognised even if the probability of a charge is low
in relation to an individual obligation contained within this group.
A provision is recognised for transports not yet completed at the end of the reporting period
which are associated with onerous contracts. The amount to be provisioned is calculated taking
into consideration the variable costs allocable to the transports as well as the pro rata fixed
costs. Before a provision is recognised, an impairment loss will be recognised for the assets
associated with the contract.
Provisions for guarantee, warranty and liability risks are created on the basis of existing or esti-
mated future damages. Provisions for restructuring measures are created if a detailed formal
restructuring plan was prepared and a justified expectation existed among the affected parties.
183
H a p a g - L L o y d a g I a n n u a L R e p o R t 2 0 1 9
n o t e s I C o n s o L I d a t e d f I n a n C I a L s t a t e M e n t s

Contract liabilities
A contract liability reflects the performance obligation still required as at the end of the reporting
period in connection with unfinished voyages. The performance obligation is determined based
on the unconditional right to payment of the transport price and will be recognised starting from
the handover of the goods to the transport agent, in line with the related trade account receiv-
able.
The contract liability will subsequently be released pro rata in accordance with performance
progress, against revenue.
Put options on non-controlling interests
Put options written involving a commitment to buy non-controlling interests when exercised are
recognised as a financial liability in the amount of the present value of the exercise price pursuant
to IAS 32. This entails application of the anticipated acquisition method which is founded on the
assumption that acquisition of the non-controlling interests has already occurred: a financial
obligation to acquire own equity instruments is carried as a liability. The non-controlling interests
are derecognised in equity and the difference between the non-controlling interests and the likely
purchase price is recognised in the remaining equity. Subsequent changes in the value of the
financial liability are recognised through profit or loss in the interest result.
The anticipated acquisition of non-controlling interests was disclosed separately in the statement
of changes in equity.
Share-based payments
The share-based payment plans used by the Group are payment plans which are settled in cash.
The debt incurred by the Group as a result is recognised in expenses at fair value at the time
when the service is rendered by the eligible party (pro rata allocation). Until the end of the per-
formance period, the fair value of the debt is remeasured at every balance sheet date. Any
changes in the fair value are recognised in profit or loss.
Realisation of income and expenses
Realisation of revenue
In the Hapag-Lloyd Group, revenue is mainly generated in connection with transport services
within the scope of revenue resulting from contracts with customers. Under IFRS 15, there is one
performance obligation per shipment, which is rendered on a period-related basis, i.e. for the
duration of transport. Combining several shipments on a single ship journey produces essentially
the same results with regard to the amount of revenue recognised and when it is recognised as
are produced when the revenue is recognised on the basis of a single shipment. Revenue is
recognised in accordance with the input-oriented method for measurement of performance
progress.
184
H a p a g - L L o y d a g I a n n u a L R e p o R t 2 0 1 9
C o n s o L I d a t e d f I n a n C I a L s t a t e M e n t s I n o t e s
other realisation of income and expenses
Operating expenses are recognised in profit or loss when the service has been utilised
or at the time of its occurrence.
Please refer to Note (27) Financial instruments for the recording of gains and losses
from derivative financial instruments used in hedges.
Dividends from non-equity-accounted investees are recorded when the legal claim to them
has arisen.
Interest income and expenses are recognised pro rata using the effective interest method.
Earnings per share
Basic earnings per share is the quotient of the Group net result attributable to the shareholders
of Hapag-Lloyd AG and the weighted average of the number of shares in circulation during the
financial year. In both the 2019 financial year and the previous year, basic earnings per share
were the same as diluted earnings per share.
Taxes
As a liner shipping company, Hapag-Lloyd AG, the largest company in the Hapag-Lloyd Group,
has opted for income taxation based on tonnage. The Tonnage Tax liability is not calculated
using the actual profits, but rather depends on the net tonnage and the operating days of the
Company’s ship fleet. All profits in direct connection with the operation of merchant ships in
international trade are essentially subject to Tonnage Tax. Income from capital and equity invest-
ments is taxed according to the normal rules. The same applies to ships that do not meet the
requirements of Tonnage Taxation. Current income taxes for the reporting period and for previ-
ous periods are measured as the amount at which their payment to or refund from the tax
authority is anticipated. They are ascertained on the basis of the Company’s tax rates as at the
balance sheet date but without interest payments or interest refunds and penalties for back
taxes. Tax liabilities are recognised for amounts considered in the tax returns that will probably
not be realised (uncertain tax positions). The amount is determined by the best estimate of the
expected tax payment (expected value or most likely value of the tax uncertainty). Tax receiv-
ables from uncertain tax positions are recognised in the balance sheet if it is predominantly prob-
able and therefore reasonably certain that they can be realised. Only if a tax loss carryforward
exists, no tax liabilities or tax assets are recognised for these uncertain tax positions; instead,
deferred tax assets are adjusted for the unused tax loss carryforwards. Income tax liabilities are
netted against the corresponding tax refund claims if they apply in the same fiscal territory and
are of the same type and maturity.
Deferred taxes are recognised using the balance sheet liability method in accordance with
IAS 12. They result from temporary differences between the recognised amounts of assets and
liabilities in the consolidated statement of financial position and those in the tax balance sheet.
185
H a p a g - L L o y d a g I a n n u a L R e p o R t 2 0 1 9
n o t e s I C o n s o L I d a t e d f I n a n C I a L s t a t e M e n t s

Expected tax savings from temporary differences or from the use of tax loss carry-forwards are
capitalised if they are estimated to be recoverable in the future. In their valuation, time limitations
on the loss carry-forwards are taken into account accordingly. In order to evaluate whether
deferred tax assets from tax loss carry-forwards can be used, i.e. recovered, the tax-related
budget of the Group is consulted. The tax-related budget is based on the medium-term budget
for 2020 to 2024, which has been extended to ten years for tax purposes.
Deferred taxes are charged or credited directly to other comprehensive income if the tax relates
to items likewise recognised directly in other comprehensive income.
Their valuation takes account of the respective national income tax rates prevailing when the
differences are recognised.
Deferred tax claims (tax assets) and deferred tax debts (tax liabilities) are netted insofar as the
Company has the right to net current income tax assets and liabilities against each other and if
the deferred tax assets and liabilities relate to current income taxes.
Fair value
A number of accounting and valuation methods require that the fair value of both financial and
non-financial assets and liabilities be determined. The fair value is the price that independent
market participants would pay on the relevant day under normal market conditions if the asset
were sold or the liability were transferred.
Fair value is measured using a three-level hierarchy based on the measurement parameters
used.
Level 1:
Unchanged adoption of quoted prices on active markets for identical assets or liabilities.
Level 2:
Use of valuation parameters whose prices are not the listed prices referred to in Level 1,
but which can be observed either directly or indirectly for the asset or liability in question.
Level 3:
Use of factors not based on observable market data for the valuation of the asset or liability
(non-observable valuation parameters).
186
H a p a g - L L o y d a g I a n n u a L R e p o R t 2 0 1 9
C o n s o L I d a t e d f I n a n C I a L s t a t e M e n t s I n o t e s

Every fair value measurement is set at the lowest level of the hierarchy based on the valuation
parameter, provided that this is a key valuation parameter. If the method of determining the fair
value of assets or liabilities to be measured on a regular basis changes, resulting in the need to
assign them to a different hierarchy level, such reclassification is performed at the end of the
reporting period.
Additional explanations of fair values can be found in Note (27) Financial instruments.
Government assistance
Hapag-Lloyd receives various forms of performance-related government assistance and
subsidies. The assistance received is offset against related expenses.
Further information on the nature of this assistance may be found in Note (28) Government
assistance.
Significant assumptions and estimates
The preparation of consolidated financial statements in accordance with IFRS requires estimates
and assumptions in order to determine the assets, liabilities and provisions shown in the state-
ment of financial position, the disclosures of contingent claims and liabilities as at the balance
sheet date, and the recognised income and expenses for the reporting period. Estimates and
assumptions are continuously re-evaluated and are based on historical experience and expec-
tations regarding future events which seem reasonable in the given circumstances.
This specifically applies to the following cases:
• Review of useful lives and residual values for intangible assets and property,
plant and equipment
• Determination of the term of leases with extension and termination options
• Measurement of the expected credit losses on receivables and other financial assets
• Recognition of deferred tax assets on loss carry-forwards
• Specification of parameters for measuring pension provisions
• Recognition and measurement of other provisions
• Determination of recognised demurrage and detention
• Determination of the non-manifested discounts recognised during the year
• Classification of present liabilities as contingent liability
187
H a p a g - L L o y d a g I a n n u a L R e p o R t 2 0 1 9
n o t e s I C o n s o L I d a t e d f I n a n C I a L s t a t e M e n t s

Review of useful lives and residual values for intangible
assets and property, plant and equipment
Useful lives and residual values for intangible assets and property, plant and equipment are
estimated on the basis of past experience. The management regularly reviews the estimates
for individual assets or groups of assets with similar characteristics based on changes in the
quality of maintenance programmes, amended environmental requirements and technical
developments. In the case of significant changes it adjusts the useful lives and residual values.
The estimation of residual values of container ships is affected by uncertainties and fluctuations
due to the long useful life of ships, the uncertainties regarding future economic developments
and the future price of steel, which is a significant parameter for determining the residual values
of container ships. As a rule, the residual value of a container ship or a class of container ships
is determined by its scrap value. The scrap value is calculated on the basis of a container ship’s
empty weight and the average price of steel. Adjustments are made to the residual value of a
container ship based on its longevity if it is expected that (long-term) market fluctuations will exist
until the end of the ship’s useful operating life.
Disclosures on the useful lives can be found in the “Accounting and measurement” section.
The carrying amounts of intangible assets and property, plant and equipment are shown in
Notes (11) Intangible assets and (12) Property, plant and equipment.
Determination of the term of leases with extension and termination options
and mutual cancellation right
Within the scope of the exercise of extension and termination options for leases, discretionary
decisions are made on the probability of the exercise of existing options. Hapag-Lloyd also
assesses possible economic disadvantages in this regard. If, from an economic perspective for
contracts with mutual cancellation right, termination of these agreements will not result in any
significant disadvantages, the term of the agreement is determined while taking account of the
termination notice period in the respective agreement and a possible transition period. If Hapag-
Lloyd believes that there are significant disadvantages, this is taken into account when assessing
the term of the agreement and the term extended until such time as the disadvantages have
been resolved.
For container rental agreements with similar characteristics, the terms and in general the fixed
payments to be recognized as lease payments are determined on the basis of a portfolio
approach and applied consistently for all leases in the portfolio.
For further information, please see the “New accounting standards” section as well as
Note (31) Leases.
188
H a p a g - L L o y d a g I a n n u a L R e p o R t 2 0 1 9
C o n s o L I d a t e d f I n a n C I a L s t a t e M e n t s I n o t e s
Measurement of the expected credit losses on receivables and other
financial assets
The measurement of expected credit losses on receivables and other financial assets includes
assessments and evaluations of individual receivables and groups of receivables which are
based on the credit standing of the relevant customer, geographic region, analysis of maturity
structures and historical defaults as well as future economic conditions. In case of adjustments
to receivables balances, a determination of whether credit losses or transaction price changes
are applicable will be made based on the relevant facts and circumstances.
Recognition of deferred tax assets on loss carry-forwards
The amount of deferred taxes recognised on loss carry-forwards in the Group is dependent
primarily on the estimation of the future usability of the tax loss carry-forwards. In this respect,
the amount of the deferred tax assets depends on the budgeting of future tax results. As a
result of discrepancies between planned and actual developments, these amounts may need
to be adjusted in future periods. Further explanations of deferred taxes are given in Note (9)
Income taxes.
Specification of parameters for measuring pension provisions
The valuation of provisions for pensions and similar obligations is based on, among other things,
assumptions regarding discount rates, anticipated future increases in salaries and pensions
and mortality tables. These assumptions may diverge from the actual figures due to changes in
external factors such as economic conditions or the market situation as well as mortality rates.
The Heubeck RT 2018 G mortality tables are used for measurement of the pension obligations.
For detailed explanations, see Note (22) Provisions for pensions and similar obligations.
Recognition and measurement of other provisions
The other provisions are naturally subject to a high level of estimation uncertainty with regard to
the amount of the obligations or the time of their occurrence. The Company must sometimes
make assumptions on the basis of past experience regarding the likelihood of the realisation of
the obligation or future developments, e.g. the costs to be estimated for the measurement of
obligations. These may be subject to estimation uncertainties, particularly in the case of non-
current provisions.
Provisions are made within the Group if losses from pending transactions are imminent, a loss is
probable and the loss can be reliably estimated. Due to the uncertainties associated with this
valuation, the actual losses may deviate from the original estimates and the respective provision
amount. For provisions for guarantee, warranty and liability risks, there is particular uncertainty
concerning the estimate of future damages.
For more detailed information, please see Note (23) Other provisions.
189
H a p a g - L L o y d a g I a n n u a L R e p o R t 2 0 1 9
n o t e s I C o n s o L I d a t e d f I n a n C I a L s t a t e M e n t s

Determination of the demurrage and detention to be recognised
As a rule, demurrage and detention for containers are recognised once the contractually stipu-
lated free times for a container are exceeded. Determination of the demurrage and detention to
be recognised requires estimates concerning the expected amount of the receivable as well as
the question of whether it is highly probable that the revenue recognised will not be subject to
any significant correction in future. These estimates are based on past experience.
Determination of the non-manifested discounts recognised during the year
Non-manifested discounts are estimated monthly based on individually specified discount con-
ditions and deducted from the transaction price, thereby reducing revenue. At the end of
the year, the discount amount will be determined on the basis of the actual circumstances and
reported accordingly.
Classification of present liabilities as contingent liability
Present liabilities based on past events will not be recognised if fulfilment of the relevant
obligation is not probable. The management will assess whether the fulfilment of an obligation
is not probable or not based on judgements made by lawyers and tax advisers.
For detailed information on the contingent liabilities resulting from tax risks which are not
classified as probable, please see Note (30) Legal disputes.
Risks and uncertainties
Influencing factors which can result in deviations from expectations comprise not only macro-
economic factors such as exchange rates, interest rates and bunker prices, but also the future
development of container shipping.
190
H a p a g - L L o y d a g I a n n u a L R e p o R t 2 0 1 9
C o n s o L I d a t e d f I n a n C I a L s t a t e M e n t s I n o t e s

191
H a p a g - L L o y d a g I a n n u a L R e p o R t 2 0 1 9
n o t e s I C o n s o L I d a t e d f I n a n C I a L s t a t e M e n t s
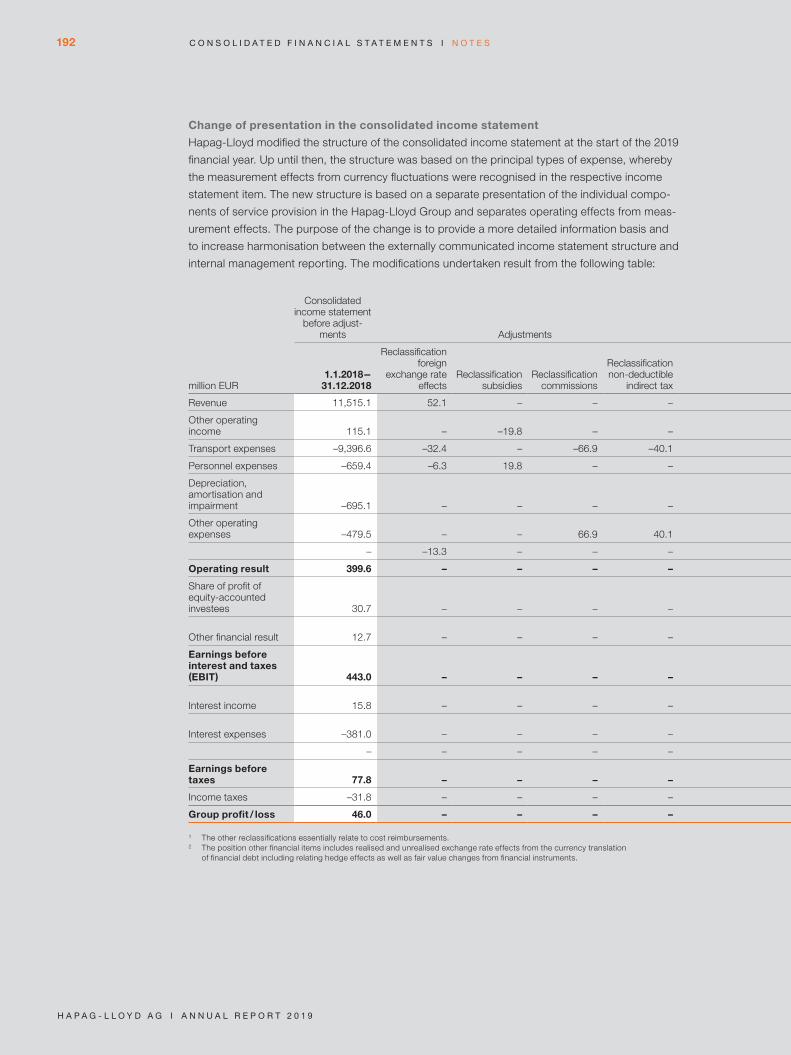
Change of presentation in the consolidated income statement
Hapag-Lloyd modified the structure of the consolidated income statement at the start of the 2019
financial year. Up until then, the structure was based on the principal types of expense, whereby
the measurement effects from currency fluctuations were recognised in the respective income
statement item. The new structure is based on a separate presentation of the individual compo-
nents of service provision in the Hapag-Lloyd Group and separates operating effects from meas-
urement effects. The purpose of the change is to provide a more detailed information basis and
to increase harmonisation between the externally communicated income statement structure and
internal management reporting. The modifications undertaken result from the following table:
million EUR
Consolidated income statement
before adjust-ments Adjustments Adjustments
Consolidated income statement after adjustments
1.1.2018-31.12.2018
Reclassification foreign
exchange rate effects
Reclassification subsidies
Reclassification commissions
Reclassification non-deductible
indirect tax
Reclassification exchange rate
gains / losses of financing
Merge of other operating income /
expensesReclassification
Others11.1.2018-
31.12.2018
Revenue 11,515.1 52.1 – – – – – 50.4 Revenue 11,617.5
Other operating income 115.1 – –19.8 – – – –95.3 – –
Transport expenses –9,396.6 –32.4 – –66.9 –40.1 – – –50.4 Transport expenses –9,586.4
Personnel expenses –659.4 –6.3 19.8 – – – – 0.9 Personnel expenses –645.0
Depreciation, amortisation and impairment –695.1 – – – – – – –
Depreciation, amortisation and impairment –695.1
Other operating expenses –479.5 – – 66.9 40.1 0.5 372.0 – –
– –13.3 – – – – –276.7 –0.9 Other operating result (OOR) –290.9
Operating result 399.6 – – – – – – – Operating result 400.1
Share of profit of equity-accounted investees 30.7 – – – – – – –
Share of profit of equity-accounted investees 30.7
Other financial result 12.7 – – – – – – –Result from investments and securities 12.7
Earnings before interest and taxes (EBIT) 443.0 – – – – – – –
Earnings before interest and taxes (EBIT) 443.5
Interest income 15.8 – – – – – – –Interest income and similar income 15.8
Interest expenses –381.0 – – – – – – –Interest expenses and similar expenses –381.0
– – – – – –0.5 – – Other financial items2 –0.5
Earnings before taxes 77.8 – – – – – – –
Earnings before taxes 77.8
Income taxes –31.8 – – – – – – – Income taxes –31.8
Group profit / loss 46.0 – – – – – – – Group profit / loss 46.0
1 The other reclassifications essentially relate to cost reimbursements.2 The position other financial items includes realised and unrealised exchange rate effects from the currency translation
of financial debt including relating hedge effects as well as fair value changes from financial instruments.
192
H a p a g - L L o y d a g I a n n u a L R e p o R t 2 0 1 9
C o n s o L I d a t e d f I n a n C I a L s t a t e M e n t s I n o t e s

Change of presentation in the consolidated income statement
Hapag-Lloyd modified the structure of the consolidated income statement at the start of the 2019
financial year. Up until then, the structure was based on the principal types of expense, whereby
the measurement effects from currency fluctuations were recognised in the respective income
statement item. The new structure is based on a separate presentation of the individual compo-
nents of service provision in the Hapag-Lloyd Group and separates operating effects from meas-
urement effects. The purpose of the change is to provide a more detailed information basis and
to increase harmonisation between the externally communicated income statement structure and
internal management reporting. The modifications undertaken result from the following table:
million EUR
Consolidated income statement
before adjust-ments Adjustments Adjustments
Consolidated income statement after adjustments
1.1.2018-31.12.2018
Reclassification foreign
exchange rate effects
Reclassification subsidies
Reclassification commissions
Reclassification non-deductible
indirect tax
Reclassification exchange rate
gains / losses of financing
Merge of other operating income /
expensesReclassification
Others11.1.2018-
31.12.2018
Revenue 11,515.1 52.1 – – – – – 50.4 Revenue 11,617.5
Other operating income 115.1 – –19.8 – – – –95.3 – –
Transport expenses –9,396.6 –32.4 – –66.9 –40.1 – – –50.4 Transport expenses –9,586.4
Personnel expenses –659.4 –6.3 19.8 – – – – 0.9 Personnel expenses –645.0
Depreciation, amortisation and impairment –695.1 – – – – – – –
Depreciation, amortisation and impairment –695.1
Other operating expenses –479.5 – – 66.9 40.1 0.5 372.0 – –
– –13.3 – – – – –276.7 –0.9 Other operating result (OOR) –290.9
Operating result 399.6 – – – – – – – Operating result 400.1
Share of profit of equity-accounted investees 30.7 – – – – – – –
Share of profit of equity-accounted investees 30.7
Other financial result 12.7 – – – – – – –Result from investments and securities 12.7
Earnings before interest and taxes (EBIT) 443.0 – – – – – – –
Earnings before interest and taxes (EBIT) 443.5
Interest income 15.8 – – – – – – –Interest income and similar income 15.8
Interest expenses –381.0 – – – – – – –Interest expenses and similar expenses –381.0
– – – – – –0.5 – – Other financial items2 –0.5
Earnings before taxes 77.8 – – – – – – –
Earnings before taxes 77.8
Income taxes –31.8 – – – – – – – Income taxes –31.8
Group profit / loss 46.0 – – – – – – – Group profit / loss 46.0
1 The other reclassifications essentially relate to cost reimbursements.2 The position other financial items includes realised and unrealised exchange rate effects from the currency translation
of financial debt including relating hedge effects as well as fair value changes from financial instruments.
193
H a p a g - L L o y d a g I a n n u a L R e p o R t 2 0 1 9
n o t e s I C o n s o L I d a t e d f I n a n C I a L s t a t e M e n t s

SEGMENT REPORTING
The Hapag-Lloyd Group is managed by the Executive Board as a single, global business unit
with one sphere of activity. The primary performance indicators are freight rates and transport
volume by geographic region as well as EBIT and EBITDA at the Group level.
The allocation of resources (use of ships and containers) and the management of the sales
market and of key customers are done on the basis of the entire liner service network and
deployment of all of the maritime assets. The Group generates its revenue solely through its
activities as a container liner shipping company. The revenue comprises income from
transporting and handling containers and from related services and commissions, all of which
are generated globally. As the Hapag-Lloyd Group operates with the same product around the
world throughout its entire liner service network, the Executive Board has decided that there is
no appropriate measure with which assets, liabilities, EBIT and EBITDA as the key performance
indicators can be allocated to different trades. All of the Group’s assets, liabilities, income and
expenses are thus only allocable to the one segment, container liner shipping. The figures
given per trade are the transport volume and freight rate, as well as the revenue allocable to
said trade.
Transport volume per trade1
TTEU 1.1.-31.12.2019 1.1.-31.12.2018
Atlantic 1,960 1,856
Transpacific 1,945 1,960
Far East 2,327 2,234
Middle East 1,391 1,419
Intra-Asia 900 1,036
Latin America 2,837 2,774
EMA (Europe – Mediterranean - Africa) 676 595
Total 12,037 11,874
1 Due to organisational changes, the transport volumes to and from Djibouti, Sudan and Eritrea have been assigned to the EMA trade since 1 January 2019. Since the third quarter of 2019, transport volumes to and from Oceania have been assigned to the Far East trade. The previous year’s values have been adjusted accordingly.
194
H a p a g - L L o y d a g I a n n u a L R e p o R t 2 0 1 9
C o n s o L I d a t e d f I n a n C I a L s t a t e M e n t s I n o t e s
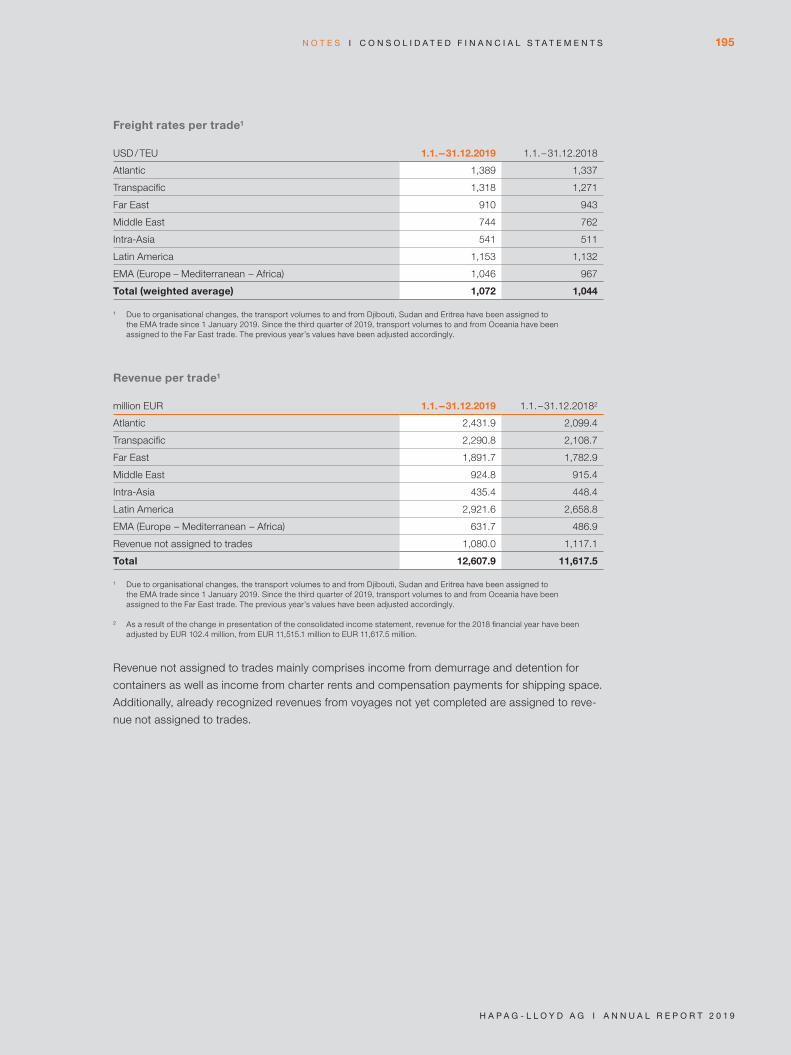
Freight rates per trade1
USD / TEU 1.1.-31.12.2019 1.1.-31.12.2018
Atlantic 1,389 1,337
Transpacific 1,318 1,271
Far East 910 943
Middle East 744 762
Intra-Asia 541 511
Latin America 1,153 1,132
EMA (Europe – Mediterranean - Africa) 1,046 967
Total (weighted average) 1,072 1,044
1 Due to organisational changes, the transport volumes to and from Djibouti, Sudan and Eritrea have been assigned to the EMA trade since 1 January 2019. Since the third quarter of 2019, transport volumes to and from Oceania have been assigned to the Far East trade. The previous year’s values have been adjusted accordingly.
Revenue per trade1
million EUR 1.1.-31.12.2019 1.1.-31.12.20182
Atlantic 2,431.9 2,099.4
Transpacific 2,290.8 2,108.7
Far East 1,891.7 1,782.9
Middle East 924.8 915.4
Intra-Asia 435.4 448.4
Latin America 2,921.6 2,658.8
EMA (Europe - Mediterranean - Africa) 631.7 486.9
Revenue not assigned to trades 1,080.0 1,117.1
Total 12,607.9 11,617.5
1 Due to organisational changes, the transport volumes to and from Djibouti, Sudan and Eritrea have been assigned to the EMA trade since 1 January 2019. Since the third quarter of 2019, transport volumes to and from Oceania have been assigned to the Far East trade. The previous year’s values have been adjusted accordingly.
2 As a result of the change in presentation of the consolidated income statement, revenue for the 2018 financial year have been adjusted by EUR 102.4 million, from EUR 11,515.1 million to EUR 11,617.5 million.
Revenue not assigned to trades mainly comprises income from demurrage and detention for
containers as well as income from charter rents and compensation payments for shipping space.
Additionally, already recognized revenues from voyages not yet completed are assigned to reve-
nue not assigned to trades.
195
H a p a g - L L o y d a g I a n n u a L R e p o R t 2 0 1 9
n o t e s I C o n s o L I d a t e d f I n a n C I a L s t a t e M e n t s
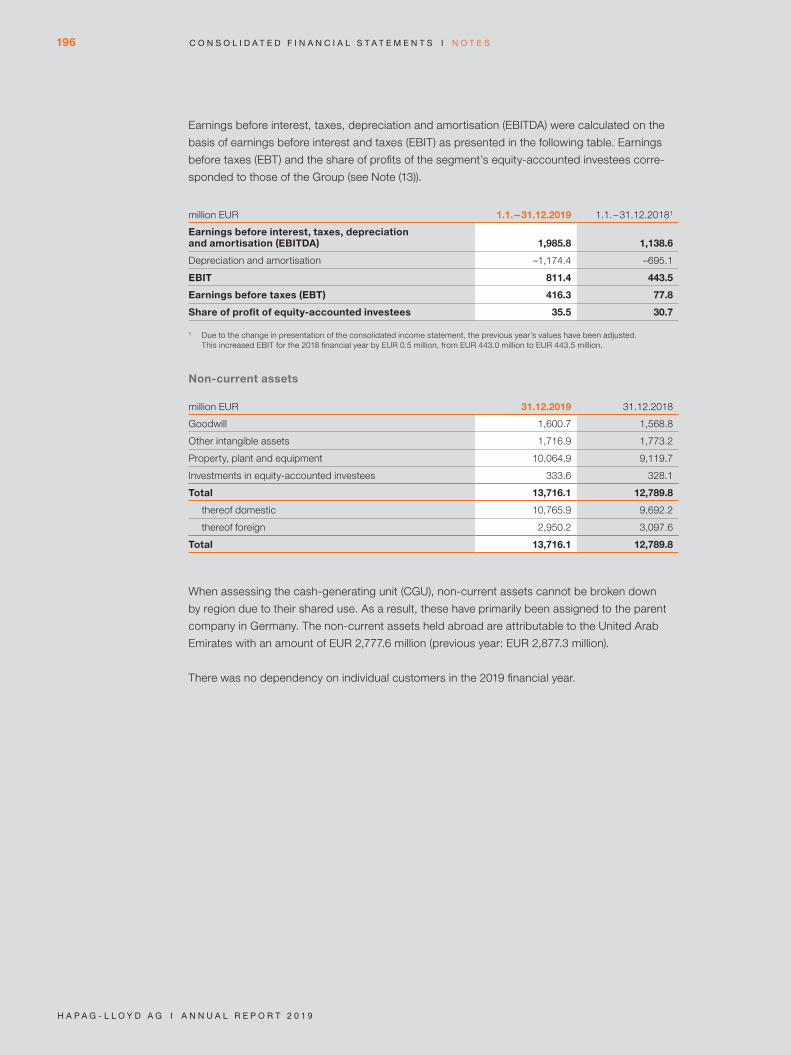
Earnings before interest, taxes, depreciation and amortisation (EBITDA) were calculated on the
basis of earnings before interest and taxes (EBIT) as presented in the following table. Earnings
before taxes (EBT) and the share of profits of the segment’s equity-accounted investees corre-
sponded to those of the Group (see Note (13)).
million EUR 1.1.-31.12.2019 1.1.-31.12.20181
Earnings before interest, taxes, depreciation and amortisation (EBITDA) 1,985.8 1,138.6
Depreciation and amortisation –1,174.4 –695.1
EBIT 811.4 443.5
Earnings before taxes (EBT) 416.3 77.8
Share of profit of equity-accounted investees 35.5 30.7
1 Due to the change in presentation of the consolidated income statement, the previous year’s values have been adjusted. This increased EBIT for the 2018 financial year by EUR 0.5 million, from EUR 443.0 million to EUR 443.5 million.
Non-current assets
million EUR 31.12.2019 31.12.2018
Goodwill 1,600.7 1,568.8
Other intangible assets 1,716.9 1,773.2
Property, plant and equipment 10,064.9 9,119.7
Investments in equity-accounted investees 333.6 328.1
Total 13,716.1 12,789.8
thereof domestic 10,765.9 9,692.2
thereof foreign 2,950.2 3,097.6
Total 13,716.1 12,789.8
When assessing the cash-generating unit (CGU), non-current assets cannot be broken down
by region due to their shared use. As a result, these have primarily been assigned to the parent
company in Germany. The non-current assets held abroad are attributable to the United Arab
Emirates with an amount of EUR 2,777.6 million (previous year: EUR 2,877.3 million).
There was no dependency on individual customers in the 2019 financial year.
196
H a p a g - L L o y d a g I a n n u a L R e p o R t 2 0 1 9
C o n s o L I d a t e d f I n a n C I a L s t a t e M e n t s I n o t e s

NOTES TO THE CONSOLIDATED INCOME STATEMENT
(1) Revenue
Revenue streams
The Hapag-Lloyd Group’s services comprise the shipping of containers by sea as well as
associated hinterland transport for customers, thus providing transport services from door to
door. As a result, the Hapag-Lloyd Group primarily generates revenue from sea freight, inland
container transport and terminal handling charges.
Revenue is broken down by trade in the Hapag-Lloyd Group. This breakdown can be found in
the “Segment reporting” section.
Contract balances
Contract liabilities essentially comprise the remaining performance obligation as at the reporting
date in connection with shipments on voyages not yet completed. The revenue which was
recorded in the reporting period and included in the balance of contract liabilities at the start of
the 2019 financial year came to EUR 260.3 million.
Hapag-Lloyd also has contracts with customers with terms of more than 1 year in accordance
with IFRS 15. However, if one considers the recognition of the associated revenue over the
course of time, it can be seen that the terms of the contracts have no effect on the time-related
recognition of revenue within 1 year. The reason is that the maximum duration of a ship voyage
is less than 1 year. This means that the recognition of revenue for an individual shipment will not
exceed a period of 1 year. With regard to the recognition of income, the Hapag-Lloyd Group
therefore only has contracts with a short-term perspective of less than 1 year. On this basis, in
accordance with IFRS 15.121 (a) in conjunction with IFRS 15.122, no further information is pro-
vided on transaction costs attributable to remaining performance obligations.
Performance obligations and methods for recognising revenue
The Hapag-Lloyd Group measures revenue based on the consideration specified in a contract
with a customer. The revenue is recognised by the Hapag-Lloyd Group when the transport
service is rendered. The performance obligation is fulfilled and the revenue is recognised in the
period when the transport service is rendered by the Hapag-Lloyd Group, i.e. they are period-
based.
The recognition of revenue is determined by performance progress. To determine the perfor-
mance progress in connection with shipments on voyages not yet completed as at the reporting
date, Hapag-Lloyd uses the input-based method while taking account of the expenses incurred
up until the reporting date. Due to the transport-related expenses allocated over the itinerary, the
procedure is considered reliable and suitable. The percentage of completion / transport progress
is therefore determined on the basis of the ratio of expenses incurred to expected total expenses.
Payment terms at Hapag-Lloyd vary at the local level. The payment term predominantly used by
the Group constitutes payment within 30 days of receipt of the outgoing invoice.
197
H a p a g - L L o y d a g I a n n u a L R e p o R t 2 0 1 9
n o t e s I C o n s o L I d a t e d f I n a n C I a L s t a t e M e n t s
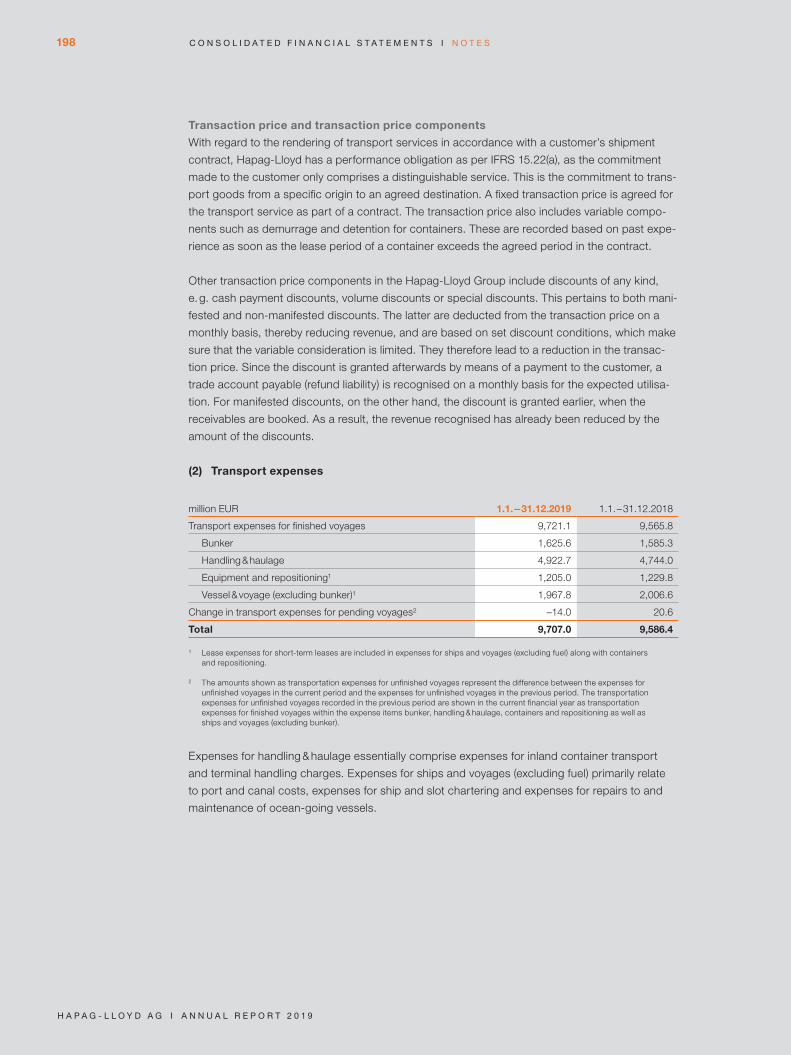
Transaction price and transaction price components
With regard to the rendering of transport services in accordance with a customer’s shipment
contract, Hapag-Lloyd has a performance obligation as per IFRS 15.22(a), as the commitment
made to the customer only comprises a distinguishable service. This is the commitment to trans-
port goods from a specific origin to an agreed destination. A fixed transaction price is agreed for
the transport service as part of a contract. The transaction price also includes variable compo-
nents such as demurrage and detention for containers. These are recorded based on past expe-
rience as soon as the lease period of a container exceeds the agreed period in the contract.
Other transaction price components in the Hapag-Lloyd Group include discounts of any kind,
e. g. cash payment discounts, volume discounts or special discounts. This pertains to both mani-
fested and non-manifested discounts. The latter are deducted from the transaction price on a
monthly basis, thereby reducing revenue, and are based on set discount conditions, which make
sure that the variable consideration is limited. They therefore lead to a reduction in the transac-
tion price. Since the discount is granted afterwards by means of a payment to the customer, a
trade account payable (refund liability) is recognised on a monthly basis for the expected utilisa-
tion. For manifested discounts, on the other hand, the discount is granted earlier, when the
receivables are booked. As a result, the revenue recognised has already been reduced by the
amount of the discounts.
(2) Transport expenses
million EUR 1.1.-31.12.2019 1.1.-31.12.2018
Transport expenses for finished voyages 9,721.1 9,565.8
Bunker 1,625.6 1,585.3
Handling & haulage 4,922.7 4,744.0
Equipment and repositioning1 1,205.0 1,229.8
Vessel & voyage (excluding bunker)1 1,967.8 2,006.6
Change in transport expenses for pending voyages2 –14.0 20.6
Total 9,707.0 9,586.4
1 Lease expenses for short-term leases are included in expenses for ships and voyages (excluding fuel) along with containers and repositioning.
2 The amounts shown as transportation expenses for unfinished voyages represent the difference between the expenses for unfinished voyages in the current period and the expenses for unfinished voyages in the previous period. The transportation expenses for unfinished voyages recorded in the previous period are shown in the current financial year as transportation expenses for finished voyages within the expense items bunker, handling & haulage, containers and repositioning as well as ships and voyages (excluding bunker).
Expenses for handling & haulage essentially comprise expenses for inland container transport
and terminal handling charges. Expenses for ships and voyages (excluding fuel) primarily relate
to port and canal costs, expenses for ship and slot chartering and expenses for repairs to and
maintenance of ocean-going vessels.
198
H a p a g - L L o y d a g I a n n u a L R e p o R t 2 0 1 9
C o n s o L I d a t e d f I n a n C I a L s t a t e M e n t s I n o t e s

(3) Personnel expenses
million EUR 1.1.-31.12.2019 1.1.-31.12.2018
Wages and salaries 562.8 526.6
Social security costs, pension costs and other benefits 119.7 118.4
Total 682.5 645.0
Pension costs include, among other things, expenses for defined benefit and defined contribution
pension obligations. A detailed presentation of pension commitments is provided in Note (22)
Provisions for pensions and similar obligations. Personnel expenses were reduced by the gov-
ernment assistance granted in the amount of EUR 10.4 million (previous year: EUR 11.2 million),
which was recognised in profit and loss. In the previous year, the item was recognised under
other operating income. Further details can be found under Note (28) Government assistance.
The average number of employees was as follows:
1.1.-31.12.2019 1.1.-31.12.2018
Marine personnel 2,026 1,985
Shore-based personnel 10,655 10,251
Apprentices 225 234
Total 12,905 12,470
(4) Depreciation, amortisation and impairment
million EUR 1.1.-31.12.2019 1.1.-31.12.2018
Scheduled amortisation / depreciation 1,174.4 694.2
Amortisation of intangible assets 99.6 99.3
Depreciation of property, plant and equipment1 1,074.7 594.9
Impairment – 0.9
Impairment of intangible assets – 0.9
Total 1,174.4 695.1
1 The Group applied IFRS 16 for the first time on 1 January 2019. In relation to this, EUR 436.5 million in depreciation and amortisa-tion was recognised for corresponding leases in 2019.
The amortisation of intangible assets largely concerned amortisation of the customer base. The
depreciation of property, plant and equipment was largely accounted for by ocean-going vessels
and containers. A break-down of depreciation and amortisation can be found in the Notes to the
respective balance sheet item.
199
H a p a g - L L o y d a g I a n n u a L R e p o R t 2 0 1 9
n o t e s I C o n s o L I d a t e d f I n a n C I a L s t a t e M e n t s

(5) Other operating result1
million EUR 1.1.-31.12.2019 1.1.-31.12.2018
Other operating income 81.2 73.7
Gains and losses from disposal of assets 20.2 15.0
Income from the reversal of provisions 11.4 14.4
Income from own cost capitalized 6.8 3.8
Miscellaneous operating income 42.8 40.4
Other operating expenses 350.0 364.5
IT & Communication expenses 155.7 142.1
Office & Administration expenses 41.8 65.0
Charges, fees, consultancy and other professional services 35.8 34.3
Training and other personnel expenses 26.9 27.3
Car and Travel expenses 19.4 17.4
Other taxes 12.5 11.3
Exchange rate gains / losses 10.2 36.9
Bank charges 8.3 9.1
Miscellaneous operating expenses 39.4 21.2
Total –268.8 –290.9
1 As a result of the changes to the structure of the Income statement, other operating income and other operating expenses are combined and reported under the item “other operating income”. The previous year’s values have been adjusted accordingly. Further explanatory notes can be found in the segment “change of presentation in the consolidated income statement”.
The income from the disposal of assets primarily results from disposals of containers in the
current financial year.
Income from the release of provisions mainly includes releases of provisions for guarantee,
warranty and liability risks and for insurance premiums.
Miscellaneous operating income comprises items that cannot be allocated to any of the items
mentioned above. This includes, among other things, income from cost transfers for services
provided.
The exchange rate gains and losses are shown netted in other operating expenses and were
mainly attributable to exchange rate fluctuations of assets and liabilities (excluding financial debt).
Miscellaneous operating expenses comprise items that cannot be allocated to any of the items
mentioned above.
(6) Income from investments and securities
Income from investments and securities was EUR 12.7 million in the previous year and essen-
tially comprised the profit of EUR 12.9 million from the disposal of the investment INTTRA Inc.,
New Jersey.
200
H a p a g - L L o y d a g I a n n u a L R e p o R t 2 0 1 9
C o n s o L I d a t e d f I n a n C I a L s t a t e M e n t s I n o t e s
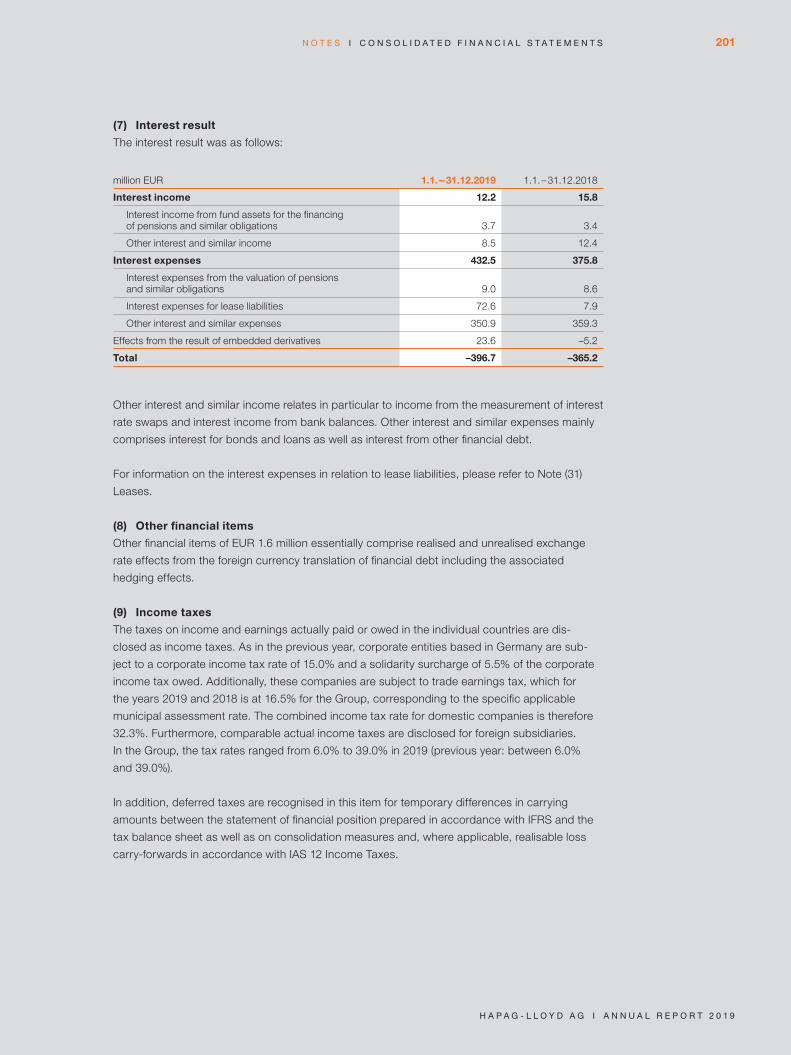
(7) Interest result
The interest result was as follows:
million EUR 1.1.-31.12.2019 1.1.-31.12.2018
Interest income 12.2 15.8
Interest income from fund assets for the financing of pensions and similar obligations 3.7 3.4
Other interest and similar income 8.5 12.4
Interest expenses 432.5 375.8
Interest expenses from the valuation of pensions and similar obligations 9.0 8.6
Interest expenses for lease liabilities 72.6 7.9
Other interest and similar expenses 350.9 359.3
Effects from the result of embedded derivatives 23.6 –5.2
Total –396.7 –365.2
Other interest and similar income relates in particular to income from the measurement of interest
rate swaps and interest income from bank balances. Other interest and similar expenses mainly
comprises interest for bonds and loans as well as interest from other financial debt.
For information on the interest expenses in relation to lease liabilities, please refer to Note (31)
Leases.
(8) Other financial items
Other financial items of EUR 1.6 million essentially comprise realised and unrealised exchange
rate effects from the foreign currency translation of financial debt including the associated
hedging effects.
(9) Income taxes
The taxes on income and earnings actually paid or owed in the individual countries are dis-
closed as income taxes. As in the previous year, corporate entities based in Germany are sub-
ject to a corporate income tax rate of 15.0% and a solidarity surcharge of 5.5% of the corporate
income tax owed. Additionally, these companies are subject to trade earnings tax, which for
the years 2019 and 2018 is at 16.5% for the Group, corresponding to the specific applicable
municipal assessment rate. The combined income tax rate for domestic companies is therefore
32.3%. Furthermore, comparable actual income taxes are disclosed for foreign subsidiaries.
In the Group, the tax rates ranged from 6.0% to 39.0% in 2019 (previous year: between 6.0%
and 39.0%).
In addition, deferred taxes are recognised in this item for temporary differences in carrying
amounts between the statement of financial position prepared in accordance with IFRS and the
tax balance sheet as well as on consolidation measures and, where applicable, realisable loss
carry-forwards in accordance with IAS 12 Income Taxes.
201
H a p a g - L L o y d a g I a n n u a L R e p o R t 2 0 1 9
n o t e s I C o n s o L I d a t e d f I n a n C I a L s t a t e M e n t s
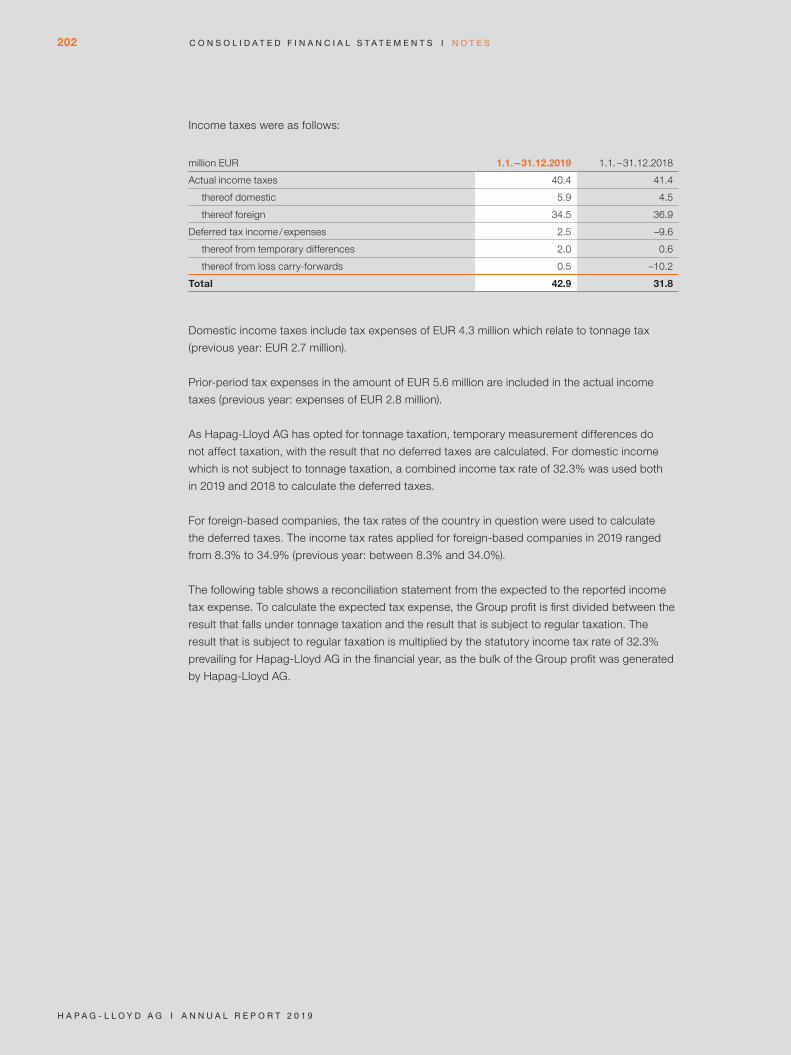
Income taxes were as follows:
million EUR 1.1.-31.12.2019 1.1.-31.12.2018
Actual income taxes 40.4 41.4
thereof domestic 5.9 4.5
thereof foreign 34.5 36.9
Deferred tax income / expenses 2.5 –9.6
thereof from temporary differences 2.0 0.6
thereof from loss carry-forwards 0.5 –10.2
Total 42.9 31.8
Domestic income taxes include tax expenses of EUR 4.3 million which relate to tonnage tax
(previous year: EUR 2.7 million).
Prior-period tax expenses in the amount of EUR 5.6 million are included in the actual income
taxes (previous year: expenses of EUR 2.8 million).
As Hapag-Lloyd AG has opted for tonnage taxation, temporary measurement differences do
not affect taxation, with the result that no deferred taxes are calculated. For domestic income
which is not subject to tonnage taxation, a combined income tax rate of 32.3% was used both
in 2019 and 2018 to calculate the deferred taxes.
For foreign-based companies, the tax rates of the country in question were used to calculate
the deferred taxes. The income tax rates applied for foreign-based companies in 2019 ranged
from 8.3% to 34.9% (previous year: between 8.3% and 34.0%).
The following table shows a reconciliation statement from the expected to the reported income
tax expense. To calculate the expected tax expense, the Group profit is first divided between the
result that falls under tonnage taxation and the result that is subject to regular taxation. The
result that is subject to regular taxation is multiplied by the statutory income tax rate of 32.3%
prevailing for Hapag-Lloyd AG in the financial year, as the bulk of the Group profit was generated
by Hapag-Lloyd AG.
202
H a p a g - L L o y d a g I a n n u a L R e p o R t 2 0 1 9
C o n s o L I d a t e d f I n a n C I a L s t a t e M e n t s I n o t e s

Reconciliation statement
million EUR 1.1.-31.12.2019 1.1.-31.12.2018
Earnings before taxes 416.3 77.8
thereof under tonnage tax 176.8 –93.7
thereof under regular income tax 239.5 171.5
Expected income tax expense (+) / income (–) (tax rate 32.3%) 77.3 55.3
Difference between the actual tax rates and the expected tax rates –24.9 -13.3
Changes in tax rate or tax law 0.2 -
Effects of income not subject to income tax –0.4 –2.8
Non-deductible expenses and trade tax additions and reductions 4.1 7.3
Effects from reassessments –4.5 –13.4
Effective tax expenses and income relating to other periods –5.6 2.8
Tax effect from equity-acounted investees –11.4 –9.4
Exchange rate differences 0.6 0.8
Other differences 3.3 1.8
Income tax expense under regular income tax 38.7 29.1
Income tax expense under tonnage tax base 4.2 2.7
thereof: effects from reassessments - –1.4
Reported income tax expenses (+) / income (–) 42.9 31.8
Effects due to deviating tax rates for domestic and foreign taxes from the income tax rate of
Hapag-Lloyd AG are disclosed in the above reconciliation statement under the difference
between the actual tax rates and the expected tax rates.
Effects from reassessments include income of EUR 4.3 million (previous year: EUR 12.0 million)
from changes in unrecognised corporate income tax loss carry-forwards both at home and
abroad. A further EUR 0.8 million (previous year: EUR 1.4 million) relates to the reduction of actual
income taxes due to the use of tax losses previously not recognised.
The other differences include EUR 3.2 million in foreign withholding taxes for dividends, which
are non-deductible (previous year: EUR 1.5 million).
203
H a p a g - L L o y d a g I a n n u a L R e p o R t 2 0 1 9
n o t e s I C o n s o L I d a t e d f I n a n C I a L s t a t e M e n t s

Deferred tax assets and deferred tax liabilities result from temporary differences and tax loss
carry-forwards as follows:
million EUR
31.12.2019 31.12.2018
Asset Liabillity Asset Liabillity
Recognition and measurement differ-ences for property, plant and equipment and other non-current assets 1.3 7.0 2.3 4.2
Recognition differences for receivables and other assets 2.6 0.6 1.9 0.5
Measurement of pension provisions 6.4 0.7 5.1 0.7
Recognition and measurement differences for other provisions 4.5 – 4.3 –
Other transactions 7.6 2.1 4.7 1.3
Capitalised tax savings from recoverable loss carry-forwards 19.0 – 19.1 –
thereof: utilised by tonnage tax base 2.7 – 4.8 –
Netting of deferred tax assets and liabilities –1.7 –1.7 –1.4 –1.4
Balance sheet recognition 39.7 8.7 36.0 5.3
The change in deferred taxes in the statement of financial position is recognised as follows:
million EURAs at
1.1.2018
Recognised as taxes in the income statement
Recognised in other
comprehensive income
Recognised as an ex-change rate difference
As at 31.12.2018
Recognition and measurement differences for property, plant and equipment and other non- current assets –1.1 –0.8 – – –1.9
Recognition differences for receivables and other assets 1.8 –0.4 – – 1.4
Measurement of pension provisions 5.5 –0.1 –1.0 – 4.4
thereof recognised directly in equity 5.4 – –1.0 – 4.4
Recognition and measurement differences for other provisions 4.5 –0.8 – 0.6 4.3
Other transactions 1.8 1.5 – 0.1 3.4
Capitalised tax savings from recoverable loss carry- frowards 8.2 10.2 – 0.7 19.1
Balance sheet recognition 20.7 9.6 –1.0 1.4 30.7
204
H a p a g - L L o y d a g I a n n u a L R e p o R t 2 0 1 9
C o n s o L I d a t e d f I n a n C I a L s t a t e M e n t s I n o t e s

million EURAs at
1.1.2019
Recognised as taxes in the income statement
Recognised in other
comprehensive income
Recognised as an ex-change rate difference
As at 31.12.2019
Recognition and measurement differences for property, plant and equipment and other non- current assets –1.9 –3.7 – -0.1 –5.7
Recognition differences for receivables and other assets 1.4 0.6 – - 2.0
Measurement of pension provisions 4.4 –1.0 2.2 0.1 5.7
thereof recognised directly in equity 4.4 – 2.2 – 6.6
Recognition and measurement differences for other provisions 4.3 0.2 – – 4.5
Other transactions 3.4 1.9 – 0.2 5.5
Capitalised tax savings from recoverable loss carry- frowards 19.1 –0.5 – 0.4 19.0
Balance sheet recognition 30.7 –2.5 2.2 0.6 31.0
Deferred tax liabilities of EUR 0.3 million (previous year: EUR 0.3 million) were recognised for
temporary differences between the net assets and the carrying amounts of subsidiaries for tax
purposes, whereby the reversal of the temporary differences is likely in the foreseeable future.
No deferred tax liabilities were recognised for the remaining taxable differences between the net
assets and the carrying amount of subsidiaries for tax purposes amounting to EUR 64.8 million
(previous year: EUR 59.3 million), as Hapag-Lloyd is able to steer how the temporary differences
are reversed over time and no reversal of the temporary differences is likely in the near future.
Deferred tax assets and liabilities are classified as non-current in the statement of financial
position in accordance with IAS 1, irrespective of their expected realisation date.
205
H a p a g - L L o y d a g I a n n u a L R e p o R t 2 0 1 9
n o t e s I C o n s o L I d a t e d f I n a n C I a L s t a t e M e n t s

Deferred tax assets are recognised for temporary differences and tax loss carry-forwards if their
realisation seems certain in the near future. The loss carry-forwards not recognised relate pri-
marily to foreign subsidiaries that are not covered by tonnage taxation. The amounts of unutilised
tax losses and the capacity to carry forward the tax losses for which no deferred tax assets were
recognised are as follows:
million EUR 31.12.2019 31.12.2018
Loss carry-forwards for which deferred tax assets were recognised 67.6 77.3
Loss carry-forwards for which no deferred tax assets were recognised 1,282.6 1,267.0
thereof loss carry-forwards forfeitable in more than 5 years 1.0 1.0
Non-forfeitable loss carry-forwards 1,281.6 1,266.0
thereof interest carry-forwards – –
Total of unutilised loss carry-forwards 1,350.2 1,344.3
(10) Earnings per share
1.1.-31.12.2019 1.1.-31.12.2018
Profit / loss attributable to shareholders in million EUR 362.0 36.8
Weighted average number of shares 175.8 175.8
Basic earnings per share in EUR 2.06 0.21
Basic earnings per share is the quotient of the Group net result attributable to the shareholders
of Hapag-Lloyd AG and the weighted average of the number of shares in circulation during the
financial year.
There were no dilutive effects in the 2019 financial year or in the previous year.
206
H a p a g - L L o y d a g I a n n u a L R e p o R t 2 0 1 9
C o n s o L I d a t e d f I n a n C I a L s t a t e M e n t s I n o t e s
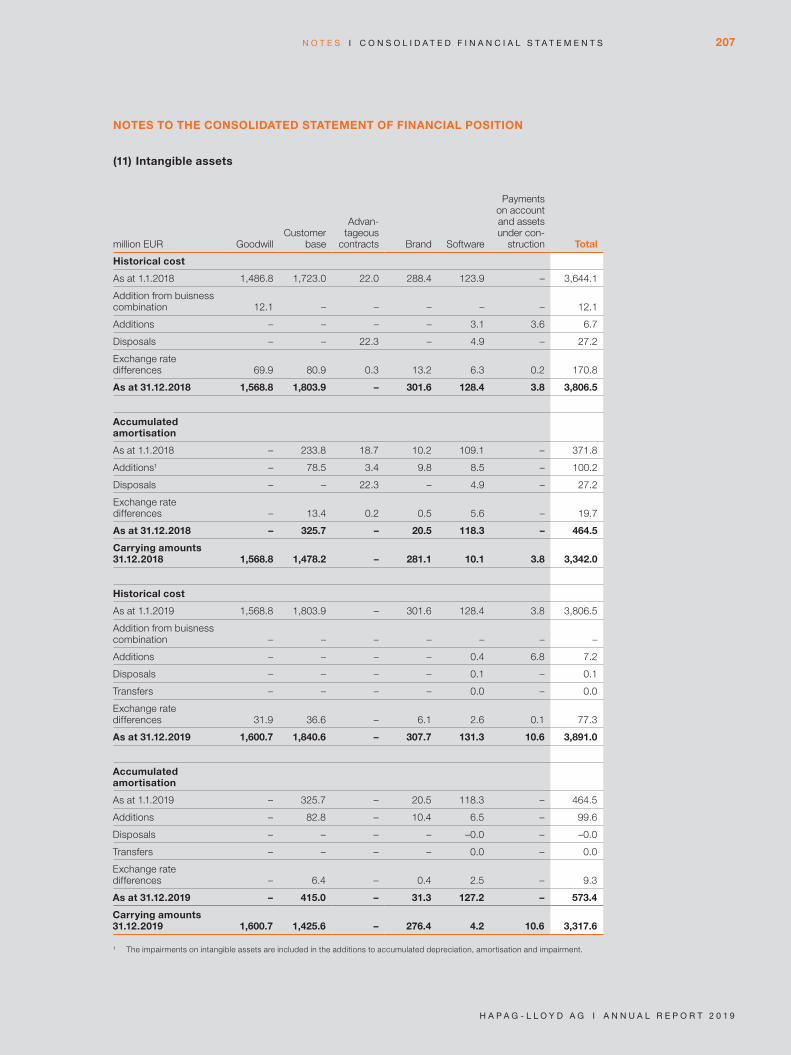
NOTES TO THE CONSOLIDATED STATEMENT OF FINANCIAL POSITION
(11) Intangible assets
million EUR GoodwillCustomer
base
Advan- tageous
contracts Brand Software
Payments on account and assets under con-
struction Total
Historical cost
As at 1.1.2018 1,486.8 1,723.0 22.0 288.4 123.9 – 3,644.1
Addition from buisness combination 12.1 – – – – – 12.1
Additions – – – – 3.1 3.6 6.7
Disposals – – 22.3 – 4.9 – 27.2
Exchange rate differences 69.9 80.9 0.3 13.2 6.3 0.2 170.8
As at 31.12.2018 1,568.8 1,803.9 – 301.6 128.4 3.8 3,806.5
Accumulated amortisation
As at 1.1.2018 – 233.8 18.7 10.2 109.1 – 371.8
Additions1 – 78.5 3.4 9.8 8.5 – 100.2
Disposals – – 22.3 – 4.9 – 27.2
Exchange rate differences – 13.4 0.2 0.5 5.6 – 19.7
As at 31.12.2018 – 325.7 – 20.5 118.3 – 464.5
Carrying amounts 31.12.2018 1,568.8 1,478.2 – 281.1 10.1 3.8 3,342.0
Historical cost
As at 1.1.2019 1,568.8 1,803.9 – 301.6 128.4 3.8 3,806.5
Addition from buisness combination – – – – – – –
Additions – – – – 0.4 6.8 7.2
Disposals – – – – 0.1 – 0.1
Transfers – – – – 0.0 – 0.0
Exchange rate differences 31.9 36.6 – 6.1 2.6 0.1 77.3
As at 31.12.2019 1,600.7 1,840.6 – 307.7 131.3 10.6 3,891.0
Accumulated amortisation
As at 1.1.2019 – 325.7 – 20.5 118.3 – 464.5
Additions – 82.8 – 10.4 6.5 – 99.6
Disposals – – – – –0.0 – –0.0
Transfers – – – – 0.0 – 0.0
Exchange rate differences – 6.4 – 0.4 2.5 – 9.3
As at 31.12.2019 – 415.0 – 31.3 127.2 – 573.4
Carrying amounts 31.12.2019 1,600.7 1,425.6 – 276.4 4.2 10.6 3,317.6
1 The impairments on intangible assets are included in the additions to accumulated depreciation, amortisation and impairment.
207
H a p a g - L L o y d a g I a n n u a L R e p o R t 2 0 1 9
n o t e s I C o n s o L I d a t e d f I n a n C I a L s t a t e M e n t s

Intangible assets not subject to amortisation comprise goodwill in the amount of EUR 1,600.7 mil-
lion (previous year: EUR 1,568.8 million) and the Hapag-Lloyd brand in the amount of EUR 228.7
million (previous year: EUR 224.2 million).
At the end of the 2019 financial year, an impairment test of goodwill and intangible assets that are
not subject to amortisation was carried out for the entire cash-generating unit “container ship-
ping”. The recoverable amount was calculated based on the fair value less costs of disposal.
Measurement was based on level 1 input factors (unchanged use of the quoted share price of
Hapag-Lloyd AG and of a bond price) and on level 2 input factors (use of observable market price
quotations that are not level 1 to measure the remaining financial debt). With regard to the funda-
mental measurement assumptions, please refer to the section “Accounting and measurement
principles”. As a whole, the fair value of the cash-generating unit “container shipping” should be
assigned to level 2, as this level corresponds to the lowest input factor that is significant for over-
all measurement.
As at the balance sheet date, the fair value less costs of disposal was higher than the carrying
amounts of the cash-generating unit “container shipping”, with the result that it was not neces-
sary to recognise an impairment.
Research and development expenses in the financial year totalled EUR 25.5 million (previous
year: EUR 17.8 million). Investments in internally generated intangible assets requiring capitalisa-
tion in 2019 amounted to EUR 6.8 million (EUR 3.8 million). These are presented completely as
payments on account and assets under construction.
208
H a p a g - L L o y d a g I a n n u a L R e p o R t 2 0 1 9
C o n s o L I d a t e d f I n a n C I a L s t a t e M e n t s I n o t e s
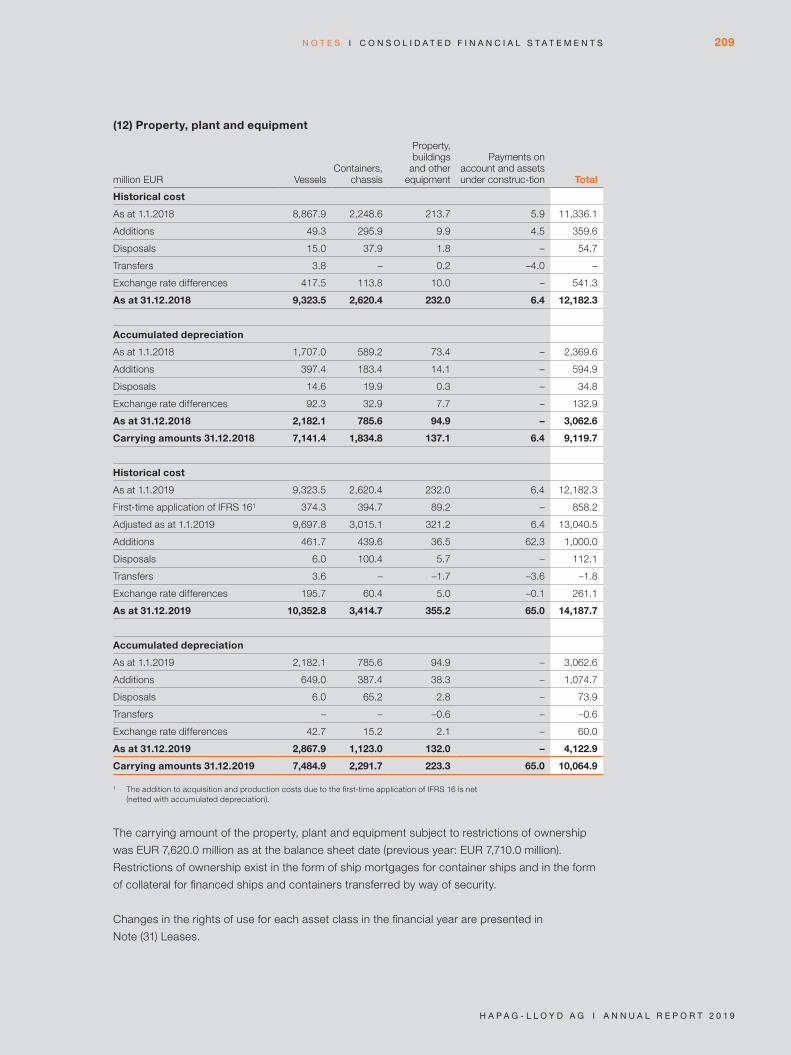
(12) Property, plant and equipment
million EUR VesselsContainers,
chassis
Property, buildings
and other equipment
Payments on account and assets under construc-tion Total
Historical cost
As at 1.1.2018 8,867.9 2,248.6 213.7 5.9 11,336.1
Additions 49.3 295.9 9.9 4.5 359.6
Disposals 15.0 37.9 1.8 – 54.7
Transfers 3.8 – 0.2 –4.0 –
Exchange rate differences 417.5 113.8 10.0 – 541.3
As at 31.12.2018 9,323.5 2,620.4 232.0 6.4 12,182.3
Accumulated depreciation
As at 1.1.2018 1,707.0 589.2 73.4 – 2,369.6
Additions 397.4 183.4 14.1 – 594.9
Disposals 14.6 19.9 0.3 – 34.8
Exchange rate differences 92.3 32.9 7.7 – 132.9
As at 31.12.2018 2,182.1 785.6 94.9 – 3,062.6
Carrying amounts 31.12.2018 7,141.4 1,834.8 137.1 6.4 9,119.7
Historical cost
As at 1.1.2019 9,323.5 2,620.4 232.0 6.4 12,182.3
First-time application of IFRS 161 374.3 394.7 89.2 – 858.2
Adjusted as at 1.1.2019 9,697.8 3,015.1 321.2 6.4 13,040.5
Additions 461.7 439.6 36.5 62.3 1,000.0
Disposals 6.0 100.4 5.7 – 112.1
Transfers 3.6 – –1.7 –3.6 –1.8
Exchange rate differences 195.7 60.4 5.0 –0.1 261.1
As at 31.12.2019 10,352.8 3,414.7 355.2 65.0 14,187.7
Accumulated depreciation
As at 1.1.2019 2,182.1 785.6 94.9 – 3,062.6
Additions 649.0 387.4 38.3 – 1,074.7
Disposals 6.0 65.2 2.8 – 73.9
Transfers – – –0.6 – –0.6
Exchange rate differences 42.7 15.2 2.1 – 60.0
As at 31.12.2019 2,867.9 1,123.0 132.0 – 4,122.9
Carrying amounts 31.12.2019 7,484.9 2,291.7 223.3 65.0 10,064.9
1 The addition to acquisition and production costs due to the first-time application of IFRS 16 is net (netted with accumulated depreciation).
The carrying amount of the property, plant and equipment subject to restrictions of ownership
was EUR 7,620.0 million as at the balance sheet date (previous year: EUR 7,710.0 million).
Restrictions of ownership exist in the form of ship mortgages for container ships and in the form
of collateral for financed ships and containers transferred by way of security.
Changes in the rights of use for each asset class in the financial year are presented in
Note (31) Leases.
209
H a p a g - L L o y d a g I a n n u a L R e p o R t 2 0 1 9
n o t e s I C o n s o L I d a t e d f I n a n C I a L s t a t e M e n t s

(13) Equity-accounted investees
The following companies were incorporated into the Hapag-Lloyd Group using the equity method
as at 31 December 2019.
Name of the company Registered office
Proportion of ownership in the Group (in %)
2019 2018
Joint venture
Consorcio Naviero Peruano S.A.1 San Isidro 47.93 47.93
Texas Stevedoring Services LLC3 Wilmington 50.00 50.00
Associated companies
Hapag-Lloyd Lanka (Pvt) Ltd1 Colombo 40.00 40.00
HHLA Container Terminal Altenwerder GmbH2 Hamburg 25.10 25.10
United Arab Shipping Agency Company (Thailand) Ltd.1 Bangkok 49.00 49.00
Djibouti Container Services FZCO1 Djibouti 19.06 19.06
1 Ship agents and local liner shipping companies2 Container terminals3 Service company at the container terminal
The Hapag-Lloyd Group exerts significant control over Djibouti Container Services FZCO,
Djibouti, as its share of voting rights in the group is 21.25%.
Proportionate cumulative losses for equity-accounted joint ventures of EUR 0.5 million
(previous year: EUR –2.6 million) were not taken into consideration in the financial year.
No impairment losses are included in the proportionate equity result.
HHLA Container Terminal Altenwerder GmbH provides terminal services for the Hapag-Lloyd
Group. Financial information for this significant equity-accounted investee reported in the
statement of financial position (100% values and therefore not adjusted to the percentage held)
is contained in the following table:
210
H a p a g - L L o y d a g I a n n u a L R e p o R t 2 0 1 9
C o n s o L I d a t e d f I n a n C I a L s t a t e M e n t s I n o t e s
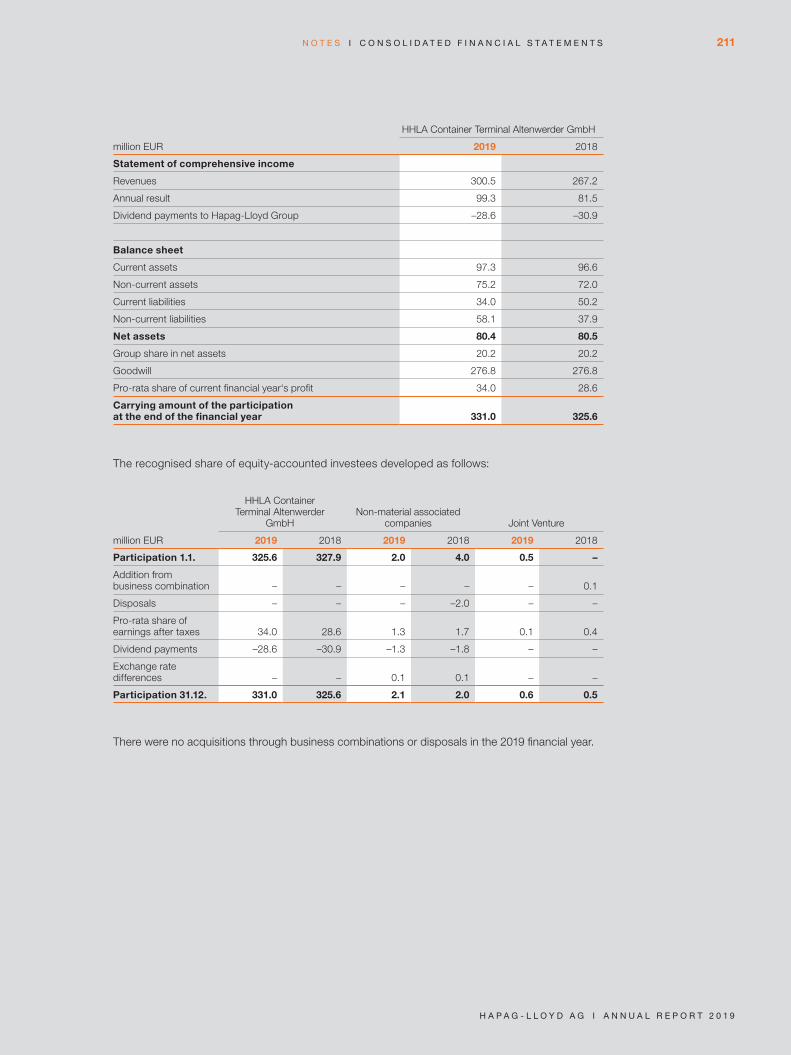
million EUR
HHLA Container Terminal Altenwerder GmbH
2019 2018
Statement of comprehensive income
Revenues 300.5 267.2
Annual result 99.3 81.5
Dividend payments to Hapag-Lloyd Group –28.6 –30.9
Balance sheet
Current assets 97.3 96.6
Non-current assets 75.2 72.0
Current liabilities 34.0 50.2
Non-current liabilities 58.1 37.9
Net assets 80.4 80.5
Group share in net assets 20.2 20.2
Goodwill 276.8 276.8
Pro-rata share of current financial year‘s profit 34.0 28.6
Carrying amount of the participation at the end of the financial year 331.0 325.6
The recognised share of equity-accounted investees developed as follows:
million EUR
HHLA Container Terminal Altenwerder
GmbHNon-material associated
companies Joint Venture
2019 2018 2019 2018 2019 2018
Participation 1.1. 325.6 327.9 2.0 4.0 0.5 –
Addition from business combination – – – – – 0.1
Disposals – – – –2.0 – –
Pro-rata share of earnings after taxes 34.0 28.6 1.3 1.7 0.1 0.4
Dividend payments –28.6 –30.9 –1.3 –1.8 – –
Exchange rate differences – – 0.1 0.1 – –
Participation 31.12. 331.0 325.6 2.1 2.0 0.6 0.5
There were no acquisitions through business combinations or disposals in the 2019 financial year.
211
H a p a g - L L o y d a g I a n n u a L R e p o R t 2 0 1 9
n o t e s I C o n s o L I d a t e d f I n a n C I a L s t a t e M e n t s

(14) Trade accounts receivable and other assets
million EUR
31.12.2019 31.12.2018
Total
Remaining term more
than a year Total
Remaining term more
than a year
Financial assets
Trade accounts receivable 1,239.8 – 1,217.7 –
from third parties – – 1,217.7 –
Other assets 257.2 12.5 230.6 6.7
Available-for-sale financial assets 8.5 8.5 2.9 2.9
Receivables relating to offset or advanced payments 146.8 – 139.3 –
Receivables from other financial assets 5.1 2.7 0.7 0.1
Receivables from deposits and prepayments 15.5 1.0 12.8 3.6
Cash securities – – 6.4 –
Other assets 81.3 0.3 68.5 0.1
Total 1,497.0 12.5 1,448.3 6.7
Non-financial assets
Other assets 113.4 11.2 80.7 3.8
Claims arising from the refund of other taxes 61.1 0.7 49.1 0.9
Commitment fees for loans 7.8 3.4 3.0 1.2
Prepaid expenses 27.4 0.3 17.8 0.8
Other assets 17.1 6.8 10.8 0.9
Total 113.4 11.2 80.7 3.8
As at 31 December 2019, in relation to ship financing there were assignments on earnings of a
type customary on the market for trade accounts receivable resulting from revenue.
In addition to this, trade accounts receivable were pledged as part of the programme to securi-
tise receivables. These kinds of receivables are not derecognised by the Group, but are held
according to the business model in order to collect contractual cash flows (held to collect).
Credit risks
The gross carrying amounts of trade account receivables and other financial assets that fall
within the scope of impairments under IFRS 9 amounted to EUR 1,517.4 million as of December
31, 2019 (December 31, 2018: EUR 1,477.0 million) and are mostly exposed to low or medium
credit risk. As of the reporting date, gross carrying amounts of EUR 123,4 million (December 31,
2018: EUR 125.9 million) were credit-impaired or exposed to high credit risk. EUR 282.4 million
of the gross carrying amounts (December 31, 2018: EUR 281.8 million) were collateral backed.
212
H a p a g - L L o y d a g I a n n u a L R e p o R t 2 0 1 9
C o n s o L I d a t e d f I n a n C I a L s t a t e M e n t s I n o t e s
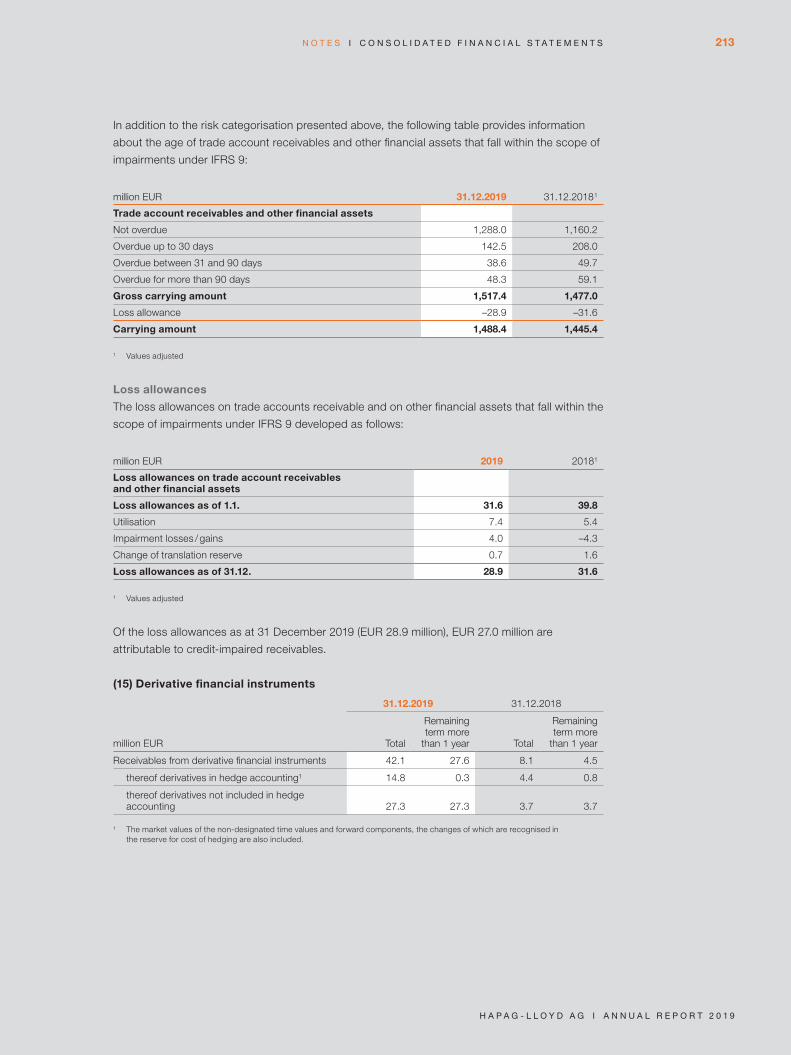
In addition to the risk categorisation presented above, the following table provides information
about the age of trade account receivables and other financial assets that fall within the scope of
impairments under IFRS 9:
million EUR 31.12.2019 31.12.2018
1
Trade account receivables and other financial assets
Not overdue 1,288.0 1,160.2
Overdue up to 30 days 142.5 208.0
Overdue between 31 and 90 days 38.6 49.7
Overdue for more than 90 days 48.3 59.1
Gross carrying amount 1,517.4 1,477.0
Loss allowance –28.9 –31.6
Carrying amount 1,488.4 1,445.4
1 Values adjusted
Loss allowances
The loss allowances on trade accounts receivable and on other financial assets that fall within the
scope of impairments under IFRS 9 developed as follows:
million EUR 2019 20181
Loss allowances on trade account receivables and other financial assets
Loss allowances as of 1.1. 31.6 39.8
Utilisation 7.4 5.4
Impairment losses / gains 4.0 –4.3
Change of translation reserve 0.7 1.6
Loss allowances as of 31.12. 28.9 31.6
1 Values adjusted
Of the loss allowances as at 31 December 2019 (EUR 28.9 million), EUR 27.0 million are
attributable to credit-impaired receivables.
(15) Derivative financial instruments
million EUR
31.12.2019 31.12.2018
Total
Remaining term more
than 1 year Total
Remaining term more
than 1 year
Receivables from derivative financial instruments 42.1 27.6 8.1 4.5
thereof derivatives in hedge accounting1 14.8 0.3 4.4 0.8
thereof derivatives not included in hedge accounting 27.3 27.3 3.7 3.7
1 The market values of the non-designated time values and forward components, the changes of which are recognised in the reserve for cost of hedging are also included.
213
H a p a g - L L o y d a g I a n n u a L R e p o R t 2 0 1 9
n o t e s I C o n s o L I d a t e d f I n a n C I a L s t a t e M e n t s

Derivative financial instruments are shown at fair value (market value). They serve to hedge
both the future operating business and the currency risks and interest rate risks in the area of
financing. This item also contains embedded derivatives in the form of buy-back options for
issued bonds. A detailed presentation of the derivative financial instruments is contained in the
explanatory note on financial instruments (Note (27)).
(16) Inventories
The inventories were as follows:
million EUR 31.12.2019 31.12.2018
Raw materials and supplies 247.2 236.5
Prepayments 1.3 1.6
Total 248.5 238.1
Raw materials, consumables and supplies primarily comprised fuel inventories, which fell from
EUR 233.8 million in the previous year to EUR 233.0 million.
Expenses of EUR 1,625.6 million for fuels were recognised in the reporting period (previous year:
EUR 1,585.3 million). Impairments for fuel inventories in the amount of EUR 0.5 million were also
recognised as expenses in the financial year (previous year: EUR 28.0 million). No write-backs
were recognised.
The carrying amount of inventories recognised at net realisable value comes to EUR 123.8 million
(previous year: EUR 99.3 million).
(17) Cash and cash equivalents
million EUR 31.12.2019 31.12.2018
Cash at bank 490.6 638.3
Cash in hand and cheques 21.0 18.8
Total 511.6 657.1
As at 31 December 2019, a sum totalling EUR 10.0 million with a term of up to 3 months was
deposited in pledged accounts (31 December 2018: EUR 11.1 million) and was therefore subject
to a limitation on disposal.
Due to local restrictions, the Hapag-Lloyd Group has limited access to cash and cash equiva-
lents of EUR 2.3 million (previous year: EUR 4.4 million) at individual subsidiaries.
(18) Subscribed capital and capital reserves
As at 31 December 2019, Hapag-Lloyd AG’s subscribed capital was divided into 175.8 million
no-par registered shares with equal rights, as in the previous year. As in the previous year, each
individual share represents EUR 1.00 of the share capital.
214
H a p a g - L L o y d a g I a n n u a L R e p o R t 2 0 1 9
C o n s o L I d a t e d f I n a n C I a L s t a t e M e n t s I n o t e s
Authorised capital
The Executive Board is authorised, subject to the approval of the Supervisory Board, to increase
the Company’s share capital by up to EUR 23.0 million in the period to 30 April 2022 by issuing
up to 23 million new no-par registered shares in exchange for cash and / or non-cash contribu-
tions (Authorised Share Capital 2017). As a general rule, subscription rights must be granted
to the shareholders. The new shares can also be taken up by one or more banks, with the obli-
gation to offer them to the shareholders for subscription. Under certain circumstances and sub-
ject to the approval of the Supervisory Board, the Executive Board is authorised to exclude the
subscription rights of the shareholders in order to exclude fractional amounts from the subscrip-
tion right.
The Authorised Share Capital still amounted to EUR 11.3 million as at 31 December 2019
following partial utilisation.
(19) Retained earnings
Retained earnings essentially comprise earnings from the financial year and previous years as
well as reclassifications from the capital reserves. In the previous financial years, a total of
EUR 1,682.3 million was withdrawn from the capital reserves in the individual financial statements
under German commercial law and reclassified accordingly in the consolidated financial state-
ments as retained earnings.
Dividend distribution 2019
On 17 June 2019, a dividend of EUR 0.15 per dividend-eligible individual share was paid out to
the shareholders of Hapag-Lloyd AG, amounting to a total payment of EUR 26.4 million.
Use of retained earnings
In accordance with the German Stock Corporation Act (AktG), the Annual General Meeting
passes resolutions regarding use of the retained earnings reported in the annual financial state-
ments prepared according to the German Commercial Code. Taking into account retained earn-
ings of EUR 208.8 million carried forward from 2018, the annual financial statements of Hapag-
Lloyd AG reported retained earnings of EUR 431.7 million. A proposal will be made at the Annual
General Meeting that the retained earnings of EUR 431.7 million be used to pay a dividend of
EUR 1.10 per dividend-eligible share and that the retained earnings of EUR 238.4 million remain-
ing after the distribution totalling EUR 193.3 million be carried forward to the subsequent year.
(20) Cumulative other equity
Changes in the value of the financial liability are subsequently recognised through profit or loss
in the interest result.
The reserve for remeasurements from defined benefit pension plans (31 December 2019:
EUR -173.3 million; 31 December 2018: EUR –112.6 million) contains gains and losses from the
remeasurement of pension obligations and plan assets recognised cumulatively in other compre-
hensive income, among other things due to the change in actuarial and financial para meters in
connection with the measurement of pension obligations and the associated fund assets. The
effect of remeasuring pension obligations and the associated plan assets recognised in other
comprehensive income in the 2019 financial year resulted in an increase of EUR 60.8 million in
the negative reserve (prior year period: decrease of EUR 6.2 million).
215
H a p a g - L L o y d a g I a n n u a L R e p o R t 2 0 1 9
n o t e s I C o n s o L I d a t e d f I n a n C I a L s t a t e M e n t s

The reserve for cash flow hedges contains changes in the intrinsic value and in the cash com-
ponent from hedging transactions that are recognised in other comprehensive income and
amounted to - EUR 14.0 million as at 31 December 2019 (31 December 2018: EUR –0.8 million).
In the 2019 financial year, the resulting gains and losses totalling EUR -31.7 million were recog-
nised in other comprehensive income as an effective part of the hedging relationship (prior year
period: EUR –38.5 million), while gains and losses of EUR 18.5 million (prior year period:
EUR 52.9 million) were reclassified and recognised through profit or loss.
The reserve hedging costs contains changes in the time value and in the forward component
from hedging transactions that are recognised in other comprehensive income and amounted
to EUR -10.2 million as at 31 December 2019 (31 December 2018: EUR –7.7 million). In the
2019 financial year, the resulting gains and losses totalling EUR -40.9 million were recognised
in other comprehensive income (previous year: EUR –47.3 million), while gains and losses of
EUR 27.0 million (previous year: EUR 29.4 million) were reclassified and recognised through
profit or loss.
The translation reserve of EUR 560.5 million (31 December 2018: EUR 439.7 million) includes
differences from currency translation. The differences from currency translation of EUR 121.2
million recognised in other comprehensive income in the 2019 financial year (previous year:
EUR 272.2 million) were due to the translation of the financial statements of Hapag-Lloyd AG and
its subsidiaries into the reporting currency. Currency translation differences are recognised in the
statement of comprehensive income under the items that are not reclassified and recognised
through profit or loss, because the currency translation effects of subsidiaries with the same
functional currency as the parent company cannot be recycled.
The difference between the relevant non-controlling interests and the expected purchase price
at the time the put option was entered is recognised in the reserve for put options on non-con-
trolling interests. Changes in the value of the financial liability are subsequently recognised
through profit or loss in the interest result. As at 31 December 2019, the reserve for put options
on non-controlling interests amounted to EUR -0.5 million and was therefore the same as at
year-end 2018.
(21) Non-controlling interests
The non-controlling interests within the Hapag-Lloyd Group are not material from a quantitative
or qualitative perspective. There were no material changes in non-controlling interests in the
2019 financial year.
216
H a p a g - L L o y d a g I a n n u a L R e p o R t 2 0 1 9
C o n s o L I d a t e d f I n a n C I a L s t a t e M e n t s I n o t e s
(22) Provisions for pensions and similar obligations
Defined benefit pension plans
Hapag-Lloyd AG maintains domestic and foreign defined benefit pension plans.
Provisions for domestic benefit obligations and similar obligations are primarily made due to
benefit commitments for pensions, survivorship annuities and disability benefits. The amount of
the benefit depends on which benefit group the employees belong to based on years of service,
and therefore on the total number of years of service. The monthly pension payable corresponds
to the balance of the benefit account of the employee when pension payments begin. The bal-
ance of the benefit account is zero when employment begins. It increases by the increment set
for the benefit group for every year of eligible service. After the 25th year of service, the annual
amount increases by a fifth of the increment applicable to the benefit group. There is no obliga-
tion for employees to participate in the pension plan by way of paying contributions.
Furthermore, there are individually agreed pension commitments with entitlements to pension,
survivorship annuity and disability benefits, the amount of which is specified in the corresponding
agreements. A small number of people also have the option of forgoing their bonuses in favour
of a company pension.
Pension commitments are provided to former Executive Board members based on a separate
defined benefit plan. These also include entitlements to pension, survivorship annuity and dis-
ability benefits, the amount of which is based on an individually specified percentage of the pen-
sionable emoluments. In some cases, they are also secured by plan assets in the form of reinsur-
ance policies. Active Executive Board members do not receive any commitments for a company
pension, with one exception. For one Executive Board member, there is a commitment for pen-
sion, survivorship annuity and disability benefits, the amount of which is determined by a fixed
amount. Retirement benefits are paid out in the form of monthly pension payments.
Foreign defined benefit pension plans primarily relate to plans in the United Kingdom, the Nether-
lands and Mexico. These likewise include entitlements to pension, survivorship annuity and disa-
bility benefits. The amount of the benefits corresponds to a defined percentage together with the
eligible years of service and emoluments. The net income generated from the amounts paid in
is also taken into account. Plan assets exist for these plans. Contributions to the foreign plans
are paid by Hapag-Lloyd and its employees. In Mexico, the contributions are paid solely by the
employer. Benefits abroad are usually paid out in the form of monthly pension payments. How-
ever, in Mexico employees have the option of choosing between ongoing pension payments and
one-time payments. The additional employee benefits mainly comprise statutory claims for
employee termination benefits.
The Company is exposed to a variety of risks associated with defined benefit pension plans.
Aside from general actuarial and financial risks such as longevity risks and interest rate risks,
the Company is exposed to currency risk and investment / capital market risk.
217
H a p a g - L L o y d a g I a n n u a L R e p o R t 2 0 1 9
n o t e s I C o n s o L I d a t e d f I n a n C I a L s t a t e M e n t s
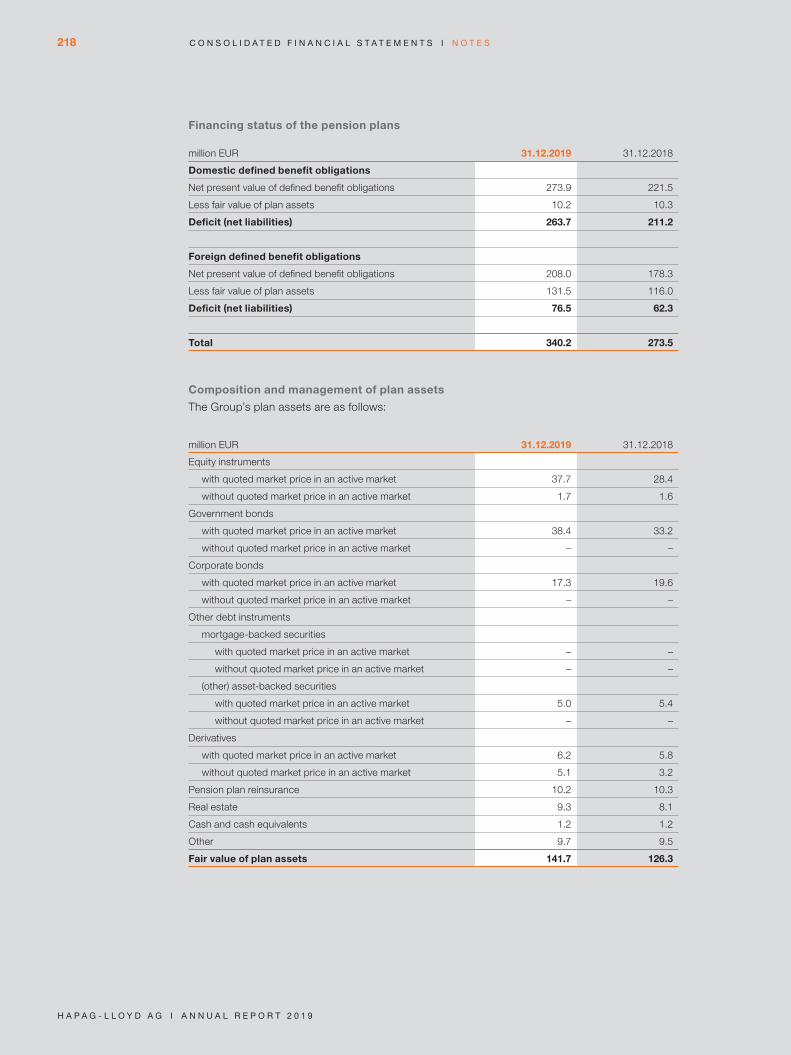
Financing status of the pension plans
million EUR 31.12.2019 31.12.2018
Domestic defined benefit obligations
Net present value of defined benefit obligations 273.9 221.5
Less fair value of plan assets 10.2 10.3
Deficit (net liabilities) 263.7 211.2
Foreign defined benefit obligations
Net present value of defined benefit obligations 208.0 178.3
Less fair value of plan assets 131.5 116.0
Deficit (net liabilities) 76.5 62.3
Total 340.2 273.5
Composition and management of plan assets
The Group’s plan assets are as follows:
million EUR 31.12.2019 31.12.2018
Equity instruments
with quoted market price in an active market 37.7 28.4
without quoted market price in an active market 1.7 1.6
Government bonds
with quoted market price in an active market 38.4 33.2
without quoted market price in an active market – –
Corporate bonds
with quoted market price in an active market 17.3 19.6
without quoted market price in an active market – –
Other debt instruments
mortgage-backed securities
with quoted market price in an active market – –
without quoted market price in an active market – –
(other) asset-backed securities
with quoted market price in an active market 5.0 5.4
without quoted market price in an active market – –
Derivatives
with quoted market price in an active market 6.2 5.8
without quoted market price in an active market 5.1 3.2
Pension plan reinsurance 10.2 10.3
Real estate 9.3 8.1
Cash and cash equivalents 1.2 1.2
Other 9.7 9.5
Fair value of plan assets 141.7 126.3
218
H a p a g - L L o y d a g I a n n u a L R e p o R t 2 0 1 9
C o n s o L I d a t e d f I n a n C I a L s t a t e M e n t s I n o t e s

The plan assets have been entrusted to independent external financial service providers for
investment and management. The plan assets contain neither the Group’s own financial
instruments nor real estate used by the Group itself. All bonds in the plan assets had a rating
of at least AA as at the balance sheet date.
Committees (trustees) exist in the United Kingdom and Mexico to manage the foreign plan
assets; these consist of plan participants and representatives of Hapag-Lloyd management.
When plan assets are invested in these countries, legally independent financial service providers
are called in to provide advice and support. They make a capital investment proposal to the
respective committee, complete with risk and success scenarios. The committee is then re -
sponsible for taking the investment decision in close consultation with Hapag-Lloyd AG; their
decisions tally with their respective investment strategy. The investment strategy first and fore-
most focuses on reducing the interest rate risk and on safeguarding liquidity and optimising
returns. To this end, the anticipated pension payments, which will be incurred in a specific time
frame, are aligned with the maturity of the capital investments. In the case of maturities from 8
to 12 years, low-risk investment forms are chosen, e.g. fixed-interest or index-linked government
and corporate bonds. For any other obligations falling due, investments are made in forms with
a higher risk, but which have a greater expected return.
In the Netherlands, an independent financial service provider is responsible both for managing
the plan assets and for deciding how to invest them.
The financing conditions in the United Kingdom are set by the regulatory body for pensions
together with the corresponding laws and regulations. Accordingly, a valuation is carried out
in line with local regulations every 3 years, which usually leads to a greater obligation compared
to measurement pursuant to IAS 19. Based on the most recent technical valuation, the defined
benefit plan in the United Kingdom has a financing deficit. The Company and trustees have
agreed on a plan to reduce the deficit, which includes additional annual payments for a limited
period.
219
H a p a g - L L o y d a g I a n n u a L R e p o R t 2 0 1 9
n o t e s I C o n s o L I d a t e d f I n a n C I a L s t a t e M e n t s
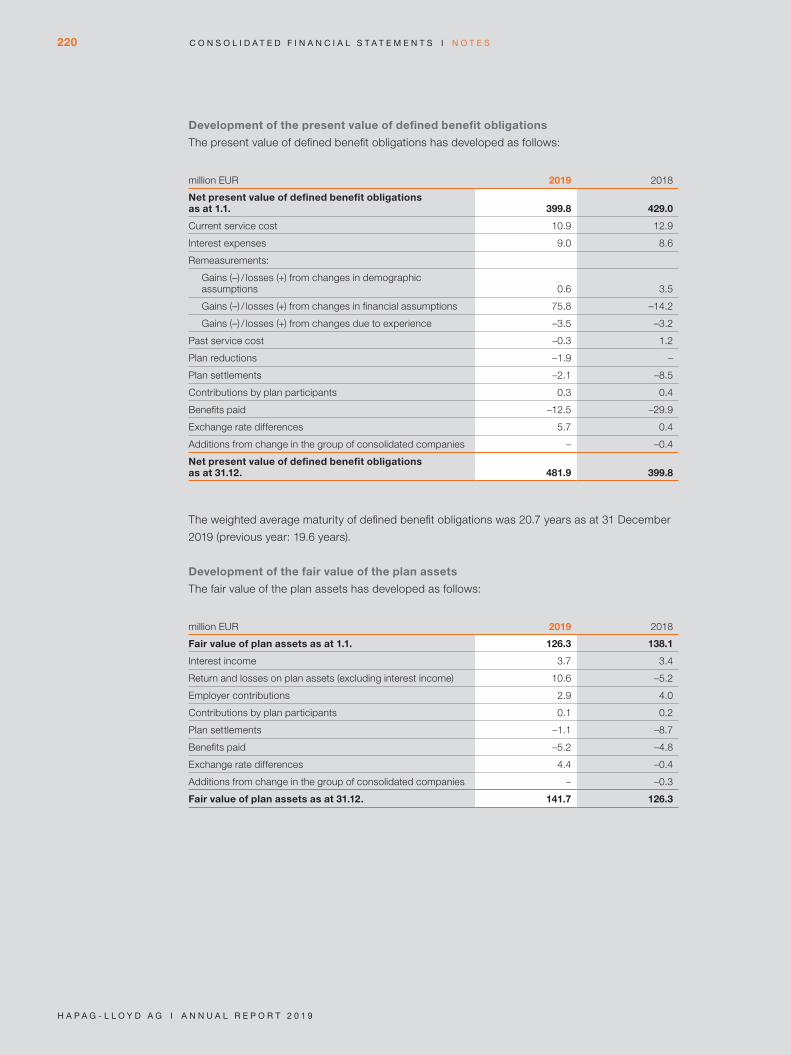
Development of the present value of defined benefit obligations
The present value of defined benefit obligations has developed as follows:
million EUR 2019 2018
Net present value of defined benefit obligations as at 1.1. 399.8 429.0
Current service cost 10.9 12.9
Interest expenses 9.0 8.6
Remeasurements:
Gains (–) / losses (+) from changes in demographic assumptions 0.6 3.5
Gains (–) / losses (+) from changes in financial assumptions 75.8 –14.2
Gains (–) / losses (+) from changes due to experience –3.5 –3.2
Past service cost –0.3 1.2
Plan reductions –1.9 –
Plan settlements –2.1 –8.5
Contributions by plan participants 0.3 0.4
Benefits paid –12.5 –29.9
Exchange rate differences 5.7 0.4
Additions from change in the group of consolidated companies – –0.4
Net present value of defined benefit obligations as at 31.12. 481.9 399.8
The weighted average maturity of defined benefit obligations was 20.7 years as at 31 December
2019 (previous year: 19.6 years).
Development of the fair value of the plan assets
The fair value of the plan assets has developed as follows:
million EUR 2019 2018
Fair value of plan assets as at 1.1. 126.3 138.1
Interest income 3.7 3.4
Return and losses on plan assets (excluding interest income) 10.6 –5.2
Employer contributions 2.9 4.0
Contributions by plan participants 0.1 0.2
Plan settlements –1.1 –8.7
Benefits paid –5.2 –4.8
Exchange rate differences 4.4 –0.4
Additions from change in the group of consolidated companies – –0.3
Fair value of plan assets as at 31.12. 141.7 126.3
220
H a p a g - L L o y d a g I a n n u a L R e p o R t 2 0 1 9
C o n s o L I d a t e d f I n a n C I a L s t a t e M e n t s I n o t e s
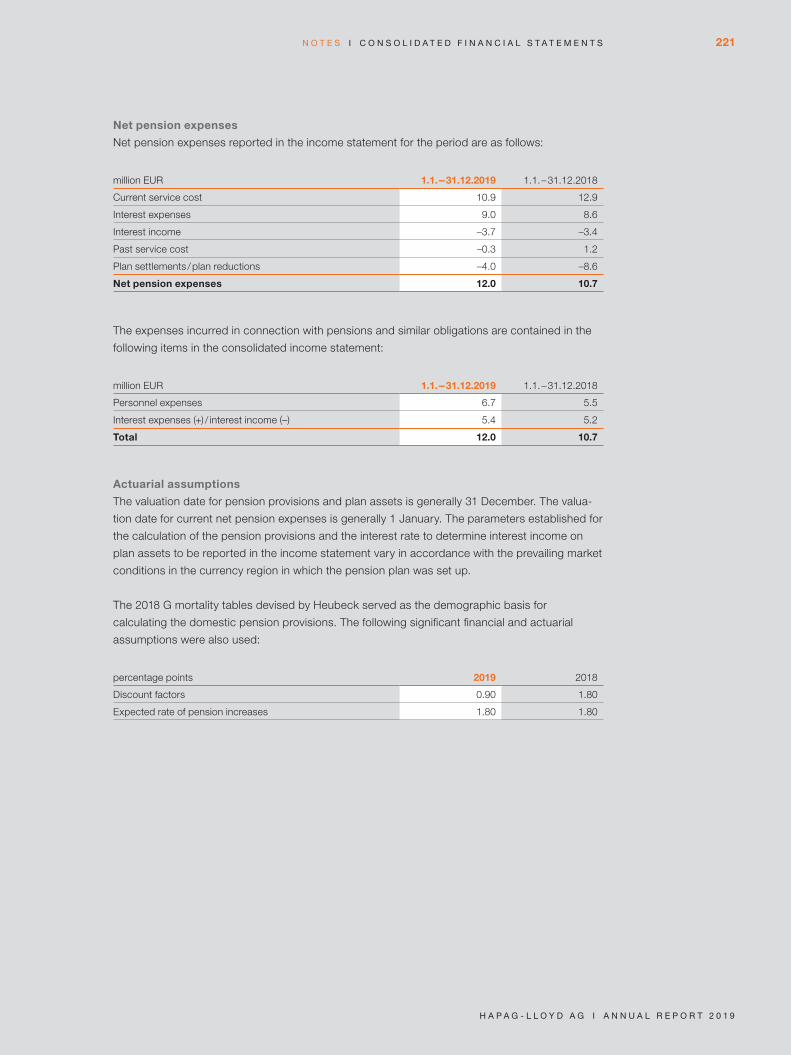
Net pension expenses
Net pension expenses reported in the income statement for the period are as follows:
million EUR 1.1.-31.12.2019 1.1.-31.12.2018
Current service cost 10.9 12.9
Interest expenses 9.0 8.6
Interest income –3.7 –3.4
Past service cost –0.3 1.2
Plan settlements / plan reductions –4.0 –8.6
Net pension expenses 12.0 10.7
The expenses incurred in connection with pensions and similar obligations are contained in the
following items in the consolidated income statement:
million EUR 1.1.-31.12.2019 1.1.-31.12.2018
Personnel expenses 6.7 5.5
Interest expenses (+) / interest income (–) 5.4 5.2
Total 12.0 10.7
Actuarial assumptions
The valuation date for pension provisions and plan assets is generally 31 December. The valua-
tion date for current net pension expenses is generally 1 January. The parameters established for
the calculation of the pension provisions and the interest rate to determine interest income on
plan assets to be reported in the income statement vary in accordance with the prevailing market
conditions in the currency region in which the pension plan was set up.
The 2018 G mortality tables devised by Heubeck served as the demographic basis for
calculating the domestic pension provisions. The following significant financial and actuarial
assumptions were also used:
percentage points 2019 2018
Discount factors 0.90 1.80
Expected rate of pension increases 1.80 1.80
221
H a p a g - L L o y d a g I a n n u a L R e p o R t 2 0 1 9
n o t e s I C o n s o L I d a t e d f I n a n C I a L s t a t e M e n t s
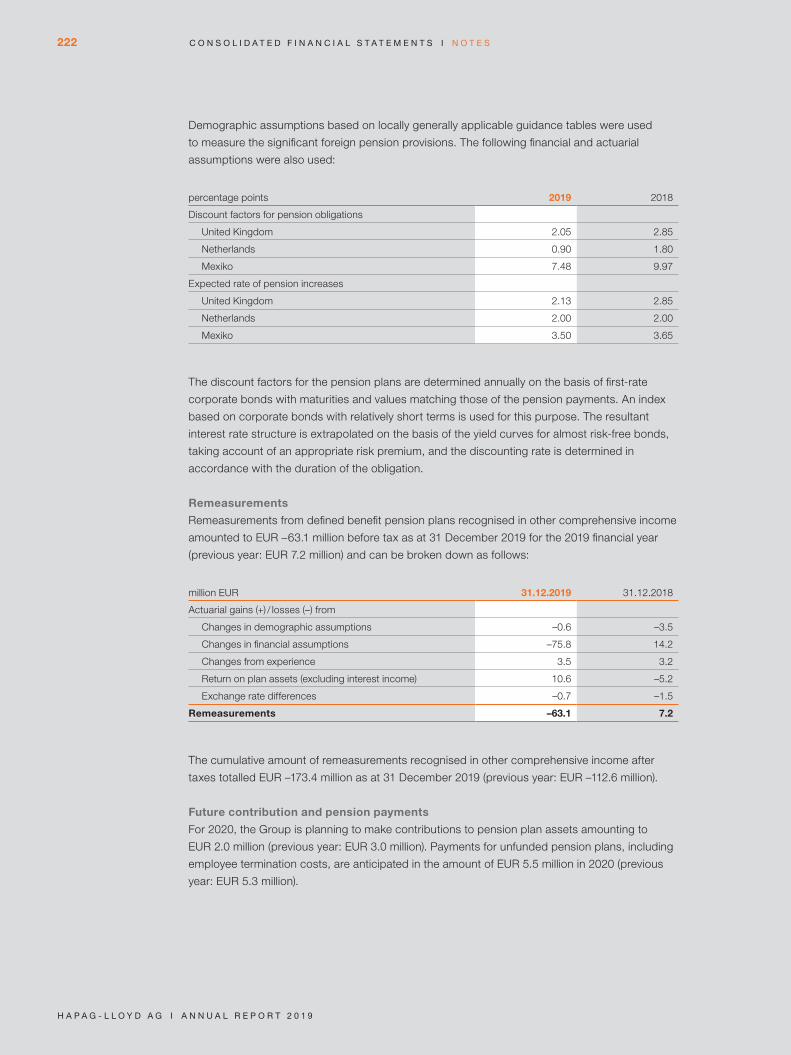
Demographic assumptions based on locally generally applicable guidance tables were used
to measure the significant foreign pension provisions. The following financial and actuarial
assumptions were also used:
percentage points 2019 2018
Discount factors for pension obligations
United Kingdom 2.05 2.85
Netherlands 0.90 1.80
Mexiko 7.48 9.97
Expected rate of pension increases
United Kingdom 2.13 2.85
Netherlands 2.00 2.00
Mexiko 3.50 3.65
The discount factors for the pension plans are determined annually on the basis of first-rate
corporate bonds with maturities and values matching those of the pension payments. An index
based on corporate bonds with relatively short terms is used for this purpose. The resultant
interest rate structure is extrapolated on the basis of the yield curves for almost risk-free bonds,
taking account of an appropriate risk premium, and the discounting rate is determined in
accordance with the duration of the obligation.
Remeasurements
Remeasurements from defined benefit pension plans recognised in other comprehensive income
amounted to EUR –63.1 million before tax as at 31 December 2019 for the 2019 financial year
(previous year: EUR 7.2 million) and can be broken down as follows:
million EUR 31.12.2019 31.12.2018
Actuarial gains (+) / losses (–) from
Changes in demographic assumptions –0.6 –3.5
Changes in financial assumptions –75.8 14.2
Changes from experience 3.5 3.2
Return on plan assets (excluding interest income) 10.6 –5.2
Exchange rate differences –0.7 –1.5
Remeasurements –63.1 7.2
The cumulative amount of remeasurements recognised in other comprehensive income after
taxes totalled EUR –173.4 million as at 31 December 2019 (previous year: EUR –112.6 million).
Future contribution and pension payments
For 2020, the Group is planning to make contributions to pension plan assets amounting to
EUR 2.0 million (previous year: EUR 3.0 million). Payments for unfunded pension plans, including
employee termination costs, are anticipated in the amount of EUR 5.5 million in 2020 (previous
year: EUR 5.3 million).
222
H a p a g - L L o y d a g I a n n u a L R e p o R t 2 0 1 9
C o n s o L I d a t e d f I n a n C I a L s t a t e M e n t s I n o t e s

Sensitivity analyses
An increase or decrease in the significant actuarial assumptions would have the following effects
on the present value of pension provisions as at 31 December 2019:
million EUR
∆ Present value ∆ Present value
31.12.2019 31.12.2018
Discount factor 0.8% points higher –69.4 –55.2
Discount factor 0.8% points lower 88.4 69.3
Expected rate of pension increase 0.2% higher 11.2 8.9
Expected rate of pension increase 0.2% lower –10.8 –8.6
Life expectancy 1 year longer 18.4 13.9
The sensitivity calculations are based on the average maturity of pension provisions determined
as at 31 December 2019. In order to present the effects on the present value of pension provi-
sions as at 31 December 2019 separately, the calculations for the key actuarial parameters were
performed individually. Correlations between the effects and valuation assumptions were not
considered either. Given that sensitivity analyses are based on the average duration of the antici-
pated pension provisions and, as a result, the expected payout date is not considered, they only
provide approximate information and indications of trends.
Defined contribution pension plans
At Hapag-Lloyd, the expenses for defined contribution pension plans relate predominantly to
the contributions to the statutory retirement pension system. In the period from 1 January to
31 December 2019, expenses incurred in connection with defined contribution pension plans
totalled EUR 27.8 million (previous year: EUR 28.1 million).
At Hapag-Lloyd exist two defined benefit multi-employer plans. These releate to a pension and
medical benefit plan in the USA as well as the Merchant Navy Officer’s Pension Fund (MNOPF)
registered in the United Kingdom, which has been established worldwide for British merchant
navy officers.
As the joint pension plans do not provide sufficient and timely information regarding the
development of the entitlement of employees of the Group or the Group’s share in the plan
assets, these plans have been recognised as a contribution plans since then.
The two multi-employer pension plans are not material in the Hapag-Lloyd Group in quantitative
and qualitative terms.
223
H a p a g - L L o y d a g I a n n u a L R e p o R t 2 0 1 9
n o t e s I C o n s o L I d a t e d f I n a n C I a L s t a t e M e n t s
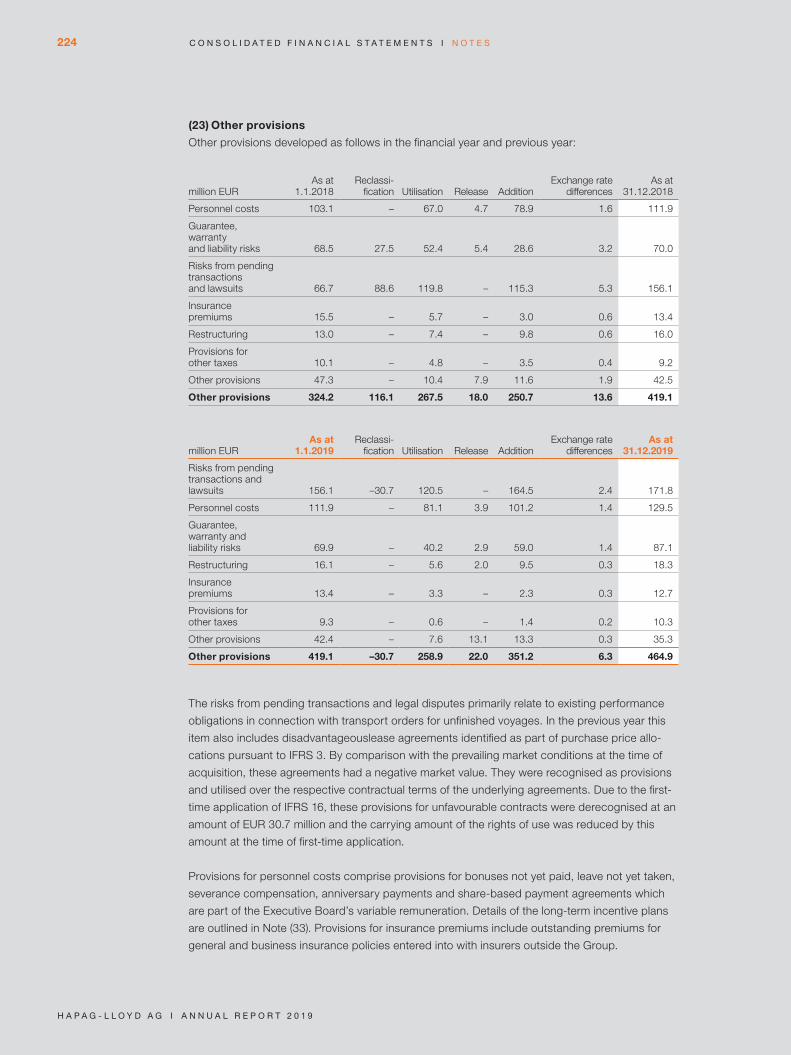
(23) Other provisions
Other provisions developed as follows in the financial year and previous year:
million EURAs at
1.1.2018Reclassi-
fication Utilisation Release AdditionExchange rate
differencesAs at
31.12.2018
Personnel costs 103.1 – 67.0 4.7 78.9 1.6 111.9
Guarantee, warranty and liability risks 68.5 27.5 52.4 5.4 28.6 3.2 70.0
Risks from pending transactions and lawsuits 66.7 88.6 119.8 – 115.3 5.3 156.1
Insurance premiums 15.5 – 5.7 – 3.0 0.6 13.4
Restructuring 13.0 – 7.4 – 9.8 0.6 16.0
Provisions for other taxes 10.1 – 4.8 – 3.5 0.4 9.2
Other provisions 47.3 – 10.4 7.9 11.6 1.9 42.5
Other provisions 324.2 116.1 267.5 18.0 250.7 13.6 419.1
million EURAs at
1.1.2019Reclassi-
fication Utilisation Release AdditionExchange rate
differencesAs at
31.12.2019
Risks from pending transactions and lawsuits 156.1 –30.7 120.5 – 164.5 2.4 171.8
Personnel costs 111.9 – 81.1 3.9 101.2 1.4 129.5
Guarantee, warranty and liability risks 69.9 – 40.2 2.9 59.0 1.4 87.1
Restructuring 16.1 – 5.6 2.0 9.5 0.3 18.3
Insurance premiums 13.4 – 3.3 – 2.3 0.3 12.7
Provisions for other taxes 9.3 – 0.6 – 1.4 0.2 10.3
Other provisions 42.4 – 7.6 13.1 13.3 0.3 35.3
Other provisions 419.1 –30.7 258.9 22.0 351.2 6.3 464.9
The risks from pending transactions and legal disputes primarily relate to existing performance
obligations in connection with transport orders for unfinished voyages. In the previous year this
item also includes disadvantageouslease agreements identified as part of purchase price allo-
cations pursuant to IFRS 3. By comparison with the prevailing market conditions at the time of
acquisition, these agreements had a negative market value. They were recognised as provisions
and utilised over the respective contractual terms of the underlying agreements. Due to the first-
time application of IFRS 16, these provisions for unfavourable contracts were derecognised at an
amount of EUR 30.7 million and the carrying amount of the rights of use was reduced by this
amount at the time of first-time application.
Provisions for personnel costs comprise provisions for bonuses not yet paid, leave not yet taken,
severance compensation, anniversary payments and share-based payment agreements which
are part of the Executive Board’s variable remuneration. Details of the long-term incentive plans
are outlined in Note (33). Provisions for insurance premiums include outstanding premiums for
general and business insurance policies entered into with insurers outside the Group.
224
H a p a g - L L o y d a g I a n n u a L R e p o R t 2 0 1 9
C o n s o L I d a t e d f I n a n C I a L s t a t e M e n t s I n o t e s
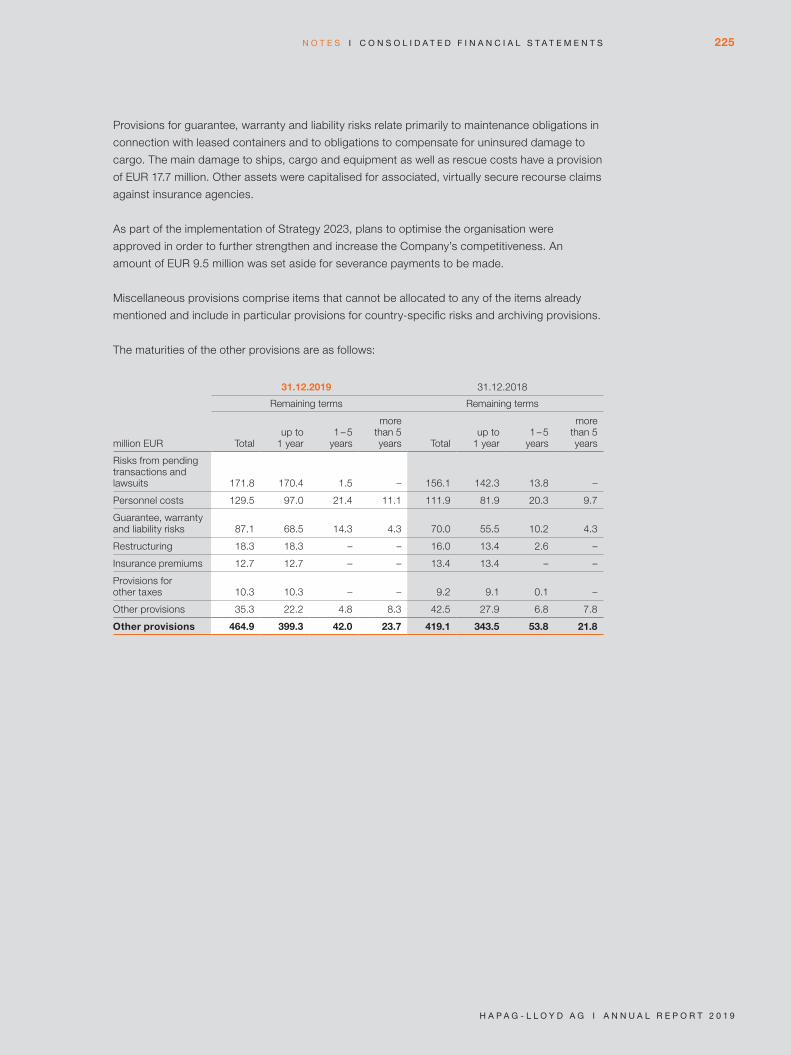
Provisions for guarantee, warranty and liability risks relate primarily to maintenance obligations in
connection with leased containers and to obligations to compensate for uninsured damage to
cargo. The main damage to ships, cargo and equipment as well as rescue costs have a provision
of EUR 17.7 million. Other assets were capitalised for associated, virtually secure recourse claims
against insurance agencies.
As part of the implementation of Strategy 2023, plans to optimise the organisation were
approved in order to further strengthen and increase the Company’s competitiveness. An
amount of EUR 9.5 million was set aside for severance payments to be made.
Miscellaneous provisions comprise items that cannot be allocated to any of the items already
mentioned and include in particular provisions for country-specific risks and archiving provisions.
The maturities of the other provisions are as follows:
million EUR
31.12.2019 31.12.2018
Remaining terms Remaining terms
Totalup to
1 year1 - 5
years
more than 5 years Total
up to 1 year
1 - 5 years
more than 5 years
Risks from pending transactions and lawsuits 171.8 170.4 1.5 – 156.1 142.3 13.8 –
Personnel costs 129.5 97.0 21.4 11.1 111.9 81.9 20.3 9.7
Guarantee, warranty and liability risks 87.1 68.5 14.3 4.3 70.0 55.5 10.2 4.3
Restructuring 18.3 18.3 – – 16.0 13.4 2.6 –
Insurance premiums 12.7 12.7 – – 13.4 13.4 – –
Provisions for other taxes 10.3 10.3 – – 9.2 9.1 0.1 –
Other provisions 35.3 22.2 4.8 8.3 42.5 27.9 6.8 7.8
Other provisions 464.9 399.3 42.0 23.7 419.1 343.5 53.8 21.8
225
H a p a g - L L o y d a g I a n n u a L R e p o R t 2 0 1 9
n o t e s I C o n s o L I d a t e d f I n a n C I a L s t a t e M e n t s
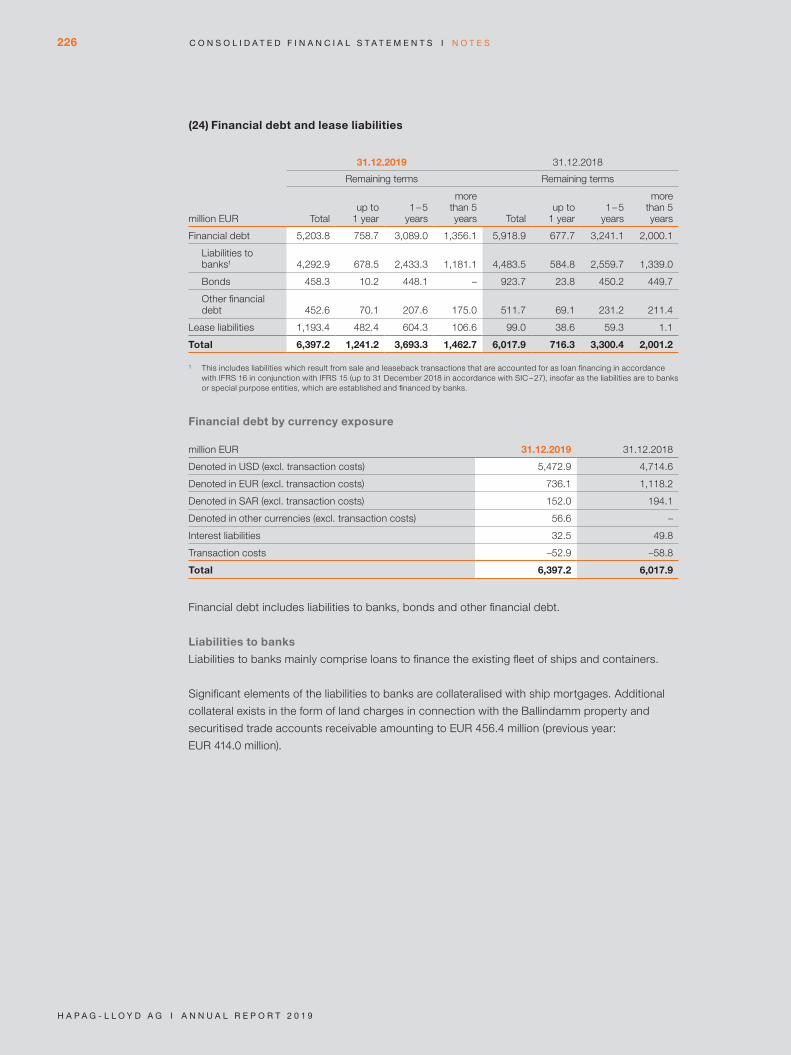
(24) Financial debt and lease liabilities
million EUR
31.12.2019 31.12.2018
Remaining terms Remaining terms
Totalup to
1 year 1-5 years
more than 5 years Total
up to 1 year
1-5 years
more than 5 years
Financial debt 5,203.8 758.7 3,089.0 1,356.1 5,918.9 677.7 3,241.1 2,000.1
Liabilities to banks1 4,292.9 678.5 2,433.3 1,181.1 4,483.5 584.8 2,559.7 1,339.0
Bonds 458.3 10.2 448.1 – 923.7 23.8 450.2 449.7
Other financial debt 452.6 70.1 207.6 175.0 511.7 69.1 231.2 211.4
Lease liabilities 1,193.4 482.4 604.3 106.6 99.0 38.6 59.3 1.1
Total 6,397.2 1,241.2 3,693.3 1,462.7 6,017.9 716.3 3,300.4 2,001.2
1 This includes liabilities which result from sale and leaseback transactions that are accounted for as loan financing in accordance with IFRS 16 in conjunction with IFRS 15 (up to 31 December 2018 in accordance with SIC-27), insofar as the liabilities are to banks or special purpose entities, which are established and financed by banks.
Financial debt by currency exposure
million EUR 31.12.2019 31.12.2018
Denoted in USD (excl. transaction costs) 5,472.9 4,714.6
Denoted in EUR (excl. transaction costs) 736.1 1,118.2
Denoted in SAR (excl. transaction costs) 152.0 194.1
Denoted in other currencies (excl. transaction costs) 56.6 –
Interest liabilities 32.5 49.8
Transaction costs –52.9 –58.8
Total 6,397.2 6,017.9
Financial debt includes liabilities to banks, bonds and other financial debt.
Liabilities to banks
Liabilities to banks mainly comprise loans to finance the existing fleet of ships and containers.
Significant elements of the liabilities to banks are collateralised with ship mortgages. Additional
collateral exists in the form of land charges in connection with the Ballindamm property and
securitised trade accounts receivable amounting to EUR 456.4 million (previous year:
EUR 414.0 million).
226
H a p a g - L L o y d a g I a n n u a L R e p o R t 2 0 1 9
C o n s o L I d a t e d f I n a n C I a L s t a t e M e n t s I n o t e s
In the 2019 financial year, Hapag-Lloyd conducted 7 container sale and leaseback transactions
to refinance investments in reefer and standard containers (Japanese operating leases [JOLs]).
The lease agreements include substantial purchase options that entitle Hapag-Lloyd to repur-
chase the containers after 7 years. As a result, the transactions are recognised as loan financing
in accordance with the provisions of IFRS 16 in conjunction with IFRS 15. The financing volume
has a total amount of EUR 290.9 million.
Furthermore, sale and leaseback transactions were conducted for the refinancing of 2 container
ships (Japanese operating leases [JOLs]). The lease agreements include substantial purchase
options that entitle Hapag-Lloyd to repurchase the container ships after 8 or 7.5 years, res-
pectively. The refinancing volume associated with these transactions has a total amount of
EUR 168.8 million. The loan liabilities of EUR 115.3 million previously associated with these
two ships were repaid in full.
These transactions are included in liabilities to banks, as the liabilities are to special purpose
entities, which are established and financed by banks.
Overall, transactions of this kind resulted in liabilities to banks totalling EUR 1,293.7 million
as at the reporting date (previous year: EUR 933.3 million) and other financial debt totalling
EUR 443.3 million (previous year: EUR 501.4 million). Interest totalling EUR 75.6 million was
recognised in interest expenses in the 2019 financial year (previous year: EUR 54.2 million).
Bonds
On 31 January 2019, the Executive Board of Hapag-Lloyd AG decided to conduct an early partial
repayment of EUR 170.0 million of its bond due in 2022. On 14 June 2019, the Board resolved to
completely repay the bond, with a remaining amount of EUR 280.0 million. Both the partial epay-
ment made on 11 February 2019 and the repayment of the residual amount made on 24 June
2019 occurred at a repayment rate of 103.375%. The bond was issued in February 2017 with a
nominal value of EUR 450.0 million and a coupon of 6.75%.
Lease liability
Descriptions relating to lease liabilities in the Hapag Lloyd Group are included in chapter
“New accounting standards”.
Credit facilities
The Hapag-Lloyd Group had total available credit facilities of EUR 521.3 million as at
31 December 2019 (31 December 2018: EUR 475.9 million).
227
H a p a g - L L o y d a g I a n n u a L R e p o R t 2 0 1 9
n o t e s I C o n s o L I d a t e d f I n a n C I a L s t a t e M e n t s
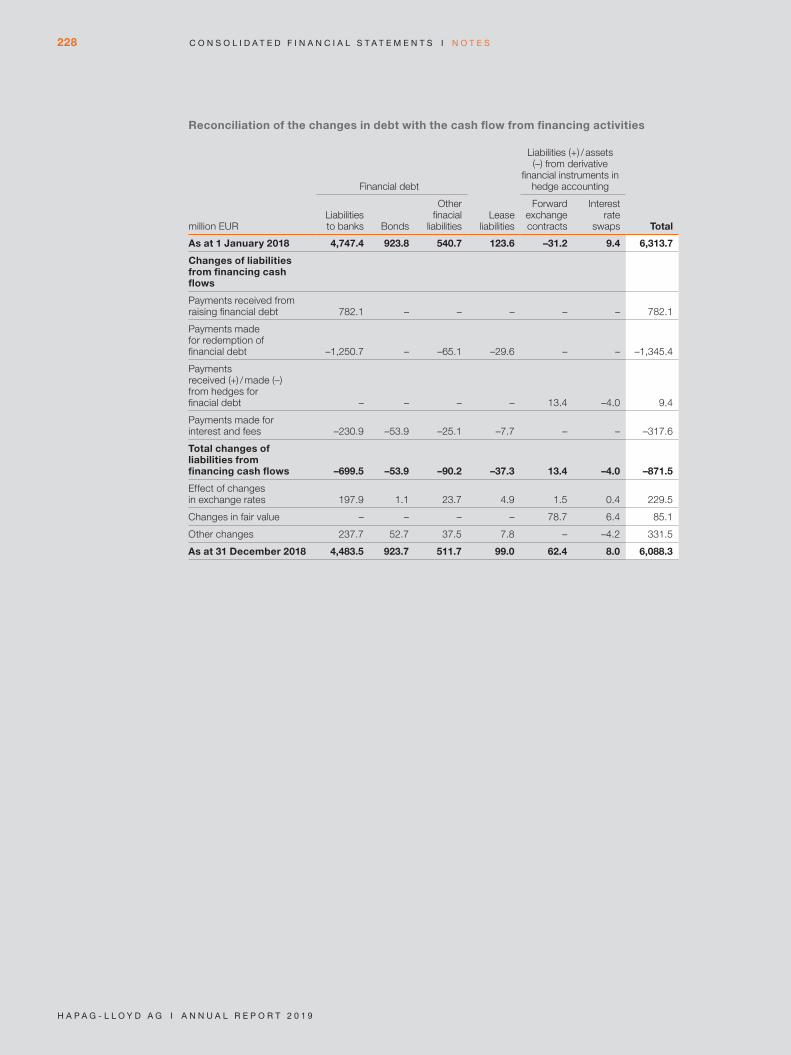
Reconciliation of the changes in debt with the cash flow from financing activities
million EUR
Financial debt
Lease liabilities
Liabilities (+) / assets (–) from derivative
financial instruments in hedge accounting
TotalLiabilities to banks Bonds
Other finacial
liabilities
Forward exchange contracts
Interest rate
swaps
As at 1 January 2018 4,747.4 923.8 540.7 123.6 –31.2 9.4 6,313.7
Changes of liabilities from financing cash flows
Payments received from raising financial debt 782.1 – – – – – 782.1
Payments made for redemption of financial debt –1,250.7 – –65.1 –29.6 – – –1,345.4
Payments received (+) / made (–) from hedges for finacial debt – – – – 13.4 –4.0 9.4
Payments made for interest and fees –230.9 –53.9 –25.1 –7.7 – – –317.6
Total changes of liabilities from financing cash flows –699.5 –53.9 –90.2 –37.3 13.4 –4.0 –871.5
Effect of changes in exchange rates 197.9 1.1 23.7 4.9 1.5 0.4 229.5
Changes in fair value – – – – 78.7 6.4 85.1
Other changes 237.7 52.7 37.5 7.8 – –4.2 331.5
As at 31 December 2018 4,483.5 923.7 511.7 99.0 62.4 8.0 6,088.3
228
H a p a g - L L o y d a g I a n n u a L R e p o R t 2 0 1 9
C o n s o L I d a t e d f I n a n C I a L s t a t e M e n t s I n o t e s

million EUR
Financial debt
Lease liabilities
Liabilities (+) / assets (–) from derivate
financial instruments in hedge accounting
TotalLiabilities to banks Bonds
Other finacial
liabilities
Foward exchange contracts
Inetrest rate
swaps
As at 1 January 2019 4,483.5 923.7 511.7 99.0 62.4 8.0 6,088.3
First-time application of IFRS 16 – – – 947.6 – – 947.6
Adjusted as at 1 January 2019 4,483.5 923.7 511.7 1,046.6 62.4 8.0 7,035.9
Changes of liabilities from financing cash flows
Payments received from raising financial debt 924.3 – – – – – 924.3
Payments made for redemption of financial debt –1,206.3 –456.8 –70.2 – – – –1,733.2
Payments made for redemption of lease liabilities – – – –456.7 – – –456.7
Payments received (+) / made (–) from hedges for finacial debt – – – – –98.4 –5.3 –103.7
Payments made for interest and fees –234.5 –62.3 –27.7 –72.6 – – –397.1
Total changes of liabilities from financing cash flows –516.5 –519.1 –97.9 –529.3 –98.4 –5.3 –1,766.5
Effect of changes in exchange rates 85.6 7.3 10.5 20.0 1.4 0.1 124.9
Changes in fair value – – – – 45.7 19.7 65.4
Other changes1 240.3 46.4 28.2 656.1 – – 971.0
As at 31 December 2019 4,292.9 458.3 452.5 1,193.4 11.1 22.5 6,430.7
1 The other changes in the lease liabilities mainly include current additions from IFRS 16 in the amount of EUR 591.5 million.
229
H a p a g - L L o y d a g I a n n u a L R e p o R t 2 0 1 9
n o t e s I C o n s o L I d a t e d f I n a n C I a L s t a t e M e n t s
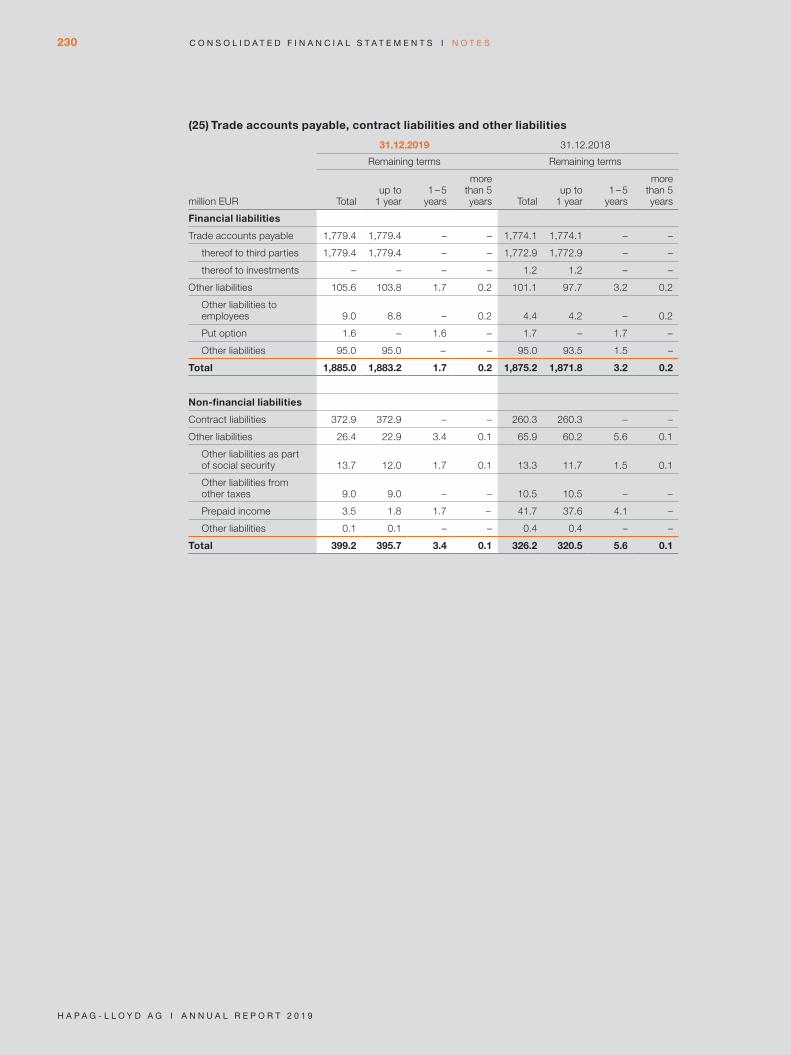
(25) Trade accounts payable, contract liabilities and other liabilities
million EUR
31.12.2019 31.12.2018
Remaining terms Remaining terms
Totalup to
1 year1 - 5
years
more than 5 years Total
up to 1 year
1 - 5 years
more than 5 years
Financial liabilities
Trade accounts payable 1,779.4 1,779.4 – – 1,774.1 1,774.1 – –
thereof to third parties 1,779.4 1,779.4 – – 1,772.9 1,772.9 – –
thereof to investments – – – – 1.2 1.2 – –
Other liabilities 105.6 103.8 1.7 0.2 101.1 97.7 3.2 0.2
Other liabilities to employees 9.0 8.8 – 0.2 4.4 4.2 – 0.2
Put option 1.6 – 1.6 – 1.7 – 1.7 –
Other liabilities 95.0 95.0 - – 95.0 93.5 1.5 –
Total 1,885.0 1,883.2 1.7 0.2 1,875.2 1,871.8 3.2 0.2
Non-financial liabilities
Contract liabilities 372.9 372.9 – – 260.3 260.3 – –
Other liabilities 26.4 22.9 3.4 0.1 65.9 60.2 5.6 0.1
Other liabilities as part of social security 13.7 12.0 1.7 0.1 13.3 11.7 1.5 0.1
Other liabilities from other taxes 9.0 9.0 – – 10.5 10.5 – –
Prepaid income 3.5 1.8 1.7 - 41.7 37.6 4.1 –
Other liabilities 0.1 0.1 – – 0.4 0.4 – –
Total 399.2 395.7 3.4 0.1 326.2 320.5 5.6 0.1
230
H a p a g - L L o y d a g I a n n u a L R e p o R t 2 0 1 9
C o n s o L I d a t e d f I n a n C I a L s t a t e M e n t s I n o t e s
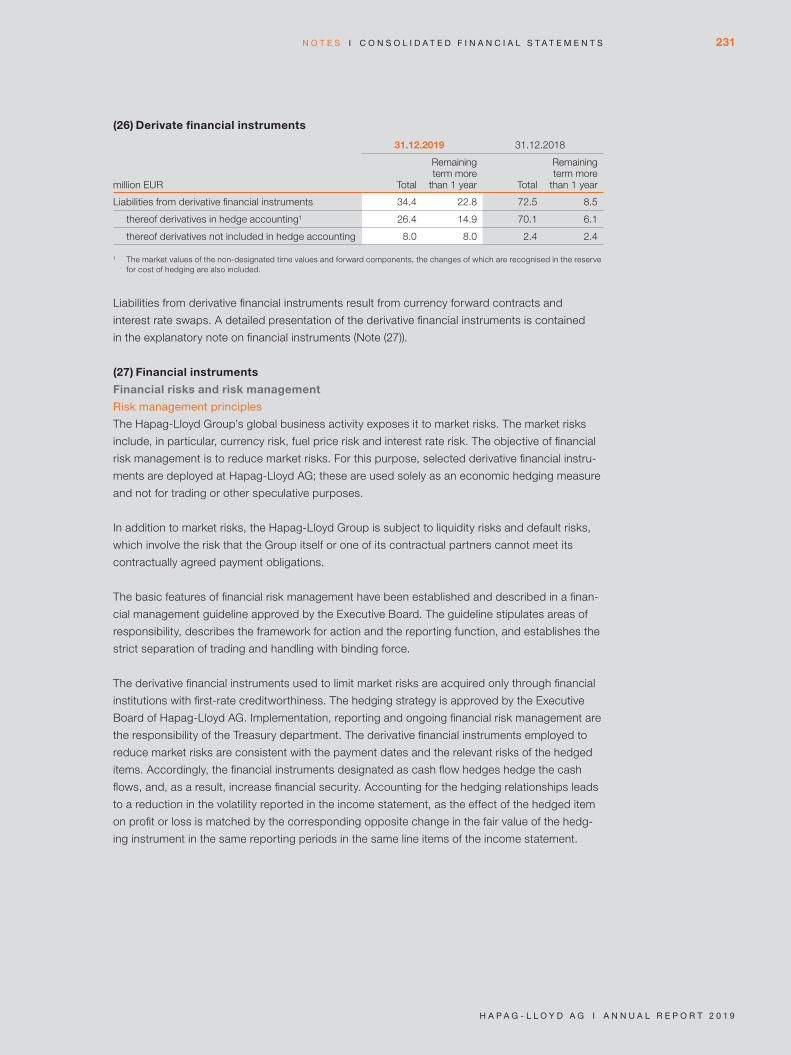
(26) Derivate financial instruments
million EUR
31.12.2019 31.12.2018
Total
Remaining term more
than 1 year Total
Remaining term more
than 1 year
Liabilities from derivative financial instruments 34.4 22.8 72.5 8.5
thereof derivatives in hedge accounting1 26.4 14.9 70.1 6.1
thereof derivatives not included in hedge accounting 8.0 8.0 2.4 2.4
1 The market values of the non-designated time values and forward components, the changes of which are recognised in the reserve for cost of hedging are also included.
Liabilities from derivative financial instruments result from currency forward contracts and
interest rate swaps. A detailed presentation of the derivative financial instruments is contained
in the explanatory note on financial instruments (Note (27)).
(27) Financial instruments
Financial risks and risk management
Risk management principles
The Hapag-Lloyd Group’s global business activity exposes it to market risks. The market risks
include, in particular, currency risk, fuel price risk and interest rate risk. The objective of financial
risk management is to reduce market risks. For this purpose, selected derivative financial instru-
ments are deployed at Hapag-Lloyd AG; these are used solely as an economic hedging measure
and not for trading or other speculative purposes.
In addition to market risks, the Hapag-Lloyd Group is subject to liquidity risks and default risks,
which involve the risk that the Group itself or one of its contractual partners cannot meet its
contractually agreed payment obligations.
The basic features of financial risk management have been established and described in a finan-
cial management guideline approved by the Executive Board. The guideline stipulates areas of
responsibility, describes the framework for action and the reporting function, and establishes the
strict separation of trading and handling with binding force.
The derivative financial instruments used to limit market risks are acquired only through financial
institutions with first-rate creditworthiness. The hedging strategy is approved by the Executive
Board of Hapag-Lloyd AG. Implementation, reporting and ongoing financial risk management are
the responsibility of the Treasury department. The derivative financial instruments employed to
reduce market risks are consistent with the payment dates and the relevant risks of the hedged
items. Accordingly, the financial instruments designated as cash flow hedges hedge the cash
flows, and, as a result, increase financial security. Accounting for the hedging relationships leads
to a reduction in the volatility reported in the income statement, as the effect of the hedged item
on profit or loss is matched by the corresponding opposite change in the fair value of the hedg-
ing instrument in the same reporting periods in the same line items of the income statement.
231
H a p a g - L L o y d a g I a n n u a L R e p o R t 2 0 1 9
n o t e s I C o n s o L I d a t e d f I n a n C I a L s t a t e M e n t s

Market risk
Market risk is defined as the risk that the fair values or future cash flows of a primary or
derivative financial instrument fluctuate as a result of underlying risk factors.
The causes of the existing market price risks to which the Hapag-Lloyd Group is exposed lie
particularly in the significant cash flows in foreign currencies at the level of Hapag-Lloyd AG, fuel
consumption and interest rate risks that result from external financing.
In order to portray the market risks, IFRS 7 demands sensitivity analyses that show the effects
of hypothetical changes in relevant risk variables on profit or loss for the period and equity. The
hypothetical changes in these risk variables relate to the respective portfolio of primary and
derivative financial instruments on the balance sheet date.
The analyses of the risk reduction activities outlined below and the amounts determined using
sensitivity analyses constitute hypothetical and therefore risky and uncertain information. Due
to unforeseeable developments on the global financial markets, actual results may deviate sub-
stantially from the information provided.
Currency risk
Currency risks are hedged as far as they influence the Hapag-Lloyd Group’s cash flow. The
objective of currency hedging is the fixing of cash flows based on hedging rates for preventing
future disadvantageous fluctuations of the currency exchange rate.
The Hapag-Lloyd Group’s functional currency is the US dollar. Currency risks mainly result from
incoming or outgoing payments in currencies other than the US dollar and from financial debt
taken on in euros. Alongside the euro, the Indian rupee (INR), Brazilian real (BRL), Chinese ren-
minbi (CNY), British pound sterling (GBP), Canadian dollar (CAD), United Arab Emirates dirham
(AED), Japanese yen (JPY) and Australian dollar (AUD) are also significant currencies.
If necessary, currency hedging instruments are conducted, while taking account of internal
guidelines. The Group hedges a portion of its operating cost exposure denominated in CAD by
using currency forward contracts on a 13-week basis with the aim of limiting currency risks.
The hedging quota for costs denominated in CAD is 80%.
The repayment of euro-denominated financial debt is also hedged up to as much as 100%. As
a rule, forward contracts used to hedge euro-denominated debt generally mature within less
than 1 year. The risks are hedged by making use of derivative financial instruments in the form of
currency forward contracts and instruments that have a natural hedging effect (e.g. euro money
market investments).
Hapag-Lloyd only designates the spot price element of the currency forward contracts. The
change in the forward components is recorded in the reserve for cost of hedging within equity.
232
H a p a g - L L o y d a g I a n n u a L R e p o R t 2 0 1 9
C o n s o L I d a t e d f I n a n C I a L s t a t e M e n t s I n o t e s
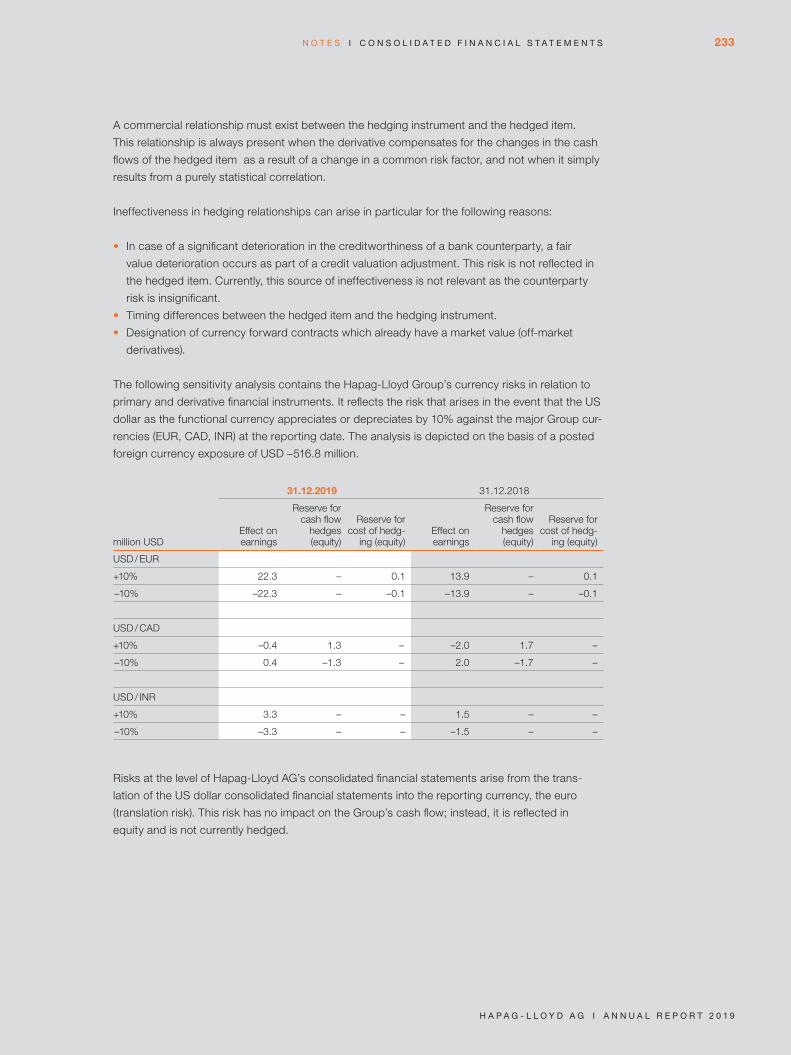
A commercial relationship must exist between the hedging instrument and the hedged item.
This relationship is always present when the derivative compensates for the changes in the cash
flows of the hedged item as a result of a change in a common risk factor, and not when it simply
results from a purely statistical correlation.
Ineffectiveness in hedging relationships can arise in particular for the following reasons:
• In case of a significant deterioration in the creditworthiness of a bank counterparty, a fair
value deterioration occurs as part of a credit valuation adjustment. This risk is not reflected in
the hedged item. Currently, this source of ineffectiveness is not relevant as the counterparty
risk is insignificant.
• Timing differences between the hedged item and the hedging instrument.
• Designation of currency forward contracts which already have a market value (off-market
derivatives).
The following sensitivity analysis contains the Hapag-Lloyd Group’s currency risks in relation to
primary and derivative financial instruments. It reflects the risk that arises in the event that the US
dollar as the functional currency appreciates or depreciates by 10% against the major Group cur-
rencies (EUR, CAD, INR) at the reporting date. The analysis is depicted on the basis of a posted
foreign currency exposure of USD –516.8 million.
million USD
31.12.2019 31.12.2018
Effect on earnings
Reserve for cash flow
hedges (equity)
Reserve for cost of hedg-
ing (equity)Effect on earnings
Reserve for cash flow
hedges (equity)
Reserve for cost of hedg-
ing (equity)
USD / EUR
+10% 22.3 – 0.1 13.9 – 0.1
-10% –22.3 – –0.1 –13.9 – –0.1
USD / CAD
+10% –0.4 1.3 - –2.0 1.7 –
-10% 0.4 –1.3 - 2.0 –1.7 –
USD / INR
+10% 3.3 – – 1.5 – –
-10% –3.3 – – –1.5 – –
Risks at the level of Hapag-Lloyd AG’s consolidated financial statements arise from the trans-
lation of the US dollar consolidated financial statements into the reporting currency, the euro
(translation risk). This risk has no impact on the Group’s cash flow; instead, it is reflected in
equity and is not currently hedged.
233
H a p a g - L L o y d a g I a n n u a L R e p o R t 2 0 1 9
n o t e s I C o n s o L I d a t e d f I n a n C I a L s t a t e M e n t s

fuel price risk
As a result of its operating activities, the Hapag-Lloyd Group is exposed to a market price risk for
the procurement of bunker fuel.
The risk management’s basic objective is securing up to 80% of the forecast bunker require-
ments. Derivative financial instruments in the form of commodity options are used to hedge
against price fluctuations.
Hapag-Lloyd only designates the intrinsic value of the option. The change in the time value is
recorded in the reserve for cost of hedging within equity.
A commercial relationship must exist between the hedging instrument and the hedged item. This
relationship is always present when the derivative compensates for the changes in the cash flows
of the hedged item as a result of a change in a common risk factor, and not when it simply
results from a purely statistical correlation. Due to the IMO2020 regulation, from 1 January 2020
the Hapag-Lloyd Group will mainly use low-sulphur fuel (LSFO 0.5%). Since the liquidity and level
of price transparency on the financial market for derivative financial instruments with the underly-
ing LSFO 0.5% are currently inadequate, for the time being fuel price hedging has been imple-
mented by using Gasoil 0.1% (Marine Gas Oil) options as a proxy for LSFO 0.5%.
Ineffectiveness in hedging relationships can arise in particular for the following reasons:
• In case of a significant deterioration in the creditworthiness of a bank counterparty,
a fair value deterioration occurs as part of a credit valuation adjustment. This risk is
not reflected in the hedged item. Currently, this source of ineffectiveness is not relevant
as the counterparty risk is insignificant.
• Differences in payment dates between the heged item and the hedging instrument.
• Change in the correlation between quoted bunker prices worldwide.
In order to portray the fuel price risks according to IFRS 7, a sensitivity analysis was performed,
with an implied hypothetical market price change of + / –10%. The consequent effects on other
comprehensive income resulting from the market price changes of the derivative financial instru-
ment used are shown in the following table.
million EUR
31.12.2019 31.12.2018
10% -10% 10% -10%
Reserve for cash flow hedges – – – –
Reserve for cost of hedging 36.6 –12.0 5.1 –1.8
234
H a p a g - L L o y d a g I a n n u a L R e p o R t 2 0 1 9
C o n s o L I d a t e d f I n a n C I a L s t a t e M e n t s I n o t e s

Interest rate risk
The Hapag-Lloyd Group is exposed to interest rate risks affecting cash flow, particularly from
financial debt based on variable interest rates. In order to minimise the interest rate risk, the
Group strives to achieve a balanced combination of assets and liabilities with variable and fixed
interest rates. Interest rate swaps have also been used since 2017 to hedge the interest rate risk.
In addition, non-cash interest rate risks relating to the measurement of separately recognised
embedded derivatives exist in the form of early buy-back options for issued bonds. Effects from
the market valuation of these financial instruments are also reflected in the interest result. In order
to reduce interest rate risk, Hapag-Lloyd designates interest swaps as hedges of the variable ele-
ment of interest rate payments of hedged items. Some interest swaps only hedge a proportion of
the total nominal volumes. In this way, certain hedged items are not designated in full, but only
certain risk components are hedged.
The variations in the cash flows of the hedging transactions are primarily affected by changes in
the variable interest rate.
A commercial relationship must exist between the hedging instrument and the hedged item. This
relationship is always present when the derivative compensates for the changes in the cash flows
of the hedged item as a result of a change in a common risk factor, and not when it simply
results from a purely statistical correlation. Generally, the nominal volume, benchmark interest
rate and interest rate fixing dates of the hedged item and the hedging instrument are matched.
Ineffectiveness in hedging relationships can arise in particular for the following reasons:
• In case of a significant deterioration in the creditworthiness of a bank counterparty, a fair value
deterioration occurs as part of a credit valuation adjustment. This risk is not reflected in the
hedged item. Currently, this source of ineffectiveness is not relevant as the counterparty
risk is insignificant.
• Differences in payment dates between the hedged item and the hedging instrument.
• Designation of interest rate swaps which already have a market value (off-market derivatives).
In order to present the interest rate risks pursuant to IFRS 7, a sensitivity analysis was performed
and used to determine the effects of hypothetical changes in market interest rates on interest
income and expenses. The market interest rate as at 31 December 2019 was increased or
decreased by + / –100 basis points. Taking into account the low interest rate level, hypothetical,
negative changes in interest rates were only made up to a maximum of 0. The determined effect
on earnings relates to financial debt with a variable interest rate amounting to EUR 3,042.2 million
that existed at the balance sheet date (previous year: EUR 3,493.3 million), the fair value of inter-
est rate swaps of EUR -22.5 million (previous year: EUR –8.0 million) and the market value of
embedded derivatives totalling EUR 27.3 million (previous year: EUR 3.7 million). It is assumed
that this exposure also constitutes a representative figure for the next financial year.
million EUR 31.12.2019 31.12.2018
Change in variable interest rate+100
base points-100
base points+100
base points-100
base points
Reserve for cash flow hedges 12.5 –13.0 20.5 –20.9
Earnings before taxes –39.5 40.2 –16.3 16.4
235
H a p a g - L L o y d a g I a n n u a L R e p o R t 2 0 1 9
n o t e s I C o n s o L I d a t e d f I n a n C I a L s t a t e M e n t s

Credit risk
In addition to the market risks described above, the Hapag-Lloyd Group is exposed to credit
risks. Credit risk constitutes the risk that a contract partner will be unable to meet its contractual
payment obligations. It refers to both the Hapag-Lloyd Group’s operating activities and the coun-
terparty risk vis-à-vis external banks.
Generally, a risk of this kind is minimised by the creditworthiness requirements which the respec-
tive contracting partners are required to fulfil. With regard to its operating activities, the Group
has an established credit and receivables management system at area, regional and head office
level which is based on internal guidelines. Payment periods for customers are determined and
continuously monitored within the framework of a credit check. This process takes account of
both internal data based on empirical values and external information on the respective custom-
er’s creditworthiness and rating. In addition, collective factors such as country risks are taken
into account. There are also credit insurance arrangements and bank guarantees in place at the
reporting date which provide protection against credit risk.
The Hapag-Lloyd Group is not exposed to major default risk from an individual counterparty. The
concentration of the default risk is limited due to the broad and heterogeneous customer base.
Analyses of the maturity structure of trade accounts receivable and other assets and infor-
mation on the impairment allowances recorded against these financial assets is provided in
Note (14) and in the description of accounting and measurement methods for primary finan-
cial instruments.
The portfolio of primary financial assets is reported in the statement of financial position.
The carrying amounts of the financial assets correspond to the maximum default risk.
With regard to derivative financial instruments, all the counterparties must have a credit rating or
alternatively, for non-rated counterparties, a corresponding internal credit assessment deter-
mined according to clear specifications. The maximum risk corresponds to the total of the posi-
tive market values as at the balance sheet date, as this is the extent of the loss that would have
to be borne.
For the derivative financial instruments with positive fair values totalling EUR 14.8 million (previ-
ous year: EUR 4.4 million) and negative fair values totalling EUR –34.4 million (previous year:
EUR –72.5 million), there is the potential to offset financial assets and financial liabilities in the
amount of EUR –5.3 million (previous year: EUR 1.1 million), taking into account the German
Master Agreement for Financial Derivatives and the ISDA Framework Agreement. The market
values of embedded derivatives linked to the buy-back option of issued bonds totalling
EUR 27.3 million (previous year: EUR 3.7 million) were not taken into account here.
236
H a p a g - L L o y d a g I a n n u a L R e p o R t 2 0 1 9
C o n s o L I d a t e d f I n a n C I a L s t a t e M e n t s I n o t e s
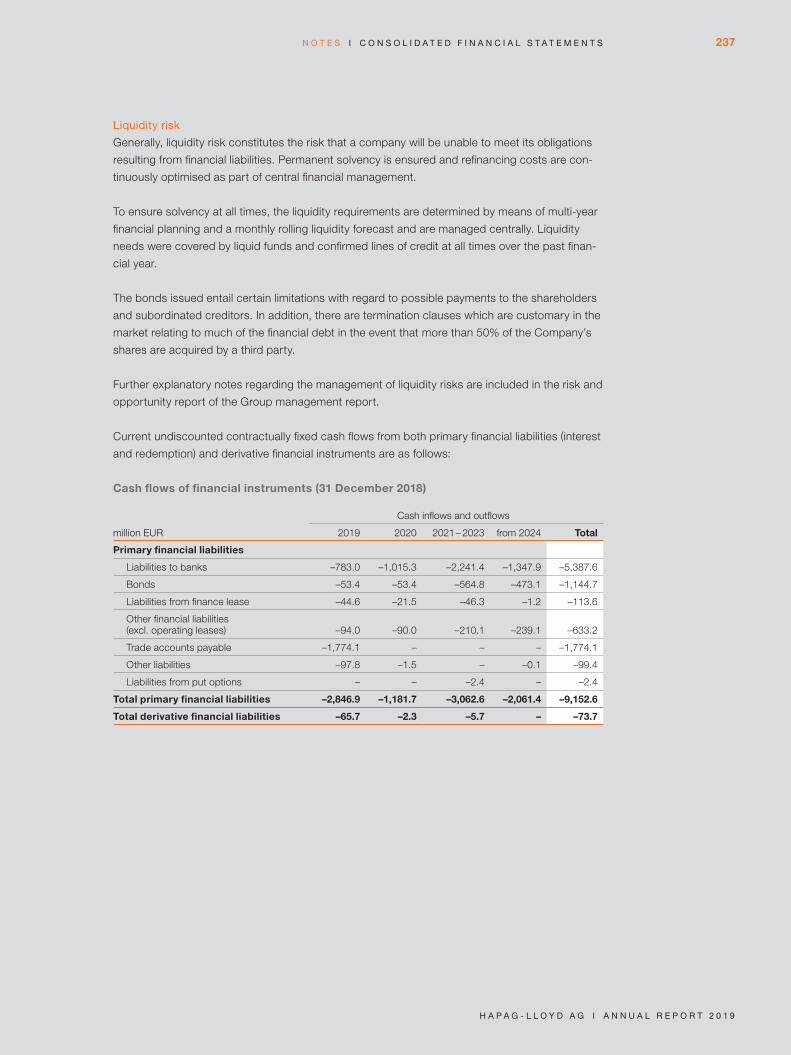
Liquidity risk
Generally, liquidity risk constitutes the risk that a company will be unable to meet its obligations
resulting from financial liabilities. Permanent solvency is ensured and refinancing costs are con-
tinuously optimised as part of central financial management.
To ensure solvency at all times, the liquidity requirements are determined by means of multi-year
financial planning and a monthly rolling liquidity forecast and are managed centrally. Liquidity
needs were covered by liquid funds and confirmed lines of credit at all times over the past finan-
cial year.
The bonds issued entail certain limitations with regard to possible payments to the shareholders
and subordinated creditors. In addition, there are termination clauses which are customary in the
market relating to much of the financial debt in the event that more than 50% of the Company’s
shares are acquired by a third party.
Further explanatory notes regarding the management of liquidity risks are included in the risk and
opportunity report of the Group management report.
Current undiscounted contractually fixed cash flows from both primary financial liabilities (interest
and redemption) and derivative financial instruments are as follows:
Cash flows of financial instruments (31 December 2018)
million EUR
Cash inflows and outflows
2019 2020 2021 - 2023 from 2024 Total
Primary financial liabilities
Liabilities to banks –783.0 –1,015.3 –2,241.4 –1,347.9 –5,387.6
Bonds –53.4 –53.4 –564.8 –473.1 –1,144.7
Liabilities from finance lease –44.6 –21.5 –46.3 –1.2 –113.6
Other financial liabilities (excl. operating leases) –94.0 –90.0 –210.1 –239.1 –633.2
Trade accounts payable –1,774.1 – – – –1,774.1
Other liabilities –97.8 –1.5 – –0.1 –99.4
Liabilities from put options – – –2.4 – –2.4
Total primary financial liabilities –2,846.9 –1,181.7 –3,062.6 –2,061.4 –9,152.6
Total derivative financial liabilities –65.7 –2.3 –5.7 – –73.7
237
H a p a g - L L o y d a g I a n n u a L R e p o R t 2 0 1 9
n o t e s I C o n s o L I d a t e d f I n a n C I a L s t a t e M e n t s

Cash flows of financial instruments (31 December 2019)
million EUR
Cash inflows and outflows
2020 2021 2022 - 2024 from 2025 Total
Primary financial liabilities
Liabilities to banks –839.9 –736.8 –2,202.6 –1,159.3 –4,938.6
Bonds –23.1 –23.1 –519.2 – –565.3
Lease liabilities –522.3 –290.1 –357.4 –108.2 –1,278.0
Other financial liabilities –91.8 –96.1 –169.6 –192.4 –549.8
Trade accounts payable –1,779.4 – – – –1,779.4
Other liabilities –103.8 – – –0.2 –104.0
Liabilities from put options – – –2.5 – –2.5
Total primary financial liabilities –3,360.3 –1,146.1 -3,251.3 –1,460.0 –9,217.6
Total derivative financial liabilities –18.3 –7.2 –9.8 – –35.3
In principle, it is not expected that the cash outflows in the maturity analysis will occur at points
in time that differ significantly or in amounts that differ significantly.
All financial instruments for which payments had already been contractually agreed as at the
reporting date of 31 December 2019 were included. Amounts in foreign currencies were trans-
lated at the spot rate as at the reporting date. In order to ascertain the variable interest payments
arising from the financial instruments, the interest rates fixed on the balance sheet date were
used for the following periods as well.
The cash outflows from the put options resulted from the undiscounted expected strike price of
the put option.
The cash outflows from derivative financial instruments include the undiscounted fair values of
the currency forward contracts used and the estimated net payments of the interest rate swaps
used on the basis of the yield curve applicable on the balance sheet date.
The cash outflows associated with the liability contained in other financial debt to reflect a contin-
gent consideration payable for a business combination result from the undiscounted expected
payments which are dependent on the development of the volumes of the agency acquired.
Derivative financial instruments and hedging relationships
Derivative financial instruments are generally used to hedge existing or planned hedged items
and serve to reduce foreign currency risks, fuel price risks and interest rate risks, which occur in
day-to-day business activities and in the context of investment and financial transactions.
Currency risks are currently hedged by means of currency forward contracts. Commodity
options are used as hedges for fuel price risks. Interest rate swaps are used to hedge interest
rate risks.
238
H a p a g - L L o y d a g I a n n u a L R e p o R t 2 0 1 9
C o n s o L I d a t e d f I n a n C I a L s t a t e M e n t s I n o t e s

Derivative financial instruments are recorded as current or non-current financial assets or
liabilities according to their remaining terms.
The positive and / or negative fair values of derivative financial instruments are shown as follows:
million EUR
31.12.2019 31.12.2018
Positive market values
Negative market values
Positive market values
Negative market values
Hedging instruments acc. to IFRS 9 (Hedge accounting)
Commodity options 13.5 – 3.4 –
Currency forward contracts 1.0 –11.6 0.2 –63.7
Interest rate swaps 0.3 –14.9 0.8 –6.4
Hedges1 14.8 –26.4 4.4 –70.1
Derivative financial instruments (FVTPL)
Interest rate swaps – –8.0 – –2.4
Embedded derivatives 27.3 – 3.7 –
Other derivative financial instruments 27.3 –8.0 3.7 –2.4
Total 42.1 –34.4 8.1 –72.5
1 The market values of the non-designated time values and forward components, the changes of which are recognised in the reserve for cost of hedging are also included.
The fair value determined for the derivative financial instruments is the price at which a contract-
ing party would assume the rights and / or obligations of the other contracting party.
The market values of currency and commodity options are calculated using the Black & Scholes
model or the modified Turnbull & Wakeman model and are based on the current exchange rates,
commodity prices, currency and commodity price volatility, yield curves and forward prices. Cur-
rency forward contracts are measured on the basis of their market-traded forward price as at the
reporting date. The fair value of the interest rate swaps is calculated as the present value of the
anticipated future cash flows. The estimates of future cash flows from variable interest payments
are based on quoted swap rates and interbank interest rates. The estimate of the fair value is
adjusted by the credit risk of the Group and the counterparty.
An analysis of the underlying contracts conducted on the bonds issued by Hapag-Lloyd resulted
in the identification of embedded derivatives in the form of early buy-back options. These are
presented at their fair values as separate derivatives independently of the underlying contract.
The market value of the embedded derivatives is calculated using the Hull-White model in com-
bination with a trinomial decision tree based on current market values.
Hedging relationships in accordance with IFRS 9 in the reporting period wholly consist of cash
flow hedges.
239
H a p a g - L L o y d a g I a n n u a L R e p o R t 2 0 1 9
n o t e s I C o n s o L I d a t e d f I n a n C I a L s t a t e M e n t s
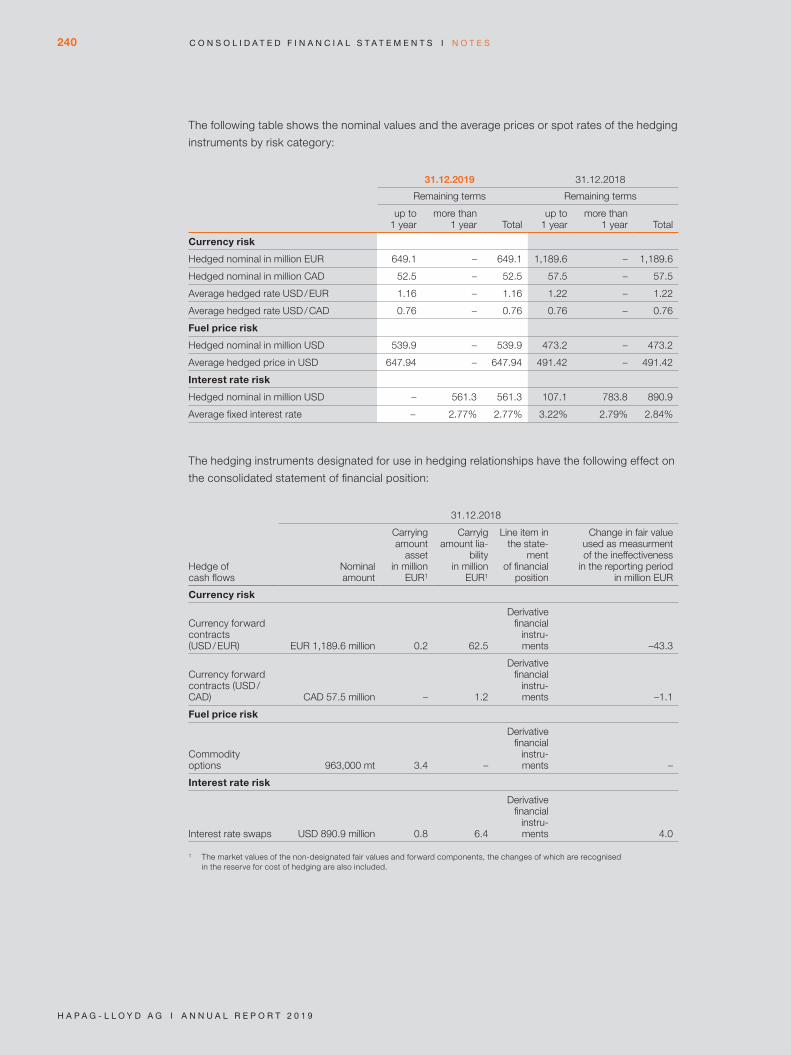
The following table shows the nominal values and the average prices or spot rates of the hedging
instruments by risk category:
31.12.2019 31.12.2018
Remaining terms Remaining terms
up to 1 year
more than 1 year Total
up to 1 year
more than 1 year Total
Currency risk
Hedged nominal in million EUR 649.1 – 649.1 1,189.6 – 1,189.6
Hedged nominal in million CAD 52.5 – 52.5 57.5 – 57.5
Average hedged rate USD / EUR 1.16 – 1.16 1.22 – 1.22
Average hedged rate USD / CAD 0.76 – 0.76 0.76 – 0.76
Fuel price risk
Hedged nominal in million USD 539.9 – 539.9 473.2 – 473.2
Average hedged price in USD 647.94 – 647.94 491.42 – 491.42
Interest rate risk
Hedged nominal in million USD – 561.3 561.3 107.1 783.8 890.9
Average fixed interest rate - 2.77% 2.77% 3.22% 2.79% 2.84%
The hedging instruments designated for use in hedging relationships have the following effect on
the consolidated statement of financial position:
Hedge of cash flows
31.12.2018
Nominal amount
Carrying amount
asset in million
EUR1
Carryig amount lia-
bility in million
EUR1
Line item in the state-
ment of financial
position
Change in fair value used as measurment of the ineffectiveness
in the reporting period in million EUR
Currency risk
Currency forward contracts (USD / EUR) EUR 1,189.6 million 0.2 62.5
Derivative financial
instru-ments –43.3
Currency forward contracts (USD / CAD) CAD 57.5 million – 1.2
Derivative financial
instru-ments –1.1
Fuel price risk
Commodity options 963,000 mt 3.4 –
Derivative financial
instru-ments –
Interest rate risk
Interest rate swaps USD 890.9 million 0.8 6.4
Derivative financial
instru-ments 4.0
1 The market values of the non-designated fair values and forward components, the changes of which are recognised in the reserve for cost of hedging are also included.
240
H a p a g - L L o y d a g I a n n u a L R e p o R t 2 0 1 9
C o n s o L I d a t e d f I n a n C I a L s t a t e M e n t s I n o t e s

Hedge of cash flows
31.12.2019
Nominal amount
Carrying amount
asset in million
EUR1
Carrying amount lia-
bility in million
EUR1
Line item in the statement
of financial position
Change in fair value used as measurement
of the ineffectveness in the reporting period
in million EUR
Currency risk
Currency forward contracts (USD / EUR) EUR 649.1 million 0.5 11.6
Derivative financial
instruments –1.4
Currency forward contracts (USD / CAD) CAD 52.5 million 0.5 –
Derivative financial
instruments 0.5
Fuel price risk
Commodity options 833,250 mt 13.5 –
Derivative financial
instruments –
Interest rate risk
Interest rate swaps USD 561.3 million 0.3 14.9
Derivative financial
instruments –14.6
1 The market values of the non-designated fair values and forward components, the changes of which are recognised in the reserve for cost of hedging are also included.
The hedged items designated to hedging relationships have the following effect on the
consolidated statement of financial position:
Hedge of cash flows million EUR
31.12.2018
Change in value used as measurement of the ineffectiveness
Reserve for cash flow hedges
Currency risk
Repayment of financial debt in EUR 43.4 –
Repayment of pension obligations in EUR –0.1 –
Operational costs in CAD 1.1 –0.4
Fuel price risk
Bunker purchases – –
Interest rate risk
Interest payments of variable rate loans 0.5 –0.4
Hedge of cash flows million EUR
31.12.2019
Change in value used as measurement of the ineffectiveness
Reserve for cash flow hedges
Currency risk
Repayment of financial debt in EUR 1.4 –
Operational costs in CAD –0.5 0.2
Fuel price risk
Bunker purchases – –
Interest rate risk
Interest payments of variable rate loans 14.6 –14.1
241
H a p a g - L L o y d a g I a n n u a L R e p o R t 2 0 1 9
n o t e s I C o n s o L I d a t e d f I n a n C I a L s t a t e M e n t s

The hedging relationships described above have the following effect on the Group’s income
statement and other comprehensive income:
Hedge of cash flows million EUR
31.12.2018
Hedging gains or losses recog-
nised in other comprehensive
income
Ineffectiveness recognised in
the income statement
Line item in the income statement
Amount reclas-sified from the other compre-
hensive into profit or loss
Line item in the income statement
Currency risk
Repayment of financial debt in EUR –49.7 – – 49.2
Other financial items
Repayment of pension obligations in EUR 0.1 – – –0.1
Other financial items
Operational costs in CAD –1.5 – – 1.1
Transport expenses /
other operat-ing result
Fuel price risk
Bunker purchases 19.0 – – – -
Interest rate risk
Interest payments of variable rate loans –6.4 2.4
Interest expenses 2.6
Interest expenses
Hedge of cash flows million EUR
31.12.2019
Hedging gains or losses recog-
nised in other comprehensive
income
Ineffectiveness recognised in
the income statement
Line item in the income statement
Amount reclas-sified from the other compre-
hensive into profit or loss
Line item in the income statement
Currency risk
Repayment of financial debt in EUR –17.3 – – 17.3
Other financial items
Operational costs in CAD 1.5 – – –0.9
Transport expenses /
other operat-ing result
Fuel price risk
Bunker purchases – – – – -
Interest rate risk
Interest payments of variable rate loans –15.8 2.2
Interest expenses 2.1
Interest expenses
242
H a p a g - L L o y d a g I a n n u a L R e p o R t 2 0 1 9
C o n s o L I d a t e d f I n a n C I a L s t a t e M e n t s I n o t e s

The following table shows a reconciliation of the equity reserves which result from accounting
for hedging relationships:
Cash flow hedges million EUR
2019 2018
Reserve for cash flow hedges
Reserve for cost of hedging
Reserve for cash flow hedges
Reserve for cost of hedging
Balance at 1.1. –0.8 –7.7 11.0 –1.0
Change in fair value: –31.7 –40.9 –38.5 –47.3
Currency risk1 –15.9 –28.6 –51.1 –29.2
Fuel price risk2 – –12.3 19.0 –18.1
Interest rate risk –15.8 – –6.4 –
Reclassification into profit or loss: 18.5 27.0 52.9 29.4
Currency risk1 16.4 27.0 50.3 29.4
Fuel price risk2 – – – –
Interest rate risk 2.1 – 2.6 –
Hedging gains and losses transferred to the cost of inventory: – 11.7 –26.4 11.4
Fuel price risk2 – 11.7 –26.4 11.4
Currency translation differences: - –0.2 0.2 –0.2
Currency risk1 - - – –
Fuel price risk2 – –0.2 0.1 –0.2
Interest rate risk - – 0.1 –
Balance at 31.12. –14.0 –10.2 –0.8 –7.7
1 The currency risk shown in the reserve for cost of hedging includes only amounts in connection with forward components in currency forward contracts which are used to hedge against primarily time-period related hedged items.
2 The fuel price risks shown in the reserve for cost of hedging includes only amounts in connection with the fair values of commodity options to hedge against transaction-related hedged items.
Financial instruments – additional disclosures, carrying amounts and fair values
The fair value of a financial instrument is the price that would be received for an asset or that
would be paid for the transfer of a liability on the relevant day in the course of a normal trans-
action between market participants.
Where financial instruments are quoted in an active market, as with bond issues in particular, the
fair value of the financial instrument corresponds to the respective market price on the balance
sheet date.
The carrying amounts of cash and cash equivalents, trade accounts receivable, trade accounts
payable and significant portions of other assets and other liabilities are a suitable approximation
of the fair values.
For liabilities to banks and other non-current financial liabilities, the fair value is determined as the
net present value of the future cash flows taking account of yield curves and the relevant credit
spreads. Traded bonds are measured at the market price as at the balance sheet date.
243
H a p a g - L L o y d a g I a n n u a L R e p o R t 2 0 1 9
n o t e s I C o n s o L I d a t e d f I n a n C I a L s t a t e M e n t s
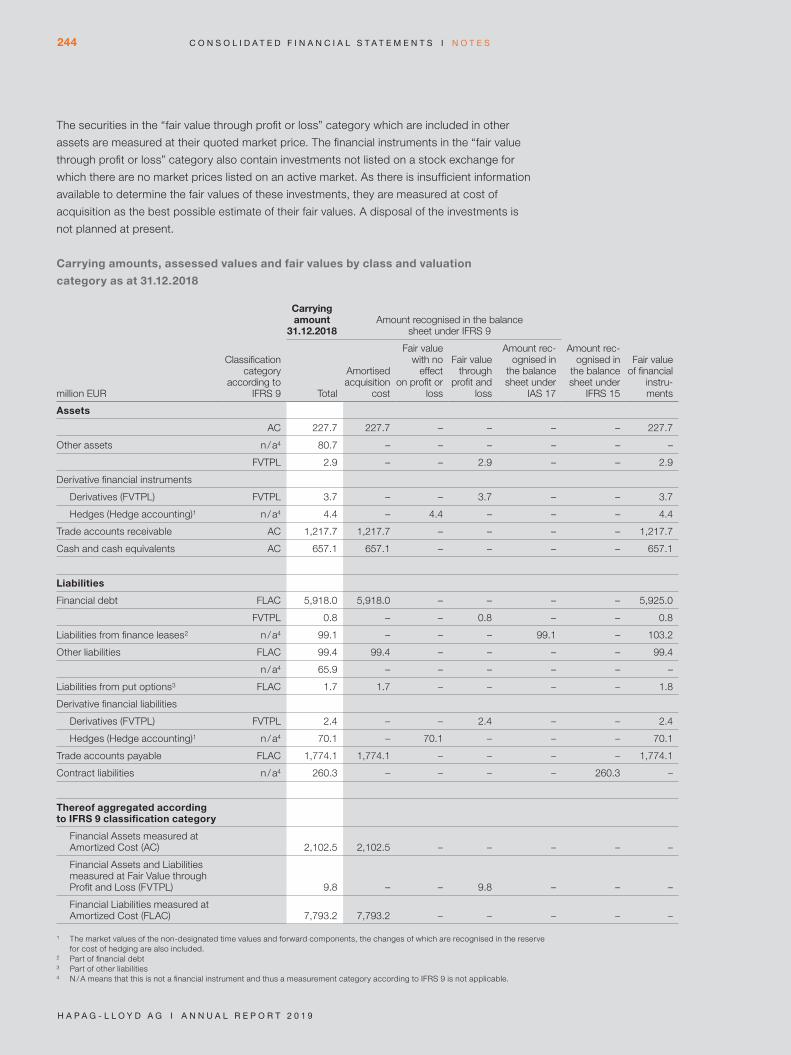
The securities in the “fair value through profit or loss” category which are included in other
assets are measured at their quoted market price. The financial instruments in the “fair value
through profit or loss” category also contain investments not listed on a stock exchange for
which there are no market prices listed on an active market. As there is insufficient information
available to determine the fair values of these investments, they are measured at cost of
acquisition as the best possible estimate of their fair values. A disposal of the investments is
not planned at present.
Carrying amounts, assessed values and fair values by class and valuation
category as at 31.12.2018
million EUR
Classification category
according to IFRS 9
Carrying amount
31.12.2018Amount recognised in the balance
sheet under IFRS 9
Amount rec-ognised in
the balance sheet under
IFRS 15
Fair value of financial
instru-mentsTotal
Amortised acquisition
cost
Fair value with no
effect on profit or
loss
Fair value through
profit and loss
Amount rec-ognised in
the balance sheet under
IAS 17
Assets
AC 227.7 227.7 – – – – 227.7
Other assets n / a4 80.7 – – – – – –
FVTPL 2.9 – – 2.9 – – 2.9
Derivative financial instruments
Derivatives (FVTPL) FVTPL 3.7 – – 3.7 – – 3.7
Hedges (Hedge accounting)1 n / a4 4.4 – 4.4 – – – 4.4
Trade accounts receivable AC 1,217.7 1,217.7 – – – – 1,217.7
Cash and cash equivalents AC 657.1 657.1 – – – – 657.1
Liabilities
Financial debt FLAC 5,918.0 5,918.0 – – – – 5,925.0
FVTPL 0.8 – – 0.8 – – 0.8
Liabilities from finance leases2 n / a4 99.1 – – – 99.1 – 103.2
Other liabilities FLAC 99.4 99.4 – – – – 99.4
n / a4 65.9 – – – – – –
Liabilities from put options3 FLAC 1.7 1.7 – – – – 1.8
Derivative financial liabilities
Derivatives (FVTPL) FVTPL 2.4 – – 2.4 – – 2.4
Hedges (Hedge accounting)1 n / a4 70.1 – 70.1 – – – 70.1
Trade accounts payable FLAC 1,774.1 1,774.1 – – – – 1,774.1
Contract liabilities n / a4 260.3 – – – – 260.3 –
Thereof aggregated according to IFRS 9 classification category
Financial Assets measured at Amortized Cost (AC) 2,102.5 2,102.5 – – – – –
Financial Assets and Liabilities measured at Fair Value through Profit and Loss (FVTPL) 9.8 – – 9.8 – – –
Financial Liabilities measured at Amortized Cost (FLAC) 7,793.2 7,793.2 – – – – –
1 The market values of the non-designated time values and forward components, the changes of which are recognised in the reserve for cost of hedging are also included.
2 Part of financial debt3 Part of other liabilities4 N / A means that this is not a financial instrument and thus a measurement category according to IFRS 9 is not applicable.
244
H a p a g - L L o y d a g I a n n u a L R e p o R t 2 0 1 9
C o n s o L I d a t e d f I n a n C I a L s t a t e M e n t s I n o t e s

Carrying amounts, assessed values and fair values by class and valuation
category as at 31.12.2019
million EUR
Classification category
according to IFRS 9
Carrying amount
31.12.2019Amount recognised in the balance
sheet under IFRS 9
Amount rec-ognised in
the balance sheet under
IFRS 16
Amount rec-ognised in
the balance sheet under
IFRS 15
Fair value of financial
instru-mentsTotal
Amortised acquisition
cost
Fair value with no
effect on profit or
loss
Fair value through
profit and loss
Assets
AC 248.7 248.7 – – – – 248.7
Other assets n / a3 113.4 – – – – – –
FVTPL 8.5 – – 8.5 – – 8.5
Derivative financial instruments
Derivatives (FVTPL) FVTPL 27.3 – – 27.3 – – 27.3
Hedges (Hedge accounting)1 n / a3 14.8 – 14.8 – – – 14.8
Trade accounts receivable AC 1,239.8 1,239.8 – – – – 1,239.8
Cash and cash equivalents AC 511.6 511.6 – – – – 511.6
Liabilities
Financial debt FLAC 5,203.2 5,203.2 – – – – 5,277.2
FVTPL 0.6 – – 0.6 – – 0.6
Lease liabilities n / a3 1,193.4 – – – 1,193.4 – –
Other liabilities FLAC 104.0 104.0 – – – – 104.0
n / a3 26.4 – – – – – –
Liabilities from put options2 FLAC 1.6 1.6 – – – – 1.8
Derivative financial liabilities
Derivatives (FVTPL) FVTPL 8.0 – – 8.0 – – 8.0
Hedges (Hedge accounting)1 n / a3 26.4 – 26.4 – – – 26.4
Trade accounts payable FLAC 1,779.4 1,779.4 – – – – 1,779.4
Contract liabilities n / a3 372.9 – – – – 372.9 –
Thereof aggregated according to IFRS 9 classifi-cation category
Financial Assets measured at Amortized Cost (AC) 2,000.0 2,000.0 – – – – –
Financial Assets and Liabilities measured at Fair Value through Profit and Loss (FVTPL) 44.4 – – 44.4 – – –
Financial Liabilities measured at Amortized Cost (FLAC) 7,088.3 7,088.3 – – – – –
1 The market values of the non-designated time values and forward components, the changes of which are recognised in the reserve for cost of hedging are also included.
2 Part of other liabilities3 N / A means that this is not a financial instrument and thus a measurement category according to IFRS 9 is not applicable.
245
H a p a g - L L o y d a g I a n n u a L R e p o R t 2 0 1 9
n o t e s I C o n s o L I d a t e d f I n a n C I a L s t a t e M e n t s

The fair values are allocated to different levels of the fair value hierarchy based on the input fac-
tors used in the valuation methods. An explanation of the individual levels from 1 to 3 of the fair
value hierarchy can be found in the chapter “Accounting and measurement principles” in the
Notes to the consolidated financial statements. There were no transfers between levels 1 to 3 in
the previous financial year.
The following table shows the classification of the financial instruments measured at fair value in
the 3 levels of the fair value hierarchy. In addition to the fair value of the financial instruments that
are recognised at fair value under IFRS 9, the table also includes financial instruments that are
recognised at amortised cost and whose fair value differs from this.
million EUR
Classification category accord-
ing to IFRS 9
31.12.2018
Level 1 Level 2 Level 3 Total
Assets
Securities / investments FVTPL 2.2 0.7 – 2.9
Derivative financial instruments (Hedge accounting) n / a3 – 4.4 – 4.4
Derivative financial instruments (Trading) FVTPL – 3.7 – 3.7
Liabilities
Derivative financial instruments (Hedge accounting) n / a3 – 70.1 – 70.1
Derivative financial instruments (Trading) FVTPL – 2.4 – 2.4
Financial debt FVTPL – – 0.8 0.8
Financial debt FLAC 909.2 5,015.8 – 5,925.0
Lease liabilities1 n / a3 – 103.2 – 103.2
Liabilities from put options2 FLAC – – 1.8 1.8
1 Part of financial debt2 Part of other liabilities3 N / A means that this is not a financial instrument and thus a measurement category according to IFRS 9 is not applicable.
million EUR
Classification category accord-
ing to IFRS 9
31.12.2019
Level 1 Level 2 Level 3 Total
Assets
Securities / investments FVTPL 1.9 6.6 – 8.5
Derivative financial instruments (Hedge accounting) n / a2 – 14.8 – 14.8
Derivative financial instruments (Trading) FVTPL – 27.3 – 27.3
Liabilities
Derivative financial instruments (Hedge accounting) n / a2 – 26.4 – 26.4
Derivative financial instruments (Trading) FVTPL – 8.0 – 8.0
Financial debt FVTPL – – 0.6 0.6
Financial debt FLAC 472.8 4,804.4 – 5,277.2
Liabilities from put options1 FLAC – – 1.8 1.8
1 Part of other liabilities2 N / A means that this is not a financial instrument and thus a measurement category according to IFRS 9 is not applicable.
246
H a p a g - L L o y d a g I a n n u a L R e p o R t 2 0 1 9
C o n s o L I d a t e d f I n a n C I a L s t a t e M e n t s I n o t e s

Net earnings
The net earnings of the financial instruments by classification category pursuant to IFRS 9
are as follows:
million EUR
31.12.2019 31.12.2018
From interest
Other net earnings
Net earnings
From interest
Other net earnings
Net earnings
Financial assets measured at amortised cost 5.1 –18.2 –13.1 –0.2 –70.0 –70.2
Financial liabilities measured at amortised cost –312.7 16.5 –296.2 –327.1 72.3 –254.8
Financial assets and liabilities measured at fair value through profit or loss 17.4 0.2 17.7 –3.3 10.4 7.1
Total -290.2 –1.5 –291.7 –330.6 12.7 –317.9
In addition to interest expenses from the liabilities to banks and other financial debt, the net earn-
ings mainly comprise the foreign currency valuation of financial assets and liabilities as well as the
realised and unrealised earnings from derivative financial instruments that are not part of an
effective hedging relationship as set out in IFRS 9.
Capital management
The prime strategic objective of the Hapag-Lloyd Group is to achieve long-term profitable growth,
measured on the basis of the developments in transport volume, the key performance indicators
EBITDA and EBIT as well as the return on invested capital (ROIC) as an indicator of the perform-
ance within a period. The aim is to generate a return on invested capital at least equal to the
weighted average cost of capital (WACC) of the Group across one economic cycle in the medium
term. To facilitate comparison with other international shipping companies, the return on invested
capital is calculated and presented exclusively on the basis of the functional currency, the US
dollar.
The Hapag-Lloyd Group strives to achieve an adequate financial profile in order to guarantee the
continuation of the Company and its financial flexibility and independence. The goal of its capital
management is to safeguard the capital base over the long term. It intends to achieve this with a
healthy balance of financing requirements for the desired profitable growth.
Covenant clauses of a type customary on the market have been arranged for existing financing.
These clauses primarily concern certain equity and liquidity indicators of the Group along with
loan-to-value ratios. As at 31 December 2019, these covenants were fulfilled for the existing
financing. Based on current planning, the Executive Board expects that these covenants will
also be adhered to during the subsequent period.
247
H a p a g - L L o y d a g I a n n u a L R e p o R t 2 0 1 9
n o t e s I C o n s o L I d a t e d f I n a n C I a L s t a t e M e n t s

OTHER NOTES
(28) Government assistance
The Federal Maritime and Hydrographic Agency awarded training subsidies and subsidies for
marine personnel totalling EUR 9.7 million in 2019 (previous year: EUR 10.6 million) according to
the guideline for lowering indirect labour costs in the German marine industry. Overall, the Group
received assistance and subsidies of EUR 10.4 million in the reporting year (previous year:
EUR 11.2 million), which was recognised through profit and loss as a deduction from personnel
expenses.
In addition, Hapag-Lloyd USA, a wholly owned subsidiary of HLAG, receives government funding
as part of the Maritime Security Program (MSP). Government grants in the 2019 financial year
totalled EUR 25.0 million (previous year: EUR 25.0 million), which was recognised through profit
and loss as a deduction from transport expenses.
(29) Contingencies
Contingencies are contingent liabilities not accounted for in the statement of financial position
which are recognised in accordance with their amounts repayable estimated as at the balance
sheet date.
As at 31 December 2019, there were no sureties or guarantees requiring disclosure.
(30) Legal disputes
Hapag-Lloyd AG and several of its foreign subsidiaries are involved in legal proceedings. These
encompass a range of topics, such as disputes with foreign tax authorities, claims asserted by
departed employees and disputes arising from contractual relationships with customers, former
agents and suppliers. Naturally, the outcome of the legal disputes cannot be predicted with any
certainty. Provisions for pending and imminent proceedings are formed if a payment obligation
is probable and its amount can be determined reliably. It is possible that the outcome of individ-
ual proceedings for which no provisions were formed may result in payment obligations whose
amounts could not have been foreseen with sufficient accuracy as at 31 December 2019. Such
payment obligations will not have any significant influence on the Group’s net asset, financial and
earnings position. As at the reporting date, there was USD 10.2 million (EUR 9.1 million) in contin-
gent liabilities from legal disputes not classified as probable.
Hapag-Lloyd is subject to regular tax audits in various countries where the Group conducts
large-scale business activities (e.g. Germany, India, USA). These tax audits may lead to the pay-
ment of tax arrears. In addition, Hapag-Lloyd regularly analyses and assesses potential tax risks
within the Group (e.g. in the area of transfer pricing). To the extent that the Company can expect
to incur charges and these charges are quantifiable, these were accounted for by creating
corres ponding provisions. As at the reporting date, there was also EUR 48.5 million in contingent
liabilities from tax risks not classified as probable (previous year adjusted: EUR 40.7 million).
248
H a p a g - L L o y d a g I a n n u a L R e p o R t 2 0 1 9
C o n s o L I d a t e d f I n a n C I a L s t a t e M e n t s I n o t e s
(31) Leases
Lessee
As a lessee, Hapag-Lloyd rents container ships, containers, office buildings, office space and
parking spaces as well as other business equipment. The obligations under these contracts
were primarily classified as operating lease contracts until 31 December 2018. In addition,
Hapag- Lloyd leased container ships and containers through finance lease contracts until the
end of the 2018 reporting year. Since 1 January 2019, the former finance lease contracts have
been reported together with the former operating lease contracts in accordance with IFRS 16.
For further details, please refer to the section “New accounting standards”.
Charter agreements for container ships are nearly always structured as time charter contracts,
i.e. in addition to the capital costs, the charterer bears all of the ship operating costs, which are
reimbursed as part of the charter rate. Non-lease components which are included in the price
structure of the charter rates are not part of the lease liability. These costs are recognised in
the (consolidated) income statement based on the time at which they are incurred. Some of the
charter agreements contain renewal options enabling Hapag-Lloyd to respond flexibly to
changes in the market and secure the use of the container vessels. If the extension options were
exercised, potential lease payments of EUR 0.5 billion would arise. The potential lease payments
have not yet been recognised as part of the lease liability.
The structure of the container lease contracts varies. Many of the contracts contain mutual rights
of termination. The termination rights enable Hapag-Lloyd to react flexibly and at short notice to
changes in the market. If the termination rights are not exercised, potential leasing payments of
EUR 0.1 billion per year would result. The potential lease payments have not yet been recognised
as part of the lease liability.
The structure of the contracts for the office buildings, office space and parking space also varies.
Many of the contracts contain unilateral rights of termination. For further details, please refer to
section “New accounting standards”.
The lease contracts for the aforementioned asset classes have terms of between 1 and 17 years.
Hapag-Lloyd has leases for rented container ships, rented office buildings, office space and
parking spaces, rented vehicles and other business equipment, with terms of less than
12 months. No rights of use and no lease liabilities are recognised in the consolidated statement
of financial position for these short-term leases. In addition, the Company has leases for other
business equipment for which the underlying asset is of low value. No rights of use and no
lease liabilities are recognised in the consolidated statement of financial position for these low-
value leases either.
Hapag-Lloyd excludes IT contracts and contracts for intangible assets from the scope of
application of IFRS 16.
249
H a p a g - L L o y d a g I a n n u a L R e p o R t 2 0 1 9
n o t e s I C o n s o L I d a t e d f I n a n C I a L s t a t e M e n t s

The table below shows the development of rights of use for each asset class in the 2019
financial year:
million EUR VesselsRented
containers
Rented office buildings,
grounds and parking slots
Rented Vehicles
Fixtures, fittings,
tools and other office equipment Total
Carrying amounts right of use as at 1.1.2019 374.3 394.7 85.0 4.1 0.1 858.2
Carrying amounts finance leases as at 1.1.2019 84.0 88.0 – - – 172.1
Adjusted carrying amount IFRS 16 leases 458.3 482.7 85.0 4.1 0.1 1,030.2
Depreciation in reporting period –241.5 –192.6 –22.9 –2.1 - –459.2
Additions right of use in reporting period 429.3 159.5 22.0 1.9 - 612.8
Disposals right of use in reporting period – –13.9 –0.8 - – –14.8
Transfers –81.2 –3.0 –0.8 –0.4 – –85.4
Exchange rate differences 8.8 9.9 1.7 0.1 - 20.5
Carrying amounts right of use as at 31.12.2019 573.8 442.5 84.3 3.7 - 1,104.3
The rights of use for the asset classes listed are reported under the item “property, plant and
equipment”.
The remaining terms of the lease liabilities as at 31 December 2019 are presented in the table
on financial debt in section (24) Financial debt and lease liabilities.
The following table shows the effects of IFRS 16 Leases to the Income Statement in financial
year 2019:
million EUR 1.1.-31.12.2019
Transport expenses 9,707.0
Expenses from short term leases 297.0
Expenses from leases of low value assets 0.2
Expenses from variable lease payments –
Depreciation, amortisation and impairment 1,174.4
Depreciation of right of use 459.2
Interest expenses and similar expenses 72.6
Total cash outflows for leases came to EUR 0.9 billion in the 2019 financial year.
250
H a p a g - L L o y d a g I a n n u a L R e p o R t 2 0 1 9
C o n s o L I d a t e d f I n a n C I a L s t a t e M e n t s I n o t e s

As at 31 December 2019, future commitments under short-term leases totalled EUR 98.6 million
(31 December 2018: EUR 131.0 million). The decrease resulted primarily from the use of a practi-
cal expedient at the point of first-time application. All leases with a remaining term of less than
12 months were classified as short-term leases at the point of first-time application.
For disclosures on future cash outflows from leases which Hapag-Lloyd has already entered into
but which have not commenced yet, please refer to the section (32) Other financial obligations.
For information on sale and leaseback transactions carried out in 2019, please refer to Note (24)
Financial liabilities and lease liabilities.
The following provides comparative information for finance and operating lease contracts in
accordance with IAS 17 for the 2018 financial year for which Hapag-Lloyd was the lessee and
lessor.
Lessee – finance leases
The Hapag-Lloyd Group had finance lease contracts as at 31 December 2018. The items leased
in this regard were primarily ships and containers. The contracts had terms of up to 9 years.
The containers can continue to be used in line with the contracts once the term of a contract has
expired. As at 31 December 2018, the ships recognised in connection with the finance lease
contracts had a net carrying amount of EUR 84.0 million; the containers had a net carrying
amount of EUR 88.0 million.
The future minimum lease payments from finance lease contracts and their present values were
as follows as at 31 December 2018:
million EUR
31.12.2018
Remaining terms
Totalup to
1 year1 – 5
years
more than 5 years
Future minimum lease payments 113.5 44.5 67.8 1.2
Interest portion –14.5 –5.9 –8.5 –0.1
Present value 99.0 38.6 59.3 1.1
As at 31 December 2018, there were no expectations of future income from non-cancellable
subletting arrangements, nor were there any contingent rental payments.
251
H a p a g - L L o y d a g I a n n u a L R e p o R t 2 0 1 9
n o t e s I C o n s o L I d a t e d f I n a n C I a L s t a t e M e n t s
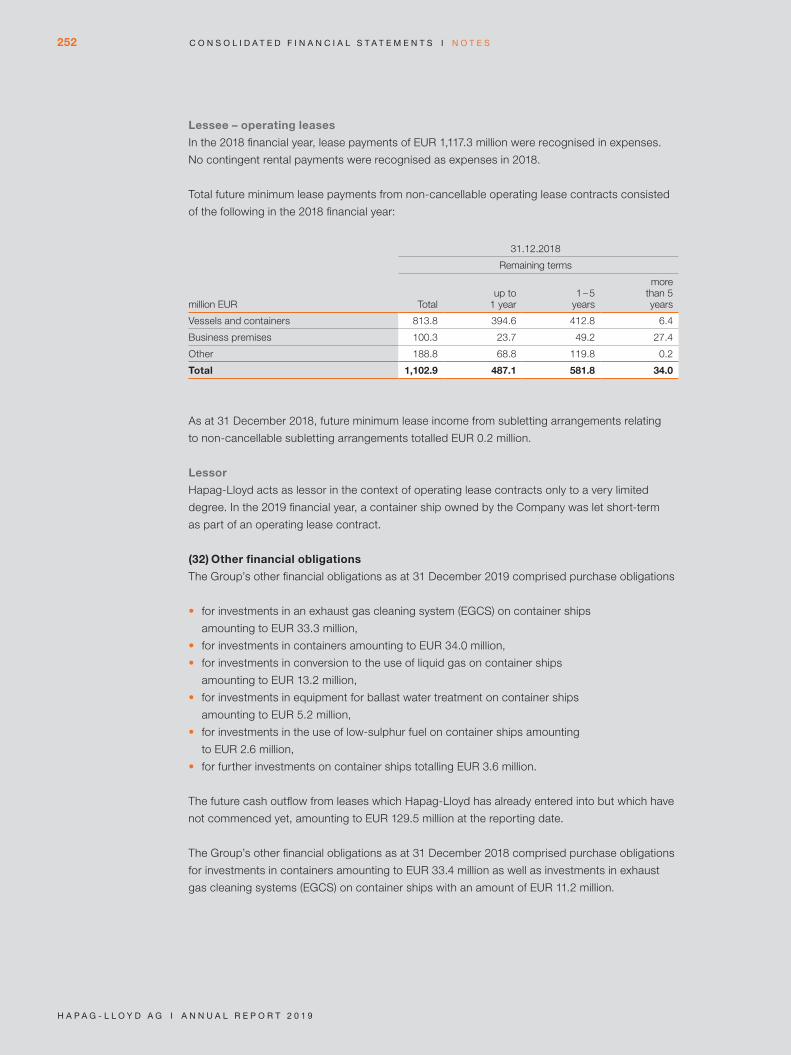
Lessee – operating leases
In the 2018 financial year, lease payments of EUR 1,117.3 million were recognised in expenses.
No contingent rental payments were recognised as expenses in 2018.
Total future minimum lease payments from non-cancellable operating lease contracts consisted
of the following in the 2018 financial year:
million EUR
31.12.2018
Remaining terms
Totalup to
1 year1 - 5
years
more than 5 years
Vessels and containers 813.8 394.6 412.8 6.4
Business premises 100.3 23.7 49.2 27.4
Other 188.8 68.8 119.8 0.2
Total 1,102.9 487.1 581.8 34.0
As at 31 December 2018, future minimum lease income from subletting arrangements relating
to non-cancellable subletting arrangements totalled EUR 0.2 million.
Lessor
Hapag-Lloyd acts as lessor in the context of operating lease contracts only to a very limited
degree. In the 2019 financial year, a container ship owned by the Company was let short-term
as part of an operating lease contract.
(32) Other financial obligations
The Group’s other financial obligations as at 31 December 2019 comprised purchase obligations
• for investments in an exhaust gas cleaning system (EGCS) on container ships
amounting to EUR 33.3 million,
• for investments in containers amounting to EUR 34.0 million,
• for investments in conversion to the use of liquid gas on container ships
amounting to EUR 13.2 million,
• for investments in equipment for ballast water treatment on container ships
amounting to EUR 5.2 million,
• for investments in the use of low-sulphur fuel on container ships amounting
to EUR 2.6 million,
• for further investments on container ships totalling EUR 3.6 million.
The future cash outflow from leases which Hapag-Lloyd has already entered into but which have
not commenced yet, amounting to EUR 129.5 million at the reporting date.
The Group’s other financial obligations as at 31 December 2018 comprised purchase obligations
for investments in containers amounting to EUR 33.4 million as well as investments in exhaust
gas cleaning systems (EGCS) on container ships with an amount of EUR 11.2 million.
252
H a p a g - L L o y d a g I a n n u a L R e p o R t 2 0 1 9
C o n s o L I d a t e d f I n a n C I a L s t a t e M e n t s I n o t e s

(33) Share-based payment
executive board members
As part of the Company’s IPO, long-term variable remuneration was introduced for Executive
Board members in the form of virtual shares. Under the long-term incentive plan (LTIP), a speci-
fied euro amount (allocation amount) contractually agreed on an individual basis is allocated to
each Executive Board member at the start of every calendar year, reflecting performance in the
current and following three financial years (performance period).
This allocation amount is converted into virtual shares in the Company based on the average
price of the Hapag-Lloyd AG share over the 60 trading days preceding the day on which the
shares are granted. For the second tranche after the IPO, which was granted on 4 January 2016,
there was a different calculation for the share price conversion. This share price was based on
the average of the 60 trading days that followed the 30th trading day after the IPO.
The virtual shares are divided equally into performance share units and retention share units.
Entitlements under the long-term incentive plan take effect on a pro rata basis when the per-
formance period ends. The retention share units automatically become non-forfeitable when the
performance period expires. They therefore depend entirely on the Executive Board member’s
length of service.
The number of performance share units relevant for the payment is dependent on a performance
factor. This factor is calculated by comparing the performance of the Hapag-Lloyd share (total
shareholder return – TSR) with a specific, industry-based reference index – the DAXglobal Ship-
ping index – over the 4-year performance period. The number of performance share units can be
a maximum of 1.5 times and a minimum of 0, as measured by a performance factor, when the
performance period ends. If the performance factor is 0, all of the performance share units are
forfeited.
When the performance period ends and the performance share units have been calculated, pay-
ments under the LTIP are automatically made. The number of non-forfeitable virtual shares is
converted into a euro amount by multiplying the non-forfeitable virtual retention and performance
shares by the relevant share price. This share price is equal to the average share price over the
last 60 trading days before the performance period ends.
The amount calculated in this way is paid to the respective Executive Board member as a gross
amount up to a specific, individually agreed limit on 31 March of the year following the end of the
performance period.
In the event that an Executive Board member’s activities cease, the performance period and the
employment contract will end simultaneously, insofar as the employment contract is not termi-
nated for cause attributable to the Executive Board member or by the Executive Board member
without cause. In the latter case, all entitlements under the long-term incentive plan are forfeited.
253
H a p a g - L L o y d a g I a n n u a L R e p o R t 2 0 1 9
n o t e s I C o n s o L I d a t e d f I n a n C I a L s t a t e M e n t s

If capital measures which affect the value of real shares are carried out during the term of the
LTIP, the conditions of the plan state that the Executive Board members must be treated like
owners of real shares as a basic principle. In the event of an ordinary capital increase, the stake
in the Company held by owners of real shares is diluted. However, they are granted subscription
rights to new shares in return. Under the conditions of the plan, the Executive Board members
are not automatically granted a subscription right in the event of an ordinary capital increase. To
compensate them for being treated differently to owners of real shares, for all LTIP tranches
belonging to Executive Board members which are in existence when a capital increase is carried
out, the number of shares is adjusted by a value equal to the subscription rights that an owner of
real shares with the same number of shares is entitled to. The additional virtual shares here are
valued at the arithmetical share price on the day before trading of the subscription rights com-
mences (ex-subscription rights). The rule must be applied separately to all LTIP tranches in exist-
ence at the time of the capital measure. The additional virtual shares are based directly on the
existing virtual shares of the respective LTIP tranches. As a result, the additional virtual shares
are given the same parameters as were defined in the conditions of the plan and at the time the
respective tranche was granted. The additional virtual shares are consequently a component of
the respective tranche.
The measurement of the virtual shares at the time they are granted is based on the allocation
amount. In the financial year, 86,800 virtual shares were granted (previous year: 72,744 shares)
with a fair value of EUR 2.6 million (previous year: EUR 2.5 million). As at 31 December 2019,
there were 312,988 virtual shares (previous year: 415,836 shares) with a fair value of
EUR 21.6 million (previous year: EUR 12.4 million).
In the reporting period, EUR 4.2 million (previous year: EUR 3.7 million) was recognised for share-
based payments to Executive Board members through profit or loss. The provision for share-
based payments to Executive Board members amounted to EUR 6.4 million as at 31 December
2019 (previous year: EUR 7.0 million).
upper management level
The members of upper management levels also receive long-term variable remuneration based
on virtual shares. Under this long-term incentive plan (LTIP), a specified euro amount (grant
amount) contractually agreed on an individual basis is granted to each plan participant on 1 Jan-
uary of every calendar year.
This grant amount is converted into virtual shares in the Company based on the average price
of the Hapag-Lloyd AG share over the 60 trading days preceding the day on which the shares
are granted. As a basic principle, the virtual shares are subject to a 3-year vesting period which
begins on 1 January of the calendar year in which the virtual shares are granted and ends on
31 December of the third subsequent year (vesting period).
When the vesting period expires, the virtual shares automatically become non-forfeitable and
the LTIP becomes due for payment. The number of non-forfeitable virtual shares is converted
into a euro amount by multiplying them by the relevant share price. This share price is equal to
the average share price over the last 60 trading days before the vesting period ends.
254
H a p a g - L L o y d a g I a n n u a L R e p o R t 2 0 1 9
C o n s o L I d a t e d f I n a n C I a L s t a t e M e n t s I n o t e s
The amount calculated in this way is paid to the respective plan participant as a gross amount on
31 March of the year following the end of the vesting period. The maximum payment amount is
equal to 1.5 times the grant amount.
In the event of an early departure, the vesting period is curtailed to the end of the employment
relationship and the virtual shares granted up until this time become non-forfeitable when the
curtailed vesting period ends. If the curtailed vesting period ends during the year, the virtual
shares granted in the year in which it ends are deemed to be non-forfeitable on a pro rata tem-
poris basis, and the payment amount is reduced accordingly on a pro rata temporis basis. If the
employment relationship ends due to extraordinary termination by the Company, all virtual
shares for which the vesting period has not yet expired are forfeited.
If capital measures which affect the value of real shares are carried out during the term of the
LTIP, the conditions of the plan state that the plan participants must be treated like owners of
real shares as a basic principle. In addition, the same regulations as detailed above in the section
on the LTIP of the Executive Board members are applicable in this regard.
The measurement of the virtual shares at the time they are granted is based on the grant
amount. In the financial year, 149.653 virtual shares were granted (previous year: 139.229
shares) with a fair value of EUR 4.5 million (previous year: EUR 4.7 million). As at 31 December
2019, there were 275,016 virtual shares (previous year: 134,418 shares) virtual with a fair value
of EUR 19.0 million (previous year: EUR 4.0 million).
In the reporting period, EUR 9.0 million (previous year: EUR 4.0 million) was recognised for share-
based payments to upper management level through profit or loss. The provision for share-
based payments to upper management level amounted to EUR 12.6 million as at 31 December
2019 (previous year: 3.9 million).
(34) Utilisation of Section 264 (3) of the German Commercial Code (HGB)
The following corporate entities, which are affiliated consolidated subsidiaries of Hapag-Lloyd AG
and for which the consolidated financial statements of Hapag-Lloyd AG are the exempting con-
solidated financial statements, utilise the exempting option provided by Section 264 (3) of the
German Commercial Code (HGB):
• Hapag-Lloyd Grundstücksholding GmbH, Hamburg
• Hapag-Lloyd Schiffsvermietungsgesellschaft mbH, Hamburg
• Zweite Hapag-Lloyd Schiffsvermietungsgesellschaft mbH, Hamburg
• Hamburg-Amerika Linie GmbH, Hamburg
255
H a p a g - L L o y d a g I a n n u a L R e p o R t 2 0 1 9
n o t e s I C o n s o L I d a t e d f I n a n C I a L s t a t e M e n t s
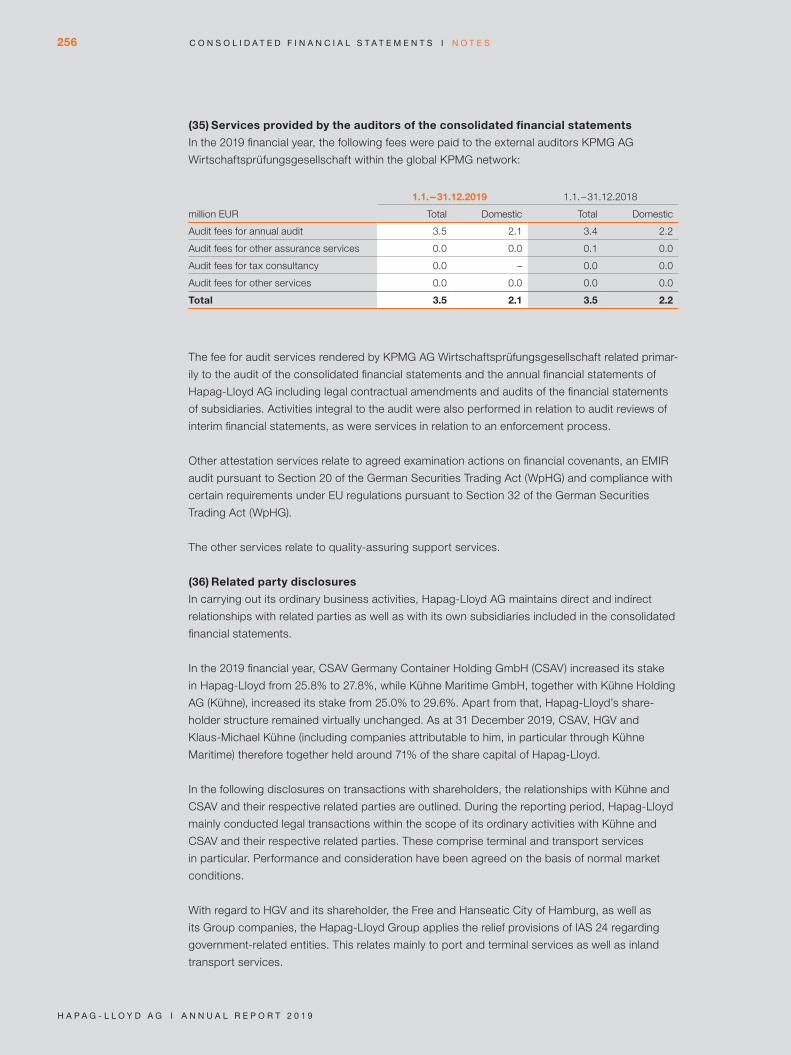
(35) Services provided by the auditors of the consolidated financial statements
In the 2019 financial year, the following fees were paid to the external auditors KPMG AG
Wirtschaftsprüfungsgesellschaft within the global KPMG network:
million EUR
1.1.-31.12.2019 1.1.-31.12.2018
Total Domestic Total Domestic
Audit fees for annual audit 3.5 2.1 3.4 2.2
Audit fees for other assurance services 0.0 0.0 0.1 0.0
Audit fees for tax consultancy 0.0 – 0.0 0.0
Audit fees for other services 0.0 0.0 0.0 0.0
Total 3.5 2.1 3.5 2.2
The fee for audit services rendered by KPMG AG Wirtschaftsprüfungsgesellschaft related primar-
ily to the audit of the consolidated financial statements and the annual financial statements of
Hapag-Lloyd AG including legal contractual amendments and audits of the financial statements
of subsidiaries. Activities integral to the audit were also performed in relation to audit reviews of
interim financial statements, as were services in relation to an enforcement process.
Other attestation services relate to agreed examination actions on financial covenants, an EMIR
audit pursuant to Section 20 of the German Securities Trading Act (WpHG) and compliance with
certain requirements under EU regulations pursuant to Section 32 of the German Securities
Trading Act (WpHG).
The other services relate to quality-assuring support services.
(36) Related party disclosures
In carrying out its ordinary business activities, Hapag-Lloyd AG maintains direct and indirect
relationships with related parties as well as with its own subsidiaries included in the consolidated
financial statements.
In the 2019 financial year, CSAV Germany Container Holding GmbH (CSAV) increased its stake
in Hapag-Lloyd from 25.8% to 27.8%, while Kühne Maritime GmbH, together with Kühne Holding
AG (Kühne), increased its stake from 25.0% to 29.6%. Apart from that, Hapag-Lloyd’s share-
holder structure remained virtually unchanged. As at 31 December 2019, CSAV, HGV and
Klaus-Michael Kühne (including companies attributable to him, in particular through Kühne
Maritime) therefore together held around 71% of the share capital of Hapag-Lloyd.
In the following disclosures on transactions with shareholders, the relationships with Kühne and
CSAV and their respective related parties are outlined. During the reporting period, Hapag-Lloyd
mainly conducted legal transactions within the scope of its ordinary activities with Kühne and
CSAV and their respective related parties. These comprise terminal and transport services
in particular. Performance and consideration have been agreed on the basis of normal market
conditions.
With regard to HGV and its shareholder, the Free and Hanseatic City of Hamburg, as well as
its Group companies, the Hapag-Lloyd Group applies the relief provisions of IAS 24 regarding
government-related entities. This relates mainly to port and terminal services as well as inland
transport services.
256
H a p a g - L L o y d a g I a n n u a L R e p o R t 2 0 1 9
C o n s o L I d a t e d f I n a n C I a L s t a t e M e n t s I n o t e s

Voting rights
in % 2019 2018
Kühne Holding AG / Kühne Maritime GmbH 29.6 25.0
CSAV Germany Container Holding GmbH 27.8 25.8
Qatar Holding Germany GmbH 14.5 14.5
HGV Hamburger Gesellschaft für Vermögens- und Beteiligungs- management mbH 13.9 13.9
Public Investment Fund of the Kingdom of Saudi Arabia 10.2 10.2
Free Float 4.0 10.6
Total 100.0 100.0
Transactions with related parties (excluding management in key positions):
million EUR
Delivered goods and services and other income recognised
Goods and services received and other expenses recognised
1.1.-31.12. 2019 1.1.-31.12. 2018 1.1.-31.12. 2019 1.1.-31.12. 2018
Shareholders 537.5 461.4 93.6 68.9
Affiliated non-con-solidated companies - – - 0.7
Associated companies and Joint Ventures 8.3 7.2 260.2 206.9
Total 545.8 468.6 353.8 276.5
million EUR
Receivables Liabilities
31.12.2019 31.12.2018 31.12.2019 31.12.2018
Shareholders 45.0 40.9 9.4 10.1
Affiliated non-con-solidated companies – – 0.2 0.3
Associated companies and Joint Ventures - 0.6 30.6 33.1
Total 45.0 41.5 40.2 43.5
The amounts for delivered goods and services and other income regognised arising from
transactions with related parties contained in the above table result from services rendered
(EUR 545.8 million; previous year: EUR 468.6 million).
Of the expenses for goods and services received and other expenses regognised shown
above, EUR 353.0 million result from operating services (previous year: EUR 275.9 million)
and EUR 0.8 million are from other services (previous year: EUR 0.6 million).
Remuneration of key management personnel
The remuneration of key management personnel in the Group to be disclosed under IAS 24
encompasses the remuneration paid to the current members of the Executive Board and
Supervisory Board of Hapag-Lloyd AG. The basic features of the remuneration system and the
amount of remuneration for the Executive Board and Supervisory Board are presented and
explained in more detail in the remuneration report. The remuneration report is part of the
Group management report.
257
H a p a g - L L o y d a g I a n n u a L R e p o R t 2 0 1 9
n o t e s I C o n s o L I d a t e d f I n a n C I a L s t a t e M e n t s

The active members of the Executive Board and the Supervisory Board were remunerated
as follows:
million EUR
Executive Board Supervisory Board
2019 2018 2019 2018
Short-term benefits 4.8 4.3 1.9 1.6
Post-employment benefits 0.3 0.4 – –
Share based benefits 4.2 3.7 – –
Total 9.3 8.6 1.9 1.6
In the 2019 financial year, the employee representatives on the Supervisory Board received
EUR 0.6 million (previous year: EUR 0.5 million) as part of their employment contracts, in addition
to their Supervisory Board emoluments. These are included in the remuneration for members of
the Supervisory Board pursuant to IAS 24.
Additional disclosures concerning total remuneration pursuant to Section 315 e
of the German Commercial Code (HGB)
million EUR
Executive Board Supervisory Board
2019 2018 2019 2018
Active board members 7.4 6.8 1.3 1.1
Former board members 0.9 1.1 – –
Total 8.3 7.9 1.3 1.1
The active Executive Board members were granted 86,800 virtual shares in total in the financial
year, with a fair value of EUR 2.6 million at the time they were granted (previous year: 72,744
virtual shares with a fair value of EUR 2.5 million).
A total of EUR 30.4 million was allocated to pension provisions for former Executive Board
members as at 31 December 2019 (previous year: EUR 24.5 million).
As in the previous year, no loans or advance payments were granted to members of the
Executive Board and Supervisory Board in the year under review.
(37) Declaration of conformity with the German Corporate Governance Code (GCGC)
pursuant to Section 161 of the German Stock Corporation Act (AktG)
The declaration required under Section 161 of the German Stock Corporation Act (AktG) was
issued by the Executive Board and Supervisory Board in June 2019 and has been made per-
manently available to shareholders on the Company’s website www.hapag-lloyd.com in the
“Investor Relations” section under “Corporate Governance” at https://www.hapaglloyd.com/
en/ir/corporate-governance/compliance-statement.html
258
H a p a g - L L o y d a g I a n n u a L R e p o R t 2 0 1 9
C o n s o L I d a t e d f I n a n C I a L s t a t e M e n t s I n o t e s
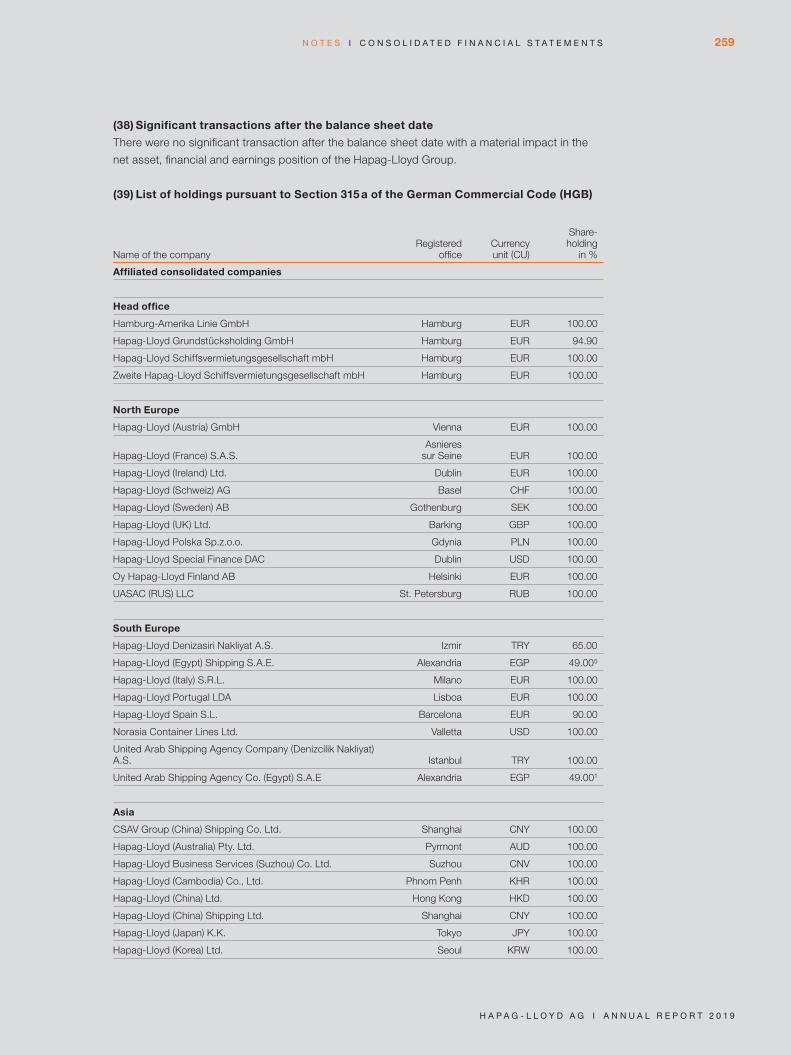
(38) Significant transactions after the balance sheet date
There were no significant transaction after the balance sheet date with a material impact in the
net asset, financial and earnings position of the Hapag-Lloyd Group.
(39) List of holdings pursuant to Section 315 a of the German Commercial Code (HGB)
Name of the companyRegistered
officeCurrency unit (CU)
Share- holding
in %
Affiliated consolidated companies
Head office
Hamburg-Amerika Linie GmbH Hamburg EUR 100.00
Hapag-Lloyd Grundstücksholding GmbH Hamburg EUR 94.90
Hapag-Lloyd Schiffsvermietungsgesellschaft mbH Hamburg EUR 100.00
Zweite Hapag-Lloyd Schiffsvermietungsgesellschaft mbH Hamburg EUR 100.00
North Europe
Hapag-Lloyd (Austria) GmbH Vienna EUR 100.00
Hapag-Lloyd (France) S.A.S.Asnieres
sur Seine EUR 100.00
Hapag-Lloyd (Ireland) Ltd. Dublin EUR 100.00
Hapag-Lloyd (Schweiz) AG Basel CHF 100.00
Hapag-Lloyd (Sweden) AB Gothenburg SEK 100.00
Hapag-Lloyd (UK) Ltd. Barking GBP 100.00
Hapag-Lloyd Polska Sp.z.o.o. Gdynia PLN 100.00
Hapag-Lloyd Special Finance DAC Dublin USD 100.00
Oy Hapag-Lloyd Finland AB Helsinki EUR 100.00
UASAC (RUS) LLC St. Petersburg RUB 100.00
South Europe
Hapag-Lloyd Denizasiri Nakliyat A.S. Izmir TRY 65.00
Hapag-Lloyd (Egypt) Shipping S.A.E. Alexandria EGP 49.005
Hapag-Lloyd (Italy) S.R.L. Milano EUR 100.00
Hapag-Lloyd Portugal LDA Lisboa EUR 100.00
Hapag-Lloyd Spain S.L. Barcelona EUR 90.00
Norasia Container Lines Ltd. Valletta USD 100.00
United Arab Shipping Agency Company (Denizcilik Nakliyat) A.S. Istanbul TRY 100.00
United Arab Shipping Agency Co. (Egypt) S.A.E Alexandria EGP 49.001
Asia
CSAV Group (China) Shipping Co. Ltd. Shanghai CNY 100.00
Hapag-Lloyd (Australia) Pty. Ltd. Pyrmont AUD 100.00
Hapag-Lloyd Business Services (Suzhou) Co. Ltd. Suzhou CNV 100.00
Hapag-Lloyd (Cambodia) Co., Ltd. Phnom Penh KHR 100.00
Hapag-Lloyd (China) Ltd. Hong Kong HKD 100.00
Hapag-Lloyd (China) Shipping Ltd. Shanghai CNY 100.00
Hapag-Lloyd (Japan) K.K. Tokyo JPY 100.00
Hapag-Lloyd (Korea) Ltd. Seoul KRW 100.00
259
H a p a g - L L o y d a g I a n n u a L R e p o R t 2 0 1 9
n o t e s I C o n s o L I d a t e d f I n a n C I a L s t a t e M e n t s

Name of the companyRegistered
officeCurrency unit (CU)
Share- holding
in %
Hapag-Lloyd (Malaysia) Sdn. Bhd. Kuala Lumpur MYR 100.00
Hapag-Lloyd (New Zealand) Ltd. Auckland NZD 100.00
Hapag-Lloyd Pte.Ltd. Singapore USD 100.00
Hapag-Lloyd (Taiwan) Ltd. Taipei TWD 100.00
Hapag-Lloyd (Thailand) Ltd. Bangkok THB 49.90
Hapag-Lloyd (Vietnam) Ltd.Ho Chi
Minh City VND 100.00
UASC (Thailand) Ltd. Bangkok THB 74.97
UASC Holding (Thailand) Ltd. Bangkok THB 49.95
United Arab Shipping Agency Co. (Asia) Pte Ltd. Singapore USD 100.00
United Arab Shipping Agency Company (Hong Kong) Ltd. Hong Kong HKD 100.00
United Arab Shipping Agency Company (Vietnam) Ltd.Ho Chi
Minh City VND 100.00
United Arab Shipping Co. (Asia) Pte. Ltd. Singapore SGD 100.00
United Arab Shipping Company (Shanghai) Ltd. Shanghai CNY 100.00
Middle East
Aratrans Transport and Logistics Service LLC Dubai AED 49.001
Hapag-Lloyd Africa (PTY) Ltd. Durban ZAR 100.00
Hapag-Lloyd Bahrain Co. WLL Manama BHD 49.00
Hapag-Lloyd Business Services LLP Mumbai INR 100.00
Hapag-Lloyd (Ghana) Ltd. Tema GHS 65.00
Hapag-Lloyd Global Services Pvt. Ltd. Thane INR 100.00
Hapag-Lloyd India Private Ltd. Mumbai INR 100.00
Hapag- Lloyd (Jordan) Private Limited Company (formerly United Arab Shipping Agencies Company Private Shareholding Company) Amman JOD 50.00
Hapag-Lloyd Middle East Shipping LLC Dubai AED 49.001
Hapag-Lloyd Pakistan (Pvt.) Ltd. Karachi PKR 100.00
Hapag-Lloyd Qatar WLL Doha QAR 49.00
Hapag-Lloyd Saudi Arabia Ltd. Jeddah SAR 60.00
Hapag-Lloyd Shipping Company – State of Kuwait (K.S.C.C.) Kuwait City KWD 49.001
Middle East Container Repair Company LLC Dubai AED 49.002
United Arab Shipping Agencies Co. LLC Dubai USD 49.001
United Arab Shipping Agency Co. (India) Pvt. Ltd. Chembur INR 100.00
United Arab Shipping Company Ltd. Dubai USD 100.00
United Arab Shipping Company for Maritime Services LLC Baghdad IQD 100.00
United Arab Shipping Company Services DMCCO Dubai AED 100.00
North America
Florida Vessel Management LLC Wilmington USD 75.00
Hapag-Lloyd (America) LLC Wilmington USD 100.00
Hapag-Lloyd (Canada) Inc. Montreal CAD 100.00
Hapag-Lloyd USA LLC Wilmington USD 100.00
Latin America
Agencias Grupo CSAV Mexico S.A. de C.V. Mexico City MXN 100.00
Andes Operador Multimodal Ltda. São Paulo BRL 100.00
260
H a p a g - L L o y d a g I a n n u a L R e p o R t 2 0 1 9
C o n s o L I d a t e d f I n a n C I a L s t a t e M e n t s I n o t e s
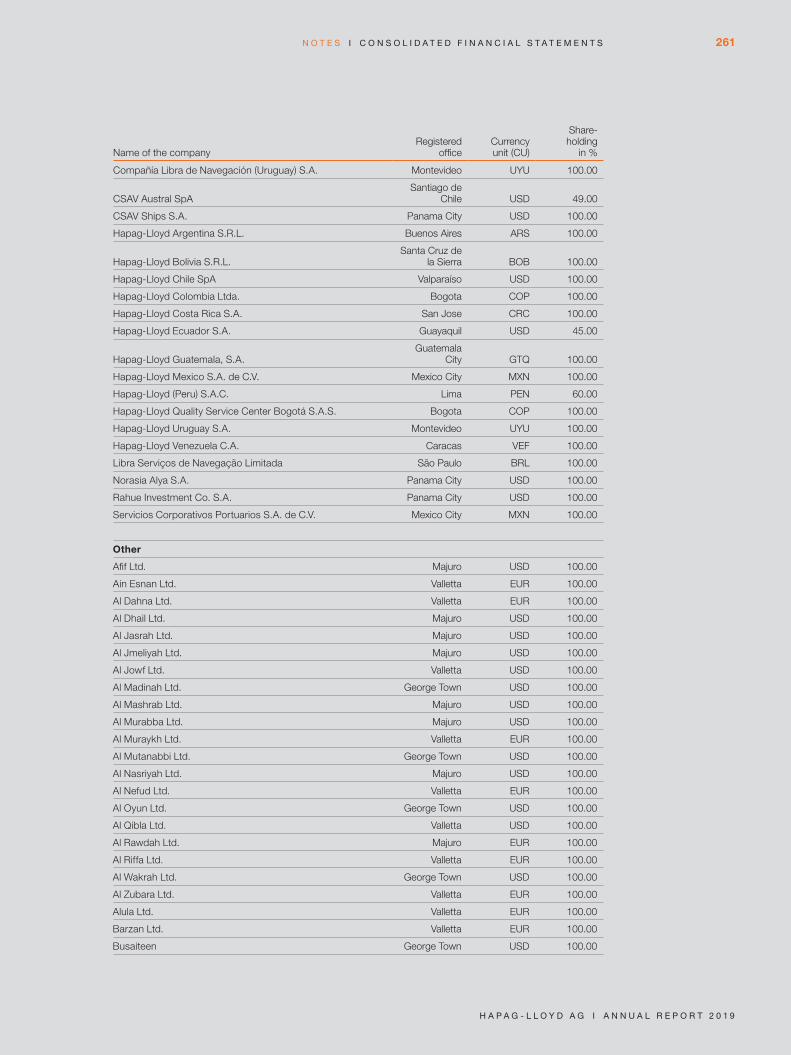
Name of the companyRegistered
officeCurrency unit (CU)
Share- holding
in %
Compañía Libra de Navegación (Uruguay) S.A. Montevideo UYU 100.00
CSAV Austral SpASantiago de
Chile USD 49.00
CSAV Ships S.A. Panama City USD 100.00
Hapag-Lloyd Argentina S.R.L. Buenos Aires ARS 100.00
Hapag-Lloyd Bolivia S.R.L.Santa Cruz de
la Sierra BOB 100.00
Hapag-Lloyd Chile SpA Valparaíso USD 100.00
Hapag-Lloyd Colombia Ltda. Bogota COP 100.00
Hapag-Lloyd Costa Rica S.A. San Jose CRC 100.00
Hapag-Lloyd Ecuador S.A. Guayaquil USD 45.00
Hapag-Lloyd Guatemala, S.A.Guatemala
City GTQ 100.00
Hapag-Lloyd Mexico S.A. de C.V. Mexico City MXN 100.00
Hapag-Lloyd (Peru) S.A.C. Lima PEN 60.00
Hapag-Lloyd Quality Service Center Bogotá S.A.S. Bogota COP 100.00
Hapag-Lloyd Uruguay S.A. Montevideo UYU 100.00
Hapag-Lloyd Venezuela C.A. Caracas VEF 100.00
Libra Serviços de Navegação Limitada São Paulo BRL 100.00
Norasia Alya S.A. Panama City USD 100.00
Rahue Investment Co. S.A. Panama City USD 100.00
Servicios Corporativos Portuarios S.A. de C.V. Mexico City MXN 100.00
Other
Afif Ltd. Majuro USD 100.00
Ain Esnan Ltd. Valletta EUR 100.00
Al Dahna Ltd. Valletta EUR 100.00
Al Dhail Ltd. Majuro USD 100.00
Al Jasrah Ltd. Majuro USD 100.00
Al Jmeliyah Ltd. Majuro USD 100.00
Al Jowf Ltd. Valletta USD 100.00
Al Madinah Ltd. George Town USD 100.00
Al Mashrab Ltd. Majuro USD 100.00
Al Murabba Ltd. Majuro USD 100.00
Al Muraykh Ltd. Valletta EUR 100.00
Al Mutanabbi Ltd. George Town USD 100.00
Al Nasriyah Ltd. Majuro USD 100.00
Al Nefud Ltd. Valletta EUR 100.00
Al Oyun Ltd. George Town USD 100.00
Al Qibla Ltd. Valletta USD 100.00
Al Rawdah Ltd. Majuro EUR 100.00
Al Riffa Ltd. Valletta EUR 100.00
Al Wakrah Ltd. George Town USD 100.00
Al Zubara Ltd. Valletta EUR 100.00
Alula Ltd. Valletta EUR 100.00
Barzan Ltd. Valletta EUR 100.00
Busaiteen George Town USD 100.00
261
H a p a g - L L o y d a g I a n n u a L R e p o R t 2 0 1 9
n o t e s I C o n s o L I d a t e d f I n a n C I a L s t a t e M e n t s
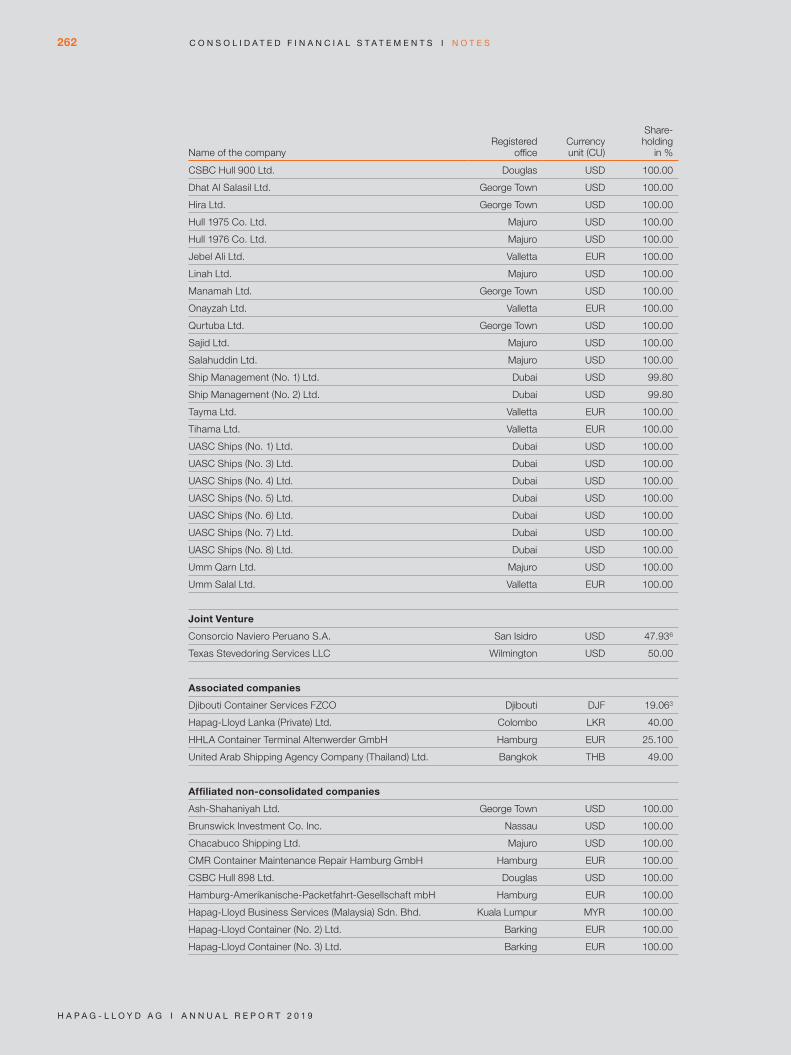
Name of the companyRegistered
officeCurrency unit (CU)
Share- holding
in %
CSBC Hull 900 Ltd. Douglas USD 100.00
Dhat Al Salasil Ltd. George Town USD 100.00
Hira Ltd. George Town USD 100.00
Hull 1975 Co. Ltd. Majuro USD 100.00
Hull 1976 Co. Ltd. Majuro USD 100.00
Jebel Ali Ltd. Valletta EUR 100.00
Linah Ltd. Majuro USD 100.00
Manamah Ltd. George Town USD 100.00
Onayzah Ltd. Valletta EUR 100.00
Qurtuba Ltd. George Town USD 100.00
Sajid Ltd. Majuro USD 100.00
Salahuddin Ltd. Majuro USD 100.00
Ship Management (No. 1) Ltd. Dubai USD 99.80
Ship Management (No. 2) Ltd. Dubai USD 99.80
Tayma Ltd. Valletta EUR 100.00
Tihama Ltd. Valletta EUR 100.00
UASC Ships (No. 1) Ltd. Dubai USD 100.00
UASC Ships (No. 3) Ltd. Dubai USD 100.00
UASC Ships (No. 4) Ltd. Dubai USD 100.00
UASC Ships (No. 5) Ltd. Dubai USD 100.00
UASC Ships (No. 6) Ltd. Dubai USD 100.00
UASC Ships (No. 7) Ltd. Dubai USD 100.00
UASC Ships (No. 8) Ltd. Dubai USD 100.00
Umm Qarn Ltd. Majuro USD 100.00
Umm Salal Ltd. Valletta EUR 100.00
Joint Venture
Consorcio Naviero Peruano S.A. San Isidro USD 47.936
Texas Stevedoring Services LLC Wilmington USD 50.00
Associated companies
Djibouti Container Services FZCO Djibouti DJF 19.063
Hapag-Lloyd Lanka (Private) Ltd. Colombo LKR 40.00
HHLA Container Terminal Altenwerder GmbH Hamburg EUR 25.100
United Arab Shipping Agency Company (Thailand) Ltd. Bangkok THB 49.00
Affiliated non-consolidated companies
Ash-Shahaniyah Ltd. George Town USD 100.00
Brunswick Investment Co. Inc. Nassau USD 100.00
Chacabuco Shipping Ltd. Majuro USD 100.00
CMR Container Maintenance Repair Hamburg GmbH Hamburg EUR 100.00
CSBC Hull 898 Ltd. Douglas USD 100.00
Hamburg-Amerikanische-Packetfahrt-Gesellschaft mbH Hamburg EUR 100.00
Hapag-Lloyd Business Services (Malaysia) Sdn. Bhd. Kuala Lumpur MYR 100.00
Hapag-Lloyd Container (No. 2) Ltd. Barking EUR 100.00
Hapag-Lloyd Container (No. 3) Ltd. Barking EUR 100.00
262
H a p a g - L L o y d a g I a n n u a L R e p o R t 2 0 1 9
C o n s o L I d a t e d f I n a n C I a L s t a t e M e n t s I n o t e s

Name of the companyRegistered
officeCurrency unit (CU)
Share- holding
in %
Hapag-Lloyd Container Ltd. Barking EUR 100.00
Hapag-Lloyd Quality Service Center Mauritius Port Louis MUR 100.00
Hapag-Lloyd Ships (No. 2) Ltd. Barking EUR 100.00
Hapag-Lloyd Ships Ltd. Barking EUR 100.00
Hull 1794 Co. Ltd. Majuro USD 100.00
Hull 2082 Co. Ltd. Majuro USD 100.00
Malik Al Ashtar Ltd. Valletta EUR 100.00
Malleco Shipping Co. S.A. Panama City USD 100.00
Maule Shipping Co. S.A. Panama City USD 100.00
Norddeutscher Lloyd GmbH Bremen EUR 100.00
Palena Shipping Ltd. Majuro USD 100.00
Servicios de Procesamiento Naviero S.R.L. i.L. Montevideo USD 100.00
Southern Shipmanagement Chile Ltda. Valparaíso USD 100.00
Southern Shipmanagement Co. S.A. Panama City USD 100.00
UASAC Groupement France G.I.E. Marseille EUR 100.00
UASC Services (India) Pvt. Ltd. i.L. Chembur INR 99.994
UASAC Uruguay (S.A.) Montevideo UYU 60.00
United Arab Shipping Agency Co. (Polska) Sp.z.o.o. i. L. Warsaw PLN 100.00
United Arab Shipping Agency Company (CEE) Kft. Budapest EUR 100.00
1 Additional 51,00% are hold by a trustee on behalf of Hapag-Lloyd Group.2 Additional 5.64% are hold by a trustee on behalf of Hapag-Lloyd Group.3 Additional 2.19% are hold by a trustee on behalf of Hapag-Lloyd Group.4 Additional 0.01% are hold by a trustee on behalf of Hapag-Lloyd Group.5 Additional 16.00% are hold by a trustee on behalf of Hapag-Lloyd Group. 6 Additional 2.07% are hold by a trustee on behalf of Hapag-Lloyd Group.
Hamburg, 10. March 2020
Hapag-Lloyd Aktiengesellschaft
Executive Board
Mark Frese Joachim SchlotfeldtDr Maximilian Rothkopf
Rolf Habben Jansen
263
H a p a g - L L o y d a g I a n n u a L R e p o R t 2 0 1 9
n o t e s I C o n s o L I d a t e d f I n a n C I a L s t a t e M e n t s
RESPONSIBILITY STATEMENT PURSU-ANT TO SECTION 297 (2) AND SECTION 315 (1) OF THE GERMAN COMMERCIAL CODE (HGB)
We confirm that, to the best of our knowledge and in accordance with the applicable accounting
principles, the consolidated financial statements of Hapag-Lloyd AG give a true and fair view of
the net asset, financial and earnings position of the Group and that the combined management
report includes a fair review of the development and performance of the business and the posi-
tion of the Group, together with a description of the principal opportunities and risks associated
with the expected development of the Group.
Hamburg, 10 March 2020
Hapag-Lloyd Aktiengesellschaft
Executive Board
Mark Frese Joachim SchlotfeldtDr Maximilian Rothkopf
Rolf Habben Jansen
264
H a p a g - L L o y d a g I a n n u a L R e p o R t 2 0 1 9
R e s p o n s I b I L I t y s t a t e M e n t
RESPONSIBILITY STATEMENT

INDEPENDENT AUDITOR’S REPORT
To Hapag-Lloyd Aktiengesellschaft, Hamburg
REPORT ON THE AUDIT OF THE CONSOLIDATED FINANCIAL STATEMENTS
AND OF THE COMBINED MANAGEMENT REPORT
Opinions
We have audited the consolidated financial statements of Hapag-Lloyd Aktiengesellschaft,
Hamburg, and its subsidiaries (the Group), which comprise the consolidated statement of finan-
cial position as at 31 December 2019, and the consolidated statement of profit or loss, the
consolidated statement of comprehensive income, the consolidated statement of changes in
equity and the consolidated statement of cash flows for the financial year from 1 January to
31 December 2019, and notes to the consolidated financial statements, including a summary of
significant accounting policies. In addition, we have audited the management report of Hapag-
Lloyd Aktiengesellschaft and the Group (combined management report) for the financial year
from 1 January to 31 December 2019. In accordance with German legal requirements, we have
not audited the content of those components of the combined management report specified in
the “Other Information” section of our auditor’s report.
In our opinion, on the basis of the knowledge obtained in the audit,
• the accompanying consolidated financial statements comply, in all material respects, with
the IFRSs as adopted by the EU, and the additional requirements of German commercial law
pursuant to Section 315e (1) HGB [Handelsgesetzbuch: German Commercial Code] and, in
compliance with these requirements, give a true and fair view of the assets, liabilities and
financial position of the Group as at 31 December 2019, and of its financial performance for
the financial year from 1 January to 31 December 2019, and
• the accompanying combined management report as a whole provides an appropriate view of
the Group’s position. In all material respects, this combined management report is consistent
with the consolidated financial statements, complies with German legal requirements and
appropriately presents the opportunities and risks of future development. Our opinion on the
combined management report does not cover the content of those components of the com-
bined management report specified in the “Other Information” section of the auditor’s report.
Pursuant to Section 322 (3) sentence 1 HGB, we declare that our audit has not led to any
reservations relating to the legal compliance of the consolidated financial statements and of
the combined management report.
265
H a p a g - L L o y d a g I a n n u a L R e p o R t 2 0 1 9
I n d e p e n d e n t a u d I t o R ’ s R e p o R t
INDEPENDENT AUDITOR’S REPORT
Basis for the Opinions
We conducted our audit of the consolidated financial statements and of the combined manage-
ment report in accordance with Section 317 HGB and EU Audit Regulation No 537/2014 (referred
to subsequently as “EU Audit Regulation”) and in compliance with German Generally Accepted
Standards for Financial Statement Audits promulgated by the Institut der Wirtschaftsprüfer [Insti-
tute of Public Auditors in Germany] (IDW). Our responsibilities under those requirements and
principles are further described in the “Auditor’s Responsibilities for the Audit of the Consolidated
Financial Statements and of the Combined Management Report” section of our auditor’s report.
We are independent of the group entities in accordance with the requirements of European law
and German commercial and professional law, and we have fulfilled our other German profes-
sional responsibilities in accordance with these requirements. In addition, in accordance with
Article 10 (2)(f) of the EU Audit Regulation, we declare that we have not provided non-audit
services prohibited under Article 5 (1) of the EU Audit Regulation. We believe that the evidence
we have obtained is sufficient and appropriate to provide a basis for our opinions on the con-
solidated financial statements and on the combined management report.
Key Audit Matters in the Audit of the Consolidated Financial Statements
Key audit matters are those matters that, in our professional judgement, were of most signifi-
cance in our audit of the consolidated financial statements for the financial year from 1 January
to 31 December 2019. These matters were addressed in the context of our audit of the con-
solidated financial statements as a whole, and in forming our opinion thereon, we do not provide
a separate opinion on these matters.
Accounting for unfinished voyages
For further information on the accounting policies applied, please refer to the disclosures in
the notes to the consolidated financial statements under “Fundamental accounting principles –
Realisation of income and expenses” and “Notes to the consolidated income statement –
(1) Revenue”.
266
H a p a g - L L o y d a g I a n n u a L R e p o R t 2 0 1 9
I n d e p e n d e n t a u d I t o R ’ s R e p o R t

THE FINANCIAL STATEMENT RISK
Revenue for unfinished voyages is recorded by Hapag-Lloyd by reference to the voyage progress
as at the reporting date. In determining voyage progress, the ratio of expenses incurred up to
the reporting date to the expected total expenses per voyage is relevant. Determining the trans-
port costs incurred in connection with the voyages unfinished as at the reporting date and the
margins underlying revenue recognition is a highly complex process.
There is the risk for the financial statements that revenue for unfinished voyages is not accurately
recognised in respect of the cut-off reporting date.
OUR AUDIT APPROACH
We assessed the design, implementation and effectiveness of the controls that are to ensure
accurate recognition cut-off of revenue as at the reporting date. We assessed the accounting
policies applied by Hapag-Lloyd for revenue recognition in terms of their compliance with the
requirements of IFRS 15. In addition, we assessed whether the policies defined by Hapag-Lloyd
for recognition cut-off are appropriately structured to ensure the recognition of revenue on an
accrual basis. We assessed the reliability of the analyses from the accounting system on an
accrual basis by examining representative samples of the underlying documents and the actual
voyage data. We assessed the method of calculating the margins for revenue recognition and
the required cut-off procedures at the reporting date and inspected the model for computa-
tional accuracy.
OUR OBSERVATIONS
Hapag-Lloyd’s approach with respect to revenue recognition cut-off is appropriate.
267
H a p a g - L L o y d a g I a n n u a L R e p o R t 2 0 1 9
I n d e p e n d e n t a u d I t o R ’ s R e p o R t

Completeness, accuracy and measurement of the right-of-use assets and
leaseliabilities according to the new accounting standard IFRS 16 Leases in
relation to ships and containers
THE FINANCIAL STATEMENT RISK
IFRS 16 Leases must be applied by Hapag-Lloyd for financial years starting on or after 1 January
2019. The new standard introduces for lessees a uniform accounting model for recognising
leases in the lessee’s statement of financial position. A lessee is required to recognise a right-of-
use asset representing its right to use the underlying leased asset and a lease liability represent-
ing its obligation to make lease payments.
The first-time application of the new financial reporting standard “IFRS 16 Leases” had a mate-
rial effect on the opening statement of financial position figures for the financial year and how
they were updated as at the reporting date. As at 31 December 2019, right-of-use assets of
EUR 1,031 million and lease liabilities of EUR 1,193 million are recognized in the consolidated
financial statements of Hapag-Lloyd AG. Right-of-use assets and lease liabilities account for 6%
and 7% of total assets respectively and thus have a material influence on the Company’s finan-
cial position.
The determination of the lease term, the amount of the lease payments and the incremental bor-
rowing rate used as the discount rate may require judgement and be based on estimates. Fur-
thermore, determining the first-time application effect of IFRS 16 and the updated lease liabilities
and right-of-use assets in accordance with the standard requires the recording of extensive data
from the lease agreements. There is the risk for the consolidated financial statements that the
lease liabilities and right-of-use assets are not recorded in full in the consolidated statement of
financial position. There is also the risk that the lease liabilities and right-of-use assets have not
been appropriately measured.
OUR AUDIT APPROACH
In an initial step, we gained an understanding of the process used to implement the new IFRS 16
accounting standard in the Hapag-Lloyd Group. We then analysed the business concept and the
accounting instructions underlying the implementation in terms of completeness and compliance
with IFRS 16.
As part of our control-based audit procedures, we assessed the appropriateness, implementa-
tion and effectiveness of the controls established by Hapag-Lloyd to ensure the full and correct
determination of the data used to measure the lease liabilities and right-of-use assets. If IT pro-
cessing systems were used to determine and collect relevant data, we tested the effectiveness
of rules and procedures relating to numerous IT applications and which support the effective-
ness of application controls, with the involvement of our IT experts.
268
H a p a g - L L o y d a g I a n n u a L R e p o R t 2 0 1 9
I n d e p e n d e n t a u d I t o R ’ s R e p o R t

As part of our test of details involving leases, we used contract documents, in some cases on the
basis of representative samples and in others on the basis of risk-oriented elements, to check
whether the relevant data was correctly and fully determined. To the extent that accounting
judgements were made for determining the lease term, we examined whether – in light of the
prevailing market conditions and risks in the industry – the underlying assumptions are compre-
hensible and consistent with other assumptions made in the financial statements.
With the involvement of our valuation experts, we compared the assumptions and parameters
underlying the incremental borrowing rates to our own assumptions and publicly available data.
We also assessed the calculation model for the interest rate in terms of appropriateness.
We verified the calculations on the carrying amounts recognised by Hapag-Lloyd for lease liabili-
ties and right-of-use assets in part on the basis of representative sampling and in part on the
basis of risk-oriented elements.
OUR OBSERVATIONS
Hapag-Lloyd has established appropriate procedures to record leases for the purposes of
IFRS 16. The assumptions and parameters used to measure the lease liabilities and right-of-use
assets are appropriate overall.
Other Information
Management and/or the Supervisory Board are/is responsible for the other information. The
other information comprises the following parts of the combined management report, whose
content was not audited:
• the corporate governance statement referred to in the combined management report, and
• the separate non-financial report, which will be provided to us expected after the date of this
independent auditor’s report, which is referred to in the combined management report.
The other information also includes the remaining parts of the annual report.
The other information does not include the consolidated financial statements, the combined
management report information audited for content and our auditor’s report thereon.
269
H a p a g - L L o y d a g I a n n u a L R e p o R t 2 0 1 9
I n d e p e n d e n t a u d I t o R ’ s R e p o R t
Our opinions on the consolidated financial statements and on the combined management report
do not cover the other information, and consequently we do not express an opinion or any other
form of assurance conclusion thereon.
In connection with our audit, our responsibility is to read the other information and, in so doing,
to consider whether the other information
• is materially inconsistent with the consolidated financial statements, with the information in the
combined management report audited for content or our knowledge obtained in the audit, or
• otherwise appears to be materially misstated.
Responsibilities of Management and the Supervisory Board for the Consolidated
Financial Statements and the Combined Management Report
Management is responsible for the preparation of consolidated financial statements that comply,
in all material respects, with IFRSs as adopted by the EU and the additional requirements of
German commercial law pursuant to Section 315e (1) HGB and that the consolidated financial
statements, in compliance with these requirements, give a true and fair view assets, liabilities,
financial position and financial performance of the Group. In addition, management is responsible
for such internal control as they have determined necessary to enable the preparation of con-
solidated financial statements that are free from material misstatement, whether due to fraud
or error.
In preparing the consolidated financial statements, management is responsible for assessing the
Group’s ability to continue as a going concern. They also have the responsibility for disclosing, as
applicable, matters related to going concern. In addition, they are responsible for financial report-
ing based on the going concern basis of accounting unless there is an intention to liquidate the
Group or to cease operations, or there is no realistic alternative but to do so.
Furthermore, management is responsible for the preparation of the combined management
report that, as a whole, provides an appropriate view of the Group’s position and is, in all material
respects, consistent with the consolidated financial statements, complies with German legal
requirements, and appropriately presents the opportunities and risks of future development. In
addition, management is responsible for such arrangements and measures (systems) as they
have considered necessary to enable the preparation of a combined management report that
is in accordance with the applicable German legal requirements, and to be able to provide suffi-
cient appropriate evidence for the assertions in the combined management report.
The Supervisory Board is responsible for overseeing the Group’s financial reporting process
for the preparation of the consolidated financial statements and of the combined management
report.
270
H a p a g - L L o y d a g I a n n u a L R e p o R t 2 0 1 9
I n d e p e n d e n t a u d I t o R ’ s R e p o R t

Auditor’s Responsibilities for the Audit of the Consolidated Financial Statements
and of the Combined Management Report
Our objectives are to obtain reasonable assurance about whether the consolidated financial
statements as a whole are free from material misstatement, whether due to fraud or error, and
whether the combined management report as a whole provides an appropriate view of the
Group’s position and, in all material respects, is consistent with the consolidated financial state-
ments and the knowledge obtained in the audit, complies with the German legal requirements
and appropriately presents the opportunities and risks of future development, as well as to issue
an auditor’s report that includes our opinions on the consolidated financial statements and on
the combined management report.
Reasonable assurance is a high level of assurance, but is not a guarantee that an audit con-
ducted in accordance with Section 317 HGB and the EU Audit Regulation and in compliance
with German Generally Accepted Standards for Financial Statement Audits promulgated by the
Institut der Wirtschaftsprüfer (IDW) will always detect a material misstatement. Misstatements
can arise from fraud or error and are considered material if, individually or in the aggregate, they
could reasonably be expected to influence the economic decisions of users taken on the basis
of these consolidated financial statements and this combined management report.
We exercise professional judgement and maintain professional scepticism throughout the audit.
We also:
• Identify and assess the risks of material misstatement of the consolidated financial statements
and of the combined management report, whether due to fraud or error, design and per-
form audit procedures responsive to those risks, and obtain audit evidence that is sufficient
and appropriate to provide a basis for our opinions. The risk of not detecting a material
misstatement resulting from fraud is higher than for one resulting from error, as fraud may
involve collusion, forgery, intentional omissions, misrepresentations, or the override of inter-
nal controls.
• Obtain an understanding of internal control relevant to the audit of the consolidated finan-
cial statements and of arrangements and measures (systems) relevant to the audit of the
combined management report in order to design audit procedures that are appropriate in
the circumstances, but not for the purpose of expressing an opinion on the effectiveness
of these systems.
• Evaluate the appropriateness of accounting policies used by management and the
reasonableness of estimates made by the management and related disclosures.
271
H a p a g - L L o y d a g I a n n u a L R e p o R t 2 0 1 9
I n d e p e n d e n t a u d I t o R ’ s R e p o R t

• Conclude on the appropriateness of management’s use of the going concern basis of
accounting and, based on the audit evidence obtained, whether a material uncertainty exists
related to events or conditions that may cast significant doubt on the Group’s ability to con-
tinue as a going concern. If we conclude that a material uncertainty exists, we are required to
draw attention in the auditor’s report to the related disclosures in the consolidated financial
statements and in the combined management report or, if such disclosures are inadequate,
to modify our respective opinions. Our conclusions are based on the audit evidence obtained
up to the date of our auditor’s report. However, future events or conditions may cause the
Group to cease to be able to continue as a going concern.
• Evaluate the overall presentation, structure and content of the consolidated financial state-
ments, including the disclosures, and whether the consolidated financial statements present
the underlying transactions and events in a manner that the consolidated financial statements
give a true and fair view of the assets, liabilities, financial position and financial performance
of the Group in compliance with IFRSs as adopted by the EU and the additional requirements
of German commercial law pursuant to Section 315e (1) HGB.
• Obtain sufficient appropriate audit evidence regarding the financial information of the entities
or business activities within the Group to express opinions on the consolidated financial state-
ments and on the combined management report. We are responsible for the direction, super-
vision and performance of the group audit. We remain solely responsible for our opinions.
• Evaluate the consistency of the combined management report with the consolidated financial
statements, its conformity with [German] law, and the view of the Group’s position it provides.
• Perform audit procedures on the prospective information presented by management in the
combined management report. On the basis of sufficient appropriate audit evidence we evalu-
ate, in particular, the significant assumptions used by management as a basis for the prospec-
tive information, and evaluate the proper derivation of the prospective information from these
assumptions. We do not express a separate opinion on the prospective information and on
the assumptions used as a basis. There is a substantial unavoidable risk that future events
will differ materially from the prospective information.
We communicate with those charged with governance regarding, among other matters, the
planned scope and timing of the audit and significant audit findings, including any significant
deficiencies in internal control that we identify during our audit.
We also provide those charged with governance with a statement that we have complied with
the relevant independence requirements, and communicate with them all relationships and other
matters that may reasonably be thought to bear on our independence, and where applicable,
the related safeguards.
272
H a p a g - L L o y d a g I a n n u a L R e p o R t 2 0 1 9
I n d e p e n d e n t a u d I t o R ’ s R e p o R t

From the matters communicated with those charged with governance, we determine those
matters that were of most significance in the audit of the consolidated financial statements of
the current period and are therefore the key audit matters. We describe these matters in our
auditor’s report unless law or regulation precludes public disclosure about the matter.
OTHER LEGAL AND REGULATORY REQUIREMENTS
Further Information pursuant to Article 10 of the EU Audit Regulation
We were elected as group auditor at the annual general meeting on 12 June 2019. We were
engaged by the chair of the Audit and Finance Committee of the Supervisory Board on 5 August
2019. We have been group auditor of Hapag-Lloyd Aktiengesellschaft, Hamburg, without inter-
ruption since financial year 2015.
We declare that the opinions expressed in this auditor’s report are consistent with the additional
report to the audit committee pursuant to Article 11 of the EU Audit Regulation (long-form audit
report).
GERMAN PUBLIC AUDITOR RESPONSIBLE FOR THE ENGAGEMENT
The German Public Auditor responsible for the engagement is Dr Victoria Röhricht.
Hamburg, 11 March 2020
KPMG AG
Wirtschaftsprüfungsgesellschaft
Madsen Dr. Röhricht
Wirtschaftsprüfer Wirtschaftsprüferin
[German Public Auditor] [German Public Auditor]
273
H a p a g - L L o y d a g I a n n u a L R e p o R t 2 0 1 9
I n d e p e n d e n t a u d I t o R ’ s R e p o R t

FINANCIAL CALENDAR
15 MAY 2020
Publication of quarterly financial report Q1 2020
5 JUNE 2020
Annual general meeting
14 AUGUST 2020
Publication of quarterly financial report H1 2020
13 NOVEMBER 2020
Publication of quarterly financial report 9M 2020
274 f I n a n C I a L C a L e n d a R
H a p a g - L L o y d a g I a n n u a L R e p o R t 2 0 1 9

IMPRINT
Hapag-Lloyd AG
Ballindamm 25
20095 Hamburg
Investor Relations
Phone: +49 40 3001 – 2896
E-mail: [email protected]
Corporate Communications
Phone: +49 40 3001 – 2529
E-mail: [email protected]
Concept and layout
Hapag-Lloyd Konzernkommunikation
Silvester Group, Hamburg
www.silvestergroup.com
www.hapag-lloyd.com

© H
apag
-Llo
yd C
orp
orat
e C
omm
unic
atio
ns 0
3/20
19©
Hap
ag-L
loyd
Cor
por
ate
Com
mun
icat
ions
03/
2020
www.hapag-lloyd.com