Annual Report 2018 - Roxas Holdings...Roxas Holdings, Inc. (RHI) tracked the national sugar...
42
Annual Report 2018
Transcript of Annual Report 2018 - Roxas Holdings...Roxas Holdings, Inc. (RHI) tracked the national sugar...
012018 ANNUAL REPORT
THE RIGHT FUNDAMENTALS: SUSTAINABILITY
Annual Report 2018
22018 ANNUAL REPORT
THE RIGHT FUNDAMENTALS: SUSTAINABILITY
12018 ANNUAL REPORT
ABOUT RHICORPORATE PROFILE
Roxas Holdings, Inc. (RHI) is one of the largest integrated sugar and ethanol producers in the Philippines and a first mover in agribusiness in the country. It manages sugar mill/refinery Central Azucarera Don Pedro, Inc. (CADPI) in Nasugbu, Batangas; sugar mill Central Azucarera de la Carlota, Inc. (CACI) in La Carlota City, Negros Occidental; ethanol producers Roxol Bioenergy Corporation (RBC), also in La Carlota City, and San Carlos Bioenergy, Inc. (SCBI) in San Carlos City — both in Negros Occidental; and agribusiness mover RHI Agri-business Development Corporation (RHI ADC). It also holds 45% interest in affiliate Hawaiian-Philippine Company (HPCo) in Silay, Negros Occidental.
RHI is listed at the Philippine Stock Exchange (PSEi: ROX). Further information can be obtained at www.roxasholdings.com.ph.
SUSTAINABILITYTHE RIGHT FUNDAMENTALS:
Roxas Holdings, Inc. (RHI) holds steadfastly onto the value of having the right fundamentals in every aspect of its operations. It ensures that its strategies are well-aligned to propel sustainable growth and to promote the welfare of its people and those in nearby communities while gently protecting the environment.
Striking a balance in its operations, its people and the concomitant challenges that beset the environment is a tough act. However, RHI is committed to deliver results without compromising people and the environment. Its uncompromising determination to sustainability in steering its businesses – be it sugar, ethanol, or agribusiness development – defines the Group.
With this mindset, RHI puts high premium on sustainability through a thorough and synchronized way of approaching businesses vis-à-vis the environment across all its operations—building on its strengths and weaving into its everyday operations the value of innovation and strategy on a focused trajectory.
Amounts in PhP M(Except for the last three items)
2018 2017 2016 2015 2014 2013 2012* 2011 2010 2009
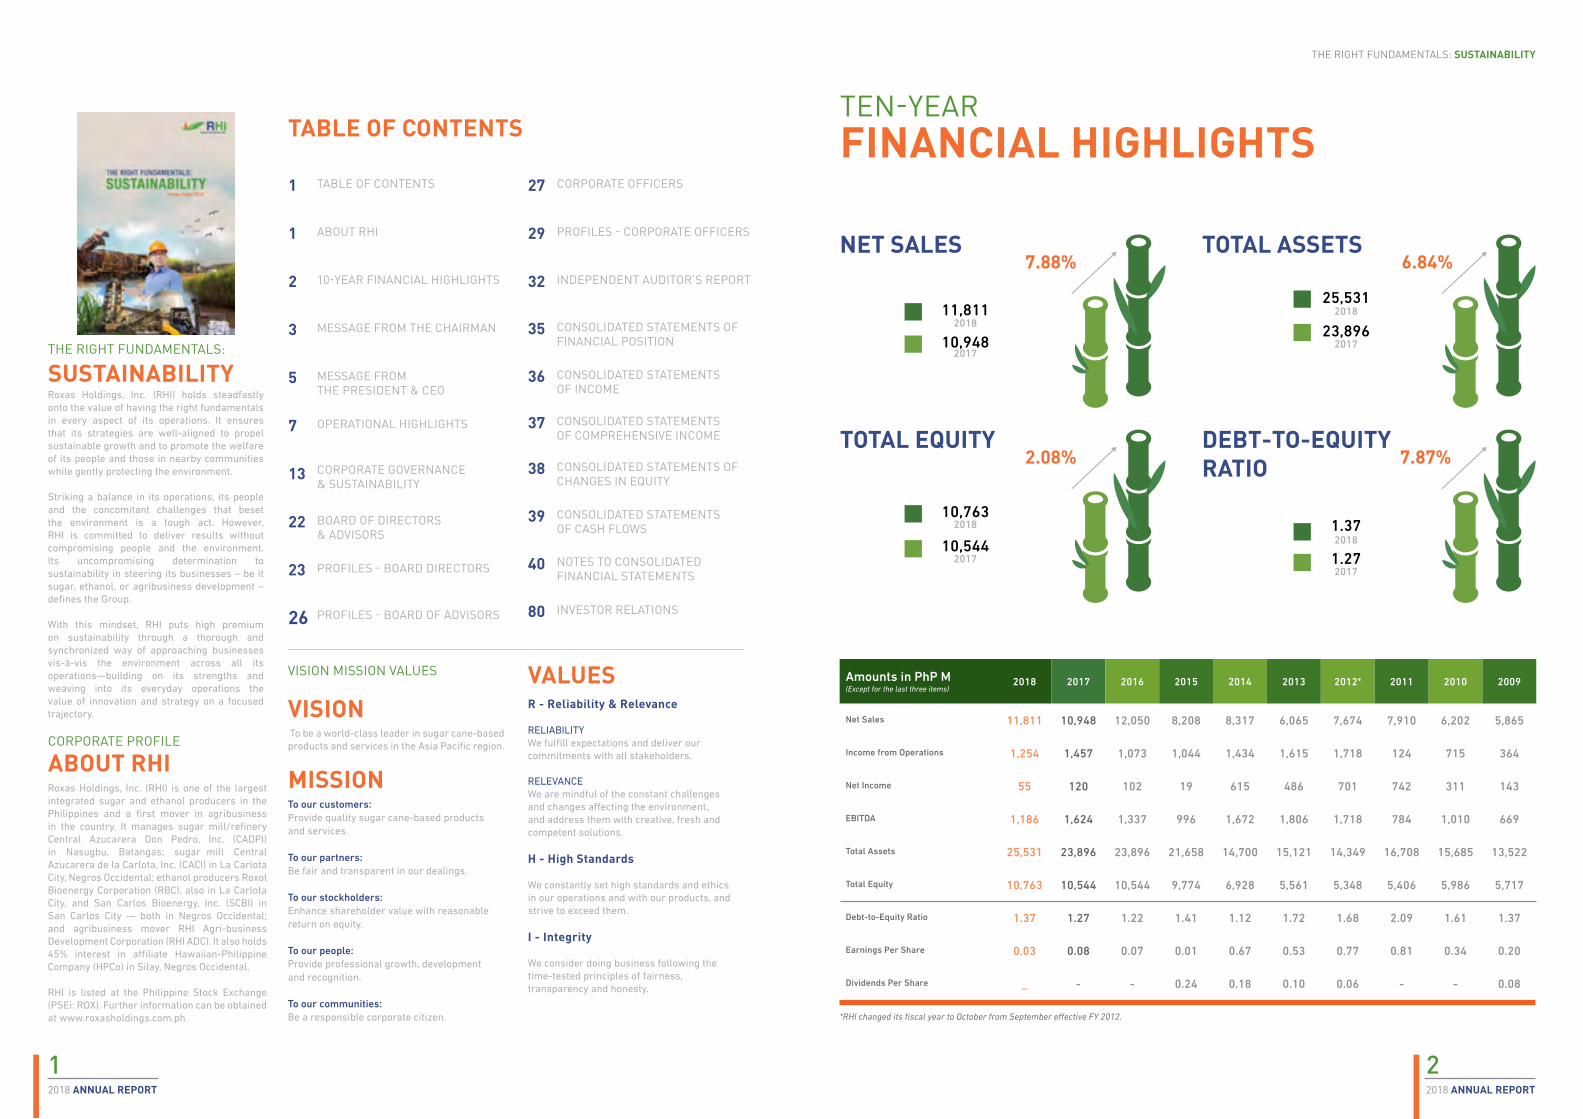
Net Sales 11,811 10,948 12,050 8,208 8,317 6,065 7,674 7,910 6,202 5,865
Income from Operations 1,254 1,457 1,073 1,044 1,434 1,615 1,718 124 715 364
Net Income 55 120 102 19 615 486 701 742 311 143
EBITDA 1,186 1,624 1,337 996 1,672 1,806 1,718 784 1,010 669
Total Assets 25,531 23,896 23,896 21,658 14,700 15,121 14,349 16,708 15,685 13,522
Total Equity 10,763 10,544 10,544 9,774 6,928 5,561 5,348 5,406 5,986 5,717
Debt-to-Equity Ratio 1.37 1.27 1.22 1.41 1.12 1.72 1.68 2.09 1.61 1.37
Earnings Per Share 0.03 0.08 0.07 0.01 0.67 0.53 0.77 0.81 0.34 0.20
Dividends Per Share _ - - 0.24 0.18 0.10 0.06 - - 0.08
*RHI changed its fiscal year to October from September effective FY 2012.
FINANCIAL HIGHLIGHTSTEN-YEAR
TABLE OF CONTENTS
1 29
27
26 80
3 35
1
23
5 36
37
13
39
2 32
7
38
22
40
TABLE OF CONTENTS
PROFILES - CORPORATE OFFICERS
CORPORATE OFFICERS
ABOUT RHI
PROFILES - BOARD OF ADVISORS
10-YEAR FINANCIAL HIGHLIGHTS
MESSAGE FROM THE CHAIRMAN
PROFILES - BOARD DIRECTORS
INDEPENDENT AUDITOR’S REPORT
CONSOLIDATED STATEMENTS OFFINANCIAL POSITION
CONSOLIDATED STATEMENTSOF INCOME
CONSOLIDATED STATEMENTSOF COMPREHENSIVE INCOME
CONSOLIDATED STATEMENTS OFCHANGES IN EQUITY
CONSOLIDATED STATEMENTSOF CASH FLOWS
NOTES TO CONSOLIDATEDFINANCIAL STATEMENTS
INVESTOR RELATIONS
MESSAGE FROM THE PRESIDENT & CEO
CORPORATE GOVERNANCE& SUSTAINABILITY
OPERATIONAL HIGHLIGHTS
BOARD OF DIRECTORS& ADVISORS
NET SALES
201710,948
11,8112018
TOTAL ASSETS6.84%
201723,896
25,5312018
DEBT-TO-EQUITYRATIO 7.87%
20171.27
1.372018
TOTAL EQUITY2.08%
7.88%
2017
2018
10,544
10,763
VISION
MISSION
VALUESVISION MISSION VALUES
To be a world-class leader in sugar cane-based products and services in the Asia Pacific region.
To our customers:Provide quality sugar cane-based products and services.
To our partners:Be fair and transparent in our dealings.
To our stockholders:Enhance shareholder value with reasonable return on equity.
To our people:Provide professional growth, development and recognition.
To our communities:Be a responsible corporate citizen.
R - Reliability & Relevance
RELIABILITYWe fulfill expectations and deliver our commitments with all stakeholders.
RELEVANCEWe are mindful of the constant challenges and changes affecting the environment, and address them with creative, fresh and competent solutions.
H - High Standards
We constantly set high standards and ethics in our operations and with our products, and strive to exceed them.
I - Integrity
We consider doing business following the time-tested principles of fairness, transparency and honesty.
432018 ANNUAL REPORT2018 ANNUAL REPORT
THE RIGHT FUNDAMENTALS: SUSTAINABILITY
The future looks promising for RHI as we see consistent improvements at our plants. Although we still foresee hurdles along the way, which is a reality in every journey, we believe that our vision of RHI as a world-class leader in sugar and sugarcane-based products in the Asia Pacific is not far-fetched.
As we have done throughout the years, let us continue to remainrelevant and reliable, consciously striving to keep our high standards, and living and working with integrity.
With this set of right fundamentals, healthily balanced with sustainability, let us steer significant and life-changing social impact for RHI, our communities, our partners, the government, and the country.
We are well positioned to deliver sustainable earnings growth in the coming year. Our optimism is hinged on how well we braved the challenges in the past crop year, and on the continuing support of our investors and other stakeholders.
As we look back and prepare for CY 2019, we thank you for your constant support to RHI.
We are deeply grateful as well to our esteemed Board of Directors whose wise guidance and direction steer RHI to newer heights; to our Board of Advisors, whose staunch counsel ensure the Group is well grounded; our Management, whose untiring devotion keeps RHI on track; to our employees and staff, whose commitment and loyalty drive RHI to go beyond what is expected; and to our partners as well as other stakeholders, for trusting RHI to do what is right and sustainable in every situation.
Together, let us rise up to the challenge and work together to catapult RHI as a leader in sugar and sugarcane-based products farther into the Asia Pacific region.
Thank you.
business unit produced significantly higher volume of ethanol at 74.35 million liters from 69.54 million liters in 2017.
The combination of our prudent practices and conscious implementation of sustainable measures has helped the Group weather the challenges of the past year.
As an integrated sugar and ethanol producer, and a first mover in the area of agribusiness, RHI is determined to deepen its commitment to sustainability through meaningful engagements within and outside of our plants. We see a better and more sustainable future ahead of us at RHI.
Our story constantly evolves with the changing times but our commitment to protect the environment and help people is intertwined with our clear vision for the Group.
As such, we assure you that we tailor solutions and craft actions for our day-to-day operations on the principles of sustainability and social responsibility.
Having established a set of right fundamentals, which embraces relevance and reliability, high standards and integrity, RHI will stick to the path of sustainability with a firm resolve to make a stark difference in the lives of Filipinos.
Putting together timely, responsive and strategically sustainable policies and actions to countless hurdles at its plants and within its communities is a tough order for RHI. However, given RHI’s focused direction on driving sustainability across all facets of its strategic business units, the Group will emerge strong despite the avalanche of unexpected and uncontrolled conditions that may affect its operations.
As we put in place sustainability measures across the Group, we are also working to reduce our debts significantly to make us agile in assessing risks and evaluating solutions to promote farm research, development and mechanization, and technological advances in the areas of sugar and ethanol production.
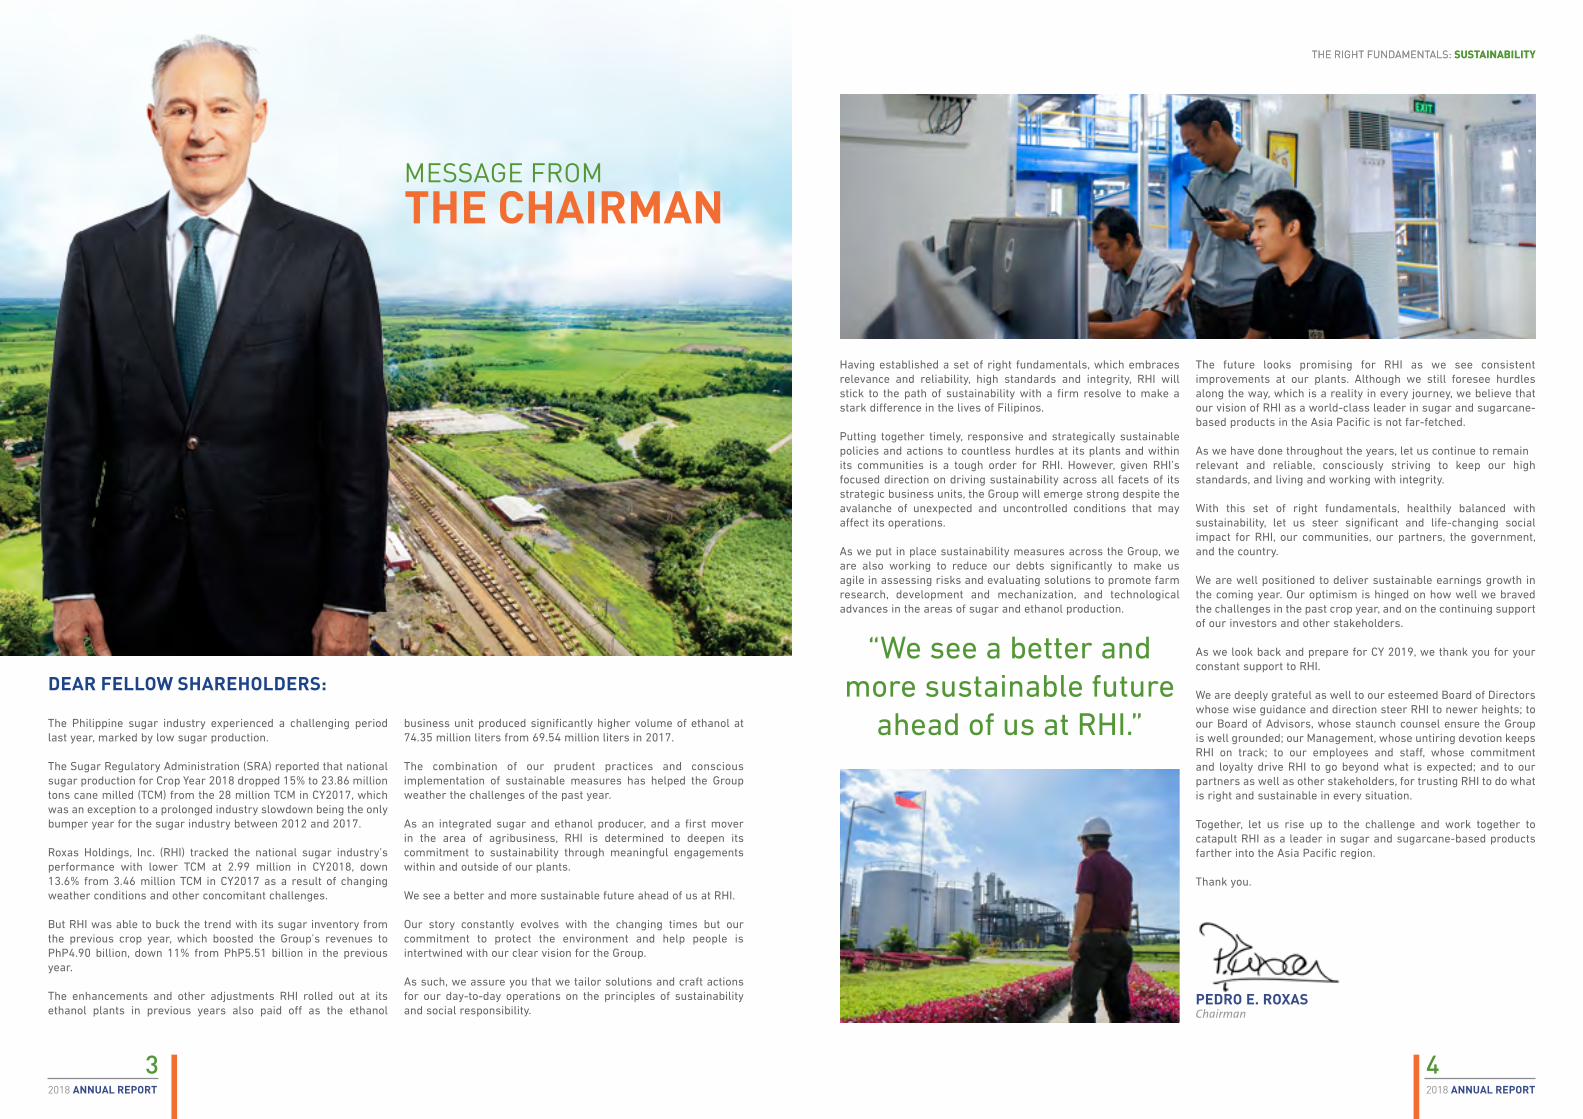
PEDRO E. ROXASChairman
THE RIGHT FUNDAMENTALS: SUSTAINABILITY
THE CHAIRMANMESSAGE FROM
The Philippine sugar industry experienced a challenging period last year, marked by low sugar production.
The Sugar Regulatory Administration (SRA) reported that national sugar production for Crop Year 2018 dropped 15% to 23.86 million tons cane milled (TCM) from the 28 million TCM in CY2017, which was an exception to a prolonged industry slowdown being the only bumper year for the sugar industry between 2012 and 2017.
Roxas Holdings, Inc. (RHI) tracked the national sugar industry’s performance with lower TCM at 2.99 million in CY2018, down 13.6% from 3.46 million TCM in CY2017 as a result of changing weather conditions and other concomitant challenges.
But RHI was able to buck the trend with its sugar inventory from the previous crop year, which boosted the Group’s revenues to PhP4.90 billion, down 11% from PhP5.51 billion in the previous year.
The enhancements and other adjustments RHI rolled out at its ethanol plants in previous years also paid off as the ethanol
“We see a better andmore sustainable future
ahead of us at RHI.”DEAR FELLOW SHAREHOLDERS:
652018 ANNUAL REPORT2018 ANNUAL REPORT
THE RIGHT FUNDAMENTALS: SUSTAINABILITY
We also saw some improvements in the Local Monthly Allocation (LMA) Compliance of oil companies/customers due to a positive margin of gasoline retail price over local ethanol price as an impact of the Tax Reform for Acceleration and Inclusion (TRAIN) Law.
However, the Group also had to contend with the relatively high production cost due to lower volume of internally-generated bagasse, coupled with a spike in the cost of outside fuel.
Such improvements in profitability were not sufficient to absorb the impact of our Sugar SBU performance. RHI net income for the year was PhP55 million, down from PhP120 million last year.
RHI – as one of the Philippines’ few integrated sugar and ethanol producers, and being a first mover in the area of agribusiness – moved swiftly and wisely with the times in keeping with its commitment to sustainability, and remains prudent and agile in continuously crafting the best available commercial mix for its businesses.
Despite the challenges, RHI continues to actively explore ways to protect the environment while ensuring cost-efficient operations in all its plants.
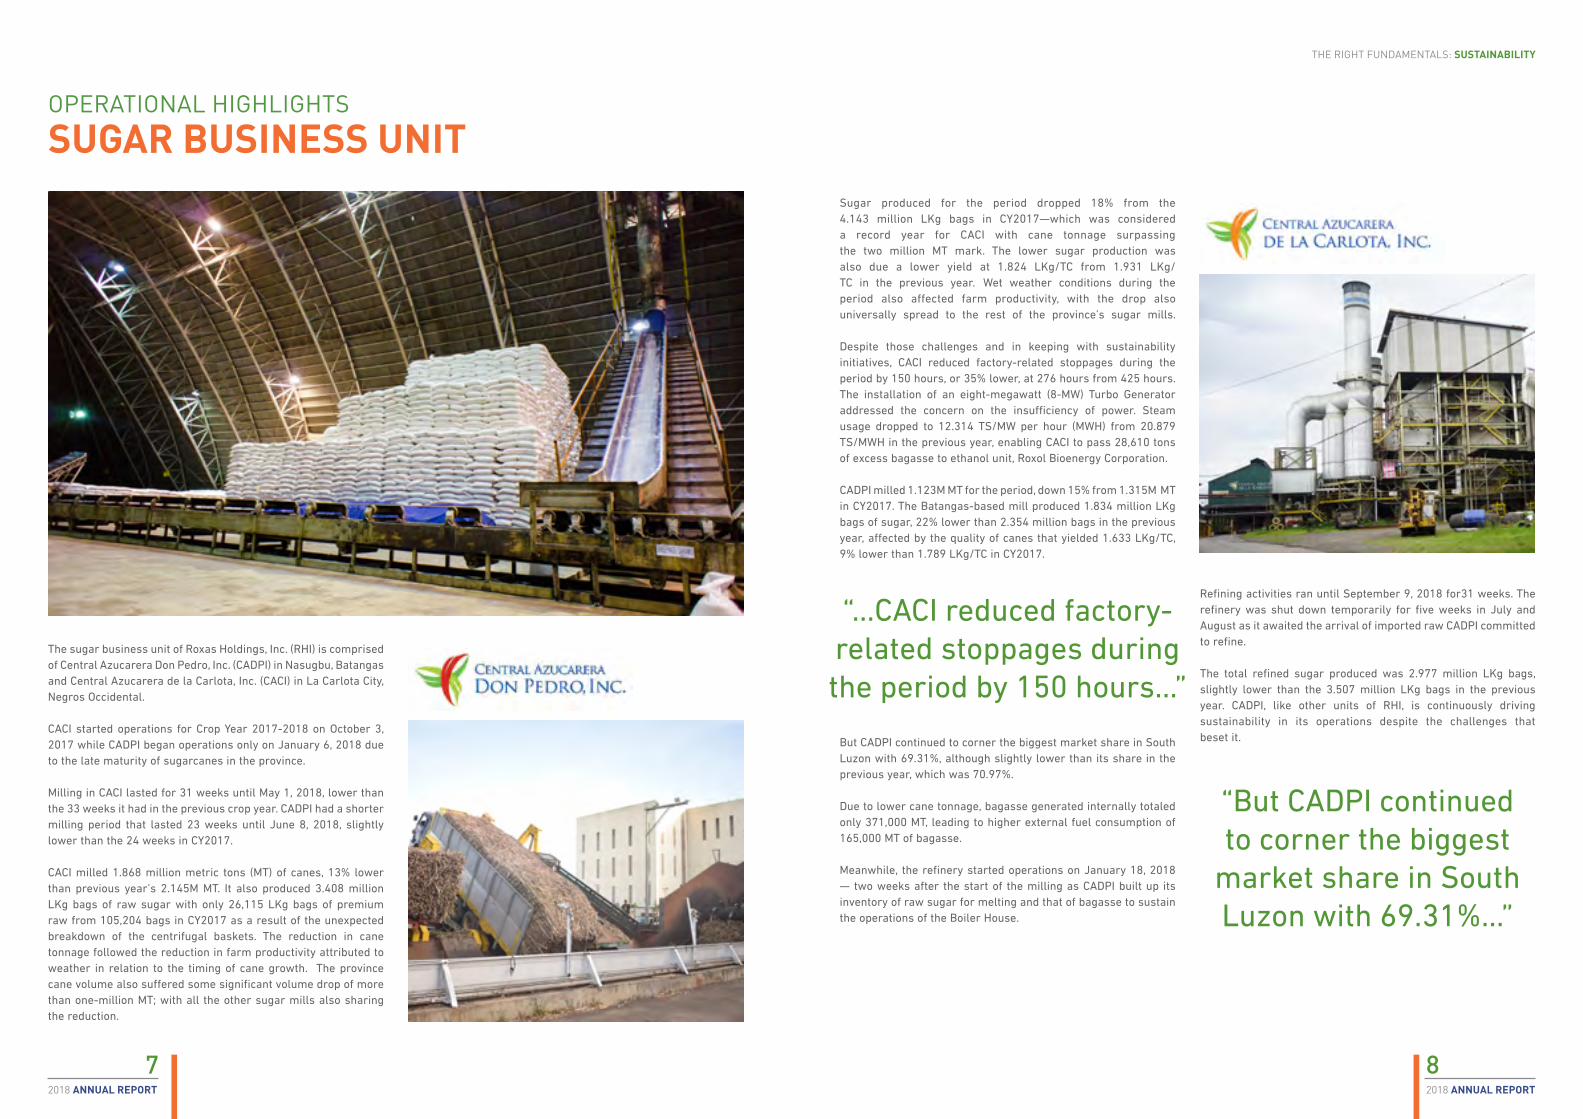
In addition to the Anaerobic Digesters (ADs) previously installed at Roxol Bioenergy Corporation (RBC), RHI inaugurated last November 2018 two units of multi-million-peso ADs at San Carlos Bioenergy, Inc. (SCBI) – a testament to the Group’s commitment to preserve and protect Mother Nature, in support of its campaign for sustainability. This is likewise expected to reduce the fuel cost of our ethanol – given the increased biogas that will be generated by the ADs from SCBI and RBC. The projected volume of biogas to be generated by these ADs is estimated to displace up to 30% of its fuel costs at full operation.
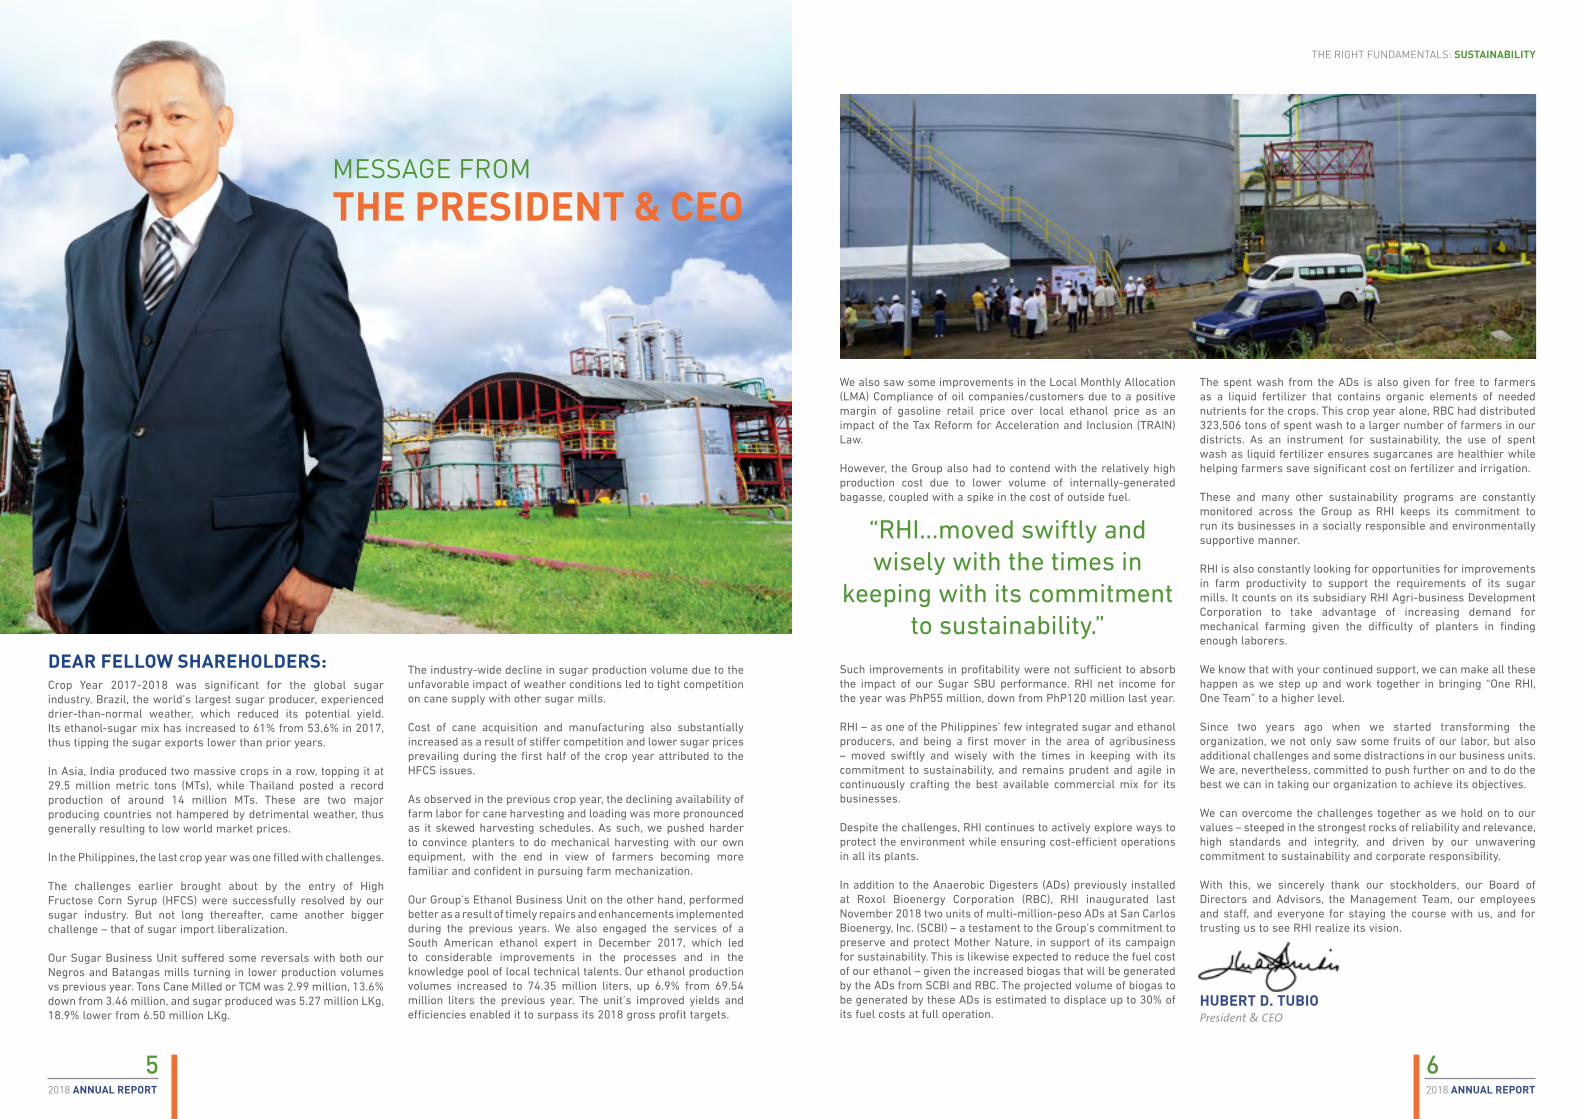
THE PRESIDENT & CEOMESSAGE FROM
HUBERT D. TUBIOPresident & CEO
DEAR FELLOW SHAREHOLDERS:Crop Year 2017-2018 was significant for the global sugar industry. Brazil, the world’s largest sugar producer, experienced drier-than-normal weather, which reduced its potential yield. Its ethanol-sugar mix has increased to 61% from 53.6% in 2017, thus tipping the sugar exports lower than prior years.
In Asia, India produced two massive crops in a row, topping it at 29.5 million metric tons (MTs), while Thailand posted a record production of around 14 million MTs. These are two major producing countries not hampered by detrimental weather, thus generally resulting to low world market prices.
In the Philippines, the last crop year was one filled with challenges.
The challenges earlier brought about by the entry of High Fructose Corn Syrup (HFCS) were successfully resolved by our sugar industry. But not long thereafter, came another bigger challenge – that of sugar import liberalization.
Our Sugar Business Unit suffered some reversals with both our Negros and Batangas mills turning in lower production volumes vs previous year. Tons Cane Milled or TCM was 2.99 million, 13.6% down from 3.46 million, and sugar produced was 5.27 million LKg, 18.9% lower from 6.50 million LKg.
The industry-wide decline in sugar production volume due to the unfavorable impact of weather conditions led to tight competition on cane supply with other sugar mills.
Cost of cane acquisition and manufacturing also substantially increased as a result of stiffer competition and lower sugar prices prevailing during the first half of the crop year attributed to the HFCS issues.
As observed in the previous crop year, the declining availability of farm labor for cane harvesting and loading was more pronounced as it skewed harvesting schedules. As such, we pushed harder to convince planters to do mechanical harvesting with our own equipment, with the end in view of farmers becoming more familiar and confident in pursuing farm mechanization.
Our Group’s Ethanol Business Unit on the other hand, performed better as a result of timely repairs and enhancements implemented during the previous years. We also engaged the services of a South American ethanol expert in December 2017, which led to considerable improvements in the processes and in the knowledge pool of local technical talents. Our ethanol production volumes increased to 74.35 million liters, up 6.9% from 69.54 million liters the previous year. The unit’s improved yields and efficiencies enabled it to surpass its 2018 gross profit targets.
“RHI...moved swiftly and wisely with the times in
keeping with its commitment to sustainability.”
The spent wash from the ADs is also given for free to farmers as a liquid fertilizer that contains organic elements of needed nutrients for the crops. This crop year alone, RBC had distributed 323,506 tons of spent wash to a larger number of farmers in our districts. As an instrument for sustainability, the use of spent wash as liquid fertilizer ensures sugarcanes are healthier while helping farmers save significant cost on fertilizer and irrigation.
These and many other sustainability programs are constantly monitored across the Group as RHI keeps its commitment to run its businesses in a socially responsible and environmentally supportive manner.
RHI is also constantly looking for opportunities for improvements in farm productivity to support the requirements of its sugar mills. It counts on its subsidiary RHI Agri-business Development Corporation to take advantage of increasing demand for mechanical farming given the difficulty of planters in finding enough laborers.
We know that with your continued support, we can make all these happen as we step up and work together in bringing “One RHI, One Team” to a higher level.
Since two years ago when we started transforming the organization, we not only saw some fruits of our labor, but also additional challenges and some distractions in our business units. We are, nevertheless, committed to push further on and to do the best we can in taking our organization to achieve its objectives.
We can overcome the challenges together as we hold on to our values – steeped in the strongest rocks of reliability and relevance, high standards and integrity, and driven by our unwavering commitment to sustainability and corporate responsibility.
With this, we sincerely thank our stockholders, our Board of Directors and Advisors, the Management Team, our employees and staff, and everyone for staying the course with us, and for trusting us to see RHI realize its vision.
872018 ANNUAL REPORT2018 ANNUAL REPORT
THE RIGHT FUNDAMENTALS: SUSTAINABILITY
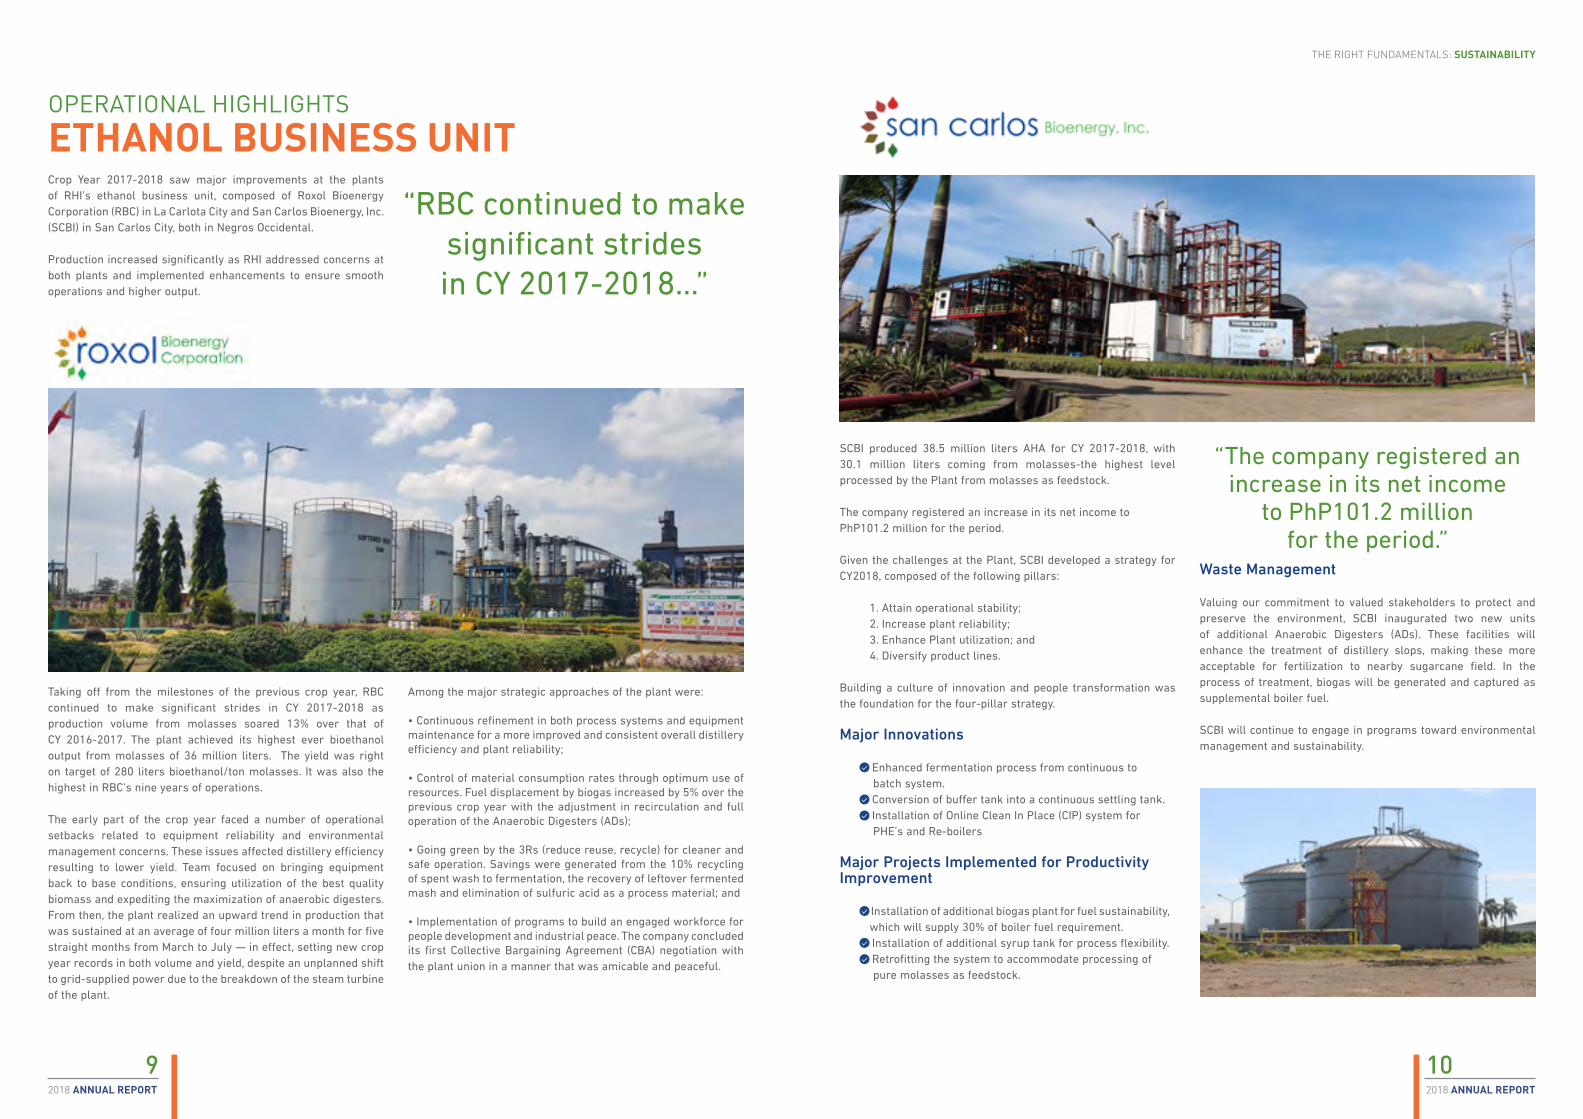
SUGAR BUSINESS UNITOPERATIONAL HIGHLIGHTS
The sugar business unit of Roxas Holdings, Inc. (RHI) is comprised of Central Azucarera Don Pedro, Inc. (CADPI) in Nasugbu, Batangas and Central Azucarera de la Carlota, Inc. (CACI) in La Carlota City, Negros Occidental.
CACI started operations for Crop Year 2017-2018 on October 3, 2017 while CADPI began operations only on January 6, 2018 due to the late maturity of sugarcanes in the province.
Milling in CACI lasted for 31 weeks until May 1, 2018, lower than the 33 weeks it had in the previous crop year. CADPI had a shorter milling period that lasted 23 weeks until June 8, 2018, slightly lower than the 24 weeks in CY2017.
CACI milled 1.868 million metric tons (MT) of canes, 13% lower than previous year’s 2.145M MT. It also produced 3.408 million LKg bags of raw sugar with only 26,115 LKg bags of premium raw from 105,204 bags in CY2017 as a result of the unexpected breakdown of the centrifugal baskets. The reduction in cane tonnage followed the reduction in farm productivity attributed to weather in relation to the timing of cane growth. The province cane volume also suffered some significant volume drop of more than one-million MT; with all the other sugar mills also sharing the reduction.
Sugar produced for the period dropped 18% from the4.143 million LKg bags in CY2017—which was considered a record year for CACI with cane tonnage surpassing the two million MT mark. The lower sugar production was also due a lower yield at 1.824 LKg/TC from 1.931 LKg/TC in the previous year. Wet weather conditions during the period also affected farm productivity, with the drop also universally spread to the rest of the province’s sugar mills.
Despite those challenges and in keeping with sustainability initiatives, CACI reduced factory-related stoppages during the period by 150 hours, or 35% lower, at 276 hours from 425 hours. The installation of an eight-megawatt (8-MW) Turbo Generator addressed the concern on the insufficiency of power. Steam usage dropped to 12.314 TS/MW per hour (MWH) from 20.879 TS/MWH in the previous year, enabling CACI to pass 28,610 tons of excess bagasse to ethanol unit, Roxol Bioenergy Corporation.
CADPI milled 1.123M MT for the period, down 15% from 1.315M MT in CY2017. The Batangas-based mill produced 1.834 million LKg bags of sugar, 22% lower than 2.354 million bags in the previous year, affected by the quality of canes that yielded 1.633 LKg/TC, 9% lower than 1.789 LKg/TC in CY2017.
Refining activities ran until September 9, 2018 for31 weeks. The refinery was shut down temporarily for five weeks in July and August as it awaited the arrival of imported raw CADPI committed to refine.
The total refined sugar produced was 2.977 million LKg bags, slightly lower than the 3.507 million LKg bags in the previous year. CADPI, like other units of RHI, is continuously driving sustainability in its operations despite the challenges thatbeset it.But CADPI continued to corner the biggest market share in South
Luzon with 69.31%, although slightly lower than its share in the previous year, which was 70.97%.
Due to lower cane tonnage, bagasse generated internally totaled only 371,000 MT, leading to higher external fuel consumption of 165,000 MT of bagasse.
Meanwhile, the refinery started operations on January 18, 2018 — two weeks after the start of the milling as CADPI built up its inventory of raw sugar for melting and that of bagasse to sustain the operations of the Boiler House.
“…CACI reduced factory-related stoppages during the period by 150 hours…”
“But CADPI continued to corner the biggest
market share in South Luzon with 69.31%…”
1092018 ANNUAL REPORT2018 ANNUAL REPORT
THE RIGHT FUNDAMENTALS: SUSTAINABILITY
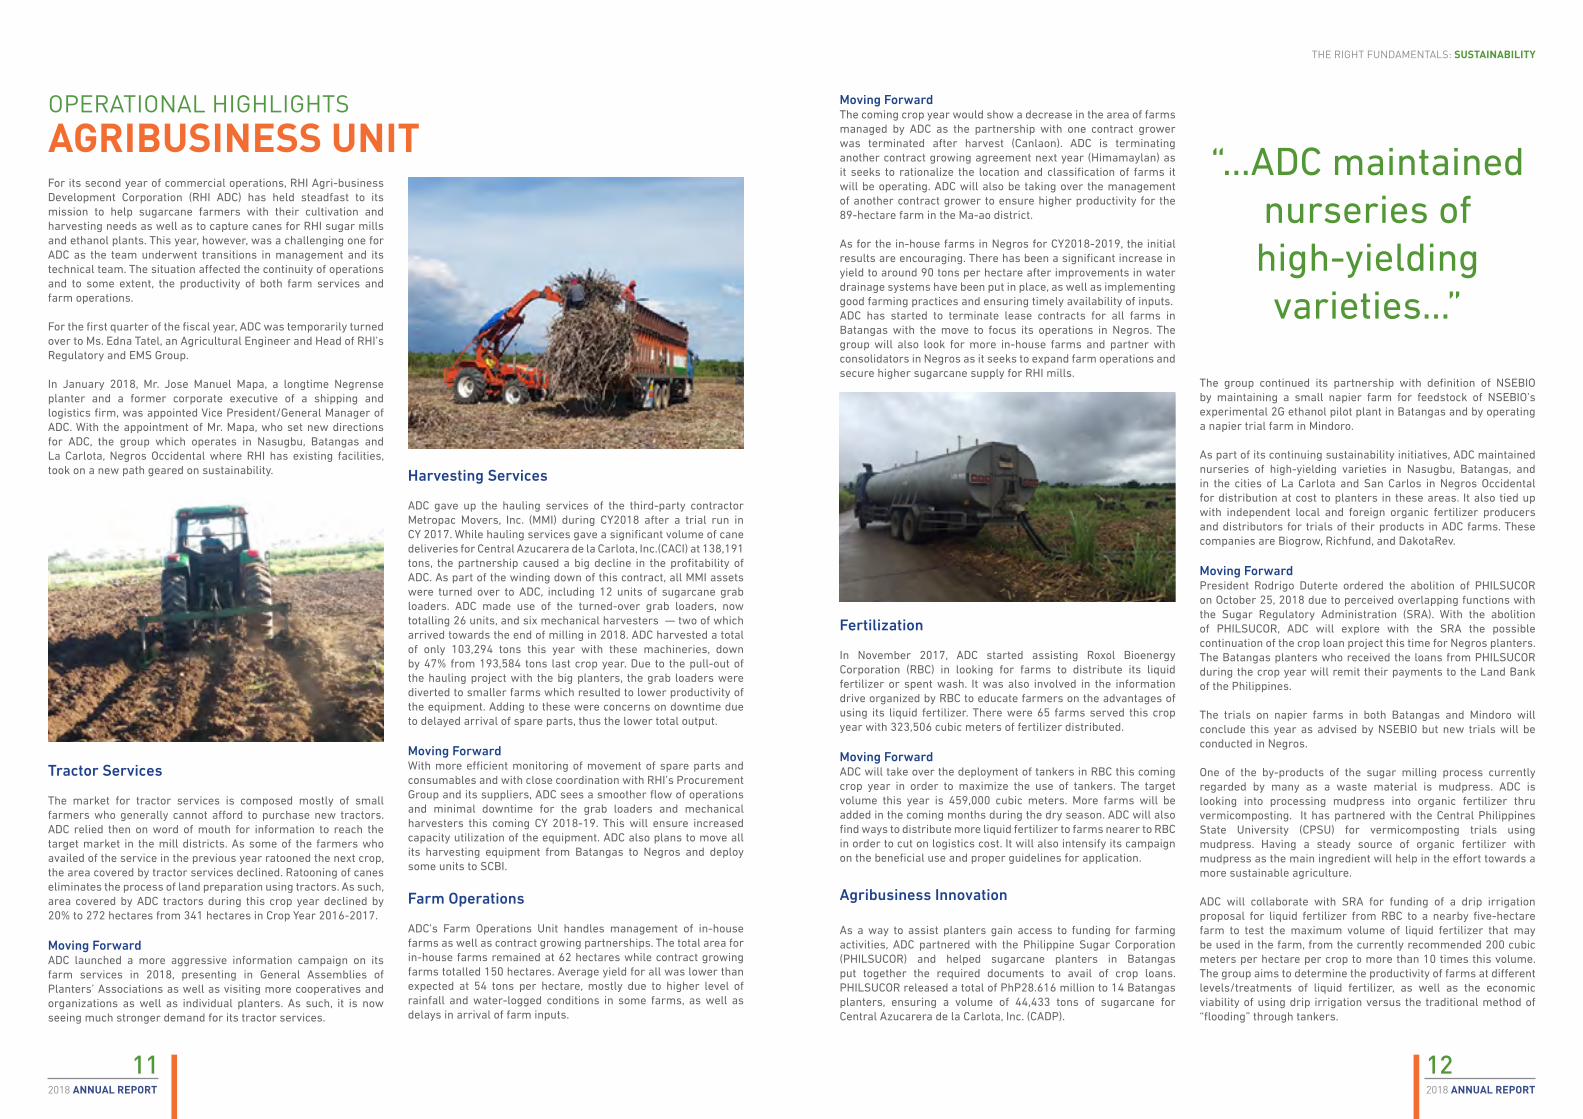
ETHANOL BUSINESS UNITOPERATIONAL HIGHLIGHTS
Crop Year 2017-2018 saw major improvements at the plants of RHI’s ethanol business unit, composed of Roxol Bioenergy Corporation (RBC) in La Carlota City and San Carlos Bioenergy, Inc. (SCBI) in San Carlos City, both in Negros Occidental.
Production increased significantly as RHI addressed concerns at both plants and implemented enhancements to ensure smooth operations and higher output.
Taking off from the milestones of the previous crop year, RBC continued to make significant strides in CY 2017-2018 as production volume from molasses soared 13% over that ofCY 2016-2017. The plant achieved its highest ever bioethanol output from molasses of 36 million liters. The yield was right on target of 280 liters bioethanol/ton molasses. It was also the highest in RBC’s nine years of operations.
The early part of the crop year faced a number of operational setbacks related to equipment reliability and environmental management concerns. These issues affected distillery efficiency resulting to lower yield. Team focused on bringing equipment back to base conditions, ensuring utilization of the best quality biomass and expediting the maximization of anaerobic digesters. From then, the plant realized an upward trend in production that was sustained at an average of four million liters a month for five straight months from March to July — in effect, setting new crop year records in both volume and yield, despite an unplanned shift to grid-supplied power due to the breakdown of the steam turbine of the plant.
Among the major strategic approaches of the plant were: • Continuous refinement in both process systems and equipment maintenance for a more improved and consistent overall distillery efficiency and plant reliability;
• Control of material consumption rates through optimum use of resources. Fuel displacement by biogas increased by 5% over the previous crop year with the adjustment in recirculation and full operation of the Anaerobic Digesters (ADs);
• Going green by the 3Rs (reduce reuse, recycle) for cleaner and safe operation. Savings were generated from the 10% recycling of spent wash to fermentation, the recovery of leftover fermented mash and elimination of sulfuric acid as a process material; and
• Implementation of programs to build an engaged workforce for people development and industrial peace. The company concluded its first Collective Bargaining Agreement (CBA) negotiation with the plant union in a manner that was amicable and peaceful.
SCBI produced 38.5 million liters AHA for CY 2017-2018, with 30.1 million liters coming from molasses-the highest level processed by the Plant from molasses as feedstock.
The company registered an increase in its net income toPhP101.2 million for the period.
Given the challenges at the Plant, SCBI developed a strategy for CY2018, composed of the following pillars:
1. Attain operational stability;2. Increase plant reliability;3. Enhance Plant utilization; and4. Diversify product lines.
Building a culture of innovation and people transformation was the foundation for the four-pillar strategy.
Major Innovations
• Enhanced fermentation process from continuous to batch system.• Conversion of buffer tank into a continuous settling tank.• Installation of Online Clean In Place (CIP) system for PHE’s and Re-boilers
Major Projects Implemented for Productivity Improvement
• Installation of additional biogas plant for fuel sustainability, which will supply 30% of boiler fuel requirement.
• Installation of additional syrup tank for process flexibility.• Retrofitting the system to accommodate processing of pure molasses as feedstock.
Waste Management
Valuing our commitment to valued stakeholders to protect and preserve the environment, SCBI inaugurated two new units of additional Anaerobic Digesters (ADs). These facilities will enhance the treatment of distillery slops, making these more acceptable for fertilization to nearby sugarcane field. In the process of treatment, biogas will be generated and captured as supplemental boiler fuel.
SCBI will continue to engage in programs toward environmental management and sustainability.
“The company registered an increase in its net income
to PhP101.2 millionfor the period.”
“RBC continued to make significant strides in CY 2017-2018...”
12112018 ANNUAL REPORT2018 ANNUAL REPORT
THE RIGHT FUNDAMENTALS: SUSTAINABILITY
AGRIBUSINESS UNITOPERATIONAL HIGHLIGHTS
For its second year of commercial operations, RHI Agri-business Development Corporation (RHI ADC) has held steadfast to its mission to help sugarcane farmers with their cultivation and harvesting needs as well as to capture canes for RHI sugar mills and ethanol plants. This year, however, was a challenging one for ADC as the team underwent transitions in management and its technical team. The situation affected the continuity of operations and to some extent, the productivity of both farm services and farm operations.
For the first quarter of the fiscal year, ADC was temporarily turned over to Ms. Edna Tatel, an Agricultural Engineer and Head of RHI’s Regulatory and EMS Group.
In January 2018, Mr. Jose Manuel Mapa, a longtime Negrense planter and a former corporate executive of a shipping and logistics firm, was appointed Vice President/General Manager of ADC. With the appointment of Mr. Mapa, who set new directions for ADC, the group which operates in Nasugbu, Batangas and La Carlota, Negros Occidental where RHI has existing facilities, took on a new path geared on sustainability.
Tractor Services
The market for tractor services is composed mostly of small farmers who generally cannot afford to purchase new tractors. ADC relied then on word of mouth for information to reach the target market in the mill districts. As some of the farmers who availed of the service in the previous year ratooned the next crop, the area covered by tractor services declined. Ratooning of canes eliminates the process of land preparation using tractors. As such, area covered by ADC tractors during this crop year declined by 20% to 272 hectares from 341 hectares in Crop Year 2016-2017.
Moving Forward ADC launched a more aggressive information campaign on its farm services in 2018, presenting in General Assemblies of Planters’ Associations as well as visiting more cooperatives and organizations as well as individual planters. As such, it is now seeing much stronger demand for its tractor services.
Harvesting Services
ADC gave up the hauling services of the third-party contractor Metropac Movers, Inc. (MMI) during CY2018 after a trial run in CY 2017. While hauling services gave a significant volume of cane deliveries for Central Azucarera de la Carlota, Inc.(CACI) at 138,191 tons, the partnership caused a big decline in the profitability of ADC. As part of the winding down of this contract, all MMI assets were turned over to ADC, including 12 units of sugarcane grab loaders. ADC made use of the turned-over grab loaders, now totalling 26 units, and six mechanical harvesters — two of which arrived towards the end of milling in 2018. ADC harvested a total of only 103,294 tons this year with these machineries, down by 47% from 193,584 tons last crop year. Due to the pull-out of the hauling project with the big planters, the grab loaders were diverted to smaller farms which resulted to lower productivity of the equipment. Adding to these were concerns on downtime due to delayed arrival of spare parts, thus the lower total output.
Moving Forward With more efficient monitoring of movement of spare parts and consumables and with close coordination with RHI’s Procurement Group and its suppliers, ADC sees a smoother flow of operations and minimal downtime for the grab loaders and mechanical harvesters this coming CY 2018-19. This will ensure increased capacity utilization of the equipment. ADC also plans to move all its harvesting equipment from Batangas to Negros and deploy some units to SCBI.
Farm Operations
ADC’s Farm Operations Unit handles management of in-house farms as well as contract growing partnerships. The total area for in-house farms remained at 62 hectares while contract growing farms totalled 150 hectares. Average yield for all was lower than expected at 54 tons per hectare, mostly due to higher level of rainfall and water-logged conditions in some farms, as well as delays in arrival of farm inputs.
Moving Forward The coming crop year would show a decrease in the area of farms managed by ADC as the partnership with one contract grower was terminated after harvest (Canlaon). ADC is terminating another contract growing agreement next year (Himamaylan) as it seeks to rationalize the location and classification of farms it will be operating. ADC will also be taking over the management of another contract grower to ensure higher productivity for the 89-hectare farm in the Ma-ao district. As for the in-house farms in Negros for CY2018-2019, the initial results are encouraging. There has been a significant increase in yield to around 90 tons per hectare after improvements in water drainage systems have been put in place, as well as implementing good farming practices and ensuring timely availability of inputs.ADC has started to terminate lease contracts for all farms in Batangas with the move to focus its operations in Negros. The group will also look for more in-house farms and partner with consolidators in Negros as it seeks to expand farm operations and secure higher sugarcane supply for RHI mills.
Fertilization
In November 2017, ADC started assisting Roxol Bioenergy Corporation (RBC) in looking for farms to distribute its liquid fertilizer or spent wash. It was also involved in the information drive organized by RBC to educate farmers on the advantages of using its liquid fertilizer. There were 65 farms served this crop year with 323,506 cubic meters of fertilizer distributed.
Moving Forward ADC will take over the deployment of tankers in RBC this coming crop year in order to maximize the use of tankers. The target volume this year is 459,000 cubic meters. More farms will be added in the coming months during the dry season. ADC will also find ways to distribute more liquid fertilizer to farms nearer to RBC in order to cut on logistics cost. It will also intensify its campaign on the beneficial use and proper guidelines for application.
Agribusiness Innovation
As a way to assist planters gain access to funding for farming activities, ADC partnered with the Philippine Sugar Corporation (PHILSUCOR) and helped sugarcane planters in Batangas put together the required documents to avail of crop loans. PHILSUCOR released a total of PhP28.616 million to 14 Batangas planters, ensuring a volume of 44,433 tons of sugarcane for Central Azucarera de la Carlota, Inc. (CADP).
“…ADC maintained nurseries of high-yielding varieties…”
The group continued its partnership with definition of NSEBIO by maintaining a small napier farm for feedstock of NSEBIO’s experimental 2G ethanol pilot plant in Batangas and by operating a napier trial farm in Mindoro.
As part of its continuing sustainability initiatives, ADC maintained nurseries of high-yielding varieties in Nasugbu, Batangas, and in the cities of La Carlota and San Carlos in Negros Occidental for distribution at cost to planters in these areas. It also tied up with independent local and foreign organic fertilizer producers and distributors for trials of their products in ADC farms. These companies are Biogrow, Richfund, and DakotaRev.
Moving Forward President Rodrigo Duterte ordered the abolition of PHILSUCOR on October 25, 2018 due to perceived overlapping functions with the Sugar Regulatory Administration (SRA). With the abolition of PHILSUCOR, ADC will explore with the SRA the possible continuation of the crop loan project this time for Negros planters. The Batangas planters who received the loans from PHILSUCOR during the crop year will remit their payments to the Land Bank of the Philippines.
The trials on napier farms in both Batangas and Mindoro will conclude this year as advised by NSEBIO but new trials will be conducted in Negros.
One of the by-products of the sugar milling process currently regarded by many as a waste material is mudpress. ADC is looking into processing mudpress into organic fertilizer thru vermicomposting. It has partnered with the Central Philippines State University (CPSU) for vermicomposting trials using mudpress. Having a steady source of organic fertilizer with mudpress as the main ingredient will help in the effort towards a more sustainable agriculture.
ADC will collaborate with SRA for funding of a drip irrigation proposal for liquid fertilizer from RBC to a nearby five-hectare farm to test the maximum volume of liquid fertilizer that may be used in the farm, from the currently recommended 200 cubic meters per hectare per crop to more than 10 times this volume. The group aims to determine the productivity of farms at different levels/treatments of liquid fertilizer, as well as the economic viability of using drip irrigation versus the traditional method of “flooding” through tankers.

14132018 ANNUAL REPORT2018 ANNUAL REPORT
THE RIGHT FUNDAMENTALS: SUSTAINABILITY
CORPORATE GOVERNANCECORPORATE GOVERNANCE & SUSTAINABILITY
In compliance with the circular of the Securities and Exchange Commission requiring all listed companies to submit new versions of their respective Manual on Corporate Governance, Roxas Holdings, Inc. (RHI) rolled out the RHI Revised Manual on Corporate Governance in 2017.
The Corporate Governance Committee unanimously approved the 2017 RHI Revised Manual on Corporate Governance, which contains the 16 principles below:
1. RHI shall be headed by a competent, working Board to foster the long-term success of the Company, and to sustain its competitiveness and profitability in a manner consistent with its corporate objectives and the long-term best interests of its shareholders and other stakeholders.
2. The fiduciary roles, responsibilities and accountabilities
of the Board as provided under the law, the Company’s articles and by-laws, and other legal pronouncements and guidelines shall be clearly made known to all directors as well as to stockholders and other stakeholders.
3. To show full commitment to the Company, the directors should devote the time and attention necessary to properly and effectively perform their duties and responsibilities, including sufficient time to be familiar with the Company’s businesses.
4. The Board shall endeavor to exercise objective and independent judgment on all corporate affairs.
5. The best measure of the Board’s effectiveness is through an assessment process. The Board shall regularly carry out evaluations to appraise its performance as a body, and assess whether it possesses the right mix of backgrounds and competencies.
6. Members of the Board are duty-bound to apply high ethical standards, taking into account the interests of the stakeholders.
7. The Board shall adopt standards for professional and ethical behavior
8. The Company shall establish corporate disclosure policies and procedures that are practical and in accordance with best practices and regulatory expectations.
9. The Company shall establish standards for the appropriate selection of an external auditor, and exercise effective oversight of the same to strengthen the external auditor’s independence and enhance audit quality.
10. The Company shall ensure that material and reportable non-financial and sustainability issues are disclosed.
Each employee is charged with the responsibility of acquiring sufficient knowledge of the laws relating to his or her particular duties in order to recognize potential dangers and to know when to seek legal advice. Unlawful conduct will not be condoned under any circumstances. Employees should consult with the in-house counsel if they have questions regarding compliance with certain laws, rules or regulations.
3. Whistle-Blowing Policy
The Group has a public interest disclosure or a whistle-blowing policy whereby all employees have the right and moral responsibility to report improper actions and omissions. A workplace culture is developed in which employees who act in good faith and in compliance with the law are protected from interference in, or retaliation for, reporting improper actions and cooperating with subsequent investigations and proceedings. Public Interest Disclosure is required when employees, in good faith, believe superiors or colleagues are engaged in an improper course of illegal or unethical conduct, and they must be able to disclose such conduct free from fear or intimidation or reprisal.
4. Conflict of Interest Policy
The Company and its stakeholders require and expect that
11. The Company shall maintain a comprehensive and cost-efficient communication channel for disseminating relevant information. This channel is crucial for informed decision-making by investors, stakeholders and other interested users.
12. To ensure the integrity, transparency and proper governance in the conduct of its affairs, the Company shall have a strong and effective internal control system and enterprise risk management framework.
13. The Company shall treat all shareholders fairly and equitably, and also recognize, protect and facilitate the exercise of their rights.
14. The rights of stakeholders established by law, by contractual relations and through voluntary commitments must be respected. Where stakeholders’ rights and/or interests are at stake, stakeholders shall have the opportunity to obtain prompt effective redress for the violation of their rights.
15. A mechanism for employee participation shall be developed to create a symbiotic environment, realize the company’s goals and participate in its corporate governance processes.
16. The Company shall be socially responsible in all its dealings with the communities where it operates. It shall ensure that its interactions serve its environment and stakeholders in a positive and progressive manner that is fully supportive of its comprehensive and balanced development.
RHI also has the following policies in place:
1. Insider Trading Policy
The Company has an Insider Trading Policy which prohibits the purchase, sale, or trading in securities of the Company or another corporation while in possession of material non-public information.
The Policy likewise prohibits the giving of material non-public information, directly or indirectly, to anyone. A violation of the Policy subjects the member of the Board of Directors, Board of Advisors, officer, or employee to disciplinary action in addition to possible civil and criminal actions.
2. Business Conduct Policy
The highest standard of individual conduct is expected at all times from each employee of Roxas Holdings, Inc. not only in matters of financial integrity but also in every aspect of business relationships. Business should be conducted on the bases of fair dealing, consideration for the rights and feelings of others and the most stringent principles of good corporate citizenship.
business affairs must be conducted in a manner that does not cloud judgment when dealing with third parties, or when making decisions on behalf of the Company. Business transactions must be undertaken solely in the best interest of the Company.
Conflict of Interest can only be defined along broad lines of ethical principles as it is impossible to conceive of all situations where a conflict may arise. In general, conflict of interest arises when an employee engages in business or professional activities exclusively for his own benefit on Company time or when such vested interest goes against the interest of the Company regardless whether it occurs during Company time or not. In short, a conflict of interest arises when the Company’s interests are sacrificed. Some illustrative situations are:
1. Accepting business or outside employment; 2. Solicitation or acceptance of gifts;3. Business dealings with the Company; and4. Other analogous circumstances.
Moving forward, the Company is committed to bring the level of adherence to good corporate governance at par with the best practices from all over the country and the ASEAN region.
SAFETYCORPORATE GOVERNANCE & SUSTAINABILITY
RHI is committed in ensuring the safety and health of its employees, including contractors, suppliers, visitors, and other stakeholders. The Group consistently looks for new innovative ways in improving the workplaces by implementing the RHI 12 Life Saving Rules; conducting Hazard Identification Risk Assessment and Determination of Control (HIRADC), Safety Quarterly Meetings with all the Safety Officers and Safety Committees, and Safety Orientations/refresher to all workers.
The company has improved monitoring procedures to ensure compliance to all regulatory requirements by implementing the Occupational Safety and Health Standards.
• To ensure health and wellness of the employees, annual physical examinations and sports activities are conducted yearly.
• Employees are provided with necessary medical services through accredited medical centers.
Emergency Disaster Preparedness activities were also conducted to ensure that procedures are followed and revised if needed and to promote awareness among employees on what to do in case of emergency situations.
The Conduct of Investigation and Root Cause Analysis was also implemented to prevent the recurrence of incidents.
By implementing these programs, RHI reached a total of 5,787,221 safe man-hours for Crop Year 2017-2018, including the contractors/agency workers inside the workplace at RHI and its subsidiaries.
RHI believes that everyone is responsible in ensuring strong leadership, participation, commitment, and intervention to safety. Facilities, equipment and tools shall be designed, operated and maintained according to high standards. The company also believes that all injuries and incidents are preventable.
Safety is a challenge in the work environment and everyone should strive continuously in improving safety performance, and in ensuring a healthy and safe workplace.
16152018 ANNUAL REPORT2018 ANNUAL REPORT
THE RIGHT FUNDAMENTALS: SUSTAINABILITY
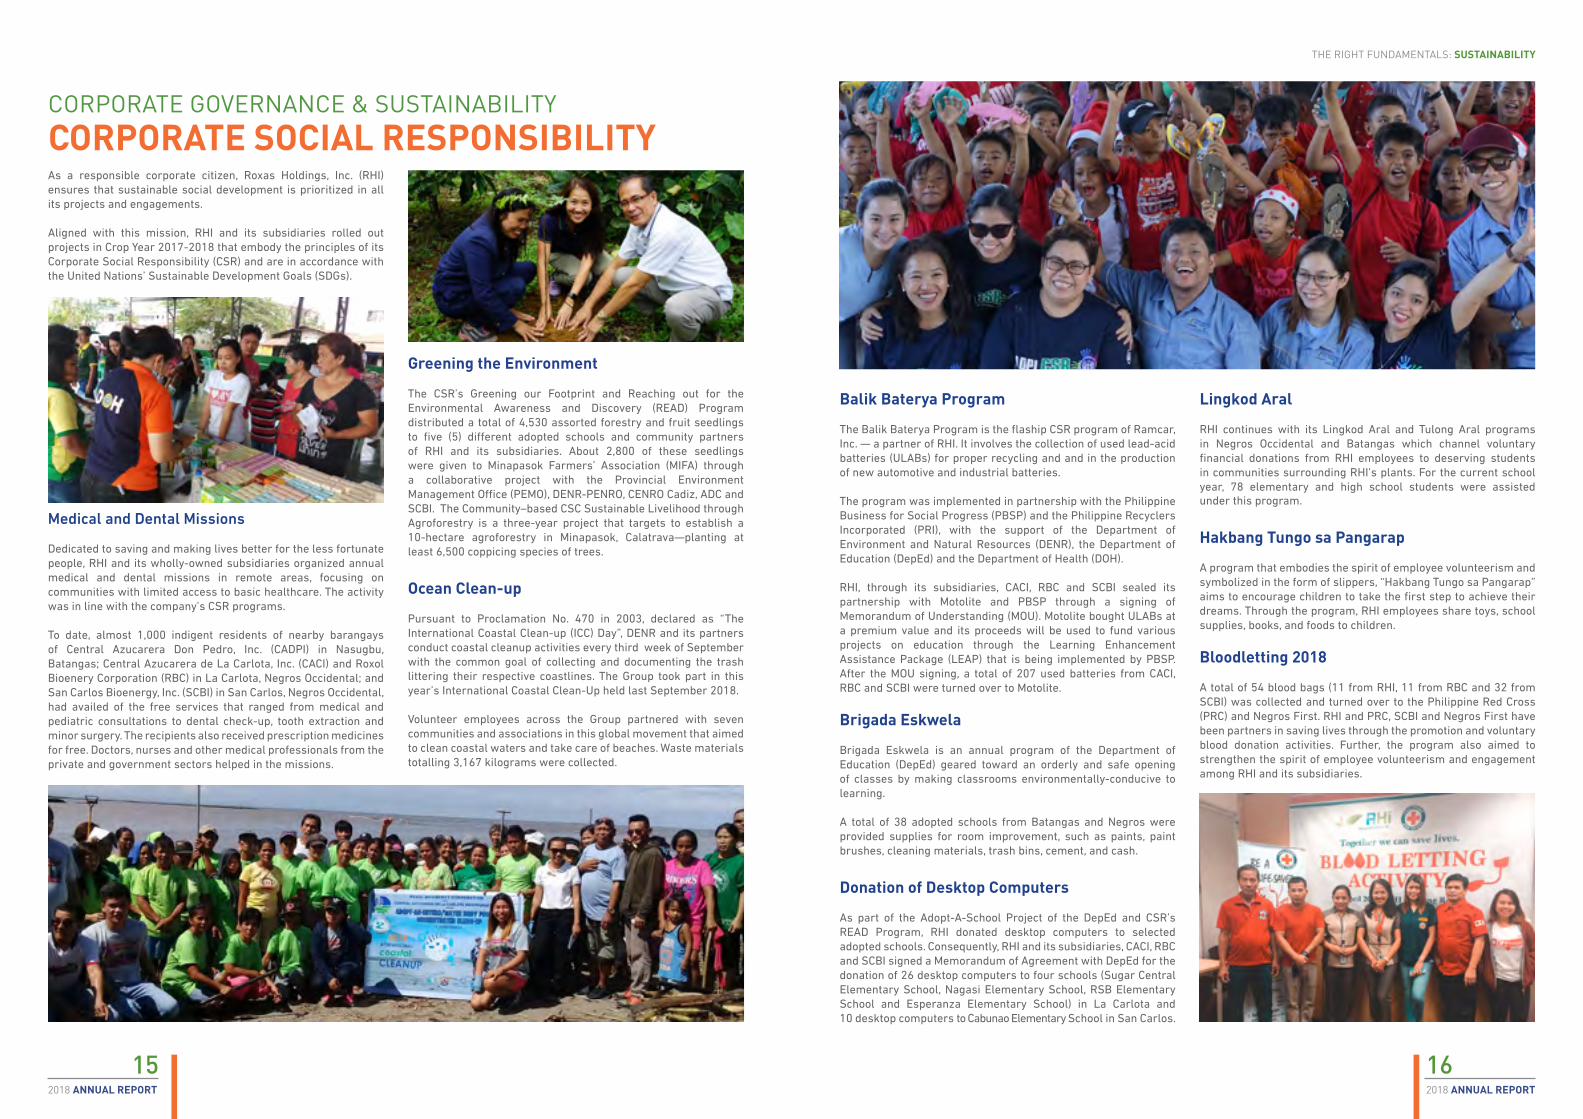
CORPORATE SOCIAL RESPONSIBILITYCORPORATE GOVERNANCE & SUSTAINABILITY
As a responsible corporate citizen, Roxas Holdings, Inc. (RHI) ensures that sustainable social development is prioritized in all its projects and engagements.
Aligned with this mission, RHI and its subsidiaries rolled out projects in Crop Year 2017-2018 that embody the principles of its Corporate Social Responsibility (CSR) and are in accordance with the United Nations’ Sustainable Development Goals (SDGs).
Medical and Dental Missions
Dedicated to saving and making lives better for the less fortunate people, RHI and its wholly-owned subsidiaries organized annual medical and dental missions in remote areas, focusing on communities with limited access to basic healthcare. The activity was in line with the company’s CSR programs.
To date, almost 1,000 indigent residents of nearby barangays of Central Azucarera Don Pedro, Inc. (CADPI) in Nasugbu, Batangas; Central Azucarera de La Carlota, Inc. (CACI) and Roxol Bioenery Corporation (RBC) in La Carlota, Negros Occidental; and San Carlos Bioenergy, Inc. (SCBI) in San Carlos, Negros Occidental, had availed of the free services that ranged from medical and pediatric consultations to dental check-up, tooth extraction and minor surgery. The recipients also received prescription medicines for free. Doctors, nurses and other medical professionals from the private and government sectors helped in the missions.
Greening the Environment
The CSR’s Greening our Footprint and Reaching out for the Environmental Awareness and Discovery (READ) Program distributed a total of 4,530 assorted forestry and fruit seedlings to five (5) different adopted schools and community partners of RHI and its subsidiaries. About 2,800 of these seedlings were given to Minapasok Farmers’ Association (MIFA) through a collaborative project with the Provincial Environment Management Office (PEMO), DENR-PENRO, CENRO Cadiz, ADC and SCBI. The Community–based CSC Sustainable Livelihood through Agroforestry is a three-year project that targets to establish a 10-hectare agroforestry in Minapasok, Calatrava—planting at least 6,500 coppicing species of trees.
Ocean Clean-up
Pursuant to Proclamation No. 470 in 2003, declared as “The International Coastal Clean-up (ICC) Day”, DENR and its partners conduct coastal cleanup activities every third week of September with the common goal of collecting and documenting the trash littering their respective coastlines. The Group took part in this year’s International Coastal Clean-Up held last September 2018.
Volunteer employees across the Group partnered with seven communities and associations in this global movement that aimed to clean coastal waters and take care of beaches. Waste materials totalling 3,167 kilograms were collected.
Balik Baterya Program
The Balik Baterya Program is the flaship CSR program of Ramcar, Inc. — a partner of RHI. It involves the collection of used lead-acid batteries (ULABs) for proper recycling and and in the production of new automotive and industrial batteries.
The program was implemented in partnership with the Philippine Business for Social Progress (PBSP) and the Philippine Recyclers Incorporated (PRI), with the support of the Department of Environment and Natural Resources (DENR), the Department of Education (DepEd) and the Department of Health (DOH).
RHI, through its subsidiaries, CACI, RBC and SCBI sealed its partnership with Motolite and PBSP through a signing of Memorandum of Understanding (MOU). Motolite bought ULABs at a premium value and its proceeds will be used to fund various projects on education through the Learning Enhancement Assistance Package (LEAP) that is being implemented by PBSP. After the MOU signing, a total of 207 used batteries from CACI, RBC and SCBI were turned over to Motolite.
Brigada Eskwela
Brigada Eskwela is an annual program of the Department of Education (DepEd) geared toward an orderly and safe opening of classes by making classrooms environmentally-conducive to learning.
A total of 38 adopted schools from Batangas and Negros were provided supplies for room improvement, such as paints, paint brushes, cleaning materials, trash bins, cement, and cash.
Donation of Desktop Computers
As part of the Adopt-A-School Project of the DepEd and CSR’s READ Program, RHI donated desktop computers to selected adopted schools. Consequently, RHI and its subsidiaries, CACI, RBC and SCBI signed a Memorandum of Agreement with DepEd for the donation of 26 desktop computers to four schools (Sugar Central Elementary School, Nagasi Elementary School, RSB Elementary School and Esperanza Elementary School) in La Carlota and10 desktop computers to Cabunao Elementary School in San Carlos.
Lingkod Aral
RHI continues with its Lingkod Aral and Tulong Aral programs in Negros Occidental and Batangas which channel voluntary financial donations from RHI employees to deserving students in communities surrounding RHI’s plants. For the current school year, 78 elementary and high school students were assisted under this program.
Hakbang Tungo sa Pangarap
A program that embodies the spirit of employee volunteerism and symbolized in the form of slippers, “Hakbang Tungo sa Pangarap” aims to encourage children to take the first step to achieve their dreams. Through the program, RHI employees share toys, school supplies, books, and foods to children.
Bloodletting 2018
A total of 54 blood bags (11 from RHI, 11 from RBC and 32 from SCBI) was collected and turned over to the Philippine Red Cross (PRC) and Negros First. RHI and PRC, SCBI and Negros First have been partners in saving lives through the promotion and voluntary blood donation activities. Further, the program also aimed to strengthen the spirit of employee volunteerism and engagement among RHI and its subsidiaries.
18172018 ANNUAL REPORT2018 ANNUAL REPORT
THE RIGHT FUNDAMENTALS: SUSTAINABILITY
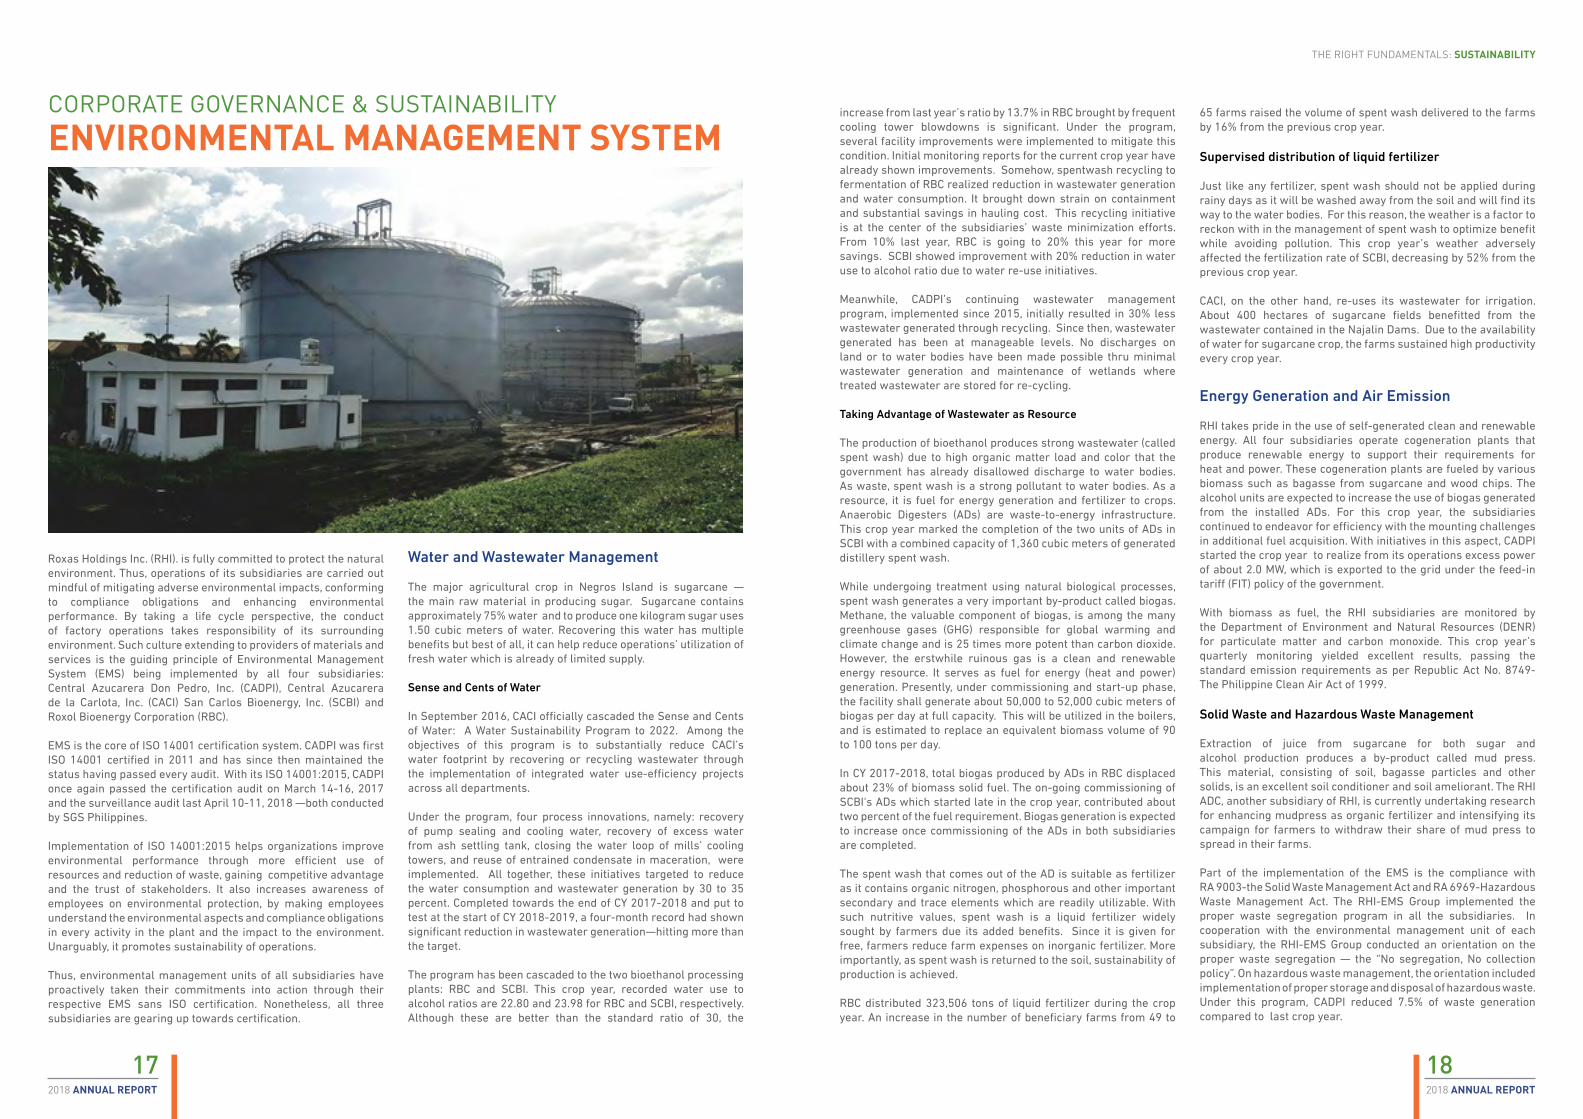
ENVIRONMENTAL MANAGEMENT SYSTEMCORPORATE GOVERNANCE & SUSTAINABILITY
Roxas Holdings Inc. (RHI). is fully committed to protect the natural environment. Thus, operations of its subsidiaries are carried out mindful of mitigating adverse environmental impacts, conforming to compliance obligations and enhancing environmental performance. By taking a life cycle perspective, the conduct of factory operations takes responsibility of its surrounding environment. Such culture extending to providers of materials and services is the guiding principle of Environmental Management System (EMS) being implemented by all four subsidiaries: Central Azucarera Don Pedro, Inc. (CADPI), Central Azucarera de la Carlota, Inc. (CACI) San Carlos Bioenergy, Inc. (SCBI) and Roxol Bioenergy Corporation (RBC).
EMS is the core of ISO 14001 certification system. CADPI was first ISO 14001 certified in 2011 and has since then maintained the status having passed every audit. With its ISO 14001:2015, CADPI once again passed the certification audit on March 14-16, 2017 and the surveillance audit last April 10-11, 2018 —both conducted by SGS Philippines.
Implementation of ISO 14001:2015 helps organizations improve environmental performance through more efficient use of resources and reduction of waste, gaining competitive advantage and the trust of stakeholders. It also increases awareness of employees on environmental protection, by making employees understand the environmental aspects and compliance obligations in every activity in the plant and the impact to the environment. Unarguably, it promotes sustainability of operations.
Thus, environmental management units of all subsidiaries have proactively taken their commitments into action through their respective EMS sans ISO certification. Nonetheless, all three subsidiaries are gearing up towards certification.
Water and Wastewater Management
The major agricultural crop in Negros Island is sugarcane — the main raw material in producing sugar. Sugarcane contains approximately 75% water and to produce one kilogram sugar uses 1.50 cubic meters of water. Recovering this water has multiple benefits but best of all, it can help reduce operations’ utilization of fresh water which is already of limited supply.
Sense and Cents of Water
In September 2016, CACI officially cascaded the Sense and Cents of Water: A Water Sustainability Program to 2022. Among the objectives of this program is to substantially reduce CACI’s water footprint by recovering or recycling wastewater through the implementation of integrated water use-efficiency projects across all departments.
Under the program, four process innovations, namely: recovery of pump sealing and cooling water, recovery of excess water from ash settling tank, closing the water loop of mills’ cooling towers, and reuse of entrained condensate in maceration, were implemented. All together, these initiatives targeted to reduce the water consumption and wastewater generation by 30 to 35 percent. Completed towards the end of CY 2017-2018 and put to test at the start of CY 2018-2019, a four-month record had shown significant reduction in wastewater generation—hitting more than the target.
The program has been cascaded to the two bioethanol processing plants: RBC and SCBI. This crop year, recorded water use to alcohol ratios are 22.80 and 23.98 for RBC and SCBI, respectively. Although these are better than the standard ratio of 30, the
increase from last year’s ratio by 13.7% in RBC brought by frequent cooling tower blowdowns is significant. Under the program, several facility improvements were implemented to mitigate this condition. Initial monitoring reports for the current crop year have already shown improvements. Somehow, spentwash recycling to fermentation of RBC realized reduction in wastewater generation and water consumption. It brought down strain on containment and substantial savings in hauling cost. This recycling initiative is at the center of the subsidiaries’ waste minimization efforts. From 10% last year, RBC is going to 20% this year for more savings. SCBI showed improvement with 20% reduction in water use to alcohol ratio due to water re-use initiatives.
Meanwhile, CADPI’s continuing wastewater management program, implemented since 2015, initially resulted in 30% less wastewater generated through recycling. Since then, wastewater generated has been at manageable levels. No discharges on land or to water bodies have been made possible thru minimal wastewater generation and maintenance of wetlands where treated wastewater are stored for re-cycling.
Taking Advantage of Wastewater as Resource
The production of bioethanol produces strong wastewater (called spent wash) due to high organic matter load and color that the government has already disallowed discharge to water bodies. As waste, spent wash is a strong pollutant to water bodies. As a resource, it is fuel for energy generation and fertilizer to crops. Anaerobic Digesters (ADs) are waste-to-energy infrastructure. This crop year marked the completion of the two units of ADs in SCBI with a combined capacity of 1,360 cubic meters of generated distillery spent wash.
While undergoing treatment using natural biological processes, spent wash generates a very important by-product called biogas. Methane, the valuable component of biogas, is among the many greenhouse gases (GHG) responsible for global warming and climate change and is 25 times more potent than carbon dioxide. However, the erstwhile ruinous gas is a clean and renewable energy resource. It serves as fuel for energy (heat and power) generation. Presently, under commissioning and start-up phase, the facility shall generate about 50,000 to 52,000 cubic meters of biogas per day at full capacity. This will be utilized in the boilers, and is estimated to replace an equivalent biomass volume of 90 to 100 tons per day.
In CY 2017-2018, total biogas produced by ADs in RBC displaced about 23% of biomass solid fuel. The on-going commissioning of SCBI‘s ADs which started late in the crop year, contributed about two percent of the fuel requirement. Biogas generation is expected to increase once commissioning of the ADs in both subsidiaries are completed.
The spent wash that comes out of the AD is suitable as fertilizer as it contains organic nitrogen, phosphorous and other important secondary and trace elements which are readily utilizable. With such nutritive values, spent wash is a liquid fertilizer widely sought by farmers due its added benefits. Since it is given for free, farmers reduce farm expenses on inorganic fertilizer. More importantly, as spent wash is returned to the soil, sustainability of production is achieved.
RBC distributed 323,506 tons of liquid fertilizer during the crop year. An increase in the number of beneficiary farms from 49 to
65 farms raised the volume of spent wash delivered to the farms by 16% from the previous crop year.
Supervised distribution of liquid fertilizer
Just like any fertilizer, spent wash should not be applied during rainy days as it will be washed away from the soil and will find its way to the water bodies. For this reason, the weather is a factor to reckon with in the management of spent wash to optimize benefit while avoiding pollution. This crop year’s weather adversely affected the fertilization rate of SCBI, decreasing by 52% from the previous crop year.
CACI, on the other hand, re-uses its wastewater for irrigation. About 400 hectares of sugarcane fields benefitted from the wastewater contained in the Najalin Dams. Due to the availability of water for sugarcane crop, the farms sustained high productivity every crop year.
Energy Generation and Air Emission
RHI takes pride in the use of self-generated clean and renewable energy. All four subsidiaries operate cogeneration plants that produce renewable energy to support their requirements for heat and power. These cogeneration plants are fueled by various biomass such as bagasse from sugarcane and wood chips. The alcohol units are expected to increase the use of biogas generated from the installed ADs. For this crop year, the subsidiaries continued to endeavor for efficiency with the mounting challenges in additional fuel acquisition. With initiatives in this aspect, CADPI started the crop year to realize from its operations excess power of about 2.0 MW, which is exported to the grid under the feed-in tariff (FIT) policy of the government.
With biomass as fuel, the RHI subsidiaries are monitored by the Department of Environment and Natural Resources (DENR) for particulate matter and carbon monoxide. This crop year’s quarterly monitoring yielded excellent results, passing the standard emission requirements as per Republic Act No. 8749- The Philippine Clean Air Act of 1999.
Solid Waste and Hazardous Waste Management
Extraction of juice from sugarcane for both sugar andalcohol production produces a by-product called mud press.This material, consisting of soil, bagasse particles and other solids, is an excellent soil conditioner and soil ameliorant. The RHI ADC, another subsidiary of RHI, is currently undertaking research for enhancing mudpress as organic fertilizer and intensifying its campaign for farmers to withdraw their share of mud press to spread in their farms.
Part of the implementation of the EMS is the compliance withRA 9003-the Solid Waste Management Act and RA 6969-Hazardous Waste Management Act. The RHI-EMS Group implemented the proper waste segregation program in all the subsidiaries. In cooperation with the environmental management unit of each subsidiary, the RHI-EMS Group conducted an orientation on the proper waste segregation — the “No segregation, No collection policy”. On hazardous waste management, the orientation included implementation of proper storage and disposal of hazardous waste. Under this program, CADPI reduced 7.5% of waste generation compared to last crop year.

20192018 ANNUAL REPORT2018 ANNUAL REPORT
THE RIGHT FUNDAMENTALS: SUSTAINABILITY
HUMAN RESOURCESTransforming into the RHI of the Future
CORPORATE GOVERNANCE & SUSTAINABILITY
To further support the thrust to cement Right Fundamentals and to Innovate the Future, the Organization is also strengthening its form with the creation of a new role that shall focus on increasing plant productivity and efficiency. Chief Manufacturing Officer for Alcohol SBU, Mr. Jose Villanueva, joined the team — bringing in extensive experience in leadership in the manufacturing setting. Productive relationship with labor unions is also essential, thus, RHI is pleased to have successfully concluded Collective Bargaining Agreement (CBA) negotiations with Central Azucarera Don Pedro, Inc. (CADPI) Professional-Technical & Monthly Paid Workers’Union and Roxol Bioenergy Corporation (RBC) Workers’ Union.
The training and development of employees continue to be at the heart of RHI’s aim to grow its people into inspired, nurturing and performing individuals. Among the highlights for Learning this year is the second leg of the “One RHI Management Series” (a Management Development Program kicked off last crop year), to equip RHI leaders with the competencies they need to move the company forward. The “Performance Management: A Leadership Tool” Program was participated in by 121 supervisors and managers from the different subsidiaries. Same employees also attended the 2017 PLOC Program (Planning, Leading, Organizing, & Controlling). The Alcohol Group Cadetship Program was launched in RBC and San Carlos Bioenergy, Inc. with a total of seven promising young engineers joining the team. The matter of Job Fundamentals is a priority technical program for the plants and is being reviewed yearly to ensure alignment to needs. RHI also actively joined hands with other companies of the MVP Group in building competencies for Digital Transformation as a defense
Thrive means to prosper or to flourish. With the onset of technological advancements and changes in the environment, the business landscape is rapidly changing. Here at RHI, our people see the waves of change coming and look at them as opportunities to transform the organization into the RHI of the future.
The One Team, One RHI campaign of the past two years sought alignment and teamwork across all subsidiaries. Events, interventions and activities done company-wide were meant to highlight the importance of working together towards one common goal. The Annual Strategic Planning Workshop in March 2018 was a venue to lay out the groundwork to take RHI to new heights. Successes as well as challenges and next steps were discussed amongst Top Management and Line Leaders in detail to ensure that as we move through the coming Crop Years, we are ready to innovate when needed. Key to this is the critical organizational review and changes to ensure that the company is equipped, responsive and remains relevant in the evolving business landscape. Roles are defined and standardized across the Head Office and business units, which serve as the anchor of rewards programs and talent management practices.
against total business disruption in the First Pacific Leadership Academy-led program “DX Masterclass”. Employee Engagement programs highlighted not only camaraderie but creativity and resourcefulness — important traits that were clearly displayed in the year-end celebrations across all subsidiaries. A sense of belongingness was on a high as employees were grouped for presentations to showcase employee talents. The year 2018 also marked the first year thatRHI joined in the MVP Olympics’ sporting competitions endingthe maiden run with a silver medal from the Chess Competition by Mr. Rex M. Durban, Senior Manager – Commercial Operations Group. There were also needs-based engagement programs recognizing that employees wear different important hats in and out of the work setting. Programs such as the Graduates Honoring, Mother’s Day, Father’s Day, Kudos Rewards, & Boss Encouragement Day celebrate the very important roles of employees as parents, mothers, fathers, and leaders. Capping off 2018, employees who have long served RHI as well as those who have delivered above and beyond in terms of work performance were given much-deserved recognition during the Service and Excellence Awards.
Year 2019 shall see RHI thrive and advance through the unique challenges of the industry, with the teamwork of our talented employees shining through.

22212018 ANNUAL REPORT2018 ANNUAL REPORT
THE RIGHT FUNDAMENTALS: SUSTAINABILITY
DIRECTORS DIRECTORS & ADVISORSBOARD OF BOARD OF
1. PEDRO E. ROXAS Chairman
(Second from right.)
2. MANUEL V. PANGILINAN Vice Chairman
(Second from left.)
3. HUBERT D. TUBIO Director, President & CEO
(First from left.)
4. CHRISTOPHER H. YOUNG Director
(First from right.)
1. SANTIAGO R. ELIZALDE Director
(Second from right.)
2. RAY C. ESPINOSA Director
(Center.)
3. ALEX ERLITO S. FIDER Director
(Second from left.)
4. DAVID L. BALANGUE Director
(First from left.)
5. SENEN C. BACANI Advisor
(First from right.)
42 13
24232018 ANNUAL REPORT2018 ANNUAL REPORT
THE RIGHT FUNDAMENTALS: SUSTAINABILITY
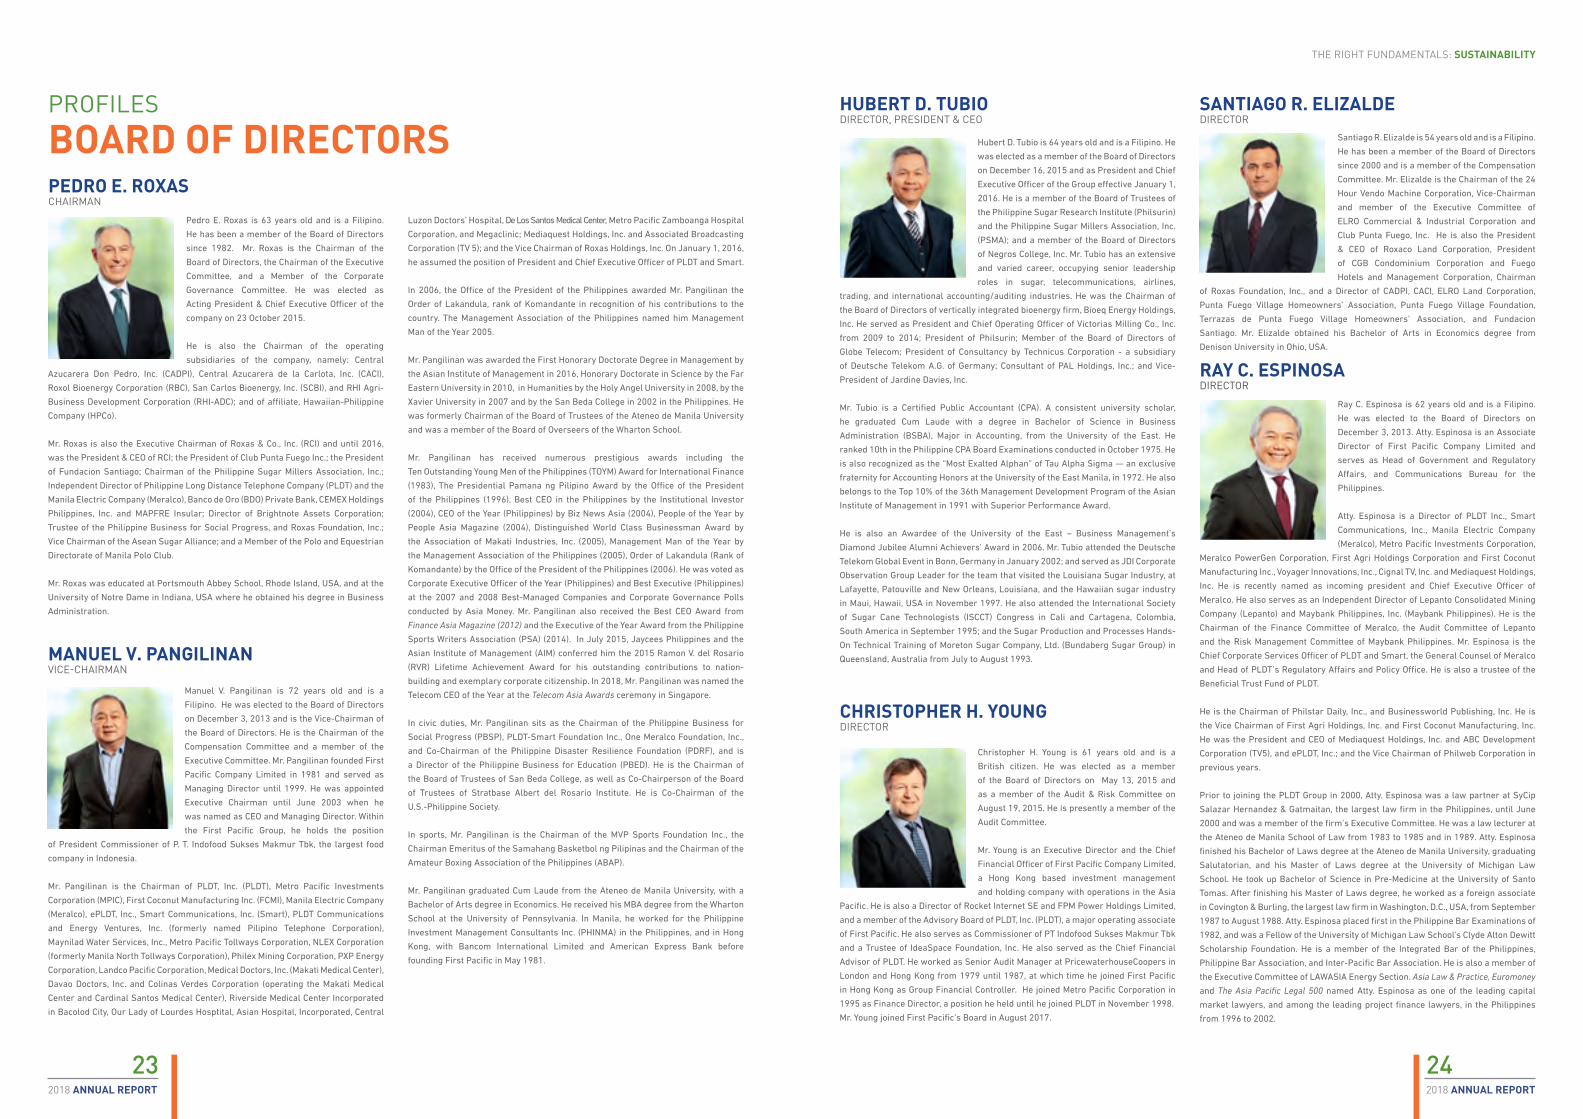
Ray C. Espinosa is 62 years old and is a Filipino.
He was elected to the Board of Directors on
December 3, 2013. Atty. Espinosa is an Associate
Director of First Pacific Company Limited and
serves as Head of Government and Regulatory
Affairs, and Communications Bureau for the
Philippines.
Atty. Espinosa is a Director of PLDT Inc., Smart
Communications, Inc., Manila Electric Company
(Meralco), Metro Pacific Investments Corporation,
Meralco PowerGen Corporation, First Agri Holdings Corporation and First Coconut
Manufacturing Inc., Voyager Innovations, Inc., Cignal TV, Inc. and Mediaquest Holdings,
Inc. He is recently named as incoming president and Chief Executive Officer of
Meralco. He also serves as an Independent Director of Lepanto Consolidated Mining
Company (Lepanto) and Maybank Philippines, Inc. (Maybank Philippines). He is the
Chairman of the Finance Committee of Meralco, the Audit Committee of Lepanto
and the Risk Management Committee of Maybank Philippines. Mr. Espinosa is the
Chief Corporate Services Officer of PLDT and Smart, the General Counsel of Meralco
and Head of PLDT’s Regulatory Affairs and Policy Office. He is also a trustee of the
Beneficial Trust Fund of PLDT.
He is the Chairman of Philstar Daily, Inc., and Businessworld Publishing, Inc. He is
the Vice Chairman of First Agri Holdings, Inc. and First Coconut Manufacturing, Inc.
He was the President and CEO of Mediaquest Holdings, Inc. and ABC Development
Corporation (TV5), and ePLDT, Inc.; and the Vice Chairman of Philweb Corporation in
previous years.
Prior to joining the PLDT Group in 2000, Atty. Espinosa was a law partner at SyCip
Salazar Hernandez & Gatmaitan, the largest law firm in the Philippines, until June
2000 and was a member of the firm’s Executive Committee. He was a law lecturer at
the Ateneo de Manila School of Law from 1983 to 1985 and in 1989. Atty. Espinosa
finished his Bachelor of Laws degree at the Ateneo de Manila University, graduating
Salutatorian, and his Master of Laws degree at the University of Michigan Law
School. He took up Bachelor of Science in Pre-Medicine at the University of Santo
Tomas. After finishing his Master of Laws degree, he worked as a foreign associate
in Covington & Burling, the largest law firm in Washington, D.C., USA, from September
1987 to August 1988. Atty. Espinosa placed first in the Philippine Bar Examinations of
1982, and was a Fellow of the University of Michigan Law School’s Clyde Alton Dewitt
Scholarship Foundation. He is a member of the Integrated Bar of the Philippines,
Philippine Bar Association, and Inter-Pacific Bar Association. He is also a member of
the Executive Committee of LAWASIA Energy Section. Asia Law & Practice, Euromoney
and The Asia Pacific Legal 500 named Atty. Espinosa as one of the leading capital
market lawyers, and among the leading project finance lawyers, in the Philippines
from 1996 to 2002.
Pedro E. Roxas is 63 years old and is a Filipino.
He has been a member of the Board of Directors
since 1982. Mr. Roxas is the Chairman of the
Board of Directors, the Chairman of the Executive
Committee, and a Member of the Corporate
Governance Committee. He was elected as
Acting President & Chief Executive Officer of the
company on 23 October 2015.
He is also the Chairman of the operating
subsidiaries of the company, namely: Central
Azucarera Don Pedro, Inc. (CADPI), Central Azucarera de la Carlota, Inc. (CACI),
Roxol Bioenergy Corporation (RBC), San Carlos Bioenergy, Inc. (SCBI), and RHI Agri-
Business Development Corporation (RHI-ADC); and of affiliate, Hawaiian-Philippine
Company (HPCo).
Mr. Roxas is also the Executive Chairman of Roxas & Co., Inc. (RCI) and until 2016,
was the President & CEO of RCI; the President of Club Punta Fuego Inc.; the President
of Fundacion Santiago; Chairman of the Philippine Sugar Millers Association, Inc.;
Independent Director of Philippine Long Distance Telephone Company (PLDT) and the
Manila Electric Company (Meralco), Banco de Oro (BDO) Private Bank, CEMEX Holdings
Philippines, Inc. and MAPFRE Insular; Director of Brightnote Assets Corporation;
Trustee of the Philippine Business for Social Progress, and Roxas Foundation, Inc.;
Vice Chairman of the Asean Sugar Alliance; and a Member of the Polo and Equestrian
Directorate of Manila Polo Club.
Mr. Roxas was educated at Portsmouth Abbey School, Rhode Island, USA, and at the
University of Notre Dame in Indiana, USA where he obtained his degree in Business
Administration.
Hubert D. Tubio is 64 years old and is a Filipino. He
was elected as a member of the Board of Directors
on December 16, 2015 and as President and Chief
Executive Officer of the Group effective January 1,
2016. He is a member of the Board of Trustees of
the Philippine Sugar Research Institute (Philsurin)
and the Philippine Sugar Millers Association, Inc.
(PSMA); and a member of the Board of Directors
of Negros College, Inc. Mr. Tubio has an extensive
and varied career, occupying senior leadership
roles in sugar, telecommunications, airlines,
trading, and international accounting/auditing industries. He was the Chairman of
the Board of Directors of vertically integrated bioenergy firm, Bioeq Energy Holdings,
Inc. He served as President and Chief Operating Officer of Victorias Milling Co., Inc.
from 2009 to 2014; President of Philsurin; Member of the Board of Directors of
Globe Telecom; President of Consultancy by Technicus Corporation - a subsidiary
of Deutsche Telekom A.G. of Germany; Consultant of PAL Holdings, Inc.; and Vice-
President of Jardine Davies, Inc.
Mr. Tubio is a Certified Public Accountant (CPA). A consistent university scholar,
he graduated Cum Laude with a degree in Bachelor of Science in Business
Administration (BSBA), Major in Accounting, from the University of the East. He
ranked 10th in the Philippine CPA Board Examinations conducted in October 1975. He
is also recognized as the “Most Exalted Alphan” of Tau Alpha Sigma — an exclusive
fraternity for Accounting Honors at the University of the East Manila, in 1972. He also
belongs to the Top 10% of the 36th Management Development Program of the Asian
Institute of Management in 1991 with Superior Performance Award.
He is also an Awardee of the University of the East – Business Management’s
Diamond Jubilee Alumni Achievers’ Award in 2006. Mr. Tubio attended the Deutsche
Telekom Global Event in Bonn, Germany in January 2002; and served as JDI Corporate
Observation Group Leader for the team that visited the Louisiana Sugar Industry, at
Lafayette, Patouville and New Orleans, Louisiana, and the Hawaiian sugar industry
in Maui, Hawaii, USA in November 1997. He also attended the International Society
of Sugar Cane Technologists (ISCCT) Congress in Cali and Cartagena, Colombia,
South America in September 1995; and the Sugar Production and Processes Hands-
On Technical Training of Moreton Sugar Company, Ltd. (Bundaberg Sugar Group) in
Queensland, Australia from July to August 1993.
Manuel V. Pangilinan is 72 years old and is a
Filipino. He was elected to the Board of Directors
on December 3, 2013 and is the Vice-Chairman of
the Board of Directors. He is the Chairman of the
Compensation Committee and a member of the
Executive Committee. Mr. Pangilinan founded First
Pacific Company Limited in 1981 and served as
Managing Director until 1999. He was appointed
Executive Chairman until June 2003 when he
was named as CEO and Managing Director. Within
the First Pacific Group, he holds the position
of President Commissioner of P. T. Indofood Sukses Makmur Tbk, the largest food
company in Indonesia.
Mr. Pangilinan is the Chairman of PLDT, Inc. (PLDT), Metro Pacific Investments
Corporation (MPIC), First Coconut Manufacturing Inc. (FCMI), Manila Electric Company
(Meralco), ePLDT, Inc., Smart Communications, Inc. (Smart), PLDT Communications
and Energy Ventures, Inc. (formerly named Pilipino Telephone Corporation),
Maynilad Water Services, Inc., Metro Pacific Tollways Corporation, NLEX Corporation
(formerly Manila North Tollways Corporation), Philex Mining Corporation, PXP Energy
Corporation, Landco Pacific Corporation, Medical Doctors, Inc. (Makati Medical Center),
Davao Doctors, Inc. and Colinas Verdes Corporation (operating the Makati Medical
Center and Cardinal Santos Medical Center), Riverside Medical Center Incorporated
in Bacolod City, Our Lady of Lourdes Hosptital, Asian Hospital, Incorporated, Central
BOARD OF DIRECTORSPROFILES
Luzon Doctors’ Hospital, De Los Santos Medical Center, Metro Pacific Zamboanga Hospital
Corporation, and Megaclinic; Mediaquest Holdings, Inc. and Associated Broadcasting
Corporation (TV 5); and the Vice Chairman of Roxas Holdings, Inc. On January 1, 2016,
he assumed the position of President and Chief Executive Officer of PLDT and Smart.
In 2006, the Office of the President of the Philippines awarded Mr. Pangilinan the
Order of Lakandula, rank of Komandante in recognition of his contributions to the
country. The Management Association of the Philippines named him Management
Man of the Year 2005.
Mr. Pangilinan was awarded the First Honorary Doctorate Degree in Management by
the Asian Institute of Management in 2016, Honorary Doctorate in Science by the Far
Eastern University in 2010, in Humanities by the Holy Angel University in 2008, by the
Xavier University in 2007 and by the San Beda College in 2002 in the Philippines. He
was formerly Chairman of the Board of Trustees of the Ateneo de Manila University
and was a member of the Board of Overseers of the Wharton School.
Mr. Pangilinan has received numerous prestigious awards including the
Ten Outstanding Young Men of the Philippines (TOYM) Award for International Finance
(1983), The Presidential Pamana ng Pilipino Award by the Office of the President
of the Philippines (1996), Best CEO in the Philippines by the Institutional Investor
(2004), CEO of the Year (Philippines) by Biz News Asia (2004), People of the Year by
People Asia Magazine (2004), Distinguished World Class Businessman Award by
the Association of Makati Industries, Inc. (2005), Management Man of the Year by
the Management Association of the Philippines (2005), Order of Lakandula (Rank of
Komandante) by the Office of the President of the Philippines (2006). He was voted as
Corporate Executive Officer of the Year (Philippines) and Best Executive (Philippines)
at the 2007 and 2008 Best-Managed Companies and Corporate Governance Polls
conducted by Asia Money. Mr. Pangilinan also received the Best CEO Award from
Finance Asia Magazine (2012) and the Executive of the Year Award from the Philippine
Sports Writers Association (PSA) (2014). In July 2015, Jaycees Philippines and the
Asian Institute of Management (AIM) conferred him the 2015 Ramon V. del Rosario
(RVR) Lifetime Achievement Award for his outstanding contributions to nation-
building and exemplary corporate citizenship. In 2018, Mr. Pangilinan was named the
Telecom CEO of the Year at the Telecom Asia Awards ceremony in Singapore.
In civic duties, Mr. Pangilinan sits as the Chairman of the Philippine Business for
Social Progress (PBSP), PLDT-Smart Foundation Inc., One Meralco Foundation, Inc.,
and Co-Chairman of the Philippine Disaster Resilience Foundation (PDRF), and is
a Director of the Philippine Business for Education (PBED). He is the Chairman of
the Board of Trustees of San Beda College, as well as Co-Chairperson of the Board
of Trustees of Stratbase Albert del Rosario Institute. He is Co-Chairman of the
U.S.-Philippine Society.
In sports, Mr. Pangilinan is the Chairman of the MVP Sports Foundation Inc., the
Chairman Emeritus of the Samahang Basketbol ng Pilipinas and the Chairman of the
Amateur Boxing Association of the Philippines (ABAP).
Mr. Pangilinan graduated Cum Laude from the Ateneo de Manila University, with a
Bachelor of Arts degree in Economics. He received his MBA degree from the Wharton
School at the University of Pennsylvania. In Manila, he worked for the Philippine
Investment Management Consultants Inc. (PHINMA) in the Philippines, and in Hong
Kong, with Bancom International Limited and American Express Bank before
founding First Pacific in May 1981.
HUBERT D. TUBIO DIRECTOR, PRESIDENT & CEO
MANUEL V. PANGILINAN VICE-CHAIRMAN
PEDRO E. ROXAS CHAIRMAN
Christopher H. Young is 61 years old and is a
British citizen. He was elected as a member
of the Board of Directors on May 13, 2015 and
as a member of the Audit & Risk Committee on
August 19, 2015. He is presently a member of the
Audit Committee.
Mr. Young is an Executive Director and the Chief
Financial Officer of First Pacific Company Limited,
a Hong Kong based investment management
and holding company with operations in the Asia
Pacific. He is also a Director of Rocket Internet SE and FPM Power Holdings Limited,
and a member of the Advisory Board of PLDT, Inc. (PLDT), a major operating associate
of First Pacific. He also serves as Commissioner of PT Indofood Sukses Makmur Tbk
and a Trustee of IdeaSpace Foundation, Inc. He also served as the Chief Financial
Advisor of PLDT. He worked as Senior Audit Manager at PricewaterhouseCoopers in
London and Hong Kong from 1979 until 1987, at which time he joined First Pacific
in Hong Kong as Group Financial Controller. He joined Metro Pacific Corporation in
1995 as Finance Director, a position he held until he joined PLDT in November 1998.
Mr. Young joined First Pacific’s Board in August 2017.
CHRISTOPHER H. YOUNGDIRECTOR
Santiago R. Elizalde is 54 years old and is a Filipino.
He has been a member of the Board of Directors
since 2000 and is a member of the Compensation
Committee. Mr. Elizalde is the Chairman of the 24
Hour Vendo Machine Corporation, Vice-Chairman
and member of the Executive Committee of
ELRO Commercial & Industrial Corporation and
Club Punta Fuego, Inc. He is also the President
& CEO of Roxaco Land Corporation, President
of CGB Condominium Corporation and Fuego
Hotels and Management Corporation, Chairman
of Roxas Foundation, Inc., and a Director of CADPI, CACI, ELRO Land Corporation,
Punta Fuego Village Homeowners’ Association, Punta Fuego Village Foundation,
Terrazas de Punta Fuego Village Homeowners’ Association, and Fundacion
Santiago. Mr. Elizalde obtained his Bachelor of Arts in Economics degree from
Denison University in Ohio, USA.
SANTIAGO R. ELIZALDE DIRECTOR
RAY C. ESPINOSA DIRECTOR

26252018 ANNUAL REPORT2018 ANNUAL REPORT
THE RIGHT FUNDAMENTALS: SUSTAINABILITY
Senen C. Bacani is 74 years old and is a Filipino.
He was formerly a member of the Board of
Directors and was elected as a member of the
Board of Advisors on December 11, 2013.
Mr. Bacani is the President of Ultrex Management
& Investments Corp.; Chairman & President of
La Frutera, Inc.; Chairman of Trully Natural Food
Corporation; a Director of Swift Foods, Inc.; a
Private Sector Representative of APEC Policy
Partnership on Food Security, ABAC Philippines;
Director of the Philippine Chamber of Agriculture & Food, Inc.; Member of the Board
of Advisors of East-West Seed Philippines, Inc.; Director of Icebox Logistics Services,
Inc.; Director of Franklin Baker Co. of the Philippines; and a Member of the National
Competitiveness Council.
He is also a Member of the Board of Trustees of the Philippine Rice Research
Institute, and the Vice-Chairman of the Technical Advisory Committee of the
PCARRD (DOST). Mr. Bacani is also involved in various non-government and people’s
organizations. He obtained his degree in Bachelor of Science in Commerce at the De
La Salle University, graduating Summa Cum Laude and Class Valedictorian, and his
Masters in Business Administration at the University of Hawaii, USA. He passed the
CPA Board Exams in 1966.
SENEN C. BACANIDIRECTOR
BOARD OF ADVISORSPROFILES
Vicente S. Perez is 60 years old and is a Filipino.
He was elected as a member of the Board of
Advisors on March 25, 2009. Mr. Perez is an
avid environment advocate and an investor in
renewable energy. He is the CEO of Alternergy,
a wind and mini-hydro power developer, and
Chairman of Merritt Partners, an energy advisory
firm, and Chairman of Solar Pacific, an off-grid
island solar PV developer.
He has been an independent director of regional
companies in Australia, the Philippines and Singapore. He is an independent director
of ST Telemedia, the Temasek holding company for telecom, data centers and mobile
technology, and is an Independent Board Adviser of Banco de Oro, the Philippines’
largest commercial bank. He is a member of the Advisory Boards of Coca-Cola
FEMSA Philippines, Geneva-based Pictet Clean Energy Fund, and the Yale Center for
Business and Environment.
His philanthropy involvements are focused on the environment. Mr. Perez is chairman
of the National Advisory Council of WWF-Philippines and treasurer of the WWF-
International board, and a trustee or adviser of the Asian Conservation Foundation,
Bhutan Foundation, Solar Energie Foundation and Solar Car Challenge Foundation.
Mr. Perez was Philippine Energy Minister from 2001 to 2005. He boosted energy self-
sufficiency, promoted clean indigenous energy, and crafted an ambitious renewable
policy framework. He served briefly in early 2001 as Deputy Minister for Trade and
Industry.
VICENTE S. PEREZDIRECTOR
Prior to 2001, Mr. Perez had 17 years of experience first in Latin American debt
restructuring at Mellon Bank in Pittsburgh, and later in debt trading, capital markets,
and private equity in emerging countries at Lazard in London, New York and
Singapore. At 35, he became General Partner at New York investment bank Lazard
Frères as head of its Emerging Markets Group. He was Managing Director of Lazard
Asia in Singapore from 1995 until 1997.
Mr. Perez founded Next Century Partners in 1997, a private equity firm based in
Singapore. In 2000, he founded Asian Conservation Company, which acquired El Nido
Resorts, an award- winning eco-tourism destination in Palawan. In 2006, he invested
in Northwind Power, the first commercial wind farm in Southeast Asia.
He has consulted for the Asian Development Bank (ADB), International Finance
Corporation (IFC) and numerous firms on renewable energy. With his various
involvements, the media has dubbed him as the Philippine “renewable czar”.
Mr. Perez obtained an MBA from the Wharton Business School of the University
of Pennsylvania in 1983 and a Bachelor’s Degree in Business Economics from the
University of the Philippines in 1979. He was a 2005 World Fellow at Yale University,
where he lectured an MBA class on renewable power in emerging countries.
Alex Erlito S. Fider is 65 years old and is a
Filipino. He was elected to the Board of Directors
on December 3, 2013. Atty. Fider graduated from
the University of the Philippines with degrees
in Economics and Law. He was admitted to the
Philippine Bar in 1985 and undertook specialized
courses in Strategic Economics and Corporate
Governance in the Philippines and Australia,
respectively. His legal experience spans three
decades of involvement in corporate transactions
and projects. His legal work extends to an array
of corporate and financial matters to companies involved in public infrastructure,
water, and power utilities, telecommunications, mass media, banking and finance,
real estate development, and agriculture. He is a specialist in the various fields
of commercial, civil, telecommunications and public utilities law. Atty. Fider is a
Director and Corporate Secretary of several Philippine corporations, including Metro
Pacific Tollways Corporation, Metro Pacific Tollways Development Corporation, NLEX
Corporation (formerly Manila North Tollways Corporation), Tollways Management
Corporation, Smart Communications, Inc. and Maynilad Water Services, Inc. He is
actively involved in the Financial Executives Institute of the Philippines (FINEX) and
the Institute of Corporate Directors of which he is a Fellow.
ALEX ERLITO S. FIDERDIRECTOR
Oscar J. Hilado is 81 years old and is a Filipino.
He has been a member of the Board of Directors
since May 11, 2016. An Independent Director, he
is the Chairman of the Corporate Governance
Committee and a member of the Audit and
Compensation Committees. He is the Chairman of
the Board of Philippine Investment Management,
Inc. (PHINMA); Phinma Corp.; Phinma Energy
Corporation; Phinma Property Holdings Corp.;
and Union Galvasteel Corporation. Mr. Hilado
is also the Vice Chairman of Trans Asia Power
Generation Corporation and Trans-Asia Petroleum Corporation and the Chairman of
the Executive Committee of Phinma Corp.
He is a Director of A. Soriano Corporation; First Philippine Holdings Corporation; Philex
Mining Corporation; United Pulp and Paper Co., Inc.; Beacon Property Ventures, Inc.;
Manila Cordage Company; Smart Communications, Inc.; Digital Telecommunications
Philippines, Inc. (DIGITEL); Pueblo de Oro Development Corporation; Seven Seas
Resorts and Leisure, Inc.; Asian Eye Institute; Rockwell Land Corporation; Araullo
University, Inc.; Cagayan de Oro College, Inc.; University of Iloilo, Inc.; University of
Pangasinan, Inc.; Southwestern University; PEN Holdings, Inc.; Microtel Inns & Suites
(Pilipinas), Inc.; and Trans Asia Renewable Energy Corporation.
Mr. Hilado is an Honorary Consul of Ecuador. He was awarded the MAP Management
Man of the Year in 1991. He was a Smith Mundt/Fullbright scholar at the Harvard
Graduate School of Business where he obtained his Master’s Degree in Business
Administration in 1962. He is a Certified Public Accountant (CPA) with a Bachelor of
Science in Commerce degree from the De La Salle College in Bacolod in 1958. He
earned his Doctorate in Business Management, Honoris Causa, from the De La Salle
University in 1992 and in 2003, attained his Doctorate of Law, Honoris Causa, from
the University of St. La Salle.
OSCAR J. HILADODIRECTOR
ID -*Independent Directors
David L. Balangue is 67 years old and is a Filipino.
He has been a member of the Board of Directors
since February 12, 2012. An Independent Director,
he is the Chairman of the Audit Committee and
is a member of the Executive and Corporate
Governance Committees. Mr. Balangue is an
accounting and auditing professional whose
career spanned 38 years at SGV & Co., the
Philippines’ largest audit and accounting
professional services firm. He is a former
Chairman & Managing Partner of the firm, after
being admitted to partnership in 1982. Mr. Balangue holds a Bachelor’s Degree in
Commerce, major in Accounting, Magna Cum Laude, from the Manuel L. Quezon
University and a Master of Management degree, with distinction, from the Kellogg
Graduate School of Management of Northwestern University in Evanston, Illinois,
USA, as an SGV scholar where he received a Distinguished Scholar Award and
elected to the Beta Gamma Sigma, an exclusive honors fraternity. He placed second
highest in the 1972 Philippine CPA Board Examinations.
He served as President of the Manila Polo Club, Inc. (2014-2015), Financial Executives
Institute of the Philippines (2006); Philippine Institute of Certified Public Accountants
(2005); and Management Association of the Philippines (2004). He is the Chairman of
NAMFREL, the Philippine Center for Population and Development, Inc. (since 2014)
and Coalition Against Corruption (since 2006); Member of the Board of Trustees of
Habitat for Humanity Philippine Foundation, Inc. (since 2012); Chairman/President
of Makati Commercial Estate Association, Inc. (since May 2010); President of Makati
Parking Authority (since 2012); and Chairman of the Philippine Financial Reporting
Standards Council (since February 2010). He is an Independent Director of Phinma
Energy Corp., Philippine Bank of Communications, Manulife Financial Plans, Inc., and
Holcim Philippines, Inc.
Mr. Balangue has a regular column in Philippine Daily Inquirer.
DAVID L. BALANGUE DIRECTOR
BOARD COMMITTEESEXECUTIVE COMMITTEE
Chairman: Mr. Pedro E. Roxas
Members: Mr. Manuel V. PangilinanMr. David L. Balangue (ID)
CORPORATE GOVERNANCECOMMITTEE
Chairman: Mr. Oscar J. Hilado (ID)
Members: Mr. Pedro E. RoxasMr. David L. Balangue (ID)
AUDIT COMMITTEE
Chairman: Mr. David L. Balangue
Members: Mr. Christopher H. YoungMr. Oscar J. Hilado (ID)
COMPENSATION COMMITTEE
Chairman: Manuel V. Pangilinan
Members: Mr. Santiago R. ElizaldeMr. Oscar J. Hilado (ID)

First row, right to left: First row, from left to right: Second row, from left to right:Second row, left to right:
28272018 ANNUAL REPORT2018 ANNUAL REPORT
THE RIGHT FUNDAMENTALS: SUSTAINABILITY
1. HUBERT D. TUBIO President & CEO
2. CELSO T. DIMARUCUT Executive Vice President/Chief Financial Officer
3. ARCADIO S. LOZADA, JR. Executive Vice President/Chief Operations Officer Sugar Business Unit
4. GEORGE T. CHEUNG Senior Vice President Commercial Operations
5.
6.
7.
8.
9.
10.
11.
12.
13.
14.
CYNTHIA L. DELA PAZCorporate Secretary
MA. HAZEL L. RABARA-RETARDOAssistant Corporate SecretaryAssistant Vice President, Corporate GovernanceDeputy Compliance OfficerGroup Head, Legal & Corporate Affairs
TIMOTHY T. BENNETTPresidentHawaiian-Philippine Company
JOSE B. VILLANUEVAVice President/Chief Manufacturing OfficerAlcohol Business Unit
JOSE MANUEL L. MAPAVice President and General ManagerRHI Agri-Business Development Corporation
JAYNEL R. SULANGIVice President/Group HeadInformation & Communications Technology
VERONICA C. CORTEZAssistant Vice President/Group HeadFinance
KATHRINA ESTRELLA L. SEBASTIANAssistant Vice President, TreasuryChief Credit & Risk Officer
JAYPEE V. JIMENEZAssistant Vice President/Group HeadProcurement Materials Management
JOSEPHINE M. LOGROÑOAssistant Vice President/Group HeadInternal Audit
OFFICERSCORPORATE

30292018 ANNUAL REPORT2018 ANNUAL REPORT
THE RIGHT FUNDAMENTALS: SUSTAINABILITY
Cynthia L. Dela Paz is 56 years old and is a
Filipino. She has been the Corporate Secretary of
the Group since February 15, 2017. Atty. de la Paz
is a senior partner at Picazo Buyco Tan Fider &
Santos. She has been in the practice of corporate
law and taxation for about 30 years. She has been
a Director of Tax Management Association of the
Philippines (TMAP) for the last 10 years. Atty. de
la Paz holds a law degree from the University
of the Philippines and graduated from the same
university with a degree in Psychology.
Celso T. Dimarucut is 57 years old and is
a Filipino. He was appointed as Executive
Vice President – Chief Financial Officer
(EVP CFO) and Group Head of Finance effective
December 1, 2015. Prior to joining the company,
Mr. Dimarucut served as Senior Executive
Vice President and Chief Finance Officer of
Landco Pacific Corporation and its subsidiaries;
Senior Vice President and Group Chief Finance
Officer of Mediaquest Holdings, Inc. and
its subsidiaries; Senior Vice President and
Group Chief Finance Officer of ePLDT, Inc. and Subsidiaries; First Vice President
and Group Controller of PLDT Group; First Vice-President and Group Financial
Controller for domestic subsidiaries of Metropolitan Bank & Trust Company; and
Finance Head of Pilipino Telephone Corporation (Piltel), and later, as Comptroller
of Philippine Long Distance Telephone Company after Piltel’s integration to Smart
Communications, Inc. where he managed the overall financial reporting functions
of the PLDT Group. Mr Dimarucut has more than 10 years of professional audit and
business advisory experience gained from SyCip, Gorres Velayo & Co. and Prasetio
Utomo & Co. (Jakarta, Indonesia). He graduated Cum Laude at the Polytechnic
University of the Philippines with a degree of BS Commerce Major in Accounting.
He is a Certified Public Accountant.
Arcadio S. Lozada, Jr. is 64 years old and is
a Filipino. He is currently the Executive Vice
President and Chief Operations Officer for RHI’s
Sugar Business Unit.
He was appointed as Executive Vice-President
and Group Head for Operations of the company,
and as President & COO of CADPI on January 1,
2014. He was formerly the Vice-President for
Manufacturing of Victorias Milling Company, Inc.,
a Technical Manager of Bronzeoak Philippines,
Inc., and an Engineering Manager at the Central Azucarera de Tarlac, among others.
Mr. Lozada is a licensed Mechanical Engineer and has completed a short course in
raw sugar manufacturing at the Nicholls State University in Louisiana, USA.
Frederick E. Reyes is 57 years old and is a
Filipino. He is the Vice President and Group
Head for Human Resources. He was appointed
as Assistant Vice President and Deputy Head of
Human Resources on February 1, 2014 and was
promoted to Vice President and Deputy Head of
Human Resources on January 5, 2015.
Mr. Reyes was formerly the Director for Human
Resources Services of Manila Water Company, Inc.
Esteban H. Coscolluela is 67 years old and is a
Filipino.
He was appointed as Vice President/General
Manager for Central Azucarera de la Carlota, Inc.
on 11 May 2016. He was a former Director and
Executive Committee Chairman of PNOC Coal
Corporation. He was also a former VP at Union
Bank. He occupied various leadership roles in
planters’ associations, farmers’ cooperatives, and
the Chamber of Commerce and Industry, in Negros
Occidental. Mr. Coscolluela also served as Mayor of Murcia in Negros Occidental. He
graduated with a degree in BS Management at the University of St. La Salle. He is an
MBA Graduate at the Asian Institute of Management.
George T. Cheung is 45 years old and is a Filipino.
He was appointed as Senior Vice President for
Marketing & Trading, which was later renamed
Commercial Operations, on January 5, 2015.
He has over 20 years of experience in the
field of agricultural and energy commodities,
specializing in sugar, fuel ethanol and thermal
coal. He has held senior commercial, general
management and business development roles in
the Philippines, Hong Kong, Taiwan and Mainland
China for leading global commodities companies like Cargill, ED&F Man, Sucden,
Wilmar and Trafigura, among others.
He was formerly a Managing Partner in Commodity Partners Pte, Ltd.; Head of
Domestic Coal Trading of Trafigura Investment China, Ltd., based in Shanghai;
Associate Director & General Manager-Sugar Division of Wilmar Sugar Pte. Ltd/Yihai
Commercial Eagle Trading; General Manager at the Greater China Region of ED&F
Man, a global supplier of sugar; and a Trading Manager of the Sugar Division in Hong
Kong of Cargill. Mr. Cheung obtained his MBA from Duke University in Durham, North
Carolina, USA and has Bachelors in Agricultural Sciences degree from the University
of British Columbia, major in Food Science and Agricultural Economics.
CELSO T. DIMARUCUTEXECUTIVE VICE PRESIDENT/CHIEF FINANCIAL OFFICER
ARCADIO S. LOZADA, JR. EXECUTIVE VICE PRESIDENT/CHIEF OPERATIONS OFFICERSUGAR BUSINESS UNIT
FREDERICK E. REYESVICE PRESIDENTHUMAN RESOURCES
ESTEBAN H. COSCOLLUELA VICE PRESIDENT/GENERAL MANAGERCENTRAL AZUCARERA DE LA CARLOTA, INC.
GEORGE T. CHEUNGSENIOR VICE PRESIDENTCOMMERCIAL OPERATIONS
Jose Manuel L. Mapa is 52 years old and is a
Filipino. He was appointed as Vice President
and General Manager of RHI Agri-business
Development Corporation on January 8, 2018.
Prior to joining RHI, he managed his family’s
sugarcane farm for the past 30 years alongside
working in the corporate world in shipping
and logistics company 2GO Group, Inc./Negros
Navigation from 1997 to 2018 where he served in
various capacities starting as Freight Marketing
Manager to Branch Manager in Bacolod City, rising up to the position of Asst. Vice
President/Area Head of Negros Island, to Vice President-National Freight Business
and eventually, Executive Vice President for Key Accounts under 2GO Logistics, Inc.
He also served as President of the UP Los Baños Alumni Association in Negros
Occidental for two terms.
Mr. Mapa is a graduate of the University of St. La Salle Graduate School-Bacolod
City with a Masters degree in Business Administration, with High Academic Honors.
He finished his Bachelor of Science in Agribusiness Management at UP Los
Baños where he received several awards, including the UP President’s Award for
Outstanding Student, the UPLB University Council Leadership Award and the UPLB
Outstanding Student Leader Award. He also served as the Chairman of the University
Student Council of UPLB in 1986-87.
In 2015, the UPLB College of Economics and Management recognized Mr. Mapa as
CEM Outstanding Alumnus in Leadership and Corporate Governance. He was also
awarded the 2015 Distinguished Alumnus Award by the UPLB College of Economics
and Management Alumni Association.
JOSE MANUEL L. MAPA VICE PRESIDENT/GENERAL MANAGER RHI AGRI-BUSINESS DEVELOPMENT CORPORATION
Jose B. Villanueva III is 49 years old and is a
Filipino. He was appointed as Vice President/
Chief Manufacturing Officer of Alcohol Strategic
Business Unit on July 2, 2018.
Mr. Villanueva has over two decades of work
experience spanning, among others, the areas
of Operations, Supply Chain, Human Resources,
and Project Management. He is currently an
Industry Advisor to the Mechanical Engineering
Department of De La Salle University in Taft,
Manila. He spent eight years in Mondelez International (formerly Kraft Food Phils.,
Inc.), where he held various roles such as Site Manager, Category Operations
& Development Manager, Maintenance Manager, and Manufacturing Business
Development Manager.
He was a former Reliability Manager of Lafarge Cement, looking after five plants
across the country. He also worked at Sanko Systems Services and as Engineering
Manager at Avon Products Manufacturing, Inc. He spent 10 years with the foods
group of Unilever Philippines, handling leadership roles across Operations
and Human Resources. He was also part of the team that built a world-class
manufacturing facility.
JOSE B. VILLANUEVA III VICE PRESIDENT/CHIEF MANUFACTURING OFFICER ALCOHOL BUSINESS UNIT
Jaynel R. Sulangi is 43 years old and is a
Filipino. He was appointed as Vice President and
Group Head of Information & Communications
Technology on March 21, 2018.
Mr. Sulangi was Vice President for SAP Project
Management at Deutsche Bank group before
joining Roxas Holdings, Inc. He also worked at
PLDT and Smart Communications, Inc. for seven
years as Senior Manager, IT-Resource Planning
(ERP) and later, as Solutions Architect, Program
Management Office. He also worked at SAP, SSIP and Business Applications
and Network Technologies. He is a Certified SAP Consultant in Production
Planning since 1997.
He graduated Cum Laude with Bachelor of Science in Industrial Engineering degree
at the University of the Philippines.
JAYNEL R. SULANGI VICE PRESIDENT/GROUP HEADINFORMATION & COMMUNICATIONS TECHNOLOGY
CYNTHIA L. DELA PAZCORPORATE SECRETARY
HUBERT D. TUBIO PRESIDENT & CEO
MANUEL V. PANGILINAN VICE-CHAIRMAN
PEDRO E. ROXAS CHAIRMAN
*Please check profiles on pages 23-24
Kathrina Estrella L. Sebastian is 44 years
old and is a Filipino. She was appointed as
Assistant Vice President - Head of Treasury and
Chief Risk Officer and Chief Credit Officer on
December 16, 2015. Ms. Sebastian was previously
the Head of Development Organizations and
the Relationship Manager/Associate Director
of Financial Institutions of Standard Chartered
Bank. She also worked for Citibank, N.A. and G &
S Transport Corporation. Ms. Sebastian obtained
her degree in Bachelor of Science in Management
at the Ateneo de Manila University and her MBA in International Business at the
Manchester Business School, United Kingdom.
KATHRINA ESTRELLA L. SEBASTIAN ASSISTANT VICE PRESIDENT, TREASURYCHIEF CREDIT & RISK OFFICER
CORPORATE OFFICERSPROFILES
Mr. Reyes also worked at Vitarich Corporation where he was in charge of Training,
Quality Control and Employee Relations. He joined Globe Telecom during its
transition to become a “wireless” telephone company where he was responsible
for Training and Development from 1990 through 1997, and also in Manila Water,
during its “privatization” years between 1997 and 2012. Mr. Reyes obtained his
degree in Industrial Engineering from the University of Sto. Tomas and is a
licensed Industrial Engineer.

32312018 ANNUAL REPORT2018 ANNUAL REPORT
THE RIGHT FUNDAMENTALS: SUSTAINABILITY
Jaypee V. Jimenez is 34 years old and is a Filipino.
He was appointed as Assistant Vice President
and Group Head of Procurement and Materials
Management on February 15, 2018.
Mr. Jimenez was Senior Manager of Procurement
at Roxas Holdings, Inc. from June 2016 to February
2018, serving both the sugar and bioethanol
units. Prior to that, he was Manager for MRO
Procurement at Aboitiz Power Corporation. He
also served as Supervisor for Procurement at AP
Renewables, Inc.; as Procurement Engineer at Bilfal Heavy Industries at the Kingdom
of Saudi Arabia, and as Engineering Buyer at the Asian Terminals Incorporated.
Ma. Hazel L. Rabara-Retardo is 38 years old and
is a Filipino. She was appointed as Assistant Vice
President for Corporate Governance and Deputy
Compliance Officer on September 20, 2016. After
briefly serving as OIC for a period from June 2018,
Atty. Rabara-Retardo is now the Group Head of
Legal & Corporate Affairs. Prior to joining RHI,
Atty. Rabara-Retardo was Vice President - Legal
& Administrative Affairs/Corporate Secretary
of Advanced Merchant Payments Lending
Corporation, an affiliate of Amplifi Capital (HK) Ltd.
and AMP credit technologies, Ltd. She also worked as Court Attorney V at the Office
of the Presiding Justice Acosta of the Court of Tax Appeals. Atty. Rabara-Retardo
also worked as an associate at the Tan Venturanza Valdez Law Office where she was
assigned as Corporate Secretary of various private and publicly listed companies.
MA. HAZEL L. RABARA-RETARDO ASSISTANT CORPORATE SECRETARYASSISTANT VICE PRESIDENT, CORPORATE GOVERNANCEDEPUTY COMPLIANCE OFFICERGROUP HEAD, LEGAL & CORPORATE AFFAIRS
Josephine M. Logroño is 42 years old and is a
Filipino. She was appointed as Assistant Vice
President and Group Head of Internal Audit on
February 1, 2018.
Ms. Logroño was a former Audit Manager at
Arthaland Corporation and Shang Properties,
Inc. She has 17 years of experience in
both internal and external auditing, having
worked as Finance – Process Solution
Auditor and as an Internal Auditor at Holcim
Philippines, Inc. Ms. Logroño also served as an Associate Auditor at Sycip,
Gorres, Velayo (SGV) & Co. She graduated with a degree in BS Accountancy
from the University of Sto. Tomas. She is a Certified Public Accountant and a
Certified Internal Auditor.
JOSEPHINE M. LOGROÑO ASSITANT VICE PRESIDENT/GROUP HEADINTERNAL AUDIT
Daisy Perpetua A. Bo is 55 years old and is a
Filipino. She was appointed as Assistant Vice
President for QA/Safety/EMS/IE on May 11, 2016.
Ms. Bo was formerly a QA Manager at Alaska
Milk Corporation. She also worked previously
at Coca Cola Export Corporation as Area Quality
Manager for the Visayas and Mega Manila and as
Concentrate Plant QA Manager. She was also a
former Product Support Business Team Leader at
Avon Products Manufacturing.
She graduated with a degree in BS Chemistry from the University of Santo
Tomas, and took some MBA units at the De La Salle University. She is a
licensed chemist since 1987.
DAISY PERPETUA A. BOASSITANT VICE PRESIDENT/GROUP HEADQUALITY ASSURANCE/SAFETY/INDUSTRIAL ENGINEERING JAYPEE V. JIMENEZ
ASSISTANT VICE PRESIDENT/GROUP HEADPROCUREMENT MATERIALS MANAGEMENT
Timothy T. Bennett is 68 years old and is an
American. He is the President and General
Manager of Hawaiian-Philippine Company
(HPCo), an affiliate of Roxas Holdings, Inc.,
in Silay, Negros Occidental since 2003.
He was previously Senior Vice President
and Director, and Head of Sugar Divisions
of Jardine Davies, Inc. where he managed
the company’s three sugar operating units:
HPCo, Bogo Medelin Milling Co., Inc., and HPCo
Agridev Corporation. He also held various roles at the Hamakua Sugar Co., Theo
Davies Hamakua Sugar Co., and Laupahoehoe Sugar Co. He is the President of
the Philippine Sugar Research Institute, Inc. since 2015 and is a Member of the
Board of Trustees of the Philippine Sugar Millers Association, Inc. since 1989.
Mr. Bennett graduated with a Bachelors Degree in Business Administration at the
Colorado College in Colorado, USA.
TIMOTHY T. BENNETT PRESIDENTHAWAIIAN-PHILIPPINE COMPANY
Veronica C. Cortez is 39 years old and is a
Filipino. She was appointed Assistant Vice
President of Finance on February 10, 2016. She
has over 10 years of experience in external
auditing. She worked with SyCip Gorres Velayo
& Co. (SGV) as Senior Director from September
2009 to 2015. She started her career with
SGV as an Associate and moved to become
Senior Associate, Associate Director and
then Director. She also worked as a Senior
Associate in the Resource Sharing Program of
Ernst & Young Houston, Texas Office. Ms. Cortez graduated with a degree in
BS Accountancy from San Sebastian College Recoletos de Cavite and is a
Certified Public Accountant.
VERONICA C. CORTEZ ASSITANT VICE PRESIDENT/GROUP HEADFINANCE
INDEPENDENT AUDITOR’S REPORT The Board of Directors and Stockholders Roxas Holdings, Inc. Opinion We have audited the consolidated financial statements of Roxas Holdings, Inc. and its subsidiaries (the Group), which comprise the consolidated statements of financial position as at September 30, 2018 and 2017, and the consolidated statements of income, consolidated statements of comprehensive income, consolidated statements of changes in equity and consolidated statements of cash flows for the years then ended, and notes to the consolidated financial statements, including a summary of significant accounting policies. In our opinion, the accompanying consolidated financial statements present fairly, in all material respects, the consolidated financial position of the Group as at September 30, 2018 and 2017, and its consolidated financial performance and its consolidated cash flows for the years then ended in accordance with Philippine Financial Reporting Standards (PFRSs). Basis for Opinion We conducted our audits in accordance with Philippine Standards on Auditing (PSAs). Our responsibilities under those standards are further described in the Auditor’s Responsibilities for the Audit of the Consolidated Financial Statements section of our report. We are independent of the Group in accordance with the Code of Ethics for Professional Accountants in the Philippines (Code of Ethics) together with the ethical requirements that are relevant to our audit of the consolidated financial statements in the Philippines, and we have fulfilled our other ethical responsibilities in accordance with these requirements and the Code of Ethics. We believe that the audit evidence we have obtained is sufficient and appropriate to provide a basis for our opinion. Other Matter The consolidated financial statements of the Group as at and for the year ended September 30, 2016 were audited by another auditor who expressed an unmodified opinion on those statements on December 1, 2016. Key Audit Matters Key audit matters are those matters that, in our professional judgment, were of most significance in our audit of the consolidated financial statements of the current period. These matters were addressed in the context of our audit of the consolidated financial statements as a whole, and in forming our opinion thereon, and we do not provide a separate opinion on these matters. For each matter below, our description of how our audit addressed the matter is provided in that context.
We have fulfilled the responsibilities described in the Auditor’s Responsibilities for the Audit of the Consolidated Financial Statements section of our report, including in relation to these matters. Accordingly, our audit included the performance of procedures designed to respond to our assessment of the risks of material misstatement of the consolidated financial statements. The results of our audit procedures, including the procedures performed to address the matters below, provide the basis for our audit opinion on the accompanying consolidated financial statements. Accounting for Completeness of Quedan The Group’s raw sugar business follows the quedan system, which is unique to the Philippine sugar industry. A quedan is a warehouse receipt document which shows ownership of a specified amount of raw sugar in a warehouse or sugar central. Accordingly, the Group’s physical possession or delivery of raw sugar may not necessarily indicate ownership, or sales or purchase transaction, respectively. We considered accounting for quedan as a key audit matter due to the volume of the transactions covered by this unique system, which impacts sales and inventory accounts which are material and significant to the consolidated financial statements. The disclosures about quedan accounting are included in Notes 9 and 28 to the consolidated financial statements. Audit Response We have confirmed our understanding of the Group’s quedanning system and tested the relevant controls on the information system and manual processes. We observed the inventory count procedures of the Group to establish the physical existence of raw sugar as of count date and reviewed the rollforward procedures to arrive at the physical quantity as of reporting date. We reviewed the reconciliation of the physical quantity and quedan accountability report to test the quantity reported, which are supported by quedans, as the Group’s inventory and those which are held in trust for the planters and traders. Impairment Testing of Goodwill Under PFRSs, the Group is required to test the goodwill annually or more frequently if events or changes in circumstances indicate that the carrying value may be impaired. As at September 30, 2018, the Group’s goodwill is attributable to its investment in San Carlos Bioenergy, Inc., the cash generating unit (CGU). The goodwill amounted to P=1.08 billion, which is considered significant to the consolidated financial statements. In addition, management’s assessment process requires estimation of value-in-use based on the expected future cash flows of the CGU. Such process involves significant management judgment about future market conditions and estimation based on assumptions, such as forecasted bioethanol price, forecasted sales volume, expected gross profit and discount rate.
The disclosures about goodwill are included in Notes 5 and 6 to the consolidated financial statements. Audit Response We involved our internal specialist in evaluating the methodology and the discount rate used. We evaluated management’s key assumptions used in preparing the cash flow forecast such as forecasted bioethanol price, forecasted sales volume, and expected gross profit by comparing them against the CGU’s historical performance and current industry outlook.
We obtained and evaluated management’s sensitivity analyses to ascertain the impact of reasonably possible changes in key assumptions. We performed our own independent sensitivity calculations to quantify the downside changes to management’s models required which will result in impairment. We also reviewed the Group’s disclosures about those assumptions to which the outcome of the impairment test is most sensitive; specifically those that have the most significant effect on the determination of the recoverable amount of goodwill. Valuation of Land Stated at Fair Value The Group carries its parcels of land, which are accounted for as property, plant and equipment at revaluation method and investment properties at fair value method in its consolidated financial statements as of reporting date. As of September 30, 2018, the carrying value of land amounted to P=1.85 billion, representing 7% of the Group’s consolidated assets. Management obtains the services of external appraisers to determine the land values whose calculations involve certain assumptions such as sales prices of similar properties and adjustments to sales price based on internal and external factors. In addition, this requires significant management judgment and estimates. Thus, we considered this as key audit matter. The disclosures relating to these parcels of land are included in Notes 12 and 13 to the consolidated financial statements.
34332018 ANNUAL REPORT2018 ANNUAL REPORT
THE RIGHT FUNDAMENTALS: SUSTAINABILITY
Audit Response We compared the property-related data in the appraisal reports against the Group’s records. We involved our internal specialist in reviewing the scope, methodology and the assumptions used by the Group’s external appraisers. We evaluated the competence, capabilities and qualifications of the external appraisers by considering their qualifications, experience and reporting responsibilities. We compared the assumptions used, specifically the sales price of comparable properties, against relevant external information. We also discussed with the external appraisers the nature and magnitude of the adjustment factors. We also reviewed the Group’s disclosures with respect to the fair values of the land under property, plant and equipment and investment properties. Estimating Useful Lives of Property, Plant and Equipment Under PFRSs, the Group is required to review the estimated useful lives of property, plant and equipment at least at each reporting period. In 2018, the Group changed the estimated useful lives of buildings and building improvements, and machinery and equipment, in view of management’s assessment based on examination of the structural condition and functional reliability of these assets that the remaining useful lives can be extended. The carrying values of buildings and building improvements, and machinery and equipment totaled to P=6.4 billion, which account for 25% of the total consolidated assets as of September 30, 2018. Given that the change in estimated useful lives involves significant management judgment and estimate, we considered this is a key audit matter. The disclosures on the estimated useful lives of the property, plant and equipment are included in Notes 4 and 5. Audit Response Our audit procedures included obtaining an understanding of management’s basis for the change in the estimated useful lives of buildings and building improvements, and machinery and equipment. We reviewed management’s internal memorandum discussing the factors considered which resulted in the change in estimated remaining useful lives. We compared the revised useful lives against market data and industry information. We tested the computation of depreciation expense based on the revised useful lives. We also reviewed the Group’s disclosures regarding the change in the estimated useful lives of buildings and building improvements, and machineries and equipment. Assessment of Contingent Liabilities and Estimation of Provisions from Claims The Group is involved in certain claims by regulatory bodies and other parties. The inherent uncertainty over the outcome of these claims is brought about by the difference in the interpretations and implementation of the relevant regulations. The assessment of whether the provision should be recognized and the estimation of the potential liability resulting from these assessments require significant judgment by management. As of September 30, 2018, total provisions recognized by the Group amounted to P=7.55 million. The disclosures on management judgment on assessment of contingent liabilities and estimation of provisions and amounts recognized are included in Notes 5, 16 and 28, respectively, to the consolidated financial statements. Audit Response We inquired of the Group’s legal counsels and management about the status and potential exposures of the significant claims and obtained legal opinion from the legal counsels, including their assessment of the likely outcome, and representation from the Group management. We also inspected relevant correspondences with the regulatory bodies and other relevant parties, and reviewed the minutes of meetings of the Board of Directors and Audit Committee. We involved our internal specialist in the evaluation of management’s assessment on whether provision should be recognized and the estimation of such amount. Accounting for Investment in Hawaiian-Philippine Company (HP Co.) The Company has a 45% investment in HP Co., an associate, with carrying value of P=642.69 million as of September 30, 2018. The investment is accounted for using the equity method. We consider the accounting for this investment as a key audit matter because it contributed P=54.67 million to the consolidated net income and P=56.83 million to the consolidated total comprehensive income. HP Co. also operates in the sugar industry business; thus, is subject to the same risks as the Group. The disclosures on the investment in HP Co., are included in Note 11 to the consolidated financial statements. Audit Response We sent instructions to the statutory auditors of HP Co. to perform an audit on the relevant financial information of HP Co. for the purpose of the Group’s consolidated financial statements. These instructions contained a discussion on their scope of work, risk assessment procedures, audit strategy and reporting requirements. We performed procedures to assess HP Co. statutory auditors’ competence. We discussed with HP Co. statutory auditors about their key audit areas, planning and execution of audit procedures, significant areas of estimation and judgment, and results of their work for the year ended September 30, 2018. We reviewed the working papers of the statutory auditor of HP Co., focusing on the procedures performed on quedan accounting. We reviewed the appraisal report of the valuation of land accounted for as property, plant and equipment and recomputed the Group’s share in appraisal increase on land of associate. We also obtained the financial information of HP Co. as of and for the year ended September 30, 2018 and recomputed the Group’s share in net income for the year ended September 30, 2018.
Other Information Management is responsible for the other information. The other information comprises the SEC Form 17-A for the year ended September 30, 2018 but does not include the consolidated financial statements and our auditor’s report thereon, which we obtained prior to the date of this auditor’s report, and the SEC Form 20-IS (Definitive Information Statement) and Annual Report for the year ended September 30, 2018, which is expected to be made available to us after that date. Our opinion on the consolidated financial statements does not cover the other information and we do not and will not express any form of assurance conclusion thereon. In connection with our audits of the consolidated financial statements, our responsibility is to read the other information identified above and, in doing so, consider whether the other information is materially inconsistent with the consolidated financial statements or our knowledge obtained in the audits, or otherwise appears to be materially misstated. If, based on the work we have performed on the other information that we obtained prior to the date of this auditor’s report, we conclude that there is a material misstatement of this other information, we are required to report that fact. We have nothing to report in this regard. Responsibilities of Management and Those Charged with Governance for the Consolidated Financial Statements Management is responsible for the preparation and fair presentation of the consolidated financial statements in accordance with PFRSs, and for such internal control as management determines is necessary to enable the preparation of consolidated financial statements that are free from material misstatement, whether due to fraud or error. In preparing the consolidated financial statements, management is responsible for assessing the Group’s ability to continue as a going concern, disclosing, as applicable, matters related to going concern and using the going concern basis of accounting unless management either intends to liquidate the Group or to cease operations, or has no realistic alternative but to do so. Those charged with governance are responsible for overseeing the Group’s financial reporting process.
Auditor’s Responsibilities for the Audit of the Consolidated Financial Statements Our objectives are to obtain reasonable assurance about whether the consolidated financial statements as a whole are free from material misstatement, whether due to fraud or error, and to issue an auditor’s report that includes our opinion. Reasonable assurance is a high level of assurance, but is not a guarantee that an audit conducted in accordance with PSAs will always detect a material misstatement when it exists. Misstatements can arise from fraud or error and are considered material if, individually or in the aggregate, they could reasonably be expected to influence the economic decisions of users taken on the basis of these consolidated financial statements. As part of an audit in accordance with PSAs, we exercise professional judgment and maintain professional skepticism throughout the audit. We also: • Identify and assess the risks of material misstatement of the consolidated financial statements, whether due to fraud or error, design and perform audit procedures responsive
to those risks, and obtain audit evidence that is sufficient and appropriate to provide a basis for our opinion. The risk of not detecting a material misstatement resulting from fraud is higher than for one resulting from error, as fraud may involve collusion, forgery, intentional omissions, misrepresentations, or the override of internal control.
• Obtain an understanding of internal control relevant to the audit in order to design audit procedures that are appropriate in the circumstances, but not for the purpose of expressing an opinion on the effectiveness of the Group’s internal control.
• Evaluate the appropriateness of accounting policies used and the reasonableness of accounting estimates and related disclosures made by management.
• Conclude on the appropriateness of management’s use of the going concern basis of accounting and, based on the audit evidence obtained, whether a material uncertainty exists related to events or conditions that may cast significant doubt on the Group’s ability to continue as a going concern. If we conclude that a material uncertainty exists, we are required to draw attention in our auditor’s report to the related disclosures in the consolidated financial statements or, if such disclosures are inadequate, to modify our opinion. Our conclusions are based on the audit evidence obtained up to the date of our auditor’s report. However, future events or conditions may cause the Group to cease to continue as a going concern.
• Evaluate the overall presentation, structure and content of the consolidated financial statements, including the disclosures, and whether the consolidated financial statements
represent the underlying transactions and events in a manner that achieves fair presentation.
• Obtain sufficient appropriate audit evidence regarding the financial information of the entities or business activities within the Group to express an opinion on the consolidated financial statements. We are responsible for the direction, supervision and performance of the audit. We remain solely responsible for our audit opinion.
We communicate with those charged with governance regarding, among other matters, the planned scope and timing of the audit and significant audit findings, including any significant deficiencies in internal control that we identify during our audit.
We also provide those charged with governance with a statement that we have complied with relevant ethical requirements regarding independence, and to communicate with them all relationships and other matters that may reasonably be thought to bear on our independence, and where applicable, related safeguards. From the matters communicated with those charged with governance, we determine those matters that were of most significance in the audit of the consolidated financial statements of the current period and are therefore the key audit matters. We describe these matters in our auditor’s report unless law or regulation precludes public disclosure about the matter or when, in extremely rare circumstances, we determine that a matter should not be communicated in our report because the adverse consequences of doing so would reasonably be expected to outweigh the public interest benefits of such communication. The engagement partner on the audit resulting in this independent auditor’s report is Aileen L. Saringan. SYCIP GORRES VELAYO & CO. Aileen L. Saringan Partner CPA Certificate No. 72557 SEC Accreditation No. 0096-AR-4 (Group A), August 18, 2016, valid until August 18, 2019 Tax Identification No. 102-089-397 BIR Accreditation No. 08-001998-058-2018, February 26, 2018, valid until February 25, 2021 PTR No. 7332610, January 3, 2019, Makati City January 14, 2019
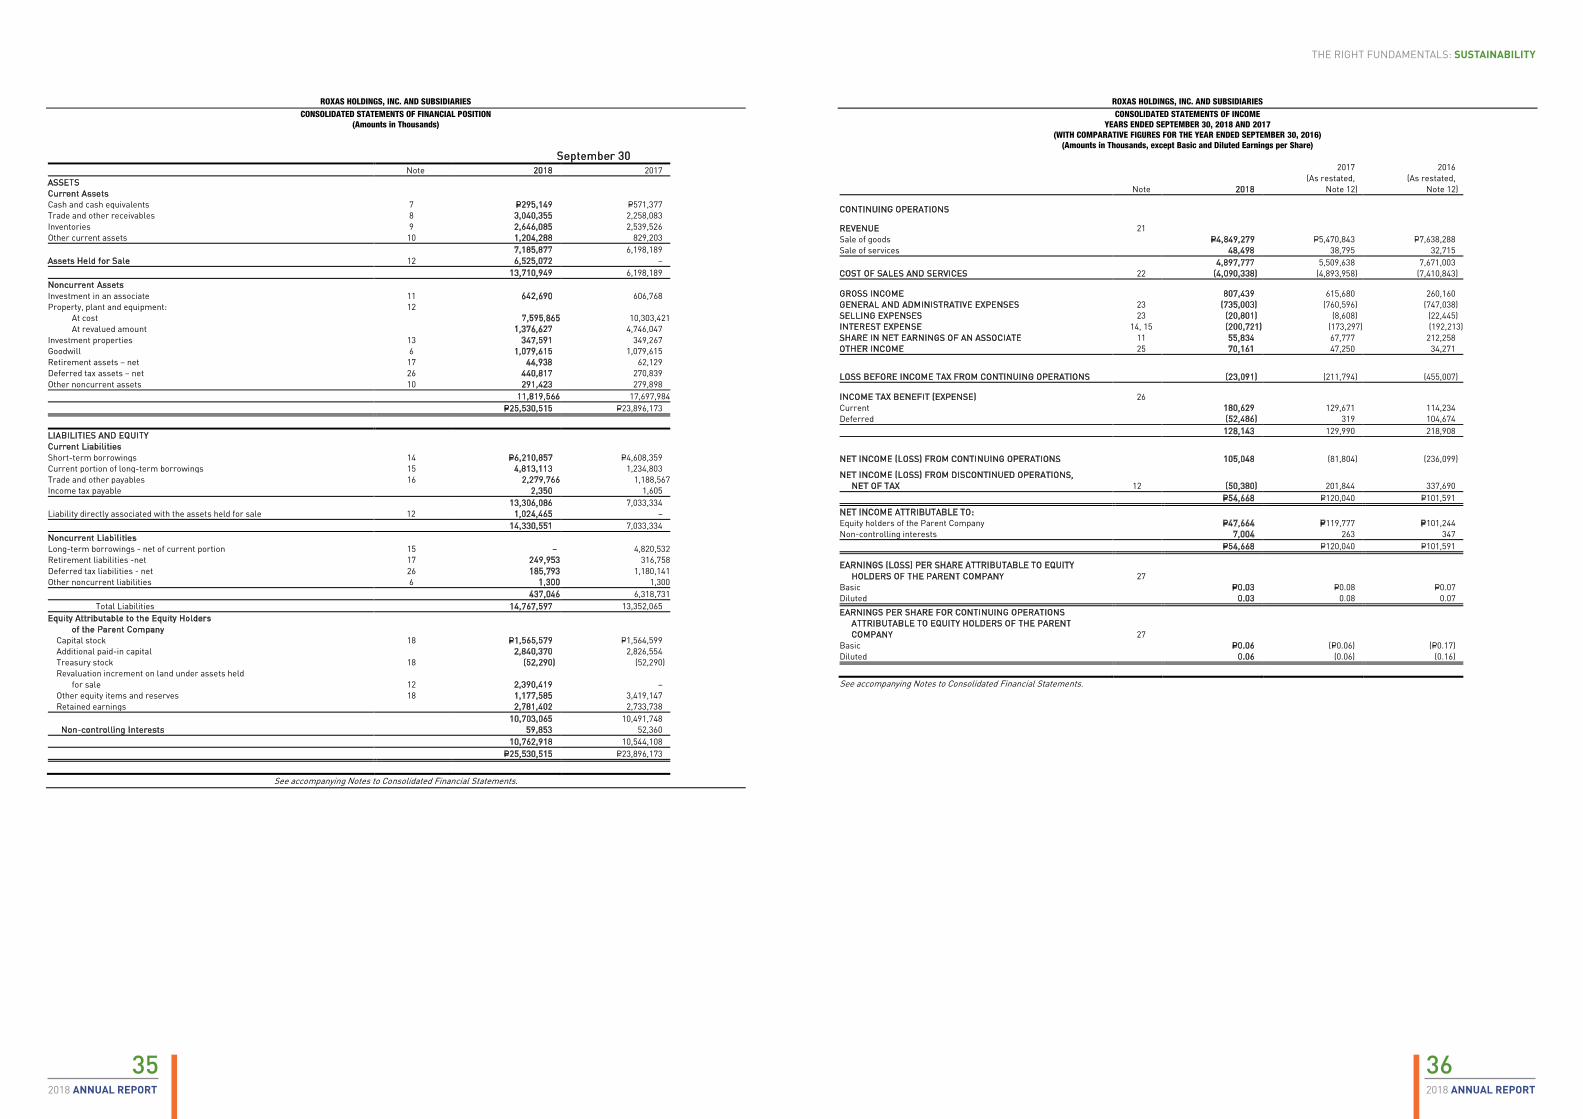
36352018 ANNUAL REPORT2018 ANNUAL REPORT
THE RIGHT FUNDAMENTALS: SUSTAINABILITY
ROXAS HOLDINGS, INC. AND SUBSIDIARIES CONSOLIDATED STATEMENTS OF FINANCIAL POSITION
(Amounts in Thousands)
September 30 Note 2018 2017 ASSETS Current Assets Cash and cash equivalents 7 P=295,149 P=571,377 Trade and other receivables 8 3,040,355 2,258,083 Inventories 9 2,646,085 2,539,526 Other current assets 10 1,204,288 829,203 7,185,877 6,198,189 Assets Held for Sale 12 6,525,072 – 13,710,949 6,198,189 Noncurrent Assets Investment in an associate 11 642,690 606,768 Property, plant and equipment: 12 At cost 7,595,865 10,303,421 At revalued amount 1,376,627 4,746,047 Investment properties 13 347,591 349,267 Goodwill 6 1,079,615 1,079,615 Retirement assets – net 17 44,938 62,129 Deferred tax assets – net 26 440,817 270,839 Other noncurrent assets 10 291,423 279,898 11,819,566 17,697,984 P=25,530,515 P=23,896,173
LIABILITIES AND EQUITY Current Liabilities Short-term borrowings 14 P=6,210,857 P=4,608,359 Current portion of long-term borrowings 15 4,813,113 1,234,803 Trade and other payables 16 2,279,766 1,188,567 Income tax payable 2,350 1,605 13,306,086 7,033,334 Liability directly associated with the assets held for sale 12 1,024,465 – 14,330,551 7,033,334 Noncurrent Liabilities Long-term borrowings - net of current portion 15 – 4,820,532 Retirement liabilities -net 17 249,953 316,758 Deferred tax liabilities - net 26 185,793 1,180,141 Other noncurrent liabilities 6 1,300 1,300 437,046 6,318,731 Total Liabilities 14,767,597 13,352,065 Equity Attributable to the Equity Holders
of the Parent Company Capital stock 18 P=1,565,579 P=1,564,599 Additional paid-in capital 2,840,370 2,826,554 Treasury stock 18 (52,290) (52,290) Revaluation increment on land under assets held
for sale 12 2,390,419 – Other equity items and reserves 18 1,177,585 3,419,147 Retained earnings 2,781,402 2,733,738
10,703,065 10,491,748 Non-controlling Interests 59,853 52,360
10,762,918 10,544,108 P=25,530,515 P=23,896,173
See accompanying Notes to Consolidated Financial Statements.
A member firm of Ernst & Young Global Limited
ROXAS HOLDINGS, INC. AND SUBSIDIARIES CONSOLIDATED STATEMENTS OF INCOME
YEARS ENDED SEPTEMBER 30, 2018 AND 2017 (WITH COMPARATIVE FIGURES FOR THE YEAR ENDED SEPTEMBER 30, 2016)
(Amounts in Thousands, except Basic and Diluted Earnings per Share)
Note 2018
2017 (As restated,
Note 12)
2016 (As restated,
Note 12)
CONTINUING OPERATIONS
REVENUE 21 Sale of goods P=4,849,279 P=5,470,843 P=7,638,288 Sale of services 48,498 38,795 32,715
4,897,777 5,509,638 7,671,003 COST OF SALES AND SERVICES 22 (4,090,338) (4,893,958) (7,410,843)
GROSS INCOME 807,439 615,680 260,160 GENERAL AND ADMINISTRATIVE EXPENSES 23 (735,003) (760,596) (747,038) SELLING EXPENSES 23 (20,801) (8,608) (22,445) INTEREST EXPENSE 14, 15 (200,721) (173,297) (192,213) SHARE IN NET EARNINGS OF AN ASSOCIATE 11 55,834 67,777 212,258 OTHER INCOME 25 70,161 47,250 34,271
LOSS BEFORE INCOME TAX FROM CONTINUING OPERATIONS (23,091) (211,794) (455,007)
INCOME TAX BENEFIT (EXPENSE) 26 Current 180,629 129,671 114,234 Deferred (52,486) 319 104,674
128,143 129,990 218,908
NET INCOME (LOSS) FROM CONTINUING OPERATIONS 105,048 (81,804) (236,099)
NET INCOME (LOSS) FROM DISCONTINUED OPERATIONS, NET OF TAX 12 (50,380) 201,844 337,690
P=54,668 P=120,040 P=101,591
NET INCOME ATTRIBUTABLE TO: Equity holders of the Parent Company P=47,664 P=119,777 P=101,244 Non-controlling interests 7,004 263 347
P=54,668 P=120,040 P=101,591
EARNINGS (LOSS) PER SHARE ATTRIBUTABLE TO EQUITY HOLDERS OF THE PARENT COMPANY 27
Basic P=0.03 P=0.08 P=0.07 Diluted 0.03 0.08 0.07
EARNINGS PER SHARE FOR CONTINUING OPERATIONS ATTRIBUTABLE TO EQUITY HOLDERS OF THE PARENT COMPANY 27
Basic P=0.06 (P=0.06) (P=0.17) Diluted 0.06 (0.06) (0.16)
See accompanying Notes to Consolidated Financial Statements.
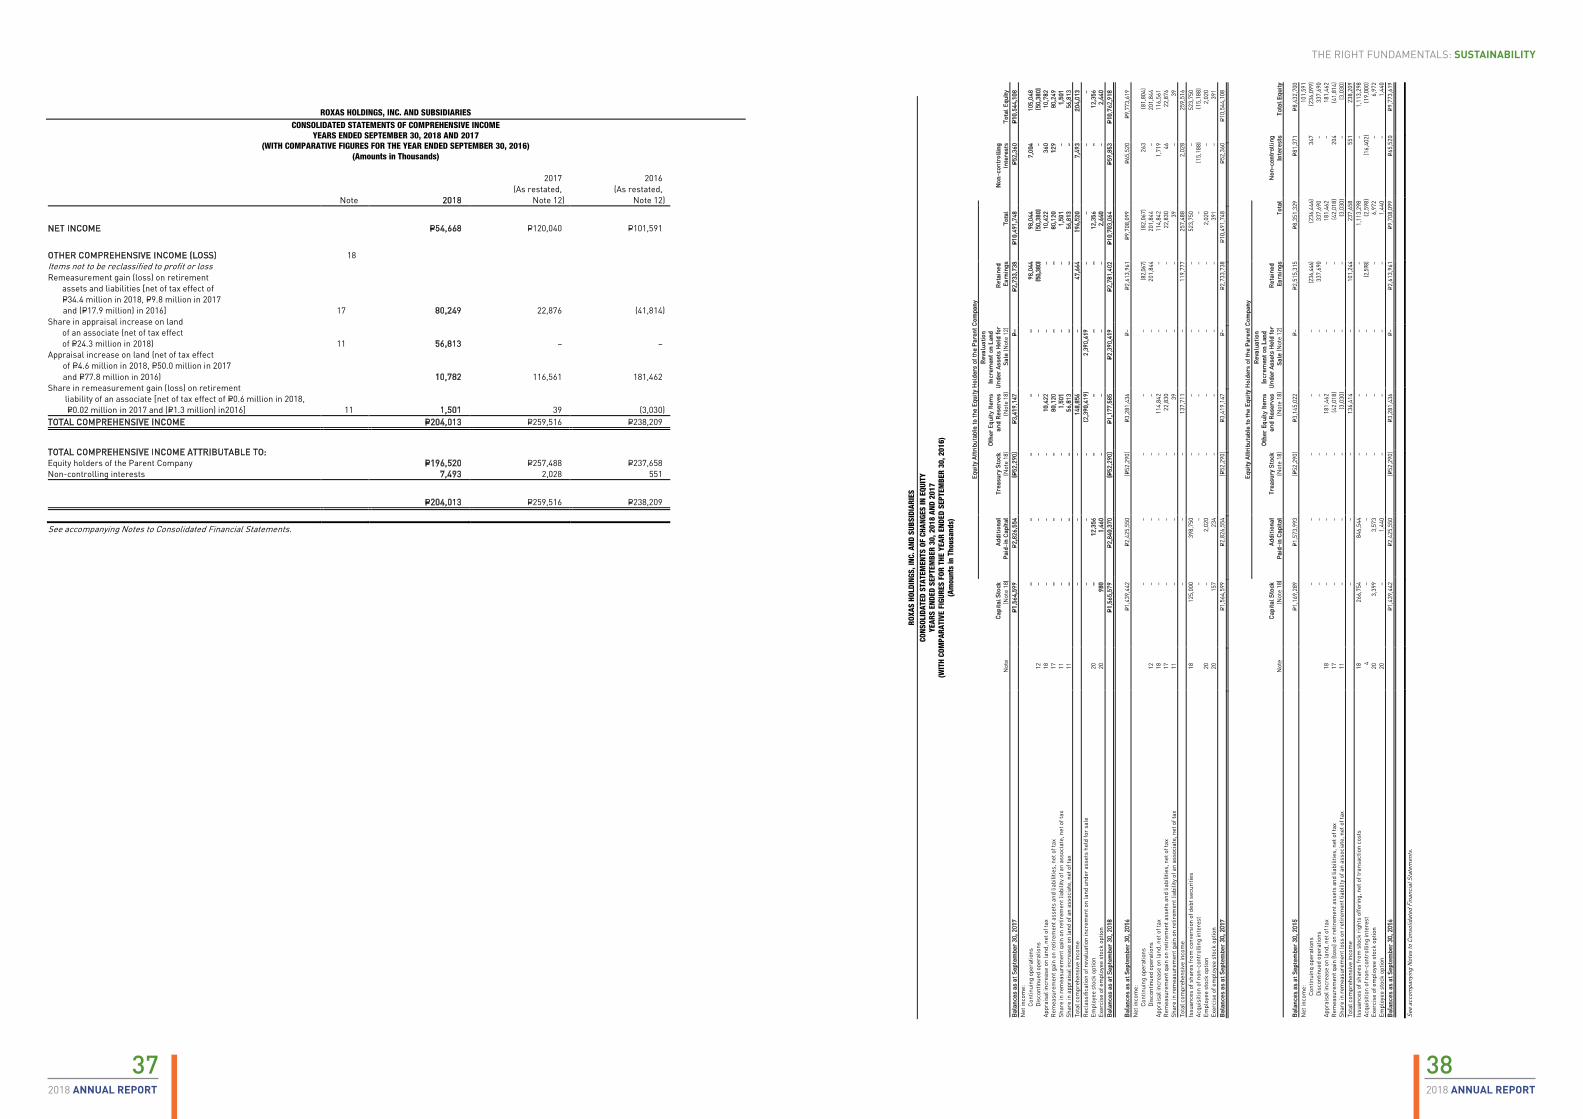
38372018 ANNUAL REPORT2018 ANNUAL REPORT
THE RIGHT FUNDAMENTALS: SUSTAINABILITY
ROXAS HOLDINGS, INC. AND SUBSIDIARIES
CONSOLIDATED STATEMENTS OF COMPREHENSIVE INCOME YEARS ENDED SEPTEMBER 30, 2018 AND 2017
(WITH COMPARATIVE FIGURES FOR THE YEAR ENDED SEPTEMBER 30, 2016) (Amounts in Thousands)
Note 2018
2017 (As restated,
Note 12)
2016 (As restated,
Note 12)
NET INCOME P=54,668 P=120,040 P=101,591
OTHER COMPREHENSIVE INCOME (LOSS) 18 Items not to be reclassified to profit or loss Remeasurement gain (loss) on retirement assets and liabilities [net of tax effect of P=34.4 million in 2018, P=9.8 million in 2017 and (P=17.9 million) in 2016] 17 80,249 22,876 (41,814) Share in appraisal increase on land of an associate (net of tax effect of P=24.3 million in 2018) 11 56,813 – – Appraisal increase on land (net of tax effect of P=4.6 million in 2018, P=50.0 million in 2017 and P=77.8 million in 2016) 10,782 116,561 181,462 Share in remeasurement gain (loss) on retirement liability of an associate [net of tax effect of P=0.6 million in 2018, P=0.02 million in 2017 and (P=1.3 million) in2016] 11 1,501 39 (3,030) TOTAL COMPREHENSIVE INCOME P=204,013 P=259,516 P=238,209
TOTAL COMPREHENSIVE INCOME ATTRIBUTABLE TO: Equity holders of the Parent Company P=196,520 P=257,488 P=237,658 Non-controlling interests 7,493 2,028 551
P=204,013 P=259,516 P=238,209
See accompanying Notes to Consolidated Financial Statements.
ROXA
S HO
LDIN
GS, I
NC. A
ND S
UBSI
DIAR
IES
CONS
OLID
ATED
STA
TEM
ENTS
OF
CHAN
GES
IN E
QUIT
Y
YEAR
S EN
DED
SEPT
EMBE
R 30
, 201
8 AN
D 20
17
(WIT
H CO
MPA
RATI
VE F
IGUR
ES F
OR T
HE Y
EAR
ENDE
D SE
PTEM
BER
30, 2
016)
(A
mou
nts
in T
hous
ands
)
Equi
ty A
ttri
buta
ble
to t
he E
quity
Hol
ders
of t
he P
aren
t C
ompa
ny
N
ote
Cap
ital
Sto
ck
(Not
e 18
) A
ddit
iona
l P
aid-
in C
apit
al
Trea
sury
Sto
ck
(Not
e 18
)
Oth
er E
quit
y It
ems
and
Res
erve
s (N
ote
18)
Rev
alua
tion
Incr
emen
t on
Lan
d U
nder
Ass
ets
Hel
d fo
r Sa
le (N
ote
12)
Ret
aine
d
Earn
ings
To
tal
Non
-con
trol
ling
Inte
rest
s To
tal E
quit
y B
alan
ces
as a
t Se
ptem
ber
30, 2
017
P=
1,56
4,59
9 P=
2,82
6,55
4 (P=
52,2
90)
P=3,
419,
147
P=–
P=2,
733,
738
P=10
,491
,748
P=
52,3
60
P=10
,544
,108
N
et in
com
e:
C
ontin
uing
ope
ratio
ns
–
– –
– –
98,0
44
98,0
44
7,00
4 10
5,04
8
Dis
cont
inue
d op
erat
ions
12
–
– –
– –
(50,
380)
(5
0,38
0)
– (5
0,38
0)
Appr
aisa
l inc
reas
e on
land
, net
of t
ax
18
– –
– 10
,422
–
– 10
,422
36
0 10
,782
R
emea
sure
men
t gai
n on
ret
irem
ent a
sset
s an
d lia
bilit
ies,
net
of t
ax
17
– –
– 80
,120
–
– 80
,120
12
9 80
,249
Sh
are
in r
emea
sure
men
t gai
n on
ret
irem
ent l
iabi
lity
of a
n as
soci
ate,
net
of t
ax
11
– –
– 1,
501
– –
1,50
1 –
1,50
1 Sh
are
in a
ppra
isal
incr
ease
on
land
of a
n as
soci
ate,
net
of t
ax
11
– –
– 56
,813
–
– 56
,813
–
56,8
13
Tota
l com
preh
ensi
ve in
com
e
– –
– 14
8,85
6 –
47,6
64
196,
520
7,49
3 20
4,01
3 R
ecla
ssifi
catio
n of
rev
alua
tion
incr
emen
t on
land
und
er a
sset
s he
ld fo
r sa
le
–
– –
(2,3
90,4
19)
2,39
0,41
9 –
– –
– Em
ploy
ee s
tock
opt
ion
20
– 12
,356
–
– –
– 12
,356
–
12,3
56
Exer
cise
of e
mpl
oyee
sto
ck o
ptio
n 20
98
0 1,
460
– –
– –
2,44
0 –
2,44
0 B
alan
ces
as a
t Se
ptem
ber
30, 2
018
P=
1,56
5,57
9 P=
2,84
0,37
0 (P=
52,2
90)
P=1,
177,
585
P=
2,39
0,41
9 P=
2,78
1,40
2 P=
10,7
03,0
64
P=59
,853
P=
10,7
62,9
18
Bal
ance
s as
at
Sept
embe
r 30
, 201
6
P=1,4
39,4
42
P=2,4
25,5
50
(P=52
,290
) P=3
,281
,436
P=–
P=2
,613
,961
P=9
,708
,099
P=6
5,52
0 P=9
,773
,619
N
et in
com
e:
C
ontin
uing
ope
ratio
ns
–
– –
– –
(82,
067)
(8
2,06
7)
263
(81,
804)
Dis
cont
inue
d op
erat
ions
12
–
– –
– –
201,
844
201,
844
– 20
1,84
4 Ap
prai
sal i
ncre
ase
on la
nd, n
et o
f tax
18
–
– –
114,
842
– –
114,
842
1,71
9 11
6,56
1 R
emea
sure
men
t gai
n on
ret
irem
ent a
sset
s an
d lia
bilit
ies,
net
of t
ax
17
– –
– 22
,830
–
– 22
,830
46
22
,876
Sh
are
in r
emea
sure
men
t gai
n on
ret
irem
ent l
iabi
lity
of a
n as
soci
ate,
net
of t
ax
11
– –
– 39
–
– 39
–
39
Tota
l com
preh
ensi
ve in
com
e
– –
– 13
7,71
1 –
119,
777
257,
488
2,02
8 25
9,51
6 Is
suan
ces
of s
hare
s fr
om c
onve
rsio
n of
deb
t sec
uriti
es
18
125,
000
398,
750
– –
– –
523,
750
– 52
3,75
0 Ac
quis
ition
of n
on-c
ontr
ollin
g in
tere
st
–
– –
– –
– –
(15,
188)
(1
5,18
8)
Empl
oyee
sto
ck o
ptio
n 20
–
2,02
0 –
– –
– 2,
020
– 2,
020
Exer
cise
of e
mpl
oyee
sto
ck o
ptio
n 20
15
7 23
4 –
– –
– 39
1 –
391
Bal
ance
s as
at
Sept
embe
r 30
, 201
7
P=1,5
64,5
99
P=2,8
26,5
54
(P=52
,290
) P=3
,419
,147
P=–
P=2
,733
,738
P=1
0,49
1,74
8 P=5
2,36
0 P=1
0,54
4,10
8
Eq
uity
Att
ribu
tabl
e to
the
Equ
ity H
olde
rs o
f the
Par
ent
Com
pany
N
ote
Cap
ital
Sto
ck
(Not
e 18
) A
ddit
iona
l P
aid-
in C
apit
al
Trea
sury
Sto
ck
(Not
e 18
)
Oth
er E
quit
y It
ems
and
Res
erve
s (N
ote
18)
Rev
alua
tion
Incr
emen
t on
Lan
d U
nder
Ass
ets
Hel
d fo
r Sa
le (N
ote
12)
Ret
aine
d
Earn
ings
To
tal
Non
-con
trol
ling
Inte
rest
s To
tal E
quit
y
Bal
ance
s as
at
Sept
embe
r 30
, 201
5
P=1,1
69,2
89
P=1,5
73,9
93
(P=52
,290
) P=3
,145
,022
P=–
P=2
,515
,315
P=8
,351
,329
P=8
1,37
1 P=8
,432
,700
N
et in
com
e:
10
1,59
1
Con
tinui
ng o
pera
tions
– –
– –
– (2
36,4
46)
(236
,446
) 34
7 (2
36,0
99)
D
isco
ntin
ued
oper
atio
ns
–
– –
– –
337,
690
337,
690
– 33
7,69
0 Ap
prai
sal i
ncre
ase
on la
nd, n
et o
f tax
18
–
– –
181,
462
– –
181,
462
– 18
1,46
2 R
emea
sure
men
t gai
n (lo
ss) o
n re
tirem
ent a
sset
s an
d lia
bilit
ies,
net
of t
ax
17
– –
– (4
2,01
8)
– –
(42,
018)
20
4 (4
1,81
4)
Shar
e in
rem
easu
rem
ent l
oss
on r
etir
emen
t lia
bilit
y of
an
asso
ciat
e, n
et o
f tax
11
–
– –
(3,0
30)
– –
(3,0
30)
– (3
,030
) To
tal c
ompr
ehen
sive
inco
me
–
– –
136,
414
– 10
1,24
4 23
7,65
8 55
1 23
8,20
9 Is
suan
ces
of s
hare
s fr
om s
tock
rig
hts
offe
ring
, net
of t
rans
actio
n co
sts
18
266,
754
846,
544
– –
– –
1,11
3,29
8 –
1,11
3,29
8 Ac
quis
ition
of n
on-c
ontr
ollin
g in
tere
st
4
–
– –
– –
(2,5
98)
(2,5
98)
(16,
402)
(1
9,00
0)
Exer
cise
of e
mpl
oyee
sto
ck o
ptio
n 20
3,
399
3,57
3 –
– –
– 6,
972
– 6,
972
Empl
oyee
sto
ck o
ptio
n 20
–
1,44
0 –
– –
– 1,
440
– 1,
440
Bal
ance
s as
at
Sept
embe
r 30
, 201
6
P=1,4
39,4
42
P=2,4
25,5
50
(P=52
,290
) P=3
,281
,436
P=–
P=2
,613
,961
P=9
,708
,099
P=6
5,52
0 P=9
,773
,619
See
acco
mpa
nyin
g N
otes
to C
onso
lidat
ed F
inan
cial
Sta
tem
ents
.
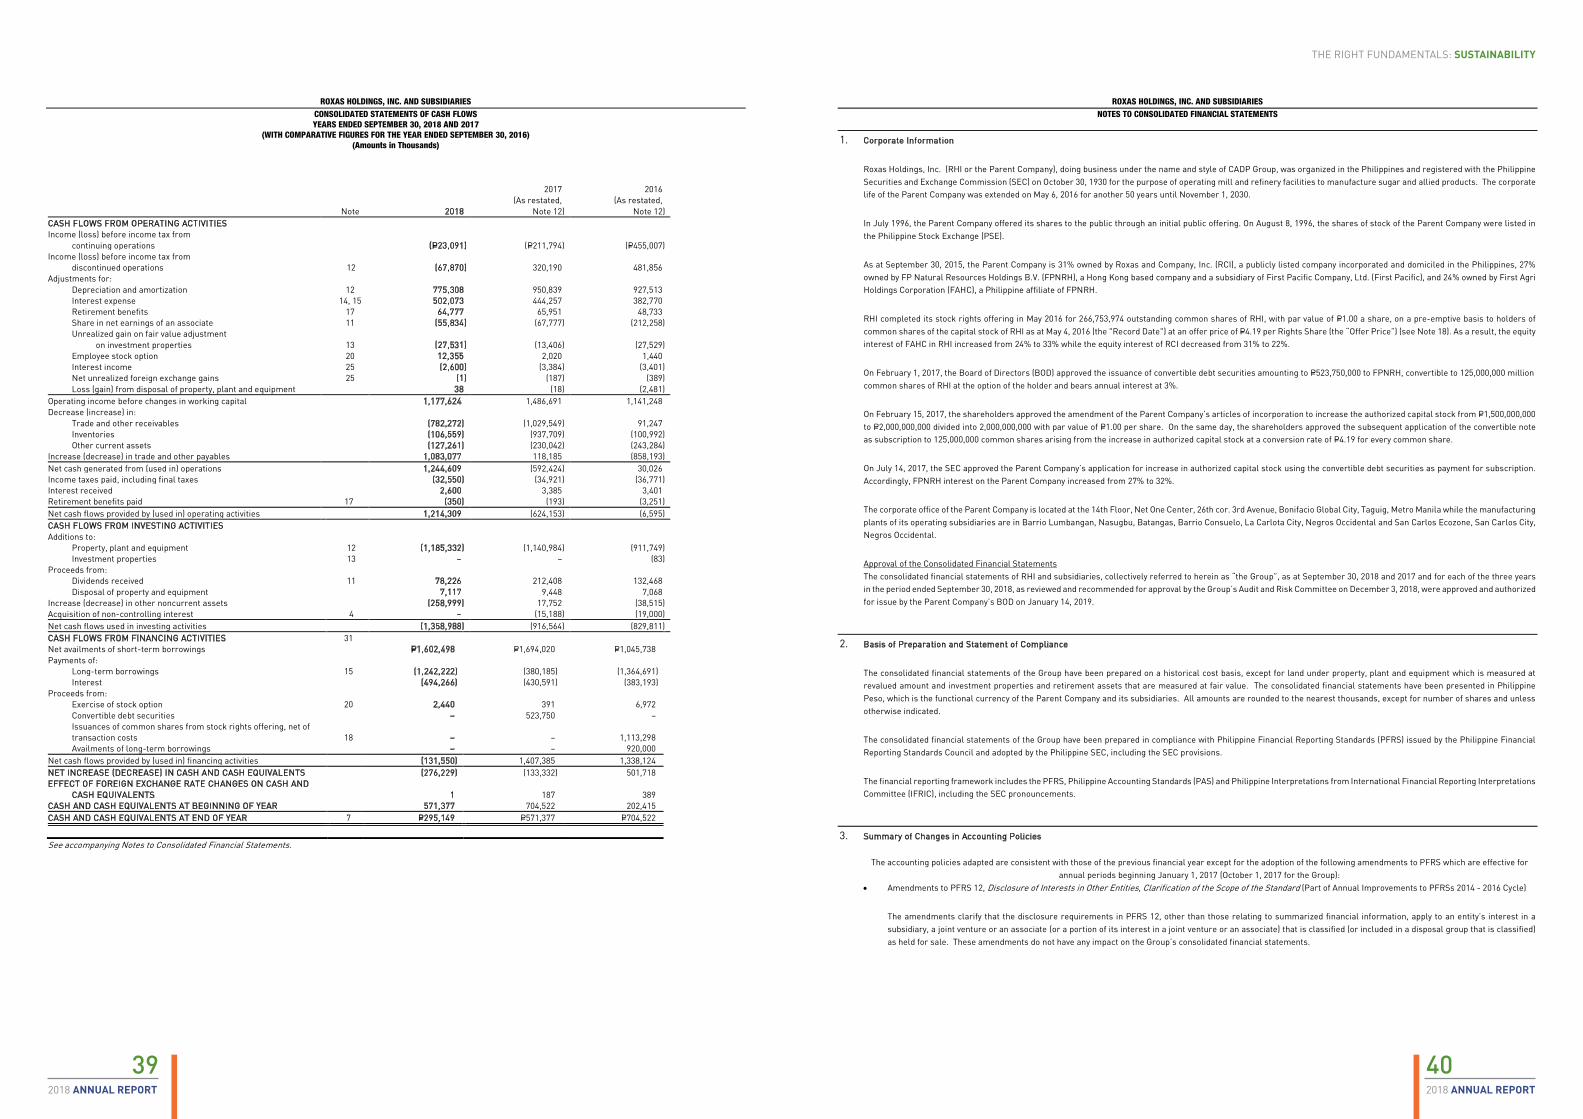
40392018 ANNUAL REPORT2018 ANNUAL REPORT
THE RIGHT FUNDAMENTALS: SUSTAINABILITY
ROXAS HOLDINGS, INC. AND SUBSIDIARIES CONSOLIDATED STATEMENTS OF CASH FLOWS YEARS ENDED SEPTEMBER 30, 2018 AND 2017
(WITH COMPARATIVE FIGURES FOR THE YEAR ENDED SEPTEMBER 30, 2016) (Amounts in Thousands)
Note 2018
2017 (As restated,
Note 12)
2016 (As restated,
Note 12) CASH FLOWS FROM OPERATING ACTIVITIES Income (loss) before income tax from continuing operations (P=23,091) (P=211,794) (P=455,007) Income (loss) before income tax from discontinued operations 12 (67,870) 320,190 481,856 Adjustments for: Depreciation and amortization 12 775,308 950,839 927,513 Interest expense 14, 15 502,073 444,257 382,770 Retirement benefits 17 64,777 65,951 48,733 Share in net earnings of an associate 11 (55,834) (67,777) (212,258)
Unrealized gain on fair value adjustment on investment properties 13 (27,531) (13,406) (27,529) Employee stock option 20 12,355 2,020 1,440 Interest income 25 (2,600) (3,384) (3,401) Net unrealized foreign exchange gains 25 (1) (187) (389) Loss (gain) from disposal of property, plant and equipment 38 (18) (2,481) Operating income before changes in working capital 1,177,624 1,486,691 1,141,248 Decrease (increase) in: Trade and other receivables (782,272) (1,029,549) 91,247 Inventories (106,559) (937,709) (100,992) Other current assets (127,261) (230,042) (243,284) Increase (decrease) in trade and other payables 1,083,077 118,185 (858,193) Net cash generated from (used in) operations 1,244,609 (592,424) 30,026 Income taxes paid, including final taxes (32,550) (34,921) (36,771) Interest received 2,600 3,385 3,401 Retirement benefits paid 17 (350) (193) (3,251) Net cash flows provided by (used in) operating activities 1,214,309 (624,153) (6,595) CASH FLOWS FROM INVESTING ACTIVITIES Additions to: Property, plant and equipment 12 (1,185,332) (1,140,984) (911,749) Investment properties 13 − − (83) Proceeds from: Dividends received 11 78,226 212,408 132,468 Disposal of property and equipment 7,117 9,448 7,068 Increase (decrease) in other noncurrent assets (258,999) 17,752 (38,515) Acquisition of non-controlling interest 4 − (15,188) (19,000) Net cash flows used in investing activities (1,358,988) (916,564) (829,811) CASH FLOWS FROM FINANCING ACTIVITIES 31 Net availments of short-term borrowings P=1,602,498 P=1,694,020 P=1,045,738 Payments of: Long-term borrowings 15 (1,242,222) (380,185) (1,364,691) Interest (494,266) (430,591) (383,193) Proceeds from: Exercise of stock option 20 2,440 391 6,972 Convertible debt securities – 523,750 – Issuances of common shares from stock rights offering, net of
transaction costs 18 – − 1,113,298 Availments of long-term borrowings – – 920,000 Net cash flows provided by (used in) financing activities (131,550) 1,407,385 1,338,124 NET INCREASE (DECREASE) IN CASH AND CASH EQUIVALENTS (276,229) (133,332) 501,718 EFFECT OF FOREIGN EXCHANGE RATE CHANGES ON CASH AND
CASH EQUIVALENTS 1 187 389 CASH AND CASH EQUIVALENTS AT BEGINNING OF YEAR 571,377 704,522 202,415 CASH AND CASH EQUIVALENTS AT END OF YEAR 7 P=295,149 P=571,377 P=704,522
See accompanying Notes to Consolidated Financial Statements.
ROXAS HOLDINGS, INC. AND SUBSIDIARIES NOTES TO CONSOLIDATED FINANCIAL STATEMENTS
1. Corporate Information
Roxas Holdings, Inc. (RHI or the Parent Company), doing business under the name and style of CADP Group, was organized in the Philippines and registered with the Philippine Securities and Exchange Commission (SEC) on October 30, 1930 for the purpose of operating mill and refinery facilities to manufacture sugar and allied products. The corporate life of the Parent Company was extended on May 6, 2016 for another 50 years until November 1, 2030.
In July 1996, the Parent Company offered its shares to the public through an initial public offering. On August 8, 1996, the shares of stock of the Parent Company were listed in the Philippine Stock Exchange (PSE).
As at September 30, 2015, the Parent Company is 31% owned by Roxas and Company, Inc. (RCI), a publicly listed company incorporated and domiciled in the Philippines, 27% owned by FP Natural Resources Holdings B.V. (FPNRH), a Hong Kong based company and a subsidiary of First Pacific Company, Ltd. (First Pacific), and 24% owned by First Agri Holdings Corporation (FAHC), a Philippine affiliate of FPNRH.
RHI completed its stock rights offering in May 2016 for 266,753,974 outstanding common shares of RHI, with par value of P=1.00 a share, on a pre-emptive basis to holders of common shares of the capital stock of RHI as at May 4, 2016 (the "Record Date") at an offer price of P=4.19 per Rights Share (the “Offer Price”) (see Note 18). As a result, the equity interest of FAHC in RHI increased from 24% to 33% while the equity interest of RCI decreased from 31% to 22%.
On February 1, 2017, the Board of Directors (BOD) approved the issuance of convertible debt securities amounting to P=523,750,000 to FPNRH, convertible to 125,000,000 million common shares of RHI at the option of the holder and bears annual interest at 3%.
On February 15, 2017, the shareholders approved the amendment of the Parent Company’s articles of incorporation to increase the authorized capital stock from P=1,500,000,000 to P=2,000,000,000 divided into 2,000,000,000 with par value of P=1.00 per share. On the same day, the shareholders approved the subsequent application of the convertible note as subscription to 125,000,000 common shares arising from the increase in authorized capital stock at a conversion rate of P=4.19 for every common share.
On July 14, 2017, the SEC approved the Parent Company’s application for increase in authorized capital stock using the convertible debt securities as payment for subscription. Accordingly, FPNRH interest on the Parent Company increased from 27% to 32%.
The corporate office of the Parent Company is located at the 14th Floor, Net One Center, 26th cor. 3rd Avenue, Bonifacio Global City, Taguig, Metro Manila while the manufacturing plants of its operating subsidiaries are in Barrio Lumbangan, Nasugbu, Batangas, Barrio Consuelo, La Carlota City, Negros Occidental and San Carlos Ecozone, San Carlos City, Negros Occidental.
Approval of the Consolidated Financial Statements The consolidated financial statements of RHI and subsidiaries, collectively referred to herein as “the Group”, as at September 30, 2018 and 2017 and for each of the three years in the period ended September 30, 2018, as reviewed and recommended for approval by the Group’s Audit and Risk Committee on December 3, 2018, were approved and authorized for issue by the Parent Company’s BOD on January 14, 2019.
2. Basis of Preparation and Statement of Compliance
The consolidated financial statements of the Group have been prepared on a historical cost basis, except for land under property, plant and equipment which is measured at revalued amount and investment properties and retirement assets that are measured at fair value. The consolidated financial statements have been presented in Philippine Peso, which is the functional currency of the Parent Company and its subsidiaries. All amounts are rounded to the nearest thousands, except for number of shares and unless otherwise indicated.
The consolidated financial statements of the Group have been prepared in compliance with Philippine Financial Reporting Standards (PFRS) issued by the Philippine Financial Reporting Standards Council and adopted by the Philippine SEC, including the SEC provisions.
The financial reporting framework includes the PFRS, Philippine Accounting Standards (PAS) and Philippine Interpretations from International Financial Reporting Interpretations Committee (IFRIC), including the SEC pronouncements.
3. Summary of Changes in Accounting Policies
The accounting policies adapted are consistent with those of the previous financial year except for the adoption of the following amendments to PFRS which are effective for annual periods beginning January 1, 2017 (October 1, 2017 for the Group):
• Amendments to PFRS 12, Disclosure of Interests in Other Entities, Clarification of the Scope of the Standard (Part of Annual Improvements to PFRSs 2014 - 2016 Cycle)
The amendments clarify that the disclosure requirements in PFRS 12, other than those relating to summarized financial information, apply to an entity’s interest in a subsidiary, a joint venture or an associate (or a portion of its interest in a joint venture or an associate) that is classified (or included in a disposal group that is classified) as held for sale. These amendments do not have any impact on the Group’s consolidated financial statements.
42412018 ANNUAL REPORT2018 ANNUAL REPORT
THE RIGHT FUNDAMENTALS: SUSTAINABILITY
• Amendments to Philippine Accounting Standards (PAS) 7, Statement of Cash Flows - Disclosure Initiative
The amendments require entities to provide disclosure of changes in their liabilities arising from financing activities, including both changes arising from cash flows and non-cash changes (such as foreign exchange gains or losses). The changes in the Group’s liabilities arising from its financing activities are presented in Note 31 of the consolidated financial statements.
As allowed under the transition provisions, the Group did not present comparative information for the years ended September 30, 2017 and 2016.
• Amendments to PAS 12, Income Taxes, Recognition of Deferred Tax Assets for Unrealized Losses
The amendments clarify that an entity needs to consider whether tax law restricts the sources of taxable profits against which it may make deductions upon the reversal of the deductible temporary difference related to unrealized losses. Furthermore, the amendments provide guidance on how an entity should determine future taxable profits and explain the circumstances in which taxable profit may include the recovery of some assets for more than their carrying amount.
These amendments did not have any impact on the Group’s consolidated financial statements.
New Accounting Standards, Interpretations and Amendments to Existing Standards Effective Subsequent to September 30, 2018
The standards, interpretations, amendments and improvements to the standards that are issued, but not yet effective, up to date of issuance of the financial statements are disclosed below. The Group intends to adopt these, if applicable, when these become effective. Unless otherwise specified, these will not have an impact on the Group’s consolidated financial statements.
Effective for Fiscal Year 2019
• PFRS 15, Revenue from Contracts with Customers, establishes a new five-step model that will apply to revenue arising from contracts with customers. Under PFRS 15, revenue is recognized at an amount that reflects the consideration to which an entity expects to be entitled in exchange for transferring goods or services to a customer. The principles in PFRS 15 provide a more structured approach to measuring and recognizing revenue. The new revenue standard is applicable to all entities and will supersede all current revenue recognition requirements under PFRSs. Entities can choose to apply the standard using either a full retrospective approach, with some limited relief provided, or a modified retrospective approach. The Group is currently evaluating the impact of adopting PFRS 15 on the Group’s milling and tolling agreements, among other revenue arrangements.
• PFRS 9, Financial Instruments, reflects all phases of the financial instruments project and replaces PAS 39 and all previous versions of PFRS 9. The standard introduces new requirements for classification and measurement, impairment, and hedge accounting. Retrospective application is required, but providing comparative information is not compulsory. The adoption of PFRS 9 will have an effect on the classification and measurement of the Group’s financial assets and impairment methodology for financial assets, but will have no impact on the classification and measurement of the Group’s financial liabilities. The Group does not expect that PFRS 9 will impact the classification of its financial instruments. However, the Group anticipates impact on the adoption of the expected credit loss.
• Amendments to PAS 40, Investment Property, Transfers of Investment Property, clarifies when an entity should transfer property, including property under construction or development into, or out of investment property. The amendments state that a change in use occurs when the property meets, or ceases to meet, the definition of investment property and there is evidence of the change in use. A mere change in management’s intentions for the use of a property does not provide evidence of a change in use. The amendments should be applied prospectively to changes in use that occur on or after the beginning of the annual reporting period in which the entity first applies the amendments. Retrospective application is only permitted if this is possible without the use of hindsight. The Group is currently assessing the impact of adopting these amendments.
• Amendments to PFRS 2, Share-based Payment - Classification and Measurement of Share-based Payment Transactions, address three main areas: the effects of vesting conditions on the measurement of a cash-settled share-based payment transaction; the classification of a share-based payment transaction with net settlement features for withholding tax obligations; and the accounting where a modification to the terms and conditions of a share-based payment transaction changes its classification from cash settled to equity settled.
On adoption, entities are required to apply the amendments without restating prior periods, but retrospective application is permitted if elected for all three amendments and if other criteria are met. Early application of the amendments is permitted.
The Group is currently assessing the impact of adopting these amendments.
• Amendments to PFRS 4, Insurance Contracts - Applying PFRS 9, Financial Instruments, with PFRS 4, address concerns arising from implementing PFRS 9, the new financial instruments standard before implementing the new insurance contracts standard. The amendments introduce two options for entities issuing insurance contracts: a temporary exemption from applying PFRS 9 and an overlay approach. The temporary exemption is first applied for reporting periods beginning on or after January 1, 2018. An entity may elect the overlay approach when it first applies PFRS 9 and apply that approach retrospectively to financial assets designated on transition to PFRS 9. The entity restates comparative information reflecting the overlay approach if, and only if, the entity restates comparative information when applying PFRS 9.
The amendments are not applicable to the Group since the Group does not have any activities related to insurance contracts.
• Amendments to PAS 28 - Measuring an Associate or Joint Venture at Fair Value
The amendments clarify that an entity that is a venture capital organization, or other qualifying entity, may elect, at initial recognition on an investment-by-investment basis, to measure its investments in associates and joint ventures at FVPL. They also clarify that if an entity that is not itself an investment entity has an interest in an associate or joint venture that is an investment entity, the entity may, when applying the equity method, elect to retain the fair value measurement applied by that investment entity associate or joint venture to the investment entity associate’s or joint venture’s interests in subsidiaries. This election is made separately for each investment entity associate or joint venture, at the later of the date on which (a) the investment entity associate or joint venture is initially recognized; (b) the associate or joint venture
becomes an investment entity; and (c) the investment entity associate or joint venture first becomes a parent. The amendments should be applied retrospectively, with earlier application permitted. The Group is currently assessing the impact of adopting these amendments.
• Philippine Interpretation based on International Financial Reporting Interpretations Committee (IFRIC) 22, Foreign Currency Transactions and Advance Consideration,
clarifies that in determining the spot exchange rate to use on initial recognition of the related asset, expense or income (or part of it) on the derecognition of a nonmonetary asset or nonmonetary liability arising from advance consideration, the date of the transaction is the date on which an entity initially recognizes the nonmonetary asset or nonmonetary liability arising from the advance consideration. If there are multiple payments or receipts in advance, then the entity must determine a date of the transactions for each payment or receipt of advance consideration. The interpretation may be applied on a fully retrospective basis. Entities may apply the interpretation prospectively to all assets, expenses and income in its scope that are initially recognized on or after the beginning of the reporting period in which the entity first applies the interpretation or the beginning of a prior reporting period presented as comparative information in the financial statements of the reporting period in which the entity first applies the interpretation. The Group is currently assessing the impact of adopting this Interpretation.
Effective for Fiscal Year 2020 • Amendments to PFRS 9, Prepayment Features with Negative Compensation
The amendments to PFRS 9 allow debt instruments with negative compensation prepayment features to be measured at amortized cost or fair value through other comprehensive income. Earlier application is permitted. The Group is currently assessing the impact of adopting these amendments.
• PFRS 16, Leases, sets out the principles for the recognition, measurement, presentation and disclosure of leases and requires lessees to account for all leases under a single on-statement of financial position model similar to the accounting for finance leases under PAS 17, Leases. The standard includes two recognition exemptions for lessees - leases of ’low-value’ assets (e.g., personal computers) and short-term leases (i.e., leases with a lease term of 12 months or less). At the commencement date of a lease, a lessee will recognize a liability to make lease payments (i.e., the lease liability) and an asset representing the right to use the underlying asset during the lease term (i.e., the right-of-use asset).
Lessees will be required to separately recognize the interest expense on the lease liability and the depreciation expense on the right-of-use asset. Lessees will be also required to remeasure the lease liability upon the occurrence of certain events (e.g., a change in the lease term, a change in future lease payments resulting from a change in an index or rate used to determine those payments). The lessee will generally recognize the amount of the remeasurement of the lease liability as an adjustment to the right-of-use asset.
Lessor accounting under PFRS 16 is substantially unchanged from today’s accounting under PAS 17. Lessors will continue to classify all leases using the same classification principle as in PAS 17 and distinguish between two types of leases: operating and finance leases.
PFRS 16 also requires lessees and lessors to make more extensive disclosures than under PAS 17. Early application is permitted, but not before an entity applies PFRS 15. A lessee can choose to apply the standard using either a full retrospective or a modified retrospective approach. The standard’s transition provisions permit certain reliefs.
The Group is currently assessing the impact of adopting the new standard on its office spaces lease agreements.
• Amendments to PAS 28, Long-term Interests in Associates and Joint Ventures, clarify that entities should account for long-term interests in an associate or joint venture to which the equity method is not applied using PFRS 9. Earlier application is permitted. The Group is currently assessing the impact of adopting these amendments.
• Philippine Interpretation IFRIC 23, Uncertainty over Income Tax Treatments
The interpretation addresses the accounting for income taxes when tax treatments involve uncertainty that affects the application of PAS 12, Income Taxes, and does not apply to taxes or levies outside the scope of PAS 12, nor does it specifically include requirements relating to interest and penalties associated with uncertain tax treatments.
The interpretation specifically addresses the following:
• Whether an entity considers uncertain tax treatments separately • The assumptions an entity makes about the examination of tax treatments by taxation authorities • How an entity determines taxable profit (tax loss), tax bases, unused tax losses, unused tax credits and tax rates • How an entity considers changes in facts and circumstances
An entity must determine whether to consider each uncertain tax treatment separately or together with one or more other uncertain tax treatments. The approach that better predicts the resolution of the uncertainty should be followed. The Group is currently assessing the impact of adopting this Interpretation.
Effective for Fiscal Year 2021
• PFRS 17, Insurance Contracts, establishes the principles for the recognition, measurement, presentation and disclosure of Insurance contracts within the scope of the Standard. The objective of is to ensure that an entity provides relevant information that faithfully represents those contracts. This information gives a basis for users of financial statements to assess the effect that insurance contracts have on the entity's financial position, financial performance and cash flows.
Some contracts meet the definition of an insurance contract but have as their primary purpose the provision of services for a fixed fee. Such issued contracts are in the scope of the standard, unless an entity chooses to apply to them PFRS 15 and provided the following conditions are met:
(a) the entity does not reflect an assessment of the risk associated with an individual customer in setting the price of the contract with that customer;
(b) the contract compensates the customer by providing a service, rather than by making cash payments to the customer; and (c) the insurance risk transferred by the contract arises primarily from the customer’s use of services rather than from uncertainty over the cost of those services
PFRS 17 is not applicable to the Group since the Group does not have any insurance contracts.
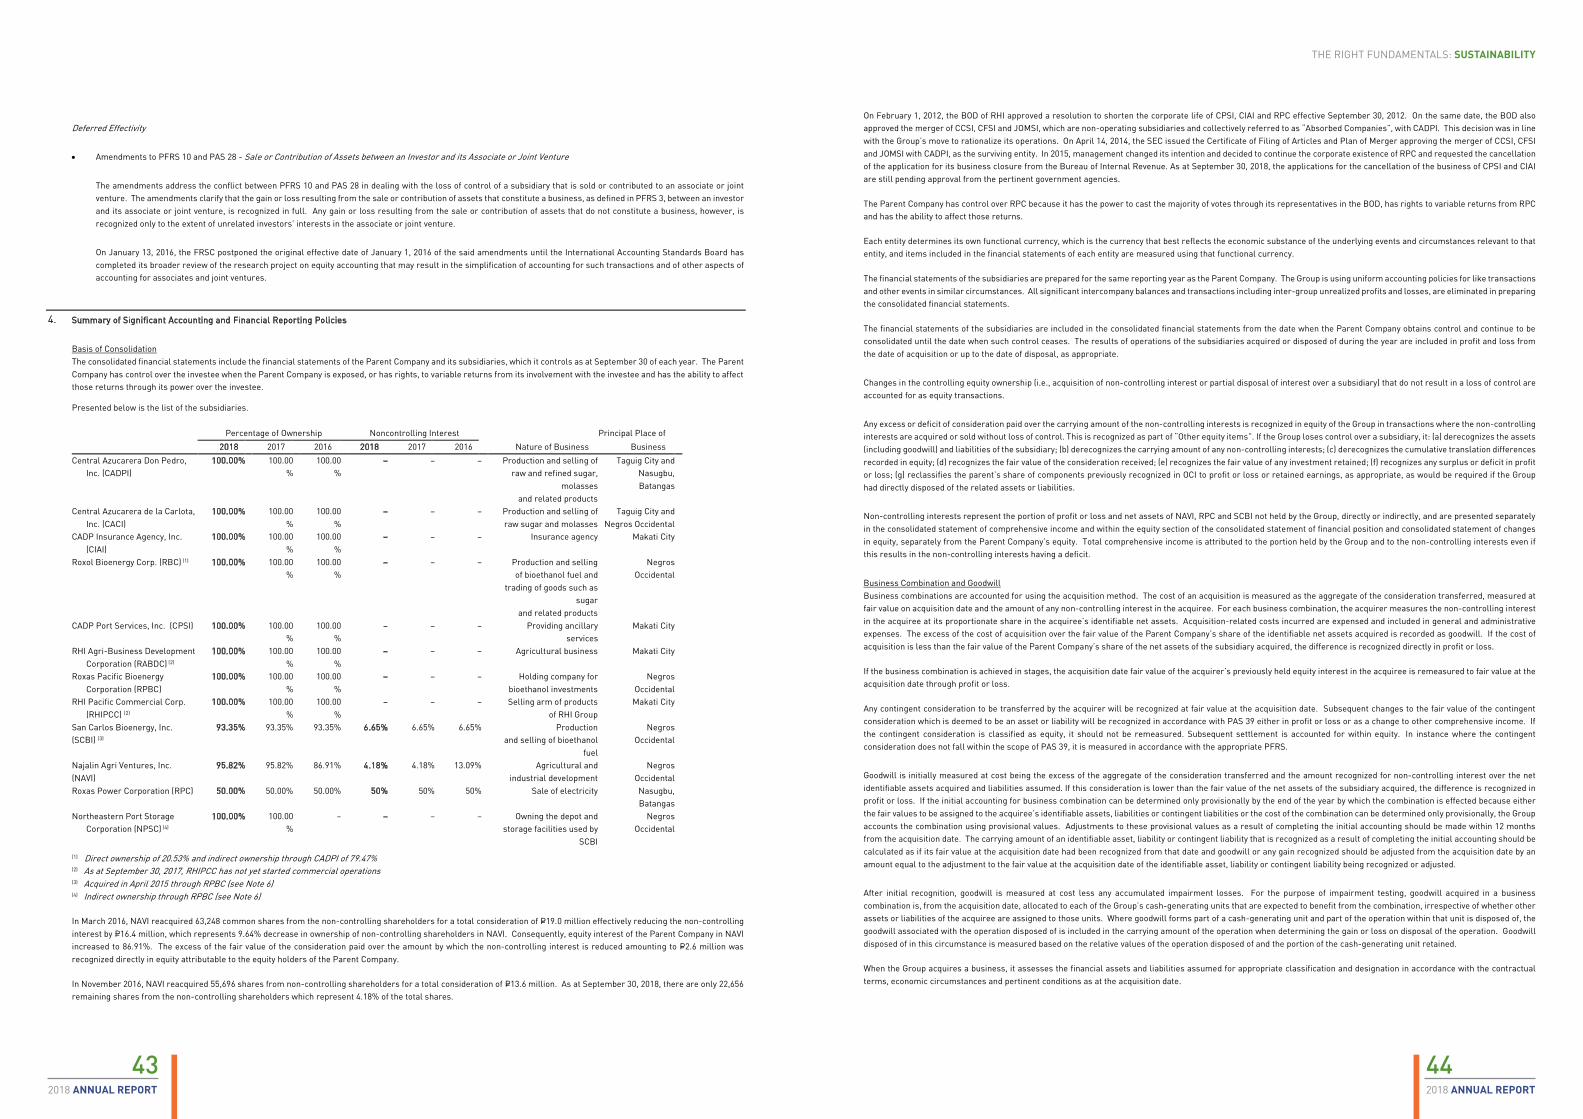
44432018 ANNUAL REPORT2018 ANNUAL REPORT
THE RIGHT FUNDAMENTALS: SUSTAINABILITY
Deferred Effectivity
• Amendments to PFRS 10 and PAS 28 - Sale or Contribution of Assets between an Investor and its Associate or Joint Venture
The amendments address the conflict between PFRS 10 and PAS 28 in dealing with the loss of control of a subsidiary that is sold or contributed to an associate or joint venture. The amendments clarify that the gain or loss resulting from the sale or contribution of assets that constitute a business, as defined in PFRS 3, between an investor and its associate or joint venture, is recognized in full. Any gain or loss resulting from the sale or contribution of assets that do not constitute a business, however, is recognized only to the extent of unrelated investors’ interests in the associate or joint venture.
On January 13, 2016, the FRSC postponed the original effective date of January 1, 2016 of the said amendments until the International Accounting Standards Board has completed its broader review of the research project on equity accounting that may result in the simplification of accounting for such transactions and of other aspects of accounting for associates and joint ventures.
4. Summary of Significant Accounting and Financial Reporting Policies
Basis of Consolidation The consolidated financial statements include the financial statements of the Parent Company and its subsidiaries, which it controls as at September 30 of each year. The Parent Company has control over the investee when the Parent Company is exposed, or has rights, to variable returns from its involvement with the investee and has the ability to affect those returns through its power over the investee.
Presented below is the list of the subsidiaries.
Percentage of Ownership Noncontrolling Interest Principal Place of 2018 2017 2016 2018 2017 2016 Nature of Business Business Central Azucarera Don Pedro,
Inc. (CADPI) 100.00% 100.00
% 100.00
% – – – Production and selling of
raw and refined sugar, molasses
and related products
Taguig City and Nasugbu, Batangas
Central Azucarera de la Carlota, Inc. (CACI)
100.00% 100.00%
100.00%
– – – Production and selling of raw sugar and molasses
Taguig City and Negros Occidental
CADP Insurance Agency, Inc. (CIAI)
100.00% 100.00%
100.00%
– – – Insurance agency Makati City
Roxol Bioenergy Corp. (RBC) (1) 100.00% 100.00%
100.00%
– – – Production and selling of bioethanol fuel and
trading of goods such as sugar
and related products
Negros Occidental
CADP Port Services, Inc. (CPSI) 100.00% 100.00%
100.00%
– – – Providing ancillary services
Makati City
RHI Agri-Business Development Corporation (RABDC) (2)
100.00% 100.00%
100.00%
– – – Agricultural business Makati City
Roxas Pacific Bioenergy Corporation (RPBC)
100.00% 100.00%
100.00%
– – – Holding company for bioethanol investments
Negros Occidental
RHI Pacific Commercial Corp. (RHIPCC) (2)
100.00% 100.00%
100.00%
– – – Selling arm of products of RHI Group
Makati City
San Carlos Bioenergy, Inc. (SCBI) (3)
93.35% 93.35% 93.35% 6.65% 6.65% 6.65% Production and selling of bioethanol
fuel
Negros Occidental
Najalin Agri Ventures, Inc. (NAVI)
95.82% 95.82% 86.91% 4.18% 4.18% 13.09% Agricultural and industrial development
Negros Occidental
Roxas Power Corporation (RPC) 50.00% 50.00% 50.00% 50% 50% 50% Sale of electricity Nasugbu, Batangas
Northeastern Port Storage Corporation (NPSC) (4)
100.00% 100.00%
– – – – Owning the depot and storage facilities used by
SCBI
Negros Occidental
(1) Direct ownership of 20.53% and indirect ownership through CADPI of 79.47% (2) As at September 30, 2017, RHIPCC has not yet started commercial operations (3) Acquired in April 2015 through RPBC (see Note 6) (4) Indirect ownership through RPBC (see Note 6)
In March 2016, NAVI reacquired 63,248 common shares from the non-controlling shareholders for a total consideration of P=19.0 million effectively reducing the non-controlling interest by P=16.4 million, which represents 9.64% decrease in ownership of non-controlling shareholders in NAVI. Consequently, equity interest of the Parent Company in NAVI increased to 86.91%. The excess of the fair value of the consideration paid over the amount by which the non-controlling interest is reduced amounting to P=2.6 million was recognized directly in equity attributable to the equity holders of the Parent Company.
In November 2016, NAVI reacquired 55,696 shares from non-controlling shareholders for a total consideration of P=13.6 million. As at September 30, 2018, there are only 22,656 remaining shares from the non-controlling shareholders which represent 4.18% of the total shares.
On February 1, 2012, the BOD of RHI approved a resolution to shorten the corporate life of CPSI, CIAI and RPC effective September 30, 2012. On the same date, the BOD also approved the merger of CCSI, CFSI and JOMSI, which are non-operating subsidiaries and collectively referred to as “Absorbed Companies”, with CADPI. This decision was in line with the Group’s move to rationalize its operations. On April 14, 2014, the SEC issued the Certificate of Filing of Articles and Plan of Merger approving the merger of CCSI, CFSI and JOMSI with CADPI, as the surviving entity. In 2015, management changed its intention and decided to continue the corporate existence of RPC and requested the cancellation of the application for its business closure from the Bureau of Internal Revenue. As at September 30, 2018, the applications for the cancellation of the business of CPSI and CIAI are still pending approval from the pertinent government agencies.
The Parent Company has control over RPC because it has the power to cast the majority of votes through its representatives in the BOD, has rights to variable returns from RPC and has the ability to affect those returns.
Each entity determines its own functional currency, which is the currency that best reflects the economic substance of the underlying events and circumstances relevant to that entity, and items included in the financial statements of each entity are measured using that functional currency.
The financial statements of the subsidiaries are prepared for the same reporting year as the Parent Company. The Group is using uniform accounting policies for like transactions and other events in similar circumstances. All significant intercompany balances and transactions including inter-group unrealized profits and losses, are eliminated in preparing the consolidated financial statements.
The financial statements of the subsidiaries are included in the consolidated financial statements from the date when the Parent Company obtains control and continue to be consolidated until the date when such control ceases. The results of operations of the subsidiaries acquired or disposed of during the year are included in profit and loss from the date of acquisition or up to the date of disposal, as appropriate.
Changes in the controlling equity ownership (i.e., acquisition of non-controlling interest or partial disposal of interest over a subsidiary) that do not result in a loss of control are accounted for as equity transactions.
Any excess or deficit of consideration paid over the carrying amount of the non-controlling interests is recognized in equity of the Group in transactions where the non-controlling interests are acquired or sold without loss of control. This is recognized as part of “Other equity items”. If the Group loses control over a subsidiary, it: (a) derecognizes the assets (including goodwill) and liabilities of the subsidiary; (b) derecognizes the carrying amount of any non-controlling interests; (c) derecognizes the cumulative translation differences recorded in equity; (d) recognizes the fair value of the consideration received; (e) recognizes the fair value of any investment retained; (f) recognizes any surplus or deficit in profit or loss; (g) reclassifies the parent’s share of components previously recognized in OCI to profit or loss or retained earnings, as appropriate, as would be required if the Group had directly disposed of the related assets or liabilities.
Non-controlling interests represent the portion of profit or loss and net assets of NAVI, RPC and SCBI not held by the Group, directly or indirectly, and are presented separately in the consolidated statement of comprehensive income and within the equity section of the consolidated statement of financial position and consolidated statement of changes in equity, separately from the Parent Company’s equity. Total comprehensive income is attributed to the portion held by the Group and to the non-controlling interests even if this results in the non-controlling interests having a deficit.
Business Combination and Goodwill Business combinations are accounted for using the acquisition method. The cost of an acquisition is measured as the aggregate of the consideration transferred, measured at fair value on acquisition date and the amount of any non-controlling interest in the acquiree. For each business combination, the acquirer measures the non-controlling interest in the acquiree at its proportionate share in the acquiree’s identifiable net assets. Acquisition-related costs incurred are expensed and included in general and administrative expenses. The excess of the cost of acquisition over the fair value of the Parent Company’s share of the identifiable net assets acquired is recorded as goodwill. If the cost of acquisition is less than the fair value of the Parent Company’s share of the net assets of the subsidiary acquired, the difference is recognized directly in profit or loss.
If the business combination is achieved in stages, the acquisition date fair value of the acquirer’s previously held equity interest in the acquiree is remeasured to fair value at the acquisition date through profit or loss.
Any contingent consideration to be transferred by the acquirer will be recognized at fair value at the acquisition date. Subsequent changes to the fair value of the contingent consideration which is deemed to be an asset or liability will be recognized in accordance with PAS 39 either in profit or loss or as a change to other comprehensive income. If the contingent consideration is classified as equity, it should not be remeasured. Subsequent settlement is accounted for within equity. In instance where the contingent consideration does not fall within the scope of PAS 39, it is measured in accordance with the appropriate PFRS.
Goodwill is initially measured at cost being the excess of the aggregate of the consideration transferred and the amount recognized for non-controlling interest over the net identifiable assets acquired and liabilities assumed. If this consideration is lower than the fair value of the net assets of the subsidiary acquired, the difference is recognized in profit or loss. If the initial accounting for business combination can be determined only provisionally by the end of the year by which the combination is effected because either the fair values to be assigned to the acquiree’s identifiable assets, liabilities or contingent liabilities or the cost of the combination can be determined only provisionally, the Group accounts the combination using provisional values. Adjustments to these provisional values as a result of completing the initial accounting should be made within 12 months from the acquisition date. The carrying amount of an identifiable asset, liability or contingent liability that is recognized as a result of completing the initial accounting should be calculated as if its fair value at the acquisition date had been recognized from that date and goodwill or any gain recognized should be adjusted from the acquisition date by an amount equal to the adjustment to the fair value at the acquisition date of the identifiable asset, liability or contingent liability being recognized or adjusted.
After initial recognition, goodwill is measured at cost less any accumulated impairment losses. For the purpose of impairment testing, goodwill acquired in a business combination is, from the acquisition date, allocated to each of the Group’s cash-generating units that are expected to benefit from the combination, irrespective of whether other assets or liabilities of the acquiree are assigned to those units. Where goodwill forms part of a cash-generating unit and part of the operation within that unit is disposed of, the goodwill associated with the operation disposed of is included in the carrying amount of the operation when determining the gain or loss on disposal of the operation. Goodwill disposed of in this circumstance is measured based on the relative values of the operation disposed of and the portion of the cash-generating unit retained.
When the Group acquires a business, it assesses the financial assets and liabilities assumed for appropriate classification and designation in accordance with the contractual terms, economic circumstances and pertinent conditions as at the acquisition date.
46452018 ANNUAL REPORT2018 ANNUAL REPORT
THE RIGHT FUNDAMENTALS: SUSTAINABILITY
Common Control Transactions. Where there are business combinations in which all the combining entities within the Group are ultimately controlled by the same ultimate parent before and after the business combination and that the control is not transitory (“business combinations under common control”), the Group accounts such business combinations under the acquisition method of accounting, if the transaction was deemed to have substance from the perspective of the reporting entity. In determining whether the business combination has substance, factors such as the underlying purpose of the business combination and the involvement of parties other than the combining entities such as the non-controlling interest, are being considered.
In cases where the business combination has no substance, the Parent Company accounts for the transaction similar to a pooling of interests. The assets and liabilities of the acquired entities and that of the Group are reflected at their carrying amounts. The difference in the amount recognized and the fair value of the consideration given, is accounted for as an equity transaction (i.e., as either a contribution or distribution of equity). Further, when a subsidiary is transferred in a common control transaction, the difference in the amount recognized and the fair value of consideration received, is also accounted for as an equity transaction.
Cash and Cash Equivalents Cash includes cash on hand and in banks that earn interest at the respective bank deposit rates. Cash equivalents are short-term, highly liquid investments that are readily convertible to known amounts of cash with original maturities of three months or less from the date of acquisition and are subject to an insignificant risk of changes in value.
Financial Instruments Date of Recognition. The Group recognizes a financial asset or a financial liability in the consolidated statement of financial position when the Group becomes a party to the contractual provisions of the instrument. All regular way purchases and sales of financial assets are recognized on the trade date, i.e., the date that the Group commits to purchase the asset. Regular way purchases or sales are purchases or sales of financial assets that require delivery of the assets within the period generally established by regulation or convention in the market place.
Initial Recognition of Financial Instruments. Financial instruments are recognized initially at fair value of the consideration given (in the case of an asset) or received (in the case of a liability). Transaction costs are included in the initial measurement of all financial assets and liabilities, except for financial instruments measured at fair value through profit or loss (FVPL). Fair value is determined by reference to the transaction price or other market prices. If such market prices are not readily determinable, the fair value of the consideration is estimated as the sum of all future cash payments or receipts, discounted using the prevailing market rate of interest for similar instruments with similar maturities.
Day 1 Difference. Where the transaction price in a non-active market is different from the fair value from other observable current market transactions in the same instrument or based on a valuation technique whose variables include only data observable from the market, the Group recognizes the difference between the transaction price and fair value (a day 1 difference) in profit or loss unless it qualifies for recognition as some other type of asset. For each transaction, the Group determines the appropriate method of recognizing a day 1 difference amount.
Classification of Financial Instruments. Financial instruments are classified as liabilities or equity in accordance with the substance of the contractual arrangement. Interest, dividends, gains and losses relating to a financial instrument or a component that is a financial liability, are recognized as expense or income. Distributions to holders of financial instruments classified as equity are charged directly to equity, net of any related income tax benefits.
The Group classifies its financial assets in the following categories: FVPL financial assets, loans and receivables, held-to-maturity (HTM) investments and available-for-sale (AFS) financial assets. The Group classifies its financial liabilities as either financial liabilities at FVPL or other financial liabilities. The classification of financial instruments depends on the purpose for which these were acquired and whether these are quoted in an active market. The Group determines the classification of its financial assets and liabilities at initial recognition and, where allowed and appropriate, re-evaluates such designation at every reporting date.
The Group does not have financial instruments classified as financial assets or liabilities at FVPL, HTM investments and AFS financial assets as at September 30, 2018 and 2017.
Loans and Receivables. Loans and receivables are non-derivative financial assets with fixed or determinable payments and maturities that are not quoted in an active market. These are not entered into with the intention of immediate or short-term resale and are not designated as AFS financial assets or financial assets at FVPL.
Subsequent to initial measurement, loans and receivables are carried at amortized cost using the effective interest method, less any impairment in value. Any interest earned on loans and receivables is recognized as part of “Interest income” recognized in profit or loss on an accrual basis. Amortized cost is calculated by taking into account any discount or premium on acquisition and fees that are integral part of the effective interest rate. The periodic amortization is also included as part of “Interest income” recognized in profit or loss. Gains or losses are recognized in profit or loss when loans and receivables are derecognized or impaired, as well as through the amortization process.
Loans and receivables are included in current assets if maturity is within 12 months from the reporting date. Otherwise, these are classified as noncurrent assets.
Classified as loans and receivables are cash in banks, trade and other receivables, except for advances to planters, as at September 30, 2018 and 2017 (see Notes 7, 8 and 19). Trade receivables with average credit terms of 15 to 120 days are recognized and carried at original invoice amount less any allowance for impairment losses.
Other Financial Liabilities. Other financial liabilities pertain to financial liabilities that are not held for trading and are not designated at FVPL upon the inception of the liability. These include liabilities arising from operating (e.g. trade and other payables, excluding statutory liabilities and provision for probable losses) and financing (e.g. short and long-term borrowings, due to related parties, dividend payable) activities.
Borrowings are recognized initially at fair value, net of transaction costs incurred, and are subsequently stated at amortized cost. Any difference between the proceeds (net of transaction costs) and the redemption value is recognized in profit or loss over the term of the borrowings using the effective interest method.
Borrowings are classified as current liabilities unless the Group has an unconditional right to defer settlement of the liability for at least 12 months after the end of reporting year.
Trade and other payables are recognized in the year in which the related money, goods or services are received or when a legally enforceable claim against the Group is established. These are measured at amortized cost, normally equal to nominal amount.
Other financial liabilities are recognized initially at fair value and are subsequently carried at amortized cost, taking into account the impact of applying the effective interest method of amortization (or accretion) for any related premium (or discount) and any directly attributable transaction costs.
This category includes trade and other payables (excluding statutory liabilities and provision for probable losses) and short-term and long-term borrowings as at September 30, 2018 and 2017 (see Notes 14, 15, 16 and 19).
Derecognition of Financial Assets and Liabilities. A financial asset (or, where applicable, a part of a financial asset or part of a group of similar financial assets) is derecognized when:
• the rights to receive cash flows from the asset expired;
• the Group retains the right to receive cash flows from the asset, but has assumed an obligation to pay them in full without material delay to a third party under a “pass-through” arrangement; or
• the Group has transferred its rights to receive cash flows from the asset and either (a) has transferred substantially all the risks and rewards of the asset, or (b) has neither transferred nor retained substantially all the risks and rewards of the asset, but has transferred control of the asset.
Where the Group has transferred its rights to receive cash flows from an asset and has neither transferred nor retained substantially all the risks and rewards of the asset nor transferred control of the asset, the asset is recognized to the extent of the Group’s continuing involvement in the asset. Continuing involvement that takes the form of a guarantee over the transferred asset is measured at the lower of original carrying amount of the asset and the maximum amount of consideration that the Group could be required to pay.
A financial liability is derecognized when the obligation under the liability is discharged or cancelled or has expired.
When an existing financial liability is replaced by another from the same lender on substantially different terms, or the terms of an existing liability are substantially modified, such an exchange or modification is treated as a derecognition of the original liability and the recognition of a new liability, and the difference in the respective carrying amounts is recognized in profit or loss.
A modification is considered substantial if the present value of the cash flows under the new terms, including net fees paid or received and discounted using the original effective interest rate, is different by at least 10% from the discounted present value of remaining cash flows of the original liability.
The fair value of the modified financial liability is determined based on its expected cash flows, discounted using the interest rate at which the Group could raise debt with similar terms and conditions in the market. The difference between the carrying value of the original liability and fair value of the new liability is recognized in profit or loss.
On the other hand, if the difference does not meet the 10% threshold, the original debt is not extinguished but merely modified. In such case, the carrying amount is adjusted by the costs or fees paid or received.
Impairment of Financial Assets. The Group assesses at the end of each reporting year whether a financial asset or a group of financial assets is impaired. The Group first assesses whether objective evidence of impairment exists individually for financial assets that are individually significant, and individually or collectively for financial assets that are not individually significant. Objective evidence includes observable data that comes to the attention of the Group about loss events such as, but not limited to, significant financial difficulty of the counterparty, a breach of contract, such as a default or delinquency in interest or principal payments, or the increasing probability that the borrower will enter bankruptcy or other financial reorganization. If it is determined that no objective evidence of impairment exists for an individually assessed financial asset, whether significant or not, the asset is included in the group of financial assets with similar credit risk and characteristics and that group of financial assets is collectively assessed for impairment. Assets that are individually assessed for impairment and for which an impairment loss is recognized are not included in a collective assessment of impairment. The impairment assessment is performed at the end of each reporting year. For the purpose of a collective evaluation of impairment, financial assets are grouped on the basis of such credit risk characteristics such as customer type, payment history, past due status and term. If there is objective evidence that an impairment loss on loans and receivables has been incurred, the amount of loss is measured as the difference between the asset’s carrying amount and the present value of estimated future cash flows (excluding future credit losses that have not been incurred) discounted at the financial asset’s original effective interest rate (i.e., the effective interest rate computed at initial recognition). The carrying amount of the asset is reduced through the use of an allowance account. The amount of impairment loss is recognized in profit or loss. Loans and receivables, together with the related allowance, are written off when there is no realistic prospect of future recovery and all collateral has been realized. If, in a subsequent period, the amount of the impairment loss decreases and the decrease can be related objectively to an event occurring after the impairment was recognized, the previously recognized impairment loss is reversed. Any subsequent reversal of an impairment loss is recognized in profit or loss, to the extent that the carrying amount of the asset does not exceed its amortized cost at the reversal date.
Offsetting Financial Instruments. Financial assets and liabilities are offset and the net amount reported in the consolidated statement of financial position if there is a currently enforceable legal right to offset the recognized amounts and there is an intention to settle on a net basis, or to realize the asset and settle the liability simultaneously. The Group assesses that it has a currently enforceable right if the right is not contingent on a future event, and is legally enforceable in the normal course of business, event of default and event of insolvency or bankruptcy of the Group and all of the counter parties.
Fair Value Measurement
The Group uses valuation techniques that are appropriate in the circumstances and for which sufficient data are available to measure fair value, maximizing the use of relevant observable inputs and minimizing the use of unobservable inputs.
All assets and liabilities for which fair value is measured or disclosed in the consolidated financial statements are categorized within the fair value hierarchy, described as follows, based on the lowest level input that is significant to the fair value measurement as a whole:
Level 1 - Quoted (unadjusted) market prices in active market for identical assets or liabilities.
Level 2 - Valuation techniques for which the lowest level input that is significant to the fair value measurement is directly or indirectly observable.
Level 3 - Valuation techniques for which the lowest level input that is significant to the fair value measurement is unobservable.
For assets and liabilities that are recognized in the consolidated financial statements on a recurring basis, the Group determines whether transfers have occurred between levels in the hierarchy by re-assessing categorization (based on the lowest level input that is significant to the fair value measurement as a whole) at the end of each reporting year.
48472018 ANNUAL REPORT2018 ANNUAL REPORT
THE RIGHT FUNDAMENTALS: SUSTAINABILITY
For the purpose of fair value disclosures, the Group has determined classes of assets and liabilities on the basis of the nature, characteristics and risks of the asset or liability and the level of the fair value hierarchy as explained in the foregoing
Further information about the assumptions made in measuring fair value is included in the following notes to the consolidated financial statements:
• Note 5, “Significant Judgments, Accounting Estimates and Assumptions - Determining the Revaluation Amount of Land and Determining the Fair Value of Investment Properties”
• Note 12, “Property, Plant and Equipment” • Note 13, “Investment Properties” • Note 30, “Fair Value Measurement”
Inventories Inventories are valued at the lower of cost and net realizable value (NRV).
Raw and Refined Sugar, Molasses and Alcohol. Cost is determined using the weighted average method. Production cost is allocated using the NRV of each of the joint products (i.e., raw sugar, refined sugar and molasses). The cost of alcohol includes direct materials and labor and a proportion of manufacturing overhead costs with unit cost determined using the moving average method. NRV is the estimated selling price in the ordinary course of business, less the estimated costs to complete the production and the estimated costs necessary to make the sale.
Materials and Supplies. Cost is determined using the moving average method. NRV is the current replacement cost.
Provision for inventory losses and obsolescence is provided for slow moving, obsolete, defective and damaged inventories based on physical inspection and management assessment.
Other Current Assets This account consists of creditable withholding taxes (CWT), input value-added tax (VAT), advances to suppliers and prepayments.
CWT. CWT represents the amount withheld by the Group’s customers in relation to its income. CWT can be utilized as payment for income taxes provided that these are properly supported by certificates of creditable tax withheld at source subject to the rules on Philippine income taxation.
VAT. Revenue, expenses, assets and liabilities are recognized net of the amount of VAT, except where the VAT incurred on a purchase of assets or services is not recoverable from the taxation authority, in which case the VAT is recognized as part of the cost of acquisition of the asset or as part of the expense item as applicable. Receivables and payables are stated with the amount of VAT included. For sale or purchase of services, related VAT is deferred until the related receivable or payable from the transaction has been collected or paid.
The net amount of VAT recoverable from taxation authority is presented as part of “Other current and noncurrent assets” in the consolidated statement of financial position. The net amount of VAT payable to taxation authority is included in “Trade and other payables” in the consolidated statement of financial position.
Prepayments. Prepayments are expenses paid in advance and recorded as asset before these are utilized. Prepayments are apportioned over the period covered by the payment and charged to appropriate expense accounts in profit or loss when incurred. Prepayments that are expected to be realized for no more than 12 months after the financial reporting year are classified as current assets. Otherwise, these are classified as noncurrent assets.
Advances to suppliers represent prepayment to suppliers for goods or services to be delivered / rendered in the future. A reclassification is made to the appropriate account (e.g. supplies, inventory, property and equipment) once the supplier has fulfilled the performance obligation. The classification as to current or noncurrent is determined by the usage or realization of the asset to which the advances were paid for.
Investment in an Associate Investment in an associate initially recognized at cost, is subsequently accounted for using the equity method.
An associate is an entity in which the Group has significant influence but not control, over the financial and operating policies. Significant influence is presumed to exist when the Group holds between 20% and 50% of the voting rights of the entity.
The share of its associate’s post-acquisition profits or losses is recognized in profit or loss, and its share of post-acquisition movements in reserves is recognized in equity. The Parent Company’s share in net appraisal increase resulting from the revaluation of land of an associate is presented as “Share in revaluation increment on land of an associate,” net of related deferred tax, in the consolidated statement of changes in equity as other comprehensive income. The cumulative post-acquisition movements are adjusted against the carrying amount of the investment.
When the share of losses in an associate equals or exceeds its interest in the associate, including any other unsecured receivables, the Group does not recognize further losses, unless it has incurred obligations or made payments in behalf of the associate. Unrealized gains on transactions between the Group and its associate are eliminated to the extent of the interest in the associate. Unrealized losses are also eliminated unless the transaction provides evidence of an impairment of the asset transferred. The financial statements of the associate are prepared for the same reporting year of the Parent Company. Adjustments, where necessary, are made to ensure consistency with the policies adopted by the Group.
Assets Held for Sale and Discontinued Operations The Group classifies non-current assets and disposal groups as held for sale if their carrying amounts will be recovered principally through a sale transaction rather than through continuing use. Non-current assets and disposal groups classified as held for sale are measured at the lower of their carrying amount and fair value less costs to sell. Costs to sell are the incremental costs directly attributable to the disposal of an asset (disposal group), excluding finance costs and income tax expense. The criteria for held for sale classification are regarded as met only when the sale is highly probable and the asset or disposal group is available for immediate sale in its present condition. Actions required to complete the sale should indicate that it is unlikely that significant changes to the sale will be made or that the decision to sale will be withdrawn. Management must be committed to the plan to sell the asset and the sale expected to be completed within one year from the date of the classification. Property, plant and equipment and intangible assets are not depreciated or amortized once classified as held for sale. Assets and liabilities classified as held for sale are presented separately as current items in the consolidated statement of financial position. A disposal group qualifies as discontinued operation if it is a component of an entity that either has been disposed of, or is classified as held for sale, and: • Represents a separate major line of business or geographical area of operations • Is part of a single co-ordinated plan to dispose of a separate major line of business or geographical area of operations; or • Is a subsidiary acquired exclusively with a view to resale Discontinued operations are excluded from the results of continuing operations and are presented as a single amount as net income (loss) after tax from discontinued operations in the consolidated statement of income. Additional disclosures are provided in Note 12. All other notes to the consolidated financial statements include amounts for continuing operations, unless indicated otherwise.
Property, Plant and Equipment Property, plant and equipment are carried at historical cost less accumulated depreciation, amortization and any impairment in value, except for land, which is stated at revalued amount.
The initial cost of property, plant and equipment comprises its purchase price, including import duties and nonrefundable purchase taxes and any directly attributable costs of bringing the asset to its working condition and location for its intended use. Cost also includes the cost of replacing part of such asset when the recognition criteria are met, and the estimated present value of the cost of dismantling and removing the asset and restoring the site. Borrowing costs incurred during the construction of a qualifying asset is likewise included in the initial cost of property, plant and equipment.
Subsequent costs are included in the asset’s carrying amount or recognized as a separate asset, as appropriate, only when it is probable that future economic benefits associated with the item will flow to the Group and the cost of the items can be measured reliably. All other repairs and maintenance are charged to profit or loss in the year incurred.
Construction in progress pertains to properties under construction and are stated at cost. Cost includes costs of construction, labor, borrowings and other direct costs. Construction in progress is depreciated only from such time as the relevant assets are completed and put into operational use. Construction in progress are reclassified to the appropriate fixed asset category upon completion.
The net appraisal increment resulting from the revaluation of land is presented as “Revaluation increment on land,” net of related deferred tax, in the consolidated statement of changes in equity as part of other equity items and reserves. Any resulting decrease is directly charged against the related revaluation increment to the extent that the decrease does not exceed the amount of the revaluation in respect of the same asset. All other decreases are charged to profit or loss. Valuations are performed frequently enough to ensure that the fair value of land does not differ significantly from its carrying amount. The portion of revaluation increment on land, net of related deferred tax, realized upon disposal of the property is transferred to retained earnings.
Depreciation and amortization are calculated using the straight-line method to allocate the cost over the estimated useful lives, as presented as follows:
Asset Category Number of Years 2018 2017
Buildings and building improvements 30 25 Land improvements 10 to 25 10 to 25 Machinery and equipment: Factory machinery and installations 17 to 28 17 to 25 Safety equipment 5 5 Office furniture, fixtures and equipment 3 to 5 3 to 5 Depot and storage facilities 15 15 Transportation equipment 3 to 6 3 to 6
Depreciation and amortization commence when an asset is in its location or condition capable of being operated in the manner intended by management. Depreciation and amortization cease at the earlier of the date that the item is classified as held for sale (or included in a disposal group that is classified as held for sale) in accordance with PFRS 5, Noncurrent Assets Held for Sale and Discontinued Operations, and the date the asset is derecognized.
Major repairs and maintenance that qualified for capitalization are depreciated and amortized over the remaining useful life of the related asset.
The asset’s estimated useful lives and depreciation and amortization method are reviewed periodically to ensure that these are consistent with the expected pattern of economic benefits from items of property, plant and equipment.
Fully depreciated property and equipment are retained in the books until these are no longer in use.
50492018 ANNUAL REPORT2018 ANNUAL REPORT
THE RIGHT FUNDAMENTALS: SUSTAINABILITY
When an asset is disposed of, or is permanently withdrawn from use and no future economic benefits are expected from its disposal, the cost and accumulated depreciation, amortization and impairment are derecognized. Gains and losses on retirement or disposal are determined by comparing the proceeds with carrying amount of the asset and are recognized in profit or loss.
Software Cost Software cost, which is presented as part of “Other noncurrent assets,” is initially measured at cost. Following initial recognition, software cost is carried at cost less accumulated amortization and any impairment losses. The software cost is amortized on a straight-line basis over its estimated economic useful life of three years and assessed for impairment whenever there is an indication that the software cost may be impaired. The amortization commences when the software cost is available for use. The period and the method of amortization for the software cost are reviewed at each financial year end.
Gains and losses arising from derecognition of software cost are measured as the difference between the net disposal proceeds and the carrying amount of the asset and are recognized in profit or loss.
Investment Properties Investment properties are measured initially at cost, including transaction costs. Subsequent to initial recognition, investment properties are stated at fair value. Gains or losses arising from changes in fair value of investment properties are included in profit or loss in the year in which these arise.
The fair value of investment property is the price at which the property could be exchanged between knowledgeable, willing parties in an arm’s-length transaction. Fair value specifically excludes an estimated price inflated or deflated by special terms or circumstances such as typical financing, sale and leaseback arrangements, special considerations or concessions granted by anyone associated with the sale. The fair value of investment property should reflect market conditions at the end of the reporting year.
Derecognition of an investment property will be triggered by a change in use or by sale or disposal. Gain or loss arising on disposal is calculated as the difference between any disposal proceeds and the carrying amount of the related asset, and is recognized in profit or loss.
Transfers are made to investment property when, and only when, there is change in use, evidenced by cessation of owner-occupation or commencement of an operating lease to another party. Transfers are made from investment property when, and only when, there is a change in use, evidenced by commencement of owner-occupation or commencement of development with a view to sell.
Impairment of Nonfinancial Assets The carrying amounts of investment in an associate, property, plant and equipment, and other nonfinancial assets are reviewed for impairment whenever events or changes in circumstances indicate that the carrying amount may not be recoverable, except for goodwill acquired in a business combination which is reviewed for impairment annually. An impairment loss is recognized for the amount by which the asset’s carrying amount exceeds its recoverable amount. The recoverable amount is the higher of an asset’s fair value less costs to sell and value-in-use. For the purposes of assessing impairment, assets are grouped at the lowest levels for which there are separately identifiable cash flows (cash-generating units). Nonfinancial assets other than goodwill that suffered impairment are reviewed for possible reversal of the impairment at each reporting date.
Impairment losses are recognized in profit or loss under the expense category consistent with the function of the impaired asset. Impairment loss recognized during interim period in respect to goodwill or investment, cannot be reversed at year end.
An assessment is made at each reporting date as to whether there is any indication that previously recognized impairment losses may no longer exist or may have decreased. If such indication exists, the recoverable amount is estimated. A previously recognized impairment loss is reversed only if there has been a change in the estimates used to determine the asset’s recoverable amount since the last impairment loss was recognized. If that is the case, the carrying amount of the asset is increased to its recoverable amount. That increased amount cannot exceed the carrying amount that would have been determined, net of depreciation and amortization, had no impairment loss been recognized for the asset in prior years. Such reversal is recognized in profit or loss unless the asset is carried at revalued amount, in which case the reversal is treated as an appraisal increase. After such a reversal, the depreciation and amortization are adjusted in future periods to allocate the asset’s revised carrying amount, less any residual value, on a systematic basis over its remaining useful life.
Equity Capital Stock and Additional Paid-in Capital. Capital stock is measured at par value for all shares issued. Incremental costs directly attributable to the issue of new shares are shown in equity as a deduction from proceeds. The excess of proceeds from issuance of shares over the par value of shares are credited to additional paid-in capital. The Parent Company also recognizes a corresponding increase in additional paid-in capital when services are rendered in an equity-settled share-based payment transaction.
Treasury Stock. Where the Parent Company purchases its own capital stock (treasury stock), the consideration paid, including any directly attributable incremental costs (net of related taxes), is deducted from equity until the shares are cancelled, reissued or disposed of. Where such shares are subsequently sold or reissued, any consideration received, net of any directly attributable incremental transactions costs and the related taxes, is included in equity attributable to the equity holders of the Parent Company.
Retained Earnings. Retained earnings represent the cumulative balance of net income or loss, dividend distributions, effects of the changes in accounting policy and other capital adjustments.
Dividend Distribution. Dividend distribution to the Parent Company’s and subsidiaries’ stockholders and the non-controlling interests is recognized as a liability and deducted from equity in the year in which the dividends are declared as approved by the BOD of respective entities. Dividends that are approved after the reporting year are dealt with as an event after the reporting year.
Other Comprehensive Income (Loss) Other comprehensive income (loss) comprises items of income and expenses (including items previously presented as other equity reserves under the consolidated statement of changes in equity) that are not recognized in profit or loss for the year in accordance with PFRS. These are presented as part of other equity reserves in the consolidated statement of changes in equity. Other comprehensive income (loss) includes revaluation increment on land, cumulative remeasurement loss on net retirement assets and liabilities and cumulative loss on remeasurement loss of retirement assets of an associate.
Employee Stock Option (ESOP)
Regular employees (including directors) receive remuneration in the form of share-based payment transactions, whereby employees render services in exchange for rights over shares (“equity-settled transactions”).
The cost of equity-settled transactions with employees is measured by reference to the fair value of the stock options at the date at which these are granted. The fair value of the stock options is determined using an option-pricing model, further details of which are presented in Note 20. In valuing equity-settled transactions, no account is taken of any performance conditions, other than conditions linked to the price of the shares of RHI (“market conditions”), if applicable.
The cost of equity-settled transactions is recognized, together with a corresponding increase in equity, over the period until employees become fully entitled to the award (“vesting date”). The cumulative expense recognized for equity-settled transactions at each reporting date until the vesting date reflects the extent to which the vesting period has expired and the best estimate of the number of awards that will ultimately vest. The change or credit for a year represents the movement in cumulative expense recognized as at the beginning and end of that year.
No expense is recognized for awards that do not ultimately vest, except for awards where vesting is conditional upon a market condition, which are treated as vesting irrespective of whether or not the market condition is satisfied, provided that all other performance conditions are satisfied.
Where the terms of an equity-settled award are modified, an expense, at a minimum, is recognized as if the terms had not been modified. An expense is recognized for any increase in the value of the transactions as a result of the modification, as measured at the date of modification. Where an equity-settled award is cancelled, it is treated as if it had vested on the date of cancellation, and any expense not yet recognized for the award is recognized immediately. However, if a new award is substituted for the cancelled award, and designated as a replacement award on the date that it is granted, the cancelled and new awards are treated as if these were modifications of the original award, as described in the previous paragraph.
The dilutive effect of outstanding stock option is reflected as additional share dilution in the computation of earnings per share (see Note 27).
Revenue Recognition
Revenue comprises the fair value of the sale of goods and services in the ordinary course of the Group’s activities. Revenue is shown net of output VAT, returns and discounts.
The Group recognizes revenue when the amount of revenue can be reliably measured, it is probable that future economic benefits will flow into the entity and specific criteria have been met for each of the Group’s activities as described below. The amount of revenue is not considered to be reliably measured until all contingencies relating to the sale have been resolved.
Sale of Raw Sugar. Sale of raw sugar is recognized upon (a) endorsement and transfer of quedans for quedan-based sales and (b) shipment or delivery and acceptance by the customers for physical sugar sales.
Sale of Refined Sugar and Alcohol. Sale of refined sugar and alcohol is recognized upon shipment or delivery and acceptance by the customers.
Sale of Molasses. Sale of molasses is recognized upon transfer of molasses warehouse receipts, which represents ownership title over the molasses inventories.
Bill and Hold Sales. Bill and hold sales are recognized when all criteria are met:
a. It is probable that delivery will be made;
b. The item is on hand, identified and ready for delivery to the buyer at the time the sale is recognized;
c. The buyer specifically acknowledges the deferred delivery instructions; and
d. The usual payment terms apply.
Revenue from Tolling Services. Revenue from tolling services is recognized when the equivalent refined sugar is produced from raw sugar owned by tollees.
Rental Income. Rental income from operating leases is recognized on a straight line basis over the lease term.
Interest Income. Interest income is recognized on a time proportion basis using the effective interest method.
Other Income. Other income is recognized when the earning process is complete and the flow of economic benefit is reasonably assured.
Cost and Expense Recognition
Cost and expenses are recognized in profit or loss upon receipt of goods, utilization of services, or at the date the cost and expenses are incurred.
Cost of Sales. Cost of sales includes direct materials and labor costs, and those related indirect cost incurred upon processing of the Group’s products and rendering of its tolling services. It is recognized as expense when related goods are sold or the related services are rendered.
Selling, General and Administrative Expenses. Selling expenses are costs incurred to sell or distribute goods. General and administrative expenses are costs of administering the business such as salaries and wages of administrative department, outside services, rental, utilities and general office expenses. These expenses are recognized when incurred.
Borrowing Costs
Borrowing costs that are directly attributable to the acquisition, construction of a qualifying asset, which necessarily takes a substantial period of time to prepare for its intended use are included in the cost of that asset. Such borrowing costs are capitalized as part of the cost of the asset when it is probable that these will result in future economic benefits to the Group and the costs can be measured reliably. Other borrowing costs are recognized as expense when incurred.
Capitalization of borrowing costs is suspended during extended period in which the Group suspends active development of a qualifying asset and ceases when substantially all the activities necessary to prepare the qualifying asset for its intended use are complete. An asset is normally ready for its intended use when the physical construction of the asset is complete even though routine administrative work might still continue.
52512018 ANNUAL REPORT2018 ANNUAL REPORT
THE RIGHT FUNDAMENTALS: SUSTAINABILITY
Leases
The determination of whether the arrangement is, or contains a lease is based on the substance of the arrangement at inception date of whether the fulfillment of the arrangement is dependent on the use of a specific asset or assets or the arrangement conveys a right to use the asset. A reassessment is made after inception on the lease only if one of the following applies: (a) there is a change in contractual terms, other than a renewal or extension of the arrangement; (b) a renewal option is exercised or extension granted, unless the term of the renewal or extension was initially included in the lease term; (c) there is a change in the determination of whether fulfillment is dependent on a specified asset; or (d) there is substantial change to the asset.
Where a reassessment is made, lease accounting commences or ceases from the date when the change in circumstances gave rise to reassessment for scenarios (a), (c) or (d) and at the date of renewal or extension period for scenario (b).
Operating Lease - The Group as a Lessee. Leases where the lessor retains substantially all the risks and benefits of ownership of the asset are classified as operating lease. Operating leases are recognized as an expense on a straight-line basis over the lease term.
For income tax reporting purposes, operating lease payment under operating lease agreements is treated as deductible expense in accordance with the terms of the lease agreements.
Operating Lease - The Group as a Lessor. Leases where the Company does not transfer substantially all the risks and benefits of ownership of the assets are classified as operating leases. Initial direct costs incurred in negotiating operating leases are added to the carrying amount of the leased asset and amortized over the lease term on the same basis as the rental income. Contingent rents are recognized as revenue in the year in which these are earned.
Employee Benefits
Short-term Employee Benefits. The Group recognizes a liability, net of amounts already paid, and an expense for services rendered by employees during the reporting year. A liability is also recognized for the amount expected to be paid under short-term cash bonus or profit sharing plans if the Group has a present legal or constructive obligation to pay this amount as a result of past service provided by the employee, and the obligation can be estimated reliably.
Short-term employee benefits liabilities are measured on an undiscounted basis and are expensed as the related service is provided.
Retirement Benefits. The retirement benefits cost is determined using the projected unit credit method, which reflects services rendered by employees to the date of valuation and incorporates assumptions concerning employees’ projected salaries.
The retirement benefits cost comprises of the service cost, net interest on the retirement liability or plan asset and remeasurements of retirement liability or plan asset.
The Group recognizes service costs, comprising of current service costs, past service costs, gains and losses on curtailments and non-routine settlements; and interest cost or income in profit or loss.
Net interest on the retirement liability or plan asset is the change during the year in the retirement liability or plan asset that arises from the passage of time, which is determined by applying the discount rate based on government bonds to the retirement liability or plan asset.
Past service costs are recognized in profit or loss on the earlier of the date of the plan amendment or curtailment, and the date that the Group recognizes restructuring-related costs.
Remeasurements comprising actuarial gains and losses, return on plan assets and any change in the effect of the asset ceiling (excluding net interest on retirement liability or asset) are recognized immediately in other comprehensive income in the year in which these arise. Remeasurements are not reclassified to profit or loss in subsequent years.
The plan assets are generally funded through payments to trustee-administered funds as determined by periodic actuarial calculations. Plan assets are not available to the creditors of the Group, nor can be paid directly to the Group. The fair value of the plan assets is based on the market price information. When no market price is available, the fair value of plan assets is estimated by discounting expected future cash flows using a discount rate that reflects both the risk associated with the plan assets and the maturity or expected disposal date of those assets (or, if they have no maturity, the expected period until the settlement of the related obligations). If the fair value of the plan assets is higher than the present value of the retirement liability, the measurement of the resulting retirement plan asset is limited to the present value of economic benefits available in the form of refunds from the plan or reductions in future contributions to the plan.
The retirement liability or asset is the aggregate of the present value of the retirement liability and the fair value of plan assets on which the obligations are to be settled directly. The present value of the retirement liability is determined by discounting the estimated future cash outflows using interest rate on government bonds that have terms to maturity approximating the terms of the related retirement liability.
Actuarial valuations are made with sufficient regularity so that the amounts recognized in the consolidated financial statements do not differ materially from the amounts that would be determined at the reporting date.
Termination Benefits. Termination benefits are payable when employment is terminated before the retirement date, or when an employee accepts voluntary redundancy in exchange for these benefits. The Group recognizes termination benefits when it is demonstrably committed to either: terminating the employment of current employees according to a detailed formal plan without possibility of withdrawal; or providing termination benefits as a result of an offer made to encourage voluntary redundancy. Benefits falling due more than 12 months after end of reporting year are discounted to present value.
Related Party Relationship and Transactions
Related party relationship exists when one party has the ability to control, directly, or indirectly through one or more intermediaries, or exercise significant influence over the other party in making financial and operating decisions. Such relationships also exist between and/or among entities which are under common control with the reporting entity, or between, and/or among the reporting entity and its key management personnel, directors or its stockholders. In considering each possible related party relationship, attention is directed to the substance of the relationship, and not merely to the legal form.
Foreign Currency-Denominated Transactions and Translations
Items included in the consolidated financial statements of each of the Group’s entities are measured using the functional currency.
Transactions denominated in foreign currencies are recorded using the exchange rate at the date of the transaction. Outstanding monetary assets and liabilities denominated in foreign currencies are translated using the closing rate of exchange at the end of reporting year. Foreign exchange differences are credited or charged directly in profit or loss.
Income Taxes
Current Tax. Current tax assets and liabilities for the current and prior years are measured at the amount expected to be recovered from or paid to the taxation authorities. The tax rate and the tax laws used to compute the amount are those that are enacted or substantively enacted at the end of the reporting year.
Deferred Tax. Deferred tax is provided on all temporary differences at the end of reporting year between the tax bases of assets and liabilities and their carrying amounts for financial reporting purposes.
Deferred tax liabilities are recognized for all taxable temporary differences, including asset revaluations. Deferred tax liability is not recognized when it arises from the initial recognition of an asset or liability in a transaction that is not a business combination and, at the time of the transaction, affects neither the accounting profit or loss nor taxable profit or loss. However, deferred tax liabilities are not provided on non-taxable temporary differences associated with investments in domestic subsidiaries and associates. Deferred tax assets are recognized for all deductible temporary differences, carryforward benefits of unused tax credits (excess of minimum corporate income taxes or MCIT over regular corporate income taxes or RCIT) and unused tax losses (net operating loss carryover or NOLCO), to the extent that it is probable that sufficient future taxable profit will be available against which the deductible temporary differences and carryforward benefits of unused tax credits and unused tax losses can be utilized.
The carrying amount of deferred tax assets is reviewed at the end of each reporting year and reduced to the extent that it is no longer probable that sufficient future taxable profit will be available to allow all or part of the deferred tax assets to be utilized. Unrecognized deferred tax assets are reassessed at the end of each reporting year and are recognized to the extent that it has become probable that sufficient future taxable profit will allow the deferred tax asset to be recovered.
Deferred tax assets and liabilities are measured at the tax rate that are expected to apply to the period when the asset is realized or the liability is settled, based on tax rates (and tax laws) that have been enacted or substantively enacted at the end of reporting year.
Deferred tax assets and liabilities are offset if a legally enforceable right exists to set off the deferred tax assets against the deferred tax liabilities and the deferred taxes relate to the same taxable entity and the same taxation authority.
Deferred tax relating to items recognized outside profit or loss is recognized outside profit or loss. Deferred tax items are recognized in relation to the underlying transaction either in other comprehensive income or directly in equity.
Provisions and Contingencies
Provision are recognized when the Group has a present legal or constructive obligation as a result of past events; it is more likely than not that an outflow of resources will be required to settle the obligation; and the amount can be reliably estimated. Restructuring provisions comprise lease termination penalties and employee termination payments. Provisions are not recognized for future operating losses.
Where there are a number of similar obligations, the likelihood that an outflow will be required in settlement is determined by considering the class of obligations as a whole. A provision is recognized even if the likelihood of an outflow with respect to any one item included in the same class of obligations may be small.
Provisions are measured at the present value of the expenditures expected to be required to settle the obligation using a pre-tax rate that reflects current market assessments of the time value of money and the risks specific to the obligation. The increase in the provision due to passage of time is recognized as interest expense.
Provisions are reviewed at the end of each reporting year and adjusted to reflect the current best estimate.
Contingent liabilities are not recognized in the consolidated financial statements. These are disclosed in the notes to consolidated financial statements unless the possibility of an outflow of resources embodying economic benefits is remote. A contingent asset is not recognized in the consolidated financial statements but disclosed in the notes to consolidated financial statements when an inflow of economic benefits is probable.
Earnings per Share
The Group presents basic and diluted earnings per share. Basic earnings per share is calculated by dividing the profit attributable to equity holders of the Parent Company by the weighted average number of common shares outstanding during the year, excluding common shares purchased by the Parent Company and held as treasury shares. Diluted earnings per share is calculated in the same manner, adjusted for the effects of all the dilutive potential common shares.
Segment Reporting
For purposes of management reporting, the Group’s operating businesses are organized and managed separately on a per company basis, but are grouped into strategic business units (SBU) defined along the Group’s core main product lines, namely: sugar and alcohol.
Operating segments are components of the Group: (a) that engage in business activities from which these may earn revenue and incur expenses (including revenue and expenses relating to transactions with other components of the Group); (b) whose operating results are regularly reviewed by the Group’s senior management, its chief operating decision maker, to make decisions about resources to be allocated to the segment and assess its performance; and (c) for which discrete financial information is available.
Events after the Reporting Date
Post year-end events that provide additional information about the Group’s financial position at the end of reporting year (adjusting events) are reflected in the consolidated financial statements when material. Post year-end events that are non-adjusting events are disclosed in the notes to consolidated financial statements when material.
5. Significant Judgments, Accounting Estimates and Assumptions
The preparation of the consolidated financial statements requires the Group to exercise judgment, make estimates and use assumptions that affect the reported amounts of assets, liabilities, income and expenses and related disclosures. The Group makes estimates and uses assumptions concerning the future. The resulting accounting estimates will, by definition, seldom equal the related actual results. Future events may occur which will cause the assumptions used in arriving at the estimates to change. The effects of any change in estimates are reflected in the consolidated financial statements as these become reasonably determinable.
54532018 ANNUAL REPORT2018 ANNUAL REPORT
THE RIGHT FUNDAMENTALS: SUSTAINABILITY
Judgments, estimates and assumptions are continuously evaluated and are based on historical experience and other factors, including expectations of future events that are believed to be reasonable under the circumstances.
The Group believes the following represent a summary of significant judgments, estimates and assumptions that have a significant risk of causing a material adjustment to the carrying amount of assets and liabilities, as well as to the related revenues and expenses, within the next fiscal year, and related impact and associated risk in the consolidated financial statements.
Judgments
In the process of applying the Group’s accounting policies, management exercised judgment on the following items, apart from those involving estimations, which has the most significant effect on the amounts recognized in the consolidated financial statements.
Determining the Operating Segments. Determination of operating segments is based on the information about components of the Group that management uses to make decisions about operating matters. Operating segments use internal reports that are regularly reviewed by the Parent Company’s chief operating decision maker, which is defined to be the Parent Company’s BOD, in order to allocate resources to the segment and assess its performance. The Parent Company reports separate information about an operating segment that meets any of the following quantitative thresholds: (a) its reported revenue, including both sales to external customers and intersegment sales or transfers, is 10% or more of the combined revenue, internal and external, of all operating segments; (b) the absolute amount of its reported profit or loss is 10% or more of the greater, in absolute amount, of (i) the combined reported profit of all operating segments that did not report a loss and (ii) the combined reported loss of all operating segments that reported a loss; and (c) its assets are 10% or more of the combined assets of all operating segments.
Management assessed that the Group’s operating businesses are organized and managed separately according to core main product lines, namely: sugar and alcohol. Consequently, reportable operating segments as at and for the years ended September 30, 2018, 2017 and 2016 are sugar, alcohol and others (see Note 32).
Determining the Existence of Control in Investee Companies. Control is presumed to exist when the Parent Company owns, directly or indirectly through subsidiaries, more than half of the voting power of an entity unless, in exceptional circumstances, it can be clearly demonstrated that such ownership does not constitute control. The Parent Company has the power to cast the majority of votes through its representatives in the BOD. Management has determined that despite having only 50% ownership in RPC and no equity ownership yet in NPSC, the Parent Company has control over RPC and NPSC by virtue of its rights to variable returns from the subsidiary and ability to affect those returns.
Determining the Classification of Lease Arrangements. Management exercises judgment in determining whether substantially all the significant risks and benefits of ownership of the assets held for lease are retained by the Group. Lease contracts in which the Group retains substantially all the risks and benefits incidental to ownership of the leased item are accounted for as operating leases. Otherwise, these are considered as finance leases.
• Operating Lease - The Group as a Lessee. The Group, has various property being leased covering several heavy handling equipment, service vehicles and office space of RHI, where it has determined that the risks and benefits of ownership over these properties are retained with the lessors. Accordingly, these lease agreements are accounted for as operating leases (see Note 28).
Rent expense amounted to P=248.3 million, P=210.8 million and P=184.4 million, respectively, included in “Cost of goods sold” and “General and administrative expenses” accounts, in 2018, 2017 and 2016, respectively (see Notes 22 and 23).
• Operating Lease - The Group as a Lessor. Leases where the Group does not transfer substantially all the risks and benefits of ownership of the asset are classified as operating leases. Rent income is recognized on a straight-line basis over the lease term of the lease, as applicable (see Note 13).
Determining the classification of assets held for sale and discontinued operations. On May 23, 2018, the Group has reached an agreement with Universal Robina Corporation (“URC”) for the sale of the Group’s sugar milling and refining operations in Batangas (the “Proposed Sale Transaction”). Management believes that the assets subject to the Proposed Sale Transaction are available for immediate sale and can be sold to URC in its current condition as of September 30, 2018. Further, management believes that the PCC approval is required in relation to similar transactions. As of January 14, 2019, the Proposed Sale Transaction is still under review by the PCC. Nonetheless, the Group remains committed to the Proposed Sale Transaction. The agreement between the Group and URC represents a disposal of a separate major operating segment of the Group hence, the disclosure as discontinued operations.
As at September 30, 2018, assets held for sale amounted to P=6,525.0 million (see Note 12).
Determining the Classification of Properties. Management determines the classification of a property depending on its use. The Group classifies its owner-occupied properties as property, plant and equipment. Properties held to earn rentals or for capital appreciation are classified as investment properties. The change of use of properties will trigger a change in classification and measurement of these properties.
The Group classified and accounted the land of NAVI, SCBI and the Parent Company held for rent or capital appreciation as investment properties. As at September 30, 2018 and 2017, the carrying amount of investment properties amounted to P=347.6 million and P=349.3 million, respectively (see Note 13).
Estimates and Assumptions
The key assumptions concerning the future and other key sources of estimation uncertainty at the end of reporting period that have a significant risk of causing a material adjustment to the carrying amounts of assets and liabilities within the next fiscal years are discussed below.
Estimating Impairment Losses on Receivables. The provision for impairment losses on receivables is estimated based on two methods: specific identification and collective assessment. The amounts calculated using each of these methods are combined to determine the total amount to be provided. First, specific accounts are evaluated based on information that certain customers may be unable to meet their financial obligations. In these cases, the Group applies judgment, in recording specific allowances against amounts due to reduce receivable amounts expected to be collected, based on the best available facts and circumstances, including but not limited to, the length of relationship with the customer and the customer’s current credit status based on third party credit reports and known market factors. These specific allowances are re-evaluated and adjusted as additional information received impacts the amounts estimated. Second, a collective assessment of historical collection, write-off, experience and customer payment terms is determined. The amount and timing of recorded expenses for any year could therefore differ based on the judgments or estimates made. An increase in the Group’s allowance for impairment of receivables would increase its general and administrative expenses and decrease its current assets.
As at September 30, 2018 and 2017, trade and other receivables amounted to P=3,040.4 million and P=2,258.1 million, respectively (see Note 8). Allowance for impairment losses of trade and other receivables amounted to P=90.8 million and P=76.0 million as at September 30, 2018 and 2017, respectively (see Note 8).
Determining the NRV of Inventories. The Group’s estimates of the NRV of inventories are based on the most reliable evidence available at the time the estimates are made of the amount that the inventories are expected to be realized. These estimates consider the fluctuations of price or cost directly relating to events occurring after the end of the reporting period to the extent that such events confirm conditions existing at the end of the reporting period. When the circumstances that previously caused inventories to be written down below cost no longer exist or when there is a clear evidence of an increase in NRV because of change in economic circumstances, the amount of the write-down is reversed so that the new carrying amount is the lower of the cost and the revised NRV.
As at September 30, 2018 and 2017, the inventories carried at lower of cost and NRV amounted to P=2,646.1 million and P=2,539.5 million, respectively (see Note 9). Allowance for inventory losses and obsolescence amounted to P=57.8 million and P=30.1 million as at September 30, 2018 and 2017, respectively (see Note 9).
Allocating the Cost to Molasses Inventory. Management uses judgment to measure and allocate cost to the molasses inventory. When the costs of conversion of each product are not separately identifiable, these are allocated among the products on a rational and consistent basis. The allocation is based on the NRV of cane products at the completion of production.
As at September 30, 2018 and 2017, portion of molasses inventory amounting to P=68.3 million and P=5.9 million, respectively, pertains to allocated cost from the total production costs of milled raw and refined sugar (see Note 9).
Estimating the Provision for Unrecoverable Creditable Withholding Taxes. Provision for unrecoverable creditable withholding taxes is maintained at a level considered adequate to provide for potentially unrecoverable claims. The Group, on a continuing basis, makes a review of the status of the claims, designed to identify those to be provided with any impairment loss. In these cases, management uses judgment based on the best available facts and circumstances. The amount and timing of recorded loss for any period would differ based on the judgments or estimates made.
As at September 30, 2018 and 2017, the carrying amount of creditable withholding taxes (net of allowance amounting to P=12.2 million as of both years) amounted to P=794.5 million and P=597.5 million, respectively, (see Note 10).
Determining the Revaluation Amount of Land. The land is carried at revalued amount, which approximates its fair value at the date of the revaluation. The valuation of land is performed by Philippine SEC accredited appraisers. The fair value was arrived at using the Market Data Approach based on the gathered available market evidences. Revaluations are made on a regular basis to ensure that the fair value does not differ materially from its carrying value.
Land carried at revalued amount as at September 30, 2018 and 2017 amounted to P=1,376.6 million and P=4,746.0 million, respectively (see Note 12). Appraisal increase, net of tax, amounted to P=10.8 million, P=116.6 million and P=181.5 million in 2018, 2017, and 2016, respectively.
Estimating Useful Lives of Property, Plant and Equipment. The useful life of each of the items of property, plant and equipment is estimated based on the year over which the asset is expected to be available for use. Such estimation is based on a collective assessment of practices of similar businesses, internal technical evaluation and experience with similar assets. The estimated useful life of each asset is reviewed periodically and updated if expectations differ from previous estimates due to physical wear and tear, technical or commercial obsolescence and legal or other limits on the use of the asset. It is possible, however, that future results of operations could be materially affected by changes in the amounts and timing of recorded expenses brought about by the changes in the factors mentioned in the foregoing. A change in the estimated useful life of any item of property, plant and equipment would impact the recorded cost and expenses and noncurrent assets.
In 2018, the Group’s review indicated that the estimated useful life of buildings and improvements and machinery and equipment, mostly pertaining to the production plants, should be extended from 25 years to 30 years, and 18-25 years to 18-28 years, respectively, effective October 1, 2017. This is based on the Group’s reassessment of the expected period over which the Group will benefit from the use of these assets. Management, with the involvement of its project engineers, performed internal technical evaluation, in determining the estimated useful life of these assets. There were no changes to the estimated useful lives of other items of property, plant and equipment.
The change in estimated useful life reduced the current year depreciation expense by P=119.5 million. Estimated decrease on future annual depreciation expense amounted to P=77.9 million in 2019 to 2023 and P=52.0 million in 2024 to 2028 while estimated increase amounted to P=249.4 million in 2029 onwards.
The carrying amount of the depreciable property, plant and equipment as at September 30, 2018 and 2017 amounted to P=6,731.7 million and P=9,849.6 million, respectively (see Note 12).
Determining the Fair Value of Investment Properties. The fair value of the investment properties was determined by Philippine SEC accredited appraisers using Market Data Approach based on gathered available market evidences. The latest appraisal reports were made on various dates in 2018.
Investment properties stated at fair value amounted to P=347.6 million and P=349.3 million as at September 30, 2018 and 2017, respectively (see Note 13). The unrealized gain on fair value adjustment of investment properties amounted to P=27.5 million, P=13.4 million and P=27.5 million in 2018, 2017 and 2016, respectively, recorded under “Other income” in the consolidated statements of income (see Note 25).
Estimation of fair value less costs to sell of assets held for sale. The assets classified as held for sale are measured at the lower of their carrying amount and fair value less costs to sell. The determination of fair values requires estimates of economic conditions and other factors. The fair value was based on the appraisal values of the assets, while the cost to sell is primarily the documentary stamp tax related to the sale of assets. As at September 30, 2018, assets held for sale are measured at its carrying amount of P=6,525.1 million, which is lower than its fair value less costs to sell.
Assessing Impairment of Nonfinancial Assets. The Group assesses at the end of each reporting year whether there is any indication that the nonfinancial assets listed in the next page (except goodwill) may be impaired. If such indication exists for nonfinancial assets other than goodwill, the Group estimates the recoverable amount of the asset, which is the higher of an asset’s fair value less costs to sell and its value-in-use. In determining fair value, an appropriate valuation model is used, which can be based on quoted prices or other available fair value indicators. Goodwill is tested for impairment at least on an annual basis or more frequently if events or changes in circumstances indicate that it may be impaired. For goodwill, annual impairment test requires estimation of value-in-use of the cash generating unit to which goodwill relates. In estimating the value-in-use, the Group is required to make an estimate of the expected future cash flows from the cash generating unit and also to choose an appropriate discount rate in order to calculate the present value of those cash flows.
Determining the recoverable amounts of the nonfinancial assets which involves the determination of future cash flows expected to be generated from the continued use and ultimate disposition of such assets, requires the use of estimates and assumptions that can materially affect the consolidated financial statements. Future events could indicate that these nonfinancial assets and goodwill may be impaired. Any resulting impairment loss could have a material adverse impact on the financial condition and results of operations of the Group.
While the Group believes that its assumptions are appropriate and reasonable, significant changes in these assumptions may materially affect its assessment of recoverable values and may lead to future additional impairment changes.
56552018 ANNUAL REPORT2018 ANNUAL REPORT
THE RIGHT FUNDAMENTALS: SUSTAINABILITY
Nonfinancial assets that are subject to impairment testing when impairment indicators are present such as obsolescence, physical damage, significant changes to the manner in which the asset is used, worse than expected economic performance, a drop in revenue or other external indicators, are as follows:
Note 2018 2017
Property, plant and equipment 12 P=7,595,865 P=10,303,421
Investment in an associate 11 642,690 606,768
There are no indications of possible impairment on the nonfinancial assets. Accordingly, the Group has not recognized any impairment losses on nonfinancial assets in 2018, 2017 and 2016.
Goodwill relates to the excess of consideration of Group’s acquisition of SCBI over the latter’s identifiable assets and liabilities in 2015. Goodwill amounted to P=1,079.6 million as of September 30, 2018 and 2017 (see Note 6).
The recoverable amount has been determined based on the value-in-use calculations using cash flow projections from financial budgets covering as approved by management a five-year period of projection. The projected cash flows were based on expectations on future outcomes taking into account past experiences, adjusted for anticipated revenue growth based on management’s future plans. The key assumptions used in determining the recoverable amount as of September 30, 2018 and 2017 are as follows:
Sales growth (average of less than 1% year on year) - Management based the projected sales growth on the production capacity of its plant over the forecast period.
Terminal growth rate (2.2%) - Cash flows beyond the five-year period are extrapolated growth rate using a 2.2% which is within the long-term average growth rate for bioethanol industry.
Alcohol selling price (average of less than 1% year on year) – Management based the unit price of bioethanol on the average historical experience in the market.
Feedstock yield (average of less than 1% year on year) - Management based the feedstock yield on the Group’s historical experience in bioethanol produced over feedstock used.
Manufacturing costs ratio (averaging at 72% over the forecast period) – Management based the ratio of production costs over feedstock margin on its historical experience.
Operating expenses ratio (averaging at 6% over the forecast period) – Management based the ratio of operating expenses over feedstock margin on its historical experience.
Discount rate (11.45% and 8.8% in 2018 and 2017, respectively) - The discount rate applied to the cash flows is based on the risk free rate for 10-year bonds issued by the government in the respective market, adjusted for a risk premium to reflect both the increased risk of investing in equities and the systematic risk of the specific Group operating company. In making this adjustment, inputs required are the equity market risk premium (that is the required increased return over and above a risk-free rate by an investor who is investing in the market as a whole) and the risk adjustment beta, applied to reflect the risk of the specific Group operating company relative to the market as a whole.
In determining the risk-adjusted discount rate, management has applied an adjustment for the systematic risk to the acquiree’s operations determined using an average of the betas of comparable listed companies across the world. Management has used market risk premium that takes into consideration studies by independent economists.
Management believes that no reasonably possible change in any of the above assumptions would cause the carrying value of the goodwill to exceed the recoverable amount of the related cash generating unit.
Based on management’s assessment, the recoverable amount of the goodwill is higher than the carrying value, thus no impairment loss was noted on the goodwill on SCBI with carrying amount of P=1,079.6 million as of September 30, 2018 and 2017 (see Note 6).
Determining Retirement Benefits and Liability. The determination of the cost of retirement benefits and related retirement liability is dependent on the selection of certain assumptions used by the actuary in calculating such amounts. Those assumptions, which include among others, discount rates and future salary increase rate are described in Note 17.
Actual results that differ from the assumptions are accumulated and are recognized as other comprehensive income and accumulated in equity. While management believes that the assumptions are reasonable and appropriate, significant differences in the Group’s actual experience of significant changes in the assumptions may materially affect the retirement liability.
As at September 30, 2018 and 2017, net retirement assets amounted to P=44.9 million and P=62.1 million, respectively, while net retirement liabilities amounted to P=249.9 million and P=316.8 million as at September 30, 2018 and 2017, respectively (see Note 17). Net retirement benefits expense amounted to P=64.8 million, P=66.0 million and P=48.7 million in 2018, 2017 and 2016, respectively (see Note 17).
Assessing Realizability of Deferred Tax Assets
The Group reviews the carrying amounts at the end of each reporting year and reduces the amount of deferred tax assets to the extent that it is no longer probable that sufficient future taxable profit will be available to allow all or part of the deferred tax assets to be utilized.
Total deferred tax assets amounted to P=638.1 million and P=472.7 million as at September 30, 2018 and 2017, respectively (see Note 26).
Deferred tax assets were not recognized on certain deductible temporary differences and carryforward benefits of excess MCIT over RCIT with income tax effect amounting to P=10.0 million and P=12.8 million as at September 30, 2018 and 2017, respectively (see Note 26). Management believes that it may not be probable that future taxable profit will be available in the near future against which the deferred tax assets can be utilized.
Evaluation of Provisions and Contingencies
The Group provides for present obligations (legal or constructive) where it is probable that there will be an outflow of resources embodying economic benefits that will be required to settle said obligations. An estimate of the provision is based on known information at the end of reporting period, net of any estimated amount that may be reimbursed to the Group. If the effect of the time value of money is material, provisions are discounted using a current pre-tax rate that reflects the risks specific to the liability. The amount of provision is being re-assessed at least on an annual basis to consider new relevant information.
The Group is involved in various other labor disputes, litigations, claims and tax assessments that are normal to its business. Based on the opinion of the Group’s legal counsels on the progress and legal grounds of certain claims and assessments, the Group has recognized outstanding provision for probable losses amounting P=7.6 million and P=96.6 million as at September 30, 2018 and 2017, respectively (see Notes 16 and 28).
6. Business Combination
In April 2015, the Group entered into a Sale and Purchase Agreement (SPA) for the acquisition of 93.35% equity interest in SCBI through RPBC, a wholly owned subsidiary, for a total consideration of P=1,737.6 million. The SPA also provides the transfer of assets of NPSC to RPBC, whether through merger with, acquisition of NPSC or direct asset sale, without additional consideration to the Group. Consequently, the Group effectively acquired the business of NPSC without holding equity interest yet. The assets of NPSC mainly include depot and storage facilities, which are included in the consolidated statements of financial position. In 2017, deeds of assignment covering the shares held by NPSC’s previous stockholders were executed in favor of RPBC.
The total consideration includes the purchase of the receivable of the former stockholders of SCBI from NPSC amounting to P=122.0 million. All closing conditions have been substantially met in May 2015. In 2016, after finalizing the purchase price allocation, total consideration was adjusted to P=1,679.9 million and the fair value of the noncontrolling interest amounted to P=34.9 million. The fair values of the identifiable assets and liabilities amounted to P=635.2 million. Accordingly, goodwill recognized amounted to P=1,079.6 million. The goodwill primarily relates to expected synergy arising from acquisition.
7. Cash and Cash Equivalents
This account consists of:
2018 2017 Cash on hand P=3,148 P=1,040 Cash in banks 289,988 520,334 Cash equivalents 2,013 50,003 P=295,149 P=571,377
Cash in banks and cash equivalents earn interest at the respective bank deposit rates.
Interest income earned from cash in bank and cash equivalents amounted to P=0.7 million, P=0.8 million and P=1.0 million in 2018, 2017, and 2016, respectively (see Note 25).
8. Trade and Other Receivables
This account consists of:
Note 2018 2017 Trade 19 P=2,811,084 P=2,013,752 Due from:
Planters and cane haulers 28 159,717 130,792 Employees 58,046 63,274
Related parties 19 37,369 57,821 Others 64,931 68,435 3,131,147 2,334,074 Allowance for impairment losses (90,792) (75,991) P=3,040,355 P=2,258,083
Trade receivables are unsecured, noninterest-bearing with credit terms ranging from 15 to 120 days.
Due from planters and cane haulers pertain to interest-bearing cash advances, which will be settled in the form of raw sugar from the planters and through services to be rendered by the cane haulers, respectively. Interest income amounted to P=1.7 million, P=2.4 million and P=1.9 million in 2018, 2017 and 2016, respectively (see Note 25).
Due from employees include housing and educational loans which are collected through salary deduction, and advances for business purposes subject to liquidation.
Other receivables mainly include claims from a former stockholder of SCBI which are noninterest-bearing and covered by an escrow agreement. The amount is expected to be collected within the next year.
Details and movements of allowance for impairment losses on trade and other receivables determined through specific identification are presented in the following tables:
2018
Note Trade
Due from Planters and
Cane Haulers Due from
Employees Others Total Balance at beginning of year P=18,732 P=46,472 P=1,929 P=8,858 P=75,991 Provision 23 14,387 259 155 – 14,801 Balance at end of year P=33,119 P=46,731 P=2,084 P=8,858 P=90,792
58572018 ANNUAL REPORT2018 ANNUAL REPORT
THE RIGHT FUNDAMENTALS: SUSTAINABILITY
2017
Note Trade
Due from Planters and
Cane Haulers Due from
Employees Others Total Balance at beginning of year P=39,176 P=37,743 P=733 P=8,858 P=86,510 Provision (reversal) 23 – (9,322) 65 – (9,257) Write-off (1,262) – – – (1,262) Reclassifications (19,182) 18,051 1,131 – – Balance at end of year P=18,732 P=46,472 P=1,929 P=8,858 P=75,991
9. Inventories
This account consists of:
2018 2017 At NRV: Materials and supplies P=560,676 P=541,014 Alcohol 46,227 46,153 At cost: Refined sugar 1,383,012 1,324,000 Molasses 488,319 335,046 Raw sugar 108,897 283,887 Others 58,954 9,426 P=2,646,085 P=2,539,526
Raw sugar quantities reported as inventories are supported by quedans held by the Group. The Group also has raw sugar quantities, which are also supported by quedans, held in trust for third parties (see Note 28). A quedan is a warehouse receipt document which evidences the ownership of specified quantity in a warehouse or sugar central.
Cost of inventories valued at NRV is shown below:
2018 2017 Materials and supplies P=600,713 P=571,051 Alcohol 63,948 46,227 P=664,661 P=617,278
Details and movements of allowance for inventory losses and obsolescence are as follows:
2018
Alcohol Materials and
Supplies Total Balance at beginning of year P=74 P=30,037 P=30,111 Provisions 17,646 10,001 27,647 Balance at end of year P=17,720 P=40,038 P=57,758
2017
Alcohol Materials and
Supplies Total Balance at beginning of year P=– P=29,985 P=29,985 Provisions 74 52 126 Balance at end of year P=74 P=30,037 P=30,111
Provisions for inventory losses and obsolescence amounting to P=27.6 million and P=0.1 million, are presented as “Others” under “Cost of goods sold” and “General and Administrative Expenses” in 2018 and 2017, respectively (see Notes 22 and 23).
Cost of inventories recognized as expense and presented as “Direct materials used” under “Cost of sales” amounted to P=1,575.8 million, P=2,086.7 million and P=4,259.7 million in 2018, 2017 and 2016, respectively (see Note 22). Cost of inventories recognized as expense included as part of “Cost of sales and services” of discontinued operations amounted to P=4,918.6 million, P=3,108.0 million and P=1,985.7 million in 2018, 2017 and 2016, respectively (see Note 12).
10. Other Assets Current portion of this account consists of:
2018 2017 Creditable withholding taxes, net of allowance for probable losses of P=12.2 million P=794,453 P=597,480 Advances to suppliers 261,040 103,682 Input VAT 37,550 70,395 Prepayments 35,932 18,211 Refundable deposits 14,410 14,315 Others 60,903 25,120 P=1,204,288 P=829,203
Input VAT, which includes deferred input VAT, arises from other purchases of capital goods and services for operations.
Noncurrent portion of other assets consist of:
2018 2017 Input VAT P=273,023 P=256,661 Refundable deposits 16,842 16,842 Others 1,558 6,395 P=291,423 P=279,898
Noncurrent portion of input VAT mostly arises from construction services relating to the Ethanol Plant.
11. Investment in an Associate
The Parent Company has 45.09% ownership interest in Hawaiian-Philippine Company (HP Co.), an entity incorporated in the Philippines, which is engaged in manufacturing and trading of raw and refined sugar, molasses and other sugar by-products.
Movements in investment in an associate are as follows:
Note 2018 2017 Acquisition cost P=127,933 P=127,933 Accumulated share in net earnings: Balance at beginning of year 280,509 322,648 Dividends declared (78,226) (109,916) Share in net earnings 55,834 67,777 Balance at end of the year P=258,117 P=280,509 Cumulative share in remeasurement loss on retirement liability: 18 Balance at beginning of year (9,166) (9,205) Share in remeasurement gain 1,501 39 Balance at end of the year (7,665) (9,166) Share in revaluation increment of land: 18 Balance at beginning of year 207,492 207,492 Share in revaluation increment 56,813 – Balance at end of the year 264,305 207,492 P=642,690 P=606,768
Cash dividends declared by HP Co. are as follows:
Date Approved Amount
per Share Total Amount Stockholders of
Record Date Date Paid March 1, 2018 P=2.74 P=173,528 February 28, 2018 April 12, 2018 February 10, 2017 3.85 243,768 February 28, 2017 April 6, 2017 September 29, 2016 3.59 227,306 October 31, 2016 November 10, 2016 February 11, 2016 2.42 153,224 February 29, 2016 April 7, 2016
Dividends declared attributable to the Parent Company amounted to P=78.2 million and P=109.9 million in 2018 and 2017, respectively.
The associate has no contingent liabilities or capital commitments as of September 30, 2018 and 2017.
Summarized financial information of HP Co. are as follows: 2018 2017 Current assets P=743,060 P=1,000,976 Noncurrent assets 1,360,903 1,388,505 Current liabilities (887,343) (1,044,500) Noncurrent liabilities (324,419) (406,395) Net assets 892,201 938,586 Revenue 2,314,515 2,136,579 Net income 100,520 150,314 Other comprehensive income - remeasurement loss on retirement benefit
obligation 283 86
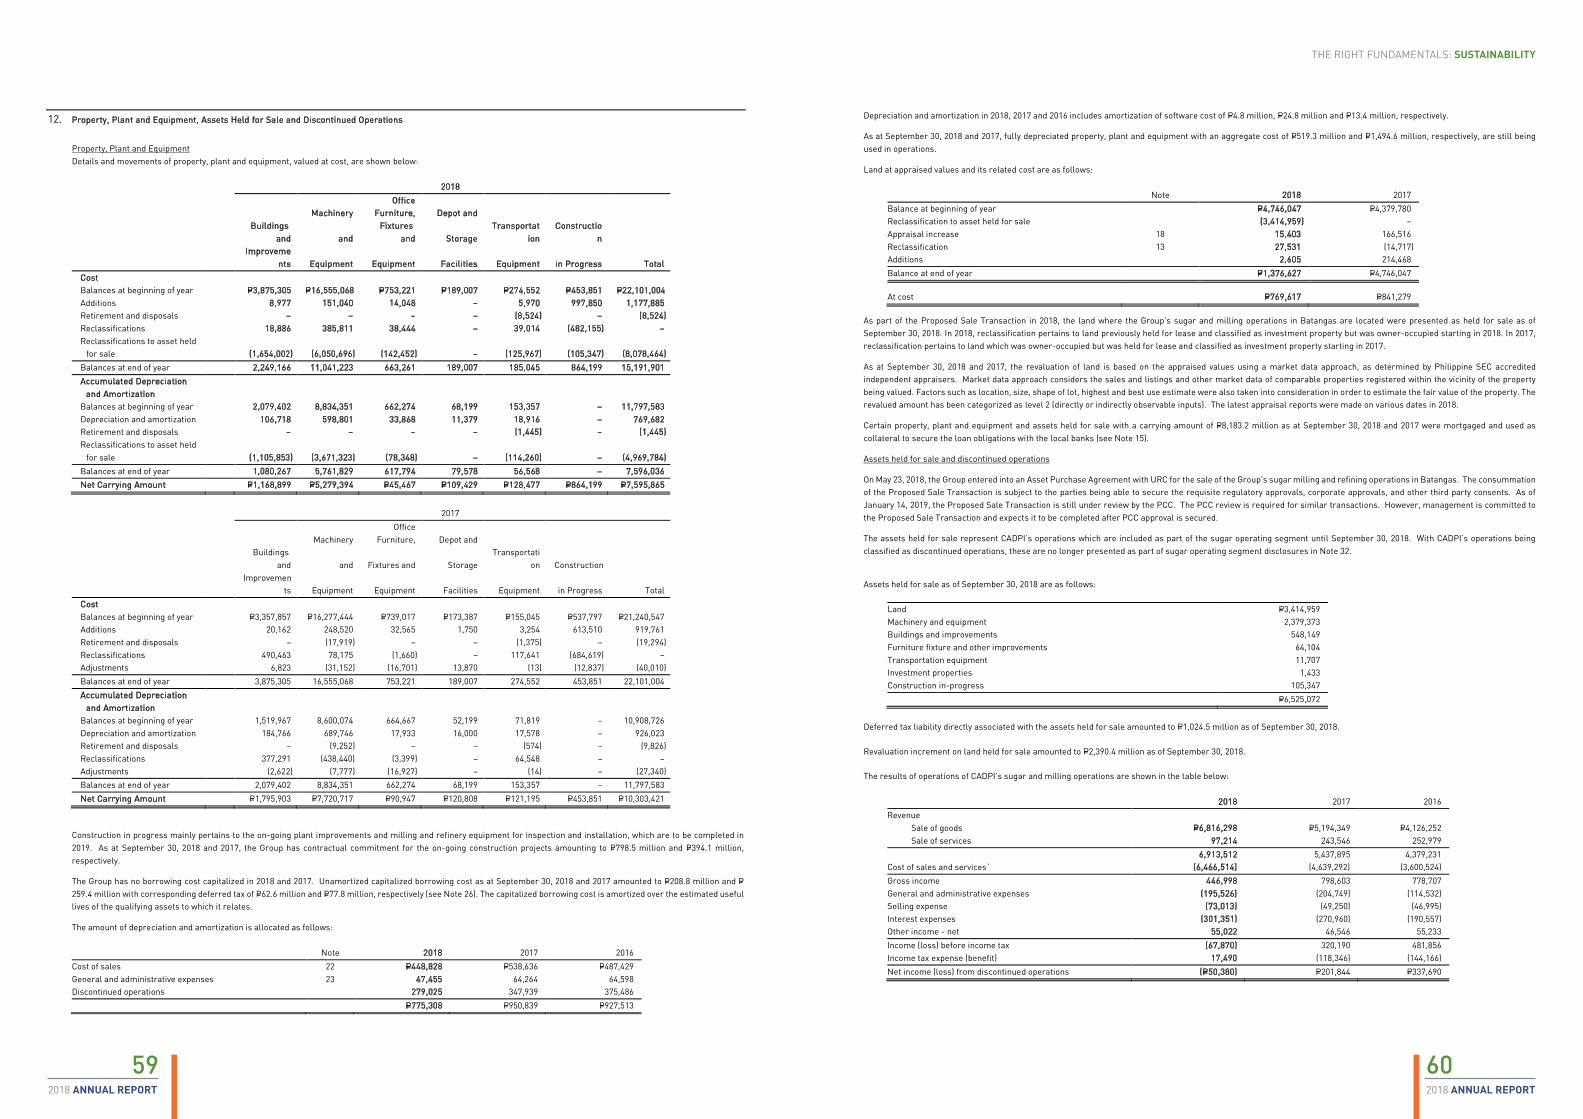
60592018 ANNUAL REPORT2018 ANNUAL REPORT
THE RIGHT FUNDAMENTALS: SUSTAINABILITY
12. Property, Plant and Equipment, Assets Held for Sale and Discontinued Operations
Property, Plant and Equipment Details and movements of property, plant and equipment, valued at cost, are shown below:
2018
Machinery Office
Furniture, Depot and
Buildings
and and Fixtures
and Storage Transportat
ion Constructio
n
Improveme
nts Equipment Equipment Facilities Equipment in Progress Total Cost Balances at beginning of year P=3,875,305 P=16,555,068 P=753,221 P=189,007 P=274,552 P=453,851 P=22,101,004 Additions 8,977 151,040 14,048 – 5,970 997,850 1,177,885 Retirement and disposals – – – – (8,524) – (8,524) Reclassifications 18,886 385,811 38,444 – 39,014 (482,155) – Reclassifications to asset held
for sale (1,654,002) (6,050,696) (142,452) – (125,967) (105,347) (8,078,464) Balances at end of year 2,249,166 11,041,223 663,261 189,007 185,045 864,199 15,191,901 Accumulated Depreciation
and Amortization Balances at beginning of year 2,079,402 8,834,351 662,274 68,199 153,357 – 11,797,583 Depreciation and amortization 106,718 598,801 33,868 11,379 18,916 – 769,682 Retirement and disposals – – – – (1,445) – (1,445) Reclassifications to asset held
for sale (1,105,853) (3,671,323) (78,348) – (114,260) – (4,969,784) Balances at end of year 1,080,267 5,761,829 617,794 79,578 56,568 – 7,596,036 Net Carrying Amount P=1,168,899 P=5,279,394 P=45,467 P=109,429 P=128,477 P=864,199 P=7,595,865
2017
Machinery Office
Furniture, Depot and
Buildings
and and Fixtures and Storage Transportati
on Construction
Improvemen
ts Equipment Equipment Facilities Equipment in Progress Total Cost Balances at beginning of year P=3,357,857 P=16,277,444 P=739,017 P=173,387 P=155,045 P=537,797 P=21,240,547 Additions 20,162 248,520 32,565 1,750 3,254 613,510 919,761 Retirement and disposals – (17,919) – – (1,375) – (19,294) Reclassifications 490,463 78,175 (1,660) – 117,641 (684,619) – Adjustments 6,823 (31,152) (16,701) 13,870 (13) (12,837) (40,010) Balances at end of year 3,875,305 16,555,068 753,221 189,007 274,552 453,851 22,101,004 Accumulated Depreciation
and Amortization Balances at beginning of year 1,519,967 8,600,074 664,667 52,199 71,819 – 10,908,726 Depreciation and amortization 184,766 689,746 17,933 16,000 17,578 – 926,023 Retirement and disposals – (9,252) – – (574) – (9,826) Reclassifications 377,291 (438,440) (3,399) – 64,548 – – Adjustments (2,622) (7,777) (16,927) – (14) – (27,340) Balances at end of year 2,079,402 8,834,351 662,274 68,199 153,357 – 11,797,583 Net Carrying Amount P=1,795,903 P=7,720,717 P=90,947 P=120,808 P=121,195 P=453,851 P=10,303,421
Construction in progress mainly pertains to the on-going plant improvements and milling and refinery equipment for inspection and installation, which are to be completed in 2019. As at September 30, 2018 and 2017, the Group has contractual commitment for the on-going construction projects amounting to P=798.5 million and P=394.1 million, respectively.
The Group has no borrowing cost capitalized in 2018 and 2017. Unamortized capitalized borrowing cost as at September 30, 2018 and 2017 amounted to P=208.8 million and P=259.4 million with corresponding deferred tax of P=62.6 million and P=77.8 million, respectively (see Note 26). The capitalized borrowing cost is amortized over the estimated useful lives of the qualifying assets to which it relates.
The amount of depreciation and amortization is allocated as follows: Note 2018 2017 2016 Cost of sales 22 P=448,828 P=538,636 P=487,429 General and administrative expenses 23 47,455 64,264 64,598 Discontinued operations 279,025 347,939 375,486 P=775,308 P=950,839 P=927,513
Depreciation and amortization in 2018, 2017 and 2016 includes amortization of software cost of P=4.8 million, P=24.8 million and P=13.4 million, respectively.
As at September 30, 2018 and 2017, fully depreciated property, plant and equipment with an aggregate cost of P=519.3 million and P=1,494.6 million, respectively, are still being used in operations.
Land at appraised values and its related cost are as follows:
Note 2018 2017 Balance at beginning of year P=4,746,047 P=4,379,780 Reclassification to asset held for sale (3,414,959) – Appraisal increase 18 15,403 166,516 Reclassification 13 27,531 (14,717) Additions 2,605 214,468 Balance at end of year P=1,376,627 P=4,746,047
At cost P=769,617 P=841,279
As part of the Proposed Sale Transaction in 2018, the land where the Group’s sugar and milling operations in Batangas are located were presented as held for sale as of September 30, 2018. In 2018, reclassification pertains to land previously held for lease and classified as investment property but was owner-occupied starting in 2018. In 2017, reclassification pertains to land which was owner-occupied but was held for lease and classified as investment property starting in 2017.
As at September 30, 2018 and 2017, the revaluation of land is based on the appraised values using a market data approach, as determined by Philippine SEC accredited independent appraisers. Market data approach considers the sales and listings and other market data of comparable properties registered within the vicinity of the property being valued. Factors such as location, size, shape of lot, highest and best use estimate were also taken into consideration in order to estimate the fair value of the property. The revalued amount has been categorized as level 2 (directly or indirectly observable inputs). The latest appraisal reports were made on various dates in 2018.
Certain property, plant and equipment and assets held for sale with a carrying amount of P=8,183.2 million as at September 30, 2018 and 2017 were mortgaged and used as collateral to secure the loan obligations with the local banks (see Note 15).
Assets held for sale and discontinued operations
On May 23, 2018, the Group entered into an Asset Purchase Agreement with URC for the sale of the Group’s sugar milling and refining operations in Batangas. The consummation of the Proposed Sale Transaction is subject to the parties being able to secure the requisite regulatory approvals, corporate approvals, and other third party consents. As of January 14, 2019, the Proposed Sale Transaction is still under review by the PCC. The PCC review is required for similar transactions. However, management is committed to the Proposed Sale Transaction and expects it to be completed after PCC approval is secured.
The assets held for sale represent CADPI’s operations which are included as part of the sugar operating segment until September 30, 2018. With CADPI’s operations being classified as discontinued operations, these are no longer presented as part of sugar operating segment disclosures in Note 32.
Assets held for sale as of September 30, 2018 are as follows:
Land P=3,414,959 Machinery and equipment 2,379,373 Buildings and improvements 548,149 Furniture fixture and other improvements 64,104 Transportation equipment 11,707 Investment properties 1,433 Construction in-progress 105,347 P=6,525,072
Deferred tax liability directly associated with the assets held for sale amounted to P=1,024.5 million as of September 30, 2018.
Revaluation increment on land held for sale amounted to P=2,390.4 million as of September 30, 2018.
The results of operations of CADPI’s sugar and milling operations are shown in the table below:
2018 2017 2016 Revenue Sale of goods P=6,816,298 P=5,194,349 P=4,126,252 Sale of services 97,214 243,546 252,979 6,913,512 5,437,895 4,379,231 Cost of sales and services` (6,466,514) (4,639,292) (3,600,524) Gross income 446,998 798,603 778,707 General and administrative expenses (195,526) (204,749) (114,532) Selling expense (73,013) (49,250) (46,995) Interest expenses (301,351) (270,960) (190,557) Other income - net 55,022 46,546 55,233 Income (loss) before income tax (67,870) 320,190 481,856 Income tax expense (benefit) 17,490 (118,346) (144,166) Net income (loss) from discontinued operations (P=50,380) P=201,844 P=337,690
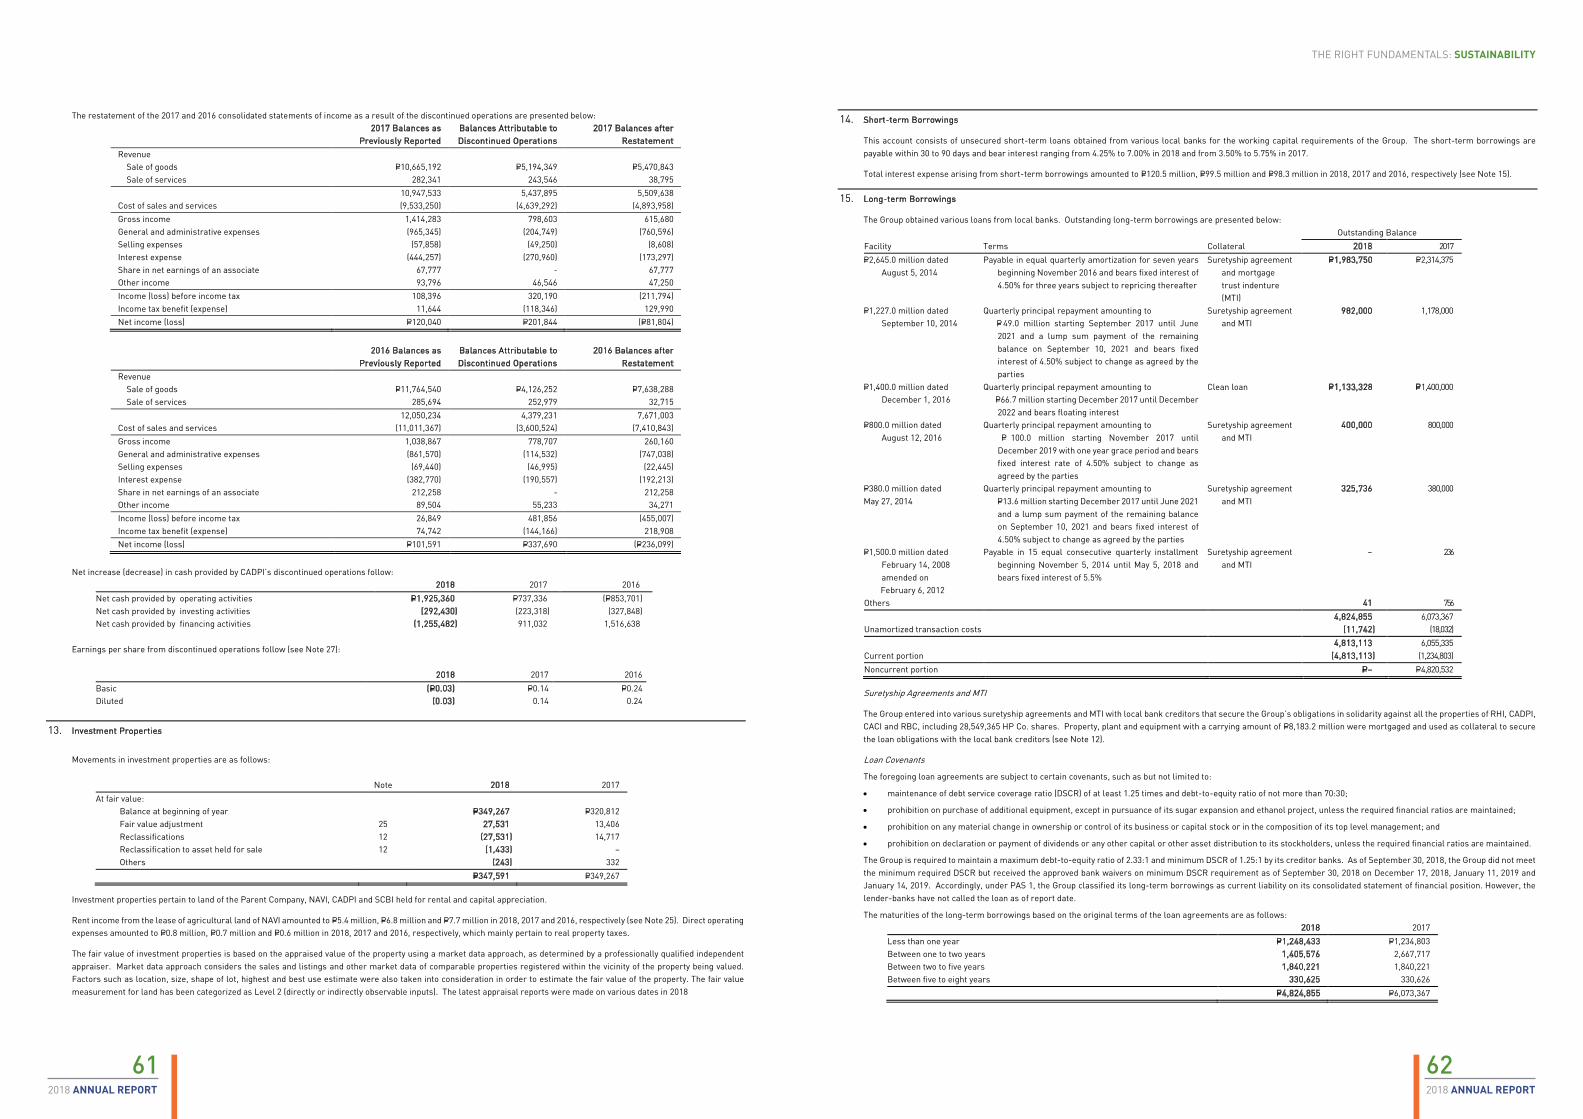
62612018 ANNUAL REPORT2018 ANNUAL REPORT
THE RIGHT FUNDAMENTALS: SUSTAINABILITY
The restatement of the 2017 and 2016 consolidated statements of income as a result of the discontinued operations are presented below:
2017 Balances as Previously Reported
Balances Attributable to Discontinued Operations
2017 Balances after Restatement
Revenue Sale of goods P=10,665,192 P=5,194,349 P=5,470,843 Sale of services 282,341 243,546 38,795
10,947,533 5,437,895 5,509,638 Cost of sales and services (9,533,250) (4,639,292) (4,893,958) Gross income 1,414,283 798,603 615,680 General and administrative expenses (965,345) (204,749) (760,596) Selling expenses (57,858) (49,250) (8,608) Interest expense (444,257) (270,960) (173,297) Share in net earnings of an associate 67,777 - 67,777 Other income 93,796 46,546 47,250 Income (loss) before income tax 108,396 320,190 (211,794) Income tax benefit (expense) 11,644 (118,346) 129,990 Net income (loss) P=120,040 P=201,844 (P=81,804)
2016 Balances as Previously Reported
Balances Attributable to Discontinued Operations
2016 Balances after Restatement
Revenue Sale of goods P=11,764,540 P=4,126,252 P=7,638,288 Sale of services 285,694 252,979 32,715
12,050,234 4,379,231 7,671,003 Cost of sales and services (11,011,367) (3,600,524) (7,410,843) Gross income 1,038,867 778,707 260,160 General and administrative expenses (861,570) (114,532) (747,038) Selling expenses (69,440) (46,995) (22,445) Interest expense (382,770) (190,557) (192,213) Share in net earnings of an associate 212,258 - 212,258 Other income 89,504 55,233 34,271 Income (loss) before income tax 26,849 481,856 (455,007) Income tax benefit (expense) 74,742 (144,166) 218,908 Net income (loss) P=101,591 P=337,690 (P=236,099)
Net increase (decrease) in cash provided by CADPI’s discontinued operations follow: 2018 2017 2016 Net cash provided by operating activities P=1,925,360 P=737,336 (P=853,701) Net cash provided by investing activities (292,430) (223,318) (327,848) Net cash provided by financing activities (1,255,482) 911,032 1,516,638
Earnings per share from discontinued operations follow (see Note 27):
2018 2017 2016
Basic (P=0.03) P=0.14 P=0.24 Diluted (0.03) 0.14 0.24
13. Investment Properties
Movements in investment properties are as follows:
Note 2018 2017 At fair value: Balance at beginning of year P=349,267 P=320,812 Fair value adjustment 25 27,531 13,406 Reclassifications 12 (27,531) 14,717 Reclassification to asset held for sale 12 (1,433) – Others (243) 332 P=347,591 P=349,267
Investment properties pertain to land of the Parent Company, NAVI, CADPI and SCBI held for rental and capital appreciation.
Rent income from the lease of agricultural land of NAVI amounted to P=5.4 million, P=6.8 million and P=7.7 million in 2018, 2017 and 2016, respectively (see Note 25). Direct operating expenses amounted to P=0.8 million, P=0.7 million and P=0.6 million in 2018, 2017 and 2016, respectively, which mainly pertain to real property taxes.
The fair value of investment properties is based on the appraised value of the property using a market data approach, as determined by a professionally qualified independent appraiser. Market data approach considers the sales and listings and other market data of comparable properties registered within the vicinity of the property being valued. Factors such as location, size, shape of lot, highest and best use estimate were also taken into consideration in order to estimate the fair value of the property. The fair value measurement for land has been categorized as Level 2 (directly or indirectly observable inputs). The latest appraisal reports were made on various dates in 2018
14. Short-term Borrowings
This account consists of unsecured short-term loans obtained from various local banks for the working capital requirements of the Group. The short-term borrowings are payable within 30 to 90 days and bear interest ranging from 4.25% to 7.00% in 2018 and from 3.50% to 5.75% in 2017.
Total interest expense arising from short-term borrowings amounted to P=120.5 million, P=99.5 million and P=98.3 million in 2018, 2017 and 2016, respectively (see Note 15).
15. Long-term Borrowings
The Group obtained various loans from local banks. Outstanding long-term borrowings are presented below: Outstanding Balance Facility Terms Collateral 2018 2017 P=2,645.0 million dated
August 5, 2014 Payable in equal quarterly amortization for seven years
beginning November 2016 and bears fixed interest of 4.50% for three years subject to repricing thereafter
Suretyship agreement and mortgage trust indenture (MTI)
P=1,983,750 P=2,314,375
P=1,227.0 million dated September 10, 2014
Quarterly principal repayment amounting to P= 49.0 million starting September 2017 until June 2021 and a lump sum payment of the remaining balance on September 10, 2021 and bears fixed interest of 4.50% subject to change as agreed by the parties
Suretyship agreement and MTI
982,000 1,178,000
P=1,400.0 million dated December 1, 2016
Quarterly principal repayment amounting to P=66.7 million starting December 2017 until December 2022 and bears floating interest
Clean loan P=1,133,328 P=1,400,000
P=800.0 million dated August 12, 2016
Quarterly principal repayment amounting to P= 100.0 million starting November 2017 until December 2019 with one year grace period and bears fixed interest rate of 4.50% subject to change as agreed by the parties
Suretyship agreement and MTI
400,000 800,000
P=380.0 million dated May 27, 2014
Quarterly principal repayment amounting to P=13.6 million starting December 2017 until June 2021 and a lump sum payment of the remaining balance on September 10, 2021 and bears fixed interest of 4.50% subject to change as agreed by the parties
Suretyship agreement and MTI
325,736 380,000
P=1,500.0 million dated February 14, 2008 amended on
February 6, 2012
Payable in 15 equal consecutive quarterly installment beginning November 5, 2014 until May 5, 2018 and bears fixed interest of 5.5%
Suretyship agreement and MTI
– 236
Others 41 756 4,824,855 6,073,367
Unamortized transaction costs (11,742) (18,032) 4,813,113 6,055,335 Current portion (4,813,113) (1,234,803) Noncurrent portion P=– P=4,820,532
Suretyship Agreements and MTI
The Group entered into various suretyship agreements and MTI with local bank creditors that secure the Group’s obligations in solidarity against all the properties of RHI, CADPI, CACI and RBC, including 28,549,365 HP Co. shares. Property, plant and equipment with a carrying amount of P=8,183.2 million were mortgaged and used as collateral to secure the loan obligations with the local bank creditors (see Note 12).
Loan Covenants
The foregoing loan agreements are subject to certain covenants, such as but not limited to:
• maintenance of debt service coverage ratio (DSCR) of at least 1.25 times and debt-to-equity ratio of not more than 70:30;
• prohibition on purchase of additional equipment, except in pursuance of its sugar expansion and ethanol project, unless the required financial ratios are maintained;
• prohibition on any material change in ownership or control of its business or capital stock or in the composition of its top level management; and
• prohibition on declaration or payment of dividends or any other capital or other asset distribution to its stockholders, unless the required financial ratios are maintained.
The Group is required to maintain a maximum debt-to-equity ratio of 2.33:1 and minimum DSCR of 1.25:1 by its creditor banks. As of September 30, 2018, the Group did not meet the minimum required DSCR but received the approved bank waivers on minimum DSCR requirement as of September 30, 2018 on December 17, 2018, January 11, 2019 and January 14, 2019. Accordingly, under PAS 1, the Group classified its long-term borrowings as current liability on its consolidated statement of financial position. However, the lender-banks have not called the loan as of report date.
The maturities of the long-term borrowings based on the original terms of the loan agreements are as follows: 2018 2017 Less than one year P=1,248,433 P=1,234,803 Between one to two years 1,405,576 2,667,717 Between two to five years 1,840,221 1,840,221 Between five to eight years 330,625 330,626 P=4,824,855 P=6,073,367
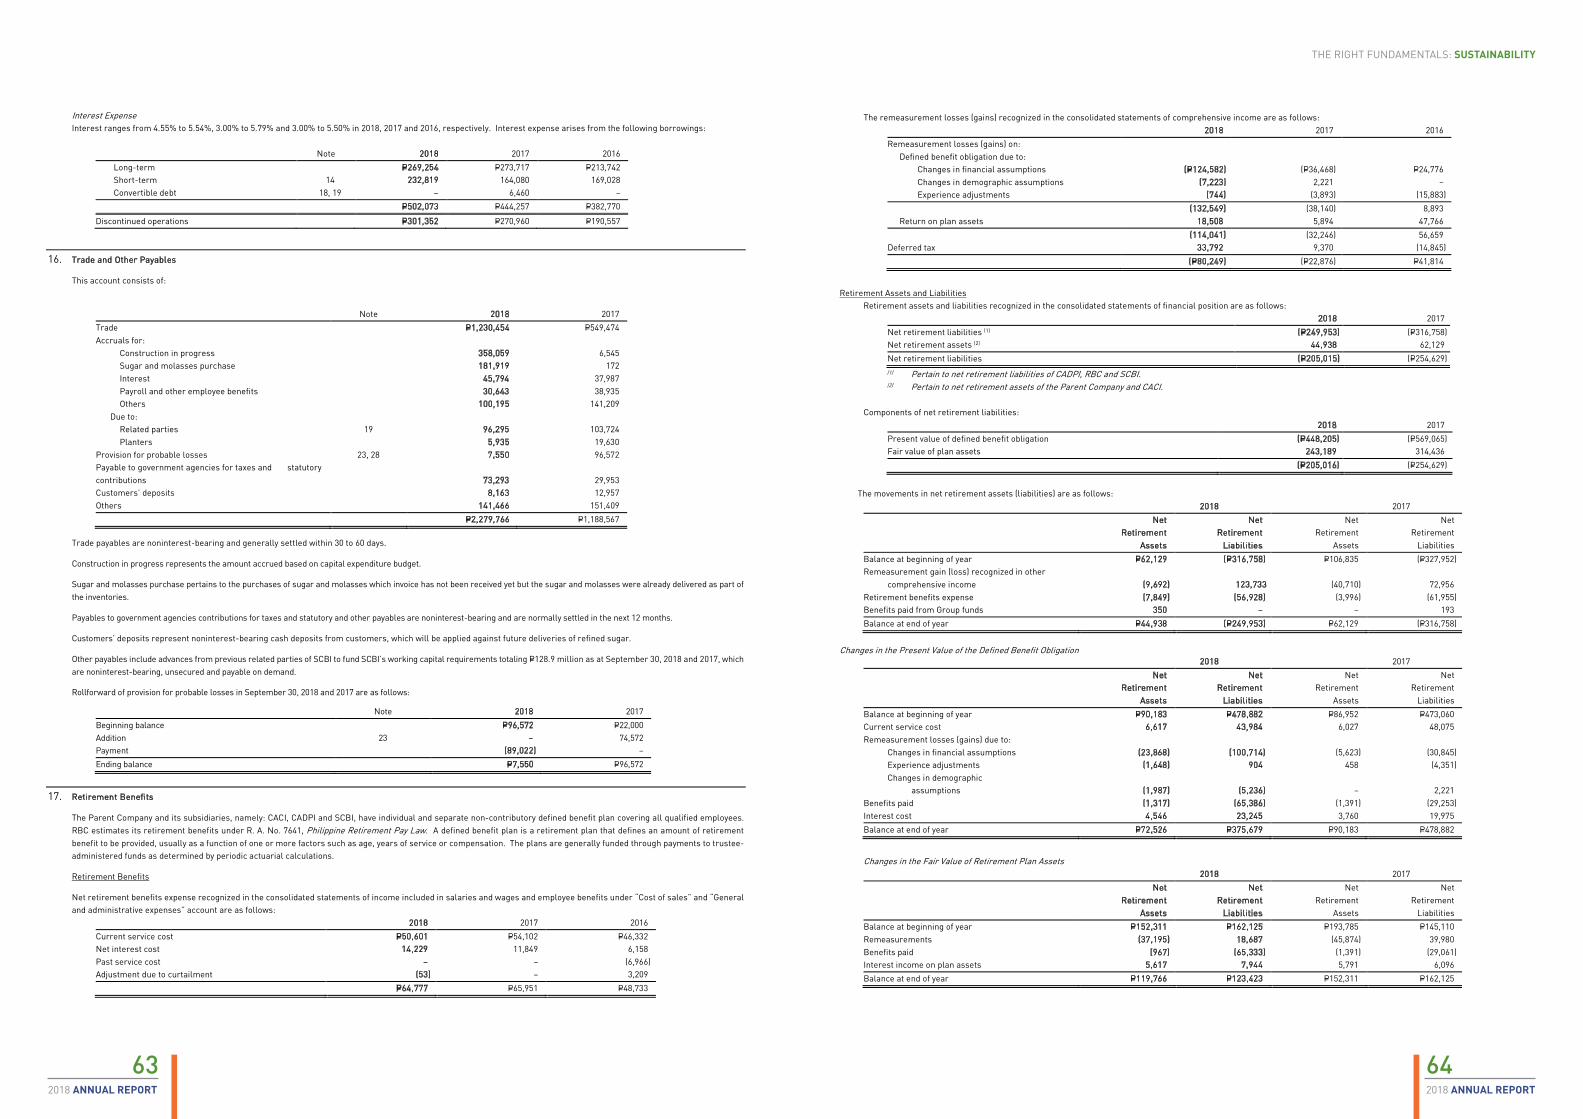
64632018 ANNUAL REPORT2018 ANNUAL REPORT
THE RIGHT FUNDAMENTALS: SUSTAINABILITY
Interest Expense Interest ranges from 4.55% to 5.54%, 3.00% to 5.79% and 3.00% to 5.50% in 2018, 2017 and 2016, respectively. Interest expense arises from the following borrowings:
Note 2018 2017 2016 Long-term P=269,254 P=273,717 P=213,742 Short-term 14 232,819 164,080 169,028 Convertible debt 18, 19 – 6,460 –
P=502,073 P=444,257 P=382,770
Discontinued operations P=301,352 P=270,960 P=190,557
16. Trade and Other Payables
This account consists of:
Note 2018 2017 Trade P=1,230,454 P=549,474 Accruals for: Construction in progress 358,059 6,545 Sugar and molasses purchase 181,919 172 Interest 45,794 37,987 Payroll and other employee benefits 30,643 38,935 Others 100,195 141,209
Due to: Related parties 19 96,295 103,724 Planters 5,935 19,630 Provision for probable losses 23, 28 7,550 96,572 Payable to government agencies for taxes and statutory contributions 73,293 29,953 Customers’ deposits 8,163 12,957 Others 141,466 151,409 P=2,279,766 P=1,188,567
Trade payables are noninterest-bearing and generally settled within 30 to 60 days.
Construction in progress represents the amount accrued based on capital expenditure budget.
Sugar and molasses purchase pertains to the purchases of sugar and molasses which invoice has not been received yet but the sugar and molasses were already delivered as part of the inventories.
Payables to government agencies contributions for taxes and statutory and other payables are noninterest-bearing and are normally settled in the next 12 months.
Customers’ deposits represent noninterest-bearing cash deposits from customers, which will be applied against future deliveries of refined sugar.
Other payables include advances from previous related parties of SCBI to fund SCBI’s working capital requirements totaling P=128.9 million as at September 30, 2018 and 2017, which are noninterest-bearing, unsecured and payable on demand.
Rollforward of provision for probable losses in September 30, 2018 and 2017 are as follows:
Note 2018 2017 Beginning balance P=96,572 P=22,000 Addition 23 – 74,572 Payment (89,022) – Ending balance P=7,550 P=96,572
17. Retirement Benefits
The Parent Company and its subsidiaries, namely: CACI, CADPI and SCBI, have individual and separate non-contributory defined benefit plan covering all qualified employees. RBC estimates its retirement benefits under R. A. No. 7641, Philippine Retirement Pay Law. A defined benefit plan is a retirement plan that defines an amount of retirement benefit to be provided, usually as a function of one or more factors such as age, years of service or compensation. The plans are generally funded through payments to trustee-administered funds as determined by periodic actuarial calculations.
Retirement Benefits
Net retirement benefits expense recognized in the consolidated statements of income included in salaries and wages and employee benefits under “Cost of sales” and “General and administrative expenses” account are as follows:
2018 2017 2016 Current service cost P=50,601 P=54,102 P=46,332 Net interest cost 14,229 11,849 6,158 Past service cost – – (6,966) Adjustment due to curtailment (53) – 3,209 P=64,777 P=65,951 P=48,733
The remeasurement losses (gains) recognized in the consolidated statements of comprehensive income are as follows: 2018 2017 2016 Remeasurement losses (gains) on:
Defined benefit obligation due to: Changes in financial assumptions (P=124,582) (P=36,468) P=24,776 Changes in demographic assumptions (7,223) 2,221 – Experience adjustments (744) (3,893) (15,883)
(132,549) (38,140) 8,893 Return on plan assets 18,508 5,894 47,766
(114,041) (32,246) 56,659 Deferred tax 33,792 9,370 (14,845) (P=80,249) (P=22,876) P=41,814
Retirement Assets and Liabilities Retirement assets and liabilities recognized in the consolidated statements of financial position are as follows:
2018 2017 Net retirement liabilities (1) (P=249,953) (P=316,758) Net retirement assets (2) 44,938 62,129 Net retirement liabilities (P=205,015) (P=254,629) (1) Pertain to net retirement liabilities of CADPI, RBC and SCBI. (2) Pertain to net retirement assets of the Parent Company and CACI.
Components of net retirement liabilities:
2018 2017 Present value of defined benefit obligation (P=448,205) (P=569,065) Fair value of plan assets 243,189 314,436 (P=205,016) (P=254,629)
The movements in net retirement assets (liabilities) are as follows:
2018 2017
Net Retirement
Assets
Net Retirement
Liabilities
Net Retirement
Assets
Net Retirement
Liabilities Balance at beginning of year P=62,129 (P=316,758) P=106,835 (P=327,952) Remeasurement gain (loss) recognized in other
comprehensive income (9,692) 123,733 (40,710) 72,956 Retirement benefits expense (7,849) (56,928) (3,996) (61,955) Benefits paid from Group funds 350 – – 193 Balance at end of year P=44,938 (P=249,953) P=62,129 (P=316,758)
Changes in the Present Value of the Defined Benefit Obligation
2018 2017
Net Retirement
Assets
Net Retirement
Liabilities
Net Retirement
Assets
Net Retirement
Liabilities Balance at beginning of year P=90,183 P=478,882 P=86,952 P=473,060 Current service cost 6,617 43,984 6,027 48,075 Remeasurement losses (gains) due to: Changes in financial assumptions (23,868) (100,714) (5,623) (30,845) Experience adjustments (1,648) 904 458 (4,351) Changes in demographic assumptions (1,987) (5,236) – 2,221 Benefits paid (1,317) (65,386) (1,391) (29,253) Interest cost 4,546 23,245 3,760 19,975 Balance at end of year P=72,526 P=375,679 P=90,183 P=478,882
Changes in the Fair Value of Retirement Plan Assets 2018 2017
Net Retirement
Assets
Net Retirement
Liabilities
Net Retirement
Assets
Net Retirement
Liabilities Balance at beginning of year P=152,311 P=162,125 P=193,785 P=145,110 Remeasurements (37,195) 18,687 (45,874) 39,980 Benefits paid (967) (65,333) (1,391) (29,061) Interest income on plan assets 5,617 7,944 5,791 6,096 Balance at end of year P=119,766 P=123,423 P=152,311 P=162,125
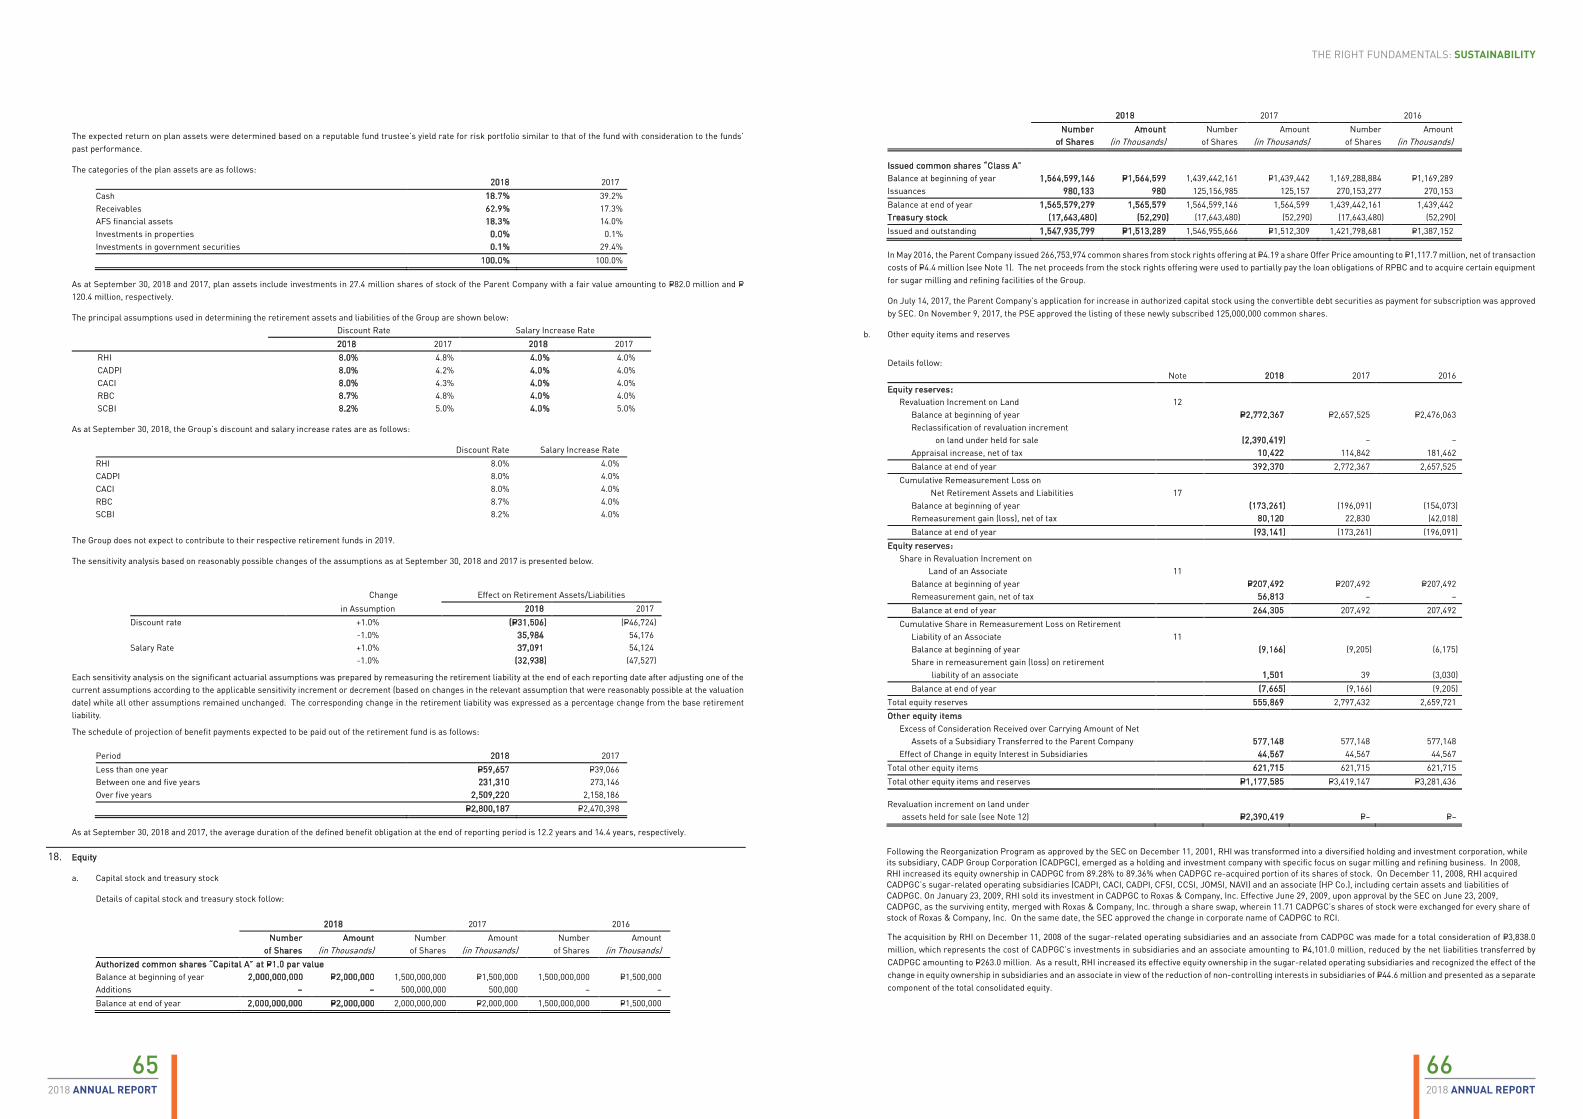
66652018 ANNUAL REPORT2018 ANNUAL REPORT
THE RIGHT FUNDAMENTALS: SUSTAINABILITY
The expected return on plan assets were determined based on a reputable fund trustee’s yield rate for risk portfolio similar to that of the fund with consideration to the funds’ past performance.
The categories of the plan assets are as follows: 2018 2017 Cash 18.7% 39.2% Receivables 62.9% 17.3% AFS financial assets 18.3% 14.0% Investments in properties 0.0% 0.1% Investments in government securities 0.1% 29.4% 100.0% 100.0%
As at September 30, 2018 and 2017, plan assets include investments in 27.4 million shares of stock of the Parent Company with a fair value amounting to P=82.0 million and P=120.4 million, respectively.
The principal assumptions used in determining the retirement assets and liabilities of the Group are shown below: Discount Rate Salary Increase Rate 2018 2017 2018 2017 RHI 8.0% 4.8% 4.0% 4.0% CADPI 8.0% 4.2% 4.0% 4.0% CACI 8.0% 4.3% 4.0% 4.0% RBC 8.7% 4.8% 4.0% 4.0% SCBI 8.2% 5.0% 4.0% 5.0%
As at September 30, 2018, the Group’s discount and salary increase rates are as follows:
Discount Rate Salary Increase Rate RHI 8.0% 4.0% CADPI 8.0% 4.0% CACI 8.0% 4.0% RBC 8.7% 4.0% SCBI 8.2% 4.0%
The Group does not expect to contribute to their respective retirement funds in 2019.
The sensitivity analysis based on reasonably possible changes of the assumptions as at September 30, 2018 and 2017 is presented below.
Change Effect on Retirement Assets/Liabilities in Assumption 2018 2017 Discount rate +1.0% (P=31,506) (P=46,724) -1.0% 35,984 54,176 Salary Rate +1.0% 37,091 54,124 -1.0% (32,938) (47,527)
Each sensitivity analysis on the significant actuarial assumptions was prepared by remeasuring the retirement liability at the end of each reporting date after adjusting one of the current assumptions according to the applicable sensitivity increment or decrement (based on changes in the relevant assumption that were reasonably possible at the valuation date) while all other assumptions remained unchanged. The corresponding change in the retirement liability was expressed as a percentage change from the base retirement liability.
The schedule of projection of benefit payments expected to be paid out of the retirement fund is as follows:
Period 2018 2017 Less than one year P=59,657 P=39,066 Between one and five years 231,310 273,146 Over five years 2,509,220 2,158,186 P=2,800,187 P=2,470,398
As at September 30, 2018 and 2017, the average duration of the defined benefit obligation at the end of reporting period is 12.2 years and 14.4 years, respectively.
18. Equity
a. Capital stock and treasury stock
Details of capital stock and treasury stock follow:
2018 2017 2016
Number
of Shares Amount
(in Thousands) Number
of Shares Amount
(in Thousands) Number
of Shares Amount
(in Thousands) Authorized common shares “Capital A” at P=1.0 par value Balance at beginning of year 2,000,000,000 P=2,000,000 1,500,000,000 P=1,500,000 1,500,000,000 P=1,500,000 Additions – – 500,000,000 500,000 – – Balance at end of year 2,000,000,000 P=2,000,000 2,000,000,000 P=2,000,000 1,500,000,000 P=1,500,000
2018 2017 2016
Number
of Shares Amount
(in Thousands) Number
of Shares Amount
(in Thousands) Number
of Shares Amount
(in Thousands)
Issued common shares “Class A” Balance at beginning of year 1,564,599,146 P=1,564,599 1,439,442,161 P=1,439,442 1,169,288,884 P=1,169,289 Issuances 980,133 980 125,156,985 125,157 270,153,277 270,153 Balance at end of year 1,565,579,279 1,565,579 1,564,599,146 1,564,599 1,439,442,161 1,439,442 Treasury stock (17,643,480) (52,290) (17,643,480) (52,290) (17,643,480) (52,290) Issued and outstanding 1,547,935,799 P=1,513,289 1,546,955,666 P=1,512,309 1,421,798,681 P=1,387,152
In May 2016, the Parent Company issued 266,753,974 common shares from stock rights offering at P=4.19 a share Offer Price amounting to P=1,117.7 million, net of transaction costs of P=4.4 million (see Note 1). The net proceeds from the stock rights offering were used to partially pay the loan obligations of RPBC and to acquire certain equipment for sugar milling and refining facilities of the Group.
On July 14, 2017, the Parent Company’s application for increase in authorized capital stock using the convertible debt securities as payment for subscription was approved by SEC. On November 9, 2017, the PSE approved the listing of these newly subscribed 125,000,000 common shares.
b. Other equity items and reserves
Details follow: Note 2018 2017 2016 Equity reserves:
Revaluation Increment on Land 12 Balance at beginning of year P=2,772,367 P=2,657,525 P=2,476,063 Reclassification of revaluation increment
on land under held for sale (2,390,419) – – Appraisal increase, net of tax 10,422 114,842 181,462 Balance at end of year 392,370 2,772,367 2,657,525
Cumulative Remeasurement Loss on Net Retirement Assets and Liabilities 17 Balance at beginning of year (173,261) (196,091) (154,073) Remeasurement gain (loss), net of tax 80,120 22,830 (42,018) Balance at end of year (93,141) (173,261) (196,091)
Equity reserves: Share in Revaluation Increment on
Land of an Associate 11 Balance at beginning of year P=207,492 P=207,492 P=207,492 Remeasurement gain, net of tax 56,813 – – Balance at end of year 264,305 207,492 207,492
Cumulative Share in Remeasurement Loss on Retirement Liability of an Associate 11 Balance at beginning of year (9,166) (9,205) (6,175) Share in remeasurement gain (loss) on retirement
liability of an associate 1,501 39 (3,030) Balance at end of year (7,665) (9,166) (9,205)
Total equity reserves 555,869 2,797,432 2,659,721 Other equity items
Excess of Consideration Received over Carrying Amount of Net Assets of a Subsidiary Transferred to the Parent Company 577,148 577,148 577,148
Effect of Change in equity Interest in Subsidiaries 44,567 44,567 44,567 Total other equity items 621,715 621,715 621,715 Total other equity items and reserves P=1,177,585 P=3,419,147 P=3,281,436
Revaluation increment on land under assets held for sale (see Note 12) P=2,390,419 P=– P=–
Following the Reorganization Program as approved by the SEC on December 11, 2001, RHI was transformed into a diversified holding and investment corporation, while its subsidiary, CADP Group Corporation (CADPGC), emerged as a holding and investment company with specific focus on sugar milling and refining business. In 2008, RHI increased its equity ownership in CADPGC from 89.28% to 89.36% when CADPGC re-acquired portion of its shares of stock. On December 11, 2008, RHI acquired CADPGC’s sugar-related operating subsidiaries (CADPI, CACI, CADPI, CFSI, CCSI, JOMSI, NAVI) and an associate (HP Co.), including certain assets and liabilities of CADPGC. On January 23, 2009, RHI sold its investment in CADPGC to Roxas & Company, Inc. Effective June 29, 2009, upon approval by the SEC on June 23, 2009, CADPGC, as the surviving entity, merged with Roxas & Company, Inc. through a share swap, wherein 11.71 CADPGC’s shares of stock were exchanged for every share of stock of Roxas & Company, Inc. On the same date, the SEC approved the change in corporate name of CADPGC to RCI.
The acquisition by RHI on December 11, 2008 of the sugar-related operating subsidiaries and an associate from CADPGC was made for a total consideration of P=3,838.0 million, which represents the cost of CADPGC’s investments in subsidiaries and an associate amounting to P=4,101.0 million, reduced by the net liabilities transferred by CADPGC amounting to P=263.0 million. As a result, RHI increased its effective equity ownership in the sugar-related operating subsidiaries and recognized the effect of the change in equity ownership in subsidiaries and an associate in view of the reduction of non-controlling interests in subsidiaries of P=44.6 million and presented as a separate component of the total consolidated equity.
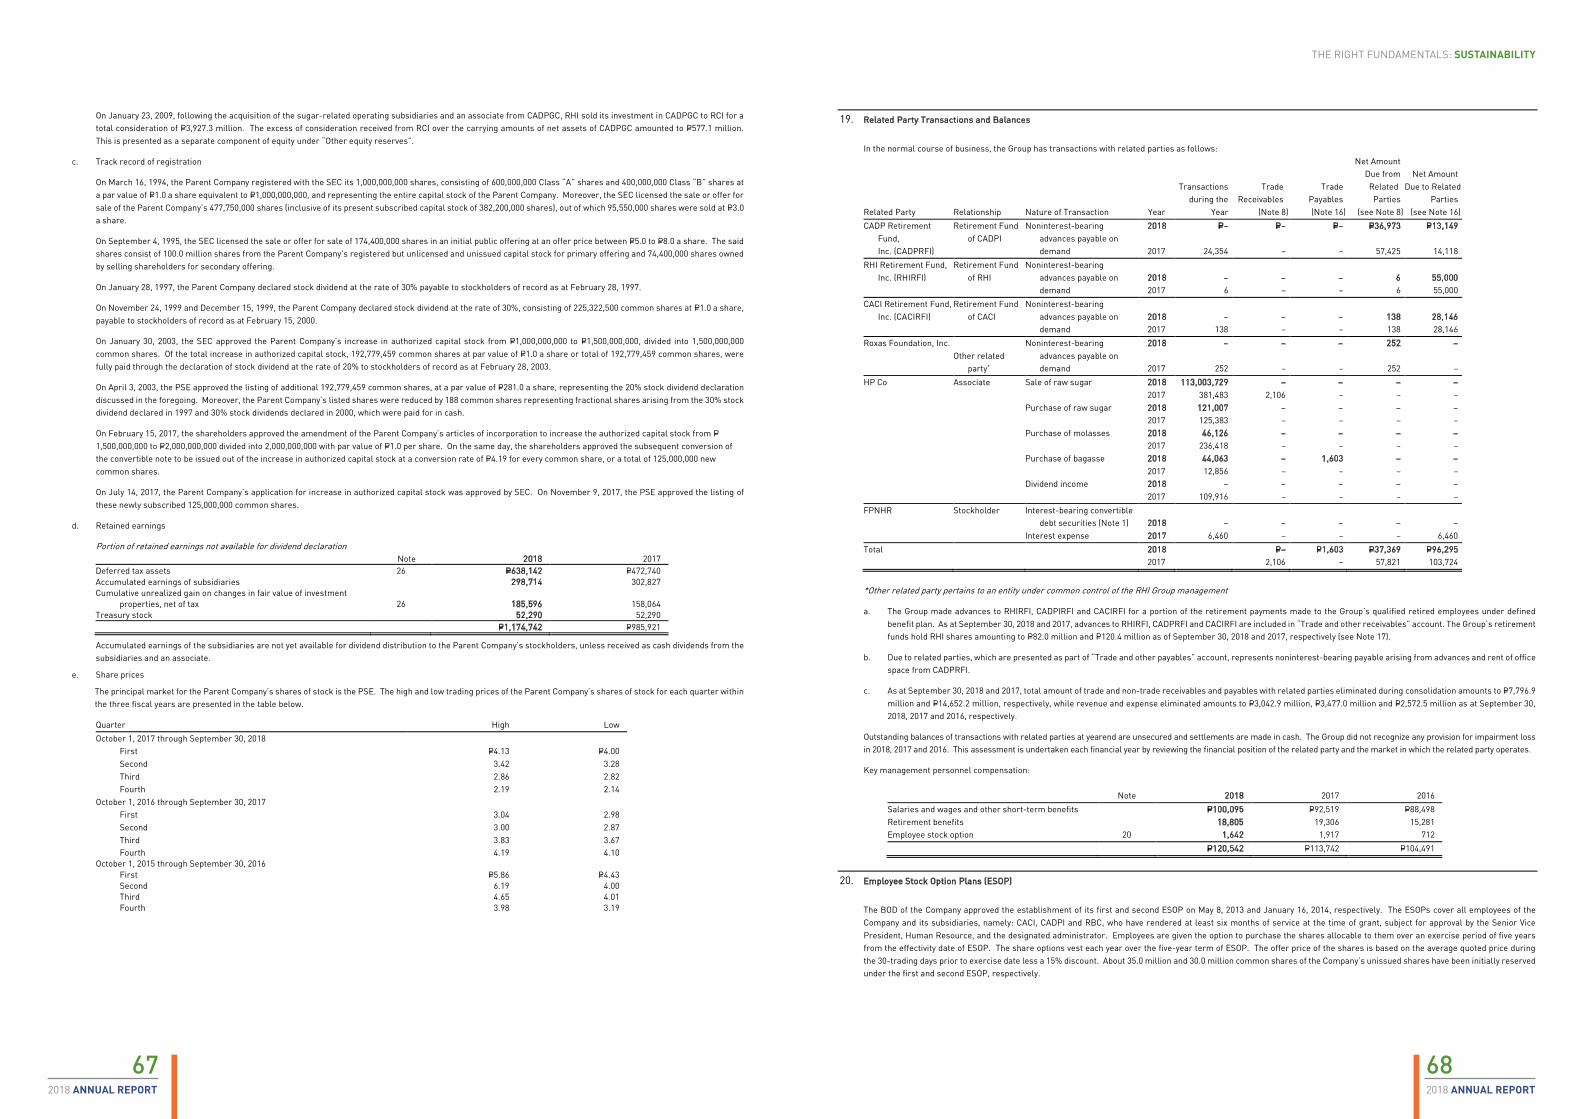
68672018 ANNUAL REPORT2018 ANNUAL REPORT
THE RIGHT FUNDAMENTALS: SUSTAINABILITY
On January 23, 2009, following the acquisition of the sugar-related operating subsidiaries and an associate from CADPGC, RHI sold its investment in CADPGC to RCI for a total consideration of P=3,927.3 million. The excess of consideration received from RCI over the carrying amounts of net assets of CADPGC amounted to P=577.1 million. This is presented as a separate component of equity under “Other equity reserves”.
c. Track record of registration
On March 16, 1994, the Parent Company registered with the SEC its 1,000,000,000 shares, consisting of 600,000,000 Class “A” shares and 400,000,000 Class “B” shares at a par value of P=1.0 a share equivalent to P=1,000,000,000, and representing the entire capital stock of the Parent Company. Moreover, the SEC licensed the sale or offer for sale of the Parent Company’s 477,750,000 shares (inclusive of its present subscribed capital stock of 382,200,000 shares), out of which 95,550,000 shares were sold at P=3.0 a share.
On September 4, 1995, the SEC licensed the sale or offer for sale of 174,400,000 shares in an initial public offering at an offer price between P=5.0 to P=8.0 a share. The said shares consist of 100.0 million shares from the Parent Company’s registered but unlicensed and unissued capital stock for primary offering and 74,400,000 shares owned by selling shareholders for secondary offering.
On January 28, 1997, the Parent Company declared stock dividend at the rate of 30% payable to stockholders of record as at February 28, 1997.
On November 24, 1999 and December 15, 1999, the Parent Company declared stock dividend at the rate of 30%, consisting of 225,322,500 common shares at P=1.0 a share, payable to stockholders of record as at February 15, 2000.
On January 30, 2003, the SEC approved the Parent Company’s increase in authorized capital stock from P=1,000,000,000 to P=1,500,000,000, divided into 1,500,000,000 common shares. Of the total increase in authorized capital stock, 192,779,459 common shares at par value of P=1.0 a share or total of 192,779,459 common shares, were fully paid through the declaration of stock dividend at the rate of 20% to stockholders of record as at February 28, 2003.
On April 3, 2003, the PSE approved the listing of additional 192,779,459 common shares, at a par value of P=281.0 a share, representing the 20% stock dividend declaration discussed in the foregoing. Moreover, the Parent Company’s listed shares were reduced by 188 common shares representing fractional shares arising from the 30% stock dividend declared in 1997 and 30% stock dividends declared in 2000, which were paid for in cash.
On February 15, 2017, the shareholders approved the amendment of the Parent Company’s articles of incorporation to increase the authorized capital stock from P=1,500,000,000 to P=2,000,000,000 divided into 2,000,000,000 with par value of P=1.0 per share. On the same day, the shareholders approved the subsequent conversion of the convertible note to be issued out of the increase in authorized capital stock at a conversion rate of P=4.19 for every common share, or a total of 125,000,000 new common shares.
On July 14, 2017, the Parent Company’s application for increase in authorized capital stock was approved by SEC. On November 9, 2017, the PSE approved the listing of these newly subscribed 125,000,000 common shares.
d. Retained earnings
Portion of retained earnings not available for dividend declaration Note 2018 2017 Deferred tax assets 26 P=638,142 P=472,740 Accumulated earnings of subsidiaries 298,714 302,827 Cumulative unrealized gain on changes in fair value of investment
properties, net of tax 26 185,596 158,064 Treasury stock 52,290 52,290 P=1,174,742 P=985,921
Accumulated earnings of the subsidiaries are not yet available for dividend distribution to the Parent Company’s stockholders, unless received as cash dividends from the subsidiaries and an associate.
e. Share prices
The principal market for the Parent Company’s shares of stock is the PSE. The high and low trading prices of the Parent Company’s shares of stock for each quarter within the three fiscal years are presented in the table below.
Quarter High Low October 1, 2017 through September 30, 2018 First P=4.13 P=4.00 Second 3.42 3.28 Third 2.86 2.82 Fourth 2.19 2.14 October 1, 2016 through September 30, 2017 First 3.04 2.98 Second 3.00 2.87 Third 3.83 3.67 Fourth 4.19 4.10 October 1, 2015 through September 30, 2016 First P=5.86 P=4.43 Second 6.19 4.00 Third 4.65 4.01 Fourth 3.98 3.19
19. Related Party Transactions and Balances
In the normal course of business, the Group has transactions with related parties as follows:
Related Party Relationship Nature of Transaction Year
Transactions during the
Year
Trade
Receivables (Note 8)
Trade Payables
(Note 16)
Net Amount Due from Related Parties
(see Note 8)
Net Amount Due to Related
Parties (see Note 16)
CADP Retirement Fund, Inc. (CADPRFI)
Retirement Fund of CADPI
Noninterest-bearing advances payable on demand
2018 P=− P=− P=− P=36,973 P=13,149
2017 24,354 − − 57,425 14,118 RHI Retirement Fund,
Inc. (RHIRFI) Retirement Fund
of RHI Noninterest-bearing
advances payable on demand
2018 − − − 6 55,000 2017 6 − − 6 55,000
CACI Retirement Fund, Inc. (CACIRFI)
Retirement Fund of CACI
Noninterest-bearing advances payable on demand
2018 − − − 138 28,146 2017 138 − − 138 28,146
Roxas Foundation, Inc. Other related
party*
Noninterest-bearing advances payable on demand
2018 − − − 252 −
2017 252 − − 252 − HP Co Associate Sale of raw sugar 2018 113,003,729 − − − − 2017 381,483 2,106 − − − Purchase of raw sugar 2018 121,007 − − − − 2017 125,383 − − − − Purchase of molasses 2018 46,126 − − − − 2017 236,418 − − − − Purchase of bagasse 2018 44,063 − 1,603 − − 2017 12,856 − − − − Dividend income 2018 − − − − − 2017 109,916 − − − − FPNHR Stockholder Interest-bearing convertible
debt securities (Note 1) 2018 − − − − − Interest expense 2017 6,460 − − – 6,460
Total 2018 P=− P=1,603 P=37,369 P=96,295 2017 2,106 − 57,821 103,724
*Other related party pertains to an entity under common control of the RHI Group management
a. The Group made advances to RHIRFI, CADPIRFI and CACIRFI for a portion of the retirement payments made to the Group’s qualified retired employees under defined benefit plan. As at September 30, 2018 and 2017, advances to RHIRFI, CADPRFI and CACIRFI are included in “Trade and other receivables” account. The Group’s retirement funds hold RHI shares amounting to P=82.0 million and P=120.4 million as of September 30, 2018 and 2017, respectively (see Note 17).
b. Due to related parties, which are presented as part of “Trade and other payables” account, represents noninterest-bearing payable arising from advances and rent of office space from CADPRFI.
c. As at September 30, 2018 and 2017, total amount of trade and non-trade receivables and payables with related parties eliminated during consolidation amounts to P=7,796.9 million and P=14,652.2 million, respectively, while revenue and expense eliminated amounts to P=3,042.9 million, P=3,477.0 million and P=2,572.5 million as at September 30, 2018, 2017 and 2016, respectively.
Outstanding balances of transactions with related parties at yearend are unsecured and settlements are made in cash. The Group did not recognize any provision for impairment loss in 2018, 2017 and 2016. This assessment is undertaken each financial year by reviewing the financial position of the related party and the market in which the related party operates.
Key management personnel compensation:
Note 2018 2017 2016 Salaries and wages and other short-term benefits P=100,095 P=92,519 P=88,498 Retirement benefits 18,805 19,306 15,281 Employee stock option 20 1,642 1,917 712 P=120,542 P=113,742 P=104,491
20. Employee Stock Option Plans (ESOP)
The BOD of the Company approved the establishment of its first and second ESOP on May 8, 2013 and January 16, 2014, respectively. The ESOPs cover all employees of the Company and its subsidiaries, namely: CACI, CADPI and RBC, who have rendered at least six months of service at the time of grant, subject for approval by the Senior Vice President, Human Resource, and the designated administrator. Employees are given the option to purchase the shares allocable to them over an exercise period of five years from the effectivity date of ESOP. The share options vest each year over the five-year term of ESOP. The offer price of the shares is based on the average quoted price during the 30-trading days prior to exercise date less a 15% discount. About 35.0 million and 30.0 million common shares of the Company’s unissued shares have been initially reserved under the first and second ESOP, respectively.
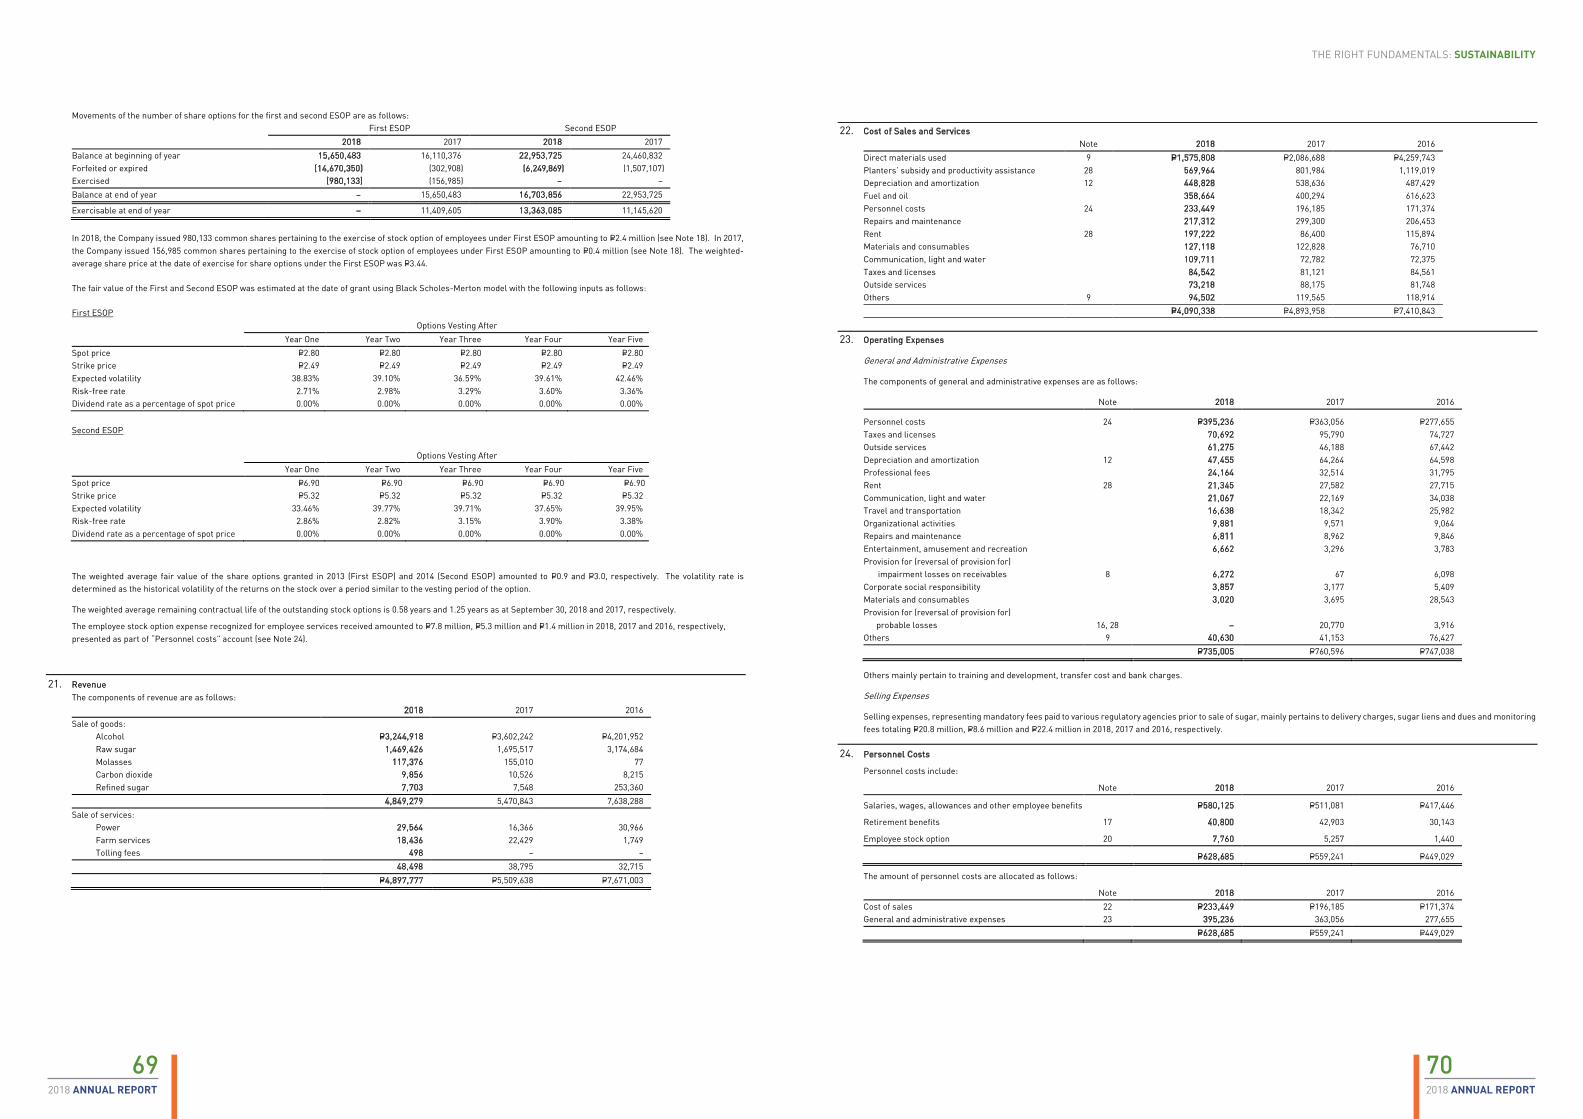
70692018 ANNUAL REPORT2018 ANNUAL REPORT
THE RIGHT FUNDAMENTALS: SUSTAINABILITY
Movements of the number of share options for the first and second ESOP are as follows: First ESOP Second ESOP 2018 2017 2018 2017 Balance at beginning of year 15,650,483 16,110,376 22,953,725 24,460,832 Forfeited or expired (14,670,350) (302,908) (6,249,869) (1,507,107) Exercised (980,133) (156,985) − − Balance at end of year − 15,650,483 16,703,856 22,953,725
Exercisable at end of year − 11,409,605 13,363,085 11,145,620
In 2018, the Company issued 980,133 common shares pertaining to the exercise of stock option of employees under First ESOP amounting to P=2.4 million (see Note 18). In 2017, the Company issued 156,985 common shares pertaining to the exercise of stock option of employees under First ESOP amounting to P=0.4 million (see Note 18). The weighted-average share price at the date of exercise for share options under the First ESOP was P=3.44.
The fair value of the First and Second ESOP was estimated at the date of grant using Black Scholes-Merton model with the following inputs as follows:
First ESOP Options Vesting After
Year One Year Two Year Three Year Four Year Five Spot price P=2.80 P=2.80 P=2.80 P=2.80 P=2.80 Strike price P=2.49 P=2.49 P=2.49 P=2.49 P=2.49 Expected volatility 38.83% 39.10% 36.59% 39.61% 42.46% Risk-free rate 2.71% 2.98% 3.29% 3.60% 3.36% Dividend rate as a percentage of spot price 0.00% 0.00% 0.00% 0.00% 0.00%
Second ESOP
Options Vesting After Year One Year Two Year Three Year Four Year Five Spot price P=6.90 P=6.90 P=6.90 P=6.90 P=6.90 Strike price P=5.32 P=5.32 P=5.32 P=5.32 P=5.32 Expected volatility 33.46% 39.77% 39.71% 37.65% 39.95% Risk-free rate 2.86% 2.82% 3.15% 3.90% 3.38% Dividend rate as a percentage of spot price 0.00% 0.00% 0.00% 0.00% 0.00%
The weighted average fair value of the share options granted in 2013 (First ESOP) and 2014 (Second ESOP) amounted to P=0.9 and P=3.0, respectively. The volatility rate is determined as the historical volatility of the returns on the stock over a period similar to the vesting period of the option.
The weighted average remaining contractual life of the outstanding stock options is 0.58 years and 1.25 years as at September 30, 2018 and 2017, respectively.
The employee stock option expense recognized for employee services received amounted to P=7.8 million, P=5.3 million and P=1.4 million in 2018, 2017 and 2016, respectively, presented as part of “Personnel costs” account (see Note 24).
21. Revenue The components of revenue are as follows: 2018 2017 2016 Sale of goods: Alcohol P=3,244,918 P=3,602,242 P=4,201,952 Raw sugar 1,469,426 1,695,517 3,174,684 Molasses 117,376 155,010 77 Carbon dioxide 9,856 10,526 8,215 Refined sugar 7,703 7,548 253,360 4,849,279 5,470,843 7,638,288 Sale of services: Power 29,564 16,366 30,966 Farm services 18,436 22,429 1,749 Tolling fees 498 − − 48,498 38,795 32,715 P=4,897,777 P=5,509,638 P=7,671,003
22. Cost of Sales and Services Note 2018 2017 2016 Direct materials used 9 P=1,575,808 P=2,086,688 P=4,259,743 Planters’ subsidy and productivity assistance 28 569,964 801,984 1,119,019 Depreciation and amortization 12 448,828 538,636 487,429 Fuel and oil 358,664 400,294 616,623 Personnel costs 24 233,449 196,185 171,374 Repairs and maintenance 217,312 299,300 206,453 Rent 28 197,222 86,400 115,894 Materials and consumables 127,118 122,828 76,710 Communication, light and water 109,711 72,782 72,375 Taxes and licenses 84,542 81,121 84,561 Outside services 73,218 88,175 81,748 Others 9 94,502 119,565 118,914 P=4,090,338 P=4,893,958 P=7,410,843
23. Operating Expenses
General and Administrative Expenses
The components of general and administrative expenses are as follows:
Note 2018 2017 2016
Personnel costs 24 P=395,236 P=363,056 P=277,655 Taxes and licenses 70,692 95,790 74,727 Outside services 61,275 46,188 67,442 Depreciation and amortization 12 47,455 64,264 64,598 Professional fees 24,164 32,514 31,795 Rent 28 21,345 27,582 27,715 Communication, light and water 21,067 22,169 34,038 Travel and transportation 16,638 18,342 25,982 Organizational activities 9,881 9,571 9,064 Repairs and maintenance 6,811 8,962 9,846 Entertainment, amusement and recreation 6,662 3,296 3,783 Provision for (reversal of provision for)
impairment losses on receivables 8 6,272 67 6,098 Corporate social responsibility 3,857 3,177 5,409 Materials and consumables 3,020 3,695 28,543 Provision for (reversal of provision for) probable losses 16, 28 − 20,770 3,916 Others 9 40,630 41,153 76,427 P=735,005 P=760,596 P=747,038
Others mainly pertain to training and development, transfer cost and bank charges.
Selling Expenses
Selling expenses, representing mandatory fees paid to various regulatory agencies prior to sale of sugar, mainly pertains to delivery charges, sugar liens and dues and monitoring fees totaling P=20.8 million, P=8.6 million and P=22.4 million in 2018, 2017 and 2016, respectively.
24. Personnel Costs
Personnel costs include:
Note 2018 2017 2016
Salaries, wages, allowances and other employee benefits P=580,125 P=511,081 P=417,446
Retirement benefits 17 40,800 42,903 30,143
Employee stock option 20 7,760 5,257 1,440
P=628,685 P=559,241 P=449,029
The amount of personnel costs are allocated as follows:
Note 2018 2017 2016 Cost of sales 22 P=233,449 P=196,185 P=171,374 General and administrative expenses 23 395,236 363,056 277,655 P=628,685 P=559,241 P=449,029
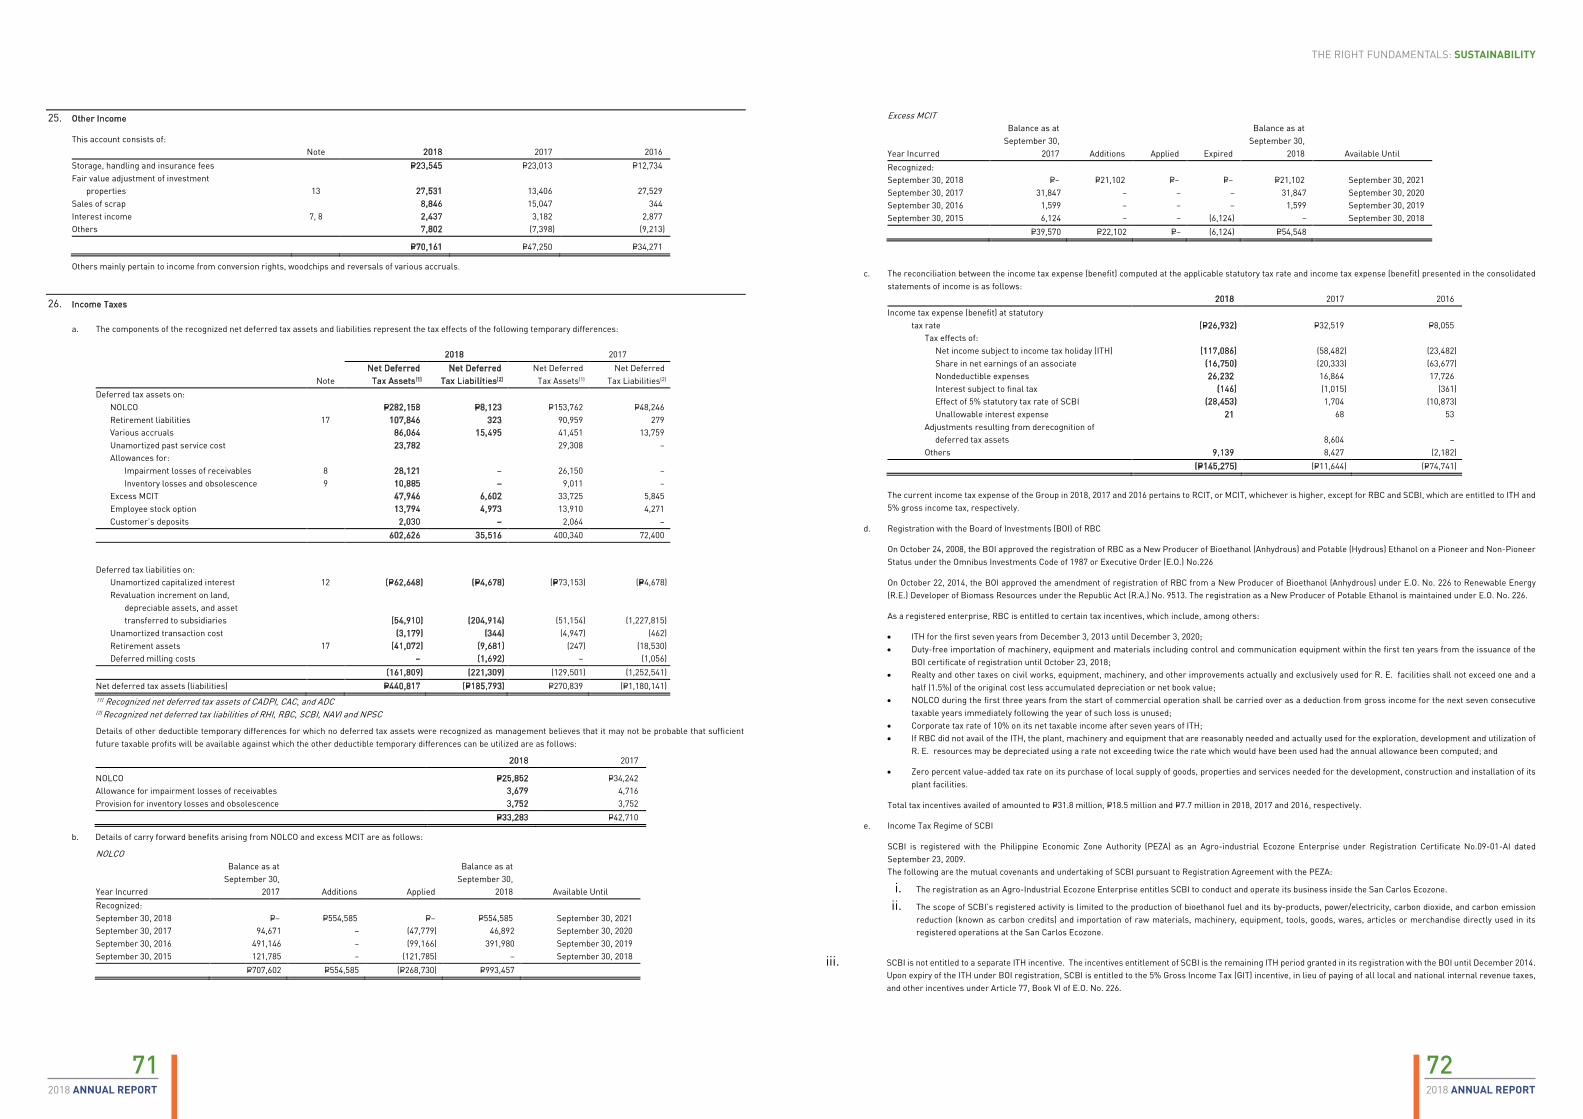
72712018 ANNUAL REPORT2018 ANNUAL REPORT
THE RIGHT FUNDAMENTALS: SUSTAINABILITY
25. Other Income
This account consists of: Note 2018 2017 2016 Storage, handling and insurance fees P=23,545 P=23,013 P=12,734 Fair value adjustment of investment properties 13 27,531 13,406 27,529 Sales of scrap 8,846 15,047 344 Interest income 7, 8 2,437 3,182 2,877 Others 7,802 (7,398) (9,213)
P=70,161 P=47,250 P=34,271
Others mainly pertain to income from conversion rights, woodchips and reversals of various accruals.
26. Income Taxes
a. The components of the recognized net deferred tax assets and liabilities represent the tax effects of the following temporary differences: 2018 2017
Note Net Deferred
Tax Assets(1) Net Deferred
Tax Liabilities(2) Net Deferred
Tax Assets(1) Net Deferred
Tax Liabilities(2) Deferred tax assets on: NOLCO P=282,158 P=8,123 P=153,762 P=48,246 Retirement liabilities 17 107,846 323 90,959 279 Various accruals 86,064 15,495 41,451 13,759 Unamortized past service cost 23,782 29,308 – Allowances for: Impairment losses of receivables 8 28,121 – 26,150 – Inventory losses and obsolescence 9 10,885 – 9,011 – Excess MCIT 47,946 6,602 33,725 5,845 Employee stock option 13,794 4,973 13,910 4,271 Customer’s deposits 2,030 – 2,064 – 602,626 35,516 400,340 72,400
Deferred tax liabilities on: Unamortized capitalized interest 12 (P=62,648) (P=4,678) (P=73,153) (P=4,678) Revaluation increment on land, depreciable assets, and asset transferred to subsidiaries (54,910) (204,914) (51,154) (1,227,815) Unamortized transaction cost (3,179) (344) (4,947) (462) Retirement assets 17 (41,072) (9,681) (247) (18,530) Deferred milling costs – (1,692) – (1,056) (161,809) (221,309) (129,501) (1,252,541) Net deferred tax assets (liabilities) P=440,817 (P=185,793) P=270,839 (P=1,180,141) (1) Recognized net deferred tax assets of CADPI, CAC, and ADC (2) Recognized net deferred tax liabilities of RHI, RBC, SCBI, NAVI and NPSC
Details of other deductible temporary differences for which no deferred tax assets were recognized as management believes that it may not be probable that sufficient future taxable profits will be available against which the other deductible temporary differences can be utilized are as follows:
2018 2017
NOLCO P=25,852 P=34,242 Allowance for impairment losses of receivables 3,679 4,716 Provision for inventory losses and obsolescence 3,752 3,752 P=33,283 P=42,710
b. Details of carry forward benefits arising from NOLCO and excess MCIT are as follows:
NOLCO
Year Incurred
Balance as at September 30,
2017 Additions Applied
Balance as at September 30,
2018 Available Until Recognized: September 30, 2018 P=− P=554,585 P=− P=554,585 September 30, 2021 September 30, 2017 94,671 − (47,779) 46,892 September 30, 2020 September 30, 2016 491,146 − (99,166) 391,980 September 30, 2019 September 30, 2015 121,785 − (121,785) − September 30, 2018 P=707,602 P=554,585 (P=268,730) P=993,457
Excess MCIT
Year Incurred
Balance as at September 30,
2017 Additions Applied Expired
Balance as at September 30,
2018 Available Until Recognized: September 30, 2018 P=− P=21,102 P=− P=− P=21,102 September 30, 2021 September 30, 2017 31,847 − − − 31,847 September 30, 2020 September 30, 2016 1,599 − − − 1,599 September 30, 2019 September 30, 2015 6,124 − − (6,124) − September 30, 2018
P=39,570 P=22,102 P=− (6,124) P=54,548
c. The reconciliation between the income tax expense (benefit) computed at the applicable statutory tax rate and income tax expense (benefit) presented in the consolidated statements of income is as follows: 2018 2017 2016 Income tax expense (benefit) at statutory
tax rate (P=26,932) P=32,519 P=8,055 Tax effects of: Net income subject to income tax holiday (ITH) (117,086) (58,482) (23,482) Share in net earnings of an associate (16,750) (20,333) (63,677) Nondeductible expenses 26,232 16,864 17,726 Interest subject to final tax (146) (1,015) (361) Effect of 5% statutory tax rate of SCBI (28,453) 1,704 (10,873) Unallowable interest expense 21 68 53 Adjustments resulting from derecognition of deferred tax assets 8,604 – Others 9,139 8,427 (2,182)
(P=145,275) (P=11,644) (P=74,741)
The current income tax expense of the Group in 2018, 2017 and 2016 pertains to RCIT, or MCIT, whichever is higher, except for RBC and SCBI, which are entitled to ITH and 5% gross income tax, respectively.
d. Registration with the Board of Investments (BOI) of RBC
On October 24, 2008, the BOI approved the registration of RBC as a New Producer of Bioethanol (Anhydrous) and Potable (Hydrous) Ethanol on a Pioneer and Non-Pioneer Status under the Omnibus Investments Code of 1987 or Executive Order (E.O.) No.226
On October 22, 2014, the BOI approved the amendment of registration of RBC from a New Producer of Bioethanol (Anhydrous) under E.O. No. 226 to Renewable Energy (R.E.) Developer of Biomass Resources under the Republic Act (R.A.) No. 9513. The registration as a New Producer of Potable Ethanol is maintained under E.O. No. 226.
As a registered enterprise, RBC is entitled to certain tax incentives, which include, among others:
• ITH for the first seven years from December 3, 2013 until December 3, 2020; • Duty-free importation of machinery, equipment and materials including control and communication equipment within the first ten years from the issuance of the
BOI certificate of registration until October 23, 2018; • Realty and other taxes on civil works, equipment, machinery, and other improvements actually and exclusively used for R. E. facilities shall not exceed one and a
half (1.5%) of the original cost less accumulated depreciation or net book value; • NOLCO during the first three years from the start of commercial operation shall be carried over as a deduction from gross income for the next seven consecutive
taxable years immediately following the year of such loss is unused; • Corporate tax rate of 10% on its net taxable income after seven years of ITH; • If RBC did not avail of the ITH, the plant, machinery and equipment that are reasonably needed and actually used for the exploration, development and utilization of
R. E. resources may be depreciated using a rate not exceeding twice the rate which would have been used had the annual allowance been computed; and
• Zero percent value-added tax rate on its purchase of local supply of goods, properties and services needed for the development, construction and installation of its plant facilities.
Total tax incentives availed of amounted to P=31.8 million, P=18.5 million and P=7.7 million in 2018, 2017 and 2016, respectively.
e. Income Tax Regime of SCBI
SCBI is registered with the Philippine Economic Zone Authority (PEZA) as an Agro-industrial Ecozone Enterprise under Registration Certificate No.09-01-AI dated September 23, 2009. The following are the mutual covenants and undertaking of SCBI pursuant to Registration Agreement with the PEZA:
i. The registration as an Agro-Industrial Ecozone Enterprise entitles SCBI to conduct and operate its business inside the San Carlos Ecozone.
ii. The scope of SCBI’s registered activity is limited to the production of bioethanol fuel and its by-products, power/electricity, carbon dioxide, and carbon emission reduction (known as carbon credits) and importation of raw materials, machinery, equipment, tools, goods, wares, articles or merchandise directly used in its registered operations at the San Carlos Ecozone.
iii. SCBI is not entitled to a separate ITH incentive. The incentives entitlement of SCBI is the remaining ITH period granted in its registration with the BOI until December 2014. Upon expiry of the ITH under BOI registration, SCBI is entitled to the 5% Gross Income Tax (GIT) incentive, in lieu of paying of all local and national internal revenue taxes, and other incentives under Article 77, Book VI of E.O. No. 226.

74732018 ANNUAL REPORT2018 ANNUAL REPORT
THE RIGHT FUNDAMENTALS: SUSTAINABILITY
The PEZA approved SCBI’s amendment in its registered activity to include the production of syrup from sugarcane, which will be subjected to 5% gross income tax, until October 1, 2015. The results of operations from said registered product thereafter is subjected to national taxes.
27. Earnings per Share
Earnings per share is computed as follows: 2018 2017 2016 Basic Diluted Basic Diluted Basic Diluted Net income attributable to the equity holders of the
Parent Company (a) P=47,664 P=47,664 P=119,777 P=119,777 P=101,244 P=101,244 Weighted average number of common shares
outstanding for basic EPS 1,565,337 1,565,337 1,449,038 1,449,038 1,421,798 1,421,798 Average incremental number of shares
under ESOP − − − 29,867 – 18,716 Weighted average number of common shares
adjusted for effect of dilution (b) 1,565,337 1,565,337 1,449,038 1,478,905 1,421,798 1,440,514
Earnings per share (a/b) P=0.03 P=0.03 P=0.08 P=0.08 P=0.07 P=0.07
Earnings per share for discontinued operations (Note 12) is computed as follows: 2018 2017 2016 Basic Diluted Basic Diluted Basic Diluted Net income (loss) attributable to equity holders of
the Parent Company from discontinued operations (a) (P=50,380) (P=50,380) P=201,844 P=201,844 P=337,690 P=337,690
Weighted average number of common shares outstanding for basic EPS 1,565,337 1,565,337 1,449,038 1,449,038 1,421,798 1,421,798 Average incremental number of shares
under ESOP − − − 29,867 – 18,716 Weighted average number of common shares
adjusted for effect of dilution (b) 1,565,337 1,565,337 1,449,038 1,478,905 1,421,798 1,440,514
Earnings per share (a/b) (P=0.03) (P=0.03) P=0.14 P=0.14 P=0.23 P=0.23
28. Commitments and Contingencies
a. Milling Contracts
CACI and CADPI (the “Mills”) have milling contracts with the planters, which provide for a 35% and 65% sharing between the Mills and the planters, respectively, of sugar, molasses and other sugar cane by-products, excluding bagasse, produced every crop year.
In December 2017, milling contracts of CADPI with the planters were revised to provide for a 32% and 68% sharing between CADPI and the planters, respectively. This agreement is effective until crop year 2017 to 2018. Renewal is upon mutual consent of both parties thereafter.
b. The Group has in its custody the following raw and refined sugar owned by third parties:
2018 2017
Total Volume (in Thousands)
(LKg*)
Estimated Market Value
(Amounts in Millions)
Total Volume (in Thousands)
(LKg*)
Estimated Market Value
(Amounts in Millions)
Raw sugar 185 P=299 426 P=511 Refined sugar 333 727 443 841
*Equivalent to 50 kilogram bag unit.
The foregoing volume of sugar is not reflected in the consolidated statements of financial position since these are not considered as assets of the Group. These raw sugar held on behalf of the third parties are also supported by quedans. The Group is accountable to the third parties for the value of trusted sugar or their sales proceeds.
c. Sales Contracts
CADPI and RBC entered into various sales contracts with its major customers for the sale of raw sugar, refined sugar and molasses. Outstanding sales contracts for refined sugar amounted to P=1,407.4 million for 672,344 lkg bags, P=765.0 million for 335,773 lkg bags and P=575.6 million for 231,622 lkg bags as at September 30, 2018, 2017 and 2016, respectively, and P=415.0 million for 7,511,654 liters, P=897.8 million for 19,240,000 liters and P=63.8 million for 1,051,000 liters for anhydrous alcohol as at September 30, 2018, 2017 and 2016, respectively.
d. Crop Loan and Contract Growing Agreements
RADC entered into crop loan and contract growing agreements with various planters for the scheduled delivery of sugar cane for the crop year 2017 to 2018. Advances made to planters related to these agreements as at September 30, 2018 and 2017 amounted to P=34.4 million and P=23.6 million, respectively, which are included as part of “Due from planters and cane haulers” under “Trade and other receivables” account (see Note 8).
e. Leases
The Group has various lease agreements for a period of one year covering heavy loading equipment and service vehicles with various trucking and heavy equipment service companies, which are used in transloading, hauling and other milling operations. The lease agreements are renewable annually upon mutual consent of both parties.
Moreover, the Group, as a lessee, leases its office space from a third party for a period of five years until May 31, 2021, which is renewable upon mutual agreement of the parties.
Future minimum lease payments on its office space as at September 30, 2018 and 2017 are as follow:
2018 2017
Within one year P=11,178 P=15,939
After one year but not more than five years 37,667 48,845
P=48,845 P=64,784
Total rent expense from the related contracts amounted to P=248.3 million, P=210.8 million and P=184.4 million in 2018, 2017 and 2016, respectively.
f. Hauling Services Contracts
The Group has an agreement for hauling services for the transport of sugarcane from the plantations to milling facilities. Related hauling expenses, which are presented as part of “Planters’ subsidy and productivity assistance” account under “Cost of goods sold”, amounted to P=758.2 million, P=1,034.0 million and P=1,343.6 million in 2018, 2017 and 2016, respectively (see Note 22).
g. Emission Reduction Purchase Agreement (ERPA)
On January 14, 2009, RBC and World Bank Group signed a $3.2 million ERPA for the purchase of carbon emission credits under the Clean Development Mechanism of the Kyoto Protocol. The ERPA will also avoid at least 50,000 metric tons of carbon dioxide each year with a crediting period of 10 years starting 2010. As part of the ERPA, portion of the revenue for the purchase of the credits will be used to finance the RBC’s community development projects.
h. Fuel Ethanol Supply Agreement (FESA)
SCBI has an existing FESA with Petron Corporation, wherein SCBI will exclusively supply fuel ethanol from the integrated ethanol distillery to Petron Corporation for a period of 10 years until 2018. The pricing, delivery, acceptance and payment terms are set out in the FESA.
i. Unused Credit Lines
The Group has unused lines of credit with various local banks amounting to P=310.7 million and P=800.0 million as at September 30, 2018 and 2017, respectively.
j. Contingencies
The Group has several pending claims and assessments, the expected ultimate outcome of which is based on management’s judgment in consultation with its legal counsel.
Outstanding provision for losses for disputed claims and assessments amounted to P=7.6 million and P=96.6 million as at September 30, 2018 and 2017, respectively, presented under “Trade and other payables” account (see Note 16).
29. Financial Instruments
Financial Risk Management Objectives and Policies
The Group’s principal financial instruments comprise cash, trade and other receivables, and trade and other payables, which arise directly from its operations, and short and long-term borrowings. The Group has other financial instruments such as restricted cash and dividends payable.
The main risks arising from the Group’s financial instruments are liquidity risk, credit risk and interest rate risk. The Group monitors the market price risk arising from all financial instruments. The Group’s operations are also exposed to commodity price risk, particularly from sugar prices. Risk management is carried out by senior management under the guidance and direction of the BOD of the Parent Company.
Liquidity risk
Liquidity risk arises from the possibility that the Group may encounter difficulties in raising funds to meet maturing obligations.
The Group’s objective is to maintain sufficient cash and the availability of funding through an adequate amount of committed credit facilities. Due to the dynamic nature of the business, the Group aims to maintain flexibility in funding by keeping track of daily cash flows and maintaining committed credit lines available. As of September 30, 2018, the Group has an APA for the Proposed Sale Transaction (Note 12), the proceeds of which will be used to repay the long-term debts and reduce short-term debt to levels sufficient for its working capital needs.
The tables below summarize the maturity profile of the Group’s financial liabilities based on contractual undiscounted payments and the related financial assets used for liquidity management. 2018
On
Demand Less than One Year
Over One to Two Years
Over Two to Four Years
Over Four to Five Years
Over Five Years Total
Short-term borrowings* P=6,583,508 P=– P=– P=– P=– P=– P=6,583,508 Trade and other payables** 78,366 2,120,555 – – – – 2,198,921 Current portion of long-term borrowings* – 1,447,850 – – – – 1,447,850 Noncurrent portion of long-term
borrowings* – – 990,883 2,179,369 421,345 339,040 3,930,637 P=6,661,874 P=3,568,405 P=990,883 P=2,179,369 P=421,345 P=339,040 P=14,160,916
Cash and cash equivalents P=292,001 P=– P=– P=– P=– P=– P=292,001
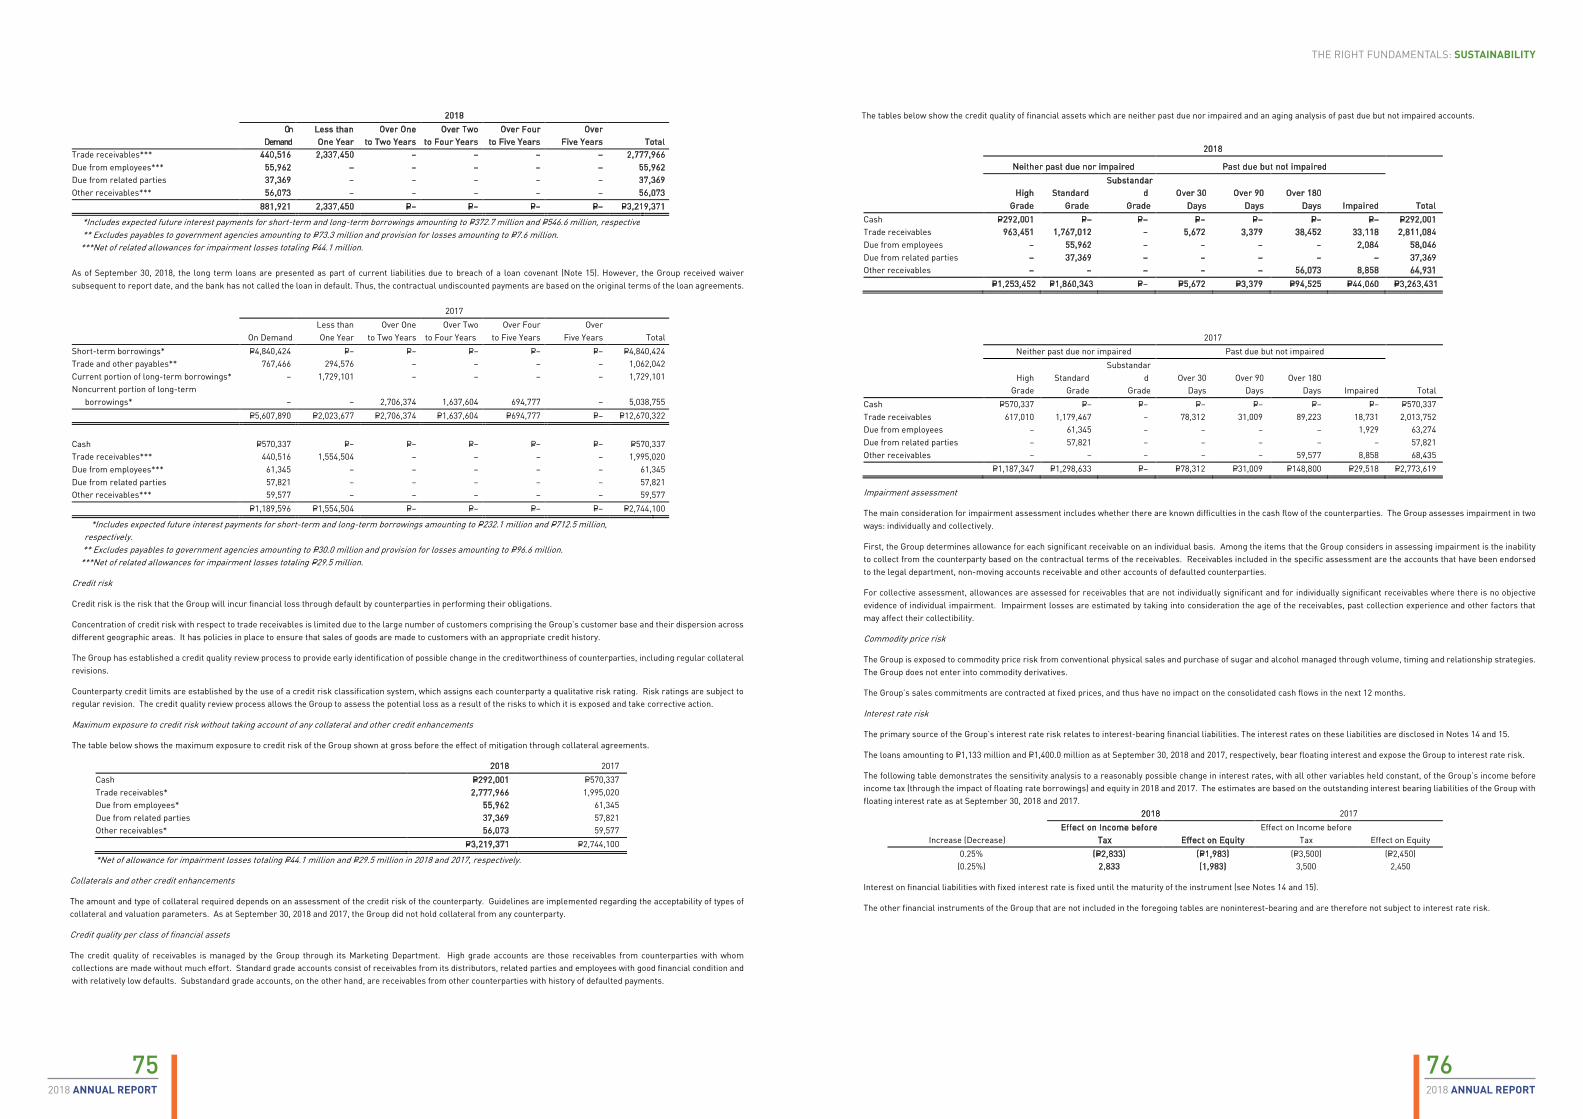
76752018 ANNUAL REPORT2018 ANNUAL REPORT
THE RIGHT FUNDAMENTALS: SUSTAINABILITY
2018
On
Demand Less than One Year
Over One to Two Years
Over Two to Four Years
Over Four to Five Years
Over Five Years Total
Trade receivables*** 440,516 2,337,450 – – – – 2,777,966 Due from employees*** 55,962 – – – – – 55,962 Due from related parties 37,369 – – – – – 37,369 Other receivables*** 56,073 – – – – – 56,073 881,921 2,337,450 P=– P=– P=– P=– P=3,219,371
*Includes expected future interest payments for short-term and long-term borrowings amounting to P=372.7 million and P=546.6 million, respective ** Excludes payables to government agencies amounting to P=73.3 million and provision for losses amounting to P=7.6 million. ***Net of related allowances for impairment losses totaling P=44.1 million.
As of September 30, 2018, the long term loans are presented as part of current liabilities due to breach of a loan covenant (Note 15). However, the Group received waiver subsequent to report date, and the bank has not called the loan in default. Thus, the contractual undiscounted payments are based on the original terms of the loan agreements. 2017
On Demand Less than One Year
Over One to Two Years
Over Two to Four Years
Over Four to Five Years
Over Five Years Total
Short-term borrowings* P=4,840,424 P=– P=– P=– P=– P=– P=4,840,424 Trade and other payables** 767,466 294,576 – – – – 1,062,042 Current portion of long-term borrowings* – 1,729,101 – – – – 1,729,101 Noncurrent portion of long-term
borrowings* – – 2,706,374 1,637,604 694,777 – 5,038,755 P=5,607,890 P=2,023,677 P=2,706,374 P=1,637,604 P=694,777 P=– P=12,670,322
Cash P=570,337 P=– P=– P=– P=– P=– P=570,337 Trade receivables*** 440,516 1,554,504 – – – – 1,995,020 Due from employees*** 61,345 – – – – – 61,345 Due from related parties 57,821 – – – – – 57,821 Other receivables*** 59,577 – – – – – 59,577 P=1,189,596 P=1,554,504 P=– P=– P=– P=– P=2,744,100
*Includes expected future interest payments for short-term and long-term borrowings amounting to P=232.1 million and P=712.5 million, respectively.
** Excludes payables to government agencies amounting to P=30.0 million and provision for losses amounting to P=96.6 million. ***Net of related allowances for impairment losses totaling P=29.5 million.
Credit risk
Credit risk is the risk that the Group will incur financial loss through default by counterparties in performing their obligations.
Concentration of credit risk with respect to trade receivables is limited due to the large number of customers comprising the Group’s customer base and their dispersion across different geographic areas. It has policies in place to ensure that sales of goods are made to customers with an appropriate credit history.
The Group has established a credit quality review process to provide early identification of possible change in the creditworthiness of counterparties, including regular collateral revisions.
Counterparty credit limits are established by the use of a credit risk classification system, which assigns each counterparty a qualitative risk rating. Risk ratings are subject to regular revision. The credit quality review process allows the Group to assess the potential loss as a result of the risks to which it is exposed and take corrective action.
Maximum exposure to credit risk without taking account of any collateral and other credit enhancements
The table below shows the maximum exposure to credit risk of the Group shown at gross before the effect of mitigation through collateral agreements.
2018 2017 Cash P=292,001 P=570,337 Trade receivables* 2,777,966 1,995,020 Due from employees* 55,962 61,345 Due from related parties 37,369 57,821 Other receivables* 56,073 59,577 P=3,219,371 P=2,744,100
*Net of allowance for impairment losses totaling P=44.1 million and P=29.5 million in 2018 and 2017, respectively.
Collaterals and other credit enhancements
The amount and type of collateral required depends on an assessment of the credit risk of the counterparty. Guidelines are implemented regarding the acceptability of types of collateral and valuation parameters. As at September 30, 2018 and 2017, the Group did not hold collateral from any counterparty.
Credit quality per class of financial assets
The credit quality of receivables is managed by the Group through its Marketing Department. High grade accounts are those receivables from counterparties with whom collections are made without much effort. Standard grade accounts consist of receivables from its distributors, related parties and employees with good financial condition and with relatively low defaults. Substandard grade accounts, on the other hand, are receivables from other counterparties with history of defaulted payments.
The tables below show the credit quality of financial assets which are neither past due nor impaired and an aging analysis of past due but not impaired accounts.
2018
Neither past due nor impaired Past due but not impaired
High Standard Substandar
d Over 30 Over 90 Over 180 Grade Grade Grade Days Days Days Impaired Total Cash P=292,001 P=– P=– P=– P=– P=– P=– P=292,001 Trade receivables 963,451 1,767,012 – 5,672 3,379 38,452 33,118 2,811,084 Due from employees – 55,962 – – – – 2,084 58,046 Due from related parties – 37,369 – – – – – 37,369 Other receivables – – – – – 56,073 8,858 64,931 P=1,253,452 P=1,860,343 P=– P=5,672 P=3,379 P=94,525 P=44,060 P=3,263,431
2017 Neither past due nor impaired Past due but not impaired
High Standard Substandar
d Over 30 Over 90 Over 180 Grade Grade Grade Days Days Days Impaired Total Cash P=570,337 P=– P=– P=– P=– P=– P=– P=570,337 Trade receivables 617,010 1,179,467 – 78,312 31,009 89,223 18,731 2,013,752 Due from employees – 61,345 – – – – 1,929 63,274 Due from related parties – 57,821 – – – – – 57,821 Other receivables – – – – – 59,577 8,858 68,435 P=1,187,347 P=1,298,633 P=– P=78,312 P=31,009 P=148,800 P=29,518 P=2,773,619
Impairment assessment
The main consideration for impairment assessment includes whether there are known difficulties in the cash flow of the counterparties. The Group assesses impairment in two ways: individually and collectively.
First, the Group determines allowance for each significant receivable on an individual basis. Among the items that the Group considers in assessing impairment is the inability to collect from the counterparty based on the contractual terms of the receivables. Receivables included in the specific assessment are the accounts that have been endorsed to the legal department, non-moving accounts receivable and other accounts of defaulted counterparties.
For collective assessment, allowances are assessed for receivables that are not individually significant and for individually significant receivables where there is no objective evidence of individual impairment. Impairment losses are estimated by taking into consideration the age of the receivables, past collection experience and other factors that may affect their collectibility.
Commodity price risk
The Group is exposed to commodity price risk from conventional physical sales and purchase of sugar and alcohol managed through volume, timing and relationship strategies. The Group does not enter into commodity derivatives.
The Group’s sales commitments are contracted at fixed prices, and thus have no impact on the consolidated cash flows in the next 12 months.
Interest rate risk
The primary source of the Group’s interest rate risk relates to interest-bearing financial liabilities. The interest rates on these liabilities are disclosed in Notes 14 and 15.
The loans amounting to P=1,133 million and P=1,400.0 million as at September 30, 2018 and 2017, respectively, bear floating interest and expose the Group to interest rate risk.
The following table demonstrates the sensitivity analysis to a reasonably possible change in interest rates, with all other variables held constant, of the Group’s income before income tax (through the impact of floating rate borrowings) and equity in 2018 and 2017. The estimates are based on the outstanding interest bearing liabilities of the Group with floating interest rate as at September 30, 2018 and 2017.
2018 2017
Increase (Decrease) Effect on Income before
Tax Effect on Equity Effect on Income before
Tax Effect on Equity 0.25% (P=2,833) (P=1,983) (P=3,500) (P=2,450)
(0.25%) 2,833 (1,983) 3,500 2,450
Interest on financial liabilities with fixed interest rate is fixed until the maturity of the instrument (see Notes 14 and 15).
The other financial instruments of the Group that are not included in the foregoing tables are noninterest-bearing and are therefore not subject to interest rate risk.
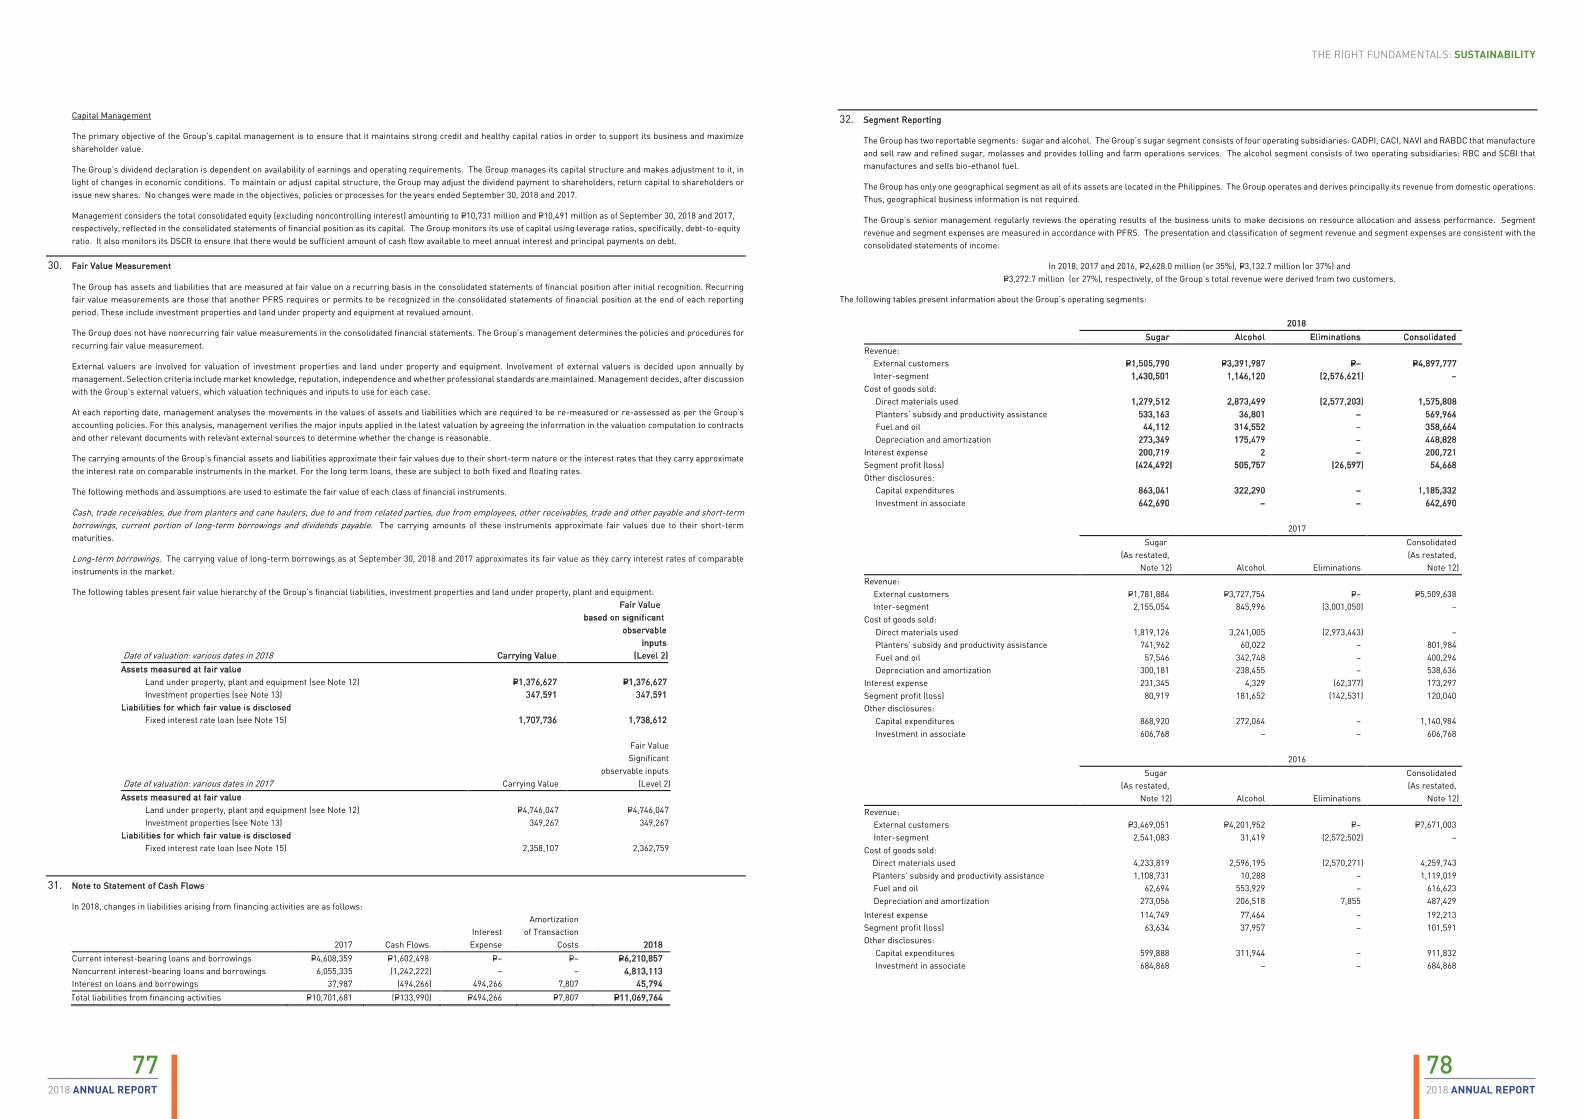
78772018 ANNUAL REPORT2018 ANNUAL REPORT
THE RIGHT FUNDAMENTALS: SUSTAINABILITY
Capital Management
The primary objective of the Group’s capital management is to ensure that it maintains strong credit and healthy capital ratios in order to support its business and maximize shareholder value.
The Group’s dividend declaration is dependent on availability of earnings and operating requirements. The Group manages its capital structure and makes adjustment to it, in light of changes in economic conditions. To maintain or adjust capital structure, the Group may adjust the dividend payment to shareholders, return capital to shareholders or issue new shares. No changes were made in the objectives, policies or processes for the years ended September 30, 2018 and 2017.
Management considers the total consolidated equity (excluding noncontrolling interest) amounting to P=10,731 million and P=10,491 million as of September 30, 2018 and 2017, respectively, reflected in the consolidated statements of financial position as its capital. The Group monitors its use of capital using leverage ratios, specifically, debt-to-equity ratio. It also monitors its DSCR to ensure that there would be sufficient amount of cash flow available to meet annual interest and principal payments on debt.
30. Fair Value Measurement
The Group has assets and liabilities that are measured at fair value on a recurring basis in the consolidated statements of financial position after initial recognition. Recurring fair value measurements are those that another PFRS requires or permits to be recognized in the consolidated statements of financial position at the end of each reporting period. These include investment properties and land under property and equipment at revalued amount.
The Group does not have nonrecurring fair value measurements in the consolidated financial statements. The Group’s management determines the policies and procedures for recurring fair value measurement.
External valuers are involved for valuation of investment properties and land under property and equipment. Involvement of external valuers is decided upon annually by management. Selection criteria include market knowledge, reputation, independence and whether professional standards are maintained. Management decides, after discussion with the Group’s external valuers, which valuation techniques and inputs to use for each case.
At each reporting date, management analyses the movements in the values of assets and liabilities which are required to be re-measured or re-assessed as per the Group’s accounting policies. For this analysis, management verifies the major inputs applied in the latest valuation by agreeing the information in the valuation computation to contracts and other relevant documents with relevant external sources to determine whether the change is reasonable.
The carrying amounts of the Group’s financial assets and liabilities approximate their fair values due to their short-term nature or the interest rates that they carry approximate the interest rate on comparable instruments in the market. For the long term loans, these are subject to both fixed and floating rates.
The following methods and assumptions are used to estimate the fair value of each class of financial instruments.
Cash, trade receivables, due from planters and cane haulers, due to and from related parties, due from employees, other receivables, trade and other payable and short-term borrowings, current portion of long-term borrowings and dividends payable. The carrying amounts of these instruments approximate fair values due to their short-term maturities.
Long-term borrowings. The carrying value of long-term borrowings as at September 30, 2018 and 2017 approximates its fair value as they carry interest rates of comparable instruments in the market.
The following tables present fair value hierarchy of the Group’s financial liabilities, investment properties and land under property, plant and equipment: Fair Value
Date of valuation: various dates in 2018 Carrying Value
based on significant observable
inputs (Level 2)
Assets measured at fair value Land under property, plant and equipment (see Note 12) P=1,376,627 P=1,376,627 Investment properties (see Note 13) 347,591 347,591
Liabilities for which fair value is disclosed Fixed interest rate loan (see Note 15) 1,707,736 1,738,612
Fair Value
Date of valuation: various dates in 2017 Carrying Value
Significant observable inputs
(Level 2) Assets measured at fair value
Land under property, plant and equipment (see Note 12) P=4,746,047 P=4,746,047 Investment properties (see Note 13) 349,267 349,267
Liabilities for which fair value is disclosed Fixed interest rate loan (see Note 15) 2,358,107 2,362,759
31. Note to Statement of Cash Flows
In 2018, changes in liabilities arising from financing activities are as follows:
2017 Cash Flows Interest Expense
Amortization of Transaction
Costs 2018 Current interest-bearing loans and borrowings P=4,608,359 P=1,602,498 P=– P=– P=6,210,857 Noncurrent interest-bearing loans and borrowings 6,055,335 (1,242,222) – – 4,813,113 Interest on loans and borrowings 37,987 (494,266) 494,266 7,807 45,794 Total liabilities from financing activities P=10,701,681 (P=133,990) P=494,266 P=7,807 P=11,069,764
32. Segment Reporting
The Group has two reportable segments: sugar and alcohol. The Group’s sugar segment consists of four operating subsidiaries: CADPI, CACI, NAVI and RABDC that manufacture and sell raw and refined sugar, molasses and provides tolling and farm operations services. The alcohol segment consists of two operating subsidiaries: RBC and SCBI that manufactures and sells bio-ethanol fuel.
The Group has only one geographical segment as all of its assets are located in the Philippines. The Group operates and derives principally its revenue from domestic operations. Thus, geographical business information is not required.
The Group’s senior management regularly reviews the operating results of the business units to make decisions on resource allocation and assess performance. Segment revenue and segment expenses are measured in accordance with PFRS. The presentation and classification of segment revenue and segment expenses are consistent with the consolidated statements of income.
In 2018, 2017 and 2016, P=2,628.0 million (or 35%), P=3,132.7 million (or 37%) and P=3,272.7 million (or 27%), respectively, of the Group’s total revenue were derived from two customers.
The following tables present information about the Group’s operating segments: 2018
Sugar Alcohol Eliminations Consolidated Revenue: External customers P=1,505,790 P=3,391,987 P=– P=4,897,777 Inter-segment 1,430,501 1,146,120 (2,576,621) – Cost of goods sold:
Direct materials used 1,279,512 2,873,499 (2,577,203) 1,575,808 Planters’ subsidy and productivity assistance 533,163 36,801 – 569,964
Fuel and oil 44,112 314,552 – 358,664 Depreciation and amortization 273,349 175,479 – 448,828
Interest expense 200,719 2 – 200,721 Segment profit (loss) (424,492) 505,757 (26,597) 54,668 Other disclosures:
Capital expenditures 863,041 322,290 – 1,185,332 Investment in associate 642,690 – – 642,690
2017
Sugar (As restated,
Note 12) Alcohol Eliminations
Consolidated (As restated,
Note 12) Revenue: External customers P=1,781,884 P=3,727,754 P=− P=5,509,638 Inter-segment 2,155,054 845,996 (3,001,050) − Cost of goods sold:
Direct materials used 1,819,126 3,241,005 (2,973,443) – Planters’ subsidy and productivity assistance 741,962 60,022 – 801,984
Fuel and oil 57,546 342,748 − 400,294 Depreciation and amortization 300,181 238,455 − 538,636
Interest expense 231,345 4,329 (62,377) 173,297 Segment profit (loss) 80,919 181,652 (142,531) 120,040 Other disclosures:
Capital expenditures 868,920 272,064 − 1,140,984 Investment in associate 606,768 − − 606,768
2016
Sugar (As restated,
Note 12) Alcohol Eliminations
Consolidated (As restated,
Note 12) Revenue: External customers P=3,469,051 P=4,201,952 P=− P=7,671,003 Inter-segment 2,541,083 31,419 (2,572,502) − Cost of goods sold: Direct materials used 4,233,819 2,596,195 (2,570,271) 4,259,743 Planters’ subsidy and productivity assistance 1,108,731 10,288 − 1,119,019 Fuel and oil 62,694 553,929 − 616,623 Depreciation and amortization 273,056 206,518 7,855 487,429
Interest expense 114,749 77,464 − 192,213 Segment profit (loss) 63,634 37,957 − 101,591 Other disclosures:
Capital expenditures 599,888 311,944 − 911,832 Investment in associate 684,868 − − 684,868

80792018 ANNUAL REPORT2018 ANNUAL REPORT
THE RIGHT FUNDAMENTALS: SUSTAINABILITY
SUBSIDIARIES
PARENT FIRMS
AFFILIATE
SubsidiariesHead OfficeROXAS HOLDINGS, INC.
14th Floor, Net One Center 26th Street Corner 3rd Avenue Bonifacio Global City, Taguig
Metro Manila, 1634 Philippines
Tel. Nos.: (63 2) 771 7800 to 05Website: www.roxasholdings.com.ph
AffiliateHAWAIIAN-PHILIPPINE COMPANY (HPCo)
Silay City, Negros Occidental6116 Philippines
Share InformationRoxas Holdings, Inc.
Shares are listed at the Philippine Stock Exchange, Inc.
Stock CodePSEi: ROX
CENTRAL AZUCARERADON PEDRO, INC.(CADPI)
Brgy. Lumbangan, NasugbuBatangas, 4231 Philippines
CENTRAL AZUCARERADE LA CARLOTA, INC. (CACI)
Brgy. Roberto S. Benedicto, La Carlota CityNegros Occidental, 6130 Philippines
ROXOL BIOENERGY CORPORATION (RBC)La Carlota City, Negros Occidental
6130 Philippines
SAN CARLOS BIOENERGY, INC. (SCBI)Plant Site, San Carlos EcozoneBarangays Punao & Palampas
San Carlos City, Negros Occidental6127 Philippines
RHI AGRI-BUSINESS DEVELOPMENT CORPORATION (RHI ADC)
14th Floor, Net One Center26th Street corner 3rd AvenueBonifacio Global City, Taguig
Metro Manila, 1634 Philippines
INFORMATION FOR INVESTORS
Atty. Ma. Hazel L. Rabara-RetardoAssistant Corporate Secretary
Assistant Vice President, Corporate GovernanceDeputy Compliance Officer
Group Head, Legal & Corporate Affairs
Roulee Jane F. CalayagHead, Stakeholder Relations
& Corporate Communications
14th Floor, Net One Center26th Street corner 3rd AvenueBonifacio Global City, Taguig
Metro Manila, 1634 PhilippinesTel. Nos.: (63 2) 771 7800 to 05
Website: www.roxasholdings.com.ph
Stock Transfer Agent
BDO Trust & Investment Group15th-17th Floors, South Tower
BDO Corporate Center7889 Makati Avenue, Makati City
Tel. No.: (63 2) 840 7000
External Auditor
SGV and Co.6760 Ayala Avenue ,Makati City
1276 PhilippinesTel. No.: (63 2) 891 0307
INVESTOR RELATIONS

812018 ANNUAL REPORT
THE RIGHT FUNDAMENTALS: SUSTAINABILITY
ROXAS HOLDINGS, INC.14th Floor, Net One Center
26th Street corner 3rd AvenueBonifacio Global City, Taguig
Metro Manila, 1634 Philippines
Tel. Nos.: (63 2) 771 7800 to 05Website: www.roxasholdings.com.ph