Annual Report 2018 - Raiffeisen Bank Kosovo
118
Annual Report 2018
Transcript of Annual Report 2018 - Raiffeisen Bank Kosovo

Annual Report 2018

Raiffeisen Bank Kosovo J.S.C.Monetary values are in € million 2018 2017 Change
Income statement 1/1-31/12 1/1-31/12
Net interest income after provisioning 38.9 32.4 20.0%
Net commission income 10.8 12.9 -16.5%
Net income from financial instruments at fair value through profit or loss 0.1 0.2 -51.0%
Trading profit/loss (0.2) (0.1) 203.0%
Other operating income 1.1 1.1 4.3%
General administrative expenses (27.6) (26.7) 3.2%
Profit before tax 23.0 19.9 15.9%
Profit after tax 20.5 17.6 16.6%
Earnings per share N/A N/A N/A
Balance sheet
Loans and advances to banks 24.7 39.6 -37.5%
Loans and advances to customers 593.2 532.5 11.4%
Deposits and borrowings from banks 0.6 9.2 -93.3%
Deposits from customers 729.5 735.8 -0.9%
Equity (incl. minorities and profit) 127.7 125.3 1.9%
Balance-sheet total 888.9 900.9 -1.3%
Local regulatory information
Risk-weighted assets B2, incl. market risk and ops. risk 721.6 636.2 13.4%
Total own funds 132.8 130.5 1.8%
Total own funds requirement 86.6 76.3 13.4%
Excess cover ratio 53.3% 70.9% -17.6 PP
Core capital ratio (Tier 1) 15.9% 17.0% -1.1 PP
Total own funds ratio 18.4% 20.5% -2.1 PP
Performance
Return on equity (ROE) before tax 20.6% 18.0% 2.6 PP
Return on equity (ROE) after tax 18.4% 16.0% 2.4 PP
Cost/income ratio 51.3% 53.2% -1.9 PP
Return on assets (ROA) before tax 2.6% 2.3% 0.4 PP
“Net provisioning ratio (average risk-weighted assets B3 in banking book)” 0.5% 1.0% -0.5 PP
Risk/earnings ratio 7.5% 11.3% -3.8 PP
Resources
Number of staff (FTE) 845 804 5.1%
Business outlets 46 46 0.0%
Survey of key data

ContentReport of the Supervisory Board 4Report of the Management Board 5The Management Board of Kosovo 6Organizational Structure 7Vision and Mission 8Raiffeisen Bank International at a glance 9
Developments in the economy of Kosovo 10The banking sector in Kosovo 12
Raiffeisen Bank Kosovo performance and financials 14Treasury and asset and liability management (ALM) 18Business segments 22Banking products and services 24Distribution channels 26Risk management 28Human resources and training 32Sustainability and corporate social responsibility 34
Financial statements 38
Addresses and contacts 112

4
Report of the Supervisory BoardLadies and Gentlemen,
As far as the Bank is concerned it was another excellent year with a Net Profit After Tax of € 20.5 million. The Bank also improved on a wide range of other Key Performance Indicators compared to 2017 and our number one position in the market was consolidated even further.
In the 2018 financial year, the members of the Supervisory Board held four ordinary meetings and one extraordinary meeting. The overall attendance rate for Supervisory Board meetings in the 2018 financial year was around 96 per cent.The Supervisory Board regularly and comprehensively monitored the business performance and risk developments at Raiffeisen Bank Kosovo. Discussions were regularly held with the Management Board on the adequacy of capital and liquidity as well as on the direction of the bank’s business and risk strategies. The Supervisory Board also dealt at length with further development in the area of corporate governance and monitored the implementation of corresponding policies. In the course of its monitoring and advisory activities, the Supervisory Board maintained direct contact with the responsible Management Board members, the auditor and heads of the internal control functions. It also maintained a continuous exchange of information and views with representatives of the banking supervisory authorities on topical issues.
Moreover, the Management Board provided the Supervisory Board with regular and detailed reports on relevant matters concerning performance in the respective business areas. Between meetings, the Supervisory Board also maintained contact with the Chairman of the Management Board and the Management Board members. The Management Board was available where required for bilateral or multilateral discussions with members of the Supervisory Board, where applicable with the involvement of experts on the matters addressed by the Supervisory Board.
The work undertaken together with the Management Board was based on a relationship of mutual trust and conducted in a spirit of efficient and constructive collaboration. Discussions were open and critical, and the Supervisory Board passed resolutions after considering all aspects. If additional information was required in order to consider individual issues in more depth, this was provided to members of the Supervisory Board without delay and to their satisfaction.
I would like to take this opportunity to thank all employees of Raiffeisen Bank Kosovo for their hard work and unwavering efforts in 2018, as well as to ask for their continued commitment in tackling any challenges going forward.
On behalf of the Supervisory Board
Peter Lennkh, Chairman of the Supervisory Board

5
Add
ress
es
F
inan
cial
Sta
tem
ents
Segm
ent
Repo
rts
P
erfo
rman
ce a
nd F
inan
cial
s
Th
e Ba
nkin
g Se
ctor
RBI
Visi
on a
nd M
issio
n
M
anag
emen
t Bo
ard
Intro
duct
ion
Report of the Management Board 2018 was an excellent year for Raiffeisen Bank Kosovo J.S.C. The macroeconomic environment was better than in many other countries in Southeastern Europe and the estimated gross domestic product for Kosovo was above 4 per cent, which contributed to another very good year for the bank with a net profit after tax of € 20.5 million.
Loan growth in all our customer segments was impressive and even though we took a prudent and sensible approach to our lending, our portfolio grew by € 41 million to € 615.2 million at the year-end, representing an 11 per cent increase compared to 2017. Our cautious approach to lending for several years now has resulted in an excellent non-performing loan (NPL) ratio of 3.2 per cent at the end of 2018, and the Kosovo banking system has the lowest NPL ratio in Southeastern Europe. Our deposits decreased by 0.9 per cent to € 729.5 million. This was a deliberate strategy so that we could maintain a satisfactory loan/deposit ratio of around 80 per cent. Cost management and improved efficiency continued to be a high priority in 2018 and our cost/income ratio reduced from 52.8 per cent in 2017 to 50.9 per cent in 2018.
Our focus on increasing the usage of electronic channels through a range of awareness campaigns lead to positive results and we processed 683,000 e-banking transactions which was a 20 per cent increase compared to 2017. Usage of our mobile banking service increased by 36 per cent and payments through this channel increased by 45 per cent. We also processed over 1.5 million transactions on our point of sale terminals, which was a 28 per cent increase compared to 2017. In addition, 4.5 million transactions were performed on our ATMs which is an 18 per cent increase compared to 2017.
In our small enterprises (SE) and corporate business segments the positive trend of increased usage of alternative channels continued. During the year, 387,000 e-banking transactions were processed, representing 83 per cent of all processed payments, an increase of 6 per cent compared to 2017. Further, the usage of the innovative SMS payment service for customs payments introduced in 2016, continued to remain at a high level: 269 million of customs payments were processed; 75 per cent in the corporate and 32 per cent in the SE segment.
Customer service continued to be a very important competitive advantage and as always, we focused on improving our customer satisfaction with all our products and services. We made significant investments in technology and staff training to meet and exceed our customer expectations and ensure that we deliver positive and memorable experiences at each interaction. Our customer centric culture is a great enabler and is the basis on which we develop everything to meet our customers’ needs and expectations. By being active on social media, we also managed to stay close and engaged with our customers with relevant and motivating communication and responses to our customers’ enquiries and questions in a timely manner.
In the field of Corporate Social Responsibility, we continued to contribute to projects in the field of culture, technology, education and social welfare. The two main cultural projects that the bank has been supporting for a decade are the well-known festivals in Kosovo: Chopin Piano Festival and PriFilm Festival. The bank also supported the Kosovo National Gallery while the young artists continued to use the Raiffeisen Gallery space in the biggest trade center to promote their artistic work. Another project that the bank continued to support in 2018 was the organization Action for Mother and Children that works on increasing the awareness and supporting new mothers in Kosovo. While, in terms of education and innovation, the bank is a partner of the Atomi project that focuses on identification and supporting people with extraordinary intelligence, gifted and talented people in Kosovo and the project BONEVET which enables children to get access to modern technology.
Finally, on behalf of the Management Board I would like to thank all employees of Raiffeisen Bank Kosovo J.S.C. for another excellent year. None of this would be possible without their skills, commitment and dedication.
On behalf of the Management Board,
Robert WrightChairman of the Management Board

6
Robert Wright
Chairman of theManagement Board
Shukri Mustafa
Member of theManagement Board
Iliriana Toçi
Member of the Management Board
Johannes Riepl
Member of the Management Board
Raiffeisen Bank KosovoManagement Board

7
Add
ress
es
F
inan
cial
Sta
tem
ents
Segm
ent
Repo
rts
P
erfo
rman
ce a
nd F
inan
cial
s
Th
e Ba
nkin
g Se
ctor
RBI
Visi
on a
nd M
issio
n
M
anag
emen
t Bo
ard
Intro
duct
ion
As of 31 December 2018
* Internal Audit reports directly to Audit Committee of Supervisory Board
Raiffeisen Bank KosovoOrganisational Structure
Chairman of BoardCEO
Support ServicesRobert Wright
Board MemberRetail BankingIliriana Toçi
Board Member Corporate Banking
Johannes Riepl
IT and Communications
Arbër Fazliu
Corporate Customers
Labinot Kelmendi
OperationsAgata Jashari
Organization and Process Management Dritan Cana
SecurityBujar Ibrahimi
Cost Management
Nazmi Matoshi
Executive Secretariat and Participation Management
Drita Ratkoceri
SE SegmentMegzon Nela
Corporate Product
Suad Lushtaku
Distribution Channels
Fahredin Sadiku
Retail Product Management and
Development Florent Lila
Micro Segment Agron Gashi
PI and Premium Baking Segment
Erik Roka
Board MemberCOO
Shukri Mustafa
Risk MenagementAnita Kovacic
Internal Audit Albert Bicaj
* FinanceFatos Shllaku
Human Resources and TrainingArta Celina
LegalIlir Tahiri
ComplianceKrenar Çela
Marketing and PRAntigona Limani
TreasuryBerat Isa
Premises, General Services
and ProcurementFlora Ahmeti
Competence Center and
Strategic InitiativesKreshnik Halili

8
Raiffeisen Bank KosovoVision and MissionVisionTo be the leading universal bank in Kosovo.
MissionTo develop long-term relationships with our customers by providing a wide range of competitive products and a high standard of service.
To be the employer of choice in Kosovo.

9
Add
ress
es
F
inan
cial
Sta
tem
ents
Segm
ent
Repo
rts
P
erfo
rman
ce a
nd F
inan
cial
s
Th
e Ba
nkin
g Se
ctor
RBI
Visi
on a
nd M
issio
n
M
anag
emen
t Bo
ard
Intro
duct
ion
Raiffeisen Bank International at a glanceRBI regards Austria, where it is a leading corporate and investment bank, as well as Central and Eastern Europe (CEE) as its home market. Subsidiary banks cover 13 markets across the region. In addition, the Group includes numerous other financial service providers active in areas such as leasing, asset management and M&A.
In total, almost 47,000 RBI employees serve 16.1 million customers in more than 2,100 business outlets, the vast majority of which are in CEE. RBI AG shares have been listed on the Vienna Stock Exchange since 2005.
At year-end 2018, RBI’s total assets stood at € 140 billion. The regional Raiffeisen banks hold approximately 58.8 per cent of RBI shares, with the remaining approximately 41.2 per cent in free float.

10
Developments in the economy of KosovoThe economy of Kosovo expanded by 3.9 per cent in average during the first three quarters of 2018, recording a deceleration compared to 4.2 per cent in 2017 (source: the Kosovo Agency of Statistics estimates). The real growth of the economy is supported by domestic demand mostly reflected in the growth of banking lending and the rise of investments. The last quarter is expected to have almost the same expansion level of the economic activity due to higher private and public investments.
Despite the weak inflationary pressures at the beginning of 2018, the change of dynamics during the year resulted in an increase in the rate of inflation in the second part of the year from negative territory or near zero levels of the first part. However, the annual inflation rate averaged 1.1 per cent in 2018 falling from 1.5 per cent in 2017. The inflation rate growth in the last months of 2018 came from higher food and fuel prices in the international markets.
The labor market has shown signs of improvement, marking a decline in the unemployment rate from 30.5 per cent in 2017 to 29.5 per cent in 2018 in average. However, the unemployment rate has deteriorated quarter after quarter peaking to 31.4 per cent in the last quarter of 2018. The youth unemployment rate remains high at around 57.3 per cent.
Developments in the fiscal sector indicate an increase in revenues and budget expenditures in 2018. An increase of budget revenues by 4.5 per cent in 2018 and an increase of budget expenditures by 10.3 per cent, have resulted in a total budget deficit of € 73 million compared to a budget deficit of € 68 million in 2017. The overall budget deficit is estimated at 1.2 per cent of GDP, which is within the required level of 2.0 per cent of GDP fiscal rule. Public investment in 2018 were estimated at € 530 million according to preliminary fiscal data (source: Ministry of Finance), which is 13.4 per cent higher than last year, giving an important contribute in the economic growth.
The level of public debt has increased to € 948.1 million by the end of 2018 from € 856.9 million in 2017, marking a level of 17.1 per cent of GDP. Public debt is on an upward trajectory, but the public debt ratio over GDP remains healthy.
The external position of Kosovo deteriorated in 2018, as the current account deficit, which amounted to € 564 million at the end of the year, expanded by 47.2 per cent compared to the same period previous year, mainly as a result of the deterioration of the trade deficit. Trade deficit amounted € 2.73 billion in 2018 or 10.9 per cent higher than in 2017, posing the main challenge of the country’s economy. Despite that exports of services continued the growth (5.4 per cent on yearly basis) with the major support of tourism inflows, the imports of services marked a faster growth (17.2 per cent on yearly basis), therefore the net services slightly dropped in 2018 giving a lesser negative impact in the current account deficit.
Remittances continued to grow in 2018, making a positive impact on the domestic economy. Remittances peaked to € 800.6 million, with an annual growth of 5.5 per cent in 2018 financing fully the current account deficit. From the other side FDIs amounted about € 214 million by the end of 2018, narrowing by 16.3 per cent, implying a decline in investing interest or the country failed to attract the investor’s attention despite its high potential.

11
Add
ress
es
F
inan
cial
Sta
tem
ents
Segm
ent
Repo
rts
P
erfo
rman
ce a
nd F
inan
cial
s
Th
e Ba
nkin
g Se
ctor
RBI
Visi
on a
nd M
issio
n
M
anag
emen
t Bo
ard
Intro
duct
ion

12
The banking sector in Kosovo continues to be the main sector contributing to the stability and expansion of financial activities in the country.
The structure of the banking sector in Kosovo during the actual year did not see any changes. Similar to a year before, there were ten licensed banks operating in the market. Banking institutions with origin from EU dominate the banking sector in Kosovo, though banks from other countries continue to increase their presence. Banks with origin from EU make up 61 per cent of total bank’s assets while banks with origin from Turkey also increased their presence to 16.5 per cent.
Total assets of the banking sector reached € 4.18 billion in December 2018 (2017: € 3.88 billion). The growth of total assets in 2018 was 7.7 per cent and is higher than previous year growth of 6.6 per cent. The growth of the banks’ total assets was mainly driven by an increase in loans and advances to customers, which continues to be the main asset category.
Bank’s balances of cash and reserve with Central Bank as well as exposure with other commercial banks also increased as of December 2018. The increase in cash and reserve with Central Bank was € 42.5 million or 8.5 per cent. The increase of balances with other banks was € 37 million or 12.2 per cent from a year before.
The lending activity of banks continued to grow during 2018, though the growth was slightly lower than the rate of growth in previous year. Total loans and advances achieved a value of € 2.76 billion (2017: € 2.49 billion), which is an annual increase of 10.9 per cent compared to 2017 growth of 11.5 per cent. This slightly slower growth than the year before is a result of slower economic growth and increase in the interest rates during 2018 in the market. Still, the growth continues to be substantial considering overall favorable lending conditions by banks, access to lending, improved loan quality in the market and increased demand for loans.
The largest contribution to the loans growth was both from loans and advances to businesses and individuals. Loans and advances to individuals continue to have an important impact in the total loan portfolio growth and during 2018, these loans increased by 11.2 per cent compared to 12.7 per cent a year before.
The percentage composition bank’s loans and advances portfolio as of December 2018 was 64 per cent non-financial corporations and 36 per cent individuals. This percentage distribution between non-financial corporations and individuals has remained rather stable for the last three years.
The economic sector concentration of new loans and advances to businesses continued to be dominated by the services sector with an overall share of 71 per cent, followed by industry 13 per cent and construction with 9 per cent. (Source: Buletini Mujor Statistikor, Dhjetor 18, Nr. 208).
On the other hand, the composition of new loans to individuals mainly consists of consumer loans with 73 per cent, followed by mortgage loans with 18 per cent and other loans with 9 per cent. (Source: Buletini Mujor Statistikor, Dhjetor 18, Nr. 208).
Banking Sector in Kosovo Note: Information in this chapter is based on material from the Central Bank of the Republic of Kosovo.
r
Other Loans9%
Mortgage Loans18%
Consumer Loans73%
Mining1%
Energy2%
Services71%
Agriculture4%
Industry13%
Construction9%
Business loan concentration

13
Add
ress
es
F
inan
cial
Sta
tem
ents
Segm
ent
Repo
rts
P
erfo
rman
ce a
nd F
inan
cial
s
Th
e Ba
nkin
g Se
ctor
RBI
Visi
on a
nd M
issio
n
M
anag
emen
t Bo
ard
Intro
duct
ion
Banking sector investments in government bonds and t-bills was € 430.2 million in December 2018 (2017: € 486.7 million), a decrease of 11.6 per cent. Investments in Kosovo t-bills continued to increase, but the decrease is a result of more rapid decrease in exposure with bonds issued by foreign countries. The decrease in bond yields could have had an impact in this decrease and more funds have been oriented in crediting of local customers with higher overall yields.
Customer deposits continue to be the main contributor in the financing of banking activities. As of December 2018, customer deposits comprised 80 per cent of total banking sector liabilities. A high reliance on financing from local deposits, especially from private individuals makes it the most reliable way for financing compared to other channels and it makes it immune from international fluctuations in the financial markets. Total deposits in the banking sector reached € 3.4 billion, representing an annual increase of € 272 million or 8.8 per cent (2017: 6.7 per cent).
The structure of deposits in the banks has changed in the recent years as the interest rates reached a historical low. Thus, there are more deposits in current accounts and less in term placements and saving accounts. As of December 2018, demand deposits accounted for 60 per cent of total deposits and the rest being term deposits and savings deposits with 40 per cent. The average rate in deposits increased by 0.2 percentage points in the last year reaching 1.5 per cent from 1.3 per cent in December 2017. The average rate for individual’s deposits was 1.4 per cent while for businesses it was 1.5 per cent.
Interest rate for loans has been decreasing for some years now. The same trend continued in 2018 as well. The average effective interest rate for loans decreased to 6 per cent from 6.8 per cent in December 2017.
The interest rates for loans decreased for businesses as well as for private individuals. The average interest rate for businesses in December 2018 was 6 per cent down compared to 6.5 per cent in December 2017. While, the average interest rate for private individuals in December 2018 decreased to 6.3 per cent from 7.3 per cent in December 2017. (Source: BQK, Sistemi Financiar, Informata Mujore, Dhjetor 2018).
In 2018, the banking sector achieved good overall financial performance at some of the key performance indicators, including profitability and non-performing loans.
Bank’s income increased in 2018 to € 253 million (2017: € 241 million) while expenses also went up to € 166 million (2017: € 156 million). The increase in income comes mostly from the increase in interest income, as result of increase in loans and advances to customers in 2018.
Interest expenses increased in 2018 by € 1 million as result of increase in market deposits levels and increase in the average rates while bank general and administrative expenses also had a slight increase of € 0.7 million from 2017 thus reaching € 105 million at the end of year 2018. By 31 December 2018, net profit of the banking sector was € 87 million (2017: € 85.3 million).
Banking sector return on average assets decreased slightly in 2018 by 0.1 percentage points to 2.5 per cent (2017: 2.6 per cent) and return on average capital also decreased to 20.2 per cent from 21.3 per cent in 2018.
Banks’ loan to deposit ratio was 81.9 per cent in 2018 up from 80.4 per cent in 2017. Capital adequacy ratio (regulatory capital /risk weighted assets) was 17 per cent down from 18 per cent in 2017.
In 2018, the nonperforming loan ratio improved and at the same time the nonperforming loan provision coverage ratio also improved. Thus, at the end of December 2018, the nonperforming loan to total loan ratio had dropped to 2.7 per cent (2017: 3.1 per cent). The nonperforming loan coverage ratio also improved from 150 per cent in 2017 to 152 per cent in 2018.
Effective average interest rates on loans
Loan / deposits GAP
Effective average interest rates on deposits
Market effective interest rates
0%
2%
4%
6%
8%
10%

14
Raiffeisen Bank Kosovo performance and financialsNote: The market analysis is based on preliminary published financial results of commercial banks prepared in compliance with the Central Bank of Kosovo (CBK) rules.
Total assets of Raiffeisen Bank Kosovo at 31 December 2018 were € 888.9 million. This is a slight decrease of 1.3 per cent when compared to the previous year (2017: € 900.9 million). The percentage of market share of the total assets of Raiffeisen Bank Kosovo was 21 per cent (2017: 24 per cent).
The structure of Raiffeisen Bank Kosovo assets continues to be dominated by loans and advances to customers. As of December 2018, 67 per cent of total assets were concentrated in loans and advances to customers after provisioning for loan losses. That is followed by 14 per cent in investment securities.
Investment securities include investments in Government and Corporate bonds of EU countries and the US, as well as treasury bills issued by the Kosovo Government.
The investments in securities decreased in 2018 by 36 per cent. This decrease is reflecting the overall liquidity position of the bank as more assets where oriented in the crediting of local retails and non-retail segments in the market. Total investments in securities in 2018 were € 123.7 million. Investments in Kosovo Government treasury bills were € 21.3 million (2017: € 33.6 million) and investments in other OECD country government and corporate bonds was € 102.4 million (2017: € 161 million).
2014 2015 2016 2017 2018
900
800
700
600
500
400
300
Total assets in € million
900.9 888.9
760.8
831.4
879.6
Market share - total assets
Other banks 79% Raiffeisen Bank
Kosovo 21%
2014 2015 2016 2017 2018
1000
900
800
700
600
500
400
300
200
100
-
Structure of balance sheet assets in € million
Loans and advances to customers Due from other banks and CBK Investment securities Other assets

15
Add
ress
es
F
inan
cial
Sta
tem
ents
Segm
ent
Repo
rts
P
erfo
rman
ce a
nd F
inan
cial
s
Th
e Ba
nkin
g Se
ctor
RBI
Visi
on a
nd M
issio
n
M
anag
emen
t Bo
ard
Intro
duct
ion
Total gross loans and advances of Raiffeisen Bank Kosovo as of 31 December 2018 were € 615.2 million (2017: € 554 million). The Bank’s market share in loans and advances as of 31 December 2018 was 22 per cent (2017: 22 per cent).
Raiffeisen Bank Kosovo also made allowances for credit losses based on credit risk policies. These allowances for credit losses amount to € 22 million (2017: € 21.5 million). These allowances are calculated based on IFRS 9 expected credit loss model and reflect Raiffeisen Bank Kosovo assessment of risk on the credit portfolio on 31 December 2018.
The balance of expected credit losses is higher than the year before and this is in part a result of implementation of IFRS 9 expected loss model from IAS 39 incurred loss model used previously. The total expected credit loss allowances to nonperforming loans in December 2018 was 110 per cent (2017: 75 per cent).
Total customer deposits reached € 729.5 million in December 2018 down from € 735.8 million in December 2017. That is an decrease of 0.9 per cent.
The domestic generation of finances also contributed towards greater stability in the banking sector and reduced the impact of any volatility from the international markets.
Market share - customer loans and advances
Raiffeisen Bank Kosovo
22%Other banks 78%
2014 2015 2016 2017 2018
650
550
450
350
250
Customer loans and advances - gross in € million
553.9
615.2
470.7 472.2
514.4
2014 2015 2016 2017 2018
Customer deposits in € million
800,0
700,0
600,0
500,0
400,0
300,0
736.0 729.5
604.3
675.2
725.0
Market share - customer deposits
Raiffeisen Bank Kosovo
22%Other banks 78%

16
2014 2015 2016 2017 2018
900
800
700
600
500
400
300
200
100
-
Structure of balance sheet liabilities in € million
Other liabilities Deposits and borrowings from banks Deposits from customers Subordinated debt
2014 2015 2016 2017 2018
140
120
100
80
60
40
20
-
Structure of equity in € million
Retained earnings Share capital
The largest contributor in deposits from customers were current accounts with a share of 79 per cent. Savings accounts follow up with e share of 18.5 per cent of total bank customer deposits. Term deposits from customers contain only 2.6 per cent of total deposit base. The increase in current account balances could also be explained by the drop in market interest rates for saving accounts and term deposits in the recent years.
The liabilities structure of Raiffeisen Bank Kosovo was dominated by customer deposits, and this was also the case for the Kosovo market.
In 2018, Raiffeisen Bank Kosovo’s share capital remained unchanged at € 63 million. The total equity as at 31 December 2018 was € 127.7 million (2017: € 125.3 million), also including € 65 million in the form of retained earnings. Raiffeisen Bank Kosovo distributed a dividend to its shareholder from its retained earnings in 2018 in the value of € 17.5 million.
This payment did not reflect in the value of total equity or in the regulatory capital requirements.
Raiffeisen Bank Kosovo continues to be well capitalized which is also reflected in the 2018 regulatory capital ratios of Tier 1 to total risk weighted assets ratio of 15.9 per cent (legal requirement 8 per cent) and a total capital (including Tier 2) to risk weighted assets ratio of 18.5 per cent (legal requirement 12 per cent). In the calculation of Tier 2 capital the Bank has included the amount of € 19 million subordinated debt with an original maturity of ten years reduced by 20 per cent in line with regulatory requirements. The above capital requirements where calculated in compliance with the CBK regulation on capital adequacy and other applicable regulatory rules and regulations.

17
Add
ress
es
F
inan
cial
Sta
tem
ents
Segm
ent
Repo
rts
P
erfo
rman
ce a
nd F
inan
cial
s
Th
e Ba
nkin
g Se
ctor
RBI
Visi
on a
nd M
issio
n
M
anag
emen
t Bo
ard
Intro
duct
ion
Interest income Non interest income Gross income
2014 2015 2016 2017 2018
100 %
80 %
60 %
40 %
20 %
0 %
Gross income development and structure in € million
55,0
50,0
45,0
40,0
35,0
Administrative costs Staff costs Cost income ratio Total OPEX
2014 2015 2016 2017 2018
100 %
80 %
60 %
40 %
20 %
0 %
35,0
30,0
25,0
20,0
15,0
10,0
General administrative expenses development in € million
Net income after tax in 2018 was € 20.5 million (2017: € 17.6 million). This result is calculated based on IFRS Financial Statements as included in the report. Raiffeisen Bank Kosovo also produces financial reports based on IFRS reflecting additional requirements from the Central Bank Regulations and those statements are sent to Central Bank and are also published on a quarterly basis on the Raiffeisen Bank Kosovo website and also in local daily papers.
Raiffesen Bank Kosovo income is strongly dominated by income generated from loans and advances to local customers. Income from interest on loans and advances and securities continues to be main source of income despite falling rates for loans in the market as well as very low yields and sometimes negative yields on OECD government issued bonds. This was partially offset by falling rates for bank deposits from customers.
In 2018, the Bank generated less non-interest income, which decreased by 19 per cent compared to 2017, though the interest income increased by 15 per cent, thus the decrease of non-interest income has been offset and the overall impact in PL of the Bank was positive in 2018.
Since 2016, there was also a noticeable effect from the changes in the legal environment with the licensing of private bailiffs. The Bank managed to execute a number of pending cases at rate much faster than before. This resulted in faster sale of Bank repossessed assets. As a result, the Bank had higher income in the other income position as result of sale of repossessed assets kept as bank inventory. Other income position has also included income from a contract related to a limited number of IT services provided for a number of RBI HO in Vienna and other RBI group of consolidated companies.
The general and administrative expenses as of 31 December 2018 were € 27.5 million (2017: € 27.3 million). The cost income ratio was 51 per cent (2017: 53.2 per cent). This shows a slight improvement in efficiency.
Staff costs also include staff related costs, such as training and other professional development. These costs continued to represent a significant part of operational expenses as Raiffeisen Bank Kosovo considers it very important to invest in the professional development of the staff.

18
Treasury, asset and liability management
Asset liability management 2018 was a successful year as far as the collection and consolidation of deposits was concerned, as well as loan issuance. Raiffeisen Bank Kosovo managed to increase further its core deposit position, reducing the total deposits balance for € 6 million compared to the year 2017. Largely, the Bank was able to increase its outstanding position with loans. Building on the increased trust in the financial system, especially the brand of Raiffeisen Bank Kosovo, the Banks’ liquidity remained at stable levels, thus lowering the funding costs on a year on year basis. Treasury/asset liability management (ALM) assets fell from 39 per cent of the Bank assets in 2017 to around 29 per cent at the end of 2018. The treasury assets where reduced to finance customer loans.
In 2018, the Bank experienced a decrease in customer deposits of around € 6 million while on the non-bank loan assets side an increase in amount of € 61 million. Prudent asset and liability management made it possible for Raiffeisen Bank Kosovo to keep the lowest cost of deposits funds in the market, which in turn enabled lower loan interest rates. Largely, the reduction in interest expense was achieved through quantitative modeling of assets and liabilities management, as well as through a rundown of historical high-rate term deposit contracts into lower cost savings accounts and current accounts. The Bank focuses on stable and relationship customers as its core-funding base for loan operations.
Core funding The Bank utilizes quantitative modeling to measure customer deposits stickiness for its non-maturing assets and liabilities, for interest rate risk purposes but also for liquidity risk purposes, for both retail and non-retail customers. The Bank’s funding sources came mainly from stable retail deposits (household deposits) amounting to 88 per cent of total deposits of the Bank, an increase of almost € 47 million in non-corporate deposits is noted in year 2018. The compound effect of a high liquidity position, and a high stickiness position produced a stable liquidity position. The interest rates basis point value (BPV) in 2018, showed an end of year BPV position of around 29,762. Net interest margin stood stable in 2017 at around 4.15 per cent despite increased liquidity and lower loan interest rates.
LiquidityAs of end of 2018, the Bank has a Net Stable Funding ratio above (NSFR) 140 per cent, and LCR above 340 per cent. The liquidity of the Bank is comprised of holdings of investment in Bonds, Money Market and Central Bank.

19
Add
ress
es
F
inan
cial
Sta
tem
ents
Segm
ent
Repo
rts
P
erfo
rman
ce a
nd F
inan
cial
s
Th
e Ba
nkin
g Se
ctor
RBI
Visi
on a
nd M
issio
n
M
anag
emen
t Bo
ard
Intro
duct
ion
Interest rate risk in Banking Book and StrategyThe Bank has made a significant reduction of duration. The reduction of duration in bond holdings has reduced the Banks’ interest rate maturity transformation in bonds, but has slightly increased the duration by allocation the excess liquidity into loans. Compared to 2016 and 2017, in 2018, the Bank has managed to transform a significant portion of its loan book from fixed rate to Variable rate loans. Having the right and prudent positioning of the interest rate balance sheet is very important for the Bank’s management and shareholders.
In a broader context: the table below shows the P&L exposures by currency per 1 basis point shift in curve.
Exposure : P&L impact per each 1 Basis Point shift in Curve BPV ( Basis Point Value)
Currency Basis Point Value Exposure
<=1Y 1-2Y 2-3Y 3-5Y 5-7Y 7-10Y 10-15Y <20Y
Total 29,762
CHF 13 13
-
EUR 29,427 (6,832) 6,692 14,478 38,273 (14,923) (8,160) (84) (17)
USD 321 (896) (327) 514 1,030 -
(-) Long fixed Rate buckets

20
Government/Corporate FI securities The Bank managed to reduce its holdings of financial investment in 2018 by almost € 71 million to the end of year volume of € 124 million. Out of a total € 124 million of financial investments, around 78 per cent of the portfolio are quality investments in Government and Corporate/FI securities, and the remainder is allocated to exposure in Kosovo Government domestic debt issuances.
(*)% Bonds Held by Raiffeisen Bank Kosovo on its Own Bond book(**) sorted as per referred Moody’s rating table
In parallel, the total market for Kosovo treasury bills continued its pace of development. In its role as a primary dealer, the Bank and its customers continued to define the creation of the Kosovo government debt secondary market, albeit at a slower rate due to its declining attractiveness given the lower yields attained. In 2018, the auction interest rates for Kosovo Bills/Bonds improved significantly compared to auctions of 2017. This has helped the Bank to improve its return on liquidity. The table below shows the last auction information for each respective year.
Moody’s Rating** Notes Bonds % Allocation * Duration Adjusted
Aaa Prime Rating 5.3% 1.2
Aaa Prime Rating 3.9% 0.8
Aaa Prime Rating 3.5% 1.2
Aaa Prime Rating 7.1% 0.6
Aa1 High Grade 12.1% 0.1
Aa3 High Grade 11.3% 3.8
A2 Upper Medium Grade 6.5% 0.2
A3 Upper medium Grade 11.7% 0.1
Baa1 Lower Medium Grade 11.3% 0.9
NR No rating 5.7% 0.9
Non Rates Kosovo No rating 21.6%

21
Add
ress
es
F
inan
cial
Sta
tem
ents
Segm
ent
Repo
rts
P
erfo
rman
ce a
nd F
inan
cial
s
Th
e Ba
nkin
g Se
ctor
RBI
Visi
on a
nd M
issio
n
M
anag
emen
t Bo
ard
Intro
duct
ion
Financial derivatives in relation to Banking BookThe Bank’s interest rate swaps portfolio is an important risk management tool for its long-term portfolio. Interest rate swaps are used to mitigate the risks from shifts of interest rates in unfavorable directions. The Bank has not entered into any new contract for interest rate swaps in 2018. Rather than entering into IRS derivative deals, the Bank has used the opportunity to continue to convert part of its loan book rates into variable rate loans and to also keep in check the duration of its bonds position.
The Bank expects that the market rates will soon have reached their lowest and a reversal toward higher interest rates will be experienced in the mid to long end, which, combined with historic low rates in the short end, will define a steeper yield curve.
0.5% 0.7%
1.8% 1.9%
3.3%
0.18% 0.34%
0.55%
0.94%
1.31%
6m 1Y 2Y 3Y 5Y
2018 2017
Kosovo Auctions / Ankandet

22
Business segmentsCorporate Developing and maintaining long-term relationships with the corporate customers is the essential goal of the Bank’s strategy, and 2018 proved a success in this regard. The main objectives of corporate department were to maintain the market leader position in Kosovo by further supporting growth of current customers and acquisition of new customers. The combination of financial strength, high capital base and deep knowledge and expertise of the corporate relationship and product managers has put Raiffeisen Bank Kosovo in unique position compared to its peers.
Being part of Raiffeisen Bank International (RBI) and having a strong local business model and product range enabled the Bank to acquire several new international companies that started operating in Kosovo in 2018, by offering a fully international standard banking service.
In 2018, corporate business recorded a further growth in its lending portfolio at € 222 million or 8 per cent more compared to the previous year, with asset quality improvement resulting to non-performing loans counting for only 4.26 per cent of loan portfolio, and down by 52 per cent compared to the previous year. A very well collateralized portfolio resulted in sustainable Return on Risk Adjusted Capital (RoRAC) of 182 per cent and net profit after tax increased by 41 per cent to € 8.3 million year-on-year (2017: € 6.1 million).
High focus during 2018 was given to ensuring full compliance with increased regulatory requirements being local, international and group requirements such as Basel III, FATCA, KYC etc.
Small enterprisesIn 2018, the Bank continued to foster relationship with small enterprises through experienced relationship managers situated in four main regions of Kosovo, supported from head-office and the expertise of the product managers. This concept resulted in the over achievement of overall results in terms of profitability, asset volumes and portfolio quality. The Bank’s product offer is permanently adapted to the clients’ requirements and business development level.
The SE loan portfolio maintained a stable growth reaching € 70.7 million in 2018. Investment appetite requiring long-term financing remained modest compared to working capital needs among SE customers. A well-collateralized lending portfolio resulted in high level of return on risk adjusted Capital (RoRAC) of 92 per cent, significant bottom line result of € 1.5 million or plus 10 per cent compared to the previous year. There was a substantial improvement of portfolio quality with NPL rate of 7.5 per cent, down by 10 per cent from the previous year.
To sustain the internal processes, several initiatives in process efficiency were taken during the year, mainly in simplifying the processes making them leaner or appropriate to the size and complexity of the applications.
Micro enterprisesRaiffeisen Bank Kosovo continued to provide a wide range of banking products and services, standard and tailored to micro enterprises. In 2018, it provided banking products and services to more than 13,000 customers.
During 2018, the Bank initiated processes that eased financing criteria for customers. It enabled the Bank to meet customer’s financing demands by providing and creating better and attractive priced access to more customers. This included special campaigns with preferential pricing, which resulted in a large number of applications from new and existing customers and the impact is expected to positively reflect Banks and customers performance in the following years – helping them grow their turnover and increase the number of employees.
In 2018, the cooperation with Kosovo Government regarding agro customer base enhanced further. Activity of rewarding agro customers with grants continued to be the focus of Ministry of Agriculture Forestry and Rural Development policies. A successful implementation and usage of third party funds in the form of guarantees such as above 90 per cent limit utilization of Kosovo Credit Guarantee Fund paved the way to opening negotiations with other international risk sharing scheme providers.

23
Add
ress
es
F
inan
cial
Sta
tem
ents
Segm
ent
Repo
rts
P
erfo
rman
ce a
nd F
inan
cial
s
Th
e Ba
nkin
g Se
ctor
RBI
Visi
on a
nd M
issio
n
M
anag
emen
t Bo
ard
Intro
duct
ion
About 70 per cent of transfers processed through internet and mobile banking, 90 per cent of cash transactions in ATMs and 33 per cent year on year increase of card payments in POS terminals are indicators of the continuous shift of customers channel preference towards electronic channels. This positive change of mindset of the customer base was made possible by various awareness campaigns and it is a positive indicator that the formal sector of economy is being favored, and from which both customers and the Bank will benefit by enabling the increase of customer exposure based on increased turnover.
Private individuals and Premium BankingThe year 2018 was a very successful year for the Individuals and Premium Customers Segment and this was mainly due to the creative and competing campaigns that were presented to the market, addressing the needs and requests of the customers. Thus, the Bank continued to retain its leading position in this segment of the banking sector, by participating with 26 per cent in the market. During the year 2018, the Bank offered banking services to more than 240,000 individuals and 10,000 premium customers.
During 2018, the marketing campaigns were mainly focused on loans: both secured and non-secured loans – as well as overdrafts. These campaigns enabled the Bank to have a considerable growth in the loan portfolio for the individuals and premium customers with about 17 per cent compared to the last year. In addition, the Bank recorded a considerable growth in the mortgage portfolio with about 23 per cent. At the same time, the Bank also increased the credit card portfolio, both in volumes and the new units. These results were achieved due to the preferential offers for the customers who have a Credit Card following the negotiating campaigns with different merchants. There were also other smaller attractive marketing campaigns in 2018, in which we used Behavior Economics approach, as a new way of communication and approach toward the customers.
The year 2018 was particularly successful for premium banking, a unique banking service that the Bank offers to customers, who are selected, based on certain criteria. The total assets of the premium banking service grew for 27 per cent while the number of customers grew by 20 per cent. In addition to the loan products, the Bank continued to be focused on offering the profitable solutions for savings by creating a holistic advising approach for premium customers. It also continued to offer premium customers the possibility to trade treasury bills to maximize their savings. In addition, in order to enhance further its services for the premium customers, the Bank increased the number of the premium customer’s relationship managers in all branches in Kosovo and which contributed in better financial results in this segment.
Another initiative implemented in the Private individuals and Premium Banking segment in 2018 was the development of a digital approach, which was designed and developed mainly for customers in Diaspora but it will also be available for the others in Kosovo, offering the customers a new way of doing banking.

24
Banking products and services
Corporate and SERaiffeisen Bank Kosovo continues to be the only bank in Kosovo to offer Project Finance, which enabled it to support non-standard requests of customers, by developing tailor-made solutions meeting their requirements. A worth case mentioning is the project financing of an extension of the biggest shopping mall in Kosovo.
The Bank continued to hold the leading position in trade finance compared to its peers. With extensive expertise and being part of a big banking group that has established a network of banks throughout the world this has facilitated the acceptance of securing instruments such as guarantees and LCs. As a result, the trade finance portfolio during 2018 showed an exceptional increase of 79 per cent compared to the previous year.
Raiffeisen Bank Kosovo possesses a wide portfolio of cutting-edge technology, in order to meet the expectations of customers by offering convenience, speed, transparency and highly innovative products. A distinguishing service in the market is SMS pay for customs payments. Customers are able to conduct customs payments at a speed of less than 10 seconds, from anywhere in the country only by having a mobile phone. Such a solution has enabled corporate customers to channel 74 per cent of all customs payments via SMS.
In 2018, Raiffeisen Bank Kosovo remained the only bank offering Factoring. The portfolio showed an exceptional increase of 152 per cent, although from a relatively low base. Factoring continued to complement the product range of working capital financing to corporate and small enterprise customers.
In line with fast technological development pace, the Bank continued to pursue its digital concept, to meet the expectations of customers by ensuring convenience, speed and transparency. In this regard, a Corporate Agile Center of Excellence was established with mission to offer superior IT product and solution developments for Corporate and SE customers with a fully agile concept as well as to help the corporate banking become an adaptive organization.
Retail Market developments and customer demands are more than ever focused on electronic channels, and as a result, enhancing capabilities on electronic channels remain a high priority of the Bank.
In continuum with the Bank increase on electronic channels, throughout 2018, both ATM and Internet Banking have increased by 89 per cent compared to 84 per cent in year 2017. Increase of percentage is a comparison of transactions between ATM and Internet/mobile banking versus branch (cash and transfers). Usage share resulted from 29 per cent of Internet/Mobile banking transaction (289 thousands transactions in 2018 compared to 223 thousands transactions in 2017) and 20 per cent increase in ATM transactions (3.9 million transaction in 2018 versus 3.2 million transaction in 2017).
Furthermore, due to numerous awareness campaign and different incentives, the ATM cash deposit transactions have increased by 137 per cent in 2018, from 178 thousand in 2017 to 421 thousand in 2018.
In addition, card business has remained a top priority and continued to be supported with innovative approaches, both in card acquiring and card issuing. Once the POS infrastructure was in place and an initial wave of awareness with consumers and merchants assistants had been done, the use of contactless payments had a positive effect in the market. As a result, the number of the POS transaction has increased by 38 per cent, from 1.2 million in 2017 to 1.7 million in 2018 and the POS volume transaction has increased by 21 per cent, from 44 million in 2017 to 53 million in 2018.
The number of contactless transactions also had a substantial increase. Even though it was a novelty to the Bank’s card holders and merchants, the Bank managed to successfully process 186 thousand contactless transactions in 2018 compared to 8 thousand contactless transactions in 2017.

25
Add
ress
es
F
inan
cial
Sta
tem
ents
Segm
ent
Repo
rts
P
erfo
rman
ce a
nd F
inan
cial
s
Th
e Ba
nkin
g Se
ctor
RBI
Visi
on a
nd M
issio
n
M
anag
emen
t Bo
ard
Intro
duct
ion
Raiffeisen Bank is continually making different initiatives to increase digital initiated sales, which involve sales of personal loans and credit cards via the landing page. Thus, digitally initiated sales increased significantly by 503 per cent in 2018 compared to the same period in 2017. In total volume, the online sales were 740 thousand in 2018 compared to 22 thousand in 2017.
The e-Commerce service certified with Visa and MasterCard secure payment offered by Raiffeisen Bank Kosovo, is continuously growing the merchant’s base. The number of merchants assigned to the e-Commerce service almost doubled by the end of 2018 compared to 2017 (from 9 merchants to 17 merchants), the number of transactions processed has increased by 126 per cent, from 1,043 to 2,358 transactions, and the volume of transactions has increased by 106 per cent for the same period. In this way, the Bank continued to facilitate the constant change and convenient ways of payments in the Kosovo market.

26
Distribution channels
Branch networkBeing physically present in all regions of Kosovo with 46 branches and sub-branches, Raiffesen Bank Kosovo represents the largest branch network in the market. In 2018, the number of ATM increased by 8 per cent, from 108 ATM in 2017 to 117 ATM in 2018, while the number of POS by 17 per cent, from 2,180 POS in 2017 to 2,547 POS in 2018.
A Branch Transformation Program was the essential change that marked the branch network during 2018. The aim of the program was to optimize the Branch network through consolidation of branch premises in to more efficient premises with more cost effectiveness, aiming to find opportunities for revenue growth by increasing the sales force through multitask staff. New model branches offer a self-service area in which a customer can use online banking services 24/7, but also a comfortable space for customers to meet and discuss their financial plans with branch officials.
As a part of the Branch Transformation Program, during 2018, the Bank remodeled 11 sub-branches by adding self-service areas. It resulted in an increased overall number of self-service areas to 20. In order to make easy and more convenient cash services for the customers, cash-in feature is added to ATMs in all branches of Raiffeisen Bank Kosovo. The Branch Transformation Program aims to remodel and optimize all of the branch network by 2021.
In addition, the Bank also uses the Direct Sales Agents Network as a very effective channel in offering and selling bank products. These sales agents offer consultancy services to the customers in every region of the country through face-to-face meetings. During 2018, the Bank’s sales agents managed to meet with about 20,000 customers and offer financial advice and product choice.
Contact Center The Bank’s Contact Center is the main support center for both existing and potential customers in day-to-day communication with the Bank. It has two main activity streams, handling queries and supporting customers 24/7 through a dedicated team for inbound calls and performing telemarketing, direct sales and various customer education campaigns through an outbound team.
The Contact Center serves as an important support center handling a wide variety of customer enquiries and consultations with customers regarding bank products through various communication channels – phone, E-mail, chat, Facebook, help desk and a communication center through internet banking. During 2018, the Bank created a dedicated sales team that is responsible for communicating the best offers to customers.
Another important role of the Contact Center is monitoring activities for card products and electronic banking services to ensure fraud prevention.

27
Add
ress
es
F
inan
cial
Sta
tem
ents
Segm
ent
Repo
rts
P
erfo
rman
ce a
nd F
inan
cial
s
Th
e Ba
nkin
g Se
ctor
RBI
Visi
on a
nd M
issio
n
M
anag
emen
t Bo
ard
Intro
duct
ion
Customer experienceCollecting the vital customer insights in a multichannel environment was one of the main activities in the customer experience agenda in 2018. The need to deliver a satisfactory customer experience remains a priority for Raiffeisen Bank Kosovo. The Bank continuously invests on expending the channels of customer feedback by implementing innovative products and solutions.
As a part of Elevator Lab, a Fintech Accelerator Program established by Raiffeisen Bank International AG (RBI), Raiffesien Bank Kosovo hosted a Proof of Concept with a company that provides a Customer Experience solution. This platform enables the collection of customer insights and the evaluation of experiences in both physical and digital channels. It enables the Bank to invite customers to provide feedback and rate their experiences immediately after their interactions and experiences in branches, web page, Facebook, ATMs, Contact Center and product landing pages. By collecting customer perceptions after product purchase, the Bank also measured a customer effort score that makes it possible to take actions on improving the key processes for main products.
During 2018, the Bank also focused on awareness campaigns to contribute to customer education on using self-service banking. The aim of such activities is to help customers to make daily banking easier and more convenient.

28
Risk managementActive risk management is a core competency of Raiffeisen Bank Kosovo. In order to effectively identify, measure and manage risks, the Bank continues to develop its comprehensive risk management system. Risk Management is an integral part of overall bank management. In particular, in addition to legal and regulatory requirements, the Bank takes into account the nature, scale, and complexity of its business activities and the resulting risks.
The Bank has a system of risk principles and procedures in place for measuring and monitoring risk, which is aimed at controlling and managing material risks. Credit, market, liquidity and operational risks are measured, limited, aggregated and compared to available risk coverage capital.
Credit Portfolio Management Credit portfolio management in the Bank is, among other aspects, based on the credit portfolio strategy, which is turn based on the business and risk strategy. By means of the selected strategy, the exposure amount in industries or product types is limited and thus prevents undesired risk concentrations.
The following graph shows the Bank’s credit exposure at the end of the reporting period and the previous two periods. Total credit risk exposure was € 902 million as of 31 December 2018, which compared to a year-end 2017 decreased by 3.3 per cent, respectively decreased by 2.2 per cent compared to year-end 2016. The decrease is mainly driven by the reduction in the Bank & Sovereign exposure.
This portfolio is diversified between business and individual customer segments and includes exposures on, and off balance sheet, prior to the application of impairment provision and credit conversion factors and thus represents the total credit exposure.
in € million
2016 2017 2018
- 100 200 300 400
Retail Customers
Non-retail Customers
Banks & Sovreigns

29
Add
ress
es
F
inan
cial
Sta
tem
ents
Segm
ent
Repo
rts
P
erfo
rman
ce a
nd F
inan
cial
s
Th
e Ba
nkin
g Se
ctor
RBI
Visi
on a
nd M
issio
n
M
anag
emen
t Bo
ard
Intro
duct
ion
Management of non-performing loans2018 was particularly a very successful year for the recovery and reduction of the defaulted portfolio. The Bank has also been actively engaged on prevention that resulted with low inflow of defaulted accounts during the whole year. Compared to year-end 2017, the non-performing loans ratio significantly decreased in 2018, from 5.2 per cent to 3.2 per cent. During the same period, the coverage ratio increased from 75.1 per cent to 111.2 per cent.
Liquidity risk Liquidity adequacy is ensured from both an economic and a regulatory perspective. In order to approach the economic perspective the bank established a governance framework comprising internal limits and steering measures.
The regulatory component is addressed by compliance with the reporting requirements under Central Bank of Kosovo (Regulatory Liquidity Ratio). In addition to the local regulatory requirements, the Bank complies also with Basel III reporting requirements (Liquidity Coverage Ratio and Net Stable Funding Ratio).
Regulatory and internal liquidity reports and ratios are generated based on particular modelling assumptions. Whereas the regulatory reports are calculated on specifications given by authorities, the internal reports are modelled with assumptions from empirical observations.
The cornerstones of the economic liquidity risk framework are the Going Concern (GC) and the Time to Wall (TTW) scenario. The Going Concern report shows the structural liquidity position. It covers all main risk drivers, which could detrimentally affect the group in a business as usual scenario. On the other hand, the Time to Wall report shows the survival horizon for defined adverse scenarios and stress models (market, reputational and combined crisis) and determines the minimum level of the liquidity buffer (and/or the counter-balancing capacity) of the bank.
The liquidity scenarios are modelled using a Group-wide approach, acknowledging local specifications where they are justified by influencing factors such as the market environment or particular business characteristic.
Monitoring of limits and reporting limit compliance is performed effectively and the respective escalation channels are being utilized and work as designed.
The Bank’s liquidity position continued to remain stable and revealed a strong liquidity buffer during 2018.
Central Bank of Kosovo Regulatory Liquidity Ratio
2018 2017 Minimum Requirement
All currencies 35.0% 39.6% 25.0%
Euro currency 27.0% 31.9% 20.0%

30
Market riskThe Bank defines market risk as the risk of possible losses arising from changes in market prices of trading and investment positions. Market risk estimates are based on changes in interest rates, exchange rates and credit spread.
Limit System
The following values are measured and limited on a daily basis in the market risk management system:
• Value-at-Risk (confidence level 99 per cent, risk horizon one day)Value-at-risk (VaR) is the main steering instrument in liquid markets and normal market situations. VaR is measured based on a hybrid simulation approach, where 5,000 scenarios are calculated. The approach combines the advantages of a historical simulation and a Monte-Carlo simulation and derives market parameters from 500 days historical data. Distribution assumptions include modern features like volatility declustering and random time change. This helps in reproducing fat-tailed and asymmetric distributions accurately. Value-at-risk results are not only used for limiting risk but also in the economic capital allocation.
• Sensitivities (to changes in exchange rates and interest rates)Sensitivity limits shall ensure that concentrations are avoided in normal market situations and are the main steering instrument under extreme market situations and in illiquid markets or in markets that are structurally difficult to measure.
• Stop lossThis limit strengthens the discipline of traders such that they do not allow losses to accumulate on their own proprietary positions but strictly limit them instead.
A comprehensive stress-testing concept compliments this multi-level limit system. It simulates potential present value changes of defined scenarios for the total portfolio.
Operational riskOperational risk is defined as the risk of losses resulting from inadequate or failed internal processes, people and systems or from external events, including legal risk. In this risk category internal risk drivers such as unauthorized activities, fraud or theft, conduct related losses, modelling errors, execution and process errors, or business disruption and system failures are managed. External factors such as damage to physical assets or fraud are managed and controlled as well.
This risk category is analyzed and managed based on own historical loss data and the results of self-assessments. Another management tool is the incentive system implemented in internal capital allocation. This system rewards high data quality and active risk management.
As with other risk types the principle of firewalling between risk management and risk controlling is also applied to operational risk. To this end, individuals are designated and trained as Operational Risk Managers for each business area. Operational Risk Managers provide central Operational Risk Controlling with reports on risk assessments, loss events, indicators and measures. They are supported in their work by Dedicated Operational Risk Specialists (DORS).Operational risk controlling unit is responsible for reporting, implementing the framework, developing control measures and monitoring compliance with requirements. Within the framework of the annual risk management cycle, they also coordinate the participation of the relevant second line of defense departments and all first line of defense partners (Operational Risk Managers).

31
Add
ress
es
F
inan
cial
Sta
tem
ents
Segm
ent
Repo
rts
P
erfo
rman
ce a
nd F
inan
cial
s
Th
e Ba
nkin
g Se
ctor
RBI
Visi
on a
nd M
issio
n
M
anag
emen
t Bo
ard
Intro
duct
ion
Risk identificationIdentifying and evaluating risks that might endanger the bank’s existence (but the occurrence of which is highly improbable) and areas where losses are more likely to arise more frequently (but have only limited impact) are important aspects of operational risk management.
Operational risk assessment is executed in a structured manner according to risk categories such as business processes and event types. Moreover, risk assessment applies to new products as well. The Bank grades the impact of high probability/low impact events and low probability/high impact incidents according to its estimation of the loss potential for the next year and in the next ten years. Low probability/high impact events are quantified by an analytical tool with specific scenarios. The internal risk profile, losses arising and external changes determine which cases are dealt with in detail.
Monitoring In order to monitor operational risks, early warning indicators are used that allow prompt identification and minimization of losses.
Loss data is collected in a central database called ORCA (Operational Risk Controlling Application) in a structured manner according to the event type and the business line. In addition to the requirements for internal and external reporting, information on loss events is exchanged with international data pools to further develop operational risk management tools as well as to track measures and control effectiveness. The results of the analyses as well as events resulting from operational risks are reported in a comprehensive manner to the Operational Risk Management Committee on a regular basis.
Loss data is collected in a database called Operational Risk Controlling Application (ORCA). Collecting losses stemming from operational risks is a prerequisite for implementing a statistical loss distribution model and a minimum requirement for implementing the regulatory Standardized Approach. Furthermore, loss data is used to create and validate operational risk scenarios and for exchange with international data pools to further develop advanced operational risk management tools as well as to track further on measures and control efficiency. The results of the analyses as well as events resulting from operational risks are reported in a comprehensive manner to the Operational Risk Management Committee on a regular basis.
Quantification and mitigationThe Bank currently calculates regulatory capital requirements for operational risks according to Basel III using the Standardized Approach (STA). Operational risk reduction is initiated by business managers who decide on preventive actions like risk mitigation or risk transfer. Progress and success of these actions is monitored by risk controlling. The former also define contingency plans and nominate responsible persons or departments for initiating the defined actions if losses in fact occur. In addition, a dedicated organizational unit provides support to business units for reducing operational risks. An important role is taken on by fraud management which reduces potential fraud related losses through proactive monitoring and preventive actions. The Bank also executes an extensive staff training program and has different emergency plans and back-up systems in place.
Changes in the regulatory environmentThe Bank followed closely the current and the upcoming regulatory developments in 2019. The Kosovo banking sector remains very dynamic with changes in legislation in line with EU.
During the year 2018, the Central Bank of the Republic of Kosovo has revised the regulations on Credit risk management, Capital adequacy and regulation on Leverage ratio, which are expected to be enforceable in January 2020. While, the new regulations have been drafted such as regulation on Internal Capital Adequacy Assessment Process (ICAAP), IFRS 9 and regulation on Non-performing exposure and Forbearance. As part of Raiffeisen Bank International (RBI) group, the Bank is subject to the changes in the regulatory environment in the EU. This enables us to be adapted in advance to changes in local regulations, which aim to be harmonized with EU regulations.

32
Human resources and training Being the employer of choice in Kosovo is the mission of Raiffeisen Bank Kosovo, which demonstrates a major commitment towards the Bank’s employees.
The Department of Human Resources and Training at the Bank is responsible to ensure that the right people are performing the right roles and that their capacities are enriched via development activities. The achievement of corporate objectives through professional, highly motivated, engaged and satisfied employees is the continuous mission of Human Resources and Training Department.
As of 31 December 2018, the Bank had 845 employees (774 full time, 71 part time), with an additional 75 Direct Sales Agents. Compared to 2017, the total number of employees in 2018 increased by 5.1 per cent. The number of new employees who joined was 105. During 2018, the Bank had a regular internship program and several other projects involving interns. The number of interns who partnered with the program and the projects was 157. The aim of the internship programs is to support under-graduate, Master Degree students and Graduated candidates of Kosovo in their professional development.
The average age of employees was 36 years, indicating a relatively young human capital. Until 2018, 52.8 per cent of total employees were women, while 47.2 per cent of total employees were men.
Professional developmentThe Bank is committed to ensuring that its employees develop their knowledge and skills by offering a variety of learning and development opportunities through on-job-training, internal and external classroom training, E-Learning, assignments and involvement in challenging local and international projects, blended learning, rotations etc. These projects resulted in knowledge improvements in the field of banking products and services. In this way, the Bank gained a competitive advantage in the market by offering a more professional and efficient service to its customers. A specific focus was given to the concept of self-development and own initiative for online self-learning in 2018 and an important investment was made with the upgrading of the online Learning Management System, which offers high quality services for learners using the latest technology.
The Bank cooperates with various training providers in and out of Kosovo for specific training programs. Training needs identification is done continuously in order to have tailored programs that meet employees’ needs. There are also individual development plans supported by individual coaching for a number of employees, which focus specifically on the competencies of an individual and increase the chances of personal development.
E-Learning is already a very well accepted learning platform by most employees. In its 11thyear of existence, there was an impressive level of interest and support by Bank employees to design and attend internally created courses. During 2018 there were about 2800 staff enrollments in the Bank self-designed sessions and RBI courses. Additional focus was also given to external provider online courses to increase efficiency and variety in learning.
In addition to the activities already mentioned, the Bank continued to support employees for the specific professional and licensing courses on a range of topics from technical to soft skills, as part of its capacity building. Lifelong learning remains one of the key messages in the Bank. Besides all the learning there was also continuous focus on leisure events to achieve an acceptable work-life balance and develop team spirit amongst employees.

33
Add
ress
es
F
inan
cial
Sta
tem
ents
Segm
ent
Repo
rts
P
erfo
rman
ce a
nd F
inan
cial
s
Th
e Ba
nkin
g Se
ctor
RBI
Visi
on a
nd M
issio
n
M
anag
emen
t Bo
ard
Intro
duct
ion
Talent managementDuring 2018 the focus on increasing the awareness and skills of bank managers toward human capabilities continued. Talent management activities were organized throughout the Bank through a process that is hand to hand linked, with internal promotion and focused development. The Bank continued to run the development initiatives as Rotation and Cross-functional programs and tailored learning assignments. These internal and international programs aim to deepen the expertise of the most talented Bank employees and managers through an innovative combination of practical, alternative and academic methods of learning.
Employer BrandingDuring 2018, the initiatives related to Employer Branding Campaign were introduced. By using internal communication channels and Social Media, Raiffeisen Bank Kosovo was present in public with different branding campaigns. The focus was on promoting internal opportunities for the professional development of the bank’s employees. These campaigns presented employees success stories related to career advancement in Raiffeisen Bank Kosovo, which demonstrated the Bank’s continuous commitment to being the Employer of Choice in Kosovo.
Health Management System Health Management activities continued to be a focus in 2018 as well. The goal is to improve health and wellbeing of employees in Raiffeisen Bank Kosovo by improving employee motivation, health and performance.
The Bank performed research to understand best practices in different countries when it comes to occupational health. Based on the research, it divided occupational health in two parts:• Sessions of an informative character• Emails regarding breast cancer• Preventative measures• Emails regarding eating healthy• Workshop with a Doctor for „Effects of sitting for long periods of time“• Health Workshop• Emails regarding the effects of smoking• Sessions with the objective of activating employees physically• Hiking sessions
We have gathered preferential rates for employees all around Kosovo for:• Gym• Fitness• Swimming Pools• Football.

34
Sustainability and corporate responsibilitySustainability has always been a fundamental principle for the RBI Group and a measure of corporate success. For 130 years Raiffeisen, has combined financial success with socially responsible action. The Bank understands sustainability to mean responsible corporate activities for long-term economic success in consideration of key societal and environmental aspects. As a subsidiary of RBI, Raiffeisen Bank Kosovo is committed to comply with the UN Global Compact Principles.1
Raiffeisen Bank Kosovo therefore commits to aligning its management structures and processes with this attitude. In the three sustainability areas of “Responsible banker”, “Fair partner” and “Engaged citizen”, which are closely linked to its business activities, the Bank endeavors to optimally apply its values and abilities to fostering sustainable development in the company and in society.
Being led by its sustainability guiding principles, the Bank works to make its business sustainable and wish to create sustainable value for its stakeholders. Its operational business activities are connected with environmental impacts that the Bank strives to keep as low as possible by means of systematic environmental management. As an employer, the Bank is responsible for ensuring safe and attractive working conditions for its employees. As a member of society, the Bank wants to contribute to the common good even beyond its business activities and take action in line with its capabilities.
1 A call to companies to align strategies and operations with universal principles on human rights, labour, environment and anti-corruption, and take actions that advance societal goals. www.unglobalcompact.org
Responsible banker
Environment
Socialy
Economy
We create
sustainable value
Product ecology
Our approach as designers of a sustainable company and society
Social product responsibility
Added value
Fair business and
operating practices
Susta
inable
entre
pren
eursh
ipAc
tive c
ivil s
ociet
y
and
publi
c inte
rest
Envir
onmen
taly
frien
dly so
ciety
Stakeholder inclusion
Inhouse ecology
Fair partner Enga
ged
citize
n

35
Add
ress
es
F
inan
cial
Sta
tem
ents
Segm
ent
Repo
rts
P
erfo
rman
ce a
nd F
inan
cial
s
Th
e Ba
nkin
g Se
ctor
RBI
Visi
on a
nd M
issio
n
M
anag
emen
t Bo
ard
Intro
duct
ion
Responsible bankerRaiffeisen Bank Kosovo in 2018 had many activities that have an effect of being a responsible banker in Kosovo.
In terms of governance and compliance, the Bank values responsibility and transparency, and applies these values in all its activities. The basis for this is the Bank’s Code of Conduct, which is applied across the Group, for all staff members and its business partners.
Lending policy and lending decision policy The Bank’s business model is oriented around the high level strategic goal of creating long-term value. Responsible lending is a significant component of this model. The Bank achieves this with a lending policy that is based on continuity. It remains a fair and reliable lender to businesses with future prospects, even in difficult times. In addition, the Bank holds a clear position regarding the handling of sensitive areas of business. Raiffeisen Bank Kosovo has introduced an environmental and social management system, including associated policy. This policy’s aim is to conduct business as a good and responsible corporate citizen. Accordingly, the Bank strives to comply with all the laws and regulations of Kosovo, including those dealing with environmental and social issues and is driven to improve environmental and social (E&S) risk management capacity to reduce credit and liability risks.
Sustainable lending During 2018, under Project Finance, the Bank continued to support and finance development of real estate projects in prime locations, by developers who have shown track record of qualitative building, timely delivering of the projects, and sustainable profitability. During the year, the Bank also tackled renewable energy projects, building a pipeline of the projects by understanding and preparing for financing of small hydropower plants as well as other renewable energy sources such as solar.
Responsible lending Raiffeisen Bank Kosovo is committed to responsible lending policies. This means that the Bank seeks to lend customers only as much as their financial situation can bear. If customers nonetheless fall into financial difficulties, the Bank supports them as best as it can with information and advice.
Customer satisfactionThe satisfaction of its customers is the Bank’s top priority. This is therefore measured regularly both in the retail and corporate businesses, in order to enable appropriate action when necessary. Customer satisfaction and service quality in the retail business have been measured for several years. In 2018, the Bank’s Net Promoter Score (NPS) was 44, which is higher than 39, which was the average market NPS score. Responsible sales practices and marketingFinancial affairs are a matter of trust. Raiffeisen Bank Kosovo therefore strives for clear and transparent labeling of products and services for all customers and stakeholders. When advertising and marketing its products, the Bank adheres to strict principles intended to protect its customers. False or misleading advertising is something the Bank feels is unacceptable.
Fair partnerCorruption and money laundering The Bank takes all the actions in order to avoid any form of corruption, money laundering, fraud or insider trading. A prerequisite in its business and operational practices is the fair, ethical and legally compliant behavior of all members of staff. Mechanisms for complying with is through the Code of Conduct (CoC) and clear, detailed regulations contained in the Compliance Manual.

36
Human ResourcesAs of 31 December 2018, the Bank had 845 employees (774 full time, 71 part time), with an additional 75 Direct Sales Agents. Compared to 2017, the total number of employees in 2018 increased for 5.1 per cent. The number of new employees who joined was 105. During 2018, the Bank had a regular internship program and several other projects involving interns. The number of interns who partnered with program and the projects was 157. The aim of the internship programs is to support under-graduate, Master Degree students and Graduated candidates of Kosovo in their professional development.
Professional developmentThe Bank offers its employees a variety of learning and development opportunities through on-job-training, internal and external classroom training, E-Learning, assignments and involvement in challenging local and international projects, blended learning, rotations etc. A specific focus was given to the concept of self-development and own initiative for online self-learning in 2018 and an important investment was made with the upgrading of the online Learning Management System, which offers high quality services for learners using the latest technology. The Bank cooperates with various training providers in and out of Kosovo for specific training programs. Training needs identification is done continuously in order to have tailored programs that meet employees’ needs. There are also individual development plans supported by individual coaching for a number of employees, which focus specifically on the competencies of an individual and increase the chances of personal development.
Engaged citizen The Bank consider itself an engaged corporate citizen, which actively champions sustainable development in the society. The commitment as corporate citizen goes beyond the core business and aims to develop the young population of Kosovo in culture, sports, technology and education. In addition, the Bank also contributed to the social welfare projects, with a particular focus on children and mothers in Kosovo.
Supported projects and initiativesDuring 2018, Raiffeisen Bank Kosovo continued to be traditional sponsor of different projects in five main areas: social welfare, culture, education, health and sport. Regarding the social welfare, the Bank continued to support the organization Action for Mother and Children that works on increasing the awareness and supporting the new mothers in Kosovo.
Culture remained one of the key areas that the Bank continued to be engaged. The main cultural projects that the Bank is supporting for ten years in a row are the two well-known festivals: the Chopin Piano Festival and the Prishtina Festival Film. The Chopin Piano Festival offers concerts, master courses for students and a symposium dedicated to the life and work of the composers or pianists being commemorated each year around the world. While, one of the most important events of the PriFest is the event series “PriFORUM Regional Coproduction”, which brings filmmakers from different countries of Europe and the world to Kosovo. Separate workshops and master courses for young artists were also part of these two main festivals.
Raiffeisen Bank Kosovo traditionally has supported National Gallery in the two main exhibitions “Muslim Mulliqi” and “Gjon Mili” that is positioning the Bank as main supporter of visual art. The National Gallery of Kosovo is the most active cultural public institution in Kosovo. Being the only public institution for the presentation of visual arts in Kosovo, this institution deals with the promotion of contemporary art in general (conceptual art, the performance, installation, video, painting and sculpture). The international exhibition “Muslim Mulliqi” was initiated in 2003 by the Kosovar Ministry of Culture to promote visual arts in Kosovo. Muslim Mulliqi Prize exhibition is the most significant exhibition for contemporary arts in Kosovo. It is a curated exhibition with local and international participants made by an external curator or curators who select both local and international participants.
In addition, the Bank continued to promote art with Raiffeisen Gallery. The idea was to give young, upcoming artists the opportunity to present their works to the public. For this purpose, the Bank has rented a space in Albi Mall, the Kosovo’s biggest shopping center, and this space was transformed into an innovative space where new works by young artists

37
Add
ress
es
F
inan
cial
Sta
tem
ents
Segm
ent
Repo
rts
P
erfo
rman
ce a
nd F
inan
cial
s
Th
e Ba
nkin
g Se
ctor
RBI
Visi
on a
nd M
issio
n
M
anag
emen
t Bo
ard
Intro
duct
ion
are exhibited every month. This helps the community to have a place where they can have an exhibition without any costs.
In terms of education and innovation in 2018, Raiffeisen Bank Kosovo supported Atomi project that focuses on identification and supporting people with extraordinary intelligence, gifted and talented people in Kosovo. More precisely, the goal of Atomi is early identification of students with extraordinary intelligence, gifted and talented students (hereafter: atomist) in order to offer proper possibilities, conditions, care and special schooling (enrichment) for these students based on their intellectual potentials, giftedness, talent, personality, ambitions, interests, motivation and their socio-economic conditions and circumstances. All these services and activities are provided in order to enable these students to develop and realize their full intellectual potential and therefore contribute firstly to their personal development and at the same time to social and national interest.
Another important project supported during 2018 were musical classes for children with Down Syndrome as well as summer camp for the SOS Kindergarten in Prishtina.
As a part of the support for education and innovation in 2018, the Bank continued cooperation with BoneVet. BONEVET is a stimulating environment for imagination, creativity and team building. Children learn by doing and by thinking about what they do. They get access to modern technology: ARDUINO, LITTLEBITS, COMPUTERS, 3D-PRINTERS, ELECTRONICS, CNC, and similar to make, to design, and to play. Thereby, they gain not only technical skills but also critical thinking, problem solving, teamwork, constructive communication, self-confidence. They learn values like equality, diversity, open-communication and freedom of voice.
Another activity in the area of innovation is the cooperation with Innovation Center of Kosovo (ICK) in the areas of Cyber Security and Fintechs, the Bank offered mentorship and educational sessions regarding these subjects in order to help start-up businesses that plan to invest in this area. In addition, Raiffeisen Bank Kosovo donated the opening of two computer labs in two private universities as part of Memorandum of Understanding between the Bank and Universities by equipping both labs with computers.
During 2018, Raiffeisen Bank Kosovo also supported different projects from the regional cities of Kosova as a part of open call. The supported projects were related to art, sports and environmental protection.

Financial statementsThe Independent Auditor’s Report and Separate Financial Statements for the year ended 31 December 2018 are prepared in accordance with International Financial Reporting Standards (IFRS)

Add
ress
es
F
inan
cial
Sta
tem
ents
Segm
ent
Repo
rts
P
erfo
rman
ce a
nd F
inan
cial
s
Th
e Ba
nkin
g Se
ctor
RBI
Visi
on a
nd M
issio
n
M
anag
emen
t Bo
ard
Intro
duct
ion
Independent Auditor’s Report 41Separate statement of financial position 42Separate statement of other comprehensive income 43Separate statement of changes in equity 44Separate statement of cash flows 45 Notes to the separate financial statements 46-111

40
Shukri Mustafa
Chief Operations Officer
Management Board Member
Statement of Management’s ResponsibilitiesTo the Shareholders and the Supervisory Board of Raiffeisen Bank Kosovo J.S.C.
We have prepared the financial statements as at 31 December 2018 and for the year then ended, which presents fairly, in all material respects the financial position of Raiffeisen Bank Kosovo J.S.C. (the “Bank”) as at 31 December 2018 and the results of its operations and its cash flows for the year ended. Management is responsible for ensuring that the Bank keeps accounting records that comply with the Kosovo banking regulations and can be suitable amended to disclose with reasonable accuracy the financial position of the Bank and the results of its operations and cash flows in accordance with International Financial Reporting Standards that include International Accounting Standards and Interpretations issued by the International Accounting Standards Board (the IASB) and the International Financial Reporting Interpretations Committee (IFRIC) of the IASB that are relevant to its operations and effective for related accounted periods. Management also has a general responsibility for taking such steps as are reasonably available to them to safeguard the assets of the Bank and prevent and detect fraud and other irregularities.
Management considers that, in preparing the financial statements, the Bank has used appropriate accounting policies, consistently applied and supported by reasonable and prudent judgment and estimates, and the appropriate International Financial Reporting Standards have been followed.
The financial statements are hereby approved on behalf of the Management Board.
Pristina, Kosovo25 April 2019
The Management Board
Johannes Riepl
Corporate Banking
Management Board Member
Iliriana Toçi
Retail Banking
Management Board Member
Robert Wright
Chief Executive Officer
Management Board Chairman

41
Add
ress
es
F
inan
cial
Sta
tem
ents
Segm
ent
Repo
rts
P
erfo
rman
ce a
nd F
inan
cial
s
Th
e Ba
nkin
g Se
ctor
RBI
Visi
on a
nd M
issio
n
M
anag
emen
t Bo
ard
Intro
duct
ion
Independent Auditors’ ReportTo the shareholders of Raiffeisen Bank Kosovo J.S.C.
OpinionWe have audited the separate financial statements of Raiffeisen Bank Kosovo J.S.C. (“the Bank”), which comprise the statement of financial position as at 31 December 2018, and the statement of comprehensive income, statement of changes in equity and statement of cash flows for the year then ended, and notes to the financial statements, including a summary of significant accounting policies. In our opinion, the separate financial statements presents fairly, in all material respects the financial position of the Bank as at 31 December 2018, and its financial performance and its cash flows for the year then ended in accordance with International Financial Reporting Standards (“IFRS”).
Basis for opinionWe conducted our audit in accordance with International Standards on Auditing (ISAs). Our responsibilities under those standards are further described in the Auditor’s responsibilities for the audit of the separate financial statements section of our report. We are independent of the Bank in accordance with the International Ethics Standards Board for Accountants’ Code of Ethics for Professional Accountants (IESBA Code) together with the ethical requirements that are relevant to our audit of the financial statements in Kosovo, and we have fulfilled our other ethical responsibilities in accordance with these requirements and the IESBA Code. We believe that the audit evidence we have obtained is sufficient and appropriate to provide a basis for our opinion.
Other information included in Raiffeisen Bank Kosovo J.S.C. 2018 Annual ReportOther information consists of the information included in Bank’s 2018 Annual Report other than the separate financial statements and our auditor’s report thereon. Management is responsible for the other information. The Bank’s 2018 Annual Report is expected to be made available to us after the date of this auditor’s report. Our opinion on the separate financial statements does not cover the other information and we will not express any form of assurance conclusion thereon.In connection with our audit of the separate financial statements, our responsibility is to read the other information identified above when it becomes available and, in doing so, consider whether the other information is materially inconsistent with the financial statements or our knowledge obtained in the audit or otherwise appears to be materially misstated.
Responsibilities of management and those charged with governance for the separate financial statementsManagement is responsible for the preparation and fair presentation of the separate financial statements in accordance with IFRS and for such internal control as management determines is necessary to enable the preparation of financial statements that are free from material misstatement, whether due to fraud or error. In preparing the separate financial statements, management is responsible for assessing the Bank’s ability to continue as a going concern, disclosing, as applicable, matters related to going concern and using the going concern basis of accounting unless management either intends to liquidate the Bank or to cease operations, or has no realistic alternative but to do so. Those charged with governance are responsible for overseeing the Bank’s financial reporting process.
Auditor’s responsibilities for the audit of the separate financial statementsOur objectives are to obtain reasonable assurance about whether the separate financial statements as a whole are free from material misstatement, whether due to fraud or error, and to issue an auditor’s report that includes our opinion.Reasonable assurance is a high level of assurance, but is not a guarantee that an audit conducted in accordance with ISAs will always detect a material misstatement when it exists. Misstatements can arise from fraud or error and are considered material if, individually or in the aggregate, they could reasonably be expected to influence the economic decisions of users taken on the basis of these separate financial statements. As part of an audit in accordance with ISAs, we exercise professional judgment and maintain professional skepticism throughout the audit. We also:• Identify and assess the risks of material misstatement of the separate financial statements, whether due to fraud or error, design and perform
audit procedures responsive to those risks, and obtain audit evidence that is sufficient and appropriate to provide a basis for our opinion. The risk of not detecting a material misstatement resulting from fraud is higher than for one resulting from error, as fraud may involve collusion, forgery, intentional omissions, misrepresentations, or the override of internal control.
• Obtain an understanding of internal control relevant to the audit in order to design audit procedures that are appropriate in the circumstances, but not for the purpose of expressing an opinion on the effectiveness of the Bank’s internal control.
• Evaluate the appropriateness of accounting policies used and the reasonableness of accounting estimates and related disclosures made by management.
• Conclude on the appropriateness of management’s use of the going concern basis of accounting and, based on the audit evidence obtained, whether a material uncertainty exists related to events or conditions that may cast significant doubt on the Bank’s ability to continue as a going concern. If we conclude that a material uncertainty exists, we are required to draw attention in our auditor’s report to the related disclosures in the separate financial statements or, if such disclosures are inadequate, to modify our opinion. Our conclusions are based on the audit evidence obtained up to the date of our auditor’s report. However, future events or conditions may cause the Bank to cease to continue as a going concern.
• Evaluate the overall presentation, structure and content of the separate financial statements, including the disclosures, and whether the separate financial statements represent the underlying transactions and events in a manner that achieves fair presentation.
We communicate with those charged with governance of Raiffeisen Bank Kosovo J.S.C. regarding, among other matters, the planned scope and timing of the audit and significant audit findings, including any significant deficiencies in internal control that we identify during our audit.
Ernst & Young Certified Auditors Kosovo sh.p.k. April 25, 2019Prishtina, Kosovo

42
Separate statement of financial position(amounts in € 000) Notes As at December As at December 31, 2018 31, 2017Assets Cash and cash equivalents and mandatory reserve 9 112,032 119,609Loans and advances from banks 10 24,733 39,551Financial assets at fair value through profit or loss 12 27,882 79,497Financial assets at fair value through other comprehensive income 12 95,840 -Financial investments – available-for-sale 12 - 102,726Debt instruments at amortised cost 12 - 12,332Loans and advances to customers 11 593,202 532,476Other assets 13 3,097 2,362Investments in subsidiaries 14 2,234 2,234Property, equipment and intangible assets 15 29,893 10,132
Total assets 888,913 900,919 Liabilities Deposits and borrowings from banks 16 618 9,174Deposits from customers 17 729,467 735,790Financial liabilities measured at fair value 18 812 1,100Other liabilities 18 10,236 8,639Provisions 18 537 109Current tax liability - 985Deferred tax liability 26 254 482Subordinated loan 19 19,325 19,325
Total liabilities 761,249 775,604 Shareholders’ equity Share capital 63,000 63,000Fair value reserve (386) 274Retained earnings 65,050 62,041
Total shareholder’s equity 20 127,664 125,315 Total liabilities and shareholder’s equity 888,913 900,919
Financial Statements are approved for issue on behalf of the Management of Raiffeisen Bank Kosovo J.S.C. and signed on its behalf on 25 April 2019 .
The separate statement of financial position is to be read in conjunction with the notes to and forming part of the separate financial statements set out on pages 46 to 111.
Robert WrightChief Executive Officer
Management Board Member
Fatos ShllakuHead of Finance

43
Add
ress
es
F
inan
cial
Sta
tem
ents
Segm
ent
Repo
rts
P
erfo
rman
ce a
nd F
inan
cial
s
Th
e Ba
nkin
g Se
ctor
RBI
Visi
on a
nd M
issio
n
M
anag
emen
t Bo
ard
Intro
duct
ion
Separate statement of profit and loss and other comprehensive income(amounts in € 000) Notes For the For the year ending year ending December December 31, 2018 31, 2017Interest income at effective interest 21 43,245 39,090Interest expense 21 (2,413) (2,494)
Net interest income 40,832 36,596 Dividend income 1,074 -Fee and commission income 22 17,569 18,976Fee and commission expense 22 (6,810) (6,085)
Net fee and commission income 10,759 12,891 Net trading expense (178) (59)Credit loss expense on loans and advances to customers 7 (4,639) (5,655)Credit loss expense on loans and advances from banks (25) -Credit loss expense for debt securities (39) -Recoveries from loans previously written off 1,740 1,493Expenses on provision for losses on commitments and contingent liabilities (175) 10Net gains on financial assets at fair value through profit or loss 115 235Other operating income 23 1,134 1,087
Net operating income 50,598 46,598 Personnel expenses 24 (12,815) (12,472)Depreciation of property and equipment 25 (1,611) (1,455)Amortisation of intangible assets 25 (1,639) (1,845)Other operating expenses 25 (11,510) (10,959)
Profit before income tax 23,023 19,867Income tax expense 26 (2,517) (2,288)Profit for the year 20,506 17,579 Other comprehensive income Items that are or may be reclassified to profit or loss Net change in fair value of Financial assets through other comprehensive income (660) Net change in fair value of available for sale financial assets - 314 Total comprehensive income for the year 19,846 17,893
The separate statement comprehensive income is to be read in conjunction with the notes to and forming part of the separate financial statements set out on pages 46 to 111

44
Separate statement of changes in equity
(amounts in € ‘000)
Share capital Retained earnings Fair value reserveTotal shareholder’s
equity
Balance at 1 January 2017 63,000 59,862 (40) 122,822
Profit for the year - 17,579 - 17,579
Net change in fair value of Financial investments – available-for-sale - - 314 314
Total comprehensive income 63,000 77,441 274 140,715
Contributions and distributions
Dividends to equity holders - (15,400) - (15,400)
Balance at 31 December 2017 63,000 62,041 274 125,315
Impact of adopting IFRS 9 Note 6 - 3 - 3
Restated opening balance under IFRS 9 Note 6 63,000 62,044 274 125,318
Profit for the year - 20,506 - 20,506
Net change in fair value of financial assets through other comprehensive income - - (660) (660)
Total comprehensive income 63,000 82,550 (386) 145,164
Contributions and distributions
Dividends to equity holders - (17,500) - (17,500)
Balance at 31 December 2018 63,000 65,050 (386) 127,664
The separate statement of changes in equity is to be read in conjunction with the notes to and forming part of the separate financial statements set out on pages 46 to 111.

45
Add
ress
es
F
inan
cial
Sta
tem
ents
Segm
ent
Repo
rts
P
erfo
rman
ce a
nd F
inan
cial
s
Th
e Ba
nkin
g Se
ctor
RBI
Visi
on a
nd M
issio
n
M
anag
emen
t Bo
ard
Intro
duct
ion
Separate statement of cash flow(amounts in € 000) Notes For the For the year ending year ending December December 31, 2018 31, 2017Cash flows from operating activities Interest received on loans 39,706 38,435Interest paid on placements 144 (93)Interest received on investment securities 2,296 4,005Interest paid on deposits and subordinated loan (2,909) (3,021)Fees and commissions received 17,569 18,976Fees and commissions paid (6,881) (5,488)Other income from non-banking activities 2,874 2,982Staff costs paid (12,762) (12,365)Other operating expenses paid (10,575) (6,428)Income tax paid (3,900) (2,550)
Cash flow from operating activities before changes in operating assets and liabilities 25,562 34,453Changes in operating assets and liabilities Mandatory liquidity reserve 293 (4,498)Loans and advances to banks 14,818 1,013Loans and advances to customers (72,858) (41,649)Investment securities 70,942 9,481Other assets (735) (926)Due to customers (5,757) 10,883Deposits from banks (202) 440Other liabilities 563 (5,211)
Net cash flow from operating activities 32,626 3,986Cash flows from investing activities Acquisition of property, equipment & intangible assets 15 (14,021) (3,116)Net cash used in investing activities (14,021) (3,116)Cash flows from financing activities Proceeds from borrowings 8 (8,354) -Proceeds from borrowings 8 - 8,223Dividends distributed 8 (17,500) (15,400)Net cash flow from financing activities (25,854) (7,177)Effect of exchange rate changes (34) (54)Net decrease in cash and cash equivalents (7,283) (6,361)Cash and cash equivalents at the beginning of year 9 47,986 54,347 Cash and cash equivalents at 31 December 9 40,703 47,986
The separate statement of cash flows is to be read in conjunction with the notes to and forming part of the separate financial statements set out on pages 46 to 111

46
Notes to the separate financial statements for the year ended 31 December 2018
1 Reporting entityRaiffeisen SEE Region Holding GmbH is the 100 per cent shareholder of Raiffeisen Bank Kosovo J.S.C. Raiffeisen SEE Region Holding GmbH is a 100 per cent indirect subsidiary of Raiffeisen Bank International AG, the ultimate parent.
The Bank operates under a banking licence issued by the Central Bank of the Republic of Kosovo - (“CBK”) on 8 November 2001. The Bank’s principal business activities are commercial and retail banking operations within Kosovo.
As at 31 December 2018 the Bank has 8 branches and 38 sub-branches within Kosovo (31 December 2017: 8 branches and 38 sub-branches). The Bank’s registered office is located at the following address: UCK Street No 51, 10000 Prishtina, Republic of Kosovo.
2 Basis of preparation
2.1 Basis of accounting
The separate financial statements have been prepared in accordance with International Financial Reporting Standards (“IFRS”) and its interpretations adopted by the International Accounting Standards Board (IASB).
2.2 New and amended standards and interpretations
In these financial statements, the Bank has applied IFRS 9, IFRS 15 and IFRS 7R, effective for annual periods beginning on or after 1 January 2018, for the first time. The Bank has not adopted early any other standard, interpretation or amendment that has been issued but is not yet effective.
2.2.1 IFRS 9 Financial Instruments
IFRS 9 replaces IAS 39 for annual periods on or after 1 January 2018.
The Bank has not restated comparative information for 2017 for financial instruments in the scope of IFRS 9. Therefore, the comparative information for 2017 is reported under IAS 39 and is not comparable to the information presented for 2018. Differences arising from the adoption of IFRS 9 have been recognized directly in retained earnings as of 1 Janu-ary 2018 and are disclosed in Note 6.
2.2.1.1 Changes to classification and measurement
To determine their classification and measurement category, IFRS 9 requires all financial assets, except equity instruments and derivatives, to be assessed based on a combination of the entity’s business model for managing the assets and the instruments’ contractual cash flow characteristics.
• The IAS 39 measurement categories of financial assets (fair value through profit or loss (FVPL), available for sale (AFS), held-to-maturity and amortised cost) have been replaced by:
• Debt instruments at amortised cost
• Debt instruments at fair value through other comprehensive income (FVOCI), with gains or losses recycled to profit or loss on derecognition
• Equity instruments at FVOCI, with no recycling of gains or losses o profit or loss on derecognition
• Financial assets FVPL
The accounting for financial liabilities remains largely the same as it was under IAS 39, except for the treatment of gains or losses arising from an entity’s own credit risk relating to liabilities designated at FVPL. Such movements are

47
Add
ress
es
F
inan
cial
Sta
tem
ents
Segm
ent
Repo
rts
P
erfo
rman
ce a
nd F
inan
cial
s
Th
e Ba
nkin
g Se
ctor
RBI
Visi
on a
nd M
issio
n
M
anag
emen
t Bo
ard
Intro
duct
ion
presented in OCI with no subsequent reclassification to the Profit or loss.
2.2.1.2 Changes to the impairment calculation
The adoption of IFRS 9 has fundamentally changed the Bank’s accounting for loan loss impairments by replacing IAS 39’s incurred loss approach with a forward-looking expected credit loss (“ECL”) approach. IFRS 9 requires the Bank to record an allowance for ECLs for all loans and other debt financial assets not held at FVPL, together with loan commit-ments and financial guarantee contracts. The allowance is based on the ECLs associated with the probability of default in the next twelve months unless there has been a significant increase in credit risk since origination. If the financial asset meets the definition of purchased or originated credit impaired (POCI), the allowance is based on the change in the ECLs over the life of the asset.
Details of the Bank’s impairment method are disclosed in Note 3 and 4. The quantitative impact of applying IFRS 9 as at 1 January 2018 is disclosed in Note 6.
2.2.2 IFRS 7R
To reflect the differences between IFRS 9 and IAS 39, IFRS 7 Financial Instruments: Disclosures was updated and the Bank has adopted it, together with IFRS 9, for the year beginning 1 January 2018. Changes include transition disclo-sures as shown in Note 6, detailed qualitative and quantitative information about the ECL calculations such as the as-sumptions and inputs used are set out in Note 6. Reconciliations from opening to closing ECL allowances are presented in Note 6 IFRS 7R also requires additional and more detailed disclosures for hedge accounting even for entities opting to continue to apply the hedge accounting requirements of IAS 39.
2.2.3 IFRS 15 Revenue from Contracts with Customers
IFRS 15 replaces all existing revenue requirements in IFRS (IAS 11 Construction Contracts, IAS 18 Revenue, IFRIC 13 Customer Loyalty Programmes, IFRIC 15 Agreements for the Construction of Real Estate, IFRIC 18 Transfers of Assets from Customers and SIC 31 Revenue – Barter Transactions Involving Advertising Services) and applies to all revenue arising from contracts with customers, unless the contracts are in the scope of other standards, such as IAS 17 Leases (or IFRS 16 Leases, once applied). Its requirements also provide a model for the recognition and measurement of gains and losses on disposal of certain non-financial assets, including property, plant and equipment and intangible assets. As the focus of IFRS 15 is not on accounting for revenue from financial instruments which in Bank’s case are treated under IFRS 9, the number of contracts to which the standard is applicable is very limited.
The Bank adopted IFRS 15 using the modified retrospective method of adoption with the date of initial application of 1 January 2018. The Bank elected to apply the standard to all contracts as at 1 January 2018. The comparative informa-tion was not restated and continues to be reported under IAS 18 and related interpretations.
IFRS 15 primarily includes within its scope the Fee and Commission income of the Bank (Note 22). These fees and com-missions are normally earned when transactions are executed, or are fees applied for accounts maintenance within a month or year, and typically performance obligations are satisfied and income recognised within the financial year. The adoption of IFRS 15 did not change the revenue recognition practices of the Bank.
2.3 Functional and presentation currency
The Bank’s functional currency used in preparing the financial statements is Euro as it is the currency of the primary eco-nomic environment in which the Bank operates and it reflects the economic substance of the underlying events (“functional currency”). All amounts have been rounded to the nearest thousands, except when otherwise indicated.
2.4 Use of judgments and estimates
In preparing these separate financial statements, management has made judgements, estimates and assumptions that affect the application of the Bank’s accounting policies and the reported amounts of assets, liabilities, income and ex-penses. Actual results may differ from these estimates.
Estimates and underlying assumptions are reviewed on an ongoing basis. Revisions to estimates are recognised pro-spectively.

48
3 Significant accounting policiesinformation about significant areas of estimation uncertainty and critical judgements in applying accounting policies that have the most significant effect on the amounts recognised in the separate financial statements are described in note 3.4, 4 and 5.
The accounting policies set below have been applied consistently to all the periods presented in these separate financial statements.
3.1 Subsidiaries and consolidation
Subsidiaries are entities controlled by the Bank. Control exists as the Bank is exposed, or has rights, to variable returns from its involvement with the investee (subsidiary) and has the ability to affect those returns through its power over the investee.
These financial statements represent the result and financial position of the Bank alone and do not include those of its subsidiaries, as detailed in Note 14.
The Bank prepares only separate financial statements in accordance with IFRS. The exemption from consolidation has been made as the Bank is itself a wholly-owned subsidiary and the ultimate parent Raiffeisen Bank International produces consolidated financial statements available for public use at http://www.rbinternational.com, in accordance with Inter-national Financial Reporting Standards.
Interests in subsidiaries are accounted for at cost in the separate financial statements.
3.2 Foreign currency transactions
Foreign exchange transactions are recorded at the rate ruling at the day of the transaction. Monetary assets and liabilities denominated in foreign currencies are translated at the rate of exchange ruling at the reporting date.
Foreign exchange gains and losses resulting from the settlement of such transactions and from the translation at year-end exchange rates of monetary assets and liabilities denominated in foreign currencies are recognized in profit or loss.
3.3 Financial assets and financial liabilities
3.3.1 Classification Financial assets
From 1 January 2018, the Bank classifies all its financial assets based on the business model for managing the assets and the asset’s contractual terms, measured at either:
• amortized cost,
• fair value through other comprehensive income (FVOCI); and
• fair value through profit or loss (FVTPL).
3.3.2 Classification Financial liabilities
Under IFRS 9, all financial liabilities are classified as subsequently measured at amortized cost except for the following items which are measured at FVTPL:
• Financial liabilities that are held for trading – including derivatives;
• Financial liabilities that arise when a transfer of a financial asset does not qualify for de-recognition or when the continuing involvement approach applies;
• Financial guarantees and below market rate interest loan commitments;
• Contingent consideration recognized by an acquirer in a business combination;
• Financial liabilities that are designated as at FVTPL on initial recognition.
The Bank classifies all its financial liabilities at amortized cost.

49
Add
ress
es
F
inan
cial
Sta
tem
ents
Segm
ent
Repo
rts
P
erfo
rman
ce a
nd F
inan
cial
s
Th
e Ba
nkin
g Se
ctor
RBI
Visi
on a
nd M
issio
n
M
anag
emen
t Bo
ard
Intro
duct
ion
3.3.3 Business Model
The Bank determines its business model at the level that best reflects how it manages groups of financial assets to achieve its business objective.
The Bank’s business model is not assessed on an instrument-by-instrument basis, but at a higher level of aggregated portfolios and is based on observable factors such as:
• How the performance of the business model and the financial assets held within that business model are evaluated and reported to the entity’s key management personnel;
• The risks that affect the performance of the business model (and the financial assets held within that business model) and, in particular, the way those risks are managed;
• How managers of the business are compensated (for example, whether the compensation is based on the fair value of the assets managed or on the contractual cash flows collected);
• The expected frequency, value and timing of sales are also important aspects of the Bank’s assessment.
However, the Bank’s expectations is that the highest level of aggregation possible is the Bank department Level. Further sub-portfolios should be used so that each portfolio has the same or similar.
• Business area;
• Performance evaluation KPI’s;
• Key Management Personal (B-1);
• Risks and risk management processes;
• IT Infrastructure.
The business model assessment is based on reasonably expected scenarios without taking ‘worst case’ or ‘stress case’ scenarios into account. If cash flows after initial recognition are realised in a way that is different from the Bank’s origi-nal expectations Bank does not change the classification of the remaining financial assets held in that business model, but incorporates such information when assessing newly originated or newly purchased financial assets going forward.
3.3.4 Contractual cash flow characteristic
Once the Bank determines that the business model of a specific portfolio is to hold the financial assets to collect the contractual cash flows (or by both collecting contractual cash flows and selling financial assets), it assesses whether the contractual terms of the financial asset give rise on specific dates to cash flows that are solely payments of principal and interest on the principal amount outstanding. For this purpose, interest is defined as consideration for the time value of money and for the credit risk associated with the principal amount outstanding during a particular period of time and for other basic lending risks (for example liquidity) and costs (for example administrative), as well as a profit margin.
In assessing whether the contractual cash flows are solely payments of principal and interest the bank will consider the contractual terms of the instrument. This will include assessing whether the financial asset contains a contractual term that could change the timing or amount of contractual cash flows such that it would not meet this condition. The Bank considers:
• Prepayment, extension terms;• Leverage features;• Claim is limited to specified assets or cash flows;• Contractually linked instruments.
Contractually linked instruments
This assessment needs to be carried out on an instrument by instrument basis on the date of initial recognition of the financial asset.
3.3.5 Modification of Time Value of Money and the Benchmark Test
Time value of money is the element of interest that provides consideration for only the passage of time. It does not take into account other risks (credit, liquidity etc.) or costs (administrative etc.) associated with holding a financial asset.
In some cases, the time value of money element may be modified (imperfect). That would be the case, for example, if a financial asset’s interest rate is periodically reset but the frequency of that reset does not match the tenor of the interest rate. In this case units must assess the modification as to whether the contractual cash flows still represent solely payments of principal and interest, i.e. the modification term does not significantly alter the cash flows from a ‘perfect’ benchmark instrument. This assessment is not an accounting policy choice and cannot be avoided simply by concluding that an

50
instrument, in the absence of such an assessment, will be measured at fair value.
For the following main contractual features that can potentially modify the time value of money a benchmark test is applied:
• Reset rate frequency does not match interest tenor;
• Lagging indicator;
• Smoothing clause;
• Grace period;
• Secondary market yield reference.
The benchmark test for any applicable product in the bank level is conducted by RBI HO in Vienna.
3.3.6 Recognition of financial assets and liabilities
The Bank initially recognises loans, receivables, and other financial liabilities on the date on which they are originated. All other financial instruments (including regular-way purchases and sales of financial assets) are recognised on the trade date, which is the date on which the Bank becomes a party to the contractual provisions of the instrument.
A financial asset or financial liability is measured initially at fair value plus, for an item not at fair value through profit or loss, transaction costs that are directly attributable to its acquisition or issue.
3.3.7 Derecognition of financial assets and liabilities
3.3.7.1 Derecognition due to substantial modification of terms and conditions - Policy applicable after 1 January 2018 (IFRS 9)
The Bank derecognises a financial asset, such as a loan to a customer, when the terms and conditions have been rene-gotiated to the extent that, substantially, it becomes a new loan, with the difference recognised as a derecognition gain or loss, to the extent that an impairment loss has not already been recorded. The newly recognised loans are classified as Stage 1 for ECL measurement purposes, unless the new loan is deemed to be POCI.
• When assessing whether or not to derecognise a loan to a customer, amongst others, the Bank considers the following factors:
• Change in currency of the loan
• Introduction of an equity feature
• Change in counterparty
• If the modification is such that the instrument would no longer meet the SPPI criterion
If the modification does not result in cash flows that are substantially different, the modification does not result in derecog-nition. Based on the change in cash flows discounted at the original EIR, the Bank records a modification gain or loss, to the extent that an impairment loss has not already been recorded.
3.3.7.2 Derecognition other than substantial modification - Policy applicable from 1 January 2018 (IFRS 9)
Financial assets
A financial asset (or, where applicable, a part of a financial asset or part of a group of similar financial assets) is derec-ognised when the rights to receive cash flows from the financial asset have expired. The Bank also derecognises the financial asset if it has both transferred the financial asset and the transfer qualifies for derecognition.
• The Bank has transferred the financial asset if, and only if, either:
The Bank has transferred its contractual rights to receive cash flows from the financial asset;
or
• It retains the rights to the cash flows, but has assumed an obligation to pay the received cash flows in full without material delay to a third party under a ‘pass–through’ arrangement.
Pass-through arrangements are transactions whereby the Bank retains the contractual rights to receive the cash flows of a financial asset (the ‘original asset’), but assumes a contractual obligation to pay those cash flows to one or more entities (the ‘eventual recipients’), when all of the following three conditions are met:

51
Add
ress
es
F
inan
cial
Sta
tem
ents
Segm
ent
Repo
rts
P
erfo
rman
ce a
nd F
inan
cial
s
Th
e Ba
nkin
g Se
ctor
RBI
Visi
on a
nd M
issio
n
M
anag
emen
t Bo
ard
Intro
duct
ion
• The Bank has no obligation to pay amounts to the eventual recipients unless it has collected equivalent amounts from the original asset, excluding short-term advances with the right to full recovery of the amount lent plus ac-crued interest at market rates,
• The Bank cannot sell or pledge the original asset other than as security to the eventual recipients,
• The Bank has to remit any cash flows it collects on behalf of the eventual recipients without material delay.
In addition, the Bank is not entitled to reinvest such cash flows, except for investments in cash or cash equivalents includ-ing interest earned, during the period between the collection date and the date of required remittance to the eventual recipients.
A transfer only qualifies for derecognition if either:
• The Bank has transferred substantially all the risks and rewards of the asset,
or
• The Bank has neither transferred nor retained substantially all the risks and rewards of the asset, but has trans-ferred control of the asset
The Bank considers control to be transferred if and only if, the transferee has the practical ability to sell the asset in its entirety to an unrelated third party and is able to exercise that ability unilaterally and without imposing additional restric-tions on the transfer.
When the Bank has neither transferred nor retained substantially all the risks and rewards and has retained control of the asset, the asset continues to be recognised only to the extent of the Bank’s continuing involvement, in which case, the Bank also recognises an associated liability. The transferred asset and the associated liability are measured on a basis that reflects the rights and obligations that the Bank has retained.
If continuing involvement takes the form of a written or purchased option (or both) on the transferred asset, the continuing involvement is measured at the value the Bank would be required to pay upon repurchase. In the case of a written put option on an asset that is measured at fair value, the extent of the entity’s continuing involvement is limited to the lower of the fair value of the transferred asset and the option exercise price.
Financial liabilities
A financial liability is derecognised when the obligation under the liability is discharged, cancelled or expires. Where an existing financial liability is replaced by another from the same lender on substantially different terms, or the terms of an existing liability are substantially modified, such an exchange or modification is treated as a derecognition of the original liability and the recognition of a new liability. The difference between the carrying value of the original financial liability and the consideration paid is recognised in profit or loss.
3.3.7.3 Derecognition of financial assets and liabilities (Policy applicable before 1 January 2018 IAS 39)
The Bank derecognized a financial asset when the contractual rights to the cash flows from the financial asset expire, or it transferred the rights to receive the contractual cash flows in a transaction in which substantially all of the risks and rewards of ownership of the financial asset were transferred or in which the Bank neither transferred nor retained substan-tially all of the risks and rewards of ownership and it did not retain control of the financial asset.
On derecognition of a financial asset, the difference between the carrying amount of the asset (or the carrying amount allocated to the portion of the asset derecognised) and the sum of the consideration received (including any new asset obtained less any new liability assumed) and any cumulative gain or loss that had been recognised in other comprehen-sive income was recognised in profit or loss. Any interest in transferred financial assets that qualified for derecognition that was created or retained by the Bank was recognised as a separate asset or liability.
The Bank derecognised a financial liability when its contractual obligations are discharged or cancelled, or expired.
3.3.8 Offsetting
Financial assets and financial liabilities are offset and the net amount presented in the statement of financial position when, and only when, the Bank has a legal right to set off the amounts and it intends either to settle them on a net basis or to realize the asset and settle the liability simultaneously.
Income and expenses are presented on a net basis only when permitted under IFRS.

52
3.3.9 Amortised cost measurement
The ‘amortized cost’ of a financial asset or financial liability is the amount at which the financial asset or financial li-ability is measured at initial recognition, minus principal repayments, plus or minus the cumulative amortization using the effective interest method of any difference between the initial amount recognized and the maturity amount, minus any reduction for impairment.
3.3.10 Fair value measurement
‘Fair value’ is the price that would be received to sell an asset or paid to transfer a liability in an orderly transaction between market participants at the measurement date in the principal or, in its absence, the most advantageous market to which the Bank has access at that date. The fair value of a liability reflects its non-performance risk.
The objective of using a valuation technique is to establish what the transaction price (ie an exit price) would have been on the measurement date in an orderly transaction between market participants. Fair value is estimated on the basis of the results of a valuation technique that takes maximum use of market inputs, and relies as little as possible on entity-specific inputs. A valuation technique would be expected to arrive at a realistic estimate of the fair value if:
a) it reasonably reflects how the market could be expected to price the instrument and
b) the inputs to the valuation technique reasonably represent market expectations and measures of the risk-return factors inherent in the financial instrument.
Therefore, a valuation technique
a) incorporates all factors that market participants would consider in setting a price and
b) is consistent with accepted economic methodologies for pricing financial instruments.
The best evidence of the fair value of a financial instrument at initial recognition is the transaction price (ie the fair value of the consideration given or received). Other methodologies include comparing the fair value of that instrument is by comparison with other observable current market transactions in the same/similar instrument (ie without modification or repackaging) or based on a valuation technique whose variables include data from observable markets. The discounted cash flow approach is a technique used to link future amounts (cash flows) to the present through a discount rate.
Present value concepts are central to the development of techniques for estimating the fair value of financial instruments because the market exit price of a financial instrument represents market participant’s collective estimate of the present value of its expected cash flows. Therefore, cash flows and discount rate should reflect only factors that are specific to the financial instrument being measured and should reflect assumptions that market participants would use in their estimates of fair value. Also, as the cash flows used are estimates rather than known amounts, a fair value estimate, using present value, is made under conditions of uncertainty.
As market participants generally seek compensation for bearing the uncertainty inherent in cash flows (risk premium), the effect of variability (risk) in the cash flows should be reflected either in the cash flows or in the discount rate.
In applying discounted cash flow (“DCF”) analysis, the Bank has to use discount rates equal to the prevailing rates of return for financial instruments having substantially the same terms and characteristics, including the credit quality of the instrument, the remaining term over which the contractual interest rate is fixed, the remaining term to the principal’s re-payment and the currency in which payments are to be made. The cash flows used in the DCF model should “fit” to the discount rate and they should also take into consideration the characteristics mentioned above (e.g. remaining term of the contractual interest rate and of the principal).
When available, the Bank measures the fair value of an instrument using the quoted price in an active market for that instrument. A market is regarded as active if transactions for the asset or liability take place with sufficient frequency and volume to provide pricing information on an ongoing basis. If there is no quoted price in an active market, then the Bank uses valuation techniques that maximise the use of relevant observable inputs and minimise the use of unobservable inputs. The chosen valuation technique incorporates all of the factors that market participants would take into account in pricing a transaction.

53
Add
ress
es
F
inan
cial
Sta
tem
ents
Segm
ent
Repo
rts
P
erfo
rman
ce a
nd F
inan
cial
s
Th
e Ba
nkin
g Se
ctor
RBI
Visi
on a
nd M
issio
n
M
anag
emen
t Bo
ard
Intro
duct
ion
The best evidence of the fair value of a financial instrument at initial recognition is normally the transaction price – i.e. the fair value of the consideration given or received.
If the Bank determines that the fair value at initial recognition differs from the transaction price and the fair value is evi-denced neither by a quoted price in an active market for an identical asset or liability nor based on a valuation technique that uses only data from observable markets, then the financial instrument is initially measured at fair value, adjusted to defer the difference between the fair value at initial recognition and the transaction price.
Subsequently, that difference is recognised in profit or loss on an appropriate basis over the life of the instrument but no later than when the valuation is wholly supported by observable market data or the transaction is closed out. If an asset or a liability measured at fair value has a bid price and an ask price, then the Bank measures assets and long positions at a bid price and liabilities and short positions at an ask price.
The fair value of a demand deposit is not less than the amount payable on demand, discounted from the first date on which the amount could be required to be paid. The Bank recognizes transfers between levels of the fair value hierarchy as of the end of the reporting period during which the change has occurred.
3.3.11 Financial guarantees, letters of credit and undrawn loan commitments
The Bank issues financial guarantees, letters of credit and loan commitments.
Financial guarantees are initially recognised in the financial statements (within Provisions) at fair value, being the premium received. Subsequent to initial recognition, the Bank’s liability under each guarantee is measured at the higher of the amount initially recognised less cumulative amortisation recognised in the income statement, and – under IAS 39 – the best estimate of expenditure required to settle any financial obligation arising as a result of the guarantee, or – under IFRS 9 – an ECL provision as set out in Note 18.1. The premium received is recognized in the income statement in Net fees and commission income on a straight-line basis over the life of the guarantee. Undrawn loan commitments and letters of credits are commitments under which, over the duration of the commitment, the Bank is required to provide a loan with pre-specified terms to the customer. Similar to financial guarantee contracts, under IAS 39, a provision was made if they were an onerous contract but, from 1 January 2018, these contracts are in the scope of the ECL requirements.
The nominal contractual value of financial guarantees, letters of credit and undrawn loan commitments, where the loan agreed to be provided is on market terms, are not recorded on in the statement of financial position. The nominal values of these instruments together with the corresponding ECLs are disclosed in Note 12.

54
3.3.12 Impairment of financial assets (Policy applicable from 1 January 2018)
The adoption of IFRS 9 has fundamentally changed the Bank’s loan loss impairment method by replacing IAS 39’s incurred loss approach with a forward-looking ECL approach. From 1 January 2018, the Bank has been recording the allowance for expected credit losses for all loans and other debt financial assets not held at FVPL, together with loan commitments and financial guarantee contracts. Equity instruments are not subject to impairment under IFRS 9. IFRS 9 uses an expected credit loss model to recognise impairment in contrast to IAS 39 which uses an incurred loss model. The expected credit loss model applies to debt instruments at amortised cost or at fair value through other comprehensive in-come, lease receivables, contract assets and loan commitments and financial guarantee contracts that are not measured at fair value through profit or loss.
The Bank has established a policy to perform an assessment, at the end of each reporting period, of whether a financial instrument’s credit risk has increased significantly since initial recognition, by considering the change in the risk of default occurring over the remaining life of the financial instrument.
Based on the above process, the Bank groups its loans into Stage 1, Stage 2, Stage 3 and POCI, as described below:
• Stage 1: When loans are first recognised, the Bank recognises an allowance based on 12mECLs. Stage 1 loans also include facilities where the credit risk has improved and the loan has been reclassified from Stage 2.
• Stage 2: When a loan has shown a significant increase in credit risk since origination, the Bank records an allowance for the Lifetime expected credit losses - LTECLs. Stage 2 loans also include facilities, where the credit risk has improved and the loan has been reclassified from Stage 3.
• Stage 3: Loans considered credit-impaired (as outlined in Note 4). The bank records an allowance for the LTECLs.
• POCI: Purchased or originated credit impaired (POCI) assets are financial assets that are credit impaired on initial recognition. POCI assets are recorded at fair value at original recognition and interest income is subse-quently recognised based on a credit-adjusted EIR. ECLs are only recognised or released to the extent that there is a subsequent change in the expected credit losses. For financial assets for which the Bank has no reasonable expectations of recovering either the entire outstanding amount, or a proportion thereof, the gross carrying amount of the financial asset is reduced. This is considered a (partial) derecognition of the financial asset.
There are 3 main approaches which can be used to calculate expected credit losses these are:A. General approachB. Simplified approach
C. Purchase or originated credit impaired financial assets
A. General Approach
Using the general approach the amount of expected credit losses recognised as a loss allowance or provision depends on the assessment of the extent of credit deterioration since initial recognition.
The general approach is applied for ECL estimation for loans and advances to customers, loans and advances to banks and financial investments which requires the use of complex models and significant assumptions about future eco-nomic conditions and payment behaviour.
Significant judgements are required in applying the accounting requirements for measuring expected credit losses, inter alia:
• Determining criteria for significant increase in credit risk• Choosing appropriate models and assumptions for the measurement of expected credit losses• Expected credit losses should be recognised is based on significant increases in the likelihood or risk of a de-
fault occurring since initial recognition irrespective of whether a financial instrument has been repriced to reflect an increase in credit risk. Establishing the number and relative weightings of forward-looking scenarios for each type of product/market and the associated expected credit losses.
• Establishing groups of similar financial assets for the purposes of measuring expected credit losses.
Definition of default
The bank considers a financial instrument defaulted and therefore Stage 3 when one or more of the following quantita-tive, qualitative or backstop criteria have been met:

55
Add
ress
es
F
inan
cial
Sta
tem
ents
Segm
ent
Repo
rts
P
erfo
rman
ce a
nd F
inan
cial
s
Th
e Ba
nkin
g Se
ctor
RBI
Visi
on a
nd M
issio
n
M
anag
emen
t Bo
ard
Intro
duct
ion
Quantitative criteria
The borrower is more than 90 days past due on a material credit obligation. No attempt is made to rebut the presump-tion that financial assets which are more than 90 days past due are to be shown in Stage 3.
Qualitative criteria
The borrower meets unlikeliness to pay criteria, which indicate that the borrower is in significant financial difficulty and unlikely to repay any credit obligation in full. The indications of unlikeliness to pay include
• A credit obligation is put to a non-accrual status due to its deteriorated credit quality• A credit obligation is sold at a material economic loss• A credit obligation is subject to a distressed restructuring• An obligor is bankrupt/insolvent• An obligor committed credit fraud
• An obligor is deceased
• A credit contract was prematurely terminated due to obligor’s non-compliance with contractual obligations.
The criteria above have been applied to all financial instruments held by the bank and are consistent with the definition of default used for internal credit risk management purposes. The default definition has been applied consistently to model the Probability of Default (PD), Exposure at Default (EAD) and Loss given Default (LGD) throughout bank’s expected loss calculations.
A credit obligation is considered to no longer be in default after a probation period of minimum three months (six months after a distressed restructuring in retail), where during the probation period the customer demonstrated good payment discipline and no other indication of unlikeliness to pay was observed.
Significant increase in credit risk
A number of factors are relevant when assessing significant increase in credit risk. The list of SICR triggers contains mostly information which is in Bank part of the internal rating model, i.e. used as an input for credit rating assignment. Having the information already embedded in the internal rating, the quantitative staging method is sufficient for accurate assess-ment of significant increase in credit risk.
The quantitative staging criterion is applied individually for every facility. No grouping of exposure is performed, which means that the measurement of a significant increase of credit risk is not performed on a collective basis. For this purpose if the borrower is more than 30 days past due on a material credit obligation.
Qualitative criteria
The qualitative criteria used by Bank regarding to SICR include:
• Changes in the entity’s credit management approach in relation to the financial instrument;
• Expected changes in the loan documentation (i.e., changes in contract terms);
• Significant changes in external market indicators of credit risk for a particular financial instrument or similar financial instruments with the same expected life.
Internal rating
Bank include also internal rating to determine SICR;
• Significant changes in internal price indicators of credit risk as a result of a change in credit risk since inception;
• An actual or expected significant change in the financial instrument’s external credit rating;
• An actual or expected internal credit rating downgrade for the borrower;
• Existing or forecast adverse changes in business, financial or economic conditions;

56
• An actual or expected significant change in the operating results of the borrower;
• Significant increases in credit risk on other financial instruments of the same borrower;
• An actual or expected significant adverse change in the regulatory, economic, or technological environment of the borrower;
• Significant changes in the value of the collateral supporting the obligation;
• A significant change in the quality of the guarantee provided by a shareholder;
• Significant changes, such as reductions, in financial support from a parent entity or other affiliate or an actual or expected significant change in the quality of credit enhancement;
• Significant changes in the expected performance and behaviour of the borrower;
• Other changes in the rates or terms of an existing financial instrument that would be significantly different if the instrument was newly originated or issued at the reporting date
Explanation of inputs, assumptions and estimation techniques
The expected credit loss is measured on either a 12-month or lifetime basis depending on whether a significant increase in credit risk has occurred since initial recognition or whether an asset is considered to be credit-impaired. Forward-looking economic information is also included in determining the 12-month and lifetime PD, EAD and LGD. These as-sumptions vary by product type.
Expected credit losses are the discounted product of the probability of default (PD), loss given default (LGD), exposure at default (EAD) and discount factor (D).
Probability of Default (PD)
The probability of default represents the likelihood of a borrower defaulting on its financial obligation either over the next twelve months or over the remaining lifetime of the obligation. In general the lifetime probability of default is calculated using the regulatory twelve month probability of default, stripped of any margin of conservatism, as a starting point. Thereafter various statistical methods are used to generate an estimate of how the default profile will develop from the point of initial recognition throughout the lifetime of the loan or portfolio of loans. The profile is based on historical ob-served data and parametric functions.
Different models have been used to estimate the default profile of outstanding lending amounts and these can be grouped into the following categories:
• Sovereign, local and regional governments, insurance companies and collective investment undertakings: The default profile is generated using a transition matrix approach. Forward looking information is incorporated into the probability of de-fault using the Vasicek one factor model.
• Corporate customers, project finance and financial institutions: The default profile is generated using a paramet-ric survival regression (Weibull) approach. Forward looking information is incorporated into the probability of default using the Vasicek one factor model. The default rate calibration is based on Kaplan Maier methodology with withdrawal adjustment.
• Retail mortgages and other retail lending: The default profile is generated using parametric survival regression in competing risk frameworks. Forward looking information is incorporated into the probability of default using satellite models.
In the limited circumstances where some inputs are not fully available grouping, averaging and benchmarking of inputs is used for the calculation.
Loss Given Default (LGD)
Loss given default represents bank’s expectation of the extent of loss on a defaulted exposure. Loss given default varies by type of counterparty and product. Loss given default rates are estimated under each asset class as follows:
• Sovereign: The loss given default is found by using market implied sources.
• Corporate customers, project finance, financial institutions, local and regional governments, insurance com-panies: The loss given default is generated by discounting cash flows collected during the workout process.
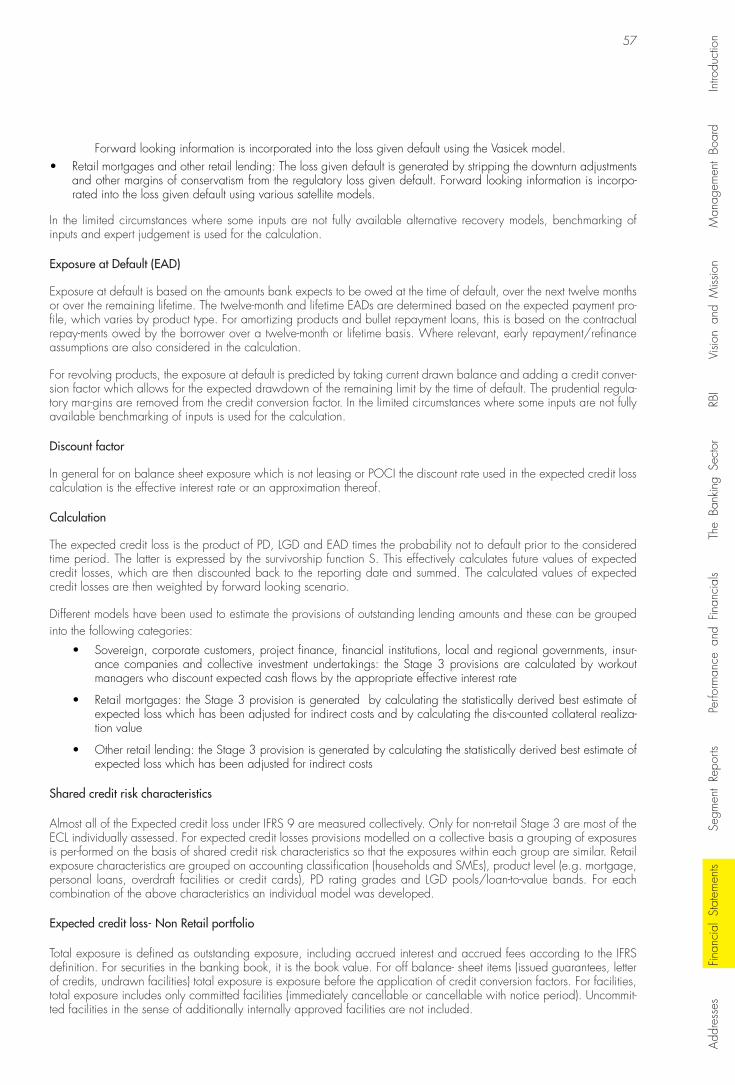
57
Add
ress
es
F
inan
cial
Sta
tem
ents
Segm
ent
Repo
rts
P
erfo
rman
ce a
nd F
inan
cial
s
Th
e Ba
nkin
g Se
ctor
RBI
Visi
on a
nd M
issio
n
M
anag
emen
t Bo
ard
Intro
duct
ion
Forward looking information is incorporated into the loss given default using the Vasicek model.• Retail mortgages and other retail lending: The loss given default is generated by stripping the downturn adjustments
and other margins of conservatism from the regulatory loss given default. Forward looking information is incorpo-rated into the loss given default using various satellite models.
In the limited circumstances where some inputs are not fully available alternative recovery models, benchmarking of inputs and expert judgement is used for the calculation.
Exposure at Default (EAD)
Exposure at default is based on the amounts bank expects to be owed at the time of default, over the next twelve months or over the remaining lifetime. The twelve-month and lifetime EADs are determined based on the expected payment pro-file, which varies by product type. For amortizing products and bullet repayment loans, this is based on the contractual repay-ments owed by the borrower over a twelve-month or lifetime basis. Where relevant, early repayment/refinance assumptions are also considered in the calculation.
For revolving products, the exposure at default is predicted by taking current drawn balance and adding a credit conver-sion factor which allows for the expected drawdown of the remaining limit by the time of default. The prudential regula-tory mar-gins are removed from the credit conversion factor. In the limited circumstances where some inputs are not fully available benchmarking of inputs is used for the calculation.
Discount factor
In general for on balance sheet exposure which is not leasing or POCI the discount rate used in the expected credit loss calculation is the effective interest rate or an approximation thereof.
Calculation
The expected credit loss is the product of PD, LGD and EAD times the probability not to default prior to the considered time period. The latter is expressed by the survivorship function S. This effectively calculates future values of expected credit losses, which are then discounted back to the reporting date and summed. The calculated values of expected credit losses are then weighted by forward looking scenario.
Different models have been used to estimate the provisions of outstanding lending amounts and these can be grouped into the following categories:
• Sovereign, corporate customers, project finance, financial institutions, local and regional governments, insur-ance companies and collective investment undertakings: the Stage 3 provisions are calculated by workout managers who discount expected cash flows by the appropriate effective interest rate
• Retail mortgages: the Stage 3 provision is generated by calculating the statistically derived best estimate of expected loss which has been adjusted for indirect costs and by calculating the dis-counted collateral realiza-tion value
• Other retail lending: the Stage 3 provision is generated by calculating the statistically derived best estimate of expected loss which has been adjusted for indirect costs
Shared credit risk characteristics
Almost all of the Expected credit loss under IFRS 9 are measured collectively. Only for non-retail Stage 3 are most of the ECL individually assessed. For expected credit losses provisions modelled on a collective basis a grouping of exposures is per-formed on the basis of shared credit risk characteristics so that the exposures within each group are similar. Retail exposure characteristics are grouped on accounting classification (households and SMEs), product level (e.g. mortgage, personal loans, overdraft facilities or credit cards), PD rating grades and LGD pools/loan-to-value bands. For each combination of the above characteristics an individual model was developed.
Expected credit loss- Non Retail portfolio
Total exposure is defined as outstanding exposure, including accrued interest and accrued fees according to the IFRS definition. For securities in the banking book, it is the book value. For off balance- sheet items (issued guarantees, letter of credits, undrawn facilities) total exposure is exposure before the application of credit conversion factors. For facilities, total exposure includes only committed facilities (immediately cancellable or cancellable with notice period). Uncommit-ted facilities in the sense of additionally internally approved facilities are not included.

58
Off-balance sheet financial instruments are also in scope of impairment calculation. To reflect possible risk arising from drawing off-balance sheet exposure, the bank uses models predicting the likelihood of drawing a particular off-balance sheet position and converting it into an on-balance financial instrument.
Collateral
Collateral plays a limited role in assessing whether there has been a significant increase in credit risk. Staging methods are based on the credit risk parameters without consideration of the collateral. In contrast to staging, the collateral does affect the measurement of expected credit losses. If a loan is guaranteed by a third party, it will receive an impairment resulting from the combined credit risk of the original customer and the guarantor if also applied in Risk-Weighted Assets – (RWA) calculation. The expected credit loss will be measured based on the PD of the guarantor and not of the original customer. If the collateral exceeds the exposure amount, the expected loss on that financial instrument will be zero. Col-laterals in impairment model are expressed in terms of weighted collateral value (WCV), which is the collateral value according to the internal collateral evaluation.
Unsecured exposure
If expected from collateral proceeds (i.e. if we assume the correct internal collateral valuation), impairment applies only to unsecured part of financial instrument. For each asset in the impairment relevant portfolio, such calculation of the unsecured exposure is performed. What impairment calculation model needs is, eventually, a run-off exposure profile of the unsecured part. Since cash flow amounts comprise a repayment of full gross exposure from both, a secured and an unsecured part, we adjust the original repayment schedule by using scaling factors to model cash flows covering only unsecured part of exposure. In this way the cash flows timing is preserved and only the cash flow amounts are proportionally adjusted.
Loss given default LGD
In case of a default event the parameter LGD indicates how much of the outstanding exposure will be lost. In case suf-ficient loss data is available the LGD can be estimated by comparing the outstanding exposure with discounted cashflows (‘workout LGD’). If the available loss data is limited external data can be used (‘Implied Market LGD’).
Effective interest rate (EIR)
Effective interest rate is determined on contractual cash flows. For a fixed-rate financial asset, the EIR on the initial recogni-tion should be used, while for a floating-rate financial asset, the current EIR should be applied. For a POCI financial asset, the credit-adjusted EIR determined on the initial recognition is required. For a financial asset in default, the last available EIR before the reclassification is to be used.
Stage 1
Impairment stage 1 represents expected credit losses from default events possible within 12 months after reporting date. Stage 1 expected loss is defined as a portion of the lifetime expected credit loss. A 12-month expected credit loss is recognized in two cases:
• if no significant increase in credit risk on financial instrument has occurred or
• at initial recognition of financial instrument.
Stage 1 covers expected loss from default events expected until 12 months after balance sheet date. It does not cover losses on financial instruments likely to default in 12 months. Or expressed differently, it does not cover expected cash shortfalls over 12 months. In stage 1, the maximum period to consider when calculating expected losses is 12 months. For all long-term financial instruments (maturity longer than 1 year), the impairment is based on the 12-month ECL instead of the lifetime ECL, which is the main advantage of the stage 1. Parameters included in the ECL calculation have the 12-month horizon, which is to a certain extent similar to the IAS 39 portfolio loan loss calculation model. Nevertheless, all short-term financial instruments (maturity in less than 1 year) are treated according to the lifetime expected loss ap-proach. In contrast to IAS 39, it is allowed to apply a maturity based expected loss calculation instead of a 12-month expected loss calculation. Practically speaking, short-term financial instruments are in stage 1 measured with the lifetime expected credit loss which represents only the portion of the 12-month expected credit loss. In such cases, stage 1 and stage 2 expected credit losses will be lifetime expected credit losses and, therefore, equal. For off-balance sheet financial instruments an estimate of 12-month expected credit loss (or lifetime for shortterm maturities) is based on the expectations of the portion of the off-balance sheet position that will be drawn down within 12 months from the reporting date. The expected loss calculation does not differ between stage 1 and stage 2. Only the time horizon is different.

59
Add
ress
es
F
inan
cial
Sta
tem
ents
Segm
ent
Repo
rts
P
erfo
rman
ce a
nd F
inan
cial
s
Th
e Ba
nkin
g Se
ctor
RBI
Visi
on a
nd M
issio
n
M
anag
emen
t Bo
ard
Intro
duct
ion
Stage 2.
The Standard defines credit loss as the difference between all contractual cash flows that are due in
accordance with the contract and all the cash flows that the bank expects to receive (i.e., all cash shortfalls), discounted at the original effective interest rate (or credit-adjusted effective interest rate for POCI assets). The lifetime expected credit losses are defined as the expected credit losses that result from all possible default events over the expected life of a finan-cial instrument. The risk of a default occurring on the financial instrument during its expected life needs to be estimated.
The calculation of the expected credit loss (ECL) for stage 1 and stage 2 is using the same equation. The only differ-ence between stage 1 and stage 2, besides the different time perspective, is that for stage 2 the expected credit loss is discounted with the effective interest rate (EIR) for all financial instruments, whereas in stage 1 only expected losses for financial instruments maturing in 12 months are discounted with EIR.
Stage 3
When determining lifetime ECL for stage 3, the same requirements apply as for stage 2 assets. The ECL is a probability-weighted best estimate of credit losses considering relevant reasonable and supportable information that is available at the reporting date without undue cost or effort.
A credit loss is defined as the difference between the cash flows that are due to an entity in accordance with the contract and the cash flows that the entity expects to receive discounted at the original effective interest rate.
As a general principle, lifetime expected losses have to be established, whenever the RBKO becomes aware, that not all of the customer’s obligations towards the bank will be fulfilled / repaid and consequently, the bank will incur a loss in terms of
(a) Forgiveness of principal repayments
(b) Forgiveness of interest
(c) Sale of exposure below book value
(d) Loss incurred by the bank when closing FX or other off-balance sheet items concluded with the customer and the customer does not and/or is unable to fulfil its obligation
(e) Granting of interest rates to the customer significantly below market (below funding cost of the bank or zero)
(f) Incurring non recoverable internal/external expenses
(g) Recover less than the outstanding through realization of collateral
Lifetime expected losses have to be considered in case:
(a) Amounts are past due for more than 90 days
(b) Bankruptcy, insolvency or similar proceedings against the customer have been started
(c) Economic difficulties of the customer which will most likely result in recoveries for the bank less than the amount outstanding (irrespective of the timing of the probable – partial – repayment)
Forward Looking Information and Macroeconomic Adjustment of the Default Probability Parameter PD(t)
The probability of default is, where relevant, adjusted for the current status of the macroeconomy and its future outlook. Via this adjustment, forward looking information enters the ECL calculation. The adjustment of the default probabilities is performed via a macroeconomic model, which describes the status of the credit cycle. This macroeconomic model is represented by the single risk factor, for time . The macroeconomic model consists of several macroeconomic variables. These variables are updated regularly and frequently to reflect the current status of the macroeconomy and forward look-ing information.
The macroeconomic adjustment of the default probability is performed for the expected credit loss calculation and the quantitative staging criterion.

60
Estimation of One-Factor and Macroeconomic Model
Within each estimation bucket, the model is estimated in the following way:
• Using default data an estimate for each bucket and is obtained via maximum likelihood. The estimate of the single risk factor can be interpreted as the status of the credit cycle, based on the level of default rates, which are observed for the respective time period.
• For each estimation bucket, a linear model for the estimates using macro data is obtained, e.g. . The estimate obtained in step 1 serves therefore as the dependent variable for the Linear Regression model, while macroeco-nomic variables serve as the explanatory variables. The aim of this step is therefore to explain the status of the credit cycle, i.e. the level of default rates, via macroeconomic variables.
Expected credit loss- Retail portfolio
The bank measures expected credit losses of a financial instrument in a way that reflects:
• An unbiased and probability-weighted amount that is determined by evaluating a range of possible outcomes
• The time value of money
• Reasonable and supportable information that is available without undue cost or effort at the reporting date about past events, current conditions and forecasts of future economic conditions reflected through macroeco-nomic overlay.
In determining the cash flows that the bank expects to receive it will adopt a sum of marginal losses approach whereby ECLs are calculated as the sum of marginal losses occurring in each time period from the reporting date. The marginal losses are derived from individual parameters that estimate exposures and losses in the case of default and the marginal probability of default (PD) for each period. The periodicity used will be monthly (i.e. marginal losses between months will be considered).
Stage 1 & 2
PD approximation
In certain cases the full-fledged survival analysis modelling methodology described above is either not applicable (e.g. low amount of data in the rating grades) or leads to uninterpretable results (e.g. poor fit for low-default rating grades). If for any reason, the generic survival analysis method described above is dropped, the PD curves may be approximated using simpler methodologies.
Option 1: In case survival analysis fails on the level of rating grades (e.g. due to low amount of data), apply it on the full portfolio level to derive product level PD and PFP curves. This is applicable even if the entity has never had a Rating System. The difference for these smaller portfolios would thus be that they will have only one PD curve for the whole portfolio, rather than different curves based on rating grade. This can be considered a simplified version of the survival analysis, but one which is consistent with the methodology for the other portfolios and allows also for macroeconomic overlay. For ECL calculation, the sum of marginal losses approach shall be kept.
Option 2: If Option 1 fails, the entities have the possibility to use own average realized 12-month Default Rates (Long-Run Average PD with Observation Weights and Real Data).
Option 3: If Option 2 cannot be utilized, for example because of insufficient default history, data unavailability or in case of new products, the last option is to use a benchmark for 12-month PD. The Benchmarks are created by RBI HO in Vienna Retail Risk using average PD values of the accounts with existing PD estimates. The calculation is based on actual data available in Head Office, excluding Defaulted and Not Rated accounts and using simple averages. The benchmarks used for the bank are the ones which include countries from the South eastern Europe (SEE) region. The Benchmarks are grouped by Product and Geographic Region and rounded with a step of 50bps. They will be revalu-ated annually and updated if necessary by RBI Retail Risk. The currently valid 12-month PD Benchmarks are:

61
Add
ress
es
F
inan
cial
Sta
tem
ents
Segm
ent
Repo
rts
P
erfo
rman
ce a
nd F
inan
cial
s
Th
e Ba
nkin
g Se
ctor
RBI
Visi
on a
nd M
issio
n
M
anag
emen
t Bo
ard
Intro
duct
ion
Segment Product Type SEE
PI
Mortgage 2,0%
Personal Loans 5,0%
Credit Cards 3,5%
Overdrafts 3,5%
Car Loans 2,5%
Other Products 5,0%
MicroSME All Products 6,5%
Macroeconomic overlay
IFRS 9 estimates should include forecasts of future economic conditions. This is handled through a so-called “macroeco-nomic overlay” which will be applied on the estimates. As a result, a vector of cumulative PDs and PFPs will be adjusted for each macroeconomic scenario.
LGD
LGD approximation
In case no Basel LGD estimate exists, the IFRS 9 compliant LGD estimate can be approximated by simpler models.
Option 1: Vintage recovery model ;
Option 2: Simple 12-month actual recovery rate ;
Option 3: LGD Benchmarks.
If none of the other models are applicable, LGD benchmarks will be used. The Benchmarks are created by RBI Head Office in Vienna -Retail Risk using average LGD values of the accounts with existing LGD estimates. The calculation is based on actual data available in Head Office, excluding Defaulted and Not Rated accounts and using simple aver-ages. The Benchmarks are grouped by Product and Geographic Region and rounded with a step of 5pp. They will be revaluated annually and updated if necessary by RBI Retail Risk. The currently valid LGD Benchmarks for SEE region are:
Segment Product Type SEE
PI
Mortgage 30%
Personal Loans 60%
Credit Cards 50%
Overdrafts 50%
Car Loans 50%
Other Products 50%
MicroSME All Products 50%
Macroeconomic overlay
As requested by IFRS 9, the LGD estimate needs to take into account relevant macroeconomic forecasts for the next years if there is reasonable and supportable evidence that the relationship between recovery rates and macroeconomic factors exists for the portfolio under consideration. For secured exposures, this LGD may be further adjusted to reflect expected developments in collateral values over the next years where this has an impact on recoveries.
Macroeconomic adjustments will be applied on a monthly basis. The resulting final LGD estimates with macroeconomic overlay will thus become a vector of values (dependent on the macroeconomic scenario).

62
EAD
The exposure at default is another key component of the ECL calculation. Although IFRS 9 does not explicitly require banks to model EAD, understanding how loan exposures are expected to change over time is crucial to an unbiased measurement of ECLs. This is particularly important for Stage 2, where the point of default may be several years in the future. Ignoring an expected fall in exposure (e.g. on a loan repayable in instalments) could lead to measurements of ECLs being too high. Ignoring an expected increase in exposure (drawdowns within an agreed limit on a revolving facil-ity) could lead to measurements of ECLs being too low.
CCF approximation
In case of missing CCF estimate, CCF benchmark values should be used (derived from EU Directive 575 (CRR), Chap-ter2 “Standardized approach” and Annex I). The most relevant ones for Retail are:
• 100% for guarantees having the character of credit substitutes,
• 50% for trade finance off-balance sheet items,
• 20% for trade finance off-balance sheet items
Expected credit loss for exposures in default (Stage 3)
For a financial asset that is credit-impaired at the reporting date, but that is not a purchased or originated credit-impaired financial asset, an entity shall measure the expected credit losses as the difference between the asset’s gross carrying amount and the present value of estimated future cash flows discounted at the financial asset’s original effective interest rate.
In case of undrawn commitments still existing for a defaulted exposure, they will be considered with CCF=100% when determining EAD.
If reasonable and supportable information to measure ECL is not available on an individual instrument basis, lifetime ECL for assets in Stage 3 shall be recognised on a collective basis that considers comprehensive credit risk information (IFRS 9.5.5.4) - same treatment as for assets in stages 1 and 2. The three methods to be used in Retail segment are:
• Collective assessment for Unsecured Exposures – Best Estimate of Expected Loss
• Collective assessment for Secured Exposures – Discounted Weighted Collateral Value
• Individual assessment
Collective assessment for Unsecured Exposures - Best Estimate of Expected Loss (BEEL)
In this sense, the Bank Retail Risk considers that the most appropriate way to reflect the historical loss experience in the estimation of the expected cash flows of a defaulted unsecured exposure is by using the so called Best Estimate of Ex-pected Loss (BEEL) parameter. By definition, this parameter reflects the most probable loss potential for accounts in default which have similar risk and recovery profile and provides a statistically derived estimated level of loss for such accounts. Therefore, it has to be ensured that the use of BEEL to adjust the contractual cash flows to their estimated recovery is ap-plied on a homogeneous group of accounts.
The estimation model for BEEL considers discounted recoveries for exposures which are already in default. As the model is designed to provide a best estimate of the loss potential until the end of the workout period, accounts for which the observation point coincides with the end of the workout period are assumed to have zero recovery, i.e. the Best Estimate of Expected Loss is 100%. In order to be appropriate for provisioning purposes, it has to be ensured that at each report-ing period each defaulted account is associated with an estimate which reflects the most current recovery experience for this account and thus determines the expected recovery potential. BEEL values must be updated monthly.
B. Simplified Approach
There is a simplified approach which has some operational simplifications and has to be applied or is a policy choice for trade receivables, contract assets and lease receivables. This includes the requirement or policy choice to apply the simplified approach that does not require entities to track changes in credit risk and the practical expedient to calculate expected credit losses on trade receivables using a provision matrix. For any such exposures for which the simplified approach is applied the bank will recognize the lifetime expected credit losses in profit and loss.

63
Add
ress
es
F
inan
cial
Sta
tem
ents
Segm
ent
Repo
rts
P
erfo
rman
ce a
nd F
inan
cial
s
Th
e Ba
nkin
g Se
ctor
RBI
Visi
on a
nd M
issio
n
M
anag
emen
t Bo
ard
Intro
duct
ion
C. Purchase or originated credit impaired financial assets
For financial assets which are credit impaired on initial recognition a unit shall only recognise the cumulative changes in lifetime expected credit losses since initial recognition as a loss allowance for purchased or originated credit-impaired financial assets. A financial asset is credit-impaired when one or more events that have a detrimental impact on the estimated future cash flows of that financial asset have occurred.
Stage 2 triggers
Significant increase of credit risk for the purpose of stage 2 allowance is perceived in terms of:
• A quantitative measure, where calculable;
• A qualitative measure in other cases; and
• Backstop indicators.
There is a rebuttable presumption that the credit risk on a financial asset has increased significantly since initial recogni-tion, at the latest when contractual payments are more than 30 days past due. The presumption can be rebutted if a unit has reasonable and supportable information that demonstrates that the credit risk has not increased significantly since initial recognition. It could therefore be the case that the presumption is rebuttable when contractual payments are more than 30 days past due if:
• Non-payment was an administrative oversight
• The bank has access to historical evidence that demonstrates that a correlation between significant increases in the credit risk and more than 30 days past due exists
In cases where the rebuttable presumption is rebutted it should be noted that bank cannot align the timing of significant increases in credit risk and the recognition of lifetime expected credit losses to when a financial asset is regarded as credit-impaired or when the financial instrument is considered to have defaulted. In cases where the 30 days past due has been rebutted it will be necessary to establish a limit for a new backstop which will not be higher than 90 days past due and provide evidence of this.
Assessment of stage-transfer on a collective basis
It may not be possible to assess whether there has been an increase in credit risk on an individual basis and therefore this assessment can also be carried out on a collective basis. For example this might be the case for retail loans where there is little or no updated credit risk information that is routinely obtained and monitored on a individual instrument until a customer breaches the contractual terms. If the bank only relies on past due information this will likely not faithfully represent the changes in credit risk since
initial recognition. In such cases lifetime expected credit losses shall be recognised on a collective basis that considers comprehensive credit risk information. This comprehensive credit risk information must incorporate not only past due information but also all relevant credit information, including forward looking macroeconomic information, in order to approximate the result of recognizing lifetime expected credit losses when there has been a significant increase in credit risk since initial recognition.
For the purpose of determining significant increases in credit risk and recognising a loss allowance on a collective basis, the bank will group financial instruments on the basis of shared credit risk characteristics with the objective of facilitating an analysis that is designed to enable significant increases in credit risk to be identified on a timely basis.
Shared credit risk characteristics may include, but are not limited to, the following:
• Instrument type;
• Credit risk ratings;
• Collateral type;
• Date of initial recognition;
• Remaining term to maturity;
• Industry;
• Geographical location of the borrower.

64
The value of collateral relative to the financial asset if it has an impact on the probability of a default occurring (for ex-ample, nonrecourse loans in some jurisdictions or loan-to-value ratios).
It is required that lifetime expected credit losses are recognised on all financial instruments for which there has been significant increases in credit risk since initial recognition. In order to meet this objective, if the bank is not able to group financial instruments for which the credit risk is considered to have increased significantly since initial recognition based on shared credit risk characteristics, the bank will recognize lifetime expected credit losses on a portion of the financial assets for which credit risk is deemed to have increased significantly. Furthermore when using historical credit loss ex-perience in estimating expected credit losses, it is important that information about historical credit loss rates is applied to groups that are defined in a manner that is consistent with the groups for which the historical credit loss rates were observed. Consequently, the method used shall enable each group of financial assets to be associated with information about past credit loss experience in groups of financial assets with similar risk characteristics and with relevant observable data that reflects current conditions.
Reversal of stage-transfer
If the bank has measured the loss allowance for a financial instrument at an amount equal to lifetime expected credit losses in the previous reporting period, but determines at the current reporting date that the change in the credit risk from initial recognition is no longer significant, the bank shall measure the loss allowance at an amount equal to 12-month expected credit losses at the current reporting date. It should be noted that the reversal of stage transfer when it is certain that there has been a reduction in credit risk to a level that it is no longer significant and furthermore that the flags such as forbearance no longer exist.
Stage-transfer for modified financial assets
If the contractual cash flows on a financial asset have been renegotiated or modified and the financial asset was derec-ognized the asset is considered a “new” financial asset and the date of modification is considered to be the date of initial recognition. This means measuring the loss allowance at an amount equal to 12-month expected credit losses until the requirements for the recognition of lifetime expected credit losses are met. However in some cases where the modi-fication results in derecognition of the original financial asset, there may be evidence that the modified financial asset is credit-impaired at initial recognition, and thus, the financial asset should be recognised as an originated credit-impaired financial asset and lifetime expected losses should be used as a basis to measure expected credit losses.
If the contractual cash flows on a financial asset have been renegotiated or modified and the financial asset was not derecognised, the bank shall assess whether there has been a significant increase in the credit risk of the financial instru-ment by comparing:
• The risk of a default occurring at the reporting date (based on the modified contractual terms)
• The risk of a default occurring at initial recognition (based on the original, unmodified contractual terms)
Furthermore, evidence that the criteria for the recognition of lifetime expected credit losses are no longer met may include a history of up-to-date and timely payment performance against the modified contractual terms. Typically a customer would need to demonstrate consistently good payment behavior over a period of time before the credit risk is considered to have decreased. For example, a history of missed or incomplete payments would not typically be erased by simply making one payment on time following a modification of the contractual terms.
Stage 3 triggers
According to the deterioration model, a financial instrument has to be transferred to stage 3 (i.e. is credit-impaired) when one or more events that have a detrimental impact on the estimated future cash flows have occurred. If the requirements for stage transfer are not fulfilled anymore (i.e. the instrument is no longer credit-impaired) it shall be transferred back to stage 1 or 2 (i.e. the approach is symmetrical).
The following list is taken as “Credit-impaired” indicators:
• significant financial difficulty of the issuer or the borrower;
• a breach of contract, such as a default or past due event;
• the lender(s) of the borrower, for economic or contractual reasons relating to the borrower’s financial difficulty, having granted to the borrower a concession(s) that the lender(s) would not otherwise consider;
• it is becoming probable that the borrower will enter bankruptcy or other financial reorganisation;
• the disappearance of an active market for that financial asset because of financial difficulties; or

65
Add
ress
es
F
inan
cial
Sta
tem
ents
Segm
ent
Repo
rts
P
erfo
rman
ce a
nd F
inan
cial
s
Th
e Ba
nkin
g Se
ctor
RBI
Visi
on a
nd M
issio
n
M
anag
emen
t Bo
ard
Intro
duct
ion
• the purchase or origination of a financial asset at a deep discount that reflects the incurred credit losses.
Due to the changed scope of IFRS 9 compared to IAS 39, also loan commitments and financial guarantee contracts shall be covered by the same process (replacement of IAS 37 assessment). There is a rebuttable presumption that default does not occur later than when a financial asset is 90 days past due unless the bank has reasonable and supportable infor-mation to demonstrate that a more lagging default criterion is more appropriate. The definition of default used for these purposes shall be applied consistently to all financial instruments unless information becomes available that demonstrates that another default definition is more appropriate for a particular financial instrument.
Due to the changed scope of IFRS 9 Impairment compared to IAS 39, the following aspects shall be considered. Firstly, loan commitments and financial guarantee contracts shall be covered by the same process (replacement of IAS 37 as-sessment), if not already covered in the current processes. Secondly, equity instruments are not in the scope of IFRS 9 Impairment. All instruments in scope of IFRS 9 Impairment where the counterparty is in default shall be transferred to stage 3. Furthermore, fully collateralised loans with zero risk provision, where the counterparty is in default, shall be assigned to stage 3 (if the ‘credit deterioration model’ applies).
Approach to off-balance items
For loan commitments and financial guarantee contracts, the date that the unit becomes a party to the irrevocable com-mitment shall be considered to be the date of initial recognition for the purposes of applying the impairment requirements. For loan commitments, a unit considers changes in the risk of a default occurring on the loan to which a loan commitment relates. For financial guarantee contracts, a unit considers the changes in the risk that the specified debtor will default on the contract. In both cases for a financial asset/s, a credit loss is the present value of the difference between the contractual cash flows that are due to a unit under the contract and the cash flows that the unit expects to receive. In the case of undrawn loan commitments, a credit loss is the present value of the difference between the contractual cash flows that are due to the unit if the holder of the loan commitment draws down the loan and the cash flows that the unit expects to receive if the loan is drawn down.
Bank’s estimate of expected credit losses on loan commitments shall be consistent with its expectations of drawdowns on that loan commitment, i.e. it shall consider the expected portion of the loan commitment that will be drawn down within 12 months of the reporting date when estimating 12-month expected credit losses, and the expected portion of the loan commitment that will be drawn down over the expected life of the loan commitment when estimating lifetime expected credit losses.
For a financial guarantee contract, the unit is required to make payments only in the event of a default by the debtor in accordance with the terms of the instrument that is guaranteed. Accordingly, cash shortfalls are the expected payments to reimburse the holder for a credit loss that it incurs less any amounts that the unit expects to receive from the holder, the debtor or any other party.
If the asset is fully guaranteed, the estimation of cash shortfalls for a financial guarantee contract would be consistent with the estimations of cash shortfalls for the asset subject to the guarantee.
The expected credit losses on a loan commitment shall be discounted using the effective interest rate, or an approximation thereof, that will be applied when recognizing the financial asset resulting from the loan commitment. This is because for the purpose of applying the impairment requirements, a financial asset that is recognised following a draw down on a loan commitment shall be treated as a continuation of that commitment instead of as a new financial instrument. The expected credit losses on the financial asset shall therefore be measured considering the initial credit risk of the loan commitment from the date that the unit became a party to the irrevocable commitment.
The Bank assesses at each reporting date whether there is objective evidence that a financial asset or group of financial assets is impaired. A financial asset or a group of financial assets is impaired only if there is objective evidence of im-pairment as a result of one or more events that occurred after the initial recognition of the asset (a ‘loss event’) and that loss event (or events) has an impact on the estimated future cash flows of the financial asset or group of financial assets that can be reliably estimated.
The criteria that the Bank uses to determine that there is objective evidence of an impairment loss include:
• Delinquency in contractual payments of principal or interest;
• Cash flow difficulties experienced by the borrower;
• Breach of loan covenants or conditions;

66
• Initiation of bankruptcy proceedings;
• Deterioration of the borrower’s competitive position;
• Deterioration in the value of collateral;
The estimated period between losses occurring and its identification is determined by local management for each identi-fied portfolio. In general, the periods used vary between three months and 12 months; in exceptional cases, longer periods are warranted.
3.3.13 Impairment of financial assets (Policy applicable before 1 January 2018)
The Bank first assesses whether objective evidence of impairment exists individually for financial assets that are individu-ally significant, and individually or collectively for financial assets that are not individually significant. If the Bank deter-mines that no objective evidence of impairment exists for an individually assessed financial asset, whether significant or not, it includes the asset in a group of financial assets with similar credit risk characteristics and collectively assesses them for impairment. Assets that are individually assessed for impairment and for which an impairment loss is or continues to be recognized are not included in a collective assessment of impairment.
The amount of the loss is measured as the difference between the asset’s carrying amount and the present value of estimated future cash flows (excluding future credit losses that have not been incurred) discounted at the financial asset’s original effective interest rate. The carrying amount of the asset is reduced through the use of an allowance account and the amount of the loss is recognized in profit or loss.
The calculation of the present value of the estimated future cash flows of a collateralized financial asset reflects the cash flows that may result from foreclosure less costs for obtaining and selling the collateral, whether or not foreclosure is probable.
For the purposes of a collective evaluation of impairment, financial assets are grouped on the basis of similar credit risk characteristics (i.e., on the basis of the Bank’s grading process that considers asset type, industry, geographical location, collateral type, past-due status and other relevant factors). Those characteristics are relevant to the estimation of future cash flows for groups of such assets by being indicative of the debtors’ ability to pay all amounts due according to the contractual terms of the assets being evaluated.
Future cash flows in a group of financial assets that are collectively evaluated for impairment are estimated on the basis of the contractual cash flows of the assets in the Bank and historical loss experience for assets with credit risk characteristics similar to those in the Bank. Historical loss experience is adjusted on the basis of current observable data to reflect the effects of current conditions that did not affect the period on which the historical loss experience is based and to remove the effects of conditions in the historical period that do not currently exist.
Estimates of changes in future cash flows for groups of assets reflect and are directionally consistent with changes in related observable data from period to period (for example, changes in unemployment rates, property prices, payment status, or other factors indicative of changes in the probability of losses in the Bank and their magnitude). The methodol-ogy and assumptions used for estimating future cash flows are reviewed regularly by the Bank to reduce any differences between loss estimates and actual loss experience.
When a loan is uncollectible, it is written off against the related provision for loan impairment. Such loans are written off after all the necessary procedures have been completed and the amount of the loss has been determined.
If, in a subsequent period, the amount of the impairment loss decreases and the decrease can be related objectively to an event occurring after the impairment was recognized (such as an improvement in the debtor’s credit rating), the previously recognized impairment loss is reversed by adjusting the allowance account. The amount of the reversal is recognized in the profit and loss against impairment charge for credit losses.
Impairment losses on available-for-sale investment securities are recognised by reclassifying the losses accumulated in the fair value reserve in equity to profit or loss. The cumulative loss that is reclassified from equity to profit or loss is the differ-ence between the acquisition cost, net of any principal repayment and amortisation, and the current fair value, less any impairment loss previously recognised in profit or loss. Changes in impairment attributable to application of the effective interest method are reflected as a component of interest income.
If, in a subsequent period, the fair value of an impaired available-for-sale debt security increases and the increase can be related objectively to an event occurring after the impairment loss was recognised, then the impairment loss is reversed through profit or loss; otherwise, any increase in fair value is recognised through OCI. Any subsequent recovery in the

67
Add
ress
es
F
inan
cial
Sta
tem
ents
Segm
ent
Repo
rts
P
erfo
rman
ce a
nd F
inan
cial
s
Th
e Ba
nkin
g Se
ctor
RBI
Visi
on a
nd M
issio
n
M
anag
emen
t Bo
ard
Intro
duct
ion
fair value of an impaired available-for-sale equity security is always recognised in OCI.
3.3.14 Forward looking information
Bank incorporates forward looking information into its impairment calculation. This is done via the macroeconomic models, which leads to a direct adjustment of the default probabilities. To be precise forward looking information is incorporated via the macroeconomic input parameters of the macroeconomic model. Since Bank will not know future realizations of these macroeconomic parameters with certainty, the inherent uncertainty makes it necessary to consider a scenario calculation.
Bank considers three scenarios: A base scenario, an optimistic scenario and a pessimistic scenario. The latter two sce-narios are attached with a weight of 25%. The base scenario has an attached weight of 50% in the calculation. The purpose of the scenarios is also to take care of any nonlinearity present in the (expected loss) calculation. The interpreta-tion of the three scenarios is that each of the three scenarios is a representative scenario of the optimistic quartile, for the pessimistic quartile and for the remaining 50%. This interpretation is necessary since the probability that a certain scenario occurs is always 0%.
For each scenario a set of values for the relevant macroeconomic variables is delivered by RBI Raiffeisen Research. This set is used as an input for the macroeconomic model, which subsequently is applied to adjust the relevant input parameter.
Sensitivity analysis
The most significant assumptions affecting the sensitivity of the expected credit loss allowance are as follows:
• Gross domestic product;• Unemployment rate;• Long term government bond rate;• Inflation rate.
3.3.15 Forborne and modified loans
The Bank sometimes makes concessions or modifications to the original terms of loans as a response to the borrower’s financial difficulties, rather than taking possession or to otherwise enforce collection of collateral. The Bank considers a loan forborne when such concessions or modifications are provided as a result of the borrower’s present or expected financial difficulties and the Bank would not have agreed to them if the borrower had been financially healthy. Indicators of financial difficulties include defaults on covenants, or significant concerns raised by the Credit Risk Department.
Forbearance may involve extending the payment arrangements and the agreement of new loan conditions. Once the terms have been renegotiated, any impairment is measured using the original EIR as calculated before the modification of terms. It is the Bank’s policy to monitor forborne loans to help ensure that future payments continue to be likely to oc-cur. Derecognition decisions and classification between Stage 2 and Stage 3 are determined on a case-by-case basis. If these procedures identify a loss in relation to a loan, it is disclosed and managed as an impaired Stage 3 forborne asset until it is collected or written off. From 1 January 2018, when the loan has been renegotiated or modified but not derecognised, the Bank also reassesses whether there has been a significant increase in credit risk, as set out in Note 4.
The Bank also considers whether the assets should be classified as Stage 3. Once an asset has been classified as for-borne, it will remain forborne for a minimum 24-month probation period. In order for the loan to be reclassified out of the forborne category, the customer has to meet all of the following criteria:
• All of its facilities has to be considered performing;
• The probation period of two years has passed from the date the forborne contract was considered performing;
• Regular payments of more than an insignificant amount of principal or interest have been made during at least half of the probation period;
• The customer does not have any contract that is more than 30 days past due.
3.3.16 Impairment losses on financial assets (Policy applicable after 1 January 2018)
The measurement of impairment losses both under IFRS 9 and IAS 39 across all categories of financial assets requires judgement, in particular, the estimation of the amount and timing of future cash flows and collateral values when determin-ing impairment losses and the assessment of a significant increase in credit risk. These estimates are driven by a number of factors, changes in which can result in different levels of allowances.
The Bank’s ECL calculations are outputs of complex models with a number of underlying assumptions regarding the choice of variable inputs and their interdependencies. Elements of the ECL models that are considered accounting judgements

68
and estimates include:
• The Bank’s internal credit grading model, which assigns PDs to the individual grades;
• The Bank’s criteria for assessing if there has been a significant increase in credit risk and so allowances for financial assets should be measured on a LTECL basis and the qualitative assessment;
• The segmentation of financial assets when their ECL is assessed on a collective basis;
• Development of ECL models, including the various formulas and the choice of inputs;
• Determination of associations between macroeconomic scenarios and, economic inputs, such as unemploy-ment levels and collateral values, and the effect on PDs, EADs and LGDs;
• Selection of forward-looking macroeconomic scenarios and their probability weightings, to derive the economic inputs into the ECL models.
Below is the bank’s internal credit rating grades information as used for internal purposes and the respective comparative data:
Internal rating grade Internal rating description 12 month Basel II PD range S&P rating
Lower PD bound Upper PD bound
1A Excellent >0.0000% ≤0.0026% AAA
1B >0.0026% ≤0.0088% AA+
1C >0.0088% ≤0.0300% AA, AA-
2A Strong >0.0300% ≤0.0408%
2B >0.0408% ≤0.0553%
2C >0.0553% ≤0.0751% A+, A, A-
3A >0.0751% ≤0.1019%
3B >0.1019% ≤0.1383%
3C >0.1383% ≤0.1878% BBB+, BBB
4A Good >0.1878% ≤0.2548%
4B >0.2548% ≤0.3459% BBB-
4C >0.3459% ≤0.4694%
5A >0.4694% ≤0.6371% BB+
5B >0.6371% ≤0.8646%
5C >0.8646% ≤1.1735% BB
6A Satisfactory >1.1735% ≤1.5927% BB-
6B >1.5927% ≤2.1616%
6C >2.1616% ≤2.9338%
7A >2.9338% ≤3.9817% B+
7B >3.9817% ≤5.4040%
7C >5.4040% ≤7.3344% B
8A Substandard >7.3344% ≤9.9543% B-
8B >9.9543% ≤13.5101%
8C >13.5101% ≤18.3360% CCC+
9A >18.3360% ≤24.8857% CCC
9B >24.8857% ≤33.7751% CCC-
9C >33.7751% <100% CC, C
10 Credit impaired 100% 100% D

69
Add
ress
es
F
inan
cial
Sta
tem
ents
Segm
ent
Repo
rts
P
erfo
rman
ce a
nd F
inan
cial
s
Th
e Ba
nkin
g Se
ctor
RBI
Visi
on a
nd M
issio
n
M
anag
emen
t Bo
ard
Intro
duct
ion
3.3.17 Impairment losses on financial assets (Policy applicable before 1 January 2018)
The Bank makes estimates and assumptions that affect the reported amounts of assets and liabilities within the next financial year. Estimates are continually evaluated based on historical experience and other factors, including expectations of future events that are believed to be reasonable under the circumstances.
Impairment charge for credit losses
The Bank reviews its loan portfolios to assess impairment at least on a quarterly basis. In determining whether an impair-ment loss should be recorded in the profit or loss, the Bank makes judgments as to whether there is any observable data indicating that there is a measurable decrease in the estimated future cash flows from a portfolio of loans before the decrease can be identified with an individual loan in that portfolio. This evidence may include observable data indicat-ing that there has been an adverse change in the payment status of borrowers in the Bank, or national or local economic conditions that correlate with defaults on assets in the Bank.
Management uses estimates based on historical loss experience for assets with credit risk characteristics and objective evidence of impairment similar to those in the portfolio when scheduling its future cash flows. The methodology and assumptions used for estimating both the amount and timing of future cash flows are reviewed regularly to reduce any differences between loss estimates and actual loss experience. A financial asset or a group of financial assets is impaired and impairment losses are incurred if, and only if, there is objective evidence of impairment as a result of one or more events that occurred after the initial recognition of the asset (a “loss event”) and that loss event (or events) has an impact on the estimated future cash flow of the financial asset of the group of financial assets that can be reliably estimated. It may not be possible to identify a single, discrete event that caused the impairment. Rather the combined effect of several events may have caused the impairment. However, the loss event must have a reliably measurable effect on the present value of estimated future cash flows and be supported by current observable data. Objective evidence that a financial asset or group of assets is impaired includes observable data that comes to the attention of the holder of the asset about the following loss events (triggering events):
Retail Portfolio:
- Accounts which have ever rolled into 180+ dpd – accounts with Absorbing Status - Early Losses: Frauds, Deceased customers, Bankruptcies- Restructured Loans: Re Aging, Extensions, Re writes and Deferrals
Non-Retail Portfolio:
- significant financial difficulty of the debtor,- a breach of legal contract, - default recognition due to delinquency in interest or principally payments,- the lender, for economic or legal reasons relating to the borrower’s financial difficulty, granting to the borrower a
concession, that the lender not otherwise consider: forgiveness of principal repayments, forgiveness of interest, - it is becoming probable that the borrower will enter bankruptcy or other financial reorganization including foreclosure
proceedings, - the disappearance of an active market for that financial asset because of financial difficulties, - Bank’s Credit Committee classifies an asset/group of assets with similar credit risk characteristics as problematic and
refers the case to Problem Loan Committee (although the customer does not meet the client rating/collateral rating grid for such classification),
- the exposure is already classified as “problematic” or handled/analyzed by the Problem Loan Committee.
If it is determined that no objective evidence of impairment exists for an individual asset, than the asset is included in a group of financial assets with similar credit characteristics and the bank collectively assesses them for impairment. The reason for this approach is that impairment that cannot be identified with an individual loan may be identifiable on portfolio basis.
Assets that are individually assessed for impairment and identified as impaired are excluded from a portfolio assessment of impairment.
For the purpose of a collective evaluation of impairment, financial assets are grouped on the basis of similar credit risk characteristics that are indicative of the debtors’ ability to pay all amounts due according to the contractual terms.
The retail portfolio is classified based on product types characteristics, for Private Individuals and Micro Entities. Due to limited historical default data, the bank could not develop internal statistical models for all Private Individuals and Micro enterprises loans. Therefore, the bank has used three approaches for portfolio loan loss provisioning.
• Internal ratings based approach – for the products where the bank had sufficient historical statistics;

70
• Flow rate model - based on days past due delinquency buckets; and• Group benchmarks –for products we could not gather sufficient historical default data;
However, in the recent years the bank accumulated significant history of default and loss data which allowed the bank to internally develop Basel 2 credit rating models. Thus currently the bank has in place the internal statistical models for Micro portfolio (excluding Credit Cards) and for the product Personal Loan of PI segment. Currently 98% of Micro port-folio and 82% of PI portfolio are covered with internal models. Credit Cards of MI segment and products of PI segment except Personal loans are provisioned based on Flow Rate Model or Benchmarking based on days past due categories, as listed below:
- Current 0 days
- 1 to 30 days
- 31 to 60 days
- 61 to 90 days
- 91 to 120 days
- 121 to 150 days
- 151 to 180 days
- Over 180 days
For the Non-Retail portfolio, RBKO uses the RBI customer rating as the credit risk characteristic which is indicative of the debtor’s ability to pay / fulfil the debt service. Corporate accounts are classified based on Customer Rating (from 1A to 10C) while Small and Medium Businesses (“SMB”) accounts are classified based on SMB rating model (from 4B to 10A). For defaults rated at 10, individual impairment model will be applied.
SMB and Corporate provisioning model is based on Customer Rating and related HDRs derived from RBI statistics are applied.
3.3.18 Amortized cost Category
A financial asset shall be measured at amortized cost if both of the following conditions are met:• The asset is held within a business model whose objective is to hold assets in order to collect contractual cash
flows,• The contractual terms of the financial asset give rise on specified dates to cash flows that are solely payments
of principal and interest on the principal amount outstanding.
Bank requires that, on initial recognition, financial assets and financial liabilities are measured at fair value plus eligible transaction costs.
• the best evidence of fair value at initial recognition is normally the transaction price – i.e. the fair value of the consideration given or received for the financial instrument; and
• if there is a difference between the entity’s estimate of fair value at initial recognition and the transaction price, then:
• if the estimate of fair value uses only data from observable markets, then the difference is recognised in profit or loss; or,
• in all other cases, the difference is deferred as an adjustment to the carrying amount of the financial instrument.
Bank’s loan and advances portfolio is carried at amortized cost and the interest income is recognized in profit and loss using effective interest rate.
3.3.19 FVOCI Category (Policy applicable from 1 January 2018)
A financial asset is classified as subsequently measured at FVOCI if it is held within a business model whose objective is both collecting contractual cash flows and selling financial assets and meets the SPPI criterion.

71
Add
ress
es
F
inan
cial
Sta
tem
ents
Segm
ent
Repo
rts
P
erfo
rman
ce a
nd F
inan
cial
s
Th
e Ba
nkin
g Se
ctor
RBI
Visi
on a
nd M
issio
n
M
anag
emen
t Bo
ard
Intro
duct
ion
The fair value of financial instruments is determined in accordance with IFRS 13.
Where it is not possible to determine a financial instrument’s fair value by reference to market prices (e.g. for loans), RBI Group has to use other valuation techniques (pricing models and methodologies). As they require more estimation and assumptions, they are necessarily more subjective than the market price approach. Two valuation techniques that are widely used are the discounted cash flow (present value) approach and option pricing models (e.g. Black and Scholes).
Short-term receivables and payables with no stated interest rate may be measured at the original invoice amount if the effect of discounting is immaterial.
3.3.20 FVTPL Category (Policy applicable after 1 January 2018)
All other financial assets – i.e. financial assets that do not meet the criteria for classification as subsequently measured at either amortised cost or FVOCI – are classified as subsequently measured at fair value, with changes in fair value recognised in profit or loss.
In addition, the Bank has the option at initial recognition to irrevocably designate a financial asset as at FVTPL if doing so eliminates or significantly reduces a measurement or recognition inconsistency – i.e. an ‘accounting mismatch’ – that would otherwise arise from measuring assets or liabilities, or recognising the gains and losses on them, on different bases.
At initial recognition the financial assets classified as at fair value shall be measured at fair value plus transaction costs that are directly attributable to the acquisition or issue of the financial asset .
After initial recognition the financial assets classified as at fair value shall be measured at fair value and transaction costs are recognised in Profit and Loss.
For debt instruments all gains or losses arising from changes in fair value of these financial assets are recognized in profit or loss in the same manner as for financial assets measured at amortised cost:
• interest revenue using the effective interest method;
• expected credit losses and reversals; and
• foreign exchange gains and losses stemming from revaluation of the amortised cost amount.
3.3.21 Financial assets at fair value through profit and loss (policy applicable before 1 January 2018)
This category has two sub-categories: financial assets held for trading (“trading assets”), including the derivatives held, and financial assets designated at fair value through profit or loss at inception. The Bank does not apply hedge account-ing. The Bank has designated financial assets and financial liabilities at fair value through profit or loss in either of the following circumstances:
• The assets or liabilities are managed, evaluated and reported internally on a fair value basis;
• The designation eliminates or significantly reduces an accounting mismatch that would otherwise arise;
a) Financial assets held for trading
A financial asset is classified as held for trading if it is acquired or incurred principally for the purpose of selling or repur-chasing in the near term or if it is part of a portfolio of identified financial instruments that are managed together and for which there is evidence of a recent actual pattern of short-term profit-taking. Derivatives are also categorized as held for trading unless they are designated as hedging instruments.
b) Designated at fair value through profit or loss
Financial assets and financial liabilities are designated at fair value through profit or loss when:
• Doing so significantly reduces measurement inconsistencies that would arise if the related instruments were treated as held for trading and the underlying financial instruments were carried at amortized cost for loans and advances to customers or banks and debt securities in issue;

72
• Certain investments, such as equity investments, are managed and evaluated on a fair value basis in accor-dance with a documented risk management or investment strategy and reported to key management personnel on that basis are designated at fair value through profit and loss; and
• Financial instruments, such as debt securities held, containing one or more embedded derivatives that signifi-cantly modify the cash flows, are designated at fair value through profit and loss.
3.3.22 Available for sale financial assets (Policy applicable before 1 January 2018)
Available-for-sale investments are non-derivative investments that are designated as available-for-sale or are not classified as another category of financial assets. Available-for-sale investments comprise debt securities.
Interest income is recognised in profit or loss using the effective interest method. Dividend income is recognised in profit or loss when the Bank becomes entitled to the dividend. Foreign exchange gains or losses on available-for-sale debt security investments are recognised in profit or loss. Impairment losses are recognised in profit or loss.
Other fair value changes, are recognised in other comprehensive income and presented in the fair value reserve within equity. When the investment is sold, the gain or loss accumulated in equity is reclassified to profit or loss.
3.3.23 Derivative financial instruments
Derivatives are initially recognized at fair value on the date on which a derivative contract is entered into and are sub-sequently measured at their fair value. Fair values are obtained from quoted market prices in active markets, including recent market transactions, and valuation techniques, including discounted cash flow models as appropriate. All deriva-tives are carried as assets when fair value is positive and as liabilities when fair value is negative. Gains and losses aris-ing from changes in fair value of derivatives are included in ‘Net income from financial instruments at fair value through profit or loss’ in profit or loss for the period.
The Bank uses derivative financial instruments such as over the counter (OTC) interest rate swaps to manage its risk arising from fluctuations of market interest rates. No hedge accounting is applied for derivative instruments.
3.3.24 Cash and cash equivalents and mandatory reserves
Cash and cash equivalents include notes and coins on hand (including restricted reserves – see below), unrestricted bal-ances held with central banks and highly liquid financial assets with original maturities of three months or less from the acquisition date that are subject to an insignificant risk of changes in their fair value, and are used by the Bank in the management of its short-term commitments.
Cash and cash equivalents are carried at amortized cost in the statement of financial position.
3.4 Significant accounting judgements, estimates and assumptions
The preparation of the Bank’s financial statements requires management to make judgements, estimates and assumptions that affect the reported amount of revenues, expenses, assets and liabilities, and the accompanying disclosures, as well as the disclosure of contingent liabilities. Uncertainty about these assumptions and estimates could result in outcomes that require a material adjustment to the carrying amount of assets or liabilities affected in future periods. In the process of applying the Bank’s accounting policies, management has made the following judgements and assumptions concerning the future and other key sources of estimation uncertainty at the reporting date, that have a significant risk of causing a material adjustment to the carrying amounts of assets and liabilities within the next financial year.
Existing circumstances and assumptions about future developments may change due to circumstances beyond the Bank’s control and are reflected in the assumptions if and when they occur. Items with the most significant effect on the amounts recognised in the consolidated financial statements with substantial management judgement and/or estimates are col-lated below with respect to judgements/estimates involved.
Significant accounting judgments and accounting are described in the following notes;
• 3.3.16 Impairment of financial assets (Policy applicable after 1 January 2018);
• 3.3.17 Impairment losses on financial assets (Policy applicable before 1 January 2018);
• 3.3.18 Amortized cost and Category;
• 3.3.19 FVOCI Category (policy applicable after 1 January 2018);

73
Add
ress
es
F
inan
cial
Sta
tem
ents
Segm
ent
Repo
rts
P
erfo
rman
ce a
nd F
inan
cial
s
Th
e Ba
nkin
g Se
ctor
RBI
Visi
on a
nd M
issio
n
M
anag
emen
t Bo
ard
Intro
duct
ion
• 3.3.20 FVTPL Category (Policy applicable after 1 January 2018);
• 3.3.21 Financial assets at fair value through profit and loss (Policy applicable before 1 January 2018);
• 3.3.22 Available for sale financial assets (Policy applicable before 1 January 2018);
• 3.8 Repossessed property;
• 3.10 Provisions.
3.5 Mandatory liquidity reserves
In accordance with the CBK rules, the Bank should meet the minimum average liquidity requirement. The liquidity require-ment is calculated on a weekly basis as 10 per cent of the deposit base, defined as the average total deposit liabilities to the non-banking public in euro and other currencies, over the business days of the maintenance period. The assets with which the Bank may satisfy its liquidity requirement are the euro deposits with the CBK and 50 per cent of the euro equivalent of cash denominated in readily convertible currencies. Deposits with the CBK must not be less than 5 per cent of the applicable deposit base. As the respective liquid assets are not available to finance the Bank’s day to day opera-tions, they have been excluded from cash and cash equivalents for the purposes of the cash flow statement.
3.6 Property and equipment
Property and equipment are stated at historical cost less accumulated depreciation and accumulated impairment, if any.
Subsequent costs are included in the asset’s carrying amount or are recognized as a separate asset, as appropriate, only when it is probable that future economic benefits associated with the item will flow to the Bank and the cost of the item can be measured reliably. All other repairs and maintenance are charged to other operating expenses during the financial period in which they are incurred.
The carrying values of property and equipment are reviewed for impairment when events change or changes in circum-stances indicate that the carrying value may not be recoverable. If any such indications exist and where the carrying values exceed the estimated recoverable amount, the assets or cash generating unit (CGU) are written down to their recoverable amount.
The recoverable amount of property and equipment is the higher of fair value less costs to sell and value in use. In as-sessing the value in use, the estimated future cash flows are discounted to their present value using a pre-tax discount rate that reflects current market assessments of the time value of money and the risks specific to the assets.
For an asset that does not generate largely independent cash flows, the recoverable amount is determined for the cash generating units (CGU) to which the asset belongs. Impairment losses are recognized in profit or loss.
Depreciation of assets is charged on a straight-line basis at prescribed rates to allocate the cost of property and equip-ment over their estimated useful lives. The annual depreciation rates are determined by the estimated useful lives of certain assets as per the table below:
Leasehold improvements within property are depreciated over the shorter of useful life and the lease term. Work in prog-ress is not depreciated until the asset is put in use.
ATMs, other bank and office equipment 5-7 years
Computer hardware 3-5 years
Depreciation methods, useful lives and residual values are reassessed at reporting date.
3.7 Intangible assets
Intangible assets are recognized if it is probable that the future economic benefits that are attributable to the asset will flow to the Bank and the cost of the asset can be measured reliably. Intangible assets are measured initially at cost. The carrying values of intangible assets are reviewed for impairment when events or changes in circumstances indicate that the carrying value may not be recoverable. Intangible assets are entirely comprised of computer software which is amortized using the straight-line method over their estimated useful life of five years and licences which are amortized during the licence term.

74
3.8 Repossessed property
Repossessed assets are acquired through enforcement of security over non-performing loans and advances to customers that do not earn rental, and are not used by the Bank and are intended for disposal in a reasonably short period of time.
Repossessed assets are initially recognised using the bailiff set amount in the last auction, and are subsequently measured at the lower of cost and net realizable value and any write-down is recognized in the profit or loss.
3.9 Borrowings
Borrowings are initially recognized at fair value, net of transaction costs incurred. Borrowings are subsequently stated at amortized cost; any difference between proceeds net of transaction costs and the redemption value is recognized in the profit or loss over the period of the borrowings using the effective interest method.
3.10 Provisions
A provision is recognised if, as a result of a past event, the Bank has a present legal or constructive obligation that can be estimated reliably, and it is probable that an outflow of economic benefits will be required to settle the obligation. Provisions are determined by discounting the expected future cash flows at a pre-tax rate that reflects current market assessments of the time value of money and the risks specific to the liability. The unwinding of the discount is recognised as finance cost.
Contingent liabilities may develop in a way not initially expected. Therefore they are assessed continually to determine whether an outflow of resources embodying economic benefits has become probable. In case that the contingent liability results in a present obligation that can be measured reliably, a provision on-balance has to be made. Only irrevocable commitments give rise to a credit risk, therefore only irrevocable contingencies and commitments can be subject to provisioning. For significant exposures, the assessment is done individually. In case of portfolio-based assessment the portfolio-building and calculation of portfolio-based provisions are calculated as indicated in the impairment of Loans and Advances.
3.11 Employee benefits
The Bank pays only contributions to a publicly administered pension plan on a mandatory basis. The Bank has no fur-ther payment obligations once the contributions have been paid. The contributions are recognized as employee benefit expense when they are due.
3.12 Share capital
Dividends on ordinary shares
Dividends on ordinary shares are recognized in equity in the period in which they are approved by the Bank’s sharehold-ers. Dividends for the year that are declared after the reporting date are disclosed as events after the end of the reporting period.
3.13 Equity reserves
The reserves recorded in equity (OCI) on the Bank’s statement of financial position include:
- Fair value reserve comprises changes in fair value of financial assets at fair value through other comprehensive income.
3.14 Interest income and expense
Under both IFRS 9 and IAS 39 Interest income and expense for all interest-bearing financial instruments are recognized through profit or loss for the period within ‘interest income’ and ‘interest expense’ using the effective interest method.
The effective interest method is a method of calculating the amortized cost of a financial asset or a financial liability and of allocating the interest income or interest expense over the relevant period. The effective interest rate is the rate that exactly discounts estimated future cash payments or receipts through the expected life of the financial instrument or, when appropriate, a shorter period to the net carrying amount of the financial asset or financial liability. When calculating the effective interest rate, the Bank estimates cash flows considering all contractual terms of the financial instrument but does not consider future credit losses.

75
Add
ress
es
F
inan
cial
Sta
tem
ents
Segm
ent
Repo
rts
P
erfo
rman
ce a
nd F
inan
cial
s
Th
e Ba
nkin
g Se
ctor
RBI
Visi
on a
nd M
issio
n
M
anag
emen
t Bo
ard
Intro
duct
ion
The calculation of the effective interest rate includes transaction costs and fees and points paid or received that are an integral part of the effective interest rate. Transaction costs include incremental costs that are directly attributable to the ac-quisition or issue of a financial asset or financial liability. Interest income and expense presented in profit or loss include:
• interest on financial assets and financial liabilities measured at amortised cost calculated on an effective interest basis; and
• interest on FVPL measured investment securities calculated on an effective interest basis.
When a financial asset becomes credit-impaired and is, therefore, regarded as ‘Stage 3’, the Bank calculates interest income by applying the effective interest rate to the net amortized cost of the financial asset. If the financial assets cures and is no longer credit-impaired, the Bank reverts to calculating interest income on a gross basis.
For purchased or originated credit-impaired (POCI) financial assets the Bank calculates interest income by calculating the credit-adjusted EIR and applying that rate to the amortised cost of the asset. The credit-adjusted EIR is the interest rate that, at original recognition, discounts the estimated future cash flows (including credit losses) to the amortised cost of the POCI assets. The Bank also holds investments in assets issued in countries with negative interest rates. The Bank discloses interest paid on these assets as an interest expense, with additional disclosures in Note 21.
Interest income on all trading assets and financial assets mandatorily required to be measured at FVPL is recognised using the contractual interest rate in net trading income and Net gains/(losses) on financial assets at fair value through profit or loss, respectively.
3.15 Fee and commission
Fees and commission income and expense that are integral to the effective interest rate on a financial asset or financial liability are included in the measurement of the effective interest rate.
Other fees and commission income – including account servicing fees, sales commission, placement gain, fees– are recognised as the related services are performed. If a loan commitment is not expected to result in the draw-down of a loan, then the related loan commitment fees are recognised on a straight-line basis over the commitment period.
Other fees and commission expense relate mainly to transaction and service fees, which are expensed as the services are received.
3.16 Operating leases
Payments made under operating leases are charged to expenses on a straight-line basis over the term of the lease. When an operating lease is terminated before the lease period has expired, any payment required to be made to the lesser by way of penalty is recognized as an expense in the period in which termination takes place.
3.17 Net income from other financial instruments at fair value through profit or loss
Net income from other financial instruments at fair value through profit or loss relates to non-trading derivatives held for risk management purposes that do not form part of qualifying hedge relationships and financial assets and financial li-abilities designated at fair value through profit or loss. It includes all realised and unrealised fair value changes, interest, dividends and foreign exchange differences.
3.18 Income tax
Income tax expense comprises current and deferred tax. It is recognised in profit or loss except to the extent that it relates to items recognised directly in equity or in other comprehensive income.
Current tax
Current tax comprises the expected tax payable or receivable on the taxable income or loss for the year and any adjust-ment to the tax payable or receivable in respect of previous years. It is measured using tax rates enacted or substantively enacted at the reporting date.
Deferred tax
Deferred tax is recognised in respect of temporary differences between the carrying amounts of assets and liabilities for financial reporting purposes and the amounts used for taxation purposes.

76
Deferred tax is measured at the tax rates that are expected to be applied to the temporary differences when they reverse, based on the laws that have been enacted or substantively enacted by the reporting date.
A deferred tax asset is recognized only to the extent that it is probable that future taxable profits will be available against which deductible temporary differences can be utilized. Deferred tax liabilities are recognized for all taxable temporary differences. Deferred tax assets and deferred tax liabilities are reviewed at each reporting date and are reduced to the extent that it is no longer probable that the related tax benefit and tax obligation, respectively will be realized.
Additional income taxes that arise from the distribution of dividends are recognized at the same time as the liability to pay the related dividend is recognized.
3.19 Standards and interpretations issued but not yet effective and not yearly adopted
The standards and interpretations that are issued, but not yet effective, up to the date of issuance of the Bank financial statements are disclosed below. The Bank intends to adopt these standards, if applicable, when they become effective.
IFRS 16 Leases
IFRS 16 was issued in January 2016 and it replaces IAS 17 Leases, IFRIC 4 Determining whether an Arrangement contains a Lease, SIC-15 Operating Leases-Incentives and SIC-27 Evaluating the Substance of Transactions Involving the Legal Form of a Lease. IFRS 16 sets out the principles for the recognition, measurement, presentation and disclosure of leases and requires lessees to account for all leases under a single on-balance sheet model similar to the accounting for finance leases under IAS 17. The standard includes two recognition exemptions for lessees – leases of ’low-value’ assets (e.g., personal computers) and short-term leases (i.e., leases with a lease term of 12 months or less). At the commence-ment date of a lease, a lessee will recognise a liability to make lease payments (i.e., the lease liability) and an asset representing the right to use the underlying asset during the lease term (i.e., the right-of-use asset). Lessees will be required to separately recognise the interest expense on the lease liability and the depreciation expense on the right-of-use asset.
Lessees will be also required to remeasure the lease liability upon the occurrence of certain events (e.g., a change in the lease term, a change in future lease payments resulting from a change in an index or rate used to determine those payments). The lessee will generally recognise the amount of the remeasurement of the lease liability as an adjustment to the right-of-use asset.
Lessor accounting under IFRS 16 is substantially unchanged from today’s accounting under IAS 17. Lessors will continue to classify all leases using the same classification principle as in IAS 17 and distinguish between two types of leases: operating and finance leases.
IFRS 16 also requires lessees and lessors to make more extensive disclosures than under IAS 17.
IFRS 16 is effective for annual periods beginning on or after 1 January 2019. Early application is permitted, but not before an entity applies IFRS 15. A lessee can choose to apply the standard using either a full retrospective or a modified retrospective approach. The standard’s transition provisions permit certain reliefs.
The bank has identified 35 lease contracts to be within the scope of IFRS 16 with an average lease maturity of 3.5 years. Based on Bank preliminary calculations of the right of use asset is € 2,600 thousands.
IFRS 17 Insurance Contracts
In May 2017, the IASB issued IFRS 17 Insurance Contracts (IFRS 17), a comprehensive new accounting standard for insurance contracts covering recognition and measurement, presentation and disclosure. Once effective, IFRS 17 will replace IFRS 4 Insurance Contracts (IFRS 4) that was issued in 2005. IFRS 17 applies to all types of insurance contracts (i.e., life, non-life, direct insurance and re-insurance), regardless of the type of entities that issue them, as well as to certain guarantees and financial instruments with discretionary participation features.
IFRS 17 is effective for reporting periods beginning on or after 1 January 2021, with comparative figures required.
For the following new standards and interpretations, the Bank anticipates that their adoption will have no material impact on the financial statements of the Bank in the period of initial application and are not expected to have an impact over the financial statements of the Bank:
• IFRIC 23 “Uncertainty over Income Tax Treatments” (effective for annual periods beginning on or after 1 Janu-ary 2019),
• Amendments to IFRS 9 “Financial Instruments” - Prepayment Features with Negative Compensation (effective

77
Add
ress
es
F
inan
cial
Sta
tem
ents
Segm
ent
Repo
rts
P
erfo
rman
ce a
nd F
inan
cial
s
Th
e Ba
nkin
g Se
ctor
RBI
Visi
on a
nd M
issio
n
M
anag
emen
t Bo
ard
Intro
duct
ion
for annual periods beginning on or after 1 January 2019),
• Amendments to IFRS 10 “Consolidated Financial Statements” and IAS 28 “Investments in Associates and Joint Ventures” - Sale or Contribution of Assets between an Investor and its Associate or Joint Venture and further amendments (effective date deferred indefinitely until the research project on the equity method has been concluded),
• Amendments to IAS 19: Plan Amendment, Curtailment or Settlement - accounting when a plan amendment, curtailment or settlement occurs during a reporting period (effective for annual periods beginning on or after 1 January 2019)
• Amendments to IAS 28 “Investments in Associates and Joint Ventures” - Long-term Inter-ests in Associates and Joint Ventures (effective for annual periods beginning on or after 1 January 2019),
• Conceptual Framework in IFRS standards - For preparers who develop accounting policies based on the Conceptual Framework, it is effective for annual periods beginning on or after 1 January 2020,
• IFRS 3: Business Combinations (Amendments) - (effective for annual periods beginning on or after 1 January 2020),
• IAS 1 Presentation of Financial Statements and IAS 8 Accounting Policies, Changes in Accounting Estimates and Errors: Definition of ‘material’ (Amendments) - (effective for annual periods beginning on or after 1 Janu-ary 2020),
• Amendments to various standards due to “Improvements to IFRSs (cycle 2015-2017)” resulting from the annual improvement project of IFRS, which become effective for annual periods beginning on or after 1 January 2019, and including:
• IFRS 3 Business Combinations
• IFRS 11 Joint Arrangements
• IAS 12 Income Taxes
• IAS 23 Borrowing costs.
3.20 Standards issued and effective for the annual period
The following new amendments to the existing standards issued by the International Accounting Standards Board (IASB) are effective for the current reporting period, but their adoption has not led to any changes in the Company’s accounting policies:
• Amendments to IFRS 2 “Share-based Payment” - Classification and Measurement of Share-based Payment Transactions (effective for annual periods beginning on or after 1 January 2018),
• Amendments to IFRS 4 “Insurance Contracts” - Applying IFRS 9 “Financial Instruments” with IFRS 4 “Insurance Contracts” (effective for annual periods beginning on or after 1 January 2018 or when IFRS 9 “Financial Instru-ments” is applied first time),
• Amendments to IAS 40 “Investment Property” - Transfers of Investment Property (effective for annual periods beginning on or after 1 January 2018),
• IFRIC 22 “Foreign Currency Transactions and Advance Consideration” (effective for annual periods beginning on or after 1 January 2018),
• Amendments to IFRS 1 and IAS 28 due to “Improvements to IFRSs (cycle 2014-2016)” resulting from the annual improvement project of IFRS (IFRS 1, IFRS 12 and IAS 28) primarily with a view to removing inconsistencies and clarifying wording (amendments to IFRS 1 and IAS 28 are applied for annual periods beginning on or after 1 January 2018).
4 Financial risk management4.1 Overview
The Bank has exposure to the following risks from its use of financial instruments:
• credit risk
• liquidity risk
78
• market risk
• operational risk
This note presents information about the Bank’s exposure to each of the above risks, the Bank’s objectives, policies and processes for measuring and managing risk, and the Bank’s management of capital.
Risk management framework
The internal controls and additional risk control tools set by Raiffeisen International Risk Management enable the con-trolled risk management of the Bank. The main Risk Management Tools have been endorsed by Raiffeisen International and are applied for use by the Bank.
From January 2008, the Bank has been complying with and reports based on Basel II requirements at the Group level covering credit and market risks. The implementation of Basel II requirements should ensure a better management of the capital.
The simple financial and market environment in Kosovo allows for the use of simple analysis method. Future more com-plex factors and risks in the banking industry will be supported by the development of new methods to better manage them.
Based on the Bank policies, the Bank’s total assets are classified and analysed as follows:
• Analysis of assets based on the class of asset / product (the assets are classified based on the Group Product Catalogue);
• Analysis of assets based on the credit quality (the assets are classified based on the Group Directives);
• Analysis of assets in line with the measurement basis;
Analysis of assets based on age, which means analysis performed for assets that are past due but not impaired;
• Individual analysis of assets determined as impaired by impairment factors;
• Analysis of assets based on the collateral type and with consideration to the recoverable estimated amount;
• Analysis of assets based on the concentration of risks for industry / sector / segment / certain exposure amount.
4.2 Credit risk
Credit risk is the risk of financial loss to the Bank if a customer or counterparty to a financial instrument fails to meet its contractual obligations, and arises principally from the Bank’s loans and advances to customers and other banks and investment securities. For risk management reporting purposes, the Bank considers all elements of credit risk exposure (such as individual obligor default risk, country and sector risk).
The Bank takes on exposure to credit risk which is the risk that a counterparty will be unable to pay amounts in full when due. The Bank structures the levels of credit risk it undertakes by placing limits on the amount of risk accepted in relation to one borrower and to geographical and industry segments. Such risks are monitored on a revolving basis and subject to a monthly or more frequent review. Limits on the level of credit risk by borrower are approved by Management.
Exposure to credit risk is managed through regular analysis of the ability of borrowers and potential borrowers to meet interest and principal repayment obligations and by changing these lending limits, where appropriate. Exposure to credit risk is also managed, in part, by obtaining collateral and corporate and personal guarantees.
The Bank’s maximum exposure to credit risk is primarily reflected in the carrying amounts of financial assets on the state-ment of financial position. The impact of possible netting of assets and liabilities to reduce potential credit exposure is not significant.
Credit risk for off-balance sheet financial instruments is defined as the possibility of sustaining a loss as a result of another

79
Add
ress
es
F
inan
cial
Sta
tem
ents
Segm
ent
Repo
rts
P
erfo
rman
ce a
nd F
inan
cial
s
Th
e Ba
nkin
g Se
ctor
RBI
Visi
on a
nd M
issio
n
M
anag
emen
t Bo
ard
Intro
duct
ion
party to a financial instrument failing to perform in accordance with the terms of the contract. The Bank uses the same credit policies in making conditional obligations as it does for on-balance sheet financial instruments through established credit approvals, risk control limits and monitoring procedures.
The Bank holds different types of collateral as security for the credit risk. Additionally, other credit enhancement methods are applied. The main types of collateral are listed below:
• Property (land, buildings)
• Apartments
• Vehicles
• Equipment
• Personal Guarantee
The collateral value is calculated according to specified methods which include standardized calculation formulas based on market values, predefined discounts, and expert assessments.
Collateral evaluation and re-evaluation is direct responsibility of Collateral Specialist of the bank, for all type of collater-als. Real estate appraisal is updated once a year. This yearly update is performed internally by the respective Collateral Specialist. If the update of the revaluation is not done once every 18 months, the WCV of the respective mortgage is reduced by at least 10% per year as long as there is no actual update performed. More frequent monitoring is required where the real estate market is subject to significant changes in conditions.
Impaired loans and securities
Impaired loans and securities are loans and securities for which the Bank determines that it is probable that it will be unable to collect all principal and interest due according to the contractual terms of the loan / securities agreement(s).
Past due but not impaired loans (Policy applicable before 1 January 2018)
Loans where contractual interest or principal payments are past due but the Bank believes that impairment is not ap-propriate on the basis of the level of security / collateral available and / or the stage of collection of amounts owed to the Bank.
Loans with renegotiated terms
Loans with renegotiated terms are loans that have been restructured due to deterioration in the borrower’s financial posi-tion and where the Bank has made concessions that it would not otherwise consider. Once the loan is restructured it remains in this category until sustained performance is observed. Sustained performance is defined as three consecutive contractual payments of principal and/or interest.
ECL
The Bank establishes a reserve for expected credit losses that represents its estimate of expected losses in its loan/security and off balance portfolio.
Write-off policy
The Bank’s accounting policy under IFRS 9 remains the same as it was under IAS 39. Financial assets are written off either partially or in their entirety only when the Bank has stopped pursuing the recovery. If the amount to be written off is greater than the accumulated loss allowance, the difference is first treated as an addition to the allowance that is then applied against the gross carrying amount. Any subsequent recoveries are credited to credit loss expense.

80
Overview of forborne loans
The following tables provide a summary of the Bank’s forborne assets as of 31 December 2018 and 31 December 2017.
Overview of forborne loans
Stage 2 Stage 3
31 December 2018 Gross carrying amount
Permanent modifi-cations to T&Cs
Total performing forborne loans
Permanent modifica-tions to T&Cs
Total non-performing forborne
loans
Total forborne loans Forbearance ratio
Due from banks 7,600 - - - - - 0%
Loans and advances to customers - - - - - - -
Non-Retail 296,649 7,781 - 11,668 - - 0%
Retail 318,544 2,829 2,832 768 768 3,600 1.13%
Total loans and advances to customers 615,193 10,610 2,832 12,436 768 3,600 1.13%
Performing portfolio Non-Performing portfolio
31 December 2017 Gross carrying amount
Permanent modifi-cations to T&Cs
Total performing forborne loans
Permanent modifica-tions to T&Cs
Total non-performing forborne
loans
Total forborne loans Forbearance ratio
Due from banks 16,091 - - - - - 0%
Loans and advances to customers - - - - - - -
Non-Retail 278,404 6,363 - 18,826 - - 0%
Retail 275,565 2,724 2,704 825 838 3,542 1.29%
Total loans and advances to customers 553,969 9,087 2,704 19,651 838 3,542 1.29%
Gross amount of forborne loans ECLs of forborne loans
31 December 2018 Stage 2 Stage 3 Total Stage 2 Collective Stage 3 Collective Total
Due from banks - - - - - -
Loans and advances to customers - - - - - -
Non-Retail - - - - - -
Retail 2,832 768 3,600 333 716 1,049
Total loans and advances to customers 2,832 768 3,600 333 716 1,049
31 December 2017 PerformingNon-perform-
ing but not impaired
Non-performing and impaired Total Specific allowance Collective allow-
ance Total
Due from banks - - - - - - -Loans and advances to customers - - - - - - -Non-Retail - - - - - - -Retail 2,704 138 700 3,542 - 970 970
Total loans and advances to customers 2,704 138 700 3,542 - 970 970

81
Add
ress
es
F
inan
cial
Sta
tem
ents
Segm
ent
Repo
rts
P
erfo
rman
ce a
nd F
inan
cial
s
Th
e Ba
nkin
g Se
ctor
RBI
Visi
on a
nd M
issio
n
M
anag
emen
t Bo
ard
Intro
duct
ion
Loans and advances to customers Fair value of collateral
31 December 2018 Retail Corporate Total Retail Corporate Total
Commercial Real Estate 821 4,933 5,754 786 4,871 5,657
Residential Real Estate 34,588 - 34,588 32,078 - 32,078
Movable 283,135 291,716 574,851 172,268 281,339 453,607
Total 318,544 296,649 615,193 205,132 286,210 491,342
Loans and advances to customers Fair value of collateral
31 December 2017 Retail Corporate Total Retail Corporate Total
Commercial Real Estate 522 6,135 6,657 277 7,779 8,056
Residential Real Estate 27,183 - 27,183 15,697 - 15,697
Movable 247,860 272,269 520,129 30,570 283,335 313,905
Total 275,565 278,404 553,969 46,544 291,114 337,658
Loans and advances to customers
Maximum exposures to credit risk before collateral and other credit enhancements as at 31 December 2017 by counterparty sector.
Loans and advances to customers
2018 2017
Maximum exposure to credit risk
Gross amount 615,193 553,969
Allowance for impairment (21,991) (21,493)
Net carrying amount 593,202 532,476
Loans with renegotiated terms
Gross carrying amount 22,714 28,005
Allowance for impairment (12,025) (12,545)
Net carrying amount 10,689 15,460
Loans and advances to customers
2018 2017
Non-Derivative
Banks 138,999 161,394
Sovereigns 123,722 194,555
Corporate customers 372,701 338,746
Retail customers 310,348 268,295
Total gross amount 945,770 962,990
Derivative
Banks 28,930 36,330
Total gross amount 28,930 36,330
Set out below is an analysis of collateral and credit enhancement obtained during the years:
The tables below set out information about the credit quality of financial assets and the allowance for impairment/loss held by the Bank against those assets.

82
Set out below is an analysis of financial assets measured at amortised cost. Unless specifically indicated, for financial assets, the amounts in the table represent gross carrying amounts:
The Bank monitors concentrations of credit risk by sector. An analysis of concentrations of credit risk as at 31 December 2018 and 31 December 2017 for loans and advances to customers past due and impaired – Stage 3 are shown below:
31 December
2018
Total gross carrying amount Stage 1 Stage 2 Stage 3 Fair value of the
collateral
Non-retail Customers 296,649 258,840 23,741 14,068 286,210
Retail Customers 318,544 298,780 13,757 6,007 205,132
Total Loans and Advances to Customers 615,193 557,620 37,498 20,075 491,342
31 December
2017
Total gross carrying amount Stage 1 Stage 2 Stage 3 Fair value of the
collateral
Non-retail Customers 278,404 235,886 18,196 24,322 291,114
Retail Customers 275,565 256,473 14,247 4,845 46,544
Total Loans and Advances to Customers 553,969 492,359 32,443 29,167 337,658
31 December
2018
Demand and less than 1 month From 1 to 3 months From 3 to 12
monthsMore than 12
month Total
Non-retail Customers 10,904 90 1,261 1,813 14,068
Retail Customers 397 87 861 4,662 5,735
Total Loans and advances to customers impaired 11,301 177 2,122 6,475 20,075
31 December
2017
Demand and less than 1 month From 1 to 3 months From 3 to 12
monthsMore than 12
month Total
Non-retail Customers 17,967 80 2,065 4,210 24,322
Retail Customers 654 118 619 3,454 4,845
Total Loans and advances to customers impaired 18,621 198 2,684 7,664 29,167

83
Add
ress
es
F
inan
cial
Sta
tem
ents
Segm
ent
Repo
rts
P
erfo
rman
ce a
nd F
inan
cial
s
Th
e Ba
nkin
g Se
ctor
RBI
Visi
on a
nd M
issio
n
M
anag
emen
t Bo
ard
Intro
duct
ion
Loans and advances to Banks
Interbank exposures are closely monitored on a daily basis by risk management and the Treasury Department. The Bank limits its deposits and other banking transactions to sound local or international banks. Before a business relationship is initiated with a given bank, the management and the Risk Department carry out an analysis of the institution’s financial standing. The financial performance of the counterparties is continuously monitored. Moreover, all correspondent banks as well as bond issuers in which the Bank has investment exposures are continuously monitored for their ratings by international rating agencies like: Moody’s, Standard & Poor’s (S&P) and Fitch except for exposures with Kosovo T-bills which are not rated. In order to represent the ratings of different international rating agencies the tables below have been prepared in accordance with Central Bank of Kosovo rating scales representing as below;
A function independent from the treasury department, usually risk management, has to monitor that the exposure toward all banks does not exceed regulatory limits or internal limits set by the management of the Bank. In accordance to the new regulation on large exposures of the Central Bank of Republic of Kosovo, banks shall not have any aggregate credit risk exposure to related counterparties exceeding 15 per cent of Tier I Regulatory Capital. Loans and advances to banks are granted without collateral. The table below presents the Bank’s current accounts and time deposits with corresponding banks by credit ratings, which are all classified as Stage 1.
Investment Securities
Investments in securities are mainly invested in government bonds with OECD Countries, Republic of Kosovo T Bills and corporate bonds.
The investments are primarily for liquidity management of the bank and insure sufficient risk diversification in terms of credit exposure with one sovereign also considering the local regulatory environment and limitation on large exposures.
The below table represents securities exposure based on Moody’s rating;
The exposure reported as not rated reflects the bank exposure to Republic of Kosovo.
Moody' or equivalent
Ratings definitions Long term rating scale Short term rating scale
High credit quality
AaaAa1Aa2Aa3
P-1
Strong payment capacity A1A2A3
P-2
Adequate payment capacityBaa1Baa2Baa3
P-3
At 31 December 2018 2017
P-1 11,999 11,807
P-2 15,433 26,721
P-3 4,134 16,373
31,566 54,901
2018 2017
P-1 45,322 100,588
P-2 38,303 46,078
P-3 14,078 14,304
Not Rated 26,019 33,585
123,722 194,555
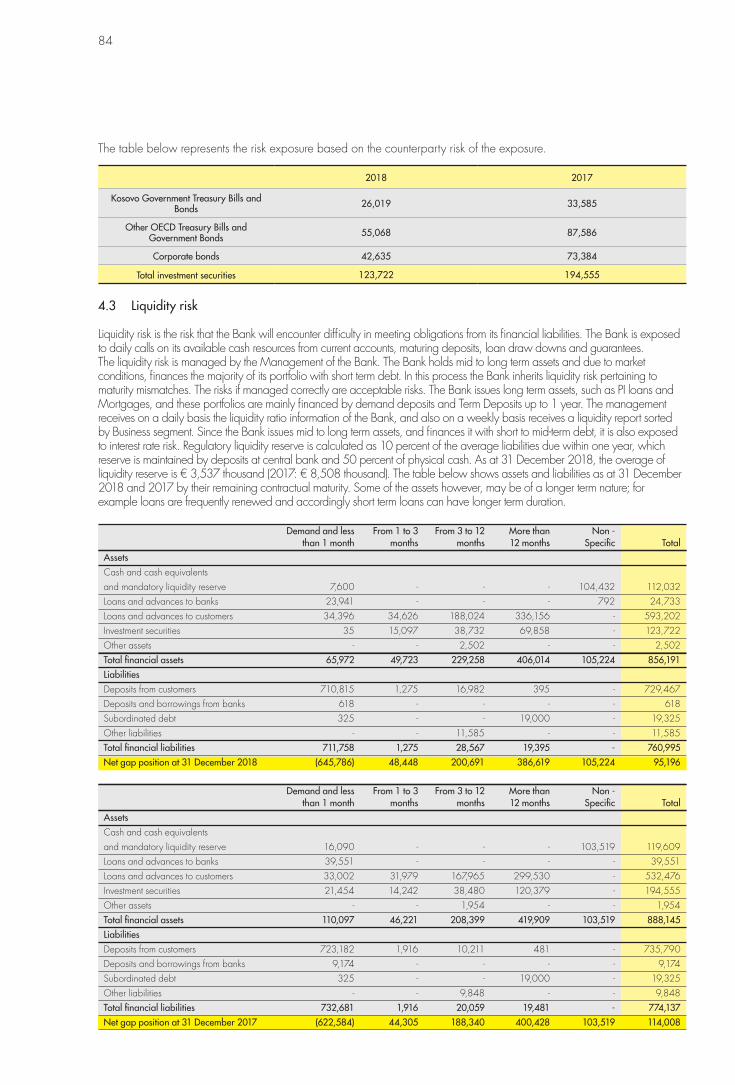
84
The table below represents the risk exposure based on the counterparty risk of the exposure.
4.3 Liquidity risk
Liquidity risk is the risk that the Bank will encounter difficulty in meeting obligations from its financial liabilities. The Bank is exposed to daily calls on its available cash resources from current accounts, maturing deposits, loan draw downs and guarantees. The liquidity risk is managed by the Management of the Bank. The Bank holds mid to long term assets and due to market conditions, finances the majority of its portfolio with short term debt. In this process the Bank inherits liquidity risk pertaining to maturity mismatches. The risks if managed correctly are acceptable risks. The Bank issues long term assets, such as PI loans and Mortgages, and these portfolios are mainly financed by demand deposits and Term Deposits up to 1 year. The management receives on a daily basis the liquidity ratio information of the Bank, and also on a weekly basis receives a liquidity report sorted by Business segment. Since the Bank issues mid to long term assets, and finances it with short to mid-term debt, it is also exposed to interest rate risk. Regulatory liquidity reserve is calculated as 10 percent of the average liabilities due within one year, which reserve is maintained by deposits at central bank and 50 percent of physical cash. As at 31 December 2018, the overage of liquidity reserve is € 3,537 thousand (2017: € 8,508 thousand). The table below shows assets and liabilities as at 31 December 2018 and 2017 by their remaining contractual maturity. Some of the assets however, may be of a longer term nature; for example loans are frequently renewed and accordingly short term loans can have longer term duration.
Demand and less From 1 to 3 From 3 to 12 More than Non - than 1 month months months 12 months Specific TotalAssetsCash and cash equivalents and mandatory liquidity reserve 7,600 - - - 104,432 112,032Loans and advances to banks 23,941 - - - 792 24,733Loans and advances to customers 34,396 34,626 188,024 336,156 - 593,202Investment securities 35 15,097 38,732 69,858 - 123,722Other assets - - 2,502 - - 2,502Total financial assets 65,972 49,723 229,258 406,014 105,224 856,191Liabilities Deposits from customers 710,815 1,275 16,982 395 - 729,467Deposits and borrowings from banks 618 - - - - 618Subordinated debt 325 - - 19,000 - 19,325Other liabilities - - 11,585 - - 11,585Total financial liabilities 711,758 1,275 28,567 19,395 - 760,995Net gap position at 31 December 2018 (645,786) 48,448 200,691 386,619 105,224 95,196
Demand and less From 1 to 3 From 3 to 12 More than Non - than 1 month months months 12 months Specific TotalAssetsCash and cash equivalents and mandatory liquidity reserve 16,090 - - - 103,519 119,609Loans and advances to banks 39,551 - - - - 39,551Loans and advances to customers 33,002 31,979 167,965 299,530 - 532,476Investment securities 21,454 14,242 38,480 120,379 - 194,555Other assets - - 1,954 - - 1,954Total financial assets 110,097 46,221 208,399 419,909 103,519 888,145Liabilities Deposits from customers 723,182 1,916 10,211 481 - 735,790Deposits and borrowings from banks 9,174 - - - - 9,174Subordinated debt 325 - - 19,000 - 19,325Other liabilities - - 9,848 - - 9,848Total financial liabilities 732,681 1,916 20,059 19,481 - 774,137Net gap position at 31 December 2017 (622,584) 44,305 188,340 400,428 103,519 114,008
2018 2017
Kosovo Government Treasury Bills and Bonds 26,019 33,585
Other OECD Treasury Bills and Government Bonds 55,068 87,586
Corporate bonds 42,635 73,384
Total investment securities 123,722 194,555

85
Add
ress
es
F
inan
cial
Sta
tem
ents
Segm
ent
Repo
rts
P
erfo
rman
ce a
nd F
inan
cial
s
Th
e Ba
nkin
g Se
ctor
RBI
Visi
on a
nd M
issio
n
M
anag
emen
t Bo
ard
Intro
duct
ion
The maturity analysis of loans to customers is based on the remaining maturity dates of the credit agreements, which means taking into account the instalments due on a monthly basis.
Liquidity reporting on a weekly basis at business segment level, monitoring of stickiness ratio separately for all business segments, banking book limits and reports, which measure the interest risks and gaps, are currently the tools applied to manage and limit the underlying risk of conducting business.
Mandatory liquidity reserves are included within demand and less than one month as the majority of liabilities to which this balance relates are also included within this category.
The maturity analysis for financial liabilities is analysed as follows:
• Based on earliest contractual maturity date – worst case scenario;• Based on contractual undiscounted cash-flows;• Determination of the time bands;• Expected cash-flows are used as supplementary information.
The matching and/or controlled mismatching of the maturities and interest rates of assets and liabilities is fundamental to the management of the Bank. It is unusual for banks to be completely matched since business transacted is often of an uncertain term and of different types. An unmatched position potentially enhances profitability, but can also increase the risk of losses. The maturities of assets and liabilities and the ability to replace interest-bearing liabilities as they mature at an acceptable cost are important factors in assessing the liquidity of the Bank and its exposure to changes in interest and exchange rates.
The Bank has a significant maturity mismatch of the assets and liabilities maturing within one year. This liquidity mismatch arises due to the fact that the major source of finance for the Bank as at 31 December 2018 was customer accounts being on demand and maturing in less than one month. Management believes that in spite of a substantial portion of customers’ accounts being on demand, diversification of these deposits by number and type of depositors would indicate that these customers’ accounts provide a long-term and stable source of funding for the Bank.
The Bank has improved the net position through other sources of funding, which provide middle-term finance and intend to continue matching assets vs. liability maturity in the periods to come. In addition, the Bank has an unused Credit Facility Agreement, which will provide support in case of liquidity needs.
The total outstanding contractual amount of commitments to extend credit does not necessarily represent future cash requirements, since many of these commitments will expire or terminate without being funded. 4.4 Market risk
Market risk is the risk that the value of an investment will decrease due to moves in market factors. The four standard market risk factors are:
• Equity risk or the risk that stock prices will change. • Interest rate risk or the risk that interest rates will change. • Currency risk or the risk that foreign exchange rates will change. • Commodity risk or the risk that commodity prices (i.e. grains, metals, etc.) will change.
The Bank takes on exposure to market risks. Market risks arise from open positions in interest rate and currency products, all of which are exposed to general and specific market movements. Management sets limits on the value of risk that may be accepted, which is monitored on a daily basis. However, the use of this approach does not prevent losses outside of these limits in the event of more significant market movements.

86
Geographical risk
The geographical concentration of the Bank’s financial assets and liabilities as at 31 December 2018 and 2017 is set out below:
Kosovo EU Other TotalAssets Cash and cash equivalents and mandatory liquidity reserve 104,432 7,600 - 112,032Loans and advances to banks - 24,733 - 24,733Loans and advances to customers 593,202 - - 593,202Investment securities 26,023 44,405 53,294 123,722Other assets 2,502 - - 2,502Total financial assets 726,159 76,738 53,294 856,191 Liabilities Deposits from customers 685,949 16,679 26,839 729,467Deposits from banks 123 495 - 618Subordinated debt - 19,325 - 19,325Other liabilities 10,773 812 - 11,585Total financial liabilities 696,845 37,311 26,839 760,995Net gap position at 31 December 2018 29,314 39,427 26,455 95,196 Kosovo EU Other TotalAssets Cash and cash equivalents and mandatory liquidity reserve 103,519 16,090 - 119,609Loans and advances to banks - 39,551 - 39,551Loans and advances to customers 532,476 - - 532,476Investment securities 33,592 93,382 67,581 194,555Other assets 1,954 - - 1,954Total financial assets 671,541 149,023 67,581 888,145 Liabilities Deposits from customers 689,336 18,374 28,080 735,790Deposits from banks 696 8,478 - 9,174Subordinated debt - 19,325 - 19,325Other liabilities 8,748 1,100 - 9,848Total financial liabilities 698,780 47,277 28,080 774,137Net gap position at 31 December 2017 (27,239) 101,746 39,501 114,008
Currency risk
This is a form of risk that arises from the change in price of one currency against another. The currency risk is managed through monitoring of open FX positions. These positions are set for daily positions and also separately, for overnight positions. The sensitivity analysis is provided to the management on weekly basis.
The Bank takes on exposure to effects of fluctuations in the prevailing foreign currency exchange rates on its financial position and cash flows. Management sets limits on the level of exposure by currency and in total, which are monitored daily. The use of euro in Kosovo and limited exposure to other currencies results in a limited need to use derivatives to manage foreign currency risk.
The Market Risk Report encapsulating the Interest Rate Risk Report and the Open FX currency report is sent to the management on weekly basis. The respective report is produced by RBI Risk management based on the inputs that are provided from local reporting resources.
The table below summarises the Bank’s exposure to foreign currency exchange rate risk at 31 December 2018 and 2017. Included in the table are the Bank’s financial assets and liabilities at carrying amounts, categorised by currency and translated into Euro ’000.

87
Add
ress
es
F
inan
cial
Sta
tem
ents
Segm
ent
Repo
rts
P
erfo
rman
ce a
nd F
inan
cial
s
Th
e Ba
nkin
g Se
ctor
RBI
Visi
on a
nd M
issio
n
M
anag
emen
t Bo
ard
Intro
duct
ion
EUR USD Other TotalAssets Cash and cash equivalents and mandatory liquidity reserve 102,201 5,080 4,751 112,032Loans and advances to banks 12,791 1,488 10,454 24,733Loans and advances to customers 593,202 - - 593,202Investment securities 92,447 31,275 - 123,722Other assets 2,502 - - 2,502Total financial assets 803,143 37,843 15,205 856,191Liabilities Deposits from customers 672,142 41,747 15,578 729,467Deposits from banks 618 - - 618Subordinated debt 19,325 - - 19,325Other liabilities 11,585 - - 11,585
Total financial liabilities 703,670 41,747 15,578 760,995 Net gap position at 31 December 2018 99,473 (3,904) (373) 95,198 EUR USD Other TotalAssets Cash and cash equivalents and mandatory liquidity reserve 111,862 1,443 6,304 119,609Loans and advances to banks 16,238 10,513 12,800 39,551Loans and advances to customers 532,476 - - 532,476Investment securities 173,426 21,129 - 194,555Other assets 1,954 - - 1,954
Total financial assets 835,956 33,085 19,104 888,145Liabilities Deposits from customers 682,101 35,196 18,493 735,790Deposits from banks 9,174 - - 9,174Subordinated debt 19,325 - - 19,325Other liabilities 9,848 - - 9,848Total financial liabilities 720,448 35,196 18,493 774,137 Net gap position at 31 December 2017 115,508 (2,111) 611 114,008
Foreign currency sensitivity analysis
The foreign currencies to which the Bank is mainly exposed are US Dollar (USD), Swiss Franc (CHF) and British Pound (GBP). The following table details the Bank’s sensitivity to the respective increase and decrease in the value of euro against the foreign currencies. The percentage used is the sensitivity rate used when reporting foreign currency risk internally to key management personnel and represents management’s assessment of the reasonably possible change in foreign exchange rates. The sensitivity analysis includes only outstanding foreign currency denominated monetary items and adjusts their translation at the period end for a respective change in foreign currency rates. The sensitivity analysis includes placements with other banks, cash with correspondent banks as well as customer deposits where the denomination of the amounts is in a currency other than the currency of the lender or the borrower. A positive number below indicates an increase in profit and other equity where the euro strengthens with respective percentages against the relevant currency. For the respective weakening of the euro against the relevant currency, there would be approximately equal and opposite impact on the profit and other equity, and the balances below would be negative.

88
Official spot exchange rates for major currencies used in the translation of the reporting date items denominated in foreign currencies were as follows (in euro):
Compared to € 31 December 2018 31 December 20171 USD 1.144 1.1991 CHF 1.126 1.1771 GBP 0.898 0.888
US Dollar Swiss Franc British Pound (USD) (CHF) (GBP) 2018 2017 2018 2017 2018 2017Sensitivity rates 6.5% 10% 3.9% 6% 2.1% 4%Profit and loss 20,538 2,744 45,877 (2,356) 250 957
In management’s opinion, the sensitivity analysis is unrepresentative of the inherent foreign exchange risk, as the year-end exposure does not reflect the exposure during the year. US Dollar, Swiss Franc and British Pound denominated transactions are infrequent and are only for transactions and placements with non-EU financial institutions.
Interest rate risk
This is the risk that the relative value of an interest-bearing asset will lose in value. The Bank’s assets being largely in mid to long fixed term loans, and liabilities being mainly short term deposits, exposes the Bank to a mismatch in interest rates, and consequently the corresponding gaps exposed the Bank to interest rate movements in the market.
The Bank takes on exposure to the effects of fluctuations in the prevailing levels of market interest rates on its financial position and cash flows. Interest margins may increase as a result of such changes but may reduce or create losses in the event that unexpected movements arise.
The Bank is exposed to interest rate risk, principally as a result of lending at fixed interest rates, in amounts and for periods, which differ from those of term deposits at fixed interest rates. In practice interest rates are generally fixed on a short-term basis. Management sets limits on the level of mismatch of interest rate re-pricing that may be undertaken. Under the interest rate SWAP contracts, the Bank agrees to exchange the difference between the fixed and floating rate interest amount calculated on agreed notional principal amounts. Cash in hand and balances with CBK on which no interest is paid are included in the “non-interest bearing” column in the below table as well as non-interest bearing deposits of customers.
In order to hedge for the gaps in fixed-mid to long term loans vs. variable short to mid-term debt, financial derivatives called Interest Rate Swaps are used, whereby Raiffeisen Bank Kosovo is mainly a fixed side interest payer, whereas in return the counterparty is variable rate payer, and the variable side is indexed to 6 Month EURIBOR, to ensure optimal sensitivity.Raiffeisen Bank Kosovo applies active risk management to hedge against market risk positions. Interest rate risk is partially hedged through financial derivatives. In order to ensure long term stability in the cash flow from existing loan portfolios, maturing from between 2018 to 2029 these positions are hedged through Interest Rate Swaps.
The Interest Rate Swaps are accounted for as banking book derivatives without hedge accounting. Interest Rate Swaps are measured at market value on each reporting date and any changes resulting from this are recognized in Profit and Loss of the year. The positions are measured using basis point value method.

89
Add
ress
es
F
inan
cial
Sta
tem
ents
Segm
ent
Repo
rts
P
erfo
rman
ce a
nd F
inan
cial
s
Th
e Ba
nkin
g Se
ctor
RBI
Visi
on a
nd M
issio
n
M
anag
emen
t Bo
ard
Intro
duct
ion
The table below summarises the Bank’s exposure to interest rate risks. Included in the table are the Bank’s financial assets and liabilities at carrying amounts, categorised by the earlier of contractual re-pricing or maturity dates.
Demand and less From 1 to 3 From 3 to 12 More than Non-interest than 1 month months months 12 months bearing TotalAssetsCash and cash equivalents and mandatory liquidity reserve 7,600 - - - 104,432 112,032Loans and advances to banks 23,941 - - - 792 24,733Loans and advances to customers 34,396 34,626 188,024 336,156 - 593,202Investment securities 35 15,097 38,732 69,858 - 123,722Other assets - - - - 2,502 2,502
Total financial assets 65,972 49,723 226,756 406,014 107,726 856,191Liabilities Deposits from customers 135,419 1,275 16,975 395 575,403 729,467Deposits from banks 123 - - - 495 618Subordinated debt 325 - - 19,000 - 19,325Other liabilities - - - - 11,585 10,935
Total financial liabilities 135,867 1,275 16,975 19,395 587,483 760,995Net gap position at 31 December 2018 (69,895) 48,448 209,781 386,619 (479,757) 95,156
Zero interest deposits from customers in the amount of € 575,403 thousand are mainly current accounts of businesses and individuals. They do not have any contractual re-pricing or maturity dates, however the interest rates would respond in a short amount of time in response to changes in market interest rates.
Demand and less From 1 to 3 From 3 to 12 More than Non-interest than 1 month months months 12 months bearing TotalAssetsCash and cash equivalents and mandatory liquidity reserve 16,091 - - - 103,518 119,609Loans and advances to banks 38,811 - - - 740 39,551Loans and advances to customers 33,002 31,979 167,965 299,530 - 532,476Investment securities 21,453 14,243 38,480 120,379 - 194,555Other assets - - - - 1,954 1,954
Total financial assets 109,357 46,222 206,445 419,909 106,212 888,145Liabilities Deposits from customers 136,559 1,998 10,131 534 586,568 735,790Deposits from banks 8,478 - - - 696 9,174Subordinated debt 325 - - 19,000 - 19,325Other liabilities - - - - 9,848 9,848
Total financial liabilities 145,362 1,998 10,131 19,534 597,112 774,137Net gap position at 31 December 2017 (36,005) 44,224 196,314 400,375 (490,900) 114,008

90
The table below summarises the effective interest rates by major currencies for major monetary financial instruments. The analysis has been prepared using annual effective rates.
In percentage 2018 2017 EUR USD CHF GBP EUR USD CHF GBPAssets Loans and advances to banks (0.2) 1.6 (0.5) (0.4) (0.9) 1.0 (0.8) 0.2Government Bonds HTM yield (0.3) N/A N/A N/A (0.4) - N/A N/AGovernment Bonds AFV yield 0.5 1.8 N/A N/A 0.2 2.7 N/A N/ALoans and advances to customers 7.3 N/A N/A N/A 7.5 N/A N/A N/A Liabilities Customer accounts N/A N/A N/A N/A 0.0 0.0 0.0 0.0Term deposits 0.6 0.0 0.0 0.0 1.6 0.0 0.0 0.0Savings accounts 0.0 0.0 0.1 0.1 0.0 0.0 0.2 0.1
From Risk Management and control perspective, there are two aspects of risk:
• Risk evaluation• Risk Control
Interest rate risk evaluation
Interest rate risk sensitivity is measured to quantify dependence of the present value of a position on a risk factor. The interest rate sensitivities, often referred to as basis point values (BPV), give the change of the present value in units of the reference currency, under the assumption that interest rates change by 200 bps. The Interest Rate risk is measured using VaR (Value at risk) approach. This approach implies a measurement scenario using 10 days duration and 99 per cent confidence interval. The VaR is measured at stress of 1bps shift in the Yield curve. This Scenario assumes the implication on Profit and loss account of the Bank, in case the yield curve moves in one or the other direction by 200 basis point. Below are presented BPV data as per 2018 and 2017:
+200bps -200bps +200bps -200bps
Total IS Sensitivity 2018 Year1 Year2 Year1 Year2 Total IS Sensitivity 2017 Year1 Year2 Year1 Year2
1,500 5,300 -3,700 -8,700 - 4,900 -3,000 -9,700
Value at risk as of 31 December 2018 is € 234 thousand, 31 December 2017 € 207 thousand. The effect of interest rate risk on equity is similar to that on Profit and Loss. The results of the sensitivity analysis are presented to the management on a weekly basis, and are independently reviewed by RBI Vienna Risk Management.
Interest Rate Risk Control
The mechanism of control interest rate risk is utilized through the daily Basis Point Value (BPV) reports. The Bank currently has a BPV limit of €15 thousand. For the purpose of measuring BPV, administered rate products are modelled using replicating portfolio. The Basis Point Value is measured per currency and per time band. The limits are also set for each currency and for different time bands. 4.5 Operational risk
The primary responsibility for the development and implementation of controls to address operational risk is assigned to senior management within each business unit. This responsibility is supported by the development of overall Bank standards for the management of operational risk in the following areas:
• requirements for appropriate segregation of duties, including the independent authorisation of transactions• requirements for the reconciliation and monitoring of transactions• compliance with regulatory and other legal requirements • documentation of controls and procedures• requirements for the periodic assessment of operational risks faced, and the adequacy of controls and procedures
to address the risks identified• requirements for the reporting of operational losses and proposed remedial action• development of contingency plans• training and professional development• ethical and business standards• risk mitigation, including insurance where this is effective.

91
Add
ress
es
F
inan
cial
Sta
tem
ents
Segm
ent
Repo
rts
P
erfo
rman
ce a
nd F
inan
cial
s
Th
e Ba
nkin
g Se
ctor
RBI
Visi
on a
nd M
issio
n
M
anag
emen
t Bo
ard
Intro
duct
ion
Compliance with Bank standards is supported by a programme of periodic reviews undertaken by Internal Audit. The results of Internal Audit reviews are discussed with the management of the business unit to which they relate, with summaries submitted to the Audit Committee and senior management of the Bank.
4.6 Capital risk management
Regulatory capital
The Bank manages its capital to ensure that it will be able to continue as a going concern while maximising the return to shareholders through the optimisation of the debt and equity balance. The Bank’s overall strategy remains unchanged from previous year. The capital structure of the Bank consists of debt, which includes borrowings, and equity attributable to equity holders, comprising issued capital and retained earnings.
Capital requirements for operational risk
The capital requirements for operational risk are calculated based on CBK regulation “on operational risk management”, using the basic indicator approach. Under the Basic Indicator Approach, the capital requirement for operational risk is equal to 15 per cent (fifteen per cent) of the relevant indicator. The relevant indicator is the average over three years of the sum of net interest income and net non-interest income.
Capital adequacy ratio
The Capital Adequacy Ratio is the proportion of the regulatory capital to risk weighted assets, off balance-sheet items and other risks, expressed as a percentage. The minimum required Capital Adequacy Ratio is 8 per cent for Tier 1 capital and 12 per cent for total own funds. The Bank has met these regulatory requirements during and at the year end of 2018 and 2017.
Risk-weighted assets (RWAs)
Assets are weighted according to broad categories of national risk, being assigned a risk weighting according to the amount of capital deemed to be necessary to support them. Six categories of risk weights (0 per cent, 20 per cent, 50 per cent, 75 per cent, 100 per cent, and 150 per cent) are applied; for example, cash and money market instruments have a zero risk weighting which means that no capital is required to support the holding of these assets. Property and equipment carries a 100 per cent risk weighting, meaning that it must be supported by capital (Tier 1) equal to 8 per cent of the carrying amount. Risk weighted assets are calculated based on local regulatory requirements.
Off-balance-sheet credit related commitments are taken into account. The amounts are then weighted for risk using the same percentages as for on-balance-sheet assets.
31 December 31 December 2018 2017Total risk weighted assets 622,256 565,443Total risk weighted off balance exposures 29,915 19,874Total risk weighted assets for operational risk 53,228 51,739
Total 705,399 637,056Regulatory capital (Total Capital) 132,704 130,351Capital adequacy ratio (Total Capital) 18.81% 20.46%
The Bank’s policy is to maintain a strong capital base to maintain investor, creditor and market confidence and to sustain future development of the business. The impact of the level of capital on shareholder return is also recognised and the Bank recognises the need to maintain a balance between the higher returns that might be possible with greater gearing and the advantages and security afforded by a sound capital position.
There have been no material changes in the Bank’s management of capital during the period.
Gearing ratio
The Bank’s risk management committee reviews the capital structure on a continuous basis. As part of this review, the committee considers the cost of capital and the risk associated with each class of capital. The gearing ratio at the year ended was as follow:

92
5 Fair value of financial instrumentsThe Bank measures fair values using the following fair value hierarchy, which reflects the significance of the inputs used in making the measurements.
Level 1: inputs that are quoted market prices (unadjusted) in active markets for identical instruments. Level 2: inputs other than quoted prices included within Level 1 that are observable either directly (i.e. as prices) or indirectly (i.e. derived from prices). This category includes instruments valued using: quoted market prices in active markets for similar instruments; quoted prices for identical or similar instruments in markets that are considered less than active; or other valuation techniques in which all significant inputs are directly or indirectly observable from market data. Level 3: inputs that are unobservable. This category includes all instruments for which the valuation technique includes inputs not based on observable data and the unobservable inputs have a significant effect on the instrument’s valuation. This category includes instruments that are valued based on quoted prices for similar instruments for which significant unobservable adjustments or assumptions are required to reflect differences between the instruments.
Valuation techniques include net present value and discounted cash flow models, comparison with similar instruments for which market observable prices exist, and other valuation models. Assumptions and inputs used in valuation techniques include risk-free and benchmark interest rates, credit spreads and other premia used in estimating discount rates, bond and equity prices, foreign currency exchange rates, equity and equity index prices and expected price volatilities and correlations. The objective of valuation techniques is to arrive at a fair value measurement that reflects the price that would be received to sell the asset or paid to transfer the liability in an orderly transaction between market participants at the measurement date.
5.1 Financial instruments not measured at fair value
Cash and cash equivalents and mandatory reserve
Cash and cash equivalents include inter-bank placements and items in the course of collection. As these balances are short term and at floating rates their fair value is considered to equate to their carrying amount.
Loans and advances to banks
Loans and advances to banks are consisted of term deposits and guarantees from other banks. As these balances are short term and at floating rates their fair value is considered to equate to their carrying amount.
Subordinated loan
Long term subordinated loan due to Raiffeisen Bank International has an estimated fair value approximately equal to its carrying amount because of its underlying floating interest rate.
The following table sets out the fair values of financial instruments not measured at fair value and analyses them by the level in the fair value hierarchy into which each fair value measurement is categorised.
Carrying Fair value Carrying Fair value value Level 3 value Level 3 Assets 2018 2018 2017 2017Loans and advances to customers 593,202 594,885 532,476 542,246
Liabilities Deposits from customers 729,467 729,962 735,790 735,806Deposits from banks 618 618 9,174 9,174
2018 2017Debt 19,449 27,803Equity 127,664 125,315Net debt to equity ratio 15% 22%

93
Add
ress
es
F
inan
cial
Sta
tem
ents
Segm
ent
Repo
rts
P
erfo
rman
ce a
nd F
inan
cial
s
Th
e Ba
nkin
g Se
ctor
RBI
Visi
on a
nd M
issio
n
M
anag
emen
t Bo
ard
Intro
duct
ion
5.2 Financial instruments measured at fair value- fair value hierarchy
The following table analyses financial instruments measured at fair value at the reporting date, by the level in the fair value hierarchy into which the fair value measurement is categorized. The amounts are based on the values recognized in the statement of financial position.
31 December 2018
Non-derivatives Carrying value Fair Value Level 1 Fair Value Level 2 Fair Value Level 3
Investment securities 123,722 97,704 26,018
Financial investments at fair value through profit or loss 27,882 6,581 21,301 -
Financial investments at fair value through OCI 95,840 91,123 4,717 -
Derivatives 812 812 - -
Derivatives held for risk management (Note 18) 812 812 - -
31 December 2017
Non-derivatives Carrying value Fair Value Level 1 Fair Value Level 2 Fair Value Level 3
Investment securities 194,555 160,970 33,535 -
Financial investments at fair value through profit or loss 79,497 45,912 33,535 -
Financial investments available for sale 102,726 102,726 - -
Financial investments held to maturity 12,332 12,332 -
Derivatives 1,100 1,100 - -
Derivatives held for risk management (Note 18) 1,100 1,100 - -
6. Transition disclousures
The following pages set out the impact of adopting IFRS 9 on the statement of financial position, and retained earnings including the effect of replacing IAS 39’s incurred credit loss calculations with IFRS 9’s ECLs.
IAS 39 IFRS 9
Reff Category Amount Reclassification Remeasure-ment
Category Amount
Assets
Cash and cash equiva-lents and mandatory reserve
119,609 119,609
Financial investments – AFV
AFV 79,497 (79,497) - 0
To: Debt instrument man-datorily at fair value
A 79,497 - FVPL 79,497
Financial investments – AFS
AFS 102,726 (102,726) - 0
To: Debt instruments at fair value through other comprehensive income
B 102,726 - FVOCI 102,726
Financial investments –HTM
HTM 12,332 (12,332) - 0
To: Debt instruments at amortised cost
C 12,332 - AC 12,332
Loans and advances to banks
39,551 AC 39,551
Loans and advances to customers
L&R 532,476 - (142) AC 532,334
Total assets - - (142) -

94
Liabilities
Deposits from customers AC 735,790 - - AC 735,790
Deposits and borrowings from banks
AC 9,174 - - AC 9,174
Financial liabilities held for trading
AC 1,100 - - FVTPL 1,100
Provisions and Other liabilities
N/A 8,748 - 139 N/A 8,887
Deferred Tax Liability D 482 - - 482
Total liabilities - - 139 -
A. As of 1 January 2018, the Bank did not have any debt instruments that did not meet the SPPI criterion within its held-to-maturity portfolio. Therefore, it elected to classify all of these instruments as debt instruments measured at amortised cost.
B. As of 1 January 2018, the Bank has assessed its liquidity portfolio which had previously been classified as AFS debt instruments. The Bank concluded that these instruments are managed within a business model of collecting contractual cash flows and selling the financial assets. Accordingly, the Bank has classified these investments as debt instruments measured at FVOCI.
C. As of 1 January 2018, the Bank has assessed its fair value portfolio which had previously been classified as AFV debt instruments. The Bank concluded that these instruments are managed within a business model of trading portfolio. Accordingly, the Bank has classified these investments as debt instruments measured at FVTPL.
D. The impact of adopting IFRS 9 on deferred tax is immaterial.
The impact of transition to IFRS 9 on reserves and retained earnings is, as follows:
Reserves and Retained Earnings
Retained Earnings
Closing balance under IAS 39 (31 December 2017) 62,041
Reclassification adjustments in relation to adopting IFRS 9 -
Recognition of IFRS 9 ECLs including those measured at FVOCI (see below) 3
Opening balance under IFRS 9 (1 January 2018) 62,044
Total change in equity due to adopting IFRS 9 3
The following table reconciles the aggregate opening loan loss provision allowances under IAS 39 and provisions for loan commitments and financial guarantee contracts in accordance with IAS 37 Provisions Contingent Liabilities and Contingent Assets to the ECL allowances under IFRS 9. Further details are disclosed in Notes 11.
Loan loss provisionunder IAS 39/IAS 37at 31 December 2017
RemeasurementECLs underIFRS 9 at
1 January 2018
Impairment allowance for
Loans as per IAS 39/financial assets at amortized cost under IFRS 9 21,493 (142) 21,351
Finance Lease receivables as per IAS 39/Debt instru-ments at AC under IFRS 9: - - -
Available-for-sale debt investment securities per IAS 39/debt financial assets at FVOCI under IFRS 9 - - -
21,493 (142) 21,351
Financial guarantees 20 138 158
Letters of credit for customers - - -
Other commitments - 1 1
20 139 159

95
Add
ress
es
F
inan
cial
Sta
tem
ents
Segm
ent
Repo
rts
P
erfo
rman
ce a
nd F
inan
cial
s
Th
e Ba
nkin
g Se
ctor
RBI
Visi
on a
nd M
issio
n
M
anag
emen
t Bo
ard
Intro
duct
ion
7. Credit loss expense
The table below shows the ECL charges on financial instruments for the year 2018 recorded in the income statement:
Credit loss expense 2018
Stage 1 Individual Stage 1 Stage 2
Individual Stage 2 Stage 3 POCI Total
Cash and cash equivalents and man-datory reserve and Due to banks
25 - - - - - 25
Loans and advances to customers - 732 - 102 (49) 2,114 2,899
Debt instruments mea-sured at FVOCI 39 - - - - - 39
Financial guarantees - 16 - 1 - - 17
Loan commitments - 158 - 15 - - 173
Letters of credit - - - - - - -
-
Total impairment loss 64 906 - 118 (49) 2,114 3,153
The table below shows the impairment charges recorded in the income statement under IAS 39 during 2017:
31 December 2017 SpecificCollective (indi-
vidually not signifi-cant exposures)
Collective (incurred but not yet identified) Total
Credit loss expense on Due from banks - - - -
Credit loss expense on Loans and advances to customers
Corporate 2,387 - (209) 2,178
SME 1,138 - 224 1,362
Consumer lending 1,642 - 442 2,084
Residential mortgages (39) - 70 31
5,128 - 527 5,655
Credit loss expense on financial investments-available for sale
Debt securities - - - -
Total on balance sheet items 5,128 - 527 5,655
Off balance sheet items - - (10) (10)
Total 5,128 - 517 5,645

96
8 Changes in liabilities arising from financing activities
1 January 2018 Cash flowsDeclaration of
Dividends 31 December 2018
Interest bearing borrowings Note 16 8,478 (8,354) - 124
Dividends payable - (17,500) 17,500 -
Total liabilities from financing activities 8,478 (25,854) 17,500 124
1 January 2017 Cash flowsDeclaration of
Dividends 31 December 2017
Interest bearing borrowings Note 16 255 8,223 - 8,478
Dividends payable - (15,400) 15,400 -
Total liabilities from financing activities 255 (7,177) 15,400 8,478
9 Cash and cash equivalents and mandatory reserve 2018 2017Cash on hand 59,132 46,776Balances with the CBK 45,300 56,743Correspondent accounts with other banks 7,625 16,090Allowance for accounts with other banks (25) -Total 112,032 119,609
Cash, cash equivalents and mandatory reserve include a mandatory liquidity reserve balance with CBK of € 71,329 thousand (31 December 2017: € 71,623 thousand). The liquidity reserve balance requirement is calculated on the basis of a simple average over a week and should be maintained as 10 per cent of bank deposits payable within one year. It consists of balances with CBK and 50 per cent of cash on hand. As such the balance can vary from day-to-day. This balance is excluded from cash and cash equivalents for the purposes of the cash flow statement.
As at 31 December 2018 and 2017 the Bank’s cash and cash equivalents for the purposes of cash flow statement were as follows:
2018 2017Total cash and cash equivalents and mandatory reserve 112,032 119,609Less: Mandatory liquidity reserve (71,329) (71,623)Cash and cash equivalents for the purposes of cash flow statement 40,703 47,986
The CBK pays interest on the Bank’s average assets holdings with the CBK above 5 per cent of the applicable deposit base up to the amount of its average minimum liquidity reserve requirement. As at 31 December 2018 the interest was paid at the rate of 0 per cent per annum (31 December 2017: 0 per cent per annum).
10 Loans and advances to banksTerm deposits and call deposits are placed with banks operating in OECD countries. The balance loans and advances to banks includes accrued interest for € 2 thousand (31 December 2017: € 2 thousand).
Guarantee deposits include an amount of € 792 thousand as at 31 December 2018 (31 December 2017: € 740 thousand) which represent restricted deposits with UOB Bank as card cash collateral. The Bank does not have the right to use these funds for the purposes of funding its own activities.
2018 2017Term deposits 23,941 38,811Guarantee deposits 792 740Total loans and advances to banks 24,733 39,551

97
Add
ress
es
F
inan
cial
Sta
tem
ents
Segm
ent
Repo
rts
P
erfo
rman
ce a
nd F
inan
cial
s
Th
e Ba
nkin
g Se
ctor
RBI
Visi
on a
nd M
issio
n
M
anag
emen
t Bo
ard
Intro
duct
ion
11 Loans and advances to customers 2018 2017Corporate Customers Current and restructured loans 253,593 225,308Overdraft facilities 43,056 53,096 296,649 278,404Retail Customers Current and restructured loans 303,883 259,810Overdraft facilities 14,661 15,755 318,544 275,565Loans and advances to customers 615,193 553,969
Less: Allowance for impairment (21,991) (21,493)Loans and advances to customers, net 593,202 532,476
Loans and advances to customers include accrued interest income for € 2,016 thousand (31 December 2017: € 1,959 thousand).
The table below shows the credit quality and the maximum exposure to credit risk based on the Bank’s internal credit rating system and year-end stage classification. The amounts presented are gross of impairment allowances.
Gross carrying amount and the corresponding ECL allowances for total loans are, as follows:
2018 2017
Internal rating grade Stage 1 Stage 2 Stage 3 POCI Total Total
Performing - - - - - -
Excellent - - - - - 205,829
Strong - - - - - 18,992
Good 266,001 1,104 - - 267,105 93,727
Satisfactory 233,332 12,411 - 29 245,772 143,926
Substandard 12,377 22,601 - 243 35,221 22,398
Credit impaired - - 19,244 400 19,644 28,730
Unrated 45,910 1,382 - 159 47,451 40,367
Total 557,620 37,498 19,244 831 615,193 553,969

98
An analysis of changes in the gross carrying amount and the corresponding ECL allowances for total loans are as follows:
Stage 1 Stage 2 Stage 3 POCI Total
Gross carrying amount as at 1 January 2018 492,359 32,443 29,001 166 553,969
New assets originated or purchased 314,593 - - 687 335,280
Assets derecognised or repaid (169,769) (20,957) (1,823) (10) (192,559)
Transfers to Stage 1 5,436 (5,428) (8) - -
Transfers to Stage 2 (36,268) 37,981 (1,713) - -
Transfers to Stage 3 (2,961) (1,591) 4,552 -
Changes due to change in credit risk
(net)(65,688) (4,933) (6,865) (12) (77,498)
Changes to contractual cash flows due to modifications not resulting in derecognition
- - - - -
Amounts written off (82) (17) (3,900) - (3,999)
Foreign exchange adjustments - - - - -
At 31 December 2018 557,620 37,498 19,244 831 615,193
Stage 1 Stage 2 Stage 3 POCI Total
ECL allowance as at 01 January 2018 1,894 2,051 17,313 93 21,351
New assets originated or purchased 2,521 - - 496 3,017
Assets derecognised or repaid (512) (501) (582) (7) (1,602)
Transfers to Stage 1 33 (33) - - -
Transfers to Stage 2 (1,418) 1,553 (135) - -
Transfers to Stage 3 (1,575) (1,144) 2,719 - -
Changes due to change in credit risk
(net)1,605 246 1,388 (15) 3,224
Changes to contractual cash flows due to modifications not resulting in derecognition
- - - - -
Amounts written off (82) (17) (3,900) - (3,999)
Foreign exchange adjustments - - - - -
At 31 December 2018 2,466 2,155 16,803 567 21,991
Non – retail loans
The table below shows the credit quality and the maximum exposure to credit risk based on the Bank’s internal credit rating system and year-end stage classification. The amounts presented are gross of impairment allowances.
Gross carrying amount and the corresponding ECL allowances for not-retail loans are, as follows:

99
Add
ress
es
F
inan
cial
Sta
tem
ents
Segm
ent
Repo
rts
P
erfo
rman
ce a
nd F
inan
cial
s
Th
e Ba
nkin
g Se
ctor
RBI
Visi
on a
nd M
issio
n
M
anag
emen
t Bo
ard
Intro
duct
ion
The contractual amount outstanding on loans that have been written off, but were still subject to enforcement activity was nil at 31 December 2018 (2017: nil).
Non – retail loans
The table below shows the credit quality and the maximum exposure to credit risk based on the Bank’s internal credit rating system and year-end stage classification. The amounts presented are gross of impairment allowances.
Gross carrying amount and the corresponding ECL allowances for not-retail loans are, as follows:
2018 2017
Internal rating grade Stage 1 Stage 2 Stage 3 POCI Total Total
Performing - - - - - -
Excellent - - - - - -
Strong - - - - - -
Good 104,192 430 - - 104,622 88,171
Satisfactory 144,935 8,521 - - 153,456 143,926
Substandard 9,713 14,790 - - 24,503 22,398
Credit impaired - - 13,668 400 14,068 23,909
Unrated - - - - - -
Total 258,840 23,741 13,668 400 296,649 278,404
An analysis of changes in the gross carrying amount and the corresponding ECL allowances for non-retail loans are as follows:
Stage 1 Stage 2 Stage 3 POCI Total
Gross carrying amount as at 1 January 2018 235,886 18,196 24,322 - 278,404
New assets originated or purchased 174,165 - - 400 174,565
Assets derecognised or repaid (98,177) (12,641) (1,188) - (112,006)
Transfers to Stage 1 1,896 (1,896) - - -
Transfers to Stage 2 (20,544) 22,156 (1,612) - -
Transfers to Stage 3 (749) (196) 945 - -
Changes due to change in credit risk
(net)(33,637) (1,878) (5,953) - (41,468)
Changes to contractual cash flows due to modifications not resulting in derecognition
- - - - -
Amounts written off - - (2,846) - (2,846)
Foreign exchange adjustments - - - - -
At 31 December 2018 258,840 23,741 13,668 400 296,649
Stage 1 Stage 2 Stage 3 POCI Total
ECL allowance as at 1 January 2018 219 280 13,760 - 14,259
New assets originated or purchased 905 0 - 400 1,305
Assets derecognised or repaid (84) (219) (359) - (662)
Transfers to Stage 1 2 (2) - - -
Transfers to Stage 2 (160) 285 (125) - -
Transfers to Stage 3 (410) (103) 513 - -
Changes due to change in credit risk
(net)288 60 1,388 - 1,736
Changes to contractual cash flows due to modifications not resulting in derecognition
- - - - -
Amounts written off - - (2,846) - (2,846)
Foreign exchange adjustments - - - - -
At 31 December 2018 760 301 12,331 400 13,792

100
The contractual amount outstanding on loans that have been written off, but were still subject to enforcement activity was nil at 31 December 2018 (2017: nil).
Retail loans
The table below shows the credit quality and the maximum exposure to credit risk based on the Bank’s internal credit rating system and year-end stage classification. The amounts presented are gross of impairment allowances.Gross carrying amount and the corresponding ECL allowances for retail loans are, as follows:
2018 2017
Internal rating grade Stage 1 Stage 2 Stage 3 POCI Total Total
Performing - - - - - -
Excellent - - - - - 205,829
Strong - - - - - 18,992
Good 161,809 674 - - 162,483 5,556
Satisfactory 88,397 3,890 - 29 92,316 -
Substandard 2,664 7,811 - 243 10,718 -
Credit impaired - - 5,576 - 5,576 4,821
Unrated 45,910 1,382 - 159 47,451 40,367
Total 298,780 13,757 5,576 431 318,544 275,565
An analysis of changes in the gross carrying amount and the corresponding ECL allowances for retail loans are as follows:
Stage 1 Stage 2 Stage 3 POCI Total
Gross carrying amount as at 1 January 2018 256,473 14,247 4,679 166 275,565
New assets originated or purchased 160,428 - - 287 160,715
Assets derecognised or repaid (71,592) (8,316) (635) (10) (80,553)
Transfers to Stage 1 3,540 (3,532) (8) - -
Transfers to Stage 2 (15,724) 15,825 (101) - -
Transfers to Stage 3 (2,212) (1,395) 3,607 - -
Changes due to change in credit risk
(net)(32,051) (3,055) (912) (12) (36,030)
Changes to contractual cash flows due to modifications not resulting in derecognition
- - - - -
Amounts written off (82) (17) (1,054) - (1,153)
Foreign exchange adjustments - - - - -
At 31 December 2018 298,780 13,757 5,576 431 318,544

101
Add
ress
es
F
inan
cial
Sta
tem
ents
Segm
ent
Repo
rts
P
erfo
rman
ce a
nd F
inan
cial
s
Th
e Ba
nkin
g Se
ctor
RBI
Visi
on a
nd M
issio
n
M
anag
emen
t Bo
ard
Intro
duct
ion
Stage 1 Stage 2 Stage 3 POCI Total
ECL allowance as at 1 January 2018 1,675 1,771 3,553 93 7,092
New assets originated or purchased 1,616 - - 96 1,712
Assets derecognised or repaid (428) (282) (223) (7) (940)
Transfers to Stage 1 31 (31) 0 - -
Transfers to Stage 2 (1,258) 1,268 (10) - -
Transfers to Stage 3 (1,165) (1,041) 2,206 - -
Changes due to change in credit risk
(net)1,317 186 - (15) 1,488
Changes to contractual cash flows due to modifications not resulting in derecognition
- - - - -
Amounts written off (82) (17) (1,054) - (1,153)
Foreign exchange adjustments - - - - -
At 31 December 2018 1,706 1,854 4,472 167 8,199
The contractual amount outstanding on loans that have been written off, but were still subject to enforcement activity was nil at 31 December 2018 (2017: nil).
Movements in the allowance for impairment losses under IAS 39 for loans and advances, by class for the year to 31 December 2017 is as follows:
Non-retail customers Retail customers Total As at 1 January 2017 12,329 6,353 18,682Charge for the year 3,352 2,806 6,158Reversal of impairment during the year (274) (229) (503)Write offs (1,183) (1,661) (2,844)As at 31 December 2018 14,224 7,269 21,493
As at 31 December 2018 the Bank has 329 borrowers (31 December 2017: 305 borrowers) with aggregated loan amounts above € 100 thousand. The aggregate amount of these loans is € 290,122 thousand or 47 per cent of the gross loan portfolio (31 December 2017: € 271,429 thousand or 48 per cent of the gross loan portfolio).
The Bank manages individual counterparty exposures in order to be compliant with the regulations of the Central Bank that require individual counterparty exposures not to exceed 15 per cent of Tier I Capital or €17,155 thousands.
As at 31 December 2018, there is no counterparty (2017: 1 counterparty) with exposure above 15 per cent of the limit after obtaining regulatory approval. In addition, the cumulative exposure of the top 10 clients of the bank is € 104,892 thousand, (2017: € 97,528 thousand).

102
Economic sector risk concentrations within the customer loan portfolio are as follows:
2018 % 2017 %Trade 174,807 28% 166,386 30%Individuals 47,684 8% 313,120 57%Manufacturing, chemical and processing 14,471 2% 42,100 8%Service 7,817 1% 12,736 2%Construction and construction servicing 5,329 1% 13,568 2%Food industry and agriculture 364,464 59% 6,032 1%Other 621 0% 27 0%
Total loans and advances to customers before allowance for loan impairment 615,193 100% 553,969 100%
12 Investment securities
2018 2017Financial Investments held to maturity - 12,332Financial Investments at fair value through profit or loss 27,882 79,497Debt securities at fair value through OCI 95,879 -Debt securities available for sale - 102,726Allowances for impairment (39) -Total investment securities 123,722 194,555
2018 2017Kosovo Government Treasury Bills and Bonds 26,019 33,585Other OECD Treasury Bills and Government Bonds 97,703 160,970Total investment securities 123,722 194,555
Financial Investments at fair value, Financial Investments held to maturity and Available for sale debt securities as at 31 December 2018 represent one month to-five year bonds and treasury bills denominated in EUR and US dollar issued by Germany, Republic of France, Austria, United States of America, Netherlands, Finland, Poland, Slovakia, Bulgaria, EIB, KFW, Luxembourg and Republic of Kosovo (Government Treasury Bills).
The table below shows the credit quality and the maximum exposure to credit risk per based on the Bank’s internal credit rating system and year-end stage classification. The amounts presented are gross of impairment allowances.
2018
Internal rating grade Stage 1 Stage 2 Stage 3 POCI
Performing -
Excellent 53,868 - - 53,868
Strong 37,288 - - 37,288
Good - - - -
Satisfactory - - - -
Substandard - - - -
Credit impaired - - - -
Unrated 4,723 - - 4,723
Total 95,879 - - 95,879
An analysis of changes in the fair value and the corresponding ECLs is, as follow2018
Fair value as at 1 January 2018 Stage 1 Stage 2 Stage 3 POCI
New assets originated or purchased 102,726 - - 102,726
Assets derecognised or matured 60,349 - - 60,349
Change in fair value (66,918) - - (66,918)

103
Add
ress
es
F
inan
cial
Sta
tem
ents
Segm
ent
Repo
rts
P
erfo
rman
ce a
nd F
inan
cial
s
Th
e Ba
nkin
g Se
ctor
RBI
Visi
on a
nd M
issio
n
M
anag
emen
t Bo
ard
Intro
duct
ion
Transfers to Stage 1 (278) - - (278)
Transfers to Stage 2 - - - -
Transfers to Stage 3 - - - -
Changes due to modifications not recognised
- - - -
Amounts written off - - - -
Foreign exchange adjustments - - - -
At 31 December 2018 95,879 - - 95,879
2018
Stage 1 Stage 2 Stage 3 POCI
ECL as at 1 January 2018 - - - -
New assets originated or purchased 39 - - 39
Assets derecognised or matured - - - -
Change in fair value (excluding write offs) - - - -
Transfers to Stage 1 - - - -
Transfers to Stage 2 - - - -
Transfers to Stage 3 - - - -
Impact on year end ECL of exposures transferred between stages during the year - - - -
Unwind of discount (recognised in interest income) - - - -
Changes due to modifications not resulting in derecognition - - - -
Changes to models and inputs used for ECL calculations - - - -
Recoveries - - - -
Amounts written off - - - -
Foreign exchange adjustments - - - -
Foreign exchange adjustments - - - -
At 31 December 2018 39 - - 39
13 Other assets 2018 2017Prepayments and advances for services 413 244Due from Visa and MasterCard 2,502 1,954Repossessed properties carried at fair value 182 164
Total investment securities 3,097 2,362
14 Investments in subsidiaries
2018 2017Investment in Raiffeisen Leasing Kosovo 2,227 2,227Investment in Raiffeisen Insurance Broker Kosovo 7 7
Total investment securities 2,234 2,234
The table below provides details of the significant subsidiaries of the Bank: Ownership interestSubsidiary Principal place of business 2018 2017Raiffeisen Leasing Kosovo Kosovo 100% 100%Raiffeisen Insurance Broker Kosovo Kosovo 70% 70%
The Bank does not have significant restrictions on its ability to access or use its assets and settle its liabilities other than those resulting from the supervisory frameworks within which banking subsidiaries operate. Banking subsidiaries must comply with rules and regulations applicable for other financial institutions and in consolidation level must comply in addition with banking rules and regulations.

104
15 Property, equipment and intangible assets Property Property and ATM, other under leasehold bank and Computer Intangible construction improvements office hardware assets Total equipment
Cost Opening Balance as at 1 January 2017 - 5,512 13,476 3,544 14,252 36,784Additions - 370 977 104 1,665 3,116Disposals - (427) (700) (104) - (1,231)Cost as at 31 December 2017 - 5,455 13,753 3,544 15,917 38,669Additions 19,201 649 1,545 367 1,262 23,024Disposals - (292) (653) (118) - (1,063)Cost as at 31 December 2018 19,201 5,812 14,645 3,793 17,179 60,630Accumulated depreciation and amortisation Opening Balance as at 1 January 2017 - 2,605 10,390 2,835 10,555 26,385Depreciation/amortisation charge for the year (Note 25) - 246 950 258 1,846 3,300Eliminated on disposals - (424) (643) (81) - (1,148)Accumulated Depreciation and amortisation as at 31 December 2017 - 2,427 10,697 3,012 12,401 28,537Depreciation/amortisation charge for the year (Note 25) - 292 1,054 261 1,643 3,250Eliminated on disposals - (280) (651) (115) (4) (1,050)Accumulated Depreciation and amortisation as at 31 December 2018 - 2,439 11,100 3,158 14,040 30,737 Net book value at 31 December 2018 19,201 3,373 3,545 635 3,139 29,893Net book value at 31 December 2017 - 3,028 3,056 532 3,516 10,132
There has been an investment of € 19,200 thousands in the current reporting year in the property to be used for Bank’s own purposes. There has been no such investment in the previous year. The property is still under construction and has not been depreciated in the current year. The completion of the construction is expected in 2019 and the premises will be depreciated over the useful life of the asset.
16 Deposits and borrowings from banks
2018 2017Borrowings Overdrawn accounts used for operational purposes with other commercial Banks – OECD Countries 124 8,478Deposits Other commercial banks – non OECD Countries 494 696
Total deposits and borrowings from banks 618 9,174
Interest on the overdrawn accounts as of 31 December 2018 is as follows (accounts based on ccy): EUR 0.661%, USD 7.25%, CHF 6.5%, GBP 2.8%
17 Deposits from customers 2018 2017Corporate customers: Current accounts 98,597 159,924Savings accounts 5,762 5,297Term deposits and margin accounts 11,913 300
116,272 165,521
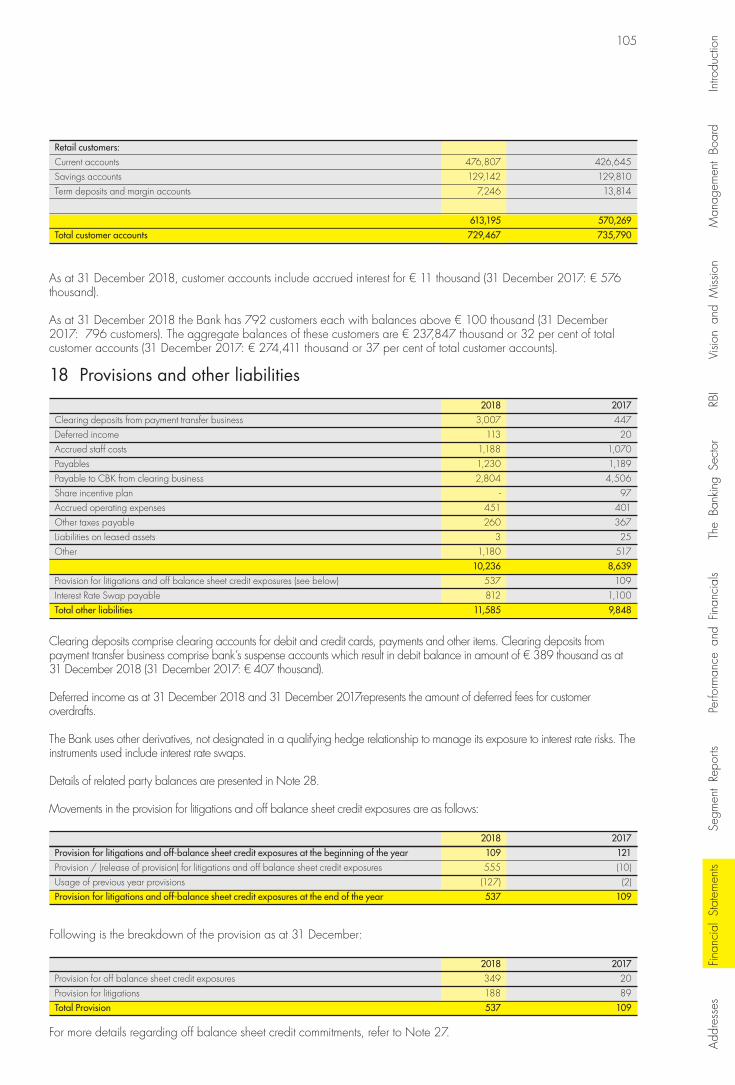
105
Add
ress
es
F
inan
cial
Sta
tem
ents
Segm
ent
Repo
rts
P
erfo
rman
ce a
nd F
inan
cial
s
Th
e Ba
nkin
g Se
ctor
RBI
Visi
on a
nd M
issio
n
M
anag
emen
t Bo
ard
Intro
duct
ion
Retail customers: Current accounts 476,807 426,645Savings accounts 129,142 129,810Term deposits and margin accounts 7,246 13,814
613,195 570,269Total customer accounts 729,467 735,790
As at 31 December 2018, customer accounts include accrued interest for € 11 thousand (31 December 2017: € 576 thousand).
As at 31 December 2018 the Bank has 792 customers each with balances above € 100 thousand (31 December 2017: 796 customers). The aggregate balances of these customers are € 237,847 thousand or 32 per cent of total customer accounts (31 December 2017: € 274,411 thousand or 37 per cent of total customer accounts).
18 Provisions and other liabilities 2018 2017Clearing deposits from payment transfer business 3,007 447Deferred income 113 20Accrued staff costs 1,188 1,070Payables 1,230 1,189Payable to CBK from clearing business 2,804 4,506Share incentive plan - 97Accrued operating expenses 451 401Other taxes payable 260 367Liabilities on leased assets 3 25Other 1,180 517 10,236 8,639Provision for litigations and off balance sheet credit exposures (see below) 537 109Interest Rate Swap payable 812 1,100Total other liabilities 11,585 9,848
Clearing deposits comprise clearing accounts for debit and credit cards, payments and other items. Clearing deposits from payment transfer business comprise bank’s suspense accounts which result in debit balance in amount of € 389 thousand as at 31 December 2018 (31 December 2017: € 407 thousand).
Deferred income as at 31 December 2018 and 31 December 2017represents the amount of deferred fees for customer overdrafts.
The Bank uses other derivatives, not designated in a qualifying hedge relationship to manage its exposure to interest rate risks. The instruments used include interest rate swaps.
Details of related party balances are presented in Note 28.
Movements in the provision for litigations and off balance sheet credit exposures are as follows:
2018 2017Provision for litigations and off-balance sheet credit exposures at the beginning of the year 109 121Provision / (release of provision) for litigations and off balance sheet credit exposures 555 (10)Usage of previous year provisions (127) (2)Provision for litigations and off-balance sheet credit exposures at the end of the year 537 109
Following is the breakdown of the provision as at 31 December:
2018 2017Provision for off balance sheet credit exposures 349 20Provision for litigations 188 89Total Provision 537 109
For more details regarding off balance sheet credit commitments, refer to Note 27.
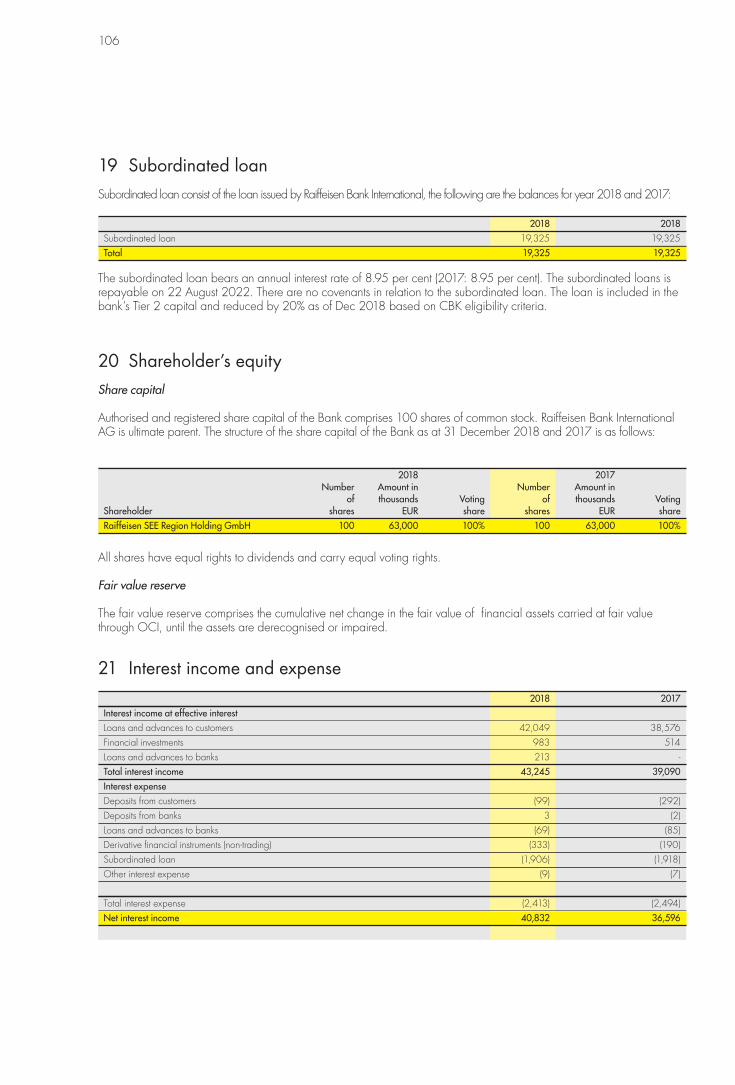
106
19 Subordinated loanSubordinated loan consist of the loan issued by Raiffeisen Bank International, the following are the balances for year 2018 and 2017:
2018 2018Subordinated loan 19,325 19,325Total 19,325 19,325
The subordinated loan bears an annual interest rate of 8.95 per cent (2017: 8.95 per cent). The subordinated loans is repayable on 22 August 2022. There are no covenants in relation to the subordinated loan. The loan is included in the bank’s Tier 2 capital and reduced by 20% as of Dec 2018 based on CBK eligibility criteria.
20 Shareholder’s equityShare capital
Authorised and registered share capital of the Bank comprises 100 shares of common stock. Raiffeisen Bank International AG is ultimate parent. The structure of the share capital of the Bank as at 31 December 2018 and 2017 is as follows:
2018 2017 Number Amount in Number Amount in of thousands Voting of thousands Voting Shareholder shares EUR share shares EUR shareRaiffeisen SEE Region Holding GmbH 100 63,000 100% 100 63,000 100%
All shares have equal rights to dividends and carry equal voting rights.
Fair value reserve
The fair value reserve comprises the cumulative net change in the fair value of financial assets carried at fair value through OCI, until the assets are derecognised or impaired.
21 Interest income and expense 2018 2017Interest income at effective interest Loans and advances to customers 42,049 38,576Financial investments 983 514Loans and advances to banks 213 -Total interest income 43,245 39,090Interest expense Deposits from customers (99) (292)Deposits from banks 3 (2)Loans and advances to banks (69) (85)Derivative financial instruments (non-trading) (333) (190)Subordinated loan (1,906) (1,918)Other interest expense (9) (7)
Total interest expense (2,413) (2,494)Net interest income 40,832 36,596

107
Add
ress
es
F
inan
cial
Sta
tem
ents
Segm
ent
Repo
rts
P
erfo
rman
ce a
nd F
inan
cial
s
Th
e Ba
nkin
g Se
ctor
RBI
Visi
on a
nd M
issio
n
M
anag
emen
t Bo
ard
Intro
duct
ion
22 Fee and commission income and expense 2018 2017 Payments transfer business 15,090 16,678Loan administration and guarantee business 870 664Foreign currency business 1,570 1,585Other banking services 39 49Total fee and commission income 17,569 18,976 Payment transfer business (5,966) (5,135)Other banking services (844) (950)Total fee and commission expense (6,810) (6,085)
23 Other operating income 2018 2017Profit from fixed assets disposal 64 35Profit from sale of repossessed assets 380 512Other income 690 540Total other operating income 1,134 1,087
Other income consists of support services provided to subsidiaries primarily related to IT function.
24 Personnel expenses 2018 2017Salaries and wages 10,909 10,695Pension contributions 606 544Other voluntary social expenses 1,288 1,209Share incentives 12 24Total personnel expenses 12,815 12,472
The Raiffeisen International management having regard to the performance of individuals and market trends determines the remuneration of directors and key executives. The Managing-Board-related expense for 2018 amounted to € 827 thousand (2017: € 793 thousand). The Share incentive program is also managed by Raiffeisen International HO in Vienna and the potential management remunerations are done based on the group performance policies.
25 Other operating expenses 2018 2017 Office space expenses (rental, maintenance, other) 2,828 2,801Depreciation of property and equipment 1,611 1,455IT cost 2,098 1,793Advertising, PR and promotional expenses 1,007 1,132Security expenses 861 904Amortization of intangible assets 1,639 1,845Other administrative expense 488 362Communication expenses 270 253Office supplies 217 241Legal, advisory and consulting expenses 1,706 1,586Training expenses for staff 320 389Deposit insurance fees 1,157 1,012Car maintenance and running expenses 302 272Travelling expenses 256 214 Total other operating expenses 14,760 14,259
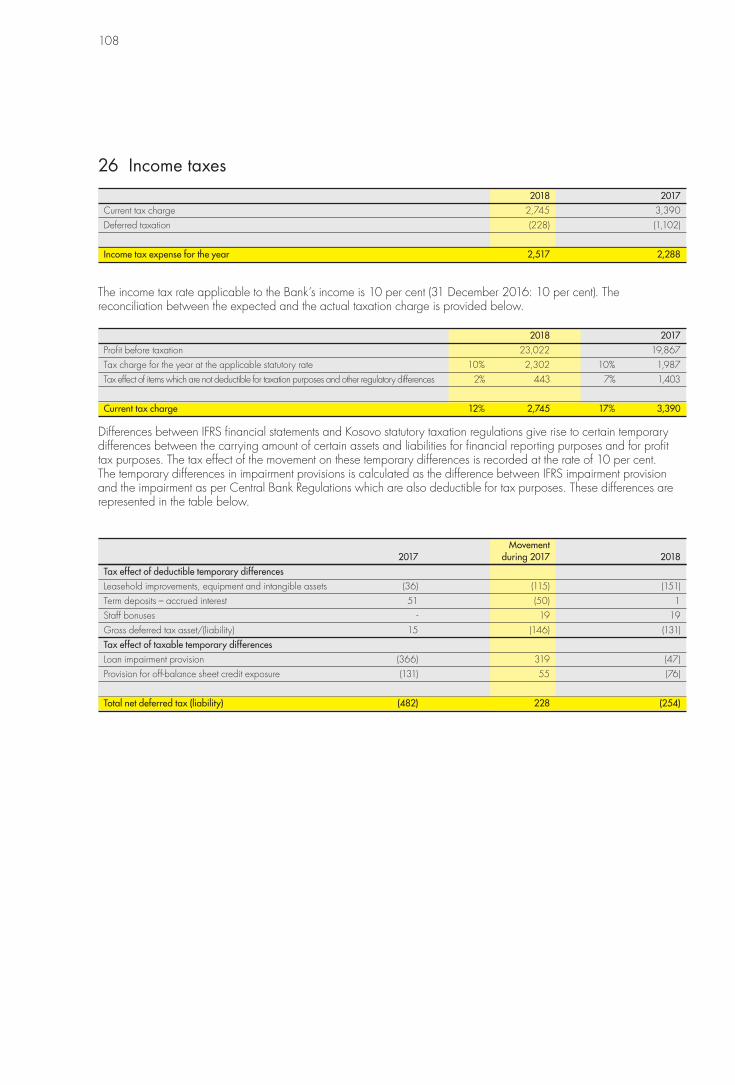
108
26 Income taxes 2018 2017Current tax charge 2,745 3,390Deferred taxation (228) (1,102) Income tax expense for the year 2,517 2,288
The income tax rate applicable to the Bank’s income is 10 per cent (31 December 2016: 10 per cent). The reconciliation between the expected and the actual taxation charge is provided below.
2018 2017Profit before taxation 23,022 19,867Tax charge for the year at the applicable statutory rate 10% 2,302 10% 1,987Tax effect of items which are not deductible for taxation purposes and other regulatory differences 2% 443 7% 1,403
Current tax charge 12% 2,745 17% 3,390
Differences between IFRS financial statements and Kosovo statutory taxation regulations give rise to certain temporary differences between the carrying amount of certain assets and liabilities for financial reporting purposes and for profit tax purposes. The tax effect of the movement on these temporary differences is recorded at the rate of 10 per cent. The temporary differences in impairment provisions is calculated as the difference between IFRS impairment provision and the impairment as per Central Bank Regulations which are also deductible for tax purposes. These differences are represented in the table below.
Movement 2017 during 2017 2018Tax effect of deductible temporary differences Leasehold improvements, equipment and intangible assets (36) (115) (151)Term deposits – accrued interest 51 (50) 1Staff bonuses - 19 19Gross deferred tax asset/(liability) 15 (146) (131)Tax effect of taxable temporary differences Loan impairment provision (366) 319 (47)Provision for off-balance sheet credit exposure (131) 55 (76)
Total net deferred tax (liability) (482) 228 (254)

109
Add
ress
es
F
inan
cial
Sta
tem
ents
Segm
ent
Repo
rts
P
erfo
rman
ce a
nd F
inan
cial
s
Th
e Ba
nkin
g Se
ctor
RBI
Visi
on a
nd M
issio
n
M
anag
emen
t Bo
ard
Intro
duct
ion
27 Contingencies and commitmentsLegal proceedings. From time to time and in the normal course of business, claims against the Bank are received. As at 31 December 2018, the Bank had a number of legal cases pending in the court. On the basis of internal judgement based on previous court rulings and Management decision, the Bank has made a provision of € 188 thousand (2017 € 89 thousand) as the nearest estimate of possible cash outflows arising from possible court decisions.
Capital commitments. As at 31 December 2018 the Bank has no capital commitments in respect of the purchase of equipment and software (31 December 2017: Nil).
Operating lease commitments. The future minimum lease payments under non-cancellable operating leases, where the Bank is the lessee, are as follows:
2018 2017 Not more than 1 year 312 307More than 1 year and not more than 5 years - -
Total operating lease commitments 312 307
Credit related commitments. The primary purpose of these instruments is to ensure that funds are available to a customer as required. Guarantees and standby letters of credit, which represent irrevocable assurances that the Bank will make payments in the event that a customer cannot meet its obligations to third parties, carry the same credit risk as loans. Documentary and commercial letters of credit, which are written undertakings by the Bank on behalf of a customer authorising a third party to draw drafts on the Bank up to a stipulated amount under specific terms and conditions, are collateralised by the underlying shipments of goods to which they relate or cash deposits and therefore carry less risk than a direct borrowing.
Commitments to make loans at a specific rate of interest during a fixed period of time are accounted for as derivatives. Unless these commitments do not extend beyond the period expected to be needed to perform appropriate underwriting, they are considered to be “regular way” transactions.
Outstanding credit related commitments are as follows:
2018 2017Commitments to extend credit 35,757 38,245Guarantees (credit facility) 41,585 27,795Guarantees (cash covered) 2,633 2,368Letters of credit (credit facility) 3,887 876Letters of credit (cash cover) 86 260Trade Finance line of credit 5,819 4,944Stand by letter of credit 80 76 Total credit related commitments 89,847 74,564

110
Commitments to extend credit represent loan amounts in which the loan documentation has been signed but the money not yet disbursed and unused amounts of overdraft limits in respect of customer accounts. With respect to credit risk on commitments to extend credit, the Bank is potentially exposed to losses in an amount equal to the total unused commitments. However, the likely amount of loss is less than the total unused commitments since most commitments to extend credit are contingent upon customers maintaining specific credit standards. The Bank monitors the term to maturity of credit related commitments because longer-term commitments generally have a greater degree of credit risk than shorter-term commitments.
The total outstanding contractual amount of commitments to extend credit and guarantees does not necessarily represent future cash requirements, as these financial instruments may expire or terminate without being funded.
Tax Commitments
During 2018 the bank was not subject to any tax inspection. However, the inspection for year 2009 (re-control), initiated in 2016 is still open.
The first report for 2009 resulted in additional tax liabilities for the Bank in the amount of € 991 thousands. However, the bank did appeal the report in the Tax administration appeals department, which approved the appeal and declared the report as null. Currently a new tax inspection in ongoing for the Corporate Income Tax for year 2009 and no final report has been issued as of statements preparation date. The bank has not allocated any provision for this possible additional tax as Bank consider the new inspection control will consider the outcome of the appeal department and new public ruling issued in December 2018 regarding treatment of loan loss provision expenses for the period in inspection.
Interest Rate SWAPs. The main purpose of these instruments is to mitigate the interest rate risk associated to the fixed rate lending. As of 31 December 2018, the Bank has 8 interest rate SWAP contracts with a notional amount of € 28,930 thousand (2017: € 36,360 thousand). The Bank pays fixed and receives variable interest rates. The net valuation result of these contracts for the year ended 31 December 2018 was a gain of € 242 thousand (2017: a gain of € 334 thousand). Fair value of SWAP contracts as at 31 December 2018 was loss of € 658 thousand (2017: loss of € 900 thousand).

111
Add
ress
es
F
inan
cial
Sta
tem
ents
Segm
ent
Repo
rts
P
erfo
rman
ce a
nd F
inan
cial
s
Th
e Ba
nkin
g Se
ctor
RBI
Visi
on a
nd M
issio
n
M
anag
emen
t Bo
ard
Intro
duct
ion
28 Related party transactionsFor the purposes of these financial statements, parties are considered to be related if one party has the ability to control the other party or exercise significant influence over the other party in making financial or operational decisions as defined by IAS 24 “Related Party Disclosures”. In considering each possible related party relationship, attention is directed to the substance of the relationship, not merely the legal form.
Banking transactions are entered into in the normal course of business with significant shareholders, directors, companies with which the Bank has significant shareholders in common and other related parties. These transactions include settlements, placements, deposit taking and foreign currency transactions. These transactions are priced at market rates. The outstanding balances at the year end and related income and expense items during the year with related parties are as follows:
2018 2017 Other Other Parent related Parent related party partyAssets 2,339 5,360 7,498 5,367Cash and cash equivalents and mandatory reserve 631 - 7,102 -Loans and advances to banks - - - -Loans and advances to customers - 3,061 - 2,002Other Loans - - - -Other assets 1,442 - 11 85Investments in subsidiaries - 2,234 - 2,234Property, equipment and intangible assets - NBV 266 65 385 1,046
Liabilities 20,044 132 29,588 1,907Customer accounts - - - 1,766Deposits and borrowings from banks 124 122 8,478 116Subordinated debt 19,325 - 19,325 -Other liabilities 595 10 1,785 25
Statement of profit and loss and other comprehensive income (4,867) (902) (3,989) 49Interest income 45 (3) 50Interest expense (2,248) - (2,109) (1)Net fees and commission (516) (947) (926) -Net valuation result financial instruments carried at fair value 252 - 382 -Other operating Income/expenses (2,355) - (1,333) -
Off Balance Sheet - - - -Guarantees - - - -Letter of credit - - - -
In the following table are presented management remuneration for the year ended 31 December 2018 and 2017:
2018 2017Management Remuneration 827 793
29 Subsequent eventsThere are no significant events after the reporting date that may require adjustment or disclosure in the separate financial statements.

112
Addresses and contacts
Raiffeisen Bank Kosovo J.S.C.
Head Office UÇK Street, no. 5110000 PrishtinaTel: +383 (0)38 222 222SWIFT Code: RBKOXKPRIBAN Code: XK05E-mail: [email protected]
Office for corporate Eqrem Çabej Street, no. 810000 PrishtinaTel: +383 (0)38 222 222
Office for premium customers Agim Ramadani Street, no. 1510000 Prishtina Tel: +383 38 222 222
Regional Branch in Prishtina Nena Tereze Street, no. 5210000 PrishtinaTel: +383 38 222 222
Branch in Prishtina Gazmend Zajmi Street, n.n., Bregu i Diellit10000 PrishtinaTel: +383 (0)38 222 222
Branch in Prishtina Vëllezërit Fazliu Street, Kodra e Trimave10000 Prishtina Tel: +383 38 222 222
Branch in Prishtina Dadania Boulevard, b 5/7 Dardani10000 Prishtina Tel: +383 38 222 222
Branch in Fushë KosovëNena Tereze Street, No. 8012000 Fushe Kosova Tel: +383 (0)38 222 222
Branch in Obiliq Hasan Prishtina Street, n.n.12000 ObiliqTel: +383 (0)38 222 222
Branch in Drenas Skenderbeu Street, n.n.13000 GllogovcTel: +383 (0)38 222 222
Branch in GracanicaMain Street, n.n.Tel: +383(0) 222 222
Branch in Lipjan Shqipëria Street, n.n.14000 LipjanTel: +383 (0)38 222 222
Branch in PodujevaZahir Pajaziti Street, n.n.11000 PodujevaTel: +383 (0)38 222 222
Regional Branch in Ferizaj Dëshmorët e Kombit Street, no. 3970000 FerizajTel: +383 (0)38 222 222
Branch in Ferizaj Rexhep Bislimi Street, no. 2870000 FerizajTel: +383 (0)38 222 222
Branch in Ferizaj Aradha e Sharrit Street, n.n.Ferizaj – Prishtina HighwayTel: +383 (0)38 222 222
Branch in Han të Elezit Agim Jashari Street71510 Hani i ElezitTel: +383 (0)38 222 222
Branch in Kaçanik Agim Bajrami Street, n.n.71000 KaçanikTel: +383 (0)38 222 222
Branch in Shtime Prishtina Street, n.n.72000 ShtimeTel: +383 (0)38 222 222
Branch in Shtrpce Main Street, n.n.73000 ShtërpceTel: +383 (0)38 222 222
Regional Branch in GjakovaMother Theresa Street, no. 32850000 GjakovëTel: +383 (0)38 222 222
Branch in Gjakova Yll Morina Street, n.n. 50000 GjakovaTel: +383 (0)38 222 222
Branch in Rahovec Avdullah Bugari Street, n.n.21010 RahovecTel: +383 (0)38 222 222
Branch in MalishevaRilindja Kombëtare Street, n.n.24000 MalishevaTel: +383 (0)38 222 222
Regional Branch in Gjilan Adem Jashari Street, no. 11060000 GjilanTel: +383 (0)38 222 222
Branch in Gjilan Mulla Idrizi Street60000 GjilanTel: +383 (0)38 222 222
Branch in Kamenica Tringë Ismajli Street, no.12/a 62000 KamenicaTel: +383 (0) 38 222 222
Branch in Viti Adem Jashari Street, n.n.61000 VitiTel: +383 (0) 38 222 222
Regional Branch in MitrovicaAli Pashe Tepelena Street, n.n.40000 MitrovicaTel: +383 (0)38 222 222
Branch in MitrovicaMbreteresha Teuta Square40000 MitrovicaTel: +383 (0)38 222 222
Branch in Vushtrri Dëshmorët e Kombit Street, n.n. 42000 VushtrriTel: +383 (0)38 222 222
Branch in Skenderaj Adem Jashari Square41000 SkenderajTel: +383 (0)38 222 222
Raiffeisen Bank Kosovo Branch Network

113
Add
ress
es
G
loss
ary
Finan
cial
Sta
tem
ents
Segm
ent
Repo
rts
P
erfo
rman
ce a
nd F
inan
cial
s
Th
e Ba
nkin
g Se
ctor
RBI
Visi
on a
nd M
issio
n
M
anag
emen
t Bo
ard
Intro
duct
ion
Regional Branch in North Mitrovica Kralja Petra I Street, n.n. Tel: +383 (0)38 222 222
Branch in Brnjak Border with Serbia Customs Terminal 1 in BrnjakTel: +383 (0)38 222 222
Branch in Jarinje Border with Serbia Customs Terminal 31 in JarinjeTel: +383 (0)38 222 222
Regional Branch in Peja Haxhi Zeka Square30000 PejaTel: +383 (0) 38 222 222
Branch in PejaBill Clinton Street, n.n.30000 PejaTel: +383 38 222 222
Branch in Peja Beteja e Koshares Street, no. 8130000, PejaTel: +383 (0)38 222 222
Branch in Decan Luan Haradinaj Street, n.n.51000 DeçanTel: +383 (0)38 222 222
Branch in Istog Trade Center, no. 6131000 IstogTel: +383 (0)38 222 222
Branch in Klina Mujë Krasniqi Square, n.n.32000 KlinaTel: +383 (0) (0)38 222 222
Regional Branch in Prizren Nëna Terezë Street, Bazhdarhane, no. 720000 PrizrenTel: +383 (0)38 222 222
Branch in Prizren Shadervani Square no. 3820000 PrizrenTel: +383 (0)38 222 222
Branch in Prizren De Rada Street, n.n.20000, PrizrenTel: +383 (0) 38 222 222
Branch in SuharekaBrigada 123 Street, n.n.23000 SuharekaTel: +383 (0)38 222 222
Branch in Dragash Sheshi i Dëshmorëve, no. 2222000 DragashTel: +383 (0)38 222 222

114
AlbaniaRaiffeisen Bank Sh.A. “European Trade Center”Bulevardi “Bajram Curri”TiranaPhone: +355-4-23 8 100Fax: +355-4-22 755 99SWIFT/BIC: SGSBALTX www.raiffeisen.al
BelarusPriorbank JSCV. Khoruzhey str. 31-A220002 MinskPhone: +375-17-28 9-9090Fax: +375-17-28 9-9191SWIFT/BIC: PJCBBY2Xwww.priorbank.by
Bosnia and Herzegovina Raiffeisen Bank d.d. Bosna i Hercegovina Zmaja od Bosne bb71000 Sarajevo Phone: +387-33-287 100 Fax: +387-33-21 385 1 SWIFT/BIC: RZBABA2S www.raiffeisenbank.ba
BulgariaRaiffeisenbank (Bulgaria) EAD Nikola I. Vaptzarov Blvd.Business Center EXPO 200 PHAZE III, floor 51407 SofiaPhone: +359-2-91 985 101 Fax: +359-2-94 345 28 SWIFT/BIC: RZBBBGSF www.rbb.bg
CroatiaRaiffeisenbank Austria d.d. Magazinska cesta 6910000 Zagreb Phone: +385-1-45 664 66 Fax: +385-1-48 116 24 SWIFT/BIC: RZBHHR2X www.rba.hr
Czech RepublicRaiffeisenbank a.s. Hvezdova 1716/2b14078 Prague 4Phone: + 420-412 446 400Fax: +420-234-402-111SWIFT/BIC: RZBCCZPP www.rb.cz
HungaryRaiffeisen Bank Zrt.Akadémia utca 61054 BudapestPhone: +36-1-48 444-00Fax: +36-1-48 444-44SWIFT/BIC: UBRTHUHBwww.raiffeisen.hu
Kosovo Raiffeisen Bank Kosovo J.S.C.Rruga UÇK, No. 19110000 Pristina Phone: +381-38-22 222 2 Fax: +381-38-20 301 130 SWIFT/BIC: RBKOXKPR www.raiffeisen-kosovo.com
RomaniaRaiffeisen Bank S.A. Calea Floreasca 246C 014476 BucharestPhone: +40-21-30 610 00Fax: +40-21-23 007 00SWIFT/BIC: RZBRROBUwww.raiffeisen.ro
RussiaAO Raiffeisenbank 17/1 St. Troitskaya 129090 MoscowPhone: +7-495-72 1-9900 Fax: +7-495-72 1-9901 SWIFT/BIC: RZBMRUMM www.raiffeisen.ru
SerbiaRaiffeisen banka a.d. Djordja Stanojevica 1611070 Novi Beograd Phone: +381-11-32 021 00 Fax: +381-11-22 070 80 SWIFT/BIC: RZBSRSBGwww.raiffeisenbank.rs
SlovakiaTatra banka, a.s. Hodžovo námestie 3 81106 Bratislava 1Phone: +421-2-59 19-1000 SWIFT/BIC: TATRSKBX www.tatrabanka.sk
UkraineRaiffeisen Bank Aval JSC9, vul Leskova01011 KievPhone: +38-044-49 088 88Fax: +38-044-285-32 31SWIFT/BIC: AVALUAUK www.aval.ua
Leasing companies
AustriaRaiffeisen-Leasing International GmbHAm Stadtpark 31030 ViennaPhone: +43-1-71 707-2071Fax: +43-1-71 707-76 2966www.rli.co.at
AlbaniaRaiffeisen Leasing Sh.a.“European Trade Center”Bulevardi “Bajram Curri”TiranaPhone: +355-4-22 749 20Fax: +355-4-22 325 24www.raiffeisen-leasing.al
Belarus“Raiffeisen-Leasing” JLLCV. Khoruzhey 31-A220002 MinskPhone: +375-17-28 9-9394Fax: +375-17-28 9-9974www.rl.by
Bosnia and HerzegovinaRaiffeisen Leasing d.o.o. SarajevoZmaja od Bosne bb.71000 SarajevoPhone: +387-33-254 354 Fax: +387-33-212 273 www.rlbh.ba
BulgariaRaiffeisen Leasing Bulgaria OOD32A Cherni Vrah Blvd. Fl.61407 SofiaPhone: +359-2-49 191 91Fax: +359-2-97 420 57www.rlbg.bg
Croatia
Raiffeisen Bank International AG AustriaAm Stadtpark 91030 ViennaPhone: +43-1-71 707-0Fax: +43-1-71 707-1715SWIFT/ BIC: RZBATWWwww.rbinternational.comir@[email protected]
Banking network

115
Add
ress
es
G
loss
ary
Finan
cial
Sta
tem
ents
Segm
ent
Repo
rts
P
erfo
rman
ce a
nd F
inan
cial
s
Th
e Ba
nkin
g Se
ctor
RBI
Visi
on a
nd M
issio
n
M
anag
emen
t Bo
ard
Intro
duct
ion
Raiffeisen Leasing d.o.o.Radnicka cesta 4310000 ZagrebPhone: +385-1-65 9-5000Fax: +385-1-65 9-5050www.rl-hr.hr
Czech RepublicRaiffeisen-Leasing s.r.o.Hvezdova 1716/2b14078 Prague 4Phone: +420-2-215 116 11 Fax: +420-2-215 116 66 www.rl.cz
HungaryRaiffeisen Corporate Lízing Zrt.Akadémia utca 6Phone: +36-1-477 8709Fax: +36-1-477 8702www.raiffeisenlizing.hu
KazakhstanRaiffeisen Leasing Kazakhstan LLP Shevchenko Str. 146, flat 1050008 Almaty Phone: +7-727-378 54 30 Fax: +7-727-378 54 31 www.rlkz.at KosovoRaiffeisen Leasing Kosovo LLCRr. UCK p.n.10000 PristinaPhone: +38-1-222 222 340www.raiffeisenleasing-kosovo.com
MoldovaI.C.S. Raiffeisen Leasing S.R.L. Alexandru cel Bun 512012 ChisinauPhone: +373-22-27 931 3 Fax: +373-22-22 838 1 www.raiffeisen-leasing.md
RomaniaRaiffeisen Leasing IFN S.A.Calea Floreasca 246 D014476 BucharestPhone: +40-21-36 532 96Fax: +40-37-28 799 88www.raiffeisen-leasing.ro
Russia
OOO Raiffeisen-LeasingSmolenskaya-Sennaya 28119121 MoscowPhone: +7-495-72 1-9980Fax: +7-495-72 1-9901www.raiffeisen-leasing.ru
SerbiaRaiffeisen Leasing d.o.o. Djordja Stanojevica 1611070 Novi BeogradPhone: +381-11-220 7400 Fax: +381-11-228 9007 www.raiffeisen-leasing.rs
SlovakiaTatra-Leasing s.r.o.Cernyševského 5085101 BratislavaPhone: +421-2-59 19-3053www.tatraleasing.sk
SloveniaRaiffeisen Leasing d.o.o.Letališka cesta 29a1000 Ljubljana Phone: +386-1-241-6250Fax: +386-1-241-6268www.rl-sl.si
UkraineLLC Raiffeisen Leasing Aval9, Stepan Bandera av.Build. 6 Office 6-20104073 Kiev Phone: +380-44-590 24 90 Fax: +380-44-200 04 08 www.rla.com.ua
Branches and representative offices - Europe
FranceRBI Representative Office Paris9-11 Avenue Franklin D. Roosevelt75008 ParisPhone: +33-1-45 612 700Fax: +33-1-45 611 606
GermanyRBI Frankfurt BranchWiesenhüttenplatz 26 60 329 FrankfurtPhone: +49-69-29 921 924Fax: +49-69-29 921 9-22
PolandRBI Branch in PolandUl. Grzybowska 7800-844 Warsaw Phone: +48-22-578 56 00Fax: +48-22-578 56 01SWIFT/BIC: RCBWPLPW www.raiffeisen.pl
SwedenRBI Representative OfficeNordic CountriesDrottninggatan 89, 14th floor11360 Stockholm Phone: +46-8-440 5086
UKRBI London BranchTower 42, Leaf C, 9th Floor25 Old Broad Street London EC2N 1HQPhone: +44-20-79 33-8000Fax: +44-20-79 33-8009

116
Branches and representative offices – Asia and America
ChinaRBI Beijing BranchBeijing International Club Suite 2002nd floorJianguomenwai Dajie 21100020 BeijingPhone: +86-10-65 32-3388Fax: +86-10-65 32-5926
RBI Representative Office ZhuhaiRoom 2404, Yue Cai BuildingNo. 188, Jingshan Road, Jida,Zhuhai, Guangdong Province519015, P.R. ChinaPhone: +86-756-32 3-3500Fax: +86-756-32 3-3321 India RBI Representative Office Mumbai501, Kamla Hub, Gulmohar Road, Juhu Mumbai – 400049Phone: +91-22-26 230 657Fax: +91-22-26 244 529 KoreaRBI Representative Office Korea#1809 Le Meilleur Jongno Town24 Jongno 1gaSeoul 110-888Republic of KoreaPhone: +82-2-72 5-7951Fax: +82-2-72 5-7988
SingaporeRBI Singapore Branch50 Raffles Place#31-03 Singapore Land TowerSingapore 048623Phone: +65-63 05-6000Fax: +65-63 05-6001
VietnamRBI Representative Office Ho-Chi-Minh-City35 Nguyen Hue Str., Harbour View TowerRoom 601A, 6th Floor, Dist 1Ho-Chi-Minh-CityPhone: +84-8-38 214 718, +84-8-38 214 719Fax: +84-8-38 215 256
Raiffeisen Zentralbank AG
AustriaAm Stadtpark 91030 ViennaPhone: +43-1-26 216-0Fax: +43-1-26 216-1715www.rzb.at

Editor, Publisher Raiffeisen Bank Kosovo J.S.C. Migjeni Street, no. 7210000 Prishtina Phone: +383-38-22 222 2 SWIFT/BIC: RBKOXKPRIBAN code: XK05 www.raiffeisen-kosovo.com
Editorial team: Marketing and PR Department and Finance Department
Pre-press:New Moment New Ideas sh.p.k.
The online version of the annual report is available in English and Albanian at: www.raiffeisen-kosovo.com
This annual report has been prepared and the data checked with the greatest possible care. However, rounding, transmission, typesetting and printing errors cannot be ruled out. This annual report was prepared in English. The annual report in Albanian version is a translation of the original English version. The English version supersedes the Albanian version.