Annual Report 2016 2016, China’s economic development continued to slow down with its GDP growth...
298
Transcript of Annual Report 2016 2016, China’s economic development continued to slow down with its GDP growth...

Annual R
eport 2016

Maanshan Iron & Steel Company Limited2016 Annual Report
1
Content
I. Definitions 3
II. Company Introduction and Major Financial Indicators 5
III. Overview of the Company’s Businesses 10
IV. Report of The Board 13
V. Significant Events 41
VI. Movements in Share Capital and Shareholders 55
VII. Directors, Supervisors, Senior Management and Employees 61
VIII. Corporate Governance 69
IX. Financial Statements 86
X. Document Available for Inspection 296
IMPORTANT NOTICE
1. The board of directors (the “Board”), the supervisory committee, the directors, the
supervisors and senior management of the Company warrant that there are no false
representations or misleading statements contained in, or material omissions from, this
report; and jointly and severally accept full responsibility for the truthfulness, accuracy and
completeness of the information contained in this report.
2. All members of the Board attended the Board meeting.
3. Ernst & Young Hua Ming LLP audited and issued a standard unqualified opinion on the
annual financial statements of the Company.
4. Mr. Ding Yi, representative of the Company, Mr. Qian Haifan, person overseeing the
accounting operations, and Mr. Xing Qunli, head of Accounting Department, make
representations in respect of the truthfulness, accuracy and completeness of the financial
statements contained in the annual report.
5. Profit distribution plan or plan for the capitalization of capital reserve during the reporting
period considered by the Board.
The Board suggests that no dividends shall be distributed for the year of 2016 and no capital surplus
shall be transferred to share capital. The distribution plan is going to be submitted to the Annual
General Meeting for approval.
6. Risk relating to forward-looking statements
The report analyzes major risks faced by the Company. Please refer to “(4) Potential risks” of “4.3.
Discussion and Analysis on the Company’s Future Development” of “Report of The Board” in Section
IV for details. Forward-looking statements, contained in this report do not constitute any substantive
commitments to investors by the Company. Investors should be aware of the relevant risks.
Content

Maanshan Iron & Steel Company Limited2016 Annual Report
2
Content (Continued)
7. No appropriation of fund on a non-operating basis by the controlling shareholder or its
related parties was found in the Company.
8. There is no violation of regulations, decisions or procedures in relation to provisions of
external guarantees.
9. The Company has no significant risk that needs to draw special attention of investors.

Maanshan Iron & Steel Company Limited2016 Annual Report
3
I. Definitions
I. DEFINITIONS
In this report, unless the context otherwise requires, the following terms have the following meanings:
Definitions of common terms
The Company and Magang means Maanshan Iron and Steel Company Limited
The Group means the Company and its subsidiaries
The Group Company means Magang (Group) Holding Company Limited
Board of Directors or the Board means the board of directors of the Company
Directors means the directors of the Company
Supervisory Committee means the supervisory committee of the Company
Supervisors means the supervisors of the Company
Senior Management means the senior management of the Company
Hong Kong Stock Exchange means the Stock Exchange of Hong Kong Limited
SSE means Shanghai Stock Exchange
A shares means the ordinary shares in the share capital of the Company
with a nominal value of RMB1.00 per share, which are
listed on the SSE, and subscribed for and traded in RMB
H shares means the foreign shares in the share capital of the Company
with a nominal value of RMB1.00 per share, which are
listed on the Hong Kong Stock Exchange, and subscribed
for and traded in Hong Kong dollars
SD&C Shanghai Branch means Shanghai Branch of China Securities Depository and
Clearing Corporation Limited
PRC means the People’s Republic of China
Hong Kong means the Hong Kong Special Administrative Region
RMB means Renminbi
CSRC means China Securities Regulatory Commission
CBRC means China Banking Regulatory Commission
MIIT means the Ministry of Industry and Information Technology of the
People’s Republic of China
CISA means China Iron and Steel Association
The Articles of Association means The articles of association of Maanshan Iron and Steel
Company Limited
Masteel Financial means Magang Group Finance Co. Ltd.
Hefei Co means Ma Steel (Hefei) Iron & Steel Co., Ltd.
Environmental Protection
Company
means Anhui Xinchuang Energy Saving and Environmental
Protection Technology Company Limited
Changjiang Steel means Anhui Changjiang Steel Co., Ltd
I. Definitions

Maanshan Iron & Steel Company Limited2016 Annual Report
4
I. Definitions (Continued)
CRCC means China Railway Test & Certification Center
Rail Transportation Co. means Magang Rail Transportation Equipment Co. Ltd.
Magang Investment Limited means Magang Group Investment Limited, a wholly owned
subsidiary of the Group Company
MG-VALDUNES means MG-VALDUNES S.A.S, a wholly owned subsidiary of the
Company
reporting period means From 1 January 2016 to 31 December 2016
I. DEFINITIONS (CONTINUED)
In this report, unless the context otherwise requires, the following terms have the following meanings:
(continued)
Definitions of common terms (continued)

Maanshan Iron & Steel Company Limited2016 Annual Report
5
II. Company Introduction and Major Financial Indicators
1. COMPANY PROFILE
Statutory Chinese name of the Company 馬鞍山鋼鐵股份有限公司
Statutory Chinese short name of the Company 馬鋼股份
Statutory English name of the Company MAANSHAN IRON & STEEL COMPANY LIMITED
Statutory English short name of the Company MAS C.L.
Legal representative of the Company Ding Yi
2. CONTACT PERSON
Representative for Securities Affairs
Name He Hongyun
Correspondence address No. 8 Jiu Hua Xi Road, Maanshan City, Anhui Province, the PRC
Telephone 86-555-2888158/2875251
Fax 86-555-2887284
Email address [email protected]
Note: Mr. Hu Shunliang, the former Secretary to the Board (Company Secretary) resigned as the Secretary to
the Board (Company Secretary) due to the reason that he has reached the age for re-designation to non-
leadership position. On 14 February 2017, the twenty-fifth meeting of the eighth session of the Board
approved the resignation of Mr. Hu as the Secretary to the Board (Company Secretary) and resolved that
the duties of the Secretary to the Board (Company Secretary) will be temporarily performed by Mr. Ding Yi,
the legal representative and Chairman of the Company. The Company will appoint a new Secretary to the
Board (Company Secretary) as soon as possible.
3. BASIC INFORMATION
Registered address No. 8 Jiu Hua Xi Road, Maanshan City, Anhui Province, the PRC
Postal code of the registered
address 243003
Office address No. 8 Jiu Hua Xi Road, Maanshan City, Anhui Province, the PRC
Postal code of the office address 243003
The Company’s website http://www.magang.com.cn (A Shares);
http://www.magang.com.hk (H Shares)
Email address [email protected]
II. Company Introduction and Major Financial Indicators

Maanshan Iron & Steel Company Limited2016 Annual Report
6
II. Company Introduction and Major Financial Indicators (Continued)
4. INFORMATION DISCLOSURE AND LOCATION FOR INSPECTION
Name of newspaper designated for information
disclosure Shanghai Securities News
Internet website designated by CSRC for annual
report publication www.sse.com.cn
Location for inspection of annual report of the
Company
The secretariat office of the Board of
Maanshan Iron & Steel Company Limited
5. BRIEF INFORMATION ON THE SHARES OF THE COMPANY
Type of shares Stock exchange for listing of shares Short name of stock Stock code
A Shares The Shanghai Stock Exchange Magang Stock 600808
H Shares The Stock Exchange of Hong Kong Limited Maanshan Iron & Steel 00323
6. OTHER RELATED INFORMATION
Company name Ernst & Young Hua Ming LLP
Name of
the auditors
appointed by the
Company (PRC)
Office address Level 16, Ernst Young Tower, Oriental Plaza,
No.1 East Chang An Avenue, Beijing, China
Names of the auditors who
signed the report An Xiuyan, Wu Xiaofang
7. MAJOR ACCOUNTING DATA AND FINANCIAL INDICATORS FOR THE PAST THREE YEARS
7.1 MAJOR ACCOUNTING DATA
Unit: RMB
Increase/
decrease
compared to
previous year
Major accounting data 2016 2015 (%) 2014
Revenue 48,275,100,310 45,108,926,739 7.02 59,820,938,286
Net profit attributable to
owners of the parent company 1,228,892,407 –4,804,299,674 – 220,616,025
Net profit excluding non-recurring
gains or losses attributable to
owners of the parent company 1,409,936,906 –5,129,504,672 – –154,967,147
Net cash flows from
operating activities 4,619,861,014 5,865,332,053 –21.23 2,912,853,829

Maanshan Iron & Steel Company Limited2016 Annual Report
7
Major accounting data
As at the end of
2016
As at the end of
2015
Increase/
decrease
compared to
the end of
the previous year
(%)
As at the end of
2014
Net assets attributable to
owners of the parent company 19,764,171,955 18,455,838,015 7.09 23,295,565,989
Total Assets 66,245,531,030 62,454,465,955 6.07 68,511,174,810
Total share capital at the end
of the year 7,700,681,186 7,700,681,186 – 7,700,681,186
7.2 MAJOR FINANCIAL INDICATORS
Unit: RMB
Increase/
decrease
compared to
the previous year
Major accounting data 2016 2015 (%) 2014
Basic earnings per share
(RMB/share) 0.160 –0.624 – 0.029
Diluted earnings per share
(RMB/share) 0.160 –0.624 – 0.029
Basic earnings per share excluding
non-recurring gains or losses
(RMB/share) 0.183 –0.666 – –0.020
Return on net assets (weighted
average) (%)
6.43 –23.01 Increased by
29.44 percentage
points
0.95
Return on net assets excluding
non-recurring gains or losses
(weighted average) (%)
7.38 –24.57 Increased by
31.95 percentage
points
–0.67

Maanshan Iron & Steel Company Limited2016 Annual Report
8
II. Company Introduction and Major Financial Indicators (Continued)
8. MAJOR FINANCIAL DATA BY QUARTER IN 2016
Unit: RMB’000
Major financial data
1st Quarter
(Jan-Mar)
2nd Quarter
(Apr-Jun)
3rd Quarter
(Jul-Sep)
4th Quarter
(Oct-Dec)
Revenue 9,225,770 11,775,393 11,990,240 15,283,697
Net profit attributable to owners
of the parent company –348,163 800,916 306,676 469,463
Net profit excluding non-recurring gains or
losses attributable to owners of the parent
company –403,012 872,800 240,399 699,750
Net cash flows from operating activities 2,385,380 –1,858,164 1,752,732 2,339,913
9. NON-OPERATING ITEMS AND EXPENSES
Unit: RMB
Non-operating items 2016 2015 2014
Gains/(losses) from disposal of non-current
assets –51,189,196 32,965,870 –82,179,597
Government subsidies recognized in current
gains/losses (excluding those having close
relationship with the Company’s normal
business, conforming to the national policies
and regulations and enjoying ongoing fixed
amount or quantity according to certain
standard) 74,522,778 259,052,828 438,439,583
In addition to effective hedging business related
to normal operations of the Company, changes
in fair value of trading financial assets and
trading financial liabilities held, as well as
the return on investment generated from the
disposal of trading financial assets, trading
financial liabilities and available-for-sale
financial assets 62,627,178 22,195,527 564,160
Employee termination benefits –347,468,731 – –
Reversal of provision for trade receivables
assessed for impairment individually 927,877 – –
Return on investments generated from the
revaluation of the shareholdings in the newly
acquired subsidiaries held on the purchase
date at fair value – 4,160,631 –

Maanshan Iron & Steel Company Limited2016 Annual Report
9
Non-operating items 2016 2015 2014
Non-operating income and expenses other than
the above items –19,729,079 –12,682,505 –2,407,250
Amortization of deferred income 116,979,983 87,185,350 100,182,129
Other investment income – –7,349,908 –809,831
Impact of minority interests –6,551,217 –391,055 –869,063
Impact of income tax –11,164,092 –59,931,740 –77,336,960
Total –181,044,499 325,204,998 375,583,171
10. ITEMS AT FAIR VALUE THROUGH PROFIT OR LOSS
Unit: RMB
Item
Opening
balance of
the reporting
period
Closing
balance of
the reporting
period
Change in
the reporting
period
Effects on
the profit for
the reporting
period
Financial assets at fair value
through profit or loss 1,005,271,054 555,322,261 –449,948,793 50,951,411
Total 1,005,271,054 555,322,261 –449,948,793 50,951,411
11. OTHERS
THE GROUP’S MAJOR ACCOUNTING AND FINANCIAL DATA FOR LAST FIVE YEARS
Unit: RMB millionAccounting Data (Indicators) 2016 2015 2014 2013 2012
Revenue 48,275 45,109 59,821 73,849 74,404Gross profit 1,369 –4,727 512 322 –3,746Net profit 1,257 –5,104 264 208 –3,801Basic earnings per share
(RMB/share) 0.160 –0.624 0.029 0.020 –0.502Diluted earnings per share
(RMB/share) 0.160 –0.624 0.029 0.020 –0.502
Major Accounting DataAt the end of
2016At the end of
2015At the end of
2014At the end of
2013At the end of
2012
Total Assets 66,246 62,454 68,511 71,822 76,011Total Liabilities 44,165 41,713 42,622 46,123 50,499Net Assets 22,081 20,742 25,889 25,699 25,512

Maanshan Iron & Steel Company Limited2016 Annual Report
10
III. Overview of the Company’s Businesses
1. INTRODUCTION OF THE COMPANY’S MAJOR BUSINESSES AND OPERATION MODEL AND INDUSTRY PERFORMANCE DURING THE REPORTING PERIOD
As one of the largest iron and steel producers and sellers in China, the Company’s major businesses
are production and sales of iron and steel products; the main production processes include iron
making, steelmaking, steel rolling, etc. Major product of the Company is steel, which can be roughly
divided into three types, i.e. plates, long products and wheels and axles.
Plates: Major products include thin plates and medium plates. Thin plates can be further categorized
into hot and cold-rolled thin plates, galvanized plates and coil-coating plates. Hot-rolled thin
plates are mostly used in the construction, automobile, bridge-building, machinery businesses and
petroleum transportation, while cold-rolled thin plates are used in high-grade light industries, home
electrical appliances, and medium and high-grade production of automobile parts. Galvanized
plates are positioned to be used as automobile plates, home electrical appliances plates, high-
grade construction plates, and plates for businesses like packaging and utensil manufacturing. Coil-
coating plates can be used in both interior and exterior of construction projects, home electrical
appliances and steel windows. Standards adopted by thin plate products of the Company include
GB, the national standard of the PRC, Japan’s JIS standard, Germany’s DIN standard and the
US ASTM standard. Medium plates are widely used in boilers, pressurized utensils, ship-building,
container manufacturing, and so forth. Plates used for building ship structures have been endorsed
by certificates issued by six ship classification societies from China, the United Kingdom, Germany,
the United States, France and Norway. Pickling plates and boiler vessel plates have obtained the PED
certification (pressure equipment) of the European Union. The Company’s automobile plate products
have obtained the IATF16949 system certification and multiple original equipment manufacturers
certification.
III. Overview of the Company’s Businesses

Maanshan Iron & Steel Company Limited2016 Annual Report
11
Long products: Major products include section steel and wire rod. Major products include section
steel and wire rod. H-shaped steel is mostly used in construction, steel structures, machinery
manufacturing and the construction of petroleum drilling platforms and railways. It has been awarded
the “Golden Cup Prize of Quality Metal Products” and has been hailed as a “Reliable and Reputable
Construction Material Brand Name Product” by the China Construction Materials Enterprise
Management Association and selected in the Catalog of China’s Top Brands by the China Promotion
Commission for Top Brand Strategy. The Company owns the core technology and patent of the shock
and fire resistant H-shaped steel for construction. The H-shaped steel products have been certified
under the Japanese JIS standards and accredited by European Union CE mark certification. The
H-shaped steel used in manufacturing oceanographic platforms has been endorsed by certificates of
both China and Germany. Common medium-shaped steel is mostly used in construction structures,
machinery manufacturing and steel structures used in shipbuilding. It has also been awarded the
“Golden Cup Prize of Quality Metal Products”. The stable corten steel has passed the on-site review
of China Railways Product Certification Center (“CRCC”). High-speed wire rod products are mostly
used in the production of robust materials, pre-stressing strand steel wires and spring steel wires,
and are occasionally used in construction materials. The Company owns the core technology and
patent of the high-efficiency, low-cost cold-forged steel with wire-softening treatment. Hot-rolled
reinforcing steel used in armored concrete is mainly used in construction. It has been acclaimed
“The First Lot of Quality Products Exempted from Inspection” by the General Administration of
Quality Supervision, Inspection and Quarantine of the PRC, and has been hailed as a “Reliable and
Reputable Construction Material Brand Name Product” by the China Construction Materials Enterprise
Management Association. It has also been endorsed by the registered BS standard in Hong Kong.
Hot-rolled reinforcing steel and hot-rolled wire rods have been endorsed by the quality control system
certification and product certification of the UK Certification Authority for Reinforcing Steels (CARES).
Wheels and axles: Major products include train wheels, axles and rings, which are widely used
in railway transport, port machinery, petrochemical industries, aerospace industry, and so forth.
Train wheel products are bestowed the honor of “Famous Brand of China”. The Company owns the
core technology and patent of train wheels used for high-speed railroads. High-speed wheels of
standardized electric multiple units have passed the CRCC product certification and obtained the first
CRCC certificate in China. The production quality assurance system for train wheels is accredited with
authoritative certifications including the ISO9000: 2000 quality system, the AAR issued by the North
American Railway Committee, the DB of Deutsche Bahn AG and RISAS (former GM/RT2470 and GM/
RT2005) issued by British Rail.
During the reporting period, the major businesses, main products and the usages, operation modes,
major driving factors of performance did not experience substantial changes.
During the reporting period, the iron and steel industry to which the Company belongs to was at
its mature stage, in which time the market demand had slightly recovered. The supply-side reform
achieved initial success but the overcapacity contradicting was still highlighted.

Maanshan Iron & Steel Company Limited2016 Annual Report
12
III. Overview of the Company’s Businesses (Continued)
2. ANALYSIS OF THE CHANGE IN THE COMPANY’S MAJOR ASSETS DURING THE REPORTING PERIOD
During the Reporting period, there was no material change in the Company’s assets.
Of which, overseas assets amounted to RMB2,080 million, accounting for 3.14% of total assets.
3. ANALYSIS OF THE COMPANY’S CORE COMPETITIVENESS DURING THE REPORTING PERIOD
As of 31 December 2016, the Company possessed 803 valid patents, and 2,126 valid technical
secrets (non-patented technology). Patents, technical secrets and know-how constitute the
Company’s core technology system. The Company has developed its own core technology in train
wheels (especially high-speed wheels for standard EMU and high-power locomotive wheels), high-
strength automotive sheet, efficient and energy-saving construction steel, marine engineering
H-shaped steel, high-grade hot-rolled steel, high-grade electrical steel and other key products,
embodying a competitive advantage compared with similar companies. Among which, the efficient and
energy-saving construction steel, railway wheels, high-speed wheels for standard EMU, high-power
locomotive wheel, axle steel and other steel products hold the leading technological position in China.
In 2016, the high-speed wheels for standard EMU developed by the Company obtained the CRCC
product certification, which was its first CRCC certification in the PRC.

Maanshan Iron & Steel Company Limited2016 Annual Report
13
IV. Report of The Board
4.1 CHAIRMAN STATEMENT
Dear Shareholders,
On behalf of the Board, I hereby present to you the
operating results of the Group for 2016.
First of all, on behalf of the Board, I would like to
express my heartfelt thanks to all shareholders and
various sectors of society for their concern for and
support to the Company.
In 2016, China’s economic development continued
to s low down wi th i ts GDP growth fur ther
decreased to 6.7% YoY. While the government moderately expanded overall demand, it intensely
promoted the supply-side structural reform. Various policy measures began to take effect and the
market witnessed favorable changes. According to the CISA statistics, China’s crude steel output
was 810 million tonnes and the apparent consumption of crude steel was 710 million tonnes for
2016, representing a YoY growth of 0.6% and 1.7% respectively. The recovery of market demand,
historically low steel inventory and other factors stimulated the fluctuation and improvement of steel
price in the domestic market. The consolidated steel price index increased by 43.14 points from 56.37
points at the beginning of the year to 99.51 points at the end of the year, representing a growth of
76.5% YoY. As the steel industry experienced a steady rising trend, it turned significant loss into profit.
Nonetheless, the profit margin of the industry was merely 1.02%, which is far lower than the average
profit margin of 5.97% for the industry sector.
In view of the opportunities ushered in by the new economic norm, the Company adhered to the
strategy of “Focusing on the two major
s e g m e n t s w h i l e d r i v i n g r e f o r m a n d
innovat ion” and p laced emphas is on
product upgrade, expansion of industrial
chain and international operation. At the
same t ime, by act ively seiz ing market
o p p o r t u n i t i e s , d e e p e n i n g s t r u c t u r e
adjustment and enhancing lean operation,
the Company turned loss into profit in
2016 through the concerted efforts of all
employees, which laid a good foundation for
the development under the “13th Five Year
Plan”.
IV. Report of The Board

Maanshan Iron & Steel Company Limited2016 Annual Report
14
IV. Report of The Board (Continued)
In accordance with the PRC Accounting Standards, the Group achieved revenue of RMB48,275 million
in 2016, representing a YoY growth of 7.02%. It turned around and recorded net profit attributable
to owners of the parent company of RMB1,229 million. The basic earnings per share were RMB0.16.
As at the end of the reporting period, the Group’s total assets amounted to RMB66,246 million,
representing a YoY growth of 6.07%. Net assets attributable to owners of the parent company were
RMB19,764 million, representing a YoY growth of 7.09%. As at the end of the reporting period,
the Group’s gearing ratio was 66.67%, representing a decrease of 0.12 percentage points when
compared with the previous year.
In accordance with the China Accounting Standards for Business Enterprises, the Group recorded net
profit of RMB1,363 million in 2016, adding the retained profit of RMB-1,489 million as at the beginning
of this year, the profit distributable to shareholders amounted to RMB-126 million as at the end of
2016. Given that the Company recorded negative profit distributable to shareholders as at the end
of 2016, the Board does not recommend the payment of cash dividend or transfer of capital surplus
to share capital for 2016. The distribution plan is to be submitted to the Annual General Meeting for
approval.
On 2 August 2016, the Company issued the short-term financing bonds in the principal amount of
RMB2.0 billion, with a coupon rate of 5.45%. The proceeds were applied for the replenishment of
working capital. In addition, on 25 August 2016, the Company settled the 5-year corporate bonds in
the principal amount of RMB2.34 billion that were issued in 2011.
In pursuit of higher overall production efficiency, the Company has decided to phase out certain costly
production lines with low efficiency. In 2016, the Company permanently shut down a blast furnace and
a converter with iron production capacity of 620,000 tonnes and steel production capacity of 640,000
tonnes.
For many years, the Company has been
committed to promoting comprehensive
and cohes ive deve lopment be tween
business, society and environment by
pers istent ly adher ing to the pract ice
of “a low-carbon economy and green
production”. In 2016, the Company strictly
complied with the rigid requirements of
environmental protect ion and pushed
forward clean production, energy saving
and emission reduction initiatives in the whole process, as a result, the emission of soot and sulfur
dioxide per ton of steel reduced over the same period of last year. In cognition of such, the Company
was awarded the “Clean Production and Environment-friendly Enterprise” by CISA.

Maanshan Iron & Steel Company Limited2016 Annual Report
15
Looking ahead to 2017, new growth drivers are emerging for China’s economy. With the country
continues to implement favorable fiscal policy and sound monetary policy, the fundamental situation
where economy develops well in the long term will remain unchanged. Despite China is well positioned
to seize major opportunities as it is set to deepen the reform of state-owned enterprises, push forward
the supply-side structural reform, cut excessive capacity of iron and steel industry, implement the
“One Belt, One Road” initiative and “Made in China 2025” strategy, and experience consumption
upgrade, it also faces tough challenges from sluggish demand, merger and restructuring, competition
due to product homogeneity, resources and environmental constraints and low profitability.
In 2017, the Company will adhere to the strategy of “deepening reform and strengthening brand
building”. It will pursue outstanding operating results and strive to pave way for the transformation,
upgrade and healthy development of Magang. To this end, the Company will carry out the following
major measures:
In-depth implementation of the performance excellence management model. The Company
will deepen the performance excellence management based on the National Quality Award as its new
starting point, and establish the management model with Magang characteristics in a planned manner
to facilitate the continuous enhancement of operating performance.
Enhancement of brand building. The Company will develop brand strategy for the purpose of
strengthening brand promotion and marketing and raise brand awareness companywide. It will also
set up the brand risk management system and procedures to maintain Magang’s brand image.
Stable and high level operation of the iron-making system. The Company will implement
differentiated management based on types of furnace to ensure excellent system operation. Through
optimizing the blast furnace inspection and early warning system, it will establish the blast furnace
operational model with Magang characteristics, thereby consolidating stable and smooth operation for
the long run and developing a leading brand of blast furnace operation.
Promotion of professional, refined, efficient and customized production of the steel rolling
system. The Company will consistently implement lean operation concept and rapidly upgrade the
steel production process; strengthen the link between production and sales while optimizing the
division of labor for production lines so as to fully utilize the capacity of major lines; revise the rules of
schedule planning to ensure on time delivery of key product orders with good quality.

Maanshan Iron & Steel Company Limited2016 Annual Report
16
IV. Report of The Board (Continued)
Enhancement of efficiency creation by the “two markets”. The Company will optimize the
decision making process, strengthen the tracking and analysis of the steel market and raw material
market to increase accuracy, and support efficiency creation of the marketing and procurement
functions. While the Company maintains low inventory level to secure supply, it adopts flexible
procurement strategy to lower procurement costs. The Company will aim at boosting the regional
market share and sales of high value added products in total sales; increase promotion to end users
and strengthen the integrated marketing of products, technology and services; step up the product
export strategy, coordinate domestic and international markets, optimize the planning for overseas
market and reach out to overseas end users; further expansion of sales via the E-business platform.
Intensive adjustment of product structure. In terms of steel plate products, the Company will
respond to the demand for high strength and lightweight products, increase the sales contribution of
high-strength steels and steel plates for automobile exterior while boosting market share; expand the
market for cold-rolled, galvanized and pickled plates used in high-end household electrical appliances,
and increase the share of high grade electrical steel. In terms of long products, the Company will
step up the research and production of section steels for railways, marine engineering, high rise
buildings and bridges, as it develops the market of industrial wire rods, which include spring steel,
welding wire steel, bearing steel, chain steel and high ended cold forging steel. In terms of wheel
and axle products, the Company will strive to achieve bulk supply of high-speed wheels in China;
expedite the development and trial production of high-speed wheels and axles, and strengthen market
share of wheel and axle products.
Steady enhancement of product quality. The Company will identify customer demand accurately
and strengthen capability of process design; stabilize quality of high-end products through
technological transformation projects to significantly reduce internal quality loss; strengthen control
over quality process, process quality supervision, inspection of production technique and quality
incident assessment, and establish the sustainable evaluation mechanism for exposing problems and
the preventive mechanism for key processes.
In the coming year, the Board of the Company will be more dedicated and diligent in leading the
employees in a concerted effort. We hope and believe that with the support of the shareholders and
various sectors of society, the Company will be able to make a great progress on various tasks.
Ding Yi
Chairman
29 March 2017
Maanshan City, Anhui Province, the PRC

Maanshan Iron & Steel Company Limited2016 Annual Report
17
4.2 BUSINESS ENVIRONMENT
• THE STEEL PRODUCT MARKET
In 2016, the prices of steel in domestic market fluctuated and rose. In 2016, the average
monthly value of China Steel Price Index (CSPI) was 75.88 points, representing an increase of
9.45 points or 14.23%.
50
60
70
80
90
100
110
2015.12
2016.1 2 3 4 5 6 7 8 9 10 11 12
Plate price index Long Products price index
Domestic steel products prince index
Graph 1. Trend of price index for domestic steel products, long products and steel plates in
2016
Overall, the prices of long products and plates products fluctuated and rose. The trend of
plates products price is superior to that of the long products price.
• THE MARKET OF RAW MATERIALS AND FUELS
In 2016, the overall trend of iron ore price is similar to that of the steel price, only the rebound
rate is slightly lower. The prices of coke surged in the second and third quarter and were finally
down in the fourth quarter. According to the statistics of Chinese Customs, the average CIF
price of imported iron ore nationwide was US$56.30/ton in 2016, dropped by 6.9% from the
previous year.
To sum up, the impact of increasing steel prices was greater than that of its raw materials. It
was the major external factor resulting in common improvement in production and operation of
iron and steel enterprises.

Maanshan Iron & Steel Company Limited2016 Annual Report
18
IV. Report of The Board (Continued)
• IMPORT AND EXPORT MARKET
Under the influence of improvement in domestic steel market and the intensified friction in steel
international trade, China’s net export of steel dropped in 2016. According to the statistics of
Chinese Customs, the annual export of steel amounted to 108,430,000 tonnes, representing
a decrease of 3.5% from the previous year; while the import of steel amounted to 13,210,000
tonnes, representing an increase of 3.4% from last year. The net export of equivalent crude
steel was approximately 98,550,000 tonnes, representing a decrease of 4.7% from the previous
year. With the rise of international trade protectionism, it becomes more difficult for exporting
China’s iron and steel products.
4.3 MAJOR BUSINESS PERFORMANCE IN THE REPORTING PERIOD
During the reporting period, the Group produced 17,640,000 tonnes of pig iron, 18,630,000 tonnes of
crude steel and 17,690,000 tonnes of steel, representing a year-on-year decrease of 2.05%, 1.01%
and 3.17% respectively (of which the Company produced 13,810,000 tonnes of pig iron, 14,640,000
tonnes of crude steel and 13,740,000 tonnes of steel, representing a year-on-year increase of 4.31%,
2.67% and 1.78% respectively). Principal activities of the Company during the reporting period were
as follows:
1. Focused on production and maintained stable operation. The iron-making system achieved
continuously stable and balanced production by improving the “physical examination” rules and
security early-warning mechanism of blast furnace operation; the steel rolling system advanced
specialized production and optimized work allocation of production lines to effectively release
the capacity of superior production lines; optimizing the management and control system
of the utility energy system to promote the economical operation of systematic energy with
manufacturing units; developed precision management for key production line equipment and
explored comprehensive efficiency ratings of key production line equipment by strengthening
the control of equipment status of the equipment system. The Company was awarded the title
of The Tenth Nationwide Equipment Management Outstanding Unit.
2. Closely monitored market demand and spared no efforts in product structure adjustment. By
expanding the proportion of high value-added products, the production and sales volume of
auto sheet exceeded 2,000,000 tonnes and the Company realized an increase of 38.6% in high
grade silicon steel production (W470 above); the sales volume of newly developed products
was 386,000 tonnes, representing an increase of 38% as compared to last year.

Maanshan Iron & Steel Company Limited2016 Annual Report
19
3. Strengthened the management of intellectual property and brand building. The Company’s
three products: low-alloy high-strength hot-rolled H-shaped steel for structure, hot-rolled
H-shaped steel for oceanographic platforms and hot-rolled ridded steel bars for reinforced
concrete were awarded the “Golden Cup Prize of Quality Metal Products” in which the hot-
rolled H-shaped steel for oceanographic platforms was awarded “Superb Quality Award”.
4. Actively promote outstanding performance management mode. The Company won the
Sixteenth National Quality Award presented by China Quality and Assurance Committee; and
the title of “Enterprise with Quality and Creditability in China 2016” presented by China Entry &
Exit Inspection and Quarantine Association.
5. Continued benchmarking and cost reduction. The Company strengthened cost management
control measures and promoted benchmarking of processes and production lines.
6. Strengthened marketing operation to create efficiency. Improved market research and decision-
making capacity and constructed a new marketing model for the market. Innovated marketing
mechanism, improved pricing strategy, developed sales channels to focus on regional markets,
expanded E-business sales and optimized export arrangement. Developed 175 new clients
throughout the year and increased the direct supply ratio of plates and strips to 66%; sold
520,000 tonnes of steel on E-business platforms and exported 1,210,000 tonnes of steel.
7. Implemented optimization of human resources. The Company enhanced productivity of
employees resulting in significant reduction on salary costs and labor costs in the year.
8. Strengthened safe production responsibility mechanism, promoted the construction of safe
production standardization and maintained stable status of safe production.
9. Strictly implemented rigid requirements of environmental protection and strengthened the
efforts of environmental governance. The Company gained the title of “Clean Production
Environmental-Friendly Enterprise” presented by the China Iron and Steel Association.

Maanshan Iron & Steel Company Limited2016 Annual Report
20
IV. Report of The Board (Continued)
(1) ANALYSIS OF PRINCIPAL OPERATION
Analysis of the change in items of the income statement and cash flows statement
Unit: RMB
Items
Amount of the
current year
Amount of the
same period of
last year
Change
(%)
Revenue 48,275,100,310 45,108,926,739 7.02
Cost of Sales 42,557,487,675 45,488,440,552 –6.44
Taxes and surcharges 432,096,408 201,228,046 114.73
Selling expenses 694,782,730 635,859,844 9.27
General and administrative expenses 1,780,281,484 1,538,609,887 15.71
Financial expenses 793,650,976 813,036,439 –2.38
Impairment losses 1,064,257,636 1,619,389,979 –34.28
Gain on the changes in fair value 4,051,190 819,265 394.49
Investment income 291,396,463 93,725,198 210.91
Non-operating income 205,202,902 384,059,748 –46.57
Non-operating expenses 84,618,416 17,538,205 382.48
Income tax expense 111,880,234 377,912,379 –70.40
Net profit attributable to owners of the
parent company 1,228,892,407 –4,804,299,674 –
Net profit attributable to non-controlling
interests 27,802,899 –300,184,707 –
Exchange differences on translation of
foreign operation 46,990,704 –28,291,071 –
Net cash flows from operating activities 4,619,861,014 5,865,332,053 –21.23
Net cash flows used in investing activities –1,937,596,411 –3,621,073,001 –
Net cash flows used in financing activities –2,090,939,141 –1,554,872,283 –
Research and development expenditure 752,570,000 672,210,000 11.95

Maanshan Iron & Steel Company Limited2016 Annual Report
21
➢ The year-on-year increase of revenue was mainly caused by rising price of steel products
in 2016.
➢ The year-on-year decrease of costs of sales was mainly caused by declining
production costs resulted from the Company’s continuous cost reduction and efficiency
enhancement and the production suspension in Ma Steel (Hefei) Iron & Steel Co., Ltd.
➢ Taxes and surcharges increased by 114.73% over the previous year, mainly due to
inclusion of the property tax, land use tax, vehicle and vessel use tax, stamp duty and
other taxes arising from operating activities in this item, since 1 May 2016.
➢ Impairment losses declined by 34.28% over the previous year, mainly due to rising price
of steel product this year and reducing provision for inventory impairment in the current
year.
➢ Gain on the changes in fair value increased by 394.49% over the previous year, mainly
due to fair value fluctuation of the currency forward contract this year.
➢ Investment income increased by 210.91% over the previous year, mainly due to this
year’s increase in net profit of the associate companies and joint ventures as compared
with last year.
➢ Non-operating income dropped by 46.57% over the previous year, mainly due to this
year’s reduction in the government’s financial subsidies as compared with last year.
➢ Non-operating expense rose by 382.48% over the previous year, mainly due to this
year’s increase in losses of fixed asset disposal, caused by engineering construction,
technological transformation and demolition, etc.
➢ Income tax expense decreased by 70.40% over the previous year, mainly due to
declined deferred income tax expense this year as compared with last year.

Maanshan Iron & Steel Company Limited2016 Annual Report
22
IV. Report of The Board (Continued)
➢ Ne t p ro f i t a t t r i bu t ab l e t o owne r s o f t he pa ren t company amoun ted t o
RMB1,228,892,407, and the profits increased by RMB6,033,192,081 over the previous
year, mainly because of rising steel price leading to an increase in gross profit margin
this year.
➢ Net profit attributable to non-controlling interests amounted to RMB27,802,899, and the
profits increased by RMB327,987,606 over the previous year, mainly due to rising profit
of non-wholly-owned subsidiaries this year as compared with last year.
➢ Exchange differences on translation of foreign operation amounted to RMB46,990,704,
rising by RMB75,281,775 over the previous year, mainly due to appreciation of the
accounting currency against RMB for overseas subsidiaries.
Financial position and exchange risks
As at 31 December 2016, the total loans of the Group amounted to RMB15,317 million. Except
for foreign currency loans amounting to US$249 million and Euro30 million, all other loans
were denominated in Renminbi. Except for US dollar loans amounted to US$210 million with
fixed interest rates and US dollar loans of US$39.44 million and Euro30 million at LIBOR plus
premium, among the Renminbi-denominated loans of the Group, loans amounting to RMB6,194
million carried fixed interest rates and loans amounting to RMB7,177 million carried floating
interest rates. The Company issued RMB2 billion medium term notes in July and August 2015,
respectively, with total issue amount reaching RMB4 billion. On 2 August 2016, the Company
issued RMB2 billion short term financing bonds. In addition, the Group settled the 5-year
corporate bonds amounting to RMB2.34 billion issued in 2011 on 25 August 2016.
The Group’s level of loans and borrowings varies according to the scale of production and
progress of construction projects. The Group had no overdue loans in the reporting period,
except for Maanshan Iron & Steel Company Limited (Shanghai) Trade Co., Ltd’s short-term
bank loans. At present, the Group is financing its capital projects primarily via its own funds.
As at the end of the Reporting period, banking facilities available to the Group amounted to
approximately RMB36.58 billion.
As at 31 December 2016, the Group’s cash and bank balances amounted to RMB5,312 million
and bills receivable amounted to RMB3,608 million, the majority of which derived from sales
proceeds.

Maanshan Iron & Steel Company Limited2016 Annual Report
23
The Group’s import of raw materials was mainly settled in US dollar, while import of equipment
and spare parts was settled in Euro or Japanese Yen, and export of products was settled
in US dollar. During the reporting period, the Group’s purchase of equipment in Europe and
Japan was not significant and, as a result, the impact of foreign exchange rate fluctuations on
procurement payment was relatively immaterial.
1. Sales and Cost
(1). Analysis of Principal Operation by Industry, Products and Regions
Unit: RMB million
Principal operation by industry
Industry Revenue
Cost of
sales
Gross
profit
(%)
Increase/
(decrease)
of revenue
when
compared
with same
period of
last year
(%)
Increase/
(decrease)
of cost of
sales when
compared
with same
period of
last year
(%)
Increase/
(decrease) of
gross profit
margin when
compared with
same period of
last year
(%)
Iron and Steel 46,095 40,197 12.80 7.57 –7.02 Increased by
13.68 percentage
points

Maanshan Iron & Steel Company Limited2016 Annual Report
24
IV. Report of The Board (Continued)
Unit: RMB million
Principal operation by product
Product Revenue
Cost of
sales
Gross
profit
(%)
Increase/
(decrease)
of revenue
when
compared
with same
period of
last year
(%)
Increase/
(decrease)
of cost of
sales when
compared
with same
period of
last year
(%)
Increase/
(decrease) of
gross profit
margin when
compared with
same period of
last year
(%)
Long products 17,713 16,198 8.55 1.37 –9.77 Increased by
11.28 percentage
points
Steel plates 25,908 21,736 16.10 13.50 –5.54 Increased by
16.91 percentage
points
Wheels and axles 1,462 1,251 14.43 –9.25 –7.88 Decreased by
1.27 percentage
points
Principal operation by region
Region Revenue
Cost of
sales
Gross
profit
(%)
Increase/
(decrease)
of revenue
when
compared
with same
period of
last year
(%)
Increase/
(decrease)
of cost of
sales when
compared
with same
period of
last year
(%)
Increase/
(decrease) of
gross profit
margin when
compared with
same period of
last year
(%)
Anhui 18,980 17,035 10.25 1.57 –13.09 Increased by
15.14 percentage
points
Jiangsu 7,680 6,940 9.64 17.31 5.90 Increased by
9.75 percentage
points
Maanshan Iron & Steel Company Limited2016 Annual Report
25
Principal operation by region
Region Revenue
Cost of
sales
Gross
profit
(%)
Increase/
(decrease)
of revenue
when
compared
with same
period of
last year
(%)
Increase/
(decrease)
of cost of
sales when
compared
with same
period of
last year
(%)
Increase/
(decrease) of
gross profit
margin when
compared with
same period of
last year
(%)
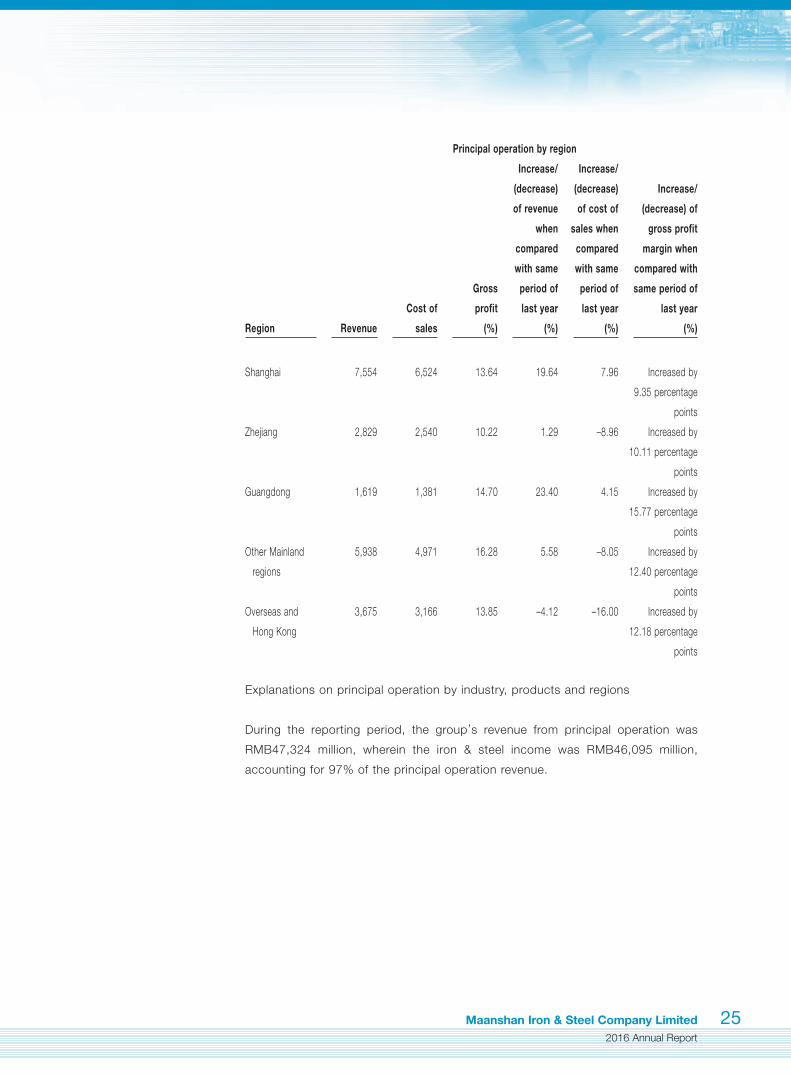
Shanghai 7,554 6,524 13.64 19.64 7.96 Increased by
9.35 percentage
points
Zhejiang 2,829 2,540 10.22 1.29 –8.96 Increased by
10.11 percentage
points
Guangdong 1,619 1,381 14.70 23.40 4.15 Increased by
15.77 percentage
points
Other Mainland
regions
5,938 4,971 16.28 5.58 –8.05 Increased by
12.40 percentage
points
Overseas and
Hong Kong
3,675 3,166 13.85 –4.12 –16.00 Increased by
12.18 percentage
points
Explanations on principal operation by industry, products and regions
During the reporting period, the group’s revenue from principal operation was
RMB47,324 million, wherein the iron & steel income was RMB46,095 million,
accounting for 97% of the principal operation revenue.

Maanshan Iron & Steel Company Limited2016 Annual Report
26
IV. Report of The Board (Continued)
(2). Analysis of Production and Sales Volumes
Product
Production
Volume
Sales
Volume Inventory
Year-on-year
increase/
decrease of
production
volume
(%)
Year-on-year
increase/
decrease of
sales volume
(%)
Year-on-year
increase/
decrease of
inventory
(%)
Long products 8,380,000
tonnes
8,279,000
tonnes
212,000
tonnes
–6.57 –7.45 90.99
Steel plates 9,169,000
tonnes
9,202,000
tonnes
50,000
tonnes
0.47 1.41 –39.76
Wheels and axles 142,000
tonnes
144,000
tonnes
5,000
tonnes
–18.39 –17.24 –28.57
(3). Analysis of Costs
Unit: RMB million
By industry
Industry
Cost
components
Amount
in 2016
% of total
cost in 2016
(%)
Amounts
in 2015
% of total
cost in 2015
(%)
Change in
proportion
of amount
in 2016
against
amount
in 2015
(%)
Iron and Steel Raw materials 31,495 74.01 30,252 66.51 4.11
Iron and Steel Salary 3,273 7.69 3,410 7.50 –4.02
Iron and Steel Depreciation 3,245 7.63 3,365 7.40 –3.57
Iron and Steel Fuels 3,260 7.66 4,145 9.11 –21.35
Iron and Steel Others 1,284 3.01 2,058 4.52 –37.61
(4). Analysis of Major Customers and Major Suppliers
The amount of total sales to the top five customers was RMB4,557 million,
accounting for 9% of the annual sales. Among the sales to the top five
customers, the amount of sales to the related parties was nil, accounting for 0%
of the annual sales.

Maanshan Iron & Steel Company Limited2016 Annual Report
27
The amount of the total purchase from the top five suppliers was RMB8,863
million, accounting for 35% of the annual purchase. Among the purchase from
the top five suppliers, the amount of purchase from the related parties was
RMB2,862 million, accounting for 11% of the annual purchases.
Other explanations
Amongst the key suppliers, was Magang (Group) Holding Co., Ltd., the controlling
shareholder of the Company. Beyond that, in 2016, there were no directors
or supervisors or their connected persons or any shareholders (to the best
knowledge of the board of directors, holding 5% or above of the shares in our
company) having any beneficial interests in the top five suppliers or customers of
our company.
2. Expenses
During the reporting period, there was no significant change in the Group’s selling
expenses, general and administration expenses and financial expenses.
3. Research and Development (R&D) Expenditure
R&D expenditure breakdown
Unit: RMB million
Expensed R&D expenditure in 2016 752.57
Capitalized R&D expenditure in 2016 –
Total R&D expenditure 752.57
Total R&D expenditure as a percentage of revenue (%) 1.56
Number of the Company’s R&D staff 3,787
Percentage of R&D staff number to the Company’s
total number of employees (%) 11.80
Percentage of capitalized R&D expenditure (%) –
4. Cash Flows
Net cash inflow from operating activities was approximately RMB4.6 billion, and the
significant difference from the net profit in the reporting period is caused by provision for
inventory impairment and depreciation expense this year.
(1) Net cash inflow from operating activities amounted to RMB4,619,861,014,
down by 21.23% over the last year, mainly due to a substantial rise of the note
endorsement and transfer settlement in sales activities this year, leading to
declined cash inflow from operating activities and increasing inventory compared
with the last year.

Maanshan Iron & Steel Company Limited2016 Annual Report
28
IV. Report of The Board (Continued)
(2) Net cash outflow from investing activities amounted to RMB1,937,596,411, while
net cash outflow of last year amounted to RMB3,621,073,001, mainly due to a
reduction in both the net cash outflow from financial asset investment and the
cost of construction in progress this year.
(3) Net cash outflow from financing activities amounted to RMB2,090,939,141, while
net cash outflow of last year amounted to RMB1,554,872,283, mainly due to
a reduction in the company’s direct financing this year, as well as payment of
corporate bonds due within one year.
(2) ANALYSIS OF ASSETS AND LIABILITIES
1. Assets and liabilities
Unit: RMB’000
Item
Closing
balance
of 2016
Percentage
of closing
balance of
2016 in
total assets
(%)
Closing
balance of
2015
Percentage
of closing
balance of
2015 in
total assets
(%)
Year-on-year
Change
(%)
Financial assets measured
at fair value through profit
or loss 555,322 0.84 1,005,271 1.61 –44.76
Interest receivable 4,045 0.01 1,600 – 152.81
Prepayments 925,051 1.40 634,407 1.02 45.81
Other receivables 127,615 0.19 190,348 0.30 –32.96
Inventories 10,548,062 15.92 6,018,496 9.64 75.26
Financial assets purchased
under agreements to
resell 230,047 0.35 – – –
Loans and advances to
customers 1,555,213 2.35 732,914 1.17 112.20
Available-for-sale financial
investments 577,948 0.87 128,934 0.21 348.25
Construction in process 2,258,191 3.41 4,245,763 6.80 –46.81
Deposits and balances from
banks and other financial
institutions 3,708,225 5.60 1,901,390 3.04 95.03
Repurchase agreements 596,566 0.90 – – –
Bills payable 3,584,228 5.41 5,343,906 8.56 –32.93
Advances from customers 3,682,322 5.56 2,602,554 4.17 41.49
Payroll and benefits payable 550,445 0.83 274,615 0.44 100.44

Maanshan Iron & Steel Company Limited2016 Annual Report
29
Item
Closing
balance
of 2016
Percentage
of closing
balance of
2016 in
total assets
(%)
Closing
balance of
2015
Percentage
of closing
balance of
2015 in
total assets
(%)
Year-on-year
Change
(%)
Taxes payable 274,232 0.41 149,898 0.24 82.95
Dividends payable 8,714 0.01 6,526 0.01 33.53
Other payables 1,912,575 2.89 1,258,464 2.02 51.98
Non-current liabilities due
within one year 3,211,056 4.85 5,084,859 8.14 –36.85
Accrued liabilities 29,580 0.04 22,233 0.04 33.05
Other current liabilities 2,273,058 3.43 – – –
Long-term payroll and
benefits payable 159,173 0.24 28,857 0.05 451.59
Special reserve 27,970 0.04 14,374 0.02 94.59
General reserve 153,395 0.23 102,539 0.16 49.60
Retained profits –190,569 –0.29 –1,368,605 –2.19 –
➢ The financial assets measured at fair value through profit or loss decreased by
44.76% over the previous year, mainly due to a reduction of banking financial
products held by the finance company, a subsidiary of the Company.
➢ Interest receivable increased by 152.81% compared with the end of last year,
mainly due to a rise in the interests receivable for loans granted by the finance
company to entities beyond the group.
➢ Prepayments increased by 45.81% compared with the end of last year, mainly
due to an increase in the advance payments for purchasing the raw materials and
fuels.
➢ Other receivables decreased by 32.96% compared with the end of last year,
mainly due to the decline in the receivable deposits for steel futures trading.
➢ Inventories increased by 75.26% compared with the end of last year, mainly due
to rising price of raw materials, fuel and the cost of finished products.
➢ Financial assets purchased under agreements to resell was RMB230,047,000 and
nil at the end of last year, mainly because the finance company increased reverse
repurchase business this year.

Maanshan Iron & Steel Company Limited2016 Annual Report
30
IV. Report of The Board (Continued)
➢ Loans and advances to customers increased by 112.20% compared with the
end of last year, mainly because the finance company increased the bill discount
amount to third parties.
➢ Available-for-sale financial investments increased by 348.25% compared with the
end of last year, mainly because the finance company purchased policy financial
bonds and corporate bonds, plus the interbank deposit this year.
➢ Construction in process decreased by 46.81% compared with the end of last
year, mainly because the company’s 4# blast furnace, as well as the public and
ancillary supporting project are transferred to fixed assets upon completion.
➢ Deposits and balances from banks and other financial institutions rose by 95.03%
compared with the end of last year, mainly because Magang (Group) Holding Co.,
Ltd. and its subsidiaries increased asset deposit into the finance company.
➢ Repurchase agreements was RMB596,565,698 and nil at the end of last year,
mainly due to inter-bank discount of bills and bonds by the finance company to
other financial institutions this year.
➢ Bills payable decreased by 32.93% compared with the end of last year, mainly
caused by more frequent receivable note endorsement and transfer, to reduce
issuance of notes payable.
➢ Advances from customers increased by 41.49% compared with the end of last
year, mainly due to the rise in steel price and the increase in customers’ advance
payment for steel this year.
➢ Payroll and benefits payable increased by 100.44% compared with the end of last
year, mainly due to increasing performance bonuses for the improved operation of
the Company.
➢ Taxes payable increased by 82.95% compared with the end of last year, mainly
due the increase of value add tax and other taxes for this year’s increase of
income.
➢ Dividends payable increased by 33.53% compared with the end of last year,
mainly due to the increase in the payable dividends of subsidiaries to minority
shareholder.

Maanshan Iron & Steel Company Limited2016 Annual Report
31
➢ Other payables increased by 51.98% compared with the end of last year, mainly
because the Group imported iron ore by means of forfeiting this year, and
changed the creditor from the holding subsidiary Ma Steel (Hong Kong) Co., Ltd.
in prior years to a commercial bank in current year.
➢ Non-current liabilities due within one year decreased by 36.85% compared with
the end of last year, mainly due to this year’s payment of corporate bonds due
within one year.
➢ Accrued liabilities increased by 33.05% compared with the end of last year,
mainly due to increase in the provision for a pending litigation of MG-VALDUNES
S.A.S., Ltd. and the provision for mine rehabilitation in Australia.
➢ Other current liabilities amounted to RMB2,273,058,356 and nil at the end of last
year, mainly due to this year’s issuance of RMB2 billion short-term financing bills
due within one year.
➢ Long-term payroll and benefits payable increased by 451.59% compared with the
end of last year, mainly due to employee benefits of the retired staff caused by
de-capacity and human resource optimization this year.
➢ Special reserve rose by 94.59% compared with the end of last year, mainly
because of changes in production safety expense of the company’s subsidiaries
ChangJiang Steel and Hefei Steel & Iron and net change in the Company’s
portion of special reserve in associate companies.
➢ General reserve increased by 49.60% compared with the end of last year, mainly
due to the increase in loan granting and bill discount business of the finance
company.
➢ Retained profits amounted to RMB-190,568,622 at the end of current year and
-1,368,605,137 at the end of last year, mainly due to the group’s profit for this
year.

Maanshan Iron & Steel Company Limited2016 Annual Report
32
IV. Report of The Board (Continued)
(3) OPERATIONAL INFORMATION ANALYSIS OF THE INDUSTRY
Operation Information
2016 is the first year to settle the work of iron and steel overcapacity, and in the domestic steel
and iron industry, crude steel capacity of more than 65 million tons is resolved. Meanwhile,
fixed asset investment in the steel and iron industry stood at RMB513.9 billion, down by 8.6%
compared with the last year, which is conducive to solve the severe overcapacity. However,
because of low industrial concentration, and the problem of overcapacity is still rather serious;
international steel trade frictions are intensified, original fuel prices rise sharply, “ground steel
strip” chaos is serious, and the market environment remains to be further improved.
Company Information
The Company is located in Eastern China, which is an area with net inflow of steel products.
During the reporting period, the production capacity and utilization rates were as follows:
Product Type
Production
capacity
(’000 tonnes)
Utilization rate
of production
capacity (%)
Pig iron 19,920 89
Crude steel 23,620 79
Steel production 21,270 83
Steel and Iron Industry Operational Information Analysis
1. Manufacturing and sales of steel material based on Processing Techniques
Unit: RMB MillionProduction volume
(tonnes)Sales volume
(tonnes) Revenue Cost of salesGross profit margin
(%)Type based on processing 2016 2015 2016 2015 2016 2015 2016 2015 2016 2015
Cold-rolled steel 4,787,338 4,221,000 4,785,420 4,215,000 14,684 11,676 12,702 11,820 13.50 –1.23Hot-rolled steel 12,761,582 13,874,000 12,695,554 13,804,000 28,937 28,624 25,232 29,142 12.80 –1.81Wheel and axles 142,196 174,000 143,814 174,000 1,462 1,611 1,251 1,358 14.43 15.70

Maanshan Iron & Steel Company Limited2016 Annual Report
33
2. Performances of Steel Material Manufacturing and Sales Based on Forms of Finished
Unit: RMB Million
Types based on forms of finished products
Production volume (tonnes)
Sales volume (tonnes) Revenue Cost of sales
Gross profit margin (%)
2016 2015 2016 2015 2016 2015 2016 2015 2016 2015
Long Products 8,380,085 8,969,331 8,278,910 8,944,863 17,713 17,474 16,198 17,951 8.55 –2.73Steel Plates 9,168,835 9,126,341 9,202,064 9,073,868 25,908 22,826 21,736 23,011 16.10 –0.81Wheels and axles 142,196 174,000 143,814 174,000 1,462 1,611 1,251 1,358 14.43 15.70
3. Performances of Steel Material Sales Based on Sales Channels
Unit: RMB Million
Revenue
Percentage (%)
in total revenue
Based on sales channels 2016 2015 2016 2015
Offline sales 43,190 40,770 89.47 90.38
Online sales 1,890 1,140 3.92 2.53
4. Supply source of iron ore
Unit: RMB Million
Supply volume
(tonnes) Expenses
Supply source of iron ore 2016 2015 2016 2015
Domestic source 7,196,830 7,415,151 3,298 3,139
Overseas import 19,864,484 19,803,055 8,273 9,471

Maanshan Iron & Steel Company Limited2016 Annual Report
34
IV. Report of The Board (Continued)
(4) INVESTMENT ANALYSIS
1. General Analysis of External Equity Investment
Unit: RMB Million
Investment amount as at the end of the reporting period
of the Company 7,278.89
Increase/decrease of investment amount 321.69
Investment amount as at the end of previous year of the Company 6,957.20
Increase/decrease in investment amount (%) 4.62
(1) Significant Equity Investment
Information of companies newly established or with investment changes during
the reporting period
Name of Invested
Company
Main Business Equity
Interest
Ma Steel Rail
Transportation
Equipment Co.,
Ltd.
Railway freight car wheel axle, passenger car
wheel axle, urban rail traffic wheel axle, high
speed CHR unit wheel axle and locomotive
wheel axle R&D, manufacturing, repair, sales,
as well as bogie R&D, manufacturing, sales and
related technical consulting service; wholesale
and retail of railway vehicle parts, metal material,
building material, chemical product (except for
dangerous goods and easy-to-make drugs),
hardware, electrical appliances & accessories,
grease, housing and equipment rental; self-
operation or agent of goods and technology
import and export business.
100%
Masteel America
INC.
Pre-sale, in-sales and after-sales services in
relation to exports of Magang’s train wheels
and H-shaped steel products to the markets in
Americas.
100%
Mascometal Co.,
Ltd.
Development, manufactur ing and sales of
steel wire rods and bars used in automobile
industry and finished iron and steel products,
the provisions of after-sales services and related
technical services, as well as trading businesses
(excluding distribution).
66%

Maanshan Iron & Steel Company Limited2016 Annual Report
35
Name of Invested
Company
Main Business Equity
Interest
Ma Steel (Cihu)
Steel Processing
& Distribution
Co., Ltd.
Production, processing and sales of various
stee l p lates, wi re rods, prof i le products,
providing product warehousing and after-sales
service, housing rental business.
92%
In the reporting period, a wholly-owned subsidiary Masteel America INC. was
established, with a total investment of USD500,000; and the Mascometal Co.,
Ltd. was established under joint investment of ASCO Industrial Corporation and
Ma’anshan Yushan District Urban Development Investment Group Co., Ltd., with
registered capital of Euro32 million.
In the report ing per iod, the whol ly-owned subsidiary of Ma Steel Rai l
Transportation Equipment Co., Ltd. increased capital of RMB60 million. Ma
Steel (Wuhu) Processing and Distribution Co., Ltd., a subsidiary of the Group
agreed to transfer 92% equity interest of Ma Steel (Cihu) Steel Processing &
Distribution Co., Ltd. to the Company. Besides, Ma-Steel OCI chemical Co., Ltd.
was established in February 2015, and the Company have increased the paid-in
capital by amount RMB22.51 million under the capital installment during 2016, in
the result of constant equity interest, which is 40%.
(2) Significant Non-equity Investment
Unit: RMB million
Project Name
Budgeted
Investment
New
Investment
Project
Progress
Product quality projects 6,417 1,344 82%
Energy-saving and
environment protection
projects 2,623 994 84%
Equipment advancement
and other modification
projects 2,360 272 85%
Other projects N/A 416 N/A
Total 3,026 /

Maanshan Iron & Steel Company Limited2016 Annual Report
36
IV. Report of The Board (Continued)
During the reporting period, there were additional investment in property, plant
and equipment which amounted to RMB112 million, and intangible assets
amounted to RMB2 million, except for the construction in progress investment
mentioned above.
The projects were financed by the Company’s fund and bank loans.
(5) ANALYSIS OF THE GROUP’S MAJOR SUBSIDIARIES AND INVESTEES
➢ Ma Steel (Hefei) Iron & Steel Co., Ltd. has a registered capital of RMB2,500 million, in
which the Company holds a direct stake of 71%. It is mainly engaged in metallurgy and
extended processing of ferrous metals and sale of resulting products and by-products;
production and sale of coke and coke chemical products and energy, extended
processing of iron and steel products, production and sale of metallic products. Net loss
for the reporting period amounted to RMB544 million. As at the end of the reporting
period, it had total assets amounting to RMB4,734 million and net assets of RMB2,137
million.
➢ Anhui Changjiang Iron and Steel Co., Ltd. has a registered capital of RMB1,200 million,
in which the Company holds a direct stake of 55%. It is mainly engaged in ferrous metal
smelting, the production and sales of screw threaded steel, round steel, section steel,
angle steel, deformed steel, wire and rod, sales of iron ore and iron ore fines and scrap
steel as well as import and export. As at the end of the reporting period, it recorded net
profit of RMB296 million, total assets of RMB6,330 million and net assets of RMB2,508
million.
➢ Magang Group Finance Co., Ltd. has a registered capital of RMB1,000 million and
91% of its equity is directly owned by the Company. It is chiefly responsible for
providing corporate finance, financial advisory, consulting and intermediary services
to its members. It provides guarantee against borrowing, offers note acceptance and
discount, lending and financial leasing services to its members. Its other activities
include interlending, collection and payment for transactions between members,
approved insurance brokerage, entrustment loans for members, internal transfer and
bill settlement, design of settlement and liquidation plans, and taking deposits from
members. In the reporting period, it posted a net profit of RMB109 million. At the end
of the reporting period, its total asset value was RMB9,024 million and net asset was
RMB1,586 million.

Maanshan Iron & Steel Company Limited2016 Annual Report
37
➢ The wholly-owned subsidiary MG-VALDUNES S.A.S., with registered capital of
Euro40.2 million, is mainly specialized in design, manufacturing, processing, putting
into production, repairing and maintaining of all kinds of products and facilities that are
applied in railway transportation, urban transportation and mechanical industry; sales,
import and export of various shapes of steel products. In the reporting period, the net
losses amounted to RMB127 million; at the end of reporting period, the total assets
stood at RMB534 million, and the net assets were RMB108 million.
➢ Anhui Masteel K. Wah New Building Materials Co., Ltd. has a registered capital of
US$8.389 million, in which the Company holds a direct stake of 70%. It is mainly
engaged in the production, sale and transportation of slag comprehensive utilization
products and the provision of related technological consultation services. Net profit for
the reporting period was RMB19 million. As at the end of the reporting period, it had
total assets amounting to RMB216 million and net assets of RMB129 million.
➢ Ma Steel (Wuhu) Processing and Distribution Co., Ltd. has a registered capital of RMB35
million, in which the Company holds direct and indirect stakes of 70% and 27.3%,
respectively. It is mainly engaged in the processing and sale of metallic products,
processing of automobile spare parts and sale of construction materials and chemical
products. Net profit for the reporting period amounted to RMB39 million. As at the end
of the reporting period, it had total assets amounting to RMB349 million and net assets
of RMB115 million.
➢ Ma Steel (Yangzhou) Processing and Distribution Co., Ltd. has a registered capital of
US$20 million, in which the Company holds a direct stake of 71%. It is mainly engaged
in the production, processing and sale of steel plates, wire rods and section steel, as
well as provision of storage and after-sales services. Net profit for the reporting period
amounted to RMB17 million. As at the end of the reporting period, it had total assets
amounting to RMB293 million and net assets of RMB192 million.
➢ Maanshan Iron and Steel (Australia) Proprietary Limited, a wholly-owned subsidiary,
has a registered capital of AU$21.7379 million. It is mainly engaged in investment and
trading. Net profit for the reporting period amounted to RMB23 million. As at the end of
the reporting period, it had total assets amounting to RMB205 million and net assets of
RMB199 million.

Maanshan Iron & Steel Company Limited2016 Annual Report
38
IV. Report of The Board (Continued)
➢ Ma Steel (Hefei) Processing and Distribution Co., Ltd. has a registered capital of
RMB120 million, in which the Company holds direct and indirect stakes of 61% and
25.48%, respectively. It is mainly engaged in processing and sale of steel plates and
production and sale of construction steel framework products, as well as the provision
of storage and transportation services. Net loss for the reporting period amounted to
RMB31 million. As at the end of the reporting period, it had total assets amounting to
RMB425 million and net assets of RMB165 million.
➢ Masteel (Hong Kong) Co., Ltd. has a registered capital of HK$260 million, in which
the Company holds a direct stake of 91%. It is mainly engaged in the production, sale
and agency of steel products and trading of pig iron. Net profit for the reporting period
amounted to RMB18 million. As at the end of the reporting period, it had total assets
amounting to RMB1,310 million and net assets of RMB253 million.
➢ Maanshan BOC-Ma Steel Gases Company Limited has a registered capital of RMB468
million and the company directly holds 50% equity, to mainly produce, sell air or liquid
form of air products, and engage in preparation for other industrial gas products. In the
reporting period, the net profits amounted to RMB166 million; at the end of reporting
period, the total assets stood at RMB729 million, and the net assets were RMB638
million.
In 2016, Anhui Changjiang Iron and Steel Co., Ltd. had a revenue of RMB8,024 million and a
profit of RMB826 million from its principal business while MG-VALDUNES S.A.S. had a revenue
of RMB338 million and a loss of RMB63 million from its principal business. Ma Steel (Hefei)
Iron & Steel Co., Ltd. had a revenue of RMB2,812 million and a profit of RMB69 million from its
principal business.
4.4 DISCUSSION AND ANALYSIS ON THE COMPANY’S FUTURE DEVELOPMENT
(1) INDUSTRY LANDSCAPE AND TREND
China’s iron and steel industry is now in the latter half period of the production and
consumption peak curve and in the period of market pattern in-depth adjustment, showing
apparent polarization. The iron and steel industry is still the basic industry of national economy,
with certain room for further development. In 2016, BAOSTEEL Group and Wuhan Iron and
Steel Group jointly reorganized to establish China BAOWU Steel Group which will dominate
the market of domestic high-end auto plate, silicon steel and other fields, putting a significant
competitive pressure on the plate products of the group.

Maanshan Iron & Steel Company Limited2016 Annual Report
39
At present, the group’s product structure covers a wide range; therefore, in the future market
competition, it may flexibly deploy resources, and produce the best varieties of steel according
to market conditions. In addition, the company is located along the Yangtze River, with short-
term and low shipping costs to all places, to ensure a prominent market competitiveness of
products.
(2) CORPORATE DEVELOPMENT STRATEGY
Adhere to iron and steel industry as the core, pursue economies of scale, introduce EVI
concept in an all-round way, combine product upgrading and service innovation, focus on
brand strategy and low cost strategy, reinforce product, optimize structure, establish brand,
create a steel and iron material service provider with unique characteristics, strive to ensure
industrial competitiveness leading the industry, enhance overall business, environment,
employee and social performance, and develop the company with a brand of “good benefit,
eco-friendliness, employee morale, customer trust and social respect”.
(3) BUSINESS PLAN
In 2017, the group plans to produce pig iron of 18.22 million tons, crude steel of 19.17 million
tons and steel of 18.24 million tons (of which the company plans to produce pig iron of 14.40
million tons, crude steel of 15.25 million tons and steel of 14.32 million tons), and there is no
significant change compared with the current year.
(4) POTENTIAL RISKS
1. Risks of trade friction on steel exports
In recent years, with the rapid growth of China’s steel and iron product export, trade
protection measures against China’s steel export were increasing. In 2016, the United
States launched the most severe “steel & iron 337 investigation” on China, to push trade
protectionism to the peak, and the EU also quickly followed up, so as to severely hinder
Chinese steel and iron product export to Europe, the United States and other major
markets.
Countermeasures: actively respond and defend based on facts, and take trade
friction solutions of investigation coordination, reasonable appeal, etc, to enhance
competitiveness of company products in the international market.

Maanshan Iron & Steel Company Limited2016 Annual Report
40
IV. Report of The Board (Continued)
2. Capacity reduction policy and industrial risk
The country will ban “ground steel strip” prior to the end of June 2017, and reduce
steel and iron capacity of around 50 million tons again throughout the year, which is
conducive to alleviate the situation of overcapacity, but in view of the promulgated
environmental protection and relocation capacity planning program in some areas, the
competition of domestic plate market will further intensify in the future, and exert a
certain impact on the company.
Countermeasures: intensify development of top-quality end customers of plates, narrow
down the ordinary steel market, optimize the layout of long material, and increase market
share in East China.
3. Risks of business models
In recent years, direct supply ratio of the Company has been increasing, bringing certain
efficiency to the Company, while certain risks come with excessive direct supply ratio:
because downstream clients now don’t have raw material inventory generally, once the
downstream industry shrinks and production slack season comes, the Company’s order
will be in shortage.
Countermeasures: keep track of changed demand of end users in time, reasonably
distribute resource ratio to direct supply, dealers and self marketing and ensure stable
production and operation.
4. Risk of significant fluctuations in RMB exchange rate
With the US dollar entering into the rate hike cycle, significant fluctuations in the RMB
exchange rate becomes inevitable. Not only will changes in exchange rate bring certain
price risk to the import of iron ore and the export of steel but it may bring some risks to
the Company’s non-Renminbi debts.
Countermeasures: give full play to the financing advantage of the subsidiaries, actively
adjust liabilities structure and funding status of the Company, increase steel exports to
improve USD-denominated revenue and maintain balance between foreign exchange
assets and liabilities of the Company.
4.5 THE COMPANY DID NOT FAIL TO COMPLY WITH DISCLOSURE STANDARDS DUE TO INAPPLICABLE STANDARDS OR SPECIFIC REASONS.

Maanshan Iron & Steel Company Limited2016 Annual Report
41
V. Significant Events
5.1 PLAN OR PROPOSED OF PROFIT DISTRIBUTION FOR ORDINARY SHARES, PLAN OR PROPOSAL OF TRANSFERRING CAPITAL RESERVE TO INCREASED EQUITY
(1) Formulation, implementation and adjustment of a cash dividend policy
According to the Article 192 of the Articles of Association of the Company, based on the
principle of giving proper regard to both the need to generate reasonable investment return for
shareholders and the need to fulfill reasonable funding requirements of the Company, dividends
will be distributed to shareholders in proportion to their shareholdings, and the Company’s cash
dividend policy should be maintained on a continuous and stable basis.
The Articles of Association of the Company and related reviewing procedures ensure that
independent directors can fully express their views during the formulation process of the
Company’s dividend distribution policy to fully protect the legitimate rights and interests of
mid to small investors. The distribution standards and profit-sharing ratio of dividend is set
out in the Articles of Association of the Company while the conditions and procedures for the
adjustment and changes of the dividend distribution policy are in line with regulations and
transparent. During the reporting period, the Company implemented the abovementioned
regulations effectively and there was no change in the dividend distribution policy.
(2) The dividend distribution or capital reserves capitalization and bonus sharing declared by the company for the last three years (the reporting period inclusive)
Unit: RMB Million
Year of
Distribution
Bonus Shares
Distributed
Every Ten
Shares
(share)
Dividends
Distributed
Every Ten
Shares (tax
included)
Transferred
Shares Every
Ten Shares
(share)
Amount
of Cash
Dividends
(tax included)
Attributable
to ordinary
equity
holders
of Listed
Company in
Consolidated
Financial
Statements
in the Year of
Distribution
Ratios to
Net Profits
Attributable
to ordinary
equity
holders
of Listed
Company in
Consolidated
Financial
Statements
(%)
2016 – – – – 1,228.9 –
2015 – – – – –4,804.3 –
2014 – – – – 220.6 –
V. Significant Events

Maanshan Iron & Steel Company Limited2016 Annual Report
42
V. Significant Events (Continued)
In 2016, the Company realized net profit amounting to RMB1,363 million in accordance with
China Accounting Standards for Business Enterprises. The undistributed accumulated loss was
RMB126 million as at 31 December 2016 after including the accumulated loss of RMB1,489
million at the beginning of the year. As the Company’s profit available for distribution to the
shareholders was negative at the end of 2016, the Board suggests that no dividends shall be
distributed for the year of 2016 and no capital surplus shall be transferred to share capital. The
distribution plan is going to be submitted to the Annual General Meeting for approval.
(3) During the reporting period, there were no such circumstances which the Company had profit and the undistributed profit for the ordinary equity holders was available, where the Company did not propose any cash dividend distribution plan for ordinary shares.
5.2 PERFORMANCE OF UNDERTAKINGS
(1) UNDERTAKINGS MADE BY ACTUAL HOLDERS, SHAREHOLDERS, RELATED PARTIES AND THE COMPANY DURING THE REPORTING PERIOD OR SUBSISTING TO THE REPORTING PERIOD
Type of
under-
taking Under-taker Content of undertaking
Time of
making the
undertaking
and its term
Deadline
for the
fulfillment of
undertaking
Undertaking
fulfilled on a
timely basis
Reasons for non-fulfillment of
undertaking
Next steps to be taken after
non-fulfillment of undertaking
Other The Group
Company
The controlling shareholder intended
to further acquire A Shares of the
Company for not less than RMB409
million at an appropriate price through
Magang Investment Limited in a way
complying with applicable laws and
regulations, and promised the shares
acquired would not be sold within six
months after the completion of the
further acquisition plan.
24 July 2015 No No In 2016, while production was improved at
the Group Company, severe overcapacity
in the iron and steel industry and the rapid
increase of cost of raw materials have dented
the fundamentals of the Group Company’s
profitabil ity. Therefore, it was faced with
a shortage of funds for the said further
acquisition.
Under the premise of ensuring
the normal operation of funds,
the Group Company will make
more effor ts to increase the
i n t e n s i t y o f f i n a n c i n g a n d
implement the increased holding
in a legitimate and compliance
manner.
(2) No explanation or reason on whether the company has achieved profit estimate issued under the reporting period on its assets or project was needed
5.3 NO APPROPRIATION OF FUND ON A NON-OPERATING BASIS WAS FOUND DURING THE REPORTING PERIOD.
5.4 THE AUDITORS ISSUED “STANDARD AUDIT REPORT” ON THE COMPANY’S FINANCIAL REPORT AND NO SPECIFIC EXPLANATION FROM THE BOARD OF DIRECTORS ON THE “NON-STANDARD AUDIT OPINIONS” WAS NEEDED.

Maanshan Iron & Steel Company Limited2016 Annual Report
43
5.5 ANALYSIS AND EXPLANATION OF THE COMPANY ON THE REASONS FOR AND THE IMPACT OF THE CHANGES TO ACCOUNTING POLICIES, ACCOUNTING ESTIMATES AND MATERIAL ACCOUNTING ERRORS
(1) ANALYSIS AND EXPLANATION OF THE COMPANY ON THE REASONS FOR AND THE IMPACT OF THE CHANGES TO ACCOUNTING POLICIES AND ACCOUNTING ESTIMATES
1. Changes in Accounting Policies
Changes in tax disclosure
In 2016, the Group adjusted the “business tax and surcharges” item in the income
statement to “tax and surcharges” in accordance with the requirements of “Value
Added Tax Accounting Treatment Regulations” (Accounting [2016] No. 22). The real
estate tax, land usage tax, vehicle and vessel tax, stamp tax and other related taxes
relating to operating activities since 1 May 2016 were recorded in “tax and surcharges”
item instead of “general administrative expenses”; For those occurred before 1 May
2016 were still recorded in “general administrative expenses”. As a result of the above
requirements, the contents disclosed in “tax and surcharges” and “general administrative
expenses” in 2016 were different from those in 2015, but there was no impact on net
profit and shareholders’ equity for 2016 and 2015.
2. Changes to Accounting Estimates
In accordance with the CAS 4 – Fixed Assets and CAS 28 – Changes in Accounting
Policy and Estimate and Correction of Errors, the subsidiary of the Company, Anhui
Changjiang Iron and Steel Co., Ltd. adjusted the useful life of fixed assets to ensure the
adjusted useful life to meet the estimates on the period that the future economic benefits
by considering actual useful life of the fixed assets accordingly. On 14 March 2016, the
change was approved by the board of directors in “Resolution of the Board of Directors
of Changjiang Iron and Steel [2016] No.2”. On 30 March 2016, the change was also
reviewed and approved by the board of directors of the Company. The above changes of
accounting estimates performed from 1 April 2016 has resulted in an increase of its net
profit amounting to RMB82 million for 2016.

Maanshan Iron & Steel Company Limited2016 Annual Report
44
V. Significant Events (Continued)
Items
Estimated
useful life
before
adjustment
(number of
years)
Estimated
useful
life after
adjustment
(number of
years) Remark
Buildings 20 30 Increased 10 years
Plant and machinery 10 15 Increased 5 years
Motor vehicles 5 8 Increased 3 years
Office (electric) equipment 10 5 Decreased 5 years
(2) During the reporting period, there was no significant accounting errors.
5.6 APPOINTMENT AND REMOVAL OF AUDITORS
Unit: RMB’000
Current Auditors
Name of auditors in the PRC Ernst & Young Hua Ming LLP
Remuneration of auditors in the PRC 5,185 (including internal control audit fee of RMB600,000)
Tenure of auditors in the PRC 23
Name Remuneration
Internal control auditors Ernst & Young Hua Ming LLP 600
APPOINTMENT AND REMOVAL OF AUDITORS
As Ernst & Young Hua Ming LLP, the auditors, had developed a thorough understanding of the
Company throughout the years, and their work has been conscientious and detailed, the Audit
Committee has recommended to re-appoint the firm as the auditors for 2016. The Board of Directors
did not have any contrary opinion and the related resolution was approved at the 2015 Annual General
Meeting held on 15 June 2016.
5.7 THERE WERE NO INSOLVENCY OR RESTRUCTURING RELATED MATTERS DURING THE REPORTING PERIOD
5.8 THERE WERE NO MAJOR LITIGATION AND ARBITRATION CASES DURING THE REPORTING PERIOD

Maanshan Iron & Steel Company Limited2016 Annual Report
45
5.9 THERE WAS NO PUNISHMENT AND RECTIFICATION ON THE COMPANY AND ITS DIRECTORS, SUPERVISORS, SENIOR MANAGEMENT, CONTROLLING SHAREHOLDERS, ACTUAL CONTROLLER AND ACQUIRERS WAS MADE DURING THE REPORTING PERIOD
5.10 NO EXPLATION OF THE CREDIBILITY OF THE COMPANY, ITS CONTROLLING SHAREHOLDERS AND ACTUAL CONTROLLER DURING THE REPORTING PERIOD WAS NEEDED
5.11 SUBSTANTIAL CONNECTED TRANSACTIONS
(1) CONNECTED TRANSACTIONS RELATED TO NORMAL OPERATIONS
The normal business transactions between the Group and the Group Company were carried
out in the normal course of business of the Company and Holding and were settled in cash or
bills. The details of which are as follows:
(i) Normal operations between the Group Company and the Company
To ensure that the Company has sufficient ore to meet the production demands, the
Group Company agreed to continuously provide the Company with ore on a first priority
basis.
In the period between 1 January 2016 and 31 December 2016, the payment made
by the Company to the Group Company in respect of the “Sale and Purchase of Ore
Agreement”, which was signed in 2015, was as follows (RMB’000):
Amount
Proportion of
transaction
of the same
category (%)
Purchase of iron ore, limestone and dolomite 2,883,966 19
Price for iron ore, limestone and dolomite in tonne acquired by the Group from Group
Company will be determined after arm’s length negotiation between both sides under
normal commercial terms with reference to comparable market price and shall not be
higher than the market price of the same categories of iron ore, dolomite and limestone
provided by independent third parties in the same area in the vicinity of the Company in
Maanshan City, Anhui Province, the PRC.

Maanshan Iron & Steel Company Limited2016 Annual Report
46
V. Significant Events (Continued)
All Directors of the Board who are not associated with Holding (including Independent
Non-executive Directors) considered that those transactions were carried out under
normal commercial terms or were no less favorable than the terms agreed between
the Company with any independent third party. They were in the best interest of the
Company and its shareholders. The continuing connected transactions contemplated
under the “Sale and Purchase of Ore Agreement” between the Company and the Group
Company were approved at the shareholders’ general meeting. In the reporting period,
such transactions were carried out according to the terms for the “Sale and Purchase of
Ore Agreement” for the year of 2016-2018 and their transaction amount was under the
annual cap for that agreement, i.e., RMB3,815 million.
(ii) In the reporting period, businesses between Masteel Financial and Group
Company:
Business
Nature Amount of loan or deposit Interest income/expenses
RMB’000 RMB’000
Deposit Maximum daily deposit 4,354,475 Interest
expenses
20,314
Monthly average maximum
daily deposit
3,633,136
Loan Maximum daily loan 498,000 Interest
income
15,825
Monthly average maximum
daily loan
496,065
Other income
Net income from handling fee and commission (RMB’000) 2,206
Income from discount interest (RMB’000) 17,886
The continuing connected transactions contemplated under the “Financial Services
Agreement” for the year of 2016 between Masteel Financial and the Group Company
were approved by the Board. All Directors of the Board who are not associated
with Holding (including Independent Non-executive Directors) considered that those
transactions were conducted under normal commercial terms and were in the best
interest of the Company and its shareholders. Their transaction amount did not exceed
the daily cap of RMB500 million, while interests, handling and service fees were less
than RMB50 million.

Maanshan Iron & Steel Company Limited2016 Annual Report
47
(iii) Business transactions between the Group and Environmental Protection Company
In the period between 1 January 2016 and 31 December 2016, the payment made
by the Company in respect of the “Energy Saving and Environmental Protection
Agreement”, which was signed in 2015, was as follows (RMB’000):
Proportion of
transaction
of the same
category
Amount (%)
Energy saving and environmental protection
engineering and services 597,743 10
Sale of wastes 4,577 –
Total 602,320 –
The “Energy Saving and Environmental Protection Agreement” for the year of 2016
between the Group and Environment Protection Company was approved by the
shareholders at the shareholders’ general meeting. All Directors of the Board who are
not associated with Holding (including Independent Non-executive Directors) considered
that those transactions were conducted under normal commercial terms and were in
the best interest of the Company and its shareholders. Their transaction amount did not
exceed the cap of RMB684 million specified in the agreement

Maanshan Iron & Steel Company Limited2016 Annual Report
48
V. Significant Events (Continued)
(iv) In the reporting period, save for the connected transactions made pursuant to
the aforementioned Sale and Purchase of Ore Agreement, Financial Services
Agreement, and Energy Saving and Environmental Protection Agreement,
amounts of other connected transactions in the normal course of business with
the Group Company are as follows (RMB’000):
Proportion of
transaction
of the same
category
Amount (%)
Steel products and other products purchased by the
Group Company from the Company 168,572 –
Water, electricity, telephone and other services
purchased by the Group Company from the
Company 120,660 17
Fixed assets and construction services purchased by
the Company from the Group Company 422,916 14
Other services and products purchased by the
Company from the Group Company 2,318,199 100
Total 3,030,347
All Directors of the Board who are not associated with Holding (including Independent
Non-executive Directors) considered that such transactions were carried out between
the Company and the Group Company in their normal course of business in compliance
with normal commercial requirements, and the terms of such transactions using market
price as the pricing benchmark were at least as favorable to the Company when they
were compared with normal commercial terms.
Those transactions were approved by the Board and conducted under the related terms
of the agreement. The transaction amount did not exceed the cap of RMB5,334 million.
• As at 31 December 2016, except for the normal course of business, there were
no other liabilities or debts thus arising between the Company and connected
parties.

Maanshan Iron & Steel Company Limited2016 Annual Report
49
• Substantial agreements entered into with controlling shareholder
On 29 December 2016, the Board approved of Financial Services Agreement and
Integrated Support Services Agreement entered into between the Company and
the Group Company. Except for those agreements, the Company did not enter
into any substantial agreements with its subsidiaries or controlling shareholder
during the reporting period.
Ernst & Young Hua Ming LLP, the Company’s auditors, were engaged to report on
the Group’s continuing connected transactions for the reporting period in accordance
with the Hong Kong Standard on Assurance Engagements 3000 (Revised) “Assurance
Engagements Other Than Audits or Reviews of Historical Financial Information” issued
by the Hong Kong Institute of Certified Public Accountants (HKICPA) and the Practice
Note 740 – Auditor’s Letter on Continuing Connected Transactions under the Hong
Kong Listing Rules issued by the HKICPA. Ernst & Young Hua Ming LLP have issued
their unqualified letter containing their findings and conclusions in respect of the
continuing connected transactions disclosed above by the Group in accordance with
Rule 14A.56 of the Listing Rules. A copy of the auditors’ letter has been provided by the
Company to the Hong Kong Stock Exchange.
(2) OTHERS
The 23rd meeting of the eighth session of the board of directors of the Company convened on
27 October 2016 approved that the Company and the Group Company increase the registered
capital of the Finance Company by RMB1 billion in cash by one-off payment according to the
original proportion of capital contribution. The Company and the Group Company contributed
RMB910 million and RMB90 million, respectively. Please see the connected transaction
announcement published on 28 October 2016 on the following address: http://static.sse.com.
cn/disclosure/listedinfo/announcement/c/2016-10-28/600808_20161028_2.pdf.
5.12 MATERIAL CONTRACTS AND PERFORMANCE THEREOF
(1) During the reporting period, there was no entrustment, contracting and leasing made by the company.

Maanshan Iron & Steel Company Limited2016 Annual Report
50
V. Significant Events (Continued)
(2) GUARANTEES
Unit: RMB100 million
Guarantees Offered by the Company (excluding guarantees offered to subsidiaries)
Guarantees incurred in the reporting period
(excluding guarantees offered to subsidiaries) –
Total ending balance of guarantees (excluding
guarantees offered to subsidiaries) (A) –
Guarantees Offered to Subsidiaries
Total amount of guarantees newly offered to
subsidiaries during the reporting period 3.2
Total ending balance of guarantees offered to
subsidiaries (B) 4.7
Total Amount of Guarantees Offered by the Company
(including guarantees offered to subsidiaries)
Total amount of guarantees (A+B) 4.7
Total amount of guarantees as a percentage of
net assets of the Company (%) 2.48
Of which:
Amount of guarantees offered to shareholders,
actual controller and their related parties (C) –
Amount of debt guarantees offered to those
with asset-liability ratio exceeding 70%,
directly or indirectly (D) –
The portion of total guarantees in excess of
50% of net assets (E) –
Total amount of the preceding three types of
guarantees (C+D+E) –

Maanshan Iron & Steel Company Limited2016 Annual Report
51
Explanation on guarantees
During the reporting period, the Company provided MG-Valdunes S.A.S., its wholly-owned
subsidiary, a guarantee totalled RMB320 million. Additionally, at the end of the reporting period,
Changjiang Steel (as a controlling subsidiary of the Company) provided RMB150 million to its
wholly-owned subsidiary. All guarantees have obtained approval from the independent directors
in prior, as well as the approval from the Board of Directors.
Pursuant to the requirements of the China Securities Regulatory Commission, the independent
directors of the Company carried out due diligence process in relation to the outstanding
guarantees of the year and guarantees offered by the Company in the reporting period. Details
are as follows:
(1) As at 31 December 2016, the approval procedures of all external guarantees offered by
the Company complied with related regulations and procedures.
(2) As at 31 December 2016, the Company did not provide any guarantees to connected
parties in which the Company and its shareholders held less than 50% equity interest,
non-legal entities or individuals.
(3) As at 31 December 2016, the total amount of external guarantees outstanding and
guarantees provided by the Company in the reporting period accounted for less than
50% of the net assets of the Company as stated in its consolidated financial statements.
(3) During the reporting, there was no entrusted asset management, entrusted loans and other wealth management and derivatives investment was made by the Company.

Maanshan Iron & Steel Company Limited2016 Annual Report
52
V. Significant Events (Continued)
5.13 OTHER MAJOR EVENTS
1. During the reporting period, the Company did not repurchase any of its listed shares and the
Group did not purchase or re-sell any of the Company’s listed shares.
2. The PRC laws and the Articles of the Association of the Company do not require the Company
to give priority to existing shareholders to purchase its new shares in the nomination of the
currency of existing shares they hold when issuing new shares.
3. There is no service contract that may be terminated without compensation within one year
(other than legitimate compensation) as signed by and between the Directors of the Company
and the Company
4. In the report period, no Director or Supervisor of the Company owns, directly or indirectly,
material interest in the contracts executed by the Company, its affiliates, the Group Company or
any service company of the Group.
5.14 ACTIVE FULFILMENT OF SOCIAL RESPONSIBILITY
(1) POVERTY ALLEVIATION WORKS BY THE COMPANY
Statistics on targeted poverty alleviation efforts by the Company in 2016
Unit: RMB’000
Indicators
Amount and
progress
I. Summary
Of which: 1. Capital input 460
2. In-kind input 60
3. Number of reduction in registered underprivileged
population through help and support
4,420

Maanshan Iron & Steel Company Limited2016 Annual Report
53
Indicators
Amount and
progress
II. By category
1. Poverty alleviation through industrial development
Of which: 1.1 Types of projects alleviating poverty through
industrial development
□ Through
agriculture
and forestry
development
□Through
tourism
development
□Through
e-commerce
development
✓Through
generating asset
income
□Through
technology
development
□Others
1.2 Number of projects alleviating poverty
through industrial development
10
1.3 Amount contributed to projects alleviating
poverty through industrial development
160
2. Poverty alleviation through education
Of which: 2.1 Amount contributed to improve educational
sources in underprivileged areas
39
3. Poverty alleviation through social participation
Of which: 3.2 Amount contributed to targeted poverty
alleviation
520
(2) SOCIAL RESPONSIBILITY WORK
Further details are stated in “Maanshan Iron & Steel Company Limited Social Responsibility
Report 2016”. Information sources: www.sse.com.cn, www.hkex.com.hk

Maanshan Iron & Steel Company Limited2016 Annual Report
54
V. Significant Events (Continued)
(3) DESCRIPTION OF THE ENVIRONMENTAL PROTECTION OF THE LISTED COMPANIES AND ITS SUBSIDIARIES IN THE HEAVY POLLUTION INDUSTRY AS PRESCRIBED BY THE MINISTRY OF ENVIRONMENTAL PROTECTION
The Company and its subsidiaries, Ma Steel (Hefei) and Anhui Changjiang Iron and Steel, are in
the heavy pollution industry as prescribed by the State Environmental Protection Department.
During the reporting period, there was no major environmental problem occurred in the
Company and its subsidiaries Ma Steel (Hefei) and Anhui Changjiang Iron and Steel and
their environmental protection facilities was built and operated under the principle of three
simultaneousness. The environmental pollution accident emergency plan was regularly revised
and maneuvered. The major pollutants were discharged up to standard and the total emissions
satisfied the requirements of the State, province and city on the emission reduction of the total
amount of pollutant.

Maanshan Iron & Steel Company Limited2016 Annual Report
55
VI. Movements in Share Capital and Shareholders
6.1 SHARE MOVEMENTS
(1) Table on share movements
Unit: ShareBefore the change Increase/(decrease) during the year After the change
Number of shares Percentage
New shares issued
Bonus shares
Shares converted
from surplus reserve Others Sub-total
Number of shares Percentage
(%) (%)
A. Shares with selling restriction – – – – – – – – –1. State-owned shares – – – – – – – – –2. State-owned legal person shares – – – – – – – – –3. Other domestically owned shares – – – – – – – – –Including: domestic non-state-owned
legal person shares – – – – – – – – –Shares owned by domestic natural persons4. Foreign shareholding – – – – – – – – –Including: Overseas legal person shares – – – – – – – – –
Overseas natural person shares – – – – – – – – –B. Shares without selling restriction 7,700,681,186 100 – – – – – 7,700,681,186 100
1. RMB ordinary shares 5,967,751,186 77.50 – – – – – 5,967,751,186 77.502. Foreign shares listed domestically – – – – – – – – –3. Foreign shares listed overseas 1,732,930,000 22.50 – – – – – 1,732,930,000 22.504. Other shares – – – – – – – – –
C. Total 7,700,681,186 100 – – – – – 7,700,681,186 100
(2) In the reporting period, there was no changes in ordinary shares of the Company.
6.2 SHAREHOLDER AND ACTUALHOLDERS
(1) Total number of shareholders
Number of ordinary shareholders by the end of reporting period (accounts) 262,775
Number of ordinary shareholders at the end of last month before
the disclosure date of annual report (accounts) 248,732
VI. Movements in Share Capital and Shareholders

Maanshan Iron & Steel Company Limited2016 Annual Report
56
VI. Movements in Share Capital and Shareholders (Continued)
(2) Shareholding of the top ten shareholders at the end of the reporting period and the top ten tradable-share holder (or shareholders without selling restrictions):
Unit: ShareShareholding of the top ten shareholders
Name of Shareholder (Full Name)
Increase/Decrease within the Reporting
Period
No. of Shares at
the End of Period
Percentage (%)
No. of Shares under
Restricted Condition for
SalesPledged or Frozen Situations
ShareholderShare status Number
Magang (Group) Holding Co., Limited – 3,506,467,456 45.54 – Pledged 800,000,000State-owned shareholder
Hong Kong Securities Clearing Company Nominees Limited 606,000 1,710,814,900 22.22 – Un-known Unknown Unknown
Central Huijin Investment Ltd. Unknown 142,155,000 1.85 – Unknown UnknownState-owned shareholder
China Securities Finance Corporation Limited Unknown 88,096,538 1.14 – Unknown Unknown
State-owned shareholder
Bosera Funds – Agricultural Bank of China (ABC) – Bosera China Securities Finance Asset Management Plan Unknown 33,609,200 0.44 – Unknown Unknown Unknown
E Fund – ABC – E Fund China Securities Finance Asset Management Plan Unknown 33,609,200 0.44 – Unknown Unknown Unknown
Dacheng Fund – ABC – Dacheng China Securities Finance Asset Management Plan Unknown 33,609,200 0.44 – Unknown Unknown Unknown
Harvest Fund – ABC – Harvest China Securities Finance Asset Management Plan Unknown 33,609,200 0.44 – Unknown Unknown Unknown
GF Fund Management – ABC – GF China Securities Finance Asset Management Plan Unknown 33,609,200 0.44 – Unknown Unknown Unknown
Zhong Ou Fund – ABC – Zhong Ou China Securities Finance Asset Management Plan Unknown 33,609,200 0.44 – Unknown Unknown Unknown

Maanshan Iron & Steel Company Limited2016 Annual Report
57
Shareholding of top ten shareholders without selling restrictions
Name
Number of
shares held
without selling
restrictions
Type and number of
shares
Type Number
Magang (Group) Holding
Company Limited 3,506,467,456
RMB-
denominated
ordinary shares 3,506,467,456
Hong Kong Securities Clearing
Company Nominees Limited 1,710,814,900
Overseas-listed
foreign shares 1,710,814,900
Central Huijin Investment Ltd. 142,155,000
RMB-
denominated
ordinary shares 142,155,000
China Securities Finance
Corporation Limited 88,096,538
RMB-
denominated
ordinary shares 88,096,538
Bosera Funds – Agricultural
Bank of China (ABC) – Bosera
China Securities Finance Asset
Management Plan 33,609,200
RMB-
denominated
ordinary shares 33,609,200
E Fund – ABC – E Fund China
Securities Finance Asset
Management Plan 33,609,200
RMB-
denominated
ordinary shares 33,609,200
Dacheng Fund – ABC – Dacheng
China Securities Finance Asset
Management Plan 33,609,200
RMB-
denominated
ordinary shares 33,609,200
Harvest Fund – ABC – Harvest
China Securities Finance Asset
Management Plan 33,609,200
RMB-
denominated
ordinary shares 33,609,200
GF Fund Management – ABC –
GF China Securities Finance
Asset Management Plan 33,609,200
RMB-
denominated
ordinary shares 33,609,200
Zhong Ou Fund – ABC – Zhong
Ou China Securities Finance
Asset Management Plan 33,609,200
RMB-
denominated
ordinary shares 33,609,200
Notes on the above
shareholders’ affiliated
relation or concerted action
Magang (Group) Holding Co., Ltd. has no affiliated relation
with any of the other foregoing shareholders, nor is it a
person acting in concerted action; however, it is not in the
knowledge of the Company whether there is any affiliated
relation among other foregoing shareholders and whether
they are persons acting in concerted action.

Maanshan Iron & Steel Company Limited2016 Annual Report
58
VI. Movements in Share Capital and Shareholders (Continued)
Shareholding of the top ten shareholders with selling restrictions
In December 2016, the Company received two notice issued by the Group Company, namely
notice on repurchase transaction of the 800 million shares of the Company held by the
Group Company used as pledge and notice on the completion of related procedures of the
pledged shares. Please refer to the Company’s announcement release on 7 July and 14 July
for more details: http://static.sse.com.cn/disclosure/listedinfo/announcement/c/2016-12-07
/600808_20161207_1.pdf and http://static.sse.com.cn/disclosure/listedinfo/announcement/c
/2016-12-14/600808_20161214_1.pdf
Apart from mentioned above, in the reporting period, no other shares held by the group
company were pledged, frozen or hosted. However, the Company was unaware whether
shares held by other shareholders who have 5% and above of the total were pledged, frozen or
hosted.
Hong Kong Securities Clearing Company Nominees Limited held 1,710,814,900 H Shares of
the Company on behalf of multiple clients.
Based on the data accessible for the Company and to the best knowledge of the board
of directors, as of the announcement date of the report, the Company meets relevant
requirements about public holdings in Securities Listing Rules of Stock Exchange of Hong Kong
Limited.
As at 31 December 2016, none of the directors, supervisors, senior management or their
respective associates had any interests or short positions in the share capital or relevant share
capital of the Company or any of its associated corporations (definition refers to the Securities
and Futures Ordinance).
Save as disclosed above, as at 31 December 2016, the Company was no aware of any
interests or short positions recorded according to the Securities and Futures Ordinance,
according to the Securities and Futures Ordinance.

Maanshan Iron & Steel Company Limited2016 Annual Report
59
6.3 SUBSTANTIAL SHAREHOLDERS AND ACTUAL HOLDER
(1) Controlling shareholders
1. Legal person
Name Magang (Group) Holding Company Limited
Head of unit or legal representative Gao Haijian
Date of Incorporation 1 September 1993
Major business operations Min ing and sort ing of minera l products;
construction, construction materials, machine
manufactur ing, maintenance and des ign;
external trading; domestic trading; distribution
and storage of materials; property management;
consulting service; rental services; agriculture
and forestry.
Equity in other domestic and overseas
listed companies controlled or
partially owned during the reporting
period
During the reporting period, the substantial
shareholders did not control or partially own
any other domestic and overseas listed
company.
2. Block diagram of property rights and control relationships between the Company
and controlling shareholder
Maanshan (Group) Holding Company Limited
Maanshan Iron & Steel Company Limited
45.54%

Maanshan Iron & Steel Company Limited2016 Annual Report
60
VI. Movements in Share Capital and Shareholders (Continued)
(2) Actual holders
1 Legal person
Name State-owned Assets Supervision and
Administration Commission of the People’s
Government of Anhui Province
2. Block diagram of property rights and controlling relations between the Company
and actual controllers
State-owned Assets Supervision and Administration People’s Government of Anhui Provincial Government
Maanshan (Group) Holding Company Limited
Maanshan Iron & Steel Company Limited
100%
45.54%

Maanshan Iron & Steel Company Limited2016 Annual Report
61
VII. Directors, Supervisors, Senior Management and Employees
7.1 CHANGES IN SHAREHOLDING HELD BY AND EMOLUMENTS
(1) Changes in shareholding held by and emoluments for incumbent and resigned directors, supervisors and senior management in the reporting period:
Name Position Gender AgeDate of term
commencementDate of term
termination
Annual emoluments
(RMB10 thousand)
Receive emoluments
from the Company’s connected
parties
Ding Yi Chairman Male 53 2014-9-1 2017-8-31 – YesQian Haifan Director Male 56 2014-9-1 2017-8-31 56.13 NoSu Shihuai Director Male 58 2014-9-1 2017-8-31 – YesRen Tianbao Director Male 53 2014-9-1 2017-8-31 – YesQin Tongzhou Independent Director Male 47 2014-9-1 2017-8-31 10 NoYang Yada Independent Director Female 61 2014-9-1 2017-8-31 10 NoLiu Fangrui Independent Director Male 53 2014-9-1 2017-8-31 10 NoZhang Xiaofeng Chairman of Supervisory
CommitteeMale 55 2014-9-1 2017-8-31 56.13 No
Fang Jinrong Supervisor Male 53 2014-9-1 2017-8-31 – YesYan Kailong Supervisor Male 52 2015-12-1 2017-8-31 26.65 NoWong Chun Wa Independent Supervisor Male 43 2014-9-1 2017-8-31 7.37 NoSu Yong Independent Supervisor Male 62 2014-9-1 2017-8-31 7.37 NoGao Haichao Senior Management Male 59 2014-9-1 2017-8-31 52.04 NoLu Kecong Senior Management Male 53 2014-9-1 2017-8-31 49.82 NoHu Shunliang Senior Management Male 59 2015-6-16 2017-2-14 23.35 NoTian Jun Senior Management Male 56 2017-2-14 2017-8-31 – NoZhang Wenyang Senior Management Male 49 2017-2-14 2017-8-31 – No
Total 308.86
During the reporting period, none of the Directors, Supervisors and Senior Management held
any shares of the Company.
VII. Directors, Supervisors, Senior Management and Employees

Maanshan Iron & Steel Company Limited2016 Annual Report
62
VII. Directors, Supervisors, Senior Management and Employees (Continued)
Name Working Experience
Ding Yi Mr. Ding served as Deputy General Manager of the Company from January
2004. From July 2011, Mr. Ding served as Deputy General Manager of
Magang (Group) Holding Company Limited and no longer served as Deputy
General Manager of the Company since then. Effective from 24 June 2013,
Mr. Ding served as General Manager of Magang (Group) Holding Company
Limited. Effective from 9 August, 2013, Mr. Ding served as Chairman of the
Company. In addition, Mr. Ding also serves as Chairman of Magang Group
Finance Co., Ltd. and MG Trading and Development Gambit in Germany.
Qian Haifan Mr. Qian was appointed Deputy General Engineer of the Company in April
2010. Mr. Qian was appointed as the general manager of the Company in
July 2011 and Director of the Company in August 2011.
Su Shihuai Mr. Su served as Deputy General Manager and Chief Engineer of the
Company from December 2009 till July 2011. Mr. Su served as Deputy
General Manager and Chief Engineer of Magang (Group) Holding Company
Limited from July 2011 to present. Mr. Su was appointed as Director of the
Company on 5 February 2013.
Ren Tianbao Mr. Ren was appointed Secretary of the Party Committee, Director and
Deputy General Manager of Ma Steel (Hefei) Iron & Steel Co., Ltd. in July
2008. Mr. Ren was appointed Deputy General Manager of the Company in
July 2011. He became Director of the Company in August 2011. He was
appointed Secretary to the Board on 9 February 2012. He was appointed
by Magang (Group) Holding Company Limited as its deputy general
manager and resigned as the deputy general manager and company
secretary of the Company on 11 May 2015. Besides, Mr. Ren was also
appointed as Chairman of Anhui Ma Steel Engineering & Technology
Group.
Qin Tongzhou Mr. Qin is a member of the Chinese Institute of Cert i f ied Publ ic
Accountants (CICPA). He is presently CFO of China Fire & Security Group
Inc. (“CFSG”) and Deputy Manager of Sureland Industrial Firefighting
Limited, a wholly owned subsidiary of CFSG. Having years of audit
experience, Mr. Qin was engaged in audit work in Ernst & Young Hua
Ming Certified Public Accountants from March 2001 to March 2010. He
was appointed Deputy General Manager of Sureland Industrial Firefighting
Limited of CFSG in March 2010 and CFO of CFSG in July 2010. Mr. Qin
was appointed Independent Director of the Company on 31 August 2011.

Maanshan Iron & Steel Company Limited2016 Annual Report
63
VII. Directors, Supervisors, Senior Management and Employees (Continued)
Name Working Experience
Yang Yada Ms. Yang is presently professor, master instructor and Dean of School of
Management of Anhui University of Technology. Ms. Yang was appointed
professor of School of Management of Anhui University of Technology in
September 2002, mainly engaged in teaching and researching in fields of
financial management and enterprise strategy. She sequentially served as
Head of Business Administration Department and Deputy Dean of School
of Management of Anhui University of Technology. She is presently Dean
of School of Management of Anhui University of Technology and Deputy
Chairman of Economic Association of Maanshan. She was elected as
members of 10th and 11th and 12th National People’s Congress. Ms.
Yang was appointed Independent Director of the Company on 31 August
2011.
Liu Fangduan Mr. Liu was qualified and practiced as a lawyer in 1991. He currently
serves as a supervisor at Anhui Xingwan Law Firm and concurrently holds
various positions such as Legal Counsel for the Wuhu Municipal People’s
Government and Vice-chairman of the Lawyers Association of Wuhu
Municipality. Mr. Liu served as Independent Directors from October 25
2012.
Zhang Xiaofeng Mr. Zhang was appointed Chairman of the Labour Union of Holding and
the Company in August 2008. Mr. Zhang was appointed Chairman of the
Supervisory Committee of the Company on 31 August 2008.
Fang Jinrong Mr. Fang was appointed Deputy Manager of the Finance Department
of the Group and the Company since February 2004. Mr. Fang has
been Supervisor of the Company since 31 August 2005. Mr. Fang was
appointed Vice Minister of Supervision and Audit Department since
December 2013.
Yan Kailong In May 2012, he was appointed Director of Equipment Support
Department and Chief Technology Officer of the No. 1 Steel-making
General Factory of Ma Steel Group. In May 2014, he was appointed Vice
Plant Manager of the No. 1 Steel-making General Factory; in December
2014, he was appointed Vice Plant Manager of the Company’s Cold
Rolling Factory. Since November 2015, Mr. Yan was additionally appointed
Vice-chairman of Maanshan Federation of Trade Unions. In December
2015, he was appointed Employee Supervisor of the Company.

Maanshan Iron & Steel Company Limited2016 Annual Report
64
VII. Directors, Supervisors, Senior Management and Employees (Continued)
Name Working Experience
Wong Chun Wa Mr. Wong is an associate member of Hong Kong Institute of Certified
Public Accountants and the Association of Chartered Certified Accountant.
He established ACT Business Consultants Limited in December 2006 and
acted as the company’s director. Mr. Wong was appointed Independent
Director of the Company on 31 August 2005. He was appointed
Independent Supervisor of the Company on 31 August 2011. Mr. Wong
is also independent director of China Zhongwang Holdings Limited and
Chongqing Iron & Steel Company Limited.
Su Yong Mr. Su was appointed Deputy Director of the School of Management of
Fudan University Eastern Management Research Centre in October 2004.
Mr. Su has been Independent Director of the Company since 31 August
2005, and become Independent Supervisor of the Company on 31 August
2011. He also serves as independent director of Shang Gong Group Co.,
Ltd.
Gao Haicao Mr. Gao served as deputy chief engineer of the Company from April 2010
to July 2011; and assistant to the general manager of Magang (Group)
Holding Co., Ltd. from July 2011 to February 2013, during which he
concurrently served as manager of the technology innovation department
of Magang (Group) Holding Co., Ltd. from August 2011 to July 2012. He
has been the Company’s deputy general manager and chief engineer since
17 February 2013. He was appointed as the Company’s deputy general
manager in 2015.
Lu Kecong Mr. Lu was appointed Manager and Secretary of the Party General
Branch of Ma Steel International Trade & Economics Corporation (“Ma
Steel International Trade Corp”) and Director of Foreign Affairs Office in
July 2004; General Manager (Director) and Secretary of the Party General
Branch of Ma Steel International Trade Corp and Raw Material & Fuel
Purchasing Center and Director of Foreign Affairs Office in May 2010;
General Manager (Director) and Deputy Secretary of the Party General
Branch of Ma Steel International Trade Corp and Raw Material & Fuel
Purchasing Center and Director of Foreign Affairs Office in February 2011.
Mr. Lu was appointed Deputy General Manager of the Company in July
2011. In May 2015, he was appointed Director of Magang (Group) Holding
Company Limited. Besides, Mr. Lu was also appointed as Chairman of
Maanshan Port (Group) Co., Ltd.

Maanshan Iron & Steel Company Limited2016 Annual Report
65
VII. Directors, Supervisors, Senior Management and Employees (Continued)
Name Working Experience
Hu Shunliang Mr. Hu was appointed as the Chief of the Secretariat Office of the Board
of the Company in February 2010. He was appointed as the Company
Secretary with effect from 16 June 2015. He resigned as Secretary to the
Board (Company Secretary) on 14 February 2017.
Tian Jun Mr. Tian was appointed as Manager and Deputy Secretary of the Party
Committee of No.1 Energy Plant of the Company in February 2011. He
was then appointed as Manager of Facilities Department of the Company
in April 2014 and assistant to general manager and Manager of Facilities
Department of the Company in August 2015. In addition, Mr. Tian serves
as Chairman of BOC-Ma Steel Gases Company, Director in Environmental
Protection Company, CFHI Maanshan Heavy Industry Co., Ltd. and the MG
Trading and Development Limited.
Zhang Wenyang Mr. Zhang was appointed as Deputy Manager of Marketing Department
of the Company in August 2011. He was then appointed as Manager
of Marketing Department of the Company in July 2012 and Manager of
Production Department (currently known as Manufacturing Department) in
December 2013. He became assistant to general Manager and manager of
Manufacturing Department of the Company in August 2015.
(2) In the reporting period, no directors, supervisors, and senior management of the Company were awarded with stock option incentive.
7.2 POSITIONS OF CURRENT AND OUTGOING DIRECTORS, SUPERVISORS AND SENIOR MANAGEMENT PERSONNEL DURING THE REPORTING PERIOD:
(1) Positions in shareholders’ company
Name Name of Shareholders’ company
Position in shareholders’
company
Ding Yi Magang (Group) Holding Company Limited Director, General Manager
Zhang Xiaofeng Magang (Group) Holding Company Limited Chairman of the Labor Union
Su Shihuai Magang (Group) Holding Company Limited
Deputy General Manager,
Chief Engineer
Qian Haifan Magang (Group) Holding Company Limited Director
Lu Kecong Magang (Group) Holding Company Limited Director
Ren Tianbao Magang (Group) Holding Company Limited Deputy General Manager
Fang Jinrong Magang (Group) Holding Company Limited
Vice Minister of Supervision
and Audit Department

Maanshan Iron & Steel Company Limited2016 Annual Report
66
VII. Directors, Supervisors, Senior Management and Employees (Continued)
(2) Positions in other entities
Name Name of other entities Position in other entities
Qin Tongzhou China Fire & Security Group Inc. (“CFSF”) CFO
Yang Yada Anhui University of Technology Professor of Business School
Liu Fangduan Anhui Xingwan Law Firm Director
Yan Kailong Maanshan Federation of Trade Unions Vice-chairman
7.3 EMOLUMENTS FOR DIRECTORS, SUPERVISORS AND SENIOR MANAGEMENT
Decision making process of emoluments
for Directors, Supervisors and Senior
Management
Annual emoluments of Executive Directors and Senior
Management of the Company were determined by the
Management Remuneration Committee of the Board
in accordance with the amount of emoluments as
approved by shareholders general meeting, and based
on their respective appraisals. Independent Directors and
Independent Supervisors of the Company received a fixed
amount of emoluments during their term of office.
Basis for determination of Directors,
Supervisors and Senior Management
Appraisals
Actual payment to Directors, Supervisors
and Senior Management
Please refer to the previous section “Changes in
Shareholding Held by and Emoluments”.
Total actual payment to Directors,
Supervisors and Senior Management at
the end of reporting period
During the reporting period, the total salaries for
Directors, Supervisors and Senior Management who
received emoluments or allowances from the Company
amounted to RMB3,088,600 (tax inclusive).
7.4 PERSONNEL MOVEMENT OF DIRECTORS, SUPERVISORS AND SENIOR MANAGEMENT
Name Position Movement Reasons of movement
Hu Shunliang Secretary to the Board
(Company Secretary)
Resignation Reached age of being non-
management
Tian Jun Deputy General Manager Appointment Proposal of the General
Manager
Zhang Wenyang Deputy General Manager Appointment Proposal of the General
Manager

Maanshan Iron & Steel Company Limited2016 Annual Report
67
VII. Directors, Supervisors, Senior Management and Employees (Continued)
7.5 THE COMPANY WAS NEVER PUNISHED BY SECURITIES REGULATORS IN RECENT THREE YEARS
7.6 EMPLOYEES IN THE PARENT COMPANY AND ITS MAJOR SUBSIDIARIES
(1) Employees
The number of current employees of the parent company 27,054
The number of current employees of the major subsidiaries 5,052
Total number of current employees 32,106
The number of resigned or retired staff for whom the parent and
the major subsidiaries need to pay the expenses 20,278
Professional constitution
Profession category
Number of
staff of
profession
constitution
Production Line 26,063
Sales representative 465
Technician 2,985
Financial staff 247
Administrative Staff 2,346
Total 32,106
Education
Number
of staff
Educational level
Postgraduate 520
Graduate 3,884
Junior College 6,852
Vocational secondary or below 20,850
Total 32,106

Maanshan Iron & Steel Company Limited2016 Annual Report
68
VII. Directors, Supervisors, Senior Management and Employees (Continued)
(2) Remuneration policy
The Company has fully implemented the Administrative Measures for Optimizing the Total Wage
of Human Resources, and established the model of the basic salary, allowance and bonus
for targeted employees of each unit. The Company increased the total wages for labor and
their substitutes and approved the basic salary and allowance (including wages for back up
personnel) for staff other than the targeted employees. Appraisal which determined income was
strictly based on performance while the total amount of bonus was linked to annual operational
target issued by the Company. Each unit established its internal performance assessment
method and implemented across different positions in various levels. The remuneration of the
Company’s mid-level and senior management, senior technical director, chief technician, and
delegated staff were paid by annual salary which was distributed according to the fulfilment of
the Company’s annual operational target and the appraised results at the year-end. Through
incentive leveraged from the salary, productivity of employees and effectiveness would be
enhanced.
(3) Training program
The Company makes full use of external and internal training resources to provide training
opportunities for the growth of employees of different professions. In 2016 the Company
launched 188 training activities, with a total of 32,306 employees attending the activities.

Maanshan Iron & Steel Company Limited2016 Annual Report
69
VIII. Corporate Governance
In accordance with the requirements of relevant laws and regulations, the Company has set up a check-
and-balance corporate governance structure, consisting of the shareholders’ general meeting, the Board,
the Supervisory Committee and the General Manager. The division of work and responsibilities among the
shareholders’ general meeting, the Board, the Supervisory Committee and the General Manager were clear
and unambiguous.
During the reporting period, the Company continued to commit itself to the standard operation and improved
its corporate governance and enhanced the fundamental system. Pursuant to the requirements of the CSRC,
the Board amended the “Articles of Association” and “Administrative Measures of External Guarantee”,
formulated the “Management System of Suspension and Exemption of Information Disclosure”, and
implemented and standardized information disclosure.
8.1 CORPORATE GOVERNANCE REPORT
In 2016, the Company has complied with all the requirements of the Code on Corporate Governance
(the “Code”) as set out in Appendix 14 of the Hong Kong Listing Rules. The information is summarized
as follows:
1 DIRECTORS
Directors and the composition of the Board
The eighth session of the Board of the Company comprised seven Directors, of whom two were
Executive Directors and five were Non-executive Directors. Among the Non-executive Directors,
three of them were Independent Directors, accounting for three-seventh of the members of the
Board.
VIII. Corporate Governance

Maanshan Iron & Steel Company Limited2016 Annual Report
70
VIII. Corporate Governance (Continued)
The Executive Directors and two Non-Executive Director of the Company are veterans in
the iron and steel industry. They are experienced in the production, operation and works
construction, and are capable of making rational decisions on the matters to be resolved by
the Board. Among the three Independent Directors, Mr. Qin Tongzhou is the member of the
Chinese Institute of Certified Public Accountants (CICPA), the CFO of China Fire &Security
Group Inc. with years of experience in the accounting profession; Ms. Yang Yada is professor,
master instructor and Dean of School of Management of Anhui University of Technology, who
is knowledgeable in corporate management. Mr. Liu Fangduan is a second-grade lawyer
and currently serves as supervisor at Anhui Xingwan Law Firm, with extensive experience
in the legal profession. These independent directors have every ability to evaluate internal
control and review financial reports. Directors are fully competent for evaluating internal
control and reviewing financial statements. The composition of the Board fully complied with
the requirements of the relevant laws, regulations and regulatory documents in the PRC and
overseas. The names of all Directors were published in the Company’s correspondence and
specifications were made to Independent Directors.
During the reporting period, as far as the Board is aware of, there were no relationships,
including relationships with respect to finance, business, family aspects or other relevant
relationship, existing among members of the Board (including Chairman and General Manager)
that were required to be disclosed.
All of the Directors of the Company had confirmed in written form that they had complied with
the requirements stipulated by the Model Code for Securities Transactions by Directors of
Listed Companies in Appendix 10 of the Hong Kong Listing Rules.
The Company received the independence confirmation letters from the three Independent
Directors, which were submitted in accordance with Rule 3.13 of Chapter 3 “Authorized
Representatives, Directors, Board Committees and Company Secretary” in the Hong
Kong Listing Rules. The Board of the Company was therefore of the opinion that the three
Independent Directors were all independent.
Chairman and General Manager
The positions of the Company’s Chairman and General Manager are assumed by different
individuals.
The Chairman is the authorized representative of the Company, and shall be elected or
removed by a simple majority of all Directors in the Board. The Chairman is responsible for
corporate planning and strategic decisions, leading the work of the Board, ensuring that the
Board will consider all matters involved in an appropriate manner, and facilitating an effective
operation of the Board.

Maanshan Iron & Steel Company Limited2016 Annual Report
71
The Chairman is entitled to chair the shareholders’ general meetings, to convene and chair
Board meetings, to review the implementation of resolutions by the Board, and to sign the
issue of the Company’s securities and other important documents. With the authorization by
the Board, the Chairman may convene the shareholders’ general meetings. Between sessions
of the Board meetings, the Chairman shall give guidance to the major business activities of
the Company. In the event of force majeure, the Chairman is authorized to adjudicate on and
dispose of the affairs of the Company.
The General Manager is appointed or removed by the Board, and shall be accountable to the
Board. The General Manager leads the Management, and is responsible for the usual course
of operation in production and management, and organizes the implementation of various
resolutions by the Board. The General Manager shall regularly report to the Board or the
Supervisory Committee on the signing and execution of the Company’s material contracts, as
well as the application of funds and profit and loss situation pursuant to the requirements of the
Board or the Supervisory Committee.
Non-executive Directors
The term of office of the Company’s Non-executive Directors (including Independent Directors)
is three years. Please refer to Section VII “Directors, Supervisors, Senior Management,
Employees” for further details of incumbency.
In order to protect the legal rights and interests of the minority shareholders and the
stakeholders, the Company established the “Work System of Independent Directors”. The
system specifies in detail the appointment criteria and nomination procedures of Independent
Directors and working conditions that the Company shall provide to Independent Directors. It
also stipulates that Independent Directors shall issue independent opinions on matters such as
connected transactions and external guarantees.
Duties and authorities of the Board and the Management
The Board performs the duties and authorities conferred by the laws and regulations as well as
the Articles of Association, mainly including:
– To convene the shareholders’ general meetings and to execute the resolutions of the
shareholders’ general meetings;
– To decide on the annual operating plans and key investment proposals of the Company;

Maanshan Iron & Steel Company Limited2016 Annual Report
72
VIII. Corporate Governance (Continued)
– To formulate the financial budget, the profit appropriation plan, the fundamental
management system and substantial acquisitions or disposal plans;
– To decide on the establishment of specialized committees, and appointment and
removal of their persons-in-charge;
– To appoint or remove the Company’s General Manager, and to appoint or dismiss
the Company’s Senior Management such as Deputy General Managers and Financial
Officers-in-charge pursuant to the General Manager’s nomination;
– To appoint or remove the Secretary to the Board;
– To manage information disclosure matters of the Company;
– To propose to the shareholders’ general meeting the re-appointment or change of the
Company’s auditors;
– To receive the report from the Company’s General Manager and to review the work of
the General Manager;
– To approve the Company’s external investments, leasing of assets, pledges of assets
and other guarantees, entrustments on operations and trust management within the limit
as stipulated in the Articles of Association;
– There are four committees under the Board, namely the Audit Committee, the
Remuneration Committee, the Nomination Committee and the Strategic Development
Committee. Please refer to “4, 5, 6 and 7” of this section for the major duties of the
committees.
The Company’s Management performed their major responsibilities in accordance with the
duties and authorities conferred by the Articles of Association, mainly including:
– To organize the implementation of the Company’s annual operating plans and
investment proposals;
– To propose the establishment schemes of the Company’s internal management
structure;
– To propose the Company’s fundamental management system;

Maanshan Iron & Steel Company Limited2016 Annual Report
73
– To formulate the Company’s basic constitutions;
– To appoint or remove the officers-in-charge other than those who are appointed or
removed by the Board;
– To decide on the rewards and penalty, promotions and demotions, increase and
decrease of salaries, appointments, recruitment or removal and termination of the
Company’s staff;
– To deal with the important external businesses of the Company on its behalf;
– To propose the convening of extraordinary Board meetings.
The Board Meeting
The Board convenes four regular meetings annually, and notifies Directors about the time and
date, location and agenda of a regular Board meeting 14 days in advance so as to ensure
all Directors could attend the meetings. All Directors are given opportunities to raise matters
for discussion and such matters will be included in the agendas of the regular meetings. If
required by the Directors, the Management is able to provide adequate information timely to the
Directors and such information can help the Directors make appropriate decisions. All or most
of the Directors shall attend each regular Board meeting in person. When the Board vote on
connected transactions, the connected Directors shall abstain from voting and the connected
transactions shall be approved by the non-connected Directors. All Directors are entitled to and
have the opportunity to access to the minutes of the Board meetings.
The Secretary to the Board is responsible for organizing and preparing the Board meetings,
and assists the Chairman to ensure that the procedures for the meetings comply with the
requirements of relevant laws, regulations and the regulatory documents.
Maanshan Iron & Steel Company Limited2016 Annual Report
74
VIII. Corporate Governance (Continued)
2 REMUNERATION OF THE DIRECTORS, SUPERVISORS AND SENIOR MANAGEMENT
Directors’ remuneration
The annual aggregate remuneration of all Directors of the eighth session of the Board of
the Company shall not exceed RMB2.20 million (tax inclusive) during their term of office.
Each of the Independent Directors receives a fixed annual remuneration of not more than
RMB80,000 (tax exclusive) from the Company. The Company has adopted an annual salary
system for the remaining Directors who receive remuneration from the Company. Taking
into account the performance of the Company and the Directors’ personal contribution, the
Remuneration Committee of the Board of the Company proposes the appraisal and distribution
opinion according to the “Remuneration Assessment Method (Trial) for Directors and Senior
Management” and the annual salaries will be implemented accordingly subject to the Board’
approval. No director may determine his/her own remuneration.
Supervisors’ remuneration
The annual aggregate remuneration of all Supervisors of the eighth session of the Company’s
Supervisory Committee shall not exceed RMB1.4 million (tax inclusive) during their term of
office. Each of the Independent Supervisors receives a fixed annual remuneration of not
more than RMB60,000 (tax exclusive) from the Company. As for the remaining Supervisors
who receive annual remunerations from the Company, their annual remunerations shall be
determined by the Supervisory Committee according to the appraisal results within the annual
aggregate remuneration for Supervisors approved by the shareholders’ general meeting, and
such remuneration shall be reported to the annual general meeting.
Senior Management’s remuneration
The Company has adopted an annual salary system for the Senior Management. Taking into
account the performance of the Company and the Senior Management member’s personal
contribution, the Remuneration Committee of the Board of the Company proposes the
appraisal and distribution opinion according to the “Remuneration Assessment Method (Trial)
for Directors and Senior Management” and the annual salaries of the Senior Management will
be implemented accordingly subject to the Board’s approval.

Maanshan Iron & Steel Company Limited2016 Annual Report
75
3 NOMINATION OF DIRECTORS
A new session of the Board of the Company shall be elected every three years. The term of
office of all Directors is the same as the term of office of the Board for such session. Upon the
expiry of the session, re-election must be held.
Candidates for Directors are nominated by the Company’s Board, the Supervisory Committee
or shareholder(s) severally or jointly holding more than 5% of the issued shares of the Company.
Candidates for Independent Directors are nominated by the Company’s Board, the Supervisory
Committee or shareholder(s) severally or jointly holding more than 1% of the issued shares of
the Company.
The nomination of a Director by the Company has taken into adequate consideration of the
nominee’s situation including his/her career, academic background, job title, detailed work
experience and all concurrent posts, with the consent of the nominee obtained in advance.
With respect to the nomination of an Independent Director, the Board will give its opinion on
the nominee’s qualifications and independence of holding the position of Independent Director.
The nominee will also issue a public statement indicating that there is no relationship between
him/her and the Company that may affect his/her independent and objective judgment. Prior
to convening the relevant shareholders’ general meeting, the Company will submit the related
materials about the candidates for Independent Directors to the SSE.
4 AUDIT COMMITTEE
The Audit Committee of the eighth session of the Board of the Company (“Audit Committee”)
comprises Independent Directors Mr. Qin Tongzhou, Ms. Yang Yada and Mr. Liu Fangduan. Mr.
Qin Tongzhou is the Chairman of the Committee. The major duties of the Committee are:
– To propose the appointment or change of external auditors;
– To monitor the Company’s internal audit system and its implementation;
– To be responsible for the communication between the internal and external auditors;
– To review the Company’s financial information and its disclosure;
– To review the Company’s internal control system.
Maanshan Iron & Steel Company Limited2016 Annual Report
76
VIII. Corporate Governance (Continued)
Furthermore, in order to fully leverage on the role of the Audit Committee, the Company has
also specifically worked out “Annual Report Work Rules of the Audit Committee”, which has
streamlined the duties of the Audit Committee in the process of the preparation of annual report
and the disclosure thereof.
In 2016, the Committee held four meetings. Details of the meetings in 2016 are as follows:
1. Discussed the unaudited 2015 financial statement with the senior management and
the financial department, to scrutinize issues concerned, to approve submission of the
financial statement for audit by external accounting firm, and to determine the working
schedule for the audit of the financial statement together with the accounting firm.
2. Discussed the audited 2015 financial statement with the Company’s audit department
and the external accounting firm to generate written opinion on the statement.
3. Debriefed the internal control work on a periodic basis to urge improvement.
4. Reviewed the audited 2015 financial statement, discussed with the Company’s audit
department and external accounting firm on the statement, and concluding that the
Company complied with the Enterprise Accounting Rules in all major aspects and made
full information disclosure without major omission.
5. Having considered and approved the summary report on the Company’s auditing work
in 2015 conducted by the external auditors.
6. Approved the payment of RMB4.985 million to Ernst & Young Hua Ming LLP in 2015,
which included an annual audit fee of RMB4.4 million (including an internal control audit
fee of RMB600,000) and a fee of RMB585,000 for the agreed-upon procedures on
interim financial statements.
7. Considered and agreed that Ernst & Young Hua Ming LLP would be re-appointed as the
Company’s auditors for 2016.

Maanshan Iron & Steel Company Limited2016 Annual Report
77
8. Reviewed and approved the related party transactions for 2015 between the Company,
its affi l iate Magang (Group) Holding and its affi l iates, and concluding that the
transactions were made in the daily business under normal business terms or no inferior
than the terms for independent providers (or by independent providers), the transactions
were carried out in line with relevant terms, the terms were fair, reasonable and met the
best interests of the Company and its shareholders.
9. Acquired an understanding from the Company’s management and the external auditors
of the Company’s provision of guarantees for external parties as at 31 December 2015,
reviewed the relevant information and was of the opinion that: The Company did not
provide any guarantee for external companies or subsidiaries.
10. Considered and approved the Report on the Discharge of Duties by the Audit Committee
of the Board of Directors of Maanshan Iron & Steel Co., Ltd. for 2015.
11. Reviewed the Company’s unaudited first quarterly financial statement of 2016 and was
of the opinion that the Company had complied with the requirements of the Accounting
Standards for Business Enterprises in every material respect and had made adequate
disclosure without any material omissions.
12. Reviewed the Company’s unaudited interim financial statement of 2016 and was of
the opinion that the Company had complied with the requirements of the Accounting
Standards for Business Enterprises in every material respect and had made adequate
disclosure without any material omissions.
13. Reviewed the Company’s unaudited third quarterly financial statement of 2016 and was
of the opinion that the Company had complied with the requirements of the Accounting
Standards for Business Enterprises in every material respect and had made adequate
disclosure without any material omissions.
All the procedures for convening and holding the Committee’s meetings as well as voting and
resolutions thereat were in compliance with the provisions of relevant laws and regulations,
the Articles of Association and the Work Rules of the Audit Committee. In 2016, all the
members of the Committee faithfully fulfilled their confidentiality obligations towards the matters
discussed at the meetings of the Committee in accordance with the relevant rules without any
unauthorized disclosure of relevant information.

Maanshan Iron & Steel Company Limited2016 Annual Report
78
VIII. Corporate Governance (Continued)
5 REMUNERATION COMMITTEE OF THE BOARD
The Remuneration Committee of the eighth session of the Board of the Company comprises
Independent Directors Mr. Liu Fangduan, Mr. Qin Tongzhou, and Ms. Yang Yada. Mr. Liu
Fangduan is Chairman of the Committee. The major duties of the Committee are:
– To recommend to the Board with respect to the remuneration policies for all Directors
and Senior Management of the Company, and the procedures of formulating such
policies in a proper and transparent manner;
– To review the remuneration of the Directors and Senior Management in accordance with
the corporate objectives formulated by the Board;
– To review the compensation to be paid to the Directors or Senior Management with
respect to their removal or appointment;
– To ensure that none of the Directors nor their associates could decide on their own
remuneration;
– Other responsibilities as delegated by the Board.
In 2016, the Remuneration Committee of the eighth session of the Board held one meeting. All
members attended the meeting in person. The details of the meeting are as follows:
1. Reviewed remuneration of directors and senior management for 2015;
2. Reviewed the Remuneration Committee’s Report on Discharge of Duties for 2015.
All the procedures for convening and holding the Remuneration Committee’s meetings as
well as voting and resolutions thereat were in compliance with relevant laws and regulations,
the Articles of Association and the Work Rules of the Remuneration Committee. When the
remuneration of directors and senior management staff were discussed at the meetings, none
of the directors was involved in deciding their own remuneration. All the members of the
Committee faithfully fulfilled their confidentiality obligations towards the matters discussed at
the meetings of the Committee in accordance with the relevant rules without any unauthorized
disclosure of relevant information.

Maanshan Iron & Steel Company Limited2016 Annual Report
79
6 NOMINATION COMMITTEE
The Nomination Committee of the eighth session of the Board of the Company comprises
Independent Directors Ms. Yang Yada, Mr. Qin Tongzhou, Mr. Liu Fangduan and Chairman Mr.
Ding Yi, with Ms. Yang Yada as Chairman of the Committee. The major duties of the Committee
are:
– To regularly evaluate the structure and number of members of the Board, and the skills,
knowledge and experience needed for Directors based on the shareholding structure
and development strategies of the Company, and to make recommendations to the
Board on any prospective changes;
– To consider and make recommendations on the selection criteria and procedures for
Directors, General Manager and Secretary to the Board;
– To seek candidates for Directors, General Manager and Secretary to the Board, and to
nominate the relevant candidates for Directors, General Manager and Secretary to the
Board according to the Company’s needs after reviewing their qualifications and abilities,
and makes recommendations to the Board in this regard;
– To examine the independence of Independent Directors;
– To make recommendations to the Board on matters related to the appointment and
reappointment of Directors, and on succession plans for Directors (including Chairman),
General Manager and Secretary to the Board.
In 2016, the Nomination Committee held one meeting. All committee members presented each
meeting in person. The meeting was chaired by Ms. Yang Yada. Agenda of the meeting was as
follows: reviewed the Nomination Committee’s Report on Discharge of Duties for 2015.
The procedures for convening and holding all the meetings of the Committee as well as the
voting and resolutions made thereat were in compliance with the requirements of relevant laws
and regulations, the Articles of Association and the Work Rules of the Nomination Committee
of the Board of Directors. All members of the Committee faithfully fulfilled the obligation of
confidentiality in accordance with the relevant rules towards the matters discussed at the
meetings of the Committee without any unauthorized disclosure of relevant information.

Maanshan Iron & Steel Company Limited2016 Annual Report
80
VIII. Corporate Governance (Continued)
7 STRATEGIC DEVELOPMENT COMMITTEE
The Strategic Development Committee of the eighth session of board of directors of the
Company consists of Chairmen Mr. Ding Yi, and independent directors Mr. Qin Tongzhou, Ms.
Yang Yada and Mr. Liu Fangduan, and was chaired by Mr. Ding Yi. The Committee mainly has
the following duties:
– Research and make suggestions on long-term development strategy and important
investment decisions of the Company;
– Research and make suggestions on long- and medium-term planning for strategic
development of the Company;
– Monitor the implementation of strategic development plan of the Company and report
any significant deviation from the development strategy to the Board of Directors;
– Research material changes in economic situation, industrial policies, technological
advances, industry conditions, and force majeure, and make suggestions to the
Company as to adjustments to its development strategy;
– Research and make suggestions on other material issues affecting development of the
Company;
– Other duties granted by the Board of Directors
In 2016, the Strategic Committee of the Board of Directors totally held two meetings, with all
committee members attending in person. Agenda of the meeting was as follows: 1) reviewed
the 2015 Duty Performance Report of the Strategic Development Committee; 2) received
reports on the Company’s preparation of the “13th Five Year Development Plan”; 3) considered
the Company’s “13th Five Year Development Plan”.
All convening procedures of meetings held by the Strategic Committee complied with relevant
laws, regulations, Articles of Association and Code of Practice of the Strategic Committee of
the Board of Directors. All committee members truthfully performed their duty of confidentiality
for reports heard in the meeting according to relevant regulations; no unauthorized disclosure of
related information happened.

Maanshan Iron & Steel Company Limited2016 Annual Report
81
8 AUDITORS’ REMUNERATION
During the year, Ernst & Young Hua Ming LLP was appointed as the auditors of the Company
and had issued audit report on the attached financial statements prepared under the PRC
Accounting Standards and internal control audit report. The remuneration for Ernst & Young
Hua Ming LLP amounted to RMB5,185,000, including annual audit fee (exclusive of taxes) of
RMB4,600,000 (including internal control audit fee of RMB600,000) and the fees for agreed
upon procedures on interim financial statements of RMB585,000 (exclusive of taxes). The
aforementioned audit fees, agreed-upon procedures fees and other professional services
were already inclusive of disbursements incurred by the auditors. Meal and accommodation
expenses incurred by auditors while performing professional services at the Company were
borne by the Company.
As at 31 December 2016, Ernst & Young Hua Ming LLP has provided auditing services to the
Group for 23 consecutive years. Ms. An Xiuyan and Ms. Wu Xiaofang were the certified public
accountants who have signed the Company’s 2016 auditors’ reports. Ms. An Xiuyan has
provided auditing services to the Company for two consecutive years, while Ms. Wu Xiaofang
has provided auditing services to the Company for the first time.
In addition, Ernst & Young Tax Services Limited provided profit tax reporting services in Hong
Kong for the Company for RMB35,000, which was not included in the scope of auditing.
9 COMMUNICATION WITH SHAREHOLDERS
Effective communication
The Board maintains a smooth communication channel with the shareholders, striving
to maintain communication with the shareholders and encouraging them to attend the
shareholders’ general meetings.
During the reporting period, the Company stated clearly in the 2015 annual general meeting
notice that A shareholders holding the Company’s A shares as at the market closing in the
afternoon of the respective register dates and registered in the register of members maintained
by the Shanghai branch of CSDCC, and H shareholders holding the Company’s H-shares
on the same date and registered in the register of members maintained by the Hong Kong
Registrars Limited were eligible for attending the respective shareholders’ general meetings
after completing the registration procedures for attending the meetings.
During the reporting period, the Chairman attended the shareholders’ general meeting in
person and served as the chairman of the meetings. At the shareholders’ general meetings, the
chairman of the meetings proposed individual resolutions for each independent matter.

Maanshan Iron & Steel Company Limited2016 Annual Report
82
VIII. Corporate Governance (Continued)
Voting by poll
The Company states clearly in the Articles of Association that the voting at shareholders’
general meetings shall be conducted by poll. Shareholders (including proxies) exercise their
voting rights according to the number of shares with voting rights they represent and each
share is entitled to the right of one vote. According to the results of voting by poll, the chairman
of the meeting shall announce the approval of the proposed resolution at the meeting and shall
record such items in the meeting minutes as the final proof. If the chairman of the meeting has
any doubts on the resolutions submitted for approval, he/she may conduct a count of votes.
If the chairman of the meeting does not conduct a count of votes, attended shareholders or
proxies who disagree with the results announced by the chairman of the meeting are entitled to
request a count of votes immediately after the announcement of voting results. The chairman
of the meeting shall immediately conduct a count of votes. If a count of votes takes place at
a shareholders’ general meeting, the vote-counting results shall be recorded in the meeting
minutes.
The minutes of the meeting, together with the signed shareholder attendance book and the
proxy forms of proxies attending the meeting shall be kept in the premises of the Company.
Shareholders may view copies of the shareholders’ general meeting minutes for free during
office hours. If any shareholder requests the Company for copies of the relevant meeting
minutes, the Company can send such copies within seven days upon receiving the relevant
reasonable fees.
10 OTHER PROVISIONS AS SET OUT IN THE CODE APART FROM THE ABOVE
During the reporting period, the Company’s Directors acknowledged their responsibilities
for preparing the Company’s accounts. Ernst & Young Hua Ming LLP, the auditors, made a
statement in the Auditors’ Report on their responsibilities for reporting on the Company’s
accounts.
As Ernst & Young Hua Ming LLP has developed a thorough understanding of the Company
throughout the years, and their work has been conscientious and detail-oriented, the Audit
Committee under the Board recommended reappointing the firm as the auditors for the
Company for year 2016. The Board did not have any contrary opinion and the relevant
resolutions were considered and approved at the 2015 annual general meeting held on 15 June
2016.

Maanshan Iron & Steel Company Limited2016 Annual Report
83
In order to regulate its management on people with access to insider information, the Company
has formulated the “Registration and Management System for People with Access to the
Company’s Insider Information” and amended regularly. During the reporting period, as far as
the Board was aware of, the Company did not discover any trading in the Company’s shares
by insiders using insider information before the Company disclosed any material price-sensitive
information; nor was there any investigation or rectification carried out by the regulatory
departments. As such, the above-mentioned system was executed effectively.
No significant variance exists between the company management and relevant requirements of
CSRC.
8.2 SEPARATION OF THE COMPANY AND CONTROLLING SHAREHOLDERS IN PERSONNEL, ASSETS, FINANCE, ORGANIZATION AND BUSINESS:
a) With respect to personnel, the Company’s production, technical, financial and sales personnel
are independent of controlling shareholders; general manager, deputy general manager and
other senior managers are paid by the Company.
b) With respect to assets, the Company has its separate production system, auxiliary system
and supporting facilities and has separate industry property, trademark and non-patented
technologies; purchasing and sales systems are also independently owned by the Company.
c) With respect to finance, the Company has an independent financial department, and has
established independent accounting system and comprehensive financial management system.
d) With respect to organization, the Company has established sound organization system;
the board of directors and the board of supervisors operate separately, while other internal
organizations and functional departments of controlling shareholders have subordination
relationships.
e) With respect to business, the Company has independent and complete business operation and
independent management ability; controlling shareholders haven’t carried out and can’t carry
out horizontal competition.

Maanshan Iron & Steel Company Limited2016 Annual Report
84
VIII. Corporate Governance (Continued)
8.3 SHAREHOLDERS’ GENERAL MEETING
Session of Meeting
Date of
Meeting Specified Website for Publishing Resolutions
Publishing Date of
Resolution
2015 Annual General
Meeting
2016-6-15 http://static.sse.com.cn/disclosure/listedinfo/announcement/c/
2016-06-16/600808_20160616_1.pdf
2016-6-16
8.4 PERFORMANCE OF DIRECTORS
(1) Attendance of directors in the board meetings and shareholders’ general meeting
Name of
Director
Independent
Director
Required
attendance
during the
year
Attendance in
person
Attendance
by way of cor-
respondence
Attendance
by proxy Absence
Two
consecutive
personal
absence
In the General
Meeting
Attendance
Ding Yi No 7 7 0 0 0 No 1
Qian Haifan No 7 6 0 1 0 No 1
Su Shihuai No 7 6 0 1 0 No 0
Ren Tianbao No 7 7 0 0 0 No 1
Qin Tongzhou Yes 7 6 0 1 0 No 1
Yang Yada Yes 7 7 0 0 0 No 0
Liu Fangduan Yes 7 7 0 0 0 No 1
No. of The Board Meeting 7
of which: convened on-site 5
Convened by way of correspondence 0
Convened by way of combination of on-site and correspondence 2
(2) The independent directors have no objection toward matters of the Company.

Maanshan Iron & Steel Company Limited2016 Annual Report
85
8.5 IF ANY OBJECTIONS EXIST IN THE SIGNIFICANT COMMENTS AND SUGGESTIONS RAISED BY SPECIAL COMMITTEE UNDER THE BOARD OF DIRECTORS WHILE PERFORMING THE RESPONSIBILITY WITHIN THE REPORTING PERIOD, SPECIFIC CIRCUMSTANCE SHALL BE DISCLOSED.
The Special Committee under the board of directors has no objection toward matters within the
reporting period.
8.6 SUPERVISORY COMMITTEE’S EXPLANATION ON IDENTIFICATION OF RISKS IN THE COMPANY
The Supervisory Committee found no risks in the Company.
8.7 ESTABLISHMENT AND IMPLEMENTATION OF APPRAISAL MECHANISM AND INCENTIVE MECHANISM FOR THE SENIOR MANAGEMENT DURING THE REPORTING PERIOD
The Company has adopted an annual salary system for the Senior Management. Taking into account
the performance of the Company and the individual contribution of Senior Management members,
the Remuneration Committee of the Board of the Company proposes the appraisal and distribution
opinion according to the “Remuneration Assessment Method (Trial) for Directors and Senior
Management” and the annual salaries of the Senior Management will be implemented accordingly
subject to the Board’s approval.
8.8 WHETHER TO DISCLOSE INTERNAL CONTROL SELF-ASSESSMENT
Report on Internal Control Assessment of the Company in 2016 has been discussed and approved by
Twenty-Sixth Session of the Eighth Board of Directors of the Company on March 29, 2017, confirming
that the Company’s internal control in 2016 is effective. Search the follow websites for the report on
the internal control assessment: www.sse.com.cn and www.hkex.com.hk.
8.9 PRESENTATION OF RELEVANT CONDITIONS CONCERNING THE AUDIT REPORT ON INTERNAL CONTROL
Ernst & Young Hua Ming LLP has audited the effectiveness of internal control related to the financial
report as of 31 December 2016 and issued unqualified audit report on internal control. Search the
follow websites for auditing report on internal control: www.sse.com.cn and www.hkex.com.hk.
Whether to disclose audit report on internal control: Yes

Maanshan Iron & Steel Company Limited2016 Annual Report
86
IX. Audited Financial Statements
CONTENTSPages
INDEPENDENT AUDITOR’S REPORT 87
AUDITED FINANCIAL STATEMENTS
CONSOLIDATED STATEMENT OF FINANCIAL POSITION 93
CONSOLIDATED STATEMENT OF PROFIT OR LOSS 96
CONSOLIDATED STATEMENT OF CHANGES IN EQUITY 98
CONSOLIDATED STATEMENT OF CASH FLOWS 100
STATEMENT OF FINANCIAL POSITION 102
STATEMENT OF PROFIT OR LOSS 104
STATEMENT OF CHANGES IN EQUITY 105
STATEMENT OF CASH FLOWS 107
NOTES TO FINANCIAL STATEMENTS 109
SUPPLEMENTARY INFORMATION APPENDICES
1. Breakdown of non-recurring gains or losses 294
2. Return on net assets and earnings per share 295
Note: The notes to the financial statements with “*” are disclosed in accordance with the Rules Governing the Listing of
Securities on The Stock Exchange of Hong Kong Limited and the Hong Kong Companies Ordinance.
IX. Audited Financial Statements

Maanshan Iron & Steel Company Limited2016 Annual Report
87
Independent Auditor’s Report
Ernst & Young Hua Ming (2017) Shen Zi No. 60438514_A01
To the shareholders of Maanshan Iron & Steel Company Limited
1. OPINION
We have audited the financial statements of Maanshan Iron & Steel Company Limited, which are
comprised of the consolidated and company statements of financial position as of 31 December
2016, and the consolidated and company statements of profit or loss, statements of changes in equity
and statements of cash flows for the year then ended, and the notes to the financial statements.
In our opinion, the accompanying financial statements of Maanshan Iron & Steel Company Limited
present fairly, in all material respects, the consolidated and company financial position of Maanshan
Iron & Steel Company Limited as of 31 December 2016 and their financial performance and cash
flows for the year then ended in accordance with Accounting Standards for Business Enterprises.
2. BASIS FOR OPINION
We conducted our audit in accordance with China Standards on Auditing (“CSAs”). Our responsibilities
under those standards are further described in the Auditor’s responsibilities for the audit of the
financial statements section of our report. We are independent of Maanshan Iron & Steel Company
Limited in accordance with the Code of Ethics for Chinese Certified Public Accountants, and we
have fulfilled our other ethical responsibilities. We believe that the audit evidence we have obtained is
sufficient and appropriate to provide a basis for our audit opinion.
3. KEY AUDIT MATTERS
Key audit matters are those matters that, in our professional judgement, were of most significance
in our audit of the financial statements of the current period. These matters were addressed in the
context of our audit of the financial statements as a whole, and in forming our opinion thereon, and
we do not provide a separate opinion on these matters. For each matter below, our description of how
our audit addressed the matter is provided in that context.
We have fulfilled the responsibilities described in the Auditor’s responsibilities for the audit of the
financial statements section of our report, including in relation to these matters. Accordingly, our
audit included the performance of procedures designed to respond to our assessment of the risks of
material misstatement of the financial statements. The results of our audit procedures, including the
procedures performed to address the matters below, provide the basis for our audit opinion on the
accompanying financial statements.
Independent Auditor’s Report

Independent Auditor’s Report (Continued)
Maanshan Iron & Steel Company Limited2016 Annual Report
88
3. KEY AUDIT MATTERS (CONTINUED)
Key audit matter How our audit addressed the key audit matter
Impairment of property, plant and equipment
Prope r t y, p l an t and equ ipmen t ( “PPE” )
amounting to RMB35,522,601,715 as of 31
December 2016, comprised the largest portion
of assets representing 53.6% of the total assets
and 84.9% of the long-term assets in the
consolidated financial statements. Management
assessed impairment indicators for these items
of PPE. For those with impairment indicators
identified, management performed impairment
testing by determining the recoverable amounts
of the cash generating units (“CGUs”) that the
PPE belong to and comparing the recoverable
amount with the carrying amount of the PPE.
The estimation of the recoverable amounts
involved estimation of the discounted future
cash flows which required significant judgement
and estimation, specifically the future selling
price, production costs, operating expenses,
discount rate and etc. Due to the inherent
uncertainty in forecasting and discounting the
future cash flows, as the basis of recoverable
amount, impairment testing of PPE involves key
judgement and estimation.
The disclosures related to the impairment of
long-term assets of Maanshan Iron & Steel
Company Limited are disclosed in Notes
III.14, III.18, III.30 and V.14 to the financial
statements.
We evaluated management’s assumptions in
determining the recoverable amounts of the
CGUs that the PPE belong to, specifically the
future price of steel by considering the forecast
steel price and market trend as provided by
third party industry analysts. We also evaluated
and challenged other key assumptions such as
production volume, production costs and operating
expenses by comparing the key assumptions to
historical data, existing supporting documentation,
ev idence obta ined subsequent to year-end,
and industry forecasts. We involved our internal
valuation specialists to assist us in evaluating
the methodology and discount rate used in the
calculation of value in use. In addition, we tested
the design and implementation of related internal
controls in place over the asset impairment
testing. We also focused on the adequacy of the
disclosures regarding the impairment of PPE in the
financial statements.

Maanshan Iron & Steel Company Limited2016 Annual Report
Independent Auditor’s Report (Continued)
89
Recognition of deferred tax assets
As of 31 December 2016, the management h a d r e c o r d e d d e f e r r e d t a x a s s e t s o f RMB348,095,783 in the consolidated financial statements resulting from temporary differences to the extent that it is probable that future taxable profits will allow the deferred tax assets to be recovered. The probability of recovery is impacted by uncertainties regarding the timing and level of future taxable profits together with tax planning strategies and the expiration dates of the tax losses.
The disclosures related to deferred tax assets of Maanshan Iron & Steel Company Limited are disclosed in Notes III.24, III.30, V.17 and V.52 to the financial statements.
We evaluated management’s assumptions in determining the future available taxable profits, specifically the future price of steel, and compared this with forecasts issued by third party industry analysts. We involved our tax specialists to assist us in evaluating the technical merits from a tax perspective of management’s analysis. In addition, we tested the design and implementation of related internal controls over the recognition of deferred tax. We also focused on the adequacy of the disclosures regarding deferred tax assets in the financial statements.
Impairment of inventories
A s o f 31 D e c e m b e r 2016 , i n v e n t o r i e s amounted to RMB10,548,061,832 in the consolidated financial statements. Management tests the impairment of inventor ies on a quarterly basis. If the cost is in excess of the net realisable value, impairment of inventories is recognised. Net real isable value is the estimated selling price on normal business terms deducted by the estimated costs to completion, the estimated selling expenses and related taxes. The estimation made by management required significant judgement and estimation, specifically the future selling price, production costs, operating expenses, related taxes and etc. As the impairment testing process is complex, the annual impairment testing of inventories involves key judgements and estimation.
The disclosures related to the impairment of inventories of Maanshan Iron & Steel Company Limited are disclosed in Notes III.11 and V.7 to the financial statements.
We evaluated management’s related parameters for impairment testing of inventories, specifically the future selling price, production costs, operating expenses, related taxes and etc. In addition, we tested the design and implementation of related internal controls over impairment test ing of inventories. We also focused on the adequacy of the disclosures regarding the impairment testing of inventories in the financial statements.
3. KEY AUDIT MATTERS (CONTINUED)
Key audit matter How our audit addressed the key audit matter

Independent Auditor’s Report (Continued)
Maanshan Iron & Steel Company Limited2016 Annual Report
90
4. OTHER INFORMATION INCLUDED IN THE ANNUAL REPORT
The management of Maanshan Iron & Steel Company Limited (hereinafter referred to as the
“management”) is responsible for the other information. The other information comprises the
information included in the Annual Report, other than the financial statements and our auditor’s report
thereon.
Our opinion on the financial statements does not cover the other information and we do not express
any form of assurance conclusion thereon.
In connection with our audit of the financial statements, our responsibility is to read the other
information and, in doing so, consider whether the other information is materially inconsistent with
the financial statements or our knowledge obtained in the audit or otherwise appears to be materially
misstated.
If, based on the work we have performed, we conclude that there is a material misstatement of this
other information, we are required to report that fact. We have nothing to report in this regard.
5. RESPONSIBILITIES OF THE MANAGEMENT AND GOVERNANCE FOR THE FINANCIAL STATEMENTS
Management is responsible for the preparation and fair presentation of these financial statements in
accordance with Accounting Standards for Business Enterprises, and designing, implementing and
maintaining internal control as management determines is necessary to enable the preparation of
financial statements that are free from material misstatement, whether due to fraud or error.
In preparing the financial statements, the management is responsible for assessing Maanshan Iron
& Steel Company Limited’s ability to continue as a going concern, disclosing, as applicable, matters
related to going concern and using the going concern basis of accounting unless either intend
to liquidate Maanshan Iron & Steel Company Limited or to cease operations or have no realistic
alternative but to do so.
The Governance is responsible for overseeing Maanshan Iron & Steel Company Limited’s financial
reporting process.

Maanshan Iron & Steel Company Limited2016 Annual Report
Independent Auditor’s Report (Continued)
91
6. AUDITOR’S RESPONSIBILITIES FOR THE AUDIT OF THE FINANCIAL STATEMENTS
Our objectives are to obtain reasonable assurance about whether the financial statements as a whole
are free from material misstatement, whether due to fraud or error, and to issue an auditor’s report
that includes our opinion. Reasonable assurance is a high level of assurance, but is not a guarantee
that an audit conducted in accordance with CSAs will always detect a material misstatement when it
exists. Misstatements can arise from fraud or error and are usually considered material if, individually
or in the aggregate, they could reasonably be expected to influence the economic decisions of users
taken on the basis of these financial statements.
As part of an audit in accordance with CSAs, we exercise professional judgement and maintain
professional scepticism throughout the audit. We also:
• Identify and assess the risks of material misstatement of the financial statements, whether due
to fraud or error, design and perform audit procedures responsive to those risks, and obtain
audit evidence that is sufficient and appropriate to provide a basis for our opinion. The risk of
not detecting a material misstatement resulting from fraud is higher than for one resulting from
error, as fraud may involve collusion, forgery, intentional omissions, misrepresentations, or the
override of internal control.
• Obtain an understanding of internal control relevant to the audit in order to design audit
procedures that are appropriate in the circumstances.
• Evaluate the appropriateness of accounting policies used and the reasonableness of
accounting estimates and related disclosures made by the management.
• Conclude on the appropriateness of the management’s use of the going concern basis of
accounting and, based on the audit evidence obtained, whether a material uncertainty exists
related to events or conditions that may cast significant doubt on Maanshan Iron & Steel
Company Limited’s ability to continue as a going concern. If we conclude that a material
uncertainty exists, we are required to draw attention in our auditor’s report to the related
disclosures in the financial statements according to the CSAs or, if such disclosures are
inadequate, to modify our opinion. Our conclusions are based on the audit evidence obtained
up to the date of our auditor’s report. However, future events or conditions may cause
Maanshan Iron & Steel Company Limited to cease to continue as a going concern.
• Evaluate the overall presentation, structure and content of the financial statements, including
the disclosures, and whether the financial statements represent the underlying transactions and
events in a manner that achieves fair presentation.
• Obtain sufficient appropriate audit evidence regarding the financial information of the entities or
business activities within Maanshan Iron & Steel Company Limited to express an opinion on the
financial statements. We are responsible for the guidance, supervision and performance of the
group audit. We remain solely responsible for our audit opinion.
Independent Auditor’s Report (Continued)
Maanshan Iron & Steel Company Limited2016 Annual Report
92
6. AUDITOR’S RESPONSIBILITIES FOR THE AUDIT OF THE FINANCIAL STATEMENTS (CONTINUED)
We communicate with the Governance regarding the planned scope, timing of the audit and significant
audit findings, including deficiencies worth of attention in internal control that we identify during our
audit.
We also provide the Governance with a statement that we have complied with relevant ethical
requirements regarding independence and to communicate with the Governance all relationships and
other matters that may reasonably be thought to bear on our independence, and where applicable,
related safeguards.
From the matters communicated with the Governance, we determine those matters that were of most
significance in the audit of the financial statements of the current period and are therefore the key
audit matters. We describe these matters in our auditor’s report unless law or regulation precludes
public disclosure about the matter or when, in extremely rare circumstances, we determine that a
matter should not be communicated in our report because the adverse consequences of doing so
would reasonably be expected to outweigh the public interest benefits of such communication.
Ernst & Young Hua Ming LLP An Xiu Yan (Engagement Partner)
Chinese Certified Public Accountant
Wu Xiao Fang
Chinese Certified Public Accountant
Beijing, the People’s Republic of China 29 March 2017

Maanshan Iron & Steel Company Limited2016 Annual Report
93
Consolidated Statement of Financial Position31 December 2016Renminbi Yuan
ASSETS Note V
31 December
2016
31 December
2015
CURRENT ASSETS
Cash and bank balances 1 5,312,101,041 5,142,711,482
Financial assets
at fair value through profit or loss 2 555,322,261 1,005,271,054
Bills receivable 3 3,608,459,121 4,689,129,290
Trade receivables 4 859,929,107 796,986,661
Interest receivable 4,044,939 1,600,176
Prepayments 5 925,051,274 634,407,421
Other receivables 6 127,614,834 190,348,070
Inventories 7 10,548,061,832 6,018,495,505
Financial assets purchased under agreements to resell 8 230,047,000 –
Loans and advances to customers 9 1,555,212,556 732,913,869
Other current assets 10 692,471,233 948,518,258
Total current assets 24,418,315,198 20,160,381,786
NON-CURRENT ASSETS
Available-for-sale financial investments 11 577,947,698 128,934,410
Long term equity investments 12 1,239,776,313 1,029,853,507
Investment properties 13 58,833,998 62,356,583
Property, plant and equipment 14 35,522,601,715 34,605,411,096
Construction in progress 15 2,258,191,398 4,245,762,868
Intangible assets 16 1,821,768,927 1,891,358,160
Deferred tax assets 17 348,095,783 330,407,545
Total non-current assets 41,827,215,832 42,294,084,169
TOTAL ASSETS 66,245,531,030 62,454,465,955
Consolidated Statement of Financial Position
31 December 2016
Renminbi Yuan
The accompanying notes are an integral part of these financial statements.

Consolidated Statement of Financial Position (Continued)31 December 2016Renminbi Yuan
Maanshan Iron & Steel Company Limited2016 Annual Report
94
LIABILITIES AND SHAREHOLDERS’ EQUITY Note V
31 December
2016
31 December
2015
CURRENT LIABILITIES
Deposits and balances from banks and
other financial institutions 19 3,708,225,021 1,901,390,488
Repurchase agreements 20 596,565,698 –
Short term loans 21 6,942,952,420 6,791,359,472
Bills payable 22 3,584,228,362 5,343,906,398
Accounts payable 23 6,668,807,923 6,144,664,281
Advances from customers 24 3,682,322,418 2,602,554,258
Payroll and employee benefits payable 25 550,444,683 274,614,723
Taxes payable 26 274,232,114 149,898,321
Interest payable 27 107,691,398 150,829,308
Dividends payable 28 8,713,584 6,525,534
Other payables 29 1,912,575,078 1,258,463,513
Non-current liabilities due within one year 30 3,211,056,320 5,084,859,415
Accrued liabilities 31 29,580,435 22,232,713
Other current liabilities 32 2,273,058,356 –
Total current liabilities 33,550,453,810 29,731,298,424
NON-CURRENT LIABILITIES
Long term loans 33 5,163,168,960 6,655,171,584
Bonds payable 34 3,987,666,667 3,979,666,667
Deferred income 35 1,269,496,538 1,285,164,299
Long-term employee benefits payable 25 159,173,203 28,857,389
Deferred tax liabilities 17 35,065,411 32,704,732
Total non-current liabilities 10,614,570,779 11,981,564,671
Total liabilities 44,165,024,589 41,712,863,095
The accompanying notes are an integral part of these financial statements.
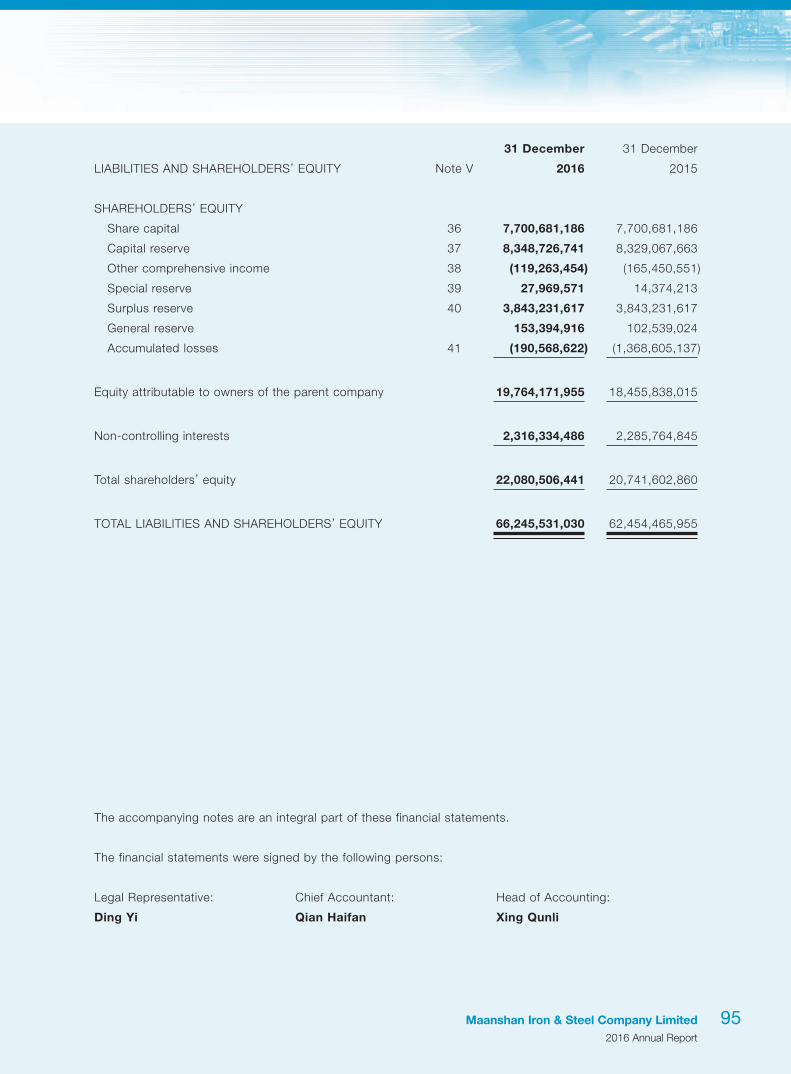
Maanshan Iron & Steel Company Limited2016 Annual Report
95
SHAREHOLDERS’ EQUITY
Share capital 36 7,700,681,186 7,700,681,186
Capital reserve 37 8,348,726,741 8,329,067,663
Other comprehensive income 38 (119,263,454) (165,450,551)
Special reserve 39 27,969,571 14,374,213
Surplus reserve 40 3,843,231,617 3,843,231,617
General reserve 153,394,916 102,539,024
Accumulated losses 41 (190,568,622) (1,368,605,137)
Equity attributable to owners of the parent company 19,764,171,955 18,455,838,015
Non-controlling interests 2,316,334,486 2,285,764,845
Total shareholders’ equity 22,080,506,441 20,741,602,860
TOTAL LIABILITIES AND SHAREHOLDERS’ EQUITY 66,245,531,030 62,454,465,955
The accompanying notes are an integral part of these financial statements.
The financial statements were signed by the following persons:
Legal Representative: Chief Accountant: Head of Accounting:
Ding Yi Qian Haifan Xing Qunli
LIABILITIES AND SHAREHOLDERS’ EQUITY Note V
31 December
2016
31 December
2015

Maanshan Iron & Steel Company Limited2016 Annual Report
96
Consolidated Statement of Profit or LossFor the year ended 31 December 2016Renminbi Yuan
Note V 2016 2015
Revenue 42 48,275,100,310 45,108,926,739
Less: Cost of sales 42, 51 42,557,487,675 45,488,440,552
Taxes and surcharges 43 432,096,408 201,228,046
Selling expenses 44, 51 694,782,730 635,859,844
General and administrative expenses 45, 51 1,780,281,484 1,538,609,887
Financial expenses 46 793,650,976 813,036,439
Impairment losses 47 1,064,257,636 1,619,389,979
Add: Gain on changes in fair value 4,051,190 819,265
Investment income 48 291,396,463 93,725,198
including: share of profits of associates
and joint ventures 232,820,475 75,538,213
Operating profit/(loss) 1,247,991,054 (5,093,093,545)
Add: Non-operating income 49 205,202,902 384,059,748
including: profit from disposal of non-current assets 7,187,676 35,444,537
Less: Non-operating expenses 50 84,618,416 17,538,205
including: loss from disposal of non-current assets 58,376,872 2,478,667
Profit/(loss) before tax 1,368,575,540 (4,726,572,002)
Less: Income tax expense 52 111,880,234 377,912,379
Net profit/(loss) 1,256,695,306 (5,104,484,381)
Net profit/(loss) attributable to
owners of the parent company 1,228,892,407 (4,804,299,674)
Net profit/(loss) attributable to non-controlling interests 27,802,899 (300,184,707)
Consolidated Statement of Profit or Loss
For the year ended 31 December 2016
Renminbi Yuan
The accompanying notes are an integral part of these financial statements.

Maanshan Iron & Steel Company Limited2016 Annual Report
97
Note V 2016 2015
Other comprehensive income, net of tax
Total other comprehensive income attributable to
owners of the parent company, net of tax
Other comprehensive income to be reclassified
to profit or loss in subsequent periods:
Fair value changes of available-for-sale
financial assets 38 (803,607) –
Exchange differences on translation
of foreign operations 38 46,990,704 (28,291,071)
Total other comprehensive income attributable to
non-controlling interests, net of tax 38 912,309 1,725,489
Total comprehensive income 1,303,794,712 (5,131,049,963)
Including:
Total comprehensive income attributable to
owners of the parent company 1,275,079,504 (4,832,590,745)
Total comprehensive income attributable to
non-controlling interests 28,715,208 (298,459,218)
EARNINGS/(LOSS) PER SHARE:
Basic earnings/(loss) 53 15.96 cents (62.39) cents
Diluted earnings/(loss) 53 15.96 cents (62.39) cents
The accompanying notes are an integral part of these financial statements.

Maanshan Iron & Steel Company Limited2016 Annual Report
98
Consolidated Statement of Changes in EquityFor the year ended 31 December 2016Renminbi Yuan
Attributable to owners of the parent
Share capital
Capital reserve
Other comprehensive
incomeSpecial reserve
Surplus reserve
General reserve
(Accumulated losses)/retained
profits Sub-totalNon-controlling
interests
Total shareholders’
equity(Note V 36) (Note V 37) (Note V 38) (Note V 39) (Note V 40) (Note V 41)
1. At 1 January 2016 7,700,681,186 8,329,067,663 (165,450,551) 14,374,213 3,843,231,617 102,539,024 (1,368,605,137) 18,455,838,015 2,285,764,845 20,741,602,860
2. Increase/(decrease) during the year1) Total comprehensive income – – 46,187,097 – – – 1,228,892,407 1,275,079,504 28,715,208 1,303,794,712
2) Capital contribution and withdrawal(i) Others – 15,146,295 – – – – – 15,146,295 – 15,146,295
3) Profit appropriation(i) Transfer to surplus reserve – – – – – – – – – –(ii) Transfer to general risk reserve – – – – – 50,855,892 (50,855,892) – – –(iii) Distribution to shareholders – – – – – – – – (2,455,170) (2,455,170)
4) Special reserve(i) Additions – – – 93,143,099 – – – 93,143,099 10,212,952 103,356,051(ii) Utilisation – – – (84,892,033) – – – (84,892,033) (5,903,349) (90,795,382)(iii) Changes in the share of
associates and joint ventures’ special reserve, net – – – 5,344,292 – – – 5,344,292 – 5,344,292
5) Others – 4,512,783 – – – – – 4,512,783 – 4,512,783
3. At 31 December 2016 7,700,681,186 8,348,726,741 (119,263,454) 27,969,571 3,843,231,617 153,394,916 (190,568,622) 19,764,171,955 2,316,334,486 22,080,506,441
Consolidated Statement of Changes in Equity
For the year ended 31 December 2016
Renminbi Yuan
The accompanying notes are an integral part of these financial statements.
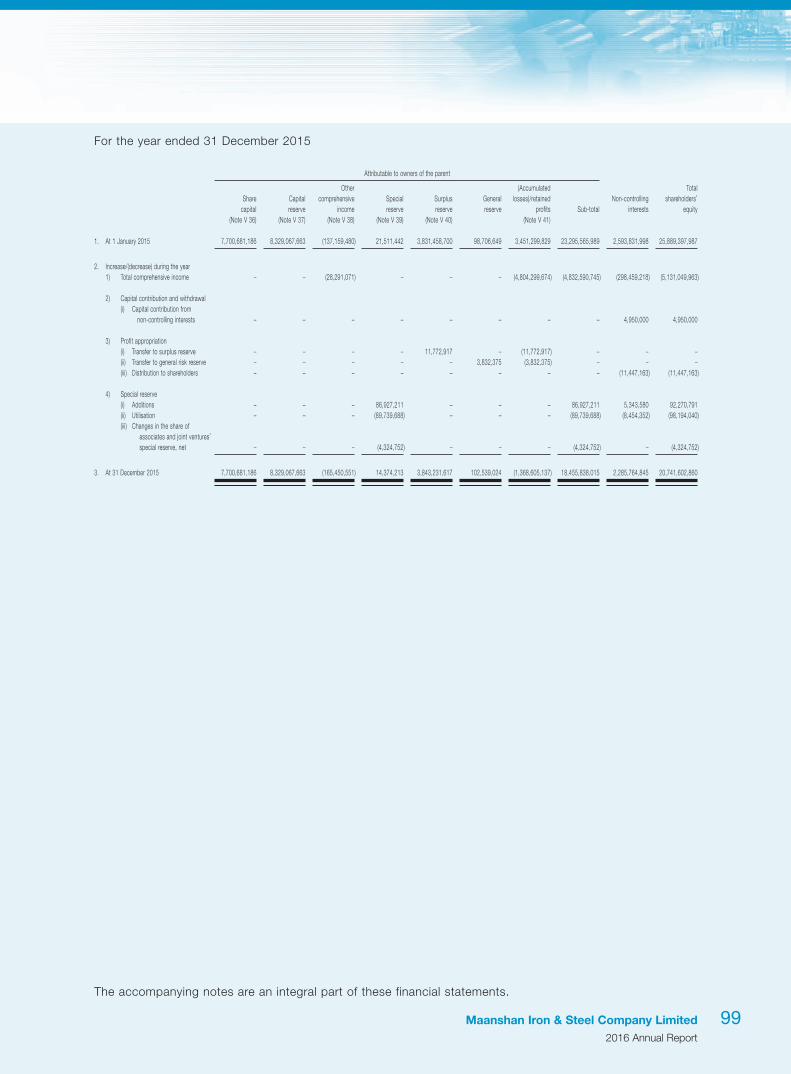
Maanshan Iron & Steel Company Limited2016 Annual Report
99
For the year ended 31 December 2015
Attributable to owners of the parent
Share capital
Capital reserve
Other comprehensive
incomeSpecial reserve
Surplus reserve
General reserve
(Accumulated losses)/retained
profits Sub-totalNon-controlling
interests
Total shareholders’
equity(Note V 36) (Note V 37) (Note V 38) (Note V 39) (Note V 40) (Note V 41)
1. At 1 January 2015 7,700,681,186 8,329,067,663 (137,159,480) 21,511,442 3,831,458,700 98,706,649 3,451,299,829 23,295,565,989 2,593,831,998 25,889,397,987
2. Increase/(decrease) during the year1) Total comprehensive income – – (28,291,071) – – – (4,804,299,674) (4,832,590,745) (298,459,218) (5,131,049,963)
2) Capital contribution and withdrawal(i) Capital contribution from
non-controlling interests – – – – – – – – 4,950,000 4,950,000
3) Profit appropriation(i) Transfer to surplus reserve – – – – 11,772,917 – (11,772,917) – – –(ii) Transfer to general risk reserve – – – – – 3,832,375 (3,832,375) – – –(iii) Distribution to shareholders – – – – – – – – (11,447,163) (11,447,163)
4) Special reserve(i) Additions – – – 86,927,211 – – – 86,927,211 5,343,580 92,270,791(ii) Utilisation – – – (89,739,688) – – – (89,739,688) (8,454,352) (98,194,040)(iii) Changes in the share of
associates and joint ventures’ special reserve, net – – – (4,324,752) – – – (4,324,752) – (4,324,752)
3. At 31 December 2015 7,700,681,186 8,329,067,663 (165,450,551) 14,374,213 3,843,231,617 102,539,024 (1,368,605,137) 18,455,838,015 2,285,764,845 20,741,602,860
Consolidated Statement of Changes in Equity
For the year ended 31 December 2015
Renminbi Yuan
The accompanying notes are an integral part of these financial statements.

Maanshan Iron & Steel Company Limited2016 Annual Report
100
Consolidated Statement of Cash FlowsFor the year ended 31 December 2016Renminbi Yuan
Note V 2016 2015
1. Cash flows from operating activities
Cash received from sale of goods
and rendering of services 53,536,500,347 57,397,210,097
Tax refunds received 43,331,736 232,132,582
Net decrease in deposits in the central bank – 472,181,056
Net increase in repurchase agreements of
financial assets 596,565,698 –
Net increase in customer deposits and
deposits from banks 1,806,834,533 201,771,638
Cash received for interest charges,
fees and commissions 68,966,168 86,197,602
Cash received relating to other operating activities 54 1,171,286,841 29,297,279
Sub-total of cash inflows 57,223,485,323 58,418,790,254
Cash paid for purchases of goods and services (45,192,755,217) (46,085,246,212)
Net increase in deposits in central bank (103,901,102) –
Net increase in financial assets purchased under
agreements to resell (230,047,000) –
Net increase in loans and advances to customers (852,919,383) (99,710,592)
Cash paid to or on behalf of employees (3,759,522,641) (3,901,087,465)
Taxes and surcharges paid (2,018,756,738) (2,021,090,985)
Cash paid for interest charges,
fees and commissions (30,304,313) (25,489,812)
Cash paid relating to other operating activities 54 (415,417,915) (420,833,135)
Sub-total of cash outflows (52,603,624,309) (52,553,458,201)
Net cash flows from operating activities 55(1) 4,619,861,014 5,865,332,053
2. Cash flows from investing activities
Cash received from disposal of investments 458,563,915 4,301,307,391
Cash received from investment income 141,575,987 243,447,481
Proceeds from disposal of items of property,
plant and equipment, intangible assets,
and other non-current assets 21,243,569 22,510,647
Cash received relating to other investing activities 54 103,844,476 186,448,184
Sub-total of cash inflows 725,227,947 4,753,713,703
Consolidated Statement of Cash Flows
For the year ended 31 December 2016
Renminbi Yuan
The accompanying notes are an integral part of these financial statements.

Maanshan Iron & Steel Company Limited2016 Annual Report
101
Note V 2016 2015
2. Cash flows from investing activities (continued)
Purchases of property, plant and equipment,
intangible assets and other non-current assets (2,130,913,649) (2,772,760,636)
Cash paid for investments (531,910,709) (5,405,067,580)
Acquisition of a subsidiary and other operating units 55(2) – (73,191,528)
Increase in restricted cash – (123,766,960)
Sub-total of cash outflows (2,662,824,358) (8,374,786,704)
Net cash flows used in investing activities (1,937,596,411) (3,621,073,001)
3. Cash flows from financing activities
Cash received from borrowings 17,427,171,551 13,721,926,562
Proceeds from issuance of bonds – 3,976,000,000
Cash received from investors – 4,950,000
Including: Capital injection from non-controlling
interests – 4,950,000
Sub-total of cash inflows 17,427,171,551 17,702,876,562
Repayment of borrowings (18,554,976,223) (18,176,630,777)
Cash paid for dividends and interest (963,134,469) (1,081,118,068)
Including: dividends paid to non-controlling
interests by subsidiaries (267,120) (11,447,163)
Sub-total of cash outflows (19,518,110,692) (19,257,748,845)
Net cash flows used in financing activities (2,090,939,141) (1,554,872,283)
4. Effect of foreign exchange rate changes on
cash and cash equivalents 186,395,867 147,187,290
5. Net increase in cash and cash equivalents 777,721,329 836,574,059
Add: cash and cash equivalents
at the beginning of the year 3,546,410,358 2,709,836,299
6. Cash and cash equivalents at the end of the year 55(3) 4,324,131,687 3,546,410,358
The accompanying notes are an integral part of these financial statements.

Maanshan Iron & Steel Company Limited2016 Annual Report
102
Statement of Financial Position31 December 2016Renminbi Yuan
ASSETS Note XIV
31 December
2016
31 December
2015
CURRENT ASSETS
Cash and bank balances 3,851,576,750 4,531,034,025
Financial assets at fair value through profit or loss 3,789,546 3,145,560
Bills receivable 3,518,320,171 3,751,615,186
Trade receivables 1 1,953,223,578 1,563,775,000
Dividends receivable 5,672,730 7,225,723
Prepayments 649,277,673 371,248,500
Other receivables 2 41,040,509 246,097,801
Inventories 3 7,370,937,053 4,348,287,858
Other current assets 294,632,327 557,052,098
Total current assets 17,688,470,337 15,379,481,751
NON-CURRENT ASSETS
Available-for-sale financial investments 126,722,160 126,722,160
Long term equity investments 4 7,152,166,287 6,830,479,397
Investment properties 73,988,855 75,681,866
Property, plant and equipment 27,272,692,483 25,954,686,393
Construction in progress 1,629,607,224 4,025,657,145
Intangible assets 933,763,504 971,003,316
Deferred tax assets 261,808,739 314,216,637
Total non-current assets 37,450,749,252 38,298,446,914
TOTAL ASSETS 55,139,219,589 53,677,928,665
Statement of Financial Position
31 December 2016
Renminbi Yuan
The accompanying notes are an integral part of these financial statements.

Maanshan Iron & Steel Company Limited2016 Annual Report
103
LIABILITIES AND SHAREHOLDERS’ EQUITY
31 December
2016
31 December
2015
CURRENT LIABILITIES
Short term loans 4,617,240,417 831,000,000
Bills payable 2,766,056,791 3,981,623,516
Accounts payable 5,708,282,008 8,853,140,561
Advances from customers 2,396,866,345 2,132,448,152
Payroll and employee benefits payable 436,242,207 180,534,218
Taxes payable 165,339,271 50,206,106
Interest payable 104,959,511 147,852,499
Dividends payable 6,525,534 6,525,534
Other payables 1,502,658,072 1,001,923,405
Non-current liabilities due within one year 4,448,099,900 5,084,859,415
Other current liabilities 2,273,058,356 –
Total current liabilities 24,425,328,412 22,270,113,406
NON-CURRENT LIABILITIES
Long term loans 7,113,168,960 9,289,847,408
Bonds payable 3,987,666,667 3,979,666,667
Deferred income 556,222,033 596,438,001
Long-term employee benefits payable 127,425,119 –
Total non-current liabilities 11,784,482,779 13,865,952,076
Total liabilities 36,209,811,191 36,136,065,482
SHAREHOLDERS’ EQUITY
Share capital 7,700,681,186 7,700,681,186
Capital reserve 8,358,017,477 8,338,358,399
Special reserve 3,827,107 (1,517,185)
Surplus reserve 2,993,175,001 2,993,175,001
Accumulated loss (126,292,373) (1,488,834,218)
Total shareholders’ equity 18,929,408,398 17,541,863,183
TOTAL LIABILITIES AND SHAREHOLDERS’ EQUITY 55,139,219,589 53,677,928,665
The accompanying notes are an integral part of these financial statements.

Maanshan Iron & Steel Company Limited2016 Annual Report
104
Statement of Profit or LossFor the year ended 31 December 2016Renminbi Yuan
Note XIV 2016 2015
Revenue 6 41,526,614,764 37,512,900,449
Less: Cost of sales 6 37,095,438,376 38,253,678,839
Taxes and surcharges 333,846,959 133,209,086
Selling expenses 311,149,677 353,703,599
General and administrative expenses 965,419,904 1,082,550,309
Financial expenses 817,756,613 791,940,217
Impairment losses 7 922,543,152 1,239,846,141
Add: Gain/(loss) on changes in fair value 3,789,546 (538,440)
Investment income 8 253,435,060 193,417,900
Including: share of profits of associates
and joint ventures 232,820,475 75,219,006
Operating profit/(loss) 1,337,684,689 (4,149,148,282)
Add: Non-operating income 155,525,603 246,820,355
Including: profit from disposal of non-current assets 6,915,183 34,997,590
Less: Non-operating expenses 78,260,549 927,412
Including: loss from disposal of non-current assets 54,410,964 –
Profit/(loss) before tax 1,414,949,743 (3,903,255,339)
Less: Income tax expense 52,407,898 269,300,783
Net profit/(loss) 1,362,541,845 (4,172,556,122)
Other comprehensive income, net of tax – –
Total comprehensive income 1,362,541,845 (4,172,556,122)
Statement of Profit or Loss
For the year ended 31 December 2016
Renminbi Yuan
The accompanying notes are an integral part of these financial statements.

Maanshan Iron & Steel Company Limited2016 Annual Report
105
Statement of Changes in EquityFor the year ended 31 December 2016Renminbi Yuan
Share capital
Capital reserve
Special reserve
Surplus reserve
Accumulated losses
Total shareholders’
equity
1. At 1 January 2016 7,700,681,186 8,338,358,399 (1,517,185) 2,993,175,001 (1,488,834,218) 17,541,863,183
2. Increase/(decrease) during the year
1) Total comprehensive income – – – – 1,362,541,845 1,362,541,845
2) Capital contribution and withdrawal(i) Other – 15,146,295 – – – 15,146,295
3) Profit appropriation(i) Transfer to surplus reserves – – – – – –(ii) Distribution to shareholders – – – – – –
4) Special reserve(i) Additions – – 60,734,571 – – 60,734,571(ii) Utilization – – (60,734,571) – – (60,734,571)(iii) Changes in the share of
associates and joint ventures’ special reserve, net – – 5,344,292 – – 5,344,292
5) Others – 4,512,783 – – – 4,512,783
3. At 31 December 2016 7,700,681,186 8,358,017,477 3,827,107 2,993,175,001 (126,292,373) 18,929,408,398
Statement of Changes in Equity
For the year ended 31 December 2016
Renminbi Yuan
The accompanying notes are an integral part of these financial statements.

Statement of Changes in Equity (Continued)For the year ended 31 December 2015Renminbi Yuan
Maanshan Iron & Steel Company Limited2016 Annual Report
106
Share capital
Capital reserve
Special reserve
Surplus reserve
Retained profits/(accumulated
losses)
Total shareholders’
equity
1. At 1 January 2015 7,700,681,186 8,338,358,399 2,807,567 2,993,175,001 2,683,721,904 21,718,744,057
2. Increase/(decrease) during the year
1) Total comprehensive income – – – – (4,172,556,122) (4,172,556,122)
2) Profit appropriation(i) Transfer to surplus reserves – – – – – –
3) Special reserve(i) Additions – – 75,031,697 – – 75,031,697(ii) Utilisation – – (75,031,697) – – (75,031,697)(iii) Changes in the share of
associates and joint ventures’ special reserve, net – – (4,324,752) – – (4,324,752)
3. At 31 December 2015 7,700,681,186 8,338,358,399 (1,517,185) 2,993,175,001 (1,488,834,218) 17,541,863,183
Statement of Changes in Equity
For the year ended 31 December 2015
Renminbi Yuan
The accompanying notes are an integral part of these financial statements.

Maanshan Iron & Steel Company Limited2016 Annual Report
107
Statement of Cash FlowsFor the year ended 31 December 2016Renminbi Yuan
Note XIV 2016 2015
1. Cash flows from operating activities
Cash received from sale of goods and
rendering of services 41,141,395,987 43,398,475,877
Tax refunds received 24,507,200 131,417,800
Cash received relating to other operating activities 797,888,505 9,477,342
Sub-total of cash inflows 41,963,791,692 43,539,371,019
Cash paid for purchase of goods and services (37,944,724,458) (37,127,742,995)
Cash paid to or on behalf of employees (2,930,467,496) (3,086,960,000)
Cash paid for all taxes (1,435,486,557) (1,581,230,486)
Cash paid relating to other operating activities (83,170,827) (133,716,328)
Sub-total of cash outflows (42,393,849,338) (41,929,649,809)
Net cash flows (used in)/from operating activities 9 (430,057,646) 1,609,721,210
2. Cash flows from investing activities
Cash received from disposal of investments 4,879,915 1,075,180
Cash received from investment income 124,838,847 318,442,126
Net cash received from disposal of items of property,
plant and equipment, intangible assets and
other long term assets 13,327,899 11,833,545
Cash received relating to other investing activities 72,790,158 167,466,584
Sub-total of cash inflows 215,836,819 498,817,435
Purchase of property, plant and equipment,
intangible assets and other non-current assets (1,925,759,949) (2,338,221,784)
Cash paid for investments (77,539,611) (104,067,580)
Acquisition of a subsidiary and other operating units (111,764,084) (180,141,000)
Increase in restricted cash – (279,454,275)
Sub-total of cash outflows (2,115,063,644) (2,901,884,639)
Net cash flows used in investing activities (1,899,226,825) (2,403,067,204)
Statement of Cash Flows
For the year ended 31 December 2016
Renminbi Yuan
The accompanying notes are an integral part of these financial statements.

Statement of Cash Flows (Continued)For the year ended 31 December 2016Renminbi Yuan
Maanshan Iron & Steel Company Limited2016 Annual Report
108
Note XIV 2016 2015
3. Cash flows from financing activities
Proceeds from issuance of bonds,
net of issuance costs – 3,976,000,000
Cash received from borrowings 10,347,247,864 9,974,252,000
Sub-total of cash inflows 10,347,247,864 13,950,252,000
Repayment of borrowings (7,422,588,144) (13,139,229,300)
Cash paid for the distribution of dividend or
profits and for interest expenses (919,289,458) (966,296,684)
Sub-total of cash outflows (8,341,877,602) (14,105,525,984)
Net cash flows from/(used in) financing activities 2,005,370,262 (155,273,984)
4. Effect of foreign exchange rate changes on
cash and cash equivalents 150,304,664 166,686,730
5. Net decrease in cash and cash equivalents (173,609,545) (781,933,248)
Add: Cash and cash equivalents
at the beginning of the year 4,025,186,295 4,807,119,543
6. Cash and cash equivalents at the end of the year 3,851,576,750 4,025,186,295
The accompanying notes are an integral part of these financial statements.

Maanshan Iron & Steel Company Limited2016 Annual Report
109
Notes to Financial Statements31 December 2016Renminbi Yuan
I. GENERAL INFORMATION OF THE GROUP
Maanshan Iron & Steel Company Limited (the “Company”), a joint stock limited company incorporated
after the reorganisation of a state-owned enterprise known as Maanshan Iron and Steel Company
(the “Original Magang”, now named as Magang (Group) Holding Company Limited), was established
in Maanshan City, Anhui Province, the People’s Republic of China (the “PRC”) on 1 September 1993.
The unified social credit code of the Company’s business license is 91340000610400837Y. The
Company’s A shares and H shares were issued and listed on the Shanghai Stock Exchange and the
Hong Kong Stock Exchange, respectively. The headquarters of the Company are located at No. 8 Jiu
Hua Xi Road, Maanshan City, Anhui Province, the PRC.
As of 31 December 2016, the Company had issued 7,700,680,000 shares in total, including ordinary
A shares of 5,967,750,000 and ordinary H shares of 1,732,930,000. The nominal value of each share
is RMB1.
The Company together with its subsidiaries (collectively known as the “Group”) is principally engaged
in the manufacture and sale of iron and steel products and related by-products.
The parent company of the Group is Magang (Group) Holding Company Limited (the “Holding”), which
is established in the PRC.
The financial statements were approved by the board of directors on 29 March 2017. According to the
articles of association of the Company, the financial statements will be submitted to shareholders for
approval at a shareholders’ meeting.
The results of subsidiaries are consolidated from the date on which the Group obtains control, and
continue to be consolidated until the date that such control ceases. The change in the scope of
consolidation during the year is described in Note VI.
II. BASIS OF PREPARATION
The financial statements were prepared in accordance with “China Accounting Standards for Business
Enterprises – General Principles” and other issued application guidance, interpretations and other
related regulations issued later (collectively known as the “CAS”).
The consolidated financial statements were prepared on going concern basis.
As of 31 December 2016, the net current liabilities of the Group amounted to RMB9,132,138,612.
The directors of the Company have considered the availability of funding sources, including but not
limited to an unused banking credit quota of RMB16.8 billion obtained on 31 December 2016. After
assessment, the Company’s board of directors believes that the Group has sufficient resources to
continue as a going concern for not less than 12 months after the end of reporting period. Therefore,
the Company’s board of directors continues to prepare the Group’s financial statements for the year
ended 31 December 2016 on a going concern basis.
Notes to Financial Statements
31 December 2016
Renminbi Yuan

Notes to Financial Statements (Continued)31 December 2016Renminbi Yuan
Maanshan Iron & Steel Company Limited2016 Annual Report
110
II. BASIS OF PREPARATION (CONTINUED)
The financial statements have been prepared under the historical cost convention, except for certain
financial instruments which have been measured at fair value. Provision for asset impairment is
provided in accordance with related regulations.
III. SIGNIFICANT ACCOUNTING POLICIES AND ACCOUNTING ESTIMATES
The Group has determined the accounting policies and accounting estimates based on the
characteristics of the operation, especially those related to bad debt provision for accounts receivable
and inventory provision, depreciation of fixed assets, amortisation of intangible assets, impairment of
non-financial assets excluding the financial instruments (other than goodwill), recognition of deferred
tax assets, recognition and measurement of revenue, etc.
1. STATEMENT OF COMPLIANCE WITH THE CAS
The financial statements have been prepared in accordance with the CAS, and present truly
and completely, the financial position of the Company and the Group as of 31 December 2016,
and the results of their operations and their cash flows for the year then ended.
2. ACCOUNTING PERIOD
The accounting year of the Group is from 1 January to 31 December of each calendar year.
3. REPORTING CURRENCY
Renminbi, in which the financial statements are presented, is used as the Group’s recording
and functional currency. All values are rounded to the nearest Renminbi Yuan (“RMB”) except
when otherwise indicated.
The Group’s subsidiaries use their respective local currencies as the reporting currencies for
recording purposes in accordance with their own operating environment, which are translated
into Renminbi in the preparation of the consolidated financial statements.
4. BUSINESS COMBINATION
A business combination represents a transaction or event where two, or more than two
separate entities form one reporting entity. Business combinations are classified into “Business
combination involving entities under common control” and “Business combination involving
entities not under common control”.

Maanshan Iron & Steel Company Limited2016 Annual Report
111
III. SIGNIFICANT ACCOUNTING POLICIES AND ACCOUNTING ESTIMATES (CONTINUED)
4. BUSINESS COMBINATION (CONTINUED)
Business combination involving entities under common control
Business combination involving entities under common control is a business combination in
which all of the combining entities are ultimately controlled by the same party or parties both
before and after the business combination, and that control is not transitory. Under a business
combination involving entities under common control, the combining entity obtains control of
another involving entity on the combination date. The combination date is the date on which
the combining entity effectively obtains control of the entity being combined.
The assets and liabilities obtained under common control (including the goodwill arising
from the acquisition of the acquiree as part of the ultimate controlling party’s investment)
are measured at the carrying amounts as recorded by the ultimate controlling party at the
acquisition date. The difference between the carrying amount of the net assets obtained and
the carrying amount of the consideration paid for the combination (or the total face value of
the shares issued) is adjusted to share premium, which is included in the capital reserve. If the
balance of the share premium reserve is insufficient, any excess is adjusted to retained profits.
Business combination involving entities not under common control
Business combination involving entities not under common control is a business combination
in which all of the combining entities are not ultimately controlled by the same party or parties
before and after the business combination. Under a business combination involving entities
not under common control, the involving entity (the acquirer) obtains control of other involving
entities (the acquiree) on the acquisition date. The acquisition date is the date on which the
acquirer effectively obtains control of the acquiree.
The acquirer shall, at the acquisition date, recognise the acquiree’s identifiable assets, liabilities
and contingent liabilities that satisfy the recognition criteria at their fair values at the date of
acquisition.
Any excess of the sum of the fair value of the consideration paid for a business combination
(or the fair value of equity securities issued) and the fair value of the acquiree’s equity interest
held before the acquisition date over the acquirer’s interest in the fair value of the acquiree’s
identifiable net assets is recorded as goodwill, which is measured at cost less any accumulated
impairment losses subsequently. If the acquirer’s interest in the net fair value of the acquiree’s
identifiable net assets exceeds the sum of the fair value of the consideration paid for a business
combination (or the fair value of equity securities issued) and the fair value of the acquiree’s
equity interest held before the acquisition date, the acquirer shall reassess the measurement of
the fair value of the acquiree’s identifiable assets, liabilities or contingent liabilities, as well as
the fair value of the consideration paid for a business combination (or the fair value of equity
securities issued) and the fair value of the acquiree’s equity interest held before the acquisition
date, and recognise immediately in profit or loss any excess remaining after the reassessment.

Notes to Financial Statements (Continued)31 December 2016Renminbi Yuan
Maanshan Iron & Steel Company Limited2016 Annual Report
112
III. SIGNIFICANT ACCOUNTING POLICIES AND ACCOUNTING ESTIMATES (CONTINUED)
5. CONSOLIDATED FINANCIAL STATEMENTS
The scope of the consolidated financial statements is determined on the control basis, which
consists of financial statements of the Company and its subsidiaries for the year ended 31
December 2016. A subsidiary is a company or entity that is controlled by the Company
(including separable parts of the enterprise and the invested entity, as well as the structural
body controlled by the Company).
The financial year of subsidiaries is coterminous and the accounting policies of subsidiaries
are applied consistently with those of the Company when preparing consolidated financial
statements. All intercompany balances, transactions and unrealised gains and losses resulting
from intercompany transactions, and dividends within the Group are fully eliminated on
consolidation.
Where the current loss assumed by non-controlling shareholders of a subsidiary exceeds the
opening minority interests, the balance offsets non-controlling interests.
For subsidiaries acquired through a business combination involving entities not under common
control, the operating results and cash flows of the acquired company are included in the
consolidated financial statements from the acquisition date until the date on which the Group
ceases the control of the subsidiary. In preparing the consolidated financial statements,
adjustments are made to the subsidiaries’ financial statements based on the fair values of the
identifiable assets, liabilities and contingent liabilities at the acquisition date.
For subsidiaries acquired through a business combination involving entities under common
control, the operating results and cash flows of a subsidiary are included in the consolidated
financial statements from the beginning of the combination period. In preparing consolidated
financial statements, adjustments are made to related items in prior years’ financial statements,
as if the combination had occurred from the date when the combining entities first came under
control of the ultimate controlling party.
The investor shall reassess its control when changes in relevant facts and circumstances lead
to changes in the elements of control.
Any change in the non-controlling interests without losing control is recognised as an equity
transaction.

Maanshan Iron & Steel Company Limited2016 Annual Report
113
III. SIGNIFICANT ACCOUNTING POLICIES AND ACCOUNTING ESTIMATES (CONTINUED)
6. JOINT ARRANGEMENT AND JOINT OPERATIONS
A joint arrangement is classified as either a joint operation or a joint venture. A joint operation is
a joint arrangement whereby the parties that have joint control of the arrangement have rights
to the assets and obligations for the liabilities, relating to the arrangement. A joint venture is a
type of joint arrangement whereby the parties that have joint control of the arrangement have
rights to the net assets of the joint venture.
The Group recognises in relation to its interest in a joint operation: its assets, including its
share of any assets held jointly; its liabilities, including its share of any liabilities incurred jointly;
its revenue from the sale of its share of the output arising from the joint operation; its share of
revenue from the sale of the output by the joint operation; its expenses, including its share of
any expenses incurred jointly.
7. CASH AND CASH EQUIVALENTS
Cash represents cash on hand and deposits which are readily available for payment. Cash
equivalents represent the Group’s short term highly liquid investments which are readily
convertible into known amounts of cash and subject to an insignificant risk of changes in value.
8. FOREIGN OPERATIONS AND FOREIGN CURRENCY TRANSLATION
The Group translates foreign currencies into the reporting currency when foreign currency
transactions occur.
Foreign currency transactions are initially recorded using the functional currency rates ruling
at the dates of the transactions. Monetary items denominated in foreign currencies are
translated into functional currencies at the rates of exchange ruling at the end of reporting
period. The resulting exchange differences are recognised in profit or loss, except those
arising from the principals and interest on foreign currency borrowings specifically for the
purpose of acquisition, construction or production of qualifying assets. Non-monetary items
denominated in foreign currencies that are measured at historical cost are translated into
functional currencies using the foreign exchange rates at the transaction date. Non-monetary
items denominated in foreign currencies that are measured at fair value are translated using the
foreign exchange rates at the date the fair value is determined, and the exchange differences
are recognised in profit or loss or other comprehensive income.

Notes to Financial Statements (Continued)31 December 2016Renminbi Yuan
Maanshan Iron & Steel Company Limited2016 Annual Report
114
III. SIGNIFICANT ACCOUNTING POLICIES AND ACCOUNTING ESTIMATES (CONTINUED)
8. FOREIGN OPERATIONS AND FOREIGN CURRENCY TRANSLATION (CONTINUED)
The Group translates functional currencies of overseas businesses into Renminbi when
preparing financial statements. All assets and liabilities are translated at the rates of exchange
ruling at the end of the reporting period; shareholders’ equity, with the exception of retained
profits, are translated at the rates of exchange ruling at the transaction date; all income and
expense items in the statement of comprehensive income are translated at the average rates
of exchange during the period. Exchange fluctuations arising from the translation mentioned
above are recognised as other comprehensive income, and are presented separately in the
shareholders’ equity in the statement of financial position. When an overseas business is
disposed of, the exchange fluctuation reserve of the overseas business will be transferred to
profit or loss in the same period. In the case of a partial disposal, only the proportionate share
of the related exchange fluctuation reserve is transferred to profit or loss.
The foreign currency cash flows and cash flows of a foreign subsidiary shall be translated at
the rates of exchange ruling at the dates of the cash flows. The effect of changes in rates of
exchange on cash and cash equivalents is presented separately in the statement of cash flows.
9. FINANCIAL INSTRUMENTS
A financial instrument is any contract that gives rise to a financial asset of one entity and a
financial liability or equity instrument of another entity.
Recognition and derecognition of financial instruments
The Group recognises a financial asset or a financial liability when, and only when, it becomes a
party to the contractual provisions of the instrument.
A financial asset (either a part of financial asset or a part of a group of similar financial assets)
will be derecognised, which means writing off from the account and the statement of financial
position:
(1) The contractual rights to the cash flows from the financial asset expire; or
(2) It transfers the contractual rights to receive the cash flows of the financial asset, or
assumes a contractual obligation to pay the cash flows to one or more recipients in
a “transfer arrangement” and that (a) substantially transfers all the risks and rewards
of ownership of the financial asset, or (b) neither transfers nor retains substantially all
the risks and rewards of ownership of the financial asset, but abandons control of the
financial asset.

Maanshan Iron & Steel Company Limited2016 Annual Report
115
III. SIGNIFICANT ACCOUNTING POLICIES AND ACCOUNTING ESTIMATES (CONTINUED)
9. FINANCIAL INSTRUMENTS (CONTINUED)
Recognition and derecognition of financial instruments (continued)
A financial liability is derecognised when, and only when, the current obligation is discharged
or cancelled or expires. If an existing financial liability is replaced by the same debtor with a
new financial liability, whose contractual stipulation is substantially different from those of the
existing financial liability, or if an enterprise makes substantial revisions to almost all of the
contractual stipulations of the existing financial liability, it shall terminate the recognition of the
existing financial liability, and at the same time recognise the financial liability after revising the
contractual stipulation as a new financial liability, and the difference is recognised in profit or
loss.
All financial assets purchased or sold in a regular way are recognised or derecognised on the
trade date, that is, the date that the Group commits to purchase or sell the asset. Regular way
purchases or sales are purchases or sales of financial assets that require delivery of assets
within the period generally established by regulation or convention in the marketplace.
Classification and measurement of financial assets
The Group classifies its financial assets into four categories at initial recognition, including:
financial assets at fair value through profit or loss, held-to-maturity investments, loans and
receivables, and available-for-sale financial assets. Financial assets are measured at fair
value initially. For financial assets at fair value through profit or loss, the directly associated
transaction costs are charged to profit or loss; for other financial assets, the directly associated
transaction costs are recognised as initial investment costs.
The subsequent measurement of financial assets depends on their classification as follows:
Financial assets at fair value through profit or loss
Financial assets at fair value through profit or loss comprise financial assets held for trading
and those that are designated as at fair value through profit or loss upon initial recognition.
A financial asset is classified as held for trading if it is: 1) acquired principally for the purpose
of selling it in the near term; 2) part of a portfolio of identified financial instruments that are
managed together and for which there is evidence of a recent actual pattern of short-term
profit-taking; or 3) a derivative (except for a derivative that is a financial guarantee contract or a
designated and effective hedging instrument, or is linked to and must be settled by delivery of
such unquoted equity instruments in an active market, and whose fair value cannot be reliably
measured). Such financial assets are measured under the fair value method subsequently. All
the realised and unrealised gains or losses are recognised in profit or loss. All dividends or
interest related to financial assets at fair value through profit or loss is recognised in profit or
loss.

Notes to Financial Statements (Continued)31 December 2016Renminbi Yuan
Maanshan Iron & Steel Company Limited2016 Annual Report
116
III. SIGNIFICANT ACCOUNTING POLICIES AND ACCOUNTING ESTIMATES (CONTINUED)
9. FINANCIAL INSTRUMENTS (CONTINUED)
Classification and measurement of financial assets (continued)
Financial assets at fair value through profit or loss (continued)
Financial assets are designated as financial assets at fair value through profit or loss, if one of
the following criteria is satisfied:
(1) The designation is able to eliminate or obviously reduce the discrepancies in the
recognition or measurement of the relevant gains or losses arising from the different
measurement bases of financial instruments.
(2) Official written documents on risk management or investment strategies have recorded
that the combination of financial instruments will be managed, evaluated and reported to
key management personnel on the basis of fair value.
(3) Hybrid instruments which contain one or more embedded derivatives, unless the
embedded derivatives do not have a substantial effect on the cash flows of the hybrid
instruments, or the embedded derivatives obviously should not be separated from the
relevant hybrid instruments.
(4) Hybrid instruments which contain embedded derivatives that should split, but cannot be
measured separately when acquired or at the end of the subsequent reporting period.
For the equity investment where is there is a quoted market price from an active market or the
fair value cannot be reliably measured, such equity investment shall not be designated as a
financial asset at fair value through profit or loss.
Upon the designation of a financial asset as a financial asset at fair value through profit or loss
at initial recognition, it shall not be reclassified to other categories of financial assets. Also,
assets from other categories of financial assets shall not be reclassified to financial assets at
fair value through profit or loss.
In accordance with the above conditions, the financial assets of this kind designated by the
Group are mainly financial products issued by banks.
Held-to-maturity investments
Held-to-maturity investments are non-derivative financial assets with fixed or determinable
payments and fixed maturity that the Group has the positive intention and ability to hold to
maturity. Held-to-maturity investments are subsequently measured at amortised cost using the
effective interest rate method. Gains or losses are recognised in profit or loss when the held-to-
maturity investments are derecognised, impaired, or amortised.

Maanshan Iron & Steel Company Limited2016 Annual Report
117
III. SIGNIFICANT ACCOUNTING POLICIES AND ACCOUNTING ESTIMATES (CONTINUED)
9. FINANCIAL INSTRUMENTS (CONTINUED)
Classification and measurement of financial assets (continued)
Loans and receivables
Loans and receivables are non-derivative financial assets with fixed or determinable payments
that are unquoted in an active market. Loans and receivables are subsequently measured at
amortised cost using the effective interest rate method. Gains or losses are recognised in profit
or loss when the loans and receivables are derecognised, impaired, or amortised.
Available-for-sale financial assets
Available-for-sale financial assets are those non-derivative financial assets that are initially
designated as available for sale or are not classified as the abovementioned categories of
financial instruments. Such available-for-sale financial assets are measured at fair value in
subsequent measurement. The premium or discount is amortised using the effective interest
method, with interest recognised as interest income or expense. The fair value changes of
available-for-sale financial assets are recognised as other comprehensive income except for
changes arising from impairment losses or foreign exchange conversion on non-Renminbi
monetary financial assets. When the financial asset is derecognised or impaired, the
accumulated gains or losses recognised in prior periods are transferred to the statement of
comprehensive income. All dividends or interest income related to available-for-sale financial
assets are recognised in profit or loss.
Investments in equity instruments that do not have a quoted market price in an active market
and whose fair value cannot be reliably measured are measured at cost.
Classification and measurement of financial liabilities
The Group classifies its financial liabilities, when they are recognised initially as financial
liabilities at fair value through profit or loss and other financial liabilities. With respect to financial
liabilities at fair value through profit or loss, transaction costs are charged to profit or loss;
whereas for other financial liabilities, transaction costs are recognised as initial cost.
The subsequent measurement of financial liabilities depends on their classification:
Financial liabilities at fair value through profit or loss
Financial liabilities at fair value through profit or loss comprise financial liabilities held for trading
and those that are designated as at fair value through profit or loss upon initial recognition.
A financial liability is classified as held for trading if it is: incurred principally for the purpose
of repurchasing in the near term; part of a portfolio of identified financial instruments that are
managed collectively and for which there is evidence of a recent actual pattern of short-term
profit-taking; or a derivative (except for a derivative that is a financial guarantee contract or a
designated and effective hedging instrument, or is linked to and must be settled by delivery of
such unquoted equity instruments in an active market, and whose fair value cannot be reliably
measured). Such financial liabilities are subsequently measured at fair value. All the realised and
unrealised gains or losses are recognised in profit or loss.

Notes to Financial Statements (Continued)31 December 2016Renminbi Yuan
Maanshan Iron & Steel Company Limited2016 Annual Report
118
III. SIGNIFICANT ACCOUNTING POLICIES AND ACCOUNTING ESTIMATES (CONTINUED)
9. FINANCIAL INSTRUMENTS (CONTINUED)
Classification and measurement of financial assets (continued)
Financial liabilities at fair value through profit or loss (continued)
Upon the designation of a financial liability as a financial liability at fair value through profit or
loss at initial recognition, it shall not be reclassified to other categories of financial liabilities.
Also, liabilities from other categories of financial liabilities shall not be reclassified to financial
liabilities at fair value through profit or loss.
Other financial liabilities
Other financial liabilities are subsequently measured at amortised cost using the effective
interest rate method.
Offsetting of financial instruments
Financial assets and financial liabilities are offset and the net amount is reported in the
statement of financial position if there is a currently enforceable legal right to offset the
recognised amounts and there is an intention to settle on a net basis, or to realise the assets
and settle the liabilities simultaneously.
Financial guarantee contracts
Financial guarantee contracts are those contracts that require a payment to be made to
reimburse the holder for a loss it incurs because the specified debtor fails to make a payment
when due in accordance with the terms of a debt instrument. Financial guarantee contracts are
initially recognised at fair value, but they do not belong to financial liabilities that are designated
as at fair value through profit or loss. They are subsequently measured at the higher of (i) the
amount of the best estimate of the expenditure required to settle the present obligation at the
end of the reporting period, and (ii) the amount initially recognised less, where appropriate,
cumulative amortisation.
Impairment of financial assets
The Group assesses the carrying amount of a financial asset at the end of each reporting
period and provides impairment provision when there is any objective evidence that the
financial asset is impaired. Such objective evidence refers to events that occurred after the
initial recognition of the financial asset and could impact the estimated future cash flows of the
financial asset, and such impacts can be reliably measured. Evidence of impairment of financial
assets may include indications that a debtor or a group of debtors is experiencing significant
financial difficulty, default or delinquency in interest or principal payments, the probability that
they will enter bankruptcy or other financial reorganisation and observable data indicating that
there is a measureable decrease in the estimated future cash flows, such as changes in arrears
or economic conditions that correlate with defaults.

Maanshan Iron & Steel Company Limited2016 Annual Report
119
III. SIGNIFICANT ACCOUNTING POLICIES AND ACCOUNTING ESTIMATES (CONTINUED)
9. FINANCIAL INSTRUMENTS (CONTINUED)
Impairment of financial assets (continued)
Financial assets carried at amortised cost
When an impairment loss has incurred, the amount of the loss is measured as the difference
between the asset’s carrying amount and the present value of estimated future cash flows
(excluding future credit losses that have not been incurred). The present value of the estimated
future cash flows is discounted at the financial asset’s original effective interest rate (i.e., the
effective interest rate computed at initial recognition) and the value of the relevant guarantee
into consideration. Accordingly, the relevant interest income is recognised based on the
discount rate of the present value of the estimated future cash flows when an impairment loss
has been incurred. In respect of loans and trade receivables, if the expectation of recovery does
not exist and all collateral is realised or transferred to the Group, loans and trade receivables
and the relevant impairment loss will be written off.
For assets that are individually significant, impairment assessment is made on an individual
basis, and an impairment loss is recognised in profit or loss when objective evidence of
impairment exists. Assets that are individually insignificant are assessed for impairment
individually. For assets that have been individually assessed (including individually significant
and individually insignificant), but for which there is no objective evidence of impairment, they
are included within a group of assets with similar credit risk characteristics and collectively
assessed for impairment. Assets that are individually assessed for impairment and for which an
impairment loss is recognised cannot be subject to a collective impairment assessment.
If, in a subsequent period, the amount of the impairment loss decreases and the decrease can
be related objectively to an event occurring after the impairment was recognised, the previously
recognised impairment loss is reversed and recognised in profit or loss. The reversal shall not
result in a carrying amount of the financial asset that exceeds what the amortised cost would
be had the impairment not been recognised at the reversal date.
Available-for-sale financial assets
If an available-for-sale financial asset is impaired, an amount comprising the difference between
its cost (net of any principal payment and amortisation) and its current fair value, less any
impairment loss previously recognised in profit or loss, is removed from other comprehensive
income and recognised in of profit or loss.
In the case of equity investments classified as available for sale, objective evidence would
include a significant or prolonged decline in the fair value of an investment below its cost. “Significant” is evaluated against the original cost of the investment and “prolonged” against
the period in which the fair value has been below its original cost. Where there is evidence of
impairment, the cumulative loss – measured as the difference between the acquisition cost
and the current fair value, less any impairment loss on that investment previously recognised in
profit or loss – is removed from other comprehensive income and recognised in profit or loss.
Impairment losses on equity instruments classified as available for sale are not reversed through
profit or loss. Increases in their fair value after impairment are recognised directly in other
comprehensive income.

Notes to Financial Statements (Continued)31 December 2016Renminbi Yuan
Maanshan Iron & Steel Company Limited2016 Annual Report
120
III. SIGNIFICANT ACCOUNTING POLICIES AND ACCOUNTING ESTIMATES (CONTINUED)
9. FINANCIAL INSTRUMENTS (CONTINUED)
Impairment of financial assets (continued)
Available-for-sale financial assets (continued)
The determination of what is “significant” or “prolonged” requires judgement. In making this
judgement, the Group evaluates, among other factors, the duration or extent to which the fair
value of an investment is less than its cost.
Impairment losses on debt instruments are reversed through profit or loss if the subsequent
increase in fair value of the instruments can be objectively related to an event occurring after
the impairment loss was recognised in profit or loss.
Financial assets carried at cost
If there is objective evidence that an impairment loss has been incurred on an unquoted equity
instrument that is not carried at fair value because its fair value cannot be reliably measured,
or on a derivative asset that is linked to and must be settled by delivery of such an unquoted
equity instrument, the amount of the loss is measured as the difference between the asset’s
carrying amount and the present value of estimated future cash flows discounted at the current
market rate of return for a similar financial asset. Impairment losses on these assets are not
reversed.
Transfer of financial assets
If the Group transfers substantially all the risks and rewards of ownership of the assets; it shall
derecognise the financial assets. Whereas, if it retains substantially all the risks and rewards of
ownership of the assets, it should not derecognise the financial assets.
When the Group has neither transferred nor retained substantially all the risks and rewards of
the financial asset, the following treatment shall be used: if the control over the financial asset
is lost, the Group should derecognise the financial asset and recognise the related assets
and liabilities incurred; if the Group has not lost control over the financial asset, the Group
recognises the financial asset to the extent of its continuing involvement of the financial asset
and recognises an associated liability.
Continuing involvement that takes the form of a guarantee over the transferred asset is
measured at the lower of the original carrying amount of the asset and the maximum amount of
consideration that the Group could be required to repay.

Maanshan Iron & Steel Company Limited2016 Annual Report
121
III. SIGNIFICANT ACCOUNTING POLICIES AND ACCOUNTING ESTIMATES (CONTINUED)
10. RECEIVABLES/LOANS AND ADVANCES TO CUSTOMERS
(1) The Group assesses impairment individually for financial assets that are individually
significant. The benchmark is RMB2 million. If there is objective evidence that an
impairment loss has been incurred, the amount of loss is charged to the profit or loss.
(2) For financial assets that are not individually significant, if there is objective evidence that
an impairment loss has been incurred, the amount is recognised as an impairment loss
and charged to profit or loss.
(3) Since loans and advances to customers have similar credit risk characteristics, they are
managed as a group of financial assets, and the bad debt provision for them is accrued
at 3% of the balance as of the year end.
11 INVENTORIES
Inventories include raw materials, work in progress, finished goods and spare parts.
Inventories are initially recognised at cost, which comprises purchase cost, processing cost,
and other costs. Costs of delivered inventories, other than construction contracts and spare
parts, are determined on the weighted average basis. Costs of spare parts, lower valued
consumables and packing materials are charged to profit or loss when issued.
Inventories are accounted for using the perpetual inventory system.
At the end of each reporting period, inventories shall be measured at the lower of cost and
net realisable value. If the cost is in excess of the amounts expected to be realised from their
sale or use, provision for inventories is recognised in profit or loss. When the circumstances
that previously caused inventories to be written down below cost no longer exist and the net
realisable value is higher than the carrying amount, the original amount of the write-down is
reversed and charged to profit or loss.
Net realisable value is the estimated selling price on normal business terms deducted by the
estimated costs to completion, the estimated selling expenses and related taxes. Provision is
considered on a category basis for raw materials, and on an individual basis for finished goods.
And for the inventories sold, the carrying amount of the inventories should be recognised as an
expense in the period in which revenue was recognised, and the inventory provision should be
written back accordingly, and the current period’s cost of sales should be reversed.

Notes to Financial Statements (Continued)31 December 2016Renminbi Yuan
Maanshan Iron & Steel Company Limited2016 Annual Report
122
III. SIGNIFICANT ACCOUNTING POLICIES AND ACCOUNTING ESTIMATES (CONTINUED)
12 LONG TERM EQUITY INVESTMENTS
Long term equity investments consist of equity investments in subsidiaries, joint ventures and
associates.
Long term equity investments are recognised at initial investment cost upon acquisition.
For a long term equity investment acquired through a business combination under common
control, the initial investment cost of the long-term equity investment shall be the absorbing
party’s share of the carrying amount of the owners’ equity of the party being absorbed in the
consolidated financial statements of the ultimate controlling party at combination date. The
difference between the initial investment cost and the carrying amount of cash paid, non-cash
assets transferred and liabilities assumed shall be adjusted to capital reserve. If the balance of
capital reserve is not sufficient, any excess shall be adjusted to retained earnings. Any other
comprehensive income previously recognised shall be accounted for on the same basis as
would have been required if the investee had directly disposed of the related assets or liabilities.
The portion recognised based on changes in the investee’s equity (other than net profit or loss,
other comprehensive income and profit distribution) is charged to profit or loss upon disposal
of such long term equity investment. For those partially disposed equity investments, gains or
losses upon disposal are proportionately recognised in profit or loss when they still constitutes
long term equity investments after the disposal and are fully charged to profit or loss when they
are reclassified to financial instruments after the disposal. For business combination involving
entities not under common control, the initial investment cost should be the cost of acquisition
(for step acquisitions not under common control, the initial investment cost is the sum of the
carrying amount of the equity investment in the acquiree held before the acquisition date and
the additional investment cost paid on the acquisition date), which is the sum of the fair value
of assets transferred, liabilities incurred or assumed and equity instruments issued. If the equity
investments in the acquiree involve other comprehensive income prior to the acquisition date,
when disposing of the investments, the relevant other comprehensive income will be accounted
for on the same basis as would have been required if the investee had directly disposed of the
related assets or liabilities. The portion recognised based on changes in the investee’s equity
(other than net profit or loss, other comprehensive income and profit distribution) is charged to
profit or loss upon disposal of such long term equity investment. For those partially disposed
equity investments, gains or losses upon disposal are proportionately recognised in profit or
loss when they still constitutes long term equity investments after the disposal and are fully
charged to profit or loss when they are reclassified to financial instruments after the disposal.
The initial investment cost of a long-term equity investment acquired otherwise than through
a business combination shall be determined as follows: for a long term equity investment
acquired by paying cash, the initial investment cost shall be the actual purchase price has
been paid plus those costs, taxes and other necessary expenditures directly attributable to
the acquisition of the long term equity investment; for those acquired by the issue of equity
securities, the initial investment cost shall be the fair value of the equity securities issued.

Maanshan Iron & Steel Company Limited2016 Annual Report
123
III. SIGNIFICANT ACCOUNTING POLICIES AND ACCOUNTING ESTIMATES (CONTINUED)
12 LONG TERM EQUITY INVESTMENTS (CONTINUED)
The cost method is applied for long term equity investments in the financial statements of the
Company when the investee is controlled by the Company. Control refers to the power over the
investee such that the Company is able to direct the relevant activities, has exposure or rights
to variable returns from its involvement with the investee and has the ability to use its power
over the investee to affect the amount of the investor’s returns.
When the cost method is adopted, long term equity investments are recorded at initial
investment cost. Profits or cash dividends declared to be distributed by the investee should be
recognised as investment income in the current period, except for the profits or cash dividends
that are declared and already included in the consideration paid to acquire the investment.
Also, the Group should consider whether there is impairment for the long term investments in
accordance with the related asset provision policy.
The equity method is applied for long term equity investments when the investees are jointly
controlled or significantly influenced by the Group. Joint control is the agreed sharing of
control of an arrangement, which exists only when decisions about the relevant activities
require unanimous consent of the parties sharing control. Significant influence is the power to
participate in the financial and operating policy decisions of the investee but is not control or
joint control over those policies.
When the equity method is adopted, the initial cost of an investment in excess of the share
of investee’s fair value on identifiable net assets remains unchanged; the initial cost of the
investment that falls short of the share of investee’s fair value on identifiable net assets shall be
adjusted, by which the difference had been charged to profit or loss.

Notes to Financial Statements (Continued)31 December 2016Renminbi Yuan
Maanshan Iron & Steel Company Limited2016 Annual Report
124
III. SIGNIFICANT ACCOUNTING POLICIES AND ACCOUNTING ESTIMATES (CONTINUED)
12 LONG TERM EQUITY INVESTMENTS (CONTINUED)
When the equity method is adopted, the investor recognises its investment income and adjusts
the carrying amount of the investment based on the post-acquisition change in the investor’s
share of net assets of the investee. The recognition of the investee’s results should be based
on the fair values of the individual identifiable assets of the investee according to the Group’s
accounting policies and accounting period. The gains and losses resulting from intercompany
transactions with the investee should be eliminated to the extent of the amount attributable
to the investor according to the shareholding (but if the gains and losses belong to asset
impairment losses, they should be entirely recognised). The recognition should be based on
the adjusted net profit of the investee. With respect to the long term equity investments in
associates and joint ventures acquired before the first-time adoption date, the remaining equity
investment difference arising from the amortisation using the straight-line method (if any) should
be recognised as investment income or loss. The investor’s share of profit distributions or cash
dividends declared by the investee is deducted from the carrying amount of the investment.
The Group recognises net losses incurred by the investee to the extent that the carrying
amount of the investment and other long term equity interests that are investment in the
investee in substance is reduced to zero, except for which the investor has an extra obligation
to assume loss of it. For the changes of equity in an investee other than profit or loss, the
investor adjusts the carrying amount of the investment and recognised it in shareholders’
equity.
When long term equity investments are disposed of, the difference between the carrying
amount and the actual proceeds received should be charged to profit or loss. For long term
equity investments under the equity method, if the method would not be adopted after the
disposal, the basis of the accounting treatment on the related other comprehensive income
under original equity method is the same as that on disposal of related assets or liabilities by
the investee, the amount recognised in the equity on the changes in other equity movements
except for the net profit or loss, other comprehensive income and profit distribution, should be
all charged to profit or loss for the year; if the equity method would continue to be adopted
after the disposal, the basis of the accounting treatment on the related other comprehensive
income under the original equity method is the same as that on disposal of related assets
or liabilities by the investee, the amount recognised in the equity on the changes in other
equity movements except for the net profit or loss, other comprehensive income and profit
distribution, should be charged to profit or loss for the year in proportion.
If the Company loses control of an investee with joint control or significant influence retained
after partial disposal of its shares, the equity investment should be accounted as long-term
investment in accordance with the rules of conversion from the cost method to the equity
method; if no joint control or significant influence was retained, the equity investment should be
accounted as financial assets. The difference between the fair value on the day of losing control
and the book value is recognised in profit or loss.

Maanshan Iron & Steel Company Limited2016 Annual Report
125
III. SIGNIFICANT ACCOUNTING POLICIES AND ACCOUNTING ESTIMATES (CONTINUED)
13 INVESTMENT PROPERTIES
Investment properties are interests in land and buildings (including the leasehold interest under
an operating lease for a property) held to earn rental income and/or for capital appreciation.
Investment properties are measured initially at cost. As for the subsequent expenses related to
investment properties, if the economic benefits of the assets are likely to flow into the Company
and its cost can be measured reliably, then it will be included in the cost of investment
properties. Otherwise, the subsequent cost will be calculated in the current profits and losses
when it occurs.
The Group uses the cost model for subsequent measurement of investment properties and
the estimated useful life is determined by the period that it can bring economic benefits to the
Group. Depreciation is calculated on the straight-line basis to write off the cost of each item
of investment properties over its estimated useful life of 24 to 50 years. The estimated residual
value is 3% to 10% of the cost.
14 PROPERTY, PLANT AND EQUIPMENT
Property, plant and equipment are recognised in situations when it is probable that their related
future economic benefits will flow to the Group, and their cost can be measured reliably. The
subsequent expenditure is recorded in the cost of fixed assets only if the conditions above
are met and the carrying amount of parts which had been replaced shall be derecognised;
otherwise, it is charged to profit or loss.
Property, plant and equipment are initially recorded at cost. The purchase cost of fixed assets
comprises its purchase price, related taxes, and any directly attributable expenditure for
bringing the asset to its working condition for its intended use.
Depreciation is calculated on the straight-line basis. The estimated useful lives, estimated
residual values, and the annual depreciation rates of each category of fixed assets are as
follows:
Estimated
useful life
Estimated
residual value
Annual
depreciation
rate
Buildings 10 – 30 years 3% 3.2 – 9.7%
Plant and machinery 10 – 15 years 3% 6.5 – 9.7%
Office equipment 5 – 10 years 3% 9.7 – 19.4%
Motor vehicles 5 – 8 years 3% 12.1 – 19.4%

Notes to Financial Statements (Continued)31 December 2016Renminbi Yuan
Maanshan Iron & Steel Company Limited2016 Annual Report
126
III. SIGNIFICANT ACCOUNTING POLICIES AND ACCOUNTING ESTIMATES (CONTINUED)
14 PROPERTY, PLANT AND EQUIPMENT (CONTINUED)
Where parts of an item of property, plant and equipment have different useful lives, the cost
of that item is allocated on a reasonable basis among the parts and each part is depreciated
separately.
Residual values, useful lives and the depreciation method are reviewed, and adjusted if
appropriate, at least at each financial year end.
15. CONSTRUCTION IN PROGRESS
Construction in progress represents a building under construction, which is stated at cost less
any impairment losses, and is not depreciated. Cost comprises the direct costs of construction
and capitalised borrowing costs on related borrowed funds during the period of construction.
Construction in progress is reclassified to the appropriate category of property, plant and
equipment when completed and ready for use.
16. BORROWING COSTS
Borrowing costs are interests and other expenses arising from borrowings of the Group,
including borrowing interest, amortisation of discounts or premiums, ancillary expenses and
exchange differences arising from foreign currency borrowings.
All the borrowing costs that are directly attributable to the construction or production of all
qualifying assets are capitalised and other borrowing costs are treated as an expense. A
qualifying asset is defined as a fixed asset, investment property or inventory that necessarily
takes a substantial period of time to get ready for its intended use or sale.
The capitalisation of borrowing costs commences when:
(1) expenditures for the assets are incurred;
(2) borrowing costs are incurred; or
(3) the acquisition and construction activities that are necessary to bring the assets to get
ready for their intended use or sale have commenced.
The capitalisation of borrowing costs ceases when the asset being acquired or constructed
is substantially ready for its intended use or sale and borrowing costs incurred thereafter are
treated as an expense.

Maanshan Iron & Steel Company Limited2016 Annual Report
127
III. SIGNIFICANT ACCOUNTING POLICIES AND ACCOUNTING ESTIMATES (CONTINUED)
16. BORROWING COSTS (CONTINUED)
Within the capitalisation period, the amounts of capitalised borrowing costs for each
accounting period are determined by the following methods:
(1) For specific borrowings, the borrowing costs eligible for capitalisation are the actual
borrowing costs incurred during the current period deducted by any temporary interest
or investment income.
(2) For general borrowings, the borrowing costs eligible for capitalisation are determined
by applying a capitalisation rate to the weighted average of capital expenditure that
exceeds the specific borrowings.
Capitalisation of borrowing costs is suspended during the extended periods in which the
acquisition or construction of a property, plant and equipment is interrupted abnormally and the
interruption lasts for more than three months until the acquisition or construction is resumed.
17. INTANGIBLE ASSETS
Intangible assets are recognised if and only if it is probable that the related economic benefits
will flow to the Group and the costs of which can be measured reliably. Intangible assets are
measured at cost initially. However, for an intangible asset acquired in the business combination
not under common control whose fair value can be reliably measured, it is separately
recognised and is measured at its fair value.
The useful lives of intangible assets are assessed based on estimated economic benefit
periods. Those intangible assets without foreseeable economic benefit periods are classified as
intangible assets with indefinite useful lives.
The useful lives of the Group’s intangible assets are as follows:
Useful life
Concession contract 25 years
Land use rights 50 years
Mining rights 25 years
Patent Rights 3 years
Concession right is the right to operate water supply factories. It is recorded at cost minus
accumulative amortisations and impairment, if any. The amortisation is calculated in a period of
25 years using the straight-line method.

Notes to Financial Statements (Continued)31 December 2016Renminbi Yuan
Maanshan Iron & Steel Company Limited2016 Annual Report
128
III. SIGNIFICANT ACCOUNTING POLICIES AND ACCOUNTING ESTIMATES (CONTINUED)
17. INTANGIBLE ASSETS (CONTINUED)
For internally generated plants and other buildings, the land use rights and buildings are
accounted for as intangible assets and fixed assets, respectively. With respect to the land use
right purchased together with buildings, the acquisition cost is allocated between the two parts
proportionately, or otherwise, it is wholly accounted for as a fixed asset if it is difficult to be
allocated reasonably.
Intangible assets with finite useful lives are amortised over the useful lives on the straight-line
basis. The Group reviews the useful lives and amortisation method of intangible assets with
finite useful lives, and adjusts then if appropriate, at least at the end of each reporting period.
The expenditures for internal research and development projects of the Group were classified
as research expenditures and development expenditures. “Research” refers to the creative and
planned investigation to acquire and understand new scientific or technological knowledge.
“Development” refers to the application of research achievements and other knowledge to
a certain plan or design, prior to the commercial production or use, so as to produce any
new material, device or product, or substantially improved material, device and product. All
research costs are charged to profit or loss as incurred. Expenditure incurred on projects to
develop new products is capitalised and deferred only when the Group can demonstrate the
technical feasibility of completing the intangible asset so that it will be available for use or sale,
its intention to complete and its ability to use or sell the asset, how the asset will generate
future economic benefits, the availability of resources to complete the project and the ability
to measure reliably the expenditure during the development. Product development expenditure
which does not meet these criteria is expensed when incurred.
18. IMPAIRMENT OF ASSETS
The Group determines the impairment of assets according to the following method, except for
inventories, deferred tax assets and financial assets.
The Group assesses whether an indication of impairment exists as at the end of each reporting
period, and performed impairment test on estimation of the asset’s recoverable amount if
such indications exist. For the goodwill acquired in business combinations and intangible
assets with indefinite lives, an annual impairment test is performed no matter whether there
is any indication of impairment. Intangible assets that not available for use are also tested for
impairment annually.

Maanshan Iron & Steel Company Limited2016 Annual Report
129
III. SIGNIFICANT ACCOUNTING POLICIES AND ACCOUNTING ESTIMATES (CONTINUED)
18. IMPAIRMENT OF ASSETS (CONTINUED)
An asset’s recoverable amount is calculated as the higher of the asset’s fair value less costs to
sell and the present value of estimated future cash flows of the assets. The recoverable amount
is calculated for an individual asset unless it is not applicable, in which case the recoverable
amount is determined for the asset groups to which the asset belongs. An asset group is
recognised based on whether the cash inflows generated by the asset group are largely
independent to those of other assets or asset groups.
When the recoverable amount of an asset or an asset group is less than its carrying amount,
the carrying amount is reduced to its recoverable amount. The reduction amount is charged to
profit or loss and an impairment allowance is provided.
As to the impairment test of goodwill, the carrying amount of goodwill arising from a business
combination is allocated to the associated asset groups based on reasonable approaches at
the date of acquisition. When it is not applicable to allocate to the associated asset groups,
the goodwill is allocated to an associated combination of asset groups. The associated asset
groups or combination of asset groups represent the lowest level within the entity at which the
goodwill is monitored for internal management purposes; and are not larger than a segment
based on the Group’s reporting segments determined.
When making an impairment test on the relevant asset groups or combinations of asset groups
containing goodwill, if any evidence shows that the impairment of asset groups or combinations
of asset groups is possible, the enterprise shall first perform an impairment test on the asset
groups or combinations of asset groups not containing goodwill, calculate the recoverable
amount, compare it with the relevant carrying amount and recognise the corresponding
impairment loss. Then the enterprise shall perform an impairment test of the asset groups or
combinations of asset groups containing the goodwill, and compare the carrying amount of
these asset groups or combinations of asset groups with the recoverable amount. Where the
recoverable amount of the relevant assets or combinations of the asset groups is lower than
the carrying amount thereof, the amount of the impairment loss shall first charge against the
carrying amount of goodwill which is apportioned to the asset group or combination of asset
groups, then charge it against the carrying amount of other assets in proportion to the weight
of other assets in the asset group or combination of asset groups with the goodwill excluded.
Impairment losses cannot be reversed in the subsequent accounting periods.

Notes to Financial Statements (Continued)31 December 2016Renminbi Yuan
Maanshan Iron & Steel Company Limited2016 Annual Report
130
III. SIGNIFICANT ACCOUNTING POLICIES AND ACCOUNTING ESTIMATES (CONTINUED)
19. PAYROLL AND EMPLOYEE BENEFITS PAYABLE
Employee benefits are all forms of consideration given by an entity in exchange for service
rendered by employees or the termination of employment, including short-term employee
benefits, post-employment benefits, termination benefits and other long-term employee
benefits. The benefits that the Group provides to the spouses, children and dependents
of employees, the late employees’ family and other beneficiaries also shall be deemed as
employee benefits.
Short-term employee benefits payable
A liability when an employee has provided service in exchange for employee benefits to be
paid in the future and an expense when the entity consumes the economic benefit arising from
service provided by an employee in exchange for employee benefits.
Post-employment benefit (defined contribution plans)
Expenditures for employees’ endowment insurance managed by the local government and
annuity plan established by the Group are capitalised in the related assets or charged to profit
or loss.
Post-employment benefit (defined benefit plans)
The Group operates a defined benefit pension plan which requires contributions to be made
to a separately administered fund. The benefits are unfunded. The cost of providing benefits
under the defined benefit plan is determined using the projected unit credit actuarial valuation
method.
Remeasurements arising from defined benefit pension plans, comprising actuarial gains and
losses, the effect of the asset ceiling (excluding amounts included in net interest on the net
defined benefit liability) and the return on plan assets (excluding amounts included in net
interest on the net defined benefit liability), are recognised immediately in the consolidated
statement of financial position with a corresponding debit or credit to retained profits through
other comprehensive income in the period in which they occur. Remeasurements are not
reclassified to profit or loss in subsequent periods.

Maanshan Iron & Steel Company Limited2016 Annual Report
131
III. SIGNIFICANT ACCOUNTING POLICIES AND ACCOUNTING ESTIMATES (CONTINUED)
19. PAYROLL AND EMPLOYEE BENEFITS PAYABLE (CONTINUED)
Post-employment benefit (defined benefit plans) (continued)
Past service costs are recognised in profit or loss at the earlier of:
• the date of the plan amendment or curtailment; and
• the date that the Group recognises restructuring-related costs
Net interest is calculated by applying the discount rate to the net defined benefit liability or
asset. The Group recognises the following changes in the net defined benefit obligation under
“cost of sales” and “administrative expenses” in the consolidated statement of comprehensive
income by function:
• service costs comprising current service costs, past-service costs, gains and losses on
curtailments and non-routine settlements
• net interest expense or income comprising interest income on plan assets, interest
expense on plan obligations and the interest influenced by asset limit.
Termination benefits
An entity is required to recognise termination benefits at the earlier of when the entity can no
longer withdraw an offer of those benefits and when it recognises any related restructuring
costs.
Other long-term employee benefits
Other long-term employee benefits apply the same recognition and measurement as for post-
employment benefits but all changes in the carrying amount of liabilities for other long-term
employment benefits are recognised in profit or loss.
20. PROVISIONS
Except for contingent considerations or contingent liabilities assumed for business combination
not under common control, a provision is recognised if:
(1) the obligation is a present obligation assumed by the Group; and
(2) it is probable that an outflow of resources embodying economic benefits will be required
to settle the obligation; and
(3) a reliable estimate can be made of the amount of the obligation.

Notes to Financial Statements (Continued)31 December 2016Renminbi Yuan
Maanshan Iron & Steel Company Limited2016 Annual Report
132
III. SIGNIFICANT ACCOUNTING POLICIES AND ACCOUNTING ESTIMATES (CONTINUED)
20. PROVISIONS (CONTINUED)
Provisions are initially measured at the best estimate of the expenditure required to settle the
present obligation, after considering risks, uncertainties, present value, etc. Provisions shall be
reviewed at the end of each reporting period and adjusted to reflect the current best estimate.
For the provision acquired from business combination, it should be initially measured at fair
value. After initial recognition, the amount of provision should be subsequently measured at the
higher of the amount being recognised and the initially recognised amount after deducting the
accumulated amortisation in accordance with the policy for revenue recognition.
21. REPURCHASE AND REVERSE REPURCHASE TRANSACTIONS
Assets sold under agreements to repurchase at a specified future date (“repos”) are not
derecognised from the statement of financial position. The corresponding cash received,
including accrued interest, is recognised as “repurchase agreement” on the statement of
financial position, reflecting the economic nature that such cash is a loan to the Group. The
difference between the sale and repurchase prices is treated as an interest expense and is
accrued over the life of the agreement using the effective interest rate method.
Conversely, assets purchased under agreements to resell at a specified future date (“reverse
repos”) are not recognised on the statement of financial position as a “reverse repurchase
agreement.” The corresponding cash paid, including accrued interest, is recognised as a
“reverse repurchase agreement” in the statement of financial position. The difference between
the purchase and resale prices is treated as interest income and is accrued over the life of the
agreement using the effective interest rate method.

Maanshan Iron & Steel Company Limited2016 Annual Report
133
III. SIGNIFICANT ACCOUNTING POLICIES AND ACCOUNTING ESTIMATES (CONTINUED)
22. REVENUE
Revenue is recognised when it is probable that the economic benefits associated with a
transaction will flow to the Group and the relevant amounts of revenue can be measured
reliably, as well as all the following conditions are satisfied.
Revenue from the sale of goods
Revenue from the sale of goods is recognised when the significant risks and rewards in relation
to ownership of the goods have been transferred to the buyer, the Group retains neither
continuing management nor effective control over the goods sold; and the relevant amounts of
costs can be measured reliably. The revenue from the sale of goods shall be determined by the
amount received or receivable by the purchaser stipulated in the contract or agreement, unless
the amount received or receivable stipulated in the contract or agreement is not at fair value.
If the receivable method of the amount stated in the contract or agreement is made by the
deferred method and it contains the nature of financing, the revenue should be determined by
the fair value of the amount receivable as stated in the contract or agreement.
Revenue from the rendering of services
As of the end of the reporting period, when the outcome of a transaction involving the rendering
of services can be estimated reliably, revenue is recognised by reference to the percentage
of completion method; otherwise, revenue is recognised only to the extent of the expenses
recognised that are recoverable. The outcome of a transaction can be estimated reliably when
all the following conditions are satisfied: the amount of revenue can be measured reliably; it
is probable that the economic benefits associated with the transaction will flow to the Group;
the stage of completion of the transaction can be measured reliably; the costs incurred for the
transaction and the costs to complete the transaction can be measured reliably. The stage of
completion is determined by the proportion of costs incurred to date to the estimated total
costs of the transaction. For the revenue from the rendering of services, it is determined by the
amount received or receivable from the party receiving the service as stated in the contract or
agreement unless the amount received or receivable as stated in the contract or agreement is
not at fair value.
When the Group enters into a contract or agreement with other parties which contains both
the sale of goods and rendering of services, if the portions of the sale of goods and rendering
of services can be separately measured, the portions of the sale of goods and rendering of
services are measured individually. If the portions of the sale of goods and rendering of services
cannot be separately measured or even if they could be separately measured but cannot be
measured individually, it is deemed to be the sale of goods.

Notes to Financial Statements (Continued)31 December 2016Renminbi Yuan
Maanshan Iron & Steel Company Limited2016 Annual Report
134
III. SIGNIFICANT ACCOUNTING POLICIES AND ACCOUNTING ESTIMATES (CONTINUED)
22. REVENUE (CONTINUED)
Interest income
Interest income is recognised based on the time horizon of the use of the Group’s cash by
others and the effective interest rate.
Royalty income
Royalty income is recognised according to the agreed contract terms.
Lease income
Lease income from operating leases is recognised over the lease terms on the straight-line
basis. Contingent lease income is recognised when incurred.
23. GOVERNMENT GRANTS
Government grants are recognised where there is reasonable assurance that the grant will
be received and all attaching conditions will be complied with. If a government grant is in the
form of a transfer of a monetary asset, it is measured at the amount received or receivable. If a
government grant is in the form of a non-monetary asset, it is measured at fair value. If the fair
value cannot be reliably determined, it is measured at a nominal amount.
Asset-related government grants are recognised when the government document designates
that the government grants are used for constructing or forming long-term assets. If the
government document is inexplicit, the Company should make a judgement based on the basic
conditions to obtain the government grants, and recognises them as asset-related government
grants if the conditions are to form long-term assets through construction or other method.
Otherwise, the government grants should be income-related.
If the grant is a compensation for related expenses or losses already incurred, the grant is
recognised immediately in profit or loss for the period. A government grant related to an
asset is recognised as deferred income, and evenly amortised to profit or loss over the useful
life of the related asset. A government grant measured at a nominal amount is recognised
immediately in profit or loss for the period.

Maanshan Iron & Steel Company Limited2016 Annual Report
135
III. SIGNIFICANT ACCOUNTING POLICIES AND ACCOUNTING ESTIMATES (CONTINUED)
24. INCOME TAX
Income tax comprises current tax and deferred tax, and is normally recognised as income or
expense in profit or loss, except for goodwill generated in a business combination or items that
have been recognised directly in equity.
Current tax assets and liabilities for the current and prior periods are measured at the amount
expected to be recovered or paid according to the taxation laws and regulations.
Based on the differences between the carrying amount of an asset or liability in the statement
of financial position and its tax base, and the differences between the carrying amounts of
some items that have a tax base but are not recognised as assets and liabilities and their tax
base, the Group adopts the liability method for the provision of deferred tax.
A deferred tax liability is recognised in respect of all taxable temporary differences except those
arising from:
(1) the initial recognition of goodwill; or the initial recognition of an asset or liability in a
transaction which is not a business combination, and at the time of the transaction,
affects neither accounting profit nor taxable profit; and
(2) as to temporary differences associated with subsidiaries, joint ventures and associates:
the Group is able to control the timing of the reversal of the temporary difference and it is
probable that the temporary difference will not reverse in the foreseeable future.
A deferred tax asset is recognised in respect of all deductible temporary differences to the
extent that it is probable that taxable profit will be available against which the deductible
temporary difference will be utilised except those arising from the initial recognition of an asset
or liability in a transaction which:
(1) is not a business combination, and at the time of the transaction, affects neither
accounting profit nor taxable profit; and
(2) as to deductible temporary differences associated with subsidiaries, joint ventures and
associates: a deferred tax asset is recognised to the extent that it is probable that the
temporary difference will reverse in the foreseeable future, and taxable profit will be
available against which the temporary difference can be utilised.
At the end of each reporting period, deferred tax assets and liabilities are measured, based on
taxation laws and regulations, at the tax rates that are expected to apply to the period when the
asset is realised or the liability is settled, taking into account the income tax effect of expected
asset realisation or liability settlement at the end of each reporting period.

Notes to Financial Statements (Continued)31 December 2016Renminbi Yuan
Maanshan Iron & Steel Company Limited2016 Annual Report
136
III. SIGNIFICANT ACCOUNTING POLICIES AND ACCOUNTING ESTIMATES (CONTINUED)
24. INCOME TAX (CONTINUED)
The carrying amount of a deferred tax asset is reviewed at the end of each reporting period
and is reduced to the extent that it is no longer probable that sufficient taxable profits will be
available to allow the related tax benefit to be utilised. Any such reduction is reversed to the
extent that it becomes probable that sufficient taxable profits will be available.
Deferred tax assets and deferred tax liabilities are offset if a legally enforceable right exists to
set off current tax assets against current tax liabilities and the deferred taxes relate to the same
taxable entity and the same taxation authority.
25. LEASES
A lease that transfers substantially all of the risks and benefits of ownership of an asset to the
lessee is termed as a finance lease. All the other leases are termed as operating leases.
As lessee in operating leases
Rentals payable under operating leases are charged to profit or loss or capitalised on the
straight-line basis over the lease terms, and contingent rental payment is charged to profit or
loss when it incurs.
As lessor in operating leases
Rentals receivable under operating leases are credited to profit or loss over the lease terms on
the straight-line basis.
26. PROFIT DISTRIBUTION
The cash dividend of the Company is recognised as a liability upon the approval at the annual
general meeting.
27. SAFETY PRODUCTION RESERVE
Safety production reserve set aside in compliance with relevant regulations, is included in the
cost of relevant products or recognised in profit or loss for the period, and credited to the
special reserve at the same time. When safety production reserve is utilised, it is accounted for
based on whether a fixed asset is generated or not: if the costs incurred can be categorised
as expenditure, the costs incurred should be charged against the special reserve; if the reserve
is used to build up fixed assets, the costs should be charged to construction in progress,
and reclassified to fixed assets when the projects reach the status ready for intended use.
Meantime, expenditures in building up fixed assets are directly charged against the special
reserve with the accumulated depreciation recognised at the same amount.

Maanshan Iron & Steel Company Limited2016 Annual Report
137
III. SIGNIFICANT ACCOUNTING POLICIES AND ACCOUNTING ESTIMATES (CONTINUED)
28. GENERAL RESERVE
According to the relevant policy of the MOF, Masteel Group Financial Co., Ltd. (“Masteel
Financial”) accrues the general reserve from net profit as profit distribution. After 1 July 2012,
the balance of the general reserve should not be less than 1.5% of the balance of the risk
assets.
29. FAIR VALUE MEASUREMENT
The Group measures listed equity investment instruments at fair value at the end of each
reporting period. Fair value is the price that would be received to sell an asset or paid to
transfer a liability in an orderly transaction between market participants at the measurement
date. The fair value measurement is based on the presumption that the transaction to sell the
asset or transfer the liability takes place in the principal market for the asset or liability or in
the most advantageous market for the asset or liability when a principal market is absent. The
principal or the most advantageous market must be accessible to by the Group. The fair value
of an asset or a liability is measured using the assumptions that market participants would use
when pricing the asset or liability, assuming that market participants act in their economic best
interest.
A fair value measurement of a non-financial asset takes into account a market participant’s
ability to generate economic benefits by using the asset in its highest and best use or by selling
it to another market participant that would use the asset in its highest and best use.
The Group uses valuation techniques that are appropriate in the circumstances and for which
sufficient data and other supporting information are available to measure fair value, giving
priority to the use of relevant observable inputs, and using unobservable inputs only when
observable inputs are unavailable or not feasible to obtain.
All assets and liabilities for which fair value is measured or disclosed in the financial statements
are categorised within the fair value hierarchy, described as follows, based on the lowest level
input that is significant to the fair value measurement as a whole:
Level 1 – Quoted (unadjusted) market prices in active markets for identical assets or
liabilities
Level 2 – Valuation techniques for which the lowest level input that is significant to the fair
value measurement is directly or indirectly observable
Level 3 – Valuation techniques for which the lowest level input that is significant to the fair
value measurement is unobservable

Notes to Financial Statements (Continued)31 December 2016Renminbi Yuan
Maanshan Iron & Steel Company Limited2016 Annual Report
138
III. SIGNIFICANT ACCOUNTING POLICIES AND ACCOUNTING ESTIMATES (CONTINUED)
29. FAIR VALUE MEASUREMENT (CONTINUED)
For assets and liabilities that are recognised in the financial statements on a recurring basis,
the Group determines whether transfers have occurred between levels in the hierarchy by re-
assessing categorisation at the end of each reporting period.
30. SIGNIFICANT ACCOUNTING JUDGEMENTS AND ESTIMATES
The preparation of the Group’s financial statements requires management to make judgments,
estimates and assumptions that affect the reported amounts of revenues, expenses, assets and
liabilities, and the disclosure of contingent liabilities, at the reporting date. However, uncertainty
about these assumptions and estimates could result in outcomes that could require a material
adjustment to the carrying amounts of the assets or liabilities affected in the future.
Judgements
In the process of applying the Group’s accounting policies, management has made the
following judgements, which have significant effect on the amounts recognised in the financial
statements:
Going concern
As stated in Note II, the going-concern ability of the Group relies on the cash inflows from
borrowings and operating activities, in order to maintain sufficient cash on the due date of
the relevant liabilities. The uncertainty of the Group’s going-concern ability involves once the
Group cannot obtain sufficient cash. The financial statements do not include any necessary
adjustments related to book value and classification of assets and liabilities when the Group
cannot operate continuously.
Operating lease – as lessor
The Group has entered into operating leases on its investment properties. The Group has
determined that it retains all the significant risks and rewards of ownership of these properties
which are leased out and hence has classified the leases as operating leases according to the
lease contracts.
Classification between investment properties and owner-occupied properties
The Group determines whether a property qualifies as an investment property, and has
developed criteria in making that judgement. Investment property is a property held to earn
rentals or for capital appreciation or both. Therefore, the Group considers whether a property
generates cash flows largely independently of the other assets held by the Group.

Maanshan Iron & Steel Company Limited2016 Annual Report
139
III. SIGNIFICANT ACCOUNTING POLICIES AND ACCOUNTING ESTIMATES (CONTINUED)
30. SIGNIFICANT ACCOUNTING JUDGEMENTS AND ESTIMATES (CONTINUED)
Judgements (continued)
Classification between investment properties and owner-occupied properties (continued)
Some properties comprise a portion that is held to earn rentals or for capital appreciation and
another portion that is held for use in the production or supply of goods or services or for
administrative purposes. If these portions could be sold separately (or leased out separately
under a finance lease), the portions are accounted for separately. If the portions could not be
sold separately, the property is an investment property only if the portion held for use in the
production or supply of goods or services or for administrative purposes is not significant.
Judgement is made on an individual basis to determine whether ancillary services are so
significant that a property does not qualify as an investment property.
Judgement on entities in which the Group holds less than 20% of voting rights but has a significant influence over them
As of 31 December 2016, the Group holds 16.34% equity interests in Anhui Xinchuang
Economize Resource Co., Ltd. (“Xinchuang Economize Resource”). The directors represent
that the Company is able to exercise significant influence over Xinchuang Economize Resource
although the equity interests that the Company holds in Xinchuang Economize Resource are
less than 20%, according to the requirements of the Articles of Association of Xinchuang
Economize Resource, the Company designated one director and one supervisor to Xinchuang
Economize Resource. Thus, the Company can exercise significant influence over Xinchuang
Economize Resource, and the investment in Xinchuang Economize Resource is accounted for
as an associate.
As of 31 December 2016, the Group holds 12% equity interests in Anhui Linhuan Chemical
Co., Ltd. (“Anhui Linhuan Chemical”). The directors represent that the Company is able to
exercise significant influence over Anhui Linhuan Chemical although the equity interests that the
Company holds in Anhui Linhuan Chemical are less than 20%, according to the requirements
of the Articles of Association of Anhui Linhuan Chemical, the Company designated one director
to Anhui Linhuan Chemical. Thus, the Company can exercise significant influence over Anhui
Linhuan Chemical, and the investment in Anhui Linhuan Chemical is accounted for as an
associate.

Notes to Financial Statements (Continued)31 December 2016Renminbi Yuan
Maanshan Iron & Steel Company Limited2016 Annual Report
140
III. SIGNIFICANT ACCOUNTING POLICIES AND ACCOUNTING ESTIMATES (CONTINUED)
30. SIGNIFICANT ACCOUNTING JUDGEMENTS AND ESTIMATES (CONTINUED)
Judgements (continued)
Judgement on entities in which the Group holds more than 50% of voting rights but does not have control over them
In 2016, the Company established Mascometal Co., Ltd. (“Mascometal”), a company jointly
established with a foreign invested enterprise (FIE), Asco Industries Ltd., in which the Company
and Asco Industries Ltd. hold 75% and 25% of equity interests respectively. According to
the requirements of the Articles of Association of Mascometal, the Company designated
three directors in the Board of Directors and Asco Industries Ltd. designated one director.
According to the Articles of Association of Mascometal, some important financial and operating
decisions must be approved by all the directors. According to the requirements of the Articles
of Associate as above, the directors represent that the Company is unable to exercise control
over Mascometal, but is able to exercise joint control over Mascometal with Asco Industries
Ltd.. Therefore, Mascometal is accounted for as a joint venture, and is not included in the
consolidation scope of the Group.
Estimation uncertainty
The key assumptions concerning the future and other key sources of estimation uncertainty at
the end of the reporting period, that have a significant risk of causing a material adjustment to
the carrying amounts of assets and liabilities within the next financial year, are discussed below.
Impairment of non-financial assets (other than goodwill)
The Group assesses whether there are any indicators of impairment for all non-financial assets
at each reporting date. Indefinite life intangible assets are tested for impairment annually and at
other times when such an indicator exists. Other non-financial assets are tested for impairment
when there are indicators that the carrying amounts may not be recoverable. When the carrying
amount of an asset or assets group is higher than its recoverable amount, that is the higher
of fair value less costs to sell and the present value of estimated future cash flows, the related
asset or assets group is impaired. The fair value less costs to sell of an asset is determined as
the contractual price of similar assets in an arm’s length transaction, or the observable market
price of similar assets, after deducting the additional costs directly attributable to the disposal
of this asset. When value in use calculations are undertaken, management must estimate
the expected future cash flows from the asset or cash-generating unit and choose a suitable
discount rate in order to calculate the present value of those cash flows.
Maanshan Iron & Steel Company Limited2016 Annual Report
141
III. SIGNIFICANT ACCOUNTING POLICIES AND ACCOUNTING ESTIMATES (CONTINUED)
30. SIGNIFICANT ACCOUNTING JUDGEMENTS AND ESTIMATES (CONTINUED)
Estimation uncertainty (continued)
Deferred tax assets
Deferred tax assets are recognised to the extent that it is probable that taxable profit will be
available against which the deductible temporary difference and unused tax credit can be
utilised. Significant management judgement is required to determine the amount of deferred tax
assets that can be recognised, based upon the likely timing and level of future taxable profits
together with tax planning strategies.
Estimation of useful life of fixed assets
The Group’s management determines the estimated useful life of its fixed assets. This estimate
is based on the historical experience of the actual useful lives of fixed assets of similar nature
and functions.
Provision for bad debts of receivables
The Group’s management determines the provision for impairment of receivables. This estimate
is based on the credit history of its customers and the current market condition. Management
reassesses the estimation at the end of each reporting period.
Estimation of inventories under net realisable value
Management reviews the condition of inventories (including spare parts) of the Group and their
net realisable values and makes provision accordingly. The Group carries out an inventory
review at the end of each reporting period and makes provision accordingly.
Net realisable value of inventories is the estimated selling price in the ordinary course of
business, less estimated costs of completion and selling expenses. These estimates are
based on the current market condition and the historical experience of manufacturing and
selling products of a similar nature. Management reassesses the estimation at the end of each
reporting period.

Notes to Financial Statements (Continued)31 December 2016Renminbi Yuan
Maanshan Iron & Steel Company Limited2016 Annual Report
142
III. SIGNIFICANT ACCOUNTING POLICIES AND ACCOUNTING ESTIMATES (CONTINUED)
31. CHANGES IN ACCOUNTING POLICIES AND ESTIMATES
Changes in accounting policies
Changes in tax disclosure
In 2016, the Group adjusted the “business tax and surcharges” item in the statement of
profit or loss to “tax and surcharges” in accordance with the requirements of “Value Added
Tax Accounting Treatment Regulations” (Accounting [2016] No. 22). The real estate tax, land
usage tax, vehicle and vessel tax, stamp tax and other related taxes relating to operating
activities since 1 May 2016 were recorded in “tax and surcharges” item instead of “general
administrative expenses”; those occurred before 1 May 2016 were still recorded in “general
administrative expenses”. As a result of the above requirements, the contents disclosed in “tax
and surcharges” and “general administrative expenses” in 2016 were different from those in
2015, but there was no impact on net profit and shareholders’ equity for 2016 and 2015.
Changes in accounting estimates
In accordance with the CAS 4 – Fixed Assets and CAS 28 – Changes in Accounting Policy and
Estimate and Correction of Errors, the subsidiary of the Group, Anhui Changjiang Iron and Steel
Co., Ltd. (“Anhui Changjiang Iron and Steel”) adjusted the useful life of fixed assets to ensure
the adjusted useful life to meet the estimates on the period that the future economic benefits
by considering actual useful life of the fixed assets accordingly. The new useful life applied from
1 April 2016 by adopting prospective method. On 14 March 2016, the change was approved
by the board of directors in “Resolution of the Board of Directors of Changjiang Iron and Steel
[2016] No.2”.On 30 March 2016, the change was also reviewed and approved by the board
of directors of the Company in “Resolution of the Board of Directors of the Company [2016]
No. 3”.
Since 1 April 2016, Anhui Changjiang Iron and Steel has made the following adjustments to the
depreciable life of fixed assets:
Items
Estimated
useful life
before
adjustment
(year)
Estimated
useful life
after
adjustment
(year) Remark
Buildings 20 30 Increased 10 years
Plant and machinery 10 15 Increased 5 years
Motor vehicles 5 8 Increased 3 years
Office (electronic) equipment 10 5 Decreased 5 years

Maanshan Iron & Steel Company Limited2016 Annual Report
143
III. SIGNIFICANT ACCOUNTING POLICIES AND ACCOUNTING ESTIMATES (CONTINUED)
31. CHANGES IN ACCOUNTING POLICIES AND ESTIMATES (CONTINUED)
Changes in accounting estimates (continued)
The above changes of accounting estimates have the following impacts on the financial
statement of the year ended 31 December 2016:
The Group:
2016
Before changes
in accounting
estimates
Changes in
useful life
After changes
in accounting
estimates
Closing balance/
transaction
amount during
the year
Closing balance/
transaction
amount during
the year
Carrying amount of fixed assets 35,413,406,163 109,195,552 35,522,601,715
Depreciation 3,486,961,669 (109,195,552) 3,377,766,117
Total profit 1,259,379,988 109,195,552 1,368,575,540
Income tax 84,581,346 27,298,888 111,880,234
Net profit 1,174,798,642 81,896,664 1,256,695,306
Accumulated loss (272,465,286) 81,896,664 (190,568,622)

Notes to Financial Statements (Continued)31 December 2016Renminbi Yuan
Maanshan Iron & Steel Company Limited2016 Annual Report
144
IV. TAX
1. THE PRINCIPAL KINDS OF TAXES AND THE RELATED RATES ARE AS FOLLOWS:
Value-added tax The output VAT rate of domestic sales is 17%. VAT payable is
the net difference between output VAT and deductible input VAT.
According to national tax regulations, the Company adopted the
“Exempt, Offset, Refund” arrangements for VAT in export sales with
the refund rates of 9% to 17%. A subsidiary of the Group adopted
the “levy first, refund afterwards” arrangements for VAT in its own
export sales.
Business tax Payable based on 3% to 5% of the taxable income. Since 1 May
2016, business tax was replaced by VAT.
City construction and
maintenance tax
Payable based on 5% to 7% of the net VAT and business tax to be
paid.
Income tax The Group and certain of its subsidiaries were subject to corporate
income tax (“CIT”) at a rate of 25% on their assessable profits.
Maanshan Iron & Steel (HK) Limited (“Ma Steel (HK)”) was
established and registered in Hong Kong (China), the applicable
income tax rate is 16.5%. Maanshan Iron and Steel (Australia)
Proprietary Limited (“Ma Steel (Australia”)) was established and
registered in Australia, the applicable income tax rate is 30%. MG
Trading and Development GmbH (“MG Trading”) was established
and registered in Germany, the applicable income tax rate is 30%.
MG-VALDUNES S.A.S was established and registered in France,
the applicable income tax rate is 33.3%. MASTEEL AMERICA INC
(“Masteel America”) was established and registered in the United
States, the applicable income tax rate is 30%.
Maanshan Iron & Steel Company Limited2016 Annual Report
145
Land appreciation tax Payable based on appreciation of land use right and building at
a progressive tax rate of 30%-60% as a result of the transfer of
ownership
Education surcharge Payable based on 3% of the net VAT and business tax to be paid.
Local education
surcharge
Payable based on 2% of the net VAT and business tax to be paid.
Real estate tax Payable based on a certain percentage of the cost of real estate
with legal title in accordance with relevant regulations.
Other taxes In accordance with tax laws and other relevant regulations.
2. TAX BENEFITS
(1) In 2015, the New and High Technology Enterprise certification of the Group’s subsidiary,
Maanshan Masteel Huayang Equipment Inspection & Engineering Co., Ltd. (“Huayang
Equipment”) was renewed by the subsidiary’s application to the authority and the entity
was recognised by local authority as New and High Technology Enterprises. The period
of validity is three years from 1 January 2015. In 2016, the applicable income tax rate is
15% accordingly.
(2) In 2014, the New and High Technology Enterprise certification of the Group’s subsidiary,
Anhui Masteel Holly Industrial Co., Ltd. (“Holly Industrial”), was renewed by the
subsidiary’s application to the authority and the entity was recognised by the local
authority as a New and High Technology Enterprise. The period of validity is three years
from 1 January 2014. In 2016, the applicable income tax rate is 15% accordingly.
IV. TAX (CONTINUED)
1. THE PRINCIPAL KINDS OF TAXES AND THE RELATED RATES ARE AS FOLLOWS: (CONTINUED)

Notes to Financial Statements (Continued)31 December 2016Renminbi Yuan
Maanshan Iron & Steel Company Limited2016 Annual Report
146
V. MAJOR NOTES TO CONSOLIDATED FINANCIAL STATEMENTS
1. CASH AND BANK BALANCES
31 December
2016
31 December
2015
Cash on hand 90,515 138,929
Bank balances 4,324,041,172 3,552,764,882
Other monetary assets 493,121,436 1,198,860,855
Mandatory reserves of Masteel Financial
deposited in the central bank 494,847,918 390,946,816
5,312,101,041 5,142,711,482
As of 31 December 2016, the Group’s other monetary assets amounting to RMB493,121,436
have been pledged to banks as security (31 December 2015: RMB1,198,860,855) for bank
acceptance bills and performance guarantees. As for bank deposits, no time deposits (31
December 2015: USD1,000,000, which is equivalent to RMB6,493,453) have been pledged to
banks to issue letters of credit.
As of 31 December 2016, the Group had cash and bank balances amounting to
RMB335,758,549 that have been deposited outside the PRC (31 December 2015:
RMB342,704,351).
Cash deposited in current accounts earns interest at floating interest rates. The terms of time
deposits are from three months, six months to one year respectively, depending on the cash
flow demand of the Group. Such deposits earn interest at the respective bank deposit rates.
Notes to Financial Statements
31 December 2016
Renminbi Yuan

Maanshan Iron & Steel Company Limited2016 Annual Report
147
V. MAJOR NOTES TO CONSOLIDATED FINANCIAL STATEMENTS (CONTINUED)
2. FINANCIAL ASSETS AT FAIR VALUE THROUGH PROFIT OR LOSS
31 December
2016
31 December
2015
Financial assets designated as at fair value through
profit or loss
Investments in equity instruments 555,322,261 1,005,271,054
As of 31 December 2016 and 31 December 2015, the equity instruments were mainly financial
products issued by banks held by the Group.
As of 31 December 2016, there was no material restriction on the realisation of these
investments.
3. BILLS RECEIVABLE
31 December
2016
31 December
2015
Bank acceptance bills 3,608,459,121 4,689,129,290
As o f 31 December 2016, bank acceptance b i l l s o f the Group amount ing to
RMB738,206,842(31 December 2015: RMB1,120,157,322) were pledged for bank loans.
As of 31 December 2016, the Group had no bank acceptance bills pledged as security to
banks to issue bank acceptance bills (31 December 2015: RMB157,001,166).
As of 31 December 2016, the undue bills discounted or endorsed were as follows:
31 December 2016 31 December 2015
Derecognised
Not
derecognised Derecognised
Not
derecognised
Bank acceptance bills 5,196,770,076 156,827,864 1,892,413,242 243,602,664
As of 31 December 2016 and 31 December 2015, there were no trade receivables transferred
from bills receivable because of the drawers’ inability to pay.

Notes to Financial Statements (Continued)31 December 2016Renminbi Yuan
Maanshan Iron & Steel Company Limited2016 Annual Report
148
V. MAJOR NOTES TO CONSOLIDATED FINANCIAL STATEMENTS (CONTINUED)
4. TRADE RECEIVABLES
The Group’s trade receivables were interest-free with normal credit terms of 30 to 90 days.
The aging of trade receivables is analysed below:
31 December
2016
31 December
2015
Within one year 756,196,252 665,862,003
One to two years 66,905,447 116,554,717
Two to three years 24,337,627 22,417,902
Over three years 33,219,589 11,348,434
880,658,915 816,183,056
Less: Provisions for bad debts 20,729,808 19,196,395
859,929,107 796,986,661
The movements of provisions for bad debts against trade receivables for the year are disclosed
in Note V.18.

Maanshan Iron & Steel Company Limited2016 Annual Report
149
V. MAJOR NOTES TO CONSOLIDATED FINANCIAL STATEMENTS (CONTINUED)
4. TRADE RECEIVABLES (CONTINUED)
The balances of trade receivables are analysed as follows:
31 December 2016 31 December 2015
Book value Provisions for bad debts Book value Provisions for bad debtsAmount Ratio (%) Amount Ratio (%) Amount Ratio (%) Amount Ratio (%)
Individually significant and assessed for impairment individually 825,690,228 94 (6,927,040) 1 768,962,510 94 (6,927,040) 1
Individually insignificant but assessed for impairment individually 54,968,687 6 (13,802,768) 25 47,220,546 6 (12,269,355) 26
880,658,915 100 (20,729,808) 816,183,056 100 (19,196,395)
As of 31 December 2016, those individually significant and assessed for impairment individually
were as follows:
Book value
Provisions for
bad debts Ratio (%) Reason
Company 1 117,299,709 – – /
Company 2 48,312,244 – – /
Company 3 35,735,250 – – /
Company 4 29,169,562 – – /
Company 5 24,738,742 – – /
Company 6 21,908,132 – – /
Company 7 21,573,834 – – /
Company 8 20,666,702 – – /
Company 9 20,279,298 – – /
Company 10 18,563,390 – – /
Company 11 17,592,138 – – /
Company 12 17,075,094 – – /
Company 13 17,025,890 – – /
Company 14 15,632,872 – – /
Company 15 13,653,503 – – /
Others 386,463,868 (6,927,040) 2 Note1
825,690,228 (6,927,040) 1

Notes to Financial Statements (Continued)31 December 2016Renminbi Yuan
Maanshan Iron & Steel Company Limited2016 Annual Report
150
V. MAJOR NOTES TO CONSOLIDATED FINANCIAL STATEMENTS (CONTINUED)
4. TRADE RECEIVABLES (CONTINUED)
As of 31 December 2015, those individually significant and assessed for impairment individually
were as follows:
Book value
Provisions for
bad debts Ratio (%) Reason
Company 1 172,899,586 – – /
Company 2 48,310,741 – – /
Company 3 47,432,229 – – /
Company 4 41,970,793 – – /
Company 5 38,765,157 – – /
Company 6 34,432,434 – – /
Company 7 20,279,298 – – /
Company 8 19,769,588 – – /
Company 9 18,718,442 – – /
Company 10 18,349,530 – – /
Company 11 18,015,133 – – /
Company 12 16,839,663 – – /
Company 13 16,186,229 – – /
Company 14 15,007,817 – – /
Company 15 13,132,791 – – /
Others 228,853,079 (6,927,040) 3 Note1
768,962,510 (6,927,040) 1
Note 1: The Company has confirmed that one of its trade receivables was uncollectable. Therefore,
provision for bad debts was fully recognised amounting to RMB6,927,040.
In 2016, provision for bad debts was RMB2,517,257 (2015: RMB2,638,179) and the recovery
or reversal of provision for bad debts was RMB927,877 (2015: Nil).
In 2016, the write-off of provision for bad debts was RMB55,967 (2015: Nil).
As of 31 December 2016 and 31 December 2015, there were no trade receivables that were
derecognised due to the transfer of financial assets.

Maanshan Iron & Steel Company Limited2016 Annual Report
151
V. MAJOR NOTES TO CONSOLIDATED FINANCIAL STATEMENTS (CONTINUED)
4. TRADE RECEIVABLES (CONTINUED)
The top five trade receivables classified by debtors are as follows:
31 December 2016
Relationship
with
the Group
Ending
balance Aging
Percentage of
trade
receivables
Ending
balance of
provision
Company 1 Third Party 117,299,709 Within 1 year 14% –
Company 2 Third Party 48,312,244 Within 3 years 5% –
Company 3 Third Party 35,735,250 Within 1 year 4% –
Company 4 Third Party 29,169,562 Within 1 year 3% –
Company 5 Third Party 24,738,742 Within 1 year 3% –
255,255,507 29%
31 December 2015
Relationship
with
the Group
Ending
Balance Aging
Percentage of
trade
receivables
Ending
balance of
provision
Company 1 Third Party 172,899,586 Within 1 year 21% –
Company 2 Third Party 48,310,741 Within 2 years 6% –
Company 3 Third Party 47,432,229 1-2 years 6% –
Company 4 Third Party 41,970,793 Within 1 year 5% –
Company 5 Third Party 38,765,157 Within 1 year 5% –
349,378,506 43%
As of 31 December 2016, the Group had no assets or liabilities deriving from transferring trade
receivables in which the Group is continuingly involved (31 December 2015: Nil).

Notes to Financial Statements (Continued)31 December 2016Renminbi Yuan
Maanshan Iron & Steel Company Limited2016 Annual Report
152
V. MAJOR NOTES TO CONSOLIDATED FINANCIAL STATEMENTS (CONTINUED)
5. PREPAYMENTS
An aging analysis of the prepayments is as follows:
31 December 2016 31 December 2015
Balance Ratio (%) Balance Ratio (%)
Within one year 896,450,454 96 612,475,882 96
One to two years 14,669,580 2 12,687,989 2
Two to three years 5,222,283 1 2,180,048 1
Over three years 8,708,957 1 7,063,502 1
925,051,274 100 634,407,421 100
Prepayments aged over one year were mainly unsettled prepayments for the purchases of
materials and equipment. The goods were not yet delivered which resulted in the corresponding
prepayments not being settled.
The top five prepayments classified by debtors are as follows:
31 December 2016
Relationship
with
the Group
Ending
balance Aging
Percentage of
prepayments
Company 1 Third Party 164,095,911 Within 1 year 18%
Company 2 Third Party 130,035,843 Within 1 year 14%
Company 3 Third Party 104,989,589 Within 1 year 11%
Company 4 Associate 100,000,000 Within 1 year 11%
Company 5 Third Party 96,486,201 Within 1 year 10%
595,607,544 64%

Maanshan Iron & Steel Company Limited2016 Annual Report
153
V. MAJOR NOTES TO CONSOLIDATED FINANCIAL STATEMENTS (CONTINUED)
5. PREPAYMENTS (CONTINUED)
31 December 2015
Relationship
with
the Group
Ending
balance Aging
Percentage of
prepayments
Company 1 Third Party 80,159,389 Within 1 year 13%
Company 2 Third Party 76,362,359 Within 1 year 12%
Company 3 Third Party 56,173,337 Within 1 year 9%
Company 4 Third Party 49,786,004 Within 1 year 8%
Company 5 Third Party 41,230,060 Within 1 year 6%
303,711,149 48%
6. OTHER RECEIVABLES
An aging analysis of other receivables is as follows:
31 December
2016
31 December
2015
Within one year 66,975,647 139,319,969
One to two years 51,655,401 5,774,543
Two to three years 3,087,522 9,780,275
Over three years 600,141,779 627,032,547
721,860,349 781,907,334
Less: Provision for bad debts 594,245,515 591,559,264
127,614,834 190,348,070
The movements of provision for bad debts against other receivables for the year are disclosed
in Note V.18.

Notes to Financial Statements (Continued)31 December 2016Renminbi Yuan
Maanshan Iron & Steel Company Limited2016 Annual Report
154
V. MAJOR NOTES TO CONSOLIDATED FINANCIAL STATEMENTS (CONTINUED)
6. OTHER RECEIVABLES (CONTINUED)
The other receivable balance is analysed as follows:
31 December 2016 31 December 2015
Book value Provision for bad debts Book value Provision for bad debtsAmount Ratio (%) Amount Ratio (%) Amount Ratio (%) Amount Ratio (%)
Individually significant and assessed for impairment individually 700,662,861 97 (587,934,699) 84 757,221,665 97 (585,248,448) 77
Individually insignificant but assessed for impairment individually 21,197,488 3 (6,310,816) 30 24,685,669 3 (6,310,816) 26
721,860,349 100 (594,245,515) 781,907,334 100 (591,559,264)
As of 31 December 2016, those individually significant and assessed for impairment individually
were as follows:
Book value
Provision for
bad debts Ratio (%) Reason
Company 1 60,939,960 (60,939,960) 100 (i)
Company 2 127,685,367 (127,685,367) 100 (i)
Company 3 37,243,732 (37,243,732) 100 (i)
Company 4 132,058,434 (132,058,434) 100 (i)
Company 5 57,988,833 (57,988,833) 100 (iv)
Company 6 76,821,224 (76,821,224) 100 (ii)
Company 7 17,079,513 (17,079,513) 100 (ii)
Company 8 34,783,463 (34,783,463) 100 (ii)
Company 9 4,069,419 (4,069,419) 100 (ii)
Company 10 9,051,133 (9,051,133) 100 (ii)
Company 11 7,396,979 (7,396,979) 100 (ii)
Company 12 5,216,988 (5,216,988) 100 (ii)
Company 13 10,056,058 (10,056,058) 100 (ii)
Company 14 5,143,596 (5,143,596) 100 (ii)
Company 15 2,400,000 (2,400,000) 100 (iii)
Others 112,728,162 – – /
700,662,861 (587,934,699) 84

Maanshan Iron & Steel Company Limited2016 Annual Report
155
V. MAJOR NOTES TO CONSOLIDATED FINANCIAL STATEMENTS (CONTINUED)
6. OTHER RECEIVABLES (CONTINUED)
As of 31 December 2015, those individually significant and assessed for impairment individually
were as follows:
Book value
Provision for
bad debts Ratio (%) Reason
Company 1 60,939,960 (60,939,960) 100 (i)
Company 2 127,685,367 (127,685,367) 100 (i)
Company 3 37,243,732 (37,243,732) 100 (i)
Company 4 132,058,434 (132,058,434) 100 (i)
Company 5 92,302,582 (55,302,582) 60 (iv)
Company 6 76,821,224 (76,821,224) 100 (ii)
Company 7 17,079,513 (17,079,513) 100 (ii)
Company 8 34,783,463 (34,783,463) 100 (ii)
Company 9 4,069,419 (4,069,419) 100 (ii)
Company 10 9,051,133 (9,051,133) 100 (ii)
Company 11 7,396,979 (7,396,979) 100 (ii)
Company 12 5,216,988 (5,216,988) 100 (ii)
Company 13 10,056,058 (10,056,058) 100 (ii)
Company 14 5,143,596 (5,143,596) 100 (ii)
Company 15 2,400,000 (2,400,000) 100 (iii)
Others 134,973,217 – – /
757,221,665 (585,248,448) 77

Notes to Financial Statements (Continued)31 December 2016Renminbi Yuan
Maanshan Iron & Steel Company Limited2016 Annual Report
156
V. MAJOR NOTES TO CONSOLIDATED FINANCIAL STATEMENTS (CONTINUED)
6. OTHER RECEIVABLES (CONTINUED)
(i) The companies were former steel trading suppliers of the Company, which were in operating
difficulties. The fair value of the assets which pledged the receivables has changed, management
assessed that it was difficult for the Company to collect the receivables as second in line pledgee,
therefore, a full provision for the bad debts was made.
(ii) The companies were former steel trading suppliers of Maanshan Iron & Steel Company Limited
(Shanghai) Trade Co., Ltd (“Shanghai Trading”), a subsidiary of the Company. Management of the
Group has assessed that it was difficult to collect the receivables because that the companies were
in operating difficulties, and made a full provision for the bad debts.
(iii) As the customer was in operating difficulties, management has assessed that it was difficult to
collect the receivables and made a full provision for the bad debts.
(iv) For purpose of protecting the Group’s interest as the creditor, Maanshan Iron and Steel (Wuhu)
Processing and Distribution Co., Ltd. (“Ma Steel (Wuhu)”), a subsidiary of the Group, signed an
equity interest transfer agreement and its supplementary agreement (collectively known as the
“Agreements”) with this debtor’s original shareholder, pursuant to which to acquire its 60% equity
interest at a purchase consideration of RMB1. The Agreements stipulated that Ma Steel (Wuhu)
would sell all the holding interests to the original shareholders at the original purchase consideration
once the debtor repay all the debts to Ma Steel (Wuhu) before 31 December 2014, and Ma Steel
(Wuhu) would not participate the daily operation and share the profit or loss before 31 December
2014. In December 2015, Ma Steel (Wuhu) signed a memorandum with the debtor, agreeing to
postpone the settlement date to 31 December 2016 and other terms retain unchanged. In 2016,
Ma Steel (Wuhu) did not participate the daily operation of the debtor and shared no profit or loss.
Therefore, management has made the judgement that the Company does not exert control over
it during the year. In October 2016, the debtor repaid part of the debt with real estates, and Ma
Steel (Wuhu) returned the equity interest to the original shareholders of the company according to
the equity interest transfer agreement. The book value of the rest amounting to RMB57,988,833 is
unable to be collected by the Company. Therefore, provision of RMB2,686,251 for bad debts was
made in 2016. As a result, full provision was made for the outstanding amount.
In 2016, provision for bad debts was RMB2,986,251 (2015: RMB35,052,464) and no recovery
or reversal of provision for bad debts was made (2015: RMB128,000).
In 2016, the write-off of provision for the debts was RMB300,000 (2015: Nil).

Maanshan Iron & Steel Company Limited2016 Annual Report
157
V. MAJOR NOTES TO CONSOLIDATED FINANCIAL STATEMENTS (CONTINUED)
6. OTHER RECEIVABLES (CONTINUED)
Other receivables analysed by nature were as follows:
31 December
2016
31 December
2015
Payment on behalf of other companies 50,733,791 50,733,791
Tax refunds 5,237,911 6,437,911
Prepayment of customs duties and VAT 11,167,848 13,022,912
Prepayment for trading 585,534,699 607,861,547
Prepaid guarantee for steel futures 28,061,996 42,768,562
Others 41,124,104 61,082,611
Provision for bad debts (594,245,515) (591,559,264)
127,614,834 190,348,070
As of 31 December 2016, the five largest other receivables were as follows:
Balance
Ratio in other
receivables (%) Nature Aging
Balance of
provision
Company 1 132,058,434 18 Prepayment
for trading
More than
3 years
132,058,434
Company 2 127,685,367 18 Prepayment
for trading
More than
3 years
127,685,367
Company 3 76,821,224 11 Prepayment
for trading
More than
3 years
76,821,224
Company 4 60,939,960 8 Prepayment
for trading
More than
3 years
60,939,960
Company 5 57,988,833 8 Prepayment
for trading
More than
3 years
57,988,833
455,493,818 63 455,493,818

Notes to Financial Statements (Continued)31 December 2016Renminbi Yuan
Maanshan Iron & Steel Company Limited2016 Annual Report
158
V. MAJOR NOTES TO CONSOLIDATED FINANCIAL STATEMENTS (CONTINUED)
6. OTHER RECEIVABLES (CONTINUED)
As of 31 December 2015, the five largest other receivables were as follows:
BalanceRatio in other
receivables (%) Nature AgingBalance of
provision
Company 1 132,058,434 17 Prepayment for trading
More than 3 years
132,058,434
Company 2 127,685,367 16 Prepayment for trading
More than 3 years
127,685,367
Company 3 92,302,582 12 Prepayment for trading
More than 3 years
55,302,582
Company 4 76,821,224 10 Prepayment for trading
More than 3 years
76,821,224
Company 5 60,939,960 8 Prepayment for trading
More than 3 years
60,939,960
489,807,567 63 452,807,567
As of 31 December 2016, the government grants receivable were as follows:
Government grant project Balance Aging
Expected receiving
time, amount and basis
Other receivable due from Taibai Town Government
Policy return from 2004 to 2009 5,237,911
More than three years
Note
As of 31 December 2015, the government grants receivable were as follows:
Government grant project Balance Aging
Expected receiving
time, amount and basis
Other receivable due from Taibai Town Government
Policy return from 2004 to 2009 6,437,911
More than three years
Note
Note: The balance is the government grant owned by a subsidiary named Anhui Changjiang Iron and Steel
in 2009 from the Town Government of Taibai, Dangtu in Anhui Province because of its timely and
fully tax payments between 2004 and 2009. This government grant was recorded as non-operating
income in 2009. In 2016, the government grant had been recovered partly. After communicating
with the government, the rest of the amount is expected to be received in 2017.
The balances of other receivables as of 31 December 2016 and 31 December 2015 did not
contain any amount derecognised due to the transfer of financial assets.

Maanshan Iron & Steel Company Limited2016 Annual Report
159
V. MAJOR NOTES TO CONSOLIDATED FINANCIAL STATEMENTS (CONTINUED)
7. INVENTORIES
31 December 2016 31 December 2015
BalanceProvision for
impairmentCarrying amount Balance
Provision for impairment
Carrying amount
Raw materials 5,068,139,785 (83,746,075) 4,984,393,710 2,804,238,500 (350,365,789) 2,453,872,711Work in progress 864,371,940 (17,659,670) 846,712,270 921,849,186 (102,234,757) 819,614,429Finished goods 3,425,296,042 (64,188,089) 3,361,107,953 1,893,162,625 (491,923,981) 1,401,238,644Spare parts 1,249,285,417 (126,912,167) 1,122,373,250 1,403,342,682 (59,572,961) 1,343,769,721Others (Note) 233,474,649 – 233,474,649 – – –
10,840,567,833 (292,506,001) 10,548,061,832 7,022,592,993 (1,004,097,488) 6,018,495,505
Note: The Company, as the creditor, received real estate amounting to RMB233,474,649 from one debtor.
Please refer to Note V.6 for details.
The movements of impairment provision against inventories for the year are disclosed in Note
V.18.
At the end of the reporting period, inventories were measured at the lower of costs and net
realisable values, and provision for impairment was made for items whose costs were higher
than their net realisable values. Net realisable value is the estimated selling price under normal
business terms deducted by the estimated costs to completion, the estimated selling expenses
and related taxes.
In 2016, the Group had no reversal of impairment provision against inventories (2015:
RMB3,360,982).
As of 31 December 2016, the Group had no pledged inventories (31 December 2015:
RMB10,859,823).

Notes to Financial Statements (Continued)31 December 2016Renminbi Yuan
Maanshan Iron & Steel Company Limited2016 Annual Report
160
V. MAJOR NOTES TO CONSOLIDATED FINANCIAL STATEMENTS (CONTINUED)
8. FINANCIAL ASSETS PURCHASED UNDER AGREEMENTS TO RESELL
31 December
2016
31 December
2015
Bonds 230,047,000 –
Financial assets purchased under agreements to resell are bonds that are bought first and to
be sold at a fixed price by Masteel Financial according to the resell agreements. The ending
balance was bonds repurchased by pledge.
9. LOANS AND ADVANCES TO CUSTOMERS
31 December
2016
31 December
2015
Loans 474,500,000 488,500,000
Discounted bills 1,128,238,113 261,318,730
1,602,738,113 749,818,730
Less:Bad debt provision for loans and advances 47,525,557 16,904,861
1,555,212,556 732,913,869
The movement of the provision for bad debts against loans and advances to customers for the
current year is disclosed in Note V.18.
The customers related to loans and advances are the Holding and its subsidiaries. After risk
evaluation, bad debt provision for loans and advances to customers was accrued at 3% of its
closing balance. As of 31 December 2016, there was no non-performing loan in the Group’s
loans and advances to customers. Loans and advances to customers due from shareholders
who held 5% or above of the Company’s equity interests and other related parties as of 31
December 2016 and 31 December 2015 are stated in Note X.6 to the financial statements.

Maanshan Iron & Steel Company Limited2016 Annual Report
161
V. MAJOR NOTES TO CONSOLIDATED FINANCIAL STATEMENTS (CONTINUED)
10. OTHER CURRENT ASSETS
31 December
2016
31 December
2015
Prepaid income tax 301,317,710 310,923,428
Accumulated deductible value added tax 386,609,452 637,594,830
Others 4,544,071 –
692,471,233 948,518,258
At the end of 2016, the amounts of prepaid corporate income tax and deductible VAT were
reclassified as other current assets.
11. AVAILABLE-FOR-SALE FINANCIAL ASSETS
31 December 2016 31 December 2015
Book valueProvision for
impairmentCarrying amount Book value
Provision for impairment
Carrying amount
Available-for-sale debt instruments 451,225,538 – 451,225,538 – – –
Available-for-sale equity instruments measured at cost 126,722,160 – 126,722,160 128,934,410 – 128,934,410
577,947,698 – 577,947,698 128,934,410 – 128,934,410
Available-for-sale financial assets measured at fair value:
31 December
2016
31 December
2015
Available-for-sale debt instruments
Debt instruments’ amortized cost 452,402,983 –
Fair value 451,225,538 –
Accumulated fair value changes recorded in
other comprehensive income (1,177,445) –
Provision – –

Notes to Financial Statements (Continued)31 December 2016Renminbi Yuan
Maanshan Iron & Steel Company Limited2016 Annual Report
162
V. MAJOR NOTES TO CONSOLIDATED FINANCIAL STATEMENTS (CONTINUED)
11. AVAILABLE-FOR-SALE FINANCIAL ASSETS (CONTINUED)
Available-for-sale financial assets measured at cost:
31 December 2016
Book value Provision for impairmentEquity
interests(%)
Cash dividend
during the year
Opening balance Addition Decrease
Ending balance
Opening balance Addition Decrease
Ending balance
Henan Longyu Energy Co., Ltd. 10,000,000 – – 10,000,000 – – – – 0.66 –China MCC17 Group Co., Ltd. 8,554,800 – – 8,554,800 – – – – 1.56 –Shanghai LuoJing Ore Quay
Co., Ltd. 88,767,360 – – 88,767,360 – – – – 12.00 –Beijing Zhonglian Steel Ecommerce Co., Ltd. 1,000,000 – – 1,000,000 – – – – 3.40 –Anshan Huatai CDQ Engineering
Technology Co., Ltd. 400,000 – – 400,000 – – – – 5.00 40,000CFHI (Group) Ma’anshan Heavy Industry Co., Ltd. 15,000,000 – – 15,000,000 – – – – 15.00 –Guoqi (Beijing) Lightweight of Automotive
Technology Institute Co., Ltd. 3,000,000 – – 3,000,000 – – – – 6.90 –Anhui Masteel Stereoscopic Auto-parking
Equipments Company Limited (Note 1) 2,212,250 – (2,212,250) – – – – – – –
128,934,410 – (2,212,250) 126,722,160 – – – – 40,000
Note 1: Ma Steel (HK), a subsidiary of the Group, signed the “Agreement on equity interest transfer of
Anhui Masteel Stereoscopic Auto-parking Equipments Company Limited” with Magang (Group)
Investment Co., Ltd. in April 2016, to transfer the 8.9367% equity interest of Anhui Masteel
Stereoscopic Auto-parking Equipments Company Limited (“Masteel Auto-parking”) to Magang
(Group) investment Co., Ltd.
As of 31 December 2016, the Group’s available-for-sale financial assets are equity investments
in non-listed companies in China. These assets are recorded at cost less impairment at the
end of each reporting period, and their fair values were not disclosed. The fair values of these
assets could not be reliably measured since there were no market prices in the active market.
Besides, the Group had no intention to dispose of the investments.

Maanshan Iron & Steel Company Limited2016 Annual Report
163
V. MAJOR NOTES TO CONSOLIDATED FINANCIAL STATEMENTS (CONTINUED)
11. AVAILABLE-FOR-SALE FINANCIAL ASSETS (CONTINUED)
Available-for-sale financial assets measured at cost: (continued)
31 December 2015
Book value Provision for impairmentEquity
interests(%)
Cash dividend
during the yearOpeningbalance Increase Decrease
Endingbalance
Openingbalance Increase Decrease
Endingbalance
Henan Longyu Energy Co., Ltd. 10,000,000 – – 10,000,000 – – – – 0.66 5,303,867China MCC17 Group Co., Ltd. 8,554,800 – – 8,554,800 – – – – 1.56 –Shanghai LuoJing Ore Quay Co., Ltd. 88,767,360 – – 88,767,360 – – – – 12.00 7,630,961Beijing Lianye Parameter Monitoring Company (Note 1) 50,000 – (50,000) – – – – – 6.10 –
Beijing Zhonglian Steel Ecommerce Co., Ltd. 1,000,000 – – 1,000,000 – – – – 3.40 –Anshan Huatai CDQ Engineering
Technology Co., Ltd. 400,000 – – 400,000 – – – – 5.00 60,000CFHI (Group) Ma'anshan Heavy Industry Co., Ltd. 15,000,000 – – 15,000,000 – – – – 15.00 –Guoqi (Beijing) Lightweight of Automotive
Technology Institute Co., Ltd. 3,000,000 – – 3,000,000 – – – – 6.90 –Masteel Auto-parking (Note 2) – 2,212,250 – 2,212,250 – – – – 8.94 –
126,772,160 2,212,250 (50,000) 128,934,410 – – – – 12,994,828
Note 1: The company was liquidated in early 2015.
Note 2: Ma Steel (HK) entered into the “Agreement on capital injection of Anhui Masteel Stereoscopic Auto-
parking Equipments Company Limited” on 26 November 2015, pursuant to which Ma Steel (HK)
would not participate in the capital injection. Therefore, Ma Steel (HK)’s equity share was diluted
from 25% to 8.9367%. As Ma Steel (HK) was no longer able to exercise significant influence over
the investee, the equity investment is accounted as an available-for-sale financial asset.
As of 31 December 2015, the Group’s available-for-sale financial assets were equity
investments in non-listed companies in China. These assets are recorded at cost less
impairment at the end of each reporting period, and their fair values would not be disclosed.
The fair values of these assets could not be reliably measured since there were no market
prices in the active market. Besides, the Group had no intention to dispose of the investments.

Notes to Financial Statements (Continued)31 December 2016Renminbi Yuan
Maanshan Iron & Steel Company Limited2016 Annual Report
164
V. MAJOR NOTES TO CONSOLIDATED FINANCIAL STATEMENTS (CONTINUED)
12. LONG TERM EQUITY INVESTMENTS
31 December 2016
Movements during the year
Opening
balance Increase Decrease
Investment
income
under the
equity method
Other
comprehensive
income
Other equity
movement
Cash
dividend
received
Provision
for
impairment
Closing
balance
Impairment
at the end
of the year
Joint ventures
Ma’anshan BOC-Ma Steel Gases Company
Limited (“BOC-Ma Steel”) 316,030,791 – – 80,857,392 – 1,129,885 (79,000,000) – 319,018,068 –
Masteel-CMI International Training Centre
Co., Ltd. (“MASTEEL-CMI”) 539,342 – – 2,091 – – – – 541,433 –
Mascometal (Note 1) – 58,171,378 (4,879,915) (7,426) – – – – 53,284,037 –
Associates
Henan JinMa Energy Co., Ltd.
(“Henan JinMa Energy”) 241,098,393 – – 77,296,589 – 3,361,408 (25,560,000) – 296,196,390 –
Shenglong Chemical Co., Ltd.
(“Shenglong Chemical”) 242,402,338 – – 66,810,341 – 183,745 – – 309,396,424 –
Shanghai Iron and Steel Electronic Deal Center
Co., Ltd. (“Shanghai Iron and
Steel Electronic”) 26,604,521 – – 4,516,071 – – (4,000,000) – 27,120,592 –
Xinchuang Economize Resource 35,539,691 – – 3,059,233 – 5,182,037 – – 43,780,961 –
Anhui Linhuan Chemical 72,000,000 – – – – – – – 72,000,000 –
Ma-Steel OCI Chemical Co., Ltd.
(“Ma-Steel OCI Chemical”) (Note 2) 95,638,431 22,513,793 – 286,184 – – – – 118,438,408 –
1,029,853,507 80,685,171 (4,879,915) 232,820,475 – 9,857,075 (108,560,000) – 1,239,776,313 –
Note 1: In 2016, the Company jointly established Mascometal with registered capital amounting to EUR32
million with a foreign invested enterprise (FIE), Asco Industries Ltd., in which the Company
and Asco Industries Ltd. hold 75% and 25% of equity interests respectively, according to the
requirements of the investment contract and the Articles of Association. The Company designated
three directors in the Board of Directors and Asco Industries Ltd. designated one director.
According to the Articles of Association of Mascometal, some important financial and operating
decisions must be approved by all the directors. According to the requirements of the Articles
of Association as above, the directors represent that the Company is unable to exercise control
over Mascometal, but able to exercise joint control over Mascometal with Asco Industries Ltd..
Therefore, the equity investment in Mascometal is accounted for as a joint venture, and Mascometal
has not been included in the consolidation scope of the Group.
In August 2016, the Company disposed of 9% equity interest of Mascometal to Maanshan City
Yushan District City Investment and Development Co., Ltd.
As of 31 December 2016, the Company had made an investment commitment to Mascometal
amounting to EUR16.07 million.
Note 2: The Company completed the final round of capital contributions amounting to RMB22,513,793
according to the requirements of the Articles of Association of Ma-Steel OCI Chemical.
* The above joint ventures and associates on which we apply the equity method are all unlisted
investments.

Maanshan Iron & Steel Company Limited2016 Annual Report
165
V. MAJOR NOTES TO CONSOLIDATED FINANCIAL STATEMENTS (CONTINUED)
12. LONG TERM EQUITY INVESTMENTS (CONTINUED)
31 December 2015
Movements during the year
Opening
balance Increase Decrease
Investment
income
under the
equity method
Other
comprehensive
income
Other equity
movement
Cash
dividend
received
Provision
for
impairment
Closing
balance
Impairment
at the end
of the year
Joint ventures
BOC-Ma Steel 311,422,276 – – 81,325,413 – (3,216,898) (73,500,000) – 316,030,791 –
MASTEEL-CMI 542,669 – – (3,327) – – – – 539,342 –
Associates
Henan JinMa Energy (Note 1) 207,497,916 37,623,600 – (4,023,123) – – – – 241,098,393 –
Shenglong Chemical 245,813,223 – – (2,786,831) – (624,054) – – 242,402,338 –
Shanghai Iron and Steel Electronic 30,977,774 – – 1,626,747 – – (6,000,000) – 26,604,521 –
Xinchuang Economize Resource 30,967,723 – – 5,055,768 – (483,800) – – 35,539,691 –
Maanshan Jinxi Rail Transit Equipment Co., Ltd.
(“Ma-Steel Rail Transportation”) (Note 2) 171,476,241 – (165,930,369) (5,545,872) – – – – – –
Jiyuan Jinyuan Chemical Co., Ltd.
(“Jiyuan Jinyuan Chemical”) (Note 1) 45,794,148 – (44,961,228) (832,920) – – – – – –
Anhui Linhuan Chemical (Note 3) 43,200,000 28,800,000 – – – – – – 72,000,000 –
Ma-Steel OCI Chemical (Note 4) – 95,235,280 – 403,151 – – – – 95,638,431 –
Masteel Auto-parking (Note 5) 1,893,043 – (2,212,250) 319,207 – – – – – –
1,089,585,013 161,658,880 (213,103,847) 75,538,213 – (4,324,752) (79,500,000) – 1,029,853,507 –
Note 1: On 29 May 2015, Henan JinMa Energy merged with Jiyuan Jinyuan Chemical. Since Henan JinMa
Energy and Jiyuan Jinyuan Chemical had identical shareholdings, all shareholders used their
respective shares in Jiyuan Jinyuan Chemical to fulfill capital increment in Henan JinMa Energy
in the amount of RMB104,510,000 proportionately, among which the Company used its original
36% shares in Jiyuan Jinyuan Chemical to contribute to the capital increment in the amount of
RMB37,623,600 to Henan JinMa Energy. After the capital increment, Jiyuan Jinyuan Chemical
becomes a wholly-owned subsidiary of Henan JinMa Energy, and the shareholding in Henan JinMa
Energy by the shareholders remains unchanged. The Company holds 36% of shares in Henan
JinMa Energy and no longer owned shares in Jiyuan Jinyuan Chemical directly.
Notes to Financial Statements (Continued)31 December 2016Renminbi Yuan
Maanshan Iron & Steel Company Limited2016 Annual Report
166
V. MAJOR NOTES TO CONSOLIDATED FINANCIAL STATEMENTS (CONTINUED)
12. LONG TERM EQUITY INVESTMENTS (CONTINUED)
Note 2: On 28 May 2015, the Company acquired another 50% equity interests of Ma-Steel Rail
Transportation from Jinxi Axle Company Limited. After the deal, the Company owns 100% equity
interests in Ma-Steel Rail Transportation. Therefore, the Company begins to account for Ma-Steel
Rail Transportation as a subsidiary using the cost method rather than the equity method, and
Ma-Steel Rail Transportation has been incorporated into the consolidation scope of the Group
thereafter.
Note 3: On 2 February 2015, the Company paid RMB28,800,000 as capital injection to Anhui Linhuan
Chemical. According to the Articles of Association of Anhui Linhuan Chemical, the Company has
fulfilled the capital contribution to Anhui Linhuan Chemical as agreed as of 31 December 2015.
Note 4: In February 2015, the Company jointly established Ma-Steel OCI Chemical with OCI (China)
Investment Co., Ltd. with the registered capital of USD47,125,000, among which the Company
committed to contribute the capital in cash and land use right. According to the Articles of
Association of Ma-Steel OCI Chemical, the capital contribution of the Company is USD18,850,000,
and both the proportions of capital contribution and shareholding are 40%. On 11 March 2015,
the Company contributed RMB27,737,594. On 4 August 2015, the Company contributed
RMB27,548,464 in cash. On 25 September 2015, the Company contributed land use rights of
RMB23,651,700. On 2 December 2015, the Company contributed RMB16,297,522 in cash. The
total capital contributions amounted to RMB95,235,280.
According to the Articles of Association of Ma-Steel OCI Chemical, the Company holds two-fifths of
seats in the Board of Directors and is bestowed 40% voting right accordingly. The Company exerts
significant influence over the investee by taking part in its decision-making, and applies the equity
method to account for the long term equity investment.
Note 5: Ma Steel (HK) entered into the “Agreement on capital injection of Anhui Masteel Stereoscopic Auto-
parking Equipments Company Limited” on 26 November 2015, pursuant to which Ma Steel (HK)
would not participate in the capital injection. Therefore, Ma Steel (HK)’s equity interest was diluted
from 25% to 8.9367%. As Ma Steel (HK) was no longer able to exercise significant influence over
the investee, the equity investment is accounted for as an available-for-sale financial asset rather
than an associate.

Maanshan Iron & Steel Company Limited2016 Annual Report
167
V. MAJOR NOTES TO CONSOLIDATED FINANCIAL STATEMENTS (CONTINUED)
13. INVESTMENT PROPERTIES
Investment properties measured using the cost method:
2016
Buildings
Cost:
At 1 January 2016 67,649,781
Addition –
Transferred into fixed assets (Note) (2,574,402)
At 31 December 2016 65,075,379
Accumulated depreciation:
At 1 January 2016 5,293,198
Provided 1,708,470
Transferred into fixed assets (Note) (760,287)
At 31 December 2016 6,241,381
Provision for impairment:
At 1 January 2016 and 31 December 2016 –
Net carrying amount:
At 31 December 2016 58,833,998
At 1 January 2016 62,356,583
Note: In 2016, the Group transferred the office leased to Masteel Auto Parking and the vacant plant
leased to Ma’anshan Jiaheng Storage and Transportation Co., Ltd. from investment properties to
own-used fixed assets.

Notes to Financial Statements (Continued)31 December 2016Renminbi Yuan
Maanshan Iron & Steel Company Limited2016 Annual Report
168
V. MAJOR NOTES TO CONSOLIDATED FINANCIAL STATEMENTS (CONTINUED)
13. INVESTMENT PROPERTIES (CONTINUED)
2015
Buildings
Cost:
At 1 January 2015 65,463,072
Addition –
Transferred from fixed assets (Note) 2,186,709
At 31 December 2015 67,649,781
Accumulated depreciation:
At 1 January 2015 2,558,862
Provided 2,063,607
Transferred from fixed assets (Note) 670,729
At 31 December 2015 5,293,198
Provision for impairment:
At 1 January 2015 and 31 December 2015 –
Net carrying amount:
At 31 December 2015 62,356,583
At 1 January 2015 62,904,210
Note: The investment properties transferred from fixed assets represent a self-owned office and vacant
plant leased under an operating lease agreement by Holly Industrial, a subsidiary of the Company.
* The Group’s investment properties are located in Mainland China and are held under medium term
leases.

Maanshan Iron & Steel Company Limited2016 Annual Report
169
V. MAJOR NOTES TO CONSOLIDATED FINANCIAL STATEMENTS (CONTINUED)
14. PROPERTY, PLANT AND EQUIPMENT
2016
Plant andbuildings
Machinery andequipment
Motorvehicles
Officeequipment
Landownership Total
(Note 2)
Cost:At 1 January 2016 26,337,817,814 52,433,784,044 388,260,936 353,968,343 10,265,796 79,524,096,933Addition 8,203,647 88,449,039 7,769,757 7,702,254 – 112,124,697Transfer from construction
in progress (Note V.15) 2,390,223,425 2,591,670,469 13,178,320 18,378,038 – 5,013,450,252Reclassifications (21,601,634) 138,103,232 (4,042,687) (112,458,911) – –Disposal (Note 1) (66,178,321) (260,848,701) (17,695,392) – – (344,722,414)Transferred from investment
properties 2,574,402 – – – – 2,574,402Exchange realignment 828,930 1,672,053 131,359 100,118 – 2,732,460Estimated adjustments for
construction (330,000,000) (400,000,000) – (1,289,037) – (731,289,037)
At 31 December 2016 28,321,868,263 54,592,830,136 387,602,293 266,400,805 10,265,796 83,578,967,293
Accumulated depreciation:At 1 January 2016 12,245,942,502 32,017,310,492 312,099,544 343,333,299 – 44,918,685,837Provided 694,973,483 2,662,489,850 16,696,545 3,606,239 – 3,377,766,117Reclassifications (20,672,194) 126,871,668 (3,885,716) (102,313,758) – –Disposal (Note 1) (48,396,925) (215,894,967) (15,746,318) – – (280,038,210)Transferred from investment
properties 760,287 – – – – 760,287Exchange realignment 63,198 439,532 53,700 27,653 – 584,083
At 31 December 2016 12,872,670,351 34,591,216,575 309,217,755 244,653,433 – 48,017,758,114
Provision for impairment:At 1 January 2016 – – – – – –Provided (Note 3) 6,514,174 32,093,290 – – – 38,607,464
At 31 December 2016 6,514,174 32,093,290 – – – 38,607,464
Net carrying amount:At 31 December 2016 15,442,683,738 19,969,520,271 78,384,538 21,747,372 10,265,796 35,522,601,715
At 1 January 2016 14,091,875,312 20,416,473,552 76,161,392 10,635,044 10,265,796 34,605,411,096

Notes to Financial Statements (Continued)31 December 2016Renminbi Yuan
Maanshan Iron & Steel Company Limited2016 Annual Report
170
V. MAJOR NOTES TO CONSOLIDATED FINANCIAL STATEMENTS (CONTINUED)
14. PROPERTY, PLANT AND EQUIPMENT (CONTINUED)
2015
Plant andbuildings
Machinery andequipment
Motorvehicles
Officeequipment
Landownership Total
(Note2)
Cost:At 1 January 2015 26,083,777,337 51,931,863,074 393,384,036 237,114,334 10,787,241 78,656,926,022Addition 12,520,307 31,633,695 2,595,226 4,307,170 – 51,056,398Acquisition – 17,794,606 1,805,199 306,760 – 19,906,565Transfer from construction
in progress (Note V.15) 140,873,740 644,444,493 18,025,270 112,300,591 – 915,644,094Reclassifications 123,748,458 (124,248,265) 499,807 – – –Disposal (Note1) (17,852,582) (67,428,660) (28,048,602) (60,512) (521,445) (113,911,801)Transferred to investment properties (2,186,709) – – – – (2,186,709)Other transfer out (3,062,737) (274,899) – – – (3,337,636)
At 31 December 2015 26,337,817,814 52,433,784,044 388,260,936 353,968,343 10,265,796 79,524,096,933
Accumulated depreciation:At 1 January 2015 11,231,030,025 29,844,694,588 316,767,843 223,076,706 – 41,615,569,162Acquisition – 609,725 311,599 119,934 – 1,041,258Provided 1,026,098,256 2,232,362,765 21,714,559 120,146,623 – 3,400,322,203Disposal (Note1) (9,865,106) (60,140,645) (26,694,457) (9,964) – (96,710,172)Transferred to investment properties (670,729) – – – – (670,729)Other transfer out (649,944) (215,941) – – – (865,885)
At 31 December 2015 12,245,942,502 32,017,310,492 312,099,544 343,333,299 – 44,918,685,837
Provision for impairment:At 1 January 2015 – – – – – –Provided – – – – – –Disposal – – – – – –
At 31 December 2015 – – – – – –
Net carrying amount:At 31 December 2015 14,091,875,312 20,416,473,552 76,161,392 10,635,044 10,265,796 34,605,411,096
At 1 January 2015 14,852,747,312 22,087,168,486 76,616,193 14,037,628 10,787,241 37,041,356,860

Maanshan Iron & Steel Company Limited2016 Annual Report
171
V. MAJOR NOTES TO CONSOLIDATED FINANCIAL STATEMENTS (CONTINUED)
14. PROPERTY, PLANT AND EQUIPMENT (CONTINUED)
Note 1: The fixed assets disposed in 2016 and 2015 were mainly the fixed assets sold and discarded by
the Company. Because of 4# blast furnace construction and 5# coke technical transformation in the
current year, the Company removed the retired assets in this area.
Note 2: The land ownership in fixed assets was obtained by a subsidiary of the Group, MG-VALDUNES, in
France.
Note 3: The Group recognised impairment of fixed assets amounting to RMB38,607,464 in the current
year because the Group disposed of some fixed assets due to the de-capacity plan of the iron and
steel segment. The Group determined the amount of provision for the assets based on the assets’
recoverable amount which is calculated as the assets’ fair value less costs to sell.
Apart from the impairment of assets’ related to the de-capacity plan above, when an indication
of impairment of other fixed assets existed, the impairment test was performed for each cash-
generating unit. The recoverable amount of each cash-generating unit would be compared with
its carrying amount. The recoverable amount of each cash-generating unit is calculated by value-
in-use method. This method used after-tax cash flows based on a 5-year financial budget made
by the management, and for cash flows above five years, a constant growth rate based on the
cash flows of the fifth year was used. Significant assumptions for the impairment test include
expected production and sales volume, future selling price, production costs, operating expenses
and discount rate, etc. Management made those significant assumptions based on historical
experiences and forecasts of market development. Management adopted the after-tax discount rate
of 9% (2015: 9%), which could represent specific risks of the relevant cash-generating unit. As of
31 December 2016, apart from the impairment of assets related to the de-capacity plan above, the
Group made no provision for other fixed assets (2015: Nil).
As of 31 December 2016, certificates of ownership in respect of 33 of the Group’s buildings
in Mainland China, with an aggregate cost of RMB1,273,300,682 (31 December 2015
RMB1,343,143,878), have not been issued by the relevant government authorities. The
directors represent that the Group is in the process of obtaining the relevant certificates, and
this will not have any significant adverse impact on the Group’s operations.

Notes to Financial Statements (Continued)31 December 2016Renminbi Yuan
Maanshan Iron & Steel Company Limited2016 Annual Report
172
V. MAJOR NOTES TO CONSOLIDATED FINANCIAL STATEMENTS (CONTINUED)
15. CONSTRUCTION IN PROGRESS
31 December 2016 31 December 2015
Balance
Provision for
impairment
Carrying
amount Balance
Provision for
impairment
Carrying
amount
Product quality projects 387,560,165 – 387,560,165 1,201,603,354 – 1,201,603,354
Energy-saving and environment
protection projects 448,789,128 – 448,789,128 1,206,463,445 – 1,206,463,445
Equipment advancement and
other modification projects 856,066,507 – 856,066,507 1,651,195,135 – 1,651,195,135
Other projects 565,775,598 – 565,775,598 186,500,934 – 186,500,934
2,258,191,398 – 2,258,191,398 4,245,762,868 – 4,245,762,868
In 2016, the movements of significant projects are as follows:
Name of projects Budget
Opening
balance Addition
Transferred to
fixed assets
(Note V.14)
Closing
balance
Source
of fund
The
proportion
projects
investment
account
for budget
Percentage
of completion
Accumulated
interest
capitalisation
The
capitalised
interest in
current year
The interest
capitalisation
rate in
current year
RMB’000 RMB RMB RMB RMB (%) (%) RMB
(Note)
RMB (%)
Product quality projects
6,416,968 1,201,603,354 1,343,913,180 (2,157,956,369) 387,560,165
Internally
financed/loan 82 82 9,671,641 2,140,342 4.4
Energy-saving and environment
protection projects 2,623,235 1,206,463,445 994,194,028 (1,751,868,345) 448,789,128
Internally
financed/loan 84 84 4,816,770 2,761,338 4.4
Equipment advancement and
other modification projects 2,359,778 1,651,195,135 272,488,041 (1,067,616,669) 856,066,507
Internally
financed/loan 85 85 7,597,740 1,655,800 4.4
Other projects
N/A 186,500,934 415,283,533 (36,008,869) 565,775,598
Internally
financed/loan N/A N/A 3,005,256 619,779 –
4,245,762,868 3,025,878,782 (5,013,450,252) 2,258,191,398
Less: Provision for impairment – – – –
4,245,762,868 3,025,878,782 (5,013,450,252) 2,258,191,398 25,091,407 7,177,259

Maanshan Iron & Steel Company Limited2016 Annual Report
173
V. MAJOR NOTES TO CONSOLIDATED FINANCIAL STATEMENTS (CONTINUED)
15. CONSTRUCTION IN PROGRESS (CONTINUED)
In 2015, the movements of significant projects are as follows:
Name of projects Budget
Opening
balance Addition
Transferred to
fixed assets
(Note V.14)
Closing
balance
Source
of fund
The proportion
Projects
investment
account for
budget
Percentage
of completion
Accumulated
interest
capitalisation
The
capitalised
interest in
current year
The interest
capitalisation
rate in
current year
RMB’000 RMB RMB RMB RMB (%) (%) RMB
(Note)
RMB (%)
Product quality projects
5,376,735 804,193,624 672,080,460 (274,670,730) 1,201,603,354
Internally
financed/loan 74 74 7,531,299 2,789,186 7.9
Energy-saving and environment
protection projects 2,426,082 436,691,290 894,818,600 (125,046,445) 1,206,463,445
Internally
financed/loan 59 59 2,055,432 2,055,432 7.9
Equipment advancement and
other modification projects 2,208,182 1,505,024,955 561,759,062 (415,588,882) 1,651,195,135
Internally
financed/loan 77 77 5,941,940 5,941,940 7.9
Other projects
N/A 85,140,313 201,698,658 (100,338,037) 186,500,934
Internally
financed/loan N/A N/A 2,385,477 2,385,477 –
2,831,050,182 2,330,356,780 (915,644,094) 4,245,762,868
Less: Provision for impairment – – – –
2,831,050,182 2,330,356,780 (915,644,094) 4,245,762,868 17,914,148 13,172,035
Note: The balance represents the capitalisation of borrowing costs included in construction in progress at
31 December 2016 and 31 December 2015 respectively.

Notes to Financial Statements (Continued)31 December 2016Renminbi Yuan
Maanshan Iron & Steel Company Limited2016 Annual Report
174
V. MAJOR NOTES TO CONSOLIDATED FINANCIAL STATEMENTS (CONTINUED)
16. INTANGIBLE ASSETS
2016
Concessionassets
Land use rights Mining rights Patent Total
(Note)
Cost:At 1 January 2016 136,979,410 2,296,421,463 137,120,350 587,217 2,571,108,440Addition – 1,567,188 – 87,682 1,654,870Disposals – (9,200,000) – – (9,200,000)Exchange realignment – – 2,784,497 17,512 2,802,009
At 31 December 2016 136,979,410 2,288,788,651 139,904,847 692,411 2,566,365,319
Accumulated depreciation:At 1 January 2016 24,305,184 614,246,226 41,097,193 101,677 679,750,280Provided 5,913,441 51,424,739 6,056,366 206,852 63,601,398Disposals – (1,441,863) – – (1,441,863)Exchange realignment – – 2,683,544 3,033 2,686,577
At 31 December 2016 30,218,625 664,229,102 49,837,103 311,562 744,596,392
Provision for impairment:At 1 January 2016 and
at 31 December 20 – – – – –
Net carrying amount:At 31 December 2016 106,760,785 1,624,559,549 90,067,744 380,849 1,821,768,927
At 1 January 2016 112,674,226 1,682,175,237 96,023,157 485,540 1,891,358,160

Maanshan Iron & Steel Company Limited2016 Annual Report
175
V. MAJOR NOTES TO CONSOLIDATED FINANCIAL STATEMENTS (CONTINUED)
16. INTANGIBLE ASSETS (CONTINUED)
2015
Concession
assets
Land
use rights Mining rights Patent Total
(Note)
Cost:
At 1 January 2015 135,813,675 2,157,031,549 148,050,244 – 2,440,895,468
Addition 1,165,735 54,247,060 – 587,217 56,000,012
Acquisition – 89,577,666 – – 89,577,666
Disposals – (4,434,812) (2,451,565) – (6,886,377)
Exchange realignment – – (8,478,329) – (8,478,329)
At 31 December 2015 136,979,410 2,296,421,463 137,120,350 587,217 2,571,108,440
Accumulated depreciation:
At 1 January 2015 16,909,355 562,486,091 35,039,446 – 614,434,892
Acquisition – 3,534,560 – – 3,534,560
Provided 7,395,829 49,264,950 8,329,290 101,677 65,091,746
Disposals – (1,039,375) – – (1,039,375)
Exchange realignment – – (2,271,543) – (2,271,543)
At 31 December 2015 24,305,184 614,246,226 41,097,193 101,677 679,750,280
Provision for impairment:
At 1 January 2015 and at
31 December 2015 – – – – –
Net carrying amount:
At 31 December 2015 112,674,226 1,682,175,237 96,023,157 485,540 1,891,358,160
At 1 January 2015 118,904,320 1,594,545,458 113,010,798 – 1,826,460,576
Note: The concession assets are owned by a subsidiary of the Company, Maanshan Iron & Steel (Hefei) Limited Industrial Water Supply Co., Ltd. (“Hefei Water Supply”). On 18 May 2011, Hefei Water Supply obtained a concession right by signing the “Concession Arrangement for Hefei Circle Economy Park Industrial Water Supply” (the “Arrangement”) with the Administrative Committee of Hefei Circle Economy Park (the “Park”) through open tender. According to the Arrangement, Hefei Water Supply has the right to receive fees from water users in the Park by providing principal services including: industrial water supply, and designing, constructing, occupying, operating and maintaining the industrial water treatment plant, water abstraction and pipe networks. The infrastructure construction contract was applied, and no construction service revenue was recognised. According to the agreement, the payment for the project during the construction was recognised as intangible assets. The specified concession service period is 25 years. Hefei Water Supply is obliged to transfer all infrastructures to the grantor, the Administrative Committee of Hefei Circle Economy Park, at the end of the period of the Arrangement with smooth operation guaranteed.
* The Group’s land use rights are located in Mainland China and are held under medium term leases.

Notes to Financial Statements (Continued)31 December 2016Renminbi Yuan
Maanshan Iron & Steel Company Limited2016 Annual Report
176
V. MAJOR NOTES TO CONSOLIDATED FINANCIAL STATEMENTS (CONTINUED)
17. DEFERRED TAX ASSETS/LIABILITIES
31 December 2016 31 December 2015
Deductible
temporary
differences
Deferred
tax assets
Deductible
temporary
differences
Deferred
tax assets
Deferred tax assets
Asset impairment provision 251,160,664 62,790,166 609,033,044 152,258,261
Sales incentive 352,819,600 88,204,900 130,156,316 32,539,079
Payroll payable 30,313,204 7,578,301 28,346,060 7,086,515
Government grants 621,341,760 155,335,440 403,793,240 100,948,310
Deductible tax losses – – 1,163,156 290,789
Others 136,747,904 34,186,976 149,138,364 37,284,591
1,392,383,132 348,095,783 1,321,630,180 330,407,545
31 December 2016 31 December 2015
Taxable
temporary
differences
Deferred
tax liabilities
Taxable
temporary
differences
Deferred
tax liabilities
Deferred tax liabilities
Fair value adjustments related to
business combination not under
common control 117,824,896 29,456,224 129,461,225 32,365,306
Changes in fair value of financial
products 1,619,352 404,838 1,357,705 339,426
Others 20,817,396 5,204,349 – –
140,261,644 35,065,411 130,818,930 32,704,732

Maanshan Iron & Steel Company Limited2016 Annual Report
177
V. MAJOR NOTES TO CONSOLIDATED FINANCIAL STATEMENTS (CONTINUED)
17. DEFERRED TAX ASSETS/LIABILITIES (CONTINUED)
Unrecognised deferred tax assets arising from deductible temporary differences and deductible
tax losses were as follows:
31 December
2016
31 December
2015
Deductible temporary differences 817,739,042 642,204,401
Deductible tax losses 9,605,772,407 10,096,630,655
10,423,511,449 10,738,835,056
Unrecognised deferred tax assets arising from deductible tax losses will expire in the following
years:
31 December
2016
31 December
2015
To expire in 2016 – 233,247,027
To expire in 2017 3,171,336,504 4,043,686,509
To expire in 2018 483,216,836 483,216,836
To expire in 2019 781,213,612 781,213,612
To expire in 2020 4,555,266,671 4,555,266,671
To expire in 2021 614,738,784 –
Total 9,605,772,407 10,096,630,655
The Group has not recognised the deferred tax assets related to the above deductible
temporary differences and unused tax losses, because it is highly probable that future taxable
profit will not be available to be utilised.
Based on the current rules and regulations of taxation and preferential tax policy committed
by local tax authorities or the Group deserved to have, the Group estimated the amount of
income tax and deferred tax. In business activities, there were uncertainties of tax treatments
for several transactions and issues. Therefore, if the final recognised results of issues in tax
treatments are different from the initial amount, the differences will pose influences on the
amount of income tax and deferred tax, which were recognised in the above time periods
accordingly.

Notes to Financial Statements (Continued)31 December 2016Renminbi Yuan
Maanshan Iron & Steel Company Limited2016 Annual Report
178
V. MAJOR NOTES TO CONSOLIDATED FINANCIAL STATEMENTS (CONTINUED)
17. DEFERRED TAX ASSETS/LIABILITIES (CONTINUED)
Uncovered deficit and other temporary deductible differences, such as non-deductible provision
for trade receivables before tax, inventories, fixed assets, construction in progress and so
on, the deferred tax assets are recognised to the extent that the deficit covered by taxable
profit which would probably arise in future or the deductible temporary differences that could
be reversed. The deferred tax assets are recognised based on the significant judgement by
management after considering when and how much taxable profit would arise and its tax
planning.
18. ASSET IMPAIRMENT PROVISIONS
31 December 2016
Decrease during the year
Opening
balance
Increase
during
the year Reversal
Write-back/
write-off
Other
changes
Closing
balance
Provisions for bad debts 627,660,520 36,124,204 (927,877) (355,967) – 662,500,880
Including: Trade receivables 19,196,395 2,517,257 (927,877) (55,967) – 20,729,808
Other receivables 591,559,264 2,986,251 – (300,000) – 594,245,515
Loans and advances
to customers 16,904,861 30,620,696 – – – 47,525,557
Inventory impairment provision (i) 1,004,097,488 990,453,845 – (1,702,045,332) – 292,506,001
Including: Raw materials 350,365,789 443,512,539 – (710,132,253) – 83,746,075
Work in progress 102,234,757 152,393,221 – (236,968,308) – 17,659,670
Finished goods 491,923,981 326,693,412 – (754,429,304) – 64,188,089
Spare parts 59,572,961 67,854,673 – (515,467) – 126,912,167
Property, plant and equipment
impairment provision – 38,607,464 – – – 38,607,464
Including: Buildings and plant – 6,514,174 – – – 6,514,174
Machinery and
equipment – 32,093,290 – – – 32,093,290
1,631,758,008 1,065,185,513 (927,877) (1,702,401,299) – 993,614,345

Maanshan Iron & Steel Company Limited2016 Annual Report
179
V. MAJOR NOTES TO CONSOLIDATED FINANCIAL STATEMENTS (CONTINUED)
18. ASSET IMPAIRMENT PROVISIONS (CONTINUED)
31 December 2015
Decrease during the year
Opening
balance
Increase
during the year Reversal
Write-back/
write-off Other changes Closing balance
Provisions for bad debts 590,097,877 37,690,643 (128,000) – – 627,660,520
Including: Trade receivables 16,558,216 2,638,179 – – – 19,196,395
Other receivables 556,634,800 35,052,464 (128,000) – – 591,559,264
Loans and advances
to customers 16,904,861 – – – – 16,904,861
Inventory impairment provision (i) 268,935,749 1,585,188,318 (3,360,982) (846,665,597) – 1,004,097,488
Including: Raw materials 126,475,398 671,838,086 (2,011,685) (445,936,010) – 350,365,789
Work in progress 27,565,874 190,331,339 (1,332,126) (114,330,330) – 102,234,757
Finished goods 54,862,983 723,018,893 (17,171) (285,940,724) – 491,923,981
Spare parts 60,031,494 – – (458,533) – 59,572,961
859,033,626 1,622,878,961 (3,488,982) (846,665,597) – 1,631,758,008
(i) Generally, the provision for inventories is assessed and made at the end of each quarter. The
provision for inventories will be written back and credited to the cost of sales upon the sale of the
corresponding inventories.

Notes to Financial Statements (Continued)31 December 2016Renminbi Yuan
Maanshan Iron & Steel Company Limited2016 Annual Report
180
V. MAJOR NOTES TO CONSOLIDATED FINANCIAL STATEMENTS (CONTINUED)
19. CUSTOMER DEPOSITS
31 December
2016
31 December
2015
Demand deposits 2,681,506,250 1,626,727,988
Notice deposit 285,300,000 74,500,000
Time deposits 741,418,771 200,162,500
3,708,225,021 1,901,390,488
Details of customer deposits of Masteel Financial relate to shareholders who held 5% or more
of voting shares and the related parties at 31 December 2016 and 31 December 2015 are
disclosed in Note X.6.
20. REPURCHASE AGREEMENTS
31 December
2016
31 December
2015
Bonds 397,900,000 –
Bills 198,665,698 –
596,565,698 –
According to the repurchase agreements, Masteel Financial discounted bills and bonds to other
financial institutions.

Maanshan Iron & Steel Company Limited2016 Annual Report
181
V. MAJOR NOTES TO CONSOLIDATED FINANCIAL STATEMENTS (CONTINUED)
21. SHORT TERM LOANS
31 December
2016
31 December
2015
Unsecured loans 6,002,740,320 2,398,449,636
Pledged loans (i) – 100,000,000
Inward documentary bills and usance letters of credit (ii) 940,212,100 4,292,909,836
6,942,952,420 6,791,359,472
(i) As of 31 December 2016, the Group had no pledged loans which are secured by bank bills (31
December 2015: RMB100,000,000).
(ii) As of 31 December 2016, the outstanding letters of credit of the Group amounted to
RMB940,212,100 (31 December 2015: RMB4,292,909,836).
As of 31 December 2016, the interest rates of the above short-term loans ranged from 1.628%
to 6.000% (31 December 2015: 1.310% to 6.000%).
As of 31 December 2016 the Group had overdue short term loans as follows:
Amount Overdue nature Due date
Annual
interest
rate
Overdue
interest
rate Purpose
China Everbright Bank
Shanghai Baoshan Branch 48,500,500 Principal overdue 2014.12.31 6.00% 9.00% Business borrowing
Bank of Nanjing Shanghai
Branch 29,757,036
Principal and
interest overdue 2015.01.03 5.60% 8.40% Business borrowing
Maanshan Rural Commercial
Bank 22,000,000
Principal and
interest overdue 2015.06.17 6.00% 9.00% Business borrowing
As of 31 December 2016, the overdue amount of short-term loans was RMB100,257,036,
which are unsecured loans borrowed by the Group’s subsidiary of Masteel Shanghai Trading.
Masteel Shanghai Trading is in the process of bankruptcy liquidation. The Company is in
negotiation with the banks for repayment.

Notes to Financial Statements (Continued)31 December 2016Renminbi Yuan
Maanshan Iron & Steel Company Limited2016 Annual Report
182
V. MAJOR NOTES TO CONSOLIDATED FINANCIAL STATEMENTS (CONTINUED)
22. BILLS PAYABLE
31 December
2016
31 December
2015
Bank acceptance bills 3,584,228,362 5,325,406,398
Commercial acceptance bills – 18,500,000
3,584,228,362 5,343,906,398
As of 31 December 2016 and 31 December 2015, the aging of the Group’s bills payable was
all within six months, and there were no overdue bills.
23. ACCOUNTS PAYABLE
The aging analysis of accounts payable is as follows:
31 December
2016
31 December
2015
Within one year 6,491,661,696 5,942,180,843
One to two years 62,554,813 127,899,157
Two to three years 52,430,647 21,240,086
Over three years 62,160,767 53,344,195
6,668,807,923 6,144,664,281
The accounts payable are interest-free and are normally settled within three months.
The amounts due to shareholders who held 5% or above of the Company’s equity interests and
other related parties among the balances of accounts payable as of 31 December 2016 and 31
December 2015 are stated in Note X.6 to the financial statements.

Maanshan Iron & Steel Company Limited2016 Annual Report
183
V. MAJOR NOTES TO CONSOLIDATED FINANCIAL STATEMENTS (CONTINUED)
23. ACCOUNTS PAYABLE (CONTINUED)
As of 31 December 2016, the material accounts payable aged over one year were as follows:
Amount
due
Reason for
non-settlement
Company 1 19,000,000 Note
Company 2 17,000,000 Note
Company 3 14,033,705 Note
Company 4 10,111,310 Note
Company 5 8,447,827 Note
68,592,842
Note: The Group’s accounts payable aged over one year are mainly attributable to the balances of
purchasing equipment with settlement periods beyond one year.
24. ADVANCES FROM CUSTOMERS
31 December
2016
31 December
2015
Advances from customers 3,682,322,418 2,602,554,258
As of 31 December 2016, the material deposits received aged over one year were as follows:
Amount
receivable
Reason for
outstanding
Company 1 12,236,108 Note
Company 2 2,185,715 Note
Company 3 2,023,692 Note
Company 4 1,258,483 Note
Company 5 970,621 Note
18,674,619
Note: the Group’s advances from customers aged over one year were mainly advances from customers
relating to the contracts not fully executed.

Notes to Financial Statements (Continued)31 December 2016Renminbi Yuan
Maanshan Iron & Steel Company Limited2016 Annual Report
184
V. MAJOR NOTES TO CONSOLIDATED FINANCIAL STATEMENTS (CONTINUED)
25. PAYROLL AND EMPLOYEE BENEFITS PAYABLE
2016
Opening
balance
Increase
during the year
Decrease
during the year
Closing
balance
Short-term employee benefits 263,336,940 3,268,054,882 3,014,988,648 516,403,174
Post-employment benefits
(defined contribution plans) 10,057,259 539,619,532 549,205,470 471,321
Supplementary retirement benefits (i) 1,220,524 1,477,159 1,570,660 1,127,023
One-off termination compensation (ii) – 172,343,335 172,343,335 –
Early retirement benefits due within one year – 32,443,165 – 32,443,165
274,614,723 4,013,938,073 3,738,108,113 550,444,683
2015
Opening
balance
Increase
during the year
Decrease
during the year
Closing
balance
Short-term employee benefits 288,200,550 3,168,777,038 3,193,640,648 263,336,940
Post-employment benefits
(defined contribution plans) 8,425,484 709,915,499 708,283,724 10,057,259
Supplementary retirement benefits (i) 2,451,178 771,531 2,002,185 1,220,524
299,077,212 3,879,464,068 3,903,926,557 274,614,723
(i) MG-VALDUNES provides retired workers with supplementary benefits, including supplementary
pension allowance, medical expenses and supplementary medical insurance, which are regarded
as defined benefit plans. The present value of the defined benefit plans is equal to the discounted
value of the estimated future cash outflow. The discounted rate is determined by the interest rate of
government bonds of which maturity is close to the payment date of the defined benefit plans. The
payroll and employee benefits payable with maturity of more than one year are recognised in long-
term compensation.
(ii) One-off termination compensation included the termination compensation amounting to
RMB152,568,484 paid by Ma Steel (Hefei) Iron & Steel Co., Ltd. (“Ma Steel (Hefei)”) to its
employees due to the shutting down and transformation and the termination compensation
amounting to RMB19,774,851 paid by the Company to its employees due to human resource
optimisation.

Maanshan Iron & Steel Company Limited2016 Annual Report
185
V. MAJOR NOTES TO CONSOLIDATED FINANCIAL STATEMENTS (CONTINUED)
25. PAYROLL AND EMPLOYEE BENEFITS PAYABLE (CONTINUED)
Short-term employee benefits:
2016
Opening
balance
Increase
during the year
Decrease
during the year
Closing
balance
Salaries, bonuses and subsidies 211,386,627 2,588,861,452 2,330,256,937 469,991,142
Welfare 21,019,222 119,535,313 121,362,477 19,192,058
Social insurance 15,911 220,098,717 220,114,628 –
Including: Medical insurance (3,693) 183,533,733 183,530,040 –
Work-related injury insurance 13,004 29,378,746 29,391,750 –
Maternity insurance 6,600 7,186,238 7,192,838 –
Housing fund 25,661,454 272,985,670 278,337,982 20,309,142
Labor union fee and employee education fee 5,253,726 66,573,730 64,916,624 6,910,832
263,336,940 3,268,054,882 3,014,988,648 516,403,174
2015
Opening
balance
Increase
during the year
Decrease
during the year
Closing
balance
Salaries, bonuses and subsidies 227,148,455 2,422,073,592 2,437,835,420 211,386,627
Welfare 21,900,908 133,447,693 134,329,379 21,019,222
Social insurance 879,915 261,262,554 262,126,558 15,911
Including: Medical insurance 74,900 208,572,354 208,650,947 (3,693)
Work-related injury insurance 810,674 41,581,435 42,379,105 13,004
Maternity insurance (5,659) 11,108,765 11,096,506 6,600
Housing fund 24,578,790 295,415,368 294,332,704 25,661,454
Labor union fee and employee education fee 13,692,482 56,577,831 65,016,587 5,253,726
288,200,550 3,168,777,038 3,193,640,648 263,336,940

Notes to Financial Statements (Continued)31 December 2016Renminbi Yuan
Maanshan Iron & Steel Company Limited2016 Annual Report
186
V. MAJOR NOTES TO CONSOLIDATED FINANCIAL STATEMENTS (CONTINUED)
25. PAYROLL AND EMPLOYEE BENEFITS PAYABLE (CONTINUED)
Defined contribution plans:
2016
Opening
balance
Increase
during the year
Decrease
during the year
Closing
balance
Pension insurance 365,178 493,460,702 493,825,880 –
Unemployment insurance 184,483 27,324,716 27,509,199 –
Supplementary pension scheme 9,507,598 18,834,114 27,870,391 471,321
10,057,259 539,619,532 549,205,470 471,321
2015
Opening
balance
Increase
during the year
Decrease
during the year
Closing
balance
Pension insurance (134,056) 565,283,557 564,784,323 365,178
Unemployment insurance (53,790) 38,463,289 38,225,016 184,483
Supplementary pension scheme 8,613,330 106,168,653 105,274,385 9,507,598
8,425,484 709,915,499 708,283,724 10,057,259
As of 31 December 2016 and 31 December 2015, the balance of payroll and employee benefits
payable had not included performance-based wages.
In addition to the basic social endowment insurance, employees (including employees of the
Company and some wholly-owned subsidiaries) participated in the established retirement
benefit contribution plans (hereinafter referred to as the “Annuity Plan”) established by the
Group. The employees who participated in the Annuity Plan use the bases of social insurance
premiums as their deposit base. The deposit rates of the Group and employees are 5% and
1%, respectively. In 2016, the Group had pay an annuity amount of RMB27,870,391 (2015:
RMB105,274,385), and the final balance of provisions but unpaid annuity was RMB471,321
(2015: RMB9,507,598).

Maanshan Iron & Steel Company Limited2016 Annual Report
187
V. MAJOR NOTES TO CONSOLIDATED FINANCIAL STATEMENTS (CONTINUED)
25. PAYROLL AND EMPLOYEE BENEFITS PAYABLE (CONTINUED)
Long-term compensation:
31 December
2016
31 December
2015
1. Post-employment benefits – net liability of defined
benefit plans (Note1) 159,868,285 –
Less: Early retirement benefits due within one year 32,443,165 –
2. Supplementary retirement benefit 32,875,106 30,077,913
Less: Supplementary retirement benefit due within
one year 1,127,023 1,220,524
159,173,203 28,857,389
Note 1: Post-employment benefits – net defined benefit liability
2016
Opening
balance Increase Decrease
Closing
balance
Less:
Due within
one year
Closing
balance
Early retirement benefits – 175,125,396 (15,257,111) 159,868,285 32,443,165 127,425,120

Notes to Financial Statements (Continued)31 December 2016Renminbi Yuan
Maanshan Iron & Steel Company Limited2016 Annual Report
188
V. MAJOR NOTES TO CONSOLIDATED FINANCIAL STATEMENTS (CONTINUED)
25. PAYROLL AND EMPLOYEE BENEFITS PAYABLE (CONTINUED)
Early retirement benefits expected to be paid by the Group:
31 December
2016
31 December
2015
Undiscounted value
Within one year 32,443,165 –
One to two years 29,197,924 –
Two to three years 26,523,841 –
Over three years 90,136,936 –
178,301,866 –
Financial charges to be recognised (18,433,581) –
159,868,285 –
Less: Due within one year 32,443,165 –
127,425,120 –
Early retirement benefit scheme was implemented by the Company due to the implementation
of the human resource optimisation policy, which allowed qualified employees to early retire on
a voluntary basis. The Company undertakes obligation to pay the early retirement employees’
living expenses for one to ten years in the future. The Company calculated the amounts of
monthly payments to employees participating in the early retirement plan based on an internally
decided standard, and the Company is also responsible for social insurance and housing fund
in accordance with local social security requirement. The Company forecasted the amount of
early retirement benefits needed to be paid in the future years using a growth rate of 2.01%
which is based on the average growth rate of CPI. When deciding the payment responsibility
in the future for the employees participating in the early retirement plan, the Company adjusted
the payment responsibility based on average mortality of Chinese people from “China Life
Insurance Mortality Table (2010 to 2013)”. The adjusted payment responsibility was discounted
by the treasure bond rate of 31 December 2016 and accounted in general administrative
expenses. As of 31 December 2016, the current portion of the payment responsibility was
accounted for in short-term employee benefits.

Maanshan Iron & Steel Company Limited2016 Annual Report
189
V. MAJOR NOTES TO CONSOLIDATED FINANCIAL STATEMENTS (CONTINUED)
26. TAXES PAYABLE
31 December
2016
31 December
2015
Value-added tax 112,249,203 21,109,732
Corporate income tax 48,757,600 30,194,469
City construction and maintenance tax 34,523,584 23,263,501
Other taxes 78,701,727 75,330,619
274,232,114 149,898,321
The basis of calculation and the applicable tax rates are disclosed in Note IV to the financial
statements.
27. INTEREST PAYABLES
31 December
2016
31 December
2015
Interest payables for short-term loans 9,590,649 4,011,073
Installment interest payables for long-term loans
repayable on due date 10,280,475 11,897,022
Interest payables for corporate bonds – 47,340,885
Interest payables for medium term notes 87,820,274 87,580,328
107,691,398 150,829,308
As of 31 December 2016, the Group had an overdue interest payable of RMB629,907 (31
December 2015: RMB629,907). It was incurred by the Group’s subsidiary, Masteel Shanghai
Trading, due to the shortage of cash. Refer to Note V.21.

Notes to Financial Statements (Continued)31 December 2016Renminbi Yuan
Maanshan Iron & Steel Company Limited2016 Annual Report
190
V. MAJOR NOTES TO CONSOLIDATED FINANCIAL STATEMENTS (CONTINUED)
28. DIVIDENDS PAYABLE
31 December
2016
31 December
2015
Other shareholders 8,713,584 6,525,534
29. OTHER PAYABLES
31 December
2016
31 December
2015
Payable for construction, maintenance and
inspection fees 174,015,328 207,933,025
Sales incentives 106,499,407 80,592,053
Service fees payable 22,336,562 17,926,119
Technology project fund received 41,804,635 34,750,947
Withholding social welfare and housing fund payable 36,408,783 43,903,216
Accrued interest expense for letters of credit 72,642,916 152,354,842
Payable for forfaiting 954,411,901 460,668,886
Others 504,455,546 260,334,425
1,912,575,078 1,258,463,513
At 31 December 2016, significant other payables aged over one year were as follows:
Amount
payable
Reason for
non-settlement
Company 1 3,000,000 Note
Company 2 2,000,000 Note
Company 3 2,000,000 Note
Company 4 2,000,000 Note
Company 5 1,200,952 Note
10,200,952
Note: The Group’s other payables aged over one year were mainly the performance guarantee received
for the construction and purchase of materials. Since the contracts were not completed, the
payments were not settled.

Maanshan Iron & Steel Company Limited2016 Annual Report
191
V. MAJOR NOTES TO CONSOLIDATED FINANCIAL STATEMENTS (CONTINUED)
30. NON-CURRENT LIABILITIES DUE WITHIN ONE YEAR
31 December
2016
31 December
2015
Long term loans due within one year (Note V.33) (Note) 3,211,056,320 2,747,792,896
Bonds payable due within one year (Note V.34) – 2,337,066,519
3,211,056,320 5,084,859,415
Note: As of 31 December 2016, the Group had a long-term loan due within one year amounting to
RMB600,000,000 which was pledged with bills (31 December 2015: RMB970,000,000).
31. ACCRUED LIABILITIES
2016
Opening
balance
Increase
during the year
Decrease
during the year
Closing
balance
Pending litigation or arbitration 3,415,629 7,451,446 – 10,867,075
Pending onerous contract (Note) 18,601,341 14,354,836 18,671,330 14,284,847
Others 215,743 4,429,741 216,971 4,428,513
22,232,713 26,236,023 18,888,301 29,580,435
Note: The accrued liabilities of the pending onerous contract represents an expected loss from executing
some sales orders entered by the Group’s subsidiary, MG-VALDUNES. Management estimated the
cost of executing those orders would exceed the agreed price. Therefore, the accrued liabilities
were estimated at RMB14,284,847 at the end of 2016.

Notes to Financial Statements (Continued)31 December 2016Renminbi Yuan
Maanshan Iron & Steel Company Limited2016 Annual Report
192
V. MAJOR NOTES TO CONSOLIDATED FINANCIAL STATEMENTS (CONTINUED)
32. OTHER CURRENT LIABILITIES
31 December
2016
31 December
2015
Other current liabilities (i) 2,046,438,356 –
Others (ii) 226,620,000 –
2,273,058,356 –
(i) Other current l iab i l i t ies o f the Group were the pr inc ipa l and in terest amount ing to
RMB2,000,000,000 and RMB46,438,356 respectively of the short-term financing bonds issued by
the Company on 2 August 2016.
(ii) The Company received the advance of land use tax refund for 2017 from the local Finance Bureau
amounting to RMB142,000,000 in 2016 and the advance of development and reform subsidy for
2017 from the municipal government amounting to RMB84,620,000.
33. LONG TERM LOANS
31 December
2016
31 December
2015
Guaranteed loans 1,175,968,960 1,973,971,584
Unsecured loans 3,987,200,000 4,681,200,000
5,163,168,960 6,655,171,584
As of 31 December 2016, the interest rates of the above long-term loans ranged from 1.20% to
4.75% (31 December 2015: from 1.20% to 6.00%)
Notes to Financial Statements
31 December 2016
Renminbi Yuan

Maanshan Iron & Steel Company Limited2016 Annual Report
193
V. MAJOR NOTES TO CONSOLIDATED FINANCIAL STATEMENTS (CONTINUED)
33. LONG TERM LOANS (CONTINUED)
* Analysis on the due date of long term loans is as follows:
31 December
2016
31 December
2015
*Within one year or on demand (Note V. 30) 3,211,056,320 2,747,792,896
One to two years (inclusive) 4,255,056,320 6,243,992,896
Two to three years (inclusive) 761,056,320 238,292,896
Three to five years (inclusive) 51,056,320 117,585,792
Over five years 96,000,000 55,300,000
8,374,225,280 9,402,964,480
34. BONDS PAYABLE
31 December
2016
31 December
2015
Medium-term note payable 3,987,666,667 3,979,666,667
Corporate bonds - 5 years – 2,337,066,519
3,987,666,667 6,316,733,186
Less: Bonds payable due within one year (Note V.30)
Including: Corporate bonds – 2,337,066,519
3,987,666,667 3,979,666,667

Notes to Financial Statements (Continued)31 December 2016Renminbi Yuan
Maanshan Iron & Steel Company Limited2016 Annual Report
194
V. MAJOR NOTES TO CONSOLIDATED FINANCIAL STATEMENTS (CONTINUED)
34. BONDS PAYABLE (CONTINUED)
As of 31 December 2016, the bonds payable balances were as follows:
Issue date
Term to
maturity
Amount
on offer
Opening
balance
Current year
issuance
Amortisation
of discount
Current year
repayment
Closing
balance
Current year
accrued
interest
Medium-term note payable –
2015 first issue 2015/07 3 years 2,000,000,000 1,990,000,000 – 4,000,000 – 1,994,000,000 101,533,591
2015 second issue 2015/08 3 years 2,000,000,000 1,989,666,667 – 4,000,000 – 1,993,666,667 96,106,355
Corporate bonds - 5 years 2011/08 3 years 2,340,000,000 2,337,066,519 – 2,933,481 2,340,000,000 – 86,975,115
6,340,000,000 6,316,733,186 – 10,933,481 2,340,000,000 3,987,666,667 284,615,061
As of 31 December 2015, the bonds payable balances were as follows:
Issue date
Term to
maturity
Amount
on offer
Opening
balance
Current year
issuance
Amortisation
of discount
Current year
repayment
Closing
balance
Current year
accrued
interest
Medium-term note payable –
2015 first issue 2015/07 3 years 2,000,000,000 – 2,000,000,000 (10,000,000) – 1,990,000,000 48,760,656
2015 second issue 2015/08 3 years 2,000,000,000 – 2,000,000,000 (10,333,333) – 1,989,666,667 38,819,672
Corporate bonds - 5 years 2011/08 3 years 2,340,000,000 2,332,666,298 – 4,400,221 – 2,337,066,519 134,186,299
6,340,000,000 2,332,666,298 4,000,000,000 (15,933,112) – 6,316,733,186 221,766,627
Medium-term note payable
In June 2015, the Company obtained the approval of the National Association of Financial
Market Institutional Investors regarding the issuance of a medium-term note with a registration
amount of RMB4 billion, which will expire within two years. The medium-term note is allowed to
be issued by stages in its registration period of validity.
On 9 July 2015, the Company issued the first batch of medium-term note of RMB2 billion
(abbreviated as 15 Magang MTN001). The issuance price was RMB100/Note, and has a fixed
rate of interest at 5.07% per annum. On 6 August 2015, the Company issued the second batch
of medium-term note of RMB2 billion (abbreviated as 15 Magang MTN002). The issuance price
is RMB100/Note, and has a fixed rate of interest at 4.80% per annum.

Maanshan Iron & Steel Company Limited2016 Annual Report
195
V. MAJOR NOTES TO CONSOLIDATED FINANCIAL STATEMENTS (CONTINUED)
34. BONDS PAYABLE (CONTINUED)
Corporate bonds
Upon the approval of the China Securities Supervision and Management Committee, [2011] no.
1177, the Company issued corporate bonds amounting to RMB5.5 billion with an issue price
of RMB100/Note in August 2011, including RMB3.16 billion (abbreviated as 11 Magang 01)
due within three years with an interest rate of 5.63%, and RMB2.34 billion (abbreviated as 11
Magang 02) due within five years with an interest rate of 5.74%. These corporate bonds were
secured by the Holding. The net amount the Company received from these corporate bonds
was RMB5,453,788,000. The corporate bond ‘11 Magang 01’ had been paid on the due date
in 2014 and the corporate bond ‘11 Magang 02’had been paid on 25 August 2016.
The interest for the year of the above bonds with the medium-term note was included in
interest payable.
35. DEFERRED INCOME
2016
Opening
balance Increase Decrease
Ending
balance
Government grants 1,285,164,299 103,844,476 119,512,237 1,269,496,538
2015
Opening
balance Increase Decrease
Ending
balance
Government grants 1,186,358,849 186,448,184 87,642,734 1,285,164,299

Notes to Financial Statements (Continued)31 December 2016Renminbi Yuan
Maanshan Iron & Steel Company Limited2016 Annual Report
196
V. MAJOR NOTES TO CONSOLIDATED FINANCIAL STATEMENTS (CONTINUED)
35. DEFERRED INCOME (CONTINUED)
As of 31 December 2016, liabilities related to government subsidies were as follows:
Opening
balance Additions
Included in
non-operating
income Other changes
Closing
balance
Related to
assets/
income
Compensation of land purchasing and storage (Note) 652,138,319 – – – 652,138,319 Income
Technological transformation fund for
Phase II silicon steel 88,641,669 – (4,400,000) – 84,241,669 Assets
Subsidy for land use rights in the new zone
(Block No. 31836 & 31837) 44,871,120 – (5,503,732) – 39,367,388 Assets
Subsidy for developing emerging strategic
industries in Anhui Province 40,788,750 – (1,980,000) – 38,808,750 Assets
New-zone Thermal Power Plant CCPP system
engineering 35,377,972 – (4,312,000) – 31,065,972 Assets
EMU steel wheel production line project 37,174,990 – (2,200,000) – 34,974,990 Assets
Cold-rolled sheet project 8,534,639 – (7,612,000) – 922,639 Assets
Relocation compensation for Transport Company 10,000,000 – (5,000,000) – 5,000,000 Assets
Exhaust gas power generation projects of
Steel blast furnace 10,090,000 – (660,000) – 9,430,000 Assets
1# – 4# coke dry quenching 9,774,893 – (920,480) – 8,854,413 Assets
Dezincification engineering of zinc dust and
mud rotary hearth furnace for 3rd iron plant 9,628,330 – (880,000) – 8,748,330 Assets
Environmental subsidy funds for flue gas
desulfurisation and 135 mw thermal power 10,000,000 – – – 10,000,000 Assets
Hot-rolled sheet project 1,745,361 – (1,745,361) – – Assets
Exhaust heat power generation by sintering belt
cooler of 3rd iron plant 8,319,817 – (698,720) – 7,621,097 Assets
National subsidy for slag muck processing and
recycling engineering (AD201050406) 2,818,333 – – – 2,818,333 Assets
Subsidy for construction by Wuhu Technique 7,147,112 – (1,453,650) – 5,693,462 Assets
6# full burning blast furnace gas boiler works 7,534,084 – (918,280) – 6,615,804 Assets
Municipal environmental protection subsidies
for desulfurisation engineering of 3rd iron
plant’s sintering flue gas 7,870,000 – – – 7,870,000 Assets
5 # 6 # coke dust removal project 12,247,819 – (363,000) – 11,884,819 Assets
Fix assets subsidy for thin plate project 16,501,300 17,054,300 (2,106,927) – 31,448,673 Assets
Flue gas curtailment project for 1st
iron plant’s blast furnace 6,366,464 – (324,249) – 6,042,215 Assets
Subsidy for technology advancement from open-hearth
furnace to converter for 1st steel plant 1,099,840 – (1,099,840) – – Assets
Rolled wheel works 4,068,000 – (2,112,000) – 1,956,000 Assets
Pulse clarifier antipollution 5,514,167 – – – 5,514,167 Assets
Environmental funds for desulfurisation project of
3rd iron plant’s flue gas (BOT) 5,550,000 – – – 5,550,000 Assets
National environmental fund for flue gas treatment by
3rd steel plant (AI201150304) 9,375,700 – – – 9,375,700 Assets
Subsidies for environmental protection funds of
smoke desulfurisation project 5,000,000 – – – 5,000,000 Assets

Maanshan Iron & Steel Company Limited2016 Annual Report
197
Opening
balance Additions
Included in
non-operating
income Other changes
Closing
balance
Related to
assets/
income
No.3 Iron general factory thermoelectricity plant
135MW generators 5,000,000 – – – 5,000,000 Assets
New-zone coking field project 6,166,501 – (926,640) – 5,239,861 Assets
Comprehensive utilisation of water resources 3,080,550 – (871,200) – 2,209,350 Assets
Subsidy for Masteel new-zone CDQ project 600,000 – – – 600,000 Assets
Subsidy for material modification of
high speed wheel and axle 33,720,000 – – – 33,720,000 Assets
Environment protection subsidy for the
thermal power plant Denitrification 4,500,000 – – – 4,500,000 Assets
Subsidies for environmental protection funds of
smoke desulfurisation project No.2 Iron general
factory 2# Sintering machine 7,000,000 13,296,887 – – 20,296,887 Assets
Subsidies for environmental protection funds of
smoke desulfurisation project No.1 Iron general
factory 3# Sintering machine 3,000,000 – – 3,000,000 Assets
Interest subsidy for rail transit industrialisation
project of Masteel 11,121,099 – (10,271,882) – 849,217 Assets
Development and reform subsidy 55,000,000 – (466,400) – 54,533,600 Assets
Development fund of efficient and economical
construction steel technology 12,164,850 – – – 12,164,850 Assets
Technology development fund by Ministry of
science and technology 19,857,445 – – – 19,857,445 Assets
Intelligent manufacturing fund for Ma-Steel Rail
Transportation 6,564,032 – (553,251) – 6,010,781 Assets
Subsidy for Maanshan railway industry – 14,000,000 – – 14,000,000 Assets
Comprehensive utilisation of gas for
power generation of a thermal power plant – 24,790,000 – – 24,790,000 Assets
Environmental subsidy for biochemical water upgrade
project of coke old area upgration project of coke old – 4,960,000 – – 4,960,000 Assets
Government subsidy for desulphurisation and
denitrification of gases project of
a thermal power plant – 4,800,000 – – 4,800,000 Assets
Government subsidy for dust elimination of hot mental
pouring on converter roof – 3,600,000 – – 3,600,000 Assets
Others 59,211,143 21,343,289 (59,600,371) (2,532,254) 18,421,807 Assets
Total 1,285,164,299 103,844,476 (116,979,983) (2,532,254) 1,269,496,538
Note: The government grant related to income was mainly attributed to the compensation for disposal of
land use right received from Hefei Municipal Land Resource Center by Ma Steel (Hefei).
V. MAJOR NOTES TO CONSOLIDATED FINANCIAL STATEMENTS (CONTINUED)
35. DEFERRED INCOME (CONTINUED)
As of 31 December 2016, liabilities related to government subsidies were as follows:
(continued)

Notes to Financial Statements (Continued)31 December 2016Renminbi Yuan
Maanshan Iron & Steel Company Limited2016 Annual Report
198
V. MAJOR NOTES TO CONSOLIDATED FINANCIAL STATEMENTS (CONTINUED)
35. DEFERRED INCOME (CONTINUED)
As of 31 December 2015, liabilities related to government subsidies were as follows:
Opening
balance Additions
Included in
non-operating
income Other changes
Closing
balance
Related to
assets/
income
Compensation of land purchasing and storage 652,138,319 – – – 652,138,319 Income
Technological transformation fund for
Phase II silicon steel 93,041,669 – (4,400,000) – 88,641,669 Assets
Subsidy for land use rights in the new zone
(Block No. 31836 & 31837) 50,374,852 – (5,503,732) – 44,871,120 Assets
Subsidy for developing emerging strategic
industries in Anhui Province 42,768,750 – (1,980,000) – 40,788,750 Assets
New-zone Thermal Power Plant CCPP system
engineering 39,689,972 – (4,312,000) – 35,377,972 Assets
EMU steel wheel production line project 39,374,990 – (2,200,000) – 37,174,990 Assets
Cold-rolled sheet project 16,146,639 – (7,612,000) – 8,534,639 Assets
Relocation compensation for Transport Company 15,000,000 – (5,000,000) – 10,000,000 Assets
Exhaust gas power generation projects of
Steel blast furnace 10,750,000 – (660,000) – 10,090,000 Assets
1# – 4# coke dry quenching 10,695,373 – (920,480) – 9,774,893 Assets
Dezincification engineering of zinc dust and
mud rotary hearth furnace for 3rd iron plant 10,508,330 – (880,000) – 9,628,330 Assets
Environmental subsidy funds for flue gas
desulfurisation and 135 MW thermal power 10,000,000 – – – 10,000,000 Assets
Hot-rolled sheet project 9,973,361 – (8,228,000) – 1,745,361 Assets
Exhaust heat power generation by sintering
belt cooler of 3rd iron plant 9,018,537 – (698,720) – 8,319,817 Assets
National subsidy for slag muck processing and
recycling engineering (AD201050406) 8,617,500 – (5,799,167) – 2,818,333 Assets
Subsidy for construction by Wuhu Technique 8,600,762 – (1,453,650) – 7,147,112 Assets
6# full burning blast furnace gas boiler works 8,452,364 – (918,280) – 7,534,084 Assets
Municipal environmental protection subsidies for
desulfurisation engineering of 3rd iron plant’s
sintering flue gas 7,870,000 – – – 7,870,000 Assets
5# 6# coke dust removal project 12,610,819 – (363,000) – 12,247,819 Assets
Fix assets subsidy for thin plate project 7,031,000 9,944,300 (474,000) – 16,501,300 Assets
Flue gas curtailment project for 1st iron plant’s
blast furnace 6,690,713 – (324,249) – 6,366,464 Assets
Subsidy for technology advancement from open-hearth
furnace to converter for 1st steel plant 6,284,800 – (5,184,960) – 1,099,840 Assets

Maanshan Iron & Steel Company Limited2016 Annual Report
199
Opening
balance Additions
Included in
non-operating
income Other changes
Closing
balance
Related to
assets/
income
Rolled wheel works 6,180,000 – (2,112,000) – 4,068,000 Assets
Pulse clarifier anti-pollution 5,839,167 – (325,000) – 5,514,167 Assets
Environmental funds for desulfurisation
project of 3rd iron plant’s flue gas (BOT) 5,550,000 – – – 5,550,000 Assets
National environmental fund for flue gas treatment by
3rd steel plant (AI201150304) 9,375,700 – – – 9,375,700 Assets
Subsidies for environmental protection funds of
smoke desulfurisation project 5,000,000 – – – 5,000,000 Assets
No.3 Iron general factory thermoelectricity
plant 135MW generators 5,000,000 – – – 5,000,000 Assets
New-zone coking field project 7,093,141 – (926,640) – 6,166,501 Assets
Comprehensive utilisation of water resources 3,951,750 – (871,200) – 3,080,550 Assets
Subsidy for Masteel new-zone CDQ project – 600,000 – – 600,000 Assets
Subsidy for material modification of
high speed wheel and axle – 33,720,000 – – 33,720,000 Assets
Environment protection subsidy for the thermal power
plant denitrification – 4,500,000 – – 4,500,000 Assets
Subsidies for environmental protection funds of
smoke desulfurisation project No.2 Iron general
factory 2# Sintering machine – 7,000,000 – – 7,000,000 Assets
Subsidies for environmental protection funds of
smoke desulfurisation project No.1 Iron general
factory 3# Sintering machine – 3,000,000 – – 3,000,000 Assets
Interest subsidy for rail transit industrialisation
project of Masteel – 25,650,000 (14,528,901) – 11,121,099 Assets
Development and reform subsidy – 55,000,000 – – 55,000,000 Assets
Development fund of efficient and economical
construction steel technology – 12,164,850 – – 12,164,850 Assets
Technology development fund by Ministry of
Science and Technology – 19,857,445 – – 19,857,445 Assets
Intelligent manufacturing fund for Ma-Steel Rail
Transportation – 9,000,000 (2,435,968) – 6,564,032 Assets
Others 62,730,341 6,011,589 (9,073,403) (457,384) 59,211,143
Total 1,186,358,849 186,448,184 (87,185,350) (457,384) 1,285,164,299
V. MAJOR NOTES TO CONSOLIDATED FINANCIAL STATEMENTS (CONTINUED)
35. DEFERRED INCOME (CONTINUED)
As of 31 December 2015, liabilities related to government subsidies are as follows: (continued)

Notes to Financial Statements (Continued)31 December 2016Renminbi Yuan
Maanshan Iron & Steel Company Limited2016 Annual Report
200
V. MAJOR NOTES TO CONSOLIDATED FINANCIAL STATEMENTS (CONTINUED)
36. SHARE CAPITAL
31 December 2016
At 1 January 2016 Increase/(decrease) during the year At 31 December 2016
Registered, issued and fully paid
Number ofshares Percentage
Sharesissued Others Subtotal
Number ofshares Percentage
(%) (%)
A. Shares with selling restriction1. State-owned shares – – – – – – –2. State-owned legal
person shares – – – – – – –3. Other domestically
owned shares – – – – – – –Including:Shares owned by
domestic natural persons – – – – – – –
Sub-total – – – – – – –
B. Shares without selling restriction1. A shares 5,967,751,186 77.5 – – – 5,967,751,186 77.52. H shares 1,732,930,000 22.5 – – – 1,732,930,000 22.5
Sub-total 7,700,681,186 100.0 – – – 7,700,681,186 100.0
C. Total 7,700,681,186 100.0 – – – 7,700,681,186 100.0
31 December 2015
At 1 January 2015 Increase/(decrease) during the year At 31 December 2015
Registered,issued and fully paid
Number ofshares Percentage
Sharesissued Others Subtotal
Number ofshares Percentage
(%) (%)
A. Shares with selling restriction1. State-owned shares – – – – – – –2. State-owned legal
person shares – – – – – – –3. Other domestically
owned shares – – – – – – –Including:Shares owned by
domestic natural persons – – – – – – –
Sub-total – – – – – – –
B. Shares without selling restriction1. A shares 5,967,751,186 77.5 – – – 5,967,751,186 77.52. H shares 1,732,930,000 22.5 – – – 1,732,930,000 22.5
Sub-total 7,700,681,186 100.0 – – – 7,700,681,186 100.0
C. Total 7,700,681,186 100.0 – – – 7,700,681,186 100.0
* Other than H share dividends, which are paid in Hong Kong dollars, all shares, including A shares and H shares, have the same right to the Company’s operating results and voting rights. The par value for each A share or H share is RMB1.00.

Maanshan Iron & Steel Company Limited2016 Annual Report
201
V. MAJOR NOTES TO CONSOLIDATED FINANCIAL STATEMENTS (CONTINUED)
37. CAPITAL RESERVE
31 December 2016
Opening
balance
Increase
during
the year
Decrease
during
the year
Closing
balance
Share premium 8,338,358,399 – – 8,338,358,399
Business combination involving entities under
common control (9,290,736) – – (9,290,736)
Others – 19,659,078 – 19,659,078
8,329,067,663 19,659,078 – 8,348,726,741
31 December 2015
Opening
balance
Increase
during
the year
Decrease
during
the year
Closing
balance
Share premium 8,338,358,399 – – 8,338,358,399
Business combination involving entities under
common control (9,290,736) – – (9,290,736)
8,329,067,663 – – 8,329,067,663
38. OTHER COMPREHENSIVE INCOME
Closing balance of other comprehensive income attributable to owners of the parent company
in the statement of financial position:
1 January
2015
Increase/
(decrease)
31 December
2015
Increase/
(decrease)
31 December
2016
Change in fair value of available-for-
sale financial assets – – – (803,607) (803,607)
Exchange differences arising from
foreign currency translation (137,159,480) (28,291,071) (165,450,551) 46,990,704 (118,459,847)
(137,159,480) (28,291,071) (165,450,551) 46,187,097 (119,263,454)

Notes to Financial Statements (Continued)31 December 2016Renminbi Yuan
Maanshan Iron & Steel Company Limited2016 Annual Report
202
V. MAJOR NOTES TO CONSOLIDATED FINANCIAL STATEMENTS (CONTINUED)
38. OTHER COMPREHENSIVE INCOME (CONTINUED)
Amount of other comprehensive income attributable to owners of the parent company in the
statement of profit or loss:
2016
Amount
before tax
Income
tax
Amount
after tax
Exchange differences arising from foreign
currency translation 46,990,704 – 46,990,704
Changes in fair value of available-for-sale
financial assets (1,071,476) 267,869 (803,607)
Less: Recorded in other comprehensive
income originally, transferred in and
included in current profit or loss – – –
45,919,228 267,869 46,187,097
2015
Amount
before tax
Income
tax
Amount
after tax
Exchange differences arising from foreign
currency translation (28,291,071) – (28,291,071)
Less: Recorded in other comprehensive
income originally, transferred in and
included in current profit or loss – – –
(28,291,071) – (28,291,071)

Maanshan Iron & Steel Company Limited2016 Annual Report
203
V. MAJOR NOTES TO CONSOLIDATED FINANCIAL STATEMENTS (CONTINUED)
39. SPECIAL RESERVE
2016
Opening
balance
Increase
during
the year
Decrease
during
the year
Closing
balance
Safety fund 14,374,213 98,487,391 (84,892,033) 27,969,571
2015
Opening
balance
Increase
during
the year
Decrease
during
the year
Closing
balance
Safety fund 21,511,442 86,927,211 (94,064,440) 14,374,213
Special reserve is the safety fund accrued according to the article of No.16 “The regulation
on the accrual and usage of enterprise’s safety production fee”, carried out by the Ministry
of Finance and State Administration of Work Safety on 14 February 2012. The fees are
mainly related to the industries of mining, gas, communication and transportation, metallurgy,
manufacturing, and construction services.
40. SURPLUS RESERVES
2016
Opening
balance
Increase
during
the year
Decrease during
the year
Closing
balance
Statutory reserve (i) 3,152,880,381 – – 3,152,880,381
Discretionary surplus reserve (ii) 529,154,989 – – 529,154,989
Reserve fund (iii) 95,685,328 – – 95,685,328
Enterprise expansion fund (iii) 65,510,919 – – 65,510,919
3,843,231,617 – – 3,843,231,617

Notes to Financial Statements (Continued)31 December 2016Renminbi Yuan
Maanshan Iron & Steel Company Limited2016 Annual Report
204
V. MAJOR NOTES TO CONSOLIDATED FINANCIAL STATEMENTS (CONTINUED)
40. SURPLUS RESERVES (CONTINUED)
2015
Opening
balance
Increase
during
the year
Decrease
during
the year
Closing
balance
Statutory reserve (i) 3,141,371,281 11,509,100 – 3,152,880,381
Discretionary surplus reserve (ii) 529,154,989 – – 529,154,989
Reserve fund (iii) 95,271,485 413,843 – 95,685,328
Enterprise expansion fund (iii) 65,660,945 (150,026) – 65,510,919
3,831,458,700 11,772,917 – 3,843,231,617
(i) In accordance with the Company Law of the PRC and the articles of association of the Company,
the Company is required to allocate 10% of its profit after tax, as determined in accordance with
CAS and related regulations applicable to these companies, to the statutory reserve (the “SR”)
until such reserve reaches 50% of the registered capital of these companies. Part of the SR may
be capitalised as these companies’ share capital, provided that the remaining balance after the
capitalisation is not less than 25% of the registered capital of these companies.
In 2016, the Group did not accrue statutory reserve (2015: RMB11,509,100).
(ii) The Company is authorised to allocate the discretionary surplus reserve from profit after tax after
the allocation of the statutory reserve. Upon the approval of the board, the discretionary surplus
reserve can be used to cover losses or increase capital.
(iii) Upon the approval of the board, these subsidiaries are required to allocate certain of their profit
after tax as determined in accordance with CAS and related regulations to the enterprise expansion
fund and the reserve fund. The allocation rates are determined by their respective boards of
directors.

Maanshan Iron & Steel Company Limited2016 Annual Report
205
V. MAJOR NOTES TO CONSOLIDATED FINANCIAL STATEMENTS (CONTINUED)
41. ACCUMULATED LOSSES
2016 2015
(Accumulated losses)/retained profits (1,368,605,137) 3,451,299,829
Add: Net profit/(loss) attributable to the owners of the
parent company 1,228,892,407 (4,804,299,674)
Less: Transfer to surplus reserve – 11,509,100
Transfer to discretionary surplus reserve – –
Transfer to reserve fund – 413,843
Transfer to enterprise expansion fund – (150,026)
Transfer to general reserve 50,855,892 3,832,375
Accumulated losses at the end of year (190,568,622) (1,368,605,137)
42. REVENUE AND COST OF SALES
2016 2015
Revenue Cost of sales Revenue Cost of sales
Principal operating income 47,323,785,914 41,607,003,797 44,008,587,535 44,086,048,485
Other operating income 951,314,396 950,483,878 1,100,339,204 1,402,392,067
48,275,100,310 42,557,487,675 45,108,926,739 45,488,440,552
* Principal operating income represents the net invoiced value of goods sold, after allowance for
returns and trade discounts, and excludes value added taxes and intra-group transactions.
Revenue is stated as follows:
2016 2015
Sale of products 47,958,420,215 44,901,171,263
Rendering of services 245,269,164 121,856,692
Others 71,410,931 85,898,784
48,275,100,310 45,108,926,739

Notes to Financial Statements (Continued)31 December 2016Renminbi Yuan
Maanshan Iron & Steel Company Limited2016 Annual Report
206
V. MAJOR NOTES TO CONSOLIDATED FINANCIAL STATEMENTS (CONTINUED)
43. TAXES AND SURCHARGES
2016 2015
City construction and maintenance tax 127,680,294 103,166,959
Education surcharge 90,272,915 73,138,711
Land use tax 121,610,785 –
Vehicle and vessel tax 128,034 –
Real estate tax 58,703,632 –
Stamp tax 20,585,286 –
Others 13,115,462 24,922,376
432,096,408 201,228,046
According to the notice of “Value Added Tax Accounting Treatment Regulations” (Accounting
[2016] No.22), land use tax, real estate tax, vehicle and vessel tax and stamp tax have been
recorded in “taxes and surcharges” instead of “general and administrative expenses” since 1
May 2016.
44. SELLING EXPENSES
2016 2015
Employee benefits 49,174,129 38,059,285
Transportation fees 584,756,840 544,579,610
Insurance premium 14,999,545 10,773,823
Others 45,852,216 42,447,126
694,782,730 635,859,844

Maanshan Iron & Steel Company Limited2016 Annual Report
207
V. MAJOR NOTES TO CONSOLIDATED FINANCIAL STATEMENTS (CONTINUED)
45. GENERAL AND ADMINISTRATIVE EXPENSES
2016 2015
Employee benefits 526,947,185 481,575,855
Other taxes other than taxes and surcharges and
income tax 129,161,233 399,170,094
Employee termination benefits 347,468,731 –
Office expenses 280,419,514 283,748,867
Rental fees 57,481,284 64,881,598
Amortisation of intangible assets 45,346,730 40,776,728
Research and development expenses 57,374,638 37,635,638
Depreciation of property, plant and equipment 136,541,889 34,269,997
Travel and entertainment expenses 23,535,483 24,801,396
Maintenance expenses 36,822,717 28,425,184
Auditors’ remuneration 5,907,723 5,674,300
Others 133,274,357 137,650,230
1,780,281,484 1,538,609,887
46. FINANCIAL EXPENSES
2016 2015
Interest expenses (Note) 896,088,299 1,070,794,132
Less: Interest income 42,161,978 142,535,189
Less: Capitalised interest 7,177,259 13,172,035
Exchange gain (100,247,410) (136,909,896)
Others 47,149,324 34,859,427
793,650,976 813,036,439
Note: The Group’s interest expenses included interest on bank loans, other loans, corporate bonds, MTN
(medium-term note) and short-term financing bonds. The capitalised amount of borrowing costs
had been recorded in construction in progress.
* The interest expense of the Group included interest on bank loans that expired within five years,
other borrowings’ interest, interest on corporate bonds, interest on MTN (medium-term note) and
short-term financing bonds and the interest on bank loans that did not need to be repaid within five
years.

Notes to Financial Statements (Continued)31 December 2016Renminbi Yuan
Maanshan Iron & Steel Company Limited2016 Annual Report
208
V. MAJOR NOTES TO CONSOLIDATED FINANCIAL STATEMENTS (CONTINUED)
46. FINANCIAL EXPENSES (CONTINUED)
2016 2015
Interest expense:
Interest on bank loans, other loans, corporate bonds
and MTN (medium-term note) repayable
within five years 895,080,899 1,070,562,292
Interest on bank loans repayable beyond five years 1,007,400 231,840
896,088,299 1,070,794,132
47. ASSET IMPAIRMENT LOSS
2016 2015
Provision for bad debts 35,196,327 37,562,643
Including: Trade receivables 1,589,380 2,638,179
Other receivables 2,986,251 34,924,464
Loans and advances 30,620,696 –
Provision for inventories 990,453,845 1,581,827,336
Provision for fixed assets 38,607,464 –
1,064,257,636 1,619,389,979

Maanshan Iron & Steel Company Limited2016 Annual Report
209
V. MAJOR NOTES TO CONSOLIDATED FINANCIAL STATEMENTS (CONTINUED)
48. INVESTMENT INCOME
2016 2015
Investment income from long term equity investments
under the equity method 232,820,475 75,538,213
Investment income from the fair-value re-measurement
of the newly acquired subsidiary’s interests held
before acquisition – 4,160,631
Investment income from available-for-sale financial
assets during holding period 40,000 12,994,828
Investment income/(loss) from disposal of
availablefor-sale financial assets 11,635,767 (48,310)
Investment income from disposal of financial assets
measured at fair value through profit or loss 46,900,221 8,429,744
Others – (7,349,908)
291,396,463 93,725,198
* During the current year, the Group’s investment income from unlisted and listed companies
amounted to RMB291,396,463 and nil, respectively (2015: the investment income from listed
companies and unlisted companies amounted to RMB625,118 and RMB93,100,080, respectively).
49. NON-OPERATING INCOME
2016 2015
Included in
non-recurring
gains and
losses of 2016
Gain on disposal of non-current assets 7,187,676 35,444,537 7,187,676
Including: Gain on disposal of fixed assets 272,493 14,733,331 272,493
Gain on disposal of intangible assets 6,915,183 20,711,206 6,915,183
Government grants 191,502,761 346,238,178 191,502,761
Others 6,512,465 2,377,033 6,512,465
205,202,902 384,059,748 205,202,902

Notes to Financial Statements (Continued)31 December 2016Renminbi Yuan
Maanshan Iron & Steel Company Limited2016 Annual Report
210
V. MAJOR NOTES TO CONSOLIDATED FINANCIAL STATEMENTS (CONTINUED)
49. NON-OPERATING INCOME (CONTINUED)
Details of government grants recorded in profit or loss are as follows:
2016 2015
Government grants related to assets (Note V.35) 116,979,983 87,185,350
Government grants related to income:
– Tax refund 43,331,736 232,132,582
– Others 31,191,042 26,920,246
191,502,761 346,238,178
50. NON-OPERATING EXPENSES
2016 2015
Included in
non-recurring
gains and
losses of 2016
Loss on disposal of non-current assets 58,376,872 2,478,667 58,376,872
Including: Loss on disposal of fixed assets 58,376,872 2,478,667 58,376,872
Public relief donation 726,550 372,800 726,550
Penalty expenditure 1,466,061 1,655,671 1,466,061
Compensation for sales transaction (Note) 22,880,000 12,213,494 22,880,000
Others 1,168,933 817,573 1,168,933
84,618,416 17,538,205 84,618,416
Note: On 19 August 2016, the London Court of International Arbitration announced the second arbitral
result for the arbitration case between the Company and Fushun Shipping Company. The Company
paid RMB22,880,000 to Fushun Shipping Company as compensation due to iron ore purchase
dispute in 2007.
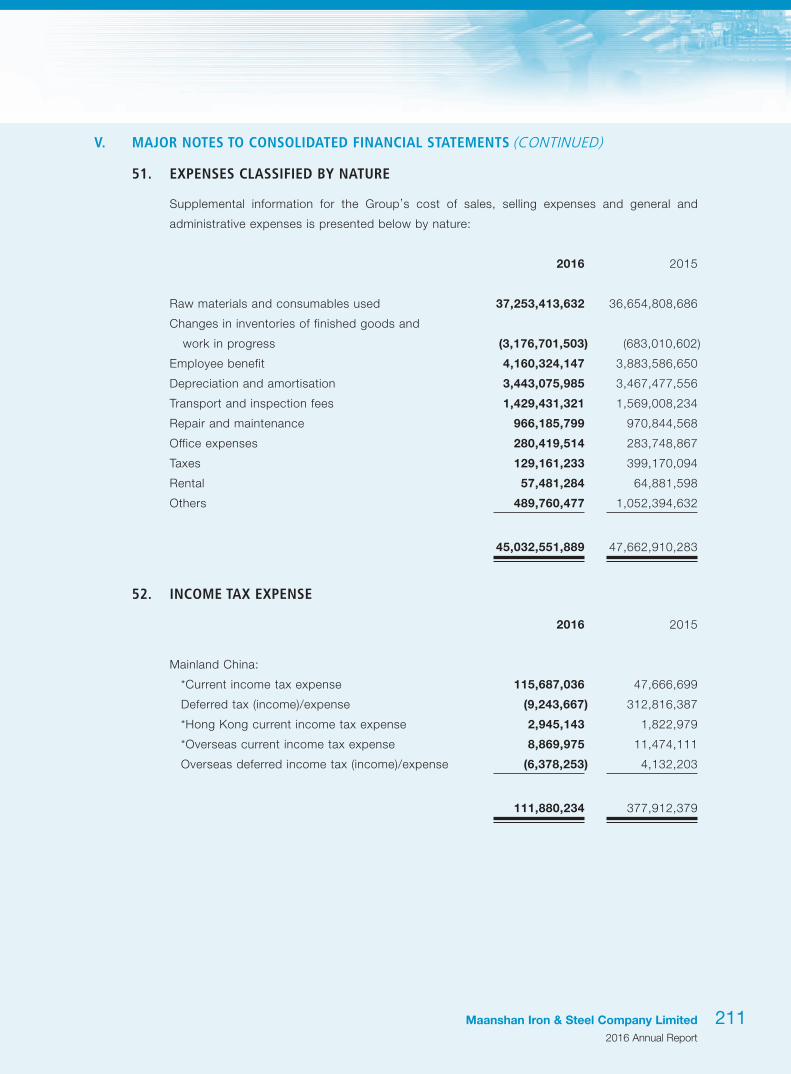
Maanshan Iron & Steel Company Limited2016 Annual Report
211
V. MAJOR NOTES TO CONSOLIDATED FINANCIAL STATEMENTS (CONTINUED)
51. EXPENSES CLASSIFIED BY NATURE
Supplemental information for the Group’s cost of sales, selling expenses and general and
administrative expenses is presented below by nature:
2016 2015
Raw materials and consumables used 37,253,413,632 36,654,808,686
Changes in inventories of finished goods and
work in progress (3,176,701,503) (683,010,602)
Employee benefit 4,160,324,147 3,883,586,650
Depreciation and amortisation 3,443,075,985 3,467,477,556
Transport and inspection fees 1,429,431,321 1,569,008,234
Repair and maintenance 966,185,799 970,844,568
Office expenses 280,419,514 283,748,867
Taxes 129,161,233 399,170,094
Rental 57,481,284 64,881,598
Others 489,760,477 1,052,394,632
45,032,551,889 47,662,910,283
52. INCOME TAX EXPENSE
2016 2015
Mainland China:
*Current income tax expense 115,687,036 47,666,699
Deferred tax (income)/expense (9,243,667) 312,816,387
*Hong Kong current income tax expense 2,945,143 1,822,979
*Overseas current income tax expense 8,869,975 11,474,111
Overseas deferred income tax (income)/expense (6,378,253) 4,132,203
111,880,234 377,912,379

Notes to Financial Statements (Continued)31 December 2016Renminbi Yuan
Maanshan Iron & Steel Company Limited2016 Annual Report
212
V. MAJOR NOTES TO CONSOLIDATED FINANCIAL STATEMENTS (CONTINUED)
52. INCOME TAX EXPENSE (CONTINUED)
Relationship between income tax and profit/(loss) before tax:
2016 2015
Profit/(loss) before tax 1,368,575,540 (4,726,572,002)
Tax at the applicable tax rate of 25% (Note) 342,143,885 (1,181,643,001)
Effect of different tax rates of subsidiaries (11,296,146) (6,095,186)
Non-deductible expenses 23,615,578 34,566,469
Adjustments in respect of current tax of previous periods – 181,419
Other tax preference (79,926,635) (15,436,489)
Income not subject to tax (2,652,988) (3,696,052)
Unrecognised deductible temporary difference and
tax losses 174,600,917 1,165,864,998
Write-off of deferred tax assets recognised in prior years – 401,140,566
Tax losses utilised (276,399,258) –
Profits and losses attributable to joint ventures and
associates (58,205,119) (16,970,345)
Income tax charge at the Group’s effective rate 111,880,234 377,912,379
The Group’s effective rate 8% 8%
Note: The Group’s income tax has been provided at the rate on the estimated taxable profits arising in
the PRC during the year. Taxes on profits assessable elsewhere have been calculated at the rates of
tax prevailing in the countries or regions in which the Group operates, based on existing legislation,
interpretations and practices in respect thereof.

Maanshan Iron & Steel Company Limited2016 Annual Report
213
V. MAJOR NOTES TO CONSOLIDATED FINANCIAL STATEMENTS (CONTINUED)
53. EARNINGS PER SHARE
Basic earnings per share shall be calculated by dividing the profit attributable to ordinary equity
holders of the parent entity (the numerator) by the weighted average number of ordinary shares
outstanding (the denominator) during the year. Shares are usually included in the weighted
average number of shares from the date of their issuance according to the terms of contract of
issuance.
The calculations of the basic and earnings per share amounts are based on:
2016 2015
Earnings/(Loss)
Profit/(loss) attributable to ordinary
equity holders of the parent as used in the
basic/diluted earnings per share calculations 1,228,892,407 (4,804,299,674)
Number of shares
Weighted average number of ordinary
shares in issue during the year as used in the
basic earnings per share calculation 7,700,681,186 7,700,681,186
During 2016 and 2015, there was no diluted item to adjust the Group’s basic earnings per
share.

Notes to Financial Statements (Continued)31 December 2016Renminbi Yuan
Maanshan Iron & Steel Company Limited2016 Annual Report
214
V. MAJOR NOTES TO CONSOLIDATED FINANCIAL STATEMENTS (CONTINUED)
54. NOTES TO THE STATEMENT OF CASH FLOWS
2016 2015
Cash received relating to other operating activities:
Specific subsidies granted by the government 257,811,042 26,920,246
Interest income 42,161,978 –
Government-allocated employee relocation
compensation 152,568,484 –
Deposit for bills, credit and guarantee 712,232,872 –
Others 6,512,465 2,377,033
1,171,286,841 29,297,279
Cash paid relating to other operating activities:
Logistics expense 183,963,715 176,823,787
Insurance expenses 30,893,025 40,586,383
Packing fees 21,193,416 22,747,742
Flood prevention fund 17,491,568 18,033,433
Environmental improvement fee 48,778,900 67,022,227
Research and development expenses 57,374,638 50,510,285
Bank charges 47,149,324 34,859,426
Others 8,573,329 10,249,852
415,417,915 420,833,135
Cash received relating to other investing activities:
Government funding for particular projects 103,844,476 186,448,184

Maanshan Iron & Steel Company Limited2016 Annual Report
215
V. MAJOR NOTES TO CONSOLIDATED FINANCIAL STATEMENTS (CONTINUED)
55. SUPPLEMENTS TO THE STATEMENT OF CASH FLOWS
(1) Reconciliation of net profit to cash flows from operating activities
2016 2015
Net profit/(loss) 1,256,695,306 (5,104,484,381)
Add: Provisions for bad debts 35,196,327 37,562,643
Provision for inventories 990,453,845 1,581,827,336
Provision for termination benefits 175,125,396 –
Provision for impairment of fixed assets 38,607,464 –
Depreciation of fixed assets 3,377,766,117 3,400,322,203
Amortisation of investment properties 1,708,470 2,063,607
Amortisation of intangible assets 63,601,398 65,091,746
Amortisation of deferred income (116,979,983) (87,185,350)
Loss/(gain) on disposal of non-current
assets 51,189,196 (32,965,870)
Increase/(decrease) in special reserves 13,595,358 (5,923,249)
Financial expenses 662,543,109 778,177,012
Investment income (291,396,463) (93,725,198)
Gain on fair value changes (4,051,190) (819,265)
(Increase)/decrease in deferred tax assets (17,688,238) 317,435,278
Increase/(decrease) in deferred tax liabilities 2,360,679 (486,688)
(Increase)/decrease in inventories (5,520,020,172) 1,084,654,072
(Increase)/decrease in receivables from
operating activities (7,629,297,320) 2,654,109,348
Increase in payables from
operating activities 11,530,451,715 1,259,923,451
Others – 9,755,358
Net cash flows from operating activities 4,619,861,014 5,865,332,053
Endorsements of bank acceptance bills received
from sales of goods or rendering of services 8,112,736,826 1,488,128,608

Notes to Financial Statements (Continued)31 December 2016Renminbi Yuan
Maanshan Iron & Steel Company Limited2016 Annual Report
216
V. MAJOR NOTES TO CONSOLIDATED FINANCIAL STATEMENTS (CONTINUED)
55. SUPPLEMENTS TO THE STATEMENT OF CASH FLOWS (CONTINUED)
(2) Acquisition of subsidiaries and other business units:
2016 2015
Acquisition price of subsidiaries and
other business units – 170,091,000
Cash and cash equivalents on acquisition of
subsidiaries and other units – 170,091,000
Less: Cash and cash equivalents held by
acquired subsidiaries and other
operation units – 96,899,472
Net cash paid on acquisition of subsidiaries and
other operating units – 73,191,528
(3) Cash and cash equivalents
Net movement of cash and cash equivalents:
2016 2015
Closing balance of cash 4,324,131,687 3,546,410,358
Less: Opening balance of cash 3,546,410,358 2,709,836,299
Add: Closing balance of cash equivalents – –
Less: Opening balance of cash equivalents – –
Net increase in cash and cash equivalents 777,721,329 836,574,059
31 December
2016
31 December
2015
Cash
Include: Cash on hand 90,515 138,929
Balances in banks without restriction 4,324,041,172 3,546,271,429
Ending balance of cash and cash equivalents 4,324,131,687 3,546,410,358

Maanshan Iron & Steel Company Limited2016 Annual Report
217
V. MAJOR NOTES TO CONSOLIDATED FINANCIAL STATEMENTS (CONTINUED)
56. DIVIDEND*
31 December
2016
31 December
2015
Proposed final dividend – –
The board of directors did not recommend the payment of any dividends for the year ended 31
December 2016.
57. RESTRICTED ASSETS
31 December
2016
31 December
2015
Cash and bank balances(Note V.1) 987,969,354 1,596,301,124 (i)
Bills receivable(Note V.3) 738,206,842 1,277,158,488 (ii)
Inventories (Note V.7) – 10,859,823 (iii)
1,726,176,196 2,884,319,435
(i) As of 31 December 2016, the Group’s cash and bank balances amounting to RMB987,969,354
(31 December 2015: RMB1,596,301,124) had been pledged to banks, including cash deposits
as collateral amounting to RMB493,121,436 (31 December 2015: RMB1,198,860,855) pledged
as security for trade facilities and performance bonds, and no time deposits had been pledged to
banks to issue letters of credit for current year (31 December 2015: USD1,000,000, equivalent to
RMB6,493,453), and mandatory reserves with the central bank of RMB494,847,918 (31 December
2015: RMB390,946,816).
(ii) As of 31 December 2016, the Company had bills of RMB738,206,842 (31 December 2015:
RMB1,120,157,322) in the Ma’anshan Branch of Industrial and Commercial Bank of China pledged
as security to obtain bank long-term loans due within one year of RMB600,000,000 (31 December
2015: RMB970,000,000). The Group had no bank acceptance bills pledged as security to banks to
issue bank acceptance bills (31 December 2015: RMB157,001,166).
(iii) As o f 31 December 2016, the Group had no res t r ic ted inventor ies (31 December
2015:RMB10,859,823).

Notes to Financial Statements (Continued)31 December 2016Renminbi Yuan
Maanshan Iron & Steel Company Limited2016 Annual Report
218
V. MAJOR NOTES TO CONSOLIDATED FINANCIAL STATEMENTS (CONTINUED)
58. MONETARY ITEMS DENOMINATED IN FOREIGN CURRENCIES
31 December 2016 31 December 2015
Originalcurrency
Exchangerate RMB
Originalcurrency
Exchangerate RMB
Cash and bank balancesHKD 2,584,446 0.8945 2,311,787 5,695,550 0.8378 4,771,732USD 249,525,036 6.9370 1,730,955,175 391,718,720 6.4936 2,543,664,680EUR 17,340,991 7.3068 126,707,153 12,579,765 7.0952 89,255,949JPA 3,311 0.0596 197 24,050 0.0539 1,296AUD 15,816,608 5.0157 79,331,361 10,144,811 4.7276 47,960,608CAD 1,226,862 5.1406 6,306,807 1,476,774 4.6814 6,913,370GBP 1,389 8.5094 11,820 991 9.6159 9,529
1,945,624,300 2,692,577,164
Trade receivablesUSD 23,181,111 6.9370 160,807,367 13,167,430 6.4936 85,504,023EUR 9,366,726 7.3068 68,440,794 9,545,274 7.0952 67,725,628CAD 172,568 5.1406 887,103 95,316 4.6814 446,212AUD 5,535,040 5.0157 27,762,100 5,489,661 4.7276 25,952,921HKD 5,306,863 0.8945 4,746,989 – – –ZAR 15,097,946 0.5083 7,674,286 – – –
270,318,639 179,628,784
Other receivablesHKD 7,265,781 0.8945 6,499,241 328,589 0.8378 275,292EUR 1,165,632 7.3068 8,517,040 1,645,122 7.0952 11,672,470AUD 4,019 5.0157 20,158 23,244 4.7276 109,888
15,036,439 12,057,650
Account payablesGBP – – – 1,520 9.6159 14,616AUD 60,135 5.0157 301,619 39,721 4.7276 187,785USD 7,012 6.9370 48,642 395,445 6.4936 2,567,862EUR 12,798,731 7.3068 93,517,768 7,408,245 7.0952 52,562,980HKD 47,251,614 0.8945 42,266,569 140,665,035 0.8378 117,849,166
136,134,598 173,182,409

Maanshan Iron & Steel Company Limited2016 Annual Report
219
31 December 2016 31 December 2015
Originalcurrency
Exchangerate RMB
Originalcurrency
Exchangerate RMB
Other payablesAUD 208,721 5.0157 1,046,882 3,080,622 4.7276 14,563,949HKD 81,210,639 0.8945 72,642,917 181,851,088 0.8378 152,354,842EUR 1,862,155 7.3068 13,606,394 1,674,790 7.0952 11,882,970
87,296,193 178,801,761
Short-term loansUSD 219,672,148 6.9370 1,523,865,691 641,071,173 6.4936 4,162,859,769EUR 29,868,315 7.3068 218,241,804 – – –
1,742,107,495 4,162,859,769
Long-term loans due within one year
USD 7,360,000 6.9370 51,056,320 7,360,000 6.4936 47,792,896
Long-term loansUSD 22,080,000 6.9370 153,168,960 29,440,000 6.4936 191,171,584
V. MAJOR NOTES TO CONSOLIDATED FINANCIAL STATEMENTS (CONTINUED)
58. MONETARY ITEMS DENOMINATED IN FOREIGN CURRENCIES (CONTINUED)

Maanshan Iron & Steel Company Limited2016 Annual Report
220
Notes to Financial Statements
VI. CHANGE IN THE SCOPE OF CONSOLIDATION
1. NEWLY ESTABLISHED SUBSIDIARY
In 2016, the Company established the following subsidiary, and included it in the scope of
consolidation since then.
Date of
establishment
Registered
capital
Percentage
of equity
Investment
form
Capital paid
as of year end
Masteel America February 2016 USD500,000 100% Cash USD500,000
VII. INTERESTS IN OTHER ENTITIES
1. INTERESTS IN SUBSIDIARIES
Details of the subsidiaries are as follows:
Name of investee
Place of
operation
Place of
registration
Business
nature Paid-in capital
Percentage of
equity (%)
Direct Indirect
Subsidiaries acquired by establishment or
investment
Anhui Masteel K.Wah New Building Materials
Co., Ltd. (New Build Masteel K. Wah.) Anhui, PRC Anhui, PRC Manufacturing USD8,389,000 70 –
Ma Steel (Wuhu) Anhui, PRC Anhui, PRC Manufacturing RMB35,000,000 70 27.3
Ma Steel (Cihu) Processing and Distribution
Co., Ltd. (“Ma Steel (Cihu)”)(Note 1) Anhui, PRC Anhui, PRC Manufacturing RMB30,000,000 92 –
Ma Steel (Guangzhou) Processing and
Distribution Co., Ltd. (“Ma Steel (Guangzhou)”) Guangdong, PRC Guangdong, PRC Manufacturing RMB120,000,000 66.66 –
Ma Steel (HK) Hong Kong, PRC Hong Kong, PRC Manufacturing HKD260,000,000 91 –
Holly Industrial Anhui, PRC Anhui, PRC Manufacturing RMB30,000,000 71 26.39
Huayang Equipment Anhui, PRC Anhui, PRC Manufacturing RMB1,000,000 90 –
Ma Steel (Jinhua) Processing and Distribution Co.,
Ltd. (“Ma Steel (Jinhua)”) Zhejiang, PRC Zhejiang, PRC Manufacturing RMB120,000,000 75 –
MG Trading Germany Germany Trading EUR153,388 100 –
Ma Steel (Australia) Australia Australia
Mine production
and sale AUD21,737,900 100 –
Ma Steel (Hefei) Anhui, PRC Anhui, PRC Manufacturing RMB2,500,000,000 71 –
Ma Steel (Hefei) Processing and Distribution Co.,
Ltd. (“Ma Steel (Hefei) Processing”) Anhui, PRC Anhui, PRC Manufacturing RMB120,000,000 61 25.48
Notes to Financial Statements

Maanshan Iron & Steel Company Limited2016 Annual Report
221
Name of investee
Place of
operation
Place of
registration
Business
nature Paid-in capital
Percentage of
equity (%)
Direct Indirect
Subsidiaries acquired by establishment or
investment (continued)
Ma Steel (Wuhu) Material Technique Co. Ltd.
(“Wuhu Technique”) Anhui, PRC Anhui, PRC Manufacturing RMB150,000,000 71 –
Maanshan Masteel Scrap Steel Co., Ltd. (“Masteel
Scrap”) Anhui, PRC Anhui, PRC Trading RMB100,000,000 100 –
Shanghai Trading Shanghai, PRC Shanghai, PRC Trading RMB60,000,000 100 –
Maanshan (Chongqing) Material Technology Co.,
Ltd. (“Chongqing Material”) Chongqing, PRC Chongqing, PRC Trading RMB250,000,000 70 –
Hefei Water Supply Anhui, PRC Anhui, PRC Manufacturing RMB50,000,000 – 100
Ma Steel (Hefei) Steel Plates Co., Ltd. (“Hefei Steel
Plates”) Anhui, PRC Anhui, PRC Manufacturing RMB2,000,000,000 – 100
Ma Steel (Hefei) Materials Technology Co., Ltd.
(“Hefei Materials”) Anhui, PRC Anhui, PRC Manufacturing RMB200,000,000 70 –
Maanshan (Guangzhou) Iron and Steel Sales Co.,
Ltd. (“Ma Steel Guangzhou Sales”) Guangdong, PRC Guangdong, PRC Trading RMB10,000,000 100 –
Ma’ Anshan (Hangzhou) Iron and Steel Sales Co.,
Ltd. (“Ma Steel Hangzhou Sales”) Zhejiang, PRC Zhejiang, PRC Trading RMB10,000,000 100 –
Ma’ Anshan (Wuxi) Iron and Steel Sales Co., Ltd.
(“Ma Steel Wuxi Sales”) Jiangsu, PRC Jiangsu, PRC Trading RMB10,000,000 100 –
Ma’ Anshan (Chongqing) Iron and Steel Sales Co.,
Ltd. (“Ma Steel Chongqing Sales”) Chongqing, PRC Chongqing, PRC Trading RMB10,000,000 100 –
Ma’ Anshan (Nanjing) Iron and Steel Sales Co.,
Ltd. (“Ma Steel Nanjing Sales”) Jiangsu, PRC Jiangsu, PRC Trading RMB10,000,000 100 –
Ma’ Anshan (Wuhan) Iron and Steel Sales Co., Ltd.
(“Ma Steel Wuhan Sales”) Hubei, PRC Hubei, PRC Trading RMB10,000,000 100 –
Ma’ Anshan (Shanghai) Iron and Steel Sales Co.,
Ltd. (“Ma Steel Shanghai Sales”) Shanghai, PRC Shanghai, PRC Trading RMB10,000,000 100 –
Anhui Chang Jiang Iron and Steel Trading Co.,
Ltd., Heifei (“Chang Jiang Iron and Steel, Hefei”) Anhui, PRC Anhui, PRC Trading RMB30,000,000 – 100
Anhui Chang Jiang Iron and Steel Trading Co.,
Ltd., Nanjing (“Chang Jiang Iron and Steel,
Nanjing”) Jiangsu, PRC Jiangsu, PRC Trading RMB30,000,000 – 100
VII. INTERESTS IN OTHER ENTITIES (CONTINUED)
1. INTERESTS IN SUBSIDIARIES (CONTINUED)

Notes to Financial Statements (Continued)
Maanshan Iron & Steel Company Limited2016 Annual Report
222
Name of investee
Place of
operation
Place of
registration
Business
nature Paid-in capital
Percentage of
equity (%)
Direct Indirect
Subsidiaries acquired by establishment or
investment (continued)
Ma’anshan Chang Jiang Iron and
Steel Metal Trading Co., Ltd.
(“Chang Jiang Iron and Steel Metal Trading”) Anhui, PRC Anhui, PRC Trading RMB30,000,000 – 100
MG-VALDUNES French French Manufacturing EUR 40,200,000 100 –
Ma’anshan Oubang Color-coated Technology Co.,
Ltd. (“Masteel Oubang Color-coated”) Anhui, PRC Anhui, PRC Manufacturing RMB50,000,000 67 –
Masteel America (Note 2) USA USA Service industry USD500,000 100 –
Subsidiaries acquired not under common control
Ma Steel (Yangzhou) Processing and Distribution
Co., Ltd. (“Ma steel (Yangzhou) Processing”) Jiangsu, PRC Jiangsu, PRC Manufacturing USD20,000,000 71 –
Anhui ChangJiang Iron and Steel Anhui, PRC Anhui, PRC Manufacturing RMB1,200,000,000 55 –
Ma-Steel Rail Transportation (Note 3) Anhui, PRC Anhui, PRC Manufacturing RMB360,000,000 100 –
Subsidiary acquired under common control
Masteel Financial Anhui, PRC Anhui, PRC Financial services RMB1,000,000,000 91 –
Note 1: Ma Steel (Wuhu) transferred 92% of equity interests of Ma Steel (Cihu) to the Company in
December 2016. As a result, Ma Steel (Cihu) became the direct holding subsidiary of the Company.
Note 2: For the information of the newly established subsidiary, please refer to Note VI.1.
Note 3: The Company injected capital of RMB60,000,000 to Ma-steel Rail Transportation in August 2016.
VII. INTERESTS IN OTHER ENTITIES (CONTINUED)
1. INTERESTS IN SUBSIDIARIES (CONTINUED)

Maanshan Iron & Steel Company Limited2016 Annual Report
223
VII. INTERESTS IN OTHER ENTITIES (CONTINUED)
1. INTERESTS IN SUBSIDIARIES (CONTINUED)
Subsidiaries which had material non-controlling interests are as follows:
31 December
2016
31 December
2015
The proportion of equity held by non-controlling
shareholders:
Ma Steel (Hefei) 29% 29%
Anhui Chang Jiang Iron and Steel 45% 45%
Masteel Financial 9% 9%
2016 2015
Profit attributable to non-controlling shareholders:
Ma Steel (Hefei) (157,681,514) (186,736,219)
Anhui Chang Jiang Iron and Steel 133,019,817 (98,134,232)
Masteel Financial 9,765,701 9,668,950
2016 2015
Dividends paid to non-controlling shareholders:
Ma Steel (Hefei) – –
Anhui Chang Jiang Iron and Steel – 11,426,163
Masteel Financial – –
31 December
2016
31 December
2015
Cumulative balances of non-controlling interests
at the end of the reporting period:
Ma Steel (Hefei) 619,631,673 774,849,514
Anhui Chang Jiang Iron and Steel 1,128,514,595 993,647,826
Masteel Financial 142,729,220 133,042,997

Notes to Financial Statements (Continued)
Maanshan Iron & Steel Company Limited2016 Annual Report
224
VII. INTERESTS IN OTHER ENTITIES (CONTINUED)
1. INTERESTS IN SUBSIDIARIES (CONTINUED)
The summarised financial information of the above subsidiaries is as follows. The amounts
listed below are the amounts before the group elimination.
Ma Steel (Hefei)
Anhui Chang
Jiang Iron and
Steel
Masteel
Financial
2016
Current assets 781,451,671 2,015,885,136 3,190,666,377
Non-current assets 3,952,650,687 4,314,065,378 5,833,102,023
Total assets 4,734,102,358 6,329,950,514 9,023,768,400
Current liabilities (1,912,013,349) (3,794,758,309) (7,437,233,334)
Non-current liabilities (685,428,067) (27,381,995) (654,837)
Total liabilities (2,597,441,416) (3,822,140,304) (7,437,888,171)
Revenue 2,967,652,002 8,131,356,505 183,656,551
Net (loss)/profit (543,729,359) 295,599,594 108,507,791
Total comprehensive income (543,729,359) 295,599,594 108,507,791
Net cash flows from operating
activities 273,032,455 317,460,887 148,934,820

Maanshan Iron & Steel Company Limited2016 Annual Report
225
VII. INTERESTS IN OTHER ENTITIES (CONTINUED)
1. INTERESTS IN SUBSIDIARIES (CONTINUED)
Ma Steel (Hefei)
Anhui Chang
Jiang Iron and
Steel
Masteel
Financial
2015
Current assets 968,758,036 1,492,741,756 3,116,708,624
Non-current assets 3,814,743,779 4,496,852,295 4,183,250,047
Total assets 4,783,501,815 5,989,594,051 7,299,958,671
Current liabilities (1,440,874,256) (3,751,201,063) (5,821,207,473)
Non-current liabilities (670,732,682) (30,286,707) (495,676)
Total liabilities (2,111,606,938) (3,781,487,770) (5,821,703,149)
Revenue 4,543,085,651 6,531,780,892 232,662,219
Net profit (643,917,997) (218,076,072) 107,432,775
Total comprehensive income (643,917,997) (218,076,072) 107,432,775
Net cash flows from operating
activities 18,217,041 316,747,830 1,207,492,849

Notes to Financial Statements (Continued)
Maanshan Iron & Steel Company Limited2016 Annual Report
226
VII. INTERESTS IN OTHER ENTITIES (CONTINUED)
2. INTERESTS IN JOINT VENTURES AND ASSOCIATES
Place ofoperation
Place ofregistration
Businessnature
Registeredcapital
Percentage of equity (%) AccountingmethodDirectly Indirectly
Joint venturesBOC-Ma Steel Anhui, PRC Anhui, PRC Manufacturing RMB468,000,000 50 – Equity methodMASTEEL-CMI Anhui, PRC Anhui, PRC Service industry RMB1,000,000 50 – Equity methodMascometal (Note1) Anhui, PRC Anhui, PRC Manufacturing EUR32,000,000 66 – Equity method
AssociatesHenan JinMa Energy Henan, PRC Henan, PRC Manufacturing RMB400,000,000 36 – Equity methodShenglong Chemical Shandong, PRC Shandong, PRC Manufacturing RMB568,800,000 32 – Equity methodShanghai Iron and Steel
Electronic Shanghai, PRC Shanghai, PRC Manufacturing RMB20,000,000 20 – Equity methodXinchuang Economize
Resource (Note 2) Anhui, PRC Anhui, PRC Service industry RMB122,381,990 16.34 – Equity methodAnhui Linhuan Chemical
(Note 3) Anhui, PRC Anhui, PRC Manufacturing RMB600,000,000 12 – Equity methodMa-Steel OCI Chemical Anhui, PRC Anhui, PRC Manufacturing USD47,125,000 40 – Equity method
Note 1: In 2016, the Company jointly established Mascometal with a foreign invested enterprise (FIE),
Asco Industries Ltd., in which the Company and Asco Industries Ltd. hold 75% and 25% equity
interests respectively, according to the requirements of the investment contract and the Articles of
Association. The Company designated three directors in the Board of Directors and Asco Industries
Ltd. designated one director. According to the Articles of Association of Mascometal, certain
important financial and operating decisions must be approved by all the directors. According to the
requirements of the Articles of Associate as above, the directors deemed that the Company was
unable to exercise control over Mascometal, but able to exercise jointly control over Mascometal
with Asco Industries Ltd. Therefore, the equity investment in Mascometal was accounted for as a
joint venture, and Mascometal had not been included in the consolidation scope of the Group.
Note 2: As of 31 December 2016, the Group held 16.34% of equity interests of Xinchuang Economize
Resource. The directors deemed that the Company was able to exercise significant influence over
Xinchuang Economize Resource although the equity interests in Xinchuang Economize Resource
holding by the Company was less than 20%, as according to the requirements of the Articles of
Association of Xinchuang Economize Resource, the Company designated one director and one
supervisor to Xinchuang Economize Resource. Thus, the equity investment in Xinchuang Economize
Resource was accounted as an associate.
Note 3: As of 31 December 2016, the Group held 12% equity interests of Anhui Linhuan Chemical. The
directors deemed that the Company was able to exercise significant influence over Anhui Linhuan
Chemical although the equity interests in Anhui Linhuan Chemical holding by the Company was
less than 20%, as according to the requirement of the Articles of Association of Anhui Linhuan
Chemical, the Company designated one director to Anhui Linhuan Chemical. Thus, the equity
investment in Anhui Linhuan Chemical was accounted as an associate.

Maanshan Iron & Steel Company Limited2016 Annual Report
227
VII. INTERESTS IN OTHER ENTITIES (CONTINUED)
2. INTERESTS IN JOINT VENTURES AND ASSOCIATES (CONTINUED)
BOC-Ma Steel, one of the Group’s material joint ventures, was accounted by using the equity
method.
The financial information of BOC-Ma Steel is as follows, which has been adjusted for all the
accounting policy differences and reconciled to the carrying amount of the financial statements.
2016 2015
Current assets 428,661,283 345,030,431
Including: Cash and cash equivalents 357,837,175 284,346,880
Non-current assets 299,955,412 343,776,987
Total assets 728,616,695 688,807,418
Current liabilities 90,580,560 56,745,837
Non-current liabilities – –
Total liabilities 90,580,560 56,745,837
Non-controlling interests – –
Equity attributable to the parent company 638,036,135 632,061,581
The Group’s share of net assets 319,018,068 316,030,791
Adjustment – –
The carrying value of the investment 319,018,068 316,030,791
Revenue 559,537,585 585,082,278
Financial expenses – Interest income 6,036,712 5,941,620
Financial expenses – Interest expenses – –
Income tax expenses 54,639,719 52,750,173
Net profit 166,383,868 156,231,473
Other comprehensive income – –
Total comprehensive income 166,383,868 156,231,473
Dividends received 79,000,000 73,500,000

Notes to Financial Statements (Continued)
Maanshan Iron & Steel Company Limited2016 Annual Report
228
VII. INTERESTS IN OTHER ENTITIES (CONTINUED)
2. INTERESTS IN JOINT VENTURES AND ASSOCIATES (CONTINUED)
Henan JinMa Energy and Shenglong Chemical are the Group’s material associates and are
accounted by using the equity method.
The financial information of material associates is as follows, which has been adjusted to all the
accounting policy differences and reconciled to the carrying amount of the financial statements:
Henan JinMa
Energy
Shenglong
Chemical
2016
Current assets 1,177,771,242 1,201,094,921
Non-current assets 1,101,444,297 1,569,224,908
Total assets 2,279,215,539 2,770,319,829
Current liabilities 868,068,750 1,803,456,004
Non-current liabilities 557,179,565 –
Total liabilities 1,425,248,315 1,803,456,004
Non-controlling interests 31,199,473 –
Equity attributable to the parent company 822,767,751 966,863,825
The Group’s share of net assets 296,196,390 309,396,424
Adjustment – –
The carrying value of the investment 296,196,390 309,396,424
Revenue 3,411,084,023 2,715,372,259
Income tax expenses 68,616,802 60,307,248
Net profit 207,108,797 214,207,608
Other comprehensive income – –
Total comprehensive income 207,108,797 214,207,608
Dividends received 25,560,000 –

Maanshan Iron & Steel Company Limited2016 Annual Report
229
VII. INTERESTS IN OTHER ENTITIES (CONTINUED)
2. INTERESTS IN JOINT VENTURES AND ASSOCIATES (CONTINUED)
Henan JinMa
Energy
Shenglong
Chemical
2015
Current assets 855,063,827 801,789,029
Non-current assets 947,374,354 1,501,617,303
Total assets 1,802,438,181 2,303,406,332
Current liabilities 968,036,241 1,545,899,026
Non-current liabilities 159,357,056 –
Total liabilities 1,127,393,297 1,545,899,026
Non-controlling interests 5,327,126 –
Equity attributable to the parent company 669,717,758 757,507,306
The Group’s share of net assets 241,098,393 242,402,338
Adjustment – –
The carrying value of the investment 241,098,393 242,402,338
Revenue 2,457,137,640 2,757,010,679
Income tax expenses 6,768,602 32,912,362
Net profit/(loss) 15,016,199 (11,233,218)
Other comprehensive income – –
Total comprehensive income 15,016,199 (11,233,218)
Dividends received – –

Notes to Financial Statements (Continued)
Maanshan Iron & Steel Company Limited2016 Annual Report
230
VII. INTERESTS IN OTHER ENTITIES (CONTINUED)
2. INTERESTS IN JOINT VENTURES AND ASSOCIATES (CONTINUED)
The financial information of the joint ventures and the associates that are not material to the
Group is as follows:
2016 2015
Joint ventures
The carrying value of the Group’s investments 53,825,470 539,342
Total shown as below (calculated according
to the respective equity holding percentage)
Net loss (5,335) (3,327)
Other comprehensive income – –
Total comprehensive income (5,335) (3,327)
2016 2015
Associates
The carrying value of the Group’s investments 261,339,961 229,782,643
Total shown as below (calculated according
to the respective equity holding percentage)
Net profit 7,861,488 7,085,666
Other comprehensive income – –
Total comprehensive income 7,861,488 7,085,666

Maanshan Iron & Steel Company Limited2016 Annual Report
231
VIII. RISKS RELATED TO FINANCIAL INSTRUMENTS
1. CLASSIFICATION OF FINANCIAL INSTRUMENTS
The carrying amounts of each of the categories of financial instruments at the end of the
reporting period are as follows:
31 December 2016
Financial assets
Financial assetsat fair value through profit or loss Loans and
receivablesAvailable-for-sale
financial assets TotalInitial recognition Held for trading
Cash – – 5,312,101,041 – 5,312,101,041Financial assets at fair value
through profit or loss 555,322,261 – – – 555,322,261Bills receivable – – 3,608,459,121 – 3,608,459,121Trade receivables – – 859,929,107 – 859,929,107Other receivables – – 98,676,949 – 98,676,949Interest receivable – – 4,044,939 – 4,044,939Financial assets purchased
under agreements to resell – – 230,047,000 – 230,047,000Loans and advances to
customers – – 1,555,212,556 – 1,555,212,556Available-for-sale financial
assets – – – 577,947,698 577,947,698
555,322,261 – 11,668,470,713 577,947,698 12,801,740,672
Financial liabilities
Financial liabilities
at fair value through profit or loss Other financial
liabilities TotalInitial recognition Held for trading
Short-term loans – – 6,942,952,420 6,942,952,420
Customer deposits – – 3,708,225,021 3,708,225,021
Repurchase agreements – – 596,565,698 596,565,698
Bills payable – – 3,584,228,362 3,584,228,362
Account payables – – 6,668,807,923 6,668,807,923
Interest payable – – 107,691,398 107,691,398
Dividend payable – – 8,713,584 8,713,584
Other payables – – 1,785,430,167 1,785,430,167
Other current liabilities – – 2,046,438,356 2,046,438,356
Non-current liabilities due within one year – – 3,211,056,320 3,211,056,320
Long-term loans – – 5,163,168,960 5,163,168,960
Bonds payable – – 3,987,666,667 3,987,666,667
– – 37,810,944,876 37,810,944,876

Notes to Financial Statements (Continued)
Maanshan Iron & Steel Company Limited2016 Annual Report
232
VIII. RISKS RELATED TO FINANCIAL INSTRUMENTS (CONTINUED)
1. CLASSIFICATION OF FINANCIAL INSTRUMENTS (CONTINUED)
The carrying amounts of each of the categories of financial instruments at the end of the
reporting period are as follows:
31 December 2015
Financial assets
Financial assetsat fair value through profit or loss Loans and
receivablesAvailable-for-sale
financial assets TotalInitial recognition Held for trading
Cash – – 5,142,711,482 – 5,142,711,482Financial assets at fair value
through profit or loss 1,003,684,000 1,587,054 – – 1,005,271,054Bills receivable – – 4,689,129,290 – 4,689,129,290Trade receivables – – 796,986,661 – 796,986,661Other receivables – – 190,348,070 – 190,348,070Interest receivable – – 1,600,176 – 1,600,176Loans and advances to
customers – – 732,913,869 – 732,913,869Available-for-sale financial
assets – – – 128,934,410 128,934,410
1,003,684,000 1,587,054 11,553,689,548 128,934,410 12,687,895,012
Financial liabilities
Financial liabilities
at fair value through profit or loss Other financial
liabilities TotalInitial recognition Held for trading
Short-term loans – – 6,791,359,472 6,791,359,472
Customer deposits – – 1,901,390,488 1,901,390,488
Bills payable – – 5,343,906,398 5,343,906,398
Account payables – – 6,144,664,281 6,144,664,281
Interest payable – – 150,829,308 150,829,308
Dividend payable – – 6,525,534 6,525,534
Other payables – – 1,258,463,513 1,258,463,513
Non-current liabilities due within one year – – 5,084,859,415 5,084,859,415
Long-term loans – – 6,655,171,584 6,655,171,584
Bonds payable – – 3,979,666,667 3,979,666,667
– – 37,316,836,660 37,316,836,660

Maanshan Iron & Steel Company Limited2016 Annual Report
233
VIII. RISKS RELATED TO FINANCIAL INSTRUMENTS (CONTINUED)
2. OFFSETTING OF FINANCIAL INSTRUMENTS
In 2016, there were no offsetting arrangements for account receivables (2015: Nil).
3. TRANSFER OF FINANCIAL ASSETS
Financial assets transferred but not yet fully derecognised
As of 31 December 2016, the Group endorsed (but not yet fully derecognised) bank
acceptance bills to its suppliers with a carrying amount of RMB156,827,864 for settlement
of account payables, and there was no bank acceptance bill discounted to banks which
was not derecognised. As of 31 December 2016, their maturity period ranged from 1 to 12
months. Pursuant to the relevant provisions of “Law of Negotiable Instruments”, the holders
of commercial instruments shall have the right of recourse against the Group (“Continuing
Involvement”) if relevant acceptance bank defaults. As the Group was of the opinion that
the Group had retained substantially all their risks and rewards, including the default risk
associated, the Group continued to recognise them and the settled accounts payable or short-
term borrowings associated therewith. After the endorsement or discount, the Group no longer
reserved the rights to use them, including the rights to sell, transfer or pledge to any other
third party. As of 31 December 2016, the carrying amount of accounts payable settled by the
Group through them amounted to RMB156,827,864 (31 December 2015: RMB132,410,064),
and there were no short term loans which were secured by bills receivable (31 December
2015:RMB111,192,600).
Transferred financial assets fully derecognised but with continuing involvement
As to 31 December 2016, the Group endorsed (and fully derecognised) bank acceptance
bills to its suppliers with a carrying amount of RMB5,196,770,076 (31 December 2015:
RMB1,488,128,608) for settlement of account payables, and there was no bank acceptance
bill discounted to banks which was fully derecognised (31 December 2015: RMB404,284,634).
As of 31 December 2016, their maturity period ranged from 1 to 12 months. Pursuant to the
relevant provisions of “Law of Negotiable Instruments”, the holders of commercial instruments
shall have the right of recourse against the Group (“Continuing Involvement”) if relevant
acceptance bank defaults. As the Group was of the opinion that the Group had transferred
substantially all their risks and rewards, the Group had derecognised them and then settled
account payables associated therewith.
During the year of 2016, no gain or loss was recognised in the date of transfer. No income or
expense was recognised for the current year or on an accumulative basis as a result of the
Group’s Continuing Involvement in derecognised financial assets. Endorsements were incurred
basically evenly during the year.

Notes to Financial Statements (Continued)
Maanshan Iron & Steel Company Limited2016 Annual Report
234
VIII. RISKS RELATED TO FINANCIAL INSTRUMENTS (CONTINUED)
4. FINANCIAL INSTRUMENTS RISK
The Group’s principal financial instruments are comprised of interest-bearing bank borrowings,
other borrowings and cash. The main purpose of these financial instruments is to finance for
the Group’s capital expenditure and operations. The Group has various other financial assets
and liabilities such as trade receivables and account payables, which arise directly from its
operations.
The main risks arising from the Group’s financial instruments are credit risk, liquidity risk, and
market risk. The Group’s risk management policies are outlined below.
Credit risk
The Group trades only with recognised and creditworthy third parties. It is the Group’s
policy that all customers who wish to trade on credit terms are subject to credit verification
procedures. In addition, trade receivables and bills receivable balances are monitored on an
ongoing basis and the Group’s exposure to bad debts is not significant. For transactions that
are not denominated in the functional currency of the relevant operating unit, the Group does
not offer credit terms without the specific approval of the Head of Credit Control.
The credit risk of other financial assets of the Group, which comprise cash, available-for-
sale financial assets, other receivables, interest receivable, financial assets purchased
under agreements to resell, loans and advances to customers, arises from default of the
counterparties, with a maximum exposure equal to the carrying amounts of these instruments.
Since the Group trades only with recognised and creditworthy third parties, there is no
requirement for collateral. Credit risk is managed in accordance with customer, counterparty,
geographical region and industry intensively. At the end of the reporting period, the Group had
a certain concentration of credit risk as 13% (2015: 21%) and 29% (2015: 43%) of the Group’s
trade receivables were due from the Group’s largest customer and five largest customers
in terms of trade receivables respectively. The Group did not hold any collateral or credit
enhancements for the balance of trade receivables.
Further quantitative data in respect of the Group’s exposure to credit risk arising from trade and
other receivables are stated in Note V.4 and Note V.6 to the financial statements.

Maanshan Iron & Steel Company Limited2016 Annual Report
235
VIII. RISKS RELATED TO FINANCIAL INSTRUMENTS (CONTINUED)
4. FINANCIAL INSTRUMENTS RISK (CONTINUED)
Credit risk (continued)
As of 31 December 2015 and 2016, the aging analysis of the Group’s financial assets that are
not considered to be impaired is as follows:
31 December 2016
Total
Neither overdue
nor impaired
Overdue
Less than
six months Over six months
Trade receivables 859,929,107 675,367,022 84,033,404 100,528,681
Bills receivable 3,608,459,121 3,608,459,121 – –
Other receivables 98,676,949 88,771,552 921,610 8,983,787
Available-for-sale financial assets 577,947,698 577,947,698 – –
Interest receivable 4,044,939 4,044,939 – –
Loans and advances to customers 1,555,212,556 1,555,212,556 – –
Financial assets purchased under
agreements to resell 230,047,000 230,047,000 – –
31 December 2015
Total
Neither overdue
nor impaired
Overdue
Less than
six months Over six months
Trade receivables 796,986,661 494,583,497 221,067,740 81,335,424
Bills receivable 4,689,129,290 4,689,129,290 – –
Other receivables 190,348,070 151,306,871 29,028,874 10,012,325
Available-for-sale financial assets 128,934,410 128,934,410 – –
Interest receivable 1,600,176 1,600,176 – –
Loans and advances to customers 732,913,869 732,913,869 – –
As of 31 December 2016, the Group’s trade receivables that were not considered to be
impaired mainly relate to a number of independent customers that had a good track record with
the Group.
Based on past experience, the directors of the Group were of the opinion that no provision for
impairment was necessary in respect of these balances as there had not been a significant
change in credit quality and the balances were still considered fully recoverable as of 31
December 2016.

Notes to Financial Statements (Continued)
Maanshan Iron & Steel Company Limited2016 Annual Report
236
VIII. RISKS RELATED TO FINANCIAL INSTRUMENTS (CONTINUED)
4. FINANCIAL INSTRUMENTS RISK (CONTINUED)
Liquidity risk
The Group applies a liquidity planning tool to manage liquidity risk of funding shortfalls,
which takes both maturity of financial instruments and estimated operating cash flows of the
Group into consideration. The Group’s aim is to balance the sustainability and flexibility of the
financing through interest-bearing loans and other instruments. The Group’s policy is that no
more than 80% of the borrowings should be due within 12 months according to the book value
in the financial statements. As of 31 December 2016, 76% of the Group’s debts were due
within 12 months (31 December 2015: 59%).
The maturity profile of the Group’s financial liabilities was as of the end of reporting period is
shown in the table below. The amounts disclosed in the table are the contractual undiscounted
cash flows.
31 December 2016
Within 1 to 2 2 to 3 3 to 5 Over1 year years years years 5 years Total
Short-term loans 6,942,952,420 – – – – 6,942,952,420Customer deposits 3,708,225,021 – – – – 3,708,225,021Repurchase agreements 596,565,698 – – – – 596,565,698Bills payable 3,584,228,362 – – – – 3,584,228,362Trade payables 6,668,807,923 – – – – 6,668,807,923Dividends payable 8,713,584 – – – – 8,713,584Other payables 1,785,430,167 – – – – 1,785,430,167Long-term loans due
within one year 3,211,056,320 – – – – 3,211,056,320Long-term loans – 4,255,056,320 761,056,320 51,056,320 96,000,000 5,163,168,960Bonds payable – 4,000,000,000 – – – 4,000,000,000Other current liabilities 2,046,438,356 – – – – 2,046,438,356Interest payable for interests-
bearing liabilities 708,657,506 265,441,922 11,595,323 1,633,260 4,807,920 992,135,931
Total 29,261,075,357 8,520,498,242 772,651,643 52,689,580 100,807,920 38,707,722,742

Maanshan Iron & Steel Company Limited2016 Annual Report
237
VIII. RISKS RELATED TO FINANCIAL INSTRUMENTS (CONTINUED)
4. FINANCIAL INSTRUMENTS RISK (CONTINUED)
Liquidity risk (continued)
31 December 2015
Within 1 to 2 2 to 3 3 to 5 Over1 year years years years 5 years Total
Short-term loans 6,791,359,472 – – – – 6,791,359,472Customer deposits 1,901,390,488 – – – – 1,901,390,488Bills payable 5,343,906,398 – – – – 5,343,906,398Trade payables 6,144,664,281 – – – – 6,144,664,281Dividends payable 6,525,534 – – – – 6,525,534Other payables 1,258,463,513 – – – – 1,258,463,513Short-term financing bonds 2,340,000,000 – – – – 2,340,000,000Long-term loans due
within one year 2,747,792,896 – – – – 2,747,792,896Long-term loans – 6,243,992,896 238,292,896 117,585,792 55,300,000 6,655,171,584Bonds payable – – 4,000,000,000 – – 4,000,000,000Interest payable for interests-
bearing liabilities 930,909,303 239,885,087 121,033,016 4,823,867 1,994,487 1,298,645,760
Total 27,465,011,885 6,483,877,983 4,359,325,912 122,409,659 57,294,487 38,487,919,926
Market risk
Interest rate risk
The Group’s exposure to the risk of changes in market interest rates relates primarily to the
Group’s long term debt obligations with a floating interest rate.
The following table demonstrates the sensitivity to a reasonably possible change in market
interest rates, with all other variables held constant, of the Group’s net profit/(loss) (through the
impact on floating rate borrowings).

Notes to Financial Statements (Continued)
Maanshan Iron & Steel Company Limited2016 Annual Report
238
VIII. RISKS RELATED TO FINANCIAL INSTRUMENTS (CONTINUED)
4. FINANCIAL INSTRUMENTS RISK (CONTINUED)
Market risk (continued)
Interest rate risk (continued)
Increase/
(decrease)
Increase/
(decrease)
in basis points in net profit
2016
RMB 50 (37,553,708)
USD 50 (965,033)
EUR 50 (358,115)
RMB (50) 37,553,708
USD (50) 965,033
EUR (50) 358,115
2015
RMB 50 (27,945,438)
USD 50 (2,809,479)
RMB (50) 27,945,438
USD (50) 2,809,479
Exchange rate risk
The Group faces transactional foreign currency risk. This risk arises from the sales and
purchases carried out by operating units which were denominated in currencies other than its
functional currencies.
The businesses of the Group are principally located in the PRC. While most of the transactions
are conducted in Renminbi, certain of its sales, purchases and borrowings are denominated in
United States dollars, Euros and Japanese Yen. Fluctuations of the exchange rates of Renminbi
against these foreign currencies can affect the Group’s results of operations.

Maanshan Iron & Steel Company Limited2016 Annual Report
239
VIII. RISKS RELATED TO FINANCIAL INSTRUMENTS (CONTINUED)
4. FINANCIAL INSTRUMENTS RISK (CONTINUED)
Market risk (continued)
Exchange rate risk (continued)
The carrying amounts and related maximum exposure to foreign currency risk of Group’s cash,
trade receivables, other receivables, short term loans, account payables, other payables and
long term loans are stated in Notes V.1, 4, 6, 21, 23, 29, 30, 33 to the financial statements,
respectively.
The following table demonstrates the sensitivity at the end of the reporting period to a
reasonably possible change in the exchange rates of the USD, EUR, JPY, AUD, HKD, CAD,
GBP and ZAR with all other variables held constant, of the Group’s net profit and equity (due to
changes in the fair values of monetary assets and liabilities).
Increase/
(decrease)
Increase/
(decrease)
Increase/
(decrease)
in exchange rate in net profit in equity
(Note)
2016
Depreciation of RMB to USD 1% (1,209,031) (29,008)
Depreciation of RMB to EUR 1% (341,902) (1,340,107)
Depreciation of RMB to JPY 1% (1) –
Depreciation of RMB to AUD 1% – (1,870,414)
Depreciation of RMB to HKD 1% (99) (1,752,142)
Depreciation of RMB to CAD 1% (53,954) –
Depreciation of RMB to GBP 1% (89) –
Depreciation of RMB to ZAR 1% (57,553) –
Appreciation of RMB to USD (1%) 1,209,031 29,008
Appreciation of RMB to EUR (1%) 341,902 1,340,107
Appreciation of RMB to JPY (1%) 1 –
Appreciation of RMB to AUD (1%) – 1,870,414
Appreciation of RMB to HKD (1%) 99 1,752,142
Appreciation of RMB to CAD (1%) 53,954 –
Appreciation of RMB to GBP (1%) 89 –
Appreciation of RMB to ZAR (1%) 57,553 –
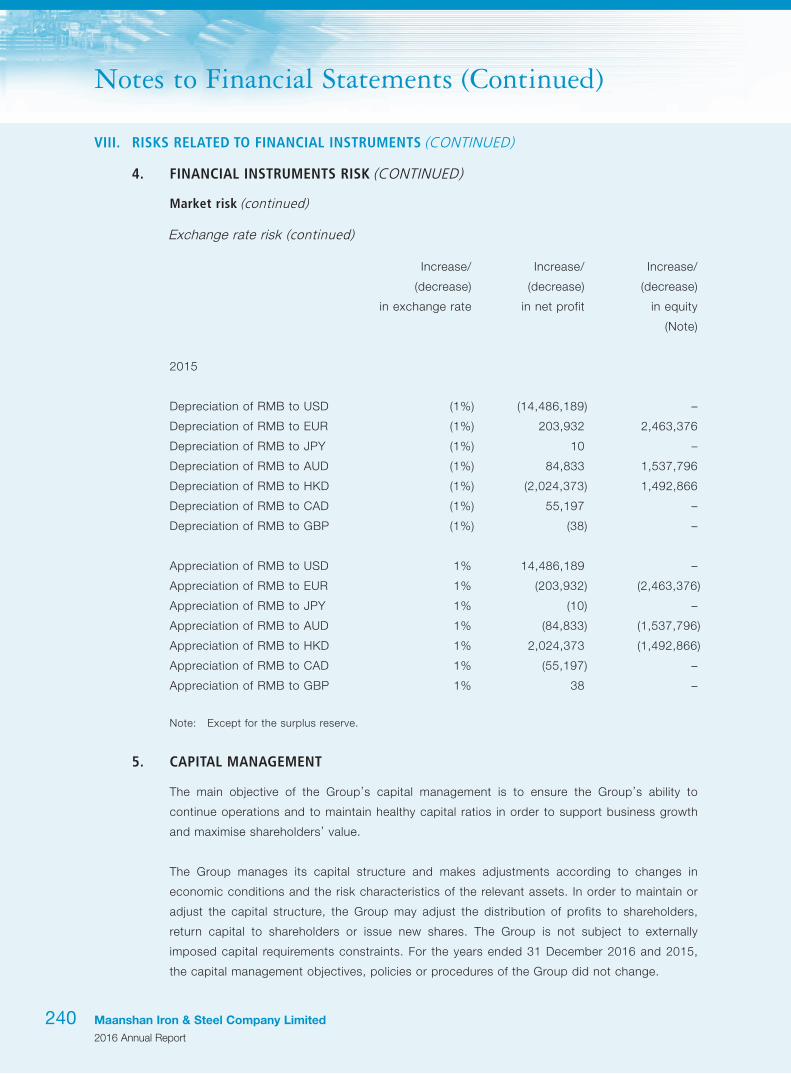
Notes to Financial Statements (Continued)
Maanshan Iron & Steel Company Limited2016 Annual Report
240
VIII. RISKS RELATED TO FINANCIAL INSTRUMENTS (CONTINUED)
4. FINANCIAL INSTRUMENTS RISK (CONTINUED)
Market risk (continued)
Exchange rate risk (continued)
Increase/
(decrease)
Increase/
(decrease)
Increase/
(decrease)
in exchange rate in net profit in equity
(Note)
2015
Depreciation of RMB to USD (1%) (14,486,189) –
Depreciation of RMB to EUR (1%) 203,932 2,463,376
Depreciation of RMB to JPY (1%) 10 –
Depreciation of RMB to AUD (1%) 84,833 1,537,796
Depreciation of RMB to HKD (1%) (2,024,373) 1,492,866
Depreciation of RMB to CAD (1%) 55,197 –
Depreciation of RMB to GBP (1%) (38) –
Appreciation of RMB to USD 1% 14,486,189 –
Appreciation of RMB to EUR 1% (203,932) (2,463,376)
Appreciation of RMB to JPY 1% (10) –
Appreciation of RMB to AUD 1% (84,833) (1,537,796)
Appreciation of RMB to HKD 1% 2,024,373 (1,492,866)
Appreciation of RMB to CAD 1% (55,197) –
Appreciation of RMB to GBP 1% 38 –
Note: Except for the surplus reserve.
5. CAPITAL MANAGEMENT
The main objective of the Group’s capital management is to ensure the Group’s ability to
continue operations and to maintain healthy capital ratios in order to support business growth
and maximise shareholders’ value.
The Group manages its capital structure and makes adjustments according to changes in
economic conditions and the risk characteristics of the relevant assets. In order to maintain or
adjust the capital structure, the Group may adjust the distribution of profits to shareholders,
return capital to shareholders or issue new shares. The Group is not subject to externally
imposed capital requirements constraints. For the years ended 31 December 2016 and 2015,
the capital management objectives, policies or procedures of the Group did not change.

Maanshan Iron & Steel Company Limited2016 Annual Report
241
VIII. RISKS RELATED TO FINANCIAL INSTRUMENTS (CONTINUED)
5. CAPITAL MANAGEMENT (CONTINUED)
The Group uses a gearing ratio to manage its capital. The gearing ratio refers to the percentage
of net debt versus the amount of adjusted capital plus net debt, and the target gearing ratio
for the Group is between 50% and 70%. Net debt includes deposits, bank loans, bills payable,
bonds payable, account payables accrued, payroll, interest payable, dividend payable and
other payables, minus cash. Capital refers to total capital attributable to owners of the parent
company. The Group’s gearing ratio at the end of the reporting period was as follows:
31 December
2016
31 December
2015
Customer deposits 3,708,225,021 1,901,390,488
Repurchase agreements of financial assets 596,565,698 –
Short-term loans 6,942,952,420 6,791,359,472
Bills payable 3,584,228,362 5,343,906,398
Account payables 6,668,807,923 6,144,664,281
Payroll and benefits payable 550,444,683 274,614,723
Interest payable 107,691,398 150,829,308
Dividend payable 8,713,584 6,525,534
Other payables 1,912,575,078 1,258,463,513
Other current liabilities 2,273,058,356 –
Non-current liabilities due within one year 3,211,056,320 5,084,859,415
Long-term loans 5,163,168,960 6,655,171,584
Bonds payable 3,987,666,667 3,979,666,667
Long-term employee benefits payable 159,173,203 28,857,389
Less: Cash and bank balances 5,312,101,041 5,142,711,482
Net liabilities 33,562,226,632 32,477,597,290
Capital attributable to owners of the parent company 19,764,171,955 18,455,838,015
Adjusted capital 19,764,171,955 18,455,838,015
Capital and net liabilities 53,326,398,587 50,933,435,305
Gearing ratio 63% 64%

Notes to Financial Statements (Continued)
Maanshan Iron & Steel Company Limited2016 Annual Report
242
IX. DISCLOSURE OF FAIR VALUE
1. FINANCIAL ASSETS AND LIABILITIES MEASURED AT FAIR VALUE
31 December 2016
Inputs used by fair value measurement
Quoted prices
in active
markets
Level 1
Significant
observable
inputs
Level 2
Significant
unobservable
inputs
Level 3 Total
Recurring fair value measurement for:
Financial assets at fair value through
profit or loss 555,322,261 – – 555,322,261
Available-for-sale financial assets--
investments in debt instruments 451,225,538 – – 451,225,538
31 December 2015
Inputs used by fair value measurement
Quoted prices
in active
markets
Significant
observable
inputs
Significant
unobservable
inputs
Level 1 Level 2 Level 3 Total
Recurring fair value measurement for:
Financial assets at fair value through
profit or loss 1,005,271,054 – – 1,005,271,054

Maanshan Iron & Steel Company Limited2016 Annual Report
243
IX. DISCLOSURE OF FAIR VALUE (CONTINUED)
2. FINANCIAL ASSETS AND LIABILITIES DISCLOSED AT FAIR VALUE
31 December 2016
Inputs used by fair value measurement
Quoted prices
in active
markets
Significant
observable
inputs
Significant
unobservable
inputs
Level 1 Level 2 Level 3 Total
Long-term loans – 5,490,140,427 – 5,490,140,427
Bonds payable – 4,086,113,423 – 4,086,113,423
31 December 2015
Inputs used by fair value measurement
Quoted prices
in active
markets
Significant
observable
inputs
Significant
unobservable
inputs
Level 1 Level 2 Level 3 Total
Long-term loans – 6,475,332,986 – 6,475,332,986
Bonds payable – 3,976,000,000 – 3,976,000,000
3. VALUATION OF FAIR VALUE
Fair value of financial instruments
The carrying amounts and fair values of the Group’s financial instruments are as follows,
excluding the financial instruments that the difference between the fair values and carrying
amounts is very little and the equity instruments that there is no price or its fair value cannot be
reliably measured in the active market:
Carrying amounts Fair values
31 December
2016
31 December
2015
31 December
2016
31 December
2015
Financial liabilities
Long-term loans 5,163,168,960 6,655,171,584 5,490,140,427 6,475,332,986
Bonds payable 3,987,666,667 3,979,666,667 4,086,113,423 3,976,000,000

Notes to Financial Statements (Continued)
Maanshan Iron & Steel Company Limited2016 Annual Report
244
IX. DISCLOSURE OF FAIR VALUE (CONTINUED)
3. VALUATION OF FAIR VALUE (CONTINUED)
Fair value of financial instruments (continued)
Management had assessed the fair value of cash, bills receivable, account receivables, interest
receivable, other receivables, financial assets purchased under agreements to resell, bills
payable, account payables, interest payable, dividend payable, other payables, loans and
advances to customers, customer deposits, repurchase agreements, short term loans, non-
current liabilities due within one year and other non-current liabilities. Since the residual terms
of the above-mentioned items were not long, the fair values were similar to the book values.
The policies and procedures for accounting financial instruments at fair value are developed by
the Group’s finance team led by the finance manager. The Group’s finance team reports directly
to the financial officer and the Audit Committee. At each balance sheet date, the finance team
analyses changes in the value of financial instruments and determines the main applicable
inputs to the valuation. Valuations are subject to the approval of the financial officer. The finance
team discusses the valuation process and results twice a year with the Audit Committee for
interim and annual financial reporting.
The fair value of the financial asstes and liabilities is the amount for which an asset could be
exchanged, or a liability settled, between knowledgeable and willing parties in an arm’s length
transaction. The following methods and assumptions are used in estimating fair value.
The method of discounted cash flows is adopted to determine the fair value of long term loans
and medium-term note payable, in which the market return rate of other financial instruments
with similar contract terms, credit risk, remaining maturity and yield characteristics is used
as the discount rate. As of 31 December 2016, the default risk for the long term loans was
evaluated as not significant for corporate bonds payable, quoted market prices were adopted
to determine their fair value.

Maanshan Iron & Steel Company Limited2016 Annual Report
245
X. RELATED PARTIES AND RELATED PARTY TRANSACTIONS
1. PARENT COMPANY
Registered Share of Share ofPlace of Business capital equity voting
Name of parent registration nature RMB interests (%) rights (%)
The Holding Anhui, PRC Manufacturing 6,298,290,000 45.535 45.535
The Company is ultimately controlled by the Holding.
2. SUBSIDIARIES
Details of the subsidiaries are stated in Note VII.1 to the financial statements.
3. ASSOCIATES AND JOINT VENTURES OF THE GROUP
Details of associates and joint ventures of the Group are stated in Note VII.2 to the financial
statements.
4. OTHER RELATED PARTIES
Name
Relationship with
the Company
Magang (Group) Investment Co., Ltd. Controlled by the Holding
Magang (Group) logistics Co., Ltd. Controlled by the Holding
Maanshan Iron & Steel Group Mining Co., Ltd. Controlled by the Holding
An Hui Masteel Zhang Zhuang Mining Co., Ltd. Controlled by the Holding
Anhui Masteel Luo He Mining Co., Ltd. Controlled by the Holding
Masteel Engineering Technology (Group) Co., Ltd. Controlled by the Holding
Masteel Automation and Information Technology Co., Ltd. Controlled by the Holding
Anhui Xiangyun Technology Co., Ltd. Controlled by the Holding
Masteel Group Design and Research Institute Co., Ltd. Controlled by the Holding
Maanshan Masteel Yan Tu Construction
Survey Mining Co., Ltd. Controlled by the Holding
Masteel Group Mapping Co., Ltd. Controlled by the Holding
Masteel Heavy Machinery Manufacturing Co., Ltd. Controlled by the Holding
Masteel Transportation Equipment Manufacturing Co., Ltd. Controlled by the Holding
Maanshan Masteel Surface Engineering Technology Co., Ltd. Controlled by the Holding
Shanghai Maanshan Iron & Steel Electrical and Mechanical
Technology Co., Ltd. Controlled by the Holding
Masteel Group Kang Tai Land Development Co., Ltd. Controlled by the Holding
Maanshan Yu Tai Property Management Co., Ltd. Controlled by the Holding
Masteel Group Kang Cheng Building and Installing Co., Ltd. Controlled by the Holding
Maanshan Gang Chen Industry Co., Ltd. Controlled by the Holding

Notes to Financial Statements (Continued)
Maanshan Iron & Steel Company Limited2016 Annual Report
246
Name
Relationship with
the Company
Masteel Shen Ma Metal Co., Ltd. Controlled by the Holding
Masteel Industry Sheng Xing Raw Material Processing Co.,
Ltd. Controlled by the Holding
Masteel Green Energy Technology Development Co., Ltd. Controlled by the Holding
Tongling Yuanda Co., Ltd. Controlled by the Holding
Maanshan Gang Chen Steel Logistics Park Co., Ltd. Controlled by the Holding
Maanshan Gang Chen Hydrogen Industry Co., Ltd. Controlled by the Holding
Shenzhen Yue Hai Masteel Industry Co., Ltd. Controlled by the Holding
Anhui BRC & Masteel Weldmesh Co., Ltd. Controlled by the Holding
Masteel Refractory Materials Co., Ltd. Controlled by the Holding
Maanshan Bo Li Construction Supervising Co., Ltd. Controlled by the Holding
Maanshan Jia Hua Commodity Concrete Co., Ltd. Controlled by the Holding
Xinchuang Economize Resource Controlled by the Holding
Masteel Automobile Transportation Service Co., Ltd. Controlled by the Holding
Maanshan Used Vehicle Trading Centre Co., Ltd. Controlled by the Holding
Anhui Masteel Dangerous Goods Transportation Co., Ltd. Controlled by the Holding
Ma Steel International Trade and Economic Co., Ltd. Controlled by the Holding
Anhui Jiangnan Iron and Steel Material Quality Monitoring
and Testing Co., Ltd. Controlled by the Holding
Shanghai Masteel International Trade and Economic Co., Ltd. Controlled by the Holding
Anhui Zhonglian Shipping Co., Ltd. Controlled by the Holding
Hefei Dianbu River Harbour Co., Ltd. Controlled by the Holding
Maanshan Masteel Electric Repair Co., Ltd. Controlled by the Holding
Ma Steel Powder Metallurgy Co., Ltd. Controlled by the Holding
Ma Steel United Electric Steel Roller Co., Ltd. Controlled by the Holding
Anhui Masteel Xinba Environmental Co., Ltd. (i) Controlled by the Holding
Anhui Masteel Dongli Transmission Equipment Co., Ltd. (i) Controlled by the Holding
Ma Steel (Hefei) Logistics Co., Ltd. (i) Controlled by the Holding
(i) The newly established companies are controlled by the Holding.
X. RELATED PARTIES AND RELATED PARTY TRANSACTIONS (CONTINUED)
4. OTHER RELATED PARTIES (CONTINUED)

Maanshan Iron & Steel Company Limited2016 Annual Report
247
X. RELATED PARTIES AND RELATED PARTY TRANSACTIONS (CONTINUED)
5. SIGNIFICANT TRANSACTIONS CARRIED OUT BETWEEN THE GROUP AND ITS RELATED PARTIES
(1) Purchases of ore from related parties
Note 2016 2015
The Holding (i) 2,562,984,067 2,245,530,588
Ma Steel International Trade and
Economic Co., Ltd. (i) 43,628,143 201,182,139
Tongling Yuanda Co., Ltd. (i) 16,723,217 58,983,607
Anhui Masteel Luo He Mining Co., Ltd. (i) 1,815,419 7,964,460
An Hui Masteel Zhang Zhuang Mining
Co., Ltd. (i) 87,370,671 –
Maanshan Iron & Steel Group Mining
Co., Ltd. (i) 171,444,673 –
2,883,966,190 2,513,660,794
(i) The terms for the purchases of iron ore from the Holding were determined in accordance
with an agreement dated 10 September 2015 entered into between the Company and the
Holding. The agreement stipulated that the price should be determined based on the Platts
Index. The Group purchased ore from Tongling Yuanda Co., Ltd., Ma Steel International
Trade and Economic Co., Ltd., and Anhui Masteel Luo He Mining Co., Ltd., and the price
was subject to negotiation according to market prices.

Notes to Financial Statements (Continued)
Maanshan Iron & Steel Company Limited2016 Annual Report
248
X. RELATED PARTIES AND RELATED PARTY TRANSACTIONS (CONTINUED)
5. SIGNIFICANT TRANSACTIONS CARRIED OUT BETWEEN THE GROUP AND ITS RELATED PARTIES (CONTINUED)
(2) Fees paid for labour, logistics and other services
Note 2016 2015
The Holding (ii) 91,109,831 75,259,657
Masteel Refractory Materials Co., Ltd. (ii) 673,010,112 523,732,813
Xinchuang Economize Resource (ii) 394,361,735 271,977,349
Masteel Automobile Transportation
Service Co., Ltd. (ii) 215,856,439 209,864,614
Masteel Heavy Machinery
Manufacturing Co., Ltd. (ii) 267,864,102 205,379,949
Maanshan Masteel Surface Engineering
Technology Co., Ltd. (ii) 170,311,795 146,979,560
Masteel Automation and Information
Technology Co., Ltd. (ii) 92,120,193 71,562,326
Masteel Engineering Technology
(Group) Co., Ltd. (ii) 398,832,280 406,968,817
Masteel Transportation Equipment
Manufacturing Co., Ltd. (ii) 75,670,153 64,823,345
Ma Steel International Trade and
Economic Co., Ltd. (ii) 36,686,520 87,392,730
Maanshan Gang Chen Industry Co.,
Ltd. (ii) 5,314,444 4,666,849
Others (ii) 247,675,539 374,050,176
2,668,813,143 2,442,658,185
(ii) The terms for the provision of certain services, including on-the-job training, food
and sanitary services, environmental and hygiene services, maintenance of roads and
landscaping services, telecommunications service, contract of transportation service,
equipment repair and maintenance services, and engineering design services, were
determined in accordance with a service agreement between the Group and the Holding.

Maanshan Iron & Steel Company Limited2016 Annual Report
249
X. RELATED PARTIES AND RELATED PARTY TRANSACTIONS (CONTINUED)
5. SIGNIFICANT TRANSACTIONS CARRIED OUT BETWEEN THE GROUP AND ITS RELATED PARTIES (CONTINUED)
(3) Agency fees paid to related parties
Note 2016 2015
Maanshan Gang Chen Industry Co.,
Ltd. (iii) 2,005,176 2,558,962
Masteel Shen Ma Metal Co., Ltd. (iii) 2,320 67,986
Ma Steel International Trade and
Economic Co., Ltd. (iii) 46,972 215,029
Shanghai Masteel International Trade
and Economic Co., Ltd. (iii) 94,058 81,617
2,148,526 2,923,594
(iii) The transactions with the Holding and its subsidiaries were conducted on terms of mutually
agreed according to market prices between the Group and the related parties.
(4) Rental expenses
Note 2016 2015
The Holding (iv) 41,599,065 48,540,000
(iv) The Holding leased a building to the Group and the rental was determined by the terms of
mutually agreed between the Group and the Holding.

Notes to Financial Statements (Continued)
Maanshan Iron & Steel Company Limited2016 Annual Report
250
X. RELATED PARTIES AND RELATED PARTY TRANSACTIONS (CONTINUED)
5. SIGNIFICANT TRANSACTIONS CARRIED OUT BETWEEN THE GROUP AND ITS RELATED PARTIES (CONTINUED)
(5) Purchases of fixed assets and construction services
Note 2016 2015
Xinchuang Economize Resource (iii) 69,867,835 198,870,368
Masteel Engineering Technology
(Group) Co., Ltd. (iii) 354,895,467 334,450,389
Masteel Automation and Information
Technology Co., Ltd. (iii) 51,137,271 19,601,634
Maanshan Masteel Surface Engineering
Technology Co., Ltd. (iii) 5,946,815 8,372,508
Masteel Transportation Equipment
Manufacturing Co., Ltd. (iii) 1,125,003 3,581,034
Masteel Heavy Machinery
Manufacturing Co., Ltd. (iii) 9,180,268 20,574,500
Maanshan Masteel Electric Repair Co.,
Ltd. (iii) 607,479 –
Others 24,270 5,963,013
492,784,408 591,413,446
(iii) The transactions with the Holding and its subsidiaries were conducted on terms of mutually
agreed according to market prices between the Group and the related parties.

Maanshan Iron & Steel Company Limited2016 Annual Report
251
X. RELATED PARTIES AND RELATED PARTY TRANSACTIONS (CONTINUED)
5. SIGNIFICANT TRANSACTIONS CARRIED OUT BETWEEN THE GROUP AND ITS RELATED PARTIES (CONTINUED)
(6) Fees received for the supply of utilities, services and other goods
Note 2016 2015
The Holding (iii) 6,921,945 3,543,613
Masteel Heavy Machinery
Manufacturing Co., Ltd. (iii) 18,789,192 27,568,934
Xinchuang Economize Resource (iii) 137,550,678 66,637,669
An Hui Masteel Zhang Zhuang Mining
Co., Ltd. (iii) 6,436 116,144
Ma Steel Powder Metallurgy Co., Ltd. (iii) 12,980,730 12,630,013
Masteel Refractory Materials Co., Ltd. (iii) 7,541,308 8,406,103
Masteel Transportation Equipment
Manufacturing Co., Ltd. (iii) 2,100,497 3,067,278
Maanshan Jia Hua Commodity
Concrete Co., Ltd. (iii) 485,730 3,552,094
Maanshan Gang Chen Industry Co.,
Ltd. (iii) 898,078 1,291,525
Masteel Engineering Technology
(Group) Co., Ltd. (iii) 30,892,903 14,035,029
Anhui BRC & Masteel Weldmesh Co.,
Ltd. (iii) 10,647,183 –
Others (iii) 29,395,898 20,254,525
258,210,578 161,102,927
(iii) The transactions with the Holding and its subsidiaries were conducted on terms of mutually
agreed according to market prices between the Group and the related parties.

Notes to Financial Statements (Continued)
Maanshan Iron & Steel Company Limited2016 Annual Report
252
X. RELATED PARTIES AND RELATED PARTY TRANSACTIONS (CONTINUED)
5. SIGNIFICANT TRANSACTIONS CARRIED OUT BETWEEN THE GROUP AND ITS RELATED PARTIES (CONTINUED)
(7) Sales of steel products and other by-products
Note 2016 2015
Masteel Engineering Technology
(Group) Co., Ltd. (iii) 115,086,118 153,747,683
Maanshan Gang Chen Industry Co.,
Ltd. (iii) 41,537,457 4,071,037
Ma Steel International Trade and
Economic Co., Ltd. (iii) 2,837,657 1,663,939
Masteel Heavy Machinery
Manufacturing Co., Ltd. (iii) 597,979 12,565,062
Others (iii) 9,052,448 –
169,111,659 172,047,721
(iii) The transactions with the Holding and its subsidiaries were conducted on terms of mutually
agreed according to market prices between the Group and the related parties.

Maanshan Iron & Steel Company Limited2016 Annual Report
253
X. RELATED PARTIES AND RELATED PARTY TRANSACTIONS (CONTINUED)
5. SIGNIFICANT TRANSACTIONS CARRIED OUT BETWEEN THE GROUP AND ITS RELATED PARTIES (CONTINUED)
(8) Financial service interest cost paid to related parties
Note 2016 2015
The Holding (v) 9,384,146 10,485,794
Masteel Engineering Technology
(Group) Co., Ltd. (v) 2,536,206 1,755,364
Maanshan Gang Chen Industry Co.,
Ltd. (v) 379,592 861,963
Maanshan Iron & Steel Group Mining
Co., Ltd. (v) 1,732,811 1,237,573
Ma Steel International Trade and
Economic Co., Ltd. (v) 553,390 626,396
Xinchuang Economize Resource (v) 513,327 –
Maanshan Masteel Surface Engineering
Technology Co., Ltd. (v) 501,628 1,051,055
Others (v) 4,712,827 6,766,809
20,313,927 22,784,954
(v) Masteel Financial absorbed deposits from the Holding and its subsidiaries, and paid interest
to them with the interest rate ranging from 0.385% to 3.25% in 2016 (2015: 0.385% to
3.25%).

Notes to Financial Statements (Continued)
Maanshan Iron & Steel Company Limited2016 Annual Report
254
X. RELATED PARTIES AND RELATED PARTY TRANSACTIONS (CONTINUED)
5. SIGNIFICANT TRANSACTIONS CARRIED OUT BETWEEN THE GROUP AND ITS RELATED PARTIES (CONTINUED)
(9) Financial service income received from related parties
Note 2016 2015
The Holding (vi) 13,622,321 2,150,493
Maanshan Gang Chen Industry Co.,
Ltd. (vi) 2,957,266 1,336,425
Anhui Masteel Luo He Mining Co., Ltd. (vi) 4,552,536 5,273,311
Maanshan Iron & Steel Group Mining
Co., Ltd. (vi) 13,085,118 17,334,088
Anhui BRC & Masteel Weldmesh Co.,
Ltd. (vi) 622,781 1,591,106
Xinchuang Economize Resource (vi) 157,368 109,740
Ma Steel International Trade and
Economic Co., Ltd. (vi) 322,992 577,379
Others (vi) 596,695 499,085
35,917,077 28,871,627
(vi) Masteel Financial, a subsidiary of the Group, obtained financial service income for the
financial services it rendered to the Holding and its subsidiaries, including providing loans,
bank acceptance bills discounting and entrusted loan. The lending rates were not lower
than the benchmark loan interest rates issued by the People’s Bank of China, and the other
service charge was not lower than the benchmark charge issued by the People’s Bank of
China.

Maanshan Iron & Steel Company Limited2016 Annual Report
255
X. RELATED PARTIES AND RELATED PARTY TRANSACTIONS (CONTINUED)
5. SIGNIFICANT TRANSACTIONS CARRIED OUT BETWEEN THE GROUP AND ITS RELATED PARTIES (CONTINUED)
(10) Rental income from an associate
Note 2016 2015
Masteel Auto-parking (vii) – 189,395
(vii) Ma Steel (HK) entered into the “Agreement on capital injection of Anhui Masteel
Stereoscopic Auto-parking Equipments Company Limited” on 26 November 2015, pursuant
to which Ma Steel (HK) would not participate in the capital injection. Therefore, Ma Steel
(HK)’s equity interest was diluted from 25% to 8.9367%. As Ma Steel (HK) was no longer
able to exercise significant influence over the investee, the investee was not an associate
anymore.
(11) Rental expenses paid to an associate
Note 2016 2015
Masteel Auto-parking (vii) – 14,952
(vii) Ma Steel (HK) entered into the “Agreement on capital injection of Anhui Masteel
Stereoscopic Auto-parking Equipments Company Limited” on 26 November 2015, pursuant
to which Ma Steel (HK) would not participate in the capital injection. Therefore, Ma Steel
(HK)’s equity interest was diluted from 25% to 8.9367%. As Ma Steel (HK) was no longer
able to exercise significant influence over the investee, the investee is not an associate
anymore.
(12) Sale of wheel to an associate
Note 2016 2015
Ma-Steel Rail Transportation (viii) – 1,199,500
(viii) On 28 May 2015, the Company acquired another 50% equity interests of Ma-Steel Rail
Transportation from Jinxi Axle Company Limited. After the acquisation, the Company owned
100% equity interests in Ma-Steel Rail Transportation. Therefore, the Company began to
account for Ma-Steel Rail Transportation as a subsidiary rather than an associate.

Notes to Financial Statements (Continued)
Maanshan Iron & Steel Company Limited2016 Annual Report
256
X. RELATED PARTIES AND RELATED PARTY TRANSACTIONS (CONTINUED)
5. SIGNIFICANT TRANSACTIONS CARRIED OUT BETWEEN THE GROUP AND ITS RELATED PARTIES (CONTINUED)
(13) Sales of coke-related products to an associate
Note 2016 2015
Shenglong Chemical (ix) – 841,809
(ix) These transactions were made between the Group and Shenglong Chemical and were
conducted in accordance with the terms of mutually agreed according to market prices
between the parties.
(14) Purchases of coke from an associate
Note 2016 2015
Shenglong Chemical (ix) – 120,258,337
(ix) These transactions were made between the Group and Shenglong Chemical and were
conducted in accordance with the terms of mutually agreed according to market prices
between the parties.
(15) Rental income from a joint venture
Note 2016 2015
BOC-Ma Steel (x) 1,250,000 1,250,000
(x) These transactions were made between the Group and BOC-Ma Steel and were conducted
in accordance with the terms of mutually agreed according to market prices between the
parties.
(16) Fees received for the supply of electricity from a joint venture
Note 2016 2015
BOC-Ma Steel (x) 248,519,202 293,461,802
(x) These transactions were made between the Group and BOC-Ma Steel and were conducted
in accordance with the terms of mutually agreed according to market prices between the
parties.

Maanshan Iron & Steel Company Limited2016 Annual Report
257
X. RELATED PARTIES AND RELATED PARTY TRANSACTIONS (CONTINUED)
5. SIGNIFICANT TRANSACTIONS CARRIED OUT BETWEEN THE GROUP AND ITS RELATED PARTIES (CONTINUED)
(17) Fee received for utilities and facilities from a joint venture
Note 2016 2015
BOC-Ma Steel (x) 5,850,823 5,742,143
(x) These transactions were made between the Group and BOC-Ma Steel and were conducted
in accordance with the terms of mutually agreed according to market prices between the
parties.
(18) Purchase of gas products from a joint venture
Note 2016 2015
BOC-Ma Steel (x) 548,384,100 569,954,048
(x) These transactions were made between the Group and BOC-Ma Steel and were conducted
in accordance with the terms of mutually agreed according to market prices between the
parties.
(19) Fee received for providing equipment inspection from a joint venture
Note 2016 2015
BOC-Ma Steel (x) 150,000 150,000
(x) These transactions were made between the Group and BOC-Ma Steel and were conducted
in accordance with the terms of mutually agreed according to market prices between the
parties.

Notes to Financial Statements (Continued)
Maanshan Iron & Steel Company Limited2016 Annual Report
258
X. RELATED PARTIES AND RELATED PARTY TRANSACTIONS (CONTINUED)
5. SIGNIFICANT TRANSACTIONS CARRIED OUT BETWEEN THE GROUP AND ITS RELATED PARTIES (CONTINUED)
(20) Guarantee from a related party
2016
Guarantee’s Guarantee Start End Has guarantee
Note name amount date Date matured or not
(RMB)
The Holding (xi) The Company 2.487 billion 2014.7 2025.10
Not yet as of the
approval date of
the report
2015
Guarantee’s Guarantee Start End Has guarantee
Note name amount date Date matured or not
(RMB)
The Holding (xi) The Company 4.812 billion 2014.3 2025.10
Not yet as of the
approval date of
the report
(xi) In 2016, the Holding had guaranteed additional certain bank loans of the Group amounting
to approximately RMB0.94 billion (2015: approximately RMB3.89 billion) in 2016 without
attached conditions. The Holding had guaranteed part of bank loans without attached
conditions amounting to approximately RMB2.487 billion as of 31 December 2016 (31
December 2015: approximately RMB4.812 billion).

Maanshan Iron & Steel Company Limited2016 Annual Report
259
X. RELATED PARTIES AND RELATED PARTY TRANSACTIONS (CONTINUED)
5. SIGNIFICANT TRANSACTIONS CARRIED OUT BETWEEN THE GROUP AND ITS RELATED PARTIES (CONTINUED)
(21) Borrowings from related parties
2016
Note Amount Start date End date
Anhui Zhonglian
Shipping Co., Ltd. (xii) 70,000,000 2016/09/27 2017/09/26
Maanshan Masteel Surface
Engineering Technology Co.,
Ltd. (xii) 20,000,000 2016/07/29 2017/07/28
Maanshan Masteel Surface
Engineering Technology Co.,
Ltd. (xii) 20,000,000 2016/11/18 2017/11/17
The Holding 40,000,000 2016/08/30 2017/08/29
(xii) On 27 September 2016, Anhui Zhonglian Shipping Co. Ltd. entrusted Masteel Financial to
provide the Company a short-term loan of RMB70,000,000 with the annual interest rate of
3.915%, and repay the principal and interest on the expiration date. The Company accrued
interest of RMB723,188, which was not paid yet as of 31 December 2016.
On 29 July 2016, Maanshan Masteel Surface Engineering Technology Co., Ltd. entrusted
Masteel Financial to provide the Company a short-term loan of RMB20,000,000 with the
annual interest rate of 3.915%, and repay the principal and interest on the expiration date.
The Company accrued interest of RMB337,125, which was not paid yet as of 31 December
2016.
On 18 November 2016, Maanshan Masteel Surface Engineering Technology Co., Ltd.
entrusted Masteel Financial to provide the Company a short term loan of RMB20,000,000
with the annual interest rate of 3.915%, and repay the principal and interest on the
expiration date. The Company accrued interest of RMB93,525, which was not paid yet as of
31 December 2016.
On 30 August 2016, The Holding entrusted Masteel Financial to provide the Company
a short term loan of RMB40,000,000 with the annual interest rate of 4.35%, and repay
the principal and interest on the expiration date. The Company accrued interest of
RMB594,500, which was not paid yet as of 31 December 2016.

Notes to Financial Statements (Continued)
Maanshan Iron & Steel Company Limited2016 Annual Report
260
X. RELATED PARTIES AND RELATED PARTY TRANSACTIONS (CONTINUED)
5. SIGNIFICANT TRANSACTIONS CARRIED OUT BETWEEN THE GROUP AND ITS RELATED PARTIES (CONTINUED)
(22) Remuneration of key management
The total amount of key management remuneration (including forms of cash, benefits
in kind and others) totally amounted to RMB2,641,209 during the current year (2015:
RMB2,254,598), which excluded the remuneration paid to independent directors, and
independent supervisors.
(23) Directors’ and supervisors’ emoluments*
2016 2015
Fee 447,368 447,368
Other emoluments:
Salaries, allowances and benefits in kind 572,000 652,142
Performance-related bonuses 813,206 560,962
Pension scheme contributions 3,930 25,676
1,389,136 1,238,780
1,836,504 1,686,148

Maanshan Iron & Steel Company Limited2016 Annual Report
261
X. RELATED PARTIES AND RELATED PARTY TRANSACTIONS (CONTINUED)
5. SIGNIFICANT TRANSACTIONS CARRIED OUT BETWEEN THE GROUP AND ITS RELATED PARTIES (CONTINUED)
(23) Directors’ and supervisors’ emoluments* (continued)
(i) Independent directors and independent supervisors
The fees paid to independent directors and independent supervisors during the
year were as follows:
2016 2015
Independent directors
Mr. Qin Tongzhou 100,000 100,000
Ms. Yang Yada 100,000 100,000
Mr. Liu Fangduan 100,000 100,000
300,000 300,000
Independent supervisors
Mr. Wong Chun Wa 73,684 73,684
Mr. Su Yong 73,684 73,684
147,368 147,368
447,368 447,368
There was no other emoluments except above fee paid to the independent
directors and independent supervisors during the year (2015: Nil).

Notes to Financial Statements (Continued)
Maanshan Iron & Steel Company Limited2016 Annual Report
262
X. RELATED PARTIES AND RELATED PARTY TRANSACTIONS (CONTINUED)
5. SIGNIFICANT TRANSACTIONS CARRIED OUT BETWEEN THE GROUP AND ITS RELATED PARTIES (CONTINUED)
(23) Directors’ and supervisors’ emoluments* (continued)
(ii) Non-independent directors and non-independent supervisors
Fee
Salaries,
allowances
and benefits in
kind
Performance-
related
bonuses
Pension
scheme
contributions
Total
remuneration
2016
Executive directors
Mr. Ding Yi (iii) – – – – –
Mr. Qian Haifan – 240,000 320,000 1,310 561,310
– 240,000 320,000 1,310 561,310
Non-executive
directors
Mr. Su Shihuai (iii) – – – – –
Mr. Ren Tianbao (i) – – – – –
– – – – –
Supervisors
Mr. Zhang Xiaofeng – 240,000 320,000 1,310 561,310
Mr. Fang Jinrong (iii) – – – – –
Mr. Yan Kailong – 92,000 173,206 1,310 266,516
– 332,000 493,206 2,620 827,826
– 572,000 813,206 3,930 1,389,136

Maanshan Iron & Steel Company Limited2016 Annual Report
263
X. RELATED PARTIES AND RELATED PARTY TRANSACTIONS (CONTINUED)
5. SIGNIFICANT TRANSACTIONS CARRIED OUT BETWEEN THE GROUP AND ITS RELATED PARTIES (CONTINUED)
(23) Directors’ and supervisors’ emoluments* (continued)
(ii) Non-independent directors and non-independent supervisors (continued)
Fee
Salaries,
allowances and
benefits in kind
Performance-
related bonuses
Pension scheme
contributions
Total
remuneration
2015
Executive director
Mr. Ding Yi (iii) – – – – –
Mr. Qian Haifan – 240,052 192,042 7,515 439,609
Mr. Ren Tianbao (i) – 80,017 61,550 3,131 144,698
– 320,069 253,592 10,646 584,307
Non-executive
directors
Mr. Su Shihuai (iii) – – – – –
– – – – –
Supervisors
Mr. Zhang Xiaofeng – 240,052 192,042 7,515 439,609
Ms. Yan Taixia (ii) – 85,021 105,783 6,889 197,693
Mr. Fang Jinrong (iii) – – – – –
Mr. Yan Kailong – 7,000 9,545 626 17,171
– 332,073 307,370 15,030 654,473
– 652,142 560,962 25,676 1,238,780

Notes to Financial Statements (Continued)
Maanshan Iron & Steel Company Limited2016 Annual Report
264
X. RELATED PARTIES AND RELATED PARTY TRANSACTIONS (CONTINUED)
5. SIGNIFICANT TRANSACTIONS CARRIED OUT BETWEEN THE GROUP AND ITS RELATED PARTIES (CONTINUED)
(23) Directors’ and supervisors’ emoluments* (continued)
(ii) Non-independent directors and non-independent supervisors (continued)
(i) Appointed as a non-executive director since 11 May 2015 instead of an executive
director.
(ii) Resigned from the supervisor position since 1 December 2015.
(iii) In 2015 and 2016, the remuneration of Mr. Ding Yi, Mr. Su Shihuai and Mr. Fang
Jinrong was paid by the Holding, rather than the Company.
There was no arrangement under which an executive director or a supervisor waived or
agreed to waive any remuneration during the year (2015: Nil).
(24) Five highest paid individuals*
The two highest paid employees during the year were director and supervisor (2015:
two), details of whose remuneration are stated in Note X 5 (23) above. Details of
the remuneration of the remaining three highest paid employees (non-director, non-
supervisor) in 2016 are as follows:
2016 2015
The Group
Salaries, allowances and benefits in kind 535,000 492,107
Performance-related bonuses 713,144 401,653
Pension scheme contributions 3,930 18,161
1,252,074 911,921
In 2016, the remuneration of the remaining three non-director and non-supervisor, as the
highest paid employees, fell within the band of nil to HKD1,000,000.
(25) The Group had not obtained any long-term entrusted loans from the Holding in 2016
(2015: Nil).

Maanshan Iron & Steel Company Limited2016 Annual Report
265
X. RELATED PARTIES AND RELATED PARTY TRANSACTIONS (CONTINUED)
5. SIGNIFICANT TRANSACTIONS CARRIED OUT BETWEEN THE GROUP AND ITS RELATED PARTIES (CONTINUED)
(26) According to the financial service agreement signed by Masteel Financial and the
Holding on 22 December 2015, Masteel Financial provides financing services and
deposit transactions to the Group and its subsidiaries, and from 1 January 2016 to 31
December 2016, the highest daily outstanding loan should be less than RMB500 million,
other financial service charge should be less than RMB50 million. The annual cap was
the highest demand for daily deposits, which was decided according to the Holding
and its affiliates’ expectations of the capital and operational requirement. In 2016, the
highest daily deposit balance was RMB4.35 billion (2015: RMB3.32 billion); the highest
average daily deposit balance on a monthly basis was RMB3.63 billion (2015: RMB2.3
billion); the highest daily loan balance was RMB0.498 billion (2015: RMB0.575 billion);
the highest average daily loan balance on a monthly basis was RMB0.496 billion (2015:
RMB0.573 billion).
(27) Ma Steel (HK), a subsidiary of the Group, signed the “Agreement on equity interest
transfer of Anhui Masteel Stereoscopic Auto-parking Equipments Company Limited” with
Magang (Group) Investment Co., Ltd. in April 2016, pursuant to which Ma Steel (HK)
would transfer the 8.9367% equity interest of Masteel Auto Parking to Magang (Group)
investment Co., Ltd. at the consideration of RMB6,232,741 based on the result of equity
valuation of Masteel Auto Parking by Anhui Guoxin Capital Valuation Limited.
The directors believed that the above transactions of from (1) to (9), (20) and (21) above
were in the ordinary course of business of the Group.
* The related party transactions disclosed from (1) to (9), (25) and (26) above constituted
connected transactions or continuing connected transactions which were defined in
Chapter 14A of the Hong Kong Stock Exchange’s Listing Rules.

Notes to Financial Statements (Continued)
Maanshan Iron & Steel Company Limited2016 Annual Report
266
X. RELATED PARTIES AND RELATED PARTY TRANSACTIONS (CONTINUED)
6. RECEIVABLES FROM/PAYABLES TO RELATED PARTIES
31 December
2016
31 December
2015
Trade receivables:
The Holding and its subsidiaries
The Holding – 1,347,893
Maanshan Jiahua Commodity Concrete Co., Ltd. 5,212,842 5,081,610
Masteel Heavy Machinery Manufacturing Co., Ltd. 8,234,542 3,073,274
Ma Steel Powder Metallurgy Co., Ltd. 10,355,549 1,278,576
Anhui Masteel Luo He Mining Co., Ltd. 3,458,390 –
Masteel Engineering Technology (Group) Co., Ltd. 12,304,092 3,605,160
Others entities controlled by the Holding 2,986,118 958,486
42,551,533 15,344,999
Joint venture of the Group
BOC-Ma Steel 24,738,742 –
24,738,742 –

Maanshan Iron & Steel Company Limited2016 Annual Report
267
31 December
2016
31 December
2015
Prepayments:
The Holding and its subsidiaries
The Holding 28,164 –
Ma Steel International Trade and Economic Co., Ltd. 25,316,196 39,493,238
Others entities controlled by the Holding 313,060 100
25,657,420 39,493,338
Associate of the Group
Henan JinMa Energy 100,000,000 –
100,000,000 –
Other receivables:
The Holding and its subsidiaries
Masteel Engineering Technology (Group) Co., Ltd. 4,000 –
Masteel Automobile Transportation Service Co., Ltd. 323 –
Masteel Heavy Machinery Manufacturing Co., Ltd. – 15,900
Masteel Refractory Materials Co., Ltd. – 66,886
4,323 82,786
X. RELATED PARTIES AND RELATED PARTY TRANSACTIONS (CONTINUED)
6. RECEIVABLES FROM/PAYABLES TO RELATED PARTIES (CONTINUED)

Notes to Financial Statements (Continued)
Maanshan Iron & Steel Company Limited2016 Annual Report
268
31 December
2016
31 December
2015
Short-term loans:
The Holding and its subsidiaries
The Holding 40,000,000 –
Anhui Zhonglian Shipping Co., Ltd. 70,000,000 110,000,000
Maanshan Masteel Surface Engineering Technology
Co., Ltd. 40,000,000 20,000,000
150,000,000 130,000,000
Bills receivable:
The Holding and its subsidiaries
Maanshan Gang Chen Industry Co., Ltd. 897,719 58,237,357
Anhui BRC & Masteel Weldmesh Co., Ltd. 1,965,529 –
Xinchuang Economize Resource – 4,382,352
Masteel Heavy Machinery Manufacturing Co., Ltd. 100,000 100,000
Masteel Engineering Technology (Group) Co., Ltd. – 7,000,000
2,963,248 69,719,709
X. RELATED PARTIES AND RELATED PARTY TRANSACTIONS (CONTINUED)
6. RECEIVABLES FROM/PAYABLES TO RELATED PARTIES (CONTINUED)
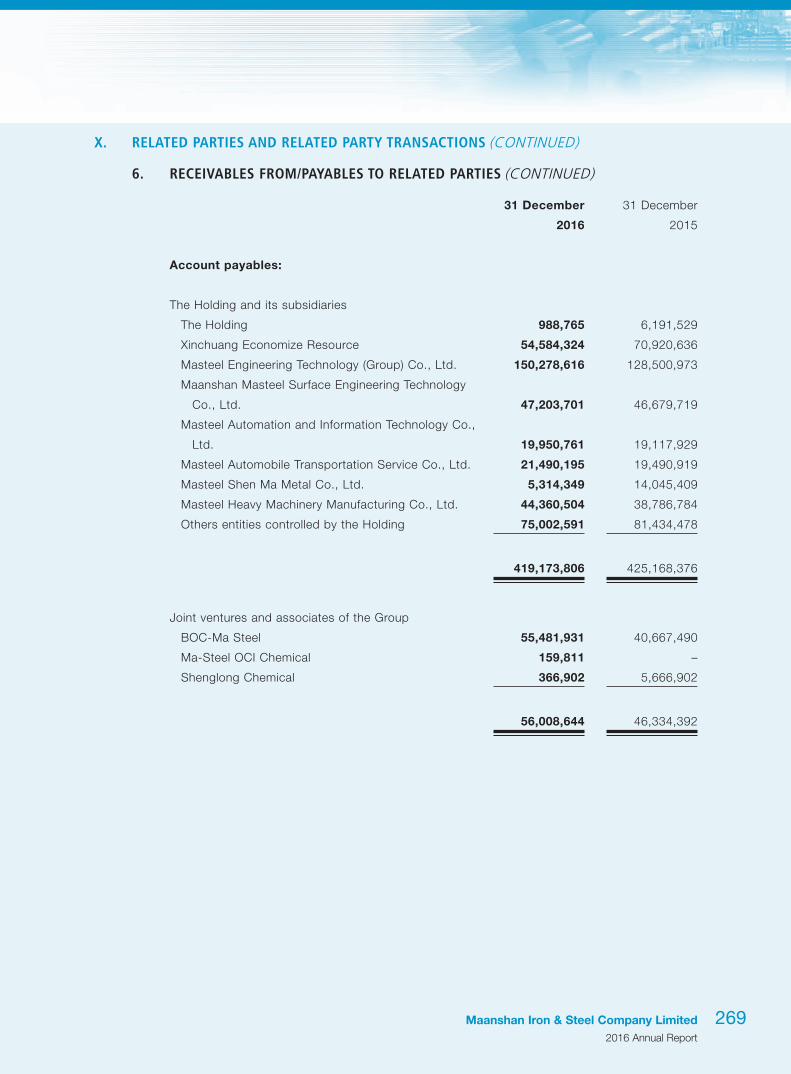
Maanshan Iron & Steel Company Limited2016 Annual Report
269
31 December
2016
31 December
2015
Account payables:
The Holding and its subsidiaries
The Holding 988,765 6,191,529
Xinchuang Economize Resource 54,584,324 70,920,636
Masteel Engineering Technology (Group) Co., Ltd. 150,278,616 128,500,973
Maanshan Masteel Surface Engineering Technology
Co., Ltd. 47,203,701 46,679,719
Masteel Automation and Information Technology Co.,
Ltd. 19,950,761 19,117,929
Masteel Automobile Transportation Service Co., Ltd. 21,490,195 19,490,919
Masteel Shen Ma Metal Co., Ltd. 5,314,349 14,045,409
Masteel Heavy Machinery Manufacturing Co., Ltd. 44,360,504 38,786,784
Others entities controlled by the Holding 75,002,591 81,434,478
419,173,806 425,168,376
Joint ventures and associates of the Group
BOC-Ma Steel 55,481,931 40,667,490
Ma-Steel OCI Chemical 159,811 –
Shenglong Chemical 366,902 5,666,902
56,008,644 46,334,392
X. RELATED PARTIES AND RELATED PARTY TRANSACTIONS (CONTINUED)
6. RECEIVABLES FROM/PAYABLES TO RELATED PARTIES (CONTINUED)
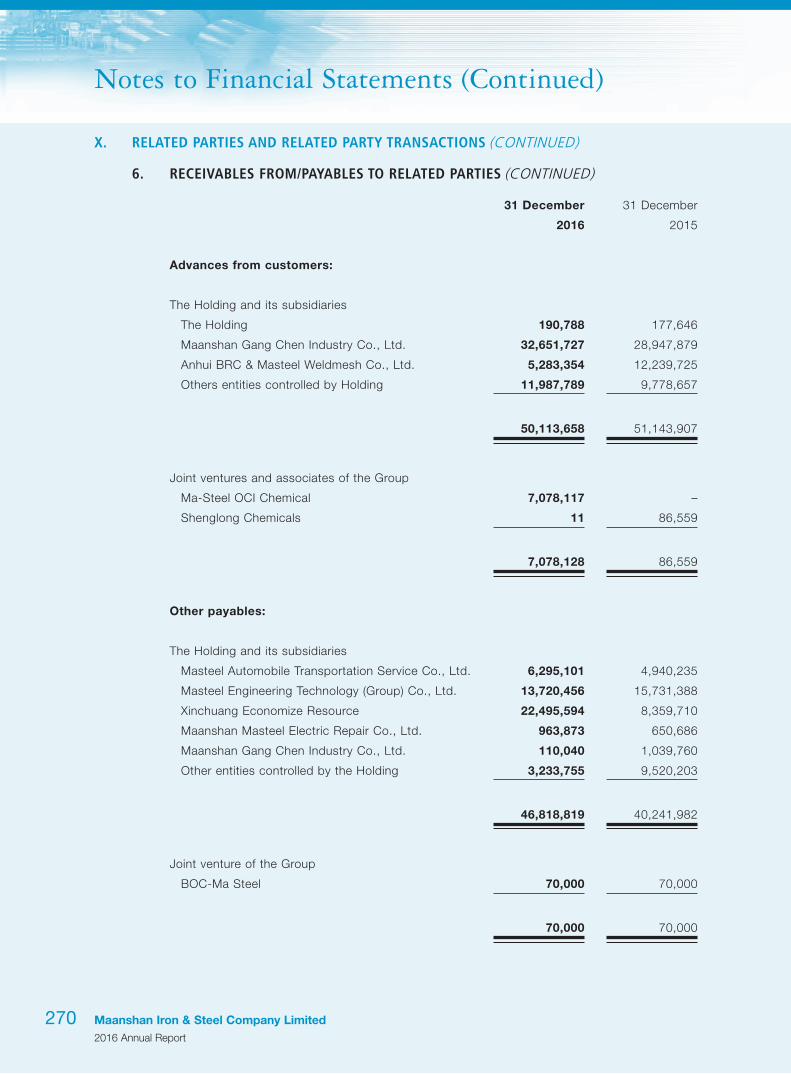
Notes to Financial Statements (Continued)
Maanshan Iron & Steel Company Limited2016 Annual Report
270
31 December
2016
31 December
2015
Advances from customers:
The Holding and its subsidiaries
The Holding 190,788 177,646
Maanshan Gang Chen Industry Co., Ltd. 32,651,727 28,947,879
Anhui BRC & Masteel Weldmesh Co., Ltd. 5,283,354 12,239,725
Others entities controlled by Holding 11,987,789 9,778,657
50,113,658 51,143,907
Joint ventures and associates of the Group
Ma-Steel OCI Chemical 7,078,117 –
Shenglong Chemicals 11 86,559
7,078,128 86,559
Other payables:
The Holding and its subsidiaries
Masteel Automobile Transportation Service Co., Ltd. 6,295,101 4,940,235
Masteel Engineering Technology (Group) Co., Ltd. 13,720,456 15,731,388
Xinchuang Economize Resource 22,495,594 8,359,710
Maanshan Masteel Electric Repair Co., Ltd. 963,873 650,686
Maanshan Gang Chen Industry Co., Ltd. 110,040 1,039,760
Other entities controlled by the Holding 3,233,755 9,520,203
46,818,819 40,241,982
Joint venture of the Group
BOC-Ma Steel 70,000 70,000
70,000 70,000
X. RELATED PARTIES AND RELATED PARTY TRANSACTIONS (CONTINUED)
6. RECEIVABLES FROM/PAYABLES TO RELATED PARTIES (CONTINUED)

Maanshan Iron & Steel Company Limited2016 Annual Report
271
31 December
2016
31 December
2015
Loans and advances to customers:
The Holding and its subsidiaries
The Holding 16,698,711 38,000,000
Anhui Masteel Luo He Mining Co., Ltd. 112,224,379 139,973,938
Anhui BRC & Masteel Weldmesh Co., Ltd. 31,811,230 13,779,345
Ma Steel International Trade and Economic Co., Ltd. 50,982,046 61,019,697
Maanshan Iron & Steel Group Mining Co., Ltd. 1,193,527,145 251,250,000
Other entities controlled by the Holding 136,864,275 64,833,022
1,542,107,786 568,856,002
Customer deposits:
The Holding and its subsidiaries
The Holding 1,830,191,701 1,003,221,893
Masteel Engineering Technology (Group) Co., Ltd. 273,754,756 160,410,862
Maanshan Gang Chen Industry Co., Ltd. 19,128,371 20,797,705
An Hui Masteel Zhang Zhuang Mining Co., Ltd. 252,042,388 93,901,242
Ma Steel International Trade and Economic Co., Ltd. 304,878,663 64,550,368
Masteel Group Kang Tai Land Development Co., Ltd. 49,183,147 111,461,440
Masteel Heavy Machinery Manufacturing Co., Ltd. 94,000,665 79,758,924
Other entities controlled by the Holding 621,115,481 215,267,964
3,444,295,172 1,749,370,398
The fee charged by Masteel Financial for the financing services and deposit transactions
provided to the Holding and its subsidiaries was determined based on negotiation between the
two parties.
* As of 31 December 2016, in current assets and current liabilities, except for the interests charge
for the deposit and loans provided by Masteel Financial, all these receivables and payables had no
interest, no pledge and would be paid in the future.
X. RELATED PARTIES AND RELATED PARTY TRANSACTIONS (CONTINUED)
6. RECEIVABLES FROM/PAYABLES TO RELATED PARTIES (CONTINUED)

Notes to Financial Statements (Continued)
Maanshan Iron & Steel Company Limited2016 Annual Report
272
X. RELATED PARTIES AND RELATED PARTY TRANSACTIONS (CONTINUED)
7. THE COMMITMENT OF THE GROUP WITH RELATED PARTIES
As of 31 December 2016, the Company had made an investment commitment to Mascometal,
which was a Joint Venture, amounting to EUR16.07 million.
XI. COMMITMENTS AND CONTINGENCIES
1. SIGNIFICANT COMMITMENTS
31 December
2016
31 December
2015
Contracted, but not provided for
Capital commitments 2,419,658,635 9,067,160,505
Investment commitments 155,870,276 60,891,437
2,575,528,911 9,128,051,942
Unrecognised commitments related to investments in joint ventures are included in Note X.7.
2. CONTINGENCIES
Difference of corporate income tax
The State Administration of Taxation issued “The notice of income tax collection and
management on Shanghai Petrochemical Company Limited and other nine companies listed
overseas corporation” (Guo Shui Han [2007] No. 664) in June 2007, with stated claims that the
relevant local tax bureaus must correct immediately the expired tax incentives of the nine Hong
Kong listed companies. The income tax difference between the results of the previously expired
preferential rate and the applicable rate should be treated in accordance with the relevant
provisions of the “People’s Republic of China Administration of Tax Collection Law”.
The Company was one of the nine companies mentioned above and used a 15% preferential
tax rate in the previous year. After understanding the above information, the Company and the
tax authorities issued a comprehensive communication and according to the tax authorities, the
applicable corporate income tax rate in 2007 was 33%, which was adjusted from the original
15%. The Company had not been recovered prior year income tax differences.
Based on the comprehensive communication between the Company and the tax authorities,
it is uncertain whether the tax authorities will recover the difference between the previous
year’s income tax at this stage, and the final result of this matter cannot be estimated reliably.
Therefore, the financial statements have not made any preparation or adjustments related to
additional tax, tax credits, deferred tax, penalties and interest.

Maanshan Iron & Steel Company Limited2016 Annual Report
273
XI. COMMITMENTS AND CONTINGENCIES (CONTINUED)
2. CONTINGENCIES (CONTINUED)
Pending litigation
As of 31 December 2016, the significant pending litigation of the Group and the Company is as
follows:
Industrial and Commercial Bank of China Co., Ltd. Hefei Heping Road Branch sued the
Company for four financial loan contract dispute cases, and the relevant claim amounts were
RMB11,348,995, RMB6,317,966, RMB4,777,092 and RMB3,860,989. The four cases were
accepted and heard by the Hefei Yaohai District People’s Court, which are currently pending for
judicial decisions by the court.
XII. POST BALANCE SHEET EVENTS
On 14 February 2017, the Board of Directors of the Company approved shutting down and
permanently sealing up a converter (of which the nominal capacity was 40 tons and the annual output
of crude steel was 640 thousand tons) and a blast furnace (of which the volume was 500 cubic meters
and the annual output of pig iron was 620 thousand tons).
As of the date of approval of the financial statements, save as disclosed above, the Group had no
other disclosure of events after the balance sheet date.
XIII. OTHER SIGNIFICANT EVENTS
1. LEASES
As lessor
The Group had leased certain of its investment properties under operating lease arrangements
ranging from one to eighteen years. The periodic rental was fixed during the operating lease
periods.
31 December
2016
31 December
2015
Remaining lease period
Within 1 year, inclusive 1,301,120 1,373,707
1 to 2 years, inclusive 1,250,000 1,250,000
2 to 3 years, inclusive 1,250,000 1,250,000
Over 3 years 3,907,534 5,157,534
7,708,654 9,031,241

Notes to Financial Statements (Continued)
Maanshan Iron & Steel Company Limited2016 Annual Report
274
XIII. OTHER SIGNIFICANT EVENTS (CONTINUED)
2. OPERATING SEGMENT INFORMATION
Operating segments
The Group divides the operation services into two operating segments which are determined
based on the internal organisation structure, management requirements and internal reporting
system:
‧ Production and sale of iron and steel products and related by-products: the Company
and its subsidiaries except for Masteel Financial
‧ Financial service: Masteel Financial
The Group did not consider financial service as an individual reportable segment, as Masteel
Financial mainly offers financial service to internal companies. Therefore, the Group focuses on
the production and sale of iron and steel products and by-products, and it is unnecessary for
the Group to disclose more detailed information.
Other information
Product and service information
External principal operating income
2016 2015
Sale of steel products 45,084,086,119 41,911,446,585
Sale of steel billets and pig iron 1,011,424,422 941,516,355
Sale of coke by-products 276,107,588 423,297,920
Others 952,167,785 732,326,675
47,323,785,914 44,008,587,535

Maanshan Iron & Steel Company Limited2016 Annual Report
275
XIII. OTHER SIGNIFICANT EVENTS (CONTINUED)
2. OPERATING SEGMENT INFORMATION (CONTINUED)
Other information (continued)
Geographical information
External principal operating income
2016 2015
The PRC 43,649,644,385 40,175,752,326
Overseas 3,674,141,529 3,832,835,209
47,323,785,914 44,008,587,535
Non-current assets
31 December
2016
31 December
2015
The PRC 40,595,765,043 41,601,037,262
Overseas 305,407,308 233,704,952
40,901,172,351 41,834,742,214
The non-current asset information above is based on the locations of the assets and excludes
financial assets and deferred tax assets.
Major customer information
The Group had not placed reliance on any single external customer which accounted for 10%
or more of its revenue.
3. OTHER FINANCIAL INFORMATION*
Group Company
31 December
2016
31 December
2015
31 December
2016
31 December
2015
Current assets 24,418,315,198 20,160,381,786 17,688,470,337 15,379,481,751
Less: Current liabilities 33,550,453,810 29,731,298,424 24,425,328,412 22,270,113,406
Net current liabilities (9,132,138,612) (9,570,916,638) (6,736,858,075) (6,890,631,655)

Notes to Financial Statements (Continued)
Maanshan Iron & Steel Company Limited2016 Annual Report
276
XIII. OTHER SIGNIFICANT EVENTS (CONTINUED)
3. OTHER FINANCIAL INFORMATION* (CONTINUED)
Group Company
31 December
2016
31 December
2015
31 December
2016
31 December
2015
Total assets 66,245,531,030 62,454,465,955 55,139,219,589 53,677,928,665
Less: Current liabilities 33,550,453,810 29,731,298,424 24,425,328,412 22,270,113,406
Total assets less current liabilities 32,695,077,220 32,723,167,531 30,713,891,177 31,407,815,259
4. EMPLOYEE COSTS (EXCLUDING DIRECTORS’ AND SUPERVISORS’ REMUNERATION) (NOTE X.5(23))*
2016 2015
Wages and salaries 2,587,028,878 2,420,410,656
Welfare 679,193,430 746,703,446
Pension scheme contributions (i) 544,796,605 714,783,936
Employee termination benefits 347,468,731 –
4,158,487,644 3,881,898,038
(i) As of 31 December 2016 and 31 December 2015, no contribution was capitalised or waived to
reduce the Group’s liability to pay pension scheme contributions in the future.

Maanshan Iron & Steel Company Limited2016 Annual Report
277
XIV. MAJOR NOTES TO COMPANY FINANCIAL STATEMENTS
1. TRADE RECEIVABLES
The Company’s trade receivables were interest-free with normal credit terms of 30 to 90 days.
An ageing analysis of trade receivables is as follows:
31 December
2016
31 December
2015
Within one year 1,782,014,214 1,474,257,377
One to two years 125,625,110 71,144,875
Two to three years 27,273,361 23,011,493
Over three years 31,693,096 8,743,458
1,966,605,781 1,577,157,203
Less: Provisions for bad debts 13,382,203 13,382,203
1,953,223,578 1,563,775,000
The trade receivable balances are analysed as follows:
31 December 2016 31 December 2015
Book value Provision for bad debts Book value Provision for bad debtsAmount Ratio Amount Ratio Amount Ratio Amount Ratio
(%) (%) (%) (%)
Individually significant and assessed for impairment individually 1,952,062,818 99 (6,927,040) – 1,562,158,216 99 (6,927,040) –
Other insignificant but assessed for impairment individually 14,542,963 1 (6,455,163) 44 14,998,987 1 (6,455,163) 43
1,966,605,781 100 (13,382,203) 1,577,157,203 100 (13,382,203)
The movements of provision for bad debts against trade receivables for the year are disclosed
in Note XIV.5.

Notes to Financial Statements (Continued)
Maanshan Iron & Steel Company Limited2016 Annual Report
278
XIV. MAJOR NOTES TO COMPANY FINANCIAL STATEMENTS (CONTINUED)
1. TRADE RECEIVABLES (CONTINUED)
As of 31 December 2016, those individually significant and assessed for impairment individually
were as follows:
Book value
Provision for
bad debts Ratio (%) Reason
Company 1 694,446,823 – – /
Company 2 214,069,244 – – /
Company 3 117,299,709 – – /
Company 4 92,487,872 – – /
Company 5 90,266,047 – – /
Company 6 64,514,240 – – /
Company 7 61,374,572 – – /
Company 8 55,798,074 – – /
Company 9 48,312,244 – – /
Company 10 35,735,250 – – /
Company 11 29,117,360 – – /
Company 12 24,738,742 – – /
Company 13 24,563,898 – – /
Company 14 21,908,132 – – /
Company 15 21,573,834 – – /
Others 355,856,777 (6,927,040) 2 Note1
1,952,062,818 (6,927,040) –
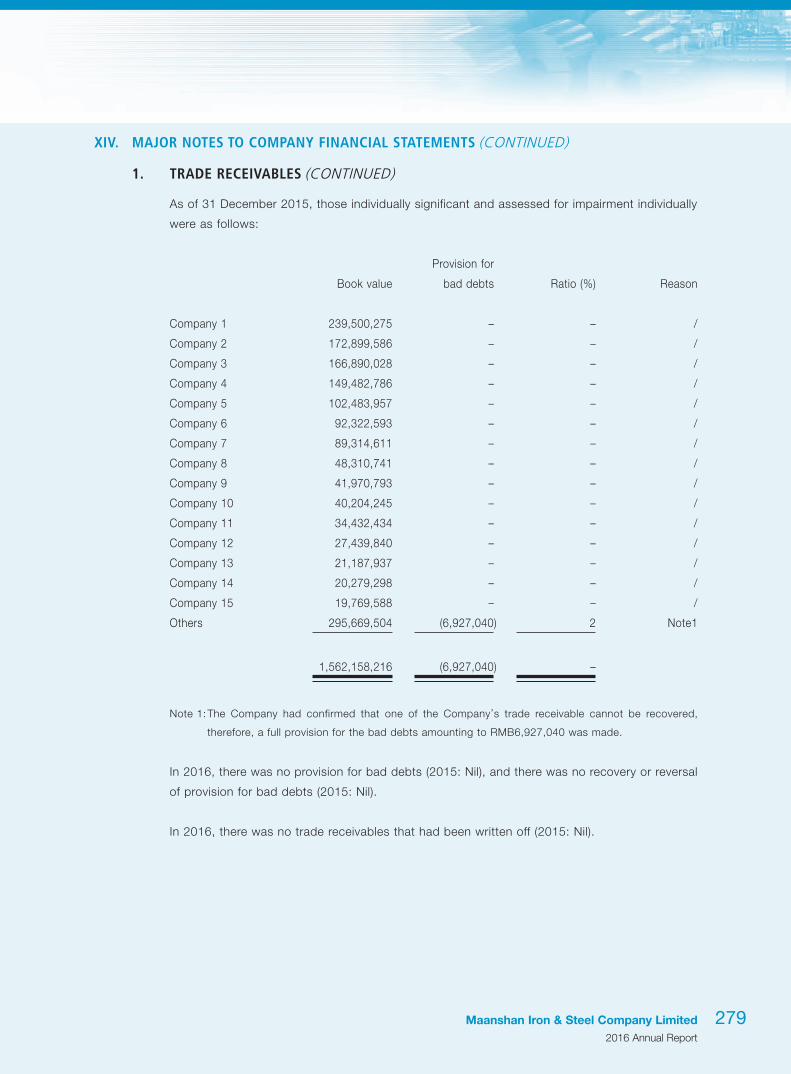
Maanshan Iron & Steel Company Limited2016 Annual Report
279
XIV. MAJOR NOTES TO COMPANY FINANCIAL STATEMENTS (CONTINUED)
1. TRADE RECEIVABLES (CONTINUED)
As of 31 December 2015, those individually significant and assessed for impairment individually
were as follows:
Book value
Provision for
bad debts Ratio (%) Reason
Company 1 239,500,275 – – /
Company 2 172,899,586 – – /
Company 3 166,890,028 – – /
Company 4 149,482,786 – – /
Company 5 102,483,957 – – /
Company 6 92,322,593 – – /
Company 7 89,314,611 – – /
Company 8 48,310,741 – – /
Company 9 41,970,793 – – /
Company 10 40,204,245 – – /
Company 11 34,432,434 – – /
Company 12 27,439,840 – – /
Company 13 21,187,937 – – /
Company 14 20,279,298 – – /
Company 15 19,769,588 – – /
Others 295,669,504 (6,927,040) 2 Note1
1,562,158,216 (6,927,040) –
Note 1: The Company had confirmed that one of the Company’s trade receivable cannot be recovered,
therefore, a full provision for the bad debts amounting to RMB6,927,040 was made.
In 2016, there was no provision for bad debts (2015: Nil), and there was no recovery or reversal
of provision for bad debts (2015: Nil).
In 2016, there was no trade receivables that had been written off (2015: Nil).

Notes to Financial Statements (Continued)
Maanshan Iron & Steel Company Limited2016 Annual Report
280
XIV. MAJOR NOTES TO COMPANY FINANCIAL STATEMENTS (CONTINUED)
1. TRADE RECEIVABLES (CONTINUED)
The top five trade receivables classified by debtor:
31 December 2016
Relationship
with the
Company Ending balance Aging
Percentage of
trade receivables
Ending
balance of
provision
Company 1 Subsidiary 694,446,823 Within one year 36% –
Company 2 Subsidiary 214,069,244 Within one year 11% –
Company 3 Third party 117,299,709 Within one year 6% –
Company 4 Subsidiary 92,487,872 One to two years 5% –
Company 5 Subsidiary 90,266,047 Within one year 5% –
1,208,569,695 63%
31 December 2015
Relationship
with the
Company Ending Balance Aging
Percentage of trade
receivables
Ending
balance of
provision
Company 1 Third party 172,899,586 Within one year 11% –
Company 2 Third party 48,310,741 Within two years 3% –
Company 3 Third party 41,970,793 Within one year 3% –
Company 4 Third party 34,432,434 Within two years 2% –
Company 5 Third party 20,279,298 Two to three years 1% –
317,892,852 20%

Maanshan Iron & Steel Company Limited2016 Annual Report
281
XIV. MAJOR NOTES TO COMPANY FINANCIAL STATEMENTS (CONTINUED)
2. OTHER RECEIVABLES
An ageing analysis of the other receivables is as follows:
31 December
2016
31 December
2015
Within one year 39,486,862 204,859,233
One to two years 615,777 1,128,177
Two to three years 1,093,937 3,110,391
Over three years 422,691,173 457,160,989
463,887,749 666,258,790
Less: Provision for bad debts 422,847,240 420,160,989
41,040,509 246,097,801
The movements of provisions for bad debts against other receivables for the year are disclosed
in Note XIV.5.
The other receivable balances are analysed as follows:
31 December 2016 31 December 2015
Book value Provision for bad debts Book value Provision for bad debtsAmount Ratio Amount Ratio Amount Ratio Amount Ratio
(%) (%) (%) (%)
Individually significant and assessed for impairment individually 452,496,848 98 (418,316,326) 92 655,815,368 98 (415,630,075) 63
Individually insignificant but assessed for impairment individually 11,390,901 2 (4,530,914) 40 10,443,422 2 (4,530,914) 43
463,887,749 100 (422,847,240) 666,258,790 100 (420,160,989)

Notes to Financial Statements (Continued)
Maanshan Iron & Steel Company Limited2016 Annual Report
282
XIV. MAJOR NOTES TO COMPANY FINANCIAL STATEMENTS (CONTINUED)
2. OTHER RECEIVABLES (CONTINUED)
As of 31 December 2016, those individually significant and assessed for impairment individually
were as follows:
Book value
Provision for
bad debts Ratio (%) Reason
Company 1 132,058,434 (132,058,434) 100 Note
Company 2 127,685,367 (127,685,367) 100 Note
Company 3 60,939,960 (60,939,960) 100 Note
Company 4 57,988,833 (57,988,833) 100 Note
Company 5 37,243,732 (37,243,732) 100 Note
Company 6 2,400,000 (2,400,000) 100 Note
Others 34,180,522 – – /
452,496,848 (418,316,326) 92
As of 31 December 2015, those individually significant and assessed for impairment individually
were as follows:
Book value
Provision for
bad debts Ratio (%) Reason
Company 1 60,939,960 (60,939,960) 100 Note
Company 2 127,685,367 (127,685,367) 100 Note
Company 3 37,243,732 (37,243,732) 100 Note
Company 4 132,058,434 (132,058,434) 100 Note
Company 5 92,302,582 (55,302,582) 60 Note
Company 6 2,400,000 (2,400,000) 100 Note
Others 203,185,293 – – /
655,815,368 (415,630,075) 63
Note: Provision for bad debts were made as a result of these long-term uncollected other receivables
were less expected to recover.
At the end of 2016, provision for bad debts of expected uncollected other receivables was
RMB2,686,251 (2015: RMB35,000,000), and there was no recovery or reversal of provision for
bad debts (2015: RMB128,000).

Maanshan Iron & Steel Company Limited2016 Annual Report
283
XIV. MAJOR NOTES TO COMPANY FINANCIAL STATEMENTS (CONTINUED)
2. OTHER RECEIVABLES (CONTINUED)
In 2016, there were no other receivables that had been written off (2015: Nil).
Other receivables classified by nature:
31 December
2016
31 December
2015
Prepayment for trading 415,916,327 594,230,077
Guarantee for steel futures 28,061,996 42,768,562
Prepayment of custom duties and VAT 11,167,848 13,022,912
Others 8,741,578 16,237,239
Provision for bad debts (422,847,240) (420,160,989)
41,040,509 246,097,801
As of 31 December 2016, the top five largest other receivables were as follows:
Balance
Ratio to
total other
receivables Nature Ageing
Balance of bad
debts
(%)
Company 1 132,058,434 28 i More than 3 years 132,058,434
Company 2 127,685,367 28 i More than 3 years 127,685,367
Company 3 60,939,960 13 i More than 3 years 60,939,960
Company 4 57,988,833 13 i More than 3 years 57,988,833
Company 5 37,243,732 8 i More than 3 years 37,243,732
415,916,326 90 415,916,326

Notes to Financial Statements (Continued)
Maanshan Iron & Steel Company Limited2016 Annual Report
284
XIV. MAJOR NOTES TO COMPANY FINANCIAL STATEMENTS (CONTINUED)
2. OTHER RECEIVABLES (CONTINUED)
As of 31 December 2015, the top five largest other receivables were as follows:
Balance
Ratio to
total other
receivables Nature Ageing
Balance of bad
debts
(%)
Company 1 132,058,434 20 i More than 3 years 132,058,434
Company 2 127,685,367 19 i More than 3 years 127,685,367
Company 3 92,302,582 14 i More than 3 years 55,302,582
Company 4 60,939,960 9 i More than 3 years 60,939,960
Company 5 37,243,732 6 i More than 3 years 37,243,732
450,230,075 68 413,230,075
i: The nature of the other receivables was prepayment for trading.
3. INVENTORIES
31 December 2016 31 December 2015
Balance
Provision for
impairment Carrying amount Balance
Provision for
impairment Carrying amount
Raw materials 2,924,952,493 (59,447,545) 2,865,504,948 1,568,921,850 (333,960,186) 1,234,961,664
Work in progress 684,820,099 (1,712,855) 683,107,244 772,043,075 (86,639,975) 685,403,100
Finished goods 2,484,308,810 (14,372,398) 2,469,936,412 1,285,841,324 (170,751,556) 1,115,089,768
Spare parts 1,215,968,100 (97,054,300) 1,118,913,800 1,372,406,287 (59,572,961) 1,312,833,326
Others 233,474,649 – 233,474,649 – – –
7,543,524,151 (172,587,098) 7,370,937,053 4,999,212,536 (650,924,678) 4,348,287,858
The movements of impairment provision against inventories for the year are disclosed in Note
XIV.5.
At the balance sheet date, inventories were measured at the lower of costs and net realisable
values, and provision for impairment was made for items whose costs were higher than their
net realisable values. Net realisable value is the estimated selling price under normal business
terms deducted by the estimated costs to completion, the estimated selling expenses and
related taxes. In the years of 2016 and 2015, there was no reversal of impairment provision
against inventories.

Maanshan Iron & Steel Company Limited2016 Annual Report
285
XIV. MAJOR NOTES TO COMPANY FINANCIAL STATEMENTS (CONTINUED)
4. LONG TERM EQUITY INVESTMENTS
31 December
2016
31 December
2015
Long term investments under the equity method
Joint ventures (i) 372,843,538 316,570,133
Associates (i) 866,932,775 713,283,374
Long term investments under the cost method
Subsidiaries (ii) 5,972,389,974 5,860,625,890
Subtotal 7,212,166,287 6,890,479,397
Less: Provision for impairment 60,000,000 60,000,000
Total 7,152,166,287 6,830,479,397
In the opinion of the directors, there was no material restriction on the realisation of investments
as at the balance sheet date.
* The above investments in joint ventures and associates under the equity method and the
investments in subsidiaries under the cost method were all unlisted equity investments.
The movements of impairment provision for long term investments for the year are disclosed in
Note XIV.5.

Notes to Financial Statements (Continued)
Maanshan Iron & Steel Company Limited2016 Annual Report
286
XIV. MAJOR NOTES TO COMPANY FINANCIAL STATEMENTS (CONTINUED)
4. LONG TERM EQUITY INVESTMENTS (CONTINUED)
(i) Joint ventures and associates
2016
Movements during the year
Opening
balance Increase Decrease
Investment
income under
the equity
method
Other
comprehensive
income
Other equity
movement
Cash dividend
received
Provision for
impairment
Closing
balance
Impairment at
the end of the
year
Joint ventures
BOC-Ma Steel 316,030,791 – – 80,857,392 – 1,129,885 (79,000,000) – 319,018,068 –
MASTEEL-CMI 539,342 – – 2,091 – – – – 541,433 –
Mascometal (Note) – 58,171,378 (4,879,915) (7,426) – – – – 53,284,037 –
Associates
Henan JinMa Energy 241,098,393 – – 77,296,589 – 3,361,408 (25,560,000) – 296,196,390 –
Shenglong Chemical 242,402,338 – – 66,810,341 – 183,745 – – 309,396,424 –
Shanghai Iron and Steel
Electronic 26,604,521 – – 4,516,071 – – (4,000,000) – 27,120,592 –
Xinchuang Economize Resource 35,539,691 – – 3,059,233 – 5,182,037 – – 43,780,961 –
Anhui Linhuan Chemical 72,000,000 – – – – – – – 72,000,000 –
Ma-Steel OCI Chemical (Note) 95,638,431 22,513,793 – 286,184 – – – – 118,438,408 –
1,029,853,507 80,685,171 (4,879,915) 232,820,475 – 9,857,075 (108,560,000) – 1,239,776,313 –
Note: Please refer to Note V.12 for details.
2015
Movements during the year
Opening balance Increase Decrease
Investment
income under
the equity
method
Other
comprehensive
income
Other equity
movement
Cash dividend
received
Provision for
impairment Closing balance
Impairment at
the end of the
year
Joint ventures
BOC-Ma Steel 311,422,276 – – 81,325,413 – (3,216,898) (73,500,000) – 316,030,791 –
MASTEEL-CMI 542,669 – – (3,327) – – – – 539,342 –
Associates
Henan JinMa Energy (Note) 207,497,916 37,623,600 – (4,023,123) – – – – 241,098,393 –
Shenglong Chemical 245,813,223 – – (2,786,831) – (624,054) – – 242,402,338 –
Shanghai Iron and Steel
Electronic 30,977,774 – – 1,626,747 – – (6,000,000) – 26,604,521 –
Xinchuang Economize Resource 30,967,723 – – 5,055,768 – (483,800) – – 35,539,691 –
Ma-steel Rail Transportation
(Note) 171,476,241 – (165,930,369) (5,545,872) – – – – – –
Jiyuan Jinyuan Chemical (Note) 45,794,148 – (44,961,228) (832,920) – – – – – –
Anhui Linhuan Chemical (Note) 43,200,000 28,800,000 – – – – – – 72,000,000 –
Ma-Steel OCI Chemical (Note) – 95,235,280 – 403,151 – – – – 95,638,431 –
1,087,691,970 161,658,880 (210,891,597) 75,219,006 – (4,324,752) (79,500,000) – 1,029,853,507 –
Note: Please refer to Note V.12 for details.

Maanshan Iron & Steel Company Limited2016 Annual Report
287
XIV. MAJOR NOTES TO COMPANY FINANCIAL STATEMENTS (CONTINUED)
4. LONG TERM EQUITY INVESTMENTS (CONTINUED)
(ii) Subsidiaries
2016
Movements during the year
Opening balance Increase DecreaseOther equity
movementProvision for
impairment Closing balance
Impairment at the end of the
yearCash dividends
declared
New Build Masteel K. Wah. 44,443,067 – – – – 44,443,067 – –Ma Steel (Wuhu) 8,225,885 – – – – 8,225,885 – –Ma Steel (Guangzhou) 80,000,000 – – – – 80,000,000 – –Ma Steel (HK) 21,146,421 – – – – 21,146,421 – –MG Trading 1,573,766 – – – – 1,573,766 – –Holly Industrial 21,478,316 – – – – 21,478,316 – –Huayang Equipment 900,000 – – – – 900,000 – –Ma Steel (Jinhua) 90,000,000 – – – – 90,000,000 – –Ma Steel (Australia) 126,312,415 – – – – 126,312,415 – –Ma Steel (Hefei) 1,775,000,000 – – – – 1,775,000,000 – –Ma Steel (Hefei) Processing 73,200,000 – – – – 73,200,000 – –Ma Steel (Yangzhou)
Processing 116,462,300 – – – – 116,462,300 – –Wuhu Technique 106,500,000 – – – – 106,500,000 – –Masteel Scrap 100,000,000 – – – – 100,000,000 – –Masteel Shanghai Trading – – – – – – 60,000,000 –Chongqing Material 175,000,000 – – – – 175,000,000 – –Anhui Chang Jiang Iron and
Steel 1,234,444,444 – – – – 1,234,444,444 – –Masteel Financial 933,172,609 – – – – 933,172,609 – –Hefei Materials 140,000,000 – – – – 140,000,000 – –MG-VALDUNES 336,695,298 – – – – 336,695,298 – –Ma Steel Guangzhou Sales 10,000,000 – – – – 10,000,000 – –Ma Steel Hangzhou Sales 10,000,000 – – – – 10,000,000 – –Ma Steel Wuxi Sales 10,000,000 – – – – 10,000,000 – –Ma Steel Chongqing Sales 10,000,000 – – – – 10,000,000 – –Ma Steel Nanjing 10,000,000 – – – – 10,000,000 – –Ma Steel Wuhan Sales 10,000,000 – – – – 10,000,000 – –Ma Steel Shanghai Sales 10,000,000 – – – – 10,000,000 – –Ma-Steel Rail
Transportation (i) 336,021,369 60,000,000 – – – 396,021,369 – –Masteel Oubang Color-
coated 10,050,000 – – – – 10,050,000 – –Masteel America Inc. (ii) – 3,298,375 – – – 3,298,375 – –Ma Steel (Cihu) (iii) – 48,465,709 – – – 48,465,709 – –
5,800,625,890 111,764,084 – – – 5,912,389,974 60,000,000 –

Notes to Financial Statements (Continued)
Maanshan Iron & Steel Company Limited2016 Annual Report
288
XIV. MAJOR NOTES TO COMPANY FINANCIAL STATEMENTS (CONTINUED)
4. LONG TERM EQUITY INVESTMENTS (CONTINUED)
(ii) Subsidiaries (continued)
(i) The Company increased investment amounting to RMB60,000,000 in Masteel Rail
Transportation in August 2016.
(ii) The newly established subsidiaries are included in Note VI.1.
(iii) Ma Steel(Wuhu) transferred 92% of equity shares of Ma Steel(Cihu) to the Company in
December 2016. As a result, Ma Steel (Cihu) became the direct holding subsidiary of the
Company.
2015
Movements during the year
Opening balance Increase DecreaseOther equity
movementProvision for
impairment Closing balanceImpairment at the
end of the yearCash dividends
declared
New Build Masteel K. Wah. 44,443,067 – – – – 44,443,067 – –Ma Steel (Wuhu) 8,225,885 – – – – 8,225,885 – –Ma Steel (Guangzhou) 80,000,000 – – – – 80,000,000 – –Ma Steel (HK) 21,146,421 – – – – 21,146,421 – –MG Trading 1,573,766 – – – – 1,573,766 – –Holly Industrial 21,478,316 – – – – 21,478,316 – –Huayang Equipment 900,000 – – – – 900,000 – 111,032,729Ma Steel (Jinhua) 90,000,000 – – – – 90,000,000 – –Ma Steel (Australia) 126,312,415 – – – – 126,312,415 – –Ma Steel (Hefei) 1,775,000,000 – – – – 1,775,000,000 – –Ma Steel (Hefei) Processing 73,200,000 – – – – 73,200,000 – –Ma Steel (Yangzhou)
Processing 116,462,300 – – – – 116,462,300 – –Wuhu Technique 106,500,000 – – – – 106,500,000 – –Masteel Scrap 100,000,000 – – – – 100,000,000 – –Masteel Shanghai Trading – – – – – – 60,000,000 –Chongqing Material 175,000,000 – – – – 175,000,000 – –Anhui Chang Jiang Iron and
Steel 1,234,444,444 – – – – 1,234,444,444 – –Masteel Financial 933,172,609 – – – – 933,172,609 – –Hefei Materials 140,000,000 – – – – 140,000,000 – –MG-VALDUNES 336,695,298 – – – – 336,695,298 – –Ma Steel Guangzhou Sales 10,000,000 – – – – 10,000,000 – –Ma Steel Hangzhou Sales 10,000,000 – – – – 10,000,000 – –Ma Steel Wuxi Sales 10,000,000 – – – – 10,000,000 – –Ma Steel Chongqing Sales 10,000,000 – – – – 10,000,000 – –Ma Steel Nanjing 10,000,000 – – – – 10,000,000 – –Ma Steel Wuhan Sales 10,000,000 – – – – 10,000,000 – –Ma Steel Shanghai Sales 10,000,000 – – – – 10,000,000 – –Ma-Steel Rail
Transportation – 170,091,000 – 165,930,369 – 336,021,369 – –Masteel Oubang Color-
coated – 10,050,000 – – – 10,050,000 – –
5,454,554,521 180,141,000 – 165,930,369 – 5,800,625,890 60,000,000 111,032,729

Maanshan Iron & Steel Company Limited2016 Annual Report
289
XIV. MAJOR NOTES TO COMPANY FINANCIAL STATEMENTS (CONTINUED)
5. ASSET IMPAIRMENT PROVISIONS
2016
Opening balance
Increase during
the year Decrease during the year Closing balance
Reversal Write-back Write-off
Provisions for bad debts 433,543,192 2,686,251 – – – 436,229,443
Including: Trade receivables 13,382,203 – – – – 13,382,203
Other receivables 420,160,989 2,686,251 – – – 422,847,240
Provisions for inventories (i) 650,924,678 883,565,693 – (1,361,903,273) – 172,587,098
Including: Raw materials 333,960,186 410,086,420 – (684,599,061) – 59,447,545
Work in progress 86,639,975 136,107,577 – (221,034,697) – 1,712,855
Finished products 170,751,556 299,376,796 – (455,755,954) – 14,372,398
Spare parts 59,572,961 37,994,900 – (513,561) – 97,054,300
Provisions for long term investments 60,000,000 – – – – 60,000,000
Including: subsidiaries 60,000,000 – – – – 60,000,000
Impairment of fixed assets – 36,291,208 – – – 36,291,208
Including: Buildings and plant – 6,514,174 – – – 6,514,174
Machinery and
equipment – 29,777,034 – – – 29,777,034
1,144,467,870 922,543,152 – (1,361,903,273) – 705,107,749
(i) Generally, the provisions for inventories is assessed and accrued at the end of each quarter. The
provisions for inventories will be written back and credited to the cost of sales upon the sale of
corresponding inventories.

Notes to Financial Statements (Continued)
Maanshan Iron & Steel Company Limited2016 Annual Report
290
XIV. MAJOR NOTES TO COMPANY FINANCIAL STATEMENTS (CONTINUED)
5. ASSET IMPAIRMENT PROVISIONS (CONTINUED)
2015
Opening balance
Increase during
the year Decrease during the year Closing balance
Reversal Write-back Write-off
Provisions for bad debts 398,671,192 35,000,000 (128,000) – – 433,543,192
Including: Trade receivables 13,382,203 – – – – 13,382,203
Other receivables 385,288,989 35,000,000 (128,000) – – 420,160,989
Provisions for inventories (i) 179,591,702 1,204,974,141 – (733,641,165) – 650,924,678
Including: Raw materials 90,011,279 637,936,253 – (393,987,346) – 333,960,186
Work in progress 18,362,373 182,310,920 – (114,033,318) – 86,639,975
Finished products 11,186,556 384,726,968 – (225,161,968) – 170,751,556
Spare parts 60,031,494 – – (458,533) – 59,572,961
Provisions for long term investments 60,000,000 – – – – 60,000,000
Including: subsidiaries 60,000,000 – – – – 60,000,000
638,262,894 1,239,974,141 (128,000) (733,641,165) – 1,144,467,870
(i) Generally, the provisions for inventories is assessed and accrued at the end of each quarter. The
provisions for inventories will be written back and credited to the cost of sales upon the sale of
corresponding inventories.

Maanshan Iron & Steel Company Limited2016 Annual Report
291
XIV. MAJOR NOTES TO COMPANY FINANCIAL STATEMENTS (CONTINUED)
6. REVENUE AND COST OF SALES
2016 2015
Revenue Cost of sales Revenue Cost of sales
Principal operating income 40,943,233,778 36,523,573,581 35,401,618,614 35,743,470,461
Other operating income 583,380,986 571,864,795 2,111,281,835 2,510,208,378
41,526,614,764 37,095,438,376 37,512,900,449 38,253,678,839
Principal operating income is stated as follows:
2016 2015
Sale of products 41,485,223,868 37,497,876,273
Rendering of services 41,390,896 15,024,176
41,526,614,764 37,512,900,449
7 ASSET IMPAIRMENT LOSS
2016 2015
Provision for bad debts 2,686,251 34,872,000
Including: Trade receivables – –
Other receivables 2,686,251 34,872,000
Provision for inventories 883,565,693 1,204,974,141
Provision for fixed assets 36,291,208 –
922,543,152 1,239,846,141

Notes to Financial Statements (Continued)
Maanshan Iron & Steel Company Limited2016 Annual Report
292
XIV. MAJOR NOTES TO COMPANY FINANCIAL STATEMENTS (CONTINUED)
8. INVESTMENT INCOME
2016 2015
Long term equity investment income
under the equity method 232,820,475 75,219,006
Long term equity investment income
under the cost method 5,888,730 111,032,729
Investment income from available-for-sale financial
assets during the holding period 40,000 12,994,828
Investment income from disposal of financial assets
at fair value through profit or loss 14,685,855 1,569,555
Investment income from disposal of available-for-sale
financial assets – (48,310)
Others – (7,349,908)
253,435,060 193,417,900
As of the end of the reporting period, there was no significant restriction imposed upon the
remittance of the Company’s investment income.

Maanshan Iron & Steel Company Limited2016 Annual Report
293
XIV. MAJOR NOTES TO COMPANY FINANCIAL STATEMENTS (CONTINUED)
9. CASH FLOWS FROM OPERATING ACTIVITIES
2016 2015
Net profit/(loss) 1,362,541,845 (4,172,556,122)
Add: Provision for bad debts 2,686,251 34,872,000
Provision for inventories 883,565,693 1,204,974,141
Early retirement benefits 175,125,396 –
Provision for fixed assets 36,291,208 –
Depreciation of fixed assets 2,696,455,382 2,599,172,168
Amortisation of investment properties 1,693,010 2,063,607
Amortisation of intangible assets 29,481,675 29,571,894
Amortisation of deferred income (111,574,252) (70,927,623)
Loss/(profit) on disposal of non-current assets 47,495,781 (34,997,590)
Financial expenses 772,680,818 745,916,241
Investment income (253,435,060) (193,417,900)
(Profit)/loss on fair value changes (3,789,546) 538,440
Decrease in deferred tax assets 52,407,898 269,300,783
(Increase)/decrease in inventories (3,906,214,888) 531,296,455
(Increase)/decrease in receivables
from operating activities (6,674,529,166) 532,520,506
Increase in payables from operating activities 4,459,060,309 131,394,210
Net cash flows from operating activities (430,057,646) 1,609,721,210
Endorsements of bank acceptance bills received
from sales of goods or rendering of services 7,208,064,925 1,359,176,259

Maanshan Iron & Steel Company Limited2016 Annual Report
294
Supplementary Information31 December 2016Renminibi Yuan
1. BREAKDOWN OF NON-RECURRING GAINS OR LOSSES
The calculation of non-recurring gains or losses is in accordance with “Regulation for the preparation
of information disclosure by listed securities companies No.1 – Non-recurring Gains or Losses (2008
revised)” (No.43 [2008]) issued by the CSRC.
2016
Items of non-recurring gains or losses
Gain on disposal of non-current assets 7,187,676
Loss on disposal of non-current assets (58,376,872)
Subsidy income 74,522,778
Amortisation of deferred income 116,979,983
Other net non-operating loss, exclude items above (19,729,079)
Employee termination compensation (347,468,731)
Reversal of provision for trade receivables assessed for impairment individually 927,877
Gain on fair value changes of financial assets at fair value through profit or loss 4,051,190
Investment income from available-for-sale financial assets during holding period 40,000
Investment income from disposal of available-for-sale financial assets 11,635,767
Investment income from disposal of financial assets
at fair value through profit or loss 46,900,221
(163,329,190)
Less: Income tax effect of non-recurring gains or losses 11,164,092
Non-recurring gains or losses attributable
to minority shareholders 6,551,217
Net effect of non-recurring gains or losses (181,044,499)
Net profit attributable to owners of the parent
excluding non-recurring gains or losses
Net profit attributable to owners of the parent 1,228,892,407
Less: net effect of non-recurring gains or losses (181,044,499)
Net profit attributable to owners of the parent
excluding non-recurring gains or losses 1,409,936,906
Supplementary Information
31 December 2016
Renminibi Yuan

Maanshan Iron & Steel Company Limited2016 Annual Report
295
2. RETURN ON NET ASSETS AND EARNINGS PER SHARE
2016 Return on
weighted
average net
assets (%) Earnings per share (RMB)
Basic Diluted
Net profit attributable to owners of the Company 6.43 0.160 0.160
Net profit attributable to owners of the Company
excluding non-recurring gains or losses 7.38 0.183 0.183
2015 Return on
weighted
average net
assets (%) Earnings per share (RMB)
Basic Diluted
Net loss attributable to owners of the Company (23.01) (0.624) (0.624)
Net loss attributable to owners of the Company
excluding non-recurring gains or losses (24.57) (0.666) (0.666)
Return on net assets and earnings per share are calculated based on the formula stipulated in the
“Regulation for the preparation of information disclosure for listed securities companies (2010) No.9
– Calculation and disclosure of return on net assets and earnings per share” (2010 revised) issued by
the CSRC.
Maanshan Iron & Steel Company Limited2016 Annual Report
296
XI. Documents Available for Inspection
1. Financial statements signed and sealed by the Company’s legal representative, chief accountant and
head of Accounting Department.
2. Original copy of the audit report, sealed by Ernst & Young Hua Ming LLP and signed by Ms. An Xiuyan
and Ms. Wu Xiaofang, certified public accountants in the PRC.
3. Original copies of all documents and announcements of the Company disclosed in Shanghai
Securities News and on the website of the SSE during the reporting period.
4. Annual report announced on the website of the Hong Kong Stock Exchange.
5. The Articles of Association of the Company.
Chairman: Ding Yi
Submission date approved by the Board of Directors: 29 March 2017
XI. Documents Available for Inspection

Annual R
eport 2016