
YoY) - Ιδιώτες | Eurobank
15
1 September 2017 Ioannis Gkionis Senior Economist Eurobank Ergasias +30 210 3331225 [email protected] Galatia Phoka Research Economist Eurobank Ergasias +30 210 3718922 [email protected] The authors wish to thank Dr. Tasos Anastasatos, Deputy Chief Economist, for his insightful comments DISCLAIMER This report has been issued by Eurobank Ergasias S.A. (“Eurobank”) and may not be reproduced in any manner or provided to any other person. Each person that receives a copy by acceptance thereof represents and agrees that it will not distribute or provide it to any other person. This report is not an offer to buy or sell or a solicitation of an offer to buy or sell the securities mentioned herein. Eurobank and others associated with it may have positions in, and may effect transactions in securities of companies mentioned herein and may also perform or seek to perform investment banking services for those companies. The investments discussed in this report may be unsuitable for investors, depending on the specific investment objectives and financial position. The information contained herein is for informative purposes only and has been obtained from sources believed to be reliable but it has not been verified by Eurobank. The opinions expressed herein may not necessarily coincide with those of any member of Eurobank. No representation or warranty (express or implied) is made as to the accuracy, completeness, correctness, timeliness or fairness of the information or opinions herein, all of which are subject to change without notice. No responsibility or liability whatsoever or howsoever arising is accepted in relation to the contents hereof by Eurobank or any of its directors, officers or employees. Any articles, studies, comments etc. reflect solely the views of their author. Any unsigned notes are deemed to have been produced by the editorial team. Any articles, studies, comments etc. that are signed by members of the editorial team express the personal views of their author. Bulgaria | Cyprus | Romania | Serbia Regional growth on solid footing in Q2-2017 REGIONAL MACROECONOMIC & MARKET DEVELOPMENTS & OUTLOOK Q2-2017 second GDP estimates confirm a solid footing for most of the economies of the region Consumer spending revival continues unabated driven by sustained sentiment gains, eased financial conditions, tighter labor markets and robust real wage dynamics Regional assets extend gains in Q3 2017 Regional bourses firm trailing the rally in emerging and major global stock markets Emerging external debt markets extend rally firm; regional currencies modestly weaken on idiosyncratic factors EM assets likely to remain range-bound into year-end as developing-economies’ fundamentals remain favorable but valuations are rich. COUNTRY FOCUS Bulgaria: Credit activity has started accelerating Cyprus: New round of sovereign rating upgrades Romania: GDP growth outperformance in the second quarter Serbia: One-off factors in H1 2017 prompt downward revisions in full-year growth forecasts Regional economies on solid footing in Q2-2017 0 1 2 3 4 5 6 7 Switzerland Greece Serbia Belgium Italy UK France Germany Norway EA-19 EU-28 Denmark Iceland Austria Portugal Finland Sweden Spain Slovakia Croatia Cyprus Hungary Bulgaria Netherlands Lithuania Albania Poland Czech R. Latvia Turkey Estonia Slovenia Romania Ireland Malta (%, YoY) Source: Eurostat, National Authorities, Eurobank Research
Transcript of YoY) - Ιδιώτες | Eurobank

1
September 2017
Ioannis Gkionis
Senior Economist
Eurobank Ergasias
+30 210 3331225
Galatia Phoka
Research Economist
Eurobank Ergasias
+30 210 3718922
The authors wish to thank
Dr. Tasos Anastasatos,
Deputy Chief Economist, for
his insightful comments
DISCLAIMER This report has been issued by Eurobank
Ergasias S.A. (“Eurobank”) and may not be
reproduced in any manner or provided to
any other person. Each person that
receives a copy by acceptance thereof
represents and agrees that it will not
distribute or provide it to any other
person. This report is not an offer to buy
or sell or a solicitation of an offer to buy
or sell the securities mentioned herein.
Eurobank and others associated with it
may have positions in, and may effect
transactions in securities of companies
mentioned herein and may also perform
or seek to perform investment banking
services for those companies. The
investments discussed in this report may
be unsuitable for investors, depending on
the specific investment objectives and
financial position. The information
contained herein is for informative
purposes only and has been obtained
from sources believed to be reliable but it
has not been verified by Eurobank. The
opinions expressed herein may not
necessarily coincide with those of any
member of Eurobank. No representation
or warranty (express or implied) is made
as to the accuracy, completeness,
correctness, timeliness or fairness of the
information or opinions herein, all of
which are subject to change without
notice. No responsibility or liability
whatsoever or howsoever arising is
accepted in relation to the contents
hereof by Eurobank or any of its directors,
officers or employees.
Any articles, studies, comments etc.
reflect solely the views of their author.
Any unsigned notes are deemed to have
been produced by the editorial team. Any
articles, studies, comments etc. that are
signed by members of the editorial team
express the personal views of their
author.
Bulgaria | Cyprus | Romania | Serbia
Regional growth on solid footing in Q2-2017
REGIONAL MACROECONOMIC & MARKET DEVELOPMENTS & OUTLOOK
Q2-2017 second GDP estimates confirm a solid footing for most of the economies of the region
Consumer spending revival continues unabated driven by sustained sentiment gains, eased
financial conditions, tighter labor markets and robust real wage dynamics
Regional assets extend gains in Q3 2017
Regional bourses firm trailing the rally in emerging and major global stock markets
Emerging external debt markets extend rally firm; regional currencies modestly weaken on
idiosyncratic factors
EM assets likely to remain range-bound into year-end as developing-economies’ fundamentals
remain favorable but valuations are rich.
COUNTRY FOCUS
Bulgaria: Credit activity has started accelerating
Cyprus: New round of sovereign rating upgrades
Romania: GDP growth outperformance in the second quarter
Serbia: One-off factors in H1 2017 prompt downward revisions in full-year growth forecasts
Regional economies on solid footing in Q2-2017
0
1
2
3
4
5
6
7
Swit
zerl
and
Gre
ece
Serb
ia
Bel
giu
m
Ital
y
UK
Fran
ce
Ge
rman
y
No
rway
EA-1
9
EU-2
8
Den
mar
k
Ice
lan
d
Au
stri
a
Po
rtu
gal
Fin
lan
d
Swe
de
n
Spai
n
Slo
vaki
a
Cro
ati
a
Cyp
rus
Hu
nga
ry
Bu
lgar
ia
Ne
ther
lan
ds
Lith
uan
ia
Alb
ania
Po
lan
d
Cze
ch R
.
Latv
ia
Turk
ey
Esto
nia
Slo
ven
ia
Ro
man
ia
Ire
lan
d
Mal
ta
(%, YoY)
Source: Eurostat, National Authorities, Eurobank Research
2
September 2017
Contents
I. Regional Macroeconomic & Market Developments & Outlook ............................................. 3 Trader’s view ............................................................................................................................... 6
II. Country Focus .......................................................................................................................... 7 Bulgaria (Baa2/BB+/BBB-) ........................................................................................................... 7
Cyprus ((P) Ba3/BB+/BB-) ............................................................................................................ 9
Romania (Baa3/BBB-/BBB-) ....................................................................................................... 11
Serbia (Ba3/BB-/BB-) ................................................................................................................. 13

3
September 2017
I. Regional Macroeconomic & Market Developments & Outlook
Regional growth on solid footing in Q2; most assets extend gains in Q3 2017
The economies of the region
remained on solid footing in Q2
driven by robust private
consumption dynamics
Emerging Market assets remain
amongst the best performing classes
so far this year
Emerging market stocks end Q3 in
the black for the 3rd quarter
running, the longest such stretch
since 2010; regional bourses trail
behind
Emerging market currencies mostly
firm; regional fx remains modestly
weaker on idiosyncratic factors
Good EM assets performance likely
to continue towards year-end
The second GDP growth estimates for Q2-2017, released for most of the countries of our focus (Bulgaria, Romania, Cyprus),
confirmed a solid footing for the region. Now that the detailed breakdown for all the economies is available, it would be fair to
say that the private spending revival continued unabated despite local political-policymaking uncertainties plus the food prices
induced spike of headline inflation, feeding a strong imports rise on the external side. Sustained consumer sentiment gains, eased
financial conditions, tighter labor markets combined with robust real wage dynamics boost consumer spending, a trend that will
most likely continue throughout 2H. On the negative side, the underperformance of EU funded projects maintained investment
spending below expectations for yet another quarter, a trend that we anticipate to change in the 2H.
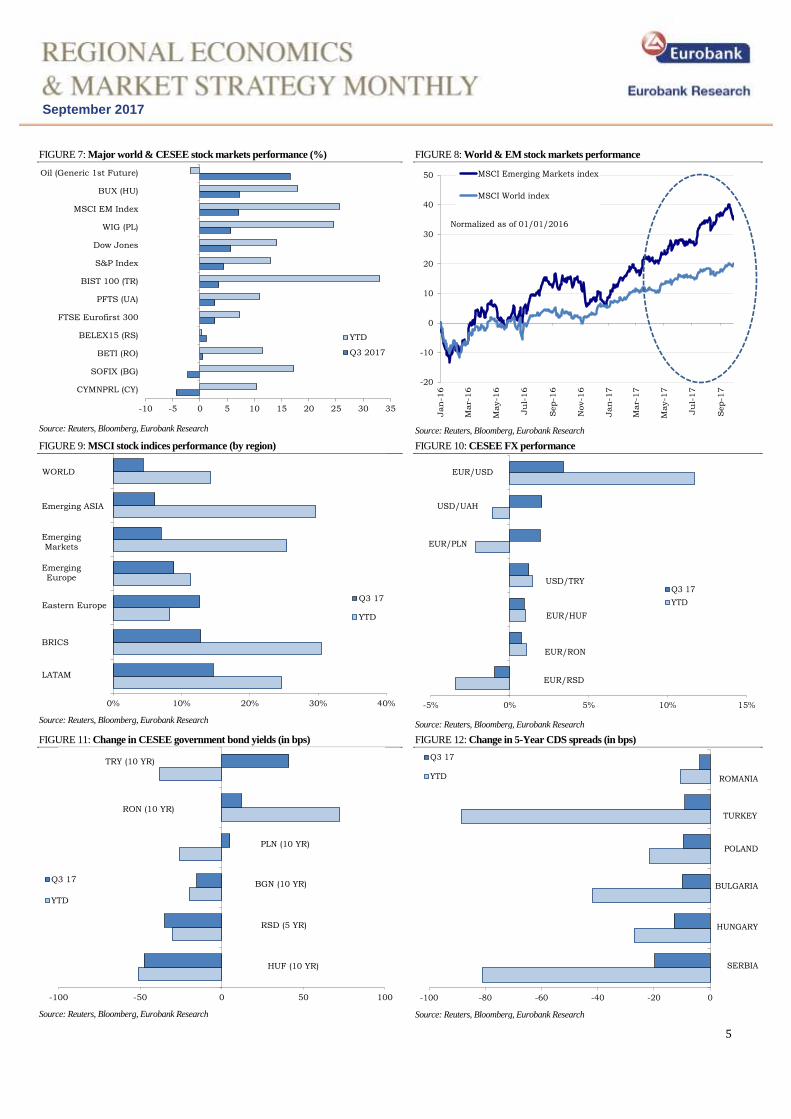
Emerging market assets broadly extended their two-year rally in Q3. Despite some bouts of increased risk aversion that have
prompted a squeeze on long EM positions, this class remains amongst the best performing so far this year. Support has mainly
stemmed from developing economies’ improving macroeconomic fundamentals, low interest rates globally, favorable EM
valuations and the USD’s weakness over the last few months. Importantly, the Fed’s monetary tightening has proved less
aggressive than feared a few months ago. Meanwhile, the ECB’s stance remains accommodative. The ability of EM assets to
withhold their gains has been primarily tested on a few occasions this year via increases in core government yields. Rising
geopolitical tensions have also weighed on valuations at times. Reflecting the improvement in global risk appetite, EM external
debt has rallied further in Q3, with corresponding spreads over USTs on the EMBI+ index having declined to a 3-year low of
315bps September while total year-to-date returns stood near 9% in the beginning of October.
In stock markets, the MSCI Emerging Markets Index ended September in the red amid persisting geopolitical tensions relating to
news around North Korea, higher UST yields and a partial recovery in the USD. The latter two were driven by the US
administration’s tax reform proposal that is expected to boost growth in the world’s largest economy and led to an upward
repricing of expectations for further FOMC monetary policy tightening this year. Although September’s 0.5% decline took some
shine off the rally and snapped an 8-month stretch of gains – the longest since 2004 - the index reached new 3-year highs earlier
that month and ended Q3 for the 3rd consecutive quarter in the black. Over the July-September period it recorded hefty gains to
the tune of 7% and marked the longest rally since 2010. On a year-to-date basis it has spiked by 25%, nearly double the ca. 15%
rise evidenced in the corresponding World index. LATAM and BRICs led the way higher in the EM space in Q3, while CESEE
bourses trailed behind. Bulgaria’s main SOFIX index was the only exception in the region and ended lower in September
compared to June. However, the index still stands more than 17% higher year-to-date.
Most emerging currencies also firmed in Q3 thanks to improving risk sentiment. The MSCI EM Currency Index advanced by ca
2% in July-September, having amassed gains to the tune of 8% since the beginning of the year. The picture is somewhat different
in CESEE, with most currencies standing modestly weaker in Q3 as well as compared to their levels in the onset of 2017.
Idiosyncratic factors also remain at play. The Hungarian forint recently slid to a 4-month low near 312.50/€, a few days after the
Central Bank launched a new round of monetary easing. The Polish zloty fell to a 6-month low close to 4.3320/€ weighed down
by escalating tensions with the EU. The European Commission took further action in September in an infringement procedure
against the country that was launched in July, deciding to send a Reasoned Opinion to the country regarding an overhaul of the
Polish judiciary system. On the flipside, the Serbian dinar has backed the negative regional trend to hit a 3-year peak just below
119/€ in late September (for further details see Trader’s view).
Barring any major shocks, EM assets are likely to remain range-bound into year-end as developing-economies’ fundamentals
remain favorable but valuations are rich. Downside risks may arise via renewed geopolitical tensions, higher core market rates,
more hawkish than expected major Central Bank rhetoric and renewed concerns over China’s growth.
Ioannis Gkionis ([email protected])
(+30) 210 337 1225
Galatia Phoka ([email protected])
(+30) 210 371 8922

4
September 2017
FIGURE 1: GDP Growth performance 2015-2017
Source: Eurostat, National Authorities, Eurobank Research
FIGURE 2: Annual average inflation 2015- 2017
Source: Eurostat, EU Spring Forecasts, Eurobank Research
FIGURE 3: Investments to GDP ratios 2008 vs. 2017
Source: IMF WEO, Eurobank Research
FIGURE 4: Energy intensity of the individual countries, 2014
Source: Eurostat, National Authorities, Eurobank Research
FIGURE 5: Fiscal Balance (% of GDP, Cash basis) 2015- 2017
Source: Eurostat, National Authorities, Eurobank Research
FIGURE 6: Annual average unemployment rates 2015-2017
Source: Eurostat, National Authorities Eurobank Research
5
September 2017
FIGURE 7: Major world & CESEE stock markets performance (%)
-10 -5 0 5 10 15 20 25 30 35
CYMNPRL (CY)
SOFIX (BG)
BETI (RO)
BELEX15 (RS)
FTSE Eurofirst 300
PFTS (UA)
BIST 100 (TR)
S&P Index
Dow Jones
WIG (PL)
MSCI EM Index
BUX (HU)
Oil (Generic 1st Future)
YTD
Q3 2017
Source: Reuters, Bloomberg, Eurobank Research
FIGURE 8: World & EM stock markets performance
-20
-10
0
10
20
30
40
50
Jan
-16
Mar-
16
May-1
6
Ju
l-16
Sep-1
6
Nov-1
6
Jan
-17
Mar-
17
May-1
7
Ju
l-17
Sep-1
7
MSCI Emerging Markets index
MSCI World index
Normalized as of 01/01/2016
Source: Reuters, Bloomberg, Eurobank Research
FIGURE 9: MSCI stock indices performance (by region)
LATAM
BRICS
Eastern Europe
Emerging Europe
Emerging Markets
Emerging ASIA
WORLD
0% 10% 20% 30% 40%
Q3 17
YTD
Source: Reuters, Bloomberg, Eurobank Research
FIGURE 10: CESEE FX performance
EUR/RSD
EUR/RON
EUR/HUF
USD/TRY
EUR/PLN
USD/UAH
EUR/USD
-5% 0% 5% 10% 15%
Q3 17
YTD
Source: Reuters, Bloomberg, Eurobank Research
FIGURE 11: Change in CESEE government bond yields (in bps)
HUF (10 YR)
RSD (5 YR)
BGN (10 YR)
PLN (10 YR)
RON (10 YR)
TRY (10 YR)
-100 -50 0 50 100
Q3 17
YTD
Source: Reuters, Bloomberg, Eurobank Research
FIGURE 12: Change in 5-Year CDS spreads (in bps)
SERBIA
HUNGARY
BULGARIA
POLAND
TURKEY
ROMANIA
-100 -80 -60 -40 -20 0
Q3 17
YTD
Source: Reuters, Bloomberg, Eurobank Research
6
September 2017
Trader’s view
Long EUR/RSD positions appear
favorable as the dinar’s rally is likely
to prove overdone
We prefer to remain on the sidelines
on BGN-denominated bonds ahead of
the next ECB meeting, while up-side
potential seems limited
We prefer to remain on the sidelines
on Bulgarian Eurobonds as credit
spreads seem very tight & valuations
stretched
FX
The dinar staged a truly impressive performance in summer period. The domestic currency has strengthened 1.15% against the euro since
June and stands 3.5% firmer on a year-to-date basis, placed among the best performers in the EMEA space. On top of that, the National Bank
of Serbia has bought €1.08bn over a period of five months to ease upside pressures and halt the dinar’s rapid appreciation. Overall, the main
drivers of this trend have been the strong credit expansion in the banking sector (0.9% QtQ rise of loans in corporate) and traditionally weak
hard currency demand during summer lull. Remittances from abroad and steady demand for government bonds have also supported the
dinar’s rally.
However, intensified Central Bank presence near 119.00 recently, indicates that the EUR/RSD is likely to have reached a near-term bottom
around that level. Also, demand for hard currency should re-emerge in the coming weeks, while a relatively thin bond auction schedule will
keep foreign investors away from FX (in most cases they are funding their bond investment via pure FX position). All these factors argue in
favour of a correction in the EUR/RSD pair ahead. Having said that, we prefer closing our earlier EUR/RSD short VS long 3M RSD bond
and playing on a long side of FX from this point onward.
Central Bank efforts to halt and reverse the recent upward dinar trend could also materialize through another – though quite unexpected - key
monetary policy rate cut. September’s MPC decision to lower rate to 3.75%, in time when most of major Central Banks around the globe
have already embarked on monetary tightening or are preparing to end QE programmes which could significantly impact FX. For time being,
this decision appeared to have negligible impact on the RSD. Furthermore, economic activity slowed down for the second consecutive
quarter in Q2 17, with real GDP growth coming in at a modest 1.3%, necessitating a downward revision in the IMF’s full-year 2017
projection to 2.3% from 3.0% before. Along these lines, , the dinar may eventually give back part of the gains achieved in last 5 months. Our
baseline scenario is for the EUR/RSD to move towards 120.00 in 1-month time and inch further higher to 121.0 in 3-months.
Security Position Entry Target level Stop loss Period
EUR/RSD
Long 119.25
120.90 118.70 3-months
Local rates
Yields on the Bulgarian sovereign debt market continued to slide during the summer on the back of positive economic data and state budget
surplus. The yield curve continued to bull-flatten, with 10-year sector spreads reaching levels of 65 bps versus benchmark swap rates. This
bull run was further supported by the lack of supply on the primary market and abundant liquidity stored into the pension funds. We expect
this trend to remain until the end of the year supported by the lack of new issuance on the primary market (up to BGN 300mn until year-end)
and the improvement of state finance. That said, we would prefer to remain in the sidelines on the Bulgarian local-currency debt market as
the current rally may eventually prove overdone and any potential up-side is likely to prove limited and would only be realizable in the very
short term. Importantly, the expected announcement from the ECB governing council on the October 26th monetary policy meeting about the
deadline for the current QE program represents a possible change in direction.
External debt markets
Bulgarian Eurobonds followed the developments in the local market with the longest end of the yield curve, Bulgaria 35 being the biggest
beneficiary of this price adjustment. At current levels, we deem Bulgarian credit spreads very tight and valuations stretched, hence we prefer
to remain on the sidelines and not enter into any new positions.
Ruslan Raychev ([email protected])
+359 2 8166 482
Zoran Korac ([email protected])
+381 11 206 5821
We would also like to the Eurobank Trading Team in Athens for its most valuable comments
7
September 2017
II. Country Focus
Bulgaria (Baa2/BB+/BBB-)
Credit activity has started accelerating
Growth remained on track in Q2-
2017, bringing the 1H-2017 at
3.6%, an inch up from 3.4% in
FY2015
Credit activity has started
accelerating in Q3-2017 providing
a further impulse to economic
activity
Inflation picked up slightly in August
after two consecutive months of
decline
Real GDP expanded by +1.0% QoQ/+3.6% YoY in Q2-2017 vs. +0.9% QoQ/+3.5% YoY in Q1-2017 compared to +0.9%
QoQ/+3.4% YoY in Q4-2016 and +0.9% QoQ/+3.5% YoY in Q2-2015. Despite the fiscal drag from lower public expenditure and the
prevailing political uncertainty ahead of the early parliamentary elections in late April, final consumption expanded by +0.4%
QoQ/+4.2% YoY in Q2-2017 vs. +1.9% QoQ/+4.3% YoY in Q1-2017 compared to +1.3% QoQ/+0.8% YoY in Q4-2016 up from
+0.4% QoQ/+1.2% YoY in Q2-2016. The solid performance of consumption was driven mainly by sustained labor market
improvement coupled with still high real wage growth, albeit the latter is decelerating due to the inflation spike in 1H (7.6% YoY in Q2-
2017 vs. 7.4% YoY in Q1-2017 down from 8.5% YoY in Q4-2016). The unemployment rate declined sharply to 6.0% in Q2-2017, the
lowest level since Q1-2009, as the economy adds new jobs in the areas of specialized business and IT services. In contrast, investments
were in the red on an annual basis for the fifth consecutive quarter in Q2 (GFCF: +2.3% QoQ/-1.0% YoY in Q2 vs. -0.6% QoQ/-4.6%
YoY in Q1). The decline mirrors the slow progress in infrastructure spending implementation during the transition period of the
caretaker government plus the low EU funds absorption in the two-year period after the closing of the programming period 2007-2013.
Finally, net exports had a negative contribution in Q2 (Exports: +6.5% YoY vs. +5.8% YoY in Q1 & Imports: +7.7% vs. +7.1% YoY
in Q1) driven by the strong imports rise in response to private consumption dynamics. Overall, Bulgaria is expected to register a second
consecutive year of strong-above potential- growth in 2017. Private consumption dynamics are broadly set to remain strong as the
economy benefits from a more expansionary fiscal policy stance in the 2H, accelerated EU funds absorption in the coming quarters, an
improving labor market, catching up wages, a vibrant export oriented manufacturing sector, an emerging tourism destination and a
rebounding real-estate market.
Credit to the non-government sector has switched to positive territory since October 2016 and started accelerating in recent months.
Credit to the non-government sector improved to 4.6% YoY in August, 4.5% YoY in July, 3.8% YoY in March, up from only 1.5%
YoY in 2016, compared to -1.2% YoY in 2015 and -8.2% YoY in 2014. The data of 2014 reflect the dropping of assets of Corporate
Commercial Bank (KTB) out of the official statistics in the aftermath of the bank run which eventually resulted in the bankruptcy of the
fourth largest bank in terms of assets. Credit to households expanded briskly by 5.7% YoY in August, 5.5% YoY in July, up from 4.7%
YoY in March, up from only 2.0% in 2016, compared to -1.3% YoY in 2015 and -1.6% YoY in 2014. Credit to the non-financial
corporations increased by 2.8% YoY in August, flat vs. July, 2.5% in March, up from 2.0% in 2016 down from -1.7% YoY in 2015 and
-11.6% YoY in 2014. On the other hand, non-government deposits expanded by +7.3% YoY in March, 2016 down from +10.6% YoY
in 2015 but still up from +1.5% YoY in 2014. Deposits have fared strongly so far, despite declining interest rates, driven by solid
households’ savings and robust corporate sector deposits (11.1% YoY in August, 6.5% YoY in 2016, and 18.7% YoY in 2015). Having
been subdued or in negative territory for a prolonged period of time, credit activity has embarked on a steadily increasing path providing
a boost to economic activity. We anticipate this trend to continue as both demand and supply factors come into play. Financial
institutions are now less reluctant to lend, as heavy regulatory requirements posed by the banking system-wide AQR and Stress test are
behind, and are still confronted by the negative interest rates on excess reserves, introduced by the BNB in January 2016. The system’s
total loans-to-deposits ratio stood at 70.7% in July, one of the lowest in the SE Europe region. This, together with the high liquid assets
ratio (36.6% in July), illustrates the increased funding capacity and strong liquidity position of the banking system.
Consumer prices edged up to +0.6% MoM/+1.4% YoY in August, up from 0.3% MoM/1.3% YoY in July compared to only +0.6%
MoM/+0.1% YoY in last December. As a result, the average annual inflation has now climbed to 1.1% YoY in 8M-2017, up from -
0.8% YoY in 2016 and -0.1% YoY in 2015. Food prices, both the largest as well as the most volatile component of CPI, edged up to
+0.0% MoM/+2.7% YoY in August up from -0.1% MoM/+2.5% YoY in July compared to a year to date peak at +0.9% MoM/+5.1%
YoY in April. The main driver was the rise in the prices of vegetables and fruits. Driven by higher global energy prices in Q2-2017 and
negative base effects, transportation prices climbed as much as +0.7% MoM/+8.3% YoY in April but have recently narrowed down to
+1.1% MoM/-0.6% YoY in August vs. -0.5% MoM/-1.3% YoY in July. Looking ahead, even though consumer prices have most
probably peaked in April, they are expected to fluctuate around these levels by year-end, reflecting elevated energy prices (Brent oil
stood at 57$/barrel, the highest level in the last 6M) and the adjustment of regulatory prices and excise hikes but also the positive impact
from further normalization of volatile food prices. So far, there is little evidence to support that underlying consumption-driven
inflationary pressures are building despite its improving dynamics.
Ioannis Gkionis ([email protected])
(+30) 210 337 1225
8
September 2017
FIGURE 13: GDP growth & Inflation 2000-2018
Source: National statistics, Ecowin Reuters, Eurobank Research
FIGURE 14: CA Balance & Net FDI inflows 2012-2017
-0.9
1.3
0.1 0.0
5.4
3.13.1 3.32.7
5.5
1.40.9
-2
-1
0
1
2
3
4
5
6
2012 2013 2014 2015 2016 7M-2017
Current Account Net FDI Inflows
% GDP
Source: National statistics, Ecowin Reuters, Eurobank Research
FIGURE 15: Inflation dynamics 2013-2017
Source: National statistics, Ecowin Reuters, Eurobank Research
FIGURE 16: Fiscal deficit & Gross Public Debt 2010-2017
Source: Ministry of Finance, Eurobank Research
2015 2016 2017e 2018f
Real GDP (yoy%) 3.6 3.4 3.6 3.5
Inflation (yoy%)
CPI (annual average) -0.1 -0.8 1.6 1.7
CPI (end of period) -0.4 0.1 1.5 1.9
Fiscal Accounts (%GDP, Cash basis)
General Government Balance -2.8 1.6 -1.3 -1.0
Gross Public Debt 25.7 27.8 24.5 24.1
Primary Balance -2.4 1.9 -0.8 -0.6
Labor Statistics
Unemployment Rate (LFS, %) 9.2 7.6 6.3 5.8
Compensation of employees/head 5.6 3.9 4.1 4.5
External Accounts
Current Account (% GDP) -0.1 5.4 3.5 3.0
Net FDI (EUR bn) 2.5 0.6 1.1 1.0
FX Reserves (EUR bn) 20.3 23.9 25.0 27.0
Domestic Credit 2013 2014 2015 2016
Total Credit (%GDP) 72.9 67.7 57.1 54.6
Credit to Enterprises (%GDP) 43.9 38.1 34.9 0.2
Credit to Households (%GDP) 21.7 21.0 20.8 2.0
FX Credit/Total Credit (%) 59.8 54.3 49.4 44.0
Private Sector Credit (yoy) 0.2 -8.2 -1.2 1.5
Loans to Deposits (%) 92.1 84.2 78.2 74.1
Financial Markets Current 3M 6M 12M
Policy Rate
EUR/BGN 1.96 1.96 1.96 1.96
Bulgaria: Macro & Market Data
Currency Board
Source: National Sources, Eurostat, IMF, Eurobank Research

9
September 2017
Cyprus ((P) Ba3/BB+/BB-)
New round of sovereign rating upgrades
The 1H-2017 GDP growth
performance at 3.6% YoY
confirming that the economy is on
a fast growth recovery track
The economy’s solid
performance continued into the
Q2-2017 with encouraging
signs across most sectors,
including the real estate sector
Even though solid growth
performance is expected to
continue in 2017-2018, the risk of
complacency is material
DBRS and Moody’s were the last
rating agencies to upgrade the
sovereign rating of Cyprus in the
current round of reviews
After a three year recession in 2012-2014 and a cumulative drop of 10.5% of GDP, the economy expanded by +1.7% YoY in 2015,
accelerated to +2.8% YoY in 2016 and is expected to further gain momentum to over 3% in 2017. Consistent with this projection, the
1H-2017 GDP growth performance stood already at 3.6% YoY. More specifically, the Q2-2017 GDP growth reading was the second
strongest -after that of the first quarter- since 2008, amongst the highest in EA-19 and EU-28, and above EA-19 average for seventh
consecutive quarter in a row. On a seasonally adjusted basis, growth expanded by 1.0% QoQ/3.5% YoY in Q2-2017 an inch down from
1.0% QoQ/3.7% YoY in Q1-2017 compared to 0.7% QoQ/2.9% YoY in Q4-2016 vs. 1.2% QoQ/2.8% YoY in Q2-2016. From a
demand point of view, final consumption expanded strongly by +2.2% QoQ/+4.1% YoY in Q2-2017 up from +0.4% QoQ/+2.2% YoY
in Q1-2017 compared to +0.6% QoQ/+2.8% YoY in Q4-2016, vs. +1.7% QoQ/+1.4% YoY in Q2-2016, making a +3.4ppts contribution
to growth. As far as other growth components are concerned, lower imports of transportation equipment weighed heavily on the imports
side (imports:-12.7% YoY vs. exports:+2.4%YoY), leading net exports’ contribution to turn positive but also resulting in lower
investment spending, thereby broadly offsetting the positive contribution of the external sector.
The consumption rebound continued in 1H-2017, driven by strong sentiment improvement, a flourishing tourism sector, improved labor
market conditions, further property market stabilization, the impact from fiscal relaxation, and the further normalization of banking sector
conditions. The strong sentiment improvement - the highest in EU-28 in the last three years- mirrors the lasting progress within the
expired adjustment program. In turn, the Economic Sentiment Index (ESI) now stands very close to the levels prior to the international
financial crisis. In addition, tourist arrivals grew by 14.7% YoY in Jan-Aug 2017, with the corresponding levels over that period heading
for a new all-time record high in the history of the Republic. Similarly, tourism revenues expanded by 19.9% YoY in 1H-2017.
Unemployment in seasonally adjusted terms resumed its downward trend, declining further to 10.8% in July 2017, down from 12.5% in
March 2017 vs. 13.0% in July 2016. Finally, the number of real-estate market sale contracts has risen by 20% YoY in 1H-2017 (from
3,610 to 3,012). The reading of 843 in June 2017 only, was a new multi-year monthly high of the last six years. The Residential Property
Price Index (RPPI) recorded its first annual increase in Q1-2017 (+0.3% QoQ/+0.2% YoY) since 2009 (Central Bank of Cyprus).
Even though Cyprus has made progress in a lot of areas, the risk of complacency following the exit from the Economic Adjustment
Programme is material. On the domestic front, the reform momentum seems to have stalled ahead of the Presidential elections in 2018.
Still, a handful of unfinished structural reforms need to progress in the areas of privatizations, public and health sectors, while addressing
the challenges of a still high bad loans stock (NPEs ratio at 47% in Dec2016). Particularly, parliamentary approval of the Bill setting a
cap on the public sector wage bill, essentially linking the expenditure expansion with the GDP growth performance, is still pending. As
time moves on, it becomes increasingly unlikely the Bill will be voted into law ahead of next year’s Presidential elections.
Both Moody’s and DBRS upgraded the long-term sovereign rating of Cyprus Republic, now placing it three notches away from
investment grade. On June 2, DBRS upgraded the rating by two notches (from B to BB low) with a stable outlook (trend). The upgrade
reflects Cyprus’ strong fiscal results over the past two years and declining imbalances in the private sector. The stable outlook reflects the
substantial challenges still ahead despite the economic recovery, namely the high level of non-performing loans and the still high private
sector debt. More recently, on July 28, Moody’s upgraded the rating of Cyprus by one notch to Ba3 from B1 with a positive outlook.
Moody’s decision reflects two main drivers: First, improvements in economic resilience that have occurred over the past two years,
which seem likely to continue in the medium term. Second, a consistent fiscal outperformance and a continuing favorable fiscal outlook.
The decision to maintain a positive outlook reflects Moody's view that improvements in economic resilience and continuing fiscal
outperformance are likely to be sustained, together with a reduction in the debt-to-GDP ratio, as well as a fall in the stock of non-
performing loans held by the banks. On September 15, in line with expectations, S&P affirmed the long-term sovereign rating of Cyprus
at BB+ but at the same time it changed the outlook from stable to positive. According to S&P, the positive outlook reflects that the
agency could raise the ratings on Cyprus over the next 12 months if budgetary consolidation continues unabated, and the economy
continues to recover toward pre-crisis output levels. It is worthwhile pointing out that S&P was the first rating agency to downgrade
Cyprus to junk status in January 2012. As things stand now, the divergence of views between the rating agencies on the sovereign rating
of Cyprus, remains. Currently, the distance from investment grade status is: one notch for S&P (currently at BB+, last upgrade in mid-
March), three notches for Moody’s (currently at Ba3), for Fitch (currently at BB-) and DBRS (currently at BB Low). The next round of
reviews by the rating agencies is scheduled for autumn-winter of 2017: Fitch (Oct20, 2017), Moody’s (Nov17, 2017), DBRS (Dec1,
2017).
Ioannis Gkionis ([email protected])
(+30) 210 337 1225
10
September 2017
FIGURE 17: Growth performance Cyprus vs. Euroarea 2010-2017
Source: Eurostat, Eurobank Research
FIGURE 18: HICP Cyprus vs. Euroarea 2011-2017
Source: Eurostat, Eurobank Research
FIGURE 19: Maturity Profile of General Government Debt
0
200
400
600
800
1000
1200
1400
1600
1800
Other loans IMF-ESM loansDomestic law securities Foreign law securities
EUR mil
Source: PDMO, Eurobank Research
FIGURE 20: Fiscal deficit & Gross Public Debt 2011-2019
60
70
80
90
100
110
120
-7
-6
-5
-4
-3
-2
-1
0
1
2
2011 2012 2013 2014 2015 2016 2017F 2018F 2019F
General Government Deficit (% of GDP, Cash Basis, Lh)
Gross Public Debt (% of GDP, Cash Basis, Rh)
% of GDP % of GDP
Source: Ministry of Finance, Eurobank Research
2015 2016 2017e 2018f
Real GDP (yoy%) 1.7 2.8 3.5 3.1
Inflation (yoy%)
HICP (annual average) -1.5 -1.2 1.0 1.5
HICP (end of period) -1.4 0.1 1.2 1.3
Fiscal Accounts (%GDP)
General Government Balance 0.1 0.4 0.2 0.4
Gross Public Debt 107.5 107.8 104.0 99.7
Primary Balance 2.7 3.0 2.6 2.9
Labor Statistics
Unemployment Rate (LFS, %) 15.0 13.1 11.5 10.0
Compensation of employees/head -1.1 -0.6 0.7 1.1
External Accounts (% GDP)
Current Account -3.0 -5.7 -5.9 -6.3
Trade Balance (Goods) -18.0 -21.2 -22.2 -22.9
Terms of Trade (of Goods) 3.2 -0.4 0.2 -0.5
Domestic Credit 2013 2014 2015 2016
Total Credit (%GDP) 351.4 353.5 360.8 308.3
Credit to Enterprises (%GDP) 160.2 148.1 151.5 125.3
Credit to Households (%GDP) 140.0 142.7 136.4 127.5
Private Sector Credit (yoy) -12.2 -2.3 -3.4 -11.0
Loans to Deposits (%) 135.3 133.4 136.6 112.6
Cyprus: Macro & Market Data
Source: National Sources, Eurostat, IMF, Eurobank Research
11
September 2017
Romania (Baa3/BBB-/BBB-)
Swift end to the looming political crisis Real GDP dynamics surpassed the
most optimistic forecasts in Q2-2017
Output outperformance is not enough
to soothe concerns on the fiscal side
Underlying inflationary pressures are
building up despite the temporary
slowdown of headline inflation in the
summer
The revised estimate on the seasonally adjusted Q2-2017 GDP reading confirmed the flash estimate of +1.6% QoQ/+5.7% YoY,
+5.9% YoY in unadjusted terms. The stronger than expected print-above analysts’ call for +1.2% QoQ/+5.2% YoY- compares to
+1.8% QoQ/ +5.7% YoY in Q1-2017 and +1.6% QoQ/+5.0% YoY in Q4-2016, up from +1.1% QoQ/+4.0% YoY in Q4-2015. From
a demand point of view, private consumption jumped by +2.6% QoQ/+7.4% YoY in Q2 up from +4.3% QoQ/+7.1% YoY in Q1,
driven by higher disposable income as a result of the VAT rate cut and the rapid rise in real wages plus the strong consumer sentiment
readings, thus making a hefty contribution of 5.2ppts to growth. Gross fixed capital formation registered the first positive reading
(+2.7% QoQ/+1.6% YoY) on an annual basis since Q2-2016. First of all, this is due to the subdued performance of investments in the
1H-2016, mirroring lower EU funds absorption throughout 2016, which has set a low starting base. The strong momentum in
residential investment was broadly offset by the underperformance of the public investments program and the still low EU funds
absorption. Nevertheless, both gross fixed capital formation and inventories still had a positive contribution of 0.6ppts and +1.3ppts
respectively. On the downside, net exports had a negative contribution (-1.4ppts) mirroring the quarterly increase of imports (+2.1%
QoQ/+9.3% YoY), which exceeded that of exports (+0.6% QoQ/+6.5% YoY). This was broadly expected as domestic demand
recovery is accompanied by a recovery of imports. Overall, real GDP expanded by 5.9% YoY in 1H-2017 compared to 4.8% in 2016,
outperforming regional peers for a fourth consecutive year and surpassing the most optimistic forecasts. Growth is largely driven by
private consumption, financed by an overly expansionary fiscal policy, and leads to a revival of macroeconomic imbalances. Hence,
the economy is driven close to, if not above, its potential growth rate at the expense of pushing government finances off consolidation
track and deteriorating the external position (CAD17e: -3% of GDP).
Overall, the consolidated government deficit in cash terms has reached RON6.5bn or 0.8% of the revised projected GDP in 8M-2017,
double than the deficit of 0.4% of GDP registered in 8M-2016. Revenues’ performance improved in August (+8.8% YoY), driven by
improved VAT collection (+19.3% YoY in August), even though VAT revenues are usually not performing well during a summer
month. On the other hand, total expenditures’ expansion has reached double digit growth (+11.0% YoY). Spending in the areas of
wages and social benefits is still on the rise (+21.4% YoY and +11.3% YoY respectively) as budget implementation incorporated the
ruling coalition's electoral program for further generous hikes. Other key spending items, such as procurement for goods& services
(+4.1% YoY), capital expenditure (-18.7% YoY) and debt servicing (-5.9% YoY) remained either relatively contained or declined
respectively. The government has revised the budget in order to bring the revenues and expenditures figures closer to reality,
maintained the fiscal deficit target of 3% unchanged, but also adopted compensatory measures-in line with our expectations- in order
to maintain fiscal performance in check. Thus, the government increased excise taxes for fuels as of September (that will bring prices
back to the levels of 2016) and also facilitated the distribution of additional dividends from the state-owned enterprises. Nevertheless,
we still doubt if those will be enough to attain the target given the public expenses dynamics. If this proves to be the case, practice has
shown that this usually results in the under execution of the public investments program (4.2% of GDP in 2017) at the expense of
neglecting infrastructure.
Inflation edged down to -0.2% MoM/+1.2% YoY in August, down from +0.3% MoM/+1.4% YoY in July, below market consensus
expectations (0.0% MoM/+1.45% YoY). The decline was primarily due to the monthly decline in the volatile food component as a
result of the increased supply from the summer harvest. As a result, food prices declined on a monthly basis by -0.9% MoM/+1.6%
YoY, down from -0.4% MoM/+2.4% YoY in July driven by lower vegetables (-7.7% MoM) and fruit prices (-9.2% MoM).
Meanwhile, non-food prices were up by +0.1% MoM/+1.6% YoY, compared to +0.9% MoM/+1.7% YoY in July, adding 0.6 ppts to
the annual figure, reflecting the pass through of higher oil prices worldwide. On top, services’ prices increased on a monthly basis by
+0.2% MoM/-0.5% YoY in July vs. +0.1% MoM/-0.8% YoY driven by higher prices for urban transportation, rents and sewage
services. Overall, underlying inflationary pressures are building up. The adjusted Core CPI (excluding administered and volatile prices,
alcohol and tobacco) has already reached 1.6% YoY in July, the highest level since August 2013, up from 1.1% YoY in March and
only 0.3% YoY in last December. The PPI (Producer Price Index) remained elevated at 3% YoY in July vs. only 0.9% YoY in last
December, driven by higher energy and intermediary goods’ prices. The regulated price increase for energy as of July and the
prospective increase of excise duty for fuel in September are going to push the headline even higher at 1.9% (according to the revised
NBR forecast) by year end. In any case, given the projected inflation trajectory and the elevated fiscal risks, it is highly likely that NBR
will initiate the tightening cycle in Q4, most probably by increasing the interest rate corridor instead of the KPR, currently at 1.75%.
Ioannis Gkionis ([email protected])
(+30) 210 337 1225
12
September 2017
FIGURE 21: Growth performance Romania vs. EU28 2010-2018
Source: Eurostat, Eurobank Research
FIGURE 22: Sentiment indicators 2013-2017
Source: Eurostat, Ecowin Reuters, Eurobank Research
FIGURE 23: Monetary policy & FX rate 2013-2017
Source: Bloomberg, Eurobank Research
FIGURE 24: Inflation components 2012-2017
Source: National statistics, Eurobank Research
2015 2016 2017e 2018f
Real GDP (yoy%) 3.7 4.8 5.5 4.0
Inflation (yoy%)
CPI (annual average) -0.6 -1.6 1.4 3.1
CPI (end of period) -0.9 -0.5 1.8 3.0
Fiscal Accounts (%GDP, Cash Basis)
General Government Balance -1.9 -2.4 -3.7 -3.8
Gross Public Debt (including guarantees) 39.4 39.1 40.5 41.7
Labor Statistics (annual avg,%)
Unemployment Rate (ILO, % of labor force) 6.8 5.9 5.3 5.2
Compensation of employees/head 0.9 10.3 9.5 6.5
External Accounts
Current Account (%GDP, BPM5) -1.1 -2.2 -3.0 -2.8
Net FDI (EUR bn) 2.7 3.9 4.0 Na
FDI / Current Account (%) 157.1 93.8 72.7 Na
FX Reserves (EUR bn) 32.2 34.3 35.5 Na
Domestic Credit 2013 2014 2015 2016
Total Credit (%GDP) 47.0 44.4 43.9 41.2
Credit to Enterprises (%GDP) 18.0 15.7 15.5 13.4
Credit to Households (%GDP) 16.5 15.4 15.4 14.9
FX Credit/Total Credit (%, private) 60.9 56.2 49.3 42.8
Private Sector Credit (yoy) -3.3 -3.1 3.0 1.2
Loans to Deposits (%) 118.4 106.3 106.6 114.3
Financial Markets Current 3M 6M 12M
Policy Rate 1.75 1.75 2.00 2.50
EUR/RON 4.58 4.62 4.65 4.65
Romania: Macro & Market Data
Source: National Authorities, EC, IMF, Eurobank Research
13
September 2017
Serbia (Ba3/BB-/BB-)
One-off factors in H1 2017 prompt downward revisions in full-year growth forecasts
Economic activity slows down in H1
2017 on adverse weather conditions
Central Bank resumes rate cutting
cycle on weaker growth, stronger
dinar
Final Q2 national accounts data confirmed that real GDP growth came in at 1.3%YoY, in line with the preliminary estimate. Albeit
having slightly picked up pace from 1.0%YoY in Q1, the data indicates that economic activity in H1 2017 slowed down to 1.2%YoY
from 2.9%YoY over the same period a year earlier and 2.6% in H2 2016. Adverse weather conditions in the first half of the year
appear to have taken a significant toll on economic activity. From the production side, very cold temperatures in the winter weighed on
agriculture, construction, mining and energy. Subsequently, the summer drought decimated cops and resulted in a 10.0%YoY decline
in Q2 in agricultural activity that followed an 8.0%YoY plunge in Q1. The CESEE region reportedly endured one of the hottest and
driest summers in years, with Serbia being amongst the countries hit the most. From the expenditure side, household consumption has
gained momentum in H1 2017, while growth in investments and government expenditure slowed down. Strong imports dynamics
(11.7%YoY in Q117 & 10.3%YoY in Q217), reflecting strengthening domestic demand and higher energy imports, counterbalanced
the positive impact from robust exports’ growth (9.7%YoY in Q117 & 11.5%YoY in Q2). High frequency indicators signal that the
manufacturing – despite disruptions in energy output - and trade sectors continued to perform well in Q3. Industrial production rose by
5.6%YoY on average in July and August following average growth of 1.9%YoY in H1 2017. Retail sales rose by 4.3%YoY over
these two months after a 3.6%YoY average advance in January-June 2017. Labour market conditions also remain firm, with net wages
rising by an average of 4.1%YoY in July and August vs. 4.4%YoY over the first six months of the year. The unemployment rate fell to
11.8% in Q2, the lowest since 2014 when new methodology was introduced, while employment continued to improve. Nonetheless,
the negative impact from the summer drought on agricultural output, electricity disruptions and a month-long strike in Fiat Chrysler
Automobiles Serbia (FCAS), which ended in late July, are likely to continue having a negative impact in Q3 and suggest that the
earlier official 3.0% real GDP growth forecast for the whole of the year is now out of reach. This was also acknowledged by PM Ana
Brnabic, who expressed hopes for growth of 2.5% and announced government plans to adopt short-term measures. This unplanned
expenditure is allowed by the ongoing fiscal consolidation and budget outperformance and is estimated to provide an additional
impulse of 0.2-0.3% to GDP. The revised government growth forecast still remains rather optimistic in our view, due to the limited
amount of time left in the remainder of the year. Also, the rather unrealistic assumption of growth of near 4% is required in each of the
remaining two quarters in order to achieve full-year 2.5% figure. Even the IMF’s 2.3% recently revised projection seems rather
optimistic. Yet, we maintain our 3.0% forecast for 2018, as growth is likely to continue being supported by improving aggregate
demand and recovering energy production, while this year’s headwinds seem to mostly stem from one-off factors.
The recent slowdown in economic activity in tandem with a firmer dinar provided leeway to the National Bank of Serbia to resume
cutting interest rates in September after more than a year of inertia. Confounding our and market expectations for stable rates, the
Central Bank cut the key policy rate by 25bps to a new lifetime low of 3.75%. It had kept interest rates stable since July 2016, when it
had last rendered a 25bps cut. Behind this latest decision, the MPC cited low inflation pressures arguing that the cut will provide an
additional boost to credit and economic activity. Albeit, the less aggressive than earlier anticipated Fed monetary tightening and
continuous accommodative ECB stance were probably also taken into account, the dinar’s persistent appreciation over recent months
is likely to have been among the most important factors in the latest MPC decision. The currency has appreciated by approximately 5%
against the euro from lows hit in April and reached 3-year highs near 118/€ in September. The high level of Euroization in the
economy impedes the monetary policy transmission mechanism, with the impact stemming from dinar fluctuations thus being
augmented. The Central Bank has repeatedly intervened in the FX markets in order to halt the domestic currency’s appreciation trend.
So far this year, it has purchased more than €1bn in order to mitigate excessive daily FX fluctuations and effectively ease monetary
tightening pressures as a result of a firmer dinar. Also supporting the case for September’s cut, price pressures appear to be gradually
easing of late. Headline CPI has moved within the target tolerance band of 3.0%±1.5 pps since October 2016 and reached a 4-year
high at 4.0%YoY in April. However, the index pulled back towards 2.5% in August. Meanwhile, core inflation pressures remain
relatively subdued, with CPI excluding food, energy, alcohol and cigarettes having slid to 1.5%YoY in August, while inflation
expectations remain well anchored within the tolerance band. The Central Bank highlighted these developments in September’s
meeting, reiterating that it expects inflation to remain within the target tolerance band in the period ahead and further slowdown as of
early 2018 on the back of favorable base effects. Yet, it acknowledged that the conduct of monetary policy requires caution amid
ongoing uncertainty regarding movements in the international commodity prices and financial markets and cited risks surrounding the
impact of diverging monetary policies pursued by major central banks on capital flows to emerging economies. The next MPC
meeting is scheduled to take place on October 9. Given the deceleration in inflation, further monetary easing cannot be ruled out in the
coming months. If so, it is likely to prove modest, as private consumption is on a recovery mode and external risks linger.
Galatia Phoka ([email protected])
+30 210 3718922

14
September 2017
2015 2016 2017 2018
Real GDP (yoy%) 0.8 2.8 2.0 3.0
Inflation (yoy%)
HICP (annual average) 1.4 1.1 3.0 3.0
HICP (end of period) 1.5 1.6 2.3 3.0
Fiscal Accounts (%GDP)
Consolidated Government Deficit -3.7 -1.3 -0.5 -0.6
Gross Public Debt 74.6 73.6 69.0 67.0
Labor Statistics (%)
Unemployment Rate (%of labor force) 17.7 15.3 12.5 11.0
Wage Growth (total economy) -2.1 2.5 0.9 1.5
External Accounts
Current Account (% GDP) -4.7 -4.0 -4.0 -3.9
Net FDI (EUR bn) 1.8 1.9 1.7 1.6
FDI / Current Account (%) 114.9 137.5 120.0 110.3
FX Reserves (EUR bn) 10.4 10.2 10.0 10.1
Domestic Credit 2013 2014 2015 2016
Total Credit (%GDP) 57.0 61.0 62.3 63.6
Credit to Enterprises (%GDP) 28.7 29.2 28.7 26.8
Credit to Households (%GDP) 17.4 18.6 18.7 19.9
Private Sector Credit (yoy%) -4.8 0.5 3.3 5.6
Loans to Deposits (%) 113.8 102.5 99.0 92.0
Financial Markets Current 3M 6M 12M
Policy Rate 3.75 3.50 3.50 4.00
EUR/RSD 119.10 120.00 121.50 122.00
Serbia: Eurobank Forecasts
Source: National Authorities, EC, IMF, Eurobank Research
FIGURE 25: … and, among other, relatively subdued inflation pressures…
-5%
0%
5%
10%
15%
20%
Jan
-12
Ap
r-12
Jul-
12
Oct
-12
Jan
-13
Ap
r-13
Jul-
13
Oct
-13
Jan
-14
Ap
r-14
Jul-
14
Oct
-14
Jan
-15
Ap
r-15
Jul-
15
Oct
-15
Jan
-16
Ap
r-16
Jul-
16
Oct
-16
Jan
-17
Ap
r-17
Jul-
17
HICP
Headline Inflation target
Food and non-alcoholic beverages
Housing, water, electricity, gas and other fuels
Inflation tolerance band
Source: National Authorities, EC, IMF, Eurobank Research
FIGURE 26: … provided leeway for resumption of Central Bank rate cuts
2
4
6
8
10
12
14
16
18
20
Sep
-06
Mar
-07
Sep
-07
Mar
-08
Sep
-08
Mar
-09
Sep
-09
Mar
-10
Sep
-10
Mar
-11
Sep
-11
Mar
-12
Sep
-12
Mar
-13
Sep
-13
Mar
-14
Sep
-14
Mar
-15
Sep
-15
Mar
-16
Sep
-16
Mar
-17
Sep
-17
Source: National Authorities, Eurobank Research
FIGURE 27: Monetary tightening pressures instigated by firmer dinar…
100
105
110
115
120
125
-10
-8
-6
-4
-2
0
2
4
6
8
Jan-10 Jan-11 Jan-12 Jan-13 Jan-14 Jan-15 Jan-16 Jan-17
Monetary Conditions Index (%, lhs) EUR/RSD exchange rate (rhs)
Restrictive monetary conditions
Expansionary monetary conditions
Source: National Authorities, EC, IMF, Eurobank Research
FIGURE 28: Trade sector continued to perform well in Q3, while labour market
conditions remain firm
-15
-10
-5
0
5
10
15
Feb
-12
Jun
-12
Oct
-12
Feb
-13
Jun
-13
Oct
-13
Feb
-14
Jun
-14
Oct
-14
Feb
-15
Jun
-15
Oct
-15
Feb
-16
Jun
-16
Oct
-16
Feb
-17
Jun
-17
Gross Wages (YoY%, real) 3MMA
Retail Trade (YoY%, real)
Source: National Authorities, EC, IMF, Eurobank Research

15
September 2017
Eurobank Ergasias S.A, 8 Othonos Str, 105 57 Athens, tel: +30 210 33 37 000, fax: +30 210 33 37 190, email: [email protected]
Eurobank Economic Analysis and Financial Markets
Research More research editions available at http://www.eurobank.gr/research
Daily Overview of Global markets & the SEE Region: Daily overview of key
macro & market developments in Greece, regional economies & global markets
Greece Macro Monitor: Periodic publication on the latest economic & market
developments in Greece
Regional Economics & Market Strategy Monthly: Monthly edition on
economic & market developments in the region
Global Economy & Markets Monthly: Monthly review of the international
economy and financial markets
Subscribe electronically at
Follow us on twitter: https://twitter.com/Eurobank_Group
Eurobank Economic Analysis and Financial Markets Research
Dr. Platon Monokroussos: Group Chief Economist
[email protected], + 30 210 37 18 903
Dr. Tassos Anastasatos: Deputy Chief Economist [email protected], + 30 210 33 71 178
Anna Dimitriadou: Economic Analyst
[email protected], + 30 210 3718 793
Ioannis Gkionis: Senior Economist
[email protected] + 30 210 33 71 225
Stylianos Gogos: Economic Analyst
[email protected] + 30 210 33 71 226
Olga Kosma: Research Economist
[email protected] + 30 210 33 71 227
Research Team
Marianna Papoutsaki
[email protected] + 30 210 33 71 224
Paraskevi Petropoulou: G10 Markets Analyst
[email protected], + 30 210 37 18 991
Galatia Phoka: Research Economist
[email protected], + 30 210 37 18 922
Theodoros Stamatiou: Senior Economist
[email protected], + 30 210 3371228
Elia Tsiampaou: Economic Analyst
[email protected], +30 210 3371207