ANNUAL REPORT 2015 - Nissan · PDF fileANNUAL REPORT 2015. ... Nissan’s plans and...
21
ANNUAL REPORT 2015
Transcript of ANNUAL REPORT 2015 - Nissan · PDF fileANNUAL REPORT 2015. ... Nissan’s plans and...

ANNUAL REPORT 2015
CONTENTS TOP MESSAGECORPORATE FACE TIME
Go back one page Jump to information on the web
Return to previously viewed page
Go forward one page
l Section Tabs
l Navigation Buttons l Link Buttons
CONTENTS
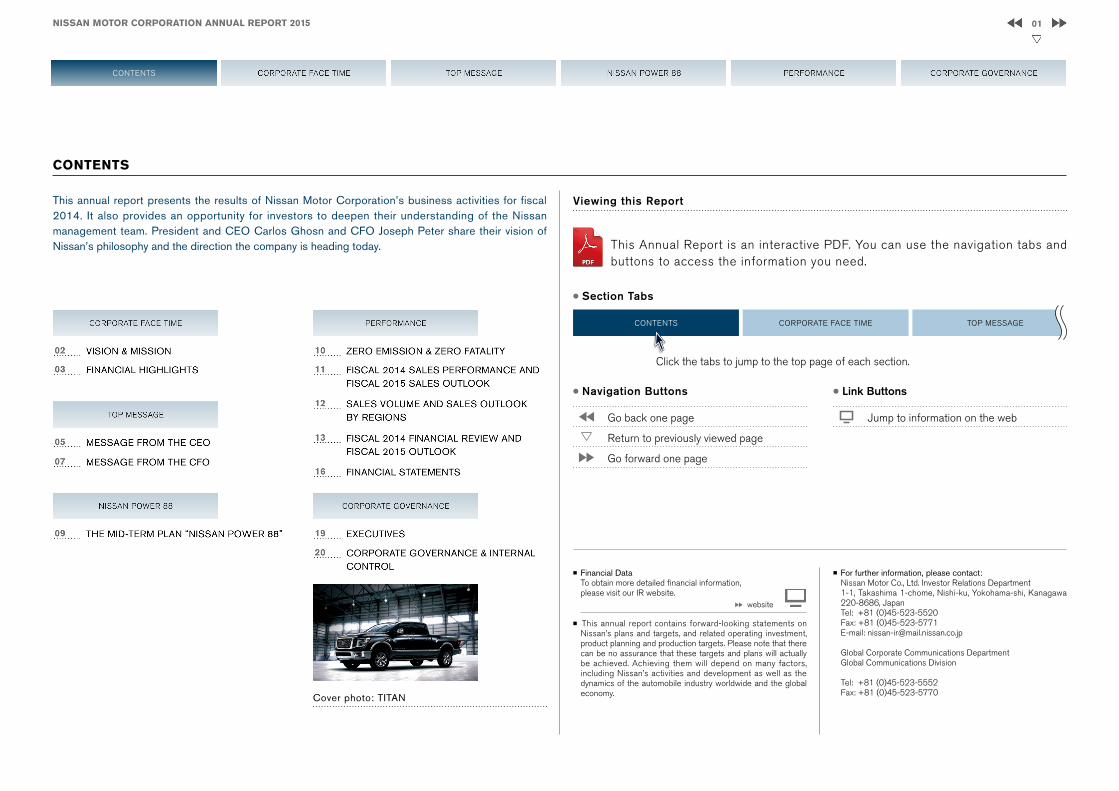
Viewing this Report
This Annual Report is an interactive PDF. You can use the navigation tabs and buttons to access the information you need.
This annual report presents the results of Nissan Motor Corporation’s business activities for fiscal 2014. It also provides an opportunity for investors to deepen their understanding of the Nissan management team. President and CEO Carlos Ghosn and CFO Joseph Peter share their vision of Nissan’s philosophy and the direction the company is heading today.
Cover photo: TITAN
Click the tabs to jump to the top page of each section.
■ Financial DataTo obtain more detailed financial information,please visit our IR website.
■ This annual report contains forward-looking statements on Nissan’s plans and targets, and related operating investment, product planning and production targets. Please note that there can be no assurance that these targets and plans will actually be achieved. Achieving them will depend on many factors, including Nissan’s activities and development as well as the dynamics of the automobile industry worldwide and the global economy.
■ For further information, please contact:Nissan Motor Co., Ltd. Investor Relations Department1-1, Takashima 1-chome, Nishi-ku, Yokohama-shi, Kanagawa 220-8686, JapanTel: +81 (0)45-523-5520Fax: +81 (0)45-523-5771E-mail: [email protected]
Global Corporate Communications DepartmentGlobal Communications Division
Tel: +81 (0)45-523-5552Fax: +81 (0)45-523-5770
website
01NISSAN MOTOR CORPORATION ANNUAL REPORT 2015
CONTENTS

VISION MISSIONNissan: Enriching People’s LivesNissan has a clear vision for the future, and − with our Alliance partner,
Renault − we are working with passion to achieve it. Our mission is to enrich
people’s lives, building trust with our employees, customers, dealers, partners,
shareholders and the world at large.
Nissan provides unique and innovative automotive products and services that deliver superior measurable values to all stakeholders* in alliance with Renault.* Our stakeholders include customers, shareholders, employees, dealers and suppliers, as well
as the communities where we work and operate.
02NISSAN MOTOR CORPORATION ANNUAL REPORT 2015
CORPORATE FACE TIME

2014 2013 2012*2 2011 2010For the years ended Mar. 31, 2015 Mar. 31, 2014 Mar. 31, 2013 Mar. 31, 2012 Mar. 31, 2011
Net sales*1 Millions of yen 11,375,207 10,482,520 8,737,320 9,409,026 8,773,093
Ordinary income Millions of yen 694,232 527,189 504,421 535,090 537,814
Net income Millions of yen 457,574 389,034 341,117 341,433 319,221
Comprehensive income Millions of yen 719,903 796,533 721,860 290,600 189,198
Net assets Millions of yen 5,247,262 4,671,528 4,036,030 3,449,997 3,273,783
Total assets Millions of yen 17,045,659 14,703,403 12,442,337 11,072,053 10,736,693
Net assets per share Yen 1,152.83 1,035.06 890.38 750.77 703.16
Basic net income per share Yen 109.15 92.82 81.39 81.67 76.44
Diluted net income per share*3 Yen 109.14 92.82 - - -
Net assets as a percentage of total assets % 28.4 29.5 30.0 28.4 27.4
Return on equity % 10.0 9.6 9.9 11.2 11.3
Price earnings ratio Times 11.21 9.91 11.08 10.79 9.65
Cash flows from operating activities Millions of yen 692,747 728,123 412,257 696,297 667,502
Cash flows from investing activities Millions of yen (1,022,025) (1,080,416) (838,047) (685,053) (331,118)
Cash flows from financing activities Millions of yen 245,896 396,925 433,817 (308,457) 110,575
Cash and cash equivalents at end of fiscal year Millions of yen 802,612 832,716 711,901 840,871 1,153,453
Employees*4 Number 149,388 142,925 130,274 157,365 155,099
(20,381) (21,750) (22,442) (34,775) (27,816)
( ) represents the average number of part-time employees not included in the above numbers 151,710 147,939 136,625 161,513 159,398
(20,748) (22,642) (23,307) (35,099) (28,089)
Notes:*1 Net sales are presented exclusive of consumption tax.*2 Effective from fiscal 2013, International Financial Reporting Standards (IFRS) 11 Joint Arrangements, which was released on May 12, 2011, and International Accounting Standards (IAS) 19 Employee Benefits,
which was released on June 16, 2011, have been applied in some foreign subsidiaries and affiliates, and key financial data and trends for fiscal 2012 are adjusted.*3 Diluted net income per share for fiscal 2010, fiscal 2011 and fiscal 2012 is not presented because the Company had no securities with dilutive effects.*4 Staff numbers, which are presented as the lower numbers in the “Employees” line, include those of unconsolidated subsidiaries accounted for by the equity method as reference data.
FINANCIAL HIGHLIGHTS
03NISSAN MOTOR CORPORATION ANNUAL REPORT 2015
CORPORATE FACE TIME

0
800
200
400
600
2010 2011 2012 2013 2014
537.5 545.8 523.5
605.7
718.6
498.4
589.6
200
100
300
400
500
02010 2011 2012 2013 2014
319.2341.4 342.4
389.0 389.0
457.6 457.6
(Billions of yen) (Billions of yen)
3,000
6,000
9,000
12,000
15,000
02010 2011 2012 2013 2014
8,773.19,409.0 9,629.6
11,434.8 12,406.3
11,375.210,482.5
0
30
20
50
40
10
2010 2011 2012 2013 2014
10
20
25
3330
0
100
200
300
400
500
2010 2011 2012 2013 2014
459.3
379.5
208.1
352.3 365.8
199.7
248.6
0
1,200
800
1,600
400
2010 2011 2012 2013 2014
293.3
619.8
915.9
1,133.7
1,524.5
1,390.1
1,015.9
Net IncomeNet Sales
Free Cash Flow (Auto Business)
Operating Profit
Net Cash (Auto Business)
(Billions of yen)
(Billions of yen) (Billions of yen)
(FY) (FY) (FY)
(FY) (FY)
■ Management pro forma basis*
■ China JV Equity basis
■ Management pro forma basis*
■ China JV Equity basis
■ Management pro forma basis*
■ China JV Equity basis
■ Management pro forma basis*
■ China JV Equity basis
■ Management pro forma basis*
■ China JV Equity basis
Dividend per Share
(Yen)
(FY)
Net sales climbed 892.7 billion yen for the year to reach 11,375.2 billion yen. Operating profit was 589.6 billion yen, for a profit margin of 5.2%.Under the forecast of consolidated operating results after fiscal 2013, the consolidation method for Dongfeng Motor Co.,Ltd. has been changed from proportionate consolidation to the equity method in comparison with the results until fiscal 2012 by the adoption of IFRS11.
Key figures for fiscal 2014(China JV Equity Basis)
* Based on continuation of proportionate consolidation of China JV
04NISSAN MOTOR CORPORATION ANNUAL REPORT 2015
CORPORATE FACE TIME
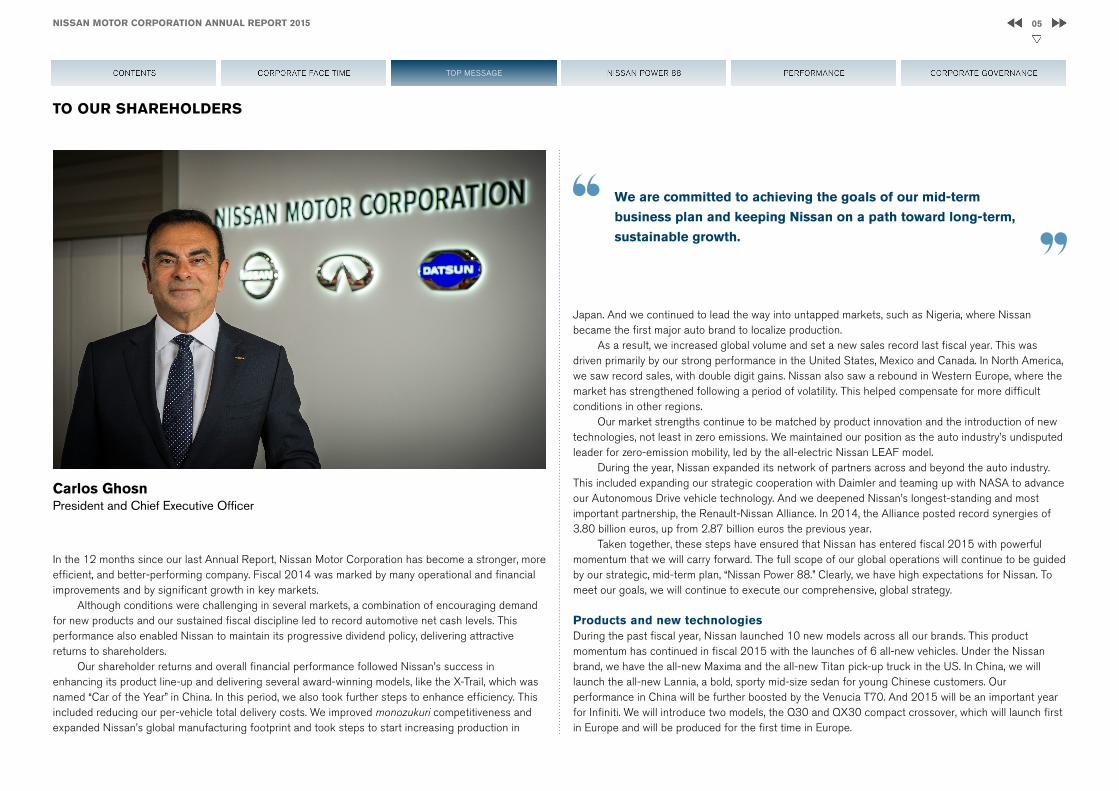
Carlos GhosnPresident and Chief Executive Officer
TO OUR SHAREHOLDERS
In the 12 months since our last Annual Report, Nissan Motor Corporation has become a stronger, more efficient, and better-performing company. Fiscal 2014 was marked by many operational and financial improvements and by significant growth in key markets.
Although conditions were challenging in several markets, a combination of encouraging demand for new products and our sustained fiscal discipline led to record automotive net cash levels. This performance also enabled Nissan to maintain its progressive dividend policy, delivering attractive returns to shareholders.
Our shareholder returns and overall financial performance followed Nissan’s success in enhancing its product line-up and delivering several award-winning models, like the X-Trail, which was named “Car of the Year” in China. In this period, we also took further steps to enhance efficiency. This included reducing our per-vehicle total delivery costs. We improved monozukuri competitiveness and expanded Nissan’s global manufacturing footprint and took steps to start increasing production in
We are committed to achieving the goals of our mid-term
business plan and keeping Nissan on a path toward long-term,
sustainable growth.
Japan. And we continued to lead the way into untapped markets, such as Nigeria, where Nissan became the first major auto brand to localize production.
As a result, we increased global volume and set a new sales record last fiscal year. This was driven primarily by our strong performance in the United States, Mexico and Canada. In North America, we saw record sales, with double digit gains. Nissan also saw a rebound in Western Europe, where the market has strengthened following a period of volatility. This helped compensate for more difficult conditions in other regions.
Our market strengths continue to be matched by product innovation and the introduction of new technologies, not least in zero emissions. We maintained our position as the auto industry’s undisputed leader for zero-emission mobility, led by the all-electric Nissan LEAF model.
During the year, Nissan expanded its network of partners across and beyond the auto industry. This included expanding our strategic cooperation with Daimler and teaming up with NASA to advance our Autonomous Drive vehicle technology. And we deepened Nissan’s longest-standing and most important partnership, the Renault-Nissan Alliance. In 2014, the Alliance posted record synergies of 3.80 billion euros, up from 2.87 billion euros the previous year.
Taken together, these steps have ensured that Nissan has entered fiscal 2015 with powerful momentum that we will carry forward. The full scope of our global operations will continue to be guided by our strategic, mid-term plan, “Nissan Power 88.” Clearly, we have high expectations for Nissan. To meet our goals, we will continue to execute our comprehensive, global strategy.
Products and new technologiesDuring the past fiscal year, Nissan launched 10 new models across all our brands. This product momentum has continued in fiscal 2015 with the launches of 6 all-new vehicles. Under the Nissan brand, we have the all-new Maxima and the all-new Titan pick-up truck in the US. In China, we will launch the all-new Lannia, a bold, sporty mid-size sedan for young Chinese customers. Our performance in China will be further boosted by the Venucia T70. And 2015 will be an important year for Infiniti. We will introduce two models, the Q30 and QX30 compact crossover, which will launch first in Europe and will be produced for the first time in Europe.
05NISSAN MOTOR CORPORATION ANNUAL REPORT 2015
TOP MESSAGE

Nissan remains at the forefront of zero-emission technologies, producing and selling vehicles that contribute to a cleaner environment. The Nissan LEAF, the world’s most popular all-electric vehicle, will pass the milestone of 200,000 unit sales in fiscal 2015. Our zero-emission product portfolio has been augmented by the launch of the e-NV200 light commercial vehicle and the Venucia e30 in China.
Nissan has been one of the foremost advocates for the development of recharging networks. There are now more than 14,000 electric vehicle (EV) chargers, not including home-chargers, in Japan. During fiscal 2015, the number of chargers in Japan will increase even further, and we will continue to develop our battery and vehicle technologies even further.
We believe that, in the near future, Nissan can provide EV drivers with even greater “peace of mind” range, by offering comparative mobility to today’s conventional vehicles. Our research is aimed at delivering exceptional range, well beyond anything on the road today.
Nissan is exploring new materials and chemistry solutions in order to make thinner, lighter weight and less costly batteries. We foresee the day when you leave your home with a full charge, and are able to go about your day with no concerns then return home with ample charge.
The current fiscal year will also see further progress in the deployment of Autonomous Drive systems – another pillar of our technology strategy. It reinforces our commitment to leading the way toward a “zero-fatality, zero-emission” future. Our goal is for Nissan to be ready to deliver Autonomous Drive vehicles by 2020. Until then, we will introduce components of this technology on a regular basis. Starting this year in Japan, we will apply our emergency-brake technology as a standard feature on our highest volume models. This will be followed in 2016 by the introduction of traffic jam technology, which will enable cars to drive autonomously and safely on congested highways. In 2018, we will introduce multiple-lane controls technology, which allows cars to autonomously negotiate hazards and change lanes on highways. And by the end of the decade, we will introduce intersection-autonomy, enabling vehicles to negotiate city cross-roads without driver intervention. This will empower customers to drive with greater confidence, ease and safety.
Increased visibility of products and brandsDelivering innovative, exciting products and technologies will continue to be the core of Nissan’s business. To realize the full benefit of these activities, we also need to make sure that potential customers are familiar with our brands and aware of our vehicles and technologies.
That is why we are backing up our monozukuri activities with bold, targeted kotozukuri activities. One particular area of strength is our sports partnerships, such as with the Yokohama F-Marinos, City Football Group, UEFA Champions League and Infiniti Red Bull Racing, which have resulted in the improvement of Nissan’s overall opinion scores and increased awareness of the Infiniti brand.
Renault – Nissan AllianceAnother area of continued strength is our focus on Alliance-driven synergies. Since the Renault-Nissan Alliance was established almost 16 years ago, it has become the fourth-largest automotive group in
the world. Last year, we sold 8.5 million vehicles. With a total of eight brands, the Alliance represents 10% global market share.
The success of the Alliance has attracted other partners, but we know we can grow further and achieve more.
To maximize Alliance synergies, last year, we converged four key functions in Purchasing, Manufacturing and Logistics, Engineering; and Human Resources. This has put us on track to over achieve our target of a minimum of 4.3 billion euros in synergies by the end of fiscal year 2016.
Year aheadIn fiscal 2015, we expect to outperform the industry sales pace and deliver record-high revenue and solid profitability. Globally, we anticipate that total industry sales volumes will increase 0.1% to 85.4 million units. With a number of new models launching from Nissan and Infiniti, we project our sales to rise by 4.4% to 5.55 million units.
Although market conditions remain challenging in Japan, Russia and Brazil, we expect to make further progress in the US, China and Europe. We also have high expectations for Infiniti and Datsun. As a result of all these factors, the quality of our earnings will continue to improve in fiscal 2015 and that we are on the right track with our mid-term strategy. Based on our performance outlook for fiscal 2015, and our expectations for continued profitability and solid free cash flow, we project an increase in the annual dividend by 27% to 42 yen per share.
ConclusionNissan has begun this new fiscal year in a position of strength. We are committed to achieving the goals of our mid-term business plan and keeping Nissan on a path toward long-term, sustainable growth.
We have the resources, the talent and the determination to meet our objectives. And we will continue to deliver for our customers and our shareholders. Thank you, once again, for your support for Nissan Motor Corporation.
Carlos GhosnPresident and Chief Executive OfficerNissan Motor Co., Ltd.
06NISSAN MOTOR CORPORATION ANNUAL REPORT 2015
TOP MESSAGE

Joseph G. PeterChief Financial Officer
MESSAGE FROM THE CFO
Nissan Motor Corporation has reinforced its position as a leading global automotive company, delivering solid business and financial results in fiscal 2014.
Despite challenging conditions in some regions, Nissan’s global unit sales in fiscal 2014 reached 5.32 million units, an all-time record.
In terms of our financial performance (based on the equity method of accounting for our China Joint Venture), consolidated net revenues increased by 892.7 billion yen to 11.4 trillion yen. Operating profit rose by 18.3% to 589.6 billion yen and net income grew by 17.6% to 457.6 billion yen.
Automotive free cash flow was a positive 365.8 billion yen and we continued to strengthen the balance sheet ending the period with net cash of 1.4 trillion yen for our automotive business.
Our strong results reflect market growth in the US, Mexico, the UK, Russia and other parts of Europe, where award-winning vehicles such as X-TRAIL and Qashqai continued to generate demand. Orders for these and other new products compensated for difficult conditions in some other parts of the world.
The results also reflect our continued focus on cost efficiency, which contributed 112.7 billion yen in year-over-year operating profit improvement, mainly through our purchasing material cost-reduction efforts.
On a management pro-forma basis – reflecting the proportional consolidation accounting method of our joint venture in China, and which is consistent with the methodology used in developing the Nissan Power 88 Mid-term Plan objectives – net revenues increased by 8.5% to 12.4 trillion yen. Pro-forma operating profit rose by 18.6% to 718.6 billion yen. On this measure, we ended the fiscal period with net cash from our automotive operations of 1.5 trillion yen.
The positive results in fiscal 2014 provide a solid base as we follow the path toward our Power 88 goals.
Looking toward fiscal 2015, we anticipate total industry volumes will increase slightly to 85.44 million units. Of that total, we project that Nissan’s global retail volumes will rise by 4.4% to 5.55 million units, driven by anticipated strong demand for our new products and continued execution of our Power 88 mid-term plan strategies and related initiatives.
Given this volume outlook, we expect net revenues to grow by 6.4% to 12.10 trillion yen for the 12 months ending March 31, 2016, calculated under the equity accounting method for our joint venture in China. Operating profit are targeted to reach 675 billion yen, representing a margin of 5.6%. Net income is expected to reach 485 billion yen, an annual increase of 6%.
We will enhance enterprise value, maintain a strong balance
sheet and provide shareholders an attractive dividend.
07NISSAN MOTOR CORPORATION ANNUAL REPORT 2015
TOP MESSAGE

On the “management pro-forma” basis (reflecting proportional consolidation of our China Joint Venture), we anticipate net revenues will increase by 7% to 13.27 trillion yen. Operating profit is forecast to grow by 16.2% to 835 billion yen, resulting in an operating profit margin of 6.3%. Net income is predicted to grow 6% to 485 billion yen.
Our financial priorities remain focused on ensuring sustainable profitable growth, generating positive automotive free cash flow and maintaining a strong balance sheet with sufficient levels of liquidity.
We will also continue to invest with discipline. In recent years, Nissan has invested in capacity in key markets for the mid- to long-term. We have expanded our manufacturing capacity, and we now are poised to take advantage of the investments made during the first half of our mid-term plan.
Overall, this means that Nissan can look ahead with confidence and remains on the right path towards the goals of our Power 88 mid-term plan.
This mid-term plan will see Nissan maintain its product offensive, following on from new models launched in the last fiscal year. We also anticipate further progress in the luxury segment through Infiniti and in emerging markets with our entry-level Datsun brand.
These efforts coincide with continued targeted investments in new technologies, particularly autonomous drive systems, and our continued deployment of the world’s best-selling zero-emission electric vehicles. Progress in these areas will complement continued contributions from our Alliance strategy, which is forecast to deliver increased synergies and global scale as we cooperate more closely in converged functions.
Reflecting confidence in our mid-term plan and based on our healthy financial position and outlook for fiscal year 2015, including continued solidly positive free cash flow generation, we announced in May this year our intention to increase the dividend by 27% to 42 yen per share for fiscal 2015.
As we’ve stated previously, our dividend policy for the remainder of the mid-term plan period targets a minimum pay-out ratio of 30% of net income. This reflects our recognition – shared by asset managers – that Nissan should continue to deliver an attractive return to shareholders.
In conclusion, our mid-term business plan is designed to significantly enhance shareholder value through business growth that drives higher revenue, profits and strong sustained free cash flow generation. We will enhance enterprise value, maintain a strong balance sheet and provide shareholders an attractive dividend.
Success in meeting our Power 88 goals should allow Nissan to continue to enhance returns to shareholders, realized through increased dividends and an improved market valuation.
Joseph G. PeterChief Financial Officer
08NISSAN MOTOR CORPORATION ANNUAL REPORT 2015
TOP MESSAGE
THE MID-TERM PLAN “NISSAN POWER 88”
1
Strengthening brand power
4
Zero-emission leadership
2
Enhancing sales power
5
Business expansion
3
Enhancing quality
6
Cost leadership
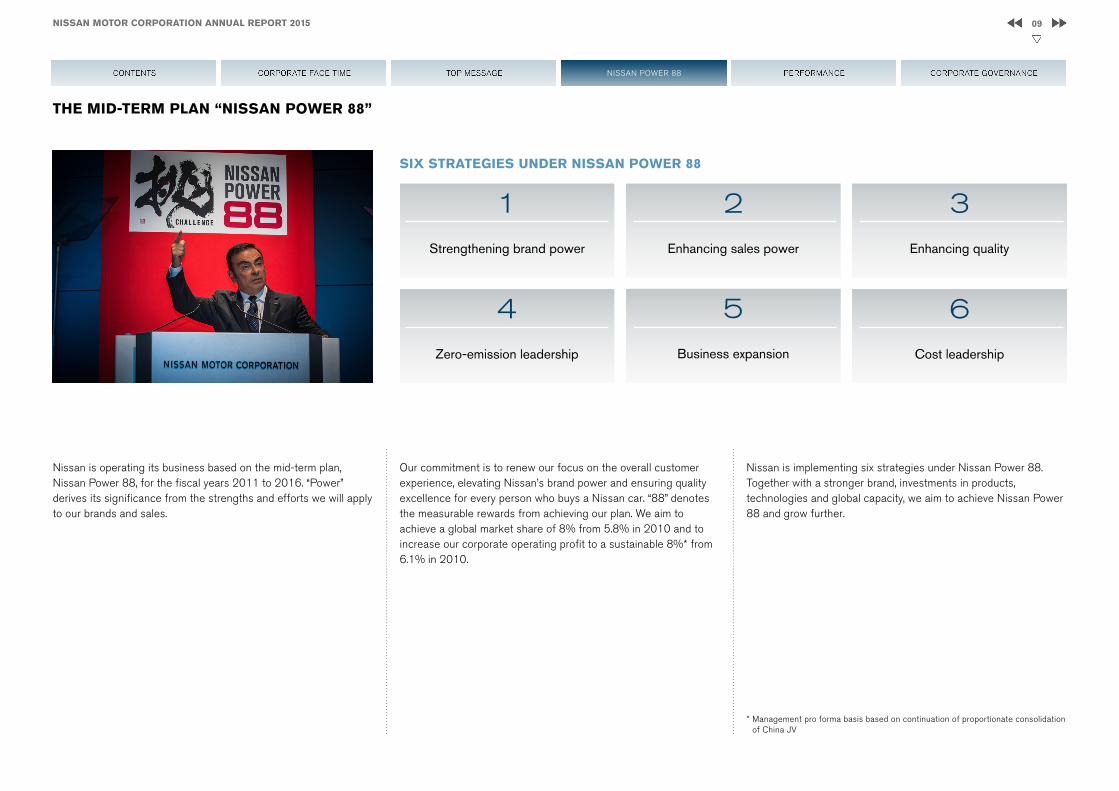
SIX STRATEGIES UNDER NISSAN POWER 88
Our commitment is to renew our focus on the overall customer experience, elevating Nissan’s brand power and ensuring quality excellence for every person who buys a Nissan car. “88” denotes the measurable rewards from achieving our plan. We aim to achieve a global market share of 8% from 5.8% in 2010 and to increase our corporate operating profit to a sustainable 8%* from 6.1% in 2010.
Nissan is operating its business based on the mid-term plan, Nissan Power 88, for the fiscal years 2011 to 2016. “Power” derives its significance from the strengths and efforts we will apply to our brands and sales.
Nissan is implementing six strategies under Nissan Power 88.Together with a stronger brand, investments in products, technologies and global capacity, we aim to achieve Nissan Power 88 and grow further.
* Management pro forma basis based on continuation of proportionate consolidation of China JV
09NISSAN MOTOR CORPORATION ANNUAL REPORT 2015
NISSAN POWER 88

ZERO EMISSION & ZERO FATALITY
As the industry leader in zero-emission mobility, Nissan is committed to the penetration of electric vehicles (EVs) in the market. It is also striving to achieve virtually zero fatalities and serious injuries in accidents involving its vehicles.
Nissan’s “Double Zero” Target
Zero EmissionsThe Nissan LEAF is the best-selling EV in the world. This year the company is targeting cumulative global sales of more than 200,000 vehicles. Nissan has also extended its zero-emission technology to the e-NV200 light commercial vehicle and the Venucia e30 in China.
Zero FatalitiesAutonomous Drive technologies will provide a platform for Nissan to pursue its ultimate vision of achieving virtually zero fatalities. In 2016, Nissan will introduce an automated system intended to allow the car to drive autonomously in heavy, stop-and-go traffic. By 2018, we will introduce new technologies that enable cars to autonomously negotiate hazards and change lanes.By 2020, the company aims to be ready to introduce automated technology allowing vehicles to navigate without driver intervention in a variety of situations, including complex city driving. Meanwhile, Nissan’s Safety Shield technologies are fundamental to autonomous driving. Starting this year in Japan, Nissan will apply Emergency Braking technology as a standard feature on highest volume models..
10NISSAN MOTOR CORPORATION ANNUAL REPORT 2015
PERFORMANCE

3,000
1,000
2,000
4,000
6,000
5,000
0
6.0
2.0
4.0
8.0
12.0
10.0
02005 2006 2007 2008 2009 2010 2011 2012 2013 2014
3,569
5.6%
3,483
5.4%
3,770
5.4%
3,411
5.5%
3,515
5.5%
4,518
5.8%
4,845
6.4%
4,914
6.2%
5,188 5,318
2015
5,550
6.2% 6.2% 6.5%
6,0005,0004,0003,0002,0001,0000
5,318
5,550+4.4%
889 755 1,829 (1,400) 1,222 623
940 790 1,920 (1,490) 1,300 600
FISCAL 2014 SALES PERFORMANCE AND FISCAL 2015 SALES OUTLOOK
Global demand in fiscal 2014 reached 85.36 million vehicles, up 2.7% from fiscal 2013. Nissan’s global sales volume climbed 2.5% to 5.318 million vehicles and global market share was 6.2%, equal to fiscal 2013.
For fiscal 2015, Nissan expects to grow faster than the industry as a whole. We anticipate that total industry volumes will increase by 0.1% to 85.44 million units. Our global retail volumes are expected to rise by 4.4% to 5.55 million units. This would equate to a global market share of 6.5%, an increase of 0.3 percentage points compared to 2014.
Sales Performance and Sales Outlook by Regions
(FY)
(Units: thousands) (%)
Japan–3.7%
China+6.4%
North America+5.0% (U.S.+6.4%)
Europe+4.6%
Other Markets+5.7%
(Forecast)
FY2014
FY2015
(Units: thousands)
(Forecast)
Global Retail Sales Performance / Market Share and Global Sales Outlook
11NISSAN MOTOR CORPORATION ANNUAL REPORT 2015
PERFORMANCE
500
1,000
1,500
0 2010 2011 2012 2013 2014 2015
1,023
1,247
1,0801,216 1,222
1,300+6.4%
500
1,000
1,500
0 2010 2011 2012 2013 2014 2015
9661,079 1,138
1,2851,400
1,490+6.4%
500
1,000
1,500
0 2010 2011 2012 2013 2014 2015
607676 660 676
755790
+4.6%
500
1,000
1,500
0 2010 2011 2012 2013 2014 2015
709825
960879 889
940+5.7%
500
1,000
1,500
0 2010 2011 2012 2013 2014 2015
600 655 646719
623605
–3.7%
(Forecast)(FY)
(Units: thousands)
(Forecast)(FY)
(Units: thousands)
(Forecast)(FY)
(Units: thousands)
(Forecast)
(FY)
(Units: thousands)
NP300 Navara
Datsun GO+ PancaQashqaiAltimaSylphy
Sales in Other MarketsSales in Europe (Including Russia)Sales in United StatesSales in China
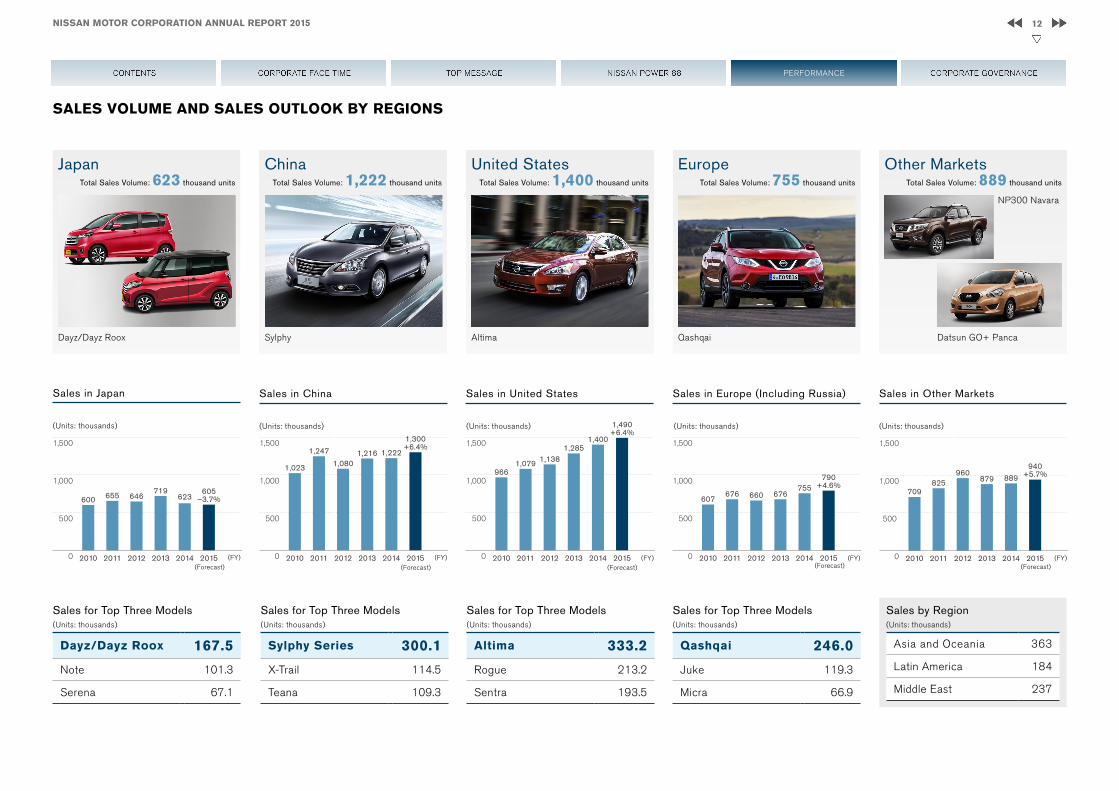
Other Markets Total Sales Volume: 889 thousand units
Europe Total Sales Volume: 755 thousand units
United States Total Sales Volume: 1,400 thousand units
China Total Sales Volume: 1,222 thousand units
Sales for Top Three Models(Units: thousands)
Qashqai 246.0
Juke 119.3
Micra 66.9
Sales for Top Three Models(Units: thousands)
Altima 333.2
Rogue 213.2
Sentra 193.5
Sales for Top Three Models(Units: thousands)
Sylphy Series 300.1
X-Trail 114.5
Teana 109.3
Sales for Top Three Models(Units: thousands)
Dayz/Dayz Roox 167.5
Note 101.3
Serena 67.1
Dayz/Dayz Roox
(Forecast)(FY)
Sales in Japan
(Units: thousands)
Japan Total Sales Volume: 623 thousand units
Sales by Region(Units: thousands)
Asia and Oceania 363
Latin America 184
Middle East 237
SALES VOLUME AND SALES OUTLOOK BY REGIONS
12NISSAN MOTOR CORPORATION ANNUAL REPORT 2015
PERFORMANCE
498.4589.6+32.4 –43.8
–39.5 –0.1 –20.1 –19.0+68.6
+112.7
800
600
400
200
02015201420132010 2011 2012
537.5 545.8 523.5605.7
498.4
718.6675.0
589.6
835.0
(Forecast)
(Billions of yen)
(FY)
Operating Profit
(Billions of yen)
2015201420132011 2012
319.2 341.4 342.4
389.0
457.6485.0
2010
600
450
300
150
0 (Forecast)
(Billions of yen)
(FY)
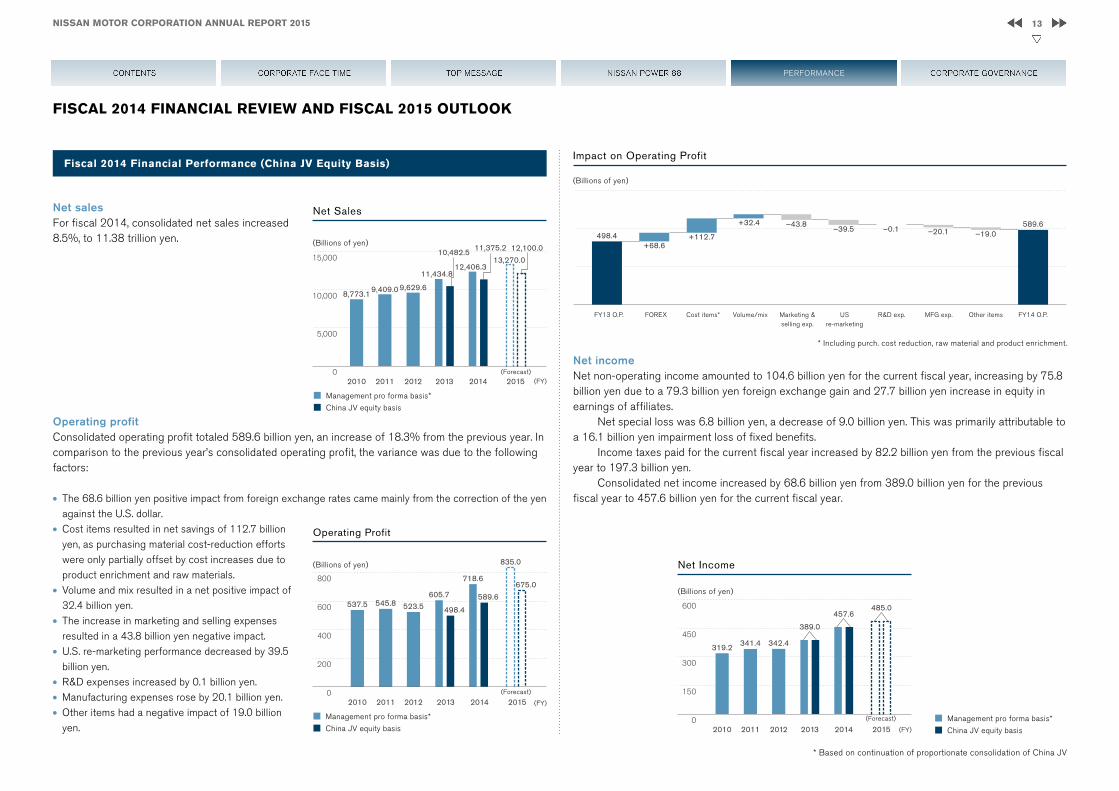
Net salesFor fiscal 2014, consolidated net sales increased 8.5%, to 11.38 trillion yen.
Operating profitConsolidated operating profit totaled 589.6 billion yen, an increase of 18.3% from the previous year. In comparison to the previous year’s consolidated operating profit, the variance was due to the following factors:
l The 68.6 billion yen positive impact from foreign exchange rates came mainly from the correction of the yen against the U.S. dollar.
l Cost items resulted in net savings of 112.7 billion yen, as purchasing material cost-reduction efforts were only partially offset by cost increases due to product enrichment and raw materials.
l Volume and mix resulted in a net positive impact of 32.4 billion yen.
l The increase in marketing and selling expenses resulted in a 43.8 billion yen negative impact.
l U.S. re-marketing performance decreased by 39.5 billion yen.
l R&D expenses increased by 0.1 billion yen.l Manufacturing expenses rose by 20.1 billion yen.l Other items had a negative impact of 19.0 billion yen.
FISCAL 2014 FINANCIAL REVIEW AND FISCAL 2015 OUTLOOK
Net incomeNet non-operating income amounted to 104.6 billion yen for the current fiscal year, increasing by 75.8 billion yen due to a 79.3 billion yen foreign exchange gain and 27.7 billion yen increase in equity in earnings of affiliates.
Net special loss was 6.8 billion yen, a decrease of 9.0 billion yen. This was primarily attributable to a 16.1 billion yen impairment loss of fixed benefits.
Income taxes paid for the current fiscal year increased by 82.2 billion yen from the previous fiscal year to 197.3 billion yen.
Consolidated net income increased by 68.6 billion yen from 389.0 billion yen for the previous fiscal year to 457.6 billion yen for the current fiscal year.
Fiscal 2014 Financial Performance (China JV Equity Basis)Impact on Operating Profit
FY13 O.P. Cost items*
* Including purch. cost reduction, raw material and product enrichment.
Marketing & selling exp.
R&D exp.FOREX Volume/mix US re-marketing
MFG exp. Other items FY14 O.P.
Net Income
■ Management pro forma basis*
■ China JV equity basis■ Management pro forma basis*
■ China JV equity basis
■ Management pro forma basis*
■ China JV equity basis
2015201420132011 2012
8,773.19,409.0
13,270.0
12,100.0 11,375.2
9,629.6
11,434.8
10,482.5
12,406.3
20100
5,000
10,000
15,000
(Forecast)
Net Sales
(Billions of yen)
(FY)
* Based on continuation of proportionate consolidation of China JV
13NISSAN MOTOR CORPORATION ANNUAL REPORT 2015
PERFORMANCE

Balance sheet Total assets increased by 15.9% to 17,045.7 billion yen compared to March 31, 2014.
Current assets increased by 19.8% to 10,317.3 billion yen compared to March 31, 2014. This was mainly attributable to an increase in sales finance receivables by 1,279.3 billion yen.
Fixed assets increased by 10.4% to 6,728.3 billion yen compared to March 31, 2014. This was mainly attributable to an increase in machinery, equipment and vehicles, net by 462.9 billion yen and an increase in investment securities by 58.4 billion yen.
Current liabilities increased by 23.7% to 6,417.5 billion yen compared to March 31, 2014. This was mainly due to increases in the current portion of long-term borrowings by 466.2 billion yen and short-term borrowings by 316.0 billion yen. Long-term liabilities increased by 11.1% to 5,380.9 billion yen compared to March 31, 2014. This was mainly due to increases in bonds by 176.7 billion yen and net retirement benefit obligation by 119.7 billion yen.
Net assets increased by 12.3% to 5,247.3 billion yen compared to 4,671.5 billion yen as of March 31, 2014. This was mainly due to net income of 457.6 billion yen and a decrease in translation adjustments by 222.4 billion yen.
Free cash flow and net cash (auto business) For fiscal 2014, Nissan achieved a positive free cash flow of 365.8 billion yen. At the end of fiscal 2014, our net automotive cash improved from the previous fiscal year to 1,390.1 billion yen.
We continue to maintain a close focus on our inventory of new vehicles. Inventory stood at 810,000 units at the end of fiscal 2014. The company continues to manage inventory carefully in order to limit its impact on free cash flow.
Aa3 AA–
A1 A+
A2 A
A3 A–
Baa1 BBB+
Baa2 BBB
Baa3 BBB–
Ba1 BB+
Financial Position (China JV Equity Basis)
Corporate Ratings
Long-term credit ratingNissan’s long-term credit rating with Rating & Investment Information, Inc. (R&I) is A+ with a stable outlook. The Standard & Poor’s (S&P) long-term credit rating for Nissan is A– with a stable outlook. Nissan’s credit rating with Moody’s is A3 with a stable outlook.
10/03 4/04 10/04 4/05 10/05
R&I
S&P
Moody’s
4/06 10/06 4/07 10/07 4/08 10/08 4/09 10/09 4/10 10/10 4/11 7/11 7/12 1/13 9/14
14NISSAN MOTOR CORPORATION ANNUAL REPORT 2015
PERFORMANCE

In our outlook for fiscal 2015, we expect our global sales to reach 5.55 million units, an increase of 4.4% compared to fiscal 2014.
With a total industry volume assumption of 85.44 million units, a 0.1 % increase year on year, our global market share is expected to grow from 6.2% to 6.5%.
In consequence of our plan, the financial forecast is as follows. We have used a foreign exchange rate assumption of 115 yen to the dollar and 130 yen to the euro:
Nissan’s Fiscal 2015 Outlookn Net sales 12.10 trillion yenn Operating profit 675.0 billion yenn Net income 485.0 billion yen
Fiscal 2015 Outlook (China JV Equity Basis)
4.5%
600
450
300
150
02010 201420132011 2012
312.0
406.4
468.7
536.3
463.1
2015
550.0
3.6%4.3%
5.4%
5.1%
4.1%
600
450
300
150
02010 2015201420132011 2012
530.0
399.3428.0
457.8500.6 506.1
4.4%4.6% 4.5%5.2%
4.8%4.4%
(Forecast)
(Forecast)
(Billions of yen)
DividendNissan’s strategic actions reflect not only its long-term vision as a global company to create sustainable value but also the company’s commitment to maximizing total shareholder returns.
We paid year-end cash dividends of 16.5 yen per share for fiscal 2014. As a result, the total dividend payment for fiscal 2014, combined with the 16.5 yen dividend for the interim period, was 33 yen per share.
The dividend payment plan for fiscal 2015 is to be 42 yen per share, considering the business condition, risks and opportunities for the year.
(FY)
Sales finance Due to the increase in retail sales, total financial assets of the sales finance segment increased by 20.8% to 9,281.3 billion yen from 7,682.1 billion yen in fiscal 2013. The sales finance segment generated 195.5 billion yen in operating profits in fiscal 2014 from 164.7 billion yen in fiscal 2013.
Investment policy Capital expenditures totaled 463.1 billion yen, which was 4.1% of net sales. The company used capital expenditures in order to ensure Nissan’s future competitiveness.
R&D expenditures totaled 506.1 billion yen. These funds were used to develop new technologies and products. One of the company’s strengths is its extensive collaboration and development structure with Renault’s R&D team, resulting from the Alliance.
R&D Expenditures
40
30
20
10
02014 2015201320122010 2011
42
10
20
25
3033
(Outlook)(FY)
Dividend
(Dividend per share, in yen)
(Billions of yen)
Capital Expenditures
(FY)
■ Management pro forma basis*■ China JV equity basis
● % of net sales (Management pro forma basis*)● % of net sales (China JV equity basis)
* Based on continuation of proportionate consolidation of China JV
15NISSAN MOTOR CORPORATION ANNUAL REPORT 2015
PERFORMANCE

FINANCIAL STATEMENTSConsolidated balance sheets (China JV Equity basis)
(Millions of yen)
FY2013As of March 31, 2014
FY2014As of March 31, 2015
Liabilities
Current liabilitiesTrade notes and accounts payable 1,511,910 1,554,399 Short-term borrowings 706,576 1,022,613Current portion of long-term borrowings 910,546 1,376,780Commercial papers 151,175 200,692Current portion of bonds 226,590 216,942Lease obligations 32,838 23,043Accrued expenses 693,438 908,909Deferred tax liabilities 316 64Accrued warranty costs 93,151 112,989Other 860,709 1,001,064Total current liabilities 5,187,249 6,417,495
Long-term liabilitiesBonds 918,783 1,095,518Long-term borrowings 2,682,381 2,717,478Lease obligations 23,580 18,167Deferred tax liabilities 605,140 673,521Accrued warranty costs 105,884 129,365Net defined benefit liability 216,583 336,261Other 292,275 410,592Total long-term liabilities 4,844,626 5,380,902
Total liabilities 10,031,875 11,798,397Net assets
Shareholders’ equityCommon stock 605,814 605,814 Capital surplus 804,485 804,567Retained earnings 3,526,646 3,811,848Treasury stock (149,315) (148,239)Total shareholders’ equity 4,787,630 5,073,990
Accumulated other comprehensive incomeUnrealized holding gain and loss on securities 81,630 95,600Unrealized gain and loss from hedging instruments (7,015) 7,185Adjustment for revaluation of the accounts of the consolidated subsidiaries based on general price level accounting
(13,945) (13,945)
Translation adjustments (469,202) (246,776)Remeasurements of defined benefit plans (40,444) (81,638)Total accumulated other comprehensive income (448,976) (239,574)
Share subscription rights 2,401 2,294Minority interests 330,473 410,552Total net assets 4,671,528 5,247,262
Total liabilities and net assets 14,703,403 17,045,659
(Millions of yen)
FY2013As of March 31, 2014
FY2014As of March 31, 2015
Assets
Current assetsCash on hand and in banks 822,863 761,074Trade notes and accounts receivable 785,954 888,814Sales finance receivables 5,033,558 6,312,874Securities 13,470 41,651Merchandise and finished goods 769,676 853,962Work in process 94,386 90,811Raw materials and supplies 287,789 365,224Deferred tax assets 210,395 226,891Other 650,143 851,168Allowance for doubtful accounts (58,956) (75,124)Total current assets 8,609,278 10,317,345
Fixed assetsProperty, plant and equipment
Buildings and structures, net 615,127 661,979Machinery, equipment and vehicles, net 2,658,776 3,121,627Land 642,932 643,940Construction in progress 337,635 265,119Other, net 503,568 573,574Total property, plant and equipment 4,758,038 5,266,239
Intangible fixed assets 92,334 114,456Investments and other assets
Investment securities 930,293 988,733Long-term loans receivable 13,529 14,569Net defined benefit assets 7,262 10,078Deferred tax assets 117,437 140,669Other 177,785 195,927Allowance for doubtful accounts (2,553) (2,357)Total investments and other assets 1,243,753 1,347,619
Total fixed assets 6,094,125 6,728,314Total assets 14,703,403 17,045,659
16NISSAN MOTOR CORPORATION ANNUAL REPORT 2015
PERFORMANCE

Consolidated statement of income (China JV Equity basis)
(Millions of yen)
FY2013(From April 1, 2013to March 31, 2014)
FY2014(From April 1, 2014to March 31, 2015)
Net sales 10,482,520 11,375,207
Cost of sales 8,636,063 9,241,341
Gross profit 1,846,457 2,133,866Selling, general and administrative expenses
Advertising expenses 289,098 336,792Service costs 100,255 93,606Provision for warranty costs 107,480 133,567Other selling expenses 204,953 255,044Salaries and wages 354,908 392,969Retirement benefit expenses 25,174 17,511Supplies 3,637 4,222Depreciation and amortization 43,515 44,826Provision for doubtful accounts 31,869 52,079Amortization of goodwill 1,814 1,837Other 185,389 211,852Total selling, general and administrative expenses 1,348,092 1,544,305
Operating income 498,365 589,561Non-operating income
Interest income 17,064 25,323Dividends income 6,013 6,425Equity in earnings of affiliates 78,815 106,513Exchange gain ― 66,185Miscellaneous income 9,254 17,813Total non-operating income 111,146 222,259
Non-operating expenses
Interest expense 28,677 29,167Derivative loss 18,166 58,379Exchange loss 13,063 ―Amortization of net retirement benefit obligation at transition 9,075 9,098Miscellaneous expenses 13,341 20,944Total non-operating expenses 82,322 117,588
Ordinary income 527,189 694,232
(Millions of yen)
FY2013(From April 1, 2013to March 31, 2014)
FY2014(From April 1, 2014to March 31, 2015)
Special gains
Gain on sales of fixed assets 9,168 20,008
Gain on contribution of securities to retirement benefit trust 12,175 17,725Other 5,785 6,169Total special gains 27,128 43,902
Special lossesLoss on sales of fixed assets 1,694 3,299Loss on disposal of fixed assets 11,456 17,069Impairment loss 2,130 16,103Other 9,659 14,242Total special losses 24,939 50,713
Income before income taxes and minority interests 529,378 687,421Income taxes-current 131,990 224,010Income taxes-deferred (16,939) (26,686)Total income taxes 115,051 197,324Income before minority interests 414,327 490,097Income attributable to minority interests 25,293 32,523Net income 389,034 457,574
17NISSAN MOTOR CORPORATION ANNUAL REPORT 2015
PERFORMANCE

Consolidated statement of cash flows (China JV Equity basis)
(Millions of yen)
FY2013(From April 1, 2013to March 31, 2014)
FY2014(From April 1, 2014to March 31, 2015)
Cash flows from operating activitiesIncome before income taxes and minority interests 529,378 687,421Depreciation and amortization (for fixed assets excluding leased vehicles)
364,926 398,982
Depreciation and amortization (for long term prepaid expenses) 24,086 28,003Depreciation and amortization (for leased vehicles) 288,276 355,292Impairment loss 2,130 16,103Gain on contribution of securities to retirement benefit trust (12,175) (17,725)Increase (decrease) in allowance for doubtful receivables 12,160 13,471Loss (gain) for residual value risk of leased vehicles 11,633 41,911Interest and dividend income (23,077) (31,748)Interest expense 101,451 112,823Equity in losses (earnings) of affiliates (78,815) (106,513)Loss (gain) on sales of fixed assets (7,474) (16,709)Loss on disposal of fixed assets 11,456 17,069Decrease (increase) in trade notes and accounts receivable (173,228) (64,118)Decrease (increase) in sales finance receivables (587,060) (707,321)Decrease (increase) in inventories (38,057) (82,435)Increase (decrease) in trade notes and accounts payable 334,367 125,840Amortization of net retirement benefit obligation at transition 9,075 9,098Retirement benefit expenses 37,701 26,789Payments relared to net defined benefit assets and liability (36,658) (25,815)Other 34,749 53,350Subtotal 804,844 833,768Interest and dividends received 20,654 25,793Proceeds from dividends income from affiliates accounted for by equity method
98,907 145,780
Interest paid (99,861) (114,659)Income taxes paid (96,421) (197,899)Net cash provided by operating activities 728,123 692,747
(Millions of yen)
FY2013(From April 1, 2013to March 31, 2014)
FY2014(From April 1, 2014to March 31, 2015)
Cash flows from investing activities Net decrease (increase) in short-term investments (3,360) 3,405Purchase of fixed assets (551,808) (513,268)Proceeds from sales of fixed assets 79,578 88,318Purchase of leased vehicles (1,004,141) (1,070,654)Proceeds from sales of leased vehicles 465,501 537,721Payments of long-term loans receivable (1,292) (534)Collection of long-term loans receivable 254 310Purchase of investment securities (37,617) (25,591)Proceeds from sales of investment securities 2,223 6,104Proceeds from (payments for) sales of subsidiaries' shares resulting in changes in the scope of consolidation
(1,321) (156)
Proceeds from (payments for) purchase of subsidiaries' shares resulting in changes in the scope of consolidation
972 ―
Net decrease (increase) in restricted cash (8,628) (36,258)Other (20,777) (11,422)Net cash used in investing activities (1,080,416) (1,022,025)
Cash flows from financing activitiesNet increase (decrease) in short-term borrowings (19,920) 445,170Proceeds from long-term borrowings 1,373,644 981,970Proceeds from issuance of bonds 444,666 325,513Repayments of long-term borrowings (1,058,838) (1,094,942)Redemption of bonds (181,628) (238,124)Proceeds from minority shareholders 9,599 6,242Purchase of treasury stock (11) (61)Proceeds from sales of treasury stock 127 618Repayments of lease obligations (44,312) (34,047)Cash dividends paid (115,265) (132,054)Cash dividends paid to minority shareholders (11,137) (14,389)Net cash provided by financing activities 396,925 245,896
Effects of exchange rate changes on cash and cash equivalents 74,850 50,660Increase (decrease) in cash and cash equivalents 119,482 (32,722)Cash and cash equivalents at beginning of the period 711,901 832,716Increase due to inclusion in consolidation 1,333 2,618Cash and cash equivalents at end of the period 832,716 802,612
18NISSAN MOTOR CORPORATION ANNUAL REPORT 2015
PERFORMANCE

エグゼクティブ・コミッティ・メンバー
Chief Executive OfficerChairman of BoardPresidentRepresentative DirectorCarlos Ghosn*
Chief Competitive OfficerVice ChairmanHiroto Saikawa*
Chief Financial OfficerJoseph G. Peter*Finance
Control
IR
M&A Support
Global Sales Finance Business Unit
Administration for Affiliated Companies,
Marine Administration OfficeGlobal IS/IT
Chief Performance OfficerTrevor Mann*Responsible for 6 management committees
Global Aftersales
Global Datsun Business Unit
Chief Planning OfficerPhilippe Klein*Global Product Planning
Global Program Management
Global Market Intelligence
Global Marketing
Vehicle Information Technology
Global Sales
Executive Vice President Takao Katagiri*Region: Japan, Asia, Oceania
Japan Marketing & Sales
Executive Vice PresidentJose Munoz*Region : North America
Executive Vice PresidentKimiyasu Nakamura*TCSX
(Total Customer Satisfaction Function)
Executive Vice PresidentHideyuki Sakamoto*Product Engineering
Executive Vice PresidentFumiaki Matsumoto*Manufacturing & SCM Operations
Executive Vice PresidentDaniele Schillaci*Global Marketing & Sales
Executive Vice PresidentTsuyoshi YamaguchiAlliance Technology Development
Executive Vice PresidentYasuhiro YamauchiAlliance Purchasing
EXECUTIVES
Representative Directors
Carlos GhosnPresident and Chairman
Hiroto Saikawa
Greg Kelly
Directors
Hideyuki Sakamoto
Fumiaki Matsumoto
Kimiyasu Nakamura
Auditors
Hidetoshi Imazu
Toshiyuki Nakamura
Motoo Nagai
Shigetoshi Andoh
(As of June 23, 2015)
Senior Vice PresidentsShiro Nakamura
Hitoshi Kawaguchi
Takao Asami
Jun Seki
Jose Luis Valls
Takashi Hata
Paul Willcox
Roland Krueger
Arun Bajaj
Asako Hoshino
Rakesh Kochhar
Hari Nada
Christian Mardrus
Corporate Vice PresidentsCelso Guiotoko
Joji Tagawa
Atsushi Hirose
Shunichi Toyomasu
Vincent Cobee
Yusuke Takahashi
Hiroshi Karube
Toru Hasegawa
Keno Kato
Noboru Tateishi
Roel De Vries
Tony Laydon
Kunio Nakaguro
Mitsuro Antoku
Naoya Fujimoto
Toshihiro Hirai
Hiroshi Nagaoka
Akihiro Otomo
Atul Pasricha
Nobuya Uranishi
Philippe Guerin-Boutaud
Allan Rushforth
Kent O'Hara
FellowHaruyoshi Kumura
Vice ChairmanToshiyuki Shiga
(As of August 1, 2015)
* Executive Committee Members
DIRECTORS OF THE BOARD AND AUDITORS
EXECUTIVE COMMITTEE MEMBERS
CORPORATE OFFICERS
Carlos Ghosn
Jose Munoz
Hiroto Saikawa
Kimiyasu NakamuraPhilippe Klein
Hideyuki Sakamoto
Joseph G. Peter
Fumiaki Matsumoto
Trevor Mann
Takao Katagiri
Daniele Schillaci
Toshiyuki Shiga
Jean-Baptiste-Duzan
Bernard Rey
19NISSAN MOTOR CORPORATION ANNUAL REPORT 2015
CORPORATE GOVERNANCE

CORPORATE GOVERNANCE & INTERNAL CONTROL
CORPORATE GOVERNANCE SYSTEMNissan believes that enhancing its corporate governance is one of its most important business issues. Ensuring clear management responsibility is a key way to achieve this. Nissan announces clear management targets and policies to all its stakeholders and discloses its performance promptly with a high degree of transparency.
Information regarding the following is provided in the Company’s Sustainability Report.l Corporate Governance System in Detaill Internal Control Systemsl Independent Internal Audits
Details of this section are reported on the Company’s website, “Blue Citizenship: Nissan’s CSR.”
Please see the Sustainability Report and the Current State of Nissan’s Risk Management.
Please see the Current State of Nissan’s Risk Management for more information on risk management.
website
Please see the 2015 Sustainability Report, p. 99, for more information on Corporate Governance & Internal Control.
website
COMPLIANCEIn promoting corporate social responsibility (CSR), it is essential that each employee practices compliance with high ethical standards. In order to raise compliance awareness throughout the company, Nissan has established specialized departments and appointed officers to promote compliance policy in each region where it operates.
Information regarding the following is provided in the Company’s Sustainability Report.l Employees and Compliancel Security-Related Export Controlsl Promoting Thorough Compliancel Nissan’s Stance Against Discrimination and Harassmentl Internal Reporting System for Corporate Soundness
RISK MANAGEMENTNissan defines risks as anything that might prevent it from achieving its business goals. By detecting risks as early as possible, examining them, planning the necessary measures to address them and implementing those measures, the company works to minimize the materialization of risks as well as the impact they cause.
Information regarding the following is provided in the Company’s Sustainability Report.l Principles for and Approach to Corporate Risk Managementl Protecting Personal Data and Reinforcing Information Security
Information regarding the following is provided in the Current State of Nissan’s Risk Managementl Risks Related to Financial Marketl Risks Related to Business Strategies and Maintenance of
Competitivenessl Business Continuity
20NISSAN MOTOR CORPORATION ANNUAL REPORT 2015
CORPORATE GOVERNANCE