annual report 2012 Global leadinG Green enerGy and ... Report_Eng(web).pdf · Management’s...
65
GLOBAL LEADING GREEN ENERGY AND CHEMICAL COMPANY ANNUAL REPORT 2012
Transcript of annual report 2012 Global leadinG Green enerGy and ... Report_Eng(web).pdf · Management’s...

1
Global leadinG Green enerGy and ChemiCal Company
annual report 2012

company overviewAbout OCI Businesses Financial Highlights 01Highlights 02CEO Message 04Management’s Discussion and Analysis 06Governance & Board of Directors 12Foundations 14
operational reviewPolysilicon 20Petro & Coal Chemicals 24Inorganic Chemicals, Specialty Gases & Others 28New Businesses 32
responsibility reviewEnvironmental Responsibility 40Social Responsibility 42Personnel Responsibility 44
Financial review Financial Statements 48 Subsidiaries & Joint Ventures 114Global Network 118Corporate Info & Contacts 120
contents

Financial Highlights
Consolidated statements oF inCome
2010 2011 2012
USD KRW USD KRW USD KRW
sales 2,873 3,322 3,859 4,276 2,856 3,219
operating income 772 893 1,005 1,118 137 155
net income 579 669 780 865 11 13
eBitda 1,068 1,235 1,418 1,571 618 696 UNIT: USD mn, KRW bn / KRW-USD EXCHANGE RATE: 1126.8 [2012 AVERAGE]
Consolidated statements oF FinanCial Position
2010 2011 2012
USD KRW USD KRW USD KRW
total assets 4,914 5,596 6,247 7,205 6,800 7,283
total liabilities 2,905 3,308 3,022 3,485 3,447 3,691
total shareholders’ equity 2,009 2,288 3,225 3,720 3,353 3,592UNIT: USD mn, KRW bn / KRW-USD EXCHANGE RATE: 1,071.10 [AS of DEC. 31, 2012]
sales KRW in bn
201220112010 201220112010 201220112010
3,219
4,276
3,322
total assets KRW in bn
7,2837,205
5,596
net inCome KRW in bn
13
865
669
About OCI
COmpAny prOfIle
OCI is a leading global producer of high-value-added specialty chemical
products. Since the company’s founding in 1959, it has leveraged its
technical expertise, process know-how, and highly efficient manufacturing
capabilities to develop a world-class portfolio of products and solutions for a
broad spectrum of industries critical to the global economy, ranging from
high-technology fields such as solar power, semiconductors, and LCDs to
more mainstream ones such as automobiles and consumer goods.
Today, OCI’s diversified product portfolio encompassing polysilicon, petro and
coal chemicals, and inorganic chemicals and specialty gases is meeting the
needs of more than 900 customers in over 100 countries. The company is
committed to being a leading provider of crucial raw materials to the clean and
renewable energy industries while continuing to innovate and achieve market
leadership in a selected range of specialty chemical products and industrial
gases. Today, it continues to strategically and systematically invest in
tomorrow’s technologies to make the future a better place.
Businesses
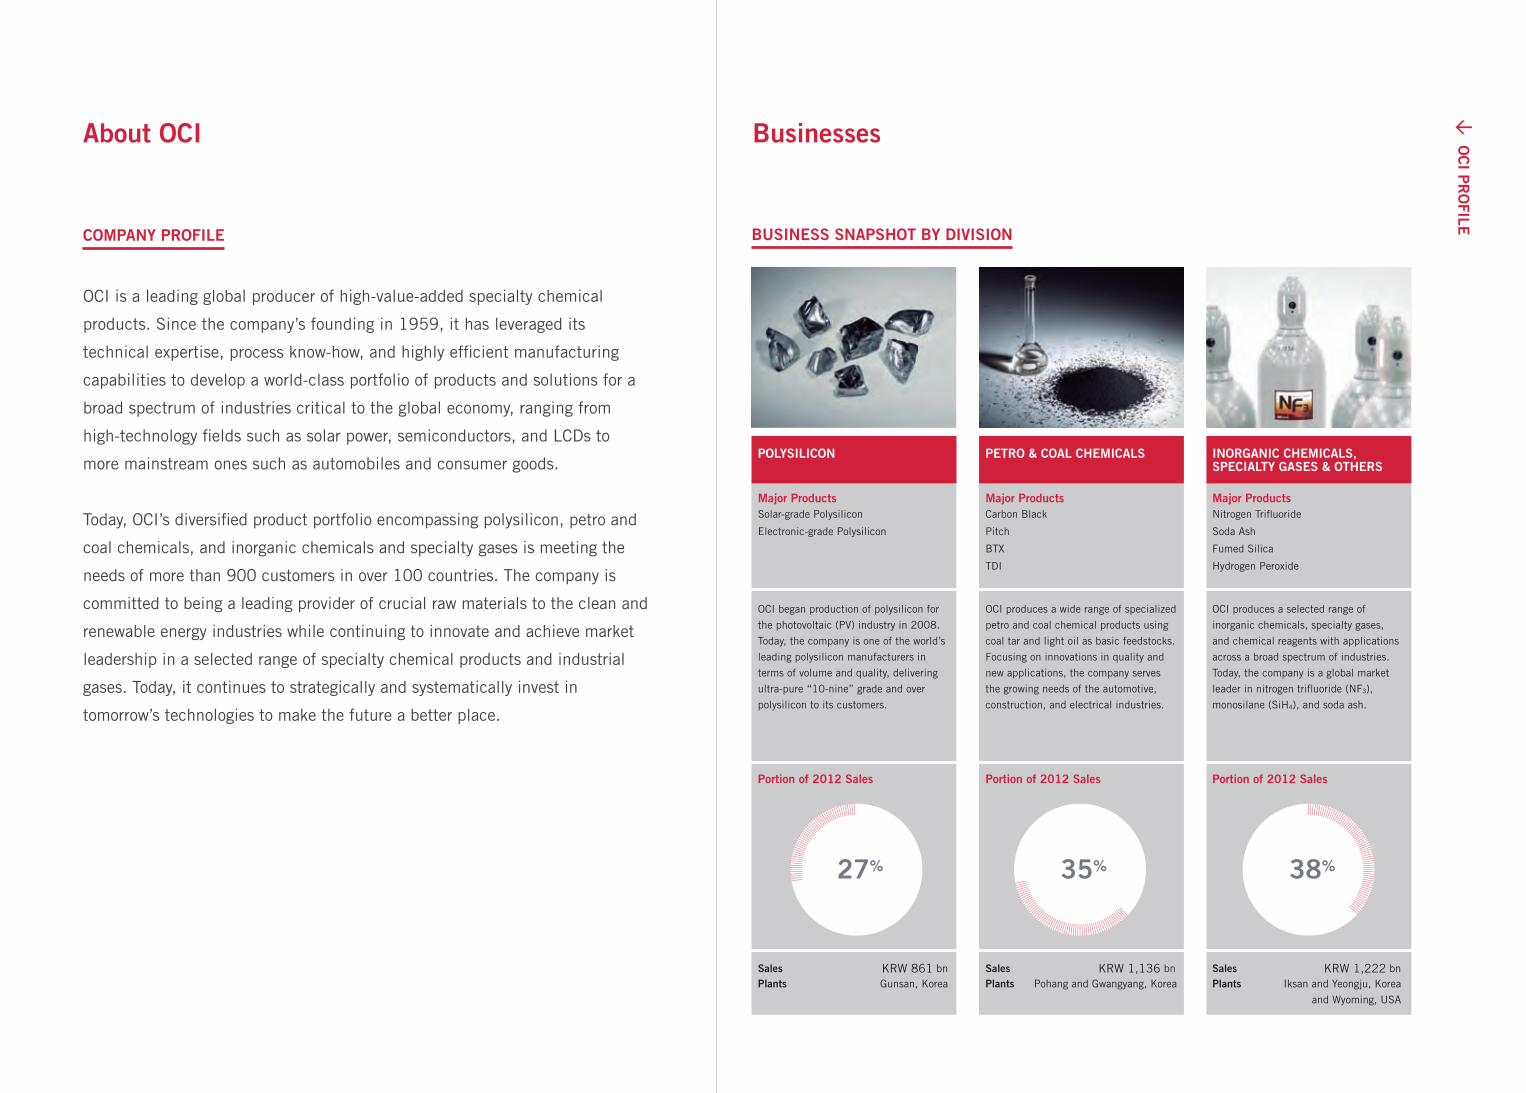
BusIness snApsHOT By DIVIsIOn
pOlysIlICOn peTrO & COAl CHemICAls InOrgAnIC CHemICAls,speCIAlTy gAses & OTHers
major productsSolar-grade Polysilicon
Electronic-grade Polysilicon
portion of 2012 sales
sales KRW 861 bnplants Gunsan, Korea
sales KRW 1,136 bnplants Pohang and Gwangyang, Korea
sales KRW 1,222 bnplants Iksan and Yeongju, Korea
and Wyoming, USA
portion of 2012 sales portion of 2012 sales
OCI began production of polysilicon for
the photovoltaic (PV) industry in 2008.
Today, the company is one of the world’s
leading polysilicon manufacturers in
terms of volume and quality, delivering
ultra-pure “10-nine” grade and over
polysilicon to its customers.
OCI produces a wide range of specialized
petro and coal chemical products using
coal tar and light oil as basic feedstocks.
Focusing on innovations in quality and
new applications, the company serves
the growing needs of the automotive,
construction, and electrical industries.
OCI produces a selected range of
inorganic chemicals, specialty gases,
and chemical reagents with applications
across a broad spectrum of industries.
Today, the company is a global market
leader in nitrogen trifluoride (NF3),
monosilane (SiH4), and soda ash.
major productsCarbon Black
Pitch
BTX
TDI
major productsNitrogen Trifluoride
Soda Ash
Fumed Silica
Hydrogen Peroxide
27% 35% 38%
03
emerging Business developments
awards & Recognition
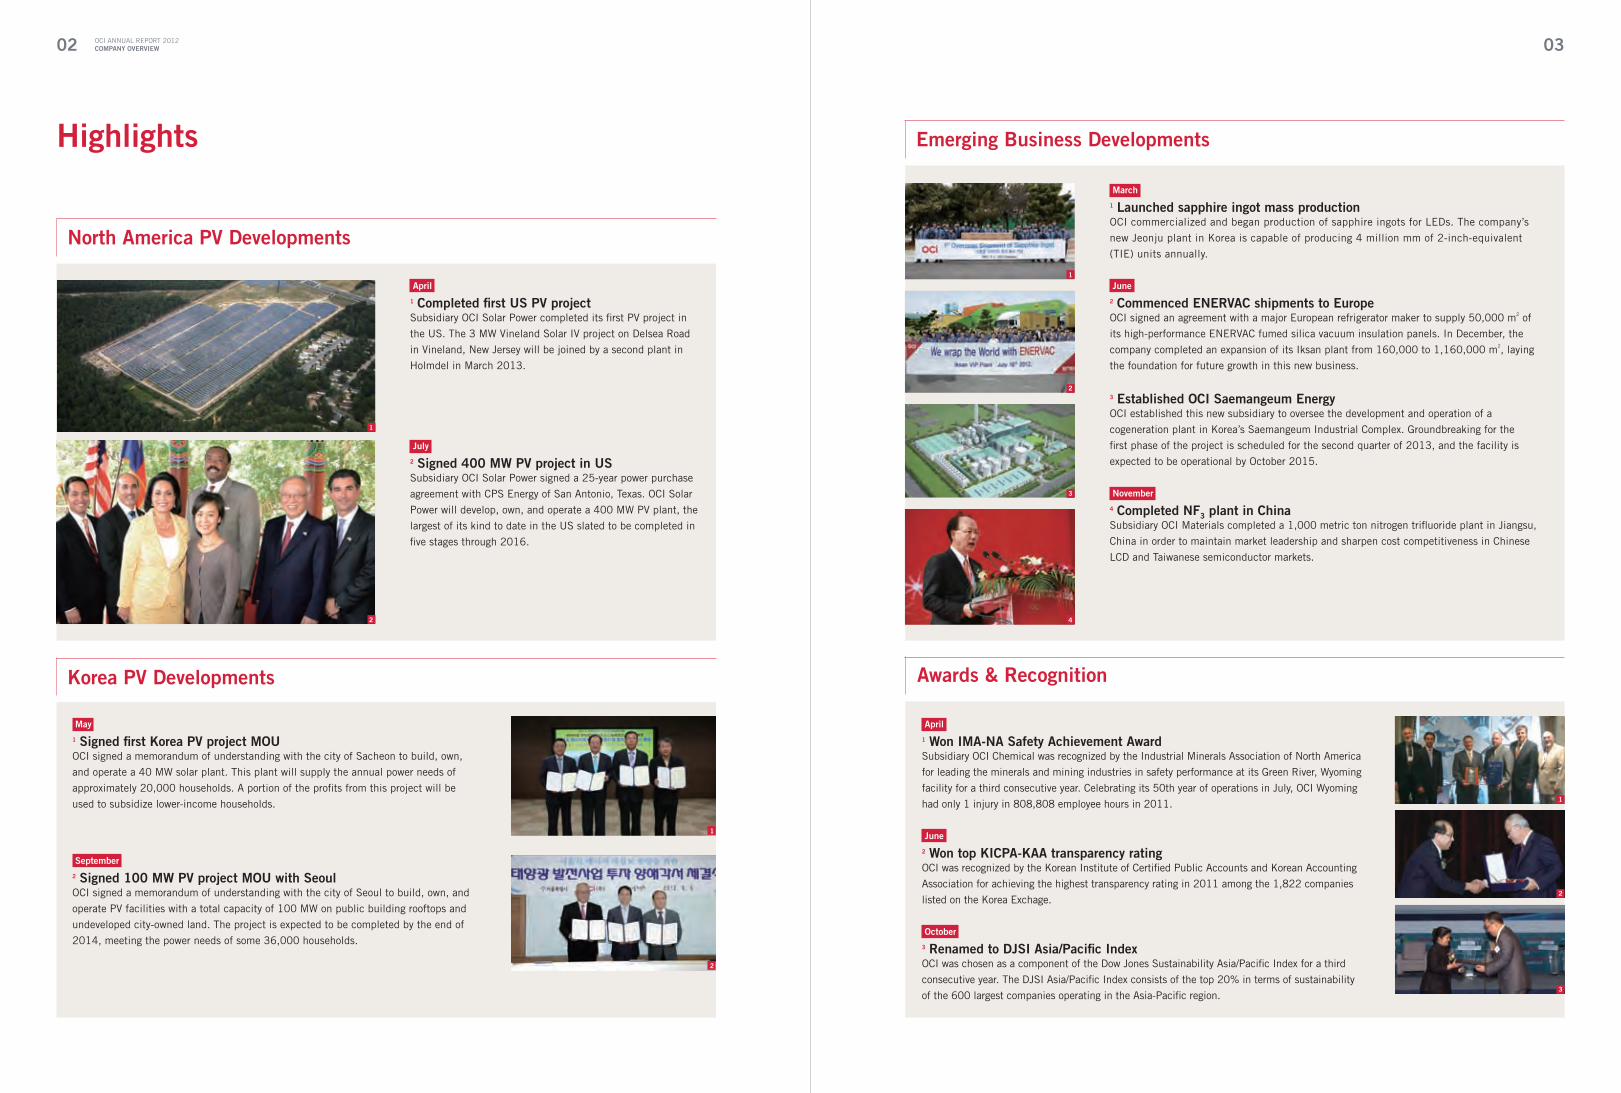
april.
1 Won ima-na safety achievement awardSubsidiary OCI Chemical was recognized by the Industrial Minerals Association of North America
for leading the minerals and mining industries in safety performance at its Green River, Wyoming
facility for a third consecutive year. Celebrating its 50th year of operations in July, OCI Wyoming
had only 1 injury in 808,808 employee hours in 2011.
June.
2 Won top KiCPa-Kaa transparency ratingOCI was recognized by the Korean Institute of Certified Public Accounts and Korean Accounting
Association for achieving the highest transparency rating in 2011 among the 1,822 companies
listed on the Korea Exchage.
october.
3 Renamed to dJsi asia/Pacific indexOCI was chosen as a component of the Dow Jones Sustainability Asia/Pacific Index for a third
consecutive year. The DJSI Asia/Pacific Index consists of the top 20% in terms of sustainability
of the 600 largest companies operating in the Asia-Pacific region.
march.
1 launched sapphire ingot mass productionOCI commercialized and began production of sapphire ingots for LEDs. The company’s
new Jeonju plant in Korea is capable of producing 4 million mm of 2-inch-equivalent
(TIE) units annually.
June.
2 Commenced eneRVaC shipments to europeOCI signed an agreement with a major European refrigerator maker to supply 50,000 m2 of
its high-performance ENERVAC fumed silica vacuum insulation panels. In December, the
company completed an expansion of its Iksan plant from 160,000 to 1,160,000 m2, laying
the foundation for future growth in this new business.
3 established oCi saemangeum energyOCI established this new subsidiary to oversee the development and operation of a
cogeneration plant in Korea’s Saemangeum Industrial Complex. Groundbreaking for the
first phase of the project is scheduled for the second quarter of 2013, and the facility is
expected to be operational by October 2015.
november.
4 Completed nF3 plant in ChinaSubsidiary OCI Materials completed a 1,000 metric ton nitrogen trifluoride plant in Jiangsu,
China in order to maintain market leadership and sharpen cost competitiveness in Chinese
LCD and Taiwanese semiconductor markets.
1.
2.
3.
4.
3.
02 OCI ANNUAL REPORT 2012ComPany oVeRVieW
Highlights
Korea PV developments
september.
2 signed 100 mW PV project moU with seoulOCI signed a memorandum of understanding with the city of Seoul to build, own, and
operate PV facilities with a total capacity of 100 MW on public building rooftops and
undeveloped city-owned land. The project is expected to be completed by the end of
2014, meeting the power needs of some 36,000 households.
may.
1 signed first Korea PV project moUOCI signed a memorandum of understanding with the city of Sacheon to build, own,
and operate a 40 MW solar plant. This plant will supply the annual power needs of
approximately 20,000 households. A portion of the profits from this project will be
used to subsidize lower-income households.
north america PV developments
april.
1 Completed first Us PV projectSubsidiary OCI Solar Power completed its first PV project in
the US. The 3 MW Vineland Solar IV project on Delsea Road
in Vineland, New Jersey will be joined by a second plant in
Holmdel in March 2013.
July.
2 signed 400 mW PV project in UsSubsidiary OCI Solar Power signed a 25-year power purchase
agreement with CPS Energy of San Antonio, Texas. OCI Solar
Power will develop, own, and operate a 400 MW PV plant, the
largest of its kind to date in the US slated to be completed in
five stages through 2016.
1.
2.
1.
2.
1.
2.

05
Industrial Complex, a facility slated to begin operations in 2015. Our subsidiary, OCI
Materials also completed a 1,000 metric ton expansion project to manufacture nitrogen
trifluoride (NF3) in Jiangsu, China.
Given the tough operating environment in 2012, our top priority was on improving our
fundamental long-term competitiveness. This focus was particularly true in our flagship
polysilicon business, where we focused on enhancing quality, reliability, and customer
relationships as we laid the groundwork that will prepare us for new opportunities after the
current period of consolidation and restructuring runs its course. At the same time,
we strengthened our operating position through ongoing cost-reduction initiatives
across all our businesses and improved on financial position by issuing two successful
corporate bonds at very competitive terms. We also upgraded our safety focus and status
by commissioning and passing an International Safety Rating System audit of our entire
safety management system.
At OCI, we aspire to be more than just a good company. As an evidence of this in 2012,
the Korean Institute of Certified Public Accounts and Korean Accounting Association
awarded us the highest transparency rating among the 1,822 companies listed on the
Korea Exchange. We were also recognized by the Dow Jones Sustainability Asia/Pacific
Index for a third consecutive year.
Internally, we continued to foster a creative and flexible organization to better meet the
challenges of today’s fast-changing markets by flattening our organizational structure and
diversifying and globalizing our workforce. We also continued to make a positive difference
in local communities through initiatives like our Solar School program which works with
communities to install basic PV systems at schools across Korea, scholarship programs for
students from low-income, multi-cultural families and support of the fine arts.
As we look ahead to 2013, the global economic and market fundamentals remain deeply
challenging. The global economy shows little signs of picking up and international trade
disputes with the potential to directly impact our businesses are on the rise. Not all news
is bad news, however. The fundamental demand dynamics of global PV market shows
continued signs of steady growth, due to various factors including falling systems prices
and rising demand from major market such as China, Japan and the United States.
Also there are signs of capacity constraint and industry consolidation seems to have taken
up speed in the global PV market. Whatever challenges lie ahead, I am confident that the
continued dedication and hard work of our employees and partners will advance our vision
of becoming a global leading green energy and chemical company, and we will continue to
concentrate our focus on creating greater value for our shareholders and other stakeholders.
BaiK Woo-sUgVice Chairman and CEO
“ While the economic outlook
for 2013 remains uncertain,
we continue to sharpen
our cost competitiveness
to maintain and improve
profitability.”
04 OCI ANNUAL REPORT 2012ComPany oVeRVieW
dear shareholders and Customers,
The year 2012 was perhaps the most challenging year to date for OCI. Although our
petrochemical, coal chemical and inorganic chemical business remained relatively stable,
our polysilicon business division continued to face significant headwinds in 2012.
The continued global economic downturn and unresolved oversupply issues that has
touched every participant in the PV value chain, has also had a significant impact on our
performance. Average selling prices continued to trend down throughout the year and
sales volume also continued a downward trend. As a result, we fell significantly short of
our performance targets as sales revenue dropped 25% to KRW 3.2 trillion and operating
income dropped 86% to KRW 155 billion.
While these financial results were disappointing, I’d like to share some noteworthy
accomplishments that helped us weather the formidable challenges we faced during the
year. Driven by our values of chance, challenge, and change, we continued to methodically
sharpen our competitive edge across all our businesses. These efforts played a crucial role
in mitigating the sharp downturn in our polysilicon business and helped us maintain a
stable and solid performance across our other businesses.
Our accomplishments in various new business initiatives should also be highlighted.
Our solar energy development business rapidly gained momentum with a number of major
contract signings, including a 400 MW project in San Antonio, Texas led by our US-based
subsidiary OCI Solar Power and a trio of build-own-operate projects with the cities of
Sacheon, Seoul, and Busan in Korea. Our ENERVAC fumed-silica vacuum insulated panel
business won its first major European order and completed its commercial production
line. Our sapphire ingot business also completed its first commercial production line and
began commercial shipments. We launched OCI Saemangeum Energy to manage
construction and operation of a cogeneration plant project in Korea’s Saemangeum

07
Consolidated figures based on K-IfRS Consolidated figures based on K-IfRS
Inorganic Chemicals, Specialty Gases & OthersPetro & Coal Chemicals Polysilicon
Inorganic Chemicals, Specialty Gases & OthersPetro & Coal Chemicals Polysilicon
2012 20122011 2011
sales oPeRating inComeKRW in bn KRW in bn
1,913.7
860.3
1,113.9
1,135.9
1,248.3
1,222.3
-110.4
791.3
96.4
230.2
118.4
146.8
Polysilicon
Polysilicon sales decreased by 55% or KRW 1,053.4 billion to KRW 860.3 billion in 2012,
accounting for 27% of total sales compared to 45% in 2011. This decrease was primarily
attributable to the lower average selling price driven by continued oversupply in the market
despite steady growth in global PV installations which grew from 27 GW in 2011 to 31 GW
according to industry estimates. According to PV Insights, the spot market price for polysilicon
at the end of 2012 was USD 15.35/kg compared to USD 30.50/kg at the start of the year.
Although a substantial portion of oCI’s polysilicon sales are made pursuant to long-term
agreements, the company’s average selling prices are impacted by market prices.
Petro and Coal Chemicals
Sales from this segment rose slightly by 2% to KRW 1,135.9 billion, accounting for 35% of
total sales in 2012. operating income increased approximately 23% to KRW 118.4 billion.
These increases were primarily driven by oCI’s carbon black capacity expansion from 220,000
metric tons to 270, 000 metric tons in late 2011 and recovering TDI and benzene average
selling prices due to tight supply and rising demand from China and the Middle East.
06 OCI ANNUAL REPORT 2012ComPany oVeRVieW
management’s discussion and analysis
oVeRVieW
The continued economic uncertainty and lack of growth in the global economy had a negative
impact on oCI’s financial performance in 2012. Polysilicon sales in particular were significantly
impacted by continuing challenging supply and demand dynamics across the entire PV value
chain. overall, sales declined by 25% or KRW 1,057.4 billion from KRW 4,275.9 billion in
2011 to KRW 3,218.5 billion. operating income declined by 86% or KRW 963.1 billion from
KRW 1,117.9 billion to KRW 154.8 billion. These declines were primarily due to poor results
in the company’s polysilicon segment due to the lower average selling price and a significant
decrease in sales volume. The company’s other business segments recorded relatively stable
operating results.
salesKRW in bn
2011 Portion 2012 Portion
Polysilicon 1,913.7 45% 860.3 27%
Petro & Coal Chemicals 1,113.9 26% 1,135.9 35%
inorganic Chemicals, specialty gases & others 1,248.3 29% 1,222.3 38%
total 4,275.9 100% 3,218.5 100%
oPeRating inComeKRW in bn
2011 Portion 2012 Portion
Polysilicon 791.3 71% (110.4) -
Petro & Coal Chemicals 96.4 9% 118.4 -
inorganic Chemicals, specialty gases & others 230.2 20% 146.8 -
total 1,117.9 100% 154.8 -

09
FinanCial Position statementsKRW in bn
2011 2012 Change
Current assets 1,985.7 1,977.4 -8.3
Cash & Cash Equivalents 849.0 773.6 -75.4
Account Receivables 614.6 624.8 10.2
Inventories 440.9 539.5 98.6
others 81.2 39.5 -41.7
non-Current assets 5,219.3 5,305.6 86.3
Tangible Assets 4,807.2 4,818.2 11.0
Investments* 242.6 224.3 -18.3
others 169.5 263.1 93.6
total assets 7,205.0 7,283.0 78.0
liabilities 3,484.9 3,691.4 206.5
Debt 1,502.9 2,192.9 690.0
Account Payables 695.0 568.5 -126.5
Long-Term Advances Received 994.4 761.6 -232.8
others 292.6 168.4 -124.2
shareholders’ equity 3,720.1 3,591.6 -128.5
leverage Ratio 94% 103%
*Investments include long-term financial assets, equity-method investments, and real estate investments
Consolidated figures based on K-IfRS
Consolidated figures based on K-IfRS
61%
40%
20122011
FUnded deBt-to-eqUity
Consolidated figures based on K-IfRS
0.3%
23%
20122011
Roe
Consolidated figures based on K-IfRS
0.2%
12%
20122011
Roa
Consolidated figures based on K-IfRS
103%94%
20122011
leVeRage Ratio
08 OCI ANNUAL REPORT 2012ComPany oVeRVieW
inorganic Chemicals and others
Sales from these segments were stable at KRW 1,222.3 billion in 2012 compared to KRW
1,248.3 billion in 2011. operating income declined 36% from KRW 230.2 billon to KRW 146.8
billion. These business segments are mainly conducted through subsidiaries oCI Enterprises
and oCI Materials. oCI sells soda ash through oCI Enterprises and specialty gases such as
Nf3 and monosilane through oCI Materials. Soda ash prices remained solid due to lower utility
costs driven by lower natural gas prices and stable demand. Nf3 and monosilane prices were
weak due to lower utilization rates and decreased production in the LCD and semiconductor
industries. The average selling price of monosilane in particular was hard hit by severe
oversupply during the year.
FinanCial inFoRmation
major Financial indicators
oCI maintained a solid financial structure despite its weak earnings in 2012, ending the year
with a leverage ratio of 103% compared to 94% in 2011. The company successfully issued
corporate bonds amounting to KRW 400 billion with favorable interest rates ranging from 3.35%
to 4.02% and long tenures ranging from 5 to 7 years.
funded debt-to-equity increased from 40% in 2011 to 61% in 2012. Debt increased by KRW
690.0 billion from KRW 1,502.9 billion to KRW 2,192.9 billion, while shareholders’ equity
declined slightly from KRW 3,720.1 billion to KRW 3,591.6 billion. Although total assets and
equity were relatively stable, net income declined significantly, plummeting from KRW 864.7
billion to KRW 12.7 billion. RoA and RoE declined to 0.2% and 0.3% respectively from 12%
and 23% in 2011.

10 11
of 1,000 metric ton plant in Jiangsu, China in November 2012 to meet customer demand.
The company also invested in metallurgical silicon, the key raw material used to produce
polysilicon, in Banting, Malaysia. That project is slated for completion in the first half of 2013.
dividend
oCI paid a cash dividend of KRW 400 per share of common stock in 2012. The total dividend
was KRW 9,540 million, which represents 18.18% of net income and a dividend yield of 0.24%
based on the December 31 closing share price of KRW 165,500.
diVidend sUmmaRy
2011 2012
Net Income in KRW mn 729,165 52,480
EPS in KRW 30,937 2,200
Dividend per Share in KRW 2,200 400
Total Dividends in KRW mn 52,469 9,540
Dividend Payout Ratio 7.20% 18.18%
Dividend Yield 1.04% 0.24%
stoCK inFoRmation
2011 2012
Total Common Shares outstanding 23,849,371 23,849,371
foreign Investor Holdings 14.32% 19.45%
Funding strategy
liquidity Risk management
oCI has historically been able to satisfy its cash requirements from cash flows from operations
and debt and equity financings. The company establishes short-term and long-term fund
management plans and reviews. It reviews its actual cash outflows, budgets, and plans to
match the maturity profiles of financial assets and liabilities.
interest Rate Risk management
oCI uses an appropriate mix of fixed and floating loans to flexibly respond to fluctuating
interest rates. In addition, the company partially hedges its floating-rate financial assets to
ensure it can properly manage interest rate exposure.
Foreign exchange Risk management
oCI is exposed to currency risk on sales, purchases, and borrowings that are denominated in
currencies other than its functional currency, the Korean won (KRW). The company enters into
forward foreign exchange contracts and cross-currency swap contracts to manage a portion
of its foreign currency risk from receivables and payables. In addition, it enters into foreign
currency forwards to manage certain foreign currency risks related to future expected sales
and purchases in foreign currencies.
Capital expenditures
oCI’s total capital expenditures in 2012 amounted to KRW 744.4 billion on a consolidated
basis, substantially down from KRW 1,622.8 billion in 2011. The company rationalized capital
expenditures during the year with stricter standards for capital investments. It temporarily
suspended its Phase 4 and 5 polysilicon expansion plans due to significant changes in
the PV industry that resulted in a longer projected payback period. It continued to invest
in Nf3, a specialty gas used in semiconductor production, by completing the construction
inteRest exPenseKRW in bn
2011 2012
Interest Expense 73 83
Interest Rate 4.73% 4.50%
Consolidated figures based on K-IfRS
OCI ANNUAL REPORT 2012ComPany oVeRVieW
12 13
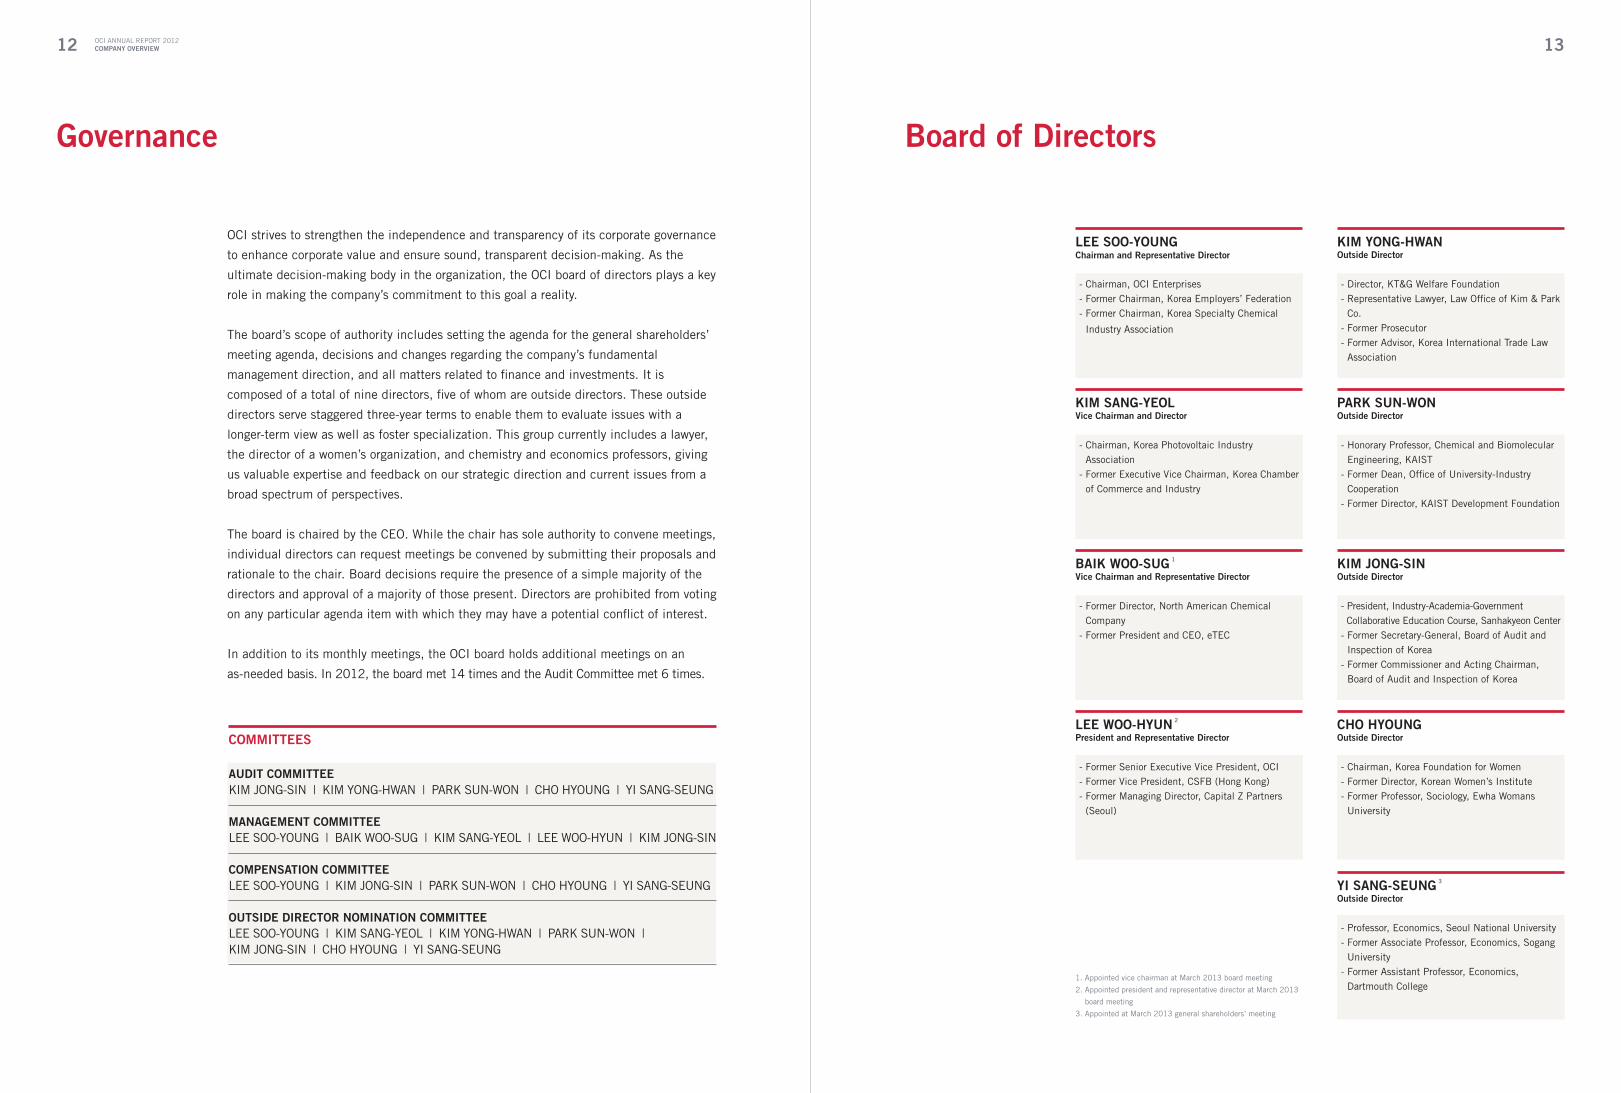
Board of directors
lee soo-yoUng Chairman and Representative director
- Chairman, OCI Enterprises- Former Chairman, Korea Employers’ Federation- Former Chairman, Korea Specialty Chemical
Industry Association
Kim sang-yeol Vice Chairman and director
- Chairman, Korea Photovoltaic Industry Association
- Former Executive Vice Chairman, Korea Chamber of Commerce and Industry
BaiK Woo-sUg 1
Vice Chairman and Representative director
- Former Director, North American Chemical Company
- Former President and CEO, eTEC
lee Woo-HyUn 2
President and Representative director
- Former Senior Executive Vice President, OCI- Former Vice President, CSFB (Hong Kong)- Former Managing Director, Capital Z Partners
(Seoul)
Kim yong-HWan outside director
- Director, KT&G Welfare Foundation- Representative Lawyer, Law Office of Kim & Park
Co.- Former Prosecutor- Former Advisor, Korea International Trade Law
Association
PaRK sUn-Won outside director
- Honorary Professor, Chemical and Biomolecular Engineering, KAIST
- Former Dean, Office of University-Industry Cooperation
- Former Director, KAIST Development Foundation
Kim Jong-sin outside director
- President, Industry-Academia-Government Collaborative Education Course, Sanhakyeon Center- Former Secretary-General, Board of Audit and
Inspection of Korea- Former Commissioner and Acting Chairman,
Board of Audit and Inspection of Korea
CHo HyoUng outside director
- Chairman, Korea Foundation for Women- Former Director, Korean Women’s Institute- Former Professor, Sociology, Ewha Womans
University
yi sang-seUng 3 outside director
- Professor, Economics, Seoul National University- Former Associate Professor, Economics, Sogang
University- Former Assistant Professor, Economics,
Dartmouth College1. Appointed vice chairman at March 2013 board meeting
2. Appointed president and representative director at March 2013
board meeting
3. Appointed at March 2013 general shareholders’ meeting
OCI ANNUAL REPORT 2012ComPany oVeRVieW
Committees
aUdit CommitteeKIM JONG-SIN | KIM YONG-HWAN | PARK SUN-WON | CHO HYOUNG | YI SANG-SEUNG
management CommitteeLEE SOO-YOUNG | BAIK WOO-SUG | KIM SANG-YEOL | LEE WOO-HYUN | KIM JONG-SIN
ComPensation CommitteeLEE SOO-YOUNG | KIM JONG-SIN | PARK SUN-WON | CHO HYOUNG | YI SANG-SEUNG
oUtside diReCtoR nomination CommitteeLEE SOO-YOUNG | KIM SANG-YEOL | KIM YONG-HWAN | PARK SUN-WON | KIM JONG-SIN | CHO HYOUNG | YI SANG-SEUNG
governance
OCI strives to strengthen the independence and transparency of its corporate governance
to enhance corporate value and ensure sound, transparent decision-making. As the
ultimate decision-making body in the organization, the OCI board of directors plays a key
role in making the company’s commitment to this goal a reality.
The board’s scope of authority includes setting the agenda for the general shareholders’
meeting agenda, decisions and changes regarding the company’s fundamental
management direction, and all matters related to finance and investments. It is
composed of a total of nine directors, five of whom are outside directors. These outside
directors serve staggered three-year terms to enable them to evaluate issues with a
longer-term view as well as foster specialization. This group currently includes a lawyer,
the director of a women’s organization, and chemistry and economics professors, giving
us valuable expertise and feedback on our strategic direction and current issues from a
broad spectrum of perspectives.
The board is chaired by the CEO. While the chair has sole authority to convene meetings,
individual directors can request meetings be convened by submitting their proposals and
rationale to the chair. Board decisions require the presence of a simple majority of the
directors and approval of a majority of those present. Directors are prohibited from voting
on any particular agenda item with which they may have a potential conflict of interest.
In addition to its monthly meetings, the OCI board holds additional meetings on an
as-needed basis. In 2012, the board met 14 times and the Audit Committee met 6 times.

14 15
total sales total eBitda
KRW 3,219 bn KRW 696 bn
1,28740%
35551%
1,932 60%
1,627100%
276100%
34149%
2002 20022012 2012
KRW in bn KRW in bn
KRW 1,627 bn
KRW 276 bn
OCI believes in the active pursuit of new opportunities. The company continuously reviews its business portfolio to ensure that it is best positioned to drive profitable growth over the long run. In addition to exploring for value-adding opportunities in existing lines of business, the company is focusing and seeking new growth opportunities in the renewable and clean energy sectors. This proactive strategy helps ensure that its business portfolio remains competitive and well positioned in today’s competitive global marketplace. It is also the reason the company has been able to generate over the past decade approximately 40% of sales and 50% of free cash flow from new businesses which did not exist in 2002.
Today, OCI is creating new growth opportunities for the global PV industry through its solar energy development business. In the United States, the company signed a 25-year power purchase agreement in 2012 with CPS Energy as part of a 400 MW project in San Antonio, Texas. The company also stepped up its project development efforts in Korea, signing memorandums of understanding with Seoul, Busan, and other cities totaling 340 MW of capacity. The company’s goal behind these efforts is to help generate new opportunities for the entire PV industry, stimulating demand for equipment and solutions that will help the industry return to growth. The company has also expanded its business portfolio into energy production by setting up OCI Saemangeum Energy to build and operate a cogeneration plant serving the Saemangeum Industrial Complex on Korea’s west-central coast as it continues to create opportunities for sustainable growth for itself, its partners, and local communities.
new Businesses
traditional Businesses
new Businesses
traditional Businesses
OCI ANNUAL REPORT 2012ComPany oVeRVieW
Foundations
●
oUR Way
innoVationCompetency to explore future growth by attempting and suggesting new businessopportunities through creative methods and expanding core businesses.
oPeRational exCellenCeCompetency to continuously accumulate knowledge on production and technology and improve operational efficiency and productivity.
CoRe teCHniCal leadeRsHiPCompetency to develop core technologies to produce differentiated and high value-addedproducts which respond to the needs of our customers.
ResoURCe oPtimiZationCompetency to generate optimum quantitative and qualitative services, technologies, and products by actively utilizing all resources available.
oPenness in CoRPoRate CUltUReCompetency to create a culture with openness, diversity, and mutual respect whereby we will maximize our capabilities.
●●
oUR ValUes
CHanCefuture is for those who find and seize the chance. We should take the chance when we are prepared to embrace future opportunities by swiftly responding to changing market, customer, and business circumstances.
CHallengeA greater future is achieved when we are brave enough to face a challenge with progressive and entrepreneurial minds and spirits to overcome difficulties.
CHangeInnovation through change is essential for growth. We embrace continuous change to reach the same goal and attain success together.
●●●
oUR stRategy
sUstainaBle gRoWtHDevelop through systematic organizational management and activities in the areas of environment, safety, and health.
FoCUs on CoRe BUsinessTurn existing competitive technological capabilities and new technologies into keybusinesses and promote them into growth businesses.
talent deVeloPmentNurture all employees into globally competitive talents.
CUstomeR-FoCUsedSatisfy and impress customers through insightful understanding of their needs, adoption of customer first approach, and prompt response to their requests.
soCial ContRiBUtionfulfill the role as a corporate citizen trusted by other members of the society for enriching their lives.
Vision
oURFUtURe
oURWay
oURValUes
●●●
Constantly innovate to producegreen energy and chemicalproducts with the highest levelof satisfaction to our employees,customers, shareholders,and stakeholders
●●
Seize the chance with thoroughpreparation and with the spirit tochallenge for continuous changefor a greater future
●
Achieve core technologyleadership through innovation,operational excellence, andresource optimization based onan open and diversity respectfulcorporate culture
‘global leading green energy and Chemical Company’
Company Vision

17
global sales by Region KRW in bn
2002 2012
OCI believes that change is indispensable for growth. The company recognizes that sustainable growth depends on the ability to constantly adapt to a rapidly changing business environment. The company is responding to this change through market diversification and globalization to create value and find new business opportunities. A decade ago in 2002, the company was dependent on the Korean market for approximately 60% of sales. Over the past 10 years, it has progressively made inroads into China, Taiwan, Japan and other new markets. In 2012, the company generated approximately 50% of sales in global markets, a trend it believes will continue to grow in the years ahead.
Today, OCI is continually identifying and exploring new business opportunities that will enable the company to reach new customers in new markets. Less than two years after entering the vacuum insulation panel business with the launch of its eco-friendly, high-performance ENERVAC fumed silica panels, the company captured the industry spotlight in 2012 by winning a 50,000 m2 order—over half of its annual capacity at the time—from a major European home appliance maker. The company’s sapphire materials have also made rapid inroads into the global LED lighting market, winning orders from major wafer manufacturers in Taiwan and across the region. The company has also expanded its global production network through projects in China, building a 1,000 metric ton nitrogen trifluoride plant in Jiangsu and a 6,000 metric ton fumed silica plant in Tangshan, enabling it to expand its customer base in China as well as Taiwan, Japan, and other major regional markets.
Korea
China
europe
america
asia
Rest of World
KRW 3,219 bn
KRW 1,627 bn
50.5%
59.2%
9.4%
3.8%
11.7%
7.9%
8.0%
14.2%
2.7%
15.9%
14.7%
2.0%
16 OCI ANNUAL REPORT 2012ComPany oVeRVieW
OCI continues to strategically invest in the future. The company has actively invested in capacity expansion in its core businesses to meet market demand and maintain industry-leading competitiveness through economies of scale. At the same time, the company has put equal weight on risk management and capital efficiency management, enabling it to maintain a sound balance sheet while executing major investments. This is why, despite ongoing investment during the three-year period between 2010 to 2012, the company’s leverage ratio has dropped from 144% to 103% even as its property, plant and equipment has risen approximately 27% and during the same period.
Today, OCI is innovating to ensure it can consistently compete and win in its core markets. Over the past few years, the PV industry has seen the price of polysilicon fall to the point where it is below the cash cost of production for many makers. In 2010, the company set out to significantly reduce the energy consumption of its production facilities, which accounts for roughly 30% of total production costs. These efforts have led to the development of proprietary technologies that have enabled it to dramatically reduce energy consumption by up to 20%. The company has also built a metallurgical-grade silicon plant in Malaysia, securing a stable, diversified supply of this key feedstock. Together, these strengths give the company a solid cost advantage over its peers that will help it weather this challenging period in the industry to emerge an even stronger competitor.
leverage Ratio and Property, Plant and equipment KRW in bn
2010 2011 2012
KRW 3,780 bn
KRW 4,807 bnKRW 4,818 bn
144%
94% 103%leverage Ratio
Property, Plant and equipment

OCI POHANG PLANT
oPeRationalReVieWOCI’s diversified and growing product portfolio led
by polysilicon and other high-tech materials and
products is building a brighter future.
∙ Polysilicon∙ Petro & Coal Chemicals∙ inorganic Chemicals, specialty gases & others∙ new Businesses

20 OCI ANNUAL REPORT 2012oPeRational ReVieW 21
market overview
Polysilicon is the primary raw material used to produce
photovoltaic wafers, cells and modules for the PV and
semiconductor industries. The global PV market had another
solid year of growth in 2012, spurred by government
incentives, falling system prices, and steadily rising demand
from major markets such as China, Japan, the United States,
and India. According to analyst consensus, between 25 to
35 GW of capacity was installed worldwide during the year.
Despite this steady growth trend in the PV industry, the
upstream polysilicon industry continues to face a chronic
oversupply situation that has pushed average selling prices
down to the USD 20/kg range, a level below the cash cost
of many producers. While OCI believes that the weakest
producers have already exited the market and all others
have cut back production, a resolution to the fundamental
overcapacity issue will require time and a major industry
consolidation. Protectionism is also emerging as a market
factor, with numerous anti-dumping actions pending
worldwide.
operating Highlights
Sales fell 55% in 2012 to KRW 861 billion, mirroring the
roughly 55% drop in polysilicon selling prices, which fell
from an average of USD 50/kg in 2011 to the USD
20/kg level. The company’s ability to rapidly respond to
market changes and strong customer relationships enabled
it to minimize the impact of falling prices as it leveraged
cost and quality competitiveness sharpened by ongoing
process and production optimization to make the best of a
difficult situation.
major Products Solar-grade PolysiliconElectronic-grade Polysilicon
sales KRW in bn
201220112010
861
1,914
1,160
2012 sales By maRKet
Korea
America
China
Asia
Europe
39.4%
27.4%26.5%
6.1%
0.6%
PRodUCtion CaPaCity
Polysilicon
in metric tons
2012201120102009
42,000
17,000
27,000
42,000
Polysilicon
oCi gUnsan Plant | Producing the world’s highest-purity polysilicon
22 OCI ANNUAL REPORT 2012oPeRational ReVieW 23
While the ultimate outcome of this escalating trade conflict
remains to be seen, the likely near-term impact will be an
additional delay in industry consolidation that will prolong
the current oversupply situation.
The company’s strategy going forward focuses on continuous
cost reduction, product differentiation, and strong customer
relationships. The company will improve its cost structure
by completing a debottlenecking project and diversifying
metallurgical-grade silicon sourcing. It will continue to
deliver superior-quality 10-nine solar-grade and 11-nine
electronic-grade polysilicon, focusing on the ultra-high purity
segment to meet the needs of major semiconductor wafer
and high-efficiency N-type PV cell producers.
The company will also continue to work closely with its
customers to create win-win outcomes in an extremely
challenging market environment. Overall, OCI believes its
top-tier quality, technology, and production capabilities
combined with a strong balance sheet and cash flow
position it to weather the current challenges and emerge
stronger and better prepared to meet the industry’s needs
in the coming years.
lee Woo-Jin
Team Manager Production Management TeamGunsan Plant
“ our ability to consistently find new ways to make polysilicon more efficiently is key to our continued leadership in this extremely competitive industry.”
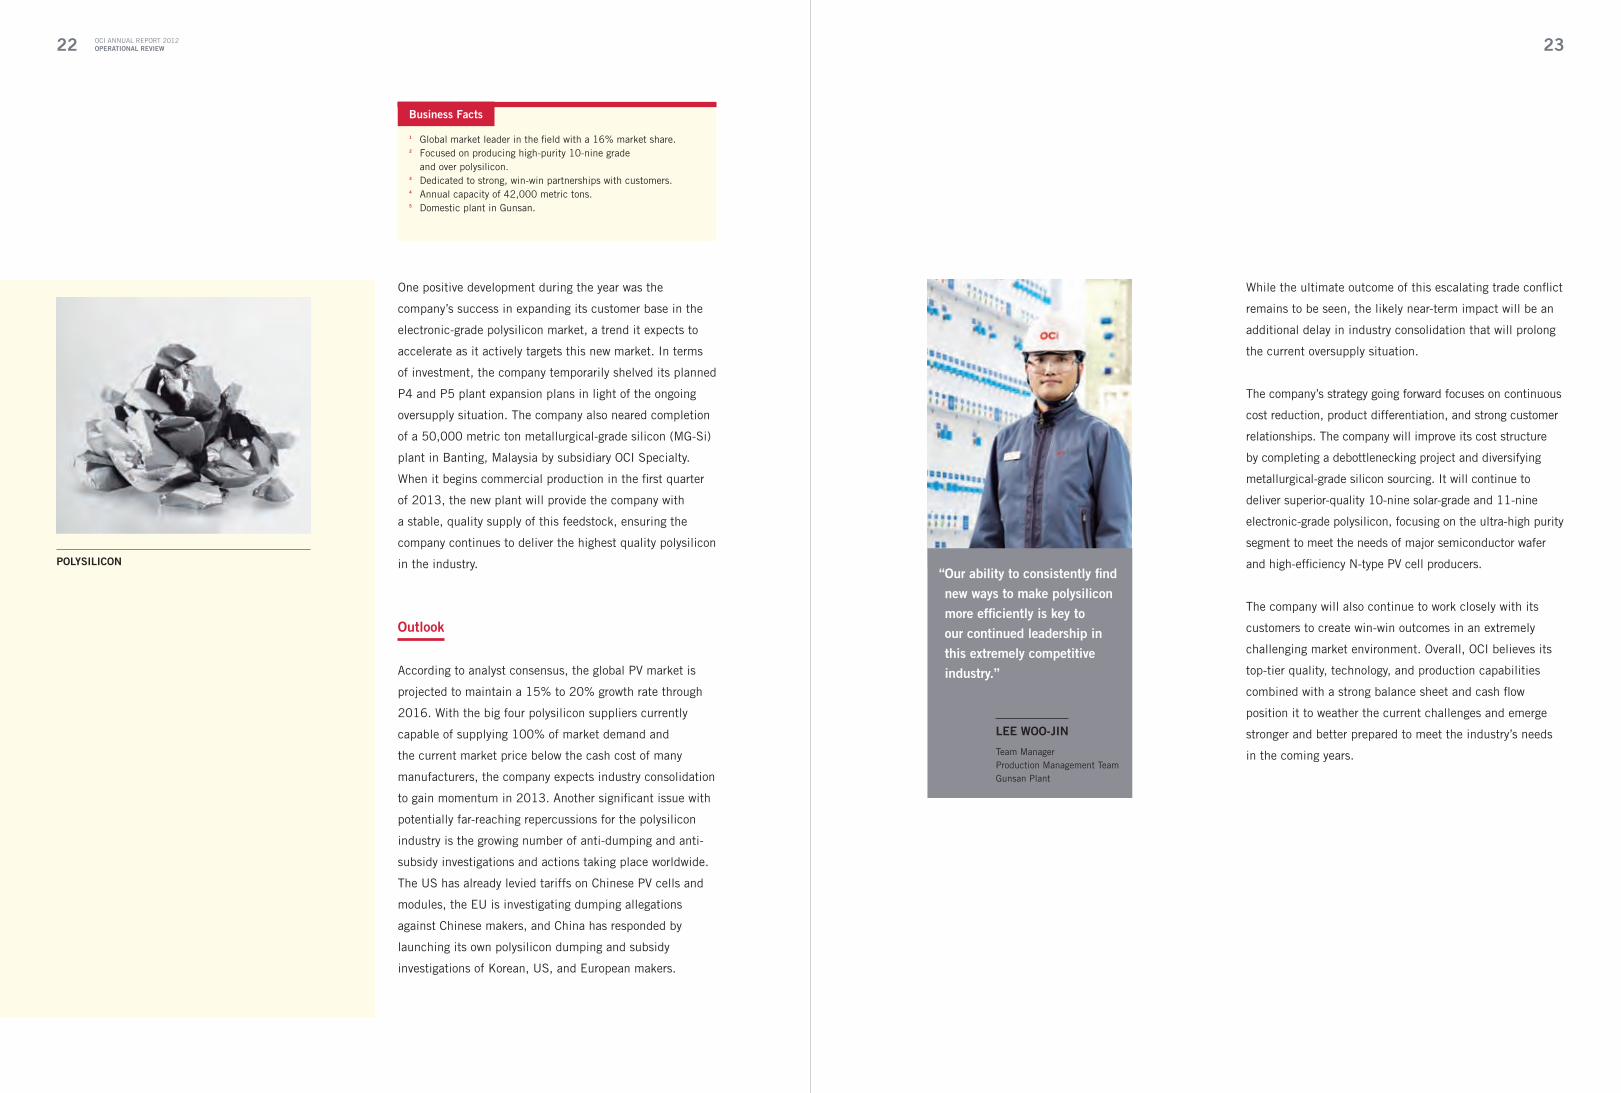
One positive development during the year was the
company’s success in expanding its customer base in the
electronic-grade polysilicon market, a trend it expects to
accelerate as it actively targets this new market. In terms
of investment, the company temporarily shelved its planned
P4 and P5 plant expansion plans in light of the ongoing
oversupply situation. The company also neared completion
of a 50,000 metric ton metallurgical-grade silicon (MG-Si)
plant in Banting, Malaysia by subsidiary OCI Specialty.
When it begins commercial production in the first quarter
of 2013, the new plant will provide the company with
a stable, quality supply of this feedstock, ensuring the
company continues to deliver the highest quality polysilicon
in the industry.
outlook
According to analyst consensus, the global PV market is
projected to maintain a 15% to 20% growth rate through
2016. With the big four polysilicon suppliers currently
capable of supplying 100% of market demand and
the current market price below the cash cost of many
manufacturers, the company expects industry consolidation
to gain momentum in 2013. Another significant issue with
potentially far-reaching repercussions for the polysilicon
industry is the growing number of anti-dumping and anti-
subsidy investigations and actions taking place worldwide.
The US has already levied tariffs on Chinese PV cells and
modules, the EU is investigating dumping allegations
against Chinese makers, and China has responded by
launching its own polysilicon dumping and subsidy
investigations of Korean, US, and European makers.
PolysiliCon
Business Facts
1 Global market leader in the field with a 16% market share.2 Focused on producing high-purity 10-nine grade
and over polysilicon.3 Dedicated to strong, win-win partnerships with customers.4 Annual capacity of 42,000 metric tons.5 Domestic plant in Gunsan.

24 OCI ANNUAL REPORT 2012oPeRational ReVieW 25
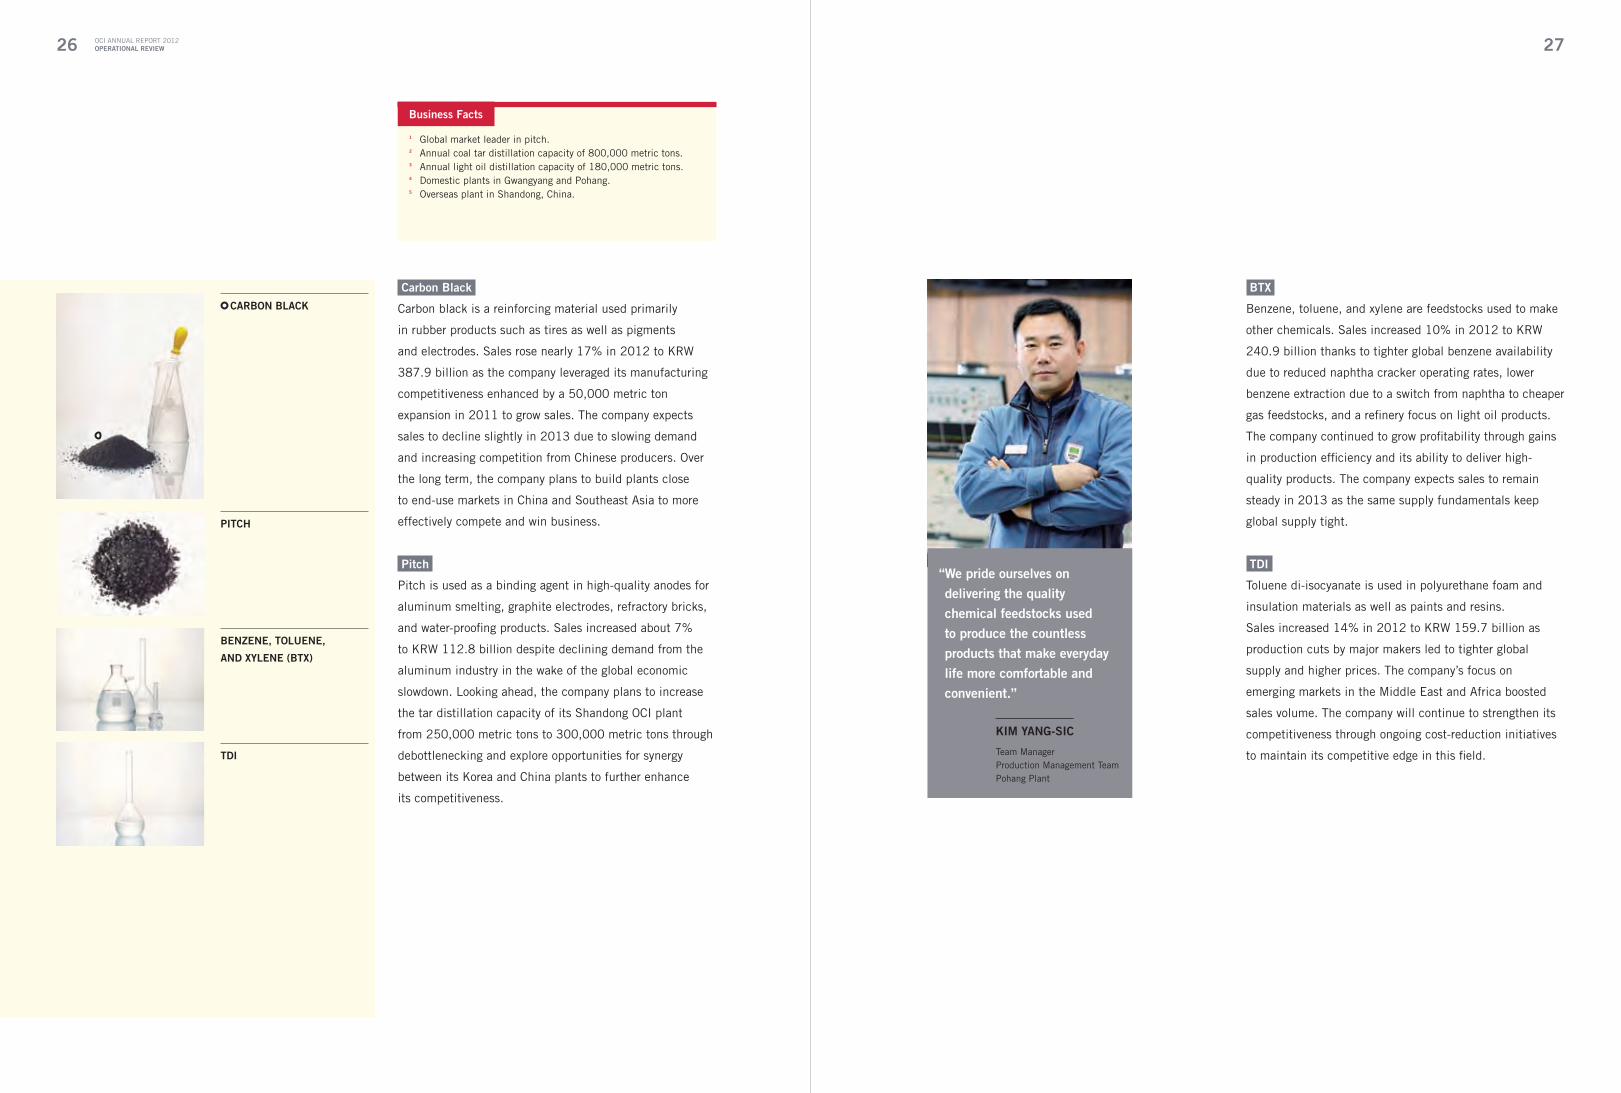
market overview
Petrochemicals and coal chemicals are crucial feedstocks
for a wide range of industries. As such, demand for these
products is closely linked to demand in the primary
industries in which they are used. For example, about
70% of carbon black demand comes from the global tire
industry, which is driven by growth in the auto industry as
well as replacement demand from existing vehicles. The
market for pitch is connected to demand for aluminum,
while the markets for BTX and TDI are connected to
demand for a vast range of other chemicals.
operating Highlights
Sales increased 2% in 2012 to KRW 1,136 billion as OCI
leveraged its quality and technology leadership to deliver
solid performances in most of its major businesses.
The company’s coal chemical businesses—carbon black
and pitch—had a mixed year. While a 50,000 metric ton
plant expansion completed in 2011 helped boost the
company’s carbon black business and market share, slowing
global demand for aluminum hurt its pitch business.
The company’s petrochemical businesses—BTX and
TDI—benefitted from tightening supply in the marketplace
due to production cuts by major competitors to post solid
sales growth.
major Products Carbon BlackPitchBenzene, Toluene, Xylene (BTX)Toluene Di-Isocyanate (TDI)
other Products Phthalic AnhydridePlasticizerPolyol
sales KRW in bn
201220112010
1,1361,114
1,004
PRodUCtion CaPaCity
tdi
Benzene
Carbon Black
Pitch
in metric tons
2012201120102009
340,000
270,000
160,000
50,000
230,000
210,000
160,000
50,000
2012 sales By maRKet
Korea
America
China
Asia Rest of World
Europe
8.4%
75.1%
10.3%5.4%
0.6%0.2%
Petro & Coal Chemicals
oCi PoHang Plant | Emerging as a global leader in pitch production
26 OCI ANNUAL REPORT 2012oPeRational ReVieW 27
Btx.
Benzene, toluene, and xylene are feedstocks used to make
other chemicals. Sales increased 10% in 2012 to KRW
240.9 billion thanks to tighter global benzene availability
due to reduced naphtha cracker operating rates, lower
benzene extraction due to a switch from naphtha to cheaper
gas feedstocks, and a refinery focus on light oil products.
The company continued to grow profitability through gains
in production efficiency and its ability to deliver high-
quality products. The company expects sales to remain
steady in 2013 as the same supply fundamentals keep
global supply tight.
tdi.
Toluene di-isocyanate is used in polyurethane foam and
insulation materials as well as paints and resins.
Sales increased 14% in 2012 to KRW 159.7 billion as
production cuts by major makers led to tighter global
supply and higher prices. The company’s focus on
emerging markets in the Middle East and Africa boosted
sales volume. The company will continue to strengthen its
competitiveness through ongoing cost-reduction initiatives
to maintain its competitive edge in this field.
Kim yang-siC
Team ManagerProduction Management TeamPohang Plant
“ We pride ourselves on delivering the quality chemical feedstocks used to produce the countless products that make everyday life more comfortable and convenient.”
Carbon Black.
Carbon black is a reinforcing material used primarily
in rubber products such as tires as well as pigments
and electrodes. Sales rose nearly 17% in 2012 to KRW
387.9 billion as the company leveraged its manufacturing
competitiveness enhanced by a 50,000 metric ton
expansion in 2011 to grow sales. The company expects
sales to decline slightly in 2013 due to slowing demand
and increasing competition from Chinese producers. Over
the long term, the company plans to build plants close
to end-use markets in China and Southeast Asia to more
effectively compete and win business.
Pitch.
Pitch is used as a binding agent in high-quality anodes for
aluminum smelting, graphite electrodes, refractory bricks,
and water-proofing products. Sales increased about 7%
to KRW 112.8 billion despite declining demand from the
aluminum industry in the wake of the global economic
slowdown. Looking ahead, the company plans to increase
the tar distillation capacity of its Shandong OCI plant
from 250,000 metric tons to 300,000 metric tons through
debottlenecking and explore opportunities for synergy
between its Korea and China plants to further enhance
its competitiveness.
tdi
PitCH
BenZene, tolUene,
and xylene (Btx)
CaRBon BlaCK
Business Facts
1 Global market leader in pitch.2 Annual coal tar distillation capacity of 800,000 metric tons.3 Annual light oil distillation capacity of 180,000 metric tons.4 Domestic plants in Gwangyang and Pohang.5 Overseas plant in Shandong, China.

28 OCI ANNUAL REPORT 2012oPeRational ReVieW 29
market overview
Inorganic chemicals and specialty gases are used in a wide
range of industries. The nitrogen trifluoride (NF3) market
centers primarily on the three major Asian semiconductor
manufacturing powerhouses of Korea, Japan, and Taiwan.
While the current NF3 oversupply situation is projected to
peak in 2013 due to weakness in the semiconductor and
LCD industries, the situation is expected to slowly improve
as demand recovers. The hydrogen peroxide market also
faces growing challenges due to ongoing expansion by both
existing players and newcomers, elevating the battle for
greater market share. The soda ash market continues to
grow, but the global economic slowdown has led to softer
demand. The fumed silica market is experiencing tight
supply due to expanding applications in the electronics,
resin, and insulation fields as well as constrained raw
materials and higher silicon tetrachloride prices.
operating Highlights
Sales decreased 2% in 2012 to KRW 1,222 billion
primarily due to significant market oversupply conditions
in the specialty gas market which overshadowed solid
performances in the hydrogen peroxide and soda ash fields.
The supply-demand imbalance was particularly severe
in the monosilane market, where an increasing number
of new entrants and aggressive price cutting by market
leaders pushed average selling prices down by over 30%.
Subsidiary OCI Materials completed a 1,000 metric ton
NF3 plant in Jiangsu, China in November, sharpening the
company’s competitiveness in that important growing market.
major Products Nitrogen Trifluoride (NF3) Hydrogen PeroxideSoda AshFumed Silica
other Products Monosilane (SiH4)Sodium Percarbonate Calcium Chloride Sodium Chloride Phosphoric AcidChemical ReagentsTungsten Hexafluoride (WF6) Silicon Filament
sales KRW in bn
201220112010
1,222 1,2481,158
PRodUCtion CaPaCity
nF3
Fumed silica
Hydrogen Peroxide
soda ash
in metric tons
2012201120102009
2,358,000
85,000
9,000
7,500
2,100,000
61,000 71,000
4,500
85,000
6,500
9,000
2,500
2012 sales By maRKet
Korea
America
China
Asia Rest of World
Europe
1.9%2.3%
43.8%
10.4% 0.5%
41.1%
inorganic Chemicals,specialty gases & others
oCi mateRials yeongJU Plant | Creating high-tech gases for high-tech manufacturing
30 OCI ANNUAL REPORT 2012oPeRational ReVieW 31
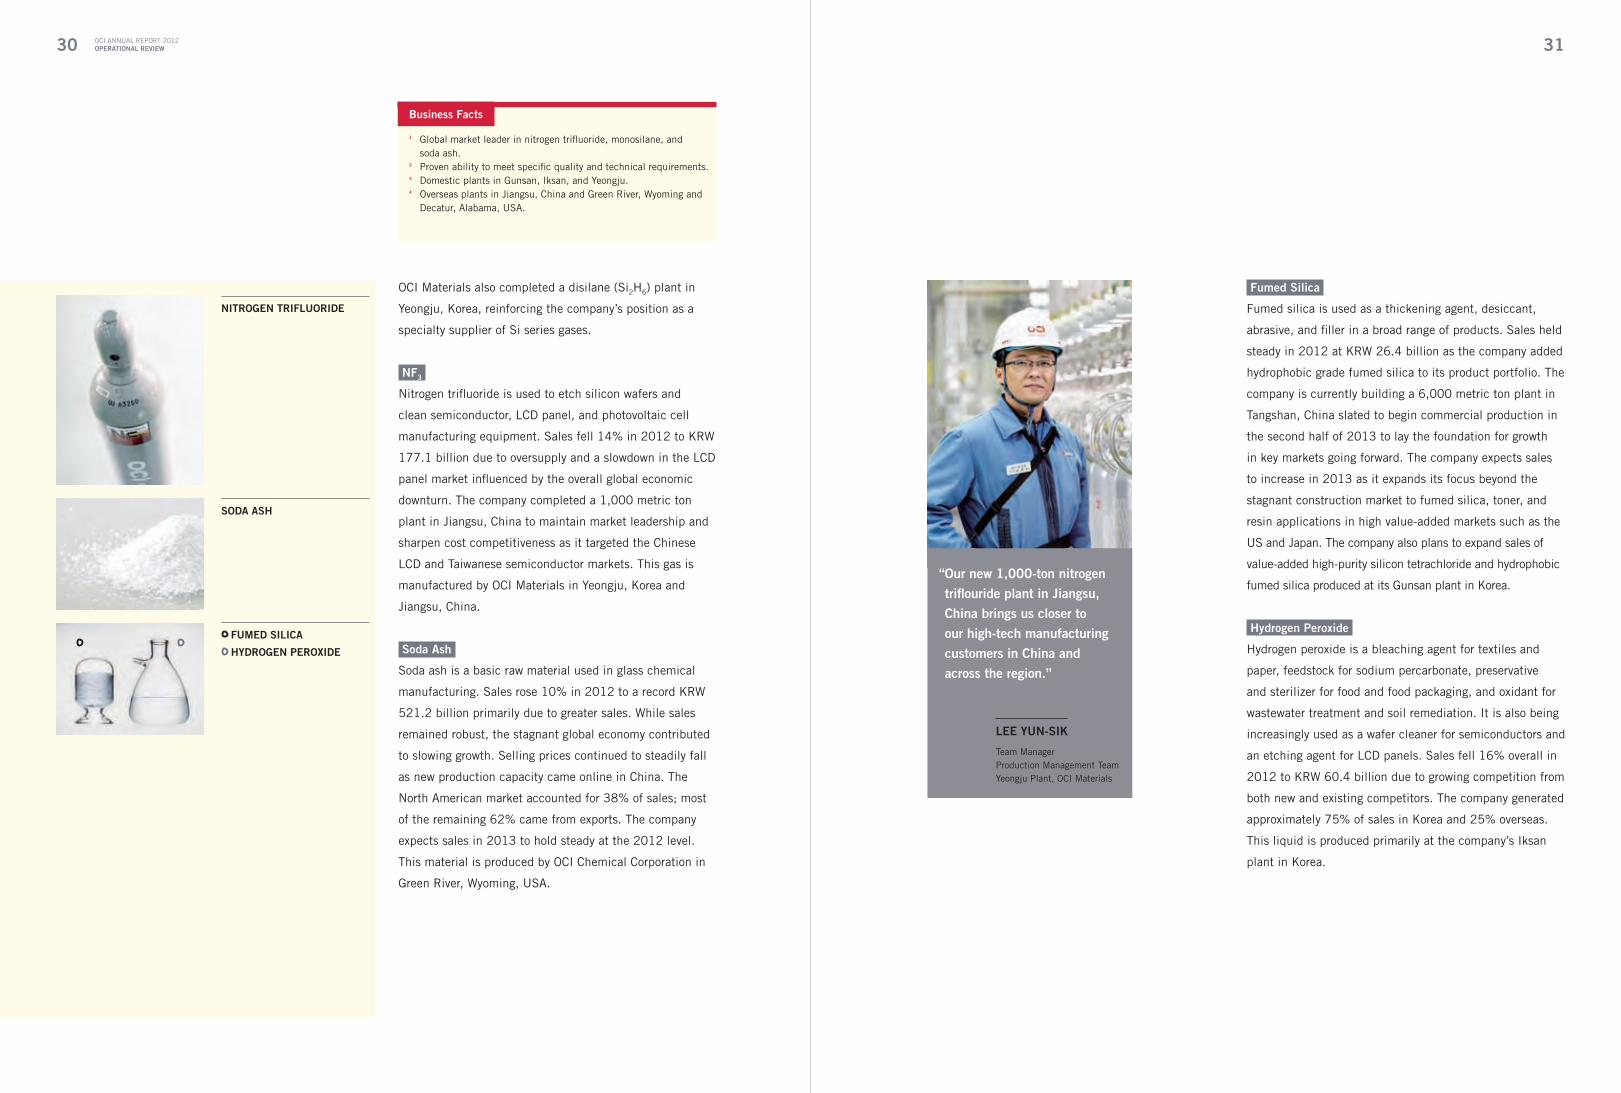
Fumed silica.
Fumed silica is used as a thickening agent, desiccant,
abrasive, and filler in a broad range of products. Sales held
steady in 2012 at KRW 26.4 billion as the company added
hydrophobic grade fumed silica to its product portfolio. The
company is currently building a 6,000 metric ton plant in
Tangshan, China slated to begin commercial production in
the second half of 2013 to lay the foundation for growth
in key markets going forward. The company expects sales
to increase in 2013 as it expands its focus beyond the
stagnant construction market to fumed silica, toner, and
resin applications in high value-added markets such as the
US and Japan. The company also plans to expand sales of
value-added high-purity silicon tetrachloride and hydrophobic
fumed silica produced at its Gunsan plant in Korea.
Hydrogen Peroxide.
Hydrogen peroxide is a bleaching agent for textiles and
paper, feedstock for sodium percarbonate, preservative
and sterilizer for food and food packaging, and oxidant for
wastewater treatment and soil remediation. It is also being
increasingly used as a wafer cleaner for semiconductors and
an etching agent for LCD panels. Sales fell 16% overall in
2012 to KRW 60.4 billion due to growing competition from
both new and existing competitors. The company generated
approximately 75% of sales in Korea and 25% overseas.
This liquid is produced primarily at the company’s Iksan
plant in Korea.
lee yUn-siK
Team ManagerProduction Management TeamYeongju Plant, OCI Materials
“ our new 1,000-ton nitrogen triflouride plant in Jiangsu, China brings us closer to our high-tech manufacturing customers in China and across the region.”
OCI Materials also completed a disilane (Si2H6) plant in
Yeongju, Korea, reinforcing the company’s position as a
specialty supplier of Si series gases.
nF3.
Nitrogen trifluoride is used to etch silicon wafers and
clean semiconductor, LCD panel, and photovoltaic cell
manufacturing equipment. Sales fell 14% in 2012 to KRW
177.1 billion due to oversupply and a slowdown in the LCD
panel market influenced by the overall global economic
downturn. The company completed a 1,000 metric ton
plant in Jiangsu, China to maintain market leadership and
sharpen cost competitiveness as it targeted the Chinese
LCD and Taiwanese semiconductor markets. This gas is
manufactured by OCI Materials in Yeongju, Korea and
Jiangsu, China.
soda ash.
Soda ash is a basic raw material used in glass chemical
manufacturing. Sales rose 10% in 2012 to a record KRW
521.2 billion primarily due to greater sales. While sales
remained robust, the stagnant global economy contributed
to slowing growth. Selling prices continued to steadily fall
as new production capacity came online in China. The
North American market accounted for 38% of sales; most
of the remaining 62% came from exports. The company
expects sales in 2013 to hold steady at the 2012 level.
This material is produced by OCI Chemical Corporation in
Green River, Wyoming, USA.
soda asH
FUmed siliCa HydRogen PeRoxide
nitRogen tRiFlUoRide
Business Facts
1 Global market leader in nitrogen trifluoride, monosilane, and soda ash.2 Proven ability to meet specific quality and technical requirements.3 Domestic plants in Gunsan, Iksan, and Yeongju.4 Overseas plants in Jiangsu, China and Green River, Wyoming and
Decatur, Alabama, USA.

32 OCI ANNUAL REPORT 2012oPeRational ReVieW 33
the terms of the agreement, OCI Solar Power will develop,
own, and operate a 400 MW solar energy project. The
project is slated to be completed in five phases through
2016, with the first 41 MW phase scheduled to come
online by and of 2013. Beyond providing clean, green
power for some 70,000 homes, the project is expected
to create more than 800 long-term jobs and generate an
estimated economic impact of USD 700 million annually.
OCI is also actively involved in solar energy development
in Korea. In May 2012, the company signed its first
memorandum of understanding with the city of Sacheon
on Korea’s southern coast to build, own, and operate a
40 MW solar plant scheduled to begin operation in 2013.
The company followed that up in September by signing a
memorandum of understanding with the city of Seoul to
build, own, and operate PV facilities with a total capacity of
100 MW on public building rooftops and undeveloped city
land. The Seoul project is slated for completion by the end
of 2014, meeting the power needs of some 36,000 homes
as it bolsters the capital city’s commitment to green growth.
As a global leader in the polysilicon market, OCI is excited
about the future of solar energy development. The company
believes that it is in a unique position to help grow the
industry as a project developer, bringing together local
stakeholders and its industry partners to harness the power
of the sun to generate clean, sustainable energy, create
jobs, and move communities and the industry forward to a
brighter future.
Business overview
While vertical integration is a common strategy that many
businesses use to capture value across the supply chain,
OCI believes that “vertical collaboration” is a far superior
choice. Rather than simply aiming to capture a bigger
piece of the PV market, the company’s strategy is to work
with local governments, utilities, and customers to create
a bigger market. It’s a collaborative, win-win strategy that
the company believes will create greater opportunities for
its partners across the entire PV value chain as it spurs
adoption of solar energy, new job generation, and cleaner
power for local communities.
2012 Review
OCI’s North American solar energy development business
is spearheaded by OCI Solar Power, a company created
through its acquisition of a 76% stake in a Chicago-based
solar power plant development company in January 2011.
OCI Solar Power has more than 40 solar energy projects
underway in communities throughout the United States
and Canada, creating new standards for partnerships and
community development.
The year 2012 was remarkable for OCI Solar Power. The
company completed its first post-acquisition project and
landed a landmark 400 MW project that is the largest
to date in the US and the second largest worldwide. In
April, the company completed the 3 MW Vineland Solar IV
project in New Jersey, the first of two company projects in
New Jersey. In July, the company signed a 25-year power
purchase agreement with CPS Energy of San Antonio, Texas,
the largest power and gas municipal utility in the US. Under
Business Facts
1 Primary focus is on expanding the PV market, creating new opportunities for partners across the PV value chain.
2 Targets solar energy projects with long-term off-take agreements.3 More than 40 projects totaling over 1 GW in development.4 North America business launched in January 2011.5 Korea business launched in January 2011.
new Businesses
Renewable solar energy development
PRoJeCts in PRogRess
north america
Korea
40+
15+
CaPaCity in PRogRess
north america
Korea
400 mW (AC)
140 mW
CaPaCity in oPeRation
north america
Korea
3 mW (AC)2.87 mW
tony doRaZio
President, OCI Solar Power
“ our solar energy development business aims to create new growth opportunities for the industry as well as new jobs and clean power in communities across the globe.”
oCi solaR PoWeR Vineland solaR iV PRoJeCt | Generating clean power for Vineland, NJ, USA

34 OCI ANNUAL REPORT 2012oPeRational ReVieW 35
plant. Representing an investment of KRW 39.5 billion, the
new 1 million m2 line augments the existing 160,000 m2
pilot line, increasing annual capacity to 1,160,000 m2.
2013 outlook
Backed by improved economies of scale from its new
commercial line, OCI is well positioned to pursue business
opportunities in new markets and fields with top-quality
products as government standards and incentives for
low-energy buildings drive new growth in the industry.
Building on its foothold in Europe, the company is now
actively expanding its distribution channels in other
markets, including China and North America. The company
is also expanding its business portfolio beyond the refrigeration
and construction markets to temperature-controlled packaging
and cold-storage truck and ship transport.
market overview
Vacuum insulation panels are primarily used in applications
for refrigeration, construction, and temperature-controlled
packaging where high thermal performance is required but
installation space is limited. Refrigeration is the primary
volume market, experiencing healthy growth in 2012
as manufacturers continued to seek proven solutions to
increase energy efficiency. Construction is a growing niche
market with the potential to become the mass market of
the future as builders gain experience and manufacturers
deliver more sophisticated solutions designed to meet new
low-energy building standards. Temperature-controlled
packaging is the fastest evolving market with strong growing
demand from the medical and pharmaceutical industries.
According to OCI’s analysis, the global market for vacuum
insulation panels was worth approximately USD 658 million
in 2012. The company expects this market to see rapid
growth over the next few years, tripling to more than USD
2.2 billion by 2016.
2012 Review
Sales of ENERVAC fumed silica vacuum insulation panels
continued to grow steadily in 2012, reaching KRW 4.0
billion as the company won new business with its high-
quality, high-performance products both at home and
abroad. In June, the company signed its first overseas
contract with a major European refrigerator maker to supply
50,000 m2 during the second half of the year. In December,
the company launched ENERVAC-D, a do-it-yourself
product aimed at the consumer market and completed
its first commercial production line at its Iksan insulation
insUlation eFFiCienCy
30 mm240 mm
206 mm
173 mm
100 mm
Business Facts
1 ENERVAC delivers the same performance as traditional insulation materials in just one-eighth the installation space.
2 Primary applications include refrigeration, construction, and temperature-controlled packaging.
3 Domestic shipments commenced in 2011.4 First overseas shipments commenced in 2012.5 “ENERVAC-D” do-it-yourself product launched in December 2012.
major Products “ENERVAC” Fumed Silica VacuumInsulation Panels
Kim yoUng-Ho
Team Manager, Quality Control TeamIksan Insulation Plant
“ our eneRVaC insulation panel business is poised for growth with increased capacity,
a growing product lineup, and an expanding international customer base.”
eneRVaC Fumed silica Vacuum insulation Panels
2012 sales By maRKet
Korea Europe
47% 53%
sales KRW in bn
20122011
4.0
1.4
PRodUCtion CaPaCity
in m2
20122011
1,160,000
160,000
oCi iKsan insUlation Plant | Delivering a superior solution for energy efficiency

36 OCI ANNUAL REPORT 2012oPeRational ReVieW 37
mUn gi-seoK
Team ManagerOCI Saemangeum Energy
“ oCi saemanguem energy’s launch in 2012 was a key milestone in our new cogeneration power business as we aim to begin operations by mid-decade.”
Project overview
Covering 18.7 square kilometers, the
Saemangeum Industrial Complex on
Korea’s west-central coast will
primarily host manufacturers serving
the green energy, shipbuilding, and
auto parts industries. This area is
unique in that some 15% of the zone
has been reserved for green space.
Industrial complexes in Korea typically
have on-site private cogeneration
utilities to efficiently supply steam and
electricity to resident companies. In
October 2011, OCI received a license
from Korea’s Ministry of Knowledge
Economy to build and operate a
cogeneration plant in the
Saemangeum complex. In June 2012,
the company established OCI
Saemangeum Energy to oversee this
new business. OCI owns a 95% equity
stake in the company, with the
remainder held by Gunjang Energy.
With the completion of non-recourse
financing agreements for the
cogeneration plant project in
December 2012 and additional
funding from a KRW 200 billion bond
issue in October 2012, The company
is preparing to break ground for the
KRW 400 billion first phase in the first
quarter of 2013. Phase 1 is scheduled
for commercial startup in October
2015. The company also has
expansion plans in place for an
additional phase to met the expected
future heat and power requirements of
the complex.
Beyond the solid revenue potential,
OCI views this project as a new
opportunity to make a concrete
contribution to local development and
quality of life in the Gunsan region. The
company will achieve this by profitably
delivering high-quality, low-cost steam
and power that will enhance the
competitiveness of resident industries
as well as advance a number of national
priorities such as energy efficiency and
greenhouse gas reduction.
Cogeneration Plant
Business Facts
1 Primary focus is on delivering high-quality heat and power to industries and creating new growth opportunities for the Gunsan region.
2 Received business license in October 2011.
3 Established operating company in June 2012.
4 Completed project financing arrangements in December 2012.
5 Phase 1 cogeneration plant scheduled for completion in October 2015.
lee sang-KyU
Team Manager, Production Team Jeonju Plant
“ our sapphire materials business got off to a solid start in 2012 as we began commercial shipments to customers in major markets across asia.”
market overview
Sapphire materials are primarily
used as a substrate in LED lighting
applications. They are also being
increasingly adopted in other
applications that demand exceptional
hardness and high transmission such
as optical windows and military optics.
LEDs or light-emitting diodes are
solid-state devices used in a growing
range of applications such as display
backlights for televisions and mobile
devices, automobile headlamps, and
general lighting. The rapid adoption
of LED backlights by TV and monitor
manufacturers has been the prime
industry growth driver in recent years.
The next major growth field for LEDs
is general lighting. According to Yole
Development, packaged LED revenue
from the general lighting segment will
grow from USD 2.3 billion in 2011
to USD 8.8 billion by 2015. This
rapid growth is being fueled by both
increasing affordability due to technical
advances and growing competition as
well as the growing adoption of national
policies that ban or discourage the sale
of incandescent bulbs.
2012 Review
OCI began shipping sapphire
ingots in volume in March to major
customers across Asia from its new
KRW 82 billion Jeonju plant, which
is capable of producing 4 million
mm of 2-inch equivalent (TIE) units
annually. Shipments to major LED
manufacturers in Taiwan, China,
Japan, and Korea established the
company as an emerging market player
in Asia in its first year in the market.
2013 outlook
While LED general lighting is projected
to see strong double-digit growth over
the next few years, sapphire material
oversupply is expected to drive market
consolidation in the near future. OCI is
confident it can emerge from this
process as a top-three player by 2015.
Toward this end, the company will
continue to enhance quality and cost
competitiveness through ongoing R&D
as it focuses on forging long-term
partnerships with major Asian LED
makers. Expanding into other sapphire
applications such as military optics,
mobile applications, and IR windows is
another key aspect of the company’s
long-term strategy to become a total
sapphire solution provider.
sapphire materials major Products Sapphire Ingots for LEDs
Business Facts
1 Primary applications include LED lighting and optical windows.
2 Domestic and international shipments commenced in March 2012.
3 Key markets include Taiwan, China, Japan, and Korea.
4 Focus is on higher-margin large-diameter ingots.
5 Jeonju plant has annual production capacity of 4 million TIE units.

38 OCI ANNUAL REPORT 2012oPeRational ReVieW 39
oCi angels seRViCe gRoUP | Sharing the power of the sun in Nepal
ResPonsiBilityReVieWOCI’s focus on its people and the local communities
where it does business is enabling the company to
forge win-win relationships with all its stakeholders.
∙ environmental Responsibility∙ social Responsibility∙ Personnel Responsibility

40 41
major initiatives
gunsan Plant | The plant took its environmental commitment to a new level in May 2012
by signing an agreement to support the Korean government’s “Green Start” campaign
to reduce the nation’s carbon footprint beyond the smokestack. The plant also renewed
its “Green Company” certification from Korea’s Ministry of Environment, a designation
awarded only to manufacturers that have adopted rigorous environmental management
systems and demonstrated an ongoing commitment to the environment.
iksan Plant | The plant made significant improvements in all major areas of environmental
performance in 2012. It reduced industrial waste by 28% and waste water pollution load
by 42%. It also conducted joint disaster response drills with the city fire department and
collected a number of awards for its health and safety initiatives. The plant completed its
fourth straight year without a major safety incident.
iksan insulation Plant | oCI is particularly proud of this plant where ENERVAC—Korea’s
first insulation product to win “Green Technology” certification—is produced. The
plant generates zero hazardous waste or emissions and recycles 100% of production
by-products. In 2012, it dramatically reduced per-ton Co2 emissions from 14 tons to 4
tons and per-ton energy consumption from 7 tons of oil equivalent to 4 tons. The plant
completed its second year in operation without a major safety incident.
Pohang Plant | oCI has created a finely-tuned production system that saves energy, cuts
emissions, and reduces costs. In 2012, the plant continued to supply 25 metric tons of
surplus steam per hour to the neighboring Pohang Steel Industrial Complex, reducing
complex Co2 emissions by an estimated 63,000 metric tons. It recycled over 50% of
biologically-treated effluent from desulfurization facilities. It captured and reused tail gas
from carbon black production as fuel for tar production and power generation. It converted
the heating furnace fuel from bunker C to LNG, cutting fuel costs as well as emissions. It
invested in grit reduction facilities for its carbon black plant, reducing Co2 emissions by
roughly 3,000 metric tons. The plant also signed a voluntary agreement with the city of
Pohang, committing itself to taking its environmental performance to the next level.
gwangyang Plant | The plant continued to systematically reduce its environmental
footprint, achieving a Co2 reduction of 8,660 metric tons. The plant also signed voluntary
agreements to reduce air pollutants such as S0X, No
X, dust, and VoCs by 30% from 2008
levels to improve local air quality. The plant marked its sixth straight year without a major
safety incident.
Jeonju Plant | oCI designed its sapphire ingot production process to minimize waste
water, enabling this plant to outsource wastewater treatment rather than building an on-site
facility. In october 2012, it also launched commercial operation of an on-site 400 kW PV
facility. The plant achieved a perfect safety record in its first full year of operations.
environmental Responsibility
OCI is committed to protecting the health
and safety of its employees, neighbors, and
customers. Today, the company is taking the
lead in making its operations even safer and
greener in support of government initiatives
to reduce greenhouse gas emissions and
energy consumption. The company has
joined a pilot emissions trading program
in preparation for the expected launch of
Korea’s cap-and-trade program in 2015. The
company has also established a 2020 GHG
master plan to serve as a roadmap for its
mitigation efforts for the rest of the decade.
In 2012, these ongoing efforts enabled
the company to reduce greenhouse gas
emissions by 42,000 metric tons, a figure it
aims to increase to 117,000 metric tons in
2013 through 36 projects.
OCI ANNUAL REPORT 2012ResPonsiBility
oCi gReen Commitment | Tackling pollution at the source
42 43
1 Delivering coal briquettes to shut-in seniors
2 Serving as guide runners for the blind
1
2
major Programs
Community engagement | oCI takes pride in engaging its local communities in a
variety of ways, both big and small. Company employees donate a small portion of their
paychecks for worthy local organizations or projects through the Angel campaign. They
help improve the standard of living in the rural farming community of Manjong through
the one Company, one Village program, participating in the annual garlic and red pepper
harvests as well as buying those products. They volunteer as guide runners for the blind
twice a year, a program that earned the company a special CSR award at the 2012 Korea
Business Communications Awards. They also participate in a variety of environmental
clean-up drives in local communities, helping keep streams, trails, and roads around oCI
plants cleaner and greener.
In 2012, the company expanded its community outreach into several new areas. It
donated a 1.5 kW PV system for a walking trail information center in the city of Incheon.
It sponsored a summer family camp program for severely disabled youth and their families
as well as installing bidets and safety bars in bathrooms at 107 homes. It also made winter
a little warmer for the less-privileged by collecting and donating used clothing as well as
installing high-performance ENERVAC-D insulation at a number of public and private
welfare facilities.
solar school Project | In April 2011, oCI launched this five-year KRW 10.5 billion
initiative to install basic PV systems at 300 schools across Korea to give students a unique
educational opportunity to learn first-hand the benefits of PV energy as well as help meet a
portion of each school’s power needs. The company completed installations at 60 schools
in 2012, bringing the total to 100 schools to date.
songam Foundation | The 2012 scholarship recipients included 10 college-age students,
who received four-year scholarships valued at KRW 32 million each, and 40 high-school
students, who received three-year tuition scholarships.
oCi museum of art | opened in 2010, the museum organizes and hosts exhibitions of
noteworthy Korean contemporary artists throughout the year. In addition to the oCI Young
Creatives program launched in 2009 to help emerging artists reach a wider audience,
the museum also operates an artist-in-residency program in Incheon, providing studio
space to eight talented artists annually. In 2012, the museum organized 11 exhibitions,
including 3 touring exhibitions to bring Korean contemporary art to smaller, culturally less-
privileged cities.
oCi Family Program | oCI believes in giving the younger members of the oCI family a
chance to make a difference in their communities. In summer 2012, oCI kids volunteered
to make and serve noodles to the elderly with the Korean Red Cross, build homes with
Habitat for Humanity, and serve at the annual Korean Special olympics.
social Responsibility
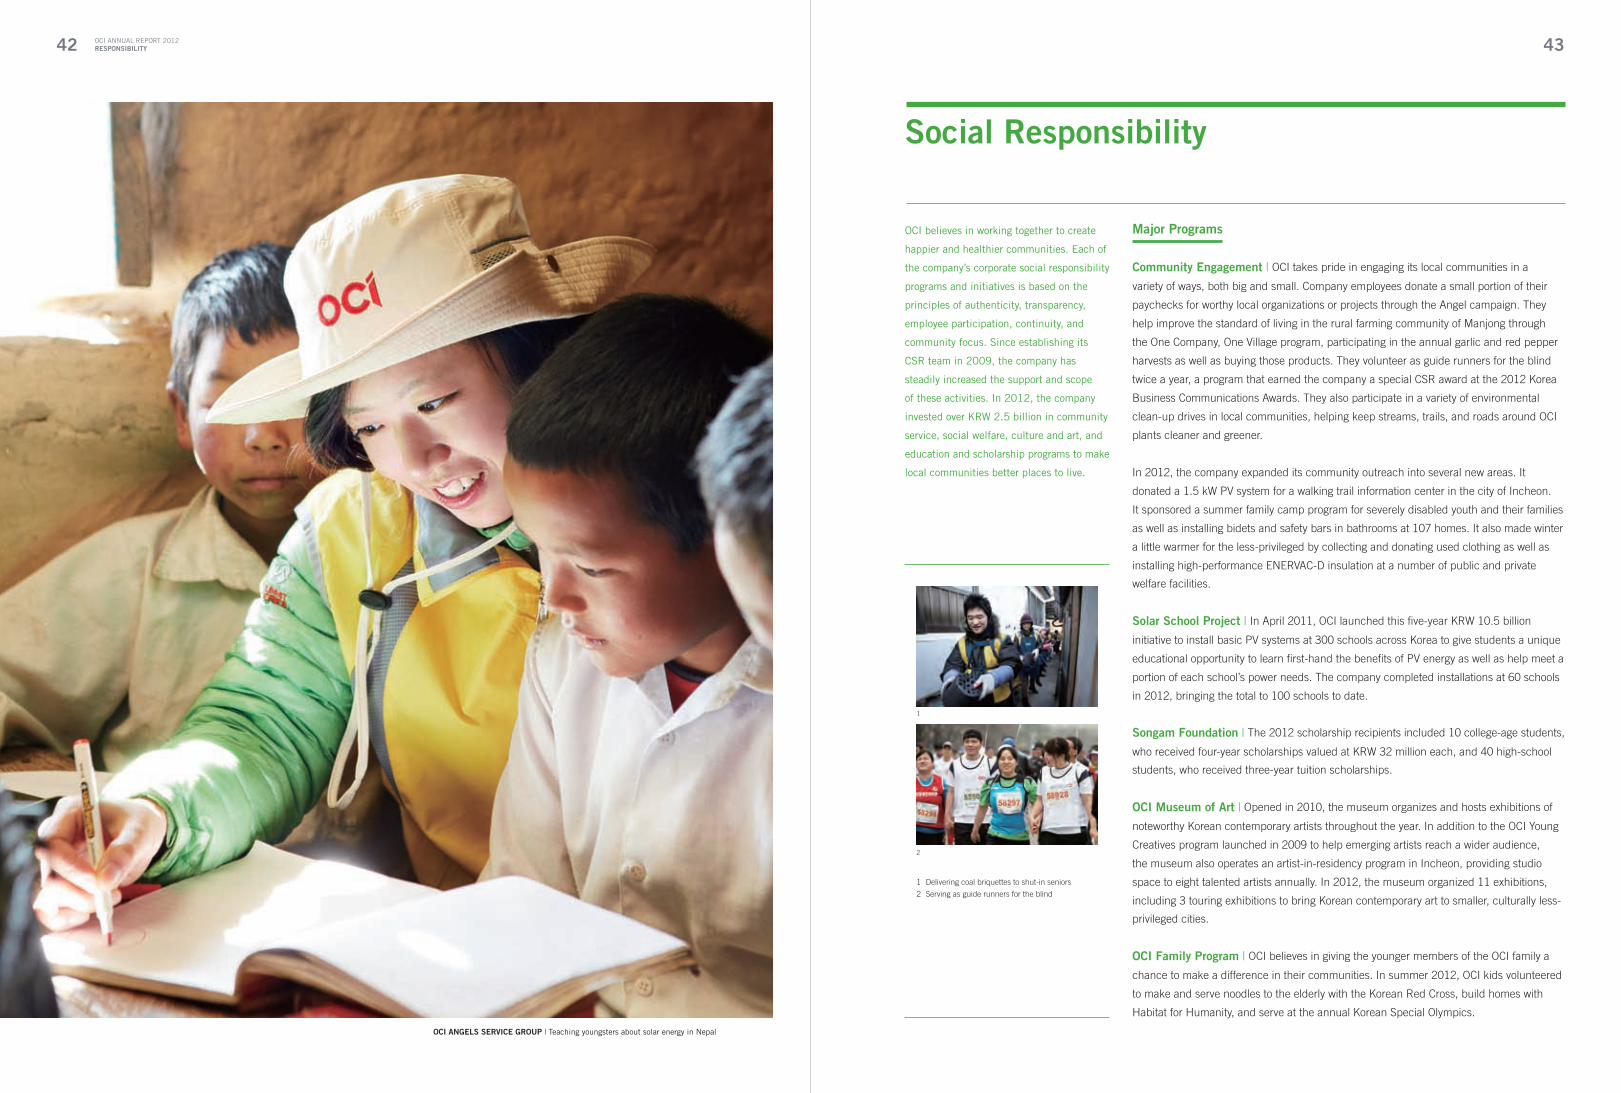
OCI believes in working together to create
happier and healthier communities. Each of
the company’s corporate social responsibility
programs and initiatives is based on the
principles of authenticity, transparency,
employee participation, continuity, and
community focus. Since establishing its
CSR team in 2009, the company has
steadily increased the support and scope
of these activities. In 2012, the company
invested over KRW 2.5 billion in community
service, social welfare, culture and art, and
education and scholarship programs to make
local communities better places to live.
OCI ANNUAL REPORT 2012ResPonsiBility
oCi angels seRViCe gRoUP | Teaching youngsters about solar energy in Nepal

44 45
major Programs
a global organization | oCI believes global success is possible through an organization
of truly global talent. The company has a strong belief that the development of global
talent can be accelerated by high caliber candidates from diversified backgrounds. In
this context, the company has not ceased its efforts to recruit individuals from all over the
world. It has thus far recruited talent from the United States, United Kingdom, france,
Germany, Canada, Japan, and China, aiming to raise the international component of its
headquarters staff to 20% by 2015.
In addition to hiring internationally, oCI also gives domestic employees in Korea an
opportunity to gain global experience. The company’s eight-week global internship
program targeting Korean engineering majors in the chemical, mechanical, electrical, and
material engineering fields gives candidates an opportunity to spend half of their time in
Korea and the other half at oCI overseas operations in Vietnam, Malaysia, or the United
States. The company’s job rotation policy also enables employees to gain valuable overseas
exposure and experience. The company is striving for an equal balance of international
and domestic employees at overseas operations.
Chance, Challenge, Change | oCI values and encourages its people to take on
challenging initiatives in order to cope with the rapidly changing global business
environment. The introduction of a new title system in late 2012 is an innovative approach
to enabling a free and open working environment. By reducing the title levels from six to
three—associate, manager, and team manager—oCI is moving away from the traditional
hierarchical-driven approach in the Korean workplace of the past and embracing the free-
flow of ideas from all employees, regardless of age or position. This initiative will ultimately
strengthen the company’s leadership pipeline by nurturing the growth of its young leaders.
Jhi-ihn-yong awards | oCI believes in recognizing excellence at all levels of its
organization. Named after the Korean words for wisdom, benevolence, and courage,
the 2012 Jhi-Ihn-Yong Awards acknowledged 25 individuals and 4 teams that made
significant contributions to enhancing the competitiveness of the organization during the
previous year. The company’s Gunsan plant garnered nine awards, followed by the Seoul
head office with eight, and the Seongnam R&D Center with three.
Personnel Responsibility
OCI’s vision of being a global leader in its
core businesses is changing the face of the
OCI organization. The company believes that
the caliber and quality of its people are key
to generating sustainable growth over the
long term. This is why the company actively
invests in recruiting the best and brightest
talent from around the world and provides a
broad range of educational and training
opportunities that enable its people to
expand their horizons and ultimately achieve
their full potential so that it can do the same.
1 Welcome ceremony for new recruits
1
OCI ANNUAL REPORT 2012ResPonsiBility
oCi leadeRsHiP | Building a winning global team

FinanCialReVieW
∙ independent auditors’ Report
∙ Consolidated statements of Financial Position
∙ Consolidated statements of income
∙ Consolidated statements of Changes in
shareholders’ equity
∙ Consolidated statements of Cash Flows
∙ notes to Consolidated Financial statements
OCI POHANG PLANT
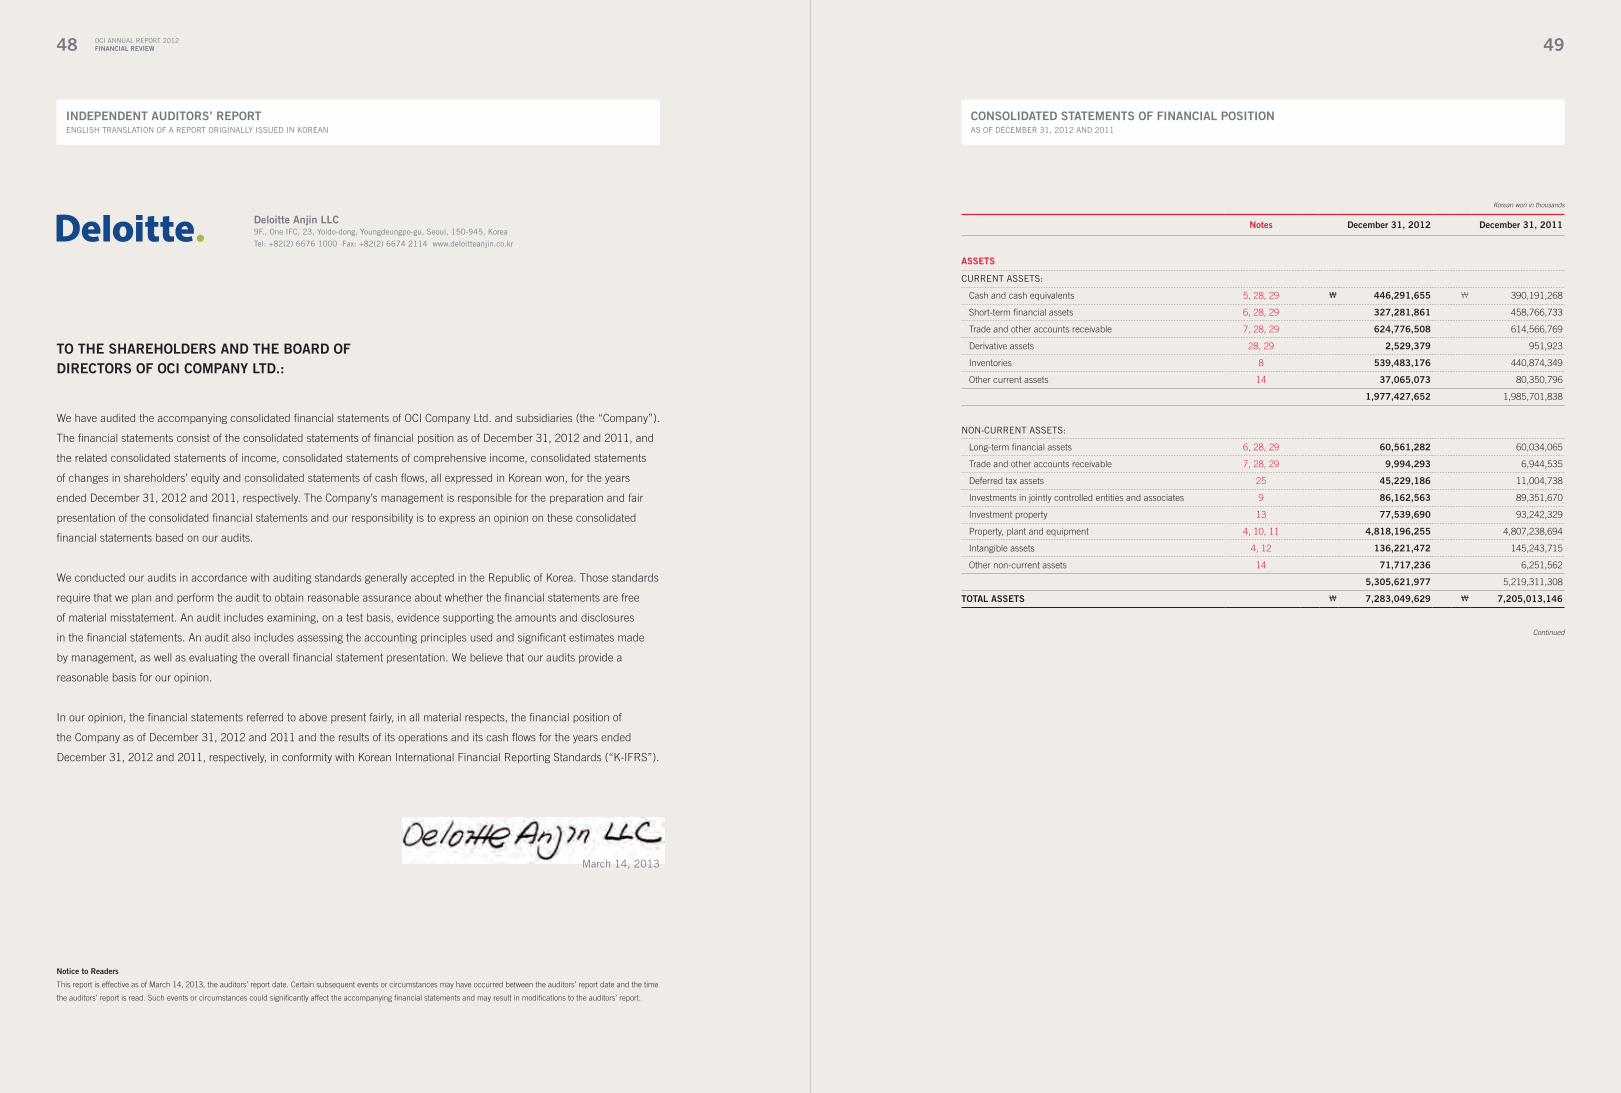
48 OCI ANNUAL REPORT 2012Financial Review 49
cOnSOliDaTeD STaTeMenTS OF Financial POSiTiOnAS OF DECEMBER 31, 2012 AND 2011
inDePenDenT aUDiTORS’ RePORTENgLISh TRANSLATION OF A REPORT ORIgINALLy ISSUED IN KOREAN
TO The ShaRehOlDeRS anD The BOaRD OFDiRecTORS OF Oci cOMPany lTD.:
We have audited the accompanying consolidated financial statements of OCI Company Ltd. and subsidiaries (the “Company”).
The financial statements consist of the consolidated statements of financial position as of December 31, 2012 and 2011, and
the related consolidated statements of income, consolidated statements of comprehensive income, consolidated statements
of changes in shareholders’ equity and consolidated statements of cash flows, all expressed in Korean won, for the years
ended December 31, 2012 and 2011, respectively. The Company’s management is responsible for the preparation and fair
presentation of the consolidated financial statements and our responsibility is to express an opinion on these consolidated
financial statements based on our audits.
We conducted our audits in accordance with auditing standards generally accepted in the Republic of Korea. Those standards
require that we plan and perform the audit to obtain reasonable assurance about whether the financial statements are free
of material misstatement. An audit includes examining, on a test basis, evidence supporting the amounts and disclosures
in the financial statements. An audit also includes assessing the accounting principles used and significant estimates made
by management, as well as evaluating the overall financial statement presentation. We believe that our audits provide a
reasonable basis for our opinion.
In our opinion, the financial statements referred to above present fairly, in all material respects, the financial position of
the Company as of December 31, 2012 and 2011 and the results of its operations and its cash flows for the years ended
December 31, 2012 and 2011, respectively, in conformity with Korean International Financial Reporting Standards (“K-IFRS”).
Deloitte anjin llc9F., One IFC, 23, yoido-dong, youngdeungpo-gu, Seoul, 150-945, Korea
Tel: +82(2) 6676 1000 Fax: +82(2) 6674 2114 www.deloitteanjin.co.kr
March 14, 2013
notice to Readers
This report is effective as of March 14, 2013, the auditors’ report date. Certain subsequent events or circumstances may have occurred between the auditors’ report date and the time
the auditors’ report is read. Such events or circumstances could significantly affect the accompanying financial statements and may result in modifications to the auditors’ report.
notes December 31, 2012 December 31, 2011
aSSeTS
CURRENT ASSETS:
Cash and cash equivalents 5, 28, 29 ₩ 446,291,655 ₩ 390,191,268
Short-term financial assets 6, 28, 29 327,281,861 458,766,733
Trade and other accounts receivable 7, 28, 29 624,776,508 614,566,769
Derivative assets 28, 29 2,529,379 951,923
Inventories 8 539,483,176 440,874,349
Other current assets 14 37,065,073 80,350,796
1,977,427,652 1,985,701,838
NON-CURRENT ASSETS:
Long-term financial assets 6, 28, 29 60,561,282 60,034,065
Trade and other accounts receivable 7, 28, 29 9,994,293 6,944,535
Deferred tax assets 25 45,229,186 11,004,738
Investments in jointly controlled entities and associates 9 86,162,563 89,351,670
Investment property 13 77,539,690 93,242,329
Property, plant and equipment 4, 10, 11 4,818,196,255 4,807,238,694
Intangible assets 4, 12 136,221,472 145,243,715
Other non-current assets 14 71,717,236 6,251,562
5,305,621,977 5,219,311,308
TOTal aSSeTS ₩ 7,283,049,629 ₩ 7,205,013,146
Continued
Korean won in thousands

50 OCI ANNUAL REPORT 2012Financial Review 51
cOnSOliDaTeD STaTeMenTS OF incOMeFOR ThE yEARS ENDED DECEMBER 31, 2012 AND 2011
cOnSOliDaTeD STaTeMenTS OF Financial POSiTiOn (cOnTinUeD)AS OF DECEMBER 31, 2012 AND 2011
notes December 31, 2012 December 31, 2011
liaBiliTieS
CURRENT LIABILITIES:
Short-term financial liabilities 15, 28, 29 ₩ 396,595,274 ₩ 641,955,041
Trade and other accounts payable 16, 28, 29 535,826,011 663,807,318
Derivative liabilities 28, 29 5,334,009 1,804,886
Income tax payable 25 457,036 137,156,521
Other current liabilities 19 10,611,349 7,745,083
948,823,679 1,452,468,849
NON-CURRENT LIABILITIES:
Long-term financial liabilities 15, 28, 29 1,796,307,316 860,944,362
Trade and other accounts payable 16, 28, 29 32,704,414 31,208,656
Deferred tax liabilities 25 9,753,794 19,334,787
Derivative liabilities 28, 29 365,494 -
Provisions 18 20,000,042 10,402,518
Retirement benefit obligation 17 116,666,431 111,307,673
Other non-current liabilities 19 766,795,222 999,207,717
2,742,592,713 2,032,405,713
TOTal liaBiliTieS 3,691,416,392 3,484,874,562
ShaRehOlDeRS’ eQUiTy
ShAREhOLDERS’ EQUITy:
Capital 21 127,246,855 127,246,855
Capital surplus 21 800,944,104 824,414,074
Capital adjustments 21 - (10,285)
Accumulated other comprehensive gain 21 1,292,776 18,801,722
Retained earnings 21 2,244,235,963 2,364,196,268
3,173,719,698 3,334,648,634
nOn-cOnTROllinG inTeReSTS 417,913,539 385,489,950
TOTal ShaRehOlDeRS’ eQUiTy 3,591,633,237 3,720,138,584
TOTal liaBiliTieS anD ShaRehOlDeRS’ eQUiTy ₩ 7,283,049,629 ₩ 7,205,013,146
See accompanying notes to consolidated financial statements.
Korean won in thousands
notes 2012 2011
Sales 4, 22 ₩ 3,218,459,512 ₩ 4,275,871,267
Cost of sales 23 (2,701,214,061) (2,797,635,497)
Gross profit 517,245,451 1,478,235,770
Selling and administrative expenses 23 362,462,605 360,319,821
Operating income 4 154,782,846 1,117,915,949
Financial income 24, 28 82,188,826 133,395,867
Financial expense 24, 28 (145,337,610) (209,343,274)
Share of profits of jointly controlled entities and associates 9 8,909,316 11,330,175
Other non-operating income 24 165,701,486 18,284,715
Other non-operating expense 24 (247,406,259) (28,261,357)
Income before income tax expense 18,838,605 1,043,322,075
Income tax expense 25 (6,129,415) (178,583,772)
Net income ₩ 12,709,190 ₩ 864,738,303
NET INCOME ATTRIBUTABLE TO:
Owners of the Company ₩ (68,352,631) ₩ 768,069,375
Non-controlling interests ₩ 81,061,821 ₩ 96,668,928
NET INCOME (LOSS) PER ShARE (In Korean won)
Basic and diluted income (loss) per share 26 ₩ (2,866) ₩ 32,588
See accompanying notes to consolidated financial statements.
Korean won in thousands, except for income per share data

52 OCI ANNUAL REPORT 2012Financial Review 53
cOnSOliDaTeD STaTeMenTS OF chanGeS in ShaRehOlDeRS’ eQUiTyFOR ThE yEARS ENDED DECEMBER 31, 2012 AND 2011
cOnSOliDaTeD STaTeMenTS OF cOMPRehenSive incOMeFOR ThE yEARS ENDED DECEMBER 31, 2012 AND 2011
notes 2012 2011
neT incOMe ₩ 12,709,190 ₩ 864,738,303
OThER COMPREhENSIVE INCOME (LOSS):
Actuarial gain (loss) on defined benefit plans 17 2,313,446 (33,334,622)
Gain (loss) on valuation of available-for-sale financial assets 28 (578,471) 29,490,952
Share of other comprehensive income of jointly controlled
entities and associates (1,706,925) (560,121)
Gain (loss) on overseas operations translation (27,736,170) 9,735,691
Loss on valuation of derivatives 28 (3,242,835) (235,767)
Others 2,125,015 (1,186,203)
(28,825,940) 3,909,930
cOMPRehenSive incOMe (lOSS) ₩ (16,116,750) ₩ 868,648,233
COMPREhENSIVE INCOME (LOSS) ATTRIBUTABLE TO:
Owners of the Company ₩ (84,599,585) ₩ 771,688,092
Non-controlling interests ₩ 68,482,835 ₩ 96,960,141
See accompanying notes to consolidated financial statements.
Korean won in thousands
notecapital
stockcapital surplus
capital adjustments
accumulatedother
comprehensive gain (loss)
Retainedearnings
Owners of the company
non-controlling
interests
Total shareholders’
equity
January 1, 2011 ₩ 121,606,450 ₩ 202,780,644 ₩ (90,590,918) ₩ (15,106,039) ₩ 1,783,629,394 ₩ 2,002,319,531 ₩ 285,412,778 ₩ 2,287,732,309
Dividends (73,971,856) (73,971,856) (31,991,774) (105,963,630)
Net income 768,069,375 768,069,375 96,668,928 864,738,303
Paid-in capital increase 21 5,640,405 557,266,197 562,906,602 20,011,269 582,917,871
Incorporation of subsidiaries - 15,097,536 15,097,536
Treasury stock 21 64,367,233 94,975,338 (83,241,601) 76,100,970 76,100,970
Stock option (4,370,904) (4,370,904) (4,370,904)
Gain on valuation of AFS financial assets 28 29,490,952 29,490,952 29,490,952
Jointly controlled entities and associates (560,121) (560,121) (560,121)
Translation gain on overseas operation 6,252,996 6,252,996 3,482,695 9,735,691
Loss on valuation of derivatives (211,576) (211,576) (24,191) (235,767)
Actuarial loss on defined benefit plans 17 (30,289,044) (30,289,044) (3,045,578) (33,334,622)
Others (23,801) (1,064,490) (1,088,291) (121,713) (1,210,004)
December 31, 2011 ₩ 127,246,855 ₩ 824,414,074 ₩ (10,285) ₩ 18,801,722 ₩ 2,364,196,268 ₩ 3,334,648,634 ₩ 385,489,950 ₩ 3,720,138,584
notecapital
stockcapital surplus
capital adjustments
accumulatedother
comprehensive gain (loss)
Retainedearnings
Owners of the company
non-controlling
interests
Total shareholders’
equity
January 1, 2012 ₩ 127,246,855 ₩ 824,414,074 ₩ (10,285) ₩ 18,801,722 ₩ 2,364,196,268 ₩ 3,334,648,634 ₩ 385,489,950 ₩ 3,720,138,584
Dividends (52,468,615) (52,468,615) (43,511,751) (95,980,366)
Net income (68,352,631) (68,352,631) 81,061,821 12,709,190
Paid-in capital increase (1,384,700) (1,384,700) 23,451,301 22,066,601
Acquisition of non-controlling interests (21,883,665) (21,883,665) (16,011,086) (37,894,751)
Loss on valuation of AFS financial assets 28 (578,471) (578,471) (578,471)
Jointly controlled entities and associates (1,706,925) (1,706,925) (1,706,925)
Translation loss on overseas operation (14,072,160) (14,072,160) (13,664,010) (27,736,170)
Loss on valuation of derivatives 28 (3,058,360) (3,058,360) (184,475) (3,242,835)
Actuarial gain on defined benefit plans 17 1,261,991 1,261,991 1,051,455 2,313,446
Others (201,605) 10,285 1,906,970 (401,051) 1,314,599 230,334 1,544,933
December 31, 2012 ₩ 127,246,855 ₩ 800,944,104 ₩ - ₩ 1,292,776 ₩ 2,244,235,963 ₩ 3,173,719,698 ₩ 417,913,539 ₩ 3,591,633,237
See accompanying notes to consolidated financial statements.
Korean won in thousands
Korean won in thousands
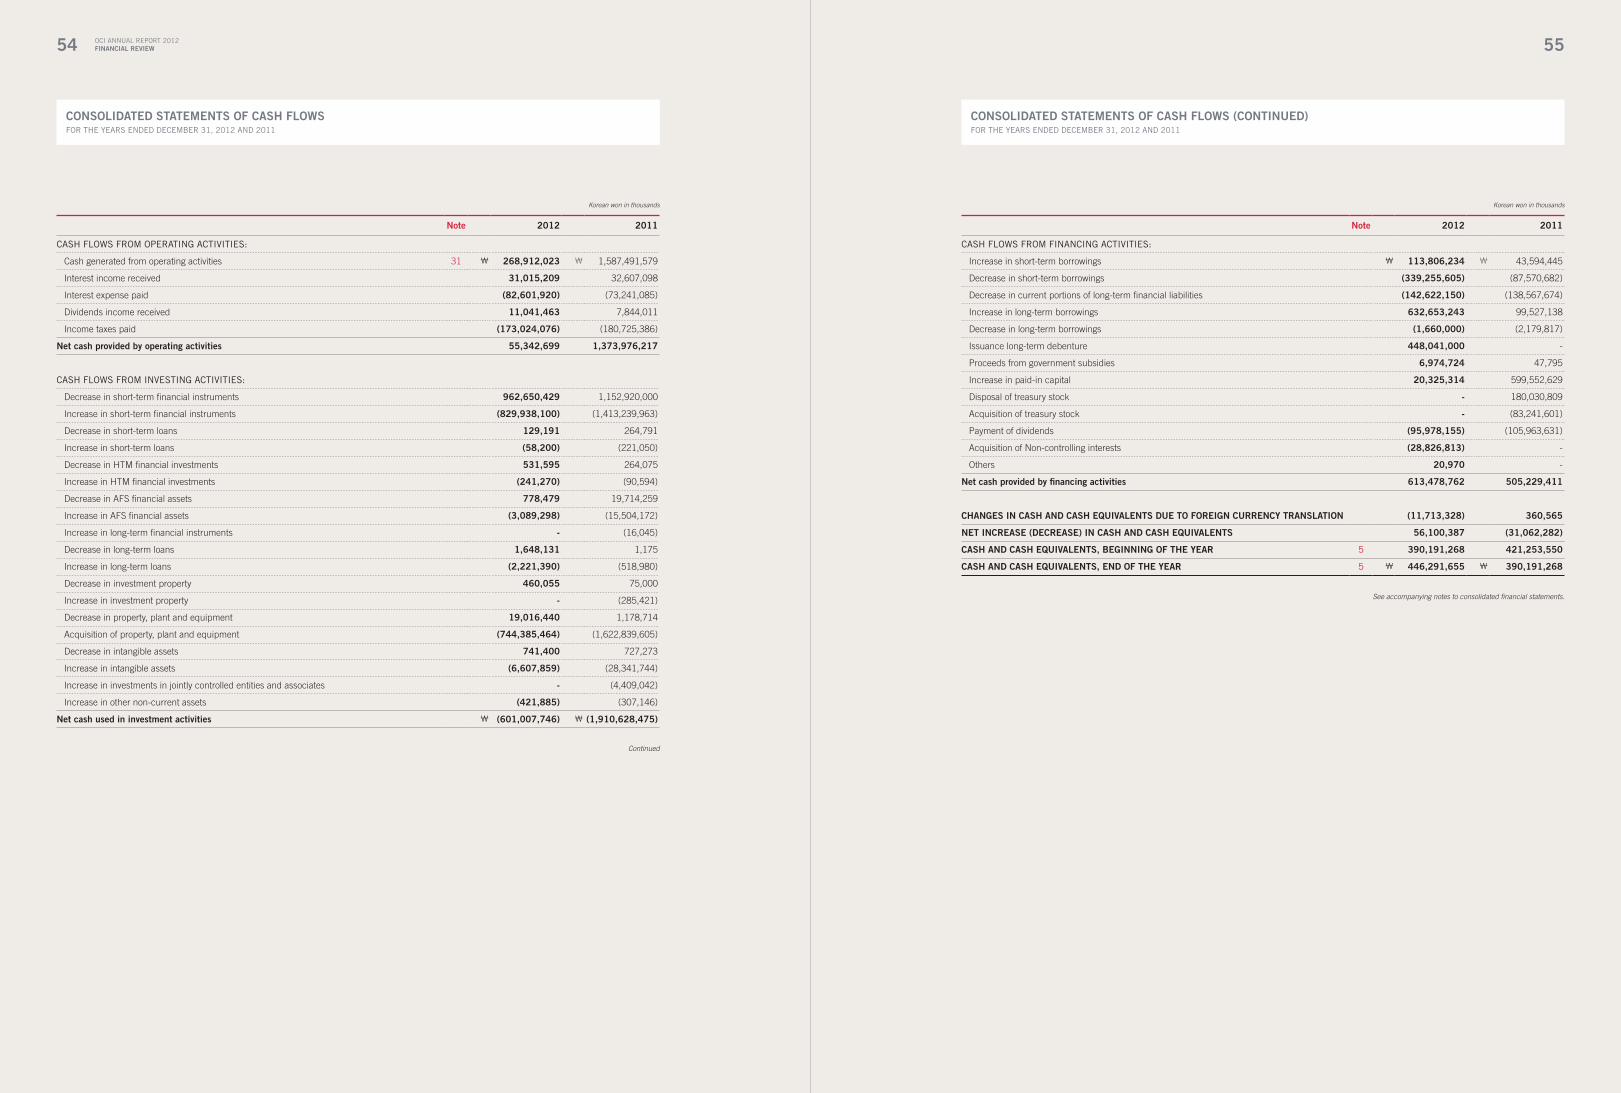
54 OCI ANNUAL REPORT 2012Financial Review 55
cOnSOliDaTeD STaTeMenTS OF caSh FlOwS (cOnTinUeD)FOR ThE yEARS ENDED DECEMBER 31, 2012 AND 2011
cOnSOliDaTeD STaTeMenTS OF caSh FlOwS FOR ThE yEARS ENDED DECEMBER 31, 2012 AND 2011
note 2012 2011
CASh FLOWS FROM OPERATINg ACTIVITIES:
Cash generated from operating activities 31 ₩ 268,912,023 ₩ 1,587,491,579
Interest income received 31,015,209 32,607,098
Interest expense paid (82,601,920) (73,241,085)
Dividends income received 11,041,463 7,844,011
Income taxes paid (173,024,076) (180,725,386)
net cash provided by operating activities 55,342,699 1,373,976,217
CASh FLOWS FROM INVESTINg ACTIVITIES:
Decrease in short-term financial instruments 962,650,429 1,152,920,000
Increase in short-term financial instruments (829,938,100) (1,413,239,963)
Decrease in short-term loans 129,191 264,791
Increase in short-term loans (58,200) (221,050)
Decrease in HTM financial investments 531,595 264,075
Increase in HTM financial investments (241,270) (90,594)
Decrease in AFS financial assets 778,479 19,714,259
Increase in AFS financial assets (3,089,298) (15,504,172)
Increase in long-term financial instruments - (16,045)
Decrease in long-term loans 1,648,131 1,175
Increase in long-term loans (2,221,390) (518,980)
Decrease in investment property 460,055 75,000
Increase in investment property - (285,421)
Decrease in property, plant and equipment 19,016,440 1,178,714
Acquisition of property, plant and equipment (744,385,464) (1,622,839,605)
Decrease in intangible assets 741,400 727,273
Increase in intangible assets (6,607,859) (28,341,744)
Increase in investments in jointly controlled entities and associates - (4,409,042)
Increase in other non-current assets (421,885) (307,146)
net cash used in investment activities ₩ (601,007,746) ₩ (1,910,628,475)
note 2012 2011
CASh FLOWS FROM FINANCINg ACTIVITIES:
Increase in short-term borrowings ₩ 113,806,234 ₩ 43,594,445
Decrease in short-term borrowings (339,255,605) (87,570,682)
Decrease in current portions of long-term financial liabilities (142,622,150) (138,567,674)
Increase in long-term borrowings 632,653,243 99,527,138
Decrease in long-term borrowings (1,660,000) (2,179,817)
Issuance long-term debenture 448,041,000 -
Proceeds from government subsidies 6,974,724 47,795
Increase in paid-in capital 20,325,314 599,552,629
Disposal of treasury stock - 180,030,809
Acquisition of treasury stock - (83,241,601)
Payment of dividends (95,978,155) (105,963,631)
Acquisition of Non-controlling interests (28,826,813) -
Others 20,970 -
net cash provided by financing activities 613,478,762 505,229,411
chanGeS in caSh anD caSh eQUivalenTS DUe TO FOReiGn cURRency TRanSlaTiOn (11,713,328) 360,565
neT incReaSe (DecReaSe) in caSh anD caSh eQUivalenTS 56,100,387 (31,062,282)
caSh anD caSh eQUivalenTS, BeGinninG OF The yeaR 5 390,191,268 421,253,550
caSh anD caSh eQUivalenTS, enD OF The yeaR 5 ₩ 446,291,655 ₩ 390,191,268
Korean won in thousands Korean won in thousands
Continued
See accompanying notes to consolidated financial statements.

56
nOTeS TO cOnSOliDaTeD Financial STaTeMenTSFOR ThE yEARS ENDED DECEMBER 31, 2012 AND 2011
OCI ANNUAL REPORT 2012Financial Review 57
nOTeS TO cOnSOliDaTeD Financial STaTeMenTSFOR ThE yEARS ENDED DECEMBER 31, 2012 AND 2011
1. GeneRal inFORMaTiOn
The PaRenT
OCI Company Ltd. (the “Parent”) was incorporated on August 5, 1959, in accordance with the Commercial Code of Korea, to manufacture and sell
soda ash and related products. In 1976, the Parent listed its common shares on the Korea Exchange. On May 1, 2001, the Parent merged with
Korea Steel Chemical Company and changed its name to DC Chemical Co., Ltd. Furthermore, on May 1, 2008, the Parent spun off its Incheon
business segment and on April 1, 2009, changed its name to OCI Company Ltd. As of May 30, 2011, the Parent listed Global Depository Receipts
(GDRs) on the Singapore Exchange Securities Trading Ltd. through a capital increase and sale of its treasury stocks.
The Parent is headquartered at Sogong-Dong 50, Jung-Gu, Seoul, Korea, and its capital amounted to ₩ 127,246,855 thousand as of December 31, 2012.
cOnSOliDaTeD SUBSiDiaRieS
Subsidiaries consolidated in the accompanying financial statements of the Parent and its subsidiaries (collectively, referred to as the “Company”)
as of December 31, 2012, are as follows:
Subsidiaries Business
number of
shares (*1)
Percentage of
ownership (*1) location
Financial
year-end
OCI Enterprises Inc. Holding company 202,317 89.74% USA Dec. 31
OCI Chemical Corp. Sales agency of OCI Wyoming L.P. 1,100 100.00% USA Dec. 31
OCI Wyoming Holding Co., Ltd. Holding company 1,000 100.00% USA Dec. 31
OCI Wyoming Co., Ltd. Holding company 32,640 80.00% USA Dec. 31
OCI Wyoming L.P. Manufactures and sells soda ash - 51.49% USA Dec. 31
OCI Chemical Europe N.V. Sells soda ash 2,500 100.00% Belgium Dec. 31
OCI Energy LLC Holding company - 100.00% USA Dec. 31
OCI Solar Power LLC Development of solar generation equipment - 100.00% USA Dec. 31
OCI Alabama LLC Manufactures of percarbonate - 100.00% USA Dec. 31
Cornerstone Power Vineland 1, LLC Development of solar generation equipment - 100.00% USA Dec. 31
Cornerstone Power Holmdel, LLC Development of solar generation equipment - 100.00% USA Dec. 31
OCI Solar San Antonio LLC Development of solar generation equipment - 100.00% USA Dec. 31
ERCAM Trackers LLC Manufactures solar tracker - 51.00% USA Dec. 31
OCI Materials Co., Ltd. (*2) Manufactures and sells industrial gas 5,178,535 49.10% Korea Dec. 31
OCI Materials Taiwan Co., Ltd. Sells industrial gas 2,000,000 100.00% Taiwan Dec. 31
OCI Materials Japan Co., Ltd. Sells industrial gas 4,989 95.00% Japan Dec. 31
JIANGSU OCI Materials Co., Ltd. Manufactures and sells industrial gas - 100.00% China Dec. 31
OCI Vietnam Co., Ltd
(formerly, Kosvida Agrochemical Co., Ltd).
Manufactures and sells agricultural
chemical raw materials - 100.00% Vietnam Dec. 31
DCRE Co., Ltd. Manufactures and sells chemical raw materials
and analytical reagent, and develops real estate 16,406,250 100.00% Korea Dec. 31
Shandong OCI Co., Ltd. Manufactures and sells coal tar - 80.00% China Dec. 31
OCI Specialty Co., Ltd.
(formerly, Elpion Co., Ltd.)
Manufactures and sells materials
related to solar energy 89,543,541 68.16% Korea Dec. 31
Elpion Silicon Sdn. Bhd. Manufactures and sells materials
related to solar energy 12,139,760 100.00% Malaysia Dec. 31
OCI Information & Communication Co., Ltd. Invests and operates information system 200,000 100.00% Korea Dec. 31
Subsidiaries Business
number of
shares (*1)
Percentage of
ownership (*1) location
Financial
year-end
DCC (Shanghai) Co., Ltd. Sells materials related to solar energy - 100.00% China Dec. 31
OCI Japan Co., Ltd. Sells materials related to solar energy 7,999 99.99% Japan Dec. 31
OCI China Co., Ltd. Holding company - 100.00% China Dec. 31
Tangshan OCI Sunfar
Chemical Co., Ltd.
Manufactures and sells materials
related to fumed silica - 80.00% China Dec. 31
OCI SE Co., Ltd. Supplier of steam and hot water and
electricity generated by owned power plant 1,330,000 95.00% Korea Dec. 31
OCI Power Co., Ltd. Solar Generation 242,000 100.00% Korea Dec. 31
OCI Seoul Photovoltaic Power
Generation Co., Ltd. Solar Generation 228,000 100.00% Korea Dec. 31
(*1) Includes indirect investments held by subsidiaries
(*2) The Parent has the authority to determine the members of the board of directors, and as a result, the Parent is considered to have substantial control over the entity
and have basis for consolidation.
The Parent owns the shares of OCI Chemical Corp., OCI Wyoming Holding Co., Ltd., OCI Wyoming Co., Ltd., OCI Wyoming L.P., OCI Chemical
Europe N.V., OCI Energy LLC, OCI Solar Power LLC, OCI Alabama LLC and Cornerstone Power Vineland 1, LLC, Cornerstone Power Holmdel, LLC,
OCI Solar San Antonio LLC and ERCAM Trackers LLC through OCI Enterprises Inc.; the shares of OCI Materials Taiwan Co., Ltd., OCI Materials
Japan Co. Ltd. and JIANGSU OCI Materials Co., Ltd., through OCI Materials Co., Ltd.; the shares of ELPION Silicon Sdn. Bhd. through OCI
Specialty Co., Ltd.; the shares of Tangshan OCI Sunfar Chemical Co., Ltd., through OCI China Co., Ltd.,; OCI Seoul Photovoltaic Power Generation
Co., Ltd. through OCI Power Co., Ltd.
Financial data of the Company’s major subsidiaries as of and for the year ended December 31, 2012 are as follows (Korean won in thousands):
Subsidiaries assets liabilities
Shareholders’
equity Sales
net income
(loss)
OCI Enterprises Inc. (*1) ₩ 696,797,118 ₩ 284,700,186 ₩ 412,096,932 ₩ 552,923,129 ₩ 93,885,641
OCI Materials Co., Ltd. (*1) 690,697,418 344,656,264 346,041,154 254,355,839 29,048,827
OCI Vietnam Co., Ltd. 19,189,645 15,721,229 3,468,416 51,208,775 1,100,246
DCRE Co., Ltd. 1,178,288,606 332,960,343 845,328,263 33,869,616 (204,421,375)
Shandong OCI Co., Ltd. 60,958,371 27,985,239 32,973,132 119,470,168 536,567
OCI Specialty Co., Ltd. (*1) 275,131,292 137,651,222 137,480,070 59,255,864 870,480
OCI Information & Communication Co., Ltd. 5,708,417 1,810,778 3,897,639 11,822,674 1,265,436
DCC (Shanghai) Co., Ltd. 7,569,789 1,195,660 6,374,129 464,469 (1,772,499)
OCI Japan Co., Ltd. 1,240,074 89,682 1,150,392 1,509,054 (250,778)
OCI China Co., Ltd. (*1) 33,145,411 2,744,964 30,400,447 2,562,708 (57,270)
OCI SE Co., Ltd. 6,917,936 2,389 6,915,547 - (84,453)
OCI Power Co., Ltd. (*1) 1,169,269 1,711 1,167,558 - (42,442)
(*1) Represents the entity’s consolidated financial statements for the period.
JOinTly cOnTROlleD enTiTieS anD aSSOciaTeS
Jointly controlled entities and associates accounted for under the equity method in the consolidated financial statements as of December 31,
2012, are as follows:

58
nOTeS TO cOnSOliDaTeD Financial STaTeMenTSFOR ThE yEARS ENDED DECEMBER 31, 2012 AND 2011
OCI ANNUAL REPORT 2012Financial Review 59
nOTeS TO cOnSOliDaTeD Financial STaTeMenTSFOR ThE yEARS ENDED DECEMBER 31, 2012 AND 2011
Jointly controlled entities and associates Business
number of
shares
Percentage of
ownership location
Financial
year-end
ORDEG Co., Ltd. Automobile exhaust gas-purifying catalyst 294,574 20.00% Korea Dec. 31
OCI-Ferro Co., Ltd. (*1) Ceramic industry 167,166 50.00% Korea Dec. 31
OCI-SNF Co., Ltd. (*1) Waste water treatment-chemical 520,000 50.00% Korea Dec. 31
Eko Peroxide LLC (*1) Manufactures and sells peroxide - 50.00% USA Dec. 31
Liaoning East Shine Chemical Technology Co., Ltd. (*1) Manufactures and sells HF - 50.00% China Dec. 31
(*1) A jointly controlled entity, which the Company accounts for under the equity method.
chanGeS in ScOPe OF SUBSiDiaRieS
During the year ended December 31, 2012, the Company newly acquired OCI Alabama, LLC, Cornerstone Power Vineland 1, LLC, Cornerstone
Power Holmdel, LLC, OCI Solar San Antonio LLC, ERCAM Trackers LLC, OCI SE Co., Ltd., OCI Power Co., Ltd. and OCI Seoul Photovoltaic Power
Generation Co., Ltd.
Also, the Company sold the investment in Zhejiang OCI Co., Ltd., and it was excluded from the scope of consolidation.
2. BaSiS OF PRePaRaTiOnS anD SiGniFicanT
accOUnTinG POlicieS
The Company prepares consolidated financial statements in
conformity with Korean International Reporting Standards (“K-IFRS”),
in the Korean language (Hangul). Accordingly, these consolidated
financial statements are intended for use by those who are informed
about K-IFRS and Korean practices.
(1) Basis of Financial Statement Preparation
The Company has prepared the consolidated financial statements in
accordance with the Korean International Financial Reporting Standards
(“K-IFRS”) for the annual period beginning on January 1, 2011.
Major accounting policies used for the preparation of the consolidated
financial statements are stated below. Unless stated otherwise, these
accounting policies have been applied consistently to the consolidated
financial statements for the current period and accompanying
comparative period.
The consolidated financial statements have been prepared on the
historical cost basis except for certain non-current assets and financial
instruments that are measured at revalued amounts or fair values.
Historical cost is measured at the fair value of the consideration paid
to acquire assets typically.
1) amendments to iFRSs affecting amounts reported in the
financial statements
The following amendments to IFRSs have been applied in the current
year and have affected the amounts reported in these financial
statements.
• K-IFRS 1001 Presentation of Financial Statements
In accordance with the amendments to K-IFRS 1001 Presentation of
Financial Statements, the Company presented operating income by
deducting cost of sales and selling and administrative expenses from
revenue line item. The amendments have been applied retrospectively
for the comparative period.
The current year’s other operating income of ₩ 94,632 million and
other operating expense of ₩ 45,206 million and the previous year’s
other operating income of ₩ 8,502 million and other operating
expense of ₩ 12,368 million are excluded from operating income. As
such, the Company’s operating income have decreased by ₩ 49,426
million in 2012 and have increased by ₩ 3,866 million in 2011. The
amendments do not result in any impact on profit or loss and earning
per shares.
2) new and revised iFRSs in issue but not yet effective
The Company has not applied the following new and revised IFRSs
that have been issued but are not yet effective.
• K-IFRS 1001 (as revised) Presentation of Financial Statements
These amendments are intended to reclassify other comprehensive
income. Other comprehensive incomes are supposed to be classified
as current profit or loss items when specific conditions are met and
non-current profit or loss items. K-IFRS 1001 is effective for annual
periods beginning on or after July 1, 2012, with earlier application
permitted. The Company does not anticipate that these amendments
referred above will have a significant effect on the Company’s financial
statements.
• K-IFRS 1019 (as revised) Employee Benefits
The amendments to K-IFRS 1019 change the accounting for defined
benefit plans and termination benefits. The most significant change
relates to the accounting for changes in defined benefit obligation and
plan assets. The amendments require the recognition of changes in
defined benefit obligation and in fair value of plan assets when they
occur, and hence eliminate the ‘corridor approach’ permitted under the
previous version of K-IFRS 1019 and accelerate the recognition of past
service costs. K-IFRS 1019 is effective for annual periods beginning
on or after January 1, 2013, with earlier application permitted. The
Company does not anticipate that these amendments referred above
will have a significant effect on the Company’s financial statements.
• K-IFRS 1110 (as constituted) Consolidated Financial Statements
K-IFRS 1110 defines the principle of control and also set outs the
accounting requirements for the preparation of consolidated financial
statements. An investor controls an investee when it is exposed, or
has rights, to variable returns from its involvement with the investee
and has the ability to affect those returns through its power over the
investee. K-IFRS 1110 is effective for annual periods beginning on or
after January 1, 2013, with earlier application permitted. The Company
does not anticipate that these amendments referred above will have a
significant effect on the Company’s financial statements.
• K-IFRS 1111 (as constituted) Joint Arrangements
K-IFRS 1111 classifies joint arrangements into two types - joint
operations and joint ventures. A joint operation is a joint arrangement
whereby the parties that have joint control of the arrangement (i.e. joint
operators) have rights to the assets, and obligations for the liabilities,
relating to the arrangement. A joint venture is a joint arrangement
whereby the parties that have joint control of the arrangement (i.e.
joint ventures) have rights to the net assets of the arrangement.
K-IFRS 1111 is effective for annual periods beginning on or after
January 1, 2013, with earlier application permitted. The Company
does not anticipate that these amendments referred above will have a
significant effect on the Company’s financial statements.
• K-IFRS 1112 (as constituted) Disclosure of Interests in Other
Entities
K-IFRS 1112 applies to entities that have an interest in a subsidiary, a
joint arrangement, an associate or an unconsolidated structured entity.
K-IFRS 1112 is effective for annual periods beginning on or after
January 1, 2013, with earlier application permitted. The Company
does not anticipate that these amendments referred above will have a
significant effect on the Company’s financial statements.
• K-IFRS 1113 (as constituted) Fair Value Measurement
K-IFRS 1113 establishes a single source of guidance for fair value
measurements and disclosures about fair value measurements. The
standard defines fair value, establishes a framework for measuring fair
value, and requires disclosures about fair value measurements. K-IFRS
1113 is effective for annual periods beginning on or after January 1,
2013, with earlier application permitted. The Company is considering
the effect on the Company’s consolidated financial statements.
Major accounting policies used for the preparation of the consolidated
financial statements are stated below.
(2) Basis of consolidation
The consolidated financial statements incorporate the financial
statements of the Company and entities (including special purpose
entities) controlled by the Company (its subsidiaries). Control is
achieved where the Company has the power to govern the financial and
operating policies of an entity so as to obtain benefits from its activities.
Income and expenses of subsidiaries acquired or disposed of during
the year are included in the consolidated statement of comprehensive
income from the effective date of acquisition and up to the effective
date of disposal, as appropriate. Total comprehensive income of
subsidiaries is attributed to the owners of the Company and to the non-
controlling interests even if this results in the non-controlling interests
having a deficit balance.
When necessary, adjustments are made to the financial statements of
subsidiaries to bring their accounting policies into line with those used
the Company.
All intra-group transactions, balances, income and expenses are
eliminated in full on consolidation.
Changes in the Company’s ownership interests in subsidiaries that
do not result in the Company losing control over the subsidiaries are
accounted for as equity transactions. The carrying amounts of the
Company’s interests and the non-controlling interests are adjusted to
reflect the changes in their relative interests in the subsidiaries. Any
difference between the amount by which the non-controlling interests
are adjusted and the fair value of the consideration paid or received is
recognized directly in equity and attributed to owners of the Company.

60
nOTeS TO cOnSOliDaTeD Financial STaTeMenTSFOR ThE yEARS ENDED DECEMBER 31, 2012 AND 2011
OCI ANNUAL REPORT 2012Financial Review 61
nOTeS TO cOnSOliDaTeD Financial STaTeMenTSFOR ThE yEARS ENDED DECEMBER 31, 2012 AND 2011
When the Company loses control of a subsidiary, the profit or loss on
disposal is calculated as the difference between (i) the aggregate of
the fair value of the consideration received and the fair value of any
retained interest and (ii) the previous carrying amount of the assets
(including goodwill), and liabilities of the subsidiary and any non-
controlling interests. When assets of the subsidiary are carried at
revalued amounts or fair values and the related cumulative gain or loss
has been recognized in other comprehensive income and accumulated
in equity, the amounts previously recognized in other comprehensive
income and accumulated in equity are accounted for as if the Company
had directly disposed of the relevant assets (i.e. reclassified to profit or
loss or transferred directly to retained earnings). The fair value of any
investment retained in the former subsidiary at the date when control is
lost is recognized as the fair value on initial recognition for subsequent
accounting under K-IFRS 1039 Financial Instruments: Recognition and
Measurement or, when applicable, the cost on initial recognition of an
investment in an associate or a jointly controlled entity.
(3) Business combinations
Acquisitions of businesses are accounted for using the acquisition
method. The consideration transferred in a business combination
is measured at fair value, which is calculated as the sum of the
acquisition-date fair values of the assets transferred by the Company,
liabilities incurred by the Company to the former owners of the
acquiree and the equity interests issued by the Company in exchange
for control of the acquiree. Acquisition-related costs are generally
recognized in profit or loss as incurred. At the acquisition date, the
identifiable assets acquired and the liabilities assumed are recognized
at their fair value at the acquisition date, except that:
− deferred tax assets or liabilities and liabilities or assets related to
employee benefit arrangements are recognized and measured in
accordance with K-IFRS 1012 Income Taxes and K-IFRS 1019 Employee
Benefits respectively;
− liabilities or equity instruments related to share-based payment
arrangements of the acquiree or share-based payment arrangements of
the Company entered into to replace share-based payment arrangements
of the acquiree are measured in accordance with K-IFRS 1102 Share-
based Payment at the acquisition date; and assets (or disposal groups)
that are classified as held for sale in accordance with K-IFRS 1105 Non-
current Assets Held for Sale and Discontinued Operations are measured
in accordance with that standard.
Goodwill is measured as the excess of the sum of: a) the consideration
transferred, b) the amount of any non-controlling interests in the
acquiree, and c) the fair value of the acquirer’s previously held equity
interest in the acquire over the net of the acquisition-date amounts
of the identifiable assets acquired and the liabilities assumed. If,
after reassessment, the net of the acquisition-date amounts of the
identifiable assets acquired and liabilities assumed exceeds the
sum of: a) the consideration transferred, b) the amount of any non-
controlling interests in the acquiree, and c) the fair value of the
acquirer’s previously held interest in the acquiree (if any); the excess
is recognized immediately in profit or loss as a bargain purchase gain.
Non-controlling interests that are present ownership interests and
entitle their holders to a proportionate share of the entity’s net assets in
the event of liquidation may be initially measured either at fair value or
at the non-controlling interests’ proportionate share of the recognized
amounts of the acquiree’s identifiable net assets. The choice of
measurement basis is made on a transaction-by-transaction basis.
Other types of non-controlling interests are measured at fair value or,
when applicable, on the basis specified in another K-IFRS.
When the consideration transferred by the Company in a business
combination includes assets or liabilities resulting from a contingent
consideration arrangement, the contingent consideration is measured at
its acquisition-date fair value and included as part of the consideration
transferred in a business combination. Changes in the fair value of
the contingent consideration that qualify as measurement period
adjustments are adjusted retrospectively, with corresponding adjustments
against goodwill. Measurement period adjustments are adjustments that
arise from additional information obtained during the ‘measurement
period’ (which cannot exceed one year from the acquisition date) about
facts and circumstances that existed at the acquisition date.
The subsequent accounting for changes in the fair value of the
contingent consideration that do not qualify as measurement period
adjustments depends on how the contingent consideration is classified.
Contingent consideration that is classified as equity is not remeasured
at subsequent reporting dates and its subsequent settlement is
accounted for within equity. Contingent consideration that is classified
as an asset or a liability is remeasured at subsequent reporting dates
in accordance with K-IFRS 1039 Financial Instruments: Recognition
and Measurement, or K-IFRS 1037 Provisions, Contingent Liabilities
and Contingent Assets, as appropriate, with the corresponding gain or
loss being recognized in profit or loss.
When a business combination is achieved in stages, the Company’s
previously held equity interest in the acquiree is remeasured to
fair value at the acquisition date (i.e. the date when the Company
obtains control) and the resulting gain or loss, if any, is recognized
in profit or loss. Amounts arising from interests in the acquiree prior
to the acquisition date that have previously been recognized in other
comprehensive income are reclassified to profit or loss where such
treatment would be appropriate if that interest were disposed of.
If the initial accounting for a business combination is incomplete by
the end of the reporting period in which the combination occurs, the
Company reports provisional amounts for the items for which the
accounting is incomplete. Those provisional amounts are adjusted
during the measurement period (see above), or additional assets or
liabilities are recognized, to reflect new information obtained about
facts and circumstances that existed at the acquisition date that, if
known, would have affected the amounts recognized at that date.
(4) Foreign currencies
The individual financial statements of each Company entity are
presented in the currency of the primary economic environment in
which the entity operates (its functional currency). For the purpose of
the consolidated financial statements, the results and financial position
of each Company entity are expressed in Currency Units (CU), which
are the functional currency of the Company and the presentation
currency for the consolidated financial statements.
In preparing the financial statements of the individual entities,
transactions in currencies other than the entity’s functional currency
(foreign currencies) are recognized at the rates of exchange prevailing
at the dates of the transactions. At the end of each reporting period,
monetary items denominated in foreign currencies are retranslated
at the rates prevailing at that date. Non-monetary items carried at fair
value that are denominated in foreign currencies are retranslated at
the rates prevailing at the date when the fair value was determined.
Non-monetary items that are measured in terms of historical cost in a
foreign currency are not retranslated.
Exchange differences are recognized in profit or loss in the period in
which they arise except for:
− exchange differences on foreign currency borrowings relating to assets
under construction for future productive use, which are included in the
cost of those assets when they are regarded as an adjustment to interest
costs on those foreign currency borrowings;
− exchange differences on transactions entered into in order to hedge
certain foreign currency risks (see Note 2 (19) below for hedging
accounting policies); and
− exchange differences on monetary items receivable from or payable to
a foreign operation for which settlement is neither planned nor likely
to occur (therefore forming part of the net investment in the foreign
operation), which are recognized initially in other comprehensive income
and reclassified from equity to profit or loss on disposal or partial disposal
of the net investment.
For the purpose of presenting consolidated financial statements,
the assets and liabilities of the Company’s foreign operations are
expressed in Currency Units using exchange rates prevailing at the
end of the reporting period. Income and expense items are translated
at the average exchange rates for the period, unless exchange
rates fluctuated significantly during that period, in which case the
exchange rates at the dates of the transactions are used. Exchange
differences arising, if any, are recognized in other comprehensive
income and accumulated in equity (attributed to non-controlling
interests as appropriate). On the disposal of a foreign operation (i.e.
a disposal of the Company’s entire interest in a foreign operation, or
a disposal involving loss of control over a subsidiary that includes a
foreign operation, loss of joint control over a jointly controlled entity
that includes a foreign operation, or loss of significant influence over
an associate that includes a foreign operation), all of the accumulated
exchange differences in respect of that operation attributable to the
Company are reclassified to profit or loss. Any exchange differences
that have previously been attributed to non-controlling interests are
derecognized, but they are not reclassified to profit or loss.
In the case of a partial disposal (i.e. no loss of control) of a subsidiary
that includes a foreign operation, the proportionate share of
accumulated exchange differences are re-attributed to non-controlling
interests in equity and are not recognized in profit or loss. For all
other partial disposals (i.e. of associates or jointly controlled entities
not involving a change of accounting basis), the proportionate share
of the accumulated exchange differences is reclassified to profit or
loss. Goodwill and fair value adjustments arising on the acquisition of
a foreign operation are treated as assets and liabilities of the foreign
operation and translated at the closing rate.
(5) cash and cash equivalents
Cash and cash equivalents includes cash, savings and checking
accounts, and short-term investment highly liquidated (maturities of
three months or less from acquisition). Bank overdrafts are accounted
for as short-term borrowings.
(6) Financial assets
All financial assets are recognized and derecognized on trade date
where the purchase or sale of a financial asset is under a contract
whose terms require delivery of the financial asset within the time
62
nOTeS TO cOnSOliDaTeD Financial STaTeMenTSFOR ThE yEARS ENDED DECEMBER 31, 2012 AND 2011
OCI ANNUAL REPORT 2012Financial Review 63
nOTeS TO cOnSOliDaTeD Financial STaTeMenTSFOR ThE yEARS ENDED DECEMBER 31, 2012 AND 2011
frame established by the market concerned, and are initially measured
at fair value, plus transaction costs, except for those financial assets
classified as at fair value through profit or loss, which are initially
measured at fair value.
Financial assets are classified into the following specified categories:
financial assets at fair value through profit or loss (“FVTPL”), held-
to-maturity (“HTM”) investments, available-for-sale (“AFS”) financial
assets and loans and receivables. The classification depends on the
nature and purpose of the financial assets and is determined at the
time of initial recognition.
1) effective interest method
The effective interest method is a method of calculating the amortized
cost of a debt instrument and of allocating interest income over the
relevant period. The effective interest rate is the rate that exactly
discounts estimated future cash receipts (including all fees and points
paid or received that form an integral part of the effective interest
rate, transaction costs and other premiums or discounts) through the
expected life of the debt instrument, or, where appropriate, a shorter
period, to the net carrying amount on initial recognition. Income is
recognized on an effective interest basis for debt instruments other
than those financial assets classified as FVTPL.
2) Financial assets at FvTPl
Financial assets are classified as at FVTPL when the financial asset
is either held for trading or it is designated as at FVTPL upon initial
recognition. A financial asset is classified as held for trading if it
has been acquired principally for the purpose of selling it in near
term. Every financial instrument, containing one of more embedded
derivatives, treated separately from the host contract, is classified as
held for trading if it is a derivative that is not designated and effective
as a hedge instrument or not a financial guarantee contract. Financial
assets at FVTPL are stated at fair value, with any gains or losses arising
on remeasurement recognized in profit or loss. Transaction costs
attributable to acquisition upon initial recognition are immediately
recognized in profit or loss in the period occurred.
Financial assets are classified as at FVTPL when the financial asset is
either held for trading or it is designated as at FVTPL.
A financial asset is classified as held for trading if:
− it has been acquired principally for the purpose of selling it in the near
term; or
− on initial recognition it is part of a portfolio of identified financial
instruments that the Company manages together and has a recent actual
pattern of short-term profit-taking; or
− it is a derivative that is not designated and effective as a hedging
instrument.
A financial asset other than a financial asset held for trading may be
designated as at FVTPL upon initial recognition if:
− such designation eliminates or significantly reduces a measurement or
recognition inconsistency that would otherwise arise; or
− the financial asset forms part of a group of financial assets or financial
liabilities or both, which is managed and its performance is evaluated on
a fair value basis, in accordance with the Company’s documented risk
management or investment strategy, and information about the grouping
is provided internally on that basis; or
− it forms part of a contract containing one or more embedded derivatives,
and K-IFRS 1039 Financial Instruments: Recognition and Measurement
permits the entire combined contract (asset or liability) to be designated
as at FVTPL.
Financial assets at FVTPL are stated at fair value, with any gains or
losses arising on remeasurement recognized in profit or loss. The
net gain or loss recognized in profit or loss incorporates any dividend
or interest earned on the financial asset and is included in the other
gains and losses line item in the Statement of Income.
3) hTM investments
Non-derivative financial assets with fixed or determinable payments
and fixed maturity dates that the Company has the positive intent
and ability to hold to maturity are classified as HTM investments.
HTM investments are measured at amortized cost using the effective
interest method less any impairment, with revenue recognized on an
effective yield basis.
4) aFS financial assets
Non-derivatives financial assets that are not classified as at held-to-
maturity; held-for-trading; designated as at fair value through profit
or loss; or loans and receivables are classified as at financial assets
AFS. Financial assets can be designated as ale on initial recognition.
Financial assets AFS are initially recognized at fair value plus directly
related transaction costs. They are subsequently measured at fair
value. Unquoted equity investments whose fair value cannot be
measured reliably are carried at cost. Gains and losses arising from
changes in fair value are recognized in other comprehensive income
and accumulated in the investments revaluation reserve, with the
exception of impairment losses, interest calculated using the effective
interest method, and foreign exchange gains and losses on monetary
assets, which are recognized in profit or loss. Where the investment
is disposed of or is determined to be impaired, the cumulative gain or
loss previously accumulated in the investments revaluation reserve is
reclassified to profit or loss. Dividends on AFS equity instruments are
recognized in profit or loss when the Company’s right to receive the
dividends is established.
The fair value of AFS monetary assets denominated in a foreign
currency is determined in that foreign currency and translated at the
spot rate at the end of the reporting period. The foreign exchange
gains and losses that are recognized in profit or loss are determined
based on the amortized cost of the monetary asset. Other foreign
exchange gains and losses are recognized in other comprehensive
income.
5) loans and receivables
Trade receivables, loans and other receivables that have fixed or
determinable payments that are not quoted in an active market
are classified as loans and receivables. Loans and receivables are
measured at amortized cost using the effective interest method,
less any impairment. Interest income is recognised by applying the
effective interest rate, except for short-term receivables when the
recognition of interest would be immaterial.
6) impairment of financial assets
Financial assets, other than those at FVTPL, are assessed for
indicators of impairment at the end of each reporting period.
Financial assets are considered to be impaired when there is objective
evidence that, as a result of one or more events that occurred after the
initial recognition of the financial asset, the estimated future cash flows
of the investment have been affected.
For listed and unlisted equity investments classified as AFS, a
significant or prolonged decline in the fair value of the security below
its cost is considered to be objective evidence of impairment.
For all other financial assets, including redeemable notes classified as
AFS and finance lease receivables, objective evidence of impairment
could include:
− significant financial difficulty of the issuer or counterparty; or
− default or delinquency in interest or principal payments; or
− it becoming probable that the borrower will enter bankruptcy or financial
re-organization.
For certain categories of financial asset, such as trade receivables,
assets that are assessed not to be impaired individually are, in
addition, assessed for impairment on a collective basis. Objective
evidence of impairment for a portfolio of receivables could include the
Company’s past experience of collecting payments, an increase in the
number of delayed payments in the portfolio past the average credit
period of 60 days, as well as observable changes in national or local
economic conditions that correlate with default on receivables.
For financial assets carried at amortized cost, the amount of the
impairment loss recognized is the differenc e between the asset’s
carrying amount and the present value of estimated future cash flows,
discounted at the financial asset’s original effective interest rate.
The carrying amount of the financial asset is reduced by the
impairment loss directly for all financial assets with the exception of
trade receivables, where the carrying amount is reduced through the
use of an allowance account. When a trade receivable is considered
uncollectible, it is written off against the allowance account.
Subsequent recoveries of amounts previously written off are credited
against the allowance account. Changes in the carrying amount of the
allowance account are recognized in profit or loss.
When an AFS financial asset is considered to be impaired, cumulative
gains or losses previously recognized in other comprehensive income
are reclassified to profit or loss in the period.
With the exception of AFS equity instruments, if, in a subsequent
period, the amount of the impairment loss decreases and the decrease
can be related objectively to an event occurring after the impairment
was recognized, the previously recognized impairment loss is reversed
through profit or loss to the extent that the carrying amount of the
investment at the date the impairment is reversed does not exceed
what the amortized cost would have been had the impairment not
been recognized.
In respect of AFS equity securities, impairment losses previously
recognized in profit or loss are not reversed through profit or loss. Any
increase in fair value subsequent to an impairment loss is recognized
in other comprehensive income.
7) Derecognition of financial assets
The Company derecognizes a financial asset only when the contractual
rights to the cash flows from the asset expire, or when it transfers the
financial asset and substantially all the risks and rewards of ownership
of the asset to another entity. If the Company neither transfers nor
retains substantially all the risks and rewards of ownership and
continues to control the transferred asset, the Company recognizes its
retained interest in the asset and an associated liability for amounts it
may have to pay. If the Company retains substantially all the risks and
64
nOTeS TO cOnSOliDaTeD Financial STaTeMenTSFOR ThE yEARS ENDED DECEMBER 31, 2012 AND 2011
OCI ANNUAL REPORT 2012Financial Review 65
nOTeS TO cOnSOliDaTeD Financial STaTeMenTSFOR ThE yEARS ENDED DECEMBER 31, 2012 AND 2011
rewards of ownership of a transferred financial asset, the Company
continues to recognize the financial asset and also recognizes a
collateralized borrowing for the proceeds received.
(7) inventories
Inventories are stated at the lower of cost or net realizable value,
where cost is determined by using the moving-average method,
except for materials in-transit whose cost is determined by the specific
identification method. The Company maintains perpetual inventory,
which is adjusted to physical inventory counts performed at year end.
When the market value of inventories (net realizable value for finished
goods, merchandise and work-in-progress, and current replacement
cost for raw materials) is less than the carrying value, carrying value
is stated at the market value. When the circumstances that previously
caused inventories to be written down below cost no longer exist
and the new market value of inventories subsequently recovers, the
valuation loss is reversed to the extent of the original valuation loss and
the reversal is deducted from cost of sales.
Inventories are stated at the lower of cost or net realizable value.
Costs, including an appropriate portion of fixed and variable overhead
costs, are assigned to inventories by the method most appropriate
to the particular class of inventory. Net realizable value represents
the estimated selling price for inventories less all estimated costs of
completion and costs necessary to make the sale.
(8) investments in associates (equity-accounted investees)
The results and assets and liabilities of associates are incorporated in
these consolidated financial statements using the equity method of
accounting, except when the investment is classified as held for sale,
in which case it is accounted for in accordance with K-IFRS 1105
Non-current Assets Held for Sale and Discontinued Operations. Under
the equity method, an investment in an associate is initially recognized
in the consolidated statement of financial position at cost and adjusted
thereafter to recognize the Company’s share of the profit or loss and
other comprehensive income of the associate. When the Company’s
share of losses of an associate exceeds the Company’s interest in that
associate (which includes any long-term interests that, in substance,
form part of the Company’s net investment in the associate), the
Company discontinues recognizing its share of further losses.
Additional losses are recognized only to the extent that the Company
has incurred legal or constructive obligations or made payments on
behalf of the associate.
Any excess of the cost of acquisition over the Company’s share of
the net fair value of the identifiable assets, liabilities and contingent
liabilities of an associate recognized at the date of acquisition is
recognized as goodwill, which is included within the carrying amount
of the investment. Any excess of the Company’s share of the net fair
value of the identifiable assets, liabilities and contingent liabilities over
the cost of acquisition, after reassessment, is recognized immediately
in profit or loss.
The requirements of K-IFRS 1039 Financial Instruments: Recognition
and Measurement are applied to determine whether it is necessary
to recognize any impairment loss with respect to the Company’s
investment in an associate. When necessary, the entire carrying
amount of the investment (including goodwill) is tested for impairment
in accordance with K-IFRS 1036 Impairment of Assets as a single
asset by comparing its recoverable amount (higher of value in use and
fair value less costs to sell) with its carrying amount, Any impairment
loss recognized forms part of the carrying amount of the investment.
Any reversal of that impairment loss is recognized in accordance
with K-IFRS 1036 to the extent that the recoverable amount of the
investment subsequently increases.
When the Company, transacts with its associate, profits and losses
resulting from the transactions with the associate are recognized in
the Company’s consolidated financial statements only to the extent of
interests in the associate that are not related to the Company.
(9) investments in joint ventures
A joint venture is a contractual arrangement whereby the Company
and other parties undertake an economic activity that is subject to joint
control (i.e. when the strategic financial and operating policy decisions
relating to the activities of the joint venture require the unanimous
consent of the parties sharing control).
When the Company undertakes its activities under joint venture
arrangements directly, the Company’s share of jointly controlled assets
and any liabilities incurred jointly with other venturers are recognized
in the financial statements of the relevant entity and classified
according to their nature. Liabilities and expenses incurred directly in
respect of interests in jointly controlled assets are accounted for on an
accrual basis. Income from the sale or use of the Company’s share
of the output of jointly controlled assets, and its share of joint venture
expenses, are recognized when it is probable that the economic
benefits associated with the transactions will flow to/from the Company
and their amount can be measured reliably.
Joint venture arrangements that involve the establishment of a
separate entity in which each venturer has an interest are referred to
as jointly controlled entities.
The Company reports its interests in jointly controlled entities using
proportionate consolidation, except when the investment is classified
as held for sale, in which case it is accounted for in accordance with
K-IFRS 1105 Non-current Assets Held for Sale and Discontinued
Operations. The Company’s share of the assets, liabilities, income and
expenses of jointly controlled entities is combined with the equivalent
items in the consolidated financial statements on a line-by-line basis.
Any goodwill arising on the acquisition of the Company’s interest
in a jointly controlled entity is accounted for in accordance with
the Company’s accounting policy for goodwill arising in a business
combination.
When the Company, [including any subsidiary / or its subsidiary],
transacts with its jointly controlled entity, profits and losses resulting from
the transactions with the jointly controlled entity are recognized in the
Company’s consolidated financial statements only to the extent of interests
in the jointly controlled entity that are not related to the Company.
(10) Property, plant and equipment
Property, plant and equipment are stated at cost less subsequent
accumulated depreciation and accumulated impairment losses. The cost
of an item of property, plant and equipment is directly attributable to their
purchase or construction, which includes any costs directly attributable
to bringing the asset to the location and condition necessary for it to be
capable of operating in the manner intended by management. It also
includes the initial estimate of the costs of dismantling and removing the
item and restoring the site on which it is located.
Subsequent costs are recognized in carrying amount of an asset or as an
asset if it is probable that future economic benefits associated with the
assets will flow into the Company and the cost of an asset can be measured
reliably. Routine maintenance and repairs are expensed as incurred.
The Company does not depreciate land and certain tangible assets.
Depreciation expense is computed using the straight-line method
based on the estimated useful lives of the assets as follows:
If each part of an item of property, plant and equipment has a cost that
is significant in relation to the total cost of the item, it is depreciated
separately.
The Company reviews the depreciation method, the estimated
useful lives and residual values of property, plant and equipment at
the end of each annual reporting period. If expectations differ from
previous estimates, the changes are accounted for as a change in an
accounting estimate.
In addition, when an acquisition of a tangible asset occurs free-of-
charge or at a value less than fair market value, due to government
subsidy, the acquisition cost less government subsidy is recorded as
the acquisition cost upon initial acquisition and depreciation expense
is calculated based on the carrying amount.
(11) investment property
Investment property, which is property held to earn rentals and/or for
capital appreciation (including property under construction for such
purposes), is measured initially at its cost, including transaction costs.
Subsequent to initial recognition, investment property is measured at
cost less accumulated depreciation and accumulated impairment losses.
Subsequent costs are recognized in carrying amount of an asset or as an
asset if it is probable that future economic benefits associated with the
assets will flow into the Company and the cost of an asset can be measured
reliably. Routine maintenance and repairs are expensed as incurred.
Amongst the investment properties, land is not depreciated. However,
investment properties other than land are depreciated over 10-40
years of their useful lives using the straight-line method.
The depreciation method, residual value and useful lives of investment
properties are reassessed or reviewed at the end of each annual
reporting period, and any changes from them are treated as change in
accounting estimates.
(12) intangible assets
1) intangible assets acquired separately
Intangible assets with finite useful lives that are acquired separately
are carried at cost less accumulated amortization and accumulated
impairment losses. Amortization is recognized on a straight-line basis over
their estimated useful lives. The estimated useful life and amortization
method are reviewed at the end of each reporting period, with the effect
of any changes in estimate being accounted for on a prospective basis.
estimated useful lives
Buildings and structures 3 - 60 years
Machinery and equipment 2 - 20 years
Vehicles 2 - 10 years
Others 2 - 15 years
66
nOTeS TO cOnSOliDaTeD Financial STaTeMenTSFOR ThE yEARS ENDED DECEMBER 31, 2012 AND 2011
OCI ANNUAL REPORT 2012Financial Review 67
nOTeS TO cOnSOliDaTeD Financial STaTeMenTSFOR ThE yEARS ENDED DECEMBER 31, 2012 AND 2011
Intangible assets with indefinite useful lives that are acquired separately
are carried at cost less accumulated impairment losses.
2) internally-generated intangible assets - research and development
expenditure
Expenditure on research activities is recognized as an expense in the
period in which it is incurred.
An internally-generated intangible asset arising from development (or
from the development phase of an internal project) is recognized if,
and only if, all of the following have been demonstrated:
− the technical feasibility of completing the intangible asset so that it will be
available for use or sale;
− the intention to complete the intangible asset and use or sell it;
− the ability to use or sell the intangible asset;
− how the intangible asset will generate probable future economic benefits;
− the availability of adequate technical, financial and other resources to
complete the development and to use or sell the intangible asset; and
− the ability to measure reliably the expenditure attributable to the
intangible asset during its development.
The amount initially recognized for internally-generated intangible
assets is the sum of the expenditure incurred from the date when
the intangible asset first meets the recognition criteria listed above.
Where no internally-generated intangible asset can be recognized,
development expenditure is recognized in profit or loss in the period in
which it is incurred.
Subsequent to initial recognition, internally-generated intangible assets
are reported at cost less accumulated amortization and accumulated
impairment losses, on the same basis as intangible assets that are
acquired separately.
3) intangible assets acquired in a business combination
Intangible assets that are acquired in a business combination are
recognized separately from goodwill and are initially recognized at their
fair value at the acquisition date (which is regarded as their cost).
Subsequent to initial recognition, intangible assets acquired in
a business combination are reported at cost less accumulated
amortization and accumulated impairment losses, on the same basis
as intangible assets that are acquired separately.
4) Derecognition of intangible assets
An intangible asset is derecognized on disposal, or when no future
economic benefits are expected from its use or disposal. Gains or
losses arising from derecognition of an intangible asset, measured as
the difference between the net disposal proceeds and the carrying
amount of the asset, are recognized in profit or loss when the asset is
derecognized.
5) Useful lives
Amortization is recognized on a straight-line basis over their estimated
useful lives. The estimated useful lives are as follows:
estimated useful
lives
amortization
method
Industrial property rights 5 ~ 10 years Straight-line
Development costs 5 years Straight-line
Others 5 ~ 80 years Straight-line
Membership Indefinite useful life -
(13) Goodwill
Goodwill arising in a business combination is recognized as an asset
at the date when control is acquired (the acquisition date). Goodwill is
measured as the excess of the sum of the consideration transferred,
the amount of any non-controlling interests in the acquiree, and
the fair value of the acquirer’s previously held equity interest in the
acquiree (if any) over the net of the acquisition-date amounts of the
identifiable assets acquired and the liabilities assumed.
Goodwill is not amortized but is reviewed for impairment at least
annually. For the purpose of impairment testing, goodwill is allocated
to each of the Company’s cash-generating units (“CGU”) expected to
benefit from the synergies of the combination. CGUs to which goodwill
has been allocated are tested for impairment annually, or more
frequently when there is an indication that the unit may be impaired.
If the recoverable amount of the CGU is less than its carrying amount,
the impairment loss is allocated first to reduce the carrying amount of
any goodwill allocated to the unit and then to the other assets of the
unit on a pro-rata basis of the carrying amount of each asset in the
unit. An impairment loss recognized for goodwill is not reversed in a
subsequent period.
On disposal of a subsidiary, the relevant amount of the related goodwill
is included in the determination of the gain or loss on disposal.
(14) impairment of non-financial assets
At the end of the reporting period, the Company reviews the carrying
amounts of its tangible and intangible assets to determine whether
there is any indication that those assets have suffered an impairment
loss. If any such indication exists, the recoverable amount of the asset
is estimated in order to determine the extent of the impairment loss,
if any. If the recoverable amount for an individual asset cannot be
estimated, recoverable amount is determined for the CGU. Where
a reasonable and consistent basis of allocation can be identified,
corporate assets are also allocated to individual CGUs, or otherwise
they are allocated to the smallest group of CGUs for which a
reasonable and consistent allocation basis can be identified.
Intangible assets with indefinite useful lives and intangible assets
not yet available for use are tested for impairment at least annually,
and whenever there is an indication that the asset may be impaired.
Recoverable amount is the higher of fair value less costs to sell or
value in use. In assessing value in use, the estimated future cash flows
are discounted to their present value using a pre-tax discount rate that
reflects current market assessments of the time value of money and
risks specific to the asset for which the estimates of future cash flows
have not been adjusted.
If the recoverable amount of an asset (or CGU) is estimated to be less
than its carrying amount, the carrying amount of the asset (or CGU) is
reduced to its recoverable amount. An impairment loss is immediately
recognized as an expense.
Where an impairment loss subsequently reverses, the carrying amount
of the asset (or CGU) is increased to its recoverable amount, but the
increased carrying amount does not exceed the carrying amount that
would have been determined had no impairment loss been recognized
for the asset in prior years. A reversal of an impairment loss is
recognized immediately in profit or loss.
(15) non-current assets held for sale
Non-current assets and disposal groups are classified as held for
sale if their carrying amount will be recovered principally through a
sale transaction rather than through continuing use. This condition is
regarded as met only when the sale is highly probable and the non-
current asset (or disposal group) is available for immediate sale in its
present condition. Management must be committed to the sale, which
should be expected to qualify for recognition as a completed sale
within one year from the date of classification.
When the Company is committed to a sale plan involving loss of
control of a subsidiary, all of the assets and liabilities of that subsidiary
are classified as held for sale when the criteria described above are
met, regardless of whether the Company will retain a non-controlling
interest in its former subsidiary after the sale.
Non-current assets (and disposal groups) classified as held for sale
are measured at the lower of their previous carrying amount and fair
value less costs to sell.
(16) Financial liabilities and equity instruments
1) classification as debt or equity
Debt and equity instruments are classified as either financial liabilities
or as equity in accordance with the substance of the contractual
arrangement.
2) equity instruments
An equity instrument is any contract that evidences a residual interest
in the assets of an entity after deducting all of its liabilities. Equity
instruments issued by the Company are recognized at the proceeds
received, net of direct issue costs.
3) compound instruments
The component parts of compound instruments (convertible bonds)
issued by the Company are classified separately as financial liabilities
and equity in accordance with the substance of the contractual
arrangement. At the date of issue, the fair value of the liability
component is estimated using the prevailing market interest rate for
a similar non-convertible instrument. This amount is recorded as a
liability on an amortized cost basis using the effective interest method
until extinguished upon conversion or at the instrument’s maturity
date. The equity component is determined by deducting the amount of
the liability component from the fair value of the compound instrument
as a whole. This is recognized and included in equity, net of income
tax effects, and is not subsequently remeasured.
4) Financial liabilities
Financial liabilities are classified as either financial liabilities at FVTPL
or other financial liabilities.
5) Financial liabilities at FvTPl
Financial liabilities are classified as at FVTPL when the financial
liability is either held for trading or it is designated as FVTPL.
A financial liability is classified as held for trading if:
− it has been acquired principally for the purpose of repurchasing it in the
near term; or
− on initial recognition it is part of a portfolio of identified financial
instruments that the Company manages together and has a recent actual
pattern of short-term profit-taking; or
− it is a derivative that is not designated and effective as a hedging instrument.
68
nOTeS TO cOnSOliDaTeD Financial STaTeMenTSFOR ThE yEARS ENDED DECEMBER 31, 2012 AND 2011
OCI ANNUAL REPORT 2012Financial Review 69
nOTeS TO cOnSOliDaTeD Financial STaTeMenTSFOR ThE yEARS ENDED DECEMBER 31, 2012 AND 2011
A financial liability other than a financial liability held for trading may
be designated as at FVTPL upon initial recognition if:
− such designation eliminates or significantly reduces a measurement or
recognition inconsistency that would otherwise arise; or
− the financial liability forms part of a group of financial assets or financial
liabilities or both, which is managed and its performance is evaluated on
a fair value basis, in accordance with the Company’s documented risk
management or investment strategy, and information about the grouping
is provided internally on that basis; or
− it forms part of a contract containing one or more embedded derivatives, and
K-IFRS 1039 Financial Instruments: Recognition and Measurement permits
the entire combined contract (asset or liability) to be designated as at FVTPL.
Financial liabilities at FVTPL are stated at fair value, with any gains or
losses arising on remeasurement recognized in profit or loss. The net
gain or loss recognized in profit or loss incorporates any interest paid
on the financial liability and is included in the ‘other gains and losses’
line item in the income statement.
6) Other financial liabilities
Other financial liabilities, including borrowings, are initially measured
at fair value, net of transaction costs. Other financial liabilities are
subsequently measured at amortized cost using the effective interest
method, with interest expense recognized on an effective yield basis.
The effective interest method is a method of calculating the amortized
cost of a financial liability and of allocating interest expense over
the relevant period. The effective interest rate is the rate that exactly
discounts estimated future cash payments through the expected life of
the financial liability, or (where appropriate) a shorter period, to the net
carrying amount on initial recognition.
7) Financial guarantee contract liabilities
Financial guarantee contract liabilities are initially measured at their
fair values and, if not designated as at FVTPL, are subsequently
measured at the higher of:
− the amount of the obligation under the contract, as determined in
accordance with K-IFRS 1037 Provisions, Contingent Liabilities and
Contingent Assets; and
− the amount initially recognized less, cumulative amortization recognized
in accordance with the K-IFRS 1018 Revenue.
8) Derecognition of financial liabilities
The Company derecognizes financial liabilities when, and only when,
the Company’s obligations are discharged, cancelled or they expire.
(17) Retirement benefit costs
Contributions to defined contribution retirement benefit plans are
recognized as an expense when employees have rendered service
entitling them to the contributions.
For defined benefit retirement benefit plans, the cost of providing
benefits is determined using the Projected Unit Credit Method, with
actuarial valuations being carried out at the end of each reporting
period. Actuarial gains and losses that exceed 10 percent of the
greater of the present value of the Company’s defined benefit
obligation and the fair value of plan assets as at the end of the prior
year are amortized over the expected average remaining working lives
of the participating employees, under the corridor approach. Past
service cost is recognized immediately to the extent that the benefits
are already vested, and otherwise is amortized on a straight-line basis
over the average period until the benefits become vested.
The retirement benefit obligation recognized in the statement of financial
position represents the present value of the defined benefit obligation as
adjusted for unrecognized actuarial gains and losses and unrecognized
past service cost, and as reduced by the fair value of plan assets. Any
asset resulting from this calculation is limited to unrecognized actuarial
losses and past service cost, plus the present value of available refunds
and reductions in future contributions to the plan.
(18) Borrowing costs
Borrowing costs directly attributable to the acquisition, construction or
production of qualifying assets, which are assets that necessarily take
a substantial period of time to get ready for their intended use or sale,
are added to the cost of those assets, until such time as the assets are
substantially ready for their intended use or sale.
Investment income earned on the temporary investment of specific
borrowings pending their expenditure on qualifying assets is deducted
from the borrowing costs eligible for capitalization. Additionally,
borrowing costs eligible for capitalization reflects hedge effectiveness
in case that the hedge accounting for interest rate risk can be applied
for borrowing costs directly related to qualifying assets.
All other borrowing costs are recognized in profit or loss in the period
in which they are incurred.
(19) Derivative financial instruments
The Company enters into a variety of derivative financial instruments
to manage its exposure to interest rate and foreign exchange rate risk,
including foreign exchange forward contracts, interest rate swaps and
cross currency swaps.
Derivatives are initially recognized at fair value at the date the
derivative contract is entered into and are subsequently remeasured to
their fair value at the end of each reporting period. The resulting gain
or loss is recognized in profit or loss immediately unless the derivative
is designated and effective as a hedging instrument, in such case the
timing of the recognition in profit or loss depends on the nature of the
hedge relationship. The Company designates certain derivatives as
either as hedges of recognized assets or liabilities or firm commitments
(fair value hedges), hedges of highly probable forecast transactions
or hedges of foreign currency risk of firm commitments (cash flow
hedges), or hedges of net investments in foreign operations (net
investment hedges).
A derivative with a positive fair value is recognized as a financial asset; a
derivative with a negative fair value is recognized as a financial liability.
A derivative is presented as a non-current asset or a non-current liability
if the remaining maturity of the instrument is more than 12 months
and it is not expected to be realized or settled within 12 months. Other
derivatives are presented as current assets or current liabilities.
1) embedded derivatives
Derivatives embedded in other financial instruments or other host
contracts are treated as separate derivatives when their risks and
characteristics are not closely related to those of the host contracts
and the host contracts are not measured at FVTPL.
An embedded derivative is presented as a non-current asset or a non-
current liability if the remaining maturity of the hybrid instrument to
which the embedded derivative relates is more than 12 months and it is
not expected to be realized or settled within 12 months. Other embedded
derivatives are presented as current assets or current liabilities.
2) hedge accounting
The Company designates certain hedging instruments, which include
derivatives, embedded derivatives and non-derivatives in respect of
foreign currency risk, as either fair value hedges, cash flow hedges,
or hedges of net investments in foreign operations. Hedges of foreign
exchange risk on firm commitments are accounted for as cash flow
hedges.
At the inception of the hedge relationship, the entity documents
the relationship between the hedging instrument and the hedged
item, along with its risk management objectives and its strategy for
undertaking various hedge transactions.
Furthermore, at the inception of the hedge and on an ongoing basis, the
Company documents whether the hedging instrument is highly effective
in offsetting changes in fair values or cash flows of the hedged item.
3) Fair value hedges
Changes in the fair value of derivatives that are designated and qualify
as fair value hedges are recognized in profit or loss immediately,
together with any changes in the fair value of the hedged asset or
liability that are attributable to the hedged risk. The change in the
fair value of the hedging instrument and the change in the hedged
item attributable to the hedged risk are recognized in the line of the
statement of comprehensive income relating to the hedged item.
Hedge accounting is discontinued when the Company revokes the hedging
relationship, when the hedging instrument expires or is sold, terminated,
or exercised, or when it no longer qualifies for hedge accounting. The fair
value adjustment to the carrying amount of the hedged item arising from
the hedged risk is amortized to profit or loss from that date.
4) cash flow hedges
The effective portion of changes in the fair value of derivatives that
are designated and qualify as cash flow hedges is recognized in other
comprehensive income. The gain or loss relating to the ineffective
portion is recognized immediately in profit or loss, and is included in
the ‘other gains and losses’ line item.
Amounts previously recognized in other comprehensive income and
accumulated in equity are reclassified to profit or loss in the periods
when the hedged item is recognized in profit or loss, in the same line
of the income statement as the recognized hedged item. However,
when the forecast transaction that is hedged results in the recognition
of a non-financial asset or a non-financial liability, the gains and losses
previously accumulated in equity are transferred from equity and
included in the initial measurement of the cost of the non-financial
asset or non-financial liability.
Hedge accounting is discontinued when the Company revokes the
hedging relationship, when the hedging instrument expires or is sold,
terminated, or exercised, or it no longer qualifies for hedge accounting.
Any gain or loss accumulated in equity at that time remains in
equity and is recognized when the forecast transaction is ultimately
recognized in profit or loss.
When a forecast transaction is no longer expected to occur, the gain or
loss accumulated in equity is recognized immediately in profit or loss.

70
nOTeS TO cOnSOliDaTeD Financial STaTeMenTSFOR ThE yEARS ENDED DECEMBER 31, 2012 AND 2011
OCI ANNUAL REPORT 2012Financial Review 71
nOTeS TO cOnSOliDaTeD Financial STaTeMenTSFOR ThE yEARS ENDED DECEMBER 31, 2012 AND 2011
5) hedges of net investments in foreign operations
Hedges of net investments in foreign operations are accounted
for similarly to cash flow hedges. Any gain or loss on the hedging
instrument relating to the effective portion of the hedge is recognized
in other comprehensive income and accumulated in the foreign
currency translation reserve. The gain or loss relating to the ineffective
portion is recognized immediately in profit or loss, and is included in
the ‘other gains and losses’.
Gains and losses on the hedging instrument relating to the effective
portion of the hedge accumulated in the foreign currency translation
reserve are reclassified to profit or loss in the same way as exchange
differences relating to the foreign operation.
(20) Provisions
Provisions are recognized when the Company has a present obligation
(legal or constructive) as a result of a past event, it is probable that
the Company will be required to settle the obligation, and a reliable
estimate can be made of the amount of the obligation.
The amount recognized as a provision is the best estimate of the
consideration required to settle the present obligation at the end of
the reporting period, taking into account the risks and uncertainties
surrounding the obligation. When a provision is measured using
the cash flows estimated to settle the present obligation, its carrying
amount is the present value of those cash flows (where the effect of
the time value of money is material).
When some or all of the economic benefits required to settle a provision
are expected to be recovered from a third party, a receivable is
recognized as an asset if it is virtually certain that reimbursement will be
received and the amount of the receivable can be measured reliably.
At the end of each reporting period, the remaining provision balance is
reviewed and assessed to determine if the current best estimate is being
recognized. If the existence of an obligation to transfer economic benefit
is no longer probable, the related provision is reversed during the period.
(21) Share-based payment
Equity-settled share-based payments to employees and others
providing similar services are measured at the fair value of the equity
instruments at the grant date.
The fair value determined at the grant date of the equity-settled share-
based payments is expensed on a straight-line basis over the vesting
period, based on the Company’s estimate of equity instruments that
will eventually vest. At the end of each reporting period, the Company
revises its estimate of the number of equity instruments expected
to vest. The impact of the revision of the original estimates, if any, is
recognized in profit or loss such that the cumulative expense reflects
the revised estimate, with a corresponding adjustment to the equity-
settled employee benefits reserve.
Equity-settled share-based payment transactions with parties other
than employees are measured at the fair value of the goods or
services received, except where that fair value cannot be estimated
reliably, in which case they are measured at the fair value of the
equity instruments granted, measured at the date the entity obtains
the goods or the counterparty renders the service.
For cash-settled share-based payments, a liability is recognized for
the goods or services acquired, measured initially at the fair value
of the liability. At the end of each reporting period until the liability
is settled, and at the date of settlement, the fair value of the liability
is remeasured, with any changes in fair value recognized in profit or
loss for the year.
(22) Treasury stock
When the Company repurchases its own equity instruments (treasury
stock), the incremental costs, net of tax effect, are deducted from
the shareholders’ equity and recognized as other capital items
deducted from the total equity in the statement of financial position.
In addition, profits or losses from purchase, sale, or retirement of
treasury stocks are directly recognized in shareholders’ equity.
(23) Revenue recognition
Revenue is measured at the fair value of the consideration received
or receivable. Revenue is reduced for estimated customer returns,
rebates and other similar allowances.
1) Sale of goods
Revenue from the sale of goods is recognized when the Company
has transferred to the buyer the significant risks and rewards of
ownership of the goods, the Company retains neither continuing
managerial involvement to the degree usually associated with
ownership nor effective control over the goods sold, the amount of
revenue can be measured reliably, it is probable that the economic
benefits associated with the transaction will flow to the entity, and the
costs incurred or to be incurred in respect of the transaction can be
measured reliably.
2) Rendering of services
Revenue from rental and management of operating services is recognized
as the passage of service periods and revenue from other services is
recognized by reference to the stage of completion of the contract.
3) interest revenue
Interest revenue is recognized when it is probable that the economic
benefits will flow to the Company and the amount of revenue can be
measured reliably. Interest revenue is accrued on a time basis, by
reference to the principal outstanding and at the effective interest
rate applicable, which is the rate that exactly discounts estimated
future cash receipts through the expected life of the financial asset
to that asset’s net carrying amount on initial recognition.
4) Dividend revenue
Dividend revenue from investments is recognized when the
shareholders’ right to receive payment has been established
(provided that it is probable that the economic benefits will flow to
the Company and the amount of revenue can be measured reliably).
(24) Government subsidies
Government subsidies are not recognized until there is reasonable
assurance that the Company will comply with the conditions
attaching to them and that the grants will be received.
The benefit of a government loan at a below-market interest rate
is treated as a government subsidy, measured as the difference
between proceeds received and the fair value of the loan based on
prevailing market interest rates.
Government subsidies whose primary condition is that the Company
should purchase, construct or otherwise acquire non-current assets
are recognized as deferred revenue in the statement of financial
position and transferred to profit or loss on a systematic and rational
basis over the useful lives of the related assets.
Other government subsidies are recognized as revenue over the periods to
correspond to the costs it intends to compensate, on a systematic basis.
Government grants that are receivable as compensation for expenses or
losses already incurred or for the purpose of giving immediate financial
support to the Company with no future related costs are recognized in
profit or loss in the period in which they become receivable.
(25) current tax payable and deferred tax
Income tax consists of current tax and deferred tax.
1) current tax
The tax currently payable is based on taxable profit for the year.
Taxable profit differs from profit as reported in the consolidated
income statement because of items of income or expense that are
taxable or deductible in other years and items that are never taxable or
deductible. The Company’s liability for current tax is calculated using
tax rates that have been enacted or substantively enacted by the end
of the reporting period.
2) Deferred tax
Deferred tax is recognized on temporary differences between the
carrying amounts of assets and liabilities in the consolidated financial
statements and the corresponding tax bases used in the computation
of taxable profit. Deferred tax liabilities are generally recognized for
all taxable temporary differences. Deferred tax assets are generally
recognized for all deductible temporary differences to the extent that
it is probable that taxable profits will be available against which those
deductible temporary differences can be utilized. Such deferred tax
assets and liabilities are not recognized if the temporary difference
arises from goodwill or from the initial recognition (other than in a
business combination) of other assets and liabilities in a transaction
that affects neither the taxable profit nor the accounting profit.
Deferred tax liabilities are recognized for taxable temporary differences
associated with investments in subsidiaries and associates, and
interests in joint ventures, except where the Company is able to
control the reversal of the temporary difference and it is probable that
the temporary difference will not reverse in the foreseeable future.
Deferred tax assets arising from deductible temporary differences
associated with such investments and interests are only recognized to
the extent that it is probable that there will be sufficient taxable profits
against which to utilize the benefits of the temporary differences and
they are expected to reverse in the foreseeable future.
The carrying amount of deferred tax assets is reviewed at the end of
each reporting period and reduced to the extent that it is no longer
probable that sufficient taxable profits will be available to allow all or
part of the asset to be recovered.
Deferred tax assets and liabilities are measured at the tax rates that
are expected to apply in the period in which the liability is settled or
the asset realized, based on tax rates (and tax laws) that have been
enacted or substantively enacted by the end of the reporting period.
The measurement of deferred tax liabilities and assets reflects the
tax consequences that would follow from the manner in which the
Company expects, at the end of the reporting period, to recover or
settle the carrying amount of its assets and liabilities.
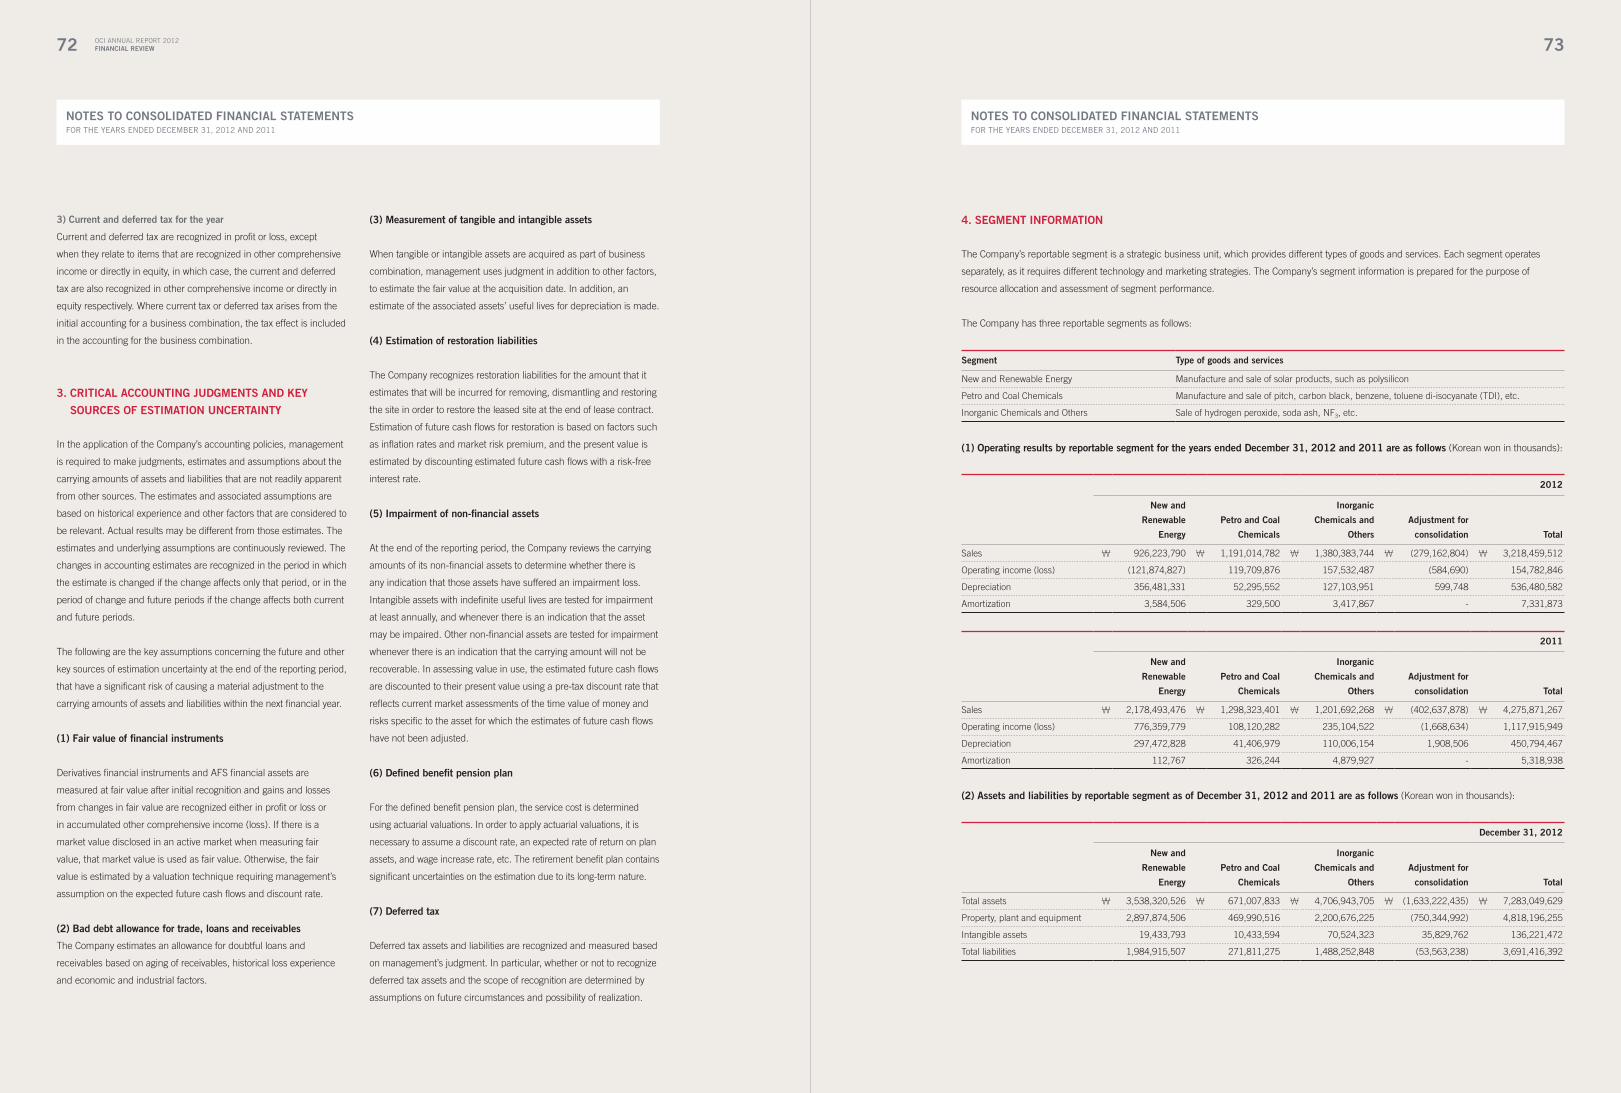
72
nOTeS TO cOnSOliDaTeD Financial STaTeMenTSFOR ThE yEARS ENDED DECEMBER 31, 2012 AND 2011
OCI ANNUAL REPORT 2012Financial Review 73
nOTeS TO cOnSOliDaTeD Financial STaTeMenTSFOR ThE yEARS ENDED DECEMBER 31, 2012 AND 2011
3) current and deferred tax for the year
Current and deferred tax are recognized in profit or loss, except
when they relate to items that are recognized in other comprehensive
income or directly in equity, in which case, the current and deferred
tax are also recognized in other comprehensive income or directly in
equity respectively. Where current tax or deferred tax arises from the
initial accounting for a business combination, the tax effect is included
in the accounting for the business combination.
3. cRiTical accOUnTinG JUDGMenTS anD Key
SOURceS OF eSTiMaTiOn UnceRTainTy
In the application of the Company’s accounting policies, management
is required to make judgments, estimates and assumptions about the
carrying amounts of assets and liabilities that are not readily apparent
from other sources. The estimates and associated assumptions are
based on historical experience and other factors that are considered to
be relevant. Actual results may be different from those estimates. The
estimates and underlying assumptions are continuously reviewed. The
changes in accounting estimates are recognized in the period in which
the estimate is changed if the change affects only that period, or in the
period of change and future periods if the change affects both current
and future periods.
The following are the key assumptions concerning the future and other
key sources of estimation uncertainty at the end of the reporting period,
that have a significant risk of causing a material adjustment to the
carrying amounts of assets and liabilities within the next financial year.
(1) Fair value of financial instruments
Derivatives financial instruments and AFS financial assets are
measured at fair value after initial recognition and gains and losses
from changes in fair value are recognized either in profit or loss or
in accumulated other comprehensive income (loss). If there is a
market value disclosed in an active market when measuring fair
value, that market value is used as fair value. Otherwise, the fair
value is estimated by a valuation technique requiring management’s
assumption on the expected future cash flows and discount rate.
(2) Bad debt allowance for trade, loans and receivables
The Company estimates an allowance for doubtful loans and
receivables based on aging of receivables, historical loss experience
and economic and industrial factors.
(3) Measurement of tangible and intangible assets
When tangible or intangible assets are acquired as part of business
combination, management uses judgment in addition to other factors,
to estimate the fair value at the acquisition date. In addition, an
estimate of the associated assets’ useful lives for depreciation is made.
(4) estimation of restoration liabilities
The Company recognizes restoration liabilities for the amount that it
estimates that will be incurred for removing, dismantling and restoring
the site in order to restore the leased site at the end of lease contract.
Estimation of future cash flows for restoration is based on factors such
as inflation rates and market risk premium, and the present value is
estimated by discounting estimated future cash flows with a risk-free
interest rate.
(5) impairment of non-financial assets
At the end of the reporting period, the Company reviews the carrying
amounts of its non-financial assets to determine whether there is
any indication that those assets have suffered an impairment loss.
Intangible assets with indefinite useful lives are tested for impairment
at least annually, and whenever there is an indication that the asset
may be impaired. Other non-financial assets are tested for impairment
whenever there is an indication that the carrying amount will not be
recoverable. In assessing value in use, the estimated future cash flows
are discounted to their present value using a pre-tax discount rate that
reflects current market assessments of the time value of money and
risks specific to the asset for which the estimates of future cash flows
have not been adjusted.
(6) Defined benefit pension plan
For the defined benefit pension plan, the service cost is determined
using actuarial valuations. In order to apply actuarial valuations, it is
necessary to assume a discount rate, an expected rate of return on plan
assets, and wage increase rate, etc. The retirement benefit plan contains
significant uncertainties on the estimation due to its long-term nature.
(7) Deferred tax
Deferred tax assets and liabilities are recognized and measured based
on management’s judgment. In particular, whether or not to recognize
deferred tax assets and the scope of recognition are determined by
assumptions on future circumstances and possibility of realization.
4. SeGMenT inFORMaTiOn
The Company’s reportable segment is a strategic business unit, which provides different types of goods and services. Each segment operates
separately, as it requires different technology and marketing strategies. The Company’s segment information is prepared for the purpose of
resource allocation and assessment of segment performance.
The Company has three reportable segments as follows:
Segment Type of goods and services
New and Renewable Energy Manufacture and sale of solar products, such as polysilicon
Petro and Coal Chemicals Manufacture and sale of pitch, carbon black, benzene, toluene di-isocyanate (TDI), etc.
Inorganic Chemicals and Others Sale of hydrogen peroxide, soda ash, NF3, etc.
(1) Operating results by reportable segment for the years ended December 31, 2012 and 2011 are as follows (Korean won in thousands):
2012
new and
Renewable
energy
Petro and coal
chemicals
inorganic
chemicals and
Others
adjustment for
consolidation Total
Sales ₩ 926,223,790 ₩ 1,191,014,782 ₩ 1,380,383,744 ₩ (279,162,804) ₩ 3,218,459,512
Operating income (loss) (121,874,827) 119,709,876 157,532,487 (584,690) 154,782,846
Depreciation 356,481,331 52,295,552 127,103,951 599,748 536,480,582
Amortization 3,584,506 329,500 3,417,867 - 7,331,873
2011
new and
Renewable
energy
Petro and coal
chemicals
inorganic
chemicals and
Others
adjustment for
consolidation Total
Sales ₩ 2,178,493,476 ₩ 1,298,323,401 ₩ 1,201,692,268 ₩ (402,637,878) ₩ 4,275,871,267
Operating income (loss) 776,359,779 108,120,282 235,104,522 (1,668,634) 1,117,915,949
Depreciation 297,472,828 41,406,979 110,006,154 1,908,506 450,794,467
Amortization 112,767 326,244 4,879,927 - 5,318,938
(2) assets and liabilities by reportable segment as of December 31, 2012 and 2011 are as follows (Korean won in thousands):
December 31, 2012
new and
Renewable
energy
Petro and coal
chemicals
inorganic
chemicals and
Others
adjustment for
consolidation Total
Total assets ₩ 3,538,320,526 ₩ 671,007,833 ₩ 4,706,943,705 ₩ (1,633,222,435) ₩ 7,283,049,629
Property, plant and equipment 2,897,874,506 469,990,516 2,200,676,225 (750,344,992) 4,818,196,255
Intangible assets 19,433,793 10,433,594 70,524,323 35,829,762 136,221,472
Total liabilities 1,984,915,507 271,811,275 1,488,252,848 (53,563,238) 3,691,416,392
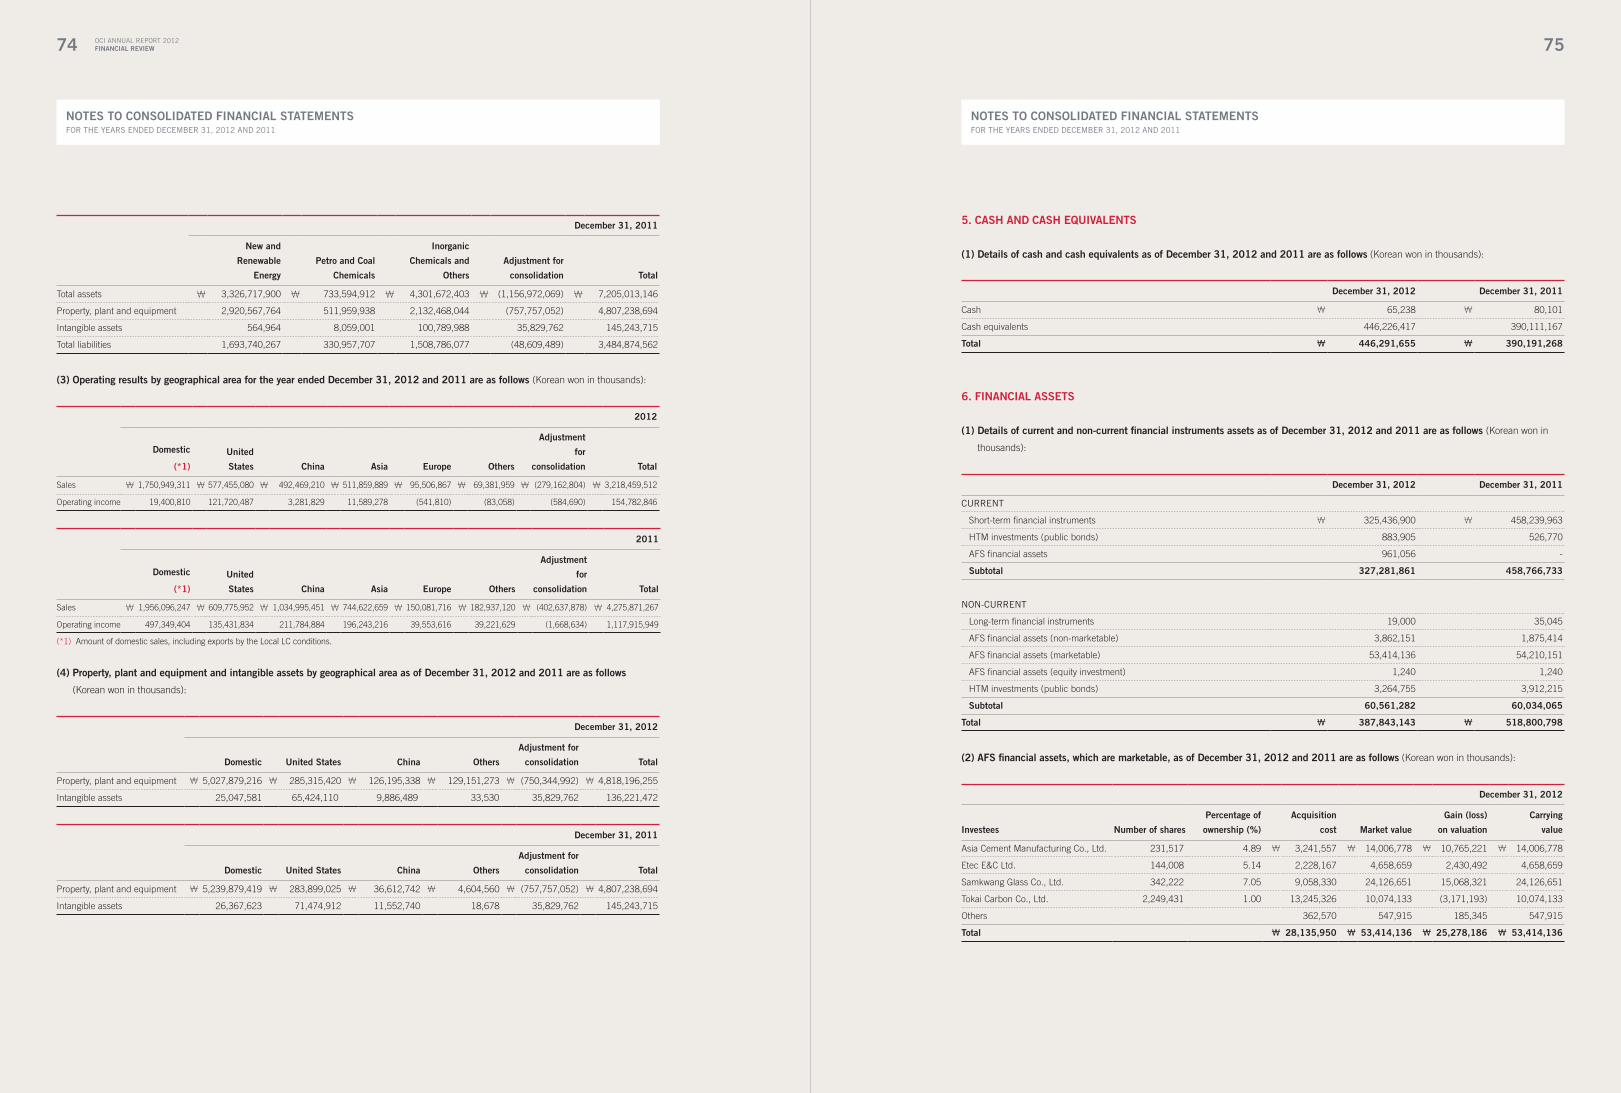
74
nOTeS TO cOnSOliDaTeD Financial STaTeMenTSFOR ThE yEARS ENDED DECEMBER 31, 2012 AND 2011
OCI ANNUAL REPORT 2012Financial Review 75
nOTeS TO cOnSOliDaTeD Financial STaTeMenTSFOR ThE yEARS ENDED DECEMBER 31, 2012 AND 2011
December 31, 2011
new and
Renewable
energy
Petro and coal
chemicals
inorganic
chemicals and
Others
adjustment for
consolidation Total
Total assets ₩ 3,326,717,900 ₩ 733,594,912 ₩ 4,301,672,403 ₩ (1,156,972,069) ₩ 7,205,013,146
Property, plant and equipment 2,920,567,764 511,959,938 2,132,468,044 (757,757,052) 4,807,238,694
Intangible assets 564,964 8,059,001 100,789,988 35,829,762 145,243,715
Total liabilities 1,693,740,267 330,957,707 1,508,786,077 (48,609,489) 3,484,874,562
(3) Operating results by geographical area for the year ended December 31, 2012 and 2011 are as follows (Korean won in thousands):
2012
Domestic
(*1)
United
States china asia europe Others
adjustment
for
consolidation Total
Sales ₩ 1,750,949,311 ₩ 577,455,080 ₩ 492,469,210 ₩ 511,859,889 ₩ 95,506,867 ₩ 69,381,959 ₩ (279,162,804) ₩ 3,218,459,512
Operating income 19,400,810 121,720,487 3,281,829 11,589,278 (541,810) (83,058) (584,690) 154,782,846
2011
Domestic
(*1)
United
States china asia europe Others
adjustment
for
consolidation Total
Sales ₩ 1,956,096,247 ₩ 609,775,952 ₩ 1,034,995,451 ₩ 744,622,659 ₩ 150,081,716 ₩ 182,937,120 ₩ (402,637,878) ₩ 4,275,871,267
Operating income 497,349,404 135,431,834 211,784,884 196,243,216 39,553,616 39,221,629 (1,668,634) 1,117,915,949
(*1) Amount of domestic sales, including exports by the Local LC conditions.
(4) Property, plant and equipment and intangible assets by geographical area as of December 31, 2012 and 2011 are as follows
(Korean won in thousands):
December 31, 2012
Domestic United States china Others
adjustment for
consolidation Total
Property, plant and equipment ₩ 5,027,879,216 ₩ 285,315,420 ₩ 126,195,338 ₩ 129,151,273 ₩ (750,344,992) ₩ 4,818,196,255
Intangible assets 25,047,581 65,424,110 9,886,489 33,530 35,829,762 136,221,472
December 31, 2011
Domestic United States china Others
adjustment for
consolidation Total
Property, plant and equipment ₩ 5,239,879,419 ₩ 283,899,025 ₩ 36,612,742 ₩ 4,604,560 ₩ (757,757,052) ₩ 4,807,238,694
Intangible assets 26,367,623 71,474,912 11,552,740 18,678 35,829,762 145,243,715
5. caSh anD caSh eQUivalenTS
(1) Details of cash and cash equivalents as of December 31, 2012 and 2011 are as follows (Korean won in thousands):
December 31, 2012 December 31, 2011
Cash ₩ 65,238 ₩ 80,101
Cash equivalents 446,226,417 390,111,167
Total ₩ 446,291,655 ₩ 390,191,268
6. Financial aSSeTS
(1) Details of current and non-current financial instruments assets as of December 31, 2012 and 2011 are as follows (Korean won in
thousands):
December 31, 2012 December 31, 2011
CURRENT
Short-term financial instruments ₩ 325,436,900 ₩ 458,239,963
HTM investments (public bonds) 883,905 526,770
AFS financial assets 961,056 -
Subtotal 327,281,861 458,766,733
NON-CURRENT
Long-term financial instruments 19,000 35,045
AFS financial assets (non-marketable) 3,862,151 1,875,414
AFS financial assets (marketable) 53,414,136 54,210,151
AFS financial assets (equity investment) 1,240 1,240
HTM investments (public bonds) 3,264,755 3,912,215
Subtotal 60,561,282 60,034,065
Total ₩ 387,843,143 ₩ 518,800,798
(2) aFS financial assets, which are marketable, as of December 31, 2012 and 2011 are as follows (Korean won in thousands):
December 31, 2012
investees number of shares
Percentage of
ownership (%)
acquisition
cost Market value
Gain (loss)
on valuation
carrying
value
Asia Cement Manufacturing Co., Ltd. 231,517 4.89 ₩ 3,241,557 ₩ 14,006,778 ₩ 10,765,221 ₩ 14,006,778
Etec E&C Ltd. 144,008 5.14 2,228,167 4,658,659 2,430,492 4,658,659
Samkwang Glass Co., Ltd. 342,222 7.05 9,058,330 24,126,651 15,068,321 24,126,651
Tokai Carbon Co., Ltd. 2,249,431 1.00 13,245,326 10,074,133 (3,171,193) 10,074,133
Others 362,570 547,915 185,345 547,915
Total ₩ 28,135,950 ₩ 53,414,136 ₩ 25,278,186 ₩ 53,414,136

76
nOTeS TO cOnSOliDaTeD Financial STaTeMenTSFOR ThE yEARS ENDED DECEMBER 31, 2012 AND 2011
OCI ANNUAL REPORT 2012Financial Review 77
nOTeS TO cOnSOliDaTeD Financial STaTeMenTSFOR ThE yEARS ENDED DECEMBER 31, 2012 AND 2011
December 31, 2011
investees number of shares
Percentage of
ownership (%)
acquisition
cost Market value
Gain (loss)
on valuation
carrying
value
Asia Cement Manufacturing Co., Ltd. 231,517 4.89 ₩ 3,241,557 ₩ 8,473,522 ₩ 5,231,965 ₩ 8,473,522
Etec E&C Ltd. 144,008 5.14 2,228,167 7,603,622 5,375,455 7,603,622
Samkwang Glass Co., Ltd. 342,222 7.05 9,058,330 23,271,096 14,212,766 23,271,096
Tokai Carbon Co., Ltd. 2,249,431 1.00 13,245,326 13,795,780 550,454 13,795,780
Others 551,223 1,066,131 514,908 1,066,131
Total ₩ 28,324,603 ₩ 54,210,151 ₩ 25,885,548 ₩ 54,210,151
7. TRaDe anD OTheR accOUnTS ReceivaBle
(1) Trade and other accounts receivable as of December 31, 2012 and 2011 are as follows (Korean won in thousands):
December 31, 2012 December 31, 2011
CURRENT:
Trade receivable ₩ 574,175,835 ₩ 534,717,475
Allowance for bad debt (4,281,498) (3,022,877)
Short-term loans 245,346 322,413
Allowance for bad debt - (4)
Other accounts receivable 53,643,972 75,256,179
Allowance for bad debt (2,240,659) (1,118,662)
Discounts on present value (19,590) (26,016)
Accrued income 2,697,575 8,076,088
Others 555,527 362,173
Subtotal 624,776,508 614,566,769
NON-CURRENT:
Long-term loans 1,002,425 765,780
Other accounts receivable 2,914,497 2,914,497
Allowance for bad debt (2,101,027) (2,182,982)
Discounts on present value (12,344) (39,101)
Deposits 8,190,742 5,486,341
Subtotal 9,994,293 6,944,535
Total ₩ 634,770,801 ₩ 621,511,304
(2) changes in allowance for bad debt for the years ended December 31, 2012 and 2011 are as follows (Korean won in thousands):
2012
Trade receivable
Other accounts
receivable Short-term loan long-term loan
non-current other
receivable
Beginning balance ₩ (3,022,877) ₩ (1,118,662) ₩ (4) ₩ - ₩ (2,182,982)
Impairment loss (1,302,353) (1,139,279) - (2,579,542) -
Write-off - - - 2,579,542 -
Recovery of impairment loss 18,361 - 4 - 10,000
Others - 17,282 - - 71,955
Effect of foreign currency translation 25,371 - - - -
ending balance ₩ (4,281,498) ₩ (2,240,659) ₩ - ₩ - ₩ (2,101,027)
2011
Trade receivable
Other accounts
receivable Short-term loan long-term loan
non-current other
receivable
Beginning balance ₩ (2,844,783) ₩ (1,050,610) ₩ (15) ₩ (4) ₩ (198,553)
Impairment loss (252,082) (147,888) - - (2,077,754)
Write-off 30,944 - - - -
Recovery of impairment loss 43,044 57,421 11 4 -
Others - 22,415 - - 93,325
ending balance ₩ (3,022,877) ₩ (1,118,662) ₩ (4) ₩ - ₩ (2,182,982)
(3) Details of aging of trade and other accounts receivable as of December 31, 2012 and 2011 are as follows (Korean won in thousands):
December 31, 2012 December 31, 2011
Trade receivable Other receivable Trade receivable Other receivable
Neither overdue nor impaired ₩ 403,436,615 ₩ 63,793,275 ₩ 468,424,138 ₩ 85,882,351
Overdue but not impaired 169,221,644 2,282,828 65,671,432 4,303,366
Below 90 days 19,577,689 251,871 43,350,078 1,302,027
Above 90 days but below 180 days 67,956,853 24,176 16,443,285 182,261
Above 180 days 81,687,102 2,006,781 5,878,069 2,819,078
Impaired 1,517,576 3,173,981 621,905 2,997,754
Total ₩ 574,175,835 ₩ 69,250,084 ₩ 534,717,475 ₩ 93,183,471
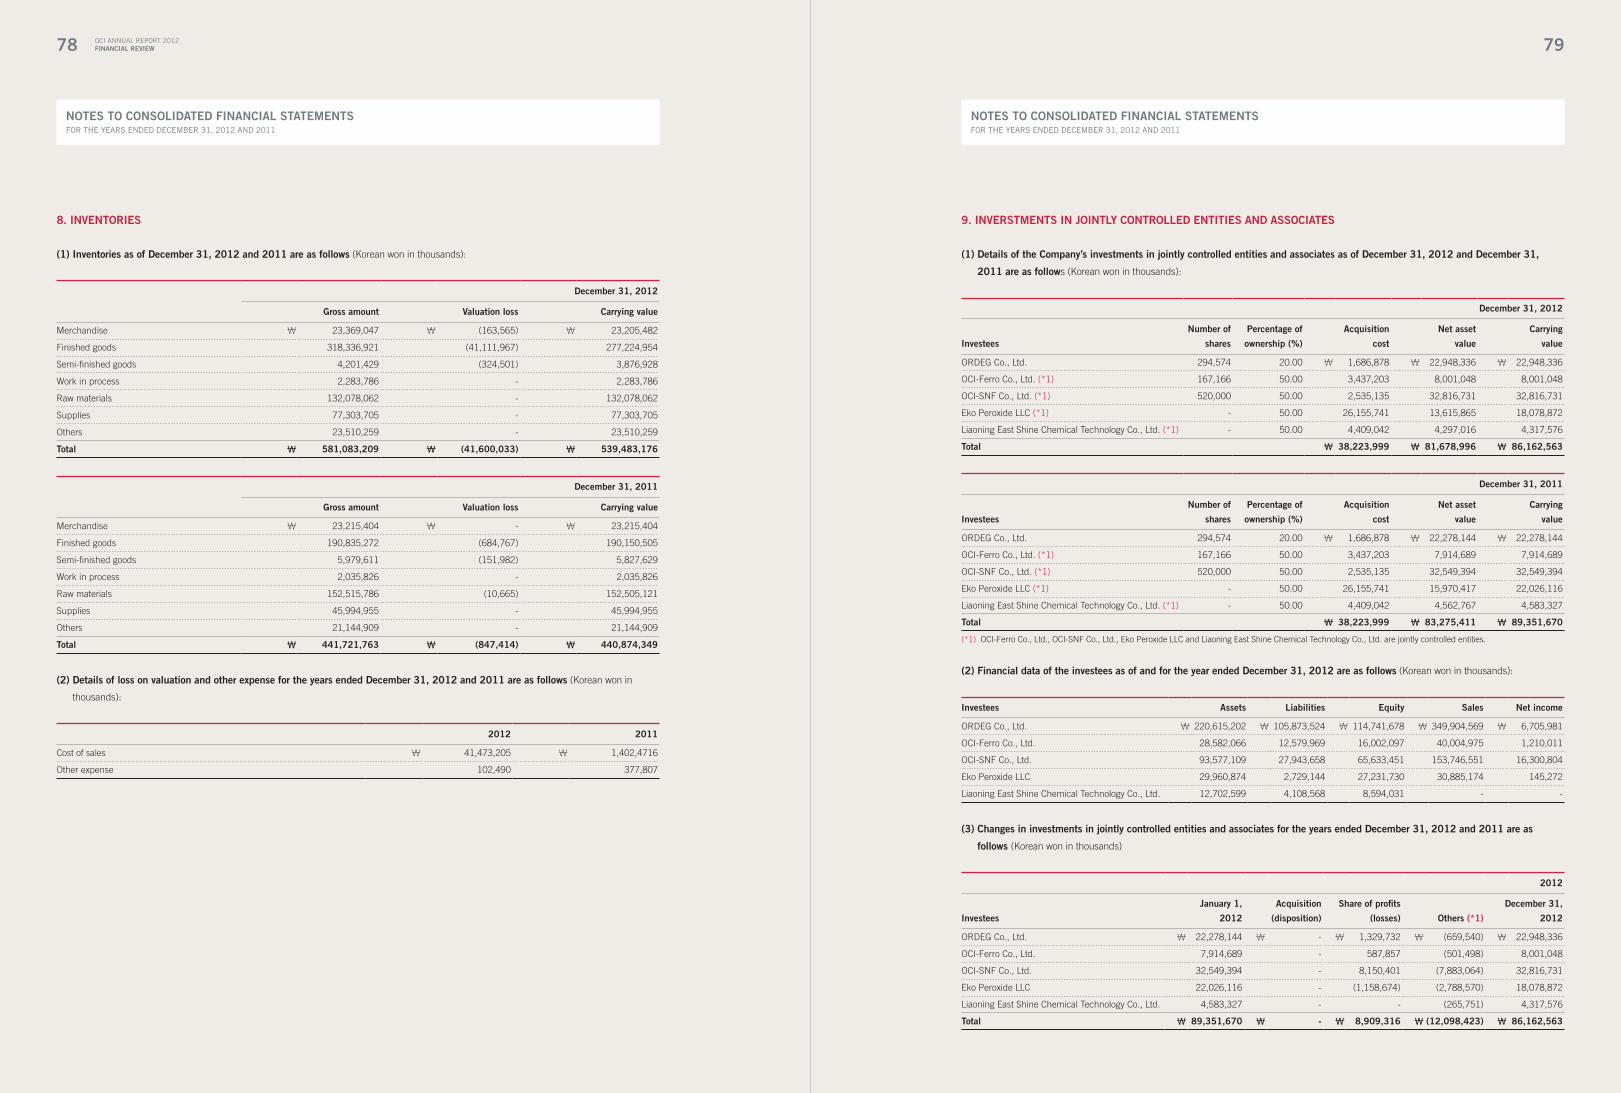
78
nOTeS TO cOnSOliDaTeD Financial STaTeMenTSFOR ThE yEARS ENDED DECEMBER 31, 2012 AND 2011
OCI ANNUAL REPORT 2012Financial Review 79
nOTeS TO cOnSOliDaTeD Financial STaTeMenTSFOR ThE yEARS ENDED DECEMBER 31, 2012 AND 2011
8. invenTORieS
(1) inventories as of December 31, 2012 and 2011 are as follows (Korean won in thousands):
December 31, 2012
Gross amount valuation loss carrying value
Merchandise ₩ 23,369,047 ₩ (163,565) ₩ 23,205,482
Finished goods 318,336,921 (41,111,967) 277,224,954
Semi-finished goods 4,201,429 (324,501) 3,876,928
Work in process 2,283,786 - 2,283,786
Raw materials 132,078,062 - 132,078,062
Supplies 77,303,705 - 77,303,705
Others 23,510,259 - 23,510,259
Total ₩ 581,083,209 ₩ (41,600,033) ₩ 539,483,176
December 31, 2011
Gross amount valuation loss carrying value
Merchandise ₩ 23,215,404 ₩ - ₩ 23,215,404
Finished goods 190,835,272 (684,767) 190,150,505
Semi-finished goods 5,979,611 (151,982) 5,827,629
Work in process 2,035,826 - 2,035,826
Raw materials 152,515,786 (10,665) 152,505,121
Supplies 45,994,955 - 45,994,955
Others 21,144,909 - 21,144,909
Total ₩ 441,721,763 ₩ (847,414) ₩ 440,874,349
(2) Details of loss on valuation and other expense for the years ended December 31, 2012 and 2011 are as follows (Korean won in
thousands):
2012 2011
Cost of sales ₩ 41,473,205 ₩ 1,402,4716
Other expense 102,490 377,807
9. inveRSTMenTS in JOinTly cOnTROlleD enTiTieS anD aSSOciaTeS
(1) Details of the company’s investments in jointly controlled entities and associates as of December 31, 2012 and December 31,
2011 are as follows (Korean won in thousands):
December 31, 2012
investees
number of
shares
Percentage of
ownership (%)
acquisition
cost
net asset
value
carrying
value
ORDEG Co., Ltd. 294,574 20.00 ₩ 1,686,878 ₩ 22,948,336 ₩ 22,948,336
OCI-Ferro Co., Ltd. (*1) 167,166 50.00 3,437,203 8,001,048 8,001,048
OCI-SNF Co., Ltd. (*1) 520,000 50.00 2,535,135 32,816,731 32,816,731
Eko Peroxide LLC (*1) - 50.00 26,155,741 13,615,865 18,078,872
Liaoning East Shine Chemical Technology Co., Ltd. (*1) - 50.00 4,409,042 4,297,016 4,317,576
Total ₩ 38,223,999 ₩ 81,678,996 ₩ 86,162,563
December 31, 2011
investees
number of
shares
Percentage of
ownership (%)
acquisition
cost
net asset
value
carrying
value
ORDEG Co., Ltd. 294,574 20.00 ₩ 1,686,878 ₩ 22,278,144 ₩ 22,278,144
OCI-Ferro Co., Ltd. (*1) 167,166 50.00 3,437,203 7,914,689 7,914,689
OCI-SNF Co., Ltd. (*1) 520,000 50.00 2,535,135 32,549,394 32,549,394
Eko Peroxide LLC (*1) - 50.00 26,155,741 15,970,417 22,026,116
Liaoning East Shine Chemical Technology Co., Ltd. (*1) - 50.00 4,409,042 4,562,767 4,583,327
Total ₩ 38,223,999 ₩ 83,275,411 ₩ 89,351,670
(*1) OCI-Ferro Co., Ltd., OCI-SNF Co., Ltd., Eko Peroxide LLC and Liaoning East Shine Chemical Technology Co., Ltd. are jointly controlled entities.
(2) Financial data of the investees as of and for the year ended December 31, 2012 are as follows (Korean won in thousands):
investees assets liabilities equity Sales net income
ORDEG Co., Ltd. ₩ 220,615,202 ₩ 105,873,524 ₩ 114,741,678 ₩ 349,904,569 ₩ 6,705,981
OCI-Ferro Co., Ltd. 28,582,066 12,579,969 16,002,097 40,004,975 1,210,011
OCI-SNF Co., Ltd. 93,577,109 27,943,658 65,633,451 153,746,551 16,300,804
Eko Peroxide LLC 29,960,874 2,729,144 27,231,730 30,885,174 145,272
Liaoning East Shine Chemical Technology Co., Ltd. 12,702,599 4,108,568 8,594,031 - -
(3) changes in investments in jointly controlled entities and associates for the years ended December 31, 2012 and 2011 are as
follows (Korean won in thousands)
2012
investees
January 1,
2012
acquisition
(disposition)
Share of profits
(losses) Others (*1)
December 31,
2012
ORDEG Co., Ltd. ₩ 22,278,144 ₩ - ₩ 1,329,732 ₩ (659,540) ₩ 22,948,336
OCI-Ferro Co., Ltd. 7,914,689 - 587,857 (501,498) 8,001,048
OCI-SNF Co., Ltd. 32,549,394 - 8,150,401 (7,883,064) 32,816,731
Eko Peroxide LLC 22,026,116 - (1,158,674) (2,788,570) 18,078,872
Liaoning East Shine Chemical Technology Co., Ltd. 4,583,327 - - (265,751) 4,317,576
Total ₩ 89,351,670 ₩ - ₩ 8,909,316 ₩ (12,098,423) ₩ 86,162,563

80
nOTeS TO cOnSOliDaTeD Financial STaTeMenTSFOR ThE yEARS ENDED DECEMBER 31, 2012 AND 2011
OCI ANNUAL REPORT 2012Financial Review 81
nOTeS TO cOnSOliDaTeD Financial STaTeMenTSFOR ThE yEARS ENDED DECEMBER 31, 2012 AND 2011
2011
investees
January 1,
2011
acquisition
(disposition)
Share of profits
(losses) Others (*1)
December 31,
2011
ORDEG Co., Ltd. ₩ 21,111,356 ₩ - ₩ 2,099,669 ₩ (932,881) ₩ 22,278,144
OCI-Ferro Co., Ltd. 5,893,305 - 2,355,716 (334,332) 7,914,689
OCI-SNF Co., Ltd. 29,741,931 - 8,248,237 (5,440,774) 32,549,394
Eko Peroxide LLC 24,133,972 - (1,373,447) (734,409) 22,026,116
Liaoning East Shine Chemical Technology Co., Ltd. - 4,409,042 - 174,285 4,583,327
Total ₩ 80,880,564 ₩ 4,409,042 ₩ 11,330,175 ₩ (7,268,111) ₩ 89,351,670
(*1) Dividends received and others.
10. PROPeRTy, PlanT anD eQUiPMenT
(1) carrying amounts of property, plant and equipment as of December 31, 2012 and 2011 are as follows (Korean won in thousands):
December 31, 2012
land
Buildings and
structures
Machinery and
equipment Others
construction in
progress Total
Acquisition costs ₩ 556,749,471 ₩ 1,060,942,486 ₩ 4,844,040,132 ₩ 154,566,477 ₩ 872,703,534 ₩ 7,489,002,100
Accumulated depreciation - (286,312,709) (2,272,146,470) (94,480,228) - (2,652,939,407)
Government subsidies - (2,747,124) (12,529,687) (39,006) (2,550,621) (17,866,438)
carrying amounts ₩ 556,749,471 ₩ 771,882,653 ₩ 2,559,363,975 ₩ 60,047,243 ₩ 870,152,913 ₩ 4,818,196,255
December 31, 2011
land
Buildings and
structures
Machinery and
equipment Others
construction in
progress Total
Acquisition costs ₩ 500,463,415 ₩ 1,036,142,727 ₩ 4,710,020,627 ₩ 145,510,978 ₩ 644,266,381 ₩ 7,036,404,128
Accumulated depreciation - (261,017,883) (1,879,813,060) (74,694,246) - (2,215,525,189)
Accumulated impairment - - (368,478) - - (368,478)
Government subsidies - (2,895,617) (10,319,963) (48,078) (8,109) (13,271,767)
carrying amounts ₩ 500,463,415 ₩ 772,229,227 ₩ 2,819,519,126 ₩ 70,768,654 ₩ 644,258,272 ₩ 4,807,238,694
(2) changes in acquisition costs of property, plant and equipment for the years ended December 31, 2012 and 2011 are as follows
(Korean won in thousands):
2012
land
Buildings and
structures
Machinery and
equipment Others
construction in
progress Total
Beginning balance ₩ 500,463,415 ₩ 1,036,142,727 ₩ 4,710,020,627 ₩ 145,510,978 ₩ 644,266,381 ₩ 7,036,404,128
Acquisition and capital expenditure 27,004,059 5,024,607 36,928,295 10,252,713 545,000,888 624,210,562
Transfer 32,082,191 49,139,644 213,359,846 1,437,469 (279,183,997) 16,835,153
Disposal (2,239,134) (15,783,613) (61,987,966) (2,234,213) (33,865,962) (116,110,888)
Effect of foreign currency translation (561,060) (13,580,879) (54,280,670) (400,470) (3,513,776) (72,336,855)
ending balance ₩ 556,749,471 ₩ 1,060,942,486 ₩ 4,844,040,132 ₩ 154,566,477 ₩ 872,703,534 ₩ 7,489,002,100
2011
land
Buildings and
structures
Machinery and
equipment Others
construction in
progress Total
Beginning balance ₩ 497,844,914 ₩ 776,240,224 ₩ 3,204,105,127 ₩ 103,192,870 ₩ 1,069,472,395 ₩ 5,650,855,530
Acquisition and capital expenditure 2,859,045 33,223,334 143,905,605 29,498,228 1,266,548,252 1,476,034,464
Transfer (217,376) 242,447,714 1,433,327,974 14,764,451 (1,689,712,550) 610,213
Disposal (77,054) (18,502,785) (85,989,150) (2,248,702) (3,178,854) (109,996,545)
Effect of foreign currency translation 53,886 2,734,240 14,671,071 304,131 1,137,138 18,900,466
ending balance ₩ 500,463,415 ₩ 1,036,142,727 ₩ 4,710,020,627 ₩ 145,510,978 ₩ 644,266,381 ₩ 7,036,404,128
(3) changes in accumulated depreciation and accumulated impairment for the years ended December 31, 2012 and 2011 are as
follows (Korean won in thousands):
2012
Buildings and
structures
Machinery and
equipment Others
construction in
progress Total
Beginning balance ₩ (261,017,883) ₩ (1,880,181,538) ₩ (74,694,246) ₩ - ₩ (2,215,893,667)
Depreciation (36,763,423) (477,308,775) (21,371,617) - (535,443,815)
Impairment loss (*1) - - - (29,125,373) (29,125,373)
Disposal 5,830,080 49,168,732 1,490,946 29,125,373 85,615,131
Others (2,570,932) (3,178,635) (3,229) - (5,752,796)
Effect of foreign currency translation 8,209,449 39,353,746 97,918 - 47,661,113
ending balance ₩ (286,312,709) ₩ (2,272,146,470) ₩ (94,480,228) ₩ - ₩ (2,652,939,407)
(*1) Some contracts of the machinery related to construction in progress have been changed. As a related portion of construction in progress was considered irrelevant,
the Company recognized impairment loss on construction in progress.
2011
Buildings and
structures
Machinery and
equipment Others Total
Beginning balance ₩ (240,785,236) ₩ (1,558,337,967) ₩ (57,023,411) ₩ (1,856,146,614)
Depreciation (33,633,942) (397,213,502) (18,676,630) (449,524,074)
Impairment cost - (368,478) (1,098,582) (1,467,060)
Disposal 8,529,243 84,222,515 2,119,771 94,871,529
Transfer 6,476,780 506,296 716 6,983,792
Others - (1,721,659) (2,622) (1,724,281)
Effect of foreign currency translation (1,604,728) (7,268,743) (13,488) (8,886,959)
ending balance ₩ (261,017,883) ₩ (1,880,181,538) ₩ (74,694,246) ₩ (2,215,893,667)
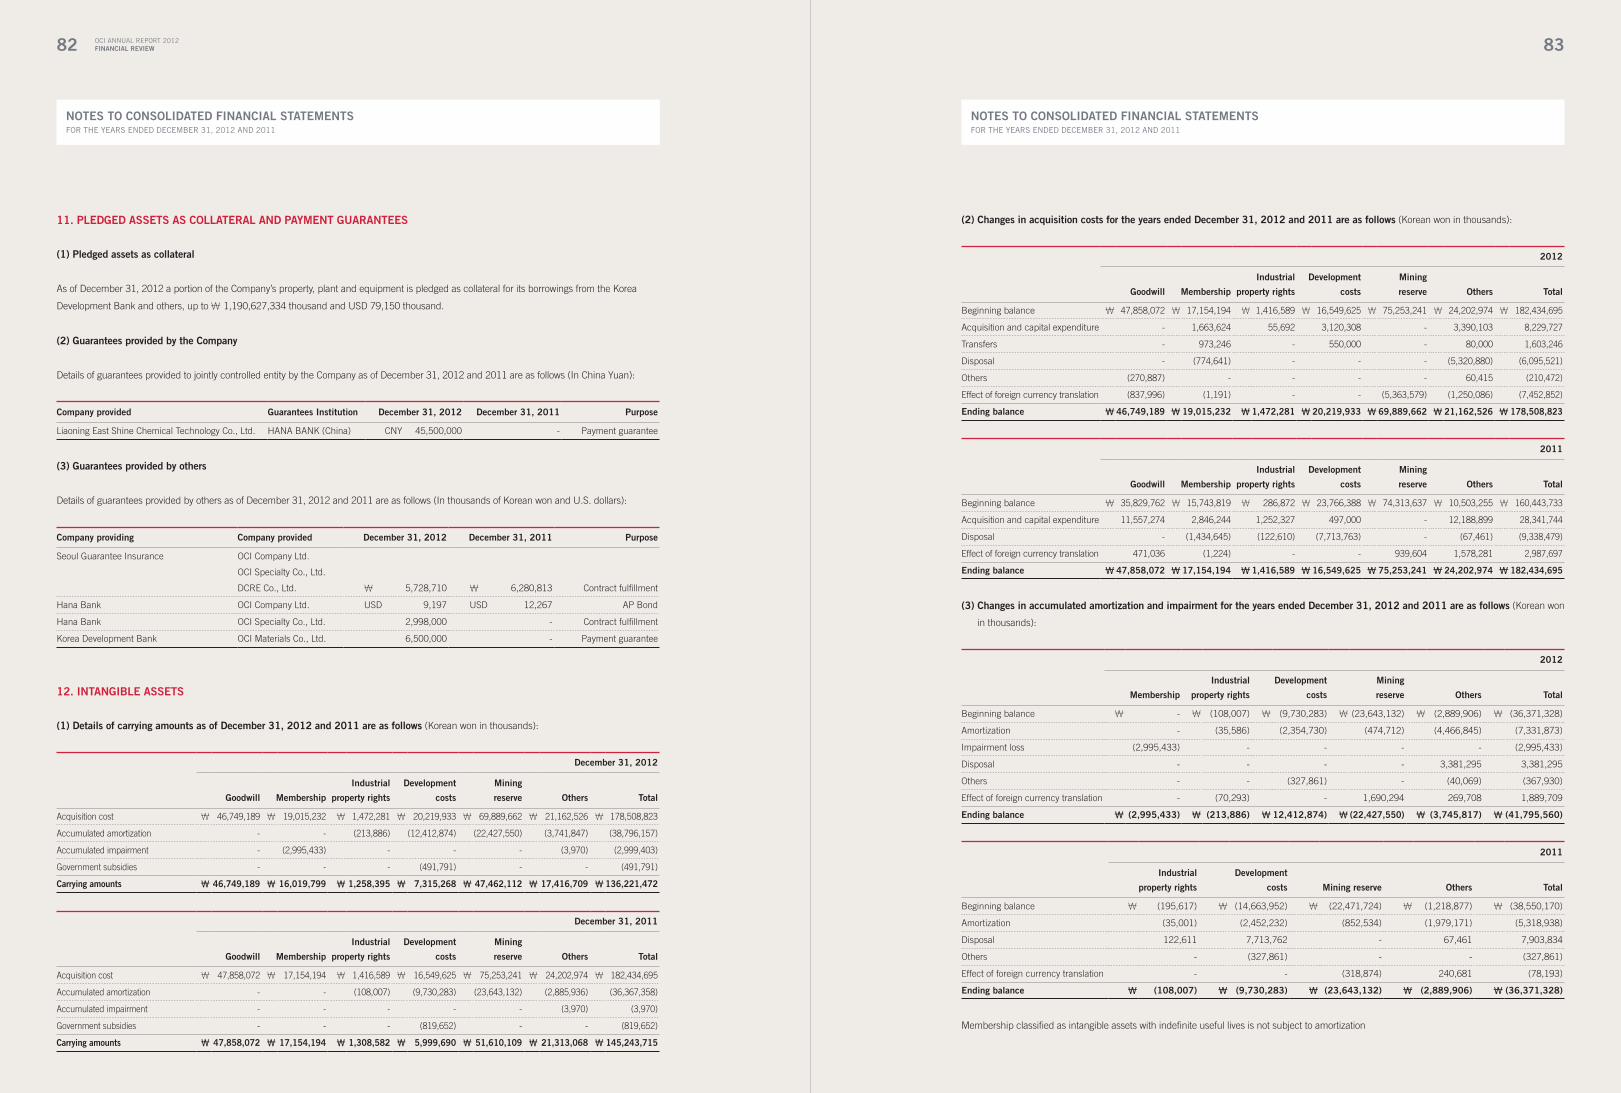
82
nOTeS TO cOnSOliDaTeD Financial STaTeMenTSFOR ThE yEARS ENDED DECEMBER 31, 2012 AND 2011
OCI ANNUAL REPORT 2012Financial Review 83
nOTeS TO cOnSOliDaTeD Financial STaTeMenTSFOR ThE yEARS ENDED DECEMBER 31, 2012 AND 2011
11. PleDGeD aSSeTS aS cOllaTeRal anD PayMenT GUaRanTeeS
(1) Pledged assets as collateral
As of December 31, 2012 a portion of the Company’s property, plant and equipment is pledged as collateral for its borrowings from the Korea
Development Bank and others, up to ₩ 1,190,627,334 thousand and USD 79,150 thousand.
(2) Guarantees provided by the company
Details of guarantees provided to jointly controlled entity by the Company as of December 31, 2012 and 2011 are as follows (In China Yuan):
company provided Guarantees institution December 31, 2012 December 31, 2011 Purpose
Liaoning East Shine Chemical Technology Co., Ltd. HANA BANK (China) CNY 45,500,000 - Payment guarantee
(3) Guarantees provided by others
Details of guarantees provided by others as of December 31, 2012 and 2011 are as follows (In thousands of Korean won and U.S. dollars):
company providing company provided December 31, 2012 December 31, 2011 Purpose
Seoul Guarantee Insurance OCI Company Ltd.
OCI Specialty Co., Ltd.
DCRE Co., Ltd. ₩ 5,728,710 ₩ 6,280,813 Contract fulfillment
Hana Bank OCI Company Ltd. USD 9,197 USD 12,267 AP Bond
Hana Bank OCI Specialty Co., Ltd. 2,998,000 - Contract fulfillment
Korea Development Bank OCI Materials Co., Ltd. 6,500,000 - Payment guarantee
12. inTanGiBle aSSeTS
(1) Details of carrying amounts as of December 31, 2012 and 2011 are as follows (Korean won in thousands):
December 31, 2012
Goodwill Membership
industrial
property rights
Development
costs
Mining
reserve Others Total
Acquisition cost ₩ 46,749,189 ₩ 19,015,232 ₩ 1,472,281 ₩ 20,219,933 ₩ 69,889,662 ₩ 21,162,526 ₩ 178,508,823
Accumulated amortization - - (213,886) (12,412,874) (22,427,550) (3,741,847) (38,796,157)
Accumulated impairment - (2,995,433) - - - (3,970) (2,999,403)
Government subsidies - - - (491,791) - - (491,791)
carrying amounts ₩ 46,749,189 ₩ 16,019,799 ₩ 1,258,395 ₩ 7,315,268 ₩ 47,462,112 ₩ 17,416,709 ₩ 136,221,472
December 31, 2011
Goodwill Membership
industrial
property rights
Development
costs
Mining
reserve Others Total
Acquisition cost ₩ 47,858,072 ₩ 17,154,194 ₩ 1,416,589 ₩ 16,549,625 ₩ 75,253,241 ₩ 24,202,974 ₩ 182,434,695
Accumulated amortization - - (108,007) (9,730,283) (23,643,132) (2,885,936) (36,367,358)
Accumulated impairment - - - - - (3,970) (3,970)
Government subsidies - - - (819,652) - - (819,652)
carrying amounts ₩ 47,858,072 ₩ 17,154,194 ₩ 1,308,582 ₩ 5,999,690 ₩ 51,610,109 ₩ 21,313,068 ₩ 145,243,715
(2) changes in acquisition costs for the years ended December 31, 2012 and 2011 are as follows (Korean won in thousands):
2012
Goodwill Membership
industrial
property rights
Development
costs
Mining
reserve Others Total
Beginning balance ₩ 47,858,072 ₩ 17,154,194 ₩ 1,416,589 ₩ 16,549,625 ₩ 75,253,241 ₩ 24,202,974 ₩ 182,434,695
Acquisition and capital expenditure - 1,663,624 55,692 3,120,308 - 3,390,103 8,229,727
Transfers - 973,246 - 550,000 - 80,000 1,603,246
Disposal - (774,641) - - - (5,320,880) (6,095,521)
Others (270,887) - - - - 60,415 (210,472)
Effect of foreign currency translation (837,996) (1,191) - - (5,363,579) (1,250,086) (7,452,852)
ending balance ₩ 46,749,189 ₩ 19,015,232 ₩ 1,472,281 ₩ 20,219,933 ₩ 69,889,662 ₩ 21,162,526 ₩ 178,508,823
2011
Goodwill Membership
industrial
property rights
Development
costs
Mining
reserve Others Total
Beginning balance ₩ 35,829,762 ₩ 15,743,819 ₩ 286,872 ₩ 23,766,388 ₩ 74,313,637 ₩ 10,503,255 ₩ 160,443,733
Acquisition and capital expenditure 11,557,274 2,846,244 1,252,327 497,000 - 12,188,899 28,341,744
Disposal - (1,434,645) (122,610) (7,713,763) - (67,461) (9,338,479)
Effect of foreign currency translation 471,036 (1,224) - - 939,604 1,578,281 2,987,697
ending balance ₩ 47,858,072 ₩ 17,154,194 ₩ 1,416,589 ₩ 16,549,625 ₩ 75,253,241 ₩ 24,202,974 ₩ 182,434,695
(3) changes in accumulated amortization and impairment for the years ended December 31, 2012 and 2011 are as follows (Korean won
in thousands):
2012
Membership
industrial
property rights
Development
costs
Mining
reserve Others Total
Beginning balance ₩ - ₩ (108,007) ₩ (9,730,283) ₩ (23,643,132) ₩ (2,889,906) ₩ (36,371,328)
Amortization - (35,586) (2,354,730) (474,712) (4,466,845) (7,331,873)
Impairment loss (2,995,433) - - - - (2,995,433)
Disposal - - - - 3,381,295 3,381,295
Others - - (327,861) - (40,069) (367,930)
Effect of foreign currency translation - (70,293) - 1,690,294 269,708 1,889,709
ending balance ₩ (2,995,433) ₩ (213,886) ₩ 12,412,874) ₩ (22,427,550) ₩ (3,745,817) ₩ (41,795,560)
2011
industrial
property rights
Development
costs Mining reserve Others Total
Beginning balance ₩ (195,617) ₩ (14,663,952) ₩ (22,471,724) ₩ (1,218,877) ₩ (38,550,170)
Amortization (35,001) (2,452,232) (852,534) (1,979,171) (5,318,938)
Disposal 122,611 7,713,762 - 67,461 7,903,834
Others - (327,861) - - (327,861)
Effect of foreign currency translation - - (318,874) 240,681 (78,193)
ending balance ₩ (108,007) ₩ (9,730,283) ₩ (23,643,132) ₩ (2,889,906) ₩ (36,371,328)
Membership classified as intangible assets with indefinite useful lives is not subject to amortization

84
nOTeS TO cOnSOliDaTeD Financial STaTeMenTSFOR ThE yEARS ENDED DECEMBER 31, 2012 AND 2011
OCI ANNUAL REPORT 2012Financial Review 85
nOTeS TO cOnSOliDaTeD Financial STaTeMenTSFOR ThE yEARS ENDED DECEMBER 31, 2012 AND 2011
(4) allocation of amortization expense for the years ended December 31, 2012 and 2011 are as follows (Korean won in thousands):
2012 2011
Cost of production ₩ 4,247,886 ₩ 2,324,208
Selling and administrative expenses 2,272,529 2,184,630
Rental cost - 54
Research and development 811,458 810,046
Total ₩ 7,331,873 ₩ 5,318,938
(5) Details of cost of research and development for the years ended December 31, 2012 and 2011 are as follows (Korean won in
thousands):
2012 2011
Research and development ₩ 34,648,274 ₩ 24,018,102
13. inveSTMenT PROPeRTy
(1) carrying amounts as of December 31, 2012 and 2011 are as follows (Korean won in thousands):
December 31, 2012
land Buildings and structures Total
Acquisition cost ₩ 51,549,954 ₩ 35,991,787 ₩ 87,541,741
Accumulated depreciation - (10,002,051) (10,002,051)
carrying amounts ₩ 51,549,954 ₩ 25,989,736 ₩ 77,539,690
December 31, 2011
land Buildings and structures Total
Acquisition cost ₩ 56,747,596 ₩ 47,971,240 ₩ 104,718,836
Accumulated depreciation - (11,476,507) (11,476,507)
carrying amounts ₩ 56,747,596 ₩ 36,494,733 ₩ 93,242,329
(2) changes in acquisition cost for the years ended December 31, 2012 and 2011 are as follows (Korean won in thousands):
2012
land Buildings and structures Total
Beginning balance ₩ 56,747,596 ₩ 47,971,240 ₩ 104,718,836
Acquisition and capital expenditure - - -
Transfers (5,045,879) (11,917,000) (16,962,879)
Disposal (151,763) (62,453) (214,216)
ending balance ₩ 51,549,954 ₩ 35,991,787 ₩ 87,541,741
2011
land Buildings and structures Total
Beginning balance ₩ 56,291,687 ₩ 52,453,439 ₩ 108,745,126
Acquisition and capital expenditure - 285,421 285,421
Transfers 458,009 (3,831,527) (3,373,518)
Disposal (2,100) (936,093) (938,193)
ending balance ₩ 56,747,596 ₩ 47,971,240 ₩ 104,718,836
(3) changes in accumulated depreciation for the years ended December 31, 2012 and 2011 are as follows (Korean won in thousands):
2012 2011
Buildings and structures Buildings and structures
Beginning balance ₩ (11,476,507) ₩ (10,768,964)
Depreciation (1,036,767) (1,270,394)
Disposal 18,541 38,229
Transfers 2,492,682 524,622
ending balance ₩ (10,002,051) ₩ (11,476,507)
(4) Details of income and expense for the years ended December 31, 2012 and 2011 are as follows (Korean won in thousands):
2012 2011
Rental income ₩ 4,508,274 ₩ 5,167,950
Operating expense on investment property (5,301,827) (5,251,337)
(5) Fair value of investment property as of December 31, 2012 and 2011 are as follows (Korean won in thousands):
December 31, 2012 December 31, 2011
carrying amounts Fair value carrying amounts Fair value
Land ₩ 51,549,954 ₩ 66,859,898 ₩ 56,747,596 ₩ 75,502,655
Buildings and structures 25,989,736 21,839,402 36,494,733 28,256,930
Total ₩ 77,539,690 ₩ 88,699,300 ₩ 93,242,329 ₩ 103,759,585

86
nOTeS TO cOnSOliDaTeD Financial STaTeMenTSFOR ThE yEARS ENDED DECEMBER 31, 2012 AND 2011
OCI ANNUAL REPORT 2012Financial Review 87
nOTeS TO cOnSOliDaTeD Financial STaTeMenTSFOR ThE yEARS ENDED DECEMBER 31, 2012 AND 2011
14. OTheR aSSeTS
Details of other assets as of December 31, 2012 and 2011 are as follows (Korean won in thousands):
December 31, 2012 December 31, 2011
CURRENT
Advance payments ₩ 27,381,741 ₩ 35,300,295
Prepaid expenses 5,550,933 15,603,828
Others 4,132,399 29,446,673
Subtotal 37,065,073 80,350,796
NON-CURRENT
Prepaid expenses 577,482 737,580
Advance payments 61,502,562 -
Others 9,637,192 5,513,982
Subtotal 71,717,236 6,251,562
Total ₩ 108,782,309 ₩ 86,602,358
15. Financial liaBiliTieS
Details of financial liabilities as of December 31, 2012 and 2011 are as follows (Korean won in thousands):
creditor
annual interest
rate (%)
December 31,
2012
December 31,
2011
CURRENT
Short-term borrowings Korea Exim Bank and others 1.35 ~ 6.89 ₩ 284,594,188 ₩ 505,944,731
Current portion of long-term financial liabilities Shinhan Bank and others 1.50 ~ 4.33 112,001,086 136,010,310
Subtotal 396,595,274 641,955,041
NON-CURRENT
Long-term debentures Hana Daetoo Securities and others 3.35 ~ 4.74 650,000,000 250,000,000
Discount on bond (2,504,049) (967,000)
Long-term borrowings Korea Development Bank and others 1.50 ~ 5.76 1,148,811,365 611,911,362
Subtotal 1,796,307,316 860,944,362
Total ₩ 2,192,902,590 ₩ 1,502,899,403
A portion of the Company’s property, plant and equipment is pledged as collateral for these financial liabilities (Refer to Note 11).
16. TRaDe anD OTheR accOUnTS PayaBle
(1) Details of trade and other accounts payable as of December 31, 2012 and 2011, are as follows (Korean won in thousands):
December 31, 2012 December 31, 2011
CURRENT
Trade payable ₩ 158,487,801 ₩ 160,759,131
Other accounts payable 312,248,020 427,951,232
Discount on present value (231,753) (264,288)
Dividends payable 36,728 38,051
Accrued expenses (interest) 6,377,969 5,393,035
Accrued expenses (others) 53,738,047 55,328,469
Withholdings 5,058,765 14,464,637
Guarantee deposits received 110,434 137,051
Subtotal 535,826,011 663,807,318
NON-CURRENT
Long-term other accounts payable 15,195,780 17,944,416
Discount on present value (1,309,272) (1,757,364)
Long-term accrued expenses 7,227,252 2,561,873
Leasehold deposits received 11,590,654 12,459,731
Subtotal 32,704,414 31,208,656
Total ₩ 568,530,425 ₩ 695,015,974
(2) Stock options granted to the management of the Parent are summarized as follows:
2012 2011 2010
Grant date January 31, 2012 January 30, 2011 January 29, 2010
Company OCI Company Ltd. OCI Company Ltd. OCI Company Ltd.
Number of shares granted (*1) 5,186 shares 3,724 shares 5,744 shares
Grant method Cash payment Cash payment Cash payment
Vesting period January 1, 2012
- December 31, 2014
January 1, 2011
- December 31, 2013
January 1, 2010
- December 31, 2012
Valuation method Fair value accounting method Fair value accounting method Fair value accounting method
Value of stock option ₩ 536,590 thousand ₩ 1,102,875 thousand ₩ 1,882,474 thousand
(*1) Number of shares granted varies according to the annual management performance.
Under the existing policy adopted by the Company, the stock options mentioned above are measured at fair value at the grant date and recognized
on a straight-line basis over the implied service period (vesting period).
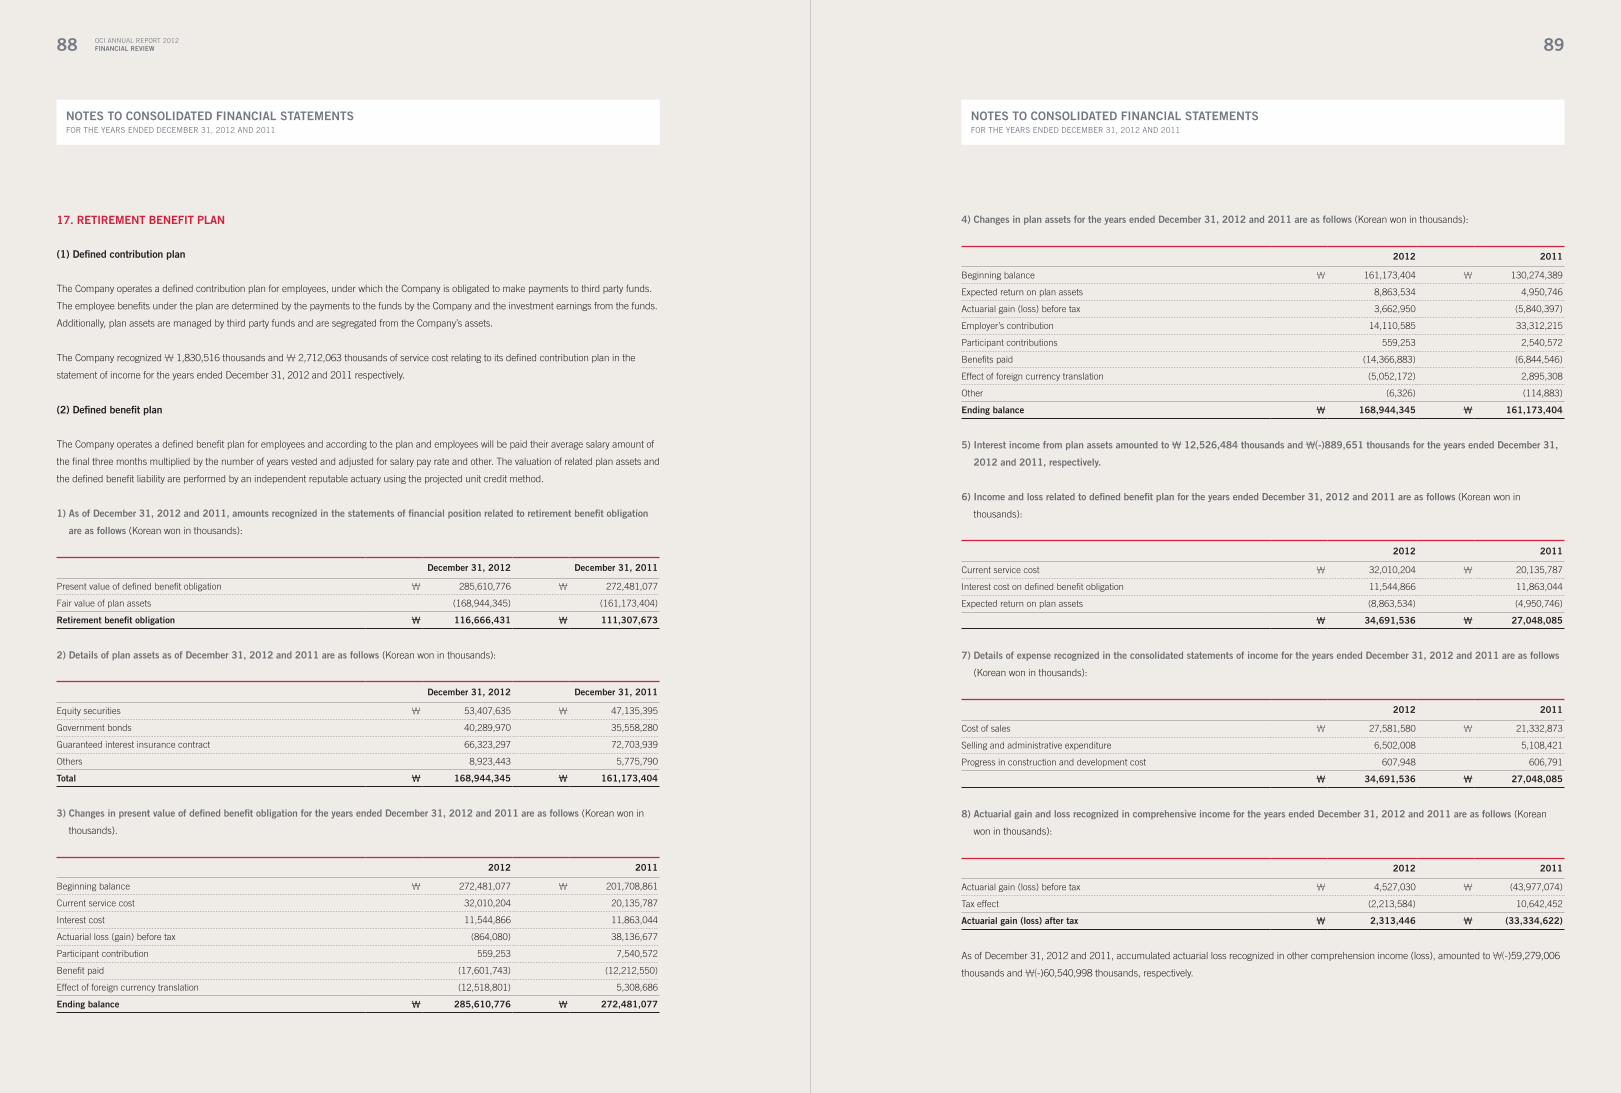
88
nOTeS TO cOnSOliDaTeD Financial STaTeMenTSFOR ThE yEARS ENDED DECEMBER 31, 2012 AND 2011
OCI ANNUAL REPORT 2012Financial Review 89
nOTeS TO cOnSOliDaTeD Financial STaTeMenTSFOR ThE yEARS ENDED DECEMBER 31, 2012 AND 2011
17. ReTiReMenT BeneFiT Plan
(1) Defined contribution plan
The Company operates a defined contribution plan for employees, under which the Company is obligated to make payments to third party funds.
The employee benefits under the plan are determined by the payments to the funds by the Company and the investment earnings from the funds.
Additionally, plan assets are managed by third party funds and are segregated from the Company’s assets.
The Company recognized ₩ 1,830,516 thousands and ₩ 2,712,063 thousands of service cost relating to its defined contribution plan in the
statement of income for the years ended December 31, 2012 and 2011 respectively.
(2) Defined benefit plan
The Company operates a defined benefit plan for employees and according to the plan and employees will be paid their average salary amount of
the final three months multiplied by the number of years vested and adjusted for salary pay rate and other. The valuation of related plan assets and
the defined benefit liability are performed by an independent reputable actuary using the projected unit credit method.
1) as of December 31, 2012 and 2011, amounts recognized in the statements of financial position related to retirement benefit obligation
are as follows (Korean won in thousands):
December 31, 2012 December 31, 2011
Present value of defined benefit obligation ₩ 285,610,776 ₩ 272,481,077
Fair value of plan assets (168,944,345) (161,173,404)
Retirement benefit obligation ₩ 116,666,431 ₩ 111,307,673
2) Details of plan assets as of December 31, 2012 and 2011 are as follows (Korean won in thousands):
December 31, 2012 December 31, 2011
Equity securities ₩ 53,407,635 ₩ 47,135,395
Government bonds 40,289,970 35,558,280
Guaranteed interest insurance contract 66,323,297 72,703,939
Others 8,923,443 5,775,790
Total ₩ 168,944,345 ₩ 161,173,404
3) changes in present value of defined benefit obligation for the years ended December 31, 2012 and 2011 are as follows (Korean won in
thousands).
2012 2011
Beginning balance ₩ 272,481,077 ₩ 201,708,861
Current service cost 32,010,204 20,135,787
Interest cost 11,544,866 11,863,044
Actuarial loss (gain) before tax (864,080) 38,136,677
Participant contribution 559,253 7,540,572
Benefit paid (17,601,743) (12,212,550)
Effect of foreign currency translation (12,518,801) 5,308,686
ending balance ₩ 285,610,776 ₩ 272,481,077
4) changes in plan assets for the years ended December 31, 2012 and 2011 are as follows (Korean won in thousands):
2012 2011
Beginning balance ₩ 161,173,404 ₩ 130,274,389
Expected return on plan assets 8,863,534 4,950,746
Actuarial gain (loss) before tax 3,662,950 (5,840,397)
Employer’s contribution 14,110,585 33,312,215
Participant contributions 559,253 2,540,572
Benefits paid (14,366,883) (6,844,546)
Effect of foreign currency translation (5,052,172) 2,895,308
Other (6,326) (114,883)
ending balance ₩ 168,944,345 ₩ 161,173,404
5) interest income from plan assets amounted to ₩ 12,526,484 thousands and ₩(-)889,651 thousands for the years ended December 31,
2012 and 2011, respectively.
6) income and loss related to defined benefit plan for the years ended December 31, 2012 and 2011 are as follows (Korean won in
thousands):
2012 2011
Current service cost ₩ 32,010,204 ₩ 20,135,787
Interest cost on defined benefit obligation 11,544,866 11,863,044
Expected return on plan assets (8,863,534) (4,950,746)
₩ 34,691,536 ₩ 27,048,085
7) Details of expense recognized in the consolidated statements of income for the years ended December 31, 2012 and 2011 are as follows
(Korean won in thousands):
2012 2011
Cost of sales ₩ 27,581,580 ₩ 21,332,873
Selling and administrative expenditure 6,502,008 5,108,421
Progress in construction and development cost 607,948 606,791
₩ 34,691,536 ₩ 27,048,085
8) actuarial gain and loss recognized in comprehensive income for the years ended December 31, 2012 and 2011 are as follows (Korean
won in thousands):
2012 2011
Actuarial gain (loss) before tax ₩ 4,527,030 ₩ (43,977,074)
Tax effect (2,213,584) 10,642,452
actuarial gain (loss) after tax ₩ 2,313,446 ₩ (33,334,622)
As of December 31, 2012 and 2011, accumulated actuarial loss recognized in other comprehension income (loss), amounted to ₩(-)59,279,006
thousands and ₩(-)60,540,998 thousands, respectively.
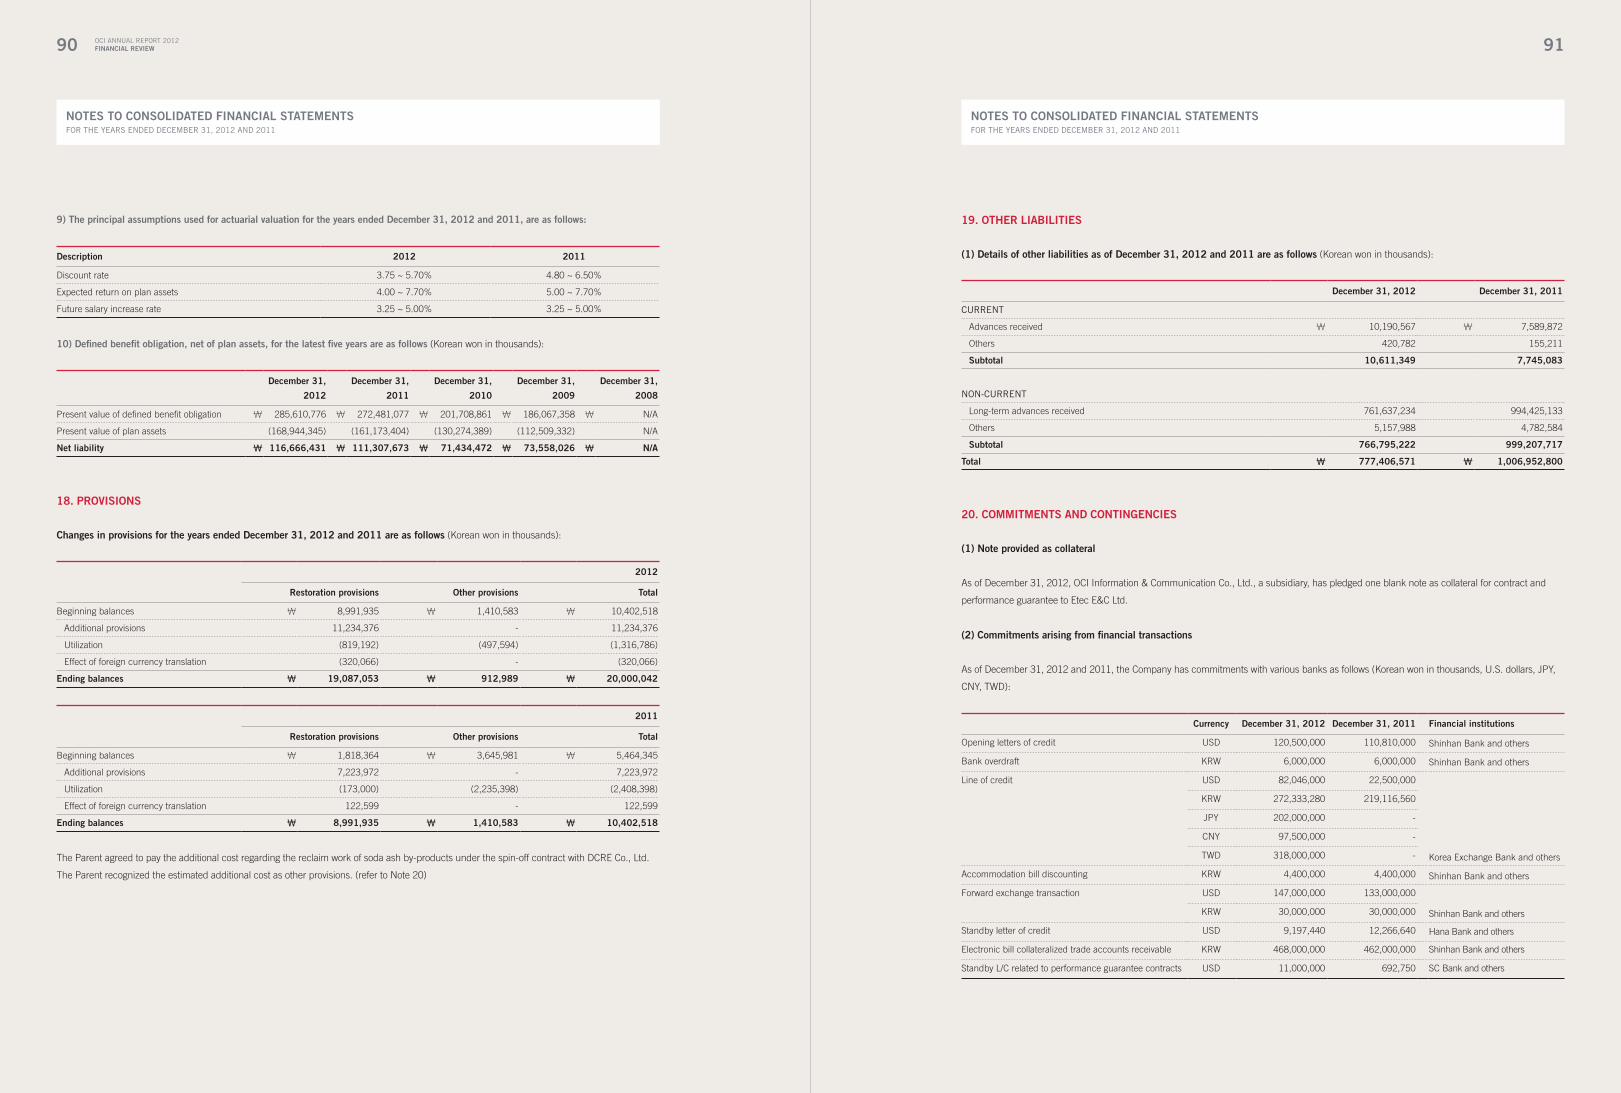
90
nOTeS TO cOnSOliDaTeD Financial STaTeMenTSFOR ThE yEARS ENDED DECEMBER 31, 2012 AND 2011
OCI ANNUAL REPORT 2012Financial Review 91
nOTeS TO cOnSOliDaTeD Financial STaTeMenTSFOR ThE yEARS ENDED DECEMBER 31, 2012 AND 2011
9) The principal assumptions used for actuarial valuation for the years ended December 31, 2012 and 2011, are as follows:
Description 2012 2011
Discount rate 3.75 ~ 5.70% 4.80 ~ 6.50%
Expected return on plan assets 4.00 ~ 7.70% 5.00 ~ 7.70%
Future salary increase rate 3.25 ~ 5.00% 3.25 ~ 5.00%
10) Defined benefit obligation, net of plan assets, for the latest five years are as follows (Korean won in thousands):
December 31,
2012
December 31,
2011
December 31,
2010
December 31,
2009
December 31,
2008
Present value of defined benefit obligation ₩ 285,610,776 ₩ 272,481,077 ₩ 201,708,861 ₩ 186,067,358 ₩ N/A
Present value of plan assets (168,944,345) (161,173,404) (130,274,389) (112,509,332) N/A
net liability ₩ 116,666,431 ₩ 111,307,673 ₩ 71,434,472 ₩ 73,558,026 ₩ n/a
18. PROviSiOnS
changes in provisions for the years ended December 31, 2012 and 2011 are as follows (Korean won in thousands):
2012
Restoration provisions Other provisions Total
Beginning balances ₩ 8,991,935 ₩ 1,410,583 ₩ 10,402,518
Additional provisions 11,234,376 - 11,234,376
Utilization (819,192) (497,594) (1,316,786)
Effect of foreign currency translation (320,066) - (320,066)
ending balances ₩ 19,087,053 ₩ 912,989 ₩ 20,000,042
2011
Restoration provisions Other provisions Total
Beginning balances ₩ 1,818,364 ₩ 3,645,981 ₩ 5,464,345
Additional provisions 7,223,972 - 7,223,972
Utilization (173,000) (2,235,398) (2,408,398)
Effect of foreign currency translation 122,599 - 122,599
ending balances ₩ 8,991,935 ₩ 1,410,583 ₩ 10,402,518
The Parent agreed to pay the additional cost regarding the reclaim work of soda ash by-products under the spin-off contract with DCRE Co., Ltd.
The Parent recognized the estimated additional cost as other provisions. (refer to Note 20)
19. OTheR liaBiliTieS
(1) Details of other liabilities as of December 31, 2012 and 2011 are as follows (Korean won in thousands):
December 31, 2012 December 31, 2011
CURRENT
Advances received ₩ 10,190,567 ₩ 7,589,872
Others 420,782 155,211
Subtotal 10,611,349 7,745,083
NON-CURRENT
Long-term advances received 761,637,234 994,425,133
Others 5,157,988 4,782,584
Subtotal 766,795,222 999,207,717
Total ₩ 777,406,571 ₩ 1,006,952,800
20. cOMMiTMenTS anD cOnTinGencieS
(1) note provided as collateral
As of December 31, 2012, OCI Information & Communication Co., Ltd., a subsidiary, has pledged one blank note as collateral for contract and
performance guarantee to Etec E&C Ltd.
(2) commitments arising from financial transactions
As of December 31, 2012 and 2011, the Company has commitments with various banks as follows (Korean won in thousands, U.S. dollars, JPY,
CNY, TWD):
currency December 31, 2012 December 31, 2011 Financial institutions
Opening letters of credit USD 120,500,000 110,810,000 Shinhan Bank and others
Bank overdraft KRW 6,000,000 6,000,000 Shinhan Bank and others
Line of credit USD 82,046,000 22,500,000
Korea Exchange Bank and others
KRW 272,333,280 219,116,560
JPY 202,000,000 -
CNY 97,500,000 -
TWD 318,000,000 -
Accommodation bill discounting KRW 4,400,000 4,400,000 Shinhan Bank and others
Forward exchange transaction USD 147,000,000 133,000,000
Shinhan Bank and othersKRW 30,000,000 30,000,000
Standby letter of credit USD 9,197,440 12,266,640 Hana Bank and others
Electronic bill collateralized trade accounts receivable KRW 468,000,000 462,000,000 Shinhan Bank and others
Standby L/C related to performance guarantee contracts USD 11,000,000 692,750 SC Bank and others

92
nOTeS TO cOnSOliDaTeD Financial STaTeMenTSFOR ThE yEARS ENDED DECEMBER 31, 2012 AND 2011
OCI ANNUAL REPORT 2012Financial Review 93
nOTeS TO cOnSOliDaTeD Financial STaTeMenTSFOR ThE yEARS ENDED DECEMBER 31, 2012 AND 2011
(3) license agreement
Under various technical license and assistance agreements, the Company has royalty payments for technical assistance.
(4) cPS energy agreement
On July 23, 2012, the Company and City Public Service of San Antonio (“CPS”) entered into the CPS Master Agreement related to the construction
of a 400MW PV solar facility. The facility is expected to be built in five stages, with construction occurring from 2013 through 2016. All of the
energy produced by the facilities will be sold to CPS, at prices set forth in the CPS Master Agreement. CPS has the right to purchase the facilities at
various dates after commencement of operations at prices also set forth in the Master Agreement.
(5) long-term purchase and supply agreement
Among the various long-term advances the Company has, as of December 31, 2012, ₩ 753,172,500 thousand relates to the Parent’s long-term poly
silicon supply contract. In addition, the Parent has entered into a refund guarantee contract with Hana Bank for the long-term advances. OCI Specialty
Co., Ltd., a subsidiary, has entered into a long-term supply contract for wafer with Shinsung Solar Energy Co., Ltd. and others from 2009 to 2014.
For fulfillment of contract about CPS Energy Agreement, the Company made contracts long-term purchase with some clients and paid non-current
advance payments that long-term purchase commitments are USD 573 million.
(6) Derivatives
As of December 31, 2012 the Company has outstanding foreign currency forward contracts with several banks. The details are as follows:
Banks number of contracts Selling amount Buying amount contract rates
KB Bank 10 USD 16,026,000 KRW 1074.80 ~ 1084.60
Korea Development Bank 57 USD 54,104,178 KRW 1073.63 ~ 1115.19
Shinhan Bank 1 USD 1,575,000 KRW 1,079
Korea Exchange Bank 65 USD 79,208,403 USD 17,350,000 KRW 1072.35 ~ 1173.50
Woori Bank 10 USD 8,691,188 KRW 1073.70 ~ 1114.90
Hana Bank 16 USD 16,590,762 KRW 1071.85 ~ 1089.00
BARCLAYS 5 USD 4,267,800 USD 3,592,800 KRW 1086.00 ~ 1095.45
Bank of America 5 USD 9,879,030 USD 5,953,500 KRW 1075.08 ~ 1095.70
Credit Agricole 4 USD 12,533,604 KRW 1073.10 ~ 1075.07
Credit Suisse 10 USD 8,912,250 KRW 1072.10 ~ 1081.60
Deutsche 3 USD 2,959,560 KRW 1086.25 ~ 1093.95
RBS 5 USD 3,809,250 KRW 1075.55 ~ 1082.35
SC Bank 4 USD 5,516,445 KRW 1079.00 ~ 1094.90
Total 195 USD 224,073,470 USD 26,896,300
(7) allowance for restoration losses
1) Reclaiming by-products
The Company reached an agreement in relation to the disposal of its soda ash by-products in the Company-owned reservoir with certain parties,
including the Incheon Metropolitan City government on December 31, 2003, and has started work related to the by-products’ disposal. The
Company has accounted for the estimated cost of this work as an allowance for restoration loss.
In accordance with the agreement with the Incheon Metropolitan City, relating to the construction and development of a public recreation area,
since 2009, the Company recognizes a liability related to its boatyard and others transferred to DCRE Co., Ltd., a subsidiary, for an additional
restoration loss of ₩ 16,509,000 thousand. The definite effect of this obligation is not recorded in the accompanying consolidated financial
statements since this liability cannot be reasonably estimated due to the fact that the method and timing for construction and development of a
public recreation area are not decided.
2) imposing local taxes
In 2008, The Parent spun off The DCRE Co., Ltd. and DCRE Co., Ltd. received registration taxes exemption on the land and buildings that were
acquired through succession, from Incheon Metropolitan City Nam-gu office and Yeonsu-gu office, in accordance with previous Tax Reduction
and Exemption Control of Korea. On April 10, 2012, Incheon Metropolitan City Nam-gu office and Yeonsu-gu office imposed acquisition and
registration taxes of ₩ 172,721 million according to their decision that the Company did not meet exemption requirements. The Company’s
management and the advisory tax firm of the Company are convinced that the spin-off was qualified for registration taxes exemption above and this
taxation will be canceled through tax appeal procedure, and appealed to the Tax Tribunal. On January 22, 2013, Tax Tribunal Court held a meeting
but the decision has not been made until the date of the audit report. The Company recognized liabilities and expenses for imposed acquisition
and registration taxes. The decision by the Court may raise other tax issues on land and buildings in connection with spun off.
(8) Operating lease agreement (Korean won in thousands):
December 31, 2012
Within 1 year ₩ 8,242,864
1 - 5 years 16,891,966
After 5 years 9,703,095
Total ₩ 34,837,925
21. ShaRehOlDeRS’ eQUiTy
(1) capital and capital surplus
The Parent is authorized to issue 100 million shares of common stock with a par value of ₩ 5,000 per share. The changes in capital and capital
surplus for the years ended December 31, 2012 and 2011, are as follows (Korean won in thousands):
2012
common stockadditional
paid-in capital
Other capital
surplusShares capital
Beginning balance ₩ 23,849,371 ₩ 127,246,855 ₩ 734,511,553 ₩ 89,902,521
Paid-in capital increase - - - (1,384,700)
Additional purchase of subsidiaries’ stock - - - (21,883,665)
Others - - 20,971 (222,576)
ending balance ₩ 23,849,371 ₩ 127,246,855 ₩ 734,532,524 ₩ 66,411,580

94
nOTeS TO cOnSOliDaTeD Financial STaTeMenTSFOR ThE yEARS ENDED DECEMBER 31, 2012 AND 2011
OCI ANNUAL REPORT 2012Financial Review 95
nOTeS TO cOnSOliDaTeD Financial STaTeMenTSFOR ThE yEARS ENDED DECEMBER 31, 2012 AND 2011
2011
common stockadditional
paid-in capital
Other capital
surplusShares capital
Beginning balance ₩ 23,121,290 ₩ 121,606,450 ₩ 177,245,356 ₩ 25,535,288
Paid-in capital increase (*1) 1,128,081 5,640,405 557,266,197 -
Retirement of shares (*2) (400,000) - - -
Gains on sale of treasury stock - - - 64,367,233
ending balance ₩ 23,849,371 ₩ 127,246,855 ₩ 734,511,553 ₩ 89,902,521
(*1) The Parent listed GDRs on the Singapore Exchange Securities Trading Ltd. through issuance of new stock and existing treasury stocks. The Parent issued 1,128,081
shares of new common stock at USD 470.18 per share.
(*2) On July 22, 2003, and November 10, 2011, in accordance with Article 189 of the Securities and Exchange Law (currently, the Capital Market and Financial
Investment Business Act), the Parent retired 1,200 thousand shares and 400 thousand shares of treasury stock, which amounted to ₩ 14,444,722 thousand and
₩ 83,241,601 thousand, respectively, through the appropriation of retained earnings.
(2) capital adjustments
Changes in capital adjustments for the years ended December 31, 2012 and 2011 are as follows (Korean won in thousands):
2012
Stock options Other capital adjustments Total
Beginning balance ₩ 13,516 ₩ (23,801) ₩ (10,285)
Others (13,516) 23,801 10,285
ending balance ₩ - ₩ - ₩ -
2011
Treasury stock Stock options
Other capital
adjustments Total
Beginning balance ₩ (94,975,338) ₩ 4,384,420 ₩ - ₩ (90,590,918)
Disposal of treasury stock 94,975,338 - - 94,975,338
Exercise of stock options - (4,370,904) - (4,370,904)
Subsidiary’s capital stock issue costs - - (23,801) (23,801)
ending balance ₩ - ₩ 13,516 ₩ (23,801) ₩ (10,285)
The Parent listed GDRs (Global Depositary Receipts) on the Singapore Exchange Securities Trading Ltd. through issuance of new stock and
existing treasury stock. As a result, the Parent disposed of 360,719 treasury stocks. In addition, for the year end of December 31, 2011, the
Company acquired and retired an additional 400 thousand treasury stocks through the appropriation of retained earnings and has no treasury
stock as of December 31, 2011.
(3) Retained earnings
Details of retained earnings as of December 31, 2012 and 2011 are as follows (Korean won in thousands):
December 31, 2012 December 31, 2011
Legal reserve (*1) ₩ 28,232,395 ₩ 22,985,533
Voluntary earned reserve (*2) 1,884,600,000 1,383,600,000
Revaluation reserve (*3) 415,932,404 415,932,404
Accumulated actuarial loss (59,279,006) (60,540,998)
Unappropriated retained earnings (25,249,830) 602,219,329
Total ₩ 2,244,235,963 ₩ 2,364,196,268
(*1) All legal reserve is earned surplus reserve. Under the Korean Commercial Law, the Company is required to appropriate at least 10% of cash dividends declared
each year to legal reserve, until such reserve equals to 50% of capital stock. This reserve may only be used to offset against future deficit, if any, or may be
transferred to capital stock.
(*2) Part of voluntary earned reserve is a reserve for research and manpower development by the special tax treatment control law, and importation and appropriation of
this reserve follow the provisions of the relevant tax law.
(*3) Revaluation reserve is the sum of ₩ 21,895,743 thousand that existed before January 1, 1982, and ₩ 405,416,941 thousand, the tax balance is from revaluation
of assets on January 1, 1996, excluding ₩ 10,764,215 thousand, which is the amount transferred to capital stock in 1996 and ₩ 616,065 thousand, which is the
reduced balance from revaluation of assets due to assets being sold within a year.
(4) accumulated other comprehensive income (loss)
Details of accumulated other comprehensive income (loss) as of December 31, 2012 and 2011 are as follows (Korean won in thousands):
December 31, 2012 December 31, 2011
Gain on valuation of AFS financial assets ₩ 19,160,865 ₩ 19,739,336
Loss on valuation of derivatives (3,269,936) (211,576)
Translation gain (loss) on overseas operation (12,550,321) 1,521,839
Share of other comprehensive loss of jointly controlled entities and associates (2,884,042) (1,177,117)
Other comprehensive gain (loss) 836,210 (1,070,760)
Total ₩ 1,292,776 ₩ 18,801,722
22. SaleS
(1) Details of sales for the years ended December 31, 2012 and 2011 are as follows (Korean won in thousands):
2012 2011
Sales of merchandise ₩ 262,845,394 ₩ 386,269,544
Sales of finished goods 2,911,771,038 3,844,797,031
Rental income 4,508,274 5,167,950
Outsourcing revenue 34,400,769 31,401,300
Service revenue 4,060,354 7,068,350
Other revenue 2,022,083 3,097,774
Sales discount (1,148,400) (1,930,682)
₩ 3,218,459,512 ₩ 4,275,871,267
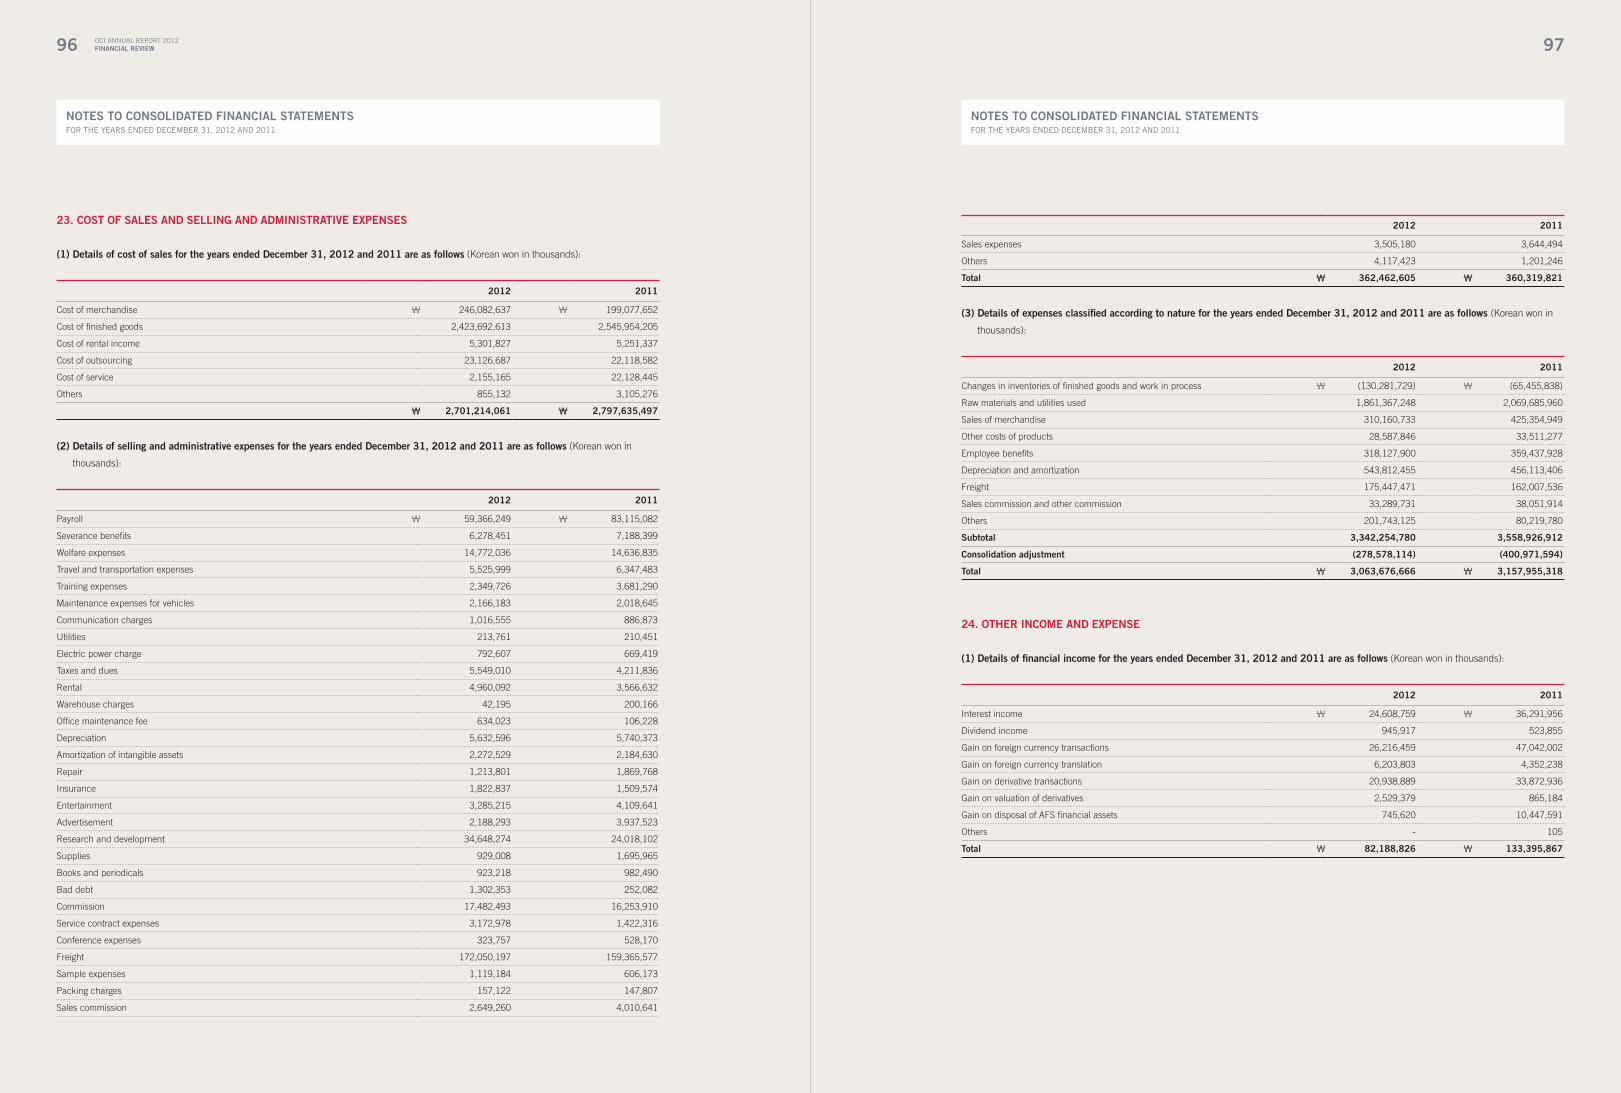
96
nOTeS TO cOnSOliDaTeD Financial STaTeMenTSFOR ThE yEARS ENDED DECEMBER 31, 2012 AND 2011
OCI ANNUAL REPORT 2012Financial Review 97
nOTeS TO cOnSOliDaTeD Financial STaTeMenTSFOR ThE yEARS ENDED DECEMBER 31, 2012 AND 2011
23. cOST OF SaleS anD SellinG anD aDMiniSTRaTive eXPenSeS
(1) Details of cost of sales for the years ended December 31, 2012 and 2011 are as follows (Korean won in thousands):
2012 2011
Cost of merchandise ₩ 246,082,637 ₩ 199,077,652
Cost of finished goods 2,423,692,613 2,545,954,205
Cost of rental income 5,301,827 5,251,337
Cost of outsourcing 23,126,687 22,118,582
Cost of service 2,155,165 22,128,445
Others 855,132 3,105,276
₩ 2,701,214,061 ₩ 2,797,635,497
(2) Details of selling and administrative expenses for the years ended December 31, 2012 and 2011 are as follows (Korean won in
thousands):
2012 2011
Payroll ₩ 59,366,249 ₩ 83,115,082
Severance benefits 6,278,451 7,188,399
Welfare expenses 14,772,036 14,636,835
Travel and transportation expenses 5,525,999 6,347,483
Training expenses 2,349,726 3,681,290
Maintenance expenses for vehicles 2,166,183 2,018,645
Communication charges 1,016,555 886,873
Utilities 213,761 210,451
Electric power charge 792,607 669,419
Taxes and dues 5,549,010 4,211,836
Rental 4,960,092 3,566,632
Warehouse charges 42,195 200,166
Office maintenance fee 634,023 106,228
Depreciation 5,632,596 5,740,373
Amortization of intangible assets 2,272,529 2,184,630
Repair 1,213,801 1,869,768
Insurance 1,822,837 1,509,574
Entertainment 3,285,215 4,109,641
Advertisement 2,188,293 3,937,523
Research and development 34,648,274 24,018,102
Supplies 929,008 1,695,965
Books and periodicals 923,218 982,490
Bad debt 1,302,353 252,082
Commission 17,482,493 16,253,910
Service contract expenses 3,172,978 1,422,316
Conference expenses 323,757 528,170
Freight 172,050,197 159,365,577
Sample expenses 1,119,184 606,173
Packing charges 157,122 147,807
Sales commission 2,649,260 4,010,641
2012 2011
Sales expenses 3,505,180 3,644,494
Others 4,117,423 1,201,246
Total ₩ 362,462,605 ₩ 360,319,821
(3) Details of expenses classified according to nature for the years ended December 31, 2012 and 2011 are as follows (Korean won in
thousands):
2012 2011
Changes in inventories of finished goods and work in process ₩ (130,281,729) ₩ (65,455,838)
Raw materials and utilities used 1,861,367,248 2,069,685,960
Sales of merchandise 310,160,733 425,354,949
Other costs of products 28,587,846 33,511,277
Employee benefits 318,127,900 359,437,928
Depreciation and amortization 543,812,455 456,113,406
Freight 175,447,471 162,007,536
Sales commission and other commission 33,289,731 38,051,914
Others 201,743,125 80,219,780
Subtotal 3,342,254,780 3,558,926,912
consolidation adjustment (278,578,114) (400,971,594)
Total ₩ 3,063,676,666 ₩ 3,157,955,318
24. OTheR incOMe anD eXPenSe
(1) Details of financial income for the years ended December 31, 2012 and 2011 are as follows (Korean won in thousands):
2012 2011
Interest income ₩ 24,608,759 ₩ 36,291,956
Dividend income 945,917 523,855
Gain on foreign currency transactions 26,216,459 47,042,002
Gain on foreign currency translation 6,203,803 4,352,238
Gain on derivative transactions 20,938,889 33,872,936
Gain on valuation of derivatives 2,529,379 865,184
Gain on disposal of AFS financial assets 745,620 10,447,591
Others - 105
Total ₩ 82,188,826 ₩ 133,395,867

98
nOTeS TO cOnSOliDaTeD Financial STaTeMenTSFOR ThE yEARS ENDED DECEMBER 31, 2012 AND 2011
OCI ANNUAL REPORT 2012Financial Review 99
nOTeS TO cOnSOliDaTeD Financial STaTeMenTSFOR ThE yEARS ENDED DECEMBER 31, 2012 AND 2011
(2) Details of financial expense for the years ended December 31, 2012 and 2011 are as follows (Korean won in thousands):
2012 2011
Interest expense ₩ 83,279,795 ₩ 73,082,357
Loss on foreign currency transactions 37,895,506 54,952,086
Loss on foreign currency translation 14,034,013 3,432,143
Loss on derivative transactions 8,209,914 27,349,489
Loss on valuation of derivatives 1,182,947 1,088,337
AFS financial assets impairment loss 177,402 48,864,082
Others 558,033 574,780
Total ₩ 145,337,610 ₩ 209,343,274
(3) Details of other non-operating income for the years ended December 31, 2012 and 2011 are as follows (Korean won in thousands):
2012 2011
Commission income ₩ - ₩ 619,523
Reversal of allowance for bad debts 28,365 100,480
Gain on disposal of property, plant and equipment 9,558,245 541,960
Gain from assets contributed 5,543,502 -
Gain from liabilities exempted - 6,596,838
Gain from contract cancellation (*1) 130,754,607 -
Others 19,816,767 10,425,914
Total ₩ 165,701,486 ₩ 18,284,715
(*1) As the Parent’s certain customers have canceled long-term polysilicon supply contracts, there is no obligation to return the related long-term advances received.
The Parent recognized them as gain from liabilities exempted.
(4) Details of other non-operating expense for the years ended December 31, 2012 and 2011 are as follows (Korean won in thousands):
2012 2011
Other bad debt expense ₩ 3,718,821 ₩ 2,225,642
Loss on valuation of inventories 102,490 377,807
Loss on impairment of property, plant and equipment 29,125,373 1,467,060
Loss on impairment of intangible assets 2,995,433 -
Loss on disposal of property, plant and equipment 7,925,434 6,592,415
Loss on disposal of intangible assets 33,241 707,372
Donations 3,117,351 8,912,257
Loss on disposal of investment in subsidiary 493,450 -
Loss on disposal of investment properties 10,938 -
Additional provisions 11,082,000 4,780,000
Imposing local taxes (see to Note 20) 177,145,744 -
Others 11,655,984 3,198,804
Total ₩ 247,406,259 ₩ 28,261,357
25. incOMe TaX eXPenSe anD DeFeRReD TaX aSSeTS (liaBiliTieS)
(1) composition of income tax expense for the years ended December 31, 2012 and 2011 are as follows (Korean won in thousands):
2012 2011
Current income tax payable ₩ 40,542,974 ₩ 194,563,579
Current income tax adjustment 2,525,733 (660,895)
Changes in deferred tax assets (liabilities) (43,805,441) 3,674,520
Tax effect related to the changes in equity 6,866,149 (18,993,433)
income tax expense ₩ 6,129,415 ₩ 178,583,772
(2) a reconciliation between income before income tax and income tax expense of the company are as follows (Korean won in thousands):
2012 2011
Income before income tax expense ₩ 18,838,605 ₩ 1,043,322,075
Tax expense calculated on book income (*1) 16,724,687 249,046,162
Adjustments:
Non-taxable income (3,714,612) (15,594,038)
Non-deductible expense 9,471,484 23,517,839
Refund (additional) of income tax (14,135,105) (76,984,090)
Changes in the assets or liabilities relating to deferred taxes and tax rate (4,051,517) 8,888,170
Others 1,834,478 (10,290,271)
income tax expense ₩ 6,129,415 ₩ 178,583,772
(*1) Sum of tax amounts by the Parent and subsidiaries, according to the applicable tax rates
(3) income tax directly reflected in equity as of December 31, 2012 and 2011 are as follows (Korean won in thousands):
December 31, 2012 December 31, 2011
Capital Adjustment
Gain on disposal of treasury stock ₩ - ₩ (20,583,424)
Capital Surplus
Capital surplus-others 7,971,528 -
Other comprehensive income (loss)
Gain (loss) on valuation of AFS financial assets 184,683 (9,052,460)
Loss on valuation of derivatives 923,522 -
Retained earnings
Actuarial gain (defined benefit obligation) (2,330,536) 10,860,150
Actuarial gain (plan assets) 116,952 (217,699)
income tax directly adjusted in capital ₩ 6,866,149 ₩ (18,993,433)
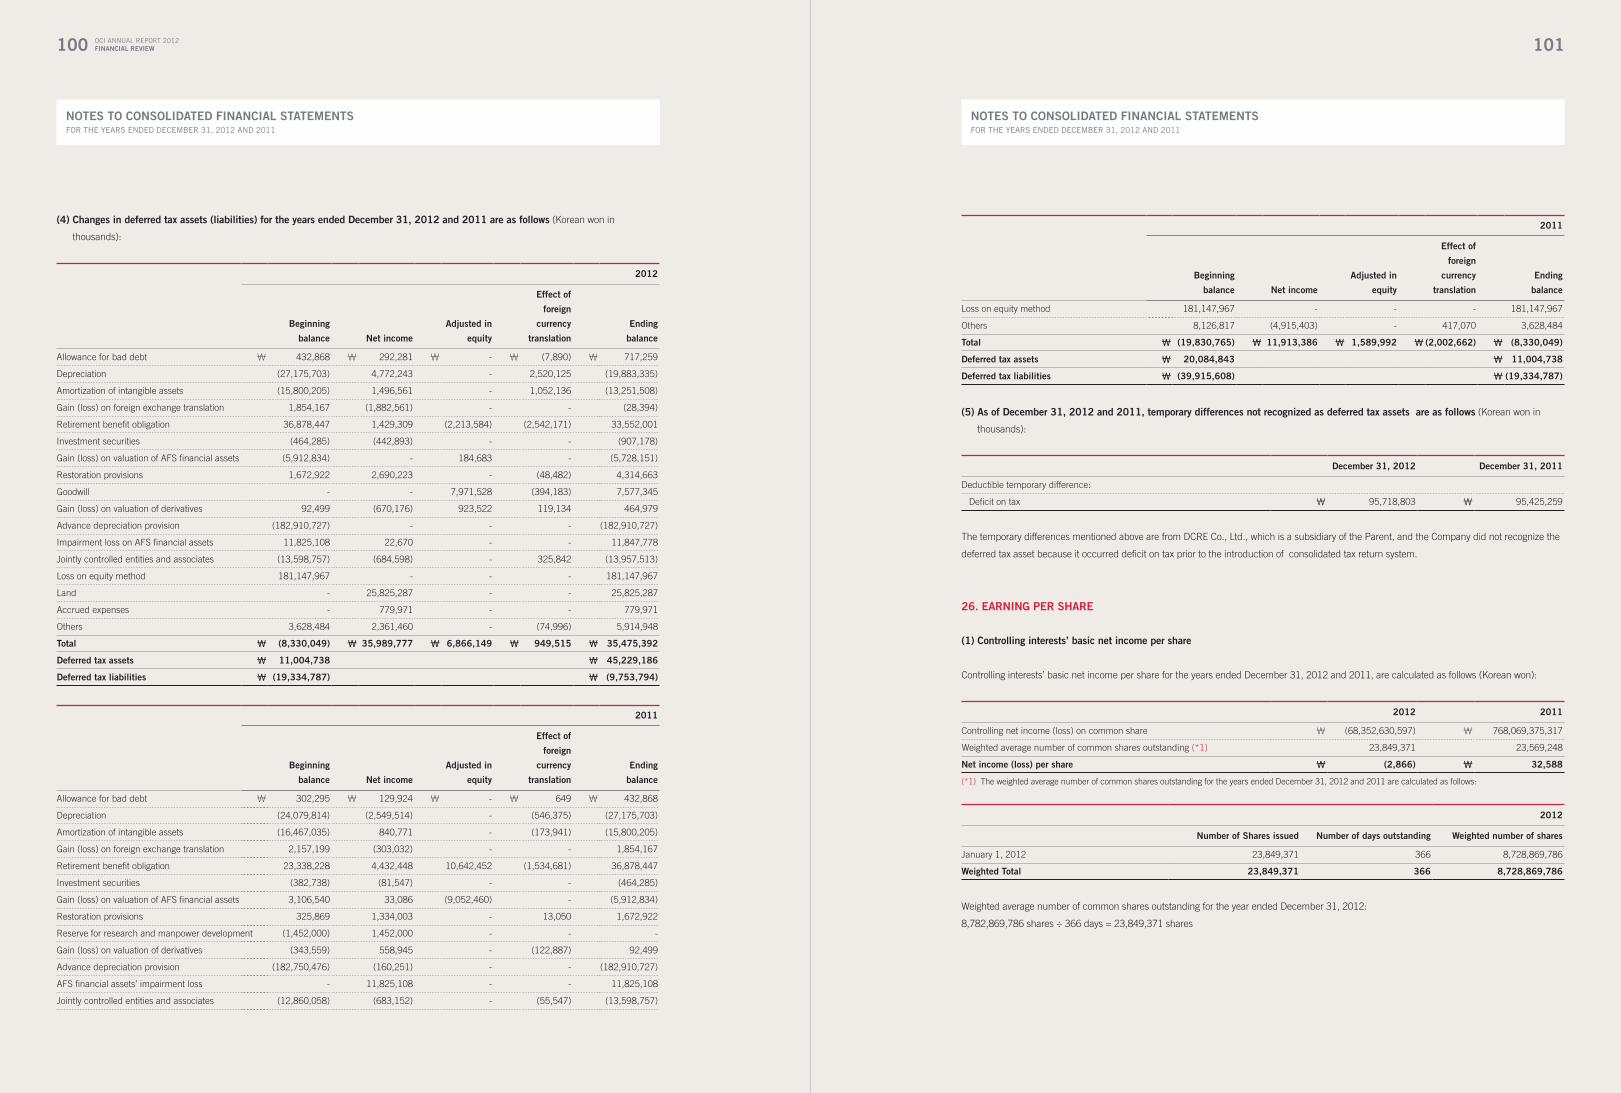
100
nOTeS TO cOnSOliDaTeD Financial STaTeMenTSFOR ThE yEARS ENDED DECEMBER 31, 2012 AND 2011
OCI ANNUAL REPORT 2012Financial Review 101
nOTeS TO cOnSOliDaTeD Financial STaTeMenTSFOR ThE yEARS ENDED DECEMBER 31, 2012 AND 2011
(4) changes in deferred tax assets (liabilities) for the years ended December 31, 2012 and 2011 are as follows (Korean won in
thousands):
2012
Beginning
balance net income
adjusted in
equity
effect of
foreign
currency
translation
ending
balance
Allowance for bad debt ₩ 432,868 ₩ 292,281 ₩ - ₩ (7,890) ₩ 717,259
Depreciation (27,175,703) 4,772,243 - 2,520,125 (19,883,335)
Amortization of intangible assets (15,800,205) 1,496,561 - 1,052,136 (13,251,508)
Gain (loss) on foreign exchange translation 1,854,167 (1,882,561) - - (28,394)
Retirement benefit obligation 36,878,447 1,429,309 (2,213,584) (2,542,171) 33,552,001
Investment securities (464,285) (442,893) - - (907,178)
Gain (loss) on valuation of AFS financial assets (5,912,834) - 184,683 - (5,728,151)
Restoration provisions 1,672,922 2,690,223 - (48,482) 4,314,663
Goodwill - - 7,971,528 (394,183) 7,577,345
Gain (loss) on valuation of derivatives 92,499 (670,176) 923,522 119,134 464,979
Advance depreciation provision (182,910,727) - - - (182,910,727)
Impairment loss on AFS financial assets 11,825,108 22,670 - - 11,847,778
Jointly controlled entities and associates (13,598,757) (684,598) - 325,842 (13,957,513)
Loss on equity method 181,147,967 - - - 181,147,967
Land - 25,825,287 - - 25,825,287
Accrued expenses - 779,971 - - 779,971
Others 3,628,484 2,361,460 - (74,996) 5,914,948
Total ₩ (8,330,049) ₩ 35,989,777 ₩ 6,866,149 ₩ 949,515 ₩ 35,475,392
Deferred tax assets ₩ 11,004,738 ₩ 45,229,186
Deferred tax liabilities ₩ (19,334,787) ₩ (9,753,794)
2011
Beginning
balance net income
adjusted in
equity
effect of
foreign
currency
translation
ending
balance
Allowance for bad debt ₩ 302,295 ₩ 129,924 ₩ - ₩ 649 ₩ 432,868
Depreciation (24,079,814) (2,549,514) - (546,375) (27,175,703)
Amortization of intangible assets (16,467,035) 840,771 - (173,941) (15,800,205)
Gain (loss) on foreign exchange translation 2,157,199 (303,032) - - 1,854,167
Retirement benefit obligation 23,338,228 4,432,448 10,642,452 (1,534,681) 36,878,447
Investment securities (382,738) (81,547) - - (464,285)
Gain (loss) on valuation of AFS financial assets 3,106,540 33,086 (9,052,460) - (5,912,834)
Restoration provisions 325,869 1,334,003 - 13,050 1,672,922
Reserve for research and manpower development (1,452,000) 1,452,000 - - -
Gain (loss) on valuation of derivatives (343,559) 558,945 - (122,887) 92,499
Advance depreciation provision (182,750,476) (160,251) - - (182,910,727)
AFS financial assets’ impairment loss - 11,825,108 - - 11,825,108
Jointly controlled entities and associates (12,860,058) (683,152) - (55,547) (13,598,757)
2011
Beginning
balance net income
adjusted in
equity
effect of
foreign
currency
translation
ending
balance
Loss on equity method 181,147,967 - - - 181,147,967
Others 8,126,817 (4,915,403) - 417,070 3,628,484
Total ₩ (19,830,765) ₩ 11,913,386 ₩ 1,589,992 ₩ (2,002,662) ₩ (8,330,049)
Deferred tax assets ₩ 20,084,843 ₩ 11,004,738
Deferred tax liabilities ₩ (39,915,608) ₩ (19,334,787)
(5) as of December 31, 2012 and 2011, temporary differences not recognized as deferred tax assets are as follows (Korean won in
thousands):
December 31, 2012 December 31, 2011
Deductible temporary difference:
Deficit on tax ₩ 95,718,803 ₩ 95,425,259
The temporary differences mentioned above are from DCRE Co., Ltd., which is a subsidiary of the Parent, and the Company did not recognize the
deferred tax asset because it occurred deficit on tax prior to the introduction of consolidated tax return system.
26. eaRninG PeR ShaRe
(1) controlling interests’ basic net income per share
Controlling interests’ basic net income per share for the years ended December 31, 2012 and 2011, are calculated as follows (Korean won):
2012 2011
Controlling net income (loss) on common share ₩ (68,352,630,597) ₩ 768,069,375,317
Weighted average number of common shares outstanding (*1) 23,849,371 23,569,248
net income (loss) per share ₩ (2,866) ₩ 32,588
(*1) The weighted average number of common shares outstanding for the years ended December 31, 2012 and 2011 are calculated as follows:
2012
number of Shares issued number of days outstanding weighted number of shares
January 1, 2012 23,849,371 366 8,728,869,786
weighted Total 23,849,371 366 8,728,869,786
Weighted average number of common shares outstanding for the year ended December 31, 2012:
8,782,869,786 shares ÷ 366 days = 23,849,371 shares
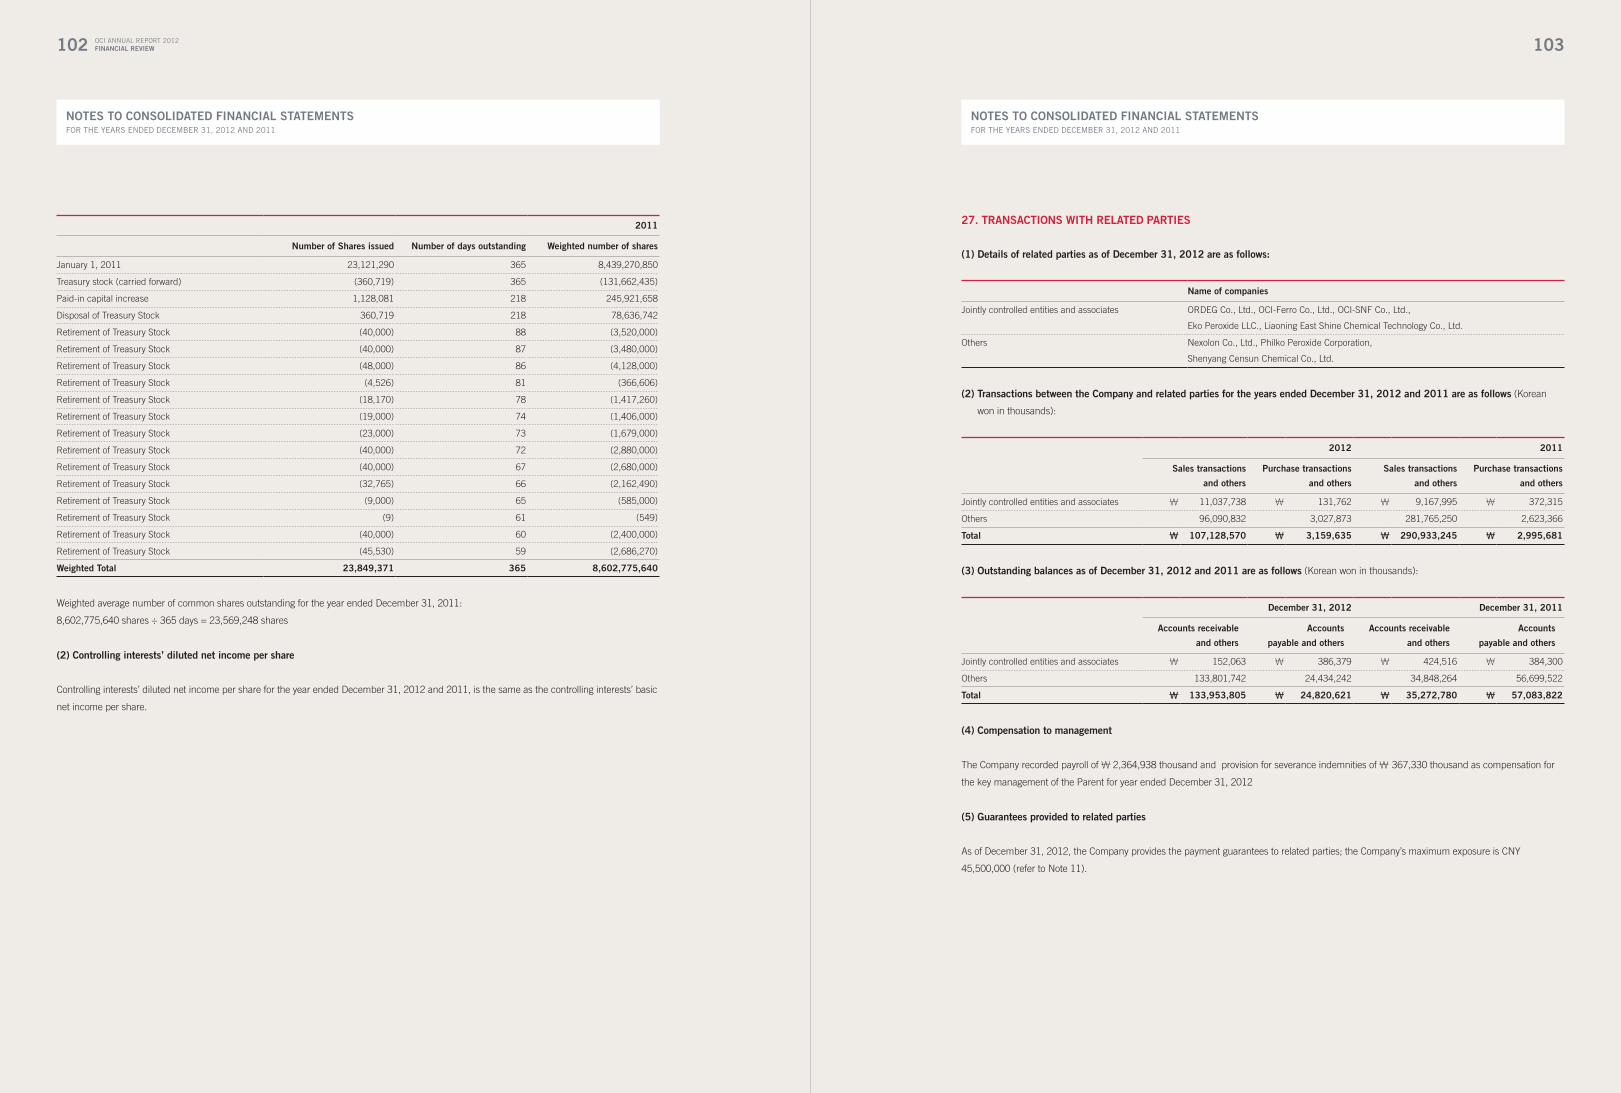
102
nOTeS TO cOnSOliDaTeD Financial STaTeMenTSFOR ThE yEARS ENDED DECEMBER 31, 2012 AND 2011
OCI ANNUAL REPORT 2012Financial Review 103
nOTeS TO cOnSOliDaTeD Financial STaTeMenTSFOR ThE yEARS ENDED DECEMBER 31, 2012 AND 2011
2011
number of Shares issued number of days outstanding weighted number of shares
January 1, 2011 23,121,290 365 8,439,270,850
Treasury stock (carried forward) (360,719) 365 (131,662,435)
Paid-in capital increase 1,128,081 218 245,921,658
Disposal of Treasury Stock 360,719 218 78,636,742
Retirement of Treasury Stock (40,000) 88 (3,520,000)
Retirement of Treasury Stock (40,000) 87 (3,480,000)
Retirement of Treasury Stock (48,000) 86 (4,128,000)
Retirement of Treasury Stock (4,526) 81 (366,606)
Retirement of Treasury Stock (18,170) 78 (1,417,260)
Retirement of Treasury Stock (19,000) 74 (1,406,000)
Retirement of Treasury Stock (23,000) 73 (1,679,000)
Retirement of Treasury Stock (40,000) 72 (2,880,000)
Retirement of Treasury Stock (40,000) 67 (2,680,000)
Retirement of Treasury Stock (32,765) 66 (2,162,490)
Retirement of Treasury Stock (9,000) 65 (585,000)
Retirement of Treasury Stock (9) 61 (549)
Retirement of Treasury Stock (40,000) 60 (2,400,000)
Retirement of Treasury Stock (45,530) 59 (2,686,270)
weighted Total 23,849,371 365 8,602,775,640
Weighted average number of common shares outstanding for the year ended December 31, 2011:
8,602,775,640 shares ÷ 365 days = 23,569,248 shares
(2) controlling interests’ diluted net income per share
Controlling interests’ diluted net income per share for the year ended December 31, 2012 and 2011, is the same as the controlling interests’ basic
net income per share.
27. TRanSacTiOnS wiTh RelaTeD PaRTieS
(1) Details of related parties as of December 31, 2012 are as follows:
name of companies
Jointly controlled entities and associates ORDEG Co., Ltd., OCI-Ferro Co., Ltd., OCI-SNF Co., Ltd.,
Eko Peroxide LLC., Liaoning East Shine Chemical Technology Co., Ltd.
Others Nexolon Co., Ltd., Philko Peroxide Corporation,
Shenyang Censun Chemical Co., Ltd.
(2) Transactions between the company and related parties for the years ended December 31, 2012 and 2011 are as follows (Korean
won in thousands):
2012 2011
Sales transactions
and others
Purchase transactions
and others
Sales transactions
and others
Purchase transactions
and others
Jointly controlled entities and associates ₩ 11,037,738 ₩ 131,762 ₩ 9,167,995 ₩ 372,315
Others 96,090,832 3,027,873 281,765,250 2,623,366
Total ₩ 107,128,570 ₩ 3,159,635 ₩ 290,933,245 ₩ 2,995,681
(3) Outstanding balances as of December 31, 2012 and 2011 are as follows (Korean won in thousands):
December 31, 2012 December 31, 2011
accounts receivable
and others
accounts
payable and others
accounts receivable
and others
accounts
payable and others
Jointly controlled entities and associates ₩ 152,063 ₩ 386,379 ₩ 424,516 ₩ 384,300
Others 133,801,742 24,434,242 34,848,264 56,699,522
Total ₩ 133,953,805 ₩ 24,820,621 ₩ 35,272,780 ₩ 57,083,822
(4) compensation to management
The Company recorded payroll of ₩ 2,364,938 thousand and provision for severance indemnities of ₩ 367,330 thousand as compensation for
the key management of the Parent for year ended December 31, 2012
(5) Guarantees provided to related parties
As of December 31, 2012, the Company provides the payment guarantees to related parties; the Company’s maximum exposure is CNY
45,500,000 (refer to Note 11).

104
nOTeS TO cOnSOliDaTeD Financial STaTeMenTSFOR ThE yEARS ENDED DECEMBER 31, 2012 AND 2011
OCI ANNUAL REPORT 2012Financial Review 105
nOTeS TO cOnSOliDaTeD Financial STaTeMenTSFOR ThE yEARS ENDED DECEMBER 31, 2012 AND 2011
28. Financial inSTRUMenTS
(1) categories of financial instruments as of December 31, 2012 and 2011, are as follows (Korean won in thousands):
account December 31, 2012 December 31, 2011
Cash and cash equivalents Cash and cash equivalents ₩ 446,291,655 ₩ 390,191,268
Financial assets at FVTPL Derivative assets 2,529,379 951,923
Loans and receivables Short-term financial instruments 325,436,900 458,239,963
Trade and other accounts receivable 624,776,508 614,566,769
Long-term financial instruments 19,000 35,045
Non-current trade and other accounts receivable 9,994,293 6,944,535
HTM investments Short-term financial instruments 883,905 526,770
Long-term financial instruments 3,264,755 3,912,215
AFS financial assets Short-term financial instruments 961,056 -
Long-term financial instruments 57,277,527 56,086,805
Total ₩ 1,471,434,978 ₩ 1,531,455,293
Financial liabilities at FVTPL Current derivatives ₩ 5,334,009 ₩ 1,804,886
Non-current derivatives 365,494 -
Amortized cost liabilities Short-term financial liabilities 396,595,274 641,955,041
Trade and other accounts payable 535,826,011 663,807,318
Long-term financial liabilities 1,796,307,316 860,944,362
Non-current trade and other accounts payable 32,704,414 31,208,656
Total ₩ 2,767,132,518 ₩ 2,199,720,263
(2) Fair values of financial instruments as of December 31, 2012 and 2011 are as follows (Korean won in thousands):
December 31, 2012 December 31, 2011
carrying amounts Fair value carrying amounts Fair value
FINANCIAL ASSETS:
Cash and cash equivalents ₩ 446,291,655 ₩ 446,291,655 ₩ 390,191,268 ₩ 390,191,268
Short-term financial assets 327,281,861 327,281,861 458,766,733 458,766,733
Trade and other accounts receivable 624,776,508 624,776,508 614,566,769 614,566,769
Derivative assets 2,529,379 2,529,379 951,923 951,923
Long-term financial assets 60,561,282 60,561,282 60,034,065 60,034,065
Long-term trade and other accounts receivable 9,994,293 9,994,293 6,944,535 6,944,535
Total ₩ 1,471,434,978 ₩ 1,471,434,978 ₩ 1,531,455,293 ₩ 1,531,455,293
FINANCIAL LIABILITIES:
Short-term financial liabilities ₩ 396,595,274 ₩ 396,595,274 ₩ 641,955,041 ₩ 641,955,041
Trade and other accounts payable 535,826,011 535,826,011 663,807,318 663,807,318
Current derivative liabilities 5,334,009 5,334,009 1,804,886 1,804,886
Long-term financial liabilities 1,796,307,316 1,796,307,316 860,944,362 860,944,362
Non-current trade and other accounts payable 32,704,414 32,704,414 31,208,656 31,208,656
Non-current Derivative liabilities 365,494 365,494 - -
Total ₩ 2,767,132,518 ₩ 2,767,132,518 ₩ 2,199,720,263 ₩ 2,199,720,263
(3) Restricted bank financials as of December 31, 2012 and 2011 are as follows (Korean won in thousands):
December 31, 2012 December 31, 2011 Restriction
Long-term financial assets ₩ 19,000 ₩ 19,000 Checking accounts
Cash and cash equivalents ₩ 36,124,537 ₩ - CPS Energy Agreement
(4) Financial income and expense
1) Financial income and expense for the years ended December 31, 2012 and 2011 are as follows (Korean won in thousands):
2012 2011
FINANCIAL INCOME:
Interest income ₩ 24,608,759 ₩ 36,291,956
Dividend income 945,917 523,855
Gain on foreign currency transactions 26,216,459 47,042,002
Gain on foreign currency translation 6,203,802 4,352,238
Gain on transaction of derivatives 20,938,890 33,872,936
Gain on valuation of derivatives 2,529,379 865,184
Gain on disposal of AFS financial assets 745,620 10,447,591
Others - 105
Subtotal ₩ 82,188,826 ₩ 133,395,867
FINANCIAL EXPENSE:
Interest expense ₩ (84,911,571) ₩ (78,783,818)
Deduction of interest expense
Capitalized financial expenses 1,631,776 5,701,461
Loss on foreign currency transactions (37,895,506) (54,952,086)
Loss on foreign currency translation (14,034,013) (3,432,143)
Loss on transactions of derivatives (8,209,914) (27,349,489)
Loss on valuation of derivatives (1,182,947) (1,088,337)
AFS financial assets impairment loss (177,402) (48,864,082)
Others (558,033) (574,780)
Subtotal ₩ (145,337,610) ₩ (209,343,274)
Total ₩ (63,148,784) ₩ (75,947,407)
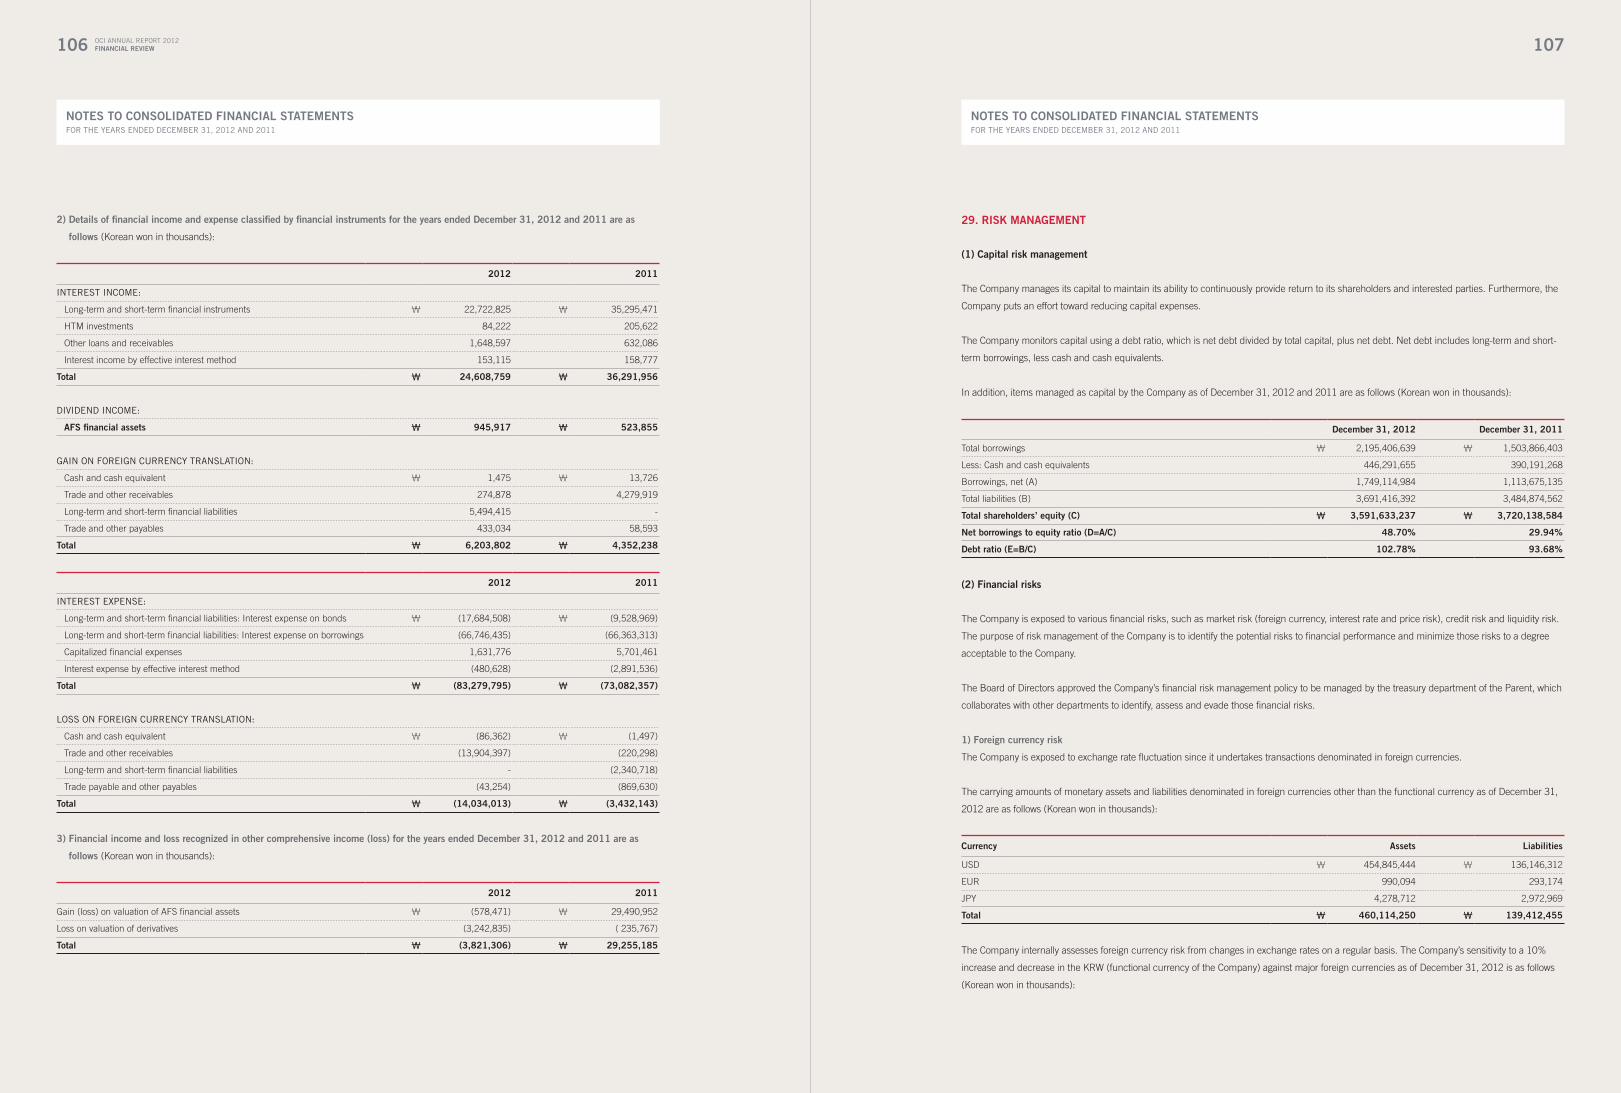
106
nOTeS TO cOnSOliDaTeD Financial STaTeMenTSFOR ThE yEARS ENDED DECEMBER 31, 2012 AND 2011
OCI ANNUAL REPORT 2012Financial Review 107
nOTeS TO cOnSOliDaTeD Financial STaTeMenTSFOR ThE yEARS ENDED DECEMBER 31, 2012 AND 2011
2) Details of financial income and expense classified by financial instruments for the years ended December 31, 2012 and 2011 are as
follows (Korean won in thousands):
2012 2011
INTEREST INCOME:
Long-term and short-term financial instruments ₩ 22,722,825 ₩ 35,295,471
HTM investments 84,222 205,622
Other loans and receivables 1,648,597 632,086
Interest income by effective interest method 153,115 158,777
Total ₩ 24,608,759 ₩ 36,291,956
DIVIDEND INCOME:
aFS financial assets ₩ 945,917 ₩ 523,855
gAIN ON FOREIgN CURRENCy TRANSLATION:
Cash and cash equivalent ₩ 1,475 ₩ 13,726
Trade and other receivables 274,878 4,279,919
Long-term and short-term financial liabilities 5,494,415 -
Trade and other payables 433,034 58,593
Total ₩ 6,203,802 ₩ 4,352,238
2012 2011
INTEREST EXPENSE:
Long-term and short-term financial liabilities: Interest expense on bonds ₩ (17,684,508) ₩ (9,528,969)
Long-term and short-term financial liabilities: Interest expense on borrowings (66,746,435) (66,363,313)
Capitalized financial expenses 1,631,776 5,701,461
Interest expense by effective interest method (480,628) (2,891,536)
Total ₩ (83,279,795) ₩ (73,082,357)
LOSS ON FOREIgN CURRENCy TRANSLATION:
Cash and cash equivalent ₩ (86,362) ₩ (1,497)
Trade and other receivables (13,904,397) (220,298)
Long-term and short-term financial liabilities - (2,340,718)
Trade payable and other payables (43,254) (869,630)
Total ₩ (14,034,013) ₩ (3,432,143)
3) Financial income and loss recognized in other comprehensive income (loss) for the years ended December 31, 2012 and 2011 are as
follows (Korean won in thousands):
2012 2011
Gain (loss) on valuation of AFS financial assets ₩ (578,471) ₩ 29,490,952
Loss on valuation of derivatives (3,242,835) ( 235,767)
Total ₩ (3,821,306) ₩ 29,255,185
29. RiSK ManaGeMenT
(1) capital risk management
The Company manages its capital to maintain its ability to continuously provide return to its shareholders and interested parties. Furthermore, the
Company puts an effort toward reducing capital expenses.
The Company monitors capital using a debt ratio, which is net debt divided by total capital, plus net debt. Net debt includes long-term and short-
term borrowings, less cash and cash equivalents.
In addition, items managed as capital by the Company as of December 31, 2012 and 2011 are as follows (Korean won in thousands):
December 31, 2012 December 31, 2011
Total borrowings ₩ 2,195,406,639 ₩ 1,503,866,403
Less: Cash and cash equivalents 446,291,655 390,191,268
Borrowings, net (A) 1,749,114,984 1,113,675,135
Total liabilities (B) 3,691,416,392 3,484,874,562
Total shareholders’ equity (c) ₩ 3,591,633,237 ₩ 3,720,138,584
net borrowings to equity ratio (D=a/c) 48.70% 29.94%
Debt ratio (e=B/c) 102.78% 93.68%
(2) Financial risks
The Company is exposed to various financial risks, such as market risk (foreign currency, interest rate and price risk), credit risk and liquidity risk.
The purpose of risk management of the Company is to identify the potential risks to financial performance and minimize those risks to a degree
acceptable to the Company.
The Board of Directors approved the Company’s financial risk management policy to be managed by the treasury department of the Parent, which
collaborates with other departments to identify, assess and evade those financial risks.
1) Foreign currency risk
The Company is exposed to exchange rate fluctuation since it undertakes transactions denominated in foreign currencies.
The carrying amounts of monetary assets and liabilities denominated in foreign currencies other than the functional currency as of December 31,
2012 are as follows (Korean won in thousands):
currency assets liabilities
USD ₩ 454,845,444 ₩ 136,146,312
EUR 990,094 293,174
JPY 4,278,712 2,972,969
Total ₩ 460,114,250 ₩ 139,412,455
The Company internally assesses foreign currency risk from changes in exchange rates on a regular basis. The Company’s sensitivity to a 10%
increase and decrease in the KRW (functional currency of the Company) against major foreign currencies as of December 31, 2012 is as follows
(Korean won in thousands):
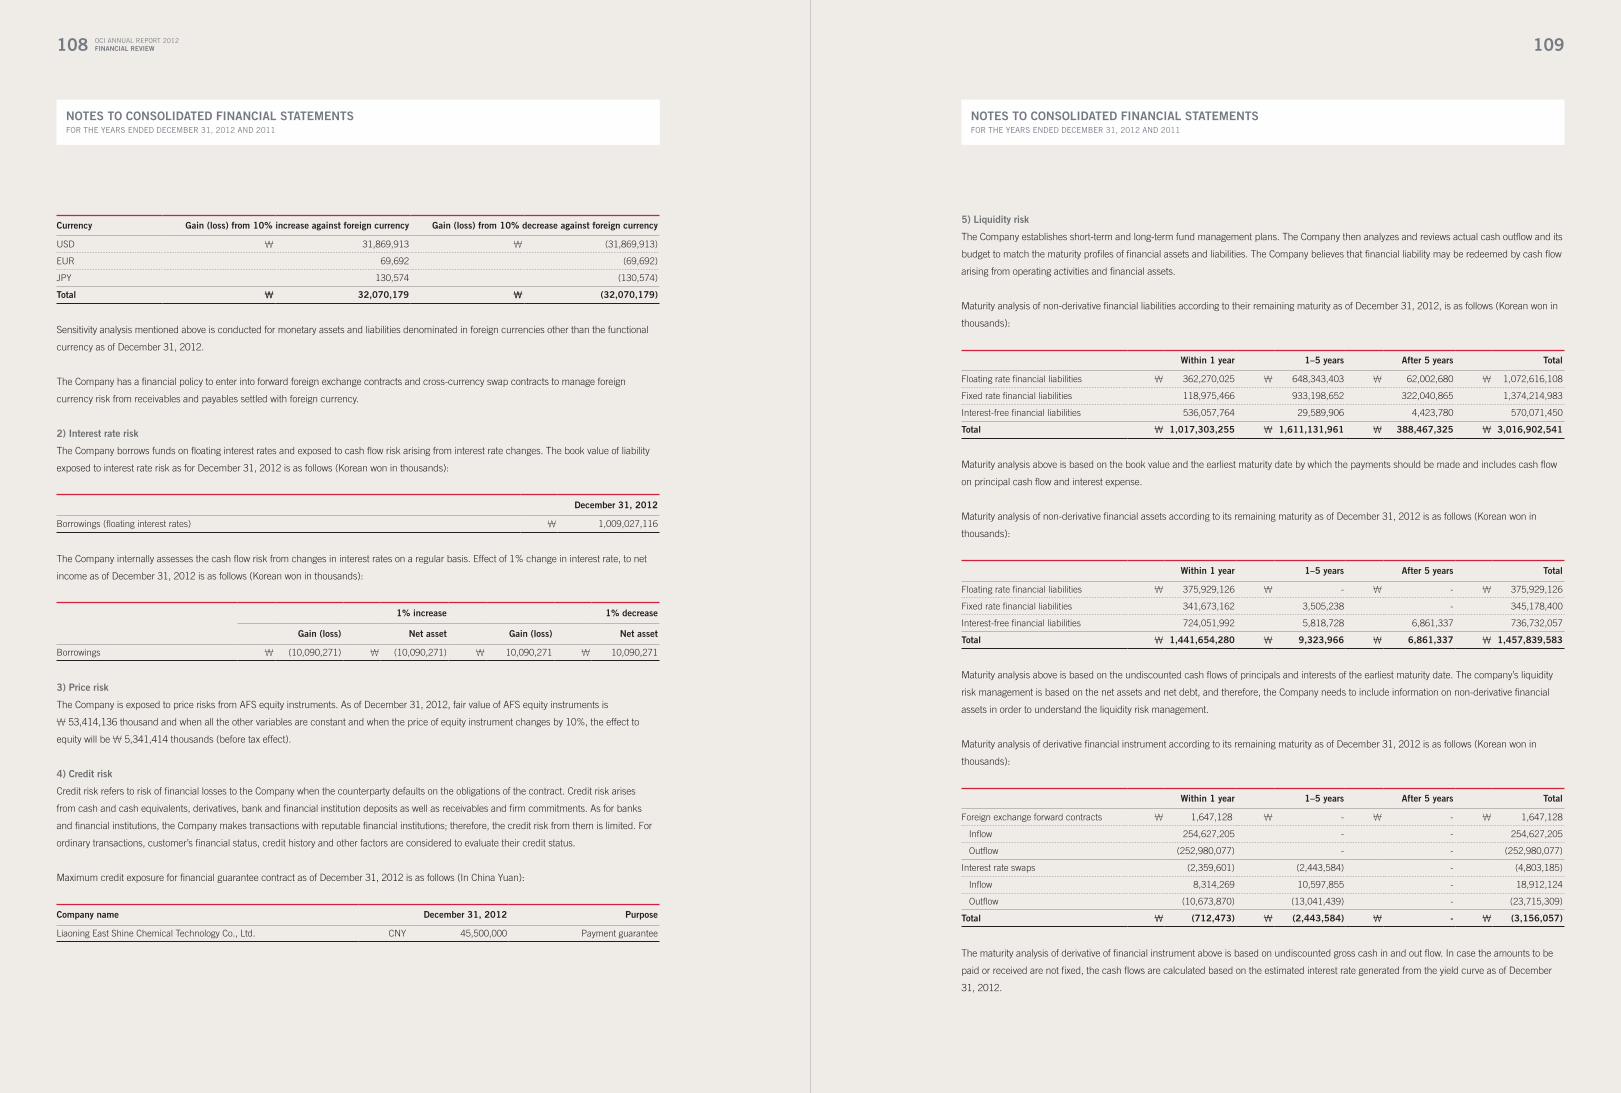
108
nOTeS TO cOnSOliDaTeD Financial STaTeMenTSFOR ThE yEARS ENDED DECEMBER 31, 2012 AND 2011
OCI ANNUAL REPORT 2012Financial Review 109
nOTeS TO cOnSOliDaTeD Financial STaTeMenTSFOR ThE yEARS ENDED DECEMBER 31, 2012 AND 2011
currency Gain (loss) from 10% increase against foreign currency Gain (loss) from 10% decrease against foreign currency
USD ₩ 31,869,913 ₩ (31,869,913)
EUR 69,692 (69,692)
JPY 130,574 (130,574)
Total ₩ 32,070,179 ₩ (32,070,179)
Sensitivity analysis mentioned above is conducted for monetary assets and liabilities denominated in foreign currencies other than the functional
currency as of December 31, 2012.
The Company has a financial policy to enter into forward foreign exchange contracts and cross-currency swap contracts to manage foreign
currency risk from receivables and payables settled with foreign currency.
2) interest rate risk
The Company borrows funds on floating interest rates and exposed to cash flow risk arising from interest rate changes. The book value of liability
exposed to interest rate risk as for December 31, 2012 is as follows (Korean won in thousands):
December 31, 2012
Borrowings (floating interest rates) ₩ 1,009,027,116
The Company internally assesses the cash flow risk from changes in interest rates on a regular basis. Effect of 1% change in interest rate, to net
income as of December 31, 2012 is as follows (Korean won in thousands):
1% increase 1% decrease
Gain (loss) net asset Gain (loss) net asset
Borrowings ₩ (10,090,271) ₩ (10,090,271) ₩ 10,090,271 ₩ 10,090,271
3) Price risk
The Company is exposed to price risks from AFS equity instruments. As of December 31, 2012, fair value of AFS equity instruments is
₩ 53,414,136 thousand and when all the other variables are constant and when the price of equity instrument changes by 10%, the effect to
equity will be ₩ 5,341,414 thousands (before tax effect).
4) credit risk
Credit risk refers to risk of financial losses to the Company when the counterparty defaults on the obligations of the contract. Credit risk arises
from cash and cash equivalents, derivatives, bank and financial institution deposits as well as receivables and firm commitments. As for banks
and financial institutions, the Company makes transactions with reputable financial institutions; therefore, the credit risk from them is limited. For
ordinary transactions, customer’s financial status, credit history and other factors are considered to evaluate their credit status.
Maximum credit exposure for financial guarantee contract as of December 31, 2012 is as follows (In China Yuan):
company name December 31, 2012 Purpose
Liaoning East Shine Chemical Technology Co., Ltd. CNY 45,500,000 Payment guarantee
5) liquidity risk
The Company establishes short-term and long-term fund management plans. The Company then analyzes and reviews actual cash outflow and its
budget to match the maturity profiles of financial assets and liabilities. The Company believes that financial liability may be redeemed by cash flow
arising from operating activities and financial assets.
Maturity analysis of non-derivative financial liabilities according to their remaining maturity as of December 31, 2012, is as follows (Korean won in
thousands):
within 1 year 1–5 years after 5 years Total
Floating rate financial liabilities ₩ 362,270,025 ₩ 648,343,403 ₩ 62,002,680 ₩ 1,072,616,108
Fixed rate financial liabilities 118,975,466 933,198,652 322,040,865 1,374,214,983
Interest-free financial liabilities 536,057,764 29,589,906 4,423,780 570,071,450
Total ₩ 1,017,303,255 ₩ 1,611,131,961 ₩ 388,467,325 ₩ 3,016,902,541
Maturity analysis above is based on the book value and the earliest maturity date by which the payments should be made and includes cash flow
on principal cash flow and interest expense.
Maturity analysis of non-derivative financial assets according to its remaining maturity as of December 31, 2012 is as follows (Korean won in
thousands):
within 1 year 1–5 years after 5 years Total
Floating rate financial liabilities ₩ 375,929,126 ₩ - ₩ - ₩ 375,929,126
Fixed rate financial liabilities 341,673,162 3,505,238 - 345,178,400
Interest-free financial liabilities 724,051,992 5,818,728 6,861,337 736,732,057
Total ₩ 1,441,654,280 ₩ 9,323,966 ₩ 6,861,337 ₩ 1,457,839,583
Maturity analysis above is based on the undiscounted cash flows of principals and interests of the earliest maturity date. The company’s liquidity
risk management is based on the net assets and net debt, and therefore, the Company needs to include information on non-derivative financial
assets in order to understand the liquidity risk management.
Maturity analysis of derivative financial instrument according to its remaining maturity as of December 31, 2012 is as follows (Korean won in
thousands):
within 1 year 1–5 years after 5 years Total
Foreign exchange forward contracts ₩ 1,647,128 ₩ - ₩ - ₩ 1,647,128
Inflow 254,627,205 - - 254,627,205
Outflow (252,980,077) - - (252,980,077)
Interest rate swaps (2,359,601) (2,443,584) - (4,803,185)
Inflow 8,314,269 10,597,855 - 18,912,124
Outflow (10,673,870) (13,041,439) - (23,715,309)
Total ₩ (712,473) ₩ (2,443,584) ₩ - ₩ (3,156,057)
The maturity analysis of derivative of financial instrument above is based on undiscounted gross cash in and out flow. In case the amounts to be
paid or received are not fixed, the cash flows are calculated based on the estimated interest rate generated from the yield curve as of December
31, 2012.
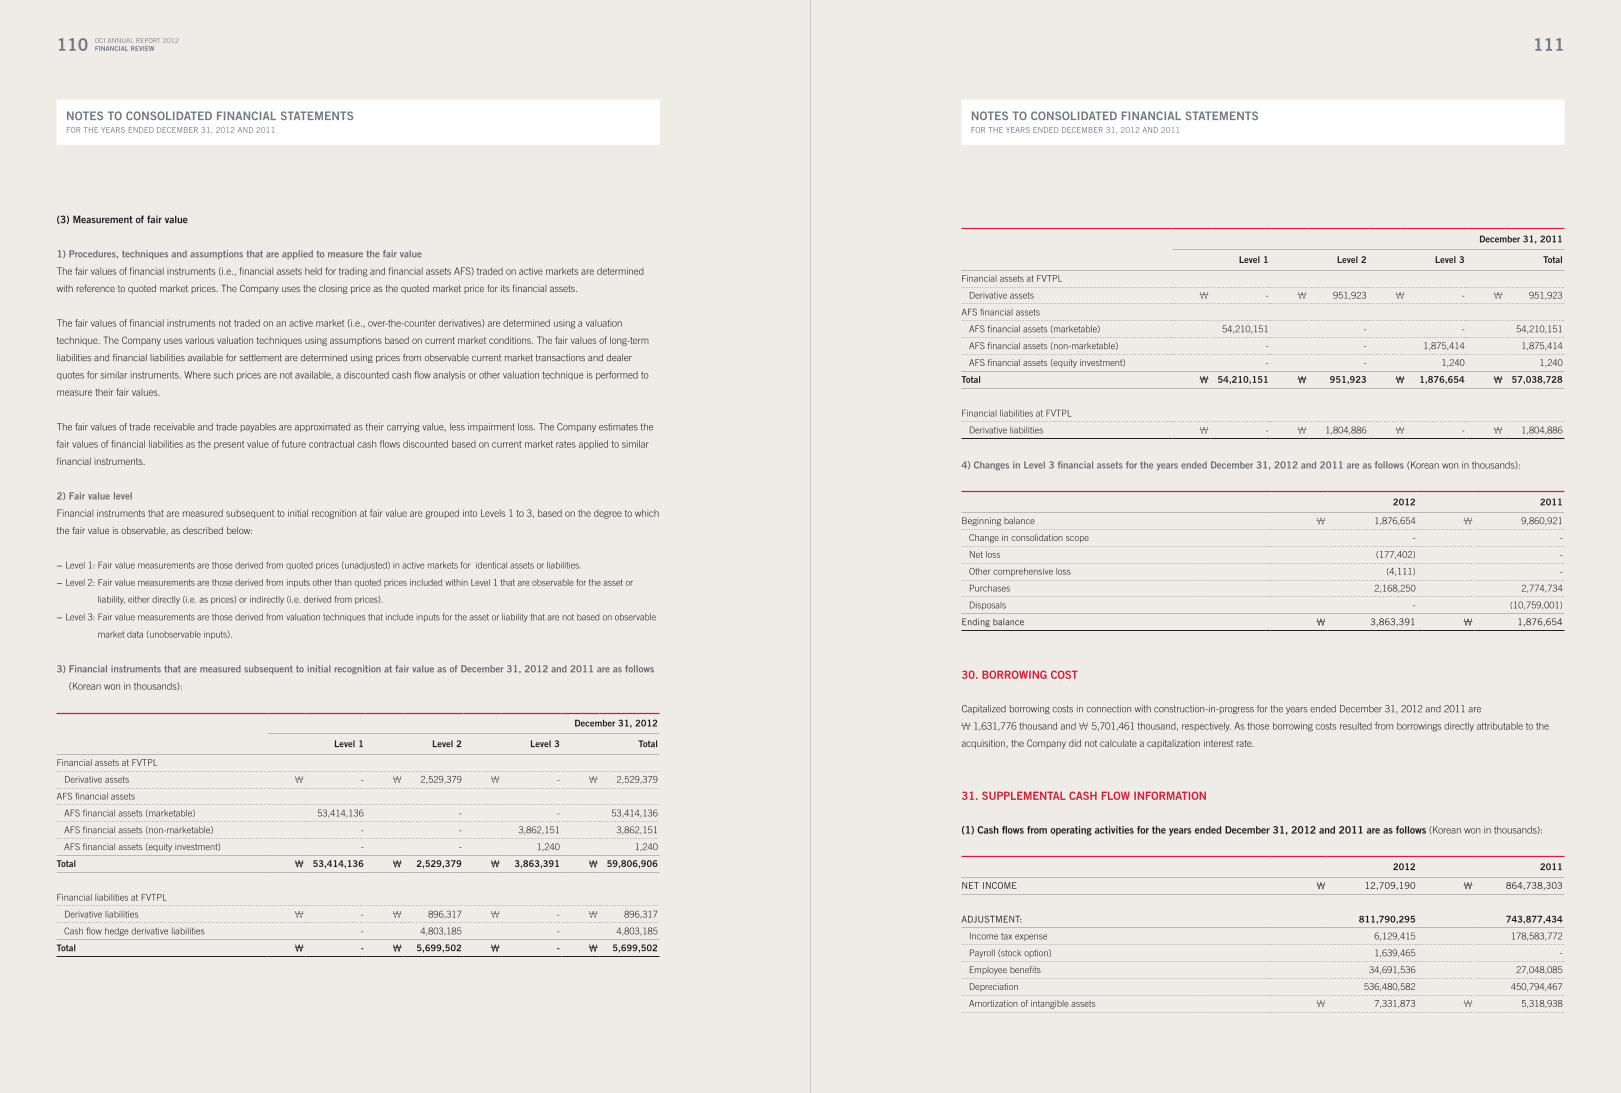
110
nOTeS TO cOnSOliDaTeD Financial STaTeMenTSFOR ThE yEARS ENDED DECEMBER 31, 2012 AND 2011
OCI ANNUAL REPORT 2012Financial Review 111
nOTeS TO cOnSOliDaTeD Financial STaTeMenTSFOR ThE yEARS ENDED DECEMBER 31, 2012 AND 2011
(3) Measurement of fair value
1) Procedures, techniques and assumptions that are applied to measure the fair value
The fair values of financial instruments (i.e., financial assets held for trading and financial assets AFS) traded on active markets are determined
with reference to quoted market prices. The Company uses the closing price as the quoted market price for its financial assets.
The fair values of financial instruments not traded on an active market (i.e., over-the-counter derivatives) are determined using a valuation
technique. The Company uses various valuation techniques using assumptions based on current market conditions. The fair values of long-term
liabilities and financial liabilities available for settlement are determined using prices from observable current market transactions and dealer
quotes for similar instruments. Where such prices are not available, a discounted cash flow analysis or other valuation technique is performed to
measure their fair values.
The fair values of trade receivable and trade payables are approximated as their carrying value, less impairment loss. The Company estimates the
fair values of financial liabilities as the present value of future contractual cash flows discounted based on current market rates applied to similar
financial instruments.
2) Fair value level
Financial instruments that are measured subsequent to initial recognition at fair value are grouped into Levels 1 to 3, based on the degree to which
the fair value is observable, as described below:
− Level 1: Fair value measurements are those derived from quoted prices (unadjusted) in active markets for identical assets or liabilities.
− Level 2: Fair value measurements are those derived from inputs other than quoted prices included within Level 1 that are observable for the asset or
liability, either directly (i.e. as prices) or indirectly (i.e. derived from prices).
− Level 3: Fair value measurements are those derived from valuation techniques that include inputs for the asset or liability that are not based on observable
market data (unobservable inputs).
3) Financial instruments that are measured subsequent to initial recognition at fair value as of December 31, 2012 and 2011 are as follows
(Korean won in thousands):
December 31, 2012
level 1 level 2 level 3 Total
Financial assets at FVTPL
Derivative assets ₩ - ₩ 2,529,379 ₩ - ₩ 2,529,379
AFS financial assets
AFS financial assets (marketable) 53,414,136 - - 53,414,136
AFS financial assets (non-marketable) - - 3,862,151 3,862,151
AFS financial assets (equity investment) - - 1,240 1,240
Total ₩ 53,414,136 ₩ 2,529,379 ₩ 3,863,391 ₩ 59,806,906
Financial liabilities at FVTPL
Derivative liabilities ₩ - ₩ 896,317 ₩ - ₩ 896,317
Cash flow hedge derivative liabilities - 4,803,185 - 4,803,185
Total ₩ - ₩ 5,699,502 ₩ - ₩ 5,699,502
December 31, 2011
level 1 level 2 level 3 Total
Financial assets at FVTPL
Derivative assets ₩ - ₩ 951,923 ₩ - ₩ 951,923
AFS financial assets
AFS financial assets (marketable) 54,210,151 - - 54,210,151
AFS financial assets (non-marketable) - - 1,875,414 1,875,414
AFS financial assets (equity investment) - - 1,240 1,240
Total ₩ 54,210,151 ₩ 951,923 ₩ 1,876,654 ₩ 57,038,728
Financial liabilities at FVTPL
Derivative liabilities ₩ - ₩ 1,804,886 ₩ - ₩ 1,804,886
4) changes in level 3 financial assets for the years ended December 31, 2012 and 2011 are as follows (Korean won in thousands):
2012 2011
Beginning balance ₩ 1,876,654 ₩ 9,860,921
Change in consolidation scope - -
Net loss (177,402) -
Other comprehensive loss (4,111) -
Purchases 2,168,250 2,774,734
Disposals - (10,759,001)
Ending balance ₩ 3,863,391 ₩ 1,876,654
30. BORROwinG cOST
Capitalized borrowing costs in connection with construction-in-progress for the years ended December 31, 2012 and 2011 are
₩ 1,631,776 thousand and ₩ 5,701,461 thousand, respectively. As those borrowing costs resulted from borrowings directly attributable to the
acquisition, the Company did not calculate a capitalization interest rate.
31. SUPPleMenTal caSh FlOw inFORMaTiOn
(1) cash flows from operating activities for the years ended December 31, 2012 and 2011 are as follows (Korean won in thousands):
2012 2011
NET INCOME ₩ 12,709,190 ₩ 864,738,303
ADJUSTMENT: 811,790,295 743,877,434
Income tax expense 6,129,415 178,583,772
Payroll (stock option) 1,639,465 -
Employee benefits 34,691,536 27,048,085
Depreciation 536,480,582 450,794,467
Amortization of intangible assets ₩ 7,331,873 ₩ 5,318,938
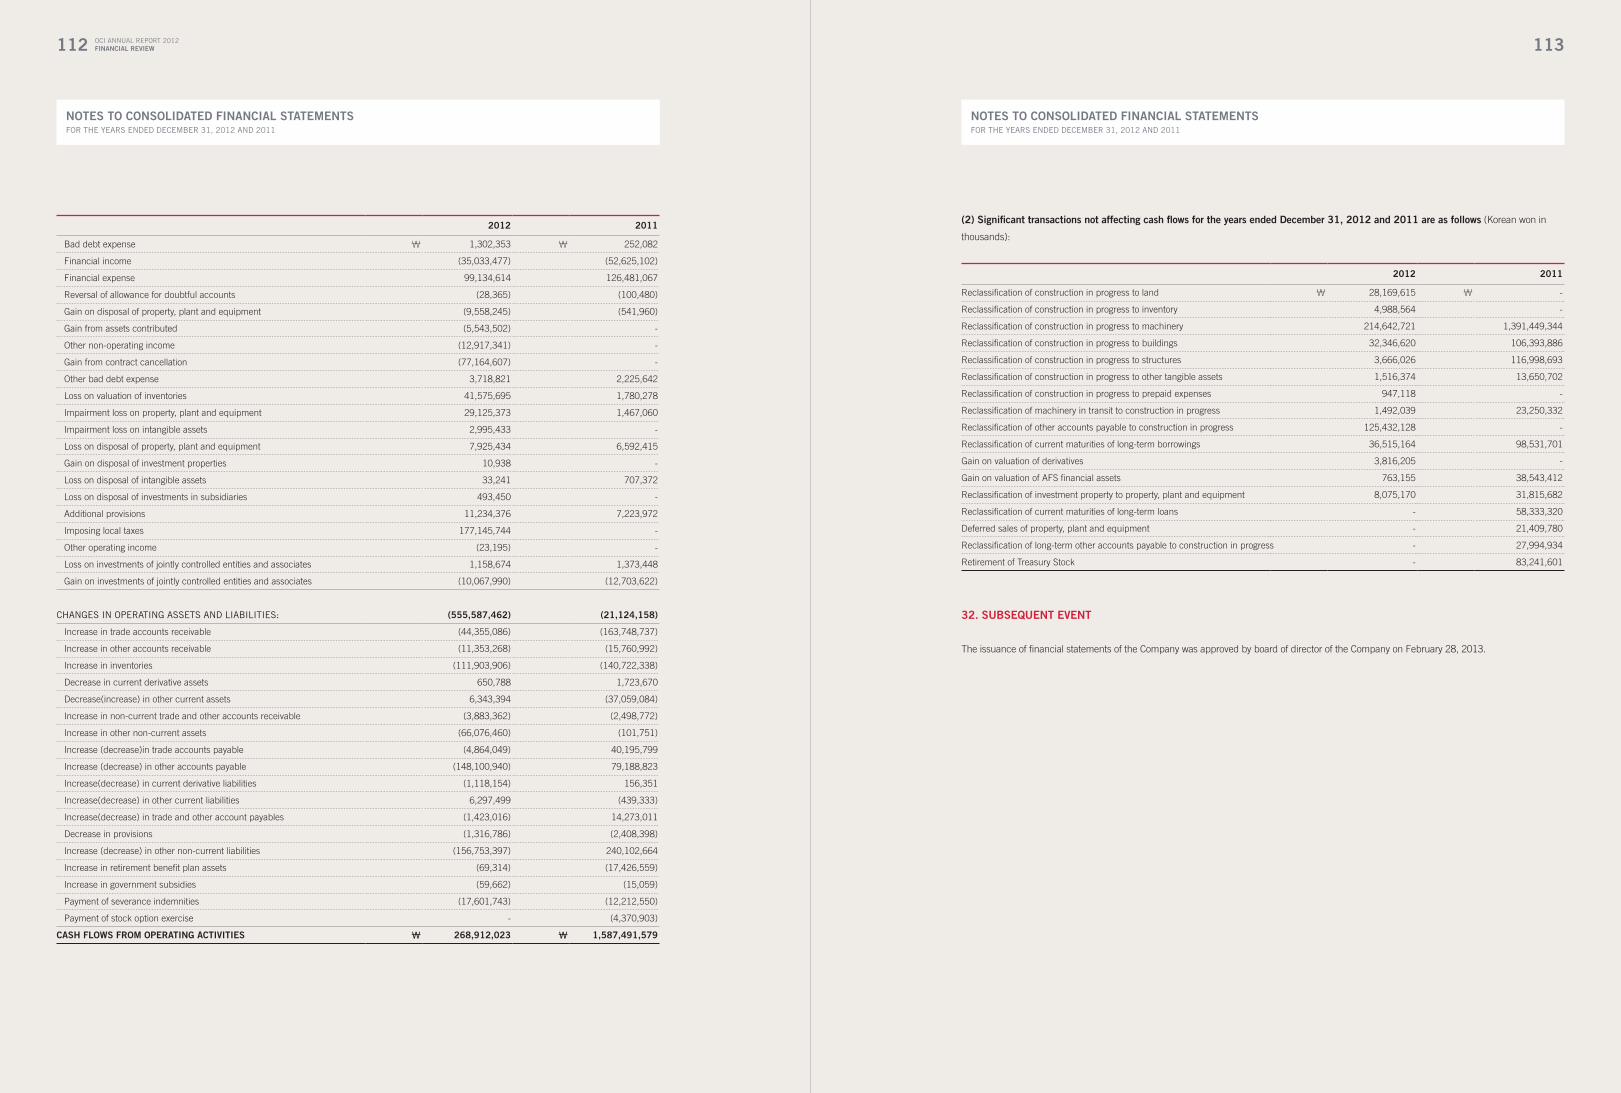
112
nOTeS TO cOnSOliDaTeD Financial STaTeMenTSFOR ThE yEARS ENDED DECEMBER 31, 2012 AND 2011
OCI ANNUAL REPORT 2012Financial Review 113
nOTeS TO cOnSOliDaTeD Financial STaTeMenTSFOR ThE yEARS ENDED DECEMBER 31, 2012 AND 2011
2012 2011
Bad debt expense ₩ 1,302,353 ₩ 252,082
Financial income (35,033,477) (52,625,102)
Financial expense 99,134,614 126,481,067
Reversal of allowance for doubtful accounts (28,365) (100,480)
Gain on disposal of property, plant and equipment (9,558,245) (541,960)
Gain from assets contributed (5,543,502) -
Other non-operating income (12,917,341) -
Gain from contract cancellation (77,164,607) -
Other bad debt expense 3,718,821 2,225,642
Loss on valuation of inventories 41,575,695 1,780,278
Impairment loss on property, plant and equipment 29,125,373 1,467,060
Impairment loss on intangible assets 2,995,433 -
Loss on disposal of property, plant and equipment 7,925,434 6,592,415
Gain on disposal of investment properties 10,938 -
Loss on disposal of intangible assets 33,241 707,372
Loss on disposal of investments in subsidiaries 493,450 -
Additional provisions 11,234,376 7,223,972
Imposing local taxes 177,145,744 -
Other operating income (23,195) -
Loss on investments of jointly controlled entities and associates 1,158,674 1,373,448
Gain on investments of jointly controlled entities and associates (10,067,990) (12,703,622)
ChANgES IN OPERATINg ASSETS AND LIABILITIES: (555,587,462) (21,124,158)
Increase in trade accounts receivable (44,355,086) (163,748,737)
Increase in other accounts receivable (11,353,268) (15,760,992)
Increase in inventories (111,903,906) (140,722,338)
Decrease in current derivative assets 650,788 1,723,670
Decrease(increase) in other current assets 6,343,394 (37,059,084)
Increase in non-current trade and other accounts receivable (3,883,362) (2,498,772)
Increase in other non-current assets (66,076,460) (101,751)
Increase (decrease)in trade accounts payable (4,864,049) 40,195,799
Increase (decrease) in other accounts payable (148,100,940) 79,188,823
Increase(decrease) in current derivative liabilities (1,118,154) 156,351
Increase(decrease) in other current liabilities 6,297,499 (439,333)
Increase(decrease) in trade and other account payables (1,423,016) 14,273,011
Decrease in provisions (1,316,786) (2,408,398)
Increase (decrease) in other non-current liabilities (156,753,397) 240,102,664
Increase in retirement benefit plan assets (69,314) (17,426,559)
Increase in government subsidies (59,662) (15,059)
Payment of severance indemnities (17,601,743) (12,212,550)
Payment of stock option exercise - (4,370,903)
caSh FlOwS FROM OPeRaTinG acTiviTieS ₩ 268,912,023 ₩ 1,587,491,579
(2) Significant transactions not affecting cash flows for the years ended December 31, 2012 and 2011 are as follows (Korean won in
thousands):
2012 2011
Reclassification of construction in progress to land ₩ 28,169,615 ₩ -
Reclassification of construction in progress to inventory 4,988,564 -
Reclassification of construction in progress to machinery 214,642,721 1,391,449,344
Reclassification of construction in progress to buildings 32,346,620 106,393,886
Reclassification of construction in progress to structures 3,666,026 116,998,693
Reclassification of construction in progress to other tangible assets 1,516,374 13,650,702
Reclassification of construction in progress to prepaid expenses 947,118 -
Reclassification of machinery in transit to construction in progress 1,492,039 23,250,332
Reclassification of other accounts payable to construction in progress 125,432,128 -
Reclassification of current maturities of long-term borrowings 36,515,164 98,531,701
Gain on valuation of derivatives 3,816,205 -
Gain on valuation of AFS financial assets 763,155 38,543,412
Reclassification of investment property to property, plant and equipment 8,075,170 31,815,682
Reclassification of current maturities of long-term loans - 58,333,320
Deferred sales of property, plant and equipment - 21,409,780
Reclassification of long-term other accounts payable to construction in progress - 27,994,934
Retirement of Treasury Stock - 83,241,601
32. SUBSeQUenT evenT
The issuance of financial statements of the Company was approved by board of director of the Company on February 28, 2013.
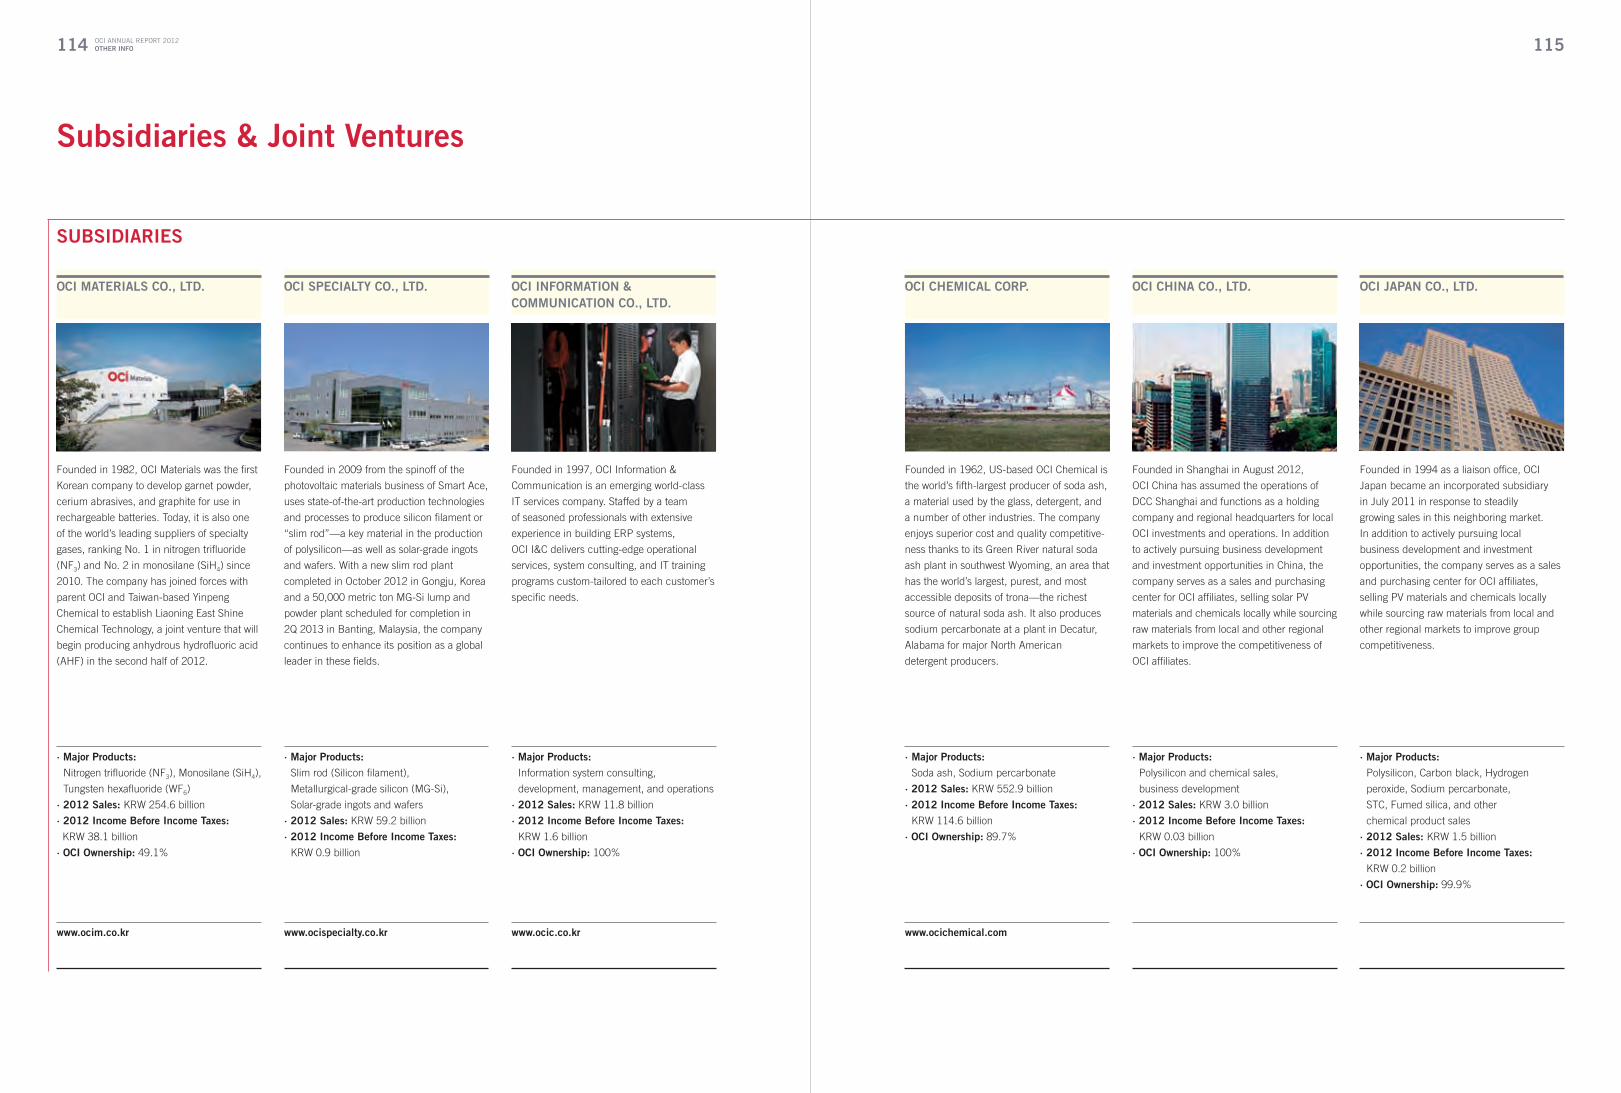
114 115
oCi CHemiCal CoRP. oCi CHina Co., ltd. oCi JaPan Co., ltd.
founded in 1962, US-based oCI Chemical is
the world’s fifth-largest producer of soda ash,
a material used by the glass, detergent, and
a number of other industries. The company
enjoys superior cost and quality competitive-
ness thanks to its Green River natural soda
ash plant in southwest Wyoming, an area that
has the world’s largest, purest, and most
accessible deposits of trona—the richest
source of natural soda ash. It also produces
sodium percarbonate at a plant in Decatur,
Alabama for major North American
detergent producers.
· major Products: Soda ash, Sodium percarbonate
· 2012 sales: KRW 552.9 billion
· 2012 income Before income taxes: KRW 114.6 billion
· oCi ownership: 89.7%
www.ocichemical.com
founded in Shanghai in August 2012,
oCI China has assumed the operations of
DCC Shanghai and functions as a holding
company and regional headquarters for local
oCI investments and operations. In addition
to actively pursuing business development
and investment opportunities in China, the
company serves as a sales and purchasing
center for oCI affiliates, selling solar PV
materials and chemicals locally while sourcing
raw materials from local and other regional
markets to improve the competitiveness of
oCI affiliates.
· major Products: Polysilicon and chemical sales,
business development
· 2012 sales: KRW 3.0 billion
· 2012 income Before income taxes: KRW 0.03 billion
· oCi ownership: 100%
founded in 1994 as a liaison office, oCI
Japan became an incorporated subsidiary
in July 2011 in response to steadily
growing sales in this neighboring market.
In addition to actively pursuing local
business development and investment
opportunities, the company serves as a sales
and purchasing center for oCI affiliates,
selling PV materials and chemicals locally
while sourcing raw materials from local and
other regional markets to improve group
competitiveness.
· major Products: Polysilicon, Carbon black, Hydrogen
peroxide, Sodium percarbonate,
STC, fumed silica, and other
chemical product sales
· 2012 sales: KRW 1.5 billion
· 2012 income Before income taxes: KRW 0.2 billion
· oCi ownership: 99.9%
OCI ANNUAL REPORT 2012otHeR inFo
subsidiaries & Joint Ventures
oCi mateRials Co., ltd. oCi sPeCialty Co., ltd. oCi inFoRmation &CommUniCation Co., ltd.
founded in 1982, oCI Materials was the first
Korean company to develop garnet powder,
cerium abrasives, and graphite for use in
rechargeable batteries. Today, it is also one
of the world’s leading suppliers of specialty
gases, ranking No. 1 in nitrogen trifluoride
(Nf3) and No. 2 in monosilane (SiH4) since
2010. The company has joined forces with
parent oCI and Taiwan-based Yinpeng
Chemical to establish Liaoning East Shine
Chemical Technology, a joint venture that will
begin producing anhydrous hydrofluoric acid
(AHf) in the second half of 2012.
· major Products: Nitrogen trifluoride (Nf3), Monosilane (SiH4),
Tungsten hexafluoride (Wf6)
· 2012 sales: KRW 254.6 billion
· 2012 income Before income taxes: KRW 38.1 billion
· oCi ownership: 49.1%
www.ocim.co.kr
founded in 2009 from the spinoff of the
photovoltaic materials business of Smart Ace,
uses state-of-the-art production technologies
and processes to produce silicon filament or
“slim rod”—a key material in the production
of polysilicon—as well as solar-grade ingots
and wafers. With a new slim rod plant
completed in october 2012 in Gongju, Korea
and a 50,000 metric ton MG-Si lump and
powder plant scheduled for completion in
2Q 2013 in Banting, Malaysia, the company
continues to enhance its position as a global
leader in these fields.
· major Products: Slim rod (Silicon filament),
Metallurgical-grade silicon (MG-Si),
Solar-grade ingots and wafers
· 2012 sales: KRW 59.2 billion
· 2012 income Before income taxes: KRW 0.9 billion
www.ocispecialty.co.kr
founded in 1997, oCI Information &
Communication is an emerging world-class
IT services company. Staffed by a team
of seasoned professionals with extensive
experience in building ERP systems,
oCI I&C delivers cutting-edge operational
services, system consulting, and IT training
programs custom-tailored to each customer’s
specific needs.
· major Products: Information system consulting,
development, management, and operations
· 2012 sales: KRW 11.8 billion
· 2012 income Before income taxes: KRW 1.6 billion
· oCi ownership: 100%
www.ocic.co.kr
sUBsidiaRies

116 117
founded in 1985 as a joint venture with
Degussa AG of Germany to produce
automotive and industrial catalysts, ordeg
is now jointly owned with Samkwang
Glass Industries of Korea and Umicore of
Luxemburg. It supplies emission control
catalysts to vehicle manufacturers in Korea,
China, India, and other countries. The leader
in Korea’s catalyst industry, the company is
now working on next-generation industrial
catalysts, photocatalysts, fuel cells, and other
high-tech fields.
· major Products: Automotive emission control catalysts,
Environmental and industrial catalysts
· 2012 sales: KRW 349.9 billion
· 2012 income Before income taxes: KRW 8.3 billion
· oCi ownership: 20%
www.ordeg.co.kr
founded in 1985, oCI-ferro is a joint venture
with US-based ferro Corporation that
produces frits—vitreous compounds that are
obtained by melting and then rapidly cooling
carefully-controlled blends of raw materials—
for ceramic products such as tile and
chinaware. The company supplies ceramic
colors, pigments, frits, and glazes to a host of
Korean industries as well as black enamel
and silver paste to the automotive industry.
· major Products: Ceramic frits, Zircon silicates
· 2012 sales: KRW 40.0 billion
· 2012 income Before income taxes: KRW 1.5 billion
· oCi ownership: 50%
www.oci-ferro.co.kr
founded in 2008, Shandong oCI is a joint
venture with Shandong Haihua Coal
Chemical of China to produce coal tar pitch,
carbon black oil, naphthalene, and wash oil
for the Chinese market as well as export to the
Middle East and other Asian markets. The
company has an annual coal tar production
capacity of 250,000 metric tons and is
focused on developing new uses and markets
as it aims to emerge as a major global supplier
in the field.
· major Products: Pitch, Carbon black oil, Naphthalene
· 2012 sales: KRW 119.5 billion
· 2012 income Before income taxes: KRW 0.6 billion
· oCi ownership: 80.0%
founded in 1993 as a joint venture with the
Trust International Paper Corporation—the
largest paper producer in the Philippines—
Philko Peroxide is the largest supplier of
hydrogen peroxide in the Philippines.
The company also supplies a number of
other chemicals used across a wide variety of
industrial applications.
· major Products: Hydrogen peroxide, other chemicals
· 2012 sales: KRW 9.3 billion
· 2012 income Before income taxes: KRW 0.8 billion
· oCi ownership: 40.0%
oRdeg Co., ltd. oCi-FeRRo Co., ltd. sHandong oCi Co., ltd.
PHilKo PeRoxide CoRP.
OCI ANNUAL REPORT 2012otHeR inFo
founded in 1993 as a joint venture with
Daewoo International and the Vietnam
Pesticide Joint Stock Company, oCI Vietnam
was Vietnam’s first technical grade insecticide
manufacturer. Today, the company produces a
full line of BPMC and carbofuran insecticides,
fungicides, herbicides, and surfactants for
customers across Vietnam and Asia.
· major Products: Insecticides, fungicides,
Herbicides, Surfactants
· 2012 sales: KRW 51.2 billion
· 2012 income Before income taxes: KRW 1.5 billion
· oCi ownership: 100%
wr
founded in January 2012 with the acquisition
of Chicago-based Cornerstone Power
Development, oCI Solar Power currently has
over 40 solar energy development projects
underway in communities throughout the
United States and Canada. The company
works closely with local officials, community
organizations, and leading environmental and
engineering firms to ensure that each project
is suitable for the community and built in an
environmentally conscious manner.
· major services: Solar energy development and operation
· oCi ownership: 100%
www.ocisolarpower.com
founded in 1986, oCI-SNf is a joint venture
with leading french flocculant producer
SNf that is also Korea’s largest producer
of chemicals for sewage and wastewater
treatment. In addition to producing 35,000
metric tons of dry powder and 12,000 tons of
liquid emulsion organic polymer flocculants,
the company also makes chemicals that are
used in the papermaking, civil engineering,
and construction industries.
· major Products: organic polymer flocculants
· 2012 sales: KRW 153.7 billion
· 2012 income Before income taxes: KRW 20.1 billion
· oCi ownership: 50%
www.oci-snf.co.kr
Joint VentURes
oCi Vietnam Co., ltd. oCi solaR PoWeR llC oCi-snF Co., ltd.
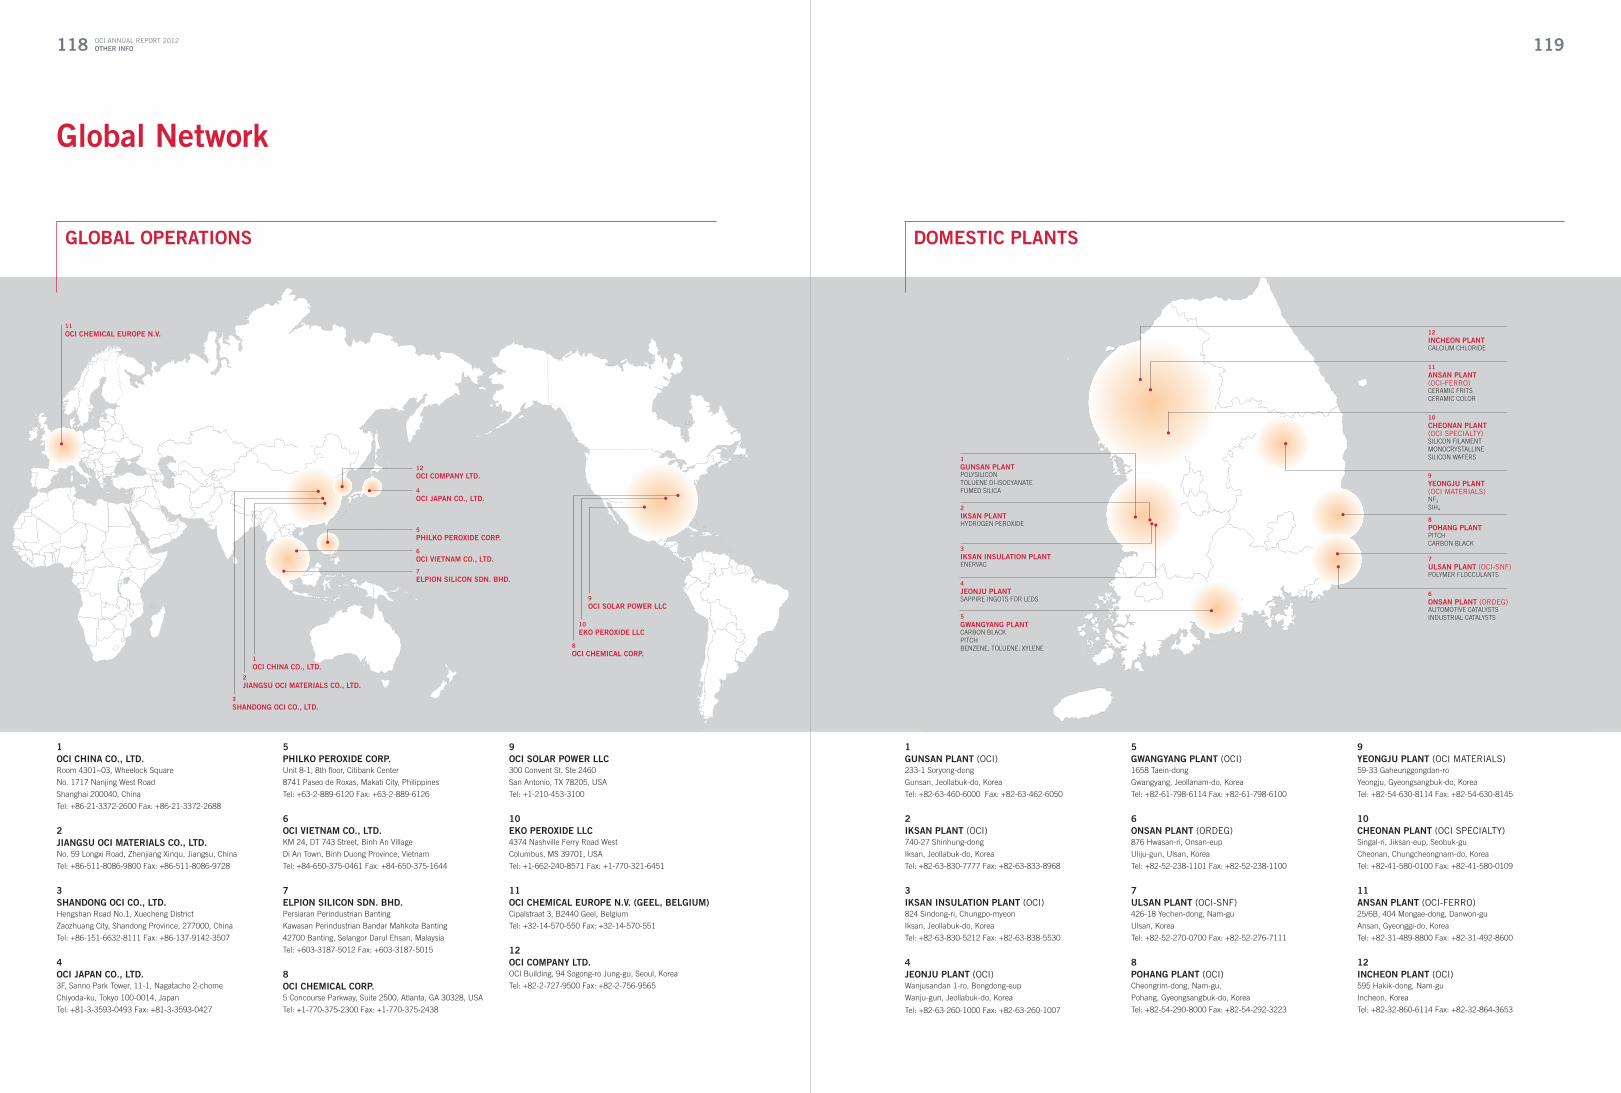
118 119
1gUnsan Plant (OCI)233-1 Soryong-dong
Gunsan, Jeollabuk-do, Korea
Tel: +82-63-460-6000 fax: +82-63-462-6050
2iKsan Plant (OCI)740-27 Shinhung-dong
Iksan, Jeollabuk-do, Korea
Tel: +82-63-830-7777 fax: +82-63-833-8968
3iKsan insUlation Plant (OCI)824 Sindong-ri, Chungpo-myeon
Iksan, Jeollabuk-do, Korea
Tel: +82-63-830-5212 fax: +82-63-838-5530
4JeonJU Plant (OCI)Wanjusandan 1-ro, Bongdong-eup
Wanju-gun, Jeollabuk-do, Korea
Tel: +82-63-260-1000 fax: +82-63-260-1007
5gWangyang Plant (OCI)1658 Taein-dong
Gwangyang, Jeollanam-do, Korea
Tel: +82-61-798-6114 fax: +82-61-798-6100
6onsan Plant (ORDEG)876 Hwasan-ri, onsan-eup
Uliju-gun, Ulsan, Korea
Tel: +82-52-238-1101 fax: +82-52-238-1100
7Ulsan Plant (OCI-SNF)426-18 Yechen-dong, Nam-gu
Ulsan, Korea
Tel: +82-52-270-0700 fax: +82-52-276-7111
8PoHang Plant (OCI)Cheongrim-dong, Nam-gu,
Pohang, Gyeongsangbuk-do, Korea
Tel: +82-54-290-8000 fax: +82-54-292-3223
9yeongJU Plant (OCI MATERIALS)59-33 Gaheunggongdan-ro
Yeongju, Gyeongsangbuk-do, Korea
Tel: +82-54-630-8114 fax: +82-54-630-8145
10CHeonan Plant (OCI SPECIALTY)Singal-ri, Jiksan-eup, Seobuk-gu
Cheonan, Chungcheongnam-do, Korea
Tel: +82-41-580-0100 fax: +82-41-580-0109
11ansan Plant (OCI-FERRO)25/6B, 404 Mongae-dong, Danwon-gu
Ansan, Gyeonggi-do, Korea
Tel: +82-31-489-8800 fax: +82-31-492-8600
12inCHeon Plant (OCI)595 Hakik-dong, Nam-gu
Incheon, Korea
Tel: +82-32-860-6114 fax: +82-32-864-3653
1gUnsan PlantPoLYSILICoNToLUENE DI-ISoCYANATEfUMED SILICA
2iKsan PlantHYDRoGEN PERoXIDE
3iKsan insUlation PlantENERVAC
4JeonJU PlantSAPPIRE INGoTS foR LEDS
5gWangyang PlantCARBoN BLACKPITCHBENZENE, ToLUENE, XYLENE
6onsan Plant (ORDEG)AUToMoTIVE CATALYSTSINDUSTRIAL CATALYSTS
7Ulsan Plant (OCI-SNF)PoLYMER fLoCCULANTS
8PoHang PlantPITCHCARBoN BLACK
9yeongJU Plant(OCI MATERIALS)Nf3
SIH4
10CHeonan Plant(OCI SPECIALTY)SILICoN fILAMENTMoNoCRYSTALLINE SILICoN WAfERS
11ansan Plant(OCI-FERRO)CERAMIC fRITSCERAMIC CoLoR
12inCHeon PlantCALCIUM CHLoRIDE
domestiC Plants
OCI ANNUAL REPORT 2012otHeR inFo
global network
1oCi CHina Co., ltd.Room 4301~03, Wheelock Square
No. 1717 Nanjing West Road
Shanghai 200040, China
Tel: +86-21-3372-2600 fax: +86-21-3372-2688
2JiangsU oCi mateRials Co., ltd.No. 59 Longxi Road, Zhenjiang Xinqu, Jiangsu, China
Tel: +86-511-8086-9800 fax: +86-511-8086-9728
3sHandong oCi Co., ltd.Hengshan Road No.1, Xuecheng District
Zaozhuang City, Shandong Province, 277000, China
Tel: +86-151-6632-8111 fax: +86-137-9142-3507
4oCi JaPan Co., ltd.3f, Sanno Park Tower, 11-1, Nagatacho 2-chome
Chiyoda-ku, Tokyo 100-0014, Japan
Tel: +81-3-3593-0493 fax: +81-3-3593-0427
5PHilKo PeRoxide CoRP.Unit 8-1, 8th floor, Citibank Center
8741 Paseo de Roxas, Makati City, Philippines
Tel: +63-2-889-6120 fax: +63-2-889-6126
6oCi Vietnam Co., ltd.KM 24, DT 743 Street, Binh An Village
Di An Town, Binh Duong Province, Vietnam
Tel: +84-650-375-0461 fax: +84-650-375-1644
7elPion siliCon sdn. BHd.Persiaran Perindustrian Banting
Kawasan Perindustrian Bandar Mahkota Banting
42700 Banting, Selangor Darul Ehsan, Malaysia
Tel: +603-3187-5012 fax: +603-3187-5015
8oCi CHemiCal CoRP.5 Concourse Parkway, Suite 2500, Atlanta, GA 30328, USA
Tel: +1-770-375-2300 fax: +1-770-375-2438
9oCi solaR PoWeR llC300 Convent St, Ste 2460
San Antonio, TX 78205, USA
Tel: +1-210-453-3100
10eKo PeRoxide llC4374 Nashville ferry Road West
Columbus, MS 39701, USA
Tel: +1-662-240-8571 fax: +1-770-321-6451
11oCi CHemiCal eURoPe n.V. (geel, BelgiUm)Cipalstraat 3, B2440 Geel, Belgium
Tel: +32-14-570-550 fax: +32-14-570-551
12oCi ComPany ltd.oCI Building, 94 Sogong-ro Jung-gu, Seoul, Korea
Tel: +82-2-727-9500 fax: +82-2-756-9565
9oCi solaR PoWeR llC
8oCi CHemiCal CoRP.
10eKo PeRoxide llC
4oCi JaPan Co., ltd.
12oCi ComPany ltd.
7elPion siliCon sdn. BHd.
5PHilKo PeRoxide CoRP.
2JiangsU oCi mateRials Co., ltd.
1oCi CHina Co., ltd.
6oCi Vietnam Co., ltd.
3sHandong oCi Co., ltd.
11oCi CHemiCal eURoPe n.V.
gloBal oPeRations
CoRPoRate inFoand ContaCts
date oF estaBlisHment
November 8, 1959
Head oFFiCe
oCI Building, 94 Sogong-ro, Jung-gu, Seoul
Tel +82-2-727-9500
WeBsite
www.oci.co.kr
stoCK inFoRmation
The stock was listed on the Korea Exchange in 1976.
Paid-in Capital | USD 118.8 million
(KRW-USD Exchange rate | 1,071.10 [As of Dec. 31, 2012])
Common stock | 23,849,371 shares
iR ContaCt Point
email | [email protected]

OCI Building, 94 Sogong-ro, Jung-gu, Seoul, Korea
Tel +82-2-727-9500 Fax +82-2-756-9565