Annual Report 2010 - Swedbank
44
Annual Report 2010
Transcript of Annual Report 2010 - Swedbank

Annual Report 2010
Contents
3 Swedbank Mortgage in brief, the Swedish housing market and rating
4 About Swedbank Mortgage
4 Market trends
5 Mortgage market
6 Loan portfolio
8 Funding
9 Risk management
11 Key financial highlights 2006–2010
12 Five-year summary
13 Income statement, Statement of comprehensive income
14 Balance sheet
15 Statement of cash flow
16 Statement of changes in equity
17 Notes
35 Definitions
36 Signatures of the Board of Directors and the President
37 Auditors’ report
38 List of bond loans
42 Board of Directors, Auditor and Executive Committee
SWEDBANK MORTGAGE IN BRIEF, HIGHLIGHTS AND RATING Swedbank Mortgage Annual Report 2010 3

SWEDBANK MORTGAGE IN BRIEF, HIGHLIGHTS AND RATING Swedbank Mortgage Annual Report 2010 3
Swedbank Mortgage in briefSwedbank Mortgage is the market leader in the Swedish mortgage market.
Market share: 26% (27% in 2009).
Distribution: Access to 596 branches, which through Swedbank and the Savings banks forms Sweden’s largest bank-owned retail network.
Loan portfolio: Residential mortgages account for over 90 per cent. Low geographical concen- tration risk through a broad-based distribution network. All lending is in Sweden with collateral in Swedish assets.
Collateral: Average loan-to-value ratio1 in the loan portfolio of 45 per cent calculated on loan level and 60% calculated on property level (45% and 60%, respectively, in 2009).
Funding: During 2010 Swedbank Mortgage issued2 SEK 155bn (119) in the domestic market. In addition, four large public euro-denominated covered bonds were issued during the year.
The Swedish housing market
• Transparent information from, among others, UC AB, Sweden’s leading credit bureau, which provides data on income, debts, payment history, etc.
• Sweden’s Consumer Credit Act requires financial institutions to conduct a detailed analysis of each customer’s ability to pay, a “left to live on” calculation and stress tests if interest rates rise.
• Borrowers are fully responsible for repaying their debts and have an unlimited recourse obligation.
• Stable social welfare system with widespread unemployment insurance.
• Not a “buy-to-let” market.
Rating Moody's Standard & Poor´s Short Long Short Long
P–1 Aaa * A–1+ AAA * P–2 Aa1 A–1 AA+ P–3 Aa2 A–2 AA Not prime Aa3 A–3 AA- A1 B A+ A2** C A A3 D A- Baa1 BBB+ Baa2 BBB Baa3 BBB- * Covered Bond rating
** Placed on review for upgrade 2010-11-16
1 Volume weighted2 Nominal amount

BOARD OF DIRECTORS’ REPORT Swedbank Mortgage Annual Report 2010 54 Swedbank Mortgage Annual Report 2010 BOARD OF DIRECTORS’ REPORT
About Swedbank MortgageSwedbank Mortgage is a market leader in the Swedish mortgage market. Its loans are part of the overall offering from Swedbank and the Savings banks.
Group relationship
Swedbank Mortgage AB (publ), with corporate identifica-
tion number 556003-3283, is a wholly owned subsidiary of
Swedbank AB (publ), 502017-7753. Swedbank Mortgage AB is
the parent company of a group with responsibility for mortgage
lending in Sweden. The group comprises Swedbank Mortgage AB
and the dormant wholly owned subsidiary Swedbank Skog och
Lantbruk AB, 556061-5592.
Swedbank Mortgage’s more than one million customers inclu-
de Swedish homeowners, businesses, tennant-owner asso-
ciations, municipalities and agricultural and forestry busines-
ses. Swedbank Mortgage’s products primarily consist of loans
secured by underlying collateral in Swedish residential, agricul-
tural and forest properties up to 75 per cent of their long-term
market value. Of Swedbank Mortgage’s total lending volume
of SEK 695bn* (SEK 664bn in 2009), slightly over 90 per cent
is represented by mortgage loans to individuals. Swedbank
Mortgage has a market share of 26% (27% in 2009).
Co-ordination with Swedbank
Swedbank Mortgage’s loans are part of the overall offering
from Swedbank and the savings banks, and lending is arranged
through their Swedish retail network, the telephone bank and
internet channels. This is an important reason for Swedbank
Mortgage’s strong market position. The 596 branches of
Swedbank and the savings banks (340 and 256) and Swedbank’s
internet and telephone banks together make up Sweden’s lar-
gest bank-owned distribution network.
Swedbank Mortgage’s functions are totally integrated in
Swedbank, which creates economies of scale with the bank’s
other operations. To be able to offer customers a complete
solution of home buying services, the Swedbank Group utilises
a number of partners in addition to its own brand, Swedbank
Fastighetsbyrå, including home builders and other construction
companies.
* Refers to nominal amounts. Does not take into account market valuations according to IAS 39.
After the severe recession in 2009 there were clear signs of a global recovery in 2010, driven by low interest rates and expansive fiscal policies. Sweden’s finances continue to improve and are among the most stable in the EU.
Market trends
After the severe recession in 2009 there were clear signs of a
global recovery in 2010, driven by low interest rates and expan-
sive fiscal policies. The sustainability of the recovery is uncertain,
however. The mountain of debt that has grown rapidly in recent
years is now forcing several euro countries to drastically cut
spending at the same time that demands for better coordinated
fiscal policies within the EU are increasing. Long-term bond
rates trended lower in 2010 partly as a result of low interest
rates and liquidity injections by central banks in the form of
government bond purchases. The reduction in interest rates also
reflected concerns that the economic rebound is unsustainable.
In countries with large macroeconomic imbalances, however,
credit spreads increased significantly in 2010.
Improved global growth prospects have helped to lift the
Swedish economy on a broad basis. According to the Swedbank
Economic Outlook from January 2011, Sweden’s GDP is expected
to rise by slightly over 5% in 2010. The industrial sector, led by
exports, posted the biggest improvement when global demand
rebounded. Low interest rates, reduced income taxes and stable
government finances have allowed households to increase their
housing investments and consumption, with debt loads increa-
sing as a result. The previous year’s deterioration in the Swedish
labour market ended in 2010 and has been followed by job crea-
tion and lower unemployment. This is one reason why Sweden
remains among the EU’s most fiscally stable members. The
Swedish krona appreciated in 2010 partly due to the Swedish
Riksbank’s rate hikes, but probably also because of Sweden’s
sound finances.

BOARD OF DIRECTORS’ REPORT Swedbank Mortgage Annual Report 2010 5
In 2010 Sweden’s export-dependent economy partially recovered after the major downturn in the previous year. Although unem-ployment is relatively high, jobs are again increasing. Housing prices rose during the year, but due to interest rate hikes by the Swedish Riksbank and the mortgage cap introduced by the Financial Supervisory Authority in October this trend may slow. Market-wide stress tests completed by Swedbank and the Swedish Riksbank, among others, point to stable solvency among mortgage customers of Swedish banks.
Mortgage market
Swedbank Mortgage’s loans are granted on the basis of the abil-
ity of customers to repay. The large retail network of Swedbank
and the Savings banks is well integrated in the local economy,
and customers are demonstrating sound solvency. A strong
local presence is also a strength when analyzing local property
prices and assessing the value of collateral offered to Swedbank
Mortgage.
The Swedish Riksbank’s interest rate hikes, coupled with
the Financial Supervisory Authority’s new mortgage cap, are
expected to slow the increase in housing prices in the years
ahead. During the year low interest rates and the special tax
reduction for housing improvements, repairs and maintenance
(ROT-avdraget) encouraged owners of single-family homes and
condominiums to invest in their homes which contributed to a
high demand for mortgage loans.
Due to the actions of the Swedish Riksbank and the Financial
Supervisory Authority, we expect new mortgage demand as a
whole to decrease in 2011.
Competition among the country’s mortgage lenders is tight.
Swedbank Mortgage is carefully following the developements
and participating in discussions on financial market policies
and similar regulations on mortgage loans. Especially in times
of change, perseverance, a local presence and a wholehearted
commitment based on close relationships are some of the most
important competitive advantages.
Stable real estate market
The Swedish housing market has several important qualities that
contribute to the stability of the real estate market. The most
fundamental is the solvency of households, which have low loan-
to-value ratios in relation to the market value of their properties.
Tax cuts in recent years are helping to further improve household
solvency. In contrast to many other European countries, Sweden
does not have a developed market where single-family homes
and condominiums are bought for rental purposes. As a result,
underlying prices are based on actual demand, not speculation.
The price increases in recent years have therefore had little to
do with speculation. Instead, the rising housing prices are mainly
the result of the limited number of new properties. Compared
with the rest of the Nordic region and Europe, Sweden has gener-
ally maintained a low rate of new construction since the Swedish
financial crisis in the early ’90s. Housing demand exceeds supply
in fast-growing metropolitan regions in particular.
Credit demand in the commercial sector is driven by the acqui-
sition financing of real estate property by converted and newly
formed tenant-owner associations.
Increased volatility in the agricultural and forestry sector
The financial crisis and recession affected the agricultural sector.
Dairy and horticultural companies faced the toughest economic
pressure. Market conditions clearly improved in 2010 and prices
rose for these businesses. Agricultural property prices remain
stable. The forestry sector was affected by the recession and
financial crisis as well. Demand for forest products increased in
2010, resulting in higher prices for lumber and pulpwood produc-
ers. Prices of forest properties rose in 2010.
New mortgage cap
As of October 2010 properties intended for housing purposes
may be mortgaged up to 85 per cent of the property’s value,
according to the new general advice of the Financial Supervisory
Authority. This change is expected to have limited direct effect
on Swedbank Mortgage’s lending, since it has long been restric-
tive in granting new loans. Swedbank Mortgage welcomes the
new regulations, which we feel will contribute to a less volatile
and better balanced mortgage market.

6 Swedbank Mortgage Annual Report 2010 BOARD OF DIRECTORS’ REPORT
The residential sector accounts for slightly over 90 per cent of Swedbank Mortgage’s lending. During the year total lending increased by SEK 31bn before provisions or 5 per cent (SEK 49bn, 8 per cent in 2009). Nearly the entire net increase has been in the private residential segment.
Loan portfolio
The lending increase in 2010 was slightly lower than in imme-
diately preceding years. During the year the economy contin-
ued to improve and employment levels rose, but unemploy-
ment remained relatively high and uncertainty affected housing
prices. Moreover, the increases in the base rate previously
announced by the Swedish Riksbank began during the summer.
In 2009 Swedbank Mortgage introduced tighter requirements
on underlying collateral and household assets for new lending.
As a whole, these factors slowed the increase in the company’s
lending during the year.
Stable risk level in the loan portfolio
Extensive stress tests of the mortgage portfolio were conducted
during the year. The tests incorporated scenarios such as sig-
nificantly higher interest rates and significantly lower housing
prices. The results of these tests indicated robust solvency
among the company’s mortgage customers and a low risk of
credit impairments, even if economic conditions were to substan-
tially worsen from a Swedish perspective.
The deep understanding of customers gained through their
large retail network, with an emphasis on customer solvency,
has helped Swedbank and the Savings banks to maintain past
due loans at very low levels.
A low loan-to-value ratio among Swedbank Mortgage’s custo-
mers, combined with a favourable real estate market, has meant
that the few customers who have incurred payment problems
have usually been able to sell their properties without losing
money.
The figure on page 7 (Risk classification Swedbank Mortgage)
illustrates how the overall portfolio of loans to homeowners,
businesses and agricultural and forestry enterprises is distrib-
uted by risk class. On the scale, 21 represents the lowest risk and
0 the highest risk, with an additional class for defaults. During
2010 a slight migration to higher risk classes has taken place,
indicating a sound ability among the company’s mortgage cus-
tomers to repay their debt and a low risk of credit losses.
Swedbank Mortgage’s low risk profile is the result of restric-
tive credit requirements, geographical loan diversification among
many customers and close monitoring of loan customers locally.
Loans judged as having higher risks are given extra attention.
Lending to the commercial sector, which largely consists of
tenant-owner associations, with low loan-to-value ratios, fell by
SEK 4bn to SEK 119bn.
Agricultural companies have been affected by major price
fluctuations in food prices due to the financial crisis and global
changes. The need for larger, more efficient farms is raising and
driving loan demand. Demand for mortgage loans in the agri-
cultural and forestry sector therefore remained high in 2010.
Lending to the sector increased by SEK 3bn during the year to
SEK 46bn.
BOARD OF DIRECTORS’ REPORT Swedbank Mortgage Annual Report 2010 7
Over half the loan portfolio has a loan-to-value ratio (LTV) of less than 30 per cent.
0
20
40
60
80
100
120
140
>0-10% >10-20% >20-30% >30-40% >40-50% >50-60% >60-70% >70-80% >80-90% >90%
Loan portfolio by LTV
SEK bn
0.00%
0.02%
0.04%
0.06%
0.08%
0.10%
0.12%
2005 2006 2007 2009 2010
Receivables past due >60 days as per cent of loan portfolio
Private Business Agriculture & Forestry
Loan-to-value ratio (LTV)
Municipalities, 1.8%
Condiminiums, 15.5%
Tenant ownerassociations, 10.3%
Agriculture andhousing, 6.7%
Multi-family housing, 4.8%
Commercialproperties, 0.1%
Single-family homes, 58.4%
Vacation homes, 2.4%
Loan portfolios as of 31 December 2010 distributed by collateral

New portfolio provision model affected the year’s credit
impairments
In 2010 credit impairments affected profit by SEK 168m (SEK 8m
in 2009). The large part of this increase is due to the change in
valuation model for portfolio provisions introduced by Swedbank
Mortgage at the beginning of the year. Established credit impair-
ments amounted to SEK 38m (22), utilisation of previous provi-
sions amounted to SEK 5m (1) and recoveries from previous
years’ impairments totalled SEK 1m (8). Provisions for credit
impairments amounted to a net of SEK 136m during the year,
against a year-earlier net reversal of SEK 6m.
The volume of loans past due by more than 60 days remains
at a very low level. Swedbank’s risk classification system and
rules serve as the basis of efficient monitoring routines that are
designed to minimise future impairments. Household loans past
due by more than 60 days as a share of the total loan portfolio
remain low at around 0.07 per cent (0.08). The corresponding
figure is 0.02 per cent (0.04) for commercial loans and 0.07 per
cent (0.10) for agricultural and forestry loans.
The portfolio’s impaired loans, after deducting provisions of
SEK 56m (57), amounted to SEK 86m (108) as of 31 December
2010, corresponding to 0.01 per cent (0.02) of the total loan
portfolio. Loans with interest reductions amounted to SEK 0m
(0). Provisions for impaired loans and book values are shown in
note 4.
BOARD OF DIRECTORS’ REPORT Swedbank Mortgage Annual Report 2010 7
0%
5%
10%
15%
20%
25%
30%
35%
Def. 0 1 2 3 4 5 6 7 8 9 10 11 12 13 14 15 16 17 18 19 20 21
Loan portfolio as of December 2010
Expo
sure
by
risk
cla
ss, %

8 Swedbank Mortgage Annual Report 2010 BOARD OF DIRECTORS’ REPORT
In 2010 the global capital markets were deeply affected by the sovereign debt crisis. In Sweden, on the other hand, the eco-nomic recovery has been considerably faster and stronger than expected, and the Swedish Riksbank was one of the first central banks to withdraw its extraordinary liquidity support measures and commence increasing its base rate.
Funding
In 2010 the global capital markets were deeply affected by
the sovereign debt crisis. Investors have worried about grow-
ing debt and large budget deficits in countries such as Greece,
Ireland, Portugal and Spain. Austerity budgets have hurt growth
prospects, and concerned investors fear that some of these
countries may have to restructure their debts. A number of banks
and mortgage institutions from southern Europe and Ireland
have essentially been shut out of funding markets and remain
dependent on the European Central Bank for their funding. In
Sweden, on the other hand, the economic recovery has been
considerably faster and stronger than expected, and the Swedish
Riksbank was one of the first central banks to withdraw its
extraordinary liquidity support measures and begin to raise its
benchmark interest rate. Swedish banks and mortgage institu-
tions are strongly positioned and have held a sound position
in relation to investors’ search for safe investment alternatives
during this international turbulence.
Demand for Swedish covered bonds in the euro market has
been very good. In 2010 Swedbank Mortgage issued four so-
called euro benchmark covered bonds (maturing in January 2013,
January 2014, June 2015 and March 2017), twice the number in
2008 and 2009. Swedbank Mortgage now has seven outstand-
ing euro benchmark covered bonds. Swedbank Mortgage has also
issued a number of public covered bonds in CHF and has been
active in registered covered bonds with long maturities, primarily
targeting the German pension- and insurance markets.
The Swedish market for covered bonds continued to operate
efficiently in 2010. Swedbank Mortgage has continued to offer
new issues, and the Swedish market still remains its primary
funding source. During the fall of 2010 Swedbank Mortgage
began a structural change of the maturity profile of its Swedish
covered bonds. Going forward its bond loans will mature at
nine-month intervals, compared with about 12 months before.
The expectation is that this will create a closer match between
assets and liabilities and better spread out maturities over time.
Initially in 2010 three new bond loans were issued maturing in
2015, 2016 and 2017.
BOARD OF DIRECTORS’ REPORT Swedbank Mortgage Annual Report 2010 9
Moody's Standard & Poor´s Short Long Short Long
P–1 Aaa * A–1+ AAA * P–2 Aa1 A–1 AA+ P–3 Aa2 A–2 AA Not prime Aa3 A–3 AA- A1 B A+ A2** C A A3 D A- Baa1 BBB+ Baa2 BBB Baa3 BBB-
* Covered Bond rating ** Placed on review for upgrade 2010-11-16
Outstanding volume of covered bonds by program*
Book values Per 31 December 2010 SEKbn Total
Mortgage bonds in Sweden 291Euro Mid Term Note program 115Mid Term Note program 22Registered Covered Bonds 18Norwegian mortgage bond program 3
* For further information, see note 4a–d.

Risk management
Swedbank Mortgage measures and reports risks in accord-
ance with the guidelines and policies of the Swedbank Group.
Swedbank Mortgage’s principal risks are credit risks, financial
risks and operational risks. For further information, see note
4a-d.
CREDIT RISK
Credit risk is the risk that a counterparty cannot meet its obliga-
tions and that pledged assets will not cover the company’s claim.
Credit risk also includes concentration risk, i.e. large exposures or
concentrations in the loan portfolio to certain regions or indus-
tries. Swedbank Mortgage’s credit risks primarily arise in its lend-
ing to the public (private individuals and companies). Risks are
geographically diversified throughout Sweden and largely con-
sist of loans secured by single-family homes and condominiums.
Swedbank Mortgage’s lending is handled through the distribu-
tion network of Swedbank and the Savings banks. The right to
grant loans has been delegated to Swedbank and the Savings
banks within specific limits. Decisions of principle regarding
credit issues or otherwise of importance (in individual cases or in
general) are made by Swedbank Mortgage’s Board of Directors.
Furthermore, Swedbank Mortgage’s Board sets loan limits for
various types of properties.
Swedbank Mortgage has delegated the right to establish
procedures on the appraisal and management of collateral and
for borrowers with financial difficulties to Swedbank. The del-
egation applies until further notice and can be recalled immedi-
ately by Swedbank Mortgage at any time. Swedbank Mortgage’s
Board regularly receives reports on credit risks in the company
and other types of analyses of the loan portfolio.
Loan evaluations take into account the customer’s ability
to repay and the value of the collateral. The latter is based on
the property’s long-term market value as determined by an
appraiser familiar with the local market. Moreover, the customer
is carefully analysed in an internal risk classification system and
assigned a value on a risk scale. The risk classification system
plays a central role in the Group’s day-to-day lending operations.
It is used in the preparation of loan applications, as guidance in
making decisions and to determine who may grant a loan.
The risk classification is also used to measure risks at an
aggregate level according to Group-wide models. Swedbank
Mortgage’s loan portfolio has a very high credit quality with low
risks, where 88 per cent of the exposure in the risk classification
has been assigned investment grade risk classes and are consid-
ered to have very low risk.
The treasury department also faces counterparty risks, for
Swedbank Mortgage mainly through derivative contracts. In
the majority of derivative contracts, the Parent Company is
the counterparty. Counterparty risks are also reduced through
bilateral agreements, which allow risks to be netted using stand-
ardised procedures, as well as through special agreements on
collateral with certain counterparties.
Swedish mortgage regulations were tightened in 2010 when
the Financial Supervisory Authority introduced a mortgage
cap of 85 per cent of a property’s value. Swedbank Mortgage’s
restrictive credit policy was already in compliance with the new
rules, in addition to which the bank further tightened its mort-
gage requirements during the fourth quarter.
FINANCIAL RISK
Financial risks are divided into two main types: market risk and
liquidity risk. Swedbank Mortgage’s Board sets comprehensive
goals for market and liquidity risks. It also sets limits within
the risks mandates given to Swedbank Mortgage by Swedbank.
Moreover, the Board retains responsibility for ensuring that the
requisite guidelines and instructions for risk management are
established and followed.
Market and liquidity risks that arise in lending are transferred
to Swedbank Mortgage’s treasury department, which has spe-
cific mandates for these risks. The department has a risk control
function responsible for the day-to-day monitoring and compila-
tion of information on financial risks. Financial risk utilisation is
reported to the Board of Swedbank Mortgage and Swedbank’s
risk control unit on a continual basis.
Market risk
Market risk refers to the risk that changes in exchange rates and
interest rates will lead to a decline in the value of net assets and
liabilities, including derivatives.
Because Swedbank Mortgage’s lending in SEK is partly
financed with funding in other liquid currencies, a foreign
exchange risk arises. This risk is neutralised through derivatives
in the foreign exchange market. Despite extensive funding in
foreign currency, Swedbank Mortgage’s exposure to foreign cur-
rency risks is therefore very limited. Swedbank Mortgage had no
open currency positions as of 31 December 2010.
The interest rate risk in Swedbank Mortgage’s operations
primarily arises as a result of differences in the average fixed
interest rate periods in the lending portfolio and funding. The risk
is managed primarily through Swedbank Mortgage’s active par-
ticipation in the funding market, and by using derivatives in the
fixed income market, e.g. swaps and forwards. Interest rate risk
cannot be completely eliminated, since residential mortgages are
constantly refinanced at new terms and new loans are granted.
The remaining risk that affects Swedbank Mortgage’s profit is
limited, however, and is kept within an interval approved by the
company’s Board.
Liquidity risks
Liquidity risks arise because the maturity structures of Swedbank
Mortgage’s assets and liabilities, including derivatives, do not
coincide. Swedbank Mortgage defines liquidity risk as the risk of
not being able to fulfil payment commitments on any given due
date without significantly raising the cost to fund payments.
BOARD OF DIRECTORS’ REPORT Swedbank Mortgage Annual Report 2010 9
10 Swedbank Mortgage Annual Report 2010 BOARD OF DIRECTORS’ REPORT
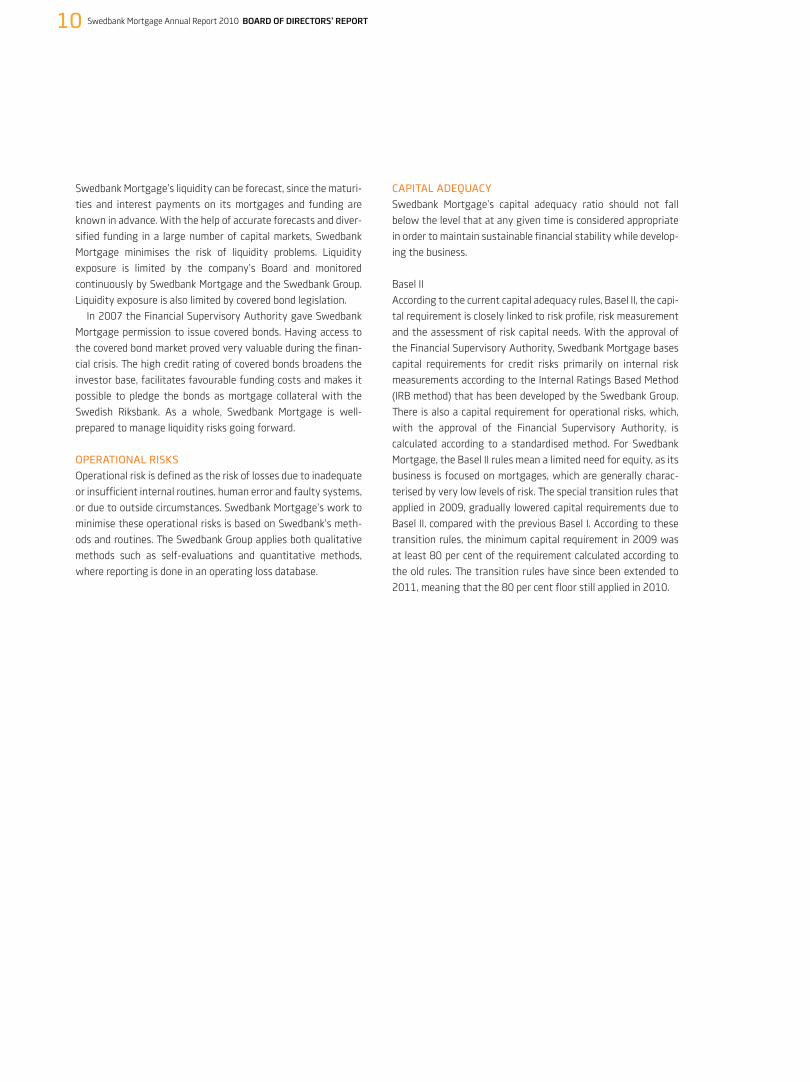
Swedbank Mortgage’s liquidity can be forecast, since the maturi-
ties and interest payments on its mortgages and funding are
known in advance. With the help of accurate forecasts and diver-
sified funding in a large number of capital markets, Swedbank
Mortgage minimises the risk of liquidity problems. Liquidity
exposure is limited by the company’s Board and monitored
continuously by Swedbank Mortgage and the Swedbank Group.
Liquidity exposure is also limited by covered bond legislation.
In 2007 the Financial Supervisory Authority gave Swedbank
Mortgage permission to issue covered bonds. Having access to
the covered bond market proved very valuable during the finan-
cial crisis. The high credit rating of covered bonds broadens the
investor base, facilitates favourable funding costs and makes it
possible to pledge the bonds as mortgage collateral with the
Swedish Riksbank. As a whole, Swedbank Mortgage is well-
prepared to manage liquidity risks going forward.
OPERATIONAL RISKS
Operational risk is defined as the risk of losses due to inadequate
or insufficient internal routines, human error and faulty systems,
or due to outside circumstances. Swedbank Mortgage’s work to
minimise these operational risks is based on Swedbank’s meth-
ods and routines. The Swedbank Group applies both qualitative
methods such as self-evaluations and quantitative methods,
where reporting is done in an operating loss database.
CAPITAL ADEQUACY
Swedbank Mortgage’s capital adequacy ratio should not fall
below the level that at any given time is considered appropriate
in order to maintain sustainable financial stability while develop-
ing the business.
Basel II
According to the current capital adequacy rules, Basel II, the capi-
tal requirement is closely linked to risk profile, risk measurement
and the assessment of risk capital needs. With the approval of
the Financial Supervisory Authority, Swedbank Mortgage bases
capital requirements for credit risks primarily on internal risk
measurements according to the Internal Ratings Based Method
(IRB method) that has been developed by the Swedbank Group.
There is also a capital requirement for operational risks, which,
with the approval of the Financial Supervisory Authority, is
calculated according to a standardised method. For Swedbank
Mortgage, the Basel II rules mean a limited need for equity, as its
business is focused on mortgages, which are generally charac-
terised by very low levels of risk. The special transition rules that
applied in 2009, gradually lowered capital requirements due to
Basel II, compared with the previous Basel I. According to these
transition rules, the minimum capital requirement in 2009 was
at least 80 per cent of the requirement calculated according to
the old rules. The transition rules have since been extended to
2011, meaning that the 80 per cent floor still applied in 2010.
BOARD OF DIRECTORS’ REPORT Swedbank Mortgage Annual Report 2010 11

Key financial highlights 2006 – 2010
2010 2009 2008 2007 2006
ProfitInvestment margin, % ** 0.53 0.56 0.56 0.67 0.75Return on equity, % 7.4 9.27 10.0 10.6 11.5Earnings per share, SEK 101.70 113.26 116.52 119.70 117.65
CapitalCapital base, SEKm 30 968 29 744 27 005 26 882 26 823Capital quotient *** 1,17 1,20 1,05 1,11 1,16 Capital adequacy ratio, % *** 9,3 9,6 8,4 8,9 9,3Tier 1 capital ratio, % *** 9,3 9,6 8,4 8,2 8,6Number of shares at start/end of period, million 23 23 23 23 23Equity per share, SEK 1 377.39 1 313.78 1 200.52 1 084.00 1 077.00Credit qualityCredit impairment ratio, % 0,00 0,00 0,00 – 0,01 – 0,00Total provision ratio for impaired loans, % 141.8 43.1 4.8 73.9 104.4Share of impaired loans, %. 0.01 0.02 0.02 0.01 0.01
OtherNumber of employees 0 0 0 13 18
* Not restated according to IAS 39. ** Calculated as of 2008 as a 12-month average. The previous calculation method used the report period’s average. *** As of 2007 capital ratios are calculated according to FFFS 2007:1 (Basel 2).
Proposed distribution of profit
Profit analysis
Operating profit amounted to SEK 3 179m (3 631). Net inter-
est income was reduced by SEK 339m to SEK 4 069m (4 408).
The dominating reason for the lower net interest income was
a lower average margin during 2010 compared to the previous
year despite an increasing trend, which was due to a low starting
level for the year. The turning point appeared in the beginning of
the past year. The increase in volumes for the year, amounting
to SEK 30bn, compensated to some extent the lower margin.
Funding costs have been considerably affected by the extended
average maturity for the debts. The increased costs of funding
have certainly affected the net interest income negatively but
it has also resulted in a reduced need of liquidity reserves which
has had a positive effect on the net interest income. The lower
levels of interest rates during the year compared to previous year
have led to somewhat lower return on equity.
Of the commission costs most part is arising from the inter-
change between the savings banks and partly owned banks.
These costs amounted to SEK 562m (661). The reduction is a
result of changes in the agreement on commission with the sav-
ings banks and partly owned banks.
In net gains and losses on financial items at fair value are
included changes in value on items for which fair value option
is applied. In April 2009 a gradual transition was initiated to
increase amortized cost and hedge accounting by applying fair
value hedge accounting and cash flow hedging. Changes in value
in fair value hedges on the hedged item and the hedging instru-
ment is reported in the income statement while the effective
part of the changes in value on a cash flow hedge is reported
in equity and is included in other comprehensive income. In net
gains and losses in financial items at fair value are also included
profit and losses on prepayments on loans at amortized cost and
repurchases of issued securities at amortized cost. All included
the net gains and losses on financial items at fair value amount-
ed to SEK -206m (-131).
Administrative expenses have from 2010 been moved to
Swedbank AB.
Net credit impairment amounted to SEK 168m (8). Most of
the credit impairment is due to that Swedbank Mortgage has
changed its valuation model for portfolio provisions. The new
model was implemented during the first half year and resulted in
a one-time effect amounting to SEK 153m.
Proposed distribution of profit
mSEK
Swedbank Mortgage AB (publ)
Retained earnings 14 144
Profit for the year 2 339
Total available 16 483
The Board of Directors proposes that the following
amount be carried forward 16 483
Total 16 483
BOARD OF DIRECTORS’ REPORT Swedbank Mortgage Annual Report 2010 11
FÖRVALTNINGSBERÄTTELSE Swedbank Mortgage Annual Report 2010 1212 Swedbank Mortgage Annual Report 2010 BOARD OF DIRECTORS’ REPORT
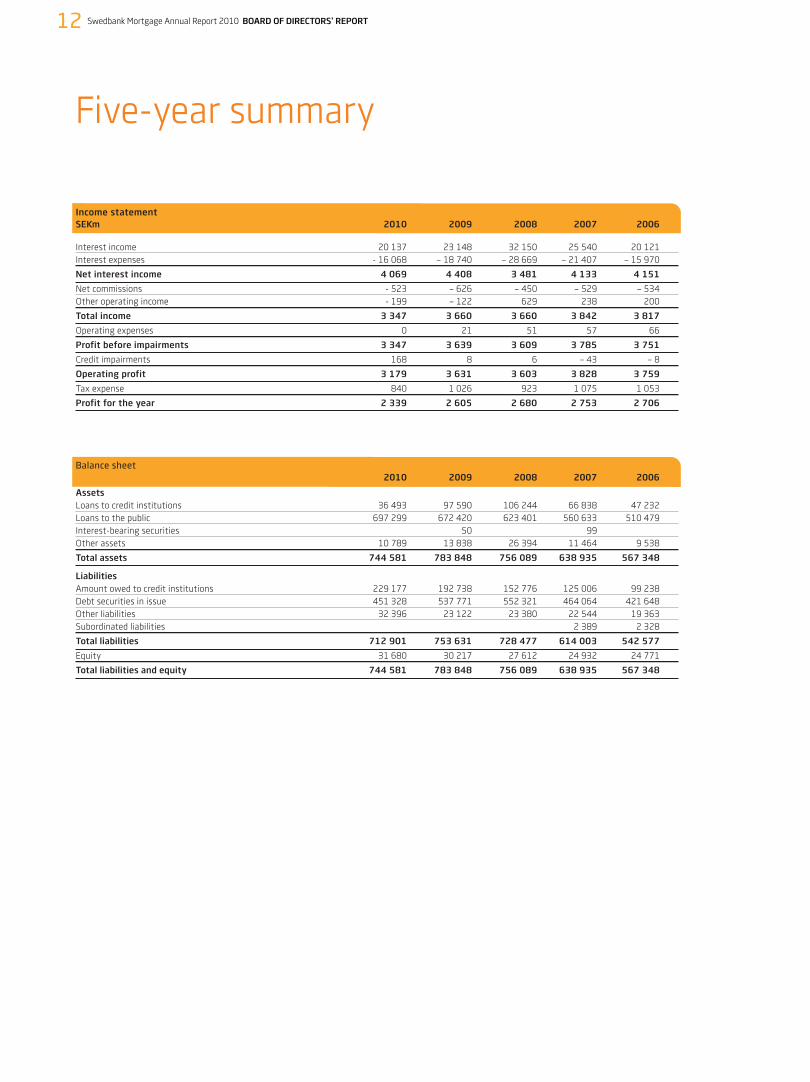
Five-year summary
Income statementSEKm 2010 2009 2008 2007 2006
Interest income 20 137 23 148 32 150 25 540 20 121Interest expenses - 16 068 – 18 740 – 28 669 – 21 407 – 15 970
Net interest income 4 069 4 408 3 481 4 133 4 151
Net commissions - 523 – 626 – 450 – 529 – 534Other operating income - 199 – 122 629 238 200
Total income 3 347 3 660 3 660 3 842 3 817
Operating expenses 0 21 51 57 66
Profit before impairments 3 347 3 639 3 609 3 785 3 751
Credit impairments 168 8 6 – 43 – 8
Operating profit 3 179 3 631 3 603 3 828 3 759
Tax expense 840 1 026 923 1 075 1 053
Profit for the year 2 339 2 605 2 680 2 753 2 706
Balance sheet 2010 2009 2008 2007 2006
AssetsLoans to credit institutions 36 493 97 590 106 244 66 838 47 232Loans to the public 697 299 672 420 623 401 560 633 510 479Interest-bearing securities 50 99Other assets 10 789 13 838 26 394 11 464 9 538
Total assets 744 581 783 848 756 089 638 935 567 348
Liabilities Amount owed to credit institutions 229 177 192 738 152 776 125 006 99 238Debt securities in issue 451 328 537 771 552 321 464 064 421 648Other liabilities 32 396 23 122 23 380 22 544 19 363Subordinated liabilities 2 389 2 328
Total liabilities 712 901 753 631 728 477 614 003 542 577
Equity 31 680 30 217 27 612 24 932 24 771
Total liabilities and equity 744 581 783 848 756 089 638 935 567 348

INCOME STATEMENT Swedbank Mortgage Annual Report 2010 13
Income statement
Statement of comprehensive income
Group Swedbank Mortgage AB
SEKm Note 2010 2009 2010 2009
Profit for the year reported via income statement 2 339 2 605 2 339 3 377Cash flow hedges: Gains/losses during the period 19 812 812 Income tax relating to components of other comprehensive income 19 - 214 - 214
Total comprehensive income for the year 2 937 2 605 2 937 3 377
Group Swedbank Mortgage AB
SEKm Note 2010 2009 2010 2009
Interest income 20 137 23 148 20 137 23 148
Interest expenses - 16 068 -18 740 - 16 068 -18 740
Net interest income 7 4 069 4 408 4 069 4 408
Dividends received 8 151
Commission income 53 53 53 53
Commission expenses - 576 -679 - 576 -679
Net commissions 9 - 523 -626 - 523 -626
Net gains and losses on financial items at fair value 10 - 206 -131 - 206 -131
Other operating income 11 7 9 7 9
Total income 3 347 3 660 3 347 3 811
Staff costs 12 0 0
Other administrative expenses 13 19 19
Total administrative expenses 19 19
Depreciation/amortisation 14 2 0
Total expenses 21 19
Profit before impairments 3 347 3 639 3 347 3 792
Credit impairments 15 168 8 168 8
Operating profit 3 179 3 631 3 179 3 784
Appropriations 16 840
Tax expense 17 840 1 026 840 1 247
Profit for the year 2 339 2 605 2 339 3 377
Earnings per share 18 101.70 113.26
STATEMENT OF CASH FLOW Swedbank Mortgage Annual Report 2010 1514 Swedbank Mortgage Annual Report 2010 BALANCE SHEET
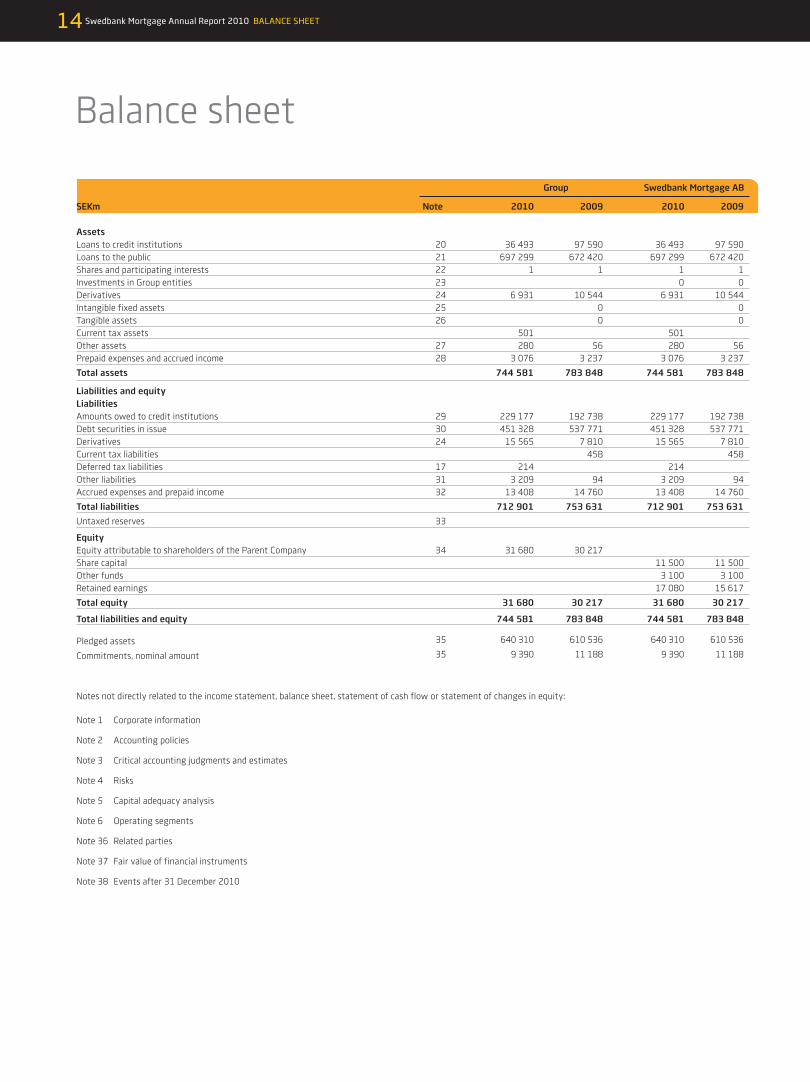
Balance sheet
Group Swedbank Mortgage AB
SEKm Note 2010 2009 2010 2009
Assets Loans to credit institutions 20 36 493 97 590 36 493 97 590Loans to the public 21 697 299 672 420 697 299 672 420Shares and participating interests 22 1 1 1 1Investments in Group entities 23 0 0Derivatives 24 6 931 10 544 6 931 10 544Intangible fixed assets 25 0 0Tangible assets 26 0 0Current tax assets 501 501Other assets 27 280 56 280 56Prepaid expenses and accrued income 28 3 076 3 237 3 076 3 237
Total assets 744 581 783 848 744 581 783 848
Liabilities and equity Liabilities Amounts owed to credit institutions 29 229 177 192 738 229 177 192 738Debt securities in issue 30 451 328 537 771 451 328 537 771Derivatives 24 15 565 7 810 15 565 7 810Current tax liabilities 458 458Deferred tax liabilities 17 214 214 Other liabilities 31 3 209 94 3 209 94Accrued expenses and prepaid income 32 13 408 14 760 13 408 14 760
Total liabilities 712 901 753 631 712 901 753 631
Untaxed reserves 33
Equity Equity attributable to shareholders of the Parent Company 34 31 680 30 217 Share capital 11 500 11 500Other funds 3 100 3 100Retained earnings 17 080 15 617
Total equity 31 680 30 217 31 680 30 217
Total liabilities and equity 744 581 783 848 744 581 783 848
Pledged assets 35 640 310 610 536 640 310 610 536
Commitments, nominal amount 35 9 390 11 188 9 390 11 188
Notes not directly related to the income statement, balance sheet, statement of cash flow or statement of changes in equity:
Note 1 Corporate information
Note 2 Accounting policies
Note 3 Critical accounting judgments and estimates
Note 4 Risks
Note 5 Capital adequacy analysis
Note 6 Operating segments
Note 36 Related parties
Note 37 Fair value of financial instruments
Note 38 Events after 31 December 2010

STATEMENT OF CASH FLOW Swedbank Mortgage Annual Report 2010 15
Statement of cash flow
Group Swedbank Mortgage AB
SEKm 2010 2009 2010 2009
Operating activities Operating profit 3 180 3 631 3 180 3 784Adjustments for non-cash items in operating activities - 2880 2 437 - 2880 2 437Taxes paid - 1 274 -1 426 - 1 274 -1 426Increase/decrease in loans to credit institutions 16 500 3 003 16 500 3 003Increase/decrease in loans to the public - 30 420 -49 115 - 30 420 - 49 115Increase/decrease in holdings of securities 50 50Increase/decrease in amount owed to credit institutions 36 455 40 218 36 455 39 418Increase/decrease in other assets and liabilities, net 225 - 69 225 - 71
Cash flow from operating activities 21 786 - 1 271 21 786 - 1 920
Investing activities Change in fixed assets 650
Cash flow from investing activities 650
Financing activities Issuance of interest-bearing securities 243 224 220 481 243 224 220 481Redemption of interest-bearing securities - 225 452 - 170 372 - 225 452 - 170 372Increase/decrease in other funding - 84 156 - 54 489 - 84 158 - 54 489
Cash flow from financing activities - 66 384 - 4 380 - 66 384 - 4 380
Cash flow for the year - 44 598 - 5 651 - 44 598 - 5 650
Cash and cash equivalents at beginning of the year 60 079 65 730 60 079 65 729Cash flow for the year - 44 598 -5 651 - 44 598 - 5 650
Liquid assets at end of year 15 481 60 079 15 481 60 079
Cash and cash equivalentsCash consist of balances on cash accounts.
Specification of adjustment of non/cash items
Group Swedbank Mortgage AB
SEKm 2010 2009 2010 2009
Unrealised translation differences, bonds in issue - 902 – 376 - 902 – 376 Prepaid expenses and accrued income 160 2 795 160 2 795 Accrued expenses and prepaid income - 1 351 – 754 - 1 351 – 754 Change in value of loans to the public and credit institutions 5 540 97 5 540 97 Change in value of funding and derivatives - 6 327 675 - 6 327 675
Total - 2 880 2 437 - 2 880 2 437
Comment on consolidated statement of cash flowThe statement of cash flow shows receipts and disbursements during the year as well as cash at the beginning and end of the year. The statement of cash flow is reported using the indirect method and is based on operating income for the period and changes in the balance sheet. Operating income is adjusted for changes not included in cash flow from operating activities. Cash flows are reported separately for receipts and disbursements from operating, investing and financing activities.
Operating activitiesCash flow from operating activities is based on operating profit for the year. Adjustments are made for income tax paid and items not included in cash flow from operating activities. Changes in assets and liabilities in operating activities consist of items that are part of regular business activities, such as loans to and borrowings from the public and credit institutions, and that are not attributable to investing and financing activities. The profit generated cash flow includes interest receipts of SEK 20 301m (25 942m) and interest payments, including capitalised interest, of SEK 17 116m (19 630m).
Financing activitiesThe issue and repayment of bond loans with maturities exceeding one year are reported gross. The item “Change in other funding” includes the net change in fund-ing with shorter maturities and high turnover.

NOTES Swedbank Mortgage Annual Report 2010 1716 Swedbank Mortgage Annual Report 2010 STATEMENT OF CHANGES IN EQUITY
Statement of changes in equity
Equity attributable to shareholders of Swedbank Mortgage AB
Other capital Cashflow Group SEKm Share capital contribution hedge Retained earnings Total
Opening balance 1 January 2009 11 500 2 400 13 712 27 612
Total comprehensive income for the year 2 605 2 605
Closing balance 31 December 2009 11 500 2 400 16 317 30 217
Opening balance 1 January 2010 11 500 2 400 16 317 30 217
Group contribution paid - 2000 - 2000
Tax reduction due to Group contributions paid 526 526
Total comprehensive income for the year 598 2 339 2 937
Closing balance 31 December 2010 11 500 2 400 598 17 182 31 680
Statutory Cashflow Non-restricted Swedbank Mortgage AB, SEKm Share capital reserve hedge equity Total
Opening balance 1 January 2009 11 500 3 100 12 241 26 840
Total comprehensive income for the year 3 377 3 377
Closing balance 31 December 2009 11 500 3 100 15 618 30 217
of which, conditional shareholder’s contributions 2 400 2 400
Opening balance 1 January 2010 11 500 3 100 15 618 30 217
Group contribution paid - 2 000 - 2 000
Tax reduction due to Group contributions paid 526 526
Total comprehensive income for the year 598 2 339 2 937
Closing balance 31 December 2010 11 500 3 100 598 16 483 31 680
of which, conditional shareholder’s contributions 2 400 2 400

NOTES Swedbank Mortgage Annual Report 2010 17
1 Corporate information
The consolidated financial statements and the annual report for Swedbank Mortgage AB (publ) for the financial year 2010 were approved for issuance by the Board of Directors and the President on 4 February 2011. Swedbank Mortgage AB, which maintains its registered office in Stockholm, Sweden, is a wholly owned subsidiary of Swedbank AB (publ). The Group’s operations are described in the Board of Directors’ report. The consolidated financial statements and annual report will be adopted by the Parent Company’s Annual General Meeting.
2 Accounting policies
BASIS OF ACCOUNTING The financial reports and the consolidated financial statements are prepared in accordance with the International Financial reporting Standards (IFRS) as adopted by the EU and interpretations of them. The standards are issued by the International Accounting Standards Board (IASB) and the interpretations by the International Financial Reporting Interpretations Committee (IFRIC). The standards and interpretations become mandatory for listed companies’ consolidated financial statements concurrently with their approval by the EU. Complete financial reports refer to:• balance sheet at the conclusion of the period,• statement of comprehensive income for the period,• statement of changes in equity for the period,• cash flow statement for the period, and• notes, comprising a summary of significant accounting policies and other explanatory information.The consolidated financial statements also apply recommendation RFR 1 Complementary accounting rules for groups, issued by the Swedish Financial Reporting Board, the pronouncements of the Swedish Financial Reporting Board, certain complementary rules in the Annual Accounts Act for Credit Institutions and Securities Companies and the regulations and general advice of the Swedish Financial Supervisory Authority. The financial statements are based on the historical cost basis. Subsequent measurements are based on the valuation category of financial instruments. The carrying amounts of financial assets and liabilities subject to hedge accounting at fair value have been adjusted for changes in fair value attributable to the hedged risk. The finan-cial statements are presented in Swedish kronor and all figures are rounded to millions of kronor (SEK m) unless indicated otherwise.
PARENT COMPANYThe Parent Company prepares its financial statements according to the Annual Accounts Act for Credit Institutions and Securities Companies, the regulations of the Swedish Financial Supervisory Authority and recommendation RFR2 of the Swedish Financial Reporting Board.
All amounts in the notes are in millions of Swedish kronor (SEKm) and at book value unless indicated otherwise. Figures in parentheses refer to the previous year.
CHANGES IN ACCOUNTING POLICIES None of the changes in accounting policies affect Swedbank Mortgage’s reporting. On the other hand, the order in which the notes are listed has been changed slightly in the 2010 annual report. Notes relating to risk and capital disclosures have generally been moved to the beginning, while those that are not directly related to individual balance sheet or income statement items have been shifted to the end. The notes have also been revised and complemented to some extent in order to improve information disclosures. In Note 36 Related parties, transactions with companies in the Swedbank Group have been divided between transactions with the Parent Company, Swedbank AB, and transactions with other compa-nies in the Swedbank Group in separate tables.
SIGNIFICANT ACCOUNTING POLICIESPresentation of financial statements (IAS 1)Financial statements provide a structured representation of a compa-ny’s financial position and financial results. The purpose is to provide information on the company’s financial position, financial results and cash flows useful in connection with financial decisions. The financial statements also indicate the results of management’s administration of the resources entrusted to them. Complete financial statements consist of a balance sheet, statement of comprehensive income, state-ment of changes in equity, cash flow statement and notes. Swedbank Mortgage presents the statement of comprehensive income in the form of two statements. A separate income statement contains all revenue and expense items in profit provided that a special IFRS does not require or allow otherwise. Such other revenue and expense items are recognised in other total comprehensive income. The statement of comprehensive income contains the profit recognised in the income statement as well as the components included in other total compre-hensive income.
Consolidated financial statements (IFRS 3, IAS 27)The consolidated financial statements are prepared in accordance with the purchase method and include Swedbank Mortgage AB (publ) and the wholly owned subsidiary Swedbank Skog och Lantbruk AB (dormant).
Assets and liabilities in foreign currency (IAS 21)The consolidated financial statements are presented in SEK, which is also the Group’s functional currency and presentation currency. Transactions in a currency other than the functional currency (for-eign currency) are initially recorded at the exchange rate prevailing at the transaction day. Financial assets, liabilities and derivatives in foreign currency are translated at the rates prevailing at the closing day. All gains and losses on the translation of monetary items and non-monetary items measured at fair value are recognised through profit or loss as changes in exchange rates in net gains and losses on financial items at fair value.
Notes

NOTES Swedbank Mortgage Annual Report 2010 1918 Swedbank Mortgage Annual Report 2010 NOTES
Financial instruments (IAS 32, IAS 39)The large part of the Group’s balance sheet items refers to financial instruments. A financial instrument is any form of agreement which gives rise to a financial asset in one company and a financial liability or equity instrument in another. Cash is an example of a financial asset, while financial liabilities might include an agreement to pay or receive cash or other finan-cial assets. Financial instruments are classified on various lines of the balance sheet such as loans to the public or credit institutions depending on the counterparty. If the financial instrument does not have a specific counterparty or when it is listed on the market, it is classified on the balance sheet among various types of securities. Financial liabilities where the creditor has a lower priority than others are classified on the balance sheet as Subordinated liabilities. A deriva-tive is a financial instrument that is distinguished by the fact that its value changes, for example, due to exchange rates, interest rates or share prices, at the same time that little or no initial net investment is required. The agreement is settled on a future date. Derivatives are reported on separate lines of the balance sheet, either as assets or lia-bilities depending on whether the contract has a positive or negative fair value. Contractually accrued interest is recognised on separate lines on the balance sheet. Financial assets are recognised on the bal-ance sheet on the trade day when an acquisition agreement has been entered into, with the exception of loans and receivables, which are recognised on the settlement day. Financial assets are derecognised when the right to obtain the cash flows from a financial instrument has expired or essentially been transferred to another party. Financial liabilities are removed from the balance sheet when the obligation in the agreement has been discharged, cancelled or expired.
Repurchase transactionA genuine repurchase transaction (repo) is defined as a contract where the parties have agreed on the sale of securities and the sub-sequent repurchase of corresponding assets at a predetermined price. In a repo, the sold security remains on the balance sheet, since the Group is exposed to the risk that the security will fluctuate in value before the repo expires. The payment received is recognised as a financial liability on the balance sheet based on who the counterparty is. Sold securities are also recognised as a pledged asset. The proceeds received for acquired securities, so-called reverse repos, are recognised on the balance sheet as a loan to the selling party.
Financial instruments, recognition (IAS 39)The Group’s financial instruments are divided into the following valu-ation categories: • financial instruments at fair value through profit or loss, • loans and receivables,• held-to-maturity investments, and• other financial liabilities. A few individual holdings of insignificant value have been catego-rised as available-for-sale financial assets in the valuation category available-for-sale. All financial instruments are initially recognised at fair value, which corresponds to cost. For financial instruments that subsequently are not valued at fair value through profit or loss, supplementary entries are made for direct transaction expenses to acquire the financial instrument. Subsequent measurements depend on the valuation cat-egory to which the financial instrument is attributed. Notes to items in the balance sheet with financial instruments indicate how the car-rying amount is divided between valuation categories.
Valuation category at fair value through profit or lossFinancial instruments at fair value through profit or loss comprise instruments held for trading and all derivatives, excluding those des-ignated for hedge accounting according to the method for cash flow hedges. In the notes to the balance sheet, these financial instruments are classified at fair value through profit or loss, trading. This category also includes other financial instruments that upon initial recognition have irrevocably been designated as at fair value, the so-called fair value option. The option to irrevocably measure financial instruments at fair value is used in the Group for individual portfolios of loans, securities in issue and amounts owed to credit institutions, when they together with derivatives essentially eliminate the portfolio’s aggre-gate interest rate risk. The option is used to eliminate the accounting volatility that would otherwise arise because different measurement principles are normally used for derivatives and other financial instru-ments. In the notes to the balance sheet, these financial instruments are classified at fair value through profit or loss, other. The fair value of financial instruments is determined based on quoted prices on active markets. When such market prices are not available, generally accepted valuation models such as discounting of future cash flows are used. The valuation models are based on observ-able market data, such as quoted prices on active markets for similar instruments or quoted prices for identical instruments on inactive markets. For loans measured at fair value where observable market data on the credit margin are not available at the time of measure-ment, the credit margin for the most recent transaction with the same counterparty is used. Changes in value are recognised through profit or loss in net gains and losses on financial items at fair value. Changes in value owing to changes in exchange rates are recognised as changes in exchange rates in the same profit or loss item. Changes in the value of financial liabilities owing to changes in Swedbank Mortgage’s credit worthiness are also recognised separately when they arise. Decreases in value attributable to debtor or issuer insol-vency are attributed to credit impairments.
Valuation category loans and receivablesLoans to credit institutions and the public, categorised as loans and receivables, are recognised on the balance sheet on the settlement day. These loans are measured at amortised cost as long as there is no objective evidence indicating that a loan or group of loans is impaired.Loans are initially recognised at cost, which consists of the loan amount paid out less fees received and any costs that constitute an integral part of the return. The interest rate that produces the loan’s cost as a result of the calculation of the present value of future pay-ments is considered the effective interest rate. The loan’s amortised cost is calculated by discounting the remaining future payments by the effective interest rate. Interest income includes interest payments received and the change in the loan’s amortised cost during the period, which produces a consistent return. On the closing day, it is determined whether there is objective evidence to indicate an impairment need for a loan or group of loans. If, after the loan is initially recognised, one or more events have occurred that negatively impact estimated future cash flows, and the impact can be estimated reliably, impairment is made. The impairment is calculated as the difference between the loan’s car-rying amount and the present value of estimated future cash flows discounted by the loan’s original effective interest rate. Swedbank Mortgage determines first whether there is objective evidence for impairment of each individual loan. Loans for which such evidence is lacking are included in portfolios with similar credit risk characteris-

NOTES Swedbank Mortgage Annual Report 2010 19
tics. These portfolios are subsequently measured collectively in the event objective evidence of impairment exists. Any impairment is then calculated for the portfolio as a whole. Homogenous groups of loans with limited value and similar credit risk that have been individually identified as having objective evidence of impairment are measured individually based on the loss risk in the portfolio as a whole. If the impairment decreases in subsequent periods, previously recognised impairment losses are reversed. Loans are never recognised at a value higher than what the amortised cost would have been if the write-down had not occurred, however. Loan impairments are recognised through profit or loss as credit impairments, which is done either as provisions for individually impaired loans, portfolio provisions or write-offs of impaired loans. Repayments of write-offs and recovery of provisions are recognised within credit impairments. The carrying amount of loans is amortised cost less write-offs and provisions. Impaired loans are those for which it is likely that payment will not be received in accordance with the contract terms. A loan is not impaired if there is collateral that covers the principal, unpaid interest and any late fees by a satisfactory margin.
Valuation category other financial liabilitiesFinancial liabilities that are not recognised as financial instruments at fair value through profit or loss are initially recognised on the trade day at cost and subsequently at amortised cost. Amortised cost is calculated in the same way as for loans and receivables.
Hedge accounting at fair valueHedge accounting at fair value is applied in certain cases when the interest rate exposure in a recognised financial asset or financial liabil-ity is hedged with derivatives. With hedge accounting, the hedged risk in the hedged instrument is also measured at fair value. Both the change in the value of the hedging instrument, the derivative, and the change in the value of the hedged risk are recognised through profit or loss in net gains and losses on financial items at fair value. One requirement to apply hedge accounting is that the hedge has been formally identified and documented. The hedge’s efficiency must be measurable in a reliable way and must be expected to be and dur-ing reported periods have been very effective in offsetting changes in value.
Cash flow hedgesDerivative transactions are sometimes entered into to hedge the exposure to variations in future cash flows resulting from changes in interest rates. These hedges can be recognised as cash flow hedges, whereby the effective portion of the change in the value of the deriva-tive, the hedging instrument, is recognised directly in other total comprehensive income. Any ineffective portion is recognised through profit or loss in net gains and losses on financial items at fair value. When a projected cash flow leads to the recognition of a non-financial item, any gains or losses on the hedging instrument are eliminated from other total comprehensive income and recognised through profit or loss in the same periods that the hedged item affects profit or loss. One of the prerequisites of hedge accounting is that the hedge is formally identi-fied and documented. Its effectiveness must be measurable in a reli-able way and be expected to remain, and during reported periods have been, very effective in offsetting changes in value.
Revenues (IAS 18)The principles of revenue recognition for financial instruments are described in a separate section, Financial instruments, recognition (IAS 39). Interest income and interest expenses for financial instruments calculated according to the effective interest method are recognised as net interest income. Changes in value in the valuation category Financial instruments at fair value through profit or loss as well as all changes in exchange rates between functional and other currencies are recognised in net gains and losses on financial items at fair value. Fees for various ser-vices provided to customers are recognised as income when the ser-vices rendered. Such income is recognised in both commission income and other income.
Tax (IAS 12)Current tax assets and tax liabilities for current and previous periods are measured at the amount expected to be obtained from or paid to tax authorities. Deferred taxes refer to tax on differences between the carrying amount and the tax base, which in the future serves as the basis for current tax. Deferred tax liabilities are tax attributable to taxable temporary differences and must be paid in the future. Deferred tax liabilities are recognised on all taxable temporary differences. Deferred tax assets represent a reduction in future tax attributable to deductible temporary differences, tax loss carry-forwards or other future taxable deductions. Deferred tax assets are tested on each closing day and recognised to the extent it is likely on each closing day that they can be utilised. As a result, a previously unrecognised deferred tax asset is recognised when it is considered likely that a sufficient surplus will be available in the future. Confirmed tax rates on the closing day are used in the calculations. All current and deferred taxes are recognised through profit or loss as tax with the exception of tax attributable to items recognised directly in other total comprehensive income or equity.
Cash and cash equivalents (IAS 7)Cash and cash equivalents consist of cash and balances with central banks and the net claim of overnight deposit receivables and over-night deposit liabilities with maturities up to five days. Cash and cash equivalents also include Treasury bills, other bills and mortgage bonds eligible for refinancing with central banks taking into account reposand short selling.
IFRS 8 Operating segmentsSegment reporting is presented on the basis of management’s perspec-tive and relates to the parts of Swedbank Mortgage that are defined as operating segments. Operating segments are identified on the basis of internal reports to the company’s chief operating decision maker. Swedbank Mortgage has identified the Chief Executive Officer as its chief operating decision maker, while the internal reports used by the CEO to oversee operations and make decisions on allocating resources serve as the basis of the information presented. The accounting poli-cies for an operating segment consist of the above accounting policies and policies that specifically refer to segment reporting. Swedbank Mortgage has three operating segments that meet the requirements of IFRS 8: Private, Corporate, and Forestry and Agriculture. Revenue is distributed with the help of customer interest rates, internal interest rates, commission agreements and relevant distribution factors. Interest income and interest expenses are netted, since the Group’s chief operating decision maker uses net interest income to determine the segment’s result. Expenses are only distrib-

NOTES Swedbank Mortgage Annual Report 2010 2120 Swedbank Mortgage Annual Report 2010 NOTES
uted in internal reports with regard to credit impairments. Items such as changes in value of financial instruments, return on legal equity and other minor items are not distributed to the operating segments. Among balance sheet items, loans to the public are distributed.
NEW STANDARDS AND INTERPRETATIONSThe International Accounting Standard Board (IASB) and International Financial Reporting Interpretations Committee (IFRIC) have issued the following standards, amendments to standards and interpretations that apply in or after 2011. The IASB permits earlier application. For Swedbank to apply them also requires that they be approved by the EU if the amendments are not consistent with previous IFRS rules. Consequently, Swedbank has not applied the following amendments in the 2010 annual report.
Amendment to Financial Instruments: Disclosures (IFRS 7)The amendment will apply to financial years beginning on or after 1 July 2011. The EU has not yet approved the amendment, which estab-lishes additional requirements on quantitative and qualitative disclo-sures of the derecognition of financial assets from the balance sheet when the company retains a continued involvement in the derecog-nised financial assets. If a transfer of financial assets does not result in a derecognition in its entirety, an additional disclosure is required.
Financial Instruments: Recognition and Measurement (IFRS 9)The new standard on the recognition and measurement of financial instruments has not been adopted by the EU, nor is there a timetable when an approval can be expected. The standard is a complete revision and will replace the current standard IAS 39, Financial Instruments: recognition and Measurement. The standard reduces the number of valuation categories for financial assets. The main reporting categories are now amortised cost and fair value through profit or loss. The rules for financial liabilities cor-respond to the existing rules in IAS 39 plus a supplement on how credit risk is presented when financial liabilities are measured at fair value. The change in the credit risk for financial liabilities designated at fair value according to the so-called fair value option is normally presented in other comprehensive income and not in the traditional income statement. This is provided that further inconsistencies do not arise in presentation of any eliminated changes in value. The standard will be complemented by new rules for impairment of financial assets that are categorized as financial assets at amortised cost, new rules for hedge accounting and new rules on derecognition from the balance sheet. IFRS 9 will probably be applied to financial years beginning on or after 1 January 2013.
Effect on Swedbank’s financial reportsThe new IFRS 9 Financial Instruments will affect Swedbank Mortgage’s financial reporting. The scope of the effect cannot be determined at present, since the valuation of Swedbank Mortgage’s financial assets is largely dependent on how the rules on hedge accounting and on the impairment of financial assets in the valuation category amortised cost are eventually worded. A judgment cannot be made until the remaining sections are issued.
3 Critical accounting judgments and estimates
Presentation of consolidated financial statements in conformity with IFRS requires management to make judgments and estimates that affect the recognised amounts for assets, liabilities and dis-closures of contingent assets and liabilities as of the closing day as well as recognised income and expenses during the report period. Management continuously evaluates these judgments and estimates, including those that affect the fair value of financial instruments, provisions for impaired loans and deferred taxes. Management bases its judgments and assumptions on previous experience and several other factors that are considered reasonable under the circumstances. Actual results may deviate from judgments and estimates.
JUDGMENTS
Financial instrumentsWhen financial instruments are valued at fair value, quoted prices on active markets are primarily used. When quoted prices on active mar-kets are not available, various valuation models are used instead. The Group determines when markets are considered inactive and when quoted prices no longer correspond to fair value, requiring valuation models to be used. The company determines which valuation model and which pricing parameters are most appropriate for the individual instrument. All the valuation models Swedbank Mortgage uses are generally accepted and are subject to independent risk control.
The company has determined that the option to measure financial instruments at fair value provides the fairest accounting of a large part of the loan and funding portfolios, since the interest rate risk is hedged through the use of derivatives. A determination is also made for which financial instruments hedge accounting will be used. In both cases the determination is made to avoid accounting volatility where possible. Accounting volatility lacks economic relevance and arises when financial instruments are valued with different measurement principles despite that they financially hedge each other.EstimatesThe company uses various estimates and assumptions about the future to determine the value of certain assets and liabilities.
Financial instruments measured at fair valueWhen financial instruments are measured at fair value according to valuation models, a determination is made which observable market data should be used in those models. The assumption is that quoted prices for financial instruments with similar turnover or were similarly issued will be used. When such prices or components of prices can-not be identified, management must make its own assumptions. As of 31 December 2010 financial liabilities measured at fair value with internal assumptions that have a significant effect on the valuation amounted to SEK 10 096m. A 10 bp change in the assumed valuation rate would result in a change in value of SEK 20m.
Provisions for credit impairments Receivables measured at amortised cost are tested if loss events have occurred. Individual loans are tested initially, followed by groups of loans with similar credit terms and which are not identified individu-ally. A loss event refers to an event that occurred after the loan was paid out and which has a negative effect on projected future cash flows. Determining loss events for groups of loans carries greater

NOTES Swedbank Mortgage Annual Report 2010 21
4 Risks
4a Credit risks
Loans to the public and credit institutions, book values 2010 Loans that are not impaired Impaired loans
Book value before provisions Book Book Book Portfolio value after value before value after
Group and Swedbank Mortgage AB Payments on time Past due provisions provisions provisions Provisions provisions Total
Loans to the public and credit institutions 732 571 1 281 - 146 733 706 142 - 56 86 733 792
Total loans to the public and credit institutions 732 571 1 281 - 146 733 706 142 - 56 86 733 792
Sector/industry Private customers 583 474 1 025 - 101 584 398 101 - 34 67 584 465Real estate management 102 193 256 - 45 102 404 39 - 20 19 102 423Retail, hotels, restaurants 648 648 648Construction 830 830 830Manufacturing 97 97 97Transportation 171 171 171Forestry and agriculture 627 627 627Other corporate lending 4 773 4 773 2 - 2 4 773Municipalities 3 265 3 265 3 265
Total 696 078 1 281 - 146 697 213 142 - 56 86 697 299
Credit institutions 36 493 36 493 36 493
Total loans to the public and credit institutions 732 571 1 281 - 146 733 706 142 - 56 86 733 792
Collateral held as security Residential properties incl. condominiums 632 952 1 025 - 101 633 876 101 -34 67 633 943Other real estate 49 110 256 - 45 49 321 41 - 22 19 49 340Municipalities 14 016 14 016 14 016
Total 696 078 1 281 - 146 697 213 142 - 56 86 697 299
Credit institutions 36 493 36 493 36 493
Total loans to the public and credit institutions 732 571 1 281 - 146 733 706 142 - 56 86 733 792
uncertainty, since a number of different events, such as macroeco-nomic factors, may have had an impact. Loss events include late or non-payments, concessions granted due to the borrower’s financial difficulties, bankruptcy or other financial reconstructions, and local economic developments tied to non-payments, such as an increase in unemployment or decreases in real estate. Where a loss event has occurred, individual loans are classified as impaired loans.
Provisions for impaired loans are made on the difference between estimated value, i.e., estimated future cash flows discounted by the
loan’s original effective interest rate, and carrying amounts according to contractual cash flows.
Assumptions about when in time a cash flow will be received as well as its size determine the size of the provisions. Decisions on provi-sions are therefore based on various calculations and management’s assumptions of current market conditions.
Management is of the opinion that provision estimates are impor-tant because of the complexity of making these estimates.
Risk management is descibed in the board of directors report on page 9-10.

NOTES Swedbank Mortgage Annual Report 2010 2322 Swedbank Mortgage Annual Report 2010 NOTES
Loans to the public and credit institutions, book values 2009 Loans that are not impaired Impaired loans
Book value before provisions Book Book Book Portfolio value after value before value after
Group and Swedbank Mortgage AB Payments on time Past due provisions provisions provisions Provisions provisions Total
Loans to the public and credit institutions 768 582 1 334 -14 769 902 165 -57 108 770 010Total loans to the public and credit institutions 768 582 1 334 -14 769 902 165 -57 108 770 010
Sector/industry Private customers 552 501 960 553 461 112 -35 77 553 538Real estate management 106 931 374 -14 107 291 52 -21 31 107 322Retail, hotels, restaurants 429 429 429Construction 898 898 898Manufacturing 94 94 94Transportation 185 185 185Forestry and agriculture 595 595 595Other corporate lending 4 739 4 739 1 -1 4 739Municipalities 4 620 4 620 4 620
Total 670 992 1 334 -14 672 312 165 -57 108 672 420
Credit institutions 97 590 97 590 97 590
Total loans to the public and credit institutions 768 582 1 334 -14 769 902 165 -57 108 770 010
Collateral held as security Residential properties incl. condominiums 606 861 960 607 821 112 -35 77 607 898Other real estate 45 967 374 -14 46 327 53 -22 31 46 358Municipalities 18 164 18 164 18 164
Total 670 992 1 334 -14 672 312 165 -57 108 672 420
Credit institutions 97 590 97 590 97 590Total loans to the public and credit institutions 768 582 1 334 -14 769 902 165 -57 108 770 010
4a Credit risks, cont.

NOTES Swedbank Mortgage Annual Report 2010 23
Provisions Group and Swedbank Mortgage AB 2010 2009
Opening balance 71 77
Provisions for the year 11 10Recoveries of previous provisions - 12 -17Provisions during the fiscal period, for loans that are not impaired 132 1
Closing balance 202 71
Total provision ratio for impaired loans, % (including portfolio provisions for individually assessed loans in relation to book value before provision for individually identified impaired loans), % 141.8% 43.1%Provision ratio for individually identified impaired loans, % 39.5% 34.8%
Specified above are the reserves allocated for impaired loans as well as for other lending where loss events have occurred but where individual loans have not yet been identi-fied. Loss events include late or non-payments, situations where the borrower is likely to go bankrupt and domestic or local economic developments tied to non-payments, such as diminished asset values.
Credit risk exposure on loans to the public according to the internal risk classification (nominal value before provisions) 2010 2009
Private Forestry & Private Forestry &Exposure at default Riskgrades customers Corporates agriculture Total customers Corporates agriculture Totalt
Defaults Default 444 131 105 680 474 136 85 695High risk 0-5 3 700 3 815 1 531 9 046 3 890 5 554 1 547 10 991Augmented risk 6-8 5 555 13 395 4 764 23 714 6 057 14 089 4 784 24 930Normal risk 9-12 18 113 34 692 15 247 68 052 18 426 39 402 13 787 71 615Low risk 13-21 489 227 79 428 24 807 533 462 458 693 74 366 23 112 556 171Non-rated 6 8
Total 517 039 131 461 46 454 694 960 487 541 133 547 43 315 664 410
Impaired, past due, and restructured loans Group and Swedbank Mortgage AB 2010 2009
Impaired loans Book value before provisions 142 165Provisions for the year - 56 -57Book value after provisions 86 108
Net impaired loans ratio, % 0.01 0.02
Gross impaired loans ratio, % 0.02 0.02
Book value of impaired loans returned in status to normal loans during the period 22 41
Past due loans that are not impaired Valuation category, loans and receivables Loans past due, 5-30 days 147 174Loans past due, 31-60 days 107 55Loans past due, 61 days or more 71 83
Valuation category, fair value through profit or loss Loans past due, 5-30 days 466 542Loans past due, 31-60 days 248 222Loans past due, 61 days or more 242 258
Total 1 281 1 334
4a Credit risks, cont.

24 Swedbank Mortgage Annual Report 2010 NOTES
Remaining maturity, 2010 Without maturity Payable date/discount Group and Swedbank Mortgage AB on demand < 3 mths 3 mths-1 yr 1-5 yrs 5-10 yrs > 10 yrs effect* Total
AssetsLoans to credit institutions 15 493 4 500 10 500 6 000 36 493Loans to the public 645 13 392 30 359 34 078 616 487 2 339 697 299Derivatives 147 02 901 3 419 200 -173 437 6 931Other assets 3 858 3 858
Total assets 15 493 5 292 26 793 39 778 34 278 616 314 6 633 744 581
Liabilities Amounts owed to credit institutions 123 384 40 578 65 215 229 177Debt securities in issue 16 877 83 610 300 054 45 481 13 207 - 7 901 451 328Derivatives 616 3 764 12 313 4 978 2 275 - 8 381 15 565Other liabilities 16 831 16 831
Total liabilities 140 877 127 952 377 582 50 459 15 482 549 712 901 Remaining maturity, 2009 Without maturity Payable date/discountGroup and Swedbank Mortgage AB on demand < 3 mths 3 mths-1 yr 1-5 yrs 5-10 yrs > 10 yrs effect* Total
Assets Loans to credit institutions 61 090 16 500 20 000 97 590Loans to the public 1 938 5 733 30 270 35 377 591 020 8 081 672 420Derivatives -138 7 202 3 728 -4 -306 62 10 544Other assets 3 294 3 294
Total assets 62 890 29 435 53 998 35 373 590 714 11 437 783 848
Liabilities
Amounts owed to credit institutions 63 879 84 491 44 321 30 16 192 738Debt securities in issue 31 087 207 971 242 014 28 709 14 332 13 658 537 771Derivatives 705 2 396 4 523 973 253 -1 040 7 810
Other liabilities 15 313 15 313
Total liabilities 95 671 294 858 290 858 29 712 14 585 27 947 753 631
* Refers to discount effect for all items except other assets and other liabilities where without maturity date applies.
4b Summary of maturities
In the summary of maturities, undiscounted contractual cash flows are distributed on the basis of remaining maturities until the agreed time of maturity. Changes in value and items without an agreed maturity date where the probable realisation date has not been determined are reported in the column “Without maturity date/change in value”. Liquidity management is de-scribed in the Board of Directors’ report on page 8. Funding, and page 9, Risk management.
NOTES Swedbank Mortgage Annual Report 2010 25

4c Interest rate risk
Interest risk is measured as the change in the value of interest-bearing assets and liabilities resulting from an increase of one percentage point in all market rates (for valuation principles, see note 2). The effect of such an increase would have reduced the fair value of all interest-bearing assets and liabilities, including derivatives, by SEK 695m (75) as of 31 December 2010. An increase of one percentage point in all market interest rates as of 31 December 2010 would have reduced net gains and losses on financial items by SEK 303m (214) for the portion of Swedbank Mortgage’s balance sheet measured at fair value through profit or loss.
Group and Swedbank Mortgage AB 2010 <=3 mths 3-6 mths 6-12 mths 1-2 yrs 2-3 yrs 3-4 yrs 4-5 yrs 5-10 yrs > 10 yrs Total
SEK 125 - 28 - 452 - 167 - 245 - 111 151 1 31 - 695Foreign currency
Total 125 - 28 - 452 - 167 - 245 - 111 151 1 31 - 695
of which financial instruments measured at fair value SEK 52 - 106 - 235 - 123 - 30 - 81 163 26 31 - 303Foreign currency
Total 52 - 105 - 235 - 123 - 30 - 81 163 26 31 - 303
Group and Swedbank Mortgage AB 2009 <=3 mths 3-6 mths 6-12 mths 1-2 yrs 2-3 yrs 3-4 yrs 4-5 yrs 5-10 yrs > 10 yrs Total
SEK - 45 157 310 - 247 - 77 - 51 - 98 - 68 42 - 75Foreign currency
Total - 45 157 310 -247 - 77 - 51 - 98 - 68 42 - 75
of which financial instruments measured at fair value SEK - 75 0 - 4 - 230 - 50 28 14 61 41 - 214Foreign currency
Total - 75 0 - 4 - 230 - 50 28 14 61 41 - 214
NOTES Swedbank Mortgage Annual Report 2010 25

NOTES Swedbank Mortgage Annual Report 2010 2726 Swedbank Mortgage Annual Report 2010 NOTES
4d Currency distribution
Group and Swedbank Mortgage AB, 2010 SEK EUR CHF NOK Other Total
Assets Loans to credit institutions 36 493 36 493Loans to the public 697 299 697 299Other assets, undistributed 10 789 10 789
Total assets 744 581 744 581
Liabilities Amounts owed to credit institutions 229 177 229 177Debt securities in issue and subordinated liabilities 339 915 92633 9 872 5 446 3 462 451 328Other liabilities, undistributed 32 396 32 396
Total liabilities 601 488 92 633 9 872 5 446 3 462 712 901
Other assets and liabilities, including positions in derivatives 92 633 9 872 5 446 3 462 111 413Net position in currency Group and Swedbank Mortgage AB, 2009 SEK EUR CHF NOK Other Total
Assets Loans to credit institutions 97 590 97 590Loans to the public 672 420 672 420Interest-bearing securities 0 0Other assets, undistributed 13 838 13 838
Total assets 783 848 783 848
Liabilities Amounts owed to credit institutions 192 738 192 738Deposits/borrowings from the public 0 0Debt securities in issue and subordinated liabilities 432 624 92 402 1 701 482 10 562 537 771Other liabilities, undistributed 23 123 23 123
Total liabilities 648 484 92 402 1 701 482 10 562 753 631
Other assets and liabilities, including positions in derivatives 92 402 1 701 482 10 562 105 147Net position in currency
The capital adequacy regulations express the legislator’s perception of how much capi-tal, designated as the capital base, a credit institution must have in relation to the size of the risks it faces. In accordance with the Capital Adequacy and Large Exposures Act, the capital base must at a minimum correspond to the sum of the capital requirement for credit risks, market risks and operating risks. Accordingly, the capital quotient, i.e., the capital base divided by the capital requirement, must be greater than 1.0.
Swedbank also formulates and documents its own methods and processes for evalua-ting the Group’s capital requirements. This evaluation includes Swedbank Mortgage. The capital requirement is determined systematically on the basis of the total level of risks to which Swedbank may be exposed. All risks are taken into account, including risks other than those included in the calculation of the capital requirement. The capi-tal requirement constitutes the buffer that is required in order to protect Swedbank from future losses, with the objective of fulfilling the minimum capital requirements and maintaining access to capital markets.
Swedbank Mortgage AB
Capital adequacy 2010 2009
Capital base 30 968 29 744Capital requirement 26 556 24 844Capital surplus 4 412 4 900Capital quotient 1.17 1.20Risk-weighted amount 331 945 310 556Tier 1 capital ratio, % 9.3 9.6Capital adequacy ratio, % 9.3 9.6
Swedbank Mortgage AB
Capital base 2010 2009
Tier 1 capital 30 968 29 744
Total 30 968 29 744
Swedbank Mortgage AB
Tier 1 capital 2010 2009
Equity according to balance sheet in annual report Deferred tax assets 31 680 30 217Intangible assets - 10 Capital share of accrual reserve - 598 Deduction internal risk classification, provision surplus - 104 - 473
Total 30 968 29 744
5 Capital adequacy
Capital adequacy analysis

NOTES Swedbank Mortgage Annual Report 2010 27
Swedbank Mortgage AB
Capital requirement 2010 2009
Credit risks 4 211 4 194Operating risks * 471 467Supplement, transitional rules 21 874 20 184
Total 26 556 24 844
* According to standard method, retail bank
Credit risks according to IRB
2010 2009
Exposure after Average Capital Exposure after Average Capital credit risk risk require- credit risk risk require- Swedbank Mortgage AB mitigant weight ment mitigant weight ment
Institutional exposures 279 10.3% 2 369 16.5% 5Corporate exposures 30 402 70.9% 1 724 30 448 69.3% 1 688Retail exposures 652 891 4.7% 2 471 619 454 5.0% 2 493Non-credit-obligation asset exposures 181 100.0% 14 106 100.0% 8Total 683 753 7.7% 4 211 650 378 8.1% 4 194
Internal Capital Adequacy Assessment Process (ICAAP)
Definition
The Internal Capital Adequacy Assessment Process is the bank’s process to ensure that Swedbank Mortgage is adequately capitalised to cover its risks and to conduct and develop its operations. The internal capital adequacy assessment therefore takes into account all relevant risks that arise within Swedbank Mortgage.
Development 2010
Since the 2009 ICAAP, the models and the calculations have been further elabo-rated, notably regarding concentration risks and the further involvement of senior management and business units. Swedbank Mortgage’s ICAAP is a process where business units are involved in measuring risks and incorporating the results in busi-ness strategies. Given the turmoil and the great uncertainty in the global economy, the 2010 ICAAP was based on exceptionally negative scenarios. The results shown in the sections below indicate that Swedbank Mortgage is adequately capitalised as of 31 December 2009. The ICAAP was approved by the Board of Directors in December 2010.
Measurement
Swedbank Mortgage’s internal capital adequacy assessment is based on two dif-ferent methods: the Building Block model and the Scenario model. Building Block is a static model with an evaluation horizon of one year, while Scenario is a dynamic model with a multi-year horizon. Since the capital adequacy assessment represents the bank’s own estimation of its requirement according to Pillar 2, the assessment may deviate, upwards or downwards, from the corresponding capital requirement according to Pillar 1.
Types of risk
Risks that have been identified and for which Swedbank Mortgage has allocated mitigating capital are:
• Credit risk (incl. concentration risk)
• Market risk (incl. interest rate risk outside trading activities)
• Operational risk
• Earnings volatility risk
Other forms of strategic risk and reputational risk usually are not dealt with in capital adequacy simulations, even though the capital buffer also implicitly protects against such risks.
These risks remain an important part of Swedbank Mortgage’s potential risk expo-sure, however, which is why they are carefully monitored and managed. Liquidity constraints may arise as a result of an imbalance between risks and capital. The Internal Capital Adequacy Assessment Process is designed to ensure that such imbalances do not arise. Consequently, a conservative view of liquidity risks is cru-
cial to the capital process.
Total capital requirement
The ultimate capital need for Swedbank Mortgage according to the assessment is given through a combination of the Building Block model and the Scenario model, together SEK 4.7bn, and through current transition rules from Basel I to Basel II. The transition rules account for SEK 20.2bn of Swedbank Mortgage’s capital supply. As of 31 December 2009 the total capital requirement according to the two models and the transition rules was SEK 24.9bn.
The total capital supply as per the same date amounted to SEK 29.7bn. As long as Swedbank Mortgage maintains a larger capital supply than the Pillar 2 requirement, all risks are covered, including the negative effects that an adverse scenario may have on the capital supply. An important conclusion of the 2010 Internal Capital Adequacy Assessment Process was that Swedbank Mortgage’s capital buffer held at 31 December 2009 was adequate to maintain a Tier 1 capital ratio exceeding the minimum capital requirements by a comfortable margin even in the unlikely but pos-sible event of adverse macroeconomic developments that are extremely unfavour-able to Swedbank Mortgage.
To estimate the ultimate capital need, these quantitative calculations are included in a general assessment and discussion, which consider analyses of the market’s expectations, competitive comparisons and other factors.
Economic conditions remained highly uncertain, and the consensus view in the mar-ket that banks are in need of higher capitalisation was reinforced.
Swedbank Mortgage AB
Capital requirement for credit risks 2010 2009
Credit risks according to IRB 4 211 4 194 of which institutional exposures 2 5 of which corporate exposures 1 724 1 688 of which retail exposures 2 471 2 493 of which non-credit-obligation asset exposures 14 8

NOTES Swedbank Mortgage Annual Report 2010 2928 Swedbank Mortgage Annual Report 2010 NOTES
7 Net interest income
Group Swedbank Mortgage AB
2010 2009 2010 2009
Interest income Loans to credit institutions 350 883 350 883Loans to the public 19 787 22 265 19 787 22 265
Total 20 137 23 148 20 137 23 148
Interest expenses Amount owed to credit institutions - 3 200 – 4 185 - 3 200 – 4 185Debt securities in issue - 12 656 – 14 445 - 12 656 – 14 445 of which derivatives 3 178 2 156 3 178 2 156 of which commission for state guarantee - 8 – 105 - 8 – 105Other - 92 – 110 - 92 – 110 of which state stabilisation fee - 76 – 63 - 76 – 63
Total - 16 068 – 18 740 - 16 068 – 18 740
Total net interest income 4 069 4 408 4 069 4 408
Average balance Loans to credit institutions 72 255 116 523 72 255 116 523Loans to the public 682 641 653 333 682 641 653 333Amount owed to credit institutions 208 369 210 466 208 369 210 466Debt securities in the issue 504 488 530 214 504 488 530 214Interest income on financial assets at amortised cost 6 537 6 234 6 537 11 631Interest income on financial liabilities at amortised cost 11 324 6 779 11 324 4 309Interest income on impaired loans 3 4 3 4
8 Dividends received
Swedbank Mortgage AB 2010 2009
Shares and participating interests in Group companies 151
Total 151
9 Net commissions
Group and Swedbank Mortgage AB 2010 2009
Commission incomePayment processing 53 53
Total 53 53
Commission expensesCommissions to savings banks - 562 – 661BKN fees - 3 – 2Market maker fees - 11 – 11Other commissions 0 – 5
Total - 576 – 679
Total net commissions - 523 – 626
2010 2009
Forestry and Forestry and Group and Swedbank Mortgage AB Private Corporate Agriculture Total Private Corporate Agriculture Total
Net interest income 2 597 439 252 3 288 2 776 520 267 3 563Net commissions - 426 - 28 - 69 - 523 – 521 – 33 – 72 – 626
Total income 2 171 411 183 2 765 2 255 487 195 2 937
Credit impairments 125 42 1 168 20 – 14 2 8
Operating profit 2 046 369 182 2 597 2 235 501 193 2 929
Lending to the public 531 229 119 435 46 635 697 299 503 737 124 809 43 874 672 420
Reconciliation between segment reporting and financial report 2010 2009
Net interest Operating Net interest Operating Group income Income profit income Income profit
Total segments 3 288 2 765 2 597 3 563 2 937 2 929Return on legal equity 781 781 781 845 845 845Net gains and losses on financial items at fair value - 206 - 206 -131 - 131Other income 7 7 9 9Other expenses -21
Total financial report 4 069 3 347 3 179 4 408 3 660 3 631
Results and balances in the Private segment relate to consumer loans to finance residential housing. The corresponding items for Corporate relate to loans to municipal hou-sing companies and tenant-owner associations with underlying collateral in multi-family housing. The Agriculture and Forestry segment comprises loans to finance forest and agricultural properties. Items in operating profit that are not included in the segments consist of changes in the value of financial instruments, the return on legal equity and other undistributed minor items.
6 Operating segments

NOTES Swedbank Mortgage Annual Report 2010 29
10 Net gains and losses on financial items at fair value
Group and Swedbank Mortgage AB 2010 2009
Valuation category, fair value through profit or lossTrading and derivativesInterest-bearing securities - 11 550 – 10 572
Total - 11 550 – 10 572
OtherInterest-bearing securities 11 162 10 310
Total 11 162 10 310
Hedge accounting at fair valueHedging instruments - 1 012 122Hedged item 1 014 – 153
Total 2 – 31
Financial liabilities at amortised cost 75
Valuation category, loans and receivables 105 162
Total net gains and losses on financial items at fair value - 206 -131
Compensations During the financial year 2009 board members received SEK 125 000 in remunera-tion. As of 2010 board members receive remuneration from Swedbank AB.
Benefits for senior executives Group Swedbank Mortgage AB
2010 2009 2010 2009
Loans to President 1 9 1 8Loans to Board members 2 11 2 6No. of persons with loans 2 6 2 2 The group has not pledged any assets, other security or accepted any contingent liabilities on behalf of any members of the company’s management. Information on senior executives The number of senior executives as of 31 December 2010 was 5 (5).
Number of employeesAs of 1 November 2008 personnel who were previously employed by Swedbank Mortgage AB are employed by Swedbank AB.
12 Remuneration and benefits for senior executives
11 Other operating incomeGroup and Swedbank Mortgage AB 2010 2009
Other operating income 7 9
Total other operating income 7 9
Group and Swedbank Mortgage AB 2010 2009
IT expenses 8Travel and entertainment 0Audit 2Consulting 0Marketing 0Outside services 3Other 6
Total 19
Group and Audit Consultation
Swedbank Mortgage AB 2010 2009 2010 2009
Remuneration to the Group’s auditors
Deloitte 1.5 0.2
Total 1.5 0.2
As of 2010 the Group’s auditors receive remuneration from Swedbank AB.
13 Other administrative expenses
14 Depreciation/amortisation of tangible and intangible fixed assets Group Swedbank Mortgage AB
2010 2009 2010 2009
Equipment 0 0Intangible fixed assets 2 0
Total 2 0
15 Net credit impairments
Group and Swedbank Mortgage AB 2010 2009
Provisions for loans that individually are assessed as impairedProvisions 11 9Reversed of previous provisions - 7 – 16Provisions for homogenous groups of impaired loans, net 0 1
Total 4 – 6
Portfolio provisions for loans that individually are not assessed as impaired 132 1
Write-offsEstablished losses 38 22Utilisation of previous provisions - 5 – 1Recoveries - 1 – 8
Total 32 13
Net credit impairments 168 8
Credit impairments by valuation categoryLoans and receivables 67 2Fair value through profit or loss 101 6
Total 168 8
Credit impairments by borrower category, General publicWrite-off and provisions 181 33Recoveries from previous years’ actual credit impairments - 13 – 25
Total 168 8
Swedbank Mortgage has changed its valuation model for portfolio provisions. The new model was implemented during 2010 and resulted in a one-time effect amount-ing to SEK 153m.

NOTES Swedbank Mortgage Annual Report 2010 3130 Swedbank Mortgage Annual Report 2010 NOTES
21 Loans to the public 20 Loans to credit institutions
18 Earnings per share
Earnings per share are calculated by dividing net profit attributable to the share-
holders of the parent by the weighted average number of shares outstanding.
2010 2009
Profit attributable to shareholders of the company 2 339 2 605Average number of shares outstanding, million 23 23Earnings per share, SEK 101.70 113.26
No other transactions involving shares or potential shares have taken place between the balance sheet date and the date of completion of these financial statements.
Group and Swedbank Mortgage AB 2010 2009
Valuation category, loans and receivables Swedish public 257 346 176 308
Total 257 346 176 309
Valuation category, fair value through profit or loss Other Swedish public * 439 953 496 111
Total 439 953 496 111
Total loans to the public 697 299 672 420
* Nominal amount 437 412 488 030Number of loans 1 567 481 1 525 508
Group and Swedbank Mortgage AB 2010 2009
Valuation category, loans and receivables Swedish banks 36 493 97 590
Total 36 493 97 590
2010 2009
Before tax Deferred Current Net of tax Before tax Deferred Current Net of tax Group and Swedbank Mortgage AB amount tax tax amount amount tax tax amount
Cash flow hedges 812 214 598
Other comprehensive income 812 214 598
19 Tax for each component in other comprehensive income
17 Tax
Group S wedbank Mortgage AB
Tax expense 2010 2009 2010 2009
Tax related to previous years 4 71 4 71Current tax 836 1 176 836 1 176Deferred tax - 221
Total 840 1 026 840 1 247
Group The tax expense corresponds to 26.3% of the Group’s pre-tax profit. The difference between the Group’s tax expense and the tax expense based on current tax rates is explained below:
2010 2009
SEKm per cent SEKm per cent
Result 840 26.30 1 026 28,26
26.3% of pre-tax profit 840 26.30 955 26,30Difference 0 0,0 - 71 - 2,0The difference consists of the following items: Tax from previous years 4 0.1 - 71 2,0Tax-exempt income/ non-deductible expenses 0 0 0 0
Total 4 0.1 - 71 2,0
Balance sheet Income statement
Group 2010 2009 2010 2009
Deferred tax liabilities Untaxed reserves 214 -221Amortisation of intangible assets 0
Total 214 -221
Swedbank Mortgage AB The tax expense corresponds to 26.3% of the company’s pretax profit. The dif-ference between the company’s tax expense and the tax expense based on current tax rates is explained below: 2010 2009
SEKm per cent SEKm per cent
Result 840 26.30 1 247 2726.3% of pre-tax profit 840 26.30 1 216 26
Difference 0 0,0 - 31 -0,7
The difference consists ofthe following items: Tax from previous years 4 0,1 - 71 -1,5Tax-exempt dividends 0 0,0 39 0,8Other tax-exempt income/ non-deductible expenses 0 0,0 1 0,0
Total 4 0,1 - 31 -0,7
16 Appropriations
Swedbank Mortgage AB 2010 2009
Untaxed reserves
Tax allocation reserve 840
Total 840
The maximum credit risk exposure for lending measured at fair value corresponds to the carrying amount.

NOTES Swedbank Mortgage Annual Report 2010 31
22 Shares and participating interests
Book value Cost
Group & Swedbank Mortgage AB 2010 2009 2010 2009
Condominiums 1 1 1 1
Total 1 1 1 1
of which, unlisted 1 1 1 1
23 Investments in Group entities
Shares in subsidiaries, Swedbank Mortgage AB’s shareholdings, Quota value/ Book 31 December 2010 Number share value
Swedbank Skog och Lantbruk AB 100% * 200 500,0 0,1
Total 200 500,0 0,1
* Corporate identification number 556061-5592, Stockholm.
24 Derivatives
Periods when hedged cash flows are expected to occur and when they are expected to affect the income statement
< 1 year 1–3 years 3–5 years 5-10 years > 10 years
Cash inflows (assets)
Cash outflows (liabilities) 1 436 13 592 34 950 30 890 14 492
Net cash flows - 1 436 - 13 592 - 34 950 - 30 890 - 14 492
Remaining contractual term to maturity, nominal amountPositive values
Negative values
Group and Swedbank Mortgage AB < 1 year 1-5 years > 5 years 2010 2009 2010 2009 2010 2009
Derivatives in hedge accounting
Fair value hedge
Interest-rate swaps 42 700 145 190 43 723 231 613 115 463 2 534 1 053 1 080 185
Cash flow hedge
Currency swaps 44 892 42 032 86 924 8 506
Total 42 700 190 082 85 755 318 537 115 463 2 534 1 053 9 586 185
Other derivatives
Interest-rate-related
Options 2 850 15 500 18 350 24 150 30 58
Forward contracts 2 262 8 2 270 144 029 0 9 0
Swaps 25 643 83 083 22 717 131 443 194 293 2 594 6 387 4 098 6 394
Currency-related
Forward contracts 7 195 71 27
Swaps 15 562 18 784 10 075 44 421 100 952 1 773 2 966 1 881 1 204
Total 46 317 117 375 32 792 196 484 470 619 4 397 9 491 5 979 7 625
Grand total 89 017 307 457 118 547 515 021 586 082 6 931 10 544 15 565 7 810
of which cleared 3 821 4

NOTES Swedbank Mortgage Annual Report 2010 3332 Swedbank Mortgage Annual Report 2010 NOTES
33 Untaxed reserves
Swedbank Mortgage AB 2010 2009
Opening balance 840Reversal of/provision to tax allocation reserve -840
Closing balance 0
Group and Swedbank Mortgage AB 2010 2009
Cost Opening balance 40
Closing balance 40
Accumulated amortisation Opening balance - 38
Amortisation for the year - 2
Closing balance - 40
Book value 0
25 Intangible fixed assets
28 Prepaid expenses and accrued income
29 Amounts owed to credit institutions
30 Debt securities in issue
31 Other liabilities
32 Accrued expenses and prepaid income
26 Tangible assets
27 Other assets
Group and Swedbank Mortgage AB 2010 2009
Current assets Repossessed assets 0
Total 0
Fixed assets Equipment 0
Total 0
Total 0
Group and Swedbank Mortgage AB Equipment 2010 2009
Cost Opening balance 0
Closing balance 84
Accumulated depreciation Opening balance - 84
Less sales and disposals 0Depreciation for the year 0
Closing balance - 84
Book value 0
Group and Swedbank Mortgage AB 2010 2009
Security settlement claims 80 Other assets 200 56
Total other assets 280 56
Group and Swedbank Mortgage AB 2010 2009
Accrued interest income 3 071 3 234Prepaid expenses and accrued income 5 3
Total 3 076 3 237
Group and Swedbank Mortgage AB 2010 2009
Valuation category, other financial liabilities Swedish banks 219 081 147 188
Total 219 081 147 188
Valuation category, fair value through profit or loss Other* Swedish banks 10 096 45 550
Total 10 096 45 550
Total 229 177 192 738
* Nominal amount 10 096 45 534
Group and Swedbank Mortgage AB 2010 2009
Valuation category, other financial liabilities Commercial paper 1 430 Bond loans 313 198 225 810Change in value due to hedge accounting - 861 153Other 1 349 66 227
Total 315 116 292 190
Valuation category, fair value through profit or loss Other * Commercial paper 100 20 861Bond loans 136 112 224 720
Total 136 112 245 581
Total 451 328 537 771
* Nominal amount 141 127 236 688
Group and Swedbank Mortgage AB 2010 2009
Group contribution to parent company 2 000
Security settlement liabilities 1 033 7Other 176 87
Total 3 209 94
Group and Swedbank Mortgage AB 2010 2009
Accrued interest expenses 12 726 13 995Accrued expenses and prepaid income 682 765
Total 13 408 14 760

NOTES Swedbank Mortgage Annual Report 2010 33
Group and Swedbank Mortgage AB 2010 2009
Assets pledged Assets pledged for own liabilities* 640 207 610 456Securities pledged for forward contracts 103 80
Commitments, nominal amount Loans granted but not paid 9 390 11 188
Total 649 700 621 724
Nominal amounts for interest, equity and currency related contracts are reported in note 24 Derivatives.
* Consists of collateral for covered bonds. This collateral is reported as the customer’s nominal loan principal, including accrued interest.
35 Contingent liabilities, assets pledged and commitments
36 Related parties 34 Equity according to Annual Accounts Act ÅRKLChanges in equity during the period are reported in the statement of the changes in equity.
Group Swedbank Mortgage AB
2010 2009 2010 2009
Restricted equity Share capital 11 500 11 500 11 500 11 500Statutory reserve 3 100 3 100 3 100 3 100
Total 14 600 14 600 14 600 14 600
Non-restricted equity Conditional shareholder’s contribution 2 400 2 400 2 400 2 400Retained earnings 14 680 13 217 14 680 13 217
Total 17 080 15 617 17 080 15 617
Total equity 31 680 30 217 31 680 30 217
2010 2009
Number of shares Approved and issued, millions 23 23
The quote value per share is SEK 0.50. All shares are fully paid.
I. Parent company Swedbank Mortgage AB is a wholly owned subsidiary of Swedbank AB (publ).The following headings in the balance sheet and statement of comprehensive income include transactions with Swedbank AB in the amounts specified. Group Swedbank Mortgage AB
2010 2009 2010 2009
Group receivables Loans to credit institutions 36 481 97 576 36 481 97 576
Derivatives 6 831 10 411 6 831 10 411
Other assets 29 29 29 29
Prepaid expenses and accrued income 173 562 173 562
Total 43 514 108 578 43 514 108 578
Group liabilities
Amounts owed to credit institutions 229 138 192 699 229 138 192 699
Debt securities in issue 39 364 176 012 39 364 176 012
Derivatives 15 565 7 767 15 565 7 767
Other liabilities 2 000 2 000
Accrued expenses and prepaid income 4 548 7 482 4 548 7 482
Total 290 615 383 960 290 615 383 960
Statement of comprehensive income
Interest income 520 1 050 520 1 050
Interest expenses - 2 674 - 7 236 - 2 674 - 7 236
Other administrative expenses -4 -4
Total - 2 154 -6 190 - 2 154 -6 190
II. Other companies in the Swedbank Group The following headings in the balance sheet and statement of comprehensive income include transactions with other companies in the Swedbank Group in the amounts specified.
Group Swedbank Mortgage AB
2010 2009 2010 2009
Group liabilities Securities in issue 3 600 3 600 Accrued expenses and prepaid income 136 167 136 167
Total 3 736 167 3 736 167
Statement of comprehensive income Commission expenses - 136 -167 - 136 -167
Total - 136 -167 - 136 -167
III. Senior executives See note 12 for further information.

NOTER Swedbank Mortgage Annual Report 2010 3534 Swedbank Mortgage Annual Report 2010 NOTES
A comparison between the book value and fair value of the Group’s financial assets and financial liabilities according to the definition in IAS 39 is presented below. The fair value of other assets and liabilities is considered equivalent to book value.
Group 2010 2009 Book value Fair value Difference Book value Fair value Difference
AssetsFinancial Assets Loans to credit institutions 36 493 36 503 10 97 590 97 609 19 Loan receivables 36 493 36 503 10 97 590 97609 19Loans to the public 697 299 696 789 - 510 672 420 674 560 2 140 Loan receivables 257 346 256 836 - 510 176 309 178 449 2 140 Fair value through profit or loss 439 953 439 953 0 496 111 496 111 0Shares and participating interests 1 1 0 1 1 0 Available for sale investments 1 1 0 1 1 0Derivatives 6 931 6 931 0 10 544 10 544 0Non-financial assets 3 857 3 356 0 3 293 3 293 0
Total 744 581 744 081 - 500 783 848 786 007 2 159
Liabilities Financial liabilities Amounts owed to credit institutions 229 177 229 121 - 56 192 738 193 134 397 Other financial liabilities 219 081 219 025 - 56 147 188 147 585 397 Fair value through profit or loss 10 096 10 096 0 45 500 45 550 0Debt securities in issue, etc. 451 328 451 002 - 326 537 771 540 213 2 442 Other financial liabilities 315 116 314 790 - 326 292 190 294 632 2 442 Fair value through profit or loss 136 212 136 212 0 245 581 245 581 0Derivatives 15 565 15 565 0 7 810 7 810 0Non-financial assets 16 831 16 831 0 15 313 15 313 0
Total 712 901 712 519 - 382 753 631 756 469 2 839
Determination of fair value of financial instruments The methods for determining fair values are divided into three levels based on the degree of observability in the valuation.
The fair value of financial instruments is primarily determined based on quoted market prices on an active market (Level 1). This category contains bonds in issue that are traded on an active market. When quoted market prices are unavailable for the instrument in its entirety, generally accepted valuation models, such as the discounting of future cash flows, are used. These valuation models are based on observable market inputs (Level 2) in the form of prices of financial instruments that are as similar as possible and for which transactions have been executed. This category primarily includes less liquid debt securities in issue, derivatives and loans to the public. The value change in own credit worthiness has been determined by calculating the difference between the value based on current prices from external dealers for own credit worthiness and the value based on own credit worthiness in own not quoted issues at the origination date.
The change in the value of securities in issue attributable to changes in credit risk amounted to SEK -85m during the period and is recognised in net gains and losses on financial items at fair value. The accumulated change in value amounted to SEK -13m. For loans to the public where there are no observable market inputs for credit margins at the time of measurement, the credit margin of the last transaction executed with the same counterparty is used. The change in the value of loans to the public attributable to changes in credit risk amounted to SEK -101m during the period and is recognised as credit impairments. The amount is determined as the difference between current estimated creditworthiness and estimated creditworthiness of the borrower at lending date. Other changes in fair value are considered to be attributable to changes in market risks.
Valuation models may require certain internal estimates (Level 3), the scope of which is dependent on the instrument’s complexity and the availability of market inputs. This category contains loans from Swedbank AB whose valuation is based on observable interbank interest rates adjusted for the difference between the interbank rate and the con-tractual interest rate at the time the contract was entered into. See also note 3 Critical accounting judgements and estimates.
The table below shows the valuation method for financial instruments measured at fair value.
Financial instruments at fair value
2010 2009
Level 1 Level 2 Level 3 Total Level 1 Level 2 Level 3 Total
Assets Loans to the public 439 953 439 953 496 111 496 111Derivatives 6 931 6 931 10 544 10 544Total 446 884 446 884 506 655 506 655
Liabilities Amounts owed to credit institutions 10 096 10 096 34 550 10 999 45 550Debt securities in issue, etc. 99 392 36 820 136 212 111 468 134 113 245 581Derivatives 15 565 15 565 7 810 7 810
Total 99 392 52 385 10 096 161 873 111 468 176 473 10 999 298 941
Financial instruments at fair value based on Level 3
2010 2009
Opening balance 10 999 Loss in statement of comprehensive income 3 - 3 Loans raised 10 996 Maturities 900 - Closing balance 10 096 10 999
37 Fair value of financial instruments
38 Events after 31 December 2010No important events have occured.
DEFINITIONS Swedbank Mortgage Annual Report 2010 35
NOTER Swedbank Mortgage Annual Report 2010 35 DEFINITIONS Swedbank Mortgage Annual Report 2010 35
Capital quotientThe capital base in relation to the capital requirement.
Capital adequacy ratioThe capital base in relation to the risk-weighted amount.
Capital baseThe sum of Tier 1 (primary) and Tier 2 (supplementary) capital less items in accordance with chapter 3 sections 5-8 of the Capital Adequacy and Large Exposures Act.
Credit impairment ratioCredit impairments on loans and other credit risk provisions, net, in relation to the opening balance of loans to the public.
Credit impairmentsEstablished and probable losses for the year less recoveries related to loans as well as the year’s net expenses for guarantees and other contingent liabilities.
Impaired loansLoans where there is, on an individual level, objective evidence of a loss event, and where this loss event has an impact on the cash flow of the exposure. Impaired loans, gross, less specific provisions for loans assessed individually and provisions for homogenous loans assessed individually constitute impaired loans, net.
Interest fixing periodContracted period during which interest on an asset or liability is fixed.
Investment marginNet interest income in relation to average total assets.
Loan-to-value (LTV) ratioLoan amount in relation to the market value of the collateral.
Definitions
Provision for credit impairmentImpairment of loans if the solvency of the borrower is not expected to improve sufficiently within two years and the value of the collateral does not cover the loan amount.
Provision ratio for individually identified impaired loansSpecific provisions for loans assessed individually and provisions for homogenous groups of loans assessed collectively in relation to impaired loans, gross.
Restructured loanLoan for which the borrower has been granted some form of conces-sion due to a deteriorated financial position.
Return on equityNet profit for the year in relation to average equity.
Risk-weighted assetsTotal assets on the balance sheet and off-balance sheet commit-ments, divided into credit and market risks, valued and risk weighted according to current capital adequacy regulations.
Share of impaired loansBook value of impaired loans, net, in relation to book value of loans to the public.
Tier 1 capitalEquity less deferred tax assets and intangible assets in the Group plus equity contributions and reserves that may be included in the capital base as Tier 1 capital according to chapter 3 section 4 of the Capital Adequacy and Large Exposures Act.
Tier 1 capital ratioTier 1 capital in relation to risk-weighted assets.
Total provision ratio for impaired loansAll provisions for loans in relation to impaired loans, gross.

36 Swedbank Mortgage Annual Report 2010 SIGNATURES OF THE BOARD OF DIRECTORS AND THE PRESIDENT
Signatures of the Board of Directorsand the President
AUDITORS’ REPORT Swedbank Mortgage Annual Report 2010 37
Stockholm, 4 February 2011
Anders Ekedahl
Chairman
Johan Smedman Ingvar Svensson Ragnar Udin
Regional Manager, Middle Region, President of President of
Swedish Retail Management Falkenbergs Sparbank Sparbanken Alingsås
Helena Silvander
President of Swedbank Mortgage
Our auditors’ report was submitted on 22 February 2011
Deloitte AB
Jan Larsson
Authorised Public Accountant

AUDITORS’ REPORT Swedbank Mortgage Annual Report 2010 37
Auditors’ report
To the Annual General Meeting of Swedbank Mortgage AB (publ)Registration number 556003-3283.
We have audited the annual report, the consolidated accounts, the accounting records and the administration of the Board of
Directors and the President of Swedbank Mortgage AB (publ) for the financial year 2010. The company’s annual report and conso-
lidated accounts are included in this document on pages 2–36 . The Board of Directors and the President are responsible for these
accounts and the administration of the company as well as for the application of the Annual Accounts Act for Credit Institutions and
Securities Companies when preparing the annual accounts and the application of the International Financial Reporting Standards
(IFRS) as adopted by the EU and the Annual Accounts Act for Credit Institutions and Securities Companies when preparing the conso-
lidated accounts. Our responsibility is to express an opinion on the annual accounts, the consolidated accounts and the administration
based on our audit.
We have conducted our audit in accordance with generally accepted auditing standards in Sweden. Those standards require that we
plan and perform the audit to obtain reasonable assurance that the annual accounts and the consolidated accounts are free of mate-
rial misstatement. An audit includes examining, on a test basis, evidence supporting the amounts and disclosures in the accounts.
An audit also includes assessing the accounting policies used and their application by the Board of Directors and the President and
significant estimates made by the Board of Directors and the President when preparing the annual accounts and the consolidated
accounts as well as evaluating the overall presentation of information in the annual accounts and the consolidated accounts. As a
basis for our opinion concerning discharge from liability, we examined significant decisions, actions taken and circumstances of the
company in order to be able to determine the liability, if any, to the company of any Board member or the President. We also exami-
ned whether any Board member or the President has, in any other way, acted in contravention of the Companies Act, the Banking
and Financing Business Act, the Annual Accounts Act for Credit Institutions and Securities Companies or the company’s Articles of
Association. We believe that our audit provides a reasonable basis for our opinion set out below.
The annual accounts have been prepared in accordance with the Annual Accounts Act for Credit Institutions and Securities Companies
and give a true and fair view of the company’s financial position and results of operations in accordance with generally accepted
accounting principles in Sweden. The consolidated accounts have been prepared in accordance with the International Financial
Reporting Standards (IFRS) as adopted by the EU and the Annual Accounts Act for Credit Institutions and Securities Companies and
give a true and fair view of the group’s financial position and results of operations. The statutory administration report is consistent
with the other parts of the annual accounts and the consolidated accounts.
We recommend to the Annual General Meeting that the statements of comprehensive income and the balance sheets of the Parent
Company and the Group be adopted, that the profit of the Parent Company be dealt with in accordance with the proposal in the
admi¬nistration report and that the members of the Board of Directors and the President be discharged from liability for the financial
year.
Stockholm, 22 February 2011
Deloitte AB
Jan Larsson
Authorised Public Accountant

38 Swedbank Mortgage Annual Report 2010 LIST OF BOND LOANS
List of bond loans
Bonds issued abroad for Swedbank Mortgage AB (publ)
Original Issue Final payment Interest adjustment (RR) Currency Outstanding loan interest rate, % date date and redemption (U) debt, Nominal amount in local currency* 31 Dec 2010 4.625% 08-05-23 11-05-23 EUR 1 000 000 5.130% 06-06-01 11-06-01 HKD 80 000 6.200% 08-06-09 11-06-09 NOK 500 000 0.858% 10-06-22 11-06-22 USD 150 000 0.852% 09-06-30 11-06-30 CHF 150 000 1.158% 09-07-08 11-07-08 SEK 1 020 000 1.348% 10-04-01 11-10-03 EUR 30 000 0.240% 10-04-21 11-10-21 JPY 5 000 000 0.670% 10-04-21 11-10-21 SEK 500 000 0.680% 09-11-11 11-11-11 SEK 855 000 0.703% 09-12-16 11-12-16 SEK 300 000 1.498% 10-07-05 12-01-05 SEK 500 000 0.700% 10-01-27 12-01-27 SEK 700 000 0.865% 10-03-05 12-03-05 SEK 900 000 1.445% 10-04-16 12-04-16 EUR 15 000 0.895% 10-04-30 12-04-30 SEK 1 000 000 0.920% 10-05-10 12-05-10 SEK 1 000 000 1.020% 10-05-21 12-05-21 SEK 2 400 000 0.867% 10-06-04 12-06-20 SEK 1 490 000 1.103% 10-06-28 12-06-28 SEK 750 000 6.910% 02-07-11 12-07-11 NOK 110 000 1.200% 10-07-13 12-07-13 SEK 400 000 0.996% 10-08-04 12-08-03 EUR 50 000 1.300% 10-08-13 12-08-13 SEK 500 000 1.530% 10-03-02 12-08-17 EUR 25 000 1.108% 10-06-01 12-09-03 SEK 1 500 000 0.985% 10-03-05 12-09-05 SEK 3 800 000 1.460% 10-09-21 12-09-21 SEK 300 000 1.023% 10-08-18 12-09-27 SEK 500 000 1.172% 10-10-12 12-10-12 EUR 200 000 1.615% 10-10-18 12-10-18 SEK 600 000 3.580% 10-05-07 13-01-07 NOK 400 000 2.500% 10-01-21 13-01-21 EUR 1 000 000 1.058% 10-08-03 13-02-04 EUR 70 000 1.010% 10-04-19 13-04-19 SEK 300 000 1.260% 10-04-22 13-04-22 CHF 375 000 1.680% 10-10-20 13-06-19 SEK 400 000 1.171% 10-07-23 13-07-23 EUR 100 000 1.550% 10-09-10 13-09-10 SEK 300 000 0.478% 10-10-05 13-10-04 CHF 150 0001) 05-08-01 13-12-27 HKD 299 000 4.170% 07-01-12 14-01-13 HKD 48 000 2.000% 10-11-02 14-01-31 EUR 1 000 000 2.520% 10-02-03 14-02-03 EUR 20 0001) 04-12-14 14-04-01 SEK 200 000 1.510% 10-08-12 14-05-05 SEK 950 000 4.125% 09-06-09 14-06-09 EUR 625 000 4.125% 09-06-09 14-06-09 EUR 625 000 3.610% 09-07-02 14-07-02 EUR 10 000 2.370% 09-10-16 14-10-16 NOK 1 000 000 2.370% 10-04-16 14-10-16 NOK 150 000 5.365% 06-10-23 14-12-23 USD 23 0001) 04-12-06 14-12-30 HKD 130 0001) 05-07-26 14-12-30 HKD 346 000
LIST OF BOND LOANS Swedbank Mortgage Annual Report 2010 39
* Thousands1 ) Zero coupon bond

LIST OF BOND LOANS Swedbank Mortgage Annual Report 2010 39
Bonds issued abroad for Swedbank Mortgage AB (publ)
List of bond loans
* Thousands1 ) Zero coupon bond2) Index bond
Original Issue Final payment Interest adjustment (RR) Currency Outstanding loan interest rate, % date date and redemption (U) debt, Nominal amount in local currency* 31 Dec 2010 4.500% 10-01-26 15-01-26 NOK 300 000 2.925% 10-01-26 15-01-26 EUR 50 000 2.030% 10-10-11 15-03-18 SEK 575 000 1.635% 10-03-29 15-05-29 CHF 150 000 2.500% 10-06-15 15-06-15 EUR 1 100 000 0.949% 05-08-03 15-08-03 JPY 2 000 000 5.135% 08-08-05 15-08-05 EUR 20 000 5.595% 06-08-21 15-08-21 USD 11 000 5.000% 05-08-25 15-08-25 EUR 10 000 4.966% 08-08-14 15-09-14 EUR 50 000 2.600% 10-11-30 15-11-30 EUR 10 0002) 04-04-07 15-12-01 SEK 500 0002) 04-06-01 15-12-01 SEK 200 0001) 05-06-07 15-12-30 HKD 220 000 3.170% 10-02-03 16-02-03 EUR 15 000 3.200% 10-02-03 16-02-03 EUR 40 000 4.620% 06-02-08 16-02-08 HKD 80 000 3.750% 09-08-12 16-05-12 EUR 20 000 5.072% 06-08-22 16-08-22 HKD 110 000 4.923% 06-08-25 16-08-25 HKD 110 000 2.135% 10-02-26 16-08-26 CHF 350 000 3.625% 09-10-05 16-10-05 EUR 1 250 000 3.375% 10-03-22 17-03-22 EUR 1 000 000 4.170% 09-07-20 17-07-20 EUR 7 000 1.625% 10-12-08 17-12-08 CHF 200 000 3.400% 10-04-19 18-04-19 EUR 3 000 5.950% 08-06-18 18-06-18 NOK 500 000 2.000% 03-08-04 18-08-05 U every half year JPY 500 000 4.920% 09-08-21 18-08-21 EUR 7 000 4.920% 09-08-21 18-08-21 EUR 3 000 4.680% 09-06-17 19-06-17 EUR 15 000 4.450% 09-07-15 19-07-15 EUR 25 000 4.420% 09-07-29 19-07-29 EUR 10 000 4.276% 09-08-07 19-08-07 EUR 13 000 1.267% 09-08-28 19-08-28 EUR 25 000 4.000% 09-09-10 19-09-10 EUR 10 000 3.955% 09-09-11 19-09-11 EUR 10 000 4.570% 09-09-17 19-09-17 EUR 20 000 4.640% 09-09-17 19-09-17 EUR 20 000 4.000% 09-09-23 19-09-23 EUR 30 500 4.020% 09-09-28 19-09-27 EUR 22 000 4.050% 09-10-01 19-10-01 EUR 15 000 4.900% 09-10-22 19-10-22 NOK 750 000 5.100% 09-11-10 19-11-11 NOK 850 000 4.190% 09-09-11 20-06-08 EUR 10 0002) 05-06-15 20-06-15 JPY 500 000 3.723% 10-06-24 20-06-24 EUR 10 0002) 05-05-27 20-07-27 U every half year JPY 1 000 000 4.560% 09-07-28 20-07-28 EUR 10 000 4.290% 09-08-21 20-08-21 EUR 100 000 4.028% 09-08-31 20-08-31 EUR 61 000 4.000% 09-09-15 20-09-15 EUR 15 000 4.000% 09-09-22 20-09-22 EUR 20 000 1.182% 10-07-02 20-09-27 EUR 10 000

40 Swedbank Mortgage Annual Report 2010 LIST OF BOND LOANS
List of bond loans
Bonds issued abroad for Swedbank Mortgage AB (publ)
LIST OF BOND LOANS Swedbank Mortgage Annual Report 2010 41
Original Issue Final payment Interest adjustment (RR) Currency Outstanding loan interest rate, % date date and redemption (U) debt, Nominal amount in local currency* 31 Dec 2010 3.980% 09-10-21 20-10-21 EUR 10 000 3.600% 05-06-30 20-12-01 SEK 350 0002) 06-04-28 20-12-01 SEK 220 000 3.920% 10-02-04 21-02-04 EUR 40 000 3.850% 10-04-08 22-04-08 EUR 50 000 3.500% 10-06-30 23-06-30 EUR 10 0002) 03-07-07 23-07-14 U every year JPY 500 000 4.520% 09-08-18 23-08-18 EUR 10 000 4.870% 09-05-15 24-05-15 EUR 30 000 5.090% 09-06-12 24-06-12 EUR 30 000 4.950% 09-07-27 24-07-26 EUR 35 000 4.010% 10-05-20 25-05-20 EUR 10 000 5.000% 09-07-21 25-07-21 EUR 25 000 5.125% 09-07-21 25-07-21 EUR 25 000 4.682% 09-08-07 25-08-07 EUR 30 000 4.245% 09-10-29 25-10-29 EUR 200 000 5.020% 09-07-22 26-07-22 EUR 15 000 4.672% 09-08-19 26-08-19 EUR 125 000 3.460% 10-06-02 27-06-02 EUR 33 000 4.100% 10-02-11 28-02-11 EUR 230 000 4.040% 10-02-11 28-02-11 EUR 17 000 4.000% 10-04-19 28-04-19 EUR 63 000 5.020% 09-07-20 28-07-20 EUR 35 000 5.100% 09-05-18 29-05-18 EUR 10 000 5.070% 09-05-22 29-05-22 EUR 10 000 4.710% 09-05-25 29-05-25 EUR 10 000 5.075% 09-05-26 29-05-28 EUR 10 000 5.300% 09-06-25 29-06-25 SEK 300 000 5.200% 09-06-25 29-06-25 EUR 10 000 5.083% 09-07-30 29-07-30 EUR 100 000 5.080% 09-07-30 29-07-30 EUR 80 000 4.910% 09-08-27 29-08-27 EUR 12 000 4.600% 10-01-27 30-01-28 EUR 10 000 4.400% 10-02-03 30-02-11 EUR 4 0002) 06-06-26 33-06-27 U every year JPY 1 000 0002) 03-06-26 33-08-26 U every year JPY 1 000 000 5.350% 08-09-10 38-09-10 U 18** EUR 20 000 4.570% 10-03-01 40-03-01 EUR 40 000 4.320% 10-05-11 40-05-11 EUR 30 000 4.070% 10-07-02 40-07-02 EUR 20 000 4.030% 10-07-02 40-07-02 EUR 39 000
* Thousands2) Index bond** Callable for redemption on 2018-09-10 and therafter every 5th year.

LIST OF BOND LOANS Swedbank Mortgage Annual Report 2010 41
List of bond loans Bonds issued in Sweden for Swedbank Mortgage AB (publ)
Issue no. Original interest Issue/final Issue/final Outstanding loan debt. rate, % payment date payment year In SEK* 31 Dec 2010 166 6.75 05-05 1997/14 42 076 800 175 4.00 06-15 2005/11 28 690 900 176 4.25 06-20 2006/12 60 372 000 177 4.75 06-19 2007/13 52 543 000 179 5.80 05-12 2008/16 87 000 180 5.70 05-12 2008/20 4 866 000 181 2.70 12-05 2009/11 32 370 000 182 3.75 03-18 2009/15 46 163 000 183 3.75 09-16 2010/16 14 029 000 184 3.75 06-15 2010/15 634 000 185 3.75 03-15 2010/17 3 500 000 7170 1) 05-05 2000/14 6 048 MTN 3018 3.858 03-10 01-17 2005/11 500 000 MTN 3019 3.905 03-10 03-15 2005/11 500 000 MTN 3020 3.941 03-10 05-16 2005/11 500 000 MTN 3021 3.989 03-10 07-15 2005/11 500 000 MTN 3032 4.373 06-27 07-15 2000/14 500 000 MTN 3040 5.238 07-16 06-15 2007/11 500 000 MTN 3041 5.262 08-15 06-15 2007/11 1 000 000 MTN 3042 5.173 09-17 03-15 2007/11 500 000 MTN 3043 5.175 09-12 03-15 2007/11 2 000 000 MTN 3044 5.197 09-12 04-15 2007/11 2 000 000 MTN 3045 5.219 09-12 05-16 2007/11 2 000 000 MTN 3076 1.700 04-22 04-22 2009/11 300 000 MTN 3085 0.680 11-20 11-21 2009/11 765 000 MTN 3086 1.903 03-21 2010/11 10 500 000 Total 307 402 748 * Thousands1 ) Zero coupon bond
KAPITEL Swedbank Mortgage Annual Report 2010 4342 Swedbank Mortgage Annual Report 2010 BOARD OF DIRECTORS, AUDITIORS AND EXECUTIVE COMMITTEE
Board members appointed by the Annual General
Meeting:
Anders Ekedahl
Head of Customer Solutions and Products,
Swedish Bank Management
Born 1960
Helena Silvander
President of Swedbank Mortgage
Born 1963
Johan Smedman
Regional Manager, Middle Region,
Swedish Retail Management
Born 1964
Ingvar Svensson
President of Falkenbergs Sparbank
Född 1950
Ragnar Udin
President of Sparbanken Alingsås
Born 1945
* Board members’ shareholdings: Since Swedbank Mortgage
AB is a wholly owned subsidiary of Swedbank, board members
have no shareholdings in the company.
Auditor appointed by the Annual General Meeting:
Deloitte AB
Jan Larsson
Swedbank Mortgage’s Executive Committee:
Helena Silvander
President of Swedbank Mortgage
e-mail: [email protected]
Board of Directors*, Auditors andExecutive Committee

KAPITEL Swedbank Mortgage Annual Report 2010 43
Design: Swedbank Marketing & Sales Production
Graphic production: Swedbank Marketing & Sales Production
Copy: Swedbank
Photography: Swedbank

KAPITEL Swedbank Mortgage Annual Report 2010 44
Swedbank Mortgage AB (publ)Corporate identification no: 556003-3283Brunkebergstorg 8S-106 11 Stockholm, SwedenTelephone: +46 8 585 900 00Fax: +46 8 585 926 09www.swedbank.se/mortgage