Annual Report 2010-11 - Marico
171
BE MORE. EVERY DAY. Annual Report 2010-11
Transcript of Annual Report 2010-11 - Marico

BE MORE.EVERY DAY.
Annual Report 2010-11


BOARD OF DIRECTORS SHAREHOLDERS' COMMITTEE
Harsh Mariwala, Chairman & Managing Director Nikhil Khattau, Chairman
Nikhil Khattau, Chairman of Audit Committee Rajen Mariwala, Member
Rajeev Bakshi Hemangi Wadkar, Secretary to the Committee
Atul Choksey
Anand Kripalu BANKERS
Rajen Mariwala Axis Bank Limited
Hema Ravichandar Barclays Bank PLC
B. S. Nagesh (w.e.f. July 16, 2010) Citibank N.A.
HDFC Bank Limited
MANAGEMENT TEAM ICICI Bank Limited
Harsh Mariwala, Chairman & Managing Director Kotak Mahindra Bank Limited
Saugata Gupta, Chief Executive Officer, Standard Chartered Bank
Consumer Products Business State Bank of India
Ajay Pahwa, Chief Executive Officer - Kaya HSBC Limited
Milind Sarwate, Group Chief Financial Officer
& Chief Human Resources Officer AUDITORS
Vijay Subramanian, Chief Executive Officer, Price Waterhouse, Chartered Accountants
International Business
INTERNAL AUDITORS
COMPANY SECRETARY Aneja Associates, Chartered Accountants
Hemangi Wadkar
REGISTERED OFFICE
AUDIT COMMITTEE Rang Sharda, Krishnachandra Marg,
Nikhil Khattau, Chairman Bandra Reclamation, Bandra (W), Mumbai 400 050
Rajen Mariwala, Member
Hema Ravichandar, Member OUR PRESENCE
B. S. Nagesh, Member (w.e.f. July 16, 2010) Factories - 15 (8 in India and 7 overseas)
Hemangi Wadkar, Secretary to the Committee Regional Offices – 4 in India
Harsh Mariwala, Permanent Invitee Depots – 32 in India
CORPORATE GOVERNANCE COMMITTEE WEBSITES
Hema Ravichandar, Chairperson www.marico.com
Rajeev Bakshi, Member www.maricobd.com
Anand Kripalu, Member www.kayaclinic.com
Milind Sarwate, Secretary to the Committee www.parachuteadvansed.com
Harsh Mariwala, Permanent Invitee www.parachutearabia.com
www.saffolalife.com
www.haircodeworld.com
www.icpvn.com
www.maricoinnovationfoundation.org
COMPANY INFORMATION

TO TRANSFORM IN A SUSTAINABLE MANNER,
THE LIVES OF ALL THOSE WE TOUCH,
TO MAXIMIZE THEIR TRUE POTENTIAL.
BY NURTURING AND EMPOWERING THEM

TO TRANSFORM IN A SUSTAINABLE MANNER,
THE LIVES OF ALL THOSE WE TOUCH,
TO MAXIMIZE THEIR TRUE POTENTIAL.
BY NURTURING AND EMPOWERING THEM

Chairman’s Letter to Shareholders 01
Performance at a Glance 05
Management Discussion and Analysis 10
Auditors’ Report 39
Balance Sheet 40
Profit & Loss Account 41
Cash Flow Statement 42
Schedules and Notes to the Accounts 44
Directors’ Report 72
Corporate Governance Report 85
Auditors’ Report 104
Balance Sheet 108
Profit & Loss Account 109
Cash Flow Statement 110
Schedules and Notes to the Accounts 112
Statement pursuant to Section 212 (1) (e)
of the Companies Act, 1956 146
Statement pursuant to Section 212 (8)
of the Companies Act, 1956 149
10 Years’ Highlights 150
Consolidated Quarterly Financials 151
Awards & Acknowledgements 161
Our Presence 162
Know Marico Better 163
MARICO CONSOLIDATED
MARICO LIMITED

Chairman’s Letter to Shareholders 01
Performance at a Glance 05
Management Discussion and Analysis 10
MARICO CONSOLIDATED
Auditors’ Report 39
Balance Sheet 40
Profit & Loss Account 41
Cash Flow Statement 42
Schedules and Notes to the Accounts 44
MARICO LIMITED
Directors’ Report 72
Corporate Governance Report 85
Auditors’ Report 104
Balance Sheet 108
Profit & Loss Account 109
Cash Flow Statement 110
Schedules and Notes to the Accounts 112
Statement pursuant to Section 212 (1) (e)
of the Companies Act, 1956 146
Statement pursuant to Section 212 (8)
of the Companies Act, 1956 149
10 Years’ Highlights 150
Consolidated Quarterly Financials 151
Awards & Acknowledgements 161
Our Presence 162
Know Marico Better 163
INDEX
Dear Shareholders,
We have just closed a rather challenging year for FMCG companies, including Marico. FY11 witnessed
high inflation, particularly food inflation, unprecedented cost push, especially in one of your Company's key
input materials - copra, a rise in interest rates and strengthening of the Indian Rupee against the US Dollar.
In addition, there was political unrest in North Africa and the Middle East region – one of the key markets for
your Company's international business operations.
Notwithstanding the challenges of the year, I am happy to state that your Company turned in a good
performance. Revenue during the year grew by 18% over FY10 and Net Profit was higher by 24%. This makes
it a 5-year CAGR of 22% in Revenue and 27% in Net Profits.
Growth in Marico's top line was supported by robust volume growths across its franchises of coconut
oil, value added hair oil and premium refined edible oils in India as well as its international FMCG business.
In the Kaya business, whilst there was a same clinic sales decline in the first half of the year, this trend
was reversed to deliver same clinic sales growth in the second half. Your Company, therefore, has stayed
the course of franchise expansion across its businesses. In addition to this organic growth, Marico made
acquisitions during the year, adding new franchises to its portfolio. Your Company has expanded
the footprint of its skin aesthetics business to Singapore through the acquisition of Derma Rx. In South Africa,
it made a bolt-on acquisition, adding the Ingwe range of immuno boosters, to complement the existing
Hercules business. In February 2011, Marico took up 85% stake in International Consumer Products
Corporation, a leading FMCG company in Vietnam, operating primarily in the male grooming segment of
the Vietnamese market. In line with its strategy to execute its plans for the wellness segment in India through
Saffola, your Company rationalized its portfolio by divesting the non-focus refined edible oil brand 'Sweekar'.
Marico continued on its journey to live its purpose – its reason to exist beyond making profit – by focusing
on sustainable profitable growth, it has enhanced shareholder value. Saffola launched a campaign, 'know your
heart's age', around World Heart Day this year, to raise awareness about heart health amongst consumers.
The Company facilitated lifestyle management programs for its employees, many of whom have benefited
by feeling healthier and being more productive. Your Company continues to work with its associates through
initiatives such as improving productivity of safflower farmers and providing inputs to distributors to enhance
their returns on investment. Marico has been contributing towards propagating innovation in India, through
the Marico Innovation Foundation. Your Company's 'Think Fresh Be Green' initiative aims to ensure it behaves
responsibly with respect to the environment and institutionalizes a 'green mindset' amongst its members.
The Company would continue to aim at managing the mutual interests of all its interdependent stakeholders.
Thank you for placing faith in the Company. I wish to thank all members of the Marico team and all
our business associates for their contribution to Marico's success. I look forward to your continued support
and co-operation.
With warm regards,
Harsh Mariwala
Chairman and Managing Director
CHAIRMAN'S LETTER TO SHAREHOLDERSA PERSONAL MESSAGE
01
1

Our premium hair and skin care brands do just what they should: make a consumer’s confidence shine.
OUR CONSUMERS ALWAYS THANK US FOR THEIR
GREAT HAIR AND SKIN.BUT WHAT'S
EVEN MORE BEAUTIFUL, IS THEIR CONFIDENCE.

Our premium hair and skin care brands do just what they should: make a consumer’s confidence shine.
OUR CONSUMERS ALWAYS THANK US FOR THEIR
GREAT HAIR AND SKIN.BUT WHAT'S
EVEN MORE BEAUTIFUL, IS THEIR CONFIDENCE.


THE NATURAL RESULT OF TRYING TO BE MORE, EVERY DAY.
YOU GROW MORE, EVERY YEAR. Marico’s growth in 2010-2011 bears out our single-minded purpose:
to create and deliver more and more value to our stakeholders – our consumers, members, partners, shareholders and society.
SALES AND SERVICES (Rs. Crore)
2000
1500
500
1000
2500 2388
1144
1905
3000
06-0705-06 07-08
2661
09-10
1557
08-09
3500
0
3128
10-11
NET PROFIT(Rs. Crore)
200
150
50
100
250
300
350
0
189
87
169
06-0705-06 07-08
232
09-10
113
08-09
286
10-11
SALES AND SERVICES (Rs. Crore)
NET PROFIT(Rs. Crore)
05

Investment Through Shares Value (in Rs.) Indexed Value
April 1996 - Original Purchase IPO 100 17,500 100
August 2002 Bonus (Equity 1:1) 100 - -
September 2002 Bonus (Preference 1:1) 200 - -
May 2004 Bonus (Equity 1:1) 200 - -
February 2007 Share Split (10:1) 4,000 - -
Holdings and Cost as on March 31, 2011 4,000 17,500 100
Return Through Shares Value (in Rs.) Indexed Value
March 31, 2011 Market value 4,000 555,000 3,171
March 2004 Redemption proceeds of 200 4,000 23
Bonus Preference shares
#April 1996 - March 2010 Dividend Received* - 26,338 151
Gross Returns 585,338 3,345
Compound Annual Return since IPO 31% 31%
* Dividends are inclusive of those received on Bonus Preference Shares# Subject to taxes as applicable
200
150
50
100
250
300
350
006-0705-06 07-08 09-1008-09 10-11
258
137
220
331
187
350
14.0
13.5
12.5
12.0
13.0
14.5
06-0705-06 07-08 09-1008-0911.5
10-11
12.712.6
12.9
14.1
12.8
13.1
EBIDTA MARGINS (%)
ECONOMIC VALUE ADDED(Rs. Crore )
CASH PROFITS (Rs. Crore)
DIVIDEND DECLARED (%)
64
63
62
61
6005-06 06-07 07-08
65
66
67
09-1008-09
62
66 66 66 66
10-11
66
200
150
50
100
250
06-0705-06 07-08 09-1008-090
10-11
144
51
132
196
79
201
SUSTAINABLE WEALTH CREATION
06

Investment Through Shares Value (in Rs.) Indexed Value
April 1996 - Original Purchase IPO 100 17,500 100
August 2002 Bonus (Equity 1:1) 100 - -
September 2002 Bonus (Preference 1:1) 200 - -
May 2004 Bonus (Equity 1:1) 200 - -
February 2007 Share Split (10:1) 4,000 - -
Holdings and Cost as on March 31, 2011 4,000 17,500 100
Return Through Shares Value (in Rs.) Indexed Value
March 31, 2011 Market value 4,000 555,000 3,171
March 2004 Redemption proceeds of 200 4,000 23
Bonus Preference shares
#April 1996 - March 2010 Dividend Received* - 26,338 151
Gross Returns 585,338 3,345
Compound Annual Return since IPO 31% 31%
* Dividends are inclusive of those received on Bonus Preference Shares# Subject to taxes as applicable
200
150
50
100
250
300
350
006-0705-06 07-08 09-1008-09 10-11
258
137
220
331
187
350
14.0
13.5
12.5
12.0
13.0
14.5
06-0705-06 07-08 09-1008-0911.5
10-11
12.712.6
12.9
14.1
12.8
13.1
EBIDTA MARGINS (%)
ECONOMIC VALUE ADDED(Rs. Crore )
CASH PROFITS (Rs. Crore)
DIVIDEND DECLARED (%)
64
63
62
61
6005-06 06-07 07-08
65
66
67
09-1008-09
62
66 66 66 66
10-11
66
200
150
50
100
250
06-0705-06 07-08 09-1008-090
10-11
144
51
132
196
79
201
SUSTAINABLE WEALTH CREATION
07

WE KNOW EXACTLY HOW TO SAFEGUARD OUR
CONSUMERS' HEALTH.BY MAKING OUR WAY INTO
THEIR HEARTS. Marico's Saffola is firmly
established as 'the heart of a healthy family', and India's leading health food brand.

WE KNOW EXACTLY HOW TO SAFEGUARD OUR
CONSUMERS' HEALTH.BY MAKING OUR WAY INTO
THEIR HEARTS. Marico's Saffola is firmly
established as 'the heart of a healthy family', and India's leading health food brand.
9

spend, is providing buoyancy to the economy while towns has increased significantly, estimated at 53%
opening up new categories in the FMCG space. over the last two decades.
With more women joining India's workforce, FMCG
marketers are finding opportunities to introduce Rural India accounts for 70% of India's
products in the convenience and health foods population and is estimated to account for 56% of
segments. While spending on women's personal national income and 64% of expenditure. This
care products is also becoming far more market is seeing significant income growth and
acceptable and guilt-free. employment diversity for the first time in its history.
Income derived directly from agriculture has
Rapid shifts in income profiles are leading to reduced to around 40% with farmers often multi-
an evolution of product categories. At the higher tasking. However, the indirect dependence of the
income levels, there is a need for more rural economy on agriculture is still high.
sophistication and customization to individual Infrastructural investments in roads, railways and
tastes. Personal preferences also drive multiple telecom have led to improved connectivity in rural
brand purchases within households, unlike the India with a posit ive impact on growth,
earlier trend of using only a single brand or employment, education and health care. The
product. Therefore, marketers are introducing Government's initiatives such as National Rural
several variants of products to cater to a wider set Employment Guarantee Act (NREGA), other
of preferences. Products are also being segmented employment generation schemes, waiver of loans
to cater separately to the needs of men, women and managing minimum support prices of select
and children. Mass customization is likely to agricultural output are resulting in higher
intensify with FMCG players profiling potential disposable incomes and consumption trends in
buyers by attributes such as age, region, skin type rural India. The most recent initiative of providing a
and ethnic background. Unique Identification Number (UID) will further
strengthen the position of people living in rural
Consumers are steadily shifting from low areas. Rural markets comprise about 34% of the
prices to a price-plus platform. They now tend to total FMCG market. In recent times, the growth rate
balance price with quali ty, convenience, has overtaken that of the urban markets. Category
consistency, innovation and shopping experience. penetration, however, still remains low, providing
The quality conscious consumer is willing to pay a significant headroom for growth. With organized
premium for effective solutions, improved services FMCG players accessing these markets, rural
and a superior experience. The focus of marketers consumers are becoming increasingly brand
is to provide consumers with a holistic solution for conscious. However affordability remains a
their needs in the form of a consolidated offering of challenge, giving rise to a large market for small
various products and services. size SKUs.
India's FMCG market can be divided into two India is currently going through a socio-
segments – urban and rural. The urban segment is economic change; the country is witnessing an
characterized by high penetration levels and higher expansion of existing markets and the creation of
spending propensity of the urban resident as many new ones. The beauty products market is
compared to his rural counterpart. The trend expected to grow by 15%-20% in the future as a
towards urbanization continues, with migration of result of the changing socio-economic status of
rural citizens to urban areas. The number of urban Indian consumers, especially women. Better paying
some of the key drivers of growth. The FMCG
segment includes products like soaps, detergents,
oral care, hair care and skin care products, food
and beverages, oils and dairy products.
In line with the requirements of the Listing Opportunities are opening up for FMCG
Agreement with the Bombay Stock Exchange and marketers in India in various household income
National Stock Exchange, your Company has been segments. The affluent, comprising about 1% of
reporting consolidated results – taking into account the population, are willing to buy premium products
the results of its subsidiaries. This discussion for their emotional value or exclusivity. The upper
therefore covers the financial results and other middle class, comprising about 2% of the
developments during the period April 2010- population, may aspire to emulate the affluent.
March 2011, with respect to Marico Consolidated These two segments are driving the fast growth of
comprising Domestic Consumer Products premium and masstige products. While they make
Business under Marico Limited (Marico) in India, up a small proportion of the consuming base in the
International Consumer Products Business country, their numbers are expanding rapidly and
comprising exports from Marico and the operations are expected to double over the next decade. The
of its overseas subsidiaries and the skin care numbers in the middle class are expected to
solutions business of Kaya in India and overseas. expand significantly over the next decade.
The consolidated entity has been referred to as Comprising about 11% of the population today, this
'Marico' or 'Group' or 'Your Group' in this discussion. segment is likely to grow to nearly 30% by 2020.
These consumers are becoming more aware about
Some statements in this discussion products and their benefits and taking informed
describing projections, estimates, expectations or decisions. While price is important, the consumer
outlook may be forward looking. Actual results also demands value. Finally, there is the Bottom of
may however differ materially from those stated the Pyramid (BOP) opportunity in India. These
on account of various factors such as changes consumers are largely rural, spending on
in government regulations, tax regimes, economic essentials with very little demand for expensive
developments within India and the countries lifestyle products. These markets have hitherto
within which the Group conducts its business, been poorly served owing to infrastructural
exchange rate and interest rate movements, impact constraints.
of competing products and their pricing, product
demand and supply constraints. India's demographic dividend is highlighted
by the fact that it has 17% of the world's population
INDUSTRY STRUCTURE, and that half of these people are below the age
OPPORTUNITIES AND THREATS of 25. With a median age of 25 years, increasing
India's Fast Moving Consumer Goods numbers are joining the Indian workforce. Whereas
(FMCG) sector is estimated to be about China's dependency ratio bottoms in the next five
INR 1300 billion having shown an annual growth years, for India it's likely to bottom out only in 2040.
of about 11% per annum over the last decade. India's share in world consumer spending is set to
Robust growth in India's Gross Domestic Product increase from 1.9% in 2005 to 3.1% in 2020.
(GDP), growing urbanization, evolving consumer (Source: Technopak) Income in the hands of
lifestyles and increased income in rural areas are younger consumers with a higher propensity to
MANAGEMENT DISCUSSION AND ANALYSIS
10

spend, is providing buoyancy to the economy while towns has increased significantly, estimated at 53%
opening up new categories in the FMCG space. over the last two decades.
With more women joining India's workforce, FMCG
marketers are finding opportunities to introduce Rural India accounts for 70% of India's
products in the convenience and health foods population and is estimated to account for 56% of
segments. While spending on women's personal national income and 64% of expenditure. This
care products is also becoming far more market is seeing significant income growth and
acceptable and guilt-free. employment diversity for the first time in its history.
Income derived directly from agriculture has
Rapid shifts in income profiles are leading to reduced to around 40% with farmers often multi-
an evolution of product categories. At the higher tasking. However, the indirect dependence of the
income levels, there is a need for more rural economy on agriculture is still high.
sophistication and customization to individual Infrastructural investments in roads, railways and
tastes. Personal preferences also drive multiple telecom have led to improved connectivity in rural
brand purchases within households, unlike the India with a posit ive impact on growth,
earlier trend of using only a single brand or employment, education and health care. The
product. Therefore, marketers are introducing Government's initiatives such as National Rural
several variants of products to cater to a wider set Employment Guarantee Act (NREGA), other
of preferences. Products are also being segmented employment generation schemes, waiver of loans
to cater separately to the needs of men, women and managing minimum support prices of select
and children. Mass customization is likely to agricultural output are resulting in higher
intensify with FMCG players profiling potential disposable incomes and consumption trends in
buyers by attributes such as age, region, skin type rural India. The most recent initiative of providing a
and ethnic background. Unique Identification Number (UID) will further
strengthen the position of people living in rural
Consumers are steadily shifting from low areas. Rural markets comprise about 34% of the
prices to a price-plus platform. They now tend to total FMCG market. In recent times, the growth rate
balance price with quali ty, convenience, has overtaken that of the urban markets. Category
consistency, innovation and shopping experience. penetration, however, still remains low, providing
The quality conscious consumer is willing to pay a significant headroom for growth. With organized
premium for effective solutions, improved services FMCG players accessing these markets, rural
and a superior experience. The focus of marketers consumers are becoming increasingly brand
is to provide consumers with a holistic solution for conscious. However affordability remains a
their needs in the form of a consolidated offering of challenge, giving rise to a large market for small
various products and services. size SKUs.
India's FMCG market can be divided into two India is currently going through a socio-
segments – urban and rural. The urban segment is economic change; the country is witnessing an
characterized by high penetration levels and higher expansion of existing markets and the creation of
spending propensity of the urban resident as many new ones. The beauty products market is
compared to his rural counterpart. The trend expected to grow by 15%-20% in the future as a
towards urbanization continues, with migration of result of the changing socio-economic status of
rural citizens to urban areas. The number of urban Indian consumers, especially women. Better paying
some of the key drivers of growth. The FMCG
segment includes products like soaps, detergents,
oral care, hair care and skin care products, food
and beverages, oils and dairy products.
In line with the requirements of the Listing Opportunities are opening up for FMCG
Agreement with the Bombay Stock Exchange and marketers in India in various household income
National Stock Exchange, your Company has been segments. The affluent, comprising about 1% of
reporting consolidated results – taking into account the population, are willing to buy premium products
the results of its subsidiaries. This discussion for their emotional value or exclusivity. The upper
therefore covers the financial results and other middle class, comprising about 2% of the
developments during the period April 2010- population, may aspire to emulate the affluent.
March 2011, with respect to Marico Consolidated These two segments are driving the fast growth of
comprising Domestic Consumer Products premium and masstige products. While they make
Business under Marico Limited (Marico) in India, up a small proportion of the consuming base in the
International Consumer Products Business country, their numbers are expanding rapidly and
comprising exports from Marico and the operations are expected to double over the next decade. The
of its overseas subsidiaries and the skin care numbers in the middle class are expected to
solutions business of Kaya in India and overseas. expand significantly over the next decade.
The consolidated entity has been referred to as Comprising about 11% of the population today, this
'Marico' or 'Group' or 'Your Group' in this discussion. segment is likely to grow to nearly 30% by 2020.
These consumers are becoming more aware about
Some statements in this discussion products and their benefits and taking informed
describing projections, estimates, expectations or decisions. While price is important, the consumer
outlook may be forward looking. Actual results also demands value. Finally, there is the Bottom of
may however differ materially from those stated the Pyramid (BOP) opportunity in India. These
on account of various factors such as changes consumers are largely rural, spending on
in government regulations, tax regimes, economic essentials with very little demand for expensive
developments within India and the countries lifestyle products. These markets have hitherto
within which the Group conducts its business, been poorly served owing to infrastructural
exchange rate and interest rate movements, impact constraints.
of competing products and their pricing, product
demand and supply constraints. India's demographic dividend is highlighted
by the fact that it has 17% of the world's population
INDUSTRY STRUCTURE, and that half of these people are below the age
OPPORTUNITIES AND THREATS of 25. With a median age of 25 years, increasing
India's Fast Moving Consumer Goods numbers are joining the Indian workforce. Whereas
(FMCG) sector is estimated to be about China's dependency ratio bottoms in the next five
INR 1300 billion having shown an annual growth years, for India it's likely to bottom out only in 2040.
of about 11% per annum over the last decade. India's share in world consumer spending is set to
Robust growth in India's Gross Domestic Product increase from 1.9% in 2005 to 3.1% in 2020.
(GDP), growing urbanization, evolving consumer (Source: Technopak) Income in the hands of
lifestyles and increased income in rural areas are younger consumers with a higher propensity to
MANAGEMENT DISCUSSION AND ANALYSIS
11

jobs and exposure to fashion and beauty trends in provide tough competition, particularly to players
the developed world through television and other that are not differentiated and relatively weaker
media have resulted in changing tastes and brands. Organized retail is also expected to make
choices. Middle class women are more conscious investments in information technology to optimize
of their appearance and are willing to spend more supply chain efficiencies. This will also require
on enhancing it. Modernization has led to changing strong backward integration with distributors and
aspirations where the need to be considered good- manufacturers.
looking, well-groomed and stylish has taken on a
newfound importance. This has changed the India Incorporated is looking to grow
mindset of saving for future. Accordingly, people inorganically. It is important to go global, not only
are spending more on consumption. As a result, to create multiple growth engines, but also to
hair care and skin care products are expected to create reverse learning for the home market. The
show healthy growth. Indian men are also year gone by has seen a number of overseas
becoming conscious about their appearance, acquisitions made by Indian FMCG companies.
creating a market for male grooming products. Also, the emerging economies in Asia and Africa
There is also an increased awareness about good have low-to-medium penetrations in some of the
health practices. Sedentary lifestyles and unhealthy FMCG categories. This signifies considerable
habits have led to the rise of lifestyle-related headroom for growth in the mid-term. Favorable
diseases such as diabetes and heart problems. macro-economic factors, changing attitudes of
Increased awareness is leading to a demand for the consumers and progressive policies of
healthier products with lower calories, less sugar, governments also make these markets attractive
lower glycemic index, higher nutritional content and destinations. Typically, gestation periods .tend to
higher fiber. be longer as one needs to go up the learning curve
in a new market. Some of them also offer inorganic
Though there has been a growth in modern entry possibilities that can create access to
retail format stores in India, a significant share of mainstream distribution, manufacturing and talent.
business is still generated through the ‘mom and This can speed up one's learning curve as long as
pop’ store (kirana) format. With better infrastructure there is a strategic fit with the target.
aiding access to the rural economy, it is likely that
‘mom and pop’ stores will remain the chief point RISKS & CONCERNS
of interface of the FMCG companies with the Input Costs
retail consumer. Organized retail comprises about Domestic commodity prices are often
5% of FMCG business, but is expected to grow linked to international indices and volatility in
rapidly and expand its share over the next few these benchmarks could cause fluctuations in
years, reaching 11% by 2015 and nearly 30% by the domestic input prices.
2020. The share of certain categories such as
processed foods and beverages is expected The past 2-3 years have witnessed wide
to grow rapidly within organized retail. Several fluctuations in the prices of commodities. Crude oil
formats exist within organized retail such as hyper touched a record high of USD 140 per barrel in
marts, supermarkets and cash-and-carry FY09 before crashing to below USD 50 per barrel in
(wholesale). It is expected that formats will evolve FY10 and then again breaching USD 100 per barrel
and new formats may come up in the future. There during the second half of FY11. Volatility was
has been a rise in private labels and these could consequently experienced in other commodities –
in crude derivatives like liquid paraffin and high Product innovations and new product
density polyethylene (HDPE) as well as edible oils. launches
The success rate for new product launches
Input costs comprise nearly 60% of the in the FMCG sector is low. New products may
production costs in the FMCG sector. Inflationary not be accepted by the consumer or may fail
trends in the input costs could create a strain to achieve the targeted sales volume or value.
on the operating margins of the FMCG Cost overruns and cannibalization of sales in
companies. Brands with greater equity may find it existing products cannot be ruled out. Marico
easier to adjust prices in line with movements in has adopted the prototyping approach to new
input costs. product introductions that helps maintain a
healthy pipeline and at the same time limits the
Pricing Power downside risks.
The equity of a brand generally allows the
organization to pass on the impact of any increase Currency Risk
in cost structure to the consumers. However, The Marico Group has a significant presence
considering the uncertainty in the environment, in the Indian subcontinent, including Bangladesh,
rising competitive pressures as well as the longer South East Asia, MENA (Middle East & North
term objective of expanding consumer franchise, Africa) and South Africa. The Group is therefore
part of the increased cost structure may be exposed to a wide variety of currencies like the
absorbed by the organizations. US Dollar, South African Rand, Bangladeshi Taka,
UAE Dirham, Egyptian Pound, Malaysian Ringgit,
Discretionary spending / Down trading Singapore Dollar and Vietnamese Dong. Import
In situations of economic duress, items which payments are made in various currencies
are in the nature of discretionary spending are the including but not limited to the US Dollar, Australian
first to be curtailed. This is relevant for the lifestyle Dollar and Malaysian Ringgit.
solutions offered by companies. In an extended
recession, down trading from branded products As the Group eyes expansion into new
to non-branded ones could also occur and affect geographical territories, the exposure to foreign
the financial performance of the Company. currency fluctuation risk may increase. Significant
fluctuation in these currencies could impact the
Competition company's financial performance. The Company is,
The FMCG environment in India and overseas however, conservative in its approach and is likely
is competition-intensive and companies need to use simple hedging mechanisms.
to focus on branding, product development,
distribution and innovation to ensure their survival. Funding costs
Product innovations help to gain market, while Though the sector is not capital intensive,
advertising and sales promotion creates visibility fund requirements arise on account of inventory
for the product. Such expenditures carry the position building or capital expenditure undertaken.
inherent risk of failure. Counter campaigning In addition, growth through acquisitions may also
by competitors could also reduce the efficacy of contribute towards leveraging the company's
promotions. Similarly, aggressive pricing stances balance sheet. Changes in the interest regime and
by competition have the potential of creating a in the terms of borrowing will impact the financial
disruption. performance of the Group.
12

jobs and exposure to fashion and beauty trends in provide tough competition, particularly to players
the developed world through television and other that are not differentiated and relatively weaker
media have resulted in changing tastes and brands. Organized retail is also expected to make
choices. Middle class women are more conscious investments in information technology to optimize
of their appearance and are willing to spend more supply chain efficiencies. This will also require
on enhancing it. Modernization has led to changing strong backward integration with distributors and
aspirations where the need to be considered good- manufacturers.
looking, well-groomed and stylish has taken on a
newfound importance. This has changed the India Incorporated is looking to grow
mindset of saving for future. Accordingly, people inorganically. It is important to go global, not only
are spending more on consumption. As a result, to create multiple growth engines, but also to
hair care and skin care products are expected to create reverse learning for the home market. The
show healthy growth. Indian men are also year gone by has seen a number of overseas
becoming conscious about their appearance, acquisitions made by Indian FMCG companies.
creating a market for male grooming products. Also, the emerging economies in Asia and Africa
There is also an increased awareness about good have low-to-medium penetrations in some of the
health practices. Sedentary lifestyles and unhealthy FMCG categories. This signifies considerable
habits have led to the rise of lifestyle-related headroom for growth in the mid-term. Favorable
diseases such as diabetes and heart problems. macro-economic factors, changing attitudes of
Increased awareness is leading to a demand for the consumers and progressive policies of
healthier products with lower calories, less sugar, governments also make these markets attractive
lower glycemic index, higher nutritional content and destinations. Typically, gestation periods .tend to
higher fiber. be longer as one needs to go up the learning curve
in a new market. Some of them also offer inorganic
Though there has been a growth in modern entry possibilities that can create access to
retail format stores in India, a significant share of mainstream distribution, manufacturing and talent.
business is still generated through the ‘mom and This can speed up one's learning curve as long as
pop’ store (kirana) format. With better infrastructure there is a strategic fit with the target.
aiding access to the rural economy, it is likely that
‘mom and pop’ stores will remain the chief point RISKS & CONCERNS
of interface of the FMCG companies with the Input Costs
retail consumer. Organized retail comprises about Domestic commodity prices are often
5% of FMCG business, but is expected to grow linked to international indices and volatility in
rapidly and expand its share over the next few these benchmarks could cause fluctuations in
years, reaching 11% by 2015 and nearly 30% by the domestic input prices.
2020. The share of certain categories such as
processed foods and beverages is expected The past 2-3 years have witnessed wide
to grow rapidly within organized retail. Several fluctuations in the prices of commodities. Crude oil
formats exist within organized retail such as hyper touched a record high of USD 140 per barrel in
marts, supermarkets and cash-and-carry FY09 before crashing to below USD 50 per barrel in
(wholesale). It is expected that formats will evolve FY10 and then again breaching USD 100 per barrel
and new formats may come up in the future. There during the second half of FY11. Volatility was
has been a rise in private labels and these could consequently experienced in other commodities –
in crude derivatives like liquid paraffin and high Product innovations and new product
density polyethylene (HDPE) as well as edible oils. launches
The success rate for new product launches
Input costs comprise nearly 60% of the in the FMCG sector is low. New products may
production costs in the FMCG sector. Inflationary not be accepted by the consumer or may fail
trends in the input costs could create a strain to achieve the targeted sales volume or value.
on the operating margins of the FMCG Cost overruns and cannibalization of sales in
companies. Brands with greater equity may find it existing products cannot be ruled out. Marico
easier to adjust prices in line with movements in has adopted the prototyping approach to new
input costs. product introductions that helps maintain a
healthy pipeline and at the same time limits the
Pricing Power downside risks.
The equity of a brand generally allows the
organization to pass on the impact of any increase Currency Risk
in cost structure to the consumers. However, The Marico Group has a significant presence
considering the uncertainty in the environment, in the Indian subcontinent, including Bangladesh,
rising competitive pressures as well as the longer South East Asia, MENA (Middle East & North
term objective of expanding consumer franchise, Africa) and South Africa. The Group is therefore
part of the increased cost structure may be exposed to a wide variety of currencies like the
absorbed by the organizations. US Dollar, South African Rand, Bangladeshi Taka,
UAE Dirham, Egyptian Pound, Malaysian Ringgit,
Discretionary spending / Down trading Singapore Dollar and Vietnamese Dong. Import
In situations of economic duress, items which payments are made in various currencies
are in the nature of discretionary spending are the including but not limited to the US Dollar, Australian
first to be curtailed. This is relevant for the lifestyle Dollar and Malaysian Ringgit.
solutions offered by companies. In an extended
recession, down trading from branded products As the Group eyes expansion into new
to non-branded ones could also occur and affect geographical territories, the exposure to foreign
the financial performance of the Company. currency fluctuation risk may increase. Significant
fluctuation in these currencies could impact the
Competition company's financial performance. The Company is,
The FMCG environment in India and overseas however, conservative in its approach and is likely
is competition-intensive and companies need to use simple hedging mechanisms.
to focus on branding, product development,
distribution and innovation to ensure their survival. Funding costs
Product innovations help to gain market, while Though the sector is not capital intensive,
advertising and sales promotion creates visibility fund requirements arise on account of inventory
for the product. Such expenditures carry the position building or capital expenditure undertaken.
inherent risk of failure. Counter campaigning In addition, growth through acquisitions may also
by competitors could also reduce the efficacy of contribute towards leveraging the company's
promotions. Similarly, aggressive pricing stances balance sheet. Changes in the interest regime and
by competition have the potential of creating a in the terms of borrowing will impact the financial
disruption. performance of the Group.
13

14

Acquisitions During the last few months of FY11, the
This may take the form of purchasing the MENA region has witnessed socio-political unrest.
brands or purchase of stake in another company This has had an adverse impact on the economy.
and is used as a means of gaining access to new Whilst the situation is moving towards normalcy in
markets or categories, of increasing market share Egypt, conditions remain serious in other countries.
or eliminating competition. Acquisitions may divert It is likely that uncertainty may prevail over the
management attention or result in increased debt region for a substantial part of the calendar year
burden on the parent entity. It may also expose the 2011. Once the situation returns to normal,
company to country specific risk. Integration of however, the potential for growth in the region
operations and cultural harmonization may also remains high.
take time, thereby deferring benefits of synergies of
unification. Marico is keen on exploring acquisitions FMCG markets in South Africa
in its core segments of beauty and wellness, where The South African economy is a productive
it believes it can add value. and industrialized economy that exhibits many
characteristics associated with developing
FMCG market in Bangladesh countries, including a division of labour between
Bangladesh has a demographic profile very formal and informal sectors and an uneven
similar to that of India. A population in excess of distribution of wealth and income. The economic
150 million and a developing economy provide measures such as Black Economic Empowerment
the perfect consumer base for the FMCG sector (BEE), adopted by the Government to ensure
to flourish. The GDP has grown at 6-7% over growth and equitable distribution of wealth, have
the last few years and it is amongst the Next 11 been very effective. South Africa's ascension into
(N11) countries identified by Goldman Sachs as BRICS recognizes the country's potential, placing it
having high potential. Political instability may, alongside the leading economies of tomorrow. With
however, be a cause for concern for companies 6% of Africa's population, it accounts for 25% of the
operating in Bangladesh. continent's GDP. South Africa also forms the
gateway to the rest of sub-Saharan Africa. Africa is
FMCG markets in Middle East and North the fastest growth region after China and India,
Africa (MENA) boasting unexploited mineral wealth, 60% of the
The market offers a curious mix of local and world's uncultivated agricultural land and the
expatriate populations, who are not averse to youngest age profile of any continent.
the idea of indulgence/extravagance. This provides
FMCG companies opportunities to offer branded FMCG markets in Vietnam
solutions tailored to the needs of the consumer Vietnam is one of the fastest-growing
in the region. The Egyptian economy has countries in South East Asia, with a GDP growth of
embraced liberalization in the recent past, thereby about 6%. The demographics of the country are
opening the doors for foreign direct investment and very promising, with a young population providing
paving the path to economic growth. It features an opportunity for FMCG companies to grow
amongst the Goldman Sachs list of N11 countries. rapidly. Vietnam finds place in the Goldman Sachs
A steadily-growing population and a developing list of N11 countries as a frontier market, indicating
economy provide a good base for FMCG an opportunity to invest but with lower market
companies. Penetration levels in hair grooming and capitalization and liquidity. The currency,
skin care products are modest. Vietnamese Dong (VND), however, has shown
relative weakness to the US Dollar in recent times. sales and distribution, marketing and finance.
The reports of the internal auditors are regularly
INTERNAL CONTROL SYSTEMS AND THEIR reviewed by the management and corrective
ADEQUACY action initiated to strengthen the controls and
Mar ico has a wel l -estab l ished and enhance the effectiveness of the existing systems.
comprehensive internal control structure across the Summaries of the reports are presented to
value chain, to ensure that all assets are the Audit Committee of the Board.
safeguarded and protected against loss from
unauthorized use or disposition, that transactions HUMAN RESOURCES
are authorized, recorded and reported correctly Marico is a professionally managed
and that operations are conducted in an efficient organization with a flat hierarchy, which empowers
and cost effective manner. The key constituents of people and fosters a culture of innovation. The
the internal control system are: organization believes that great people deliver
great results and lays emphasis on hiring right
• Establishment and review of business plans and retaining key talent. The company maintains
• Identification of key risks and opportunities a strong business linkage to all human resource
• Policies on operational and strategic processes and initiatives.
risk management
• Clear and well defined organization structure Marico recruits its talent from the country's
and limits of financial authority premier technical and business schools, with the
• Continuous identification of areas requiring long-term perspective of grooming its next-
strengthening of internal controls generation leaders. The organization believes in
• Operating procedures to ensure effectiveness providing challenge and early responsibility at
of business processes work, keeping team members enthused and
• Systems of monitoring compliance with motivated.
statutory regulations
• Well-defined principles and procedures for Hiring right is the first step, often by tapping
evaluation of new business proposals/capital into the networks of existing members. A strong
expenditure referral mechanism operates under the brand
• A robust management information system name ‘Tareef’ (Talent referred by Mariconians).
• A robust internal audit and review system This benefits the organization in two ways: the
talent referred is usually of a higher calibre than
M/s Aneja Associates, Chartered Accountants, personnel sourced through other means and it
have been appointed to carry out the internal also results in substantial cost savings in the
audit for Marico. The work of internal auditors recruitment process.
is coordinated by an internal team at Marico.
This combination of Marico's internal team Marico ensures that its work environment
and expertise of Aneja Associates ensures is challenging and motivating, through its
independence as well as effective value addition. Management by Results policy. This includes
performance-based compensation, along with
Internal audits are undertaken on a other measures that help enhance performance.
continuous basis, covering various areas across
the value chain like manufacturing, operations, The organization believes in investing in
15

people to develop and expand their capability. standardize Marico HR practices across its
Personal development plans focus on how each international locations – the Middle East,
individual's strengths can be leveraged to maximize Bangladesh, Egypt and South Africa.
his or her potential. External training programmes
and cross functional exposure often provide the Employee relations throughout the year were
extra edge. In line with the company's philosophy supportive of business performance. As on
of valuing internal talent first, a structured internal March 31, 2011, the employee strength of Marico
job posting mechanism - MINTOS (Marico Internal Ltd. was 996 and that of the entire group was 2277.
Talent Opportunity Scheme) provides an internal
forum for members to benefit from opportunities CORPORATE SOCIAL RESPONSIBILITY
within the organization. Marico believes in aligning the interest of
all stakeholders in the environment in which it
Marico has a holistic member well-being operates – its shareholders, consumers, members,
program, which includes the physical, emotional associates, government and society. Promoting
and financial aspects of an employee's well-being. conscious capitalism is an important step towards
Its initiatives are many: a Member Assistance fulfilling the Company's purpose. Marico has
Program in association with www.1to1help.net, chosen the following areas of focus to make its
a counseling service run by a team of qualified contributions towards society and to function
and experienced counselors; a physical well-being responsibly is respect of the impact its operations
program that provides personalized diet, lifestyle have on the environment.
and physical training by a panel of health experts;
and financial well-being through customized 1. Marico Innovation Foundation
financial planning programs. Marico instituted the Marico Innovation
Foundation (www.maricoinnovationfoundation.org)
Marico continually strives to increase the in 2003, to provide a framework to the Industry and
engagement levels of its teams. The Gallup Survey Social Sector to leverage innovation for quantum
keeps the organization updated on its success growth. The overall approach of the Foundation is
at building engagement across the organization to be a catalyst that concentrates on creation of
as well as in each of its teams. knowledge through research, knowledge
dissemination & recognition through its Innovation
Through 'Values Workshops', Marico for India Awards.
disseminates its core values to all its members,
building commitment and helping teams work The Foundation has drawn insights from
with a corporate focus. Indian organizations that have challenged
convention and achieved quantum growth through
‘Popcorn with Harsh’ sessions, giving innovation – organizations that have considered
members the opportunity to interact directly with ideas and not resources as their key competitive
the Chairman and Managing Director, Harsh advantage. Its social innovation research seeks to
Mariwala, continue to leverage the strengths of highlight inspiring work that brings insight into what
Marico's leaders, helping them mentor Mariconians differentiates social innovation which if scaled up,
and coach the leaders of the future. has the power to address some of the fundamental
problems in the country. One of Foundation's
Specif ic in i t iat ives are underway to popular researches resulted in a best seller
23
WE SET UP OUR INNOVATION FOUNDATION FOR
ONE SIMPLE REASON. WE WANT YOU
TO CHANGE THE WORLD. The Marico Innovation Foundation isn’t about us.
It’s about recognizing and mentoring upcoming innovators and supporting ideas that can transform lives.
16

people to develop and expand their capability. standardize Marico HR practices across its
Personal development plans focus on how each international locations – the Middle East,
individual's strengths can be leveraged to maximize Bangladesh, Egypt and South Africa.
his or her potential. External training programmes
and cross functional exposure often provide the Employee relations throughout the year were
extra edge. In line with the company's philosophy supportive of business performance. As on
of valuing internal talent first, a structured internal March 31, 2011, the employee strength of Marico
job posting mechanism - MINTOS (Marico Internal Ltd. was 996 and that of the entire group was 2277.
Talent Opportunity Scheme) provides an internal
forum for members to benefit from opportunities CORPORATE SOCIAL RESPONSIBILITY
within the organization. Marico believes in aligning the interest of
all stakeholders in the environment in which it
Marico has a holistic member well-being operates – its shareholders, consumers, members,
program, which includes the physical, emotional associates, government and society. Promoting
and financial aspects of an employee's well-being. conscious capitalism is an important step towards
Its initiatives are many: a Member Assistance fulfilling the Company's purpose. Marico has
Program in association with www.1to1help.net, chosen the following areas of focus to make its
a counseling service run by a team of qualified contributions towards society and to function
and experienced counselors; a physical well-being responsibly is respect of the impact its operations
program that provides personalized diet, lifestyle have on the environment.
and physical training by a panel of health experts;
and financial well-being through customized 1. Marico Innovation Foundation
financial planning programs. Marico instituted the Marico Innovation
Foundation (www.maricoinnovationfoundation.org)
Marico continually strives to increase the in 2003, to provide a framework to the Industry and
engagement levels of its teams. The Gallup Survey Social Sector to leverage innovation for quantum
keeps the organization updated on its success growth. The overall approach of the Foundation is
at building engagement across the organization to be a catalyst that concentrates on creation of
as well as in each of its teams. knowledge through research, knowledge
dissemination & recognition through its Innovation
Through 'Values Workshops', Marico for India Awards.
disseminates its core values to all its members,
building commitment and helping teams work The Foundation has drawn insights from
with a corporate focus. Indian organizations that have challenged
convention and achieved quantum growth through
‘Popcorn with Harsh’ sessions, giving innovation – organizations that have considered
members the opportunity to interact directly with ideas and not resources as their key competitive
the Chairman and Managing Director, Harsh advantage. Its social innovation research seeks to
Mariwala, continue to leverage the strengths of highlight inspiring work that brings insight into what
Marico's leaders, helping them mentor Mariconians differentiates social innovation which if scaled up,
and coach the leaders of the future. has the power to address some of the fundamental
problems in the country. One of Foundation's
Specif ic in i t iat ives are underway to popular researches resulted in a best seller
23
WE SET UP OUR INNOVATION FOUNDATION FOR
ONE SIMPLE REASON. WE WANT YOU
TO CHANGE THE WORLD. The Marico Innovation Foundation isn’t about us.
It’s about recognizing and mentoring upcoming innovators and supporting ideas that can transform lives.

publication ‘Making Breakthrough Innovation Department of Science and Technology,
Happen: How 11 Indians pulled off the impossible’. Government of India.
This publication is a culmination of a six year
joint discovery effort to identify genuine To recognize and applaud outstanding
breakthrough innovations from within India and leadership with a focus on innovation, the Marico
then uncover cutting edge insights into; 'what Innovation Foundation institutionalized Innovation
these innovators did differently to make the for India Awards in 2006. These Awards
impossible happen'. The other knowledge building acknowledge & foster leadership with innovative
initiatives of the foundation include alliances focus in various Business & Social sectors. From
between top Indian Business Schools and Indian 2010 a new category - Public Governance, has
organizations for a 2-month elective 'live' course been introduced to recognize innovations where
on Applied Innovation. the Central or State government or any wing of the
government including public-private partnership
To extend the Marico Innovation Foundation's has innovated. The intent of the Awards is to
catalytic approach towards Innovation, it organises reward projects and businesses that make a real
‘Innovation Workshop for Social Enterprises'. The difference to India and the community at large.
purpose of these workshops is to enable social Based on the criteria of uniqueness, impact and
organizations to apply innovation as a key tool to scalability, 'India's Best Innovations' are declared
significantly increase their social impact and scale biennially. Since 2006, 32 innovators have been
programs. The 3-day workshop focuses on recognized. Bharti Airtel and Tata Nano were
innovation tools, knowledge sharing from recognized as Global Game Changers for their
successful case studies, addressing primary spirit of innovation.
challenges in applying innovation and helping social
enterprises identify and put together an innovative An eminent Governing Council chaired by
roadmap to scale up and create greater impact. Dr. R A Mashelkar FRS, CSIR Bhatnagar Fellow
After the workshop, organizations are selected for steers the work of the Foundation.
a 12-18 month innovation incubation program.
2. Sustainability Initiatives
Through the knowledge dissemination Marico's sustainability efforts are aimed
mechanism the Foundation is able to propagate towards conserv ing the ecology, whi ls t
the findings of the researches through large-scale institutionalizing a 'green mindset' amongst
mass platforms across India. It has shared its Mariconians. Marico has successfully implemented
learning at business schools, industry fora and over 50 ideas in the areas of energy, water
management associations to help take other and paper usage reduction in the last 2 years.
organizations to take quantum leaps instead of The ideas varied from process changes in
going through the process of rediscovery. In manufacturing to investing in equipment that
addition its Innovation Exchange is a portal that would reduce energy consumption to reduced
brings the entire Innovation Ecosystem including usage of plastic.
researchers, innovators, entrepreneurs and
academia across industry along with investors and We have gained considerable momentum
mentors together onto one single platform. This is in our efforts to reduce our carbon footprint, most
an initiative in association with the Indian Institute of our strategies and processes today undergo
of Management, Ahmedabad (IIM –A) and the a Green filter, as we intrinsically evaluate the
environmental implications of all initiatives. measures progress on our Green journey through
member feedback. Teams that have made
Highlighted below are some key initiatives significant contributions to our sustainability
that had a significant positive impact on the journey are recognized every year at the annual
environment. Organisation Communication event.
Energy We conducted sessions for our C&FA agents
• Leveraged the latest technology to (depots) on the need and benefits of going Green,
reduce power consumption in our which has led to considerable savings for the
datacenter organisation. More importantly however, it has
• Improved truck loading efficiency at our increased the saliency of the need to adopt
factories leading to reduced fuel sustainable work practices amongst our
consumption associates.
• Designed the new plant at Baddi in an
energy-efficient manner. Learning from Our achievements in this space have been
here is being replicated across all recognized through numerous awards,
manufacturing locations • Marico (Kanjikode) was conferred with
• Installed variable frequency drives to the Kerala State Energy Conservation
reduce energy consumption at our Commendation Award 2010, in the
Pondicherry factory large-scale energy consumers category.
• Use of bio mass fuel for boilers • Marico won 'Silver' at the Greentech
Environment Excellence Award 2010, in
Water the FMCG sector.
• Reduction of water consumption at • Marico bagged the Runners-up trophy at
Jalgaon plant by about 36% the G-CUBE
• Rainwater harvesting across manufacturing • Marico (Jalgaon) won the Good Green
sites Governance Award.
• Drip irrigation system installed at the
Jalgaon factory 2. Safety
Marico places prime importance on the safety
Paper & health of all its members.
• Use of recycled paper at Kaya Skin Clinic
In pursuit of a hazard and incident-free work
Plastic environment, we have defined an Environmental
• Reduction in PVC Consumption by 90% in & Occupational Health & Safety (EOHS) policy,
plastic bottles which guides systematic efforts to continually
upgrade our systems, impart relevant training
The ‘Think Fresh, Be Green’ initiative aims and improve communication system to handle
to build a Green culture at Marico. Tree plantations emergency situations.
on birthdays, using video conferencing to
reduce travel, celebrating festivals in an Some of the initiatives we have taken are:
eco-friendly way are part of the culture. We have • Marico Factories are certified for OHSAS
also institutionalized a Green Score Card which 18001:2007 by certifying body DNV. We
18

publication ‘Making Breakthrough Innovation Department of Science and Technology,
Happen: How 11 Indians pulled off the impossible’. Government of India.
This publication is a culmination of a six year
joint discovery effort to identify genuine To recognize and applaud outstanding
breakthrough innovations from within India and leadership with a focus on innovation, the Marico
then uncover cutting edge insights into; 'what Innovation Foundation institutionalized Innovation
these innovators did differently to make the for India Awards in 2006. These Awards
impossible happen'. The other knowledge building acknowledge & foster leadership with innovative
initiatives of the foundation include alliances focus in various Business & Social sectors. From
between top Indian Business Schools and Indian 2010 a new category - Public Governance, has
organizations for a 2-month elective 'live' course been introduced to recognize innovations where
on Applied Innovation. the Central or State government or any wing of the
government including public-private partnership
To extend the Marico Innovation Foundation's has innovated. The intent of the Awards is to
catalytic approach towards Innovation, it organises reward projects and businesses that make a real
‘Innovation Workshop for Social Enterprises'. The difference to India and the community at large.
purpose of these workshops is to enable social Based on the criteria of uniqueness, impact and
organizations to apply innovation as a key tool to scalability, 'India's Best Innovations' are declared
significantly increase their social impact and scale biennially. Since 2006, 32 innovators have been
programs. The 3-day workshop focuses on recognized. Bharti Airtel and Tata Nano were
innovation tools, knowledge sharing from recognized as Global Game Changers for their
successful case studies, addressing primary spirit of innovation.
challenges in applying innovation and helping social
enterprises identify and put together an innovative An eminent Governing Council chaired by
roadmap to scale up and create greater impact. Dr. R A Mashelkar FRS, CSIR Bhatnagar Fellow
After the workshop, organizations are selected for steers the work of the Foundation.
a 12-18 month innovation incubation program.
1. Sustainability Initiatives
Through the knowledge dissemination Marico's sustainability efforts are aimed
mechanism the Foundation is able to propagate towards conserv ing the ecology, whi ls t
the findings of the researches through large-scale institutionalizing a 'green mindset' amongst
mass platforms across India. It has shared its Mariconians. Marico has successfully implemented
learning at business schools, industry fora and over 50 ideas in the areas of energy, water
management associations to help take other and paper usage reduction in the last 2 years.
organizations to take quantum leaps instead of The ideas varied from process changes in
going through the process of rediscovery. In manufacturing to investing in equipment that
addition its Innovation Exchange is a portal that would reduce energy consumption to reduced
brings the entire Innovation Ecosystem including usage of plastic.
researchers, innovators, entrepreneurs and
academia across industry along with investors and We have gained considerable momentum
mentors together onto one single platform. This is in our efforts to reduce our carbon footprint, most
an initiative in association with the Indian Institute of our strategies and processes today undergo
of Management, Ahmedabad (IIM –A) and the a Green filter, as we intrinsically evaluate the
environmental implications of all initiatives. measures progress on our Green journey through
member feedback. Teams that have made
Highlighted below are some key initiatives significant contributions to our sustainability
that had a significant positive impact on the journey are recognized every year at the annual
environment. Organisation Communication event.
Energy We conducted sessions for our C&FA agents
• Leveraged the latest technology to (depots) on the need and benefits of going Green,
reduce power consumption in our which has led to considerable savings for the
datacenter organisation. More importantly however, it has
• Improved truck loading efficiency at our increased the saliency of the need to adopt
factories leading to reduced fuel sustainable work practices amongst our
consumption associates.
• Designed the new plant at Baddi in an
energy-efficient manner. Learning from Our achievements in this space have been
here is being replicated across all recognized through numerous awards,
manufacturing locations • Marico (Kanjikode) was conferred with
• Installed variable frequency drives to the Kerala State Energy Conservation
reduce energy consumption at our Commendation Award 2010, in the
Pondicherry factory large-scale energy consumers category.
• Use of bio mass fuel for boilers • Marico won 'Silver' at the Greentech
Environment Excellence Award 2010, in
Water the FMCG sector.
• Reduction of water consumption at • Marico bagged the Runners-up trophy at
Jalgaon plant by about 36% the G-CUBE
• Rainwater harvesting across manufacturing • Marico (Jalgaon) won the Good Green
sites Governance Award.
• Drip irrigation system installed at the
Jalgaon factory 3. Safety
Marico places prime importance on the safety
Paper & health of all its members.
• Use of recycled paper at Kaya Skin Clinic
In pursuit of a hazard and incident-free work
Plastic environment, we have defined an Environmental
• Reduction in PVC Consumption by 90% in & Occupational Health & Safety (EOHS) policy,
plastic bottles which guides systematic efforts to continually
upgrade our systems, impart relevant training
The ‘Think Fresh, Be Green’ initiative aims and improve communication system to handle
to build a Green culture at Marico. Tree plantations emergency situations.
on birthdays, using video conferencing to
reduce travel, celebrating festivals in an Some of the initiatives we have taken are:
eco-friendly way are part of the culture. We have • Marico Factories are certified for OHSAS
also institutionalized a Green Score Card which 18001:2007 by certifying body DNV. We
19

have recently undergone an ISO: 14001 material, clothes and emergency lamps and aided
and OHSAS: 18001 (EOHS) audit by an renovation at various local government schools.
external agency.
• Safety Councils at our plants, periodically In order to give students an industry
review accidents, safety records and perspective, Marico collaborated with the local
issues related to safety, health and work institutes to offer training programs to students.
environment. These include training sessions on Supply Chain
• In factories, every major project is routed & TPM. Several plant visits were organized for
through the Safety department. government primary schools.
• We have installed diesel engines for the
operation of the fire hydrant systems, in Marico also conducted a training programme
case of power failures. on FSSC for Food Safety Officers, all across India.
• All plants hold annual safety weeks that It covered about 650 Food Safety Officers.
aim to increase awareness of potential
hazards and serve as a refresher for key Mar i co Bang ladesh has o rgan i zed
safety procedures. communities under the Community based
• Emergency preparedness and response organization. It educates and guides the
procedures are tested regularly by community in solving problems faced by them
conducting mock drills. in areas of coconut production and development
• Members undergo Safety Training as and conversion of the coconuts to copra. It has
part of their induction. Health and safety also worked towards establishment of other
seminars are conducted for contract businesses that complement copra supply to
workers. augment income of the participating groups.
• Reinforcement training like Fire fighting
is compulsory at least once a year; other A w a r e n e s s s e s s i o n s f o r t h e l o c a l
training is imparted as per a training communities were organized; Aids Awareness
calendar. programme for truck drivers by Pondicherry
AIDS Control Committee at the Pondicherry factory.
In recognition of our achievement Marico In addition, parenting sessions were held for
plants at Jalgoan, Goa, Poanta Sahib and workers' family members at some of the factories.
Kanjikode have won the Greetech Award for Safety.
Support for Local Communities:
4. Other Initiatives As part of our contributions to the local
Most of these initiatives have been primarily communities in which we are present Marico has
in the areas of Education and Training and contributed towards participation in blood donation
support for local communities. camps at factory locations in India and overseas,
conducted skin care camps for Helpage India
Education & Training: by dermatologists from Kaya, provided financial
Marico's factories and depots are present support for weather risk insurance to farmers
in rural areas, where there is an opportunity for and helped in the renovation exercise of the local
the Company to give back to the society by police station in Egypt.
empowering the younger generation. Keeping this in
mind, Marico has donated books, stationery, study This year, Marico members also participated
in the week-long Joy of Giving Initiative, to promote the past 5 years, the top line and bottom line have
'Giving'. grown at a compounded average growth rate
(CAGR) of 22% and 27% respectively.
Joy of Giving:
Joy of Giving Week is a not-for-profit CONSUMER PRODUCTS BUSINESS (INDIA)
organization, run and managed by a group of
volunteers, that promotes 'Giving' in any form- Parachute & Nihar in India
Money, Resources, Skills, Time. Marico organized Parachute, Marico's flagship brand, continued
a series of activities at its various locations, to expand its consumer franchise during the year.
during the week of September 26–October 2, 2010. Parachute coconut oil in rigid packs, the focus
These included: part of its portfolio, grew by ~10% in volume as
compared to FY10.
Vastra Samman & Toy Bank: A week long
collection drive that encouraged members to The year saw an unprecedented increase in
donate old clothes, toys, books and stationery. The the price of copra - dried coconut kernel, the raw
donated items were in turn distributed to rural material input for coconut oil. The average prices
areas and villages, through the NGO Goonj and in FY11 were higher than in FY10 by ~45%. This
Toy Bank. Members donated enthusiastically for rise can be primarily attributed to the spiraling
this cause. of the global Palm Kernel oil table. (While pure
coconut oil is the preferred cooking medium in
Make A Wish Foundation: The foundation parts of the country, it may be substituted with
collects monetary donations, in order to fulfill palm kernel oil when palm kernel oil prices remain
wishes of children facing life threatening diseases. at a normal discount to coconut oil. When palm
Members contributed generously to this cause. A kernel rises to close the gap, consumers may
variety of wishes were fulfilled; holiday with family, switch to coconut oil, thus increasing its demand
owning a doll set, a computer and many more. and consequently the market rates).
Crafts Bazaar: Marico organized a day-long The Company took price increases to pass
Crafts Bazaar at several of its locations. It invited on most of the cost push to its consumers.
NGOs that support Women Empowerment, However, with the rapid upward spiral of costs,
Children and Education to set up stalls at its office retail price increases lagged behind, resulting in
premises. This gave the NGOs a platform to not some compression in margins. The Company
only display but also sell their products; the key implemented retail price increases in a phased
objective being to raise funds that would in turn be manner from August 2010 to February 2011,
ploughed back into the NGO, to further support taking a cumulative increase of about 32%. This
their individual causes. unprecedented price increase, in the overall
context of inflation in the country, has led to
THE MARICO GROWTH STORY a modest volume growth of ~5% in H2FY11.
Marico achieved a turnover of INR 3128 crore However, at the same time, the Company has
during FY11, a growth of 18% over FY10. The prioritized expansion of its consumer franchise.
volume growth underlying this revenue growth was Consequently, it did not pass on the entire
healthy at 12%. Profit after Tax (PAT) for FY11 was cost inflation; particularly in its 'recruiter packs',
INR 286 crore, a growth of 24% over FY10. Over the smaller stock keeping units (SKUs).
20

have recently undergone an ISO: 14001 material, clothes and emergency lamps and aided
and OHSAS: 18001 (EOHS) audit by an renovation at various local government schools.
external agency.
• Safety Councils at our plants, periodically In order to give students an industry
review accidents, safety records and perspective, Marico collaborated with the local
issues related to safety, health and work institutes to offer training programs to students.
environment. These include training sessions on Supply Chain
• In factories, every major project is routed & TPM. Several plant visits were organized for
through the Safety department. government primary schools.
• We have installed diesel engines for the
operation of the fire hydrant systems, in Marico also conducted a training programme
case of power failures. on FSSC for Food Safety Officers, all across India.
• All plants hold annual safety weeks that It covered about 650 Food Safety Officers.
aim to increase awareness of potential
hazards and serve as a refresher for key Mar i co Bang ladesh has o rgan i zed
safety procedures. communities under the Community based
• Emergency preparedness and response organization. It educates and guides the
procedures are tested regularly by community in solving problems faced by them
conducting mock drills. in areas of coconut production and development
• Members undergo Safety Training as and conversion of the coconuts to copra. It has
part of their induction. Health and safety also worked towards establishment of other
seminars are conducted for contract businesses that complement copra supply to
workers. augment income of the participating groups.
• Reinforcement training like Fire fighting
is compulsory at least once a year; other A w a r e n e s s s e s s i o n s f o r t h e l o c a l
training is imparted as per a training communities were organized; Aids Awareness
calendar. programme for truck drivers by Pondicherry
AIDS Control Committee at the Pondicherry factory.
In recognition of our achievement Marico In addition, parenting sessions were held for
plants at Jalgoan, Goa, Poanta Sahib and workers' family members at some of the factories.
Kanjikode have won the Greetech Award for Safety.
Support for Local Communities:
3. Other Initiatives As part of our contributions to the local
Most of these initiatives have been primarily communities in which we are present Marico has
in the areas of Education and Training and contributed towards participation in blood donation
support for local communities. camps at factory locations in India and overseas,
conducted skin care camps for Helpage India
Education & Training: by dermatologists from Kaya, provided financial
Marico's factories and depots are present support for weather risk insurance to farmers
in rural areas, where there is an opportunity for and helped in the renovation exercise of the local
the Company to give back to the society by police station in Egypt.
empowering the younger generation. Keeping this in
mind, Marico has donated books, stationery, study This year, Marico members also participated
in the week-long Joy of Giving Initiative, to promote the past 5 years, the top line and bottom line have
'Giving'. grown at a compounded average growth rate
(CAGR) of 22% and 27% respectively.
Joy of Giving:
Joy of Giving Week is a not-for-profit CONSUMER PRODUCTS BUSINESS (INDIA)
organization, run and managed by a group of
volunteers, that promotes 'Giving' in any form- Parachute & Nihar in India
Money, Resources, Skills, Time. Marico organized Parachute, Marico's flagship brand, continued
a series of activities at its various locations, to expand its consumer franchise during the year.
during the week of September 26–October 2, 2010. Parachute coconut oil in rigid packs, the focus
These included: part of its portfolio, grew by ~10% in volume as
compared to FY10.
Vastra Samman & Toy Bank: A week long
collection drive that encouraged members to The year saw an unprecedented increase in
donate old clothes, toys, books and stationery. The the price of copra - dried coconut kernel, the raw
donated items were in turn distributed to rural material input for coconut oil. The average prices
areas and villages, through the NGO Goonj and in FY11 were higher than in FY10 by ~45%. This
Toy Bank. Members donated enthusiastically for rise can be primarily attributed to the spiraling
this cause. of the global Palm Kernel oil table. (While pure
coconut oil is the preferred cooking medium in
Make A Wish Foundation: The foundation parts of the country, it may be substituted with
collects monetary donations, in order to fulfill palm kernel oil when palm kernel oil prices remain
wishes of children facing life threatening diseases. at a normal discount to coconut oil. When palm
Members contributed generously to this cause. A kernel rises to close the gap, consumers may
variety of wishes were fulfilled; holiday with family, switch to coconut oil, thus increasing its demand
owning a doll set, a computer and many more. and consequently the market rates).
Crafts Bazaar: Marico organized a day-long The Company took price increases to pass
Crafts Bazaar at several of its locations. It invited on most of the cost push to its consumers.
NGOs that support Women Empowerment, However, with the rapid upward spiral of costs,
Children and Education to set up stalls at its office retail price increases lagged behind, resulting in
premises. This gave the NGOs a platform to not some compression in margins. The Company
only display but also sell their products; the key implemented retail price increases in a phased
objective being to raise funds that would in turn be manner from August 2010 to February 2011,
ploughed back into the NGO, to further support taking a cumulative increase of about 32%. This
their individual causes. unprecedented price increase, in the overall
context of inflation in the country, has led to
THE MARICO GROWTH STORY a modest volume growth of ~5% in H2FY11.
Marico achieved a turnover of INR 3128 crore However, at the same time, the Company has
during FY11, a growth of 18% over FY10. The prioritized expansion of its consumer franchise.
volume growth underlying this revenue growth was Consequently, it did not pass on the entire
healthy at 12%. Profit after Tax (PAT) for FY11 was cost inflation; particularly in its 'recruiter packs',
INR 286 crore, a growth of 24% over FY10. Over the smaller stock keeping units (SKUs).
21

The Company will maintain its bias to grow ~52.1% during the 12 months ended March 2011.
volumes and in the event of a decline in copra
prices could thus be expected to pass back During FY11, while average market prices
some of the decline in input costs to consumers, of safflower oil remained flat, those of rice bran
particularly in the smaller packs. It may, however, oil were up ~21% as compared to FY10. The
hold on to a portion of the softening of input Company took price increases in select packs
costs so as to regain a part of the margin drop to compensate for this cost push.
in coconut oil during FY11.
In the longer term, Saffola would like to
Parachute's volume market share during establish itself as a leading healthy lifestyle brand.
the 12 months ended March 2011 was ~45.8%. It has commenced its journey in the foods space,
Together with Nihar and Oil of Malabar, Marico's and plans to have a basket of offerings that
volume share in the INR 1900 crore branded provides healthy food options throughout the day.
coconut oil segment in India was ~52.6%. In line with this strategy, the Company introduced
Saffola Oats in the month of June 2010. The
Saffola product prototyped primarily in the Modern Trade
Over the years, Saffola has created a very format in select cities across India and has
strong franchise for itself in the super premium received a good response. The oats market in India
refined edible oils market. It continues to leverage is valued at INR 120-140 crore and is growing
its 'good for heart' equity, riding the trend of at a healthy rate of ~40%. While the category has
increasing concern for overall health and heart seen the recent entry of a few players, the nascent
health in India. Several households have adopted market and trend towards wellness and health
Saffola in order to lead a healthier lifestyle foods provides room for all players to participate
(a preventive measure as opposed to being largely in this category growth. Saffola will also play a role
doctor-recommended). With the introduction of in expanding the market.
blends (currently Saffola refined oil is offered to
consumers in four blends), the Company has been During Q4FY10, Saffola Arise was launched
able to bring Saffola to its consumers at a range across key Saffola markets. The performance so
of price points. Given that the brand has a healthy far has been encouraging in the West and South
consumer retention rate, an increased household India markets, where short grain rice is popular.
base is expected to create a larger long term Repeat purchases of Saffola Arise are taking
franchise for the brand. place and the brand is also receiving the
support of influencers such as nutritionists.
During this year's World Heart Day, Saffola During Q4FY11, two more variants, Basmati Gold
launched its 'Young at Heart ' campaign, and Premium Grain (long grain rice) were
partnering leading hospitals, diagnostic centers introduced to strengthen the brand's position
and dietician teams to educate consumers in the North, where the longer grain is preferred.
about their 'heart age'. Aided by this initiative, the
Saffola refined oils franchise continued its healthy The packaged rice market in India is
growth. Saffola grew by ~16% in volume terms ~INR 400 Crore and is growing at over 20%. With
during FY11 compared to FY10. It maintained its innovative health positioning, Saffola hopes
its leadership position in the super premium to create a sizable franchise for itself over the next
refined edible oils market, with a market share of two to three years.
PROTECTING. NOURISHING. ENHANCING.
IF IT COMES FROM MARICO, IT HAS TO DO MORE.
With heart-friendly foods, nourishing hair oils and high-performance grooming aids, Marico ensures that its brands
deliver the maximum value possible to its consumers.
23

Hair Oils approach in a low-cost, fail-fast model to test
Marico offers its consumers a basket of the products before launching.
value-added hair oils for their pre-wash and post-
wash hair conditioning, nourishment and grooming In order to invest in new product initiatives,
needs. In the INR 3000 crore branded hair oils Marico follows a Strategic Funding (SF) approach.
market, hair oiling remains a deeply ingrained hair Marico defines SF as the negative contribution
conditioning habit across the Indian sub-continent. a product makes after providing for material costs,
With rising incomes in India, there are opportunities variable manufacturing and distribution costs and
to serve consumers looking for value-added advertising and sales promotion expenditure for
options to their hair oiling needs. the product. Each year, the company budgets for
a certain percentage of its Profit Before Tax to be
During the year, all Marico's hair oil brands available towards strategic funding for new
recorded healthy growth. The company's hair oils products and businesses. All new product ideas
portfolio in rigid packs grew by ~24% over FY10 fight for these resources. As the company's bottom
in volume terms, with most variants clocking line grows, the SF pie grows larger. This provides
a growth of over 20%. Moreover, the introduction sufficient investments towards creating future
of new sub-segments in Marico's portfolio, such growth engines and at the same time puts an
as Parachute Advansed Ayurvedic Hot Oil, overall ceiling to the SF at the group level.
Parachute Advansed Cooling Oil and Parachute
Advansed Ayurvedic Hair Oil has grown the overall During the year, the Company continued
hair oils franchise by bringing specificity and the process of prototyping and launching.
creating more occasions for use. Parachute Advansed Ayurvedic Hair Oil is being
prototyped in Tamil Nadu, while Parachute
Marico's hair oils franchise has achieved Advansed Body Lotion in being prototyped in
market share gains during FY11. Its volume market West Bengal. Both have received a positive
share during the 12 months ended March 2011, response. The Company is also prototyping Saffola
was 23%. The share is, however, on an increasing Oats in the Organized Trade channel across
trend, having reached ~25% in recent months. Five India and certain ‘mom and pop’ stores in
years ago, the company's share was about 17%. Southern India. The response has exceeded
These market share gains have been achieved expectations. Saffola Arise was launched in
through providing consumers with specific January 2010. During the year, two more variants,
solutions, product innovations, packaging Basmati and Premium Grain were introduced.
re-staging, participation in more sub-segments of
the value-added hair oils category, continued International FMCG Business
media support to some of the brands and Marico's International FMCG business (with
penetrative pricing action in others. key geographical constituents being Bangladesh,
MENA (Middle East and North Africa), South Africa
Prototypes & New Launches and South East Asia) comprised 23% of
Marico, being an FMCG company, has to the Marico Group's turnover in FY11. The
generate a healthy pipeline of new products to Company's international business continued to
create growth engines for the future. In order to grow handsomely and registered a growth of
identi fy scalable market ing and product 22% in FY11. The business growth (excluding
propositions, Marico follows a prototyping foreign currency impact) was, however, higher
HAIR QUALITY DIFFERS WIDELY ACROSS SOUTH-EAST ASIA & AFRICA.
THE HAIR CARE PROVIDER, HOWEVER, STAYS THE SAME.
Acquiring some leading local brands and adapting some from its Indian portfolio, Marico holds the dominant position in ethnic hair care
and male grooming, across South-east Asia and Africa.
24

Hair Oils approach in a low-cost, fail-fast model to test
Marico offers its consumers a basket of the products before launching.
value-added hair oils for their pre-wash and post-
wash hair conditioning, nourishment and grooming In order to invest in new product initiatives,
needs. In the INR 3000 crore branded hair oils Marico follows a Strategic Funding (SF) approach.
market, hair oiling remains a deeply ingrained hair Marico defines SF as the negative contribution
conditioning habit across the Indian sub-continent. a product makes after providing for material costs,
With rising incomes in India, there are opportunities variable manufacturing and distribution costs and
to serve consumers looking for value-added advertising and sales promotion expenditure for
options to their hair oiling needs. the product. Each year, the company budgets for
a certain percentage of its Profit Before Tax to be
During the year, all Marico's hair oil brands available towards strategic funding for new
recorded healthy growth. The company's hair oils products and businesses. All new product ideas
portfolio in rigid packs grew by ~24% over FY10 fight for these resources. As the company's bottom
in volume terms, with most variants clocking line grows, the SF pie grows larger. This provides
a growth of over 20%. Moreover, the introduction sufficient investments towards creating future
of new sub-segments in Marico's portfolio, such growth engines and at the same time puts an
as Parachute Advansed Ayurvedic Hot Oil, overall ceiling to the SF at the group level.
Parachute Advansed Cooling Oil and Parachute
Advansed Ayurvedic Hair Oil has grown the overall During the year, the Company continued
hair oils franchise by bringing specificity and the process of prototyping and launching.
creating more occasions for use. Parachute Advansed Ayurvedic Hair Oil is being
prototyped in Tamil Nadu, while Parachute
Marico's hair oils franchise has achieved Advansed Body Lotion in being prototyped in
market share gains during FY11. Its volume market West Bengal. Both have received a positive
share during the 12 months ended March 2011, response. The Company is also prototyping Saffola
was 23%. The share is, however, on an increasing Oats in the Organized Trade channel across
trend, having reached ~25% in recent months. Five India and certain ‘mom and pop’ stores in
years ago, the company's share was about 17%. Southern India. The response has exceeded
These market share gains have been achieved expectations. Saffola Arise was launched in
through providing consumers with specific January 2010. During the year, two more variants,
solutions, product innovations, packaging Basmati and Premium Grain were introduced.
re-staging, participation in more sub-segments of
the value-added hair oils category, continued International FMCG Business
media support to some of the brands and Marico's International FMCG business (with
penetrative pricing action in others. key geographical constituents being Bangladesh,
MENA (Middle East and North Africa), South Africa
Prototypes & New Launches and South East Asia) comprised 23% of
Marico, being an FMCG company, has to the Marico Group's turnover in FY11. The
generate a healthy pipeline of new products to Company's international business continued to
create growth engines for the future. In order to grow handsomely and registered a growth of
identi fy scalable market ing and product 22% in FY11. The business growth (excluding
propositions, Marico follows a prototyping foreign currency impact) was, however, higher
HAIR QUALITY DIFFERS WIDELY ACROSS SOUTH-EAST ASIA & AFRICA.
THE HAIR CARE PROVIDER, HOWEVER, STAYS THE SAME.
Acquiring some leading local brands and adapting some from its Indian portfolio, Marico holds the dominant position in ethnic hair care
and male grooming, across South-east Asia and Africa.

at 27% comprising 17% volume growth, 8% pricing 5-6 weeks. While this stabilized towards the end
and the balance coming from the new business of Q4FY11, the situation in other parts of the
in Vietnam. These growth rates would have region remains uncertain. While we believe the
been higher had the MENA region not seen long term trends for personal care products in the
political unrest in Q4FY11. region remain positive, the growth in the immediate
future may be unpredictable. In the near term,
Bangladesh the company will be cautious about the overall
In Bangladesh, Parachute continues to play level of investment in advertising. Meanwhile it is
out its market expansion strategy by converting also working on alternative sourcing options in
loose oil to packed branded coconut oil while order to de-risk its supply chain operations.
maintaining its strong leadership position. It
continued to ride on the growth momentum South Africa
backed by strong thematic campaigns and new The South African business continued to grow
launches. The brand has gone from strength to handsomely and recorded a growth of ~33%,
strength and was recognized as the 2nd most aided by the acquisition of Ingwe. The organic
trusted brand in Bangladesh across categories growth during the year was 24%. Caivil and Black
last year. (Source: A C Neilsen) Chic, the two lead brands, have been growing
steadily and improving their market shares in
The Company is building on its strategy of the ethnic hair care market in South Africa.
leveraging the extensive distribution network
created by Parachute. Hair Code hair dye has Malaysia
achieved about 29% value market share, Marico's Malaysian business has grown at
establishing itself as a strong number 2 player. In a very healthy growth rate and has responded
the value added hair oils space, Parachute well to the brand re-stage and the renewed
Advansed Beli, a light hair oil with a floral fragrance, thrust to distribution for Code 10. The initiatives of
is showing a positive trend while the recently integrating distribution and managing the transition
launched Parachute Advansed Cooling Oil has in manufacturing were completed as planned.
seen encouraging results in the market. The
response to Saffola refined edible oil, introduced in Entry into Vietnam
Bangladesh in FY11, is in line with expectations. Marico increased its commitment to the
This makes us confident of achieving continued South-east Asian market by taking up 85% equity
strong growth in Bangladesh, through these new in International Consumer Products Corporation
categories that complement the growth of the (ICP), one of the most successful Vietnamese
flagship, Parachute. FMCG companies. ICP was founded in 2001, by
Dr. Phan Quoc Cong and his partner. Its brands
MENA (Middle East and North Africa) (X-Men, L'Ovite, Thuan Phat and others) have
Revenue for this region in FY11 was flat as a significant presence across the personal care,
compared to FY10. Growth during the first three beauty cosmetics and sauces/condiments
quarters of the year was unfortunately negated categories. X-Men is a leading player in the male
by a fourth quarter that was badly impacted by the grooming segment in Vietnam and is the 2nd
political unrest in the region. Marico has created Most Trusted Personal Care brand in the country.
a manufacturing hub for MENA in Egypt. The With over 35% market share, it leads the men's
supply chain was adversely impacted for about shampoo category. L'Ovite, the company's
premium cosmetics brand, ranks amongst the the future in the form of loyalty and referral offers.
top 5 premium cosmetics brands in Vietnam. The
investment was funded entirely through debt. Four new advanced skin care products from
the Derma Rx range addressing acne and skin
The ICP numbers were consolidated with the ageing concerns were launched. The response
Marico Group financials for the period February 18 to these products has been encouraging. The
to March 31, 2011 and contributed ~INR 15 crore share of products to total turnover has increased
to the Group's top line for FY11. to ~17% in H2FY11 compared to ~13% earlier.
This is in line with the Company's strategy to
Kaya Skin Clinic increase the share of products to about 20%-22%
Kaya was the first organized player in in the next 2 years. The Company will continue to
the segment of cosmetic dermatology in India, and introduce more products in India in a phased
now enjoys a large first mover advantage in manner. Derma Rx products are in the process
the segment. During FY11, Kaya's skin solutions of being introduced in the Middle East too. The
business achieved a turnover of INR 239 crore, process has got delayed owing to regulatory
recording a revenue growth of ~31% over FY10, procedural issues. It is expected that these
boosted by the acquisition of Singapore-based products can be introduced in the clinics in the
Derma Rx in May 2010. On an overall basis, Kaya Middle East by Q2FY12. The Company believes
made a loss of INR 2.30 crores at PBT level. that introduction of these products makes the
range of products at Kaya more complete. These
The Kaya business without Derma Rx products will set a new standard for acne and
achieved a revenue growth of ~7% over FY10. pigmentation management in India. Higher product
Same clinic growth during the year was 2%. The sales will generate more through-put from the
Kaya business (excluding Derma Rx) incurred a clinics and help improve their ROCE.
PBT loss of INR 14.1 crore. (These numbers are
before considering the impact of exceptional and Kaya now offers its technology-led cosmetic
one time items explained in the notes to the dermatological services through 103 clinics:
financial statements). 81 in India across 26 cities, 16 in the Middle East
and 2 in Bangladesh, in addition to the 4 clinics
While Kaya had experienced same clinic and medispas in Singapore and Malaysia through
decline in revenue during H1FY11, the trend Derma Rx.
was reversed during H2FY11. It recorded a same
clinic year-on-year growth of ~8% in the second
half of the year.
Kaya introduced services priced at INR 990
for a single session to serve as traffic builders.
These were accompanied by easy upgradable
offers. They were backed by advertising on radio
and press as well as robust digital and CRM plans.
The change in media strategy from TV to radio and
press has resulted in better utilization of resources.
Kaya will continue to use consumer promotions in
26

at 27% comprising 17% volume growth, 8% pricing 5-6 weeks. While this stabilized towards the end
and the balance coming from the new business of Q4FY11, the situation in other parts of the
in Vietnam. These growth rates would have region remains uncertain. While we believe the
been higher had the MENA region not seen long term trends for personal care products in the
political unrest in Q4FY11. region remain positive, the growth in the immediate
future may be unpredictable. In the near term,
Bangladesh the company will be cautious about the overall
In Bangladesh, Parachute continues to play level of investment in advertising. Meanwhile it is
out its market expansion strategy by converting also working on alternative sourcing options in
loose oil to packed branded coconut oil while order to de-risk its supply chain operations.
maintaining its strong leadership position. It
continued to ride on the growth momentum South Africa
backed by strong thematic campaigns and new The South African business continued to grow
launches. The brand has gone from strength to handsomely and recorded a growth of ~33%,
strength and was recognized as the 2nd most aided by the acquisition of Ingwe. The organic
trusted brand in Bangladesh across categories growth during the year was 24%. Caivil and Black
last year. (Source: A C Neilsen) Chic, the two lead brands, have been growing
steadily and improving their market shares in
The Company is building on its strategy of the ethnic hair care market in South Africa.
leveraging the extensive distribution network
created by Parachute. Hair Code hair dye has Malaysia
achieved about 29% value market share, Marico's Malaysian business has grown at
establishing itself as a strong number 2 player. In a very healthy growth rate and has responded
the value added hair oils space, Parachute well to the brand re-stage and the renewed
Advansed Beli, a light hair oil with a floral fragrance, thrust to distribution for Code 10. The initiatives of
is showing a positive trend while the recently integrating distribution and managing the transition
launched Parachute Advansed Cooling Oil has in manufacturing were completed as planned.
seen encouraging results in the market. The
response to Saffola refined edible oil, introduced in Entry into Vietnam
Bangladesh in FY11, is in line with expectations. Marico increased its commitment to the
This makes us confident of achieving continued South-east Asian market by taking up 85% equity
strong growth in Bangladesh, through these new in International Consumer Products Corporation
categories that complement the growth of the (ICP), one of the most successful Vietnamese
flagship, Parachute. FMCG companies. ICP was founded in 2001, by
Dr. Phan Quoc Cong and his partner. Its brands
MENA (Middle East and North Africa) (X-Men, L'Ovite, Thuan Phat and others) have
Revenue for this region in FY11 was flat as a significant presence across the personal care,
compared to FY10. Growth during the first three beauty cosmetics and sauces/condiments
quarters of the year was unfortunately negated categories. X-Men is a leading player in the male
by a fourth quarter that was badly impacted by the grooming segment in Vietnam and is the 2nd
political unrest in the region. Marico has created Most Trusted Personal Care brand in the country.
a manufacturing hub for MENA in Egypt. The With over 35% market share, it leads the men's
supply chain was adversely impacted for about shampoo category. L'Ovite, the company's
premium cosmetics brand, ranks amongst the the future in the form of loyalty and referral offers.
top 5 premium cosmetics brands in Vietnam. The
investment was funded entirely through debt. Four new advanced skin care products from
the Derma Rx range addressing acne and skin
The ICP numbers were consolidated with the ageing concerns were launched. The response
Marico Group financials for the period February 18 to these products has been encouraging. The
to March 31, 2011 and contributed ~INR 15 crore share of products to total turnover has increased
to the Group's top line for FY11. to ~17% in H2FY11 compared to ~13% earlier.
This is in line with the Company's strategy to
Kaya Skin Clinic increase the share of products to about 20%-22%
Kaya was the first organized player in in the next 2 years. The Company will continue to
the segment of cosmetic dermatology in India, and introduce more products in India in a phased
now enjoys a large first mover advantage in manner. Derma Rx products are in the process
the segment. During FY11, Kaya's skin solutions of being introduced in the Middle East too. The
business achieved a turnover of INR 239 crore, process has got delayed owing to regulatory
recording a revenue growth of ~31% over FY10, procedural issues. It is expected that these
boosted by the acquisition of Singapore-based products can be introduced in the clinics in the
Derma Rx in May 2010. On an overall basis, Kaya Middle East by Q2FY12. The Company believes
made a loss of INR 2.30 crores at PBT level. that introduction of these products makes the
range of products at Kaya more complete. These
The Kaya business without Derma Rx products will set a new standard for acne and
achieved a revenue growth of ~7% over FY10. pigmentation management in India. Higher product
Same clinic growth during the year was 2%. The sales will generate more through-put from the
Kaya business (excluding Derma Rx) incurred a clinics and help improve their ROCE.
PBT loss of INR 14.1 crore. (These numbers are
before considering the impact of exceptional and Kaya now offers its technology-led cosmetic
one time items explained in the notes to the dermatological services through 103 clinics:
financial statements). 81 in India across 26 cities, 16 in the Middle East
and 2 in Bangladesh, in addition to the 4 clinics
While Kaya had experienced same clinic and medispas in Singapore and Malaysia through
decline in revenue during H1FY11, the trend Derma Rx.
was reversed during H2FY11. It recorded a same
clinic year-on-year growth of ~8% in the second
half of the year.
Kaya introduced services priced at INR 990
for a single session to serve as traffic builders.
These were accompanied by easy upgradable
offers. They were backed by advertising on radio
and press as well as robust digital and CRM plans.
The change in media strategy from TV to radio and
press has resulted in better utilization of resources.
Kaya will continue to use consumer promotions in
27

COST STRUCTURE FOR MARICO GROUP CAPITAL UTILIZATION
(before exceptional and one time adjustments) Over the years, Marico has been maintaining
a healthy Return on Capital Employed (ROCE).
Given below is a snapshot of various capital
efficiency ratios for Marico Group:
Notes:
1. The above ratios are before exceptional
and one time items included in the financials
for the period.
*Turnover Ratios calculated on the basis of average balances
2. The year witnessed steep inflation in prices
1. There has been a decline in the Group's of input materials. Market prices of Copra,
ROCE in FY11 compared to FY10 mainly on the input for coconut oil, which accounts
account of the investments made in Vietnam. for ~40% of the Group's raw material cost,
was ~45% higher than in FY10. Market
2. There has been an increase in NWC level prices of Safflower Oil were flat whereas
mainly due to an increase in inventory on prices of Rice Bran Oil were up by 21%
account of inflation in input prices. compared to the previous year. The Company
chose to pass on a part of the input cost
3. As of March 31, 2011 the Marico Group had increase to consumers.
a net debt of INR 500 crore (~USD 111 mio)
{Gross INR 772 crore (~USD 171.5 mio)}. 3. With increased input costs and retail prices,
Of the gross debt, about INR 554 crore while the company may maintain its absolute
(~USD 123.1 mio) is denominated in foreign margin per unit at around the last three
currency. About INR 222 crore (~USD 49.3 years' average, the higher sales realization
mio) of the foreign currency debt is repayable base will reflect a lower margin in percentage
within a year. Other than INR 50 crore terms.
(~USD 11.1 mio) debt, the balance debt of
INR 168 crore (~USD 37.3 mio) denominated4. Increases in ASP, personnel costs and
in Indian Rupees is payable within a year. other expenses have not kept pace with the
The average cost of the debt is ~5.0 %. The 18% revenue growth leading to some decline
company may roll over some of the loans in percentage terms. During Q4FY11, the
when they fall due during the year or redeem company took a conservative approach to
investments for repayment. Marico has ASP spends in MENA. In Kaya there was
adequate cash flows to maintain healthy a change in strategy to focus on press and
debt service coverage. digital media instead of television advertizing.
In the domestic consumer products business,
4. The Company periodically reviews and the phasing between quarters saw a lower
hedges the variable interest liability for long spend in Q4FY11.
% to Sales & Services (net of excise)
Material Cost (Raw + Packaging) 51.2 47.4
Advertising & Sales Promotion (ASP) 11.0 13.2
Personnel Costs 7.3 7.3
Other Expenses 16.6 16.8
PBDIT Margins 13.9 15.3
Gross Margins (PBDIT before ASP) 24.9 28.5
FY11 FY10
Ratio FY11 FY10
Return on Capital Employed 22% 34.4%
Return on Net Worth 36.5% 41.8%
Working Capital Ratios
• Debtors Turnover (Days) 20 18
• Inventory Turnover (Days) 61 54
• Net Working Capital Turnover (Days) 69 57
Debt: Equity 0.78 0.74
Finance Costs to Turnover (%) 1.3 1.0
With advanced technology, customized skin care services and world-class clinics at destinations across the country and overseas, Kaya Ltd. brings radiant skin
and unbounded confidence to over a million people every year - making it India's leading cosmetic dermatology chain and one of the largest in the world.
WORLD-CLASS CLINICS. CUSTOMIZED SKINCARE SOLUTIONS.
CUTTING-EDGE TECHNOLOGY.NATURALLY, OUR CUSTOMERS
ARE GLOWING.

CAPITAL UTILIZATION
(before exceptional and one time adjustments) Over the years, Marico has been maintaining
a healthy Return on Capital Employed (ROCE).
Given below is a snapshot of various capital
efficiency ratios for Marico Group:
Notes:
1. The above ratios are before exceptional
and one time items included in the financials
for the period.
*Turnover Ratios calculated on the basis of average balances
2. The year witnessed steep inflation in prices 1. There has been a decline in the Group's of input materials. Market prices of Copra,
ROCE in FY11 compared to FY10 mainly on the input for coconut oil, which accounts account of the investments made in Vietnam. for ~40% of the Group's raw material cost,
was ~45% higher than in FY10. Market 2. There has been an increase in NWC level prices of Safflower Oil were flat whereas
mainly due to an increase in inventory on prices of Rice Bran Oil were up by 21% account of inflation in input prices. compared to the previous year. The Company
chose to pass on a part of the input cost 3. As of March 31, 2011 the Marico Group had increase to consumers.
a net debt of INR 500 crore (~USD 111 mio)
{Gross INR 772 crore (~USD 171.5 mio)}. 3. With increased input costs and retail prices, Of the gross debt, about INR 554 crore while the company may maintain its absolute (~USD 123.1 mio) is denominated in foreign margin per unit at around the last three currency. About INR 222 crore (~USD 49.3 years' average, the higher sales realization mio) of the foreign currency debt is repayable base will reflect a lower margin in percentage within a year. Other than INR 50 crore terms. (~USD 11.1 mio) debt, the balance debt of
INR 168 crore (~USD 37.3 mio) denominated4. Increases in ASP, personnel costs and in Indian Rupees is payable within a year. other expenses have not kept pace with the The average cost of the debt is ~5.0 %. The 18% revenue growth leading to some decline company may roll over some of the loans in percentage terms. During Q4FY11, the when they fall due during the year or redeem company took a conservative approach to investments for repayment. Marico has ASP spends in MENA. In Kaya there was adequate cash flows to maintain healthy a change in strategy to focus on press and debt service coverage. digital media instead of television advertizing.
In the domestic consumer products business, 4. The Company periodically reviews and the phasing between quarters saw a lower
hedges the variable interest liability for long spend in Q4FY11.
COST STRUCTURE FOR MARICO GROUP
% to Sales & Services (net of excise)
Material Cost (Raw + Packaging) 51.2 47.4
Advertising & Sales Promotion (ASP) 11.0 13.2
Personnel Costs 7.3 7.3
Other Expenses 16.6 16.8
PBDIT Margins 13.9 15.3
Gross Margins (PBDIT before ASP) 24.9 28.5
FY11 FY10
Ratio FY11 FY10
Return on Capital Employed 22% 34.4%
Return on Net Worth 36.5% 41.8%
Working Capital Ratios
• Debtors Turnover (Days) 20 18
• Inventory Turnover (Days) 61 54
• Net Working Capital Turnover (Days) 69 57
Debt: Equity 0.78 0.74
Finance Costs to Turnover (%) 1.3 1.0
With advanced technology, customized skin care services and world-class clinics at destinations across the country and overseas, Kaya Ltd. brings radiant skin
and unbounded confidence to over a million people every year - making it India's leading cosmetic dermatology chain and one of the largest in the world.
WORLD-CLASS CLINICS. CUSTOMIZED SKINCARE SOLUTIONS.
CUTTING-EDGE TECHNOLOGY.NATURALLY, OUR CUSTOMERS
ARE GLOWING.
29

Rs. 3.09 crore as a result of review of remaining Skin Care Clinics under the brand Kaya
useful life of certain assets at Kaya Skin clinics. and Derma Rx.
Similarly there were certain one-time items 2. Income from services offered at the Skin
included in FY10 results which are not strictly Care Clinics under the brand Kaya and
comparable such as Write-off of Translation Derma Rx
Reserve pertaining Sundari business amounting
to Rs. 4.1 crore and closure costs of Kaya Life 3. Other Income, primarily includes profits on
Centres amounting to Rs. 5.7 crore. sale of investments, dividends, interest and
miscellaneous income.
If these items were to be ignored, the
Sales and PAT for the year under review would The following table shows the details of
have been higher at Rs. 3157 crore, a growth of income from sales and services for FY11 and FY10
19% over FY10, and Rs. 300 crore, a growth of
15% over FY10, respectively.
Marico has kept up its track record of
quarterly growth. Q4FY11 was in Y-o-Y terms, the:
• 42nd consecutive Quarter of growth in
Turnover and
• 46th consecutive Quarter of growth in Profits There has been around 18% growth in
Net Sales/Income from Operations on account of
Over the past 5 years, the Sales and PAT 17% growth in Consumer Products Business in
have grown at a compounded annual growth India, 22% growth in Consumer Products Business
rate of 22% and 27% respectively outside India and 12% in Kaya. There was a one-off
revenue adjustment in Kaya amounting to
TOTAL INCOME INR 31.32 crore (Please refer to Note 16, Schedule
R). The growth before this one off adjustment is
Our total income consists of the following higher at 19%.
1. Sale of products comprising The underlying Volume growth in the
a. Sa les f rom ‘Consumer Products ’ Consumer Products Business was healthy
including coconut oil, value added hair at 12% at Group level as a result of 11%
oils, premium refined edible oils, anti-lice growth in Consumer Products Business in India
treatments, fabric care, edible salt, and 19% growth in Consumer Products Business
functional foods, hair creams & gels, outside India.
shampoos, hair straightners and other
similar consumer products, by-products, Other income principally accounts for profit
and scrap sales. on sales of investment, interest and dividend
b. Sale and income from other products income arising largely from investment of short
including skin care products sold through term surpluses.
term loans using Interest Rate Swaps. respectively. With this, the cumulative dividend
declared for the year is 66%. This corresponds
5. The Company had decided to adopt to a dividend payout ratio of 16.5% (inclusive of
Accounting Standard (AS) 30 in FY10 – dividend distribution tax).
Financial Instruments: Recognition &
Measurement issued by The Institute of RESULTS OF OPERATIONS – AN OVERVIEW
Chartered Accountants of India. Accordingly Marico achieved a turnover of Rs. 3128 crore
the net unrealized gains or losses in respect during FY11, a growth of 18% over FY10. The
of outstanding derivative instruments and volume growth underlying this revenue growth
foreign currency loans at the period end was healthy at 12%.
which qualify for hedge accounting are
reflected in the 'Hedge Reserve Account', Profit after tax (PAT) for FY11 was 286 crore,
which will get recognized in the Profit and a growth of 24% over FY10. These results include
Loss account when the underlying transaction the following items that are not strictly comparable
or forecast revenue arises. with FY10. Each of these items is explained in
detail in the Notes to the Consolidated Annual
SHAREHOLDER VALUE Financial Statements:
• Reversal of Excise Duty Provision of Rs. 29.4
Pay out – distribution of profit to shareholders crore made during FY10 towards contingent
Over the past few years, Marico has made excise duty obligation in respect of
acquisitions, including a majority stake in dispatches of coconut oil in packs up to
International Consumer Products (ICP), Vietnam in 200 ml (Please refer to Note 27, Schedule R);
February 2011. The company financed the same • Profit on divestment of edible oil brand
through issue of fresh equity, borrowings from ‘Sweekar’ amounting to Rs. 50 crore (Please
banks and internal cash generation. Marico has refer to Note 14 (b), Schedule R);
focused on deploying its resources in avenues • Impact of change in accounting estimates
which will result in maximization of shareholder relating to revenue recognition in Kaya
value. Continuing with this policy, the Board of amounting to Rs. 31.32 crore (Please refer
Directors of Marico has decided to follow a to Note 16, Schedule R );
conservative dividend policy, till we are able to • Impairment Provision impact of Rs. 7.74 crore
deploy the funds in attractive growth opportunities. as a result of impairment testing at clinic
The broad direction is to maintain the absolute level at Kaya Skin clinics in India (Please refer
amount of dividend as paid out in the previous to Note 14 (d), Schedule R);
year. On a growing profit base, the pay out ratio • Impairment of tangible and intangible assets
would be lower. However, if we do not find any relating to the business of Fiancée amounting
suitable avenue to deploy funds in the near term, to Rs. 22.7 crore (Please refer to Note 14(c),
we will repay the debt on the balance sheet and Schedule R) and
re-look at the dividend payout ratios. • Amortization of Intangible assets (brands)
held by overseas subsidiaries amounting
Dividend declared to Rs. 9.5 crore (Please refer to Note 15,
At its meetings held on October 26, 2010 Schedule R).
and May 2, 2011, the Board of Directors had
declared interim dividends of 30% and 36% Also, there is an increase in depreciation by
Particulars FY 10-11 FY 09-10
Net Sales / Income from Operations 3128.31 2660.75
Other Income 27.88 18.26
Total 3156.19 2679.01
INR crore
30

Rs. 3.09 crore as a result of review of remaining Skin Care Clinics under the brand Kaya
useful life of certain assets at Kaya Skin clinics. and Derma Rx.
Similarly there were certain one-time items 2. Income from services offered at the Skin
included in FY10 results which are not strictly Care Clinics under the brand Kaya and
comparable such as Write-off of Translation Derma Rx
Reserve pertaining Sundari business amounting
to Rs. 4.1 crore and closure costs of Kaya Life 3. Other Income, primarily includes profits on
Centres amounting to Rs. 5.7 crore. sale of investments, dividends, interest and
miscellaneous income.
If these items were to be ignored, the
Sales and PAT for the year under review would The following table shows the details of
have been higher at Rs. 3157 crore, a growth of income from sales and services for FY11 and FY10
19% over FY10, and Rs. 300 crore, a growth of
15% over FY10, respectively.
Marico has kept up its track record of
quarterly growth. Q4FY11 was in Y-o-Y terms, the:
• 42nd consecutive Quarter of growth in
Turnover and
• 46th consecutive Quarter of growth in Profits There has been around 18% growth in
Net Sales/Income from Operations on account of
Over the past 5 years, the Sales and PAT 17% growth in Consumer Products Business in
have grown at a compounded annual growth India, 22% growth in Consumer Products Business
rate of 22% and 27% respectively outside India and 12% in Kaya. There was a one-off
revenue adjustment in Kaya amounting to
TOTAL INCOME INR 31.32 crore (Please refer to Note 16, Schedule
R). The growth before this one off adjustment is
Our total income consists of the following higher at 19%.
1. Sale of products comprising The underlying Volume growth in the
a. Sa les f rom ‘Consumer Products ’ Consumer Products Business was healthy
including coconut oil, value added hair at 12% at Group level as a result of 11%
oils, premium refined edible oils, anti-lice growth in Consumer Products Business in India
treatments, fabric care, edible salt, and 19% growth in Consumer Products Business
functional foods, hair creams & gels, outside India.
shampoos, hair straightners and other
similar consumer products, by-products, Other income principally accounts for profit
and scrap sales. on sales of investment, interest and dividend
b. Sale and income from other products income arising largely from investment of short
including skin care products sold through term surpluses.
term loans using Interest Rate Swaps. respectively. With this, the cumulative dividend
declared for the year is 66%. This corresponds
5. The Company had decided to adopt to a dividend payout ratio of 16.5% (inclusive of
Accounting Standard (AS) 30 in FY10 – dividend distribution tax).
Financial Instruments: Recognition &
Measurement issued by The Institute of RESULTS OF OPERATIONS – AN OVERVIEW
Chartered Accountants of India. Accordingly Marico achieved a turnover of Rs. 3128 crore
the net unrealized gains or losses in respect during FY11, a growth of 18% over FY10. The
of outstanding derivative instruments and volume growth underlying this revenue growth
foreign currency loans at the period end was healthy at 12%.
which qualify for hedge accounting are
reflected in the 'Hedge Reserve Account', Profit after tax (PAT) for FY11 was 286 crore,
which will get recognized in the Profit and a growth of 24% over FY10. These results include
Loss account when the underlying transaction the following items that are not strictly comparable
or forecast revenue arises. with FY10. Each of these items is explained in
detail in the Notes to the Consolidated Annual
SHAREHOLDER VALUE Financial Statements:
• Reversal of Excise Duty Provision of Rs. 29.4
Pay out – distribution of profit to shareholders crore made during FY10 towards contingent
Over the past few years, Marico has made excise duty obligation in respect of
acquisitions, including a majority stake in dispatches of coconut oil in packs up to
International Consumer Products (ICP), Vietnam in 200 ml (Please refer to Note 27, Schedule R);
February 2011. The company financed the same • Profit on divestment of edible oil brand
through issue of fresh equity, borrowings from ‘Sweekar’ amounting to Rs. 50 crore (Please
banks and internal cash generation. Marico has refer to Note 14 (b), Schedule R);
focused on deploying its resources in avenues • Impact of change in accounting estimates
which will result in maximization of shareholder relating to revenue recognition in Kaya
value. Continuing with this policy, the Board of amounting to Rs. 31.32 crore (Please refer
Directors of Marico has decided to follow a to Note 16, Schedule R );
conservative dividend policy, till we are able to • Impairment Provision impact of Rs. 7.74 crore
deploy the funds in attractive growth opportunities. as a result of impairment testing at clinic
The broad direction is to maintain the absolute level at Kaya Skin clinics in India (Please refer
amount of dividend as paid out in the previous to Note 14 (d), Schedule R);
year. On a growing profit base, the pay out ratio • Impairment of tangible and intangible assets
would be lower. However, if we do not find any relating to the business of Fiancée amounting
suitable avenue to deploy funds in the near term, to Rs. 22.7 crore (Please refer to Note 14(c),
we will repay the debt on the balance sheet and Schedule R) and
re-look at the dividend payout ratios. • Amortization of Intangible assets (brands)
held by overseas subsidiaries amounting
Dividend declared to Rs. 9.5 crore (Please refer to Note 15,
At its meetings held on October 26, 2010 Schedule R).
and May 2, 2011, the Board of Directors had
declared interim dividends of 30% and 36% Also, there is an increase in depreciation by
Particulars FY 10-11 FY 09-10
Net Sales / Income from Operations 3128.31 2660.75
Other Income 27.88 18.26
Total 3156.19 2679.01
INR crore
31

EXPENSES
The following table sets the expenses and certain other profit and loss account line items
for the years FY11 and FY10:
Particulars
Total Income
Expenditure
Cost of Materials
% of Total Income
Employees Cost
% of Total Income
Advertisement and Sales Promotion
% of Total Income
Depreciation, Amortisation and Impairment
% of Total Income
Other Expenditure
% of Total Income
Finance Charges
% of Total Income
Total Expenses before exceptional items
% of Total Income
PBT before Exceptional Items
% of Total Income
Exceptional Items
Profit Before Tax
% of Total Income
Tax
Profit after tax before Minority Interest
% of Total Income
Minority Interest
Profit after Tax
% of Total Income
FY 2009-10
2679.01
1261.60
47.1%
190.12
7.1%
351.11
13.1%
60.06
2.2%
482.78
18.0%
25.68
1.0%
2371.36
88.5%
307.65
11.5%
297.86
11.1%
64.32
233.54
8.7%
1.87
231.67
8.6%
(9.78)
FY 2010-11
3156.19
1617.94
51.3%
230.37
7.3%
345.98
11.0%
70.80
2.2%
524.24
16.6%
39.33
1.2%
2828.66
89.6%
327.53
10.4%
(48.91)
376.44
11.9%
84.99
291.45
9.2%
5.01
286.44
9.1%
Cost of Materials bigger new product launches. In addition the
Cost of material includes consumption of overall cost push in materials also led to some
raw material, packing material, purchase of moderation in the ASP spends. In Kaya we have
finished goods for sale and increase or decrease gone back to localised and more effective
in the stocks of finished goods, by-products advertisement in Print and Radio as against TV
and work in progress. There was an overall earlier. During Q4FY11 advertising expenditure in
inflationary environment seen in input cost prices MENA was curtailed owing to the political unrest
during FY11. As a result, the Company's material in the region.
cost as a percentage to total income has
increased. This is largely on account of Depreciation, amortisation and impairment
unprecedented inflation seen in prices of Copra, Generally, depreciation costs increase based
an important ingredient for the Company. The on the capital expenditure we incur.
market prices of copra were higher by 45%
compared to the previous year. Prices of other Depreciation expense has increased
input materials also saw an increase. Rice bran compared to FY10 mainly on account of certain
oil for instance was higher by 21%, Liquid Paraffin one off adjustments during FY11
by 36% and HDPE by 6%. The Company • In line with the Indian Accounting
maintained its thrust on volume growth and Standards the Company has commenced
therefore chose not to pass on the entire input amortisation of Brands held by some of the
cost push to the consumers. overseas subsidiaries. This expense however
will be continued going forward (Please refer
Employee Cost to Note 15, Schedule R).
Employee cost includes salaries, wages,
bonus and gratuity, contribution to provident and Other Expenses
other funds and staff welfare schemes expenses. Other expenses include items such as
We have an extensive process of performance Freight & Forwarding, Selling and Distribution,
management enhancement th rough the Rent and other expenses mainly fixed in nature.
deployment of MBR (Management by Results), There is a decline seen in the other expenses
which is intended to create an environment where as a percentage to sales mainly due to the fact
employees are encouraged to challenge and that the Excise Duty Provision of Rs. 29.4 crore
stretch themselves. Linked to this is a variable made during FY10 towards possible excise duty
compensation element based on the Company's obligation in respect of dispatches of coconut
target achievement and the indiv idual 's oil in packs up to 200 ml was reversed in FY11
performances against goals identified. The (Please refer to Note 27, Schedule R). In addition
increase in employee costs is primarily on account inflation in other expenses has not kept pace with
of normal annual compensation revisions and the inflationary growth in top line.
increase in headcount.
Finance Charges
Advertisement and Sales Promotion Financial charges include interest on loans
Our advertisement and sales promotion (ASP) and other financial charges. There is an increase
expenses in FY11 were slightly lower than that in in finance costs owing partly to an increase in the
FY10. In the Consumer Products Business in India overall interest rate regime and partly on account
there was a conscious strategy to do fewer but of increased borrowings. Borrowings are
INR crore
32

EXPENSES
The following table sets the expenses and certain other profit and loss account line items
for the years FY11 and FY10:
Particulars
Total Income
Expenditure
Cost of Materials
% of Total Income
Employees Cost
% of Total Income
Advertisement and Sales Promotion
% of Total Income
Depreciation, Amortisation and Impairment
% of Total Income
Other Expenditure
% of Total Income
Finance Charges
% of Total Income
Total Expenses before exceptional items
% of Total Income
PBT before Exceptional Items
% of Total Income
Exceptional Items
Profit Before Tax
% of Total Income
Tax
Profit after tax before Minority Interest
% of Total Income
Minority Interest
Profit after Tax
% of Total Income
FY 2009-10
2679.01
1261.60
47.1%
190.12
7.1%
351.11
13.1%
60.06
2.2%
482.78
18.0%
25.68
1.0%
2371.36
88.5%
307.65
11.5%
297.86
11.1%
64.32
233.54
8.7%
1.87
231.67
8.6%
(9.78)
FY 2010-11
3156.19
1617.94
51.3%
230.37
7.3%
345.98
11.0%
70.80
2.2%
524.24
16.6%
39.33
1.2%
2828.66
89.6%
327.53
10.4%
(48.91)
376.44
11.9%
84.99
291.45
9.2%
5.01
286.44
9.1%
Cost of Materials bigger new product launches. In addition the
Cost of material includes consumption of overall cost push in materials also led to some
raw material, packing material, purchase of moderation in the ASP spends. In Kaya we have
finished goods for sale and increase or decrease gone back to localised and more effective
in the stocks of finished goods, by-products advertisement in Print and Radio as against TV
and work in progress. There was an overall earlier. During Q4FY11 advertising expenditure in
inflationary environment seen in input cost prices MENA was curtailed owing to the political unrest
during FY11. As a result, the Company's material in the region.
cost as a percentage to total income has
increased. This is largely on account of Depreciation, amortisation and impairment
unprecedented inflation seen in prices of Copra, Generally, depreciation costs increase based
an important ingredient for the Company. The on the capital expenditure we incur.
market prices of copra were higher by 45%
compared to the previous year. Prices of other Depreciation expense has increased
input materials also saw an increase. Rice bran compared to FY10 mainly on account of certain
oil for instance was higher by 21%, Liquid Paraffin one off adjustments during FY11
by 36% and HDPE by 6%. The Company • In line with the Indian Accounting
maintained its thrust on volume growth and Standards the Company has commenced
therefore chose not to pass on the entire input amortisation of Brands held by some of the
cost push to the consumers. overseas subsidiaries. This expense however
will be continued going forward (Please refer
Employee Cost to Note 15, Schedule R).
Employee cost includes salaries, wages,
bonus and gratuity, contribution to provident and Other Expenses
other funds and staff welfare schemes expenses. Other expenses include items such as
We have an extensive process of performance Freight & Forwarding, Selling and Distribution,
management enhancement th rough the Rent and other expenses mainly fixed in nature.
deployment of MBR (Management by Results), There is a decline seen in the other expenses
which is intended to create an environment where as a percentage to sales mainly due to the fact
employees are encouraged to challenge and that the Excise Duty Provision of Rs. 29.4 crore
stretch themselves. Linked to this is a variable made during FY10 towards possible excise duty
compensation element based on the Company's obligation in respect of dispatches of coconut
target achievement and the indiv idual 's oil in packs up to 200 ml was reversed in FY11
performances against goals identified. The (Please refer to Note 27, Schedule R). In addition
increase in employee costs is primarily on account inflation in other expenses has not kept pace with
of normal annual compensation revisions and the inflationary growth in top line.
increase in headcount.
Finance Charges
Advertisement and Sales Promotion Financial charges include interest on loans
Our advertisement and sales promotion (ASP) and other financial charges. There is an increase
expenses in FY11 were slightly lower than that in in finance costs owing partly to an increase in the
FY10. In the Consumer Products Business in India overall interest rate regime and partly on account
there was a conscious strategy to do fewer but of increased borrowings. Borrowings are
INR crore
33

Shareholders Funds stake in DRx Clinic Pte. Ltd., The DRx
This comprises the paid up share capital and Medispa Pte. Ltd., DRx Investment Pte. Ltd.
reserves & surplus. There has been an increase in and DRx Aesthetics Sdn. Bhd in Singapore.
the share capital on account of stock options
exercised by the employees under the ESOP 2. Further in February 2011, Marico Limited
Scheme. (Note 21) to the Financial Statements acquired 85% equity stake in International
provides further details of stock options issued, Consumer Products Corporation, Vietnam.
exercised and pending to be exercised.
Fixed Assets
Minority Interest Fixed assets represent investments made
Minority Interest represents the share of by the Company in tangible assets such as
Consolidated profits attributable to non-Marico Buildings, Plant & Machinery, Furniture & Fixtures
shareholders in Marico Bangladesh Limited and etc. Apart from normal yearly capital expenditure,
International Consumer Products Corporation: the increase is largely on account of trade marks
1. The Company’s Bangladesh subsidiary, and fixed assets of Derma Rx and ICP which
Marico Bangladesh Limited, had listed were acquired during the year.
10% of its equity share capital on the Dhaka
Stock Exchange in September 2009 by Investments
issuing fresh shares to public in that country; Investments comprise funds parked in short
term and long term instruments like Mutual Funds.
2. The Company acquired 85% stake A substantial part of the investments is parked
in International Consumer Products in short term instruments. There has not been
Corporation (ICP) in Vietnam and started any significant variation in the balances as on
consolidating it with effect from February March 2011 compared to March 2010.
18, 2011. The balance 15% shareholding
continues to be with one of the sellers. Deferred Tax Asset (DTA)
Deferred Tax Asset represents the timing
Loan Funds differences resulting due to variations in the
Loan funds include borrowings which are treatment of items as per Income Tax Act, 1961
payable after one year or more from the date and Indian GAAP.
of the balance sheet. These include a judicious
blend of borrowings in local and foreign currency. The amount of deferred tax asset has come
There has been an increase in the loan funds due down on account of two main reasons
to various acquisitions made by the Company • The Company had adjusted in the Books of
during the year primarily funded through debt. Account the value of Intangible Assets
against the Capital Redemption Reserve and
Goodwill on Consolidation Securities Premium Account under the Capital
Goodwill on consolidation represents the Restructuring Scheme in an earlier year and
consideration paid to acquire companies in excess hence created a DTA. As the Written Down
of their net assets. Value of those Intangible Assets as per
1. In May 2010, a wholly owned subsidiary of Taxation books is coming down the DTA is
Kaya Limited, Derma Rx International getting reversed.
Aesthetics Pte. Ltd. acquired 100% equity • The Company has made a DTA on the excise
higher primarily on account of the acquisitions explained in Note 14 of Schedule R of the
of Derma Rx, Ingwe and shares in ICP as well as Consolidated Financial Statements.
higher inventory owing to inflation in input costs.
Tax
Exceptional Items Taxes comprise Income Tax and Deferred
There were some items which are exceptional Tax. There has not been any significant change
in nature and hence detailed separately on the in the effective tax rate for the year FY11 compared
face of Profit and Loss account. These are to FY10.
Particulars
SOURCES OF FUNDS
Shareholders' Funds
Share Capital
Reserves and surplus
Minority Interest
Loan Funds
Total
APPLICATION OF FUNDS
Goodwill on Consolidation
Fixed Assets (Net)
Investments
Deferred Tax Asset (Net)
Current Assets, Loans and Advances
Inventories
Sundry Debtors
Cash and bank balances
Loans and Advances
Less: Current Liabilities and Provisions
Current Liabilities
Provisions
Net Current Assets
Total
As at
March 31, 2010
60.93
593.03
653.96
12.54
445.87
1112.37
85.03
399.66
82.71
61.63
444.81
150.69
111.46
190.00
896.96
336.86
76.76
413.62
483.34
1112.37
As at
March 31, 2011
61.44
854.05
915.49
21.88
771.82
1709.19
397.60
489.74
89.16
30.11
601.13
187.98
213.09
206.06
1208.27
440.46
65.23
505.69
702.58
1709.19
Statement of Assets and Liabilities - Consolidated Financials INR crore
BALANCE SHEET
34

Shareholders Funds stake in DRx Clinic Pte. Ltd., The DRx
This comprises the paid up share capital and Medispa Pte. Ltd., DRx Investment Pte. Ltd.
reserves & surplus. There has been an increase in and DRx Aesthetics Sdn. Bhd in Singapore.
the share capital on account of stock options
exercised by the employees under the ESOP 2. Further in February 2011, Marico Limited
Scheme. (Note 21) to the Financial Statements acquired 85% equity stake in International
provides further details of stock options issued, Consumer Products Corporation, Vietnam.
exercised and pending to be exercised.
Fixed Assets
Minority Interest Fixed assets represent investments made
Minority Interest represents the share of by the Company in tangible assets such as
Consolidated profits attributable to non-Marico Buildings, Plant & Machinery, Furniture & Fixtures
shareholders in Marico Bangladesh Limited and etc. Apart from normal yearly capital expenditure,
International Consumer Products Corporation: the increase is largely on account of trade marks
1. The Company’s Bangladesh subsidiary, and fixed assets of Derma Rx and ICP which
Marico Bangladesh Limited, had listed were acquired during the year.
10% of its equity share capital on the Dhaka
Stock Exchange in September 2009 by Investments
issuing fresh shares to public in that country; Investments comprise funds parked in short
term and long term instruments like Mutual Funds.
2. The Company acquired 85% stake A substantial part of the investments is parked
in International Consumer Products in short term instruments. There has not been
Corporation (ICP) in Vietnam and started any significant variation in the balances as on
consolidating it with effect from February March 2011 compared to March 2010.
18, 2011. The balance 15% shareholding
continues to be with one of the sellers. Deferred Tax Asset (DTA)
Deferred Tax Asset represents the timing
Loan Funds differences resulting due to variations in the
Loan funds include borrowings which are treatment of items as per Income Tax Act, 1961
payable after one year or more from the date and Indian GAAP.
of the balance sheet. These include a judicious
blend of borrowings in local and foreign currency. The amount of deferred tax asset has come
There has been an increase in the loan funds due down on account of two main reasons
to various acquisitions made by the Company • The Company had adjusted in the Books of
during the year primarily funded through debt. Account the value of Intangible Assets
against the Capital Redemption Reserve and
Goodwill on Consolidation Securities Premium Account under the Capital
Goodwill on consolidation represents the Restructuring Scheme in an earlier year and
consideration paid to acquire companies in excess hence created a DTA. As the Written Down
of their net assets. Value of those Intangible Assets as per
1. In May 2010, a wholly owned subsidiary of Taxation books is coming down the DTA is
Kaya Limited, Derma Rx International getting reversed.
Aesthetics Pte. Ltd. acquired 100% equity • The Company has made a DTA on the excise
higher primarily on account of the acquisitions explained in Note 14 of Schedule R of the
of Derma Rx, Ingwe and shares in ICP as well as Consolidated Financial Statements.
higher inventory owing to inflation in input costs.
Tax
Exceptional Items Taxes comprise Income Tax and Deferred
There were some items which are exceptional Tax. There has not been any significant change
in nature and hence detailed separately on the in the effective tax rate for the year FY11 compared
face of Profit and Loss account. These are to FY10.
Particulars
SOURCES OF FUNDS
Shareholders' Funds
Share Capital
Reserves and surplus
Minority Interest
Loan Funds
Total
APPLICATION OF FUNDS
Goodwill on Consolidation
Fixed Assets (Net)
Investments
Deferred Tax Asset (Net)
Current Assets, Loans and Advances
Inventories
Sundry Debtors
Cash and bank balances
Loans and Advances
Less: Current Liabilities and Provisions
Current Liabilities
Provisions
Net Current Assets
Total
As at
March 31, 2010
60.93
593.03
653.96
12.54
445.87
1112.37
85.03
399.66
82.71
61.63
444.81
150.69
111.46
190.00
896.96
336.86
76.76
413.62
483.34
1112.37
As at
March 31, 2011
61.44
854.05
915.49
21.88
771.82
1709.19
397.60
489.74
89.16
30.11
601.13
187.98
213.09
206.06
1208.27
440.46
65.23
505.69
702.58
1709.19
Statement of Assets and Liabilities - Consolidated Financials INR crore
BALANCE SHEET
35

Acquisition of the brand ‘Ingwe’ Corporate Governance Committee ('Committee') of
Marico, through its wholly owned subsidiary the Board of Directors is entrusted with the
Marico South Africa (Pty) Ltd (MSA), acquired responsibility of administering the Scheme and
the brand 'Ingwe' from the South Africa-based has granted 1,13,76,300 stock options (as
Guideline Trading Company in August 2010. at March 31, 2011) comprising about 1.85% of the
The product range comprises immuno boosters current paid-up equity capital of the Company.
focused on the ethnic consumer in South Africa. Additional information on ESOS as required
The acquisition of Ingwe brings in a range of by Securities and Exchange Board of India
products that complements that of MSA's (Employees Stock Option Scheme and Employees
brand, Hercules. Stock Purchase Scheme) Guidelines, 1999 is
annexed and forms part of the Directors’ report.
Marico's entry into Vietnam
Marico strengthened its foot hold in None of the Non-executive Directors
South-East Asia by taking up 85% equity in (including Independent Directors) have received
International Consumer Products Corporation stock options in pursuance of the above Scheme.
(ICP), one of the most successful Vietnamese Likewise, no employee has been granted stock
FMCG companies, in February 2011. ICP was options during the year equal to or exceeding
founded in 2001 by Dr. Phan Quoc Cong and 0.5% of the issued capital (excluding outstanding
his partner. Its brands (X-Men, L'Ovite, Thuan Phat warrants and conversions) at the time of grant.
and others) have a significant presence across
the personal care, beauty cosmetics and Our auditors, M/s. Price Waterhouse, have
sauces/condiments categories. X-Men is a leading certified that the Scheme has been implemented
player in the male grooming segment in Vietnam in accordance with the SEBI Guidelines and
and has been rated the 2nd Most Trusted Personal the resolution passed by the members at
Care brand in the country. With over 35% market the Extra-Ordinary General Meeting held on
share, it leads the men's shampoo category. November 24, 2006.
L'Ovite, the company's premium cosmetics brand,
ranks amongst the top 5 premium cosmetics OUTLOOK
brands in Vietnam. • Fundamentals in place to leverage India
growth story
Divestment of brand ‘Sweekar’ • New product pipeline being made robust –
Marico divested its refined sunflower oil scalability a key objective
brand 'Sweekar' to Cargill India Private Limited • Continued growth in international business,
(Cargill) in March 2011. This is in line with the near term MENA environment uncertain
Company's focus on the wellness platform through • Kaya India showing early signs of recovery
its healthy refined edible oils and functional foods
brand Saffola. Marico will continue to focus on its long term
strategic objectives, with a bias towards franchise
Marico Employee Stock Option Scheme expansion in its businesses. In coconut oils in
2007 and STAR India, we will aim to grow the market through
Marico has an Employee Stock Options low-unit size packs. We expect to achieve volume
Scheme (the Scheme) for grant of Employee growth of 6% to 8% per annum in the medium term.
Stock Options (ESOS) to certain employees. The In hair oils in India, Marico will focus on share gain
duty liability on coconut oil packs below 200 amounts payable by the Company for the purchase
ml. This provision has been reversed during of various input materials and services. Increase
FY11 and hence the corresponding DTA in current liabilities is in line with growth in the
created on this unpaid liability is also reversed. business. Further, impact of change in accounting
estimates relating to revenue recognition in Kaya
Inventory amounting to Rs. 31.32 crore also lead to increase
Inventory includes the stocks of raw material, in current liabilities. A part of the increase is also
packing material, work in process and finished attributed to consolidation of overseas acquisition
goods held for sale in ordinary course of business. made by the Company.
Inventory days have increased on account of cost
push in input material which was not completely Provisions
passed on to the consumers in order to focus on Provision include liabilities on account of
growing the long term consumer franchise of the items such as Income tax, Leave encashment,
company's brands. The Company has also built up Gratuity etc. It also includes amounts that are
stocks of finished goods to service the Q1FY12 acknowledged by the Company as Debts but not
sales plans. been transferred to the credit of that specific
vendor. Compared to March 31, 2010, there have
Sundry Debtors been two significant movements in the Provisions:
Sundry Debtors include the monies to be
received from its customers against sales made 1. Reduction due to reversal of excise duty
to them. The industry norm for debtors in provision relating to FY10 on pack size up to
international markets is higher as compared to 200 ml – Rs. 29.4 crore (Please refer to Note 27,
India. With an increase in the share of international Schedule R of the Consolidated Financials) and
business in the company's sales mix the debtors'
days has trended upwards. 2. Increase due to accounting of contingent
consideration in respect of Derma Rx acquisition –
Cash and Bank balance Rs. 43.8 Crore (Please refer to Note 18, Schedule
This include amounts lying in Cash and R of the Consolidated Financials).
with the Company's bankers. There is an increase
in the cash balances primarily due to increase OTHER DEVELOPMENTS
in retained cash earnings in Marico Bangladesh
Limited and Derma Rx. Acquisition of Derma Rx
In May 2010, Kaya Limited, Marico's wholly
Loans and Advances owned subsidiary delivering skin care solutions in
Loans and advances include the amounts India, acquired the skincare aesthetics business
paid by the Company recoverable in cash or in of the Singapore-based Derma Rx Asia Pacific Pte
kind. These include amounts such as security Ltd. (Drx AP). Derma Rx offers solutions to its
deposits, advances paid to suppliers in select customers through four clinics and medispas
cases etc. There has not been any material change located in Singapore and Kuala Lumpur (Malaysia).
in the position. This acquisition gives Kaya access to a range of
highly efficacious skin care products, some of
Current Liabilities which have been introduced in India and are in the
Current liabilities mainly comprise the process of being introduced in the Middle East.
36

Acquisition of the brand ‘Ingwe’ Corporate Governance Committee ('Committee') of
Marico, through its wholly owned subsidiary the Board of Directors is entrusted with the
Marico South Africa (Pty) Ltd (MSA), acquired responsibility of administering the Scheme and
the brand 'Ingwe' from the South Africa-based has granted 1,13,76,300 stock options (as
Guideline Trading Company in August 2010. at March 31, 2011) comprising about 1.85% of the
The product range comprises immuno boosters current paid-up equity capital of the Company.
focused on the ethnic consumer in South Africa. Additional information on ESOS as required
The acquisition of Ingwe brings in a range of by Securities and Exchange Board of India
products that complements that of MSA's (Employees Stock Option Scheme and Employees
brand, Hercules. Stock Purchase Scheme) Guidelines, 1999 is
annexed and forms part of the Directors’ report.
Marico's entry into Vietnam
Marico strengthened its foot hold in None of the Non-executive Directors
South-East Asia by taking up 85% equity in (including Independent Directors) have received
International Consumer Products Corporation stock options in pursuance of the above Scheme.
(ICP), one of the most successful Vietnamese Likewise, no employee has been granted stock
FMCG companies, in February 2011. ICP was options during the year equal to or exceeding
founded in 2001 by Dr. Phan Quoc Cong and 0.5% of the issued capital (excluding outstanding
his partner. Its brands (X-Men, L'Ovite, Thuan Phat warrants and conversions) at the time of grant.
and others) have a significant presence across
the personal care, beauty cosmetics and Our auditors, M/s. Price Waterhouse, have
sauces/condiments categories. X-Men is a leading certified that the Scheme has been implemented
player in the male grooming segment in Vietnam in accordance with the SEBI Guidelines and
and has been rated the 2nd Most Trusted Personal the resolution passed by the members at
Care brand in the country. With over 35% market the Extra-Ordinary General Meeting held on
share, it leads the men's shampoo category. November 24, 2006.
L'Ovite, the company's premium cosmetics brand,
ranks amongst the top 5 premium cosmetics OUTLOOK
brands in Vietnam. • Fundamentals in place to leverage India
growth story
Divestment of brand ‘Sweekar’ • New product pipeline being made robust –
Marico divested its refined sunflower oil scalability a key objective
brand 'Sweekar' to Cargill India Private Limited • Continued growth in international business,
(Cargill) in March 2011. This is in line with the near term MENA environment uncertain
Company's focus on the wellness platform through • Kaya India showing early signs of recovery
its healthy refined edible oils and functional foods
brand Saffola. Marico will continue to focus on its long term
strategic objectives, with a bias towards franchise
Marico Employee Stock Option Scheme expansion in its businesses. In coconut oils in
2007 and STAR India, we will aim to grow the market through
Marico has an Employee Stock Options low-unit size packs. We expect to achieve volume
Scheme (the Scheme) for grant of Employee growth of 6% to 8% per annum in the medium term.
Stock Options (ESOS) to certain employees. The In hair oils in India, Marico will focus on share gain
duty liability on coconut oil packs below 200 amounts payable by the Company for the purchase
ml. This provision has been reversed during of various input materials and services. Increase
FY11 and hence the corresponding DTA in current liabilities is in line with growth in the
created on this unpaid liability is also reversed. business. Further, impact of change in accounting
estimates relating to revenue recognition in Kaya
Inventory amounting to Rs. 31.32 crore also lead to increase
Inventory includes the stocks of raw material, in current liabilities. A part of the increase is also
packing material, work in process and finished attributed to consolidation of overseas acquisition
goods held for sale in ordinary course of business. made by the Company.
Inventory days have increased on account of cost
push in input material which was not completely Provisions
passed on to the consumers in order to focus on Provision include liabilities on account of
growing the long term consumer franchise of the items such as Income tax, Leave encashment,
company's brands. The Company has also built up Gratuity etc. It also includes amounts that are
stocks of finished goods to service the Q1FY12 acknowledged by the Company as Debts but not
sales plans. been transferred to the credit of that specific
vendor. Compared to March 31, 2010, there have
Sundry Debtors been two significant movements in the Provisions:
Sundry Debtors include the monies to be
received from its customers against sales made 1. Reduction due to reversal of excise duty
to them. The industry norm for debtors in provision relating to FY10 on pack size up to
international markets is higher as compared to 200 ml – Rs. 29.4 crore (Please refer to Note 27,
India. With an increase in the share of international Schedule R of the Consolidated Financials) and
business in the company's sales mix the debtors'
days has trended upwards. 2. Increase due to accounting of contingent
consideration in respect of Derma Rx acquisition –
Cash and Bank balance Rs. 43.8 Crore (Please refer to Note 18, Schedule
This include amounts lying in Cash and R of the Consolidated Financials).
with the Company's bankers. There is an increase
in the cash balances primarily due to increase OTHER DEVELOPMENTS
in retained cash earnings in Marico Bangladesh
Limited and Derma Rx. Acquisition of Derma Rx
In May 2010, Kaya Limited, Marico's wholly
Loans and Advances owned subsidiary delivering skin care solutions in
Loans and advances include the amounts India, acquired the skincare aesthetics business
paid by the Company recoverable in cash or in of the Singapore-based Derma Rx Asia Pacific Pte
kind. These include amounts such as security Ltd. (Drx AP). Derma Rx offers solutions to its
deposits, advances paid to suppliers in select customers through four clinics and medispas
cases etc. There has not been any material change located in Singapore and Kuala Lumpur (Malaysia).
in the position. This acquisition gives Kaya access to a range of
highly efficacious skin care products, some of
Current Liabilities which have been introduced in India and are in the
Current liabilities mainly comprise the process of being introduced in the Middle East.
37

through introduction of differentiated and innovative continue to invest in new clinic growth through
products, providing specificity to consumers, expansion in the Middle East. It has taken Kaya
accompanied by effective communication. longer to achieve profitability than what we had
Successful execution of this strategy is expected earlier anticipated. The long- term attractiveness
to result in annual volume growth of 15% to 17% of the business, however, remains intact.
over the next 2-3 years. The Company's efforts
in expanding rural reach is also expected to The medium to long-term outlook on all the
contribute towards franchise expansion in three businesses remains positive. Marico will thus
coconut oils and hair oils. Saffola is riding a trend focus on strengthening the building blocks for
in healthy living being adopted by the Indian future value creation - strong equities for its existing
consumer. The brand expects to continue to brands amongst its consumers, volume growths,
grow its basket of premium refined edible oil by robust new product pipelines and competitive
about 15% in volume each year. In addition Marico supply chain effectiveness.
plans to build a sizeable business in the healthy
foods space by leveraging Saffola's health equity. On Behalf of the Board of Directors
In the international consumer products
business, Marico will focus on growing the Harsh Mariwala
categories where it has significant market share - Chairman & Managing Director
coconut oil in Bangladesh and male hair grooming
in MENA and Vietnam. We will complement the Place: Mumbai
growth of Parachute Coconut Oil in Bangladesh Date: May 2, 2011
with the introduction of other products. In South
Africa, we will work on increasing share in key
categories, and over the medium term expand our
footprint to other parts of sub-Saharan Africa. In the
immediate term, our approach in MENA will be
cautious. However, our current penetration levels
indicate positive long term potential in this market.
Code 10 in Malaysia is expected to continue at
a very healthy growth rate, albeit on a small base.
In Vietnam, we will focus on the process of
integration. The business is expected to grow in
healthy double digits, though the bottom line may
be modest owing to the conscious strategy of
higher investments in advertising during the year.
The Kaya skin business in India is showing
early signs of recovery, having posted growth at
same clinic level in H2FY11. In the short term
therefore, we will work on improving its revenue
streams from the existing clinics in India and bring
the business back on the growth track. We will
38

C O N S O L I D A T E D F I N A N C I A L S
39
THE BOARD OF DIRECTORS OF MARICO LIMITED
1. We have audited the attached consolidated balance sheet of Marico Limited (The “Company”) and its subsidiaries, hereinafter
referred to as the “Group” (refer Note 2 of Schedule R to the attached consolidated financial statements) as at March 31,
2011, the related consolidated Profit and Loss account and the consolidated Cash Flow statement for the year ended on
that date annexed thereto, which we have signed under reference to this report. These consolidated financial statements are
the responsibility of the Company’s management. Our responsibility is to express an opinion on these financial statements
based on our audit.
2. We conducted our audit in accordance with the auditing standards generally accepted in India. Those Standards require that
we plan and perform the audit to obtain reasonable assurance about whether the financial statements are free of material
misstatement. An audit includes examining, on a test basis, evidence supporting the amounts and disclosures in the financial
statements. An audit also includes assessing the accounting principles used and significant estimates made by management,
as well as evaluating the overall financial statement presentation. We believe that our audit provides a reasonable basis for
our opinion.
3. We did not audit the financial statements of thirteen subsidiaries included in the consolidated financial statements, which
constitute total assets of Rs. 488.02 crores and net assets of Rs 337.07 crores as at March 31, 2011, total revenue of
Rs. 715.87 crores, net profit of Rs. 59.52 crores and net cash inflows amounting to Rs. 87.61 crores for the year then ended.
These financial statements and other financial information have been audited by other auditors whose reports have been
furnished to us and our opinion on the consolidated financial statements to the extent they have been derived from such
financial statements is based solely on the report of such other auditors.
4. We have relied on the unaudited financial statements of six subsidiary companies and a subsidiary firm included in
consolidated financial statements, which constitute total assets of Rs.136.40 crores and net assets of Rs. 81.99 crores
as at March 31, 2011, total revenues of Rs. 89.49 crores, net profit of Rs. 8.34 crores and net cash inflows amounting to
Rs. 5.47 crores for the year then ended. These unaudited financial statements as approved by the respective Board of
Directors of these companies and firm have been furnished to us by the Management and our report in so far as it relates
to the amounts included in respect of these subsidiaries is based solely on such approved unaudited financial statements.
5. We report that the consolidated financial statements have been prepared by the Company’s Management in accordance
with the requirements of Accounting Standard (AS) 21 - Consolidated Financial Statements, notified under sub-section 3C
of Section 211of the Companies Act, 1956.
6. Based on our audit and on consideration of reports of other auditors on separate financial statements and on the other
financial information of the components of the Group as referred to in para 3 and 4 above, and to the best of our information
and according to the explanations given to us, in our opinion, the attached consolidated financial statements give a true and
fair view in conformity with the accounting principles generally accepted in India:
(a) in the case of the consolidated Balance Sheet, of the state of affairs of the Group as at March 31, 2011;
(b) in the case of the consolidated Profit and Loss account, of the profit of the Group for the year ended on that date: and
(c) in the case of the consolidated Cash Flow statement, of the cash flows of the Group for the year ended on that date.
For Price WaterhouseChartered Accountants
Firm Registration Number: 301112E
Vilas Y. RaneDate : Mumbai PartnerPlace : May 2, 2011 Membership Number: F-33220
AUDITORS’ REPORT

C O N S O L I D A T E D F I N A N C I A L S
40
As at March 31,
SCHEDULE 2011 2010
Rs. Crore Rs. Crore
SOURCES OF FUNDS
SHAREHOLDERS’ FUNDS
Share Capital A 61.44 60.93
Reserves and surplus B 854.04 593.03
915.48 653.96
MINORITY INTEREST 21.88 12.53
LOAN FUNDS
Secured loans C 425.03 114.20
Unsecured loans D 346.80 331.68
771.83 445.88
1,709.19 1,112.37
APPLICATION OF FUNDS
GOODWILL ON CONSOLIDATION E 397.59 85.03
FIXED ASSETS F
Gross block 761.51 529.18
Less : Depreciation, amortisation and impairment 336.55 242.41
Net block 424.96 286.77
Capital work-in-progress 64.60 112.90
Asset held for disposal 0.18 0.01
489.74 399.68
INVESTMENTS G 88.98 82.71
DEFERRED TAX ASSET (NET) 30.11 61.63
(Refer Note 13 (a), Schedule R)
CURRENT ASSETS, LOANS AND ADVANCES
Inventories H 601.13 444.81
Sundry debtors I 187.97 150.69
Cash and bank balances J 213.09 111.46
Loans and Advances K 218.11 189.99
1,220.30 896.95
Less: CURRENT LIABILITIES AND PROVISIONS
Current Liabilities L 409.80 336.87
Provisions M 107.73 76.76
517.53 413.63
NET CURRENT ASSETS 702.77 483.32
1,709.19 1,112.37
Notes to accounts R
BALANCE SHEET
As per our attached report of even date
For Price Waterhouse For and on behalf of the Board of Directors
Chartered Accountants HARSH MARIWALA Chairman and Managing Director
Firm Registration No. 301112E NIKHIL KHATTAU Director and Chairman of Audit Committee
MILIND SARWATE Group Chief Financial Officer and
VILAS Y. RANE Chief Human Resource Officer
Partner HEMANGI WADKAR Company Secretary & Compliance Officer
Membership No. F-33220
Place : Mumbai Place : Mumbai
Date : May 2, 2011 Date : May 2, 2011

C O N S O L I D A T E D F I N A N C I A L S
41
For the year ended March 31,
SCHEDULE 2011 2010 Rs. Crore Rs. Crore INCOME : Sales 2,997.14 2,501.14 Less : Excise Duty 0.98 1.05 2,996.16 2,500.09 Income from services (Refer Note 16, Schedule R) 132.15 160.67 Total Sales and Services 3,128.31 2,660.76 Other income N 27.90 18.26 3,156.21 2,679.02 EXPENDITURE : Cost of materials O 1,667.11 1,302.07 Manufacturing and other expenses P 1,051.45 983.54 Finance charges Q 39.33 25.69 Depreciation, amortisation and impairment (Refer Note 14, Schedule R) F 70.80 60.06 2,828.69 2,371.36 PROFIT BEFORE TAXATION AND EXCEPTIONAL ITEMS 327.52 307.66 Exceptional Items - Income/(expense) (Net) (Refer Note 14 (a), Schedule R) 48.91 (9.79)PROFIT BEFORE TAXATION AND MINORITY INTEREST 376.43 297.87 Provision for taxation - Current Tax 96.92 63.83 - MAT Credit (entitlement) / utilisation (43.55) (2.55) - Fringe Benefit Tax – (0.01) - Deferred Tax - debit / (credit) 31.61 3.06 84.98 64.33 PROFIT AFTER TAXATION AND BEFORE MINORITY INTEREST 291.45 233.54 Minority interest in (profit) / loss of subsidiaries (5.01) (1.87)PROFIT AFTER TAXATION AND AFTER MINORITY INTEREST 286.44 231.67 Balance brought forward as on April 1 452.95 314.04 PROFIT AVAILABLE FOR APPROPRIATION 739.39 545.71 APPROPRIATIONS Interim dividend 40.54 40.21 Tax on interim dividend 6.65 6.83 Minority Share in accumulated profits (Refer Note 29, Schedule R) (0.49) 7.22 Debenture Redemption Reserve 16.67 15.00 General Reserve 31.53 23.50 BALANCE CARRIED TO THE BALANCE SHEET 644.49 452.95
EARNINGS PER SHARE (Face Value Re. 1)
BASIC 4.68 3.80 DILUTED 4.65 3.79 (Refer Note 20 of Schedule R) Notes to account R
PROFIT AND LOSS ACCOUNT
As per our attached report of even date
For Price Waterhouse For and on behalf of the Board of Directors
Chartered Accountants HARSH MARIWALA Chairman and Managing Director
Firm Registration No. 301112E NIKHIL KHATTAU Director and Chairman of Audit Committee
MILIND SARWATE Group Chief Financial Officer and
VILAS Y. RANE Chief Human Resource Officer
Partner HEMANGI WADKAR Company Secretary & Compliance Officer
Membership No. F-33220
Place : Mumbai Place : Mumbai
Date : May 2, 2011 Date : May 2, 2011

C O N S O L I D A T E D F I N A N C I A L S
42
For the year ended March 31,
2011 2010
Rs. Crore Rs. Crore
A CASH FLOW FROM OPERATING ACTIVITIES
PROFIT BEFORE TAXATION AND AFTER EXCEPTIONAL ITEMS 376.43 297.87
Adjustments for:
Depreciation, amortisation and impairment 70.80 60.06
Provision for impairment of assets of Kaya Life centres
(Refer Note 14 (f), Schedule R) – 2.91
Provision for impairment of assets of Kaya Clinincs
(Refer Note 14 (d), Schedule R) 7.74 –
Provision for impairment on assets written back as no longer
required / on discard of assets. (3.95) (1.20)
Provision for impairment of Goodwill and FIANCEE Trademark
(Refer Note 14 (c), Schedule R) 22.70 –
Profit on sale of Sweekar Brand (Refer Note 14 (b), Schedule R) (50.00) –
Impaired Capital advance assets written off 3.92 –
Provision for contingencies (Refer Note 27, Schedule R) – 29.35
Reversal of provision for contingencies (Refer Note 14 (a) and 27, Schedule R) (29.35) –
Finance charges 39.33 25.69
Interest income (16.21) (11.07)
Loss / (Profit) on sale of assets - (net) (0.01) 1.16
(Profit) / Loss on sale of investments (0.40) (0.02)
Dividend income (2.44) (2.49)
Employee stock compensation expense 0.06 0.08
(Write back) / Provision for doubtful debts, advances and deposits (0.05) (4.67)
42.14 99.80
Operating profit before working capital changes 418.57 397.67
Adjustments for:
(Increase) / Decrease in inventories (156.32) (105.77)
(Increase) / Decrease in sundry debtors (37.31) (34.15)
(Increase) / Decrease in loans and advances 14.28 (56.88)
Increase / (Decrease) in current liabilities and provisions 67.62 68.10
(111.73) (128.70)
Cash generated from Operations 306.85 268.97
Taxes paid (net of refunds) (78.31) (62.87)
NET CASH INFLOW FROM OPERATING ACTIVITIES 228.54 206.10
B CASH FLOW FROM INVESTING ACTIVITIES
Purchase of fixed assets (includes assets of newly acquired subsidiaries) (184.12) (156.35)
Sale of fixed assets 3.22 3.75
Proceed from divestment of Sweekar Brand 50.00 –
Effect of translation differences on fixed assets (1.01) 3.93
(Purchase) / Sale of investments (net) (5.86) (70.58)
Goodwill on consolidation* (277.59) –
Dividend income received 2.44 2.49
Interest received 17.43 9.39
NET CASH OUTFLOW FROM INVESTING ACTIVITIES (395.49) (207.37)
CASH FLOW STATEMENT

C O N S O L I D A T E D F I N A N C I A L S
43
For the year ended March 31,
2011 2010
Rs. Crore Rs. Crore
C CASH FLOW FROM FINANCING ACTIVITIES
Proceeds from issuance of Share Capital on exercise of stock option 28.59 1.83
Proceeds from issuance of equity shares by a subsidiary company – 19.99
Issue / (Redemption) of commercial papers (net) 58.90 (14.46)
Inter-Corporate deposits taken / (repaid) – (5.00)
Increase in Minority Interest 5.32 –
Issue of Debentures 50.00 30.00
Other borrowings (repaid) / taken (net) 219.22 70.13
Finance charges paid (38.84) (27.17)
Equity dividend paid (inclusive of dividend distribution tax) (47.06) (47.21)
Dividend paid to Minority shareholder (0.48) –
NET CASH INFLOW / (OUTFLOW) FROM FINANCING ACTIVITIES 275.65 28.11
D Effect of exchange difference on translation of
foreign currency cash and cash equivalents (9.03) (3.98)
E NET INCREASE IN CASH & CASH EQUIVALENTS (A+B+C+D) 99.67 22.86
F Cash and cash equivalents - opening balance (as at April 1) 111.19 88.33
G Cash and cash equivalents - closing balance (as at March 31) 210.86 111.19
Cash and cash equivalents at the year end comprise of :
Cash and Bank Balances 213.09 111.46
Book Overdraft (2.23) (0.27)
Total 210.86 111.19
* Represents excess of purchase price paid over the net assets value of a subsidiary acquired.
Notes
1 The above Cash Flow statement has been prepared under the indirect method as set out in Accounting Standard 3 (AS 3)
‘Cash Flow Statements’ as specified in Companies (Accounting Standards) Rules , 2006
2 Cash and Cash Equivalents - Closing balance includes balances aggregating to Rs.4.56 Crore (Rs.4.33 Crore) with
scheduled banks in fixed deposits and Margin accounts which is pledged against the bank guarantees and deposit with
sales tax authorities, which are not available for use by the Company.
3 The figures for the previous year have been regrouped where necessary to conform to current period’s classification.
CASH FLOW STATEMENT
As per our attached report of even date
For Price Waterhouse For and on behalf of the Board of Directors
Chartered Accountants HARSH MARIWALA Chairman and Managing Director
Firm Registration No. 301112E NIKHIL KHATTAU Director and Chairman of Audit Committee
MILIND SARWATE Group Chief Financial Officer and
VILAS Y. RANE Chief Human Resource Officer
Partner HEMANGI WADKAR Company Secretary & Compliance Officer
Membership No. F-33220
Place : Mumbai Place : Mumbai
Date : May 2, 2011 Date : May 2, 2011

C O N S O L I D A T E D F I N A N C I A L S
44
As at March 31,
2011 2010 Rs. Crore Rs. Crore SCHEDULE ‘A’ SHARE CAPITAL AUTHORISED 650,000,000 (650,000,000) Equity shares of Re. 1 each (Re. 1 each) 65.00 65.00 150,000,000 (150,000,000) Preference shares of Rs. 10 each (Rs.10 each) 150.00 150.00 215.00 215.00 ISSUED AND SUBSCRIBED 614,399,550 (609,325,700) Equity shares of Re. 1 each (Re. 1 each) fully paid up 61.44 60.93 (Refer Note 21 (a), Schedule R) 61.44 60.93
SCHEDULE ‘B’ RESERVES AND SURPLUS
SECURITIES PREMIUM ACCOUNT As on April 1 31.29 13.50 Add : Receipt on exercise of Employees stock options (Refer Note 21 (a), Schedule R) 28.08 1.79 Add : Transfer from Employee Stock option reserve 0.12 0.01
Add : Receipt on fresh issue of shares by a subsidiary company – 15.99 As at the year end 59.49 31.29
GENERAL RESERVE As on April 1 91.66 68.16 Add : Transfer from Profit and Loss account 31.53 23.50 As at the year end 123.19 91.66
EMPLOYEE STOCK OPTION RESERVE (Refer Note 21 (a), Schedule R) As on April 1 0.15 0.07 Add : Additions 0.08 0.24 0.23 0.31 Less : Transferred to Securities Premium account 0.12 0.01 Less : Forfeited / Lapsed 0.04 0.15 As at the year end 0.07 0.15
DEBENTURE REDEMPTION RESERVE
As on April 1 15.00 – Add : Transfer from Profit and Loss account 16.67 15.00 As at the year end 31.67 15.00
FOREIGN CURRENCY TRANSLATION RESERVE (Translation adjustments) As on April 1 (0.83) 3.15 Adjustments during the year (net) (9.03) (3.98)As at the year end (9.86) (0.83)
HEDGE RESERVE ACCOUNT (Refer Note 19 (c), Schedule R) As on April 1 2.81 (6.26)Adjustments during the year 2.18 9.07 As at the year end 4.99 2.81
PROFIT AND LOSS ACCOUNT 644.49 452.95 854.04 593.03
SCHEDULES TO BALANCE SHEET

C O N S O L I D A T E D F I N A N C I A L S
45
As at March 31,
2011 2010 Rs. Crore Rs. CroreSCHEDULE ‘C’ SECURED LOANS Term Loan from banks 74.25 –Secured by (i) fixed charge over all the fixed property and assets of one of the subsidiaries, namely, Derma – Rx International Asthetics Pte. Ltd. (DIAL) including all machinery and equipment of its subsidiaries; (ii) shares held by DIAL in each of its subsidiaries; (iii) shares held by Kaya Limited in DIAL and (iv) Corporate guarantee of Marico Limited (Amount repayable within one year Rs. Nil) Secured Redeemable Non-Convertible Debentures (NCD) 30.00 30.00(Refer Note 26 (a), Schedule R) (Secured against first pari passu charge over land and building situated at Andheri (East), Mumbai) External commercial borrowings from banks a) Secured by hypothecation of plant and machinery 39.01 61.76 (Amount repayable within one year Rs. 22.29 Crore (Rs 22.46 Crore) b) Secured by (i) Pledge of shares of International Consumer Products 240.76 –Corporation (a Subsidiary company) ; (ii) First ranking pari passu charge over all current and future plant and machinery and (iii) Mortgage on the land and building currently provided as security to NCD holders, post the repayment of the NCD immediately and, in any event, within 90 days from such repayment. The documentation for creation of charge is under progress. (Amount repayable within one year Rs. Nil) 279.77 61.76 Working capital finance from banks 41.01 22.44 (Secured by hypothecation of stocks in trade and debtors) 425.03 114.20
SCHEDULE ‘D’ UNSECURED LOANS From banks: Short term 185.20 288.37 Other loans 18.61 9.22 Commercial Papers (Redeemable within a year): Face Value 95.00 35.00 Less : Deferred interest 2.01 0.91 92.99 34.09 (Maximum amount outstanding during the year Rs.146.00 Crore (Rs.104.51 Crore)) Redeemable Non-convertible Debentures (Refer Note 26 (b), Schedule R) 50.00 – 346.80 331.68
SCHEDULE ‘E’ GOODWILL ON CONSOLIDATION Goodwill on consolidation (Refer Note 17 and 18, Schedule R) 406.41 85.03 Less : Provision for impairment (Refer Note 14 (c), Schedule R) 8.82 – 397.59 85.03
SCHEDULES TO BALANCE SHEET

C O N S O L I D A T E D F I N A N C I A L S
46
SCHEDULES TO BALANCE SHEETS
CH
ED
ULE
‘F’
FIX
ED
AS
SE
TS
Rs.
Cro
re
Not
es:
1.
Gro
ss b
lock
incl
udes
: - B
uild
ings
Rs.
0.10
Cro
re (R
s. 0
.10
Cro
re) w
here
con
veya
nce
has
been
exe
cute
d, p
endi
ng re
gist
ratio
n
- Pla
nt a
nd M
achi
nery
of R
s. N
il (R
s. 3
.95
Cro
re) b
eing
ass
ets
give
n on
fina
nce
leas
e pr
ior t
o A
pril
1, 2
001.
2.
“Dep
reci
atio
n, a
mor
tisat
ion
and
prov
isio
n fo
r im
pairm
ent”
for t
he y
ear:
a)
in
clud
es im
pairm
ent p
rovi
sion
in re
spec
t of c
apita
lised
ass
e ts
Rs.
0.02
Cro
re (R
s. 7
.54
Cro
re) a
nd C
apita
l wor
k in
pro
gres
s R
s.N
il. (R
s. 2
.89
Cro
re).
b)
in
clud
es im
pairm
ent l
oss
writ
ten
off d
urin
g th
e ye
ar R
s. N
il ( 5
.13
Cro
re).
3.
Pro
visi
on fo
r im
pairm
ent a
s at
Mar
ch 3
1, 2
011:
a)
incl
udes
impa
irmen
t as
men
tione
d in
2(a
) ab
ove
and
is n
et o
f rev
ersa
l of p
rovi
sion
no
long
er re
quire
d R
s. N
il (R
s. 1
.20
Cro
re)
and
adju
stm
ent o
n sa
le /
disc
ard
of th
e re
late
d as
sets
R
s. 4
.39
Cro
re (R
s. 0
.13
Cro
re).
b)
in
clud
es p
rovi
sion
for
impa
irmen
t of a
sset
s of
Rs.
21.6
2 C
rore
(2.
91 C
rore
), w
hich
is in
clud
ed u
nder
‘Exc
eptio
nal i
tem
s’ in
the
Pro
fit a
nd L
oss
acco
unt.(
Ref
er N
ote
14 (
c) ,(
d) a
nd (
f) re
spec
tivel
y, S
ched
ule
R)
4.
Dep
reci
atio
n fo
r the
yea
r inc
lude
s ac
cele
rate
d de
prec
iatio
n ch
arge
d R
s. 3
.09
Cro
re (R
s. 1
.56
Cro
re) d
ue to
revi
sion
of e
stim
ated
use
ful l
ife o
f cer
tain
ass
ets
5.
Acq
uisi
tions
in G
ross
blo
ck a
n d D
epre
ciat
ion
/ am
ortis
atio
n re
pres
ents
orig
inal
cos
ts a
nd a
ccum
ulat
ed d
epre
ciat
ion,
resp
ectiv
ely
for a
sset
s of
sub
sidi
arie
s ac
quire
d du
ring
the
year
.6.
T r
adem
arks
of R
s. 7
1.68
Cro
re (R
s. 4
7.42
Cro
re) a
re p
endi
ng re
gist
ratio
n.7.
D
educ
tions
/ ad
just
men
t of G
r oss
blo
ck ,d
epre
ciat
ion
and
Pro
visi
on fo
r Im
pairm
ent i
nclu
des
trans
latio
n di
ffere
nce
of R
s. 1
.01
Cro
re (R
s. 3
.93
Cro
re).
* re
pres
ents
pre
viou
s ye
ar fi
gure
s
PAR
TIC
ULA
RS
GR
OS
S B
LOC
KD
EP
RE
CIA
TIO
N /
AM
OR
TIS
ATI
ON
NE
T B
LOC
KA
s at
A
pril
1,
201
0
Acq
uisi
-tio
n (R
efer
no
te 5
be
low
)
Add
ition
sD
educ
tions
/ ad
just
-m
ents
(R
efer
not
e 7
belo
w)
As
at
Mar
ch
31, 2
011
As
at
Apr
il
1, 2
010
Acq
uisi
-tio
n (R
efer
no
te 5
be
low
)
For
the
Year
(R
efer
not
e 2,
3 a
nd 4
be
low
)
Ded
uctio
ns/
adju
st-
men
ts
(Ref
er n
ote
7 be
low
)
As
at
Mar
ch
31, 2
011
Pro
visi
on fo
r
impa
irmen
t as
at
Mar
ch 3
1,
2011
(S
ee n
ote
2 an
d 3
belo
w)
As
at
Mar
ch
31, 2
011
As
at
Mar
ch
31, 2
010
Tang
ible
Ass
ets
Free
hold
land
5.3
5 –
0.0
1 0
.01
5.3
5 –
–
–
–
–
–
5
.35
5.3
5 Le
aseh
old
land
14.
26
4.8
6 8
.25
0.2
4 2
7.13
0
.60
0.1
3 0
.31
(0.0
1) 1
.05
–
26.
08
13.
66
Bui
ldin
gs (N
ote
1) 8
6.53
8
.18
55.
07
2.9
7 1
46.8
1 1
8.27
5
.37
5.8
7 1
.73
27.
78
–
119
.03
68.
26
Pla
nt a
nd m
achi
nery
(Not
e 1)
301
.31
16.
44
84.
63
16.
31
386
.07
168
.48
9.4
0 4
4.22
9
.78
212
.32
14.
24
159
.51
121
.53
Furn
iture
and
fitti
ngs
37.
87
2.0
1 1
0.26
3
.23
46.
91
14.
73
1.4
6 5
.70
1.0
6 2
0.83
2
.11
23.
97
22.
28
Vehi
cles
4.1
3 –
0
.97
(0.3
7) 5
.47
1.6
2 0
.52
0.9
7 0
.38
2.7
3 –
2
.74
2.5
1 In
tang
ible
Ass
ets
- Tr
adem
arks
and
cop
yrig
hts
(Not
e 6
belo
w)
60.
72
0.1
6 5
6.82
(3
.88)
121
.58
7.9
1 –
11.
95
(0.0
1) 1
9.87
1
6.20
8
5.51
5
0.57
-
Oth
er in
tang
ible
s 1
.50
0.0
4 –
0
.02
1.5
2 0
.76
0.0
5 0
.30
0.0
2 1
.09
–
0.4
3 0
.74
- C
ompu
ter s
oftw
are
17.
51
2.3
2 1
.26
0.4
2 2
0.67
1
5.63
1
.35
1.4
6 0
.11
18.
33
–
2.3
4 1
.87
TOTA
L 5
29.1
8 3
4.01
2
17.2
7 1
8.95
7
61.5
1 2
28.0
0 1
8.28
7
0.78
1
3.06
3
04.0
0 3
2.55
4
24.9
6 2
86.7
7 A
s on
Mar
ch 3
1, 2
010
456
.88
–
101
.06
28.
76
529
.18
194
.45
–
49.
63
16.
08
228
.00
14.
41
286
.76
–
Cap
ital w
ork-
in-p
rogr
ess
(at c
ost)
incl
udin
g ad
vanc
es o
n ca
pita
l acc
ount
6
6.47
–
1
.86
64.
60
*
(115
.79)
*(2
.89)
*(1
12.9
0)
Ass
et h
eld
for d
ispo
sal
0.1
8 –
–
0
.18
0.0
1
*(0
.01)
34.
41
489
.74
399
.68

C O N S O L I D A T E D F I N A N C I A L S
47
As at March 31,
2011 2010 Rs. Crore Rs. Crore
SCHEDULE ‘G’
INVESTMENTS (Non Trade)
LONG TERM
- UNQUOTED, AT COST
Government Securities :
National Savings Certificates (Deposited with Government authorities) 0.01 0.01
0.01 0.01
- QUOTED, AT COST
Indian Infrastructure Finance Company Limited 10.21 10.21
1,000 (1000) Unsecured, 6.85% Non-convertible, tax-free Bonds of face value of
Rs. 100,000 each , guaranteed by Government of India, redeemable on
22nd January 2014.
Grameenphone Ltd. 0.82 0.82
170,229 (170,229) equity shares of Bangladesh Taka 10 each fully paid
11.03 11.03
CURRENT INVESTMENTS - UNQUOTED, LOWER OF COST AND FAIR VALUE Birla Sun Life Cash Manager - Institutional Plan - Growth 10.00 – 6,087,057 (Nil) Units of Rs. 10 each fully paid Fidelity Ultra Short Term Debt Fund Institutional Plan - Growth – 10.00 NIL (8,399,009) Units of Rs. 10 each fully paid Templeton India Ultra Short Bond Fund Super Institutional Plan - Growth 7.50 – 5,921,645 (Nil) Units of Rs. 10 each fully paid Templeton India Ultra Short Bond Fund Super Institutional Plan - Growth 2.50 – 1,987,297 (Nil) Units of Rs. 10 each fully paid Birla Sun Life Dynamic Bond Fund Retail - Monthly Payout – 2.02 NIL (1,940,982) Units of Rs. 10 each fully paid Birla Sunlife Saving Fund Institutional Plan - Growth – 3.50 NIL (2,002,208) Units of Rs. 10 each fully paid Kotak Flexi Debt Scheme Institutional Plan - Growth – 10.05 NIL (8,878,078) Units of Rs. 10 each fully paid ICICI Prudential Flexible Income Premium Institutional Plan -Growth – 9.85 NIL (575,207) Units of Rs. 100 each fully paid LIC MF Savings Plus Fund Institutional Plan - Growth – 10.28 NIL (7,029,097) Units of Rs. 10 each fully paid Templeton India STIR Plan - Weekly Dividend Reinvestment – 3.14 NIL (29,243) Units of Rs. 1000 each fully paid Tata Treasury Manager Institutional Plan - Growth – 10.09 NIL (96,376) Units of Rs. 1000 each fully paid Reliance Money Manager Retail - Daily Dividend Reinvestment – 0.10 NIL (826) Units of Rs. 1000 each fully paid IDFC Money Manager Fund - TP - Institutional Plan C - Growth 10.00 2.60 8,583,470 (2,380,321) Units of Rs. 10 each fully paid UTI Floating Rate Fund - Short Term Plan - Institutional Plan - Growth – 10.04 NIL (97,076) Units of Rs. 1000 each fully paid UTI Treasury Advantage Fund - Growth 10.00 – 75,743 (Nil) Units of Rs. 10 each fully paid BPBIGICICI Prudential Btended Plan B 10.16 – Institutional Growth option II 9,659,482 (Nil) Units of Rs. 10 each fully paidDWS Money plus Fund - Institutional Plan - Growth 10.16 – 9,865,755 (Nil) Units of Rs. 10 each fully paid HDFC Floating Rate Income Fund - Short Term Plan - Wholesale option - Growth 9.50 – 5,678,049 (Nil) Units of Rs. 10 each fully paid JPMorgan India Short Term Income Fund - Growth 8.12 – 7,612,090 (Nil) Units of Rs. 10 each fully paid 77.94 71.67 88.98 82.71
SCHEDULES TO BALANCE SHEET

C O N S O L I D A T E D F I N A N C I A L S
48
SCHEDULES TO BALANCE SHEET As at March 31,
2011 2010 Rs. Crore Rs. Crore
Notes:
1) Cost / Market Value of Quoted/ Unquoted Investments Aggregate value of Quoted Investments: Cost 11.03 11.03 Market Value 10.00 13.90
Aggregate value of Unquoted Investments: Cost 77.95 71.68
2) Units of Mutual Funds purchased and sold during the year
Name of the Scheme Face No. of Units Purchase Cost Value Rs. Crore
ICICI Prudential Flexible Income Premium - Institutional Plan - Daily Dividend Reinvestment 100 4,112,281 43.48
Prudential ICICI Liquid Plan Super Institutional Plan - Daily Dividend Reinvestment 100 3,204,562 32.05
ICICI Prudential Flexible Income Premium - Institutional Plan -Growth 100 1,183,510 20.35
Prudential ICICI Liquid Plan Super Institutional Plan - Growth 100 1,909,741 26.14
BPBID ICICI Prudential - Blended Plan B - Institutional - Dividend 10 4,853,323 5.03
BPBIG ICICI Prudential Blended Plan B - Institutional Growth Option II 10 9,659,482 10.16
Fortis Money Plus - Institutional Plan - Daily Dividend Reinvestment 10 10,014,509 10.02
Fortis Overnight Fund - Institutional Plan - Daily Dividend Reinvestment 10 1,999,577 2.00
BNP Paribas Overnight Fund - Institutional Plan - Daily Dividend Reinvestment 10 13,128,445 13.13
Tata Floater Fund - Daily Dividend Reinvestment 10 22,849,287 22.93
Tata Treasury Manager Super High Investment Plan - Growth 1,000 96,376 10.09
Tata Treasury Manager Super High Investment Plan-Daily Dividend Reinvestment 1,000 58,346 6.50
Tata Floater Fund - Growth 10 11,730,072 16.50
TATA Liquid Fund - Super Institutional Plan - Growth 1,000 121,165 21.00
Kotak Flexi Debt Scheme - Institutional Plan - Daily Dividend Reinvestment 10 14,109,459 20.79
Kotak Flexi Debt Scheme - Institutional Plan - Growth 10 8,878,078 10.05
Kotak Liquid Fund - Institutional Plan - Growth 10 5,392,244 10.12
Kotak Liquid Fund - Institutional Plan - Daily Dividend Reinvestment 10 27,388,595 39.45
Kotak Floater - Short term - Daily Dividend 10 4,969,342 5.03
Kotak Floater - Long term - Daily Dividend 10 8,002,417 8.07
LIC Saving Plus Fund - Institutional Plan - Daily Dividend Reinvestment 10 18,297,307 18.30
LIC MF Liquid Fund - Daily Dividend Reinvestment 10 10,019,800 11.00
LIC Saving Plus Fund - Institutional Plan - Growth 10 7,029,097 10.28
LIC Floating Rate Fund - Institutional Plan - Growth 10 6,800,931 10.30
LIC MF Liquid Fund - Growth 10 6,106,415 10.35
LIC MF Income plus Fund - Daily Dividend Reinvestment 10 6,754,301 6.75
DWS Ultra Short Term Fund - Institutional Daily Dividend Reinvestment 10 10,030,384 10.05
DWS Insta Cash Plus Fund - Super Institutional Plan - Growth 100 8,290,155 10.00
DWS Insta Cash Plus Fund - Institutional Plan - Daily Dividend Reinvestment 100 7,023,486 7.05
DWS Treasury Fund - Cash - Institutional Plan - Daily Dividend Reinvestment 10 10,103,620 10.15
DWS Money plus Fund - Institutional Plan Growth 10 9,865,755 10.15

C O N S O L I D A T E D F I N A N C I A L S
49
HDFC Cash Management Fund - Treasury Advantage Plan - Wholesale - Daily Dividend Reinvestment 10 16,996,629 17.05
HDFC Liquid Fund Premium Plan - Daily Dividend Reinvestment 10 10,604,873 13.00
HDFC Floating Rate Income Fund- Short term Fund- Wholesale Plan- Growth 10 10,086,119 10.17
HDFC Floating Rate Income Fund - Short Term Plan - Wholesale option - Growth 10 5,678,049 9.50
JP Morgan India Treasury Fund - Super Institutional Plan- Daily Dividend Reinvestment 10 12,027,801 12.04
JP Morgan India Liquid Fund- Super Institutional Plan-Daily Dividend Reinvestment 10 4,497,034 4.50
JP Morgan India Treasury Fund- Super Institutional Plan-Growth 10 5,285,735 6.50
JP Morgan India Liquid Fund- Super Institutional Plan-Growth 10 4,098,730 5.00
JP Morgan India Short Term Income Fund - Weekly Dividend 10 10,104,722 10.13
JP Morgan India Short Term Income Fund - Growth 10 7,612,090 8.12
IDFC Money Manager Fund - Treasury Plan - Super Institutional Plan C - Daily Dividend Reinvestment 10 5,612,381 5.61
IDFC Money Manager Fund - Treasury Plan - Super Institutional Plan C - Growth 10 10,963,791 12.60
IDFC Money Manager - Treasury Plan - Plan C - Daily Dividend 10 10,171,080 10.17
Reliance Money Manager - Institutional Plan - Daily Dividend Reinvestment 1,000 65,068 6.52
Reliance Money Manager - Retail - Growth 1,000 826 0.10
Reliance Medium Term Fund - Retail Plan - Growth Plan 10 1,830,688 3.50
Reliance Medium Term Fund - Daily Dividend Reinvestment 10 17,273,151 29.53
Reliance Money Manager - Institutional Plan - Growth Option 1,000 68,485 8.60
Reliance Liquid Fund - Institutional Plan - Daily Dividend Reinvestment 10 981,301 1.50
Reliance Monthly Interval Fund - Series II - Institutional Dividend plan 10 10,040,662 10.04
Reliance Liquidity Fund - Daily Dividend Reinvestment 10 3,498,599 3.50
Reliance Liquid Fund - Cash Plan - Daily Dividend Reinvestment 10 9,678,426 10.78
Fidelity Ultra Short Term Debt Fund - Institutional Plan - Growth 10 8,399,010 10.00
Templeton India Short Term Income Retail Plan - Weekly Dividend Reinvestment 1,000 29,702 3.21
Templeton India Treasury Management Account Super institutional Plan - Daily Dividend Reinvestment 1,000 109,939 11.00
Templeton India Ultra Short Bond Fund Super Institutional Plan Daily Dividend Reinvestment 10 30,186,837 30.22
Templeton India Treasury Management Account - Super Institutional Plan - Daily Dividend Reinvestment 1,000 59,967 6.00
Templeton India Ultra Short Bond Fund Super Institutional Plan - Growth 10 5,921,645 7.50
Templeton India Ultra Short Bond Fund Institutional Plan - Growth 10 1,987,297 2.50
Birla Sunlife Saving Fund - Institutional Plan - Daily Dividend Reinvestment 10 30,471,103 30.49
Birla Sunlife Saving Fund - Institutional Plan - Growth 10 2,002,208 3.50
Birla Sunlife Cash Plus - Institutional Plan -Daily Dividend Reinvestment 10 4,990,873 5.00
Birla Sun Life Cash Manager - Institutional Plan - Growth 10 13,390,621 21.50
Birla Sun Life Cash Manager - Institutional Plan - Daily Dividend Reinvestment 10 2,753,354 2.75
Birla Sun Life Dynamic Bond Fund - Retail Plan - Monthly Dividend 10 1,940,982 2.02
UTI Floating Rate Fund - Short Term Plan - Institutional Plan - Growth 1,000 97,076 10.04
UTI Liquid Cash Plan Institutional - Growth Option 1,000 7,976 1.25
UTI Liquid Cash Plan Institutional - Daily Income Option - Reinvestment 1,000 93,457 9.53
UTI Floating Rate Fund - Short term plan - Daily Dividend 1,000 96,466 9.65
UTI Treasury Advantage Fund - Growth 1,000 75,743 10.00
Name of the Scheme Face No. of Units Purchase Cost Value Rs. Crore

C O N S O L I D A T E D F I N A N C I A L S
50
As at March 31,
2011 2010 Rs. Crore Rs. Crore
SCHEDULES TO BALANCE SHEET
SCHEDULE ‘H’ INVENTORIES (Refer Note 3 (i), Schedule R, for basis of valuation)Raw materials 210.39 188.19 Packing materials 73.57 54.45 Work-in-process 93.05 62.56 Finished products 197.83 118.96 Stores, spares and consumables 14.87 13.45 By-products 1.91 1.15 Goods in Transit - Raw materials 9.40 5.75 - Finished products 0.11 0.30 9.51 6.05 601.13 444.81
SCHEDULE ‘I’ SUNDRY DEBTORS Unsecured Over six months - Considered good 2.95 0.01 - Considered doubtful 2.99 3.81 5.94 3.82 Less: Provision for doubtful debts 2.99 3.81 2.95 0.01
Other Debts - Considered good 185.02 150.68 - Considered doubtful 0.99 0.16 186.01 150.84 Less: Provision for doubtful debts 0.99 0.16 185.02 150.68 187.97 150.69 SCHEDULE ‘J’ CASH AND BANK BALANCES Cash on hand 2.55 1.53 Remittances in transit 5.12 0.36 Balances with scheduled banks: Fixed deposits 141.91 86.43 (Rs.0.28 Crore (Rs. 0.24 Crore) deposited with sales tax authorities and against bank gurantees, Rs.0.18 Crore (Rs. Nil) is pledged with bank as collateral for banking facilities) Margin accounts (against bank guarantees) 4.09 4.09 Current accounts * 58.87 18.90 Balances with non-scheduled banks: Current accounts 0.55 0.15 213.09 111.46
* Includes balances in Unclaimed dividend account and Unclaimed Preference Share Capital Rs. 0.26 Crore (Rs. 0.26 Crore)

C O N S O L I D A T E D F I N A N C I A L S
51
SCHEDULE ‘K’ LOANS AND ADVANCES (Unsecured - considered good, unless otherwise stated) Advances recoverable in cash or in kind or for value to be received - considered good 81.33 81.56 - considered doubtful – 0.06 81.33 81.62 Less: Provision for doubtful advances – 0.06 81.33 81.56 Deposits - Considered good 37.46 31.54 - Considered doubtful 1.00 1.00 38.46 32.54 Less: Provision for doubtful deposits 1.00 1.00 37.46 31.54 Intercorporate Deposits – 18.49 Balances with central excise authorities 0.47 1.06 Interest accrued on loans / deposits 2.80 4.02 Gratuity – 0.82 Fringe benefit tax payments, net of provisions 0.55 0.55 MAT Credit Entitlement 95.50 51.95 218.11 189.99
SCHEDULE ‘L’ CURRENT LIABILITIES Sundry creditors - Due to Micro and Small Enterprises 1.53 – - Others 306.46 309.58 Other liabilities 47.84 19.21 Advances received from customers 47.82 4.08 Book Overdraft 2.23 0.27 Security deposits 0.25 1.10 Interest accrued but not due on loans 3.41 2.37 Unclaimed Dividend 0.23 0.23 Unclaimed Redeemed 8% Preference Share Capital 0.03 0.03 409.80 336.87
SCHEDULE ‘M’ PROVISIONS Income tax (net of payments) 22.72 4.01 Leave encashment 8.36 8.26 Gratuity 5.47 2.68 Long term service benefits – 1.88 Contingencies (Refer Note 27, Schedule R) – 29.35 Others (Refer Note 28, Schedule R) 45.40 4.92 Interim dividend 22.11 21.93 Tax on interim dividend 3.67 3.73 107.73 76.76
SCHEDULES TO BALANCE SHEET As at March 31,
2011 2010 Rs. Crore Rs. Crore

C O N S O L I D A T E D F I N A N C I A L S
52
SCHEDULE ‘N’
OTHER INCOME
Income from current investments
Profits on sale of units of mutual funds 0.40 0.02
Dividend on investment in liquid mutual funds 2.45 2.49
Interest income on loans, deposits, etc. 16.21 11.07
(Tax deducted at source Rs. 1.62 Crore (Rs.0.64 Crore))
Miscellaneous income 8.84 4.68
(Refer Note 8, Schedule R)
27.90 18.26
SCHEDULE ‘O’
COST OF MATERIALS
Raw materials consumed 1,440.74 1,049.42
Packing materials consumed 270.54 216.06
Stores and spares consumed 49.19 40.47
Purchase for resale 16.57 12.47
(Increase)/Decrease in stocks
Opening stocks
- Work-in-process 62.56 51.18
- By-products 1.15 1.42
- Finished products 119.26 114.02
Less :
Closing stocks
- Work-in-process 93.05 62.56
- By-products 1.91 1.15
- Finished products 197.94 119.26
(109.93) (16.35)
1,667.11 1,302.07
SCHEDULES TO BALANCE SHEET
For the year ended March 31,
2011 2010 Rs. Crore Rs. Crore

C O N S O L I D A T E D F I N A N C I A L S
53
SCHEDULE ‘P’
MANUFACTURING AND OTHER EXPENSES
Employees’ costs :
- Salaries, wages and bonus 202.38 171.68
- Contribution to provident fund and other funds 10.01 6.53
- Long term service benefits 3.04 1.88
- Employee stock compensation expense 0.06 0.08
- Welfare expenses 14.88 13.05
230.37 193.22
Power, fuel and water 13.89 10.68
Contract manufacturing charges 104.33 86.25
Rent and storage charges 59.92 50.42
Repairs :
- Buildings 9.21 7.99
- Machinery 10.96 8.69
- Others 3.81 2.74
Freight, forwarding and distribution expenses 131.50 102.79
Advertisement and sales promotion 345.98 351.12
Rates and taxes 2.68 2.26
Provision for contingencies - Excise Duty – 29.35
(Refer Note 27, Schedule R)
Sales tax and cess 11.59 19.15
Commission to selling agents 5.82 5.12
Bad debts 0.11 8.43
Less : Provision for doubtful debts utilised – (6.63)
0.11 1.80
Provision for doubtful debts, advances and deposits 0.02 1.96
Printing, stationery and communication expenses 12.41 11.15
Travelling, conveyance and vehicle expenses 31.64 30.64
Royalty 0.29 0.42
Insurance 2.55 2.61
Auditors’ remuneration
- Audit fees 1.73 0.87
- Tax Audit fees 0.10 0.10
- Other services 0.97 0.60
- Out of pocket expenses 0.01 0.01
Exchange losses (net) 2.18 3.55
Miscellaneous expenses 69.38 60.05
(Refer Note 9, Schedule R)
1,051.45 983.54
SCHEDULE ‘Q’
FINANCE CHARGES
Interest on
- Fixed period loans 14.73 10.50
- Other loans 4.10 4.60
- Debentures 2.50 2.23
Bank and other financial charges 18.00 8.36
39.33 25.69
SCHEDULES TO PROFIT AND LOSS ACCOUNT For the year ended March 31,
2011 2010 Rs. Crore Rs. Crore

C O N S O L I D A T E D F I N A N C I A L S
54
NOTES TO ACCOUNTS TO THE CONSOLIDATED BALANCE SHEET AND PROFIT AND LOSS ACCOUNTSCHEDULE ‘R’
1) The Group and Nature of its operations:
Marico Limited (herein after referred to as ‘the Company’), headquartered in Mumbai, India, together with its subsidiaries is
referred as ‘Marico’ or ‘Group’. Marico carries on business in Branded Fast Moving Consumer Goods and Branded services.
In India, Marico manufactures and markets products under the brands Parachute, Nihar, Saffola, Hair & Care, Revive, Shanti,
Oil of Malabar, Mediker, Manjal. Marico’s international portfolio includes brands like Fiancée, HairCode, Camelia, Aromatic,
Caivil, Hercules, Black Chic, Ingwe, Code 10, X-men, L’Ovite and Thuan Phat. It is present in Skin Care solutions business
under the brand name Kaya in India and international markets and the brand name Derma Rx in Singapore and Malaysia.
2) Subsidiaries considered in Consolidated Financial Statements:
(i) List of subsidiary companies
Name of the Company Country of incorporation
Percentage of ownership interest
Kaya Limited India 100 (100)
Marico Bangladesh Limited (MBL) Bangladesh 90 (90)
MBL Industries Limited (MBLIL) (Through Marico Middle East FZE) Bangladesh 100 (100)
Marico Middle East FZE (MME) UAE 100 (100)
Kaya Middle East FZE (KME) (Through Marico Middle East FZE) UAE 100 (100)
MEL Consumer Care SAE (MELCC)(Through Marico Middle East FZE)
Egypt 100 (100)
Egyptian American Investment & Industrial Development Company (EAIIDC) (Through Marico Middle East FZE)
Egypt 100 (100)
Marico Egypt Industries Company (MEIC) (Through MEL Consumer Care SAE) Egypt 100 (100)
Sundari LLC. (upto June 8, 2009) United States of America
Nil (100)
Marico South Africa Consumer Care (Pty) Ltd. (MSACC) South Africa 100 (100)
Marico South Africa (Pty) Ltd. (MSA) (Through Marico South Africa Consumer Care (Pty) Ltd.)
South Africa 100 (100)
CPF International (Pty) Ltd. (CPF) (Through Marico South Africa (Pty) Ltd.)
South Africa 100 (100)
Marico Malaysia Sdn. Bhd. (MMSB) (Through Marico Middle East FZE) (w.e.f December 4, 2009)
Malaysia 100 (100)
Derma – Rx International Aesthetics Pte. Ltd. (DIAL) (w.e.f. May 22, 2010) Singapore 100 (Nil)
The DRx Clinic Pte. Ltd. (DCPL) (Through Derma – Rx International Aesthetics Pte. Ltd.) (w.e.f. May 25, 2010)
Singapore 100 (Nil)
The DRx Medispa Pte. Ltd. (DMSPL) (Through Derma – Rx International Aesthetics Pte. Ltd.) (w.e.f. May 25, 2010)
Singapore 100 (Nil)
DRx Investments Pte. Ltd. (DIPL) (Through Derma – Rx International Aesthetics Pte. Ltd.) (w.e.f. May 25, 2010)
Singapore 100 (Nil)
DRx Meditech Pte. Ltd. – (w.e.f. from May 25, 2010 and upto February 28, 2011 – merged with Derma-Rx International Aesthetics Pte. Ltd. w.e.f. March 1, 2011)
Singapore –
DRx Aesthetics Sdn. Bhd. (DASB) (Through Derma – Rx International Aesthetics Pte. Ltd.) (w.e.f. May 25, 2010)
Malaysia 100 (Nil)
International Consumer Products Corporation (ICP) (w.e.f. February 18, 2011) Vietnam 85 (Nil)
Beaute Cosmetique Societe Par Actions (BCS) (Through International Consumer Products Corporation) (w.e.f. February 18, 2011) (99% equity held by ICP)
Vietnam 84.15 (Nil)
Thuan Phat Foodstuff Joint Stock Company (TPF) (Through International Consumer Products Corporation) (w.e.f. February 18, 2011) (87% equity held by ICP)
Vietnam 73.95 (Nil)

C O N S O L I D A T E D F I N A N C I A L S
55
NOTES TO ACCOUNTS TO THE CONSOLIDATED BALANCE SHEET AND PROFIT AND LOSS ACCOUNT
ii) List of Subsidiary firm
Name of the Company Country of incorporation Percentage of ownership interest
Wind Company (Through MEL Consumer Care SAE) Egypt 99 (99)
(iii) The effect of the subsidiaries formed / acquired during the year is as under:
Rs. Crore
Name of Subsidiary Net Profit Net Assets
Derma – Rx International Aesthetics Pte. Ltd. and its subsidiaries 5.95 2.10
International Consumer Products Corporation and its subsidiaries 0.22 40.38
Total 6.17 42.48
3) Summary of Significant Accounting Policies:
(a) Basis of preparation of Financial Statements
The financial statements are prepared in accordance with Indian Generally Accepted Accounting Principles (“GAAP”)
under the historical cost convention on an accrual basis, except for certain financial instruments which are measured at
fair values, and are in conformity with mandatory accounting standards, as prescribed by the Companies (Accounting
Standards) Rules, 2006, the provisions of the Companies Act, 1956 and guidelines issued by the Securities and Exchange
Board of India (SEBI).
(b) Basis of preparation of Consolidated Financial Statements
The Consolidated Financial Statements relate to the Company and its subsidiaries. The consolidated financial statements
have been prepared on the following basis:
i) In respect of Subsidiary companies, the financial statements have been consolidated on a line-by-line basis by
adding together the book values of like items of assets, liabilities, income and expenses, after fully eliminating
intra-group balances and unrealised profits / losses on intra-group transactions as per Accounting Standard (AS
21) “Consolidated Financial Statements”. The results of subsidiaries are included from the date of acquisition of
a controlling interest.
ii) In case of foreign subsidiaries, being Non-Integral Foreign Operations, revenue items are consolidated at the
average rate prevailing during the year. All asset and liabilities are converted at the rate prevailing at the end of the
year. The resultant translation gains and losses are shown separately as ‘Foreign Currency Translation Reserve
(Translation adjustments)’ under ‘Reserves and Surplus’.
iii) The excess of cost to the Group of its investment in subsidiary companies over its share of equity and reserves of
its subsidiary companies at the dates on which investments are made, is recognized in the financial statements
as Goodwill, which is tested for impairment at every balance sheet date. The excess of Group’s share of equity
and reserves of its subsidiary companies over the cost of acquisition is treated as Capital Reserve.
iv) Minority interests in the net assets of consolidated subsidiaries consist of the amount of equity attributable to the
minority shareholders at the dates on which investments are made by the Company in the subsidiary companies
and further movements in their share in the equity, subsequent to the dates of investments.
v) The Consolidated Financial Statements have been prepared using uniform accounting policies for like transactions
and other events in similar circumstances and are presented to the extent possible, in the same manner as the
Company’s separate financial statements, except for :
1. In case of all subsidiaries, except Plant & Machinery of Marico Egypt Industries Company, depreciation in
respect of Factory Building and Plant & Machinery is provided on Straight Line Basis instead of Written Down
Value Basis as followed by Marico Limited (except items specified in note 3(e)(I)(a) below). The total amount
of net block of these items of fixed assets represents 15.99% of the total consolidated net block of fixed assets
of the Group as at the year end.

C O N S O L I D A T E D F I N A N C I A L S
56
NOTES TO ACCOUNTS TO THE CONSOLIDATED BALANCE SHEET AND PROFIT AND LOSS ACCOUNT 2. In case of Marico Middle East FZE, Marico Malaysia Sdn. Bhd., The DRx Clinic Pte. Ltd., The DRx Medispa
Pte. Ltd. and DRx Aesthetics Sdn. Bhd., costs of inventories are ascertained on FIFO instead of weighted
average basis. These inventories represent 0.25 % of the total consolidated inventories of the group as at the
year end.
3. In case of certain subsidiaries referred in note 3 (l) below, leave encashment and gratuity is provided on
arithmetical basis instead of actuarial basis. These liabilities represent 49.83 % of the total consolidated gratuity
and leave encashment liability of the Group as at the year end.
(c) Use of estimates
The preparation of the financial statements in conformity with GAAP requires Management to make estimates and
assumptions that affect the reported balances of assets and liabilities and disclosure relating to contingent assets
and liabilities as at the date of the financial statements and reported amounts of income and expenses during
the period. Examples of such estimates include provisions for doubtful debts, future obligations under employee
retirement benefit plans, income taxes, the useful lives and provision for impairment of fixed assets and intangible
assets.
Management believes that the estimates used in the preparation of financial statements are prudent and reasonable.
Future results could differ from these estimates.
(d) Fixed assets, intangible assets and capital work-in-progress
Fixed assets and intangible assets are stated at cost of acquisition less accumulated depreciation and impairments, if
any. Cost includes taxes, duties, freight and other incidental expenses related to acquisition and installation. Borrowing
costs attributable to acquisition, construction of a qualifying asset (i.e. an asset requiring substantial period of time to
get ready for intended use) are capitalized in accordance with the requirements of Accounting Standard 16 (AS 16),
“Borrowing Costs” mandated by Rule 3 of the Companies (Accounting Standards) Rules 2006. Other pre-operative
expenses for major projects are also capitalised, where appropriate.
Capital work-in-progress comprises outstanding advances paid to acquire fixed assets and cost of fixed assets that
are not yet ready for their intended use at the year end.
(e) Depreciation and amortisation
I. Tangible assets
a. Depreciation in respect of assets of Indian entities viz, Marico Limited and Kaya Limited is provided at higher of
the rates based on useful lives of the assets as estimated by the management or those stipulated in Schedule
XIV to the Companies Act, 1956. The depreciation rates considered for the following items are higher than the
rates stipulated in Schedule XIV to the Companies Act, 1956:
Asset class Particulars Rates
Plant and Machinery Computer hardware and related peripherals 33.33%
Moulds 16.21%
Office equipment 10 % - 50%
Technologically advanced machinery 14.29% - 33.33%
Furniture and Fittings Furniture and fittings (including lease hold improvements) 11.11% - 12.5%
Vehicles Vehicles 20%
Leasehold land Leasehold land Lease period

C O N S O L I D A T E D F I N A N C I A L S
57
NOTES TO ACCOUNTS TO THE CONSOLIDATED BALANCE SHEET AND PROFIT AND LOSS ACCOUNT b. Depreciation in respect of assets of foreign subsidiaries is provided based on useful life of the assets as
estimated by the management here under:
Asset class Rates
Buildings 4% - 20%
Plant and Machinery 6.67% - 50%
Furniture and fittings (including leasehold improvements) 6.67% - 50%
Vehicles 10% - 33%
c. In Marico Limited, depreciation on Factory Building and Plant and Machinery (other than items referred in item
I(a) above which are depreciated on straight line basis) is provided on written down value basis. Depreciation
on all assets of MEIC is provided on written down value basis. Depreciation on other assets of Marico Limited
and on all assets of other subsidiaries is provided on straight line basis.
d. Assets individually costing Rs. 5,000 or less are depreciated fully in the year of acquisition
II. Intangible assets
Intangible assets are amortized over their respective individual estimated useful lives on a straight line basis but
not exceeding the period given here under:
Trademarks, copyrights and business and commercial rights and other intangibles 7 to 10 years
Computer software 2 to 3 years
(f) Assets taken on lease
(i) In respect of finance lease arrangements, the assets are capitalized and depreciated. Finance charges are charged
off to the Profit and Loss account of the year in which they are incurred.
(ii) Operating lease payments are recognized as expenditure in the Profit and Loss account as per the terms of the
respective lease agreement.
(g) Assets given on lease
The Company has given Plant and Machinery on an operating lease basis. Lease rentals are accounted on accrual
basis in accordance with the respective lease agreements.
(h) Investments
(i) Long term investments are valued at cost. Provision for diminution, if any, in the value of investments is made to
recognize a decline in value, other than temporary.
(ii) Current investments are valued at lower of cost and fair value, computed individually for each investment. In case
of investments in mutual funds which are unquoted, net asset value is taken as fair value.
(i) Inventories
(i) Raw material, packing materials, stores, spares and consumables are valued at lower of cost and net realizable
value. However, these items are considered to be realizable at cost if the finished products in which they will be
used are expected to be sold at or above cost.
(ii) Work-in-process and finished products are valued at lower of cost and net realizable value.
(iii) By-products and unserviceable/damaged finished products are valued at net realizable value.
(iv) Cost is ascertained on weighted average method and in case of work-in-process includes appropriate production
overheads and in case of finished products includes appropriate production overheads and excise duty, wherever
applicable. In case of Marico Middle East FZE, Marico Malaysia Sdn. Bhd., The DRx Clinic Pte. Ltd., The DRx
Medispa Pte. Ltd. and DRx Aesthetics Sdn. Bhd., costs of inventories are ascertained on FIFO instead of weighted
average basis.

C O N S O L I D A T E D F I N A N C I A L S
58
NOTES TO ACCOUNTS TO THE CONSOLIDATED BALANCE SHEET AND PROFIT AND LOSS ACCOUNT
(j) Research and development
Capital expenditure on research and development is capitalised and depreciated as per the accounting policy mentioned
in para 3(e) above. Revenue expenditure is charged off in the year in which it is incurred.
(k) Revenue recognition
(i) Domestic sales are recognized at the point of dispatch of goods to the customers, which is when risks and
rewards of ownership are passed to the customers and stated net of trade discount and exclusive of sales tax
and excise duty.
(ii) Export sales are recognised based on the date of bill of lading except sales to Nepal which are recognized when
the goods cross the Indian territory, which is when risks and rewards of ownership are passed to the customers.
(iii) Revenue from services is recognized on rendering of the services and is recorded net of discount and service tax.
(iv) Interest and other income are recognised on accrual basis.
(l) Retirement and other benefits to employees
(i) The Group has various schemes of employee benefits as per applicable Local Laws of the respective countries,
namely, provident fund, superannuation fund, gratuity, leave encashment and contributions to government social
insurance system. Provident, superannuation and gratuity funds (wherever funded) are administered through
trustees/Regional Provident Fund and the Group’s contribution thereto is charged to revenue every year. In case
of provident fund, the Company has an obligation to make good the shortfall if any, between return on investment
by the trust and government administered interest rates. Leave encashment and gratuity are provided on the basis
of actuarial valuation as at the year end by an independent actuary except that in case of Marico Bangladesh
Limited, Marico Middle East FZE, Kaya Middle East FZE and MEL Consumer Care SAE liability on account of
gratuity and in case of Marico Bangladesh Limited, Marico Middle East FZE, Marico Egypt Industries Company,
Wind Co., Marico South Africa (Pty) Ltd., International Consumer Products Corporation, Beauté Cosmétique Societé
Par Actions, Thuan Phat Foodstuff Joint Stock Company, liability on account of leave encashment is provided on
arithmetical basis instead of actuarial basis.
(ii) Long term service benefits
Liability on account of long term service benefits is determined and provided on the basis of an independent
actuarial valuation.
(m) Foreign currency transactions
(i) Transactions in foreign currencies are recognized at the prevailing exchange rates on the transaction dates. Realized
gains and losses on settlement of foreign currency transactions are recognized in the Profit and Loss account.
(ii) Foreign currency monetary assets and liabilities at the year end are translated at the year end exchange rates and
the resultant exchange differences except those qualifying for hedge accounting are recognised in the Profit and
Loss account.
(iii) In case of forward contracts with underlying assets or liabilities, the difference between the forward rate and the
exchange rate on the date of inception of a forward contract is recognized as income or expense and is amortized
over the life of the contract. Exchange differences on such contracts are recognized in the Profit and Loss account
in the year in which they arise.
(iv) The Company uses forward and options contracts to hedge its risks associated with foreign currency transactions
relating to certain firm commitments and forecasted transactions. The Company also uses Interest Rates Swap
contracts to hedge its interest rate risk exposure. The Company designates these as Cash Flow Hedges. These
contracts are marked to market as at the year end and resultant exchange differences, to the extent they represent
effective portion of the hedge, are recognized directly in ‘Hedge Reserve account’. The ineffective portion of the

C O N S O L I D A T E D F I N A N C I A L S
59
NOTES TO ACCOUNTS TO THE CONSOLIDATED BALANCE SHEET AND PROFIT AND LOSS ACCOUNT
same is recognized immediately in the Profit and Loss account.
(v) Exchange differences taken to Hedge Reserve account are recognised in the Profit and Loss account upon
crystallization of firm commitments or occurrence of forecasted transactions or upon discontinuation of hedge
accounting resulting from expiry / sale / termination of hedge instrument or upon hedge becoming ineffective.
(n) Accounting for taxes on income
(i) Current income tax expense comprises taxes on income from operations in India and in foreign jurisdictions. Income
tax payable in India is made, based on the tax payable under the Income Tax Act, 1961. Minimum Alternative Tax
(MAT) credit, which is equal to the excess of MAT (calculated in accordance with provisions of section 115JB
of the Income Tax Act, 1961) over normal income tax is recognized as an asset by crediting the Profit and Loss
account only when and to the extent there is convincing evidence that the Company will be able to avail the said
credit against normal tax payable during the period of ten succeeding assessment years.
(ii) Deferred tax on timing differences between taxable income and accounting income is accounted for, using the
tax rates and the tax laws enacted or substantially enacted as on the balance sheet date. Deferred tax assets on
unabsorbed tax losses and unabsorbed tax depreciation are recognised only when there is a virtual certainty of their
realisation. Other deferred tax assets are recognised only when there is a reasonable certainty of their realization.
(o) Impairment
The Company reviews the carrying values of tangible and intangible assets for any possible impairment at each balance
sheet date. An impairment loss is recognised when the carrying amount of an asset exceeds its recoverable amount.
The recoverable amount is the greater of net selling price and value in use. In assessing the value in use, the estimated
future cash flows are discounted to their present value at appropriate discount rates. If at the balance sheet date there
is an indication that a previously assessed impairment loss no longer exists, the recoverable amount is reassessed and
the asset is reflected at the recoverable amount.
(p) Employee Stock Option Plan
In respect of stock options granted pursuant to the Company’s Employee Stock Option Scheme, the intrinsic value of
the options (excess of market value of shares over the exercise price of the option at the date of grant) is recognised
as Employee compensation cost over the vesting period.
(q) Employee Stock Appreciation Rights Scheme
In respect of Employee Stock appreciation rights granted pursuant to the Company’s Employee Stock Appreciation
Rights Scheme, the intrinsic value of the rights (excess of market value as at the year end and the market price on the
date of grant) is recognised as Employee compensation cost over the vesting period.
(r) Contingent Liabilities
Contingent Liabilities are disclosed in respect of possible obligations that arise from past events but their existence will
be confirmed by the occurrence or non-occurrence of one or more uncertain future events not wholly within the control
of the Company or where any present obligation cannot be measured in terms of future outflow of resources or where a
reliable estimate of the obligation cannot be made. A Provision is made based on a reliable estimate when it is probable
that an outflow of resources embodying economic benefits will be required to settle an obligation and in respect of which
a reliable estimate can be made. Provision is not discounted and is determined based on best estimate required to settle
the obligation at the year end date. Contingent Assets are not recognized or disclosed in the financial statements.
4) The audited consolidated financial results for the year ended March 31, 2011 comprised the audited financial results of
Marico Limited, Kaya Limited, Marico Bangladesh Limited, MBL Industries Limited, Marico Middle East FZE, Kaya Middle
East FZE, Marico South Africa Consumer Care (Pty) Ltd., Marico South Africa (Pty) Ltd., CPF International (Pty) Ltd., Marico
Malaysia Sdn. Bhd., Derma Rx International Aesthetics Pte. Ltd., The DRx Clinic Pte. Ltd., The DRx Medispa Pte. Ltd., DRx
Investments Pte. Ltd. and DRx Aesthetics Sdn. Bhd. and unaudited results of MEL Consumer Care SAE, Egyptian American

C O N S O L I D A T E D F I N A N C I A L S
60
NOTES TO ACCOUNTS TO THE CONSOLIDATED BALANCE SHEET AND PROFIT AND LOSS ACCOUNT
Investment & Industrial Development Company, Marico Egypt Industries Company, Wind Company, International Consumer
Products Corporation, Beauté Cosmétique Societé Par Actions and Thuan Phat Foodstuff Joint Stock Company which have
been approved by the respective Board of Directors of these companies.
5) a) Contingent liabilities not provided for in respect of:
(i) Disputed tax demands/ claims:
(Rs. Crore)
March 31, 2011 March 31, 2010
Sales tax 17.61 6.08
Service tax 0.37 0.38
Customs duty 0.40 0.40
Agricultural Produce Marketing cess 8.14 7.93
Employees State Insurance Corporation 0.13 0.13
Excise duty on Subcontractors 0.29 0.24
Lease termination cost 0.11 2.00
(ii) Excise duty on CNO dispatches Rs. 210.74 Crore (Rs. 131.57 Crore) (Refer note 27 below)
(iii) Claims against the Company not acknowledged as debts Rs. 1.38 Crore (Rs. 1.03 Crore)
(iv) Possible indemnification obligations under the Deed of Assignment for assignment of “Sweekar” brand, in the event
Company is unable to reinstate the trademark registration number in the records of the trademark registry within a
period of six months from the date of execution of the deed - Rs. 4.00 Crore (Refer note 14 (b) below).
b) (i) Corporate guarantees given to banks on behalf of subsidiaries for credit and other facilities granted by banks
Rs. 137.44 Crore (Rs. 41.40 Crore). The credit and other facilities availed by the subsidiaries as at the year end is
Rs. 59.04 Crore (Rs. 7.02 Crore).
(ii) Stand by Letter of Credit given to banks on behalf of subsidiaries for credit and other facilities granted by banks
Rs. 108.47 Crore (Rs. 76.46 Crore). The credit and other facilities availed by the subsidiaries as at the year end is
Rs. 96.65 Crore (Rs. 54.14 Crore).
(iii) Bank guarantees given to statutory authorities Rs. 12.52 Crore (Rs. 7.23 Crore).
(iv) Contingent consideration for acquisition of skin care business of Derma Rx. Rs.10.60 Crore (Rs. Nil) (Refer note 18 below)
c) Amount outstanding towards Letters of Credit Rs. 29.20 Crore (Rs. 12.71 Crore).
6) Estimated amount of contracts remaining to be executed on capital account and not provided for Rs. 62.87 Crore
(Rs. 22.11 Crore) net of advances.
7) Borrowing costs capitalized during the year amount to Rs. 0.56 Crore (Rs. 2.83 Crore).
8) Miscellaneous income includes lease income Rs. 0.39 Crore (Rs. 0.43 Crore) and export subsidy Rs. 6.54 Crore
(Rs. 2.10 Crore).
9) Miscellaneous expenses include labour charges Rs 5.43 Crore (Rs. 2.78 Crore), training and seminar expenses Rs. 6.10 Crore
(Rs. 4.62 Crore), outside services Rs. 2.60 Crore (Rs. 17.69 Crore) , professional charges Rs. 24.01 Crore (Rs. 19.11 Crore),
donations Rs. 0.08 Crore (Rs. 0.44 Crore), loss on sale / disposal/discard of assets (net) Rs. Nil (Rs. 1.16 Crore) , Leakage
and Damage expenses of Rs. 2.27 Crore (Rs. 9.66 Crore) and impaired assets/capital advances written off Rs. 3.92 Crore (Rs.
Nil) and are net of excess provisions no longer required written back Rs. 1.96 Crore (Rs. 7.88 Crore) [including Impairment
provision of Rs. 1.03 Crore (Rs. 1.20 Crore) written back upon sale/discard of related assets and written off impaired capital
advance/assets].
10) Research and Development expenses aggregating Rs. 7.81 Crore (Rs. 8.04 Crore) have been included under the relevant
heads in the Profit and Loss account.

C O N S O L I D A T E D F I N A N C I A L S
61
NOTES TO ACCOUNTS TO THE CONSOLIDATED BALANCE SHEET AND PROFIT AND LOSS ACCOUNT11) Additional information on assets taken on lease:
The Company’s significant leasing arrangements are in respect of residential flats, office premises, Skin clinics, warehouses,
vehicles etc taken on lease. The arrangements range between 11 months to 9 years and are generally renewable by mutual
consent or mutually agreeable terms. Under these arrangements refundable interest-free deposits have been given.
(Rs. Crore)
March 31, 2011 March 31, 2010
Lease rentals recognised in the Profit and loss account 60.18 36.85
In respect of assets taken on non cancelable operating lease:
Lease obligations
Future minimum lease rental payments payable
- not later than one year 29.17 23.93
- later than one year but not later than five years 79.80 77.46
- later than five years 1.70 4.79
Total 110.67 106.18
12) Additional information on assets given on operating lease:
The Company has given on lease certain Plant & Machinery for a lease period ranging between 1 to 3 years. These arrangements
are in the nature of cancelable lease and are generally renewable by mutual consent or mutual agreeable terms.
Fixed Asset given on operating lease as at March 31, 2011 and 2010
(Rs. Crore)
Cost Accumulated Depreciation Net Book Value
Plant and Machinery 2.03 1.94 0.09
(2.03) (1.92) (0.11)
The aggregate depreciation charged on the above assets during the year ended March 31, 2011 amounted to Rs. 0.02 Crore (Rs. 0.03 Crore).
(Rs. Crore)
March 31, 2011 March 31, 2010
Lease rental income recognised in the Profit and Loss account. 0.39 0.43
13) a) Break-up of deferred tax asset:
(Rs. Crore)
March 31, 2011 March 31, 2010Deferred Tax Asset:Provision for doubtful debtors/advances that are deducted for tax purposes when written off
1.17 2.68
On intangible assets adjusted against Capital Redemption Reserve and Securities Premium Account under the Capital Restructuring Scheme implemented in an earlier year
36.53 48.91
Liabilities / Provisions that are deducted for tax purposes when paid : - Provision for contingencies–Excise (refer Note 27 below) – 9.75 - Provision for others 3.55 2.68Others 2.76 2.94Total Deferred tax asset 44.01 66.96Deferred Tax Liability:Additional depreciation on fixed assets for tax purposes due to higher tax depreciation rates
13.90 5.33
Total Deferred tax liability 13.90 5.33Deferred Tax Asset (net) 30.11 61.63
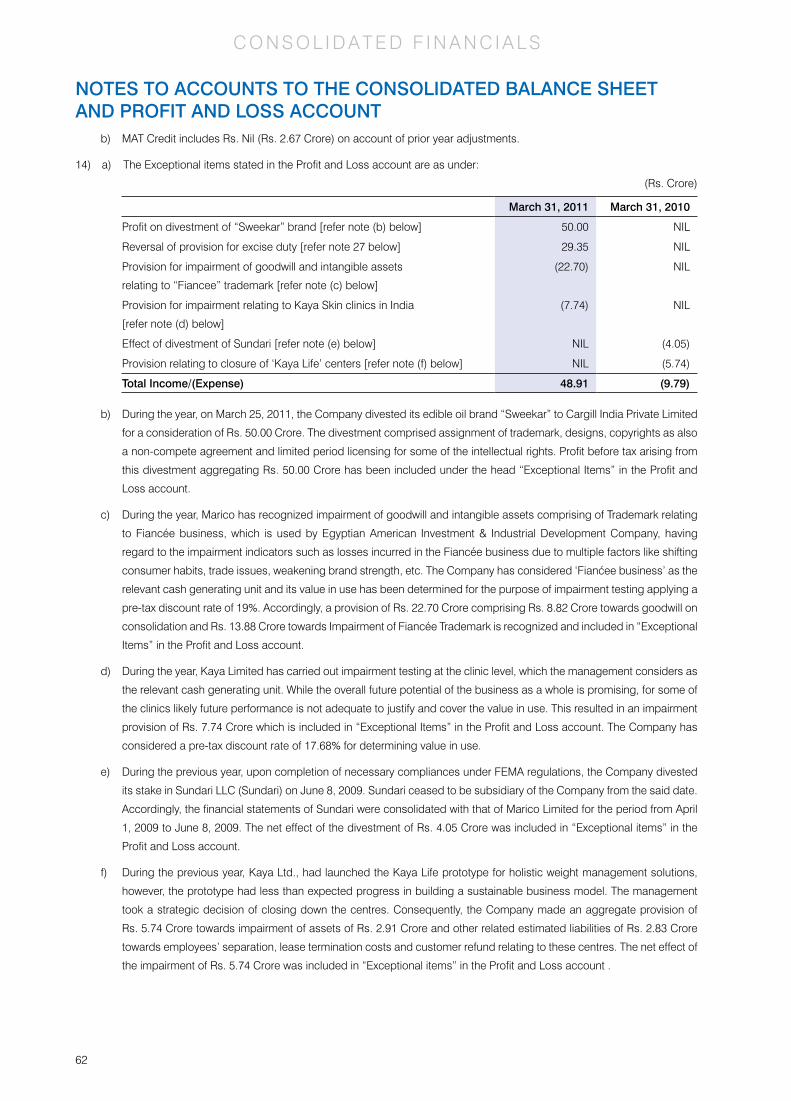
C O N S O L I D A T E D F I N A N C I A L S
62
NOTES TO ACCOUNTS TO THE CONSOLIDATED BALANCE SHEET AND PROFIT AND LOSS ACCOUNT
b) MAT Credit includes Rs. Nil (Rs. 2.67 Crore) on account of prior year adjustments.
14) a) The Exceptional items stated in the Profit and Loss account are as under:
(Rs. Crore)
March 31, 2011 March 31, 2010
Profit on divestment of “Sweekar” brand [refer note (b) below] 50.00 NIL
Reversal of provision for excise duty [refer note 27 below] 29.35 NIL
Provision for impairment of goodwill and intangible assets
relating to “Fiancee” trademark [refer note (c) below]
(22.70) NIL
Provision for impairment relating to Kaya Skin clinics in India
[refer note (d) below]
(7.74) NIL
Effect of divestment of Sundari [refer note (e) below] NIL (4.05)
Provision relating to closure of ‘Kaya Life’ centers [refer note (f) below] NIL (5.74)
Total Income/(Expense) 48.91 (9.79)
b) During the year, on March 25, 2011, the Company divested its edible oil brand “Sweekar” to Cargill India Private Limited
for a consideration of Rs. 50.00 Crore. The divestment comprised assignment of trademark, designs, copyrights as also
a non-compete agreement and limited period licensing for some of the intellectual rights. Profit before tax arising from
this divestment aggregating Rs. 50.00 Crore has been included under the head “Exceptional Items” in the Profit and
Loss account.
c) During the year, Marico has recognized impairment of goodwill and intangible assets comprising of Trademark relating
to Fiancée business, which is used by Egyptian American Investment & Industrial Development Company, having
regard to the impairment indicators such as losses incurred in the Fiancée business due to multiple factors like shifting
consumer habits, trade issues, weakening brand strength, etc. The Company has considered ‘Fianćee business’ as the
relevant cash generating unit and its value in use has been determined for the purpose of impairment testing applying a
pre-tax discount rate of 19%. Accordingly, a provision of Rs. 22.70 Crore comprising Rs. 8.82 Crore towards goodwill on
consolidation and Rs. 13.88 Crore towards Impairment of Fiancée Trademark is recognized and included in “Exceptional
Items” in the Profit and Loss account.
d) During the year, Kaya Limited has carried out impairment testing at the clinic level, which the management considers as
the relevant cash generating unit. While the overall future potential of the business as a whole is promising, for some of
the clinics likely future performance is not adequate to justify and cover the value in use. This resulted in an impairment
provision of Rs. 7.74 Crore which is included in “Exceptional Items” in the Profit and Loss account. The Company has
considered a pre-tax discount rate of 17.68% for determining value in use.
e) During the previous year, upon completion of necessary compliances under FEMA regulations, the Company divested
its stake in Sundari LLC (Sundari) on June 8, 2009. Sundari ceased to be subsidiary of the Company from the said date.
Accordingly, the financial statements of Sundari were consolidated with that of Marico Limited for the period from April
1, 2009 to June 8, 2009. The net effect of the divestment of Rs. 4.05 Crore was included in “Exceptional items” in the
Profit and Loss account.
f) During the previous year, Kaya Ltd., had launched the Kaya Life prototype for holistic weight management solutions,
however, the prototype had less than expected progress in building a sustainable business model. The management
took a strategic decision of closing down the centres. Consequently, the Company made an aggregate provision of
Rs. 5.74 Crore towards impairment of assets of Rs. 2.91 Crore and other related estimated liabilities of Rs. 2.83 Crore
towards employees’ separation, lease termination costs and customer refund relating to these centres. The net effect of
the impairment of Rs. 5.74 Crore was included in “Exceptional items” in the Profit and Loss account .

C O N S O L I D A T E D F I N A N C I A L S
63
NOTES TO ACCOUNTS TO THE CONSOLIDATED BALANCE SHEET AND PROFIT AND LOSS ACCOUNT15) Intangible Assets namely Brands and Intellectual Property Rights represented by Trademarks etc. are owned by certain
foreign subsidiaries of the Company. The management believes that these intangible assets have indefinite useful life.
These companies are not amortizing the said assets in accordance with the requirements of the applicable local accounting
standards in which their standalone financial statements are prepared.
Under Indian GAAP, under which the Consolidated Financial Statements are prepared, such intangible assets are required
to be amortized over a period of 10 years. However, while preparing the Consolidated Financial Statements for the year
ended March 31, 2010, the Company had continued the policy adopted by the overseas subsidiaries and accordingly had
not amortized these intangible assets.
During the year, the Company has reviewed this policy and has decided to amortize these intangible assets over a period of
10 years so as to align the policy with the Indian Accounting Standards. Accordingly, an amount of Rs. 9.53 Crore has been
amortized in the Consolidated Financial Statements and is included in “Depreciation, Amortization and Impairment”.
Had the Company continued to follow the policy of not amortizing such intangible assets as in the previous year, the
“Depreciation, Amortization and Impairment” for the year would have been lower by Rs. 9.53 Crore and the carrying value of
the said intangible assets and the Profit before tax for the year each would have been higher by Rs. 9.53 Crore.
16) The service revenue of Kaya Skin Care business (Kaya Limited and Kaya Middle East FZE) includes packaged services in
which the consideration is collected upfront towards services to be availed by the customers over a period of time covered by
the package. These advances are non-refundable. However, due to inadequate measuring tools to record actual availment
of services by customers against each package, these companies had been recognizing revenue on an estimated basis.
During the year, the companies have been able to develop and deploy Point of Sale (POS) software to track the availment of
services by customers against these packages and have accordingly refined the said policy so as to align the recognition
of revenue with the services rendered. Accordingly, during the year, an amount of Rs. 35.30 Crore collected upto March 31,
2011 in respect of which services are pending to be rendered as at the year end has been deferred for recognition, and is
reflected as Advances received from customers under the head “Current Liabilities”. Had these companies not made the
said refinement of the accounting estimates, revenue from sale of services and consolidated profit before tax would have
been higher by Rs. 31.32 Crore and advances received from customers would have been lower by an equivalent amount.
17) During the year, on February 18, 2011, Marico Limited acquired controlling equity stake in International Consumer Products
Corporation (ICP), a company incorporated in Vietnam and its subsidiaries. The acquisition resulted in Goodwill of Rs. 221.63
Crore arising on consolidation.
18) During the year, Derma Rx International Aesthetics Pte. Ltd. (DIAL), which was incorporated in Singapore as wholly owned
subsidiary of Kaya Limited, acquired the skin care business of Derma Rx in Singapore and Malaysia. The acquisition comprised
of 100% equity stake in DRx Clinic Pte. Ltd., DRx Meditech Pte. Ltd., The DRx Medispa Pte. Ltd., DRx Investment Pte. Ltd.,
and DRx Aesthetics Sdn. Bhd. and associated Intellectual Property Rights etc. from Derma Rx (Asia Pacific) Pte. Ltd. for a
consideration of Rs. 90.94 Crore comprising cost of Investment Rs. 45.49 Crore and cost of Trademark and other Intellectual
Property Rights of Rs. 45.45 Crore . The agreement also envisages a contingent consideration of Rs. 54.39 Crore which is
payable over the three years period commencing from May 25, 2010 upon achievement of certain milestones such as turnover,
profits etc.
Based on the assessment of the performance of Derma Rx business since the acquisition, the management has assessed
that it is more than probable that a consideration of Rs. 43.79 Crore would be payable. Accordingly, the Company has
considered the provision of the said amount as part of the cost of acquisition. The balance of contingent consideration of Rs.
10.60 Crore is considered as ‘Contingent Liability’. The above acquisition has resulted in Goodwill of Rs. 99.75 Crore arising
on consolidation.

C O N S O L I D A T E D F I N A N C I A L S
64
NOTES TO ACCOUNTS TO THE CONSOLIDATED BALANCE SHEET AND PROFIT AND LOSS ACCOUNT
19) a) The total derivative instruments outstanding as on March 31, 2011 are Plain Forwards, Plain Vanilla Option contracts
and an Interest rate swap:
March 31, 2011 March 31, 2010
Notional amount in Foreign currency
Equivalent amount in at the year end
(Rs. Crore)
Notional amount in Foreign currency
Equivalent amount in at the year end
(Rs. Crore)
Forward contracts outstanding*
Exports:
- in USD 6,000,000 26.75 4,250,000 19.09
Foreign currency loans:
- in USD 12,308,344 54.88 11,847,085 53.21
Creditors:
- in USD 5,000,000 22.29 2,057,775 9.24
- in AUD 297,898 1.37 Nil Nil
Advance receivable:
- in AUD Nil Nil 600,000 2.47
Loan to subsidiary:
- in ZAR 19,000,000 84.71 Nil Nil
Options Contracts outstanding
Exports:
- in USD Nil Nil 7,250,000 32.57
* Converted into the exchange rate at the year end.
** Out of the forward contracts outstanding as on March 31, 2011, USD 11,000,000 (USD 6,307,775), AUD 297,898
(AUD 600,000), having fair value of Rs. 52.01 Crore(Rs. 31.19 Crore) and all outstanding option contracts as on
March 31, 2011, having fair value of Rs. Nil (Rs. 1.01 Crore) have been designated as Cash Flow hedges.
- The Company has entered into Interest rate swap of USD 8,750,000 (USD 4,583,333), for hedging its interest rate
exposure on borrowings in foreign currency which has a fair value of Rs. 0.34 Crore (Rs. 0.63 Crore).
- The Cash flows are expected to occur and impact the Profit and Loss account within the period of 1 year except
interest rate swap, in respect of which Cash Flows are expected to occur and impact the Profit and Loss account
within the period of 1 to 2 years (1 to 3 years).
- All the derivative contracts entered by the Company were for hedging purpose and not for any speculative purpose.

C O N S O L I D A T E D F I N A N C I A L S
65
NOTES TO ACCOUNTS TO THE CONSOLIDATED BALANCE SHEET AND PROFIT AND LOSS ACCOUNT
b) Net foreign currency exposures not hedged as at the year end are as under:
March 31, 2011 March 31, 2010
Currency Amount in Foreign
Currency
Equivalent amount at
the year end (Rs.Crore)
Amount in Foreign
Currency
Equivalent amount at
the year end (Rs.Crore)
a. Amount receivable in foreign currency on account of following :
- Export of goods AED 4,988 0.01 4,988 0.01
USD Nil Nil 21,003 0.09
b. Amount (payable) /receivable in foreign currency on account of following :
(i) Import of goods and Services AED 65,000 0.08 45,075 0.06
AUD Nil Nil 188,288 0.61
EUR 27,380 0.17 (93,550) (0.57)
CHF Nil Nil 20,600 0.09
GBP Nil Nil 291 0.01
USD 187,448 0.84 (789,791) (3.55)
CHF Nil Nil (24,160) (0.10)
GBP Nil Nil (9,842) (0.07)
SGD 121 0.01 Nil Nil
(ii) Capital imports CHF 680 0.01 680 0.01
GBP 800 0.01 800 0.01
(iii) Loan payables * USD (12,308,344) (54.88) Nil Nil
c. Bank balances USD 518,470 2.31 152,925 0.69
EUR Nil Nil 1,600 0.01
OMR 115,147 1.33 22,097 0.26
SAR 109,632 0.13 285,300 0.36
VND 2,089,000 0.01 Nil Nil
d. Other receivables / (payables) USD 8,288 0.04 190,320 0.85
AED (4,447) (0.01) 147,273 0.18
OMR 4,694 0.05 2,089 0.02
SAR 302,470 0.34 120,665 0.15
EUR 600 0.01 1,324 0.01
Total (49.55) (0.87)
*excludes Loans payable of Rs. 279.77 Crore [USD 62,750,000] (Rs. 61.76 Crore [USD 13,750,000]) assigned to
hedging relationship against highly probable forecast sales. The Cash flows are expected to occur and impact the
Profit and Loss account within the period of 1 to 6 years.
c) Pursuant to the Announcement of the Institute of Chartered Accountants of India’s (ICAI) “Accounting for Derivatives” on
encouraging the early adoption of Accounting Standard (AS) 30, “Financial Instruments: Recognition and Measurement”,
the Company had in previous year ended March 31, 2009, decided an early adoption of AS 30 to the extent it does
not conflict with existing mandatory accounting standards and other authoritative pronouncements, Company Law
and other regulatory requirements. Accordingly the net unrealized gain Rs. 4.99 Crore (Rs. 2.81 Crore) in respect of
outstanding derivative instruments and foreign currency loans at the year end which qualify for hedge accounting,
is standing in the ‘Hedge Reserve account’, which would be recognized in the Profit and Loss account when the
underlying transaction or forecast revenue arises, as against the earlier practice of recognizing the same in the Profit
and Loss account.

C O N S O L I D A T E D F I N A N C I A L S
66
NOTES TO ACCOUNTS TO THE CONSOLIDATED BALANCE SHEET AND PROFIT AND LOSS ACCOUNT
20) Earnings per share:
March 31, 2011 March 31, 2010
Profit after taxation / Profit available to equity share holders (Rs. Crore) 286.44 231.67
Equity shares outstanding as at the year end 614,399,550 609,325,700
Weighted average number of equity shares used as denominator for calculating basic earnings per share
612,569,618 609,150,561
Weighted average number of equity shares used as denominator for calculating diluted earnings per share
615,400,555 611,557,579
Nominal value per equity share Re. 1 Re. 1
Basic earnings per equity share Rs. 4.68 Rs. 3.80
Diluted earnings per equity share* Rs. 4.65 Rs. 3.79
*Diluted EPS has been calculated after taking into account options granted to certain eligible employees as referred in note 21 below.
21) a) Employee Stock Option Scheme 2007
The Corporate Governance Committee of the Board of Directors of Marico Limited has granted Stock Options to
certain eligible employees pursuant to the Marico ‘Employees Stock Options Scheme 2007’. Each option represents 1
equity share in the Company. The Vesting period and the Exercise Period both range from 1 year to 5 years. Pursuant
to exercise of 5,073,850 (325,700) options during the year, the issued and subscribed share capital has increased by
Rs. 0.51 Crore (Rs. 0.03 Crore) to Rs. 61.44 Crore (Rs. 60.93 Crore) and Securities Premium account has increased by
Rs. 28.20 Crore (Rs. 1.80 Crore). The options outstanding as on the Balance sheet date correspond to about 0.39%
(1.28%) of the current paid up equity capital of the Company.
Number of options granted, exercised and forfeited March 31, 2011 March 31, 2010
Options outstanding at beginning of the year 7,816,800 8,339,600
Granted Nil 1,332,100
Less : Exercised 5,053,850 325,700
Forfeited / Lapsed 354,900 1,529,200
Options outstanding at the end of the year 2,388,050 7,816,800
The Company has applied the intrinsic value based method of accounting for determining compensation cost for its stock
based compensation plan and has accordingly accounted Rs. 0.04 Crore (Rs. 0.08 Crore) under the ‘intrinsic value’ method.
Had the Company considered ‘fair value’ method for accounting of compensation cost the Company’s net income and
Basic and Diluted earnings per share as reported would have reduced to the pro-forma amounts as indicated:
(Rs. Crore)
Particulars March 31, 2011 March 31, 2010
Net Profit after tax as reported 286.44 231.67
Less : Stock-based employee compensation expense 1.76 3.91
Adjusted pro-forma 284.68 227.76
Basic earnings per share as reported Rs. 4.68 Rs. 3.80
Pro-forma basic earnings per share Rs. 4.65 Rs. 3.74
Diluted earnings per share as reported Rs. 4.65 Rs. 3.79
Pro-forma diluted earnings per share Rs. 4.63 Rs. 3.72
b) The Corporate Governance Committee has granted stock appreciation rights to certain eligible employees pursuant to
the Company’s Employee Stock Appreciation Rights Scheme, 2011(“Scheme”) . The vesting period under the Scheme
is from March 28, 2011 to September 30, 2013. Under the Scheme, the respective employees are entitled to receive
excess of the maturity price over the grant price subject to fulfillment of certain conditions. The stock appreciation rights
equivalent to 2,874,000 shares were granted to employees which were outstanding as at the year end and difference
between the market price of Company’s shares as at the year end and the grant price is recognized over the vesting
period amounting to Rs. 0.02 Crore in the Profit and Loss account.

C O N S O L I D A T E D F I N A N C I A L S
67
NOTES TO ACCOUNTS TO THE CONSOLIDATED BALANCE SHEET AND PROFIT AND LOSS ACCOUNT
22) Segment Information
The Group regards business segment as the primary segment. The composition of this segment is given below.
Business segments Type of products and services
Consumer Products Coconut oils, other edible oils, hair oils and other hair care products, male grooming products, fabric care products, healthy foods, soaps, health care products, female beauty care products.
Others Skin care and Global ayurvedics (up to June 8, 2009)
a. “Consumer Products” segment comprises consumer product business of Marico Limited, Marico Bangladesh Limited,
MBL Industries Limited, Marico Middle East FZE, MEL Consumer Care SAE, Marico Egypt Industries Company, Egyptian
American Investment & Industrial Development Company, Wind Company, Marico South Africa Consumer Care (Pty)
Limited, Marico South Africa (Pty) Limited, CPF International (Pty) Limited, Marico Malaysia Sdn. Bhd, International
Consumer Prouducts, Beauté Cosmétique Societé Par Actions and Thuan Phat Foodstuff Joint Stock Company.
b. “Skin care” segment comprises operations of Kaya Limited, Kaya Middle East FZE, Kaya operations of Marico
Bangladesh Limited, Derma – Rx International Aesthetics Pte. Ltd., The DRx Clinic Pte. Ltd., The DRx Medispa Pte.
Ltd., DRx Investments Pte. Ltd. and DRx Aesthetics Sdn. Bhd.
c. “Global Ayurvedics” comprised the business of (Sundari LLC.) (up to June 8, 2009)
i) Primary segment information
(Rs. Crore)
Consumer Products
Others Total
Segment revenue 2,920.38(2,475.04)
207.93(185.72)
3,128.31(2,660.76)
Segment resultProfit / (loss)
380.30(337.91)
(32.49) (-)(18.12)
347.81 (319.79)
Unallocable expenses –
–
–
–
–
–
Unallocable income 2.85
(2.49)
Interest expenses 39.33
(25.69)
Interest income 16.21
(11.07)
Profit before tax, ‘Exceptional items’ and minority interest 327.52
(307.66)
Exceptional Items Income / (expense) (net) 56.65 –
(7.74) (-)(9.79)
48.91 (-)(9.79)
Profit before tax and minority interest 376.43
(297.87)
Taxation on the above 84.98
(64.33)
Net profit after tax and before minority interest 291.45
(233.54)
Minority interest in losses / (profits) of subsidiaries (5.01)
(-)(1.87)

C O N S O L I D A T E D F I N A N C I A L S
68
NOTES TO ACCOUNTS TO THE CONSOLIDATED BALANCE SHEET AND PROFIT AND LOSS ACCOUNT
Consumer Products
Others Total
Profit after taxation and minority interest 286.44
(231.67)
Other information
Segment assets 1,518.85
(1,046.78)
348.18
(174.24)
1,867.03
(1,221.02)
Unallocable assets 359.70
(304.98)
Total assets 2,226.73
(1,526.00)
Segment liabilities 367.02
(366.49)
120.23
(27.37)
487.25
(393.86)
Unallocable liabilities 824.00
(478.18)
Total liabilities 1,311.25
(872.04)
Capital expenditure 154.45
(73.13)
6.28
(27.93)
* 217.26
(101.06)
Depreciation, impairment and amortization 43.65
(42.97)
27.15
(17.09)
** 70.80
(60.06)
* excludes assets acquired on acquisition of new subsidiaries
** excludes provision for impairment of Rs. 21.62 Crore (Rs. Nil) reflected in “Exceptional items”
ii) Secondary Segment Information
The Group has identified geographical markets as the Secondary segment.
Geographical Segments Composition
Domestic All over India
International (others) Primarily Middle East, SAARC countries, Egypt, Malaysia,
South Africa, Singapore and Vietnam.
Domestic (Rs.Crore)
Others (Rs.Crore)
Total (Rs.Crore)
Revenue 2,290.69 (2,001.38)
837.62 (659.38)
3,128.31 (2,660.76)
Carrying amount of assets 1,261.92 (1,146.49)
964.82 (379.51)
2,226.73 (1,526.00)
Capital expenditure 140.96 (56.59)
76.31 (44.47)
217.26 (101.06)
iii) Notes to Segmental information:
a) Segment revenue and expense: Revenues and expenses directly attributable to segments are reported under each
reportable segment. Revenue and expenses which relate to Group as whole and are not allocable to a segment
on reasonable basis, have been disclosed under ‘Unallocable’.
b) Segment assets and liabilities: Segment assets include all operating assets used by a segment comprising intangibles,
fixed assets, inventories, debtors, cash and bank balances and loans and advances. Segment liabilities include all
operating liabilities of the segment comprising creditors and other liabilities. Investments, taxes and other assets
and liabilities which are not allocable to segment on reasonable basis, have been disclosed under ‘Unallocable’.

C O N S O L I D A T E D F I N A N C I A L S
69
23) Related Party Disclosures
Enterprise over which Key Managerial Personnel exercise significant influence:
The Bombay Oil Private Limited
(Rs. Crore)
March 31, 2011 March 31, 2010
Nature of transactions
Transactions during the year
1) Rent Paid 0.15 0.90
2) Payment made on behalf of the entity Nil 1.20
3) Recovery of payment made on behalf of the entity 1.20 Nil
Balances
1) Sundry Creditors 0.01 Nil
2) Loans and advances Nil 0.30
Key management personnel and their relatives:
i) Whole-time director: Harsh Mariwala, Chairman and Managing Director
(Rs. Crore)
Nature of transactions: March 31, 2011 March 31, 2010
Remuneration for the year 3.58 3.03
ii) Employee: Rishabh Mariwala, son of Harsh Mariwala
(Rs. Crore)
Nature of transactions: March 31, 2011 March 31, 2010
Remuneration for the year 0.13 0.11
24) Managerial Remuneration:
(Rs. Crore)
March 31, 2011 March 31, 2010
Payments and provisions on account of remuneration to Chairman and Managing Director included in the Profit and Loss account
Salary 2.26 1.96
- Contribution to provident and pension funds 0.26 0.23
- Other perquisites 0.09 0.08
- Annual performance incentives 0.97 0.76
3.58 3.03
Remuneration to non-whole time directors (including Sitting fees) 0.46 0.25
Notes:
1. The above remuneration to Chairman and Managing Director does not include contribution to Gratuity Fund and provision
for Leave encashment, as these are lump sum amounts for all relevant employees based on actuarial valuation.
2. Since no commission is payable during the year, computation of net profits for the year under section 198 of the
Companies Act, 1956 has not been given.
25) The Guidance Note on implementing AS 15, Employee benefits (revised 2005) issued by Accounting Standards Board (ASB)
states that benefits involving employer-established provident funds, which require interest shortfalls to be recompensed, are
to be considered as defined benefit plans. Pending the issuance of the guidance note from the Actuarial Society of India, the
Company’s actuary has expressed an inability to reliably measure provident fund liabilities. Accordingly, the Company has
accounted for the same as a defined contribution plan. However, as permitted by the circular number 2009/104919 issued
by the Employees’ Provident Fund Organization, the interest shortfall can be adjusted against the Reserve available with the
NOTES TO ACCOUNTS TO THE CONSOLIDATED BALANCE SHEET AND PROFIT AND LOSS ACCOUNT

C O N S O L I D A T E D F I N A N C I A L S
70
trust. Based on the unaudited financial statements of the fund as at March 31, 2011, the Reserve available with the fund are
adequate to cover interest shortfalls arising till the said date. Hence no provision for liability is required to be created on such
interest shortfall as on March 31, 2011.
26) a) Secured Debentures represents 300 8.25% Rated Taxable Redeemable Non-convertible Debentures of Face Value
Rs. 0.10 Crore each, aggregating to Rs. 30.00 Crore which were issued on May 8, 2009 and are redeemable at par after
3 years. As per the terms of the issue Put / Call option is available with the Investor / Company at the end of 2 years.
These debentures are listed on the National Stock Exchange.
b) During the year, on March 30, 2011, The Company has issued 500 10.05% Rated Taxable Unsecured Redeemable Non-
convertible Debentures of Face value of Rs. 0.10 Crore each aggregating to Rs. 50.00 Crore which are redeemable at
par after 30 months. These debentures have been listed on the National Stock Exchange after the Balance Sheet date.
27) During the year ended March 31, 2010, the Company had made a provision of Rs. 29.35 Crore towards 75% of possible
excise duty obligation which may arise in the event of unfavorable outcome of the matter in respect of coconut oil packed in
container size up to 200ml and cleared on and after June 3, 2009, which is being contested by the Company. Based on the
facts of the case and the legal opinion obtained in this regard, the Company had made an assessment that the probability
of success in the matter is more likely than not. In terms of Accounting Standard (AS) 29 “Provisions, Contingent Liabilities
and Contingent Assets”, the possible obligation on this account could be in the nature of contingent liabilities, which need
not be provided for in the accounts. Pending outcome of the matter, the Company had made the aforesaid provision in the
accounts for the year ended March 31, 2010. The Management had, while finalizing financial results for the quarters ended
June 30, 2010, September 30, 2010 and December 31, 2010 continued to make provision on the said basis and had provided
Rs. 26.61 Crore for the first nine months ended December 31, 2010.
The Auditors had qualified their audit report for the year ended March 31, 2010 and the limited review reports for the said
quarters to the effect that the said provisioning was not in accordance with the requirements of AS 29.
As at March 31, 2011, the Company has reviewed the matter again and has taken a legal opinion, which has reaffirmed the
earlier assessment that the probability of success in the matter is more likely than not. Considering the continued strength of
the Company’s case, the Company has, during the year, reversed the entire provision of Rs. 29.35 Crore and Rs. 26.61 Crore
made during the year ended March 31, 2010 and during the nine months ended December 31, 2010 respectively, having
regard to the fact that the said provision was not in accordance with the requirements of AS 29. The reversal of the provision
pertaining to the year ended March 31, 2010 aggregating to Rs. 29.35 Crore has been included under the head “Exceptional
Items” in the Profit and Loss account. Further, deferred tax asset of Rs. 9.75 Crore created during the year ended March
31, 2010 has been reversed and included in Deferred Tax charge for the year in the Profit and Loss account. Provisions of
Rs. 26.61 Crore made in the first nine months ended December 31, 2010 were reversed in the quarter ended March 31, 2011,
which has no impact for the results of the full year ended March 31, 2011. Consequentially, the possible excise duty obligation
of Rs. 88.97 Crore for clearances made after June 03, 2009 till March 31, 2011 and Rs. 121.77 Crore for clearances made prior
to June 03, 2009 has been disclosed as Contingent Liability to the extent of the time horizon covered by show-cause notices
issued by the excise department within the normal period of one year (from the date of clearance) under the excise laws.
Had the Company continued to make provisions on the same basis as in the previous year, the Profit before tax and Exceptional
Items for the year would have been lower by Rs.37.38 Crore. Further, balances as at March 31, 2011 in Deferred Tax Asset
and Provisions would have been higher by Rs. 21.65 Crore and Rs. 66.73 Crore respectively and balance in Reserve and
Surplus would have been lower by Rs. 45.08 Crore.
The Company will continue to review this matter during the coming accounting periods based on the developments on the
outcomes in the pending cases and the legal advice that it may receive from time to time.
NOTES TO ACCOUNTS TO THE CONSOLIDATED BALANCE SHEET AND PROFIT AND LOSS ACCOUNT

C O N S O L I D A T E D F I N A N C I A L S
71
28) Other Provisions in schedule ‘M’ includes:
(Rs. Crore)
Lease termination
cost*
Employees termination
cost*
Customers Refunds*
Site restoration
Cost**
Contingent Consideration
(Refer note 18)
Total
Opening Balance 2.44 0.27 0.82 1.39 Nil 4.92
Add: Provisions made Nil Nil Nil Nil 43.79 43.79
Less: Provisions utilized/
Reversed 2.22 0.27 0.82 Nil Nil 3.31
Closing Balance 0.22 Nil Nil 1.39 43.79 45.40
Notes:
* Above provisions, represent estimates made for probable liability arising on account of closure of Kaya Life operations
and close down of seven clinics of Kaya Skin. Provision for lease termination cost is towards locking period rent which
is recognized to the extent its more than probable that outflow of resources will be required to settle the transactions.
The balance amount is treated as contingent in nature.
** A provision for site restoration cost is recognized for the estimates made for probable liability towards the restoration
of these premises at the end of lease period.
29) Minority share in accumulated profits of Rs. 0.49 Crore represents adjustment relating to the earlier year.
30) (a) The figures in brackets represent those of the previous year.
(b) The figures for the previous year have been restated / regrouped wherever necessary to conform to current period’s
classification.
Signatures to Schedules A to R
NOTES TO ACCOUNTS TO THE CONSOLIDATED BALANCE SHEET AND PROFIT AND LOSS ACCOUNT
As per our attached report of even date
For Price Waterhouse For and on behalf of the Board of Directors
Chartered Accountants HARSH MARIWALA Chairman and Managing Director
Firm Registration No. 301112E NIKHIL KHATTAU Director and Chairman of Audit Committee
MILIND SARWATE Group Chief Financial Officer and
VILAS Y. RANE Chief Human Resource Officer
Partner HEMANGI WADKAR Company Secretary & Compliance Officer
Membership No. F-33220
Place : Mumbai Place : Mumbai
Date : May 2, 2011 Date : May 2, 2011

M A R I C O L I M I T E D
72
DIRECTORS’ REPORT
To the Members
Your Board of Directors (‘Board’) is pleased to present the Twenty Third Annual Report of your Company, Marico Limited, for the
year ended March 31, 2011 (‘the year under review’, ‘the year’ or ‘FY11’).
In line with the requirements of the Listing Agreement with the Bombay Stock Exchange and National Stock Exchange, your Company
has been reporting consolidated results – taking into account the results of its subsidiaries. This Discussion therefore covers the
financial results and other developments during April 2010 – March 2011 in respect of Marico Consolidated comprising– Domestic
Consumer Products Business under Marico Limited (Marico) in India, International Consumer Products Business comprising
exports from Marico and operations of its overseas subsidiaries and the Solutions Business of Kaya in India and overseas. The
consolidated entity has been referred to as ‘Marico’ or ‘Group’ or ‘Your Group’ in this discussion.
FINANCIAL RESULTS – AN OVERVIEW
Rs. CroreYear ended March 31,
2011 2010
Consolidated Summary Financials for the Group
Sales and Services 3128.3 2660.8
Profit before Tax 376.4 297.9
Profit after Tax 286.4 231.7
Marico Limited – financials
Sales and Services 2346.9 2024.3
Profit before Tax 374.6 292.6
Less: Provision for Tax for the current year 59.2 57.5
Profit after Tax for the current year 315.3 235.0
Add : Surplus brought forward 382.61 233.1
Profit available for Appropriation 697.9 468.1
Appropriations :
Distribution to shareholders 40.5 40.2
Tax on dividend 6.7 6.8
47.2 47.0
Transfer to General Reserve 31.5 23.5
Debenture Redemption Reserve 16.7 15.0
Surplus carried forward 602.5 382.6
Total 697.9 468.1
DISTRIBUTION TO EQUITY SHAREHOLDERS
Your Company’s Distribution policy has aimed at sharing your Company’s prosperity with its shareholders, through a formal
earmarking / disbursement of profits to shareholders.
Marico has identified acquisitions as one of its avenues to pursue growth. Since April 2005, the Group has consummated 11
acquisitions including two each in India, Bangladesh, Egypt and South Africa and one each in Malaysia, Singapore and Vietnam. As
part of its growth agenda, Marico would continue to explore new acquisition opportunities. These would call for additional funding.
As indicated last year, your Company intends to be more conservative in the quantum of dividend payout in the near future.
Your Company’s distribution to equity shareholders during FY 11 comprised the following:
First interim dividend of 30% on the equity base of Rs 61.41 Crore
Second interim dividend of 36% on the equity base of Rs. 61.45 Crore
The total equity dividend for FY11 at 66.0% is thus at par with the dividend paid during FY10. The total dividend (including dividend
tax) was Rs. 47.2 crore (about 16.5 % of the group PAT).

M A R I C O L I M I T E D
73
MANAGEMENT DISCUSSION AND ANALYSIS
An Annexure to this Report contains a detailed Management Discussion and Analysis, which, inter alia, covers the following:
• Industrystructureanddevelopment
• OpportunitiesandThreats
• RisksandConcerns
• Internalcontrolsystemsandtheiradequacy
• Discussiononfinancialandoperationalperformance
• Segment-wiseperformance
• Outlook
In addition, a Review of Operations of your Company has been given in this report.
REVIEW OF OPERATIONS
Marico achieved a strong growth of 18% in revenue over the previous year and registered a top line of Rs 3128 crores during
FY11. A substantial part of the growth was organic growth, with 12% volume led growth while the remaining came from price
increasesandsalesmix.Thetoplineincreasewasaccompaniedbyabottom-linegrowthof24%,afterconsideringtheimpact
ofextra-ordinary /exceptional items.ProfitAfterTax (PAT) includingexceptional /extra-ordinary itemsduring theyearwasat
Rs 286.4 crore as against Rs. 232 crore in FY10. The financials for FY11 include certain exceptional items of Rs 48.9 crores (Rs 29.4
Cr on account of write back of provision towards contingent excise duty liability provided in FY10, Rs. 50 Cr on account of profit on
sale of Sweekar intellectual property rights, Rs. 7.7 Cr on account of impairment of clinic assets in Kaya Limited and Rs 22.7 Cr on
account of impairment of intangibles related to Fiancée business) while the financials of FY 10 include certain exceptional items .
The exceptional items have been explained in detail in the Management Discussion and Analysis, which is an integral part of this
Report. Had it not been for these items, the PAT for FY11 would have been Rs. 256.3 Cr, a growth of 6% over FY10 (extraordinary
items excluded from the comparable figure in the previous year).
During the year, Marico extended its record of year on year quarterly growth.
Q4FY11 was on a Y-o-Y basis:
• The42ndconsecutiveQuarterofgrowthinTurnoverand
• The46thconsecutiveQuarterofgrowthinProfits
The company has demonstrated steady growth on both the top line and bottom line. Over the last 5 years, they have grown at a
Compounded Annual Growth Rate of 22 % and 27% respectively
Consumer Products Business: India
Parachute, Marico’s flagship brand, continued to expand its franchise during the year. Parachute coconut oil in rigid packs, the
focus part of its portfolio, grew by 8% in volume as compared to FY10. Coconut oil category as a whole grew by 5% in volume
as compared to FY10. The volume growth have been lower than expected due to steep rise in the input prices due to which the
CompanytookthepricesupoftheProducts.Maricooffersitsconsumersabasketofvalueaddedhairoilsfortheirpre-wash
and post wash hair conditioning, nourishment and grooming needs (Key brands being Parachute Advansed hair oil, Parachute
Advansed Cooling oil, Parachute Jasmine non sticky hair oil, Nihar Naturals perfumed hair oil, Hair & Care nourishing non sticky
hair oil, Hair & Care Almond Gold and Shanti Badam Amla hair oil). During the year, all Marico’s hair oil brands recorded healthy
growth and the portfolio as a whole grew by about 23% in volume terms over FY10. Super Premium edible oils brand Saffola grew
by about 16% in volume terms compared to FY10. These growths were aided by introduction of new products.
Marico has been constantly investing in a healthy pipeline of new products. During the year your company launched new prototypes.
These included variants of Saffola Rice Arise (Basmati and Long grain) – lower GI rice, Parachute Advansed Ayurvedic hair fall
solution and Parachute Advansed Body Lotion.
DIRECTORS’ REPORT

M A R I C O L I M I T E D
74
International FMCG Business
From a single digit share in FY05, about 23% of the group’s turnover is now contributed by Marico’s International FMCG business.
Its key geographical presence is in Bangladesh, MENA (Middle East and North Africa), Malaysia, South Africa and Vietnam.
Marico’s South African subsidiary acquired the healthcare brand “Ingwe”. Its product portfolio complements the existing healthcare
brand Hercules. In February 2011, Marico strengthened its entry into the South East Asian region through the acquisition of
International Consumer Products in Vietnam.
During FY11, the company’s international business recorded a turnover growth of 22% over FY10. Much of this growth was derived
from consumer franchise expansion – about 19%, accompanied by price led growth of 8%. However, this was impacted adversely
by forex appreciation of 5%. Political disturbance in the MENA region adversely effected the growth of the international business
inQ4ofFY11.
Kaya
Kaya is the first organized player in the segment of cosmetic dermatology and now enjoys a large first mover advantage in the
segment in India. It now offers its technology led cosmetic dermatological services through 103 clinics: 81 in India across 26 cities
and 16 in the Middle East, 2 in Dhaka and 4 clinics through Derma Rx in Singapore and Malaysia.
During the year Kaya acquired Singapore based skin care solutions business Derma Rx. This gave Kaya an access to an advanced
skin care market in terms of a wide bouquet of products and technology capable of being transported across geographies.
Kaya’s offering are in the nature of discretionary spends. We had seen a down turn in Kaya’s performance in FY10 due to some
external and internal factors. While external macro environment is picking up we had identified customer retention and share of
product sales as key issues to be addressed internally during FY11. There were efforts put to tackle these issues. Kaya has seen
a reasonable success as a result of these measures taken.
OuroverallexperiencewithKayaSkincarebusinesshasbeenencouraging.Thisisafairlyyoungbusiness-only8yearssinceits
inception. We have already experienced, in a few accounting periods, profitability at both clinic level and regional level. Marico’s
belief in the Kaya Business model is therefore intact, especially as we perceive the long term opportunity in skin care solutions to
be significant.
OTHER CORPORATE DEVELOPMENTS
Acquisition of Derma Rx
Kaya Limited, Marico’s wholly owned subsidiary delivering skin care solutions in India acquired the cosmetic dermatological
business of the Singapore based Derma Rx Asia Pacific Pte Ltd (DRx AP). This acquisition provides Kaya access to a range
of highly efficacious skin care products. These products are capable of being transported across geographies. Some of these
products have already been introduced in India and are in the process of being introduced in the Middle East. We believe that it
will help in increasing the share of products to total revenue of Kaya.
Acquisition of the Brand “Ingwe”
Marico, through its wholly owned subsidiary, Marico South Africa (Pty) Ltd acquired the brand “Ingwe” from South Africa based
Guideline Trading Company. The range comprises immuno boosters focused on the ethnic consumer in South Africa. The acquisition
of Ingwe brings in a range of products that complements that of MSA’s brand Hercules.
Acquisition of the International Consumer Products (ICP)
Marico strengthened its foot hold in South East Asia by taking up 85% equity in International Consumer Products Corporation (ICP),
oneofthemostsuccessfulVietnameseFMCGcompanies.ICPwasfounded,in2001,byDr.PhanQuocCongandhispartner.Its
brands(X-Men,L’Ovite,ThuanPhatandothers)haveasignificantpresenceacrosspersonalcare,beautycosmeticsandsauces/
condimentscategories.X-MenisaleadingplayerinthemalegroomingsegmentinVietnamandisthe2ndMostTrustedPersonal
Care brand in the country. With over 35% market share, it leads the men’s shampoo category. L’Ovite, the company’s premium
cosmetics brand ranks amongst the top 5 premium cosmetics brands in Vietnam.
DIRECTORS’ REPORT

M A R I C O L I M I T E D
75
Divestment of Brand “Sweekar”
Marico divested its refined sunflower oil brand “Sweekar” to Cargill India private Limited (Cargill). This is in line with Company’s
focus towards wellness platform through Saffola and thus focusing on healthy edible oils and functional foods.
Marico Employee Stock Option Scheme 2007
In pursuance of shareholders approval obtained on November 24, 2006, your Company formulated and implemented an Employee
Stock Options Scheme (the Scheme) for grant of Employee Stock Options (ESOS) to certain employees of the Company and its
subsidiaries. The Corporate Governance Committee (‘Committee’) of the Board of Directors of your Company is entrusted with
the responsibility of administering the Scheme and in pursuance thereof, the Committee has granted 1,13,76,300 stock options
(as at March 31, 2011) comprising about 1.85% of the current paid up equity capital of the Company. Additional information on
ESOS as required by Securities and Exchange Board of India (Employees Stock Option Scheme and Employees Stock Purchase
Scheme) Guidelines, 1999 is annexed and forms part of this report.
NoneoftheNon-executiveDirectors(includingIndependentDirectors)havereceivedstockoptionsinpursuanceoftheabove
Scheme. Likewise, no employee has been granted stock options, during the year equal to or exceeding 0.5% of the issued capital
(excluding outstanding warrants and conversions) of the Company at the time of grant.
The Company’s Auditors, M/s. Price Waterhouse, have certified that the Scheme has been implemented in accordance with the
SEBIGuidelinesandtheresolutionpassedbythemembersattheExtra-OrdinaryGeneralMeetingheldonNovember24,2006.
Marico Employees Stock Appreciation Rights Plan, 2011
During the financial year under review, the Board of Directors of your Company implemented a long term incentive plan namely,
Marico Stock Appreciation Rights Plan, 2011 (‘STAR Plan’) for the welfare of its employees and those of its subsidiaries.
The purposes envisaged in the STAR Plan and the various schemes thereunder are:
a. To promote amongst Members the desired behavior for meeting long term business objectives of Marico Group
b. To enable retention of desired Members in Marico Group
c. To enable attraction of talent especially to challenging roles
d. To provide a wealth building dimension to the remuneration structure
The Corporate Governance Committee of the Board of Directors has granted stock appreciation rights to certain eligible employees
pursuant to the Company’s Employee Stock Appreciation Rights Scheme, 2011(“Scheme”), which is notified under the STAR
Plan . The vesting period under the Scheme is from March 28, 2011 to September 30, 2013. Under the Scheme, the respective
employees are entitled to receive excess of the maturity price over the grant price subject to fulfilment of certain conditions. The
stock appreciation rights equivalent to 2,874,000 shares were granted to employees which were outstanding as on March 31, 2011.
Application to the Central Government for exemption from including Balance Sheets of the Subsidiary Companies
Your Company had applied to the Central Government under Section 212(8) of the Companies Act seeking an exemption from
attaching copies of the Balance Sheet, Profit and Loss Accounts, Directors’ Report and Auditors’ Report of its subsidiary companies.
With reference to the application, the Ministry of Corporate Affairs has granted a general exemption subject to fulfillment of certain
conditions.
In terms of the said exemption granted by the Ministry of Corporate Affairs; copies of the Balance Sheet, Profit and Loss Account,
Report of the Board of Directors and the Report of the Auditors of the Subsidiary Companies have not been attached to the
Balance Sheet of the Company. However, the statement required under section 212 of the Companies Act, 1956 is attached. The
Company will make these documents / details available upon request by any member of the Company interested in obtaining the
same and same would also be made available on its website. The Consolidated Financial Statements prepared by the Company
pursuanttoAccountingStandardAS-21asprescribedbytheCompanies(AccountingStandards)Rules,2006,includefinancial
information of its subsidiaries.
DIRECTORS’ REPORT

M A R I C O L I M I T E D
76
PUBLIC DEPOSITS
There were no outstanding Public deposits at the end of this or the previous year. The Company did not accept any public deposits
during the year.
DIRECTORS’ RESPONSIBILITY STATEMENT
Pursuant to Section 217(2AA) of the Companies Act, 1956 (the Act) amended by the Companies (Amendment) Act, 2000, the
Directors confirm that:
In preparation of the Annual Accounts of your Company, the Accounting Standards, laid down by the Institute of Chartered
Accountants of India from time to time, have been followed.
Appropriate accounting policies have been selected and applied consistently, and reasonable and prudent judgement and estimates
have been made so as to ensure that the accounts give a true and fair view of the state of affairs of your Company as at March
31, 2011 and the profits of your Company for the year ended March 31, 2011.
Proper and sufficient care has been taken for maintenance of appropriate accounting records in accordance with the provisions
of the Act for safeguarding the assets of your Company and for preventing and detecting frauds and other irregularities.
The annual accounts have been prepared on a going concern basis.
The observation(s) and qualification(s) of the Auditors in their report to the Members have been adequately dealt with in the relevant
notes to the accounts. Hence no additional explanation is considered necessary.
CORPORATE GOVERNANCE
A report on Corporate Governance has been provided as a separate part of this Report.
GROUP
Pursuant to intimation from Promoters of your Company, the names of Promoters and companies comprising ‘Group’ as defined
in the Monopolies and Restrictive Trade Practices Act, 1969, have been disclosed in the Annual Report of your Company for the
purpose of Regulation 3(1)(e) of the SEBI (Substantial Acquisition of Shares and Takeovers) Regulations, 1997.
DIRECTORS
Directors retiring by rotation
Mr. Nikhil Khattau and Ms. Hema Ravichandar, Directors of the Company, retire by rotation as per Section 256 of the Companies
Act,1956andbeingeligibleofferthemselvesforre-appointment.
Changes in the Board of Directors
Mr.B.S.NageshwasappointedwitheffectfromJuly16,2010asaNon-executiveandIndependentDirectorincasualvacancy
created by resignation of Director, Mr. Bipin Shah. Mr. Nagesh would hold office as Director of the Company up to the conclusion
oftheAnnualGeneralMeetingtobeheldfortheFinancialYear2011-12.
Mr.HarshMariwalatheManagingDirectorofyourCompanywasre-appointedastheManagingDirectorbytheBoardofDirectors
at its meeting held on January 27, 2011 for a further period of 3 years with effect from April 1, 2011, subject to the approval of the
Shareholders at the ensuing Annual General Meeting.
Change in the Company Secretary & Compliance Officer
Ms Rachana Lodaya ceased to be the Company Secretary & Compliance Officer with effect from October 27, 2010 and Ms. Hemangi
Wadkar was appointed as the Company Secretary & Compliance Officer of the Company in her place with effect from that date.
ADDITIONAL STATUTORY INFORMATION
Information under Section 217(1)(e) of the Act read with the Companies (Disclosure of Particulars in the Report of the Board of
Directors) Rules, 1988 is annexed and forms part of this Report. Information pursuant to Section 217(2A) of the Act read with the
Companies (Particulars of Employees) Rules, 1975, as amended by the Companies (Particulars of Employees) Amendment Rules,
DIRECTORS’ REPORT

M A R I C O L I M I T E D
77
DIRECTORS’ REPORTDIRECTORS’ REPORT
1999 forms part of this Report. Although in accordance with the provisions of Section 219(1)(b)(iv) of the Act such information has
been excluded from the Report and Accounts sent to the Members, any member desirous of obtaining this information may write
to the Company Secretary at the Registered Office of the Company.
AUDITORS
M/s. Price Waterhouse, Chartered Accountants and Statutory Auditors of the Company retire at the ensuing Annual General Meeting
andhaveconfirmedtheireligibilityforre-appointment.
Aneja Associates, a Chartered Accountant Firm, has been associated with your Company as its internal auditor. They have been
partneringyourCompanyintheareaofriskmanagementandinternalcontrolsystems.YourCompanyhasre-appointedAneja
Associatesasitsinternalauditorfortheyear2010-11.
ACKNOWLEDGEMENT
The Board takes this opportunity to thank all its employees for their dedicated service and firm commitment to the goals of the
Company. The Board also wishes to place on record its sincere appreciation for the wholehearted support received from shareholders,
distributors, bankers and all other business associates, and from the neighbourhood communities of the various Marico locations.
We look forward to continued support of all these partners in progress.
On behalf of the Board of Directors
Place : Mumbai HARSH MARIWALA
Date : May 2, 2011 Chairman and Managing Director

M A R I C O L I M I T E D
78
ANNExURE TO THE DIRECTORS’ REPORT
Disclosure of Particulars with respect to Conservation of Energy, Technology Absorption and Foreign Exchange earnings and outgo
as required under the Companies (Disclosure of Particulars in the Report of Board of Directors) Rules, 1988.
A. Conservation of Energy
Marico continued to emphasize on the conservation and optimal utilization of energy in every manufacturing unit of the
Company. The energy conservation measures implemented during FY 11 are listed below:
• Installations of VFD at turn table and shrink tunnels to lower the power consumption.
• Re-engineeringofairdistributionsystemtoavoidlossesandoptimizationofcompressorusesenablingpowersaving.
• Replacement of 250w mercury lamps with 80w & 36w CFL lamps thus reducing the overall power consumption for
illumination in plant.
• Conversion of DC motors to AC motors in all shrink tunnels which reduced power consumption.
• Re-designingofbyproductconveyingsystembyeliminatingoneoftheconveyorreducingpowerconsumption.
• Elimination of cooling fans from shrink tunnels thus eliminating 4 cooling fans from system.
• Replacement of FO with Diesel resulting in reduction of SFC.
• Reduction in SPC through six sigma project by lowering watts/bottle at one of the blow molding unit.
• Modification of compressor system by changing the pulley to improve the efficiency by 10 % at one of the blow molding
unit.
• Installation of flash steam recovery system, enabling the increase of feed water temperature by 10oC, there by reducing
the FO consumption and thus carbon emission.
• Optimized the oil heating in the pre filtration sump, thus reducing the FO consumption and thus carbon emission.
• Re aligned and modified the steam distribution system and condensate recovery system, there by reducing transmission
losses of steam supply and increasing the condensate recovery by 5%.
• Reengineered the copra conditioner designs for increased heat transfer efficiency, which will reduce the need for higher
cooking and in turn save FO.
• Optimized the copra particle size and process parameters enabled to reduce the heating area by 15%, inturn resulted
in FO savings.
• Automated CC bit conveyor and Cake overflow conveyor enabling optimized usage, thus saving power.
• Through integration of conveying system, removed copra parallel conveyor enabling power saving.
• Redesigned the raw material handling system and eliminated belt conveyor resulting in power savings.
• Roof replaced with adequate translucent sheet in process area enabling utilizing natural light during day time.
• Replaced 250 KW motor with 185 KW motor for first stage expeller, 72000 units of power saved.
• ReplacedhighpressuremercuryvapourlampswithCFLlampsinproductionarea-13699unitsofpowersaved.
• Eliminatedone2.2KWexpellerblower-10560unitsofpowersaved.
• Thru be green drive Pondy plant
o Saved 35904 KWh of Power
o Saved 50 KL of fuel
o 33.36 T Co2 emission reduced
• Saved 3055 KL of water.
• AtJalgaon-Earlierwewereusingatunnelconsuming18.182KWofpowerwhichisveryhigh.ReplacedtheTunnelwith
another one consuming only 8 KW of power, hence saving 10.182 KW of Energy.

M A R I C O L I M I T E D
79
ANNExURE TO THE DIRECTORS’ REPORT
• InAcidOilPlantatJalgaon-A,B,Cvesselbottomwashaving2’’linewhichhad11bends.Andsludgetransfertime
from Vessel to 4th pond was 16hr/batch, No. of batches in a month = 50 , electricity consumption = 3200 KWA
• AtJalgaon-WewereusingCFL32lights32KW-Used6Tubelightsof23Wattsinsteadofthese32CFLs.
Marico continued its journey towards effective utilization of energy. Significant reduction in power consumption has been
achieved and rationalization efforts will continue.
The details of total energy consumption and energy consumption per unit of production are given in Enclosure ‘A’.
B. Technology Absorption
I. Research and Development (R&D)
1. Specific areas in which R & D was carried out by your Company:
Innovation is one of the key pivots for growth at Marico. Over the years, there has been substantial progress
made to understand the consumer needs gap, sensorial delights of the products and the consumer differentiable
functional benefits and, finally blending these to offer the products with consumer delight and value for money.
Theprogressmade indevelopingconsumer-product interactionshashelpedsignificantly togenerate theapt
combinations of different sensories. The consumer relevant clinical protocols created in understanding efficacy
of the products has enabled in creation of unique products. The continuous benchmarking of competition and
its products has created the benchmarks which helped to make differentiated products. Along with the product
development, the following research areas were explored to provide the right science base for the products and
regulatory environment.
• Basic research programs to understand physiology of hair and skin.
• The new active systems based on the principles of Ayurveda.
• New Active systems based on local traditional herbs and natural products from different geographies – Middle
east, Egypt, Bangladesh, South Africa.
• Developing newer formats and platforms for hair care and styling products to suit needs in various IBG
countries–(hairstyling-waxes,clays,watergels,mousse,etc.andhaircare/grooming–serums,aerosol,
atomizers etc)
• Creating a knowledge base on food nutrition and lifestyle diseases.
• Informationsharingprogramswithdoctorsforhairoilingandheartcare.
• Newdesigntechniquesbasedonsixsigmaforcreatingformulations.
• Collaboratewith external partners-Academic institutes, researchcenters, International testing labsand
suppliers – for development of new technologies.
• CollaboratingwithscientistsofreputeandfunctionalexpertsforupdatingthesciencebasewithCompany.
• Havingaresearchadvisorycommitteeofdomainexpertswhocanprovidedirectiontobasicscienceprogram.
• Havingarigorousproductintegritysystemwhichcanensurethattheproductdevelopedinadherenceto
the regulatory frameworks of the country (and countries within the IBG domain)
2. Benefits derived as the result of the above efforts:
New SKUs were developed under the various categories in which Marico operates.
A few domestic launches include:
• ParachuteAdvansedAyurvedicHairoil
• ParachuteAdvansedbodylotion

M A R I C O L I M I T E D
80
• NiharNaturalsAlmondHairoil
• Parachuteadvansedcoolingoil(improvedsensory)
• Saffolaoats
• AriseBasmatiandlonggrainrice
International business group launched the following products across geographies:
• BurgundyHairColor–HairCodeBangladesh
• ChocolateFlavoredCastorOil–HerculesSouthAfrica
• Re-engineeringofHairCodecreamsforgreatersensoryandefficacy–Egypt
• Re-launchofCode10gelandcreamsaftertransferoftechnology(manufacturingofproductandpackaging)
to new vendors and in new smaller skus
Kaya too launched new products and services this year which include:
• IndialaunchofDermaRXproducts
o Antox Vit C formula
o Blemish Control Formula
o Comedone Control Serum
o Sweat proof sunscreen SPF 30
• LaunchofAquaRadianceservicesbasedontheinnovativeJetPeelplatform
A lot of work has been directed towards the optimization of formulations and also packaging options to deliver
the enhanced primary features. These were done without changing the benefit and aesthetics delivery. This has
resulted in good amount of savings.
Major emphasis was also placed on gearing up the organization to face the dynamic, rapidly changing regulatory
environment. The experts from Marico served on many committees which were enacting the new food and cosmetic
laws. This was initiated to ensure that Marico has freedom to operate in the categories of the interest without any
compromise on regulatory laws.
3. Future Plan of Action:
Your Company’s R&D will work towards continuous innovation in process, product & packaging technology to
offer consumers value for money with delightful new product concepts, sensorial and product efficacy.
4. Expenditure on R & D:
(Rs. Crore)
2010-11 2009-10
a) Capital 17.70 0.1
b) Recurring 7.53 7.5
Total 25.23 7.6
c) Total R & D expenditure as % to Sales & Services 1.08 0.4
d) Total R & D expenditure as % to PBT 9.43 2.6
ANNExURE TO THE DIRECTORS’ REPORT

M A R I C O L I M I T E D
81
ANNExURE TO THE DIRECTORS’ REPORT
II. Technology absorption, adaptation and innovation
1. Efforts, in brief, made towards technology absorption, adoption and innovation and benefits derived as a result
of the same:
Various collaborations with academic institutions were initiated to understand the skin and hair biology. These
programs have helped in understanding the science behind many product efficacies. A few technologies were
developed within R & D were, like low GI process for basmati rice, a natural based synergistic active system for
hair fall, a functional body lotion, Henna colored hair dye, Innovative use of the Jet Peel technology to increase
penetration of skin care actives. There has been impetus to scout for technologies available with the suppliers/
specialty chemical manufacturers/collaborators to improve the efficacy of the products to deliver best value for
money to consumers.
2. Imported technology (imported during the last 5 years reckoned from the beginning of this financial year):
Not Applicable
C. Foreign Exchange Earnings and Outgo
ThedetailsoftotalexchangeusedandearnedareprovidedinScheduleQofNotestotheAccountsofMaricoLimited.
On behalf of the Board of Directors
Place : Mumbai HARSH MARIWALA
Date : May 2, 2011 Chairman and Managing Director
AUDITORS’ CERTIFICATE REGARDING COMPLIANCE OF CONDITIONS OF CORPORATE GOVERNANCE
To
The Members of Marico Limited
We have examined the compliance of conditions of Corporate Governance by Marico Limited, for the year ended March 31, 2011, as stipulated in Clause 49 of the Listing Agreement of the said Company with stock exchanges in India.
The compliance of conditions of Corporate Governance is the responsibility of the Company’s management. Our examination was carried out in accordance with the Guidance Note on Certification of Corporate Governance (as stipulated in Clause 49 of the Listing Agreement), issued by the Institute of Chartered Accountants of India and was limited to procedures and implementation thereof, adopted by the Company for ensuring the compliance of the conditions of Corporate Governance. It is neither an audit nor an expression of opinion on the financial statements of the Company.
In our opinion and to the best of our information and according to the explanations given to us, we certify that the Company has complied with the conditions of Corporate Governance as stipulated in the above mentioned Listing Agreement.
We state that such compliance is neither an assurance as to the future viability of the Company nor the efficiency or effectiveness
with which the management has conducted the affairs of the Company.
For Price Waterhouse. Chartered Accountants Firm Registration Number: 301112E
Vilas Y. Rane Partner MembershipNo:F-33220
Address: 252 Veer Savarkar MargPlace: Mumbai Shivaji Park, Dadar (W)Date: May 2, 2011 Mumbai – 400 028

M A R I C O L I M I T E D
82
ANNExURE TO THE DIRECTORS’ REPORT 2011
Disclosure pursuant to the provisions of the Securities and Exchange Board of India (Employee Stock Option Scheme and Employee
Stock Purchase Scheme) Guidelines, 1999
Marico Employees Stock Option Scheme 2007 (ESOS 2007)
a) Options granted (as at March 31, 2011) 11,376,300optionsaggregatingtoabout1.85%ofthepaid-upequity
capital of the Company (options, net of lapsed/forfeited/exercised as
at March 31, 2011: 23,88,050 options aggregating to about 0.39% of
thepaid-upcapitaloftheCompany)
The Exercise Price of the options shall be lower of the following:b) The pricing formula
i) Average of the closing price for last 21 (twenty one) trading
session(s) on National Stock Exchange (NSE) prior to the date on
which the Corporate Governance Committee, grants the specific
number of options to the employees,
Or
ii) The closing price for the last session on National Stock Exchange
(NSE) prior to the date on which the Corporate Governance
Committee, grants the specific number of options to the
employees.
c) Options vested (as at March 31, 2011) 63,95,835
d) Options exercised (as at March 31, 2011) 53,99,550
e) The total number of shares arising as a result of
exercising of option (as at March 31, 2011)
53,99,550
f) Options lapsed/forefeited (as at March 31, 2011) 35,88,700
g) Variation of terms of options -N.A.-
h) Money realised by exercise of options (as at March
31, 2011)
Rs. 28,59,19,620
i) Total number of options in force (as at March 31,
2011)
23,49,185
j) Employee wise details of options granted to : (as
at March 31, 2011)
i) Senior Managerial Personnel Asummary•ofoptionsgranted toseniormanagerialpersonnelare
as under :
No. of employees covered – 63 (Sixty Three)
No. of options granted to such personnel – 65,05,935 (Sixty Five Lac
Five Thousand and Nine Hundred and Thirty Five Only)
•Onlysummarygivenduetosensitivenatureofinformation
ii) any other employee who receives a grant in any
one year of options amounting to 5% or more of
option granted during the year
-N.A.-
iii) identified employees who were granted option,
during any one year, equal to or exceeding 1% of
the issued capital (excluding outstanding warrants
and conversions) of the company at the time of
grant
-N.A.-
k) Diluted Earnings per Share (EPS) pursuant to
issue of shares on exercise of option calculated
in accordance with the Accounting Standard (AS)
20’ Earnings per Share
Rs. 5.76

M A R I C O L I M I T E D
83
ANNExURE TO THE DIRECTORS’ REPORT 2011
l) i) Method of calculating employee compensation
cost
The Company has calculated the employee compensation cost using
the intrinsic value method of accounting for the options granted under
the Scheme
ii) Difference between the employee compensation
cost so computed at (i) above and the employee
compensation cost that shall have been recognised
if it had used the fair value of the Options
Rs. 1.73 Crores
iii) The impact of this difference on the profits and on
EPS of the Company
Had the Company considered ‘fair value’ method then the additional
employee compensation cost would be Rs. 1.77 crore the Profit Before
Tax would be lower by the same amount and Earning Per Share by
Rs. 5.73
m) Weighted –average exercise price and weighted
average fair values of options (to be disclosed
separately for options whose exercise price either
equals or exceeds or is less than the market price
of the stock)
Weighted average Exercise Price : Rs. 74.17
Weighted average Fair Value of Option : Rs. 24.9
n) Description of method and significant assumptions
used during the year to estimate the fair values of
options
Intrinsic Value Method
i) risk – free interest rate
ii) expected life of options
iii) expected volatility
iv) expected dividends
v) Closing Market price of share on date of option
grant

M A R I C O L I M I T E D
84
ANNExURE TO THE DIRECTORS’ REPORT 2011
ENCLOSURE ‘A’
Power & Fuel ConsumptionFor the year ended March 31
Note: The numbers given below relate to the own manufacturing facilities of the company. 2011 20101. Electricity a. Purchased units (Kwh) 9,946,291 7,538,935 Amount (Rs. Crore) 4.43 3.14 Average Rate (Rs. / Unit) 4.46 4.17 b. Own Generation i. Through Diesel Generator (Kwh) 3,652,696 3,168,345 Amount (Rs. Crore) 4.66 3.10 Average Rate (Rs. / Unit) 12.76 9.78 ii. Through Steam Generator (Kwh) – – Amount (Rs. Crore) – – Average Rate (Rs. / Unit) – –
2. Coal – –
3. Furnace oil Quantity(KL) 2,755.30 627.37 Amount (Rs. Crore) 9.17 1.72 Average Rate (Rs. / KL) 33,284.44 27,493.24
4. Other Internal Generation (excludes HSD used for electricity generation) L.D.O / H.S.D. – – Quantity(KL) 430.65 137.82 Amount (Rs. Crore) 1.45 0.43 Average Rate (Rs. / KL) 33,714.71 31,008.42
5. Baggase Consumption Quantity(MT) 12,503.81 14,138.56 Amount (Rs. Crore) 2.74 3.48 Average Rate (Rs. / MT) 2,189.66 2,462.18
Consumption per unit of production of edible oils Unit Electricity Kwh 127.86 117.04 Coal MT – – Furnace oil KL 0.03 0.01 L.D.O./H.S.D. KL – – Baggase KG 0.38 0.38
Consumption per unit of production of processed foods Unit Electricity Kwh – – Coal MT – – Furnace oil KL – – L.D.O./H.S.D. KL – –
Consumption per unit of production of hair oils & other formulations Unit Electricity Kwh 50.51 37.91 Coal MT – – Furnace oil KL – – L.D.O./H.S.D. KL – –
Consumption per unit of production of Formulations Unit Electricity Kwh – – Coal MT – – Furnace oil KL – – L.D.O./H.S.D. KL – –

M A R I C O L I M I T E D
85
This report on Corporate Governance is divided into the following parts:
• PhilosophyonCodeofCorporateGovernance
• BoardofDirectors
• AuditCommittee
• RemunerationCommittee/CorporateGovernanceCommittee
• Shareholders’Committee
• GeneralBodyMeetings
• Disclosures
• MeansofCommunication
• GeneralShareholderInformation
I. PHILOSOPHY ON CODE OF CORPORATE GOVERNANCE
Basic Philosophy
Corporate Governance encompasses laws, procedures, practices and implicit rules that determine a management’s ability
totakesounddecisionsvis-à-visall itsstakeholders–inparticular,itsshareholders,creditors,theStateandemployees.
ThereisaglobalconsensusontheobjectiveofGoodCorporateGovernance:Maximisinglong-termshareholdervalue.
Sinceshareholdersareresidualclaimants,thisobjectivefollowsfromapremisethatinwell-performingcapitalandfinancial
markets, whatever maximises shareholder value must necessarily maximise corporate value, and best satisfy the claims of
creditors, employees and the State.
A company which is proactively compliant with the law and which adds value to itself through Corporate Governance initiatives
would also command a higher value in the eyes of present and prospective shareholders.
Marico therefore believes that Corporate Governance is not an end in itself but is a catalyst in the process towards maximisation
ofshareholdervalue.Therefore,shareholdervalueasanobjectiveiswovenintoallaspectsofCorporateGovernance-the
underlying philosophy, development of roles, creation of structures and continuous compliance with standard practices.
Corporate Governance as a concept has gained considerable importance of late, primarily because of the proposal to enshrine
many of the accepted good governance principles into corporate law. For Marico, however, good corporate governance has
been a cornerstone of the entire management process, the emphasis being on professional management, with a decision
making model based on decentralisation, empowerment and meritocracy. Together, the management & Board ensure that
Marico remains a company of uncompromised integrity and excellence.
Risk Assessment and Risk Mitigation Framework
Marico believes that:
• Risksareanintegralpartofanybusinessenvironmentanditisessentialthatwecreatestructuresthatarecapableof
identifying and mitigating them in a continuous and vibrant manner.
• Risksaremulti-dimensional and thereforehave tobe lookedat in a holisticmanner, straddlingboth, theexternal
environment and the internal processes.
Marico’s Risk Management processes therefore envisage that all significant activities are analysed keeping in mind the
following types of risks:
Business Risks
Controls Risks
Governance Risks
CORPORATE GOVERNANCE REPORT

M A R I C O L I M I T E D
86
This analysis is followed by the relevant Function(s) in Marico tracking the risk elements, both internal and external, and
reporting status at periodic management reviews. This is aimed at ensuring that adequate checks and balances are in
place with reference to each significant risk.
The Board and its Audit Committee are periodically presented with all the information under risks management at group
level and the progress on the risk responses.
The Company has an internal audit system commensurate with the size of the Company and the nature of its business.
The Audit Committee of the Board has the ultimate authority and responsibility to select, evaluate and, where appropriate,
replace the independent auditor in accordance with the law. All possible measures must be taken by the committee
to ensure the objectivity and independence of the independent auditor. The Committee, independent of the executive
director and promoter directors of the Company, holds periodic one to one discussions with the Internal Auditors to
review the scope and findings of audit and to ensure adequacy of internal audit system in the Company.
We believe that this framework ensures a unified and comprehensive perspective.
Cornerstones
Marico thus follows Corporate Governance Practices around the following philosophical cornerstones:
Generative Transparency and Openness in Information sharing
Marico believes that sharing and explaining all relevant information on the Company’s policies and actions to all
those to whom it has responsibilities, with transparency and openness, generates an ambience which helps all
stakeholders to take informed decisions about the Company. This reflects externally in making maximum appropriate
disclosures without jeopardising the Company’s strategic interests as also internally in the Company’s relationship
with its employees and in the conduct of its business.
The Company announces its financial results each quarter, usually within a month of the end of the quarter. Apart
from disclosing these in a timely manner to the stock exchanges, the Company also hosts the results on its
website together with a detailed information update and media release discussing the results. The financial results
arepublishedinleadingnewspapers.Maricoparticipatesinanalystandinvestorconferencecalls,one-on-one
meetings and investor conferences where analysts and fund managers get frequent access to the company’s
senior management. Presentations made by the Company at investor conferences are also uploaded on its website.
Through these meetings, presentations and information updates the Company shares its broad strategy and
business outlook. The Company also follows a practice of making public information on significant developments
through immediate disclosure to the stock exchanges on which it is listed.
Constructive Separation of Ownership and Management
Marico believes that constructive separation of the Management of the Company from its owners results in
maximising the effectiveness of both, by sharpening their respective accountability. Seven out of eight directors
arenon-executiveandsixofthemareindependent.TheBoarddoesnotconsistofrepresentativesofcreditorsor
banks. The Committees of the Board are chaired by Independent Directors.
No related party transactions exist except for those with subsidiaries/group companies and for remuneration to
Chairman and Managing Director (CMD) and relatives of CMD. These can be referred to in Notes to Accounts
annexed to the financial statements for the year ended March 31, 2011.
As and when required, senior management personnel are present at Board / Committee meetings so that the
Board/ Committees can seek and get explanations as required from them.
All Directors and employees are required to comply with Marico’s Unified Code Of Conduct (share dealing rules)
for trading in Company’s securities in addition to concerned SEBI regulations.
The Company’s Internal and External auditors are not related to the Company.
CORPORATE GOVERNANCE REPORT

M A R I C O L I M I T E D
87
CORPORATE GOVERNANCE REPORT
Accountability
The Board plays a supervisory role rather than an executive role. Members of the Board of Directors of the Company
provide constructive critique on the operations of the Company. Each business unit is headed by a Chief Executive
Officer who is responsible for its management and operation and is answerable to the Board.
The Audit Committee and the Board of Directors meet at least once every quarter to consider inter alia, the business
performance and other matters of importance.
Discipline
Marico’s senior management understands and advocates the need for good corporate governance practices.
The Company places significant emphasis on good corporate governance practices and endeavours to ensure
that the same is followed at all levels across the Organisation.
The Company continues to focus on its core businesses of beauty and wellness. In its international business too
it is focussed on growing in the Asian and African continents in the near term. This would result in the Company
building depth in its selected segments and geographies rather than spreading itself thin.
The Company has always adopted a conservative policy with respect to debt. All actions having financial implications
are well thought through. Funds are raised for financing activities which add to the business performance and not
for the purpose of arbitrage. The Company has also stayed away from entering into exotic derivative products.
The Company has also followed a prudent dividend policy and has been declaring cash dividend on a regular
basis thereby providing a regular return on investment to shareholders.
Responsibility
The Group has put in place checks and balances to ensure orderly and smooth functioning of operations and
also defined measures in case of transgressions by members.
There exists a Unified Code of Conduct which regulates the behaviour and conduct of the members of the
Organisation. Swift action is taken against members found in violation of the code.
Purchase and sale of shares by members is governed by the Unified Code of Conduct to ensure transparency in
trading by all members of the Organisation.
Fairness
All actions taken are arrived after considering the impact on the interests of all stakeholders including minority
shareholders. All shareholders have equal rights and can convene general meetings if they feel the need to do so.
Investor Relations is given due priority. There exists a separate department for handling this function. Full disclosures
are made in the general meeting of all matters. Notice of the meetings are comprehensive, the presentations made
at the meetings are informative. Board remuneration does not rise faster than Company’s profits.
Social Awareness
The Company has an explicit policy emphasising ethical behaviour. It follows a strict policy of not employing the
under-aged.TheCompanybelievesinequalityofgendersanddoesnotpractiseanytypeofdiscrimination.All
policies are free of bias and discrimination. Environmental responsibility is given high importance and measures have
been taken at all locations to ensure that members are educated and equipped to discharge their responsibilities
in ensuring the proper maintenance of the environment.
Value-adding Checks & Balances
Marico relies on a robust structure with value adding checks and balances designed to:
prevent misuse of authority
facilitate timely response to change and
ensure effective management of risks, especially those relating to statutory compliance

M A R I C O L I M I T E D
88
At the same time, the structure provides scope for adequate executive freedom, so that bureaucracies do
not take value away from the Governance Objective.
Board / Committee Proceedings
The process of the conduct of the Board and Committee proceedings is explained in detail later on in this Report.
Other Significant Practices
Other significant Corporate Governance Practices followed by Marico are listed below:
Checks & Balances
All directors are provided with complete information relating to operations and Company finances to
enable them to participate effectively in Board discussions.
Proceedings of Board are logically segregated and matters are delegated to committees as under:
• Administrative Committee covers routine transactional issues.
• Investment and Borrowing Committee covers management of funds.
• Audit Committee covers internal control systems, financial reporting and compliance issues.
• Corporate Governance Committee (erstwhile Remuneration Committee) covers remuneration of
Directors and their relatives, Corporate Governance policy and procedures and has been designated
as the Compensation Committee for the purpose of administration and superintendence of the
Marico Employees Stock Option Scheme 2007.
• ShareTransferCommitteecoverstransferformalitiesandothershare-relatedprocedures.
• Shareholders’ Committee covers redressal of investor grievances.
• Securities Issue Committee covers the matters relating to the issue and allotment of securities and
allied matters.
• Real Estate Projects Committee (erstwhile Committee for investing in new office premises) covers
matters relating to transactions in real estate and allied matters.
• Above constituted committees meet periodically to review operations.
Eachnon-executivedirectorbringsvaluethroughaspecialisation.
Directorships held are within the ceiling limits specified.
Committee memberships and chairmanship of directors are within overall limits.
Statutory compliance report along with a Compliance Certificate is placed before the Audit Committee/
Board at every meeting.
Audit Committee is chaired by an Independent Director to check control systems and review them.
All Directors endeavour to attend all the Board/Committee meetings as also the Annual General Meeting.
The Chairman of the Audit Committee attends the Annual General Meeting to answer queries, if any,
on accounts.
The Chairman of the Board/Committee, in consultation with the Chief Financial Officer and the Company
Secretary, formalises the agenda for each of the Board Meetings.
The Board/Committees, at their discretion, invite Senior Managers of the Company and / or outside
Advisors to any meeting(s) of the Board/Committee.
The Audit Committee has, during the year considered, all important Company policies having a financial
or control angle viz: materials, risk management, internal controls and compliances across the Company.
It has regularly monitored the effectiveness of policies, need for strengthening internal controls etc.
CORPORATE GOVERNANCE REPORT

M A R I C O L I M I T E D
89
Compliance with Clause 49 of the Listing Agreement
The Company has complied with the provisions of Clause 49 of the Listing agreement (LA), as revised from time to
time.
The Company already has a Unified Code of Conduct for the Board of Directors and Senior Members, and a Whistle
Blower Policy in place.
The Unified Code of Conduct prescribes certain dos and don’ts to the Directors, Senior Management comprising key
personnel of the Company and other employees of the Company to promote ethical conduct in accordance with the
stated values of Marico and also to meet statutory requirements.
The CEO declaration has been included in the CEO Certificate given elsewhere in the Annual Report.
II. BOARD OF DIRECTORS
(I) Composition and categories of Directors:
Name Category
Mr. Harsh Mariwala Chairman and Managing Director (Promoter)
Mr. Rajeev Bakshi Non-ExecutiveandIndependent
Mr. Atul Choksey Non-ExecutiveandIndependent
Mr. Nikhil Khattau Non-ExecutiveandIndependent
Mr. Anand Kripalu Non-ExecutiveandIndependent
Mr. Rajen Mariwala Non-Executive(Promoter)
Ms. Hema Ravichandar Non-ExecutiveandIndependent
Mr. B. S. Nagesh* Non-ExecutiveandIndependent
*Member of the Board w.e.f July 16, 2010
No director is related to any other director on the Board in terms of the definition of ‘Relative’ given under the Companies
Act, 1956 except Mr. Harsh Mariwala and Mr. Rajen Mariwala, who are related to each other as first cousins.
(II) Attendance of each Director at the Board meetings and the last Annual General Meeting:
Six meetings of the Board of Directors were held during the period April 01, 2010 to March 31, 2011 viz: April 28, 2010,
July 16, 2010, July 28, 2010, September 10, 2010, October 26, 2010 and January 27, 2011. The attendance record of
alldirectorsisasunder:-
Names of Directors No. of Board Meetings Attendance at Last AGM
Held Attended
Mr. Harsh Mariwala 6 6 Yes
Mr. Rajeev Bakshi 6 3 No
Mr. Atul Choksey 6 5 No
Mr. Nikhil Khattau 6 5 No
Mr. Anand Kripalu 6 4 No
Mr. Rajen Mariwala 6 4 Yes
Ms. Hema Ravichandar 6 5 Yes
Mr. B. S. Nagesh 6 4 Yes
CORPORATE GOVERNANCE REPORT

M A R I C O L I M I T E D
90
CORPORATE GOVERNANCE REPORT
(III) Number of Board or Board Committees of which a Director is a member or chairperson (Only the Membership(s)/
Chairmanship(s) of Audit Committee and Shareholders’ Committee is considered as per Clause 49 of the Listing
Agreement)
Director Number of Outside
Directorships ($) held
Number of Other
Committee (*)
Memberships
Number of
Committees (*) in
which Chairperson
Mr. Harsh Mariwala 3 Nil 1
Mr. Rajeev Bakshi 2 1 Nil
Mr. Atul Choksey 8 Nil Nil
Mr. Nikhil Khattau Nil Nil Nil
Mr. Anand Kripalu 2 Nil Nil
Mr. Rajen Mariwala 2 Nil Nil
Ms. Hema Ravichandar 1 Nil Nil
Mr. B. S. Nagesh 4 Nil Nil
($) Excludes directorship in private limited companies, foreign companies and companies under Section 25 of the
Companies Act, 1956
(*) Only two committees, namely, Audit Committee and Shareholders’/Investors’ Grievance Committee have been
considered as per Clause 49 of the Listing Agreement.
III. AUDIT COMMITTEE
Constitution:
The Audit Committee was constituted by the Board of Directors at its meeting held on January 23, 2001, in accordance with
Section292AoftheCompaniesAct,1956.TheAuditCommitteewaslastre-constitutedbytheBoardofDirectorsonJuly
16, 2010.
The Audit Committee now comprises of the following Members:
Mr.NikhilKhattau - Chairman
Mr.RajenMariwala - Member
Ms.HemaRavichandar - Member
Mr.B.S.Nagesh - Member
Ms.HemangiWadkar* - SecretarytotheCommittee
Mr.HarshMariwala - PermanentInvitee
* Appointed as secretary to the Committee w.e.f October 27, 2010
The terms of reference of the Audit Committee are as stated in Clause 49 of the Standard Listing Agreement and Section
292A of the Companies Act, 1956 and include:
1. Oversight of the Company’s financial reporting process and the disclosure of its financial information to ensure that the
financial statement is correct, sufficient and credible.
2. RecommendingtotheBoard,theappointment,re-appointmentand, if required,thereplacementorremovalof the
statutory auditor and the fixation of audit fees.
3. Approval of payment to statutory auditors for any other services rendered by the statutory auditors.

M A R I C O L I M I T E D
91
4. Reviewing, with the management, the annual financial statements before submission to the Board for approval, with
particular reference to:
a. Matters required to be included in the Director’s Responsibility Statement to be included in the Board’s report in
terms of clause (2AA) of Section 217 of the Companies Act, 1956
b. Changes, if any, in accounting policies and practices and reasons for the same
c. Major accounting entries involving estimates based on the exercise of judgement by management
d. Significant adjustments made in the financial statements arising out of audit findings
e. Compliance with listing and other legal requirements relating to financial statements
f. Disclosure of any related party transactions
g. Qualificationsinthedraftauditreport.
5. Reviewing, with the management, the quarterly financial statements before submission to the Board for approval.
6. Reviewing, with the management, the statement of uses / application of funds raised through an issue (public issue,
rights issue, preferential issue, etc.), the statement of funds utilized for purposes other than those stated in the offer
document/prospectus/notice and the report submitted by the monitoring agency monitoring the utilisation of proceeds
of a public or rights issue, and making appropriate recommendations to the Board to take up steps in this matter.
7. Reviewing, with the management, performance of statutory and internal auditors, and adequacy of the internal control
systems.
8. Reviewing the adequacy of internal audit function, if any, including the structure of the internal audit department, staffing
and seniority of the official heading the department, reporting structure coverage and frequency of internal audit.
9. Discussion with internal auditors any significant findings and follow up there on.
10. Reviewing the findings of any internal investigations by the internal auditors into matters where there is suspected fraud
or irregularity or a failure of internal control systems of a material nature and reporting the matter to the Board.
11. Discussionwithstatutoryauditorsbeforetheauditcommences,aboutthenatureandscopeofauditaswellaspost-
audit discussion to ascertain any area of concern.
12. To look into the reasons for substantial defaults in the payment to the depositors, debenture holders, shareholders (in
case of non payment of declared dividends) and creditors.
13. To review the functioning of the Whistle Blower mechanism.
14. ApprovalofappointmentofCFO(i.e.,thewhole-timeFinanceDirectororanyotherpersonheadingthefinancefunction
or discharging that function) after assessing the qualifications, experience & background, etc. of the candidate.
15. Reviewing mandatorily the following information:
a. Management discussion and analysis of financial condition and results of operations;
b. Statement of significant related party transactions, submitted by management;
c. Management letters / letters of internal control weaknesses issued by the statutory auditors;
d. Internal audit reports relating to internal control weaknesses; and
e. The appointment, removal and terms of remuneration of the Chief internal auditor.
CORPORATE GOVERNANCE REPORT

M A R I C O L I M I T E D
92
The Committee had 5 meetings during the period April 01, 2010 to March 31, 2011 viz: April 28, 2010, July 16, 2010, July 28,
2010, October 26, 2010 and January 27, 2011.
Names of Directors No. of Audit Committee Meetings
Held Attended
Mr. Nikhil Khattau 5 4
Mr. Rajen Mariwala 5 3
Ms. Hema Ravichandar 5 4
Mr. B. S. Nagesh* 5 3
Mr. Harsh Mariwala 5 5
* Appointed as a member w.e.f July 16, 2010
IV. CORPORATE GOVERNANCE COMMITTEE
Constitution:
The Board of Directors had at its meeting held on October 25, 2005, renamed the Remuneration Committee as the Corporate
Governance Committee with terms of reference relating to overseeing and continuously improving the Corporate Governance
policies and practices in the Company. The primary purpose of the Corporate Governance Committee is ‘to enable’ the Board
function effectively in strategic and core issues of management.
The Corporate Governance Committee reviews and oversees the Remuneration strategy and Performance Management
Philosophy of Marico, especially for Directors and senior employees. The Committee has also been designated as the
Compensation Committee for administration and superintendence of the Company’s Employees Stock Option Scheme.
The Committee will also act as the Nomination Committee, with the details of this role being defined at an appropriate and
relevant time in the future. The Corporate Governance Committee was last reconstituted by the Board of Directors on January
28, 2010.
The Corporate Governance Committee comprises of the following Directors:
Ms.HemaRavichandar - Chairperson
Mr.RajeevBakshi - Member
Mr.AnandKripalu - Member
Mr.MilindSarwate - SecretarytotheCommittee
Mr.HarshMariwala - PermanentInvitee
The Corporate Governance Committee met four times during the period April 01, 2010 to March 31, 2011, viz: April 27, 2010,
July 16, 2010, September 10, 2010 and January 26, 2011.
TheRemunerationpaid/payabletoNon-ExecutiveDirectorsfortheFinancialYear2010-2011isasunder:
Name Remuneration
(payable annually)
(Rs.)
Sitting Fees (Rs.)
Mr. Rajeev Bakshi 6,00,000 60,000
Mr. Atul Choksey 6,00,000 50,000
Mr. Nikhil Khattau 6,00,000 90,000
Mr. Anand Kripalu 6,00,000 80,000
Mr. Rajen Mariwala 6,00,000 70,000
Ms. Hema Ravichandar 6,00,000 1,20,000
Mr. B. S. Nagesh 4,25,806 70,000
CORPORATE GOVERNANCE REPORT

M A R I C O L I M I T E D
93
TheremunerationpaidtoMr.HarshMariwala,Chairman&ManagingDirector,forthefinancialyear2010-2011isasunder:
Name Salary and Perquisites
(Rs.)
Annual Performance Incentive
(Rs.)
Mr. Harsh Mariwala 2,34,47,579 97,27,301
For any termination of service contract, the Company and/or the Executive Director is required to give a notice of three months.
Shareholding of Non Executive Directors
Name of Non Executive Director No. of Shares held
(As on March 31, 2011)
Mr. Rajeev Bakshi 0
Mr. Atul Choksey 12,000
Mr. Nikhil Khattau 0
Mr. Anand Kripalu 0
Mr. Rajen Mariwala 36,93,200
Ms. Hema Ravichandar 0
Total 37,05,200
REMUNERATION POLICY OF THE COMPANY
Remuneration Policy for Executive Director
The Marico Board presently consists of only one executive director namely Mr. Harsh Mariwala, Chairman & Managing Director
(CMD). Therefore, the remuneration policy for executive directors presently covers only the CMD
The remuneration of the CMD was governed by the agreement dated June 28, 2006 executed between the Company and
Mr. Harsh Mariwala. The said agreement was valid upto March 31, 2011. The terms of remuneration of CMD has been revised
with effect from April 1, 2011 by the Board at its meeting held on January 27, 2011 based on the recommendation of the
Corporate Governance Committee. The remuneration to the CMD comprises of two broad terms – Fixed Remuneration and
Variable Remuneration in the form of performance incentive. The revised terms of remuneration are subject to the approval
of the shareholders of the Company at this Annual General Meeting.
The performance incentive is based on internally developed detailed performance related matrix which is verified by the HR
department.
Remuneration Policy for Non-Executive Directors
Non-ExecutiveDirectorsofaCompany’sBoardofDirectorscanaddsubstantialvaluetotheCompanythroughtheircontribution
to the Management of the Company. In addition, they can safeguard the interests of the investors at large by playing an
appropriatecontrolrole.ForbestutilizingtheNon-ExecutiveDirectors,MaricohasconstitutedcertainCommitteesofthe
Board, viz: Corporate Governance Committee, Audit Committee and Shareholders’ Committee.
Non-ExecutiveDirectorsbringintheirlongexperienceandexpertisetobearonthedeliberationsoftheMaricoBoardandits
Committees.AlthoughtheNon-ExecutiveDirectorswouldcontributetoMaricoinseveralways,includingoff-linedeliberations
with the Managing Director, the bulk of their measurable inputs come in the form of their contribution to Board/Committee
meetings.MaricothereforehasastructureforremunerationtoNon-ExecutiveDirectors,basedonengagementlevelsofthe
Board members linked to their attendance at Board/Committee Meetings.
TheshareholdersoftheCompanyhadonJuly28,2010approvedpaymenttoNon-ExecutiveDirectorsforaperiodoffive
years up to a limit of 3% of the net profits of the Company calculated in accordance with the provisions of the Companies Act,
1956 with a liberty to the Board of Directors to decide the mode, the quantum, the recipients and the frequency of payment
of such remuneration within the said limit.
CORPORATE GOVERNANCE REPORT
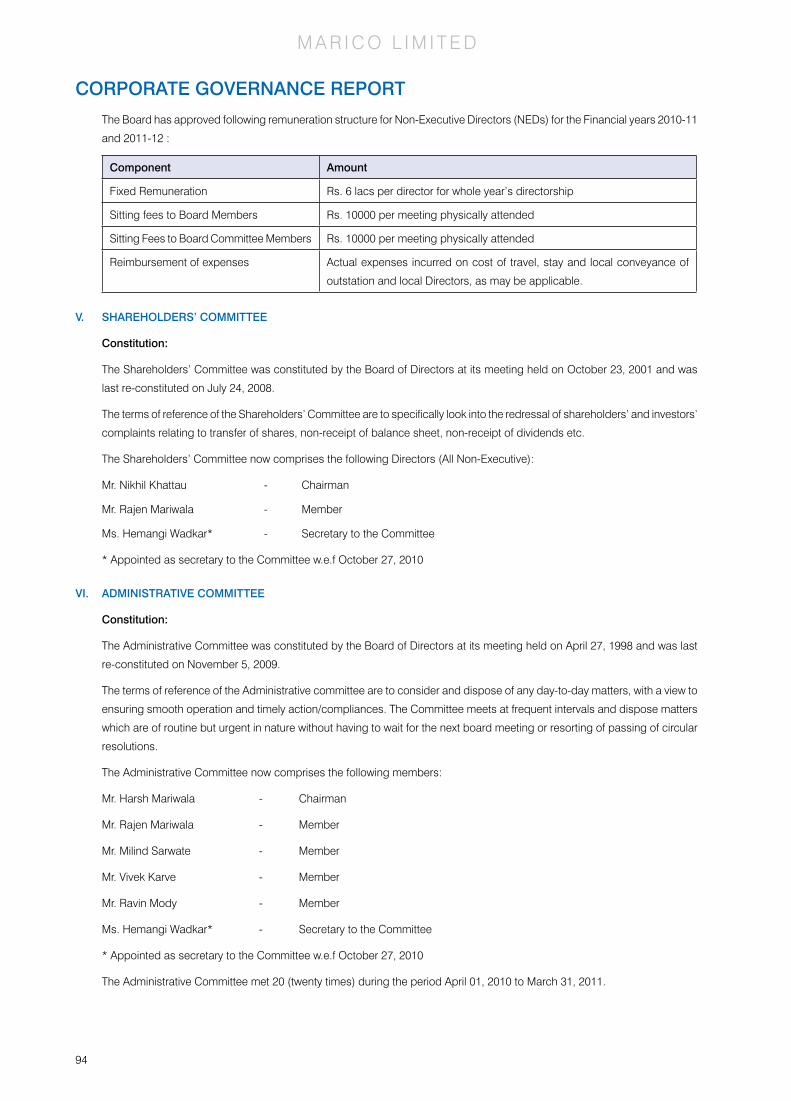
M A R I C O L I M I T E D
94
TheBoardhasapprovedfollowingremunerationstructureforNon-ExecutiveDirectors(NEDs)fortheFinancialyears2010-11
and2011-12:
Component Amount
Fixed Remuneration Rs. 6 lacs per director for whole year’s directorship
Sitting fees to Board Members Rs. 10000 per meeting physically attended
Sitting Fees to Board Committee Members Rs. 10000 per meeting physically attended
Reimbursement of expenses Actual expenses incurred on cost of travel, stay and local conveyance of
outstation and local Directors, as may be applicable.
V. SHAREHOLDERS’ COMMITTEE
Constitution:
The Shareholders’ Committee was constituted by the Board of Directors at its meeting held on October 23, 2001 and was
lastre-constitutedonJuly24,2008.
The terms of reference of the Shareholders’ Committee are to specifically look into the redressal of shareholders’ and investors’
complaintsrelatingtotransferofshares,non-receiptofbalancesheet,non-receiptofdividendsetc.
TheShareholders’CommitteenowcomprisesthefollowingDirectors(AllNon-Executive):
Mr.NikhilKhattau - Chairman
Mr.RajenMariwala - Member
Ms.HemangiWadkar* - SecretarytotheCommittee
* Appointed as secretary to the Committee w.e.f October 27, 2010
VI. ADMINISTRATIVE COMMITTEE
Constitution:
The Administrative Committee was constituted by the Board of Directors at its meeting held on April 27, 1998 and was last
re-constitutedonNovember5,2009.
ThetermsofreferenceoftheAdministrativecommitteearetoconsideranddisposeofanyday-to-daymatters,withaviewto
ensuring smooth operation and timely action/compliances. The Committee meets at frequent intervals and dispose matters
which are of routine but urgent in nature without having to wait for the next board meeting or resorting of passing of circular
resolutions.
The Administrative Committee now comprises the following members:
Mr.HarshMariwala - Chairman
Mr.RajenMariwala - Member
Mr.MilindSarwate - Member
Mr.VivekKarve - Member
Mr.RavinMody - Member
Ms.HemangiWadkar* - SecretarytotheCommittee
* Appointed as secretary to the Committee w.e.f October 27, 2010
The Administrative Committee met 20 (twenty times) during the period April 01, 2010 to March 31, 2011.
CORPORATE GOVERNANCE REPORT
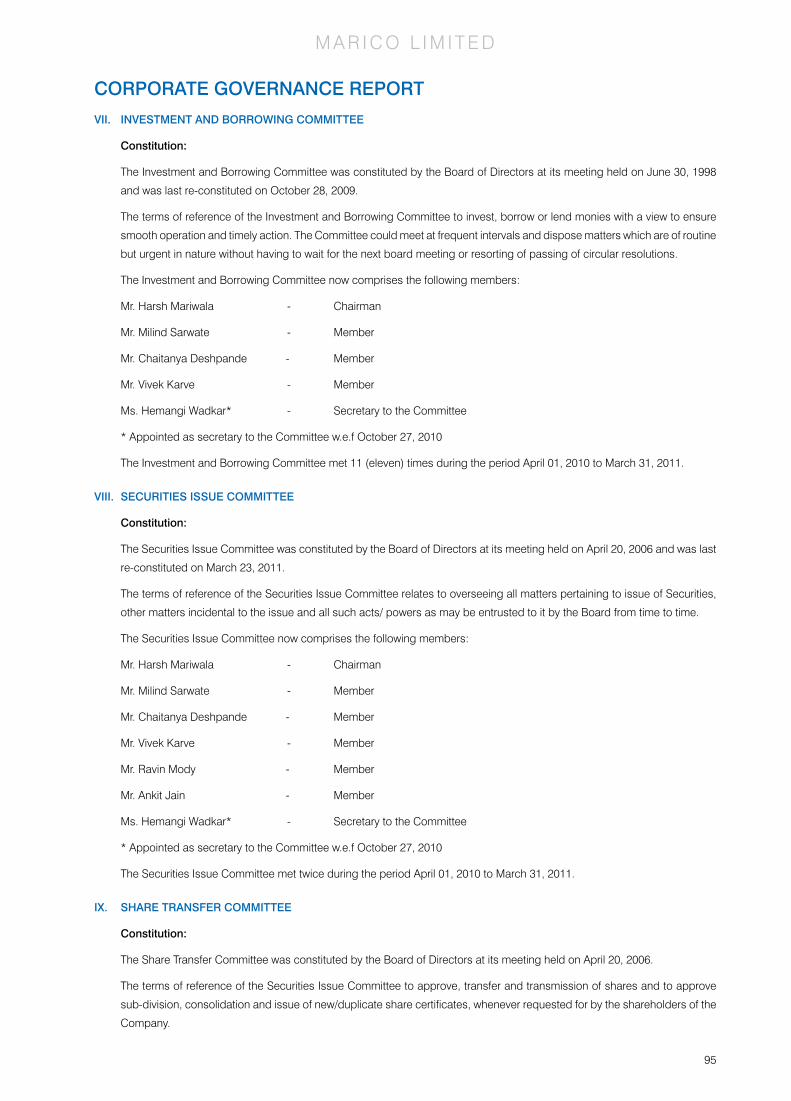
M A R I C O L I M I T E D
95
VII. INVESTMENT AND BORROWING COMMITTEE
Constitution:
The Investment and Borrowing Committee was constituted by the Board of Directors at its meeting held on June 30, 1998
andwaslastre-constitutedonOctober28,2009.
The terms of reference of the Investment and Borrowing Committee to invest, borrow or lend monies with a view to ensure
smooth operation and timely action. The Committee could meet at frequent intervals and dispose matters which are of routine
but urgent in nature without having to wait for the next board meeting or resorting of passing of circular resolutions.
The Investment and Borrowing Committee now comprises the following members:
Mr.HarshMariwala - Chairman
Mr.MilindSarwate - Member
Mr.ChaitanyaDeshpande - Member
Mr.VivekKarve - Member
Ms.HemangiWadkar* - SecretarytotheCommittee
* Appointed as secretary to the Committee w.e.f October 27, 2010
The Investment and Borrowing Committee met 11 (eleven) times during the period April 01, 2010 to March 31, 2011.
VIII. SECURITIES ISSUE COMMITTEE
Constitution:
The Securities Issue Committee was constituted by the Board of Directors at its meeting held on April 20, 2006 and was last
re-constitutedonMarch23,2011.
The terms of reference of the Securities Issue Committee relates to overseeing all matters pertaining to issue of Securities,
other matters incidental to the issue and all such acts/ powers as may be entrusted to it by the Board from time to time.
The Securities Issue Committee now comprises the following members:
Mr.HarshMariwala - Chairman
Mr.MilindSarwate - Member
Mr.ChaitanyaDeshpande - Member
Mr.VivekKarve - Member
Mr.RavinMody - Member
Mr.AnkitJain - Member
Ms.HemangiWadkar* - SecretarytotheCommittee
* Appointed as secretary to the Committee w.e.f October 27, 2010
The Securities Issue Committee met twice during the period April 01, 2010 to March 31, 2011.
Ix. SHARE TRANSFER COMMITTEE
Constitution:
The Share Transfer Committee was constituted by the Board of Directors at its meeting held on April 20, 2006.
The terms of reference of the Securities Issue Committee to approve, transfer and transmission of shares and to approve
sub-division,consolidationandissueofnew/duplicatesharecertificates,wheneverrequestedforbytheshareholdersofthe
Company.
CORPORATE GOVERNANCE REPORT

M A R I C O L I M I T E D
96
The Share Transfer Committee now comprises the following members:
Mr.HarshMariwala - Chairman
Mr.ChaitanyaDeshpande - Member
Ms.HemangiWadkar* - Member&SecretarytotheCommittee
* Appointed as member and secretary to the Committee w.e.f October 27, 2010
The Share Transfer Committee met four times during the period April 01, 2010 to March 31, 2011.
Name and Designation of Compliance Officer:
Ms. Hemangi Wadkar was appointed as the Company Secretary & Compliance Officer w.e.f. October 27, 2010.
Status Report of Investor Complaints for the year ended March 31, 2011
No.ofComplaintsReceived - 38
No.ofComplaintsResolved - 38
No.ofComplaintsPending - NIL
All valid requests for share transfer received during the year have been acted upon and no such transfer is pending.
x. GENERAL BODY MEETINGS
Annual General Meetings
YEAR VENUE DATE TIME
2008 MayfairRooms, ‘MayfairSouth’,254-C, Dr.Annie
Besant Road, Worli, Mumbai – 400 030
July 24, 2008 2.30 p.m.
2009 MayfairRooms, ‘MayfairSouth’,254-C, Dr.Annie
Besant Road, Worli, Mumbai – 400 030
July 23, 2009 3.00 p.m.
2010 The National Stock Exchange of India Limited, ‘NSE Auditorium’,GroundFloor,ExchangePlaza,Bandra-Kurla Complex, Bandra (East), Mumbai – 400051
July 28, 2010 3.30 p.m.
xI. DISCLOSURES
Therehasnotbeenanynon-compliance,penaltiesorstricturesimposedontheCompanybytheStockExchanges,SEBIor
any other statutory authority, on any matter relating to the capital markets during the last three years.
Duringtheyear2010-2011,therewerenomateriallysignificantrelatedpartytransactionsi.e.transactionsofthecompany
of material nature, with its Promoters, the Directors or the Management, their subsidiaries or relatives etc. that may have
potential conflict with the interest of Company at large.
TheCompanyhasawell-definedWhistleBlowerPolicyanditisfullyimplementedbytheManagement.
No personnel has been denied access to the Audit Committee.
Compliance with mandatory and non-mandatory requirements of Clause 49 of the Listing Agreement
The Company has complied with mandatory requirements of Clause 49 of the Listing Agreement requiring it to obtain a
certificate from either the Auditors or Practising Company Secretaries regarding compliance of conditions of Corporate
Governance as stipulated in this clause and annex the certificate with the Directors’ Report, which is sent annually to all the
shareholders of the Company. We have obtained a certificate to this effect from the auditors and the same is given as an
annexure to the Directors’ Report.
Theclausefurtherstatesthatthenon-mandatoryrequirementsmaybeimplementedasperourdiscretion.However,the
disclosuresof thecompliancewithmandatory requirementsandadoption (andcompliance) /non-adoptionof thenon-
mandatory requirements shall be made in the section on Corporate Governance of the Annual Report. We comply with the
followingnon-mandatoryrequirements:
CORPORATE GOVERNANCE REPORT

M A R I C O L I M I T E D
97
Remuneration Committee
The scope of the Remuneration Committee was expanded and designated as the Corporate Governance Committee by the Board
of Directors at its meeting held on October 25, 2005. A detailed note on the Committee is provided elsewhere in this report.
Whistle Blower Policy
We have established a mechanism for employees to report concerns about unethical behaviour, actual or suspected fraud or
violation of our code of conduct or ethics policy. This mechanism also provides for adequate safeguards against victimization
of employees who avail of the mechanism and also provide for direct access to the Chairman of the Audit Committee in
exceptional cases. The guidelines are meant for all members of the Organization from the day they join and are designed to
ensure that they may raise any specific concern on integrity, value adherence without fear of being punished for raising that
concern. The guidelines also cover our associates who partner us in our organizational objectives and customers for whom
we exist.
The Board and its Corporate Governance Committees are informed periodically on the matters reported with the Whistle
Blower Ombudsman and the status of resolution of such cases.
xII. MEANS OF COMMUNICATION
Quarterly,half-yearlyandannualresultsforMaricoLimitedasalsoconsolidatedfinancialresultsfortheMaricogroupare
published in an English financial daily (Free Press Journal) and a vernacular newspaper (Navashakti).
AllofficialnewsreleasesandfinancialresultsarecommunicatedbytheCompanythroughitscorporatewebsite-www.marico.
com. Presentations made to Institutional Investors/ analysts are also put up on the website for wider dissemination.
The Management Discussion and Analysis Report forms part of the Annual Report.
xIII. GENERAL SHAREHOLDER INFORMATION
Details of Directors seeking appointment/reappointment at the forthcoming Annual General Meeting
Ms. Hema Ravichandar
Ms. Hema Ravichandar is a Bachelor of Arts (Economics) from the University of Chennai and holds a Post Graduate Diploma
in Management from the Indian Institute of Management, Ahmedabad. Hema’s experience of 28 years comprises corporate
roles in Infosys Technologies Ltd. and Motor Industries Co. Ltd., and entrepreneurial stints in HR, across industries. Her
experience spans Change Management, Leadership Development and Human Resource Development. In her last role
as the Senior Vice President and Global Head of HR for the Infosys Group, she was responsible for staffing & recruitment,
compensation and benefits, performance management, immigration, learning & development and organizational effectiveness.
She currently provides Strategic HR Advisory to several multinational and Indian organizations. Hema has held several key
industry positions. She was formerly the Chairperson for The Conference Board’s HR Council of India and was a Member
of the National Advisory Council of the National HRD Network of India. She has worked closely with industry bodies such as
CII and NASSCOM on some of their key initiatives. She is a regular speaker at several international and national conferences
and leading business schools. She has been on the Board of Directors of the Company since July 26, 2005.
Mr. Nikhil Khattau
Nikhil Khattau is an experienced banker, entrepreneur and venture capital investor who has built and invested in companies in
India since 1995. Nikhil also has an additional 10 years of international work experience. Currently, he is a Managing Director of
MF Advisors Pvt. Ltd. He sits on the boards of Consim Info Pvt. Ltd. (India’s largest matrimony company), Geodesic Techniques
(a speciality construction company) and Sohanlal Commodity Management (an agricultural logistics company). Nikhil is also
on the national board of advisors of AIESEC (The International Association of Students of Economics and Management) in
India. Nikhil was the founding CEO of SUN F&C Asset Management, one of the first private sector mutual fund companies
in India. Nikhil’s prior experience includes working for Ernst & Young’s Corporate Finance and Audit practices in New York
andLondonfrom1986-1995,wherehesuccessfullyadvisedanumberofmid-marketcompaniesontheiracquisitionand
divestment strategies. Nikhil received his bachelor’s degree in commerce from Bombay University and is an associate of the
Institute of Chartered Accountants in England and Wales.
CORPORATE GOVERNANCE REPORT

M A R I C O L I M I T E D
98
Annual General Meeting – Date, time and Venue : 3.30 p.m. on Wednesday, July 27, 2011
IES Management College & Research Centre, Gate No. 4, Seminar
Hall, 6th Floor, Plot No. 791, S. K. Marg, VMDL Complex, Bandra
Reclamation, Bandra (W), Mumbai – 400050
FinancialYear : April01-March31
Book Closure Date : Monday, July 25, 2011 to Wednesday, July 27, 2011, both days
inclusive.
DividendPaymentDate : November16,2010(1stInterimEquityDividend10-11)
May23,2011(2ndInterimEquityDividend10-11)
Listing on Stock Exchanges : Bombay Stock Exchange Limited (BSE),
Phiroze Jeejeebhoy Towers, Dalal Street, Mumbai 400 001.
The National Stock Exchange of India Limited (NSE),
Exchange Plaza, Bandra Kurla Complex, Mumbai 400 051.
ListingfeesforFinancialYear2010-2011hasbeenpaid.
Stock /Scrip Code : BSE – 531642
NSE – MARICO
ISIN number : INE 196A01026
Company Identification Number (CIN) : L15140MH1988PLC049208
Unique Identification Number : 100067223
Market Price Data
Month Bombay Stock Exchange Limited
(BSE)
(in Rs.)
The National Stock Exchange of India
Limited
(NSE)
(in Rs.)
High Low High Low
April 2010 122.40 106.10 124.85 106.25
May 2010 117.50 99.75 117.50 99.15
June 2010 136.20 104.35 136.50 104.05
July 2010 134.40 123.10 134.50 123.25
August 2010 133.90 116.25 144.65 116.15
September 2010 133.40 122.00 133.70 121.55
October 2010 153.00 126.50 145.70 126.80
November 2010 144.60 125.00 143.80 125.35
December 2010 131.90 115.00 132.00 118.00
January 2011 136.40 119.50 136.70 120.00
February 2011 129.40 112.10 129.80 112.05
March 2011 139.90 119.05 140.80 119.40
CORPORATE GOVERNANCE REPORT

M A R I C O L I M I T E D
99
PERFORMANCE IN COMPARISON: BSE SENSEx, S & P CNx NIFTY AND BSE FMCG
CORPORATE GOVERNANCE REPORT
Marico - BSE v/s BSE Index
Pric
e In
dexe
d to
100
Apr
-10
May
-10
Jun-
10
Jul-1
0
Aug
-10
Sep
-10
Oct
-10
Nov
-10
Dec
-10
Jan-
11
Feb-
11
Mar
-11
50
70
90
110
150
130
Marico BSE Index
Marico v/s NSE Index
Apr
-10
May
-10
Jun-
10
Jul-1
0
Aug
-10
Sep
-10
Oct
-10
Nov
-10
Dec
-10
Jan-
11
Mar
-11
Feb-
11
150
130
110
90
70
50
Marico NSE Index
Pric
e In
dexe
d to
100
Marico - BSE v/s BSE FMCG
150
130
110
90
50
70Pric
e In
dexe
d to
100
Apr
-10
May
-10
Jun-
10
Jul-1
0
Aug
-10
Sep
t-10
Oct
-10
Nov
-10
Dec
-10
Jan-
11
Feb-
11
Mar
-11
Marico FMCG Index

M A R I C O L I M I T E D
100
Share Transfer System : Transfers in physical form are registered by the Registrar and Share
Transfer Agents immediately on receipt of completed documents and
certificates are issued within one month of date of lodgement of transfer.
Invalid share transfers are returned within 15 days of receipt.
The Share Transfer Committee generally meets as may be warranted
by the number of share transaction requests received by the Company.
All requests for dematerialisation of shares are processed and the
confirmation is given to respective Depositories i.e. National Securities
Depository Limited and Central Depository Services (India) Limited,
generally within 20 days.
Registrar & Transfer Agents : M/s Link Intime India Pvt Limited (erstwhile Intime Spectrum Registry
Limited),(Unit:MaricoLtd.)C-13PannalalSilkMillsCompound,LBS
Road, Bhandup (West), Mumbai 400 078
Distribution of Shareholding as on March 31, 2011 :
No. of Equity
Shares held
No. of
Shareholders
% of
Shareholders
No. of
Shares held
% of
Shareholding
1-500 26,601 82.68 3,159,561 0.51
501-1000 2,210 6.87 1,909,623 0.31
1001-2000 1,176 3.66 1,970,268 0.32
2001-3000 400 1.24 1,060,550 0.17
3001-4000 625 1.94 2,428,320 0.40
4001-5000 204 0.63 977,138 0.16
5001-10000 421 1.31 3,235,360 0.53
10001 & above 538 1.67 599,658,730 97.60
Total 32,175 100.00 614,399,550 100.00
Categories of Shareholding as on March 31, 2011 :
Category No. of
Shareholders
No. of
Shares held
Percentage of
Shareholding
Promoters 28 386,376,520 62.88
Foreign Institutional Investors 107 159,191,646 25.91
NRIs and OCBs 684 2,059,390 0.34
Insurance Companies, Banks and other
Financial Institutions
13 7,798,670 1.27
Mutual Funds, including Unit Trust of India 37 19,274,048 3.14
Public / Private Ltd. Companies 528 14,848,333 2.42
Resident Individuals, Trusts and In Transit 30,778 24,850,943 4.04
Total 32,175 614,399,550 100.00
CORPORATE GOVERNANCE REPORT

M A R I C O L I M I T E D
101
Group coming within the definition of Group : List of persons forming part of the same “Group” for the purposes
as defined in the Monopolies and Restrictive of Regulation 3(1)(e)(i) of SEBI (Substantial Acquisition of Shares &
Trade Practices Act, 1969 (54 of 1969) Takeovers) Regulations, 1997:
1. Valentine Family Trust
2. Aquarius Family Trust
3. Taurus Family Trust
4. Gemini Family Trust
5. Harshraj C Mariwala HUF
6. Harsh C Mariwala & Family
7. Archana Mariwala & Family
8. Rajvi Harsh Mariwala & Family
9. Rishabh Harsh Mariwala & Family
10. Kishore V Mariwala & Family
11. Hema K Mariwala & Family
12. Rajen Mariwala & Family
13. Anjali R Mariwala & Family
14. Ravindra K Mariwala & Family
15. Paula R Mariwala & Family
16. Malika Chirayu Amin & Family
17. Pallavi C Jaikishen & Family
18. Preeti Gautam Shah & Family
19. The Bombay Oil Private Limited
(erstwhile Bombay Oil Industries Pvt. Ltd.)
20. Arctic Investment and Trading Co. Pvt. Ltd
21. Hindustan Polyamides and Fibres Ltd
Dematerialization of Shares and Liquidity : As on March 31, 2011, 99.68% of shareholding was held in Dematerialised
form with National Securities Depository Limited and Central Depository
Services (India) Limited.
In terms of the notification issued by SEBI, trading in the equity shares of
the Company is permitted only in dematerialised form with effect from May
31, 1999.
Outstanding GDR / ADR / Warrants or any : The Company has not issued any GDR / ADR / Warrants or any
convertible instruments, conversion date convertible instruments.
and impact on equity
Plant Locations : Kanjikode, Jalgaon, Goa, Pondicherry, Daman, Dehradun, Paonta Sahib and
Baddi
CORPORATE GOVERNANCE REPORT

M A R I C O L I M I T E D
102
CORPORATE GOVERNANCE REPORT
Address for correspondence : Shareholding related queries
Company’s Registrar & Transfer Agent:
M/s Link Intime India Pvt Limited
(erstwhile Intime Spectrum Registry Limited)
Unit: Marico Limited
C-13PannalalSilkMillsCompound,LBSRoad,
Bhandup (West), Mumbai 400 078
Tel.:022-25946970,Fax:022-25946969
E-mail:[email protected]
General Correspondence
Marico Limited, Rang Sharda, Krishnachandra Marg,
Bandra Reclamation, Bandra (West), Mumbai – 400 050.
Tel.:022-66480480,Fax:022-66490112/3/4
E-mail:[email protected]

M A R I C O L I M I T E D
103
CHIEF ExECUTIVE OFFICER (CEO) AND CHIEF FINANCIAL OFFICER (CFO) CERTIFICATION
We, to the best of our knowledge and belief, hereby certify that:
(a) We have reviewed the financial statements and cash flow statement for the year ended March 31, 2011 and to the best of
our knowledge and belief:
(i) These statements do not contain any materially untrue statement or omit any material fact or contain statements that
might be misleading;
(ii) These statements together present a true and fair view of the Company’s affairs and are in compliance with existing
accounting standards, applicable laws and regulations.
(b) There are, to the best of our knowledge and belief, no transactions entered into by the Company during the year, which are
fraudulent, illegal or violative of the Company’s Code of Conduct.
(c) We accept responsibility for establishing and maintaining internal controls for financial reporting and that we have evaluated
the effectiveness of the internal control systems of the Company pertaining to the financial reporting and we have disclosed
to the auditors and the Audit Committee, deficiencies in the design or operation of internal controls, if any, of which we are
aware and the steps we have taken or propose to take to rectify these deficiencies.
(d) We have indicated to the auditors and the Audit Committee:
(i) significant changes in internal control over financial reporting during the year;
(ii) significant changes in accounting policies during the year and that the same have been disclosed in the notes to the
financial statements; and
(iii) instances of significant fraud of which we have become aware and the involvement therein, if any, of the Management
or an employee having a significant role in the Company’s internal control system over financial reporting.
Yours truly,
For Marico Limited For Marico Limited
Harsh Mariwala Milind Sarwate
Chairman and Managing Director Group Chief Financial Officer &
Chief Human Resources Officer
Place: Mumbai Place: Mumbai
Date: May 2, 2011 Date: May 2, 2011
CHIEF ExECUTIVE OFFICER (CEO) DECLARATION
This is to confirm that the Company has adopted a Code of Conduct for its Board Members and senior management. This Code
of Conduct is available on the Company’s website.
I confirm that the Company has in respect of the financial year ended March 31, 2011, received from the senior management team
of the Company and the Members of the Board a declaration of compliance with the Code of Conduct as applicable to them.
For the purpose of this declaration, senior management team means personnel as specified in the Annexure to the Code of Conduct.
HARSH MARIWALA
Chairman and Managing Director
Place: Mumbai
Date: May 2, 2011
CORPORATE GOVERNANCE REPORT

M A R I C O L I M I T E D
104
TO THE MEMBERS OF MARICO LIMITED
1. We have audited the attached Balance Sheet of Marico Limited (the “Company”) as at March 31,2011, and the related Profit
and Loss account and Cash Flow statement for the year ended on that date (all together referred to as ‘financial statements’)
annexed thereto, which we have signed under reference to this report. These financial statements are the responsibility of
the Company’s Management. Our responsibility is to express an opinion on these financial statements based on our audit.
2. We conducted our audit in accordance with the auditing standards generally accepted in India. Those Standards require that
we plan and perform the audit to obtain reasonable assurance about whether the financial statements are free of material
misstatement. An audit includes examining, on a test basis, evidence supporting the amounts and disclosures in the financial
statements. An audit also includes assessing the accounting principles used and significant estimates made by Management,
as well as evaluating the overall financial statement presentation. We believe that our audit provides a reasonable basis for
our opinion.
3. As required by the Companies (Auditor’s Report) Order, 2003, as amended by the Companies (Auditor’s Report) (Amendment)
Order, 2004 (together the “Order”), issued by the Central Government of India in terms of sub-section (4A) of Section 227 of
‘The Companies Act, 1956’ of India (the ‘Act’) and on the basis of such checks of the books and records of the Company
as we considered appropriate and according to the information and explanations given to us, we give in the Annexure a
statement on the matters specified in paragraphs 4 and 5 of the Order.
4. Further to our comments in the Annexure referred to in paragraph 3 above, we report that:
(a) We have obtained all the information and explanations which, to the best of our knowledge and belief, were necessary
for the purposes of our audit;
(b) In our opinion, proper books of account as required by law have been kept by the Company so far as appears from
our examination of those books;
(c) The Balance Sheet, Profit and Loss account and Cash Flow statement dealt with by this report are in agreement with
the books of account;
(d) In our opinion, the Balance Sheet, Profit and Loss account and Cash Flow statement dealt with by this report comply
with the accounting standards referred to in sub-section (3C) of Section 211 of the Act;
(e) On the basis of written representations received from the directors, as on March 31,2011 and taken on record by the
Board of Directors, none of the directors is disqualified as on March 31,2011 from being appointed as a director in
terms of clause (g) of sub-section (1) of Section 274 of the Act;
(f) In our opinion and to the best of our information and according to the explanations given to us, the said financial
statements together with the notes thereon and attached thereto give, in the prescribed manner, the information required
by the Act, and give a true and fair view in conformity with the accounting principles generally accepted in India:
(i) in the case of the Balance Sheet, of the state of affairs of the company as at March 31,2011;
(ii) in the case of the Profit and Loss account, of the profit for the year ended on that date; and
(iii) in the case of the Cash Flow statement, of the cash flows for the year ended on that date.
For Price WaterhouseChartered AccountantsFirm Registration Number: 301112E
Vilas Y. RanePartnerMembership Number: F-33220Place : MumbaiDate : May 2, 2011
AUDITORS’ REPORT

M A R I C O L I M I T E D
105
AnnExURE TO AUDITORS’ REPORT
Referred to in Paragraph 3 of the Auditors’ Report of even date to the members of Marico Limited on the financial statements
for the year ended March 31, 2011.
1. (a) The Company is maintaining proper records showing full particulars, including quantitative details and situation of fixed
assets.
(b) The fixed assets are physically verified by the Management according to a phased programme designed to cover all
the items over a period of two years which, in our opinion, is reasonable having regard to the size of the Company and
the nature of its assets. Pursuant to the programme, a portion of the fixed assets has been physically verified by the
Management during the year and no material discrepancies between the book records and the physical inventory have
been noticed.
(c) In our opinion and according to the information and explanations given to us, a substantial part of fixed assets has not
been disposed off by the Company during the year.
2. (a) The inventory has been physically verified by the Management during the year. In respect of inventory lying with third
parties, these have substantially been confirmed by them. In our opinion, the frequency of verification is reasonable.
(b) In our opinion, the procedures of physical verification of inventory followed by the Management are reasonable and
adequate in relation to the size of the Company and the nature of its business.
(c) On the basis of our examination of the inventory records, in our opinion, the Company is maintaining proper records
of inventory. The discrepancies noticed on physical verification of inventory as compared to book records were not
material.
3. The Company has neither granted nor taken any loans, secured or unsecured, to / from companies, firms or other parties
covered in the register maintained under Section 301 of the Act. Accordingly, paragraph 4(iii) (b), 4(iii) (c), 4(iii) (d), 4(iii) (f)
and (iii) (g) of the Order are not applicable.
4. In our opinion and according to the information and explanations given to us, there is an adequate internal control system
commensurate with the size of the Company and the nature of its business for the purchase of inventory, fixed assets and
for the sale of goods and services. Further, on the basis of our examination of the books and records of the Company, and
according to the information and explanations given to us, we have neither come across nor have been informed of any
continuing failure to correct major weaknesses in the aforesaid internal control system.
5. According to the information and explanations given to us, there have been no contracts or arrangements referred to in
Section 301 of the Act during the year to be entered in the register required to be maintained under that Section. Accordingly,
the question of commenting on transactions made in pursuance of such contracts or arrangements does not arise.
6. The Company has not accepted any deposits from the public within the meaning of Sections 58A and 58AA of the Act and
the rules framed there under.
7. In our opinion, the Company has an internal audit system commensurate with its size and the nature of its business.
8. We have broadly reviewed the books of account maintained by the Company in respect of products where, pursuant to the
Rules made by the Central Government of India, the maintenance of cost records has been prescribed under clause (d) of
sub-section (1) of Section 209 of the Act, and are of the opinion that prima facie, the prescribed accounts and records have
been made and maintained. We have not, however, made a detailed examination of the records with a view to determine
whether they are accurate or complete.
9. (a) According to the information and explanations given to us and the records of the Company examined by us, in our
opinion, the Company is regular in depositing the undisputed statutory dues including provident fund, investor education
and protection fund, employees’ state insurance, income tax, sales tax, wealth tax, service tax, customs duty, excise
duty, cess and other material statutory dues as applicable with the appropriate authorities.

M A R I C O L I M I T E D
106
AnnExURE TO AUDITORS’ REPORT
(b) According to the information and explanations given to us and the records of the Company examined by us, the particulars
of dues of sales tax, customs duty and cess as at March 31, 2011 which have not been deposited on account of a
dispute are as follows:
name of the Statute nature of dues Amount
(Rs. crore)
Period to which the
amount relates
Forum where the dispute
is pending
The Central Sales Tax Act
and Local Sales Tax Acts
Sales tax including
interest and penalty
as applicable
10.03 2005 -06 to 2009-10 Additional Commissioner -
Sales Tax Appeals
0.65 Various years Deputy Commissioner –
Sales Tax Appeals.
0.13 2005-06 to 2006-07 Joint Commissioner –
Sales Tax Appeals
2.58 Various years Sales Tax Tribunal
0.53 2010 -11 High Court – U.P
0.17 2007-08 Superintendent of
Sales Tax
0.57 2004-05 Assistant Commissioner –
Sales Tax Appeals
Maharashtra Agricultural
Produce Marketing
(Development &
Regulation) Act, 1963
Supervision
charges
1.04 2006 to 2010 Mumbai High Court
Maharashtra Agricultural
Produce Marketing
(Development &
Regulation) Act, 1963
Agricultural
Produce Marketing
committee cess –
Goa Bench
8.13 1997 to 2011 Mumbai High Court (Panji
Bench)
The Indian Customs
Act,1962
Export cess 0.09 2004 Deputy Commissioner of
Customs - Kolkatta
The Indian Customs
Act,1962
Redemption f ine
and penalty
0.30 2002 to 2004 Customs Excise and
Service Tax Appellate
Tribunal - Mumbai
The Indian Customs
Act,1962
Custom duty 0.01 2008 Assistant Commissioner of
Customs - Mumbai
10. The Company has no accumulated losses as at March 31, 2011 and it has not incurred any cash losses in the financial year
ended on that date or in the immediately preceding financial year.
11. According to the records of the Company examined by us and the information and explanations given to us, the Company
has not defaulted in repayment of dues to any financial institution or bank or debenture holders as at the balance sheet date.
12. The Company has not granted any loans and advances on the basis of security by way of pledge of shares, debentures and
other securities.
13. The provisions of any special statute applicable to chit fund / nidhi / mutual benefit fund / societies are not applicable to the
Company.
14. In our opinion the Company is not a dealer or trader in shares, securities, debentures and other investments.
15. In our opinion and according to the information and explanations given to us, the terms and conditions of the guarantees
given by the Company for loans taken by subsidiaries from banks during the year are not prejudicial to the interest of the
Company.

M A R I C O L I M I T E D
107
16. In our opinion and according to the information and explanations given to us, on an overall basis, the term loans have been
applied for the purposes for which they were obtained.
17. On the basis of an overall examination of the balance sheet of the Company, in our opinion and according to the information
and explanations given to us, there are no funds raised on a short-term basis which have been used for long-term investment.
18. The Company has not made any preferential allotment of shares to parties and companies covered in the register maintained
under Section 301 of the Act during the year.
19. The Company has created security or charge in respect of secured debentures issued and outstanding at the year-end.
20. The Company has not raised any money by public issues during the year.
21. During the course of our examination of the books and records of the Company, carried out in accordance with the Generally
Accepted Auditing Practices in India, and according to the information and explanations given to us, we have neither come
across any instance of fraud on or by the Company, noticed or reported during the year, nor have we been informed of such
case by the Management.
For Price Waterhouse
Chartered Accountants
Firm Registration No. 301112E
VILAS Y. RAnE
Partner
Membership No: F-33220
Mumbai
May 2, 2011

M A R I C O L I M I T E D
108
SOURCES OF FUnDS
SHAREHOLDERS’ FUnDS
Share Capital A 61 .44 60.93
Reserves and surplus B 811.68 510.73
873.12 571.66
LOAn FUnDS
Secured loans C 332.42 99.61
Unsecured loans D 220.07 277.31
552.49 376.92
1,425.61 948.58
APPLICATIOn OF FUnDS
FIxED ASSETS E
Gross block 421.20 294.45
Less : Depreciation, amortisation and impairment 198.74 164.48
Net block 222.46 129.97
Capital work-in-progress 45.52 109.95
Assets held for disposal 0.18 0.01
268.16 239.93
InVESTMEnTS F 470.36 209.11
DEFERRED TAx ASSET (nET) 26.54 58.50
(Refer Note 12 a, Schedule R)
CURREnT ASSETS, LOAnS AnD ADVAnCES
Inventories G 454.22 369.90
Sundry debtors H 118.98 94.51
Cash and bank balances I 18.17 11.21
Loans and Advances J 329.57 254.17
920.94 729.79
Less: CURREnT LIABILITIES AnD PROVISIOnS
Current Liabilities K 228.43 226.51
Provisions L 31.96 62.24
260.39 288.75
nET CURREnT ASSETS 660.55 441.04
1,425.61 948.58
Additional information to Accounts Q
notes to Accounts R
BALAnCE SHEET
As per our attached report of even date
For Price Waterhouse For and on behalf of the Board of Directors
Chartered Accountants HARSH MARIWALA Chairman and Managing Director
Firm Registration No. 301112E nIKHIL KHATTAU Director and Chairman of Audit Committee
MILInD SARWATE Group Chief Financial Officer and
VILAS Y. RAnE Chief Human Resource Officer
Partner HEMAnGI WADKAR Company Secretary & Compliance Officer
Membership No. F-33220
Place : Mumbai Place : Mumbai
Date : May 2, 2011 Date : May 2, 2011
As at March 31,
SCHEDULE 2011 2010
Rs. Crore Rs. Crore

M A R I C O L I M I T E D
109
InCOME :
Sales 2,347.85 2,025.34
Less : Excise Duty 0.98 1.05
Total Sales and Services 2,346.87 2,024.29
Other income M 25.17 22.06
2,372.04 2,046.35
ExPEnDITURE :
Cost of materials n 1,364.30 1,085.10
Manufacturing and other expenses O 641.12 625.17
Finance charges P 29.92 18.30
Depreciation, amortisation and impairment E 27.63 25.21
2,062.97 1,753.78
PROFIT BEFORE TAxATIOn AnD ExCEPTIOnAL ITEMS 309.07 292.57
Exceptional Items - (Net) (Refer Note 13, Schedule R) (65.47) –
PROFIT BEFORE TAxATIOn 374.54 292.57
Provision for taxation : - Current Tax 70.81 55.20
- MAT Credit (entitlement) / utilisation (43.55) (2.55)
- Fringe Benefit Tax – (0.01)
- Deferred Tax - debit / (credit) 31.96 4.91
59.22 57.55
PROFIT AFTER TAxATIOn 315.32 235.02
Balance brought forward as on April 1 382.58 233.10
PROFIT AVAILABLE FOR APPROPRIATIOn 697.90 468.12
APPROPRIATIOnS
Interim dividend 40.54 40.21
Tax on interim dividend 6.64 6.83
Debenture Redemption Reserve 16.67 15.00
General Reserve 31.53 23.50
BALAnCE CARRIED TO THE BALAnCE SHEET 602.52 382.58
EARnInGS PER SHARE (FACE VALUE Re.1)
- BASIC 5.15 3.86
- DILUTED 5.12 3.84
(Refer Note 15 of Schedule R)
Additional information to Accounts Q
notes to Accounts R
PROFIT AnD LOSS ACCOUnT
As per our attached report of even date
For Price Waterhouse For and on behalf of the Board of Directors
Chartered Accountants HARSH MARIWALA Chairman and Managing Director
Firm Registration No. 301112E nIKHIL KHATTAU Director and Chairman of Audit Committee
MILInD SARWATE Group Chief Financial Officer and
VILAS Y. RAnE Chief Human Resource Officer
Partner HEMAnGI WADKAR Company Secretary & Compliance Officer
Membership No. F-33220
Place : Mumbai Place : Mumbai
Date : May 2, 2011 Date : May 2, 2011
For the year ended March 31,
SCHEDULE 2011 2010
Rs. Crore Rs. Crore

M A R I C O L I M I T E D
110
CASH FLOW STATEMEnT
A CASH FLOW FROM OPERATInG ACTIVITIES
PROFIT BEFORE TAxATIOn AnD AFTER ExCEPTIOnAL ITEMS 374.54 292.57
Adjustments for:
Depreciation, amortisation and impairment 27.63 25.21
Provision for impairment on assets written back as no
longer required / on discard of assets. (1.03) (1.20)
Capital advances written off 1.00 –
Provision for impairment of FIANCEE Trademark (Refer Note 26, Schedule R) 13.88 –
Provision for contingencies (Refer Note 25, Schedule R) – 29.35
Reversal of provision for contingencies (Refer Note 25, Schedule R) (29.35) –
Profit on divestment of Sweekar Brand (Refer Note 24, Schedule R) (50.00) –
Finance charges 29.92 18.30
Interest income (5.18) (5.60)
Loss / (Profit) on sale of assets - (net) (0.08) (0.09)
(Profit) / Loss on sale of investments (net) (0.40) (0.02)
Dividend income (6.82) (7.18)
Employee stock compensation expense 0.06 0.08
Provision for doubtful debts, advances and deposits (0.55) 1.47
(20.92) 60.32
Operating profit before working capital changes 353.62 352.89
Adjustments for:
(Increase)/ Decrease in inventories (84.32) (96.21)
(Increase)/ Decrease in sundry debtors (23.93) (33.93)
(Increase)/ Decrease in loans and advances 17.35 (29.07)
Increase/ (Decrease) in current liabilities and provisions (0.38) 31.78
(91.28) (127.43)
Cash generated from Operations 262.34 225.46
Taxes paid (net of refunds) (67.50) (52.31)
nET CASH InFLOW FROM OPERATInG ACTIVITIES 194.84 173.15
B CASH FLOW FROM InVESTInG ACTIVITIES
Purchase of fixed assets (69.88) (101.16)
Sale of fixed assets 0.68 1.68
Proceeds from divestment of Sweekar Brand 50.00 –
(Purchase) / Sale of investments (net) (5.85) (69.76)
Investment in a Subsidiary (254.98) (26.76)
Loans and advances repaid by subsidiaries 149.19 46.66
Loans and advances given to subsidiaries (197.84) (61.70)
Dividend income received 6.82 7.18
Interest received 4.26 5.38
nET CASH OUTFLOW FROM InVESTInG ACTIVITIES (317.60) (198.48)
For the year ended March 31,
2011 2010 Rs. Crore Rs. Crore

M A R I C O L I M I T E D
111
CASH FLOW STATEMEnT
As per our attached report of even date
For Price Waterhouse For and on behalf of the Board of Directors
Chartered Accountants HARSH MARIWALA Chairman and Managing Director
Firm Registration No. 301112E nIKHIL KHATTAU Director and Chairman of Audit Committee
MILInD SARWATE Group Chief Financial Officer and
VILAS Y. RAnE Chief Human Resource Officer
Partner HEMAnGI WADKAR Company Secretary & Compliance Officer
Membership No. F-33220
Place : Mumbai Place : Mumbai
Date : May 2, 2011 Date : May 2, 2011
C CASH FLOW FROM FInAnCInG ACTIVITIES
Proceeds from issuance of Share Capital on exercise of stock option 28.59 1.83
Issue / (Redemption) of commercial papers (net) 58.90 (14.46)
Inter-Corporate deposits taken / (repaid) – (5.00)
Issue of Debentures 50.00 30.00
Other borrowings (repaid) / taken (net) 68.84 67.62
Finance charges paid (29.55) (19.76)
Equity dividend paid (inclusive of dividend distribution tax) (47.06) (46.67)
nET CASH InFLOW FROM FInAnCInG ACTIVITIES 129.72 13.56
D nET InCREASE / (DECREASE) In CASH & CASH EQUIVALEnTS (A+B+C) 6.96 (11.77)
E Cash and cash equivalents - opening balance (as at April 1) 11.21 22.98
F Cash and cash equivalents - closing balance (as at March 31) 18.17 11.21
notes
1 The above Cash Flow statement has been prepared under the indirect method as set out in Accounting Standard 3 (AS 3)
‘Cash Flow Statements’ as specified in Companies (Accounting Standards) Rules , 2006
2 Cash and Cash Equivalents - Closing balance include balances aggregating to Rs. 4.22 Crore (Rs. 4.19 Crore) with scheduled
banks in fixed deposits and Margin accounts which is pledged against the bank guarantees and deposit with sales tax
authorities, which are not available for use by the Company.
3 The figures for the previous year have been regrouped where necessary to conform to current period’s classification.
For the year ended March 31,
2011 2010 Rs. Crore Rs. Crore

M A R I C O L I M I T E D
112
SCHEDULE ‘A’ SHARE CAPITAL AUTHORISED 650,000,000 (650,000,000) Equity shares of Re. 1 each (Re. 1 each) 65.00 65.00
150,000,000 (150,000,000) Preference shares of Rs. 10 each (Rs.10 each) 150.00 150.00 215.00 215.00 ISSUED AnD SUBSCRIBED 614,399,550 (609,325,700) Equity shares of Re. 1 each (Re. 1 each) fully paid up 61.44 60.93 (Refer Note 17 (a), Schedule R)The above includes:
(a) 290,000,000 equity shares issued as fully paid bonus shares by capitalisation
of Capital Redemption Reserve.
(b) 265,000,000 equity shares issued as fully paid bonus shares by capitalisation of
General Reserve 61.44 60.93
SCHEDULE ‘B’
RESERVES AnD SURPLUS
SECURITIES PREMIUM ACCOUnT
As on April 1 15.30 13.50
Add : Receipt on exercise of Employees stock options (Refer Note 17(a), Schedule R) 28.08 1.79
Add : Transfer from Employee stock option reserve 0.12 0.01
As at the year end 43.50 15.30
GEnERAL RESERVE
As on April 1 91.66 68.16
Add : Transfer from Profit and Loss account 31.53 23.50
As at the year end 123.19 91.66
EMPLOYEE STOCK OPTIOn RESERVE (Refer Note 17(a), Schedule R)
As on April 1 0.15 0.07
Add : Additions 0.08 0.24
0.23 0.31
Less : Transferred to Securities Premium account 0.12 0.01
Less : Forfeited / Lapsed 0.04 0.15
As at the year end 0.07 0.15
DEBEnTURE REDEMPTIOn RESERVE
As on April 1 15.00 –
Add : Transfer from Profit and Loss account 16.67 15.00
As at the year end 31.67 15.00
FOREIGn CURREnCY TRAnSLATIOn RESERVE (Refer Note 28, Schedule R)
As on April 1 3.23 (1.72)
Adjustments during the year 2.51 4.95
As at the year end 5.74 3.23
HEDGE RESERVE ACCOUnT (Refer Note 14 c, Schedule R)
As on April 1 2.81 (6.26)
Adjustments during the year 2.18 9.07
As at the year end 4.99 2.81
PROFIT AnD LOSS ACCOUnT 602.52 382.58
811.68 510.73
SCHEDULES TO BALAnCE SHEET As at March 31,
2011 2010 Rs. Crore Rs. Crore

M A R I C O L I M I T E D
113
As at March 31,
2011 2010 Rs. Crore Rs. Crore
SCHEDULES TO BALAnCE SHEET
SCHEDULE ‘C’
SECURED LOAnS
Secured Redeemable Non-Convertible Debentures (NCD) (Refer Note 23 a, Schedule R) 30.00 30.00 (Secured against first pari passu charge over Land and Building situated at Andheri (East), Mumbai) From banks :External commercial borrowingsa) Secured by hypothecation of Plant and Machinery 39.01 61.76 (Amount repayable within one year Rs.22.29 Crore (Rs 22.46 Crore))
b) Secured by (i) Pledge of shares of International Consumer Products Corporation 240.76 –
(a Subsidiary company) ; (ii) First ranking pari passu charge over all current and
future plant and machinery and (iii) mortgage on the land and building currently
provided as security to NCD holders, post the repayment of the NCD immediately
and, in any event, within 90 days from such repayment. The documentation for
creation of charge is under progress. (Amount repayable within one year Rs. Nil)
Working capital finance 22.65 7.85 (Secured by hypothecation of stocks in trade and debtors)
332.42 99.61
SCHEDULE ‘D’
UnSECURED LOAnS
From banks :
Short term 77.08 243.22 Commercial Papers (Redeemable within a year) Face Value 95.00 35.00 Less : Deferred interest 2.01 0.91 92.99 34.09
(Maximum amount outstanding during the year Rs. 146.00 Crore (Rs. 104.51 Crore))
Redeemable Non-Convertible Debentures (Refer Note 23 b, Schedule R) 50.00 –
220.07 277.31

M A R I C O L I M I T E D
114
SCHEDULES TO BALAnCE SHEETS
CH
ED
ULE
‘E’
FIx
ED
AS
SE
TS
Rs.
Cro
re
not
es :
1.
Gro
ss b
lock
incl
udes
: - B
uild
ings
Rs.
0.10
cro
re (R
s. 0
.10
cror
e) w
here
con
veya
nce
has
been
exe
cute
d, p
endi
ng re
gist
ratio
n
- P
lant
and
Mac
hine
ry R
s. N
il (R
s. 3
.95
cror
e) b
eing
ass
ets
give
n on
fina
nce
leas
e pr
ior t
o A
pril
1, 2
001.
2.
“Dep
reci
atio
n, a
mor
tisat
ion
and
prov
isio
n fo
r im
pairm
ent”
for
the
year
incl
udes
impa
irmen
t pr
ovis
ion
in r
espe
ct o
f cap
italis
ed a
sset
s R
s.0.
02 C
rore
(R
s. 2
.08
Cro
re)
and
Cap
ital w
ork
in
prog
ress
Rs.
Nil.
(Rs.
2.8
9 C
rore
).
3.
Pro
visi
on fo
r im
pairm
ent a
s at
Mar
ch 3
1, 2
011:
a)
incl
udes
impa
irmen
t as
men
tione
d in
2 a
bove
and
is n
et o
f rev
ersa
l of p
rovi
sion
no
long
er re
quire
d R
s. N
il (R
s. 1
.20
Cro
re) a
nd a
djus
tmen
t on
sale
/ di
scar
d of
the
rela
ted
asse
ts R
s.1.
46
Cro
re (R
s. 0
.13
Cro
re).
b
) in
clud
es p
rovi
sion
for i
mpa
irmen
t of a
sset
s of
Rs.
13.8
8 cr
ore
(Rs.
Nil)
, whi
ch is
incl
uded
und
er ‘E
xcep
tiona
l ite
ms’
in th
e P
rofit
and
Los
s ac
coun
t.(R
efer
Not
e 26
, Sch
edul
e R
)
4.
Dep
reci
atio
n fo
r the
yea
r inc
lude
s ac
cele
rate
d de
prec
iatio
n ch
arge
d R
s. N
il (R
s.1.
56 C
rore
) due
to re
visi
on o
f est
imat
ed u
sefu
l life
of c
erta
in a
sset
s
5.
Trad
emar
ks o
f Rs.
Nil
(Rs.
25.2
0 C
rore
) are
pen
ding
regi
stra
tion.
* re
pres
ents
pre
viou
s ye
ar fi
gure
s
PA
RTI
CU
LAR
SG
RO
SS
BLO
CK
DE
PR
EC
IATI
On
/AM
OR
TIS
ATI
On
nE
T B
LOC
KA
s at
M
arch
31
, 201
0
Ad
diti
ons
Ded
uctio
ns/
Ad
just
men
tsA
s at
M
arch
31,
20
11
As
at
Mar
ch 3
1,
2010
For
the
Year
(S
ee n
ote
2 an
d 4
b
elow
)
Ded
uctio
ns/
Ad
just
men
ts A
s at
M
arch
31,
20
11
Pro
visi
on fo
r im
pai
rmen
t as
at
Mar
ch
31, 2
011
(See
no
te 3
bel
ow)
As
at
Mar
ch 3
1,
2011
As
at
Mar
ch
31, 2
010
Tang
ible
Ass
ets
Free
hold
land
2.4
8 0
.01
–
2.4
9 –
–
–
–
–
2
.49
2.4
8 Le
aseh
old
land
14.
08
8.2
4 –
2
2.32
0
.60
0.3
1 –
0
.91
–
21.
41
13.
48
Bui
ldin
gs (N
ote
1) 5
1.07
5
4.66
–
1
05.7
3 1
4.77
3
.84
–
18.
61
–
87.
12
36.
30
Pla
nt a
nd m
achi
nery
(Not
e 1)
179
.66
68.
88
7.8
8 2
40.6
6 1
17.9
6 1
9.13
6
.71
130
.38
4.6
1 1
05.6
7 5
6.67
Fu
rnitu
re a
nd fi
tting
s 5
.59
2.0
3 0
.10
7.5
2 3
.20
0.6
6 0
.05
3.8
1 –
3
.71
2.3
9 Ve
hicl
es 1
.21
–
0.0
1 1
.20
0.2
2 0
.23
0.0
1 0
.44
–
0.7
6 0
.99
Inta
ngib
le A
sset
s -
Trad
emar
ks a
nd c
opyr
ight
s [N
ote
3 (b
) & 5
] 2
5.20
–
–
2
5.20
7
.91
2.4
1 –
1
0.32
1
4.88
–
1
6.29
- C
ompu
ter s
oftw
are
15.
16
0.9
5 0
.03
16.
08
13.
78
1.0
3 0
.03
14.
78
–
1.3
0 1
.37
TOTA
L 2
94.4
5 1
34.7
7 8
.02
421
.20
158
.44
27.
61
6.8
0 1
79.2
5 1
9.49
2
22.4
6 1
29.9
7 A
s on
Mar
ch 3
1, 2
010
262
.16
36.
64
4.3
5 2
94.4
5 1
40.9
6 2
0.23
2
.75
158
.44
6.0
4 1
29.9
7 –
Cap
ital
wor
k-in
-pro
gres
s (a
t co
st)
incl
udin
g ad
vanc
es o
n ca
pita
l acc
ount
Ass
et h
eld
for d
ispo
sal
47.
38
1.8
6 4
5.52
–
* (1
12.8
4) (2
.89)
–
(109
.95)
0.1
8 –
0
.18
0.0
1 *
(0.0
1) –
–
– 2
1.35
2
68.1
6 2
39.9
3

M A R I C O L I M I T E D
115
SCHEDULES TO BALAnCE SHEET
SCHEDULE ‘F’
InVESTMEnTS (non Trade)
LOnG TERM - UnQUOTED, AT COST
Government Securities :National Savings Certificates (Deposited with Government authorities) 0.01 0.01 0.01 0.01
Subsidiary Companies :Kaya Limited (Wholly Owned) 73.00 73.00 14,500,000 (14,500,000) equity shares of Rs. 10 each fully paidMarico Middle East FZE (Wholly Owned) 27.99 27.99 22 (22) equity share of UAE dirham 1,000,000 (1,000,000) fully paidMarico South Africa Consumer Care (Pty) Limited (Wholly Owned) 25.37 25.37 800 (800) equity shares of SA Rand 1.00 fully paidInternational Consumer Products Corporation 254.98 – 9,535,495 (Nil) equity shares of VND 10,000 fully paid 381.34 126.36
- QUOTED, AT COST
Subsidiary Company :Marico Bangladesh Limited 0.86 0.86 28,350,000 (28,350,000) equity shares of Bangladesh Taka 10 each fully paid(Refer Note 2 below)Others :Indian Infrastructure Finance Company Limited 10.21 10.21 (1,000 Unsecured, 6.85% Non-convertible, tax-free Bonds of face value of Rs. 100,000/- each, guaranteed by Government of India, redeemable on 22nd January, 2014) 11.07 11.07
CURREnT InVESTMEnTS - UnQUOTED, LOWER OF COST AnD FAIR VALUE
Birla Sun Life Cash Manager - Institutional Plan - Growth 10.00 –
6,087,057 (Nil) Units of Rs. 10 each fully paid
Fidelity Ultra Short Term Debt Fund Institutional Plan - Growth – 10.00
NIL (8,399,009) Units of Rs. 10 each fully paid
Templeton India Ultra Short Bond Fund Super Institutional Plan - Growth 7.50 –
5,921,645 (Nil) Units of Rs. 10 each fully paid
Templeton India Ultra Short Bond Fund Super Institutional Plan - Growth 2.50 –
1,987,297 (Nil) Units of Rs. 10 each fully paid
Birla Sun Life Dynamic Bond Fund Retail - Monthly Payout – 2.02
NIL (1,940,982) Units of Rs. 10 each fully paid
Birla Sunlife Saving Fund Institutional Plan - Growth – 3.50
NIL (2,002,208) Units of Rs. 10 each fully paid
Kotak Flexi Debt Scheme Institutional Plan - Growth – 10.05
NIL (8,878,078) Units of Rs. 10 each fully paid
ICICI Prudential Flexible Income Premium Institutional Plan -Growth – 9.85
NIL (575,207) Units of Rs. 100 each fully paid
LIC MF Savings Plus Fund Institutional Plan - Growth – 10.28
NIL (7,029,097) Units of Rs. 10 each fully paid
Templeton India STIR Plan - Weekly Dividend Reinvestment – 3.14
NIL (29,243) Units of Rs. 1000 each fully paid
Tata Treasury Manager Institutional Plan - Growth – 10.09
NIL (96,376) Units of Rs. 1000 each fully paid
As at March 31,
2011 2010 Rs. Crore Rs. Crore

M A R I C O L I M I T E D
116
SCHEDULES TO BALAnCE SHEET
Reliance Money Manager Retail - Daily Dividend Reinvestment – 0.10
NIL (826) Units of Rs. 1000 each fully paid
IDFC Money Manager Fund - TP - Institutional Plan C - Growth 10.00 2.60
8,583,470 (2,380,321) Units of Rs. 10 each fully paid
UTI Floating Rate Fund - Short Term Plan - Institutional Plan - Growth – 10.04
NIL (97,076) Units of Rs. 1000 each fully paid
UTI Treasury Advantage Fund - Growth 10.00 –
75,743 (Nil) Units of Rs. 10 each fully paid
BPBIG ICICI Prudential Blended Plan B - Institutional Growth Option II 10.16 –
9,659,482 (Nil) Units of Rs. 10 each fully paid
DWS Money plus Fund - Institutional Plan Growth 10.16 –
9,865,755 (Nil) Units of Rs. 10 each fully paid
HDFC Floating Rate Income Fund - Short Term Plan - Wholesale option - Growth 9.50 –
5,678,049 (Nil) Units of Rs. 10 each fully paid
JPMorgan India Short Term Income Fund - Growth 8.12 –
7,612,090 (Nil) Units of Rs. 10 each fully paid 77.94 71.67 470.36 209.11
notes:
1) Cost / Market Value of Quoted/ Unquoted Investments Aggregate value of Quoted Investments: Cost 11.07 11.07 Market Value 1,154.80 812.01
Aggregate value of Unquoted Investments: Cost 459.29 198.04
2) Equity shares of Marico Bangladesh Limited were listed on Dhaka Stock exchange on August 28, 2009.
3) Units of Mutual Funds purchased and sold during the year
name of the Scheme Face Value Rs.
no. of Units
Purchase Cost
Rs. Crore
ICICI Prudential Flexible Income Premium - Institutional Plan - Daily Dividend Reinvestment
100 4,112,281 43.48
Prudential ICICI Liquid Plan Super Institutional Plan - Daily Dividend Reinvestment
100 3,204,562 32.05
ICICI Prudential Flexible Income Premium - Institutional Plan -Growth 100 1,183,510 20.35
Prudential ICICI Liquid Plan Super Institutional Plan - Growth 100 1,909,741 26.14
BPBID ICICI Prudential - Blended Plan B - Institutional - Dividend 10 4,853,323 5.03
BPBIG ICICI Prudential Blended Plan B - Institutional Growth Option II 10 9,659,482 10.16
Fortis Money Plus - Institutional Plan - Daily Dividend Reinvestment 10 10,014,509 10.02
Fortis Overnight Fund - Institutional Plan - Daily Dividend Reinvestment 10 1,999,577 2.00
BNP Paribas Overnight Fund - Institutional Plan - Daily Dividend Reinvestment 10 13,128,445 13.13
Tata Floater Fund - Daily Dividend Reinvestment 10 22,849,287 22.93
Tata Treasury Manager Super High Investment Plan - Growth 1000 96,376 10.09
Tata Treasury Manager Super High Investment Plan-Daily Dividend Reinvestment
1000 58,346 6.50
As at March 31,
2011 2010 Rs. Crore Rs. Crore

M A R I C O L I M I T E D
117
name of the Scheme Face Value Rs.
no. of Units
Purchase Cost
Rs. Crore
Tata Floater Fund - Growth 10 11,730,072 16.50
Tata Liquid Fund - Super Institutional Plan - Growth 1000 121,165 21.00
Kotak Flexi Debt Scheme - Institutional Plan - Daily Dividend Reinvestment 10 14,109,459 20.79
Kotak Flexi Debt Scheme - Institutional Plan - Growth 10 8,878,078 10.05
Kotak Liquid Fund - Institutional Plan - Growth 10 5,392,244 10.12
Kotak Liquid Fund - Institutional Plan - Daily Dividend Reinvestment 10 27,388,595 39.45
Kotak Floater - Short term - Daily Dividend 10 4,969,342 5.03
Kotak Floater - Long term - Daily Dividend 10 8,002,417 8.07
LIC Saving Plus Fund - Institutional Plan - Daily Dividend Reinvestment 10 18,297,307 18.30
LIC MF Liquid Fund - Daily Dividend Reinvestment 10 10,019,800 11.00
LIC Saving Plus Fund - Institutional Plan - Growth 10 7,029,097 10.28
LIC Floating Rate Fund - Institutional Plan - Growth 10 6,800,931 10.30
LIC MF Liquid Fund - Growth 10 6,106,415 10.35
LIC MF Income Plus Fund - Daily Dividend Reinvestment 10 6,754,301 6.75
DWS Ultra Short Term Fund - Institutional Daily Dividend Reinvestment 10 10,030,384 10.05
DWS Insta Cash Plus Fund - Super Institutional Plan - Growth 100 8,290,155 10.00
DWS Insta Cash Plus Fund - Institutional Plan - Daily Dividend Reinvestment 100 7,023,486 7.05
DWS Treasury Fund - Cash - Institutional Plan - Daily Dividend Reinvestment 10 10,103,620 10.15
DWS Money plus Fund - Institutional Plan Growth 10 9,865,755 10.15
HDFC Cash Management Fund - Treasury Advantage Plan - Wholesale - Daily Dividend Reinvestment
10 16,996,629 17.05
HDFC Liquid Fund Premium Plan - Daily Dividend Reinvestment 10 10,604,873 13.00
HDFC Floating Rate Income Fund- Short term Fund- wholesale Plan- Growth 10 10,086,119 10.17
HDFC Floating Rate Income Fund - Short Term Plan - Wholesale option - Growth
10 5,678,049 9.50
JP Morgan India Treasury Fund - Super Institutional Plan-Daily Dividend Reinvestment
10 12,027,801 12.04
JP Morgan India Liquid Fund- Super Institutional Plan-Daily Dividend Reinvestment
10 4,497,034 4.50
JP Morgan India Treasury Fund- Super Institutional Plan-Growth 10 5,285,735 6.50
JP Morgan India Liquid Fund- Super Institutional Plan-Growth 10 4,098,730 5.00
JP Morgan India Short Term Income Fund - Weekly Dividend 10 10,104,722 10.13
JP Morgan India Short Term Income Fund - Growth 10 7,612,090 8.12
IDFC Money Manager Fund - Treasury Plan - Super Institutional Plan C - Daily Dividend Reinvestment
10 5,612,381 5.61
IDFC Money Manager Fund - Treasury Plan - Super Institutional Plan C - Growth 10 10,963,791 12.60
IDFC Money Manager - Treasury Plan - Plan C - Daily Dividend 10 10,171,080 10.17
Reliance Money Manager - Institutional Plan - Daily Dividend Reinvestment 1000 65,068 6.52
Reliance Money Manager - Retail Plan - Growth 1000 826 0.10
Reliance Medium Term Fund - Retail Plan - Growth Plan 10 1,830,688 3.50
Reliance Medium Term Fund - Daily Dividend Reinvestment 10 17,273,151 29.53
Reliance Money Manager - Institutional Plan - Growth Option 1000 68,485 8.60
Reliance Liquid Fund - Institutional Plan - Daily Dividend Reinvestment 10 981,301 1.50
SCHEDULES TO BALAnCE SHEET

M A R I C O L I M I T E D
118
name of the Scheme Face Value Rs.
no. of Units
Purchase Cost
Rs. Crore
Reliance Monthly Interval Fund - Series II - Institutional Dividend Plan 10 10,040,662 10.04
Reliance Liquidity Fund - Daily Dividend Reinvestment 10 3,498,599 3.50
Reliance Liquid Fund - Cash Plan - Daily Dividend Reinvestment 10 9,678,426 10.78
Fidelity Ultra Short Term Debt Fund - Institutional Plan - Growth 10 8,399,010 10.00
Templeton India Short Term Income Retail Plan - Weekly Dividend Reinvestment
1000 29,702 3.21
Templeton India Treasury Management Account Super institutional Plan - Daily Dividend Reinvestment
1000 109,939 11.00
Templeton India Ultra Short Bond Fund Super Institutional Plan Daily Dividend Reinvestment
10 30,186,837 30.22
Templeton India Treasury Management Account - Super Institutional Plan - Daily Dividend Reinvestment
1000 59,967 6.00
Templeton India Ultra Short Bond Fund Super Institutional Plan - Growth 10 5,921,645 7.50
Templeton India Ultra Short Bond Fund Institutional Plan - Growth 10 1,987,297 2.50
Birla Sunlife Saving Fund - Institutional Plan - Daily Dividend Reinvestment 10 30,471,103 30.49
Birla Sunlife Saving Fund - Institutional Plan - Growth 10 2,002,208 3.50
Birla Sunlife Cash Plus - Institutional Plan -Daily Dividend Reinvestment 10 4,990,873 5.00
Birla Sun Life Cash Manager - Institutional Plan - Growth 10 13,390,621 21.50
Birla Sun Life Cash Manager - Institutional Plan - Daily Dividend Reinvestment 10 2,753,354 2.75
Birla Sun Life Dynamic Bond Fund - Retail Plan - Monthly Dividend 10 1,940,982 2.02
UTI Floating Rate Fund - Short Term Plan - Institutional Plan - Growth 1000 97,076 10.04
UTI Liquid Cash Plan Institutional - Growth Option 1000 7,976 1.25
UTI Liquid Cash Plan Institutional - Daily Income Option - Reinvestment 1000 93,457 9.53
UTI Floating Rate Fund - Short term plan - Daily Dividend 1000 96,466 9.65
UTI Treasury Advantage Fund - Growth 1000 75,743 10.00
SCHEDULES TO BALAnCE SHEET

M A R I C O L I M I T E D
119
SCHEDULES TO BALAnCE SHEET
SCHEDULE ‘G’
InVEnTORIES(Refer Note 2 (h), Schedule R, for basis of valuation)Raw materials 160.88 161.46 Packing materials 55.67 46.04 Work-in-process 77.73 58.00 Finished products 152.39 98.89 Stores, spares and consumables 5.65 4.49 By-products 1.90 1.02 454.22 369.90
SCHEDULE ‘H’
SUnDRY DEBTORSUnsecuredOver six months - Considered good 2.94 – - Considered doubtful 2.99 3.54 5.93 3.54 Less: Provision for doubtful debts 2.99 3.54 2.94 – Other Debts - Considered good 116.04 94.51 118.98 94.51
SCHEDULE ‘I’
CASH AnD BAnK BALAnCESCash on hand 0.46 0.32 Remittances in transit 4.55 0.36 Balances with scheduled banks:Fixed Deposit 0.13 0.10(Rs.0.13 Crore (Rs. 0.10 Crore) deposited with sales tax authorities and against bank gurantees and Rs.0.18 Crore(Rs Nil) is pledged with bank as collateral for banking facilities) Margin accounts (against bank guarantees) 4.09 4.09 Current accounts * 8.40 6.19 Balances with non - scheduled banks:Current accounts (Refer Note 9, Schedule R) 0.54 0.15 18.17 11.21 * Includes balances in Unclaimed dividend account and UnclaimedPreference Share Capital Rs. 0.26 Crore (Rs. 0.26 Crore)
As at March 31,
2011 2010 Rs. Crore Rs. Crore

M A R I C O L I M I T E D
120
As at March 31,
2011 2010 Rs. Crore Rs. Crore
SCHEDULES TO BALAnCE SHEET
SCHEDULE ‘J’
LOAnS AnD ADVAnCES(Unsecured - considered good, unless otherwise stated)Advances recoverable in cash or in kind or for value to be received 35.87 57.69 Loans and Advances to subsidiaries 177.05 125.89 Deposits - Considered good 18.38 12.55 - Considered doubtful 1.00 1.00 19.38 13.55 Less : Provision for doubtful deposits 1.00 1.00 18.38 12.55 Balances with central excise authorities 0.16 0.70 Interest accrued on loans / deposits 0.65 0.52 Interest accrued on loans / advances to subsidiaries 1.48 0.69 Gratuity (Refer Note 20, Schedule R) – 0.82 Income tax payments (net of provisions) – 2.88 Fringe benefit tax payments (net of provisions) 0.48 0.48 MAT credit entitlement 95.50 51.95 329.57 254.17
SCHEDULE ‘K’
CURREnT LIABILITIESSundry creditors - Due to Micro and Small Enterprises (Refer Note 22, Schedule R) 1.53 – - Others 201.02 209.08 Due to subsidiaries 0.32 1.58 Other liabilities 21.89 12.12 Security deposits 0.25 1.10 Interest accrued but not due on loans 3.16 2.37 Unclaimed dividend 0.23 0.23 Unclaimed Redeemed 8% Preference Share Capital 0.03 0.03 228.43 226.51
SCHEDULE ‘L’
PROVISIOnSIncome tax (net of tax payments) 0.43 – Leave encashment 5.57 5.35 Gratuity (Refer Note 20, Schedule R) 0.18 – Long term service benefits – 1.88 Contingencies (Refer Note 25, Schedule R) – 29.35 Interim dividend 22.11 21.93 Tax on interim dividend 3.67 3.73 31.96 62.24

M A R I C O L I M I T E D
121
SCHEDULES TO BALAnCE SHEET
SCHEDULE ‘M’
OTHER InCOMEIncome from current investments : Profit on sale of units of mutual funds 0.40 0.02 Dividend on Investment in liquid mutual funds 2.34 2.49 Income from long term investments : Dividend from subsidiaries 4.48 4.69 (Tax deducted at source Rs. 0.47 Crore (Rs. 0.46 Crore))Interest income on loans, deposits, etc. 5.18 5.60 (Tax deducted at source Rs. 0.01 Crore (Rs. 0.03 Crore))Miscellaneous income 12.77 9.26 (Refer note 6, Schedule R) 25.17 22.06
SCHEDULE ‘n’
COST OF MATERIALS
Raw materials consumed 1,096.33 830.60
Packing materials consumed 212.68 166.41
Stores and spares consumed 22.54 14.11
Purchase for resale 106.85 85.46
(Increase)/Decrease in stocks
Opening stocks
- Work-in-process 58.01 50.70
- By-products 1.02 1.37
- Finished products 98.89 94.37
Less :
Closing stocks
- Work-in-process 77.73 58.01
- By-products 1.90 1.02
- Finished products 152.39 98.89
(74.10) (11.48)
1,364.30 1,085.10
For the year ended March 31,
2011 2010 Rs. Crore Rs. Crore

M A R I C O L I M I T E D
122
SCHEDULES TO PROFIT AnD LOSS ACCOUnT
SCHEDULE ‘O’
MAnUFACTURInG AnD OTHER ExPEnSES
Employees’ costs :
- Salaries, wages and bonus 91.42 90.34
- Contribution to provident fund and other funds 6.10 4.20
- Long term service benefits 3.05 1.88
- Employee stock compensation expense 0.06 0.08
- Welfare expenses 7.59 6.61
108.22 103.11
Power, fuel and water 9.49 5.24
Contract manufacturing charges 84.91 71.14
Rent and storage charges 24.05 22.80
Repairs :
- Buildings 2.59 2.07
- Machinery 6.30 4.72
- Others 1.77 1.75
Freight, forwarding and distribution expenses 108.58 82.32
Advertisement and sales promotion 213.65 221.65
Rates and taxes 1.07 0.82
Provision for contingencies - Excise Duty — 29.35
(Refer note 25, Schedule R)
Sales tax and cess 10.23 16.61
Commission to selling agents 3.23 3.42
Provision for doubtful debts, advances and deposits * (0.55) 1.47
Printing, stationery and communication expenses 5.26 5.09
Travelling, conveyance and vehicle expenses 16.96 16.64
Royalty 0.29 0.42
Insurance 1.76 1.98
Auditors’ remuneration
- Audit fees 0.46 0.39
- Tax Audit fees 0.09 0.08
- Other services 0.03 0.26
- Out of pocket expenses 0.01 0.01
Exchange losses (net) 1.82 4.90
Miscellaneous expenses 40.90 28.93
(Refer Note 7 , Schedule R)
641.12 625.17
SCHEDULE ‘P’
FInAnCE CHARGESInterest on Fixed period loans 13.68 10.50 Other loans 1.96 2.31 Debentures 2.50 2.23 Bank and other financial charges 11.78 3.26 29.92 18.30 * Represent write back of doubtful debts net of provision for the year.
For the year ended March 31,
2011 2010 Rs. Crore Rs. Crore

123
M A R I C O L I M I T E D
ScheduleS to Profit and loSS accounta
dd
itio
na
l in
for
Ma
tio
n
Sc
he
du
le ‘Q
’
a)
det
ails
of P
rod
uctio
n, t
urno
ver,
op
enin
g S
tock
and
clo
sing
Sto
ck
Am
ount
in R
s. C
rore
Sr
n
o.
Par
ticul
ars
(u
nit
) P
erio
d e
nded
inst
alle
d
cap
acity
(n
ote
i)
op
enin
g S
tock
P
rod
uctio
n P
urch
ases
t
urno
ver
clo
sing
Sto
ck
Qua
ntity
a
mou
nt
Qua
ntity
Q
uant
ity
am
ount
Q
uant
ity
am
ount
Q
uant
ity
am
ount
1
ed
ible
oils
(n
ote
iii)
(M
.t.)
3
1.03
.201
1 2
08,0
00
11,
255.
32
78.
43
125,
684.
28
–
–
141,
869.
12
1,6
95.5
4 1
1,36
9.92
1
09.6
8
31.
03.2
010
170
,000
9
,320
.97
68.
34
117
,485
.47
–
–
131
,780
.03
1,4
76.6
1 1
1,25
5.32
7
8.43
2
hai
r o
ils (
not
e ii)
(
K.l
.)
31.
03.2
011
161
,000
1
,891
.39
15.
72
22,
397.
07
–
–
24,
750.
80
476
.41
3,4
12.2
4 3
8.33
31.
03.2
010
125
,000
2
,060
.98
19.
72
16,
586.
27
– –
2
0,12
0.52
3
82.6
6 1
,891
.39
15.
72
3
oil
See
ds
(M
.t.)
3
1.03
.201
1 –
–
–
–
15,
933.
63
89.0
715
,933
.63
92.3
1–
–
31.
03.2
010
–
–
–
–
19,
896.
32
71.
10
19,
896.
32
82.
83
–
–
4
oth
ers
[(In
cl p
roce
ss fo
ods
and
by
prod
ucts
) and
By
prod
ucts
]
31.
03.2
011
31.
03.2
010
–
–
– –
5.7
6
7.6
8
– –
– –
17.
78
14.
36
– –
82.
61
82.
19
– –
6.2
8
5.7
6
t
ota
l 3
1.03
.201
1 9
9.91
1
06.8
5 2
,346
.87
154
.29
31.
03.2
010
95.
74
85.
46
2,0
24.2
9 9
9.91
I)
a)
The
aud
itors
hav
e re
lied
on th
e in
stal
led
capa
citie
s as
cer
tifie
d by
the
man
agem
ent o
n a
thre
e sh
ift b
asis
, bei
ng te
chni
cal i
n na
ture
.
b)
N
o lic
ense
s ar
e re
quire
d fo
r pro
duct
s m
anuf
actu
red
by th
e co
mpa
ny a
s pe
r Gov
ernm
ent o
f Ind
ia N
otifi
catio
n N
o. S
.O.4
77(E
). da
ted
25th
Jul
y,19
91.
II)
Exc
lude
s pr
oduc
tion
of h
air O
il pr
oduc
ed b
y ot
hers
- 3,
874.
58 (
336
4.66
KL)
III)
Exc
lude
s pr
oduc
tion
of E
dibl
e O
il pr
oduc
ed b
y ot
hers
- 16
,299
.44
( 16
228.
91 M
.T. )

124
M A R I C O L I M I T E D
ScheduleS to Profit and loSS account
for the year ended March 31,
2011 2010
Quantity amount Quantity amount
M.t. rs. crore M.t. rs. crore
Schedule ‘Q’
B) raW MaterialS conSuMed
Oil seeds (copra & kardi seeds) 116,540 490.91 103,887 340.81
Raw oils (other than copra & kardi seeds) 78,372 412.77 74,212 347.43
Others – 192.65 – 142.36
1,096.33 830.60
% amount % amount
rs. crore rs. crore
c) Value of iMPorted and
indiGenouS MaterialS conSuMed
Raw materials
Imported 5.27 57.74 9.96 82.77
Indigenous 94.73 1,038.59 90.04 747.83
100 1,096.33 100.00 830.60
Stores, spares and chemicals
Imported – – – –
Indigenous 100.00 22.54 100.00 14.11
100.00 22.54 100.00 14.11
d) Value of iMPortS on c.i.f. BaSiS
Raw material 32.80 84.45
Packing material 2.70 6.42
Capital goods 0.16 0.50
Finished goods for resale 1.88 3.20
37.54 94.57
e) eXPenditure in foreiGn currencY
Travelling and other expenses 0.39 0.43
Advertisement and sales promotion 2.67 5.62
Interest on other loans 3.78 1.31
Miscellaneous expenses 8.64 0.76
15.48 8.12
f) earninGS in foreiGn eXchanGe
F.O.B. Value of exports 139.16 130.64
Royalty 6.84 6.56
Dividend 4.48 4.69
Interest 4.03 4.41
154.51 146.30

125
M A R I C O L I M I T E D
Schedule ‘r’
noteS to accountS:
1) The Company and nature of its operations:
Marico Limited (‘Marico’ or ‘the Company’), headquartered in Mumbai, Maharashtra, India, carries on business in Branded
Consumer Products. Marico manufactures and markets products under brands such as Parachute, Nihar, Saffola, Hair & Care,
Revive, Shanti, Oil of Malabar, Mediker and Manjal. Marico’s products reach its consumers through retail outlets serviced by
Marico’s distribution network comprising regional offices, carrying & forwarding agents, redistribution centers and distributors
spread all over India.
2) Summary of significant accounting policies:
(a) Basis of preparation of financial statements
The financial statements are prepared in accordance with Indian Generally Accepted Accounting Principles (“GAAP”)
under the historical cost convention on an accrual basis, except for certain financial instruments which are measured at
fair values and are in conformity with mandatory accounting standards, as prescribed by the Companies (Accounting
Standards) Rules, 2006, the provisions of the Companies Act, 1956 and guidelines issued by the Securities and Exchange
Board of India (SEBI).
(b) Use of estimates
The preparation of the financial statements in conformity with GAAP requires Management to make estimates and
assumptions that affect the reported balances of assets and liabilities and disclosures relating to contingent assets and
liabilities as at the date of the financial statements and reported amounts of income and expenses during the period.
Examples of such estimates include provisions for doubtful debts, future obligations under employee retirement benefit
plans, income taxes, the useful lives and provision for impairment of fixed assets and intangible assets.
Management believes that the estimates used in the preparation of financial statements are prudent and reasonable.
Future results could differ from these estimates.
(c) Fixed assets, intangible assets and capital work-in-progress
Fixed assets and intangible assets are stated at cost of acquisition, less accumulated depreciation and impairments, if
any. Cost includes taxes, duties, freight and other incidental expenses related to acquisition and installation. Borrowing
costs attributable to acquisition, construction of qualifying asset (i.e. an asset requiring substantive period of time to
get ready for intended use) are capitalized in accordance with the requirements of Accounting Standard 16 (AS 16),
“Borrowing Costs” mandated by Rule 3 of the Companies (Accounting Standards) Rules 2006. Other pre-operative
expenses for major projects are also capitalised, where appropriate.
Capital work-in-progress comprises outstanding advances paid to acquire fixed assets and cost of fixed assets that
are not yet ready for their intended use at the year end.
(d) Depreciation and amortisation
I. Tangible assets
(i) Depreciation is provided at higher of the rates based on useful lives of the assets as estimated by the
management or those stipulated in Schedule XIV to the Companies Act, 1956. The depreciation rates considered
for the following items are higher than the rates stipulated in Schedule XIV to the Companies Act, 1956:
Plant and Machinery:
a) Computer hardware and related peripherals - 33.33%
b) Moulds - 16.21%
c) Office Equipment - 10% to 50%
Furniture and Fittings: - 12.50 %
Vehicles: - 20 %
noteS to the accountS

126
M A R I C O L I M I T E D
noteS to the accountS
(ii) Depreciation on factory building and plant and machinery (other than items specified in (i) above) is provided
on written down value basis. Depreciation on all other assets is provided on straight line basis.
(iii) Extra shift depreciation is provided on “Plant” basis.
(iv) Assets individually costing Rs. 5,000 or less are depreciated fully in the year of acquisition.
(v) Leasehold land is amortised over the primary period of the lease.
(vi) Fixtures in leasehold premises are amortised over the primary period of the lease.
(vii) Depreciation on additions / deletions during the year is provided from the month in which the asset is capitalized
/ up to the month in which the asset is disposed off.
II. Intangible assets
Intangible assets are amortised over their respective individual estimated useful lives on a straight line basis, but
not exceeding the period given here under:
Trademarks, copyrights and business & commercial rights 10 years
Computer software 3 years
(e) Assets taken on lease
(i) In respect of finance lease arrangements, the assets are capitalized and depreciated. Finance charges are charged
off to the Profit and Loss account of the year in which they are incurred.
(ii) Operating lease payments are recognized as expenditure in the Profit and Loss account as per the terms of the
respective lease agreement.
(f) Asset given on lease
The Company has given Plant and Machinery on an operating lease basis. Lease rentals are accounted on accrual
basis in accordance with the respective lease agreements.
(g) Investments
(i) Long term investments are valued at cost. Provision for diminution, if any, in the value of investments is made to
recognise a decline in value, other than temporary.
(ii) Current investments are valued at lower of cost and fair value, computed individually for each investment. In case
of investments in mutual funds which are unquoted, net asset value is taken as fair value.
(h) Inventories
(i) Raw materials, packing materials, stores, spares and consumables are valued at lower of cost and net realizable
value. However, these items are considered to be realizable at cost if the finished products in which they will be
used are expected to be sold at or above cost.
(ii) Work-in-process and finished products are valued at lower of cost and net realizable value.
(iii) By-products and unserviceable / damaged finished products are valued at net realizable value.
(iv) Cost is ascertained on weighted average method and in case of work-in-process includes appropriate production
overheads and in case of finished products includes appropriate production overheads and excise duty, wherever
applicable.
(i) Research and development
Capital expenditure on research and development is capitalised and depreciated as per the accounting policy mentioned
in para 2(d) above. Revenue expenditure is charged off in the year in which it is incurred.

127
M A R I C O L I M I T E D
noteS to the accountS
(j) Revenue recognition
(i) Domestic sales are recognised at the point of dispatch of goods to the customers, which is when risks and rewards
of ownership are passed to the customers, and stated net of trade discount and exclusive of sales tax and excise
duty.
(ii) Export sales are recognised based on the date of bill of lading except, sales to Nepal which are recognized when
the goods cross the Indian territory, which is when risks and rewards of ownership are passed to the customers.
(iii) Revenue from services is recognized on rendering of the services.
(iv) Interest and other income are recognised on accrual basis.
(k) Retirement and other benefits to employees
– Gratuity
Liabilities with regard to the gratuity benefits payable in future are determined by actuarial valuation at each Balance
Sheet date using the Projected Unit Credit method and contributed to Employees Gratuity Fund managed by
HDFC Standard Life Insurance Limited. Actuarial gains and losses arising from changes in actuarial assumptions
are recognised in the Profit and Loss account in the period in which they arise.
– Superannuation
The Company makes contribution to the Superannuation Scheme, a defined contribution scheme, administered
by ICICI Prudential Life Insurance Company Limited.
– Leave encashment / Compensated absences
The Company provides for the encashment of leave with pay subject to certain rules. The employees are entitled
to accumulate leave subject to certain limits, for future encashment / availment. The liability is provided based
on the number of days of unutilized leave at each balance sheet date on the basis of an independent actuarial
valuation.
– Provident fund
Provident fund contributions are made to a trust administered by the Company and are charged to the Profit and
Loss account. The Company has an obligation to make good the shortfall if any, between return on investment
by the trust and government administered interest rate.
– Long term service benefits
Liability on account of long term service benefits is determined and provided on the basis of an independent
actuarial valuation.
(l) Foreign currency transactions
– Transactions in foreign currencies are recognized at the prevailing exchange rates on the transaction dates. Realized
gains and losses on settlement of foreign currency transactions are recognized in the Profit and Loss account.
– Foreign currency monetary assets and liabilities at the year end are translated at the year end exchange rates and
the resultant exchange differences except those qualifying for hedge accounting are recognised in the Profit and
Loss account.
– In case of forward contracts with underlying assets or liabilities, the difference between the forward rate and the
exchange rate on the date of inception of a forward contract is recognized as income or expense and is amortized
over the life of the contract. Exchange differences on such contracts are recognized in the Profit and Loss account
in the year in which they arise.
– The Company uses forward and options contracts to hedge its risks associated with foreign currency transactions
relating to certain firm commitments and forecasted transactions. The Company also uses Interest rates swap

128
M A R I C O L I M I T E D
noteS to the accountS
contracts to hedge its interest rate risk exposure. The Company designates these as cash flow hedges. These
contracts are marked to market as at the year end and resultant exchange differences, to the extent they represent
effective portion of the hedge, are recognized directly in ‘Hedge Reserve account’. The ineffective portion of the
same is recognized immediately in the Profit and Loss account.
– Exchange differences taken to Hedge Reserve account are recognised in the Profit and Loss account upon
crystallization of firm commitments or occurrence of forecasted transactions or upon discontinuation of hedge
accounting resulting from expiry / sale / termination of hedge instrument or upon hedge becoming ineffective.
– Non-monetary foreign currency items are carried at cost / fair value and accordingly the investments in shares
of foreign subsidiaries are expressed in Indian currency at the rate of exchange prevailing at the time when the
original investments are made or fair values determined.
– Exchange differences arising on monetary items that in substance form part of Company’s net investment in a
non-integral foreign operation are accumulated in a ‘Foreign Currency Translation Reserve’ until the disposal of
the net investment. The same is recognized in the Profit and Loss account upon disposal of the net investment.
(m) Accounting for taxes on income
(i) Provision for current tax is made, based on the tax payable under the Income Tax Act, 1961. Minimum Alternative
Tax (MAT) credit, which is equal to the excess of MAT (calculated in accordance with provisions of section 115JB
of the Income tax Act, 1961) over normal income-tax is recognized as an asset by crediting the Profit and Loss
account only when and to the extent there is convincing evidence that the Company will be able to avail the said
credit against normal tax payable during the period of ten succeeding assessment years.
(ii) Deferred tax on timing differences between taxable income and accounting income is accounted for, using the
tax rates and the tax laws enacted or substantially enacted as on the balance sheet date. Deferred tax assets
on unabsorbed tax losses and unabsorbed tax depreciation are recognised only when there is a virtual certainty
of their realisation. Other deferred tax assets are recognised only when there is a reasonable certainty of their
realisation.
(n) Impairment
The Company reviews the carrying values of tangible and intangible assets for any possible impairment at each balance
sheet date. An impairment loss is recognised when the carrying amount of an asset exceeds its recoverable amount.
The recoverable amount is the greater of net selling price and value in use. In assessing the value in use, the estimated
future cash flows are discounted to their present value at appropriate discount rates. If at the balance sheet date there
is an indication that a previously assessed impairment loss no longer exists, the recoverable amount is reassessed and
the asset is reflected at the recoverable amount.
(o) Employee Stock Option Plan
In respect of stock options granted pursuant to the Company’s Employee Stock Option Scheme, the intrinsic value of
the options (excess of market value of shares over the exercise price of the option at the date of grant) is recognised
as Employee compensation cost over the vesting period.
(p) Employee Stock Appreciation Rights Scheme
In respect of Employee Stock appreciation rights granted pursuant to the Company’s Employee Stock Appreciation
Rights Scheme, the intrinsic value of the rights (excess of market value as at the year end and the market price on the
date of grant) is recognised as Employee compensation cost over the vesting period.
(q) Contingent liabilities
Contingent Liabilities are disclosed in respect of possible obligations that arise from past events but their existence
will be confirmed by the occurrence or non occurrence of one or more uncertain future events not wholly within the
control of the Company or where any present obligation cannot be measured in terms of future outflow of resources

129
M A R I C O L I M I T E D
noteS to the accountS
or where a reliable estimate of the obligation cannot be made. A Provision is made based on a reliable estimate when
it is probable that an outflow of resources embodying economic benefits will be required to settle an obligation and in
respect of which a reliable estimate can be made. Provision is not discounted and is determined based on best estimate
required to settle the obligation at the year end date. Contingent Assets are not recognized or disclosed in the financial
statements.
(r) Share issue expenses
Expenses incurred on issues of shares are adjusted against securities premium.
3) a) Contingent liabilities not provided for in respect of:
(i) Disputed tax demands/ claims:
Rs. Crore
March 31, 2011 March 31, 2010
Sales tax 17.24 6.08
Customs duty 0.40 0.40
Agricultural Produce Marketing cess 8.14 7.93
Employees State Insurance Corporation 0.13 0.13
Excise duty on Subcontractors 0.29 0.24
(ii) Excise duty on CNO dispatches Rs. 210.74 Crore (Rs.131.57 Crore) (Refer note 25 below)
(iii) Claims against the Company not acknowledged as debts Rs. 0.27 Crore (Rs.0.22 Crore)
(iv) Possible indemnification obligations under the Deed of Assignment for assignment of “Sweekar” brand, in the
event the Company is unable to reinstate the trademark registration number in the records of the trademark registry
within a period of six months from the date of execution of the deed - Rs. 4.00 Crore (Refer note 24 below).
b) (i) Corporate guarantees given to banks on behalf of subsidiaries for credit and other facilities granted by banks Rs.
137.44 Crore (Rs.41.40 Crore) . The credit and other facilities availed by the subsidiaries as at the year end is Rs.
59.04 Crore (Rs.7.02 Crore)
(ii) Stand by Letter of Credit given to banks on behalf of subsidiaries for credit and other facilities granted by banks
Rs.108.47 Crore (Rs.76.45 Crore). The credit and other facilities availed by the subsidiaries as at the year end is
Rs. 96.65 Crore (Rs. 54.14 Crore)
(iii) Bank guarantees given to statutory authorities Rs. 12.26 Crore (Rs.7.08 Crore)
c) Amount outstanding towards Letters of Credit Rs. Nil (Rs. 2.81 Crore)
4) Estimated amount of contracts remaining to be executed on capital account and not provided for Rs. 54.48 Crore (Rs. 21.22
Crore) net of advances.
5) Borrowing costs capitalized during the year amount to Rs. 0.42 Crore (Rs. 2.83 Crore).
6) Miscellaneous income includes lease income Rs. 0.39 Crore (Rs.0.43 Crore), profit on sale / disposal of assets (net) Rs. 0.08
Crore (Rs.0.09 Crore), royalty from subsidiaries Rs. 6.84 Crore (Rs. 6.56 Crore) and export subsidy Rs. 3.54 Crore (Rs.1.00
Crore).
7) Miscellaneous expenses include labour charges Rs. 4.53 Crore (Rs. 2.06 Crore), training and seminar expenses Rs. 4.62
Crore (Rs. 3.47 Crore), outside services Rs. 2.22 Crore (Rs. 2.21 Crore) and professional charges Rs. 18.34 Crore (Rs.
13.42 Crore),donations Rs. 0.04 Crore (Rs. 0.43 Crore) and capital advance written off Rs. 1.00 Crore and are net of excess
provisions no longer required written back Rs. 1.96 Crore ( Rs. 7.54 Crore) [including Impairment provision of Rs. 1.03 Crore
(Rs.1.20 Crore)].
8) Research and Development expenses aggregating Rs. 7.53 Crore (Rs. 7.54 Crore) have been included under the relevant
heads in the Profit and Loss account.

130
M A R I C O L I M I T E D
9) Details of balances with non-scheduled banks are as under:
Rs. Crore
Bank name Balance as on
March 31, 2011
Balance as on
March 31, 2010
Maximum balance
during the year
ended March 31, 2011
Maximum balance
during the year ended
March 31, 2010
Standard Chartered Bank
– Dubai
0.15 0.15 0.17 0.17
HSBC Vietnam - Current
Account
0.39 Nil 250.40 Nil
HSBC Vietnam - Capital
Account
Nil Nil 162.56 Nil
0.54 0.15
10) Additional information on assets taken on lease:
The Company’s significant leasing arrangements are in respect of residential flats, office premises, warehouses, vehicles
etc taken on lease. The arrangements range between 11 months to 3 years and are generally renewable by mutual consent
or mutually agreeable terms. Under these arrangements refundable interest-free deposits have been given.
Rs. Crore
March 31, 2011 March 31, 2010
Lease rental payments recognised in the Profit and Loss account. 19.57 9.26
in respect of assets taken on non cancelable operating lease:
lease obligations
Future minimum lease rental payments
- not later than one year 1.18 1.16
- later than one year but not later than five years 0.96 0.88
total 2.14 2.04
11) Additional information on assets given on operating lease:
The Company has given on lease certain plant & machinery for a lease period ranging between 1 to 3 years. These arrangements
are in the nature of cancelable lease and are generally renewable by mutual consent or mutual agreeable terms.
Fixed Asset given on operating lease as at March 31, 2011 and March 31, 2010
Rs. Crore
cost accumulated depreciation net Book Value
Plant and Machinery 2.03 1.94 0.09
(2.03) (1.92) (0.11)
The aggregate depreciation charged on the above assets during the period ended March 31, 2011 amounted to Rs. 0.02
Crore (Rs. 0.03 Crore).
Rs. Crore
March 31, 2011 March 31, 2010
Lease rental income recognised in the Profit and loss account. 0.39 0.43
noteS to the accountS

131
M A R I C O L I M I T E D
12) a) Break-up of deferred tax asset:
Rs. Crore
March 31, 2011 March 31, 2010
deferred tax asset:
Provision for doubtful debts / advances that are deducted for tax purposes
when written off
1.15 1.54
On intangible assets adjusted against Capital Redemption Reserve and
Securities Premium Account under the Capital Restructuring scheme
implemented in an earlier year
36.53 48.91
Liabilities / Provisions that are deducted for tax purposes when paid:
- Provision for contingencies – Excise Nil 9.75
(Refer Note 25 of Schedule R)
- Others 2.50 2.54
Total Deferred tax asset 40.18 62.74
deferred tax liability:
Additional depreciation on fixed assets for tax purposes due to higher tax
depreciation rates
13.64 4.24
Total Deferred tax liability 13.64 4.24
deferred tax asset (net) 26.54 58.50
b) MAT Credit includes Rs. Nil (Rs. 2.67 Crore) on account of prior year adjustments.
13) Details of Exceptional Items disclosed in the Profit and Loss account are as under:
Rs. Crore
March 31, 2011 March 31, 2010
Reversal of provision for excise duty (Refer Note 25 below) 29.35 Nil
Profit on divestment of “Sweekar” brand (Refer Note 24 below) 50.00 Nil
Provision for impairment of “Fiancée” trademark (Refer Note 26 below) (13.88) Nil
Loss on sale of investment in Sundari LLC. Nil 6.05
Less: Withdrawals from the provisions made in earlier years Nil 6.05
net income shown as exceptional items 65.47 nil
14) Derivative Transactions:
a) The total derivative instruments outstanding as on year end March 31, 2011 are Plain Forwards and Interest rate swap:
March 31, 2011 March 31, 2010
notional amount
in foreign
currency
equivalent amount in
rs. at the year end *
(rs. crore)
notional amount
in foreign
currency
equivalent amount
in rs. at the year end
(rs. crore)
forward contracts
outstanding **
Exports:
- in USD 6,000,000 26.75 4,250,000 19.09
Foreign currency
loans:
- in USD 12,308,344 54.88 11,847,085 53.21
Creditors:
- in USD 5,000,000 22.29 2,057,775 9.24
- in AUD 297,898 1.37 Nil Nil
noteS to the accountS

132
M A R I C O L I M I T E D
March 31, 2011 March 31, 2010
notional amount
in foreign
currency
equivalent amount in
rs. at the year end *
(rs. crore)
notional amount
in foreign
currency
equivalent amount
in rs. at the year end
(rs. crore)
Advance Receivable:
- in AUD Nil Nil 600,000 2.47
Loan to subsidiary:
- in ZAR 19,000,000 12.51 Nil Nil
options contracts
outstanding
Exports:
- in USD Nil Nil 7,250,000 32.57
*Converted into the exchange rate at the year end.
**Out of the forward contracts outstanding as on March 31, 2011, USD 11,000,000 (USD 6,307,775), AUD 297,898
(AUD 600,000), having fair value of Rs. 52.01 Crore (Rs. 31.19 Crore) and all outstanding option contracts as on March
31, 2011, having fair value of Rs. Nil (Rs. 1.01 Crore ) have been designated as Cash Flow hedges.
– The Company has entered into Interest rate swap of USD 8,750,000 (USD 4,583,333), for hedging its interest rate
exposure on borrowings in foreign currency which has a fair value of Rs. 0.34 Crore (Rs. 0.63 Crore).
– The Cash flows are expected to occur and impact the Profit and Loss account within the period of 1 year except
interest rate swap, in respect of which Cash Flows are expected to occur and impact the Profit and Loss account
within the period of 1 to 2 years (1 to 3 years).
– All the derivative contracts entered by the Company were for hedging purpose and not for any speculative purpose.
b) The Net foreign currency exposures not hedged as at the year end are as under:
currency March 31, 2011 March 31, 2010
amount
in foreign
currency
equivalent
amount in rs.
at the year end
(rs. crore)
amount
in foreign
currency
equivalent
amount in rs.
at the year end
(rs. crore)
a. amount receivable in foreign
currency on account of following :
- Export of goods AED 4,988 0.01 4,988 0.01
USD Nil Nil Nil Nil
b. amount (payable) / receivable in
foreign currency on account of
following :
(i) Import of goods and services AED 65,000 0.08 45,075 0.06
AUD Nil Nil 188,288 0.61
EUR (5,038) (0.03) (5,303) (0.03)
CHF Nil Nil 20,600 0.09
GBP Nil Nil 291 0.01
SGD 121 0.01 Nil Nil
USD Nil Nil Nil Nil
(ii) Capital imports CHF 680 0.01 680 0.01
GBP 800 0.01 800 0.01
(iii) Loan payables * USD Nil Nil Nil Nil
noteS to the accountS

133
M A R I C O L I M I T E D
currency March 31, 2011 March 31, 2010
amount
in foreign
currency
equivalent
amount in rs.
at the year end
(rs. crore)
amount
in foreign
currency
equivalent
amount in rs.
at the year end
(rs. crore)
c. Bank Balances USD 215,186 0.96 96,115 0.43
VND 2,089,001 0.01 Nil Nil
d. other receivable / (Payable) USD 8,288 0.04 14,368 0.06
AED (4,447) (0.01) (4,447) (0.01)
EUR 600 0.01 Nil Nil
e. other loans and advances to
Subsidiaries including interest
accrued
AED
TAKA
USD
ZAR
EGP
SGD
2,290,417
120,335,640
313,727
62,312,333
371,830
64,175
2.78
7.40
1.40
41.01
0.28
0.23
2,274,527
63,726,807
209,641
61,183,253
595,482
Nil
2.78
4.11
0.94
37.73
0.49
Nil
*excludes Loans payable of rs. 279.77 crore [uSd 62,750,000] (Rs. 61.76 Crore [USD 13,750,000]) assigned to
hedging relationship against highly probable forecast sales. The Cash flows are expected to occur and impact the Profit
and Loss account within the period of 1 to 6 years.
c) Pursuant to the Announcement of the Institute of Chartered Accountants of India’s (ICAI) “Accounting for Derivatives” on
encouraging the early adoption of Accounting Standard (AS) 30, “Financial Instruments: Recognition and Measurement”,
the Company had, during the year ended March 31, 2009, decided an early adoption of AS 30 to the extent it does not
conflict with existing mandatory accounting standards and other authoritative pronouncements, Company Law and other
regulatory requirements. Accordingly the net unrealised gain/(loss) of Rs. 4.99 Crore [P.Y Rs. 2.81 Crore] in respect of
outstanding derivative instruments and foreign currency loans at the year end which qualify for hedge accounting, is
standing in the ‘Hedge Reserve Account’, which would be recognised in the Profit and Loss account when the underlying
transaction or forecast revenue arises.
15) Earnings per share:
March 31, 2011 March 31, 2010
Profit after taxation / Profit available to equity share holders (rs. crore) 315.32 235.02
Equity shares outstanding as at the year end 614,399,550 609,325,700
Weighted average number of equity shares used as denominator for calculating
basic earnings per share
612,569,618 609,150,561
Weighted average number of equity shares used as denominator for calculating
diluted earnings per share
615,400,555 611,557,579
Nominal value per equity share (Refer note below) Re. 1 Re. 1
Basic earnings per equity share rs. 5.15 rs. 3.86
*diluted earnings per equity share rs. 5.12 rs. 3.84
*Diluted EPS has been calculated after taking into account options granted to certain eligible employees as referred in note
17 below.
noteS to the accountS

134
M A R I C O L I M I T E D
noteS to the accountS
16) Segment Information
The Company has only one reportable segment in terms of Accounting Standard 17 (AS 17) ‘Segment Reporting’ mandated
by Rule 3 of the Companies (Accounting Standard) Rules 2006, which is manufacturing and sale of consumer products and
geographical segments are insignificant.
17) a) Employee Stock Option Scheme 2007
The Corporate Governance Committee of the Board of Directors of Marico Limited has granted Stock Options to certain
eligible employees pursuant to the Marico ‘Employees Stock Options Scheme 2007’. Each option represents 1 equity
share in the Company. The Vesting period and the Exercise Period both range from 1 year to 5 years. Pursuant to
exercise of 5,073,850 (325,700) options during the year, the issued and subscribed share capital has increased by Rs.
0.51 Crore (Rs.0.03 Crore) to Rs. 61.44 Crore (Rs. 60.93 Crore) and Securities Premium account has increased by Rs.
28.20 Crore (Rs. 1.80 Crore) to Rs. 43.50 Crore (Rs. 15.30 Crore). The options outstanding as on the Balance sheet
date correspond to about 0.39% (1.28%) of the current paid up equity capital of the Company.
number of options granted, exercised and forfeited March 31, 2011 March 31, 2010
Options outstanding at beginning of the year 7,816,800 8,339,600
Granted Nil 1,332,100
Less : Exercised 5,073,850 325,700
Forfeited / Lapsed 354,900 1,529,200
Options outstanding at the end of the year 2,388,050 7,816,800
The Company has applied the intrinsic value based method of accounting for determining compensation cost for its
stock based compensation plan and has accordingly accounted during the year Rs. 0.04 Crore (Rs. 0.08 Crore) as
compensation cost under the ‘intrinsic value’ method. Had the Company considered ‘fair value’ method for accounting
of compensation cost the Company’s net income and Basic and Diluted earnings per share as reported would have
reduced to the pro-forma amounts as indicated:
Particulars March 31, 2011 March 31, 2010
Net Profit after tax as reported (Rs. Crore) 315.32 235.02
Less : Stock-based employee compensation expense (Rs. Crore) 1.76 3.91
Adjusted pro-forma (Rs. Crore) 313.56 231.11
Basic earnings per share as reported Rs. 5.15 Rs. 3.86
Pro-forma basic earnings per share Rs. 5.12 Rs. 3.79
Diluted earnings per share as reported Rs. 5.12 Rs.3.84
Pro-forma diluted earnings per share Rs. 5.10 Rs. 3.78
b) The Corporate Governance Committee has granted stock appreciation rights to certain eligible employees pursuant to
the Company’s Employee Stock Appreciation Rights Scheme, 2011(“Scheme”) . The vesting period under the Scheme
is from March 28, 2011 to September 30, 2013. Under the Scheme, the respective employees are entitled to receive
excess of the maturity price over the grant price subject to fulfillment of certain conditions. The stock appreciation rights
equivalent to 2,874,000 shares were granted to employees which were outstanding as at the year end and difference
between the market price of Company’s shares as at the year end and the grant price is recognized over the vesting
period amounting to Rs. 0.02 Crore in the Profit and Loss account.

135
M A R I C O L I M I T E D
noteS to the accountS
18) Related Party disclosures :
a) Subsidiary: Marico Bangladesh Limited (90% holding by Marico Limited)
March 31, 2011
rs. crore
March 31, 2010
rs. crore
nature of transactionstransactions during the year1) Sales 98.65 89.282) Royalty income 3.68 2.953) Dividend income 4.48 4.694) Sale of assets Nil 0.76Balances1) Debtors 5.71 2.692) Investments 0.86 0.863) Loans and advances 7.58 4.32Maximum balance 11.04 10.534) Corporate guarantees given to a bank Nil 33.40
b) Subsidiary: MBL Industries Limited (100% holding by Marico Middle East FZE)
March 31, 2011
rs. crore
March 31, 2010
rs. crorenature of transactionstransactions during the year1) Sales Nil 0.56Balances1) Loan and advances 0.22 0.23
Maximum balance 0.26 0.26
c) Subsidiary: Marico Middle East FZE (100% holding by Marico Limited)
March 31, 2011
rs. crore
March 31, 2010
rs. crore
nature of transactions
transactions during the year
1) Sales 27.29 33.35
2) Royalty income 2.84 2.92
3) Interest income 0.26 0.54
4) Payments made on behalf of Subsidiary 0.81 0.38
5) Loans and advances recovered 34.68 31.46
6) Loans and advances given 30.33 21.19
7) Other expenses recovered by Subsidiary Nil 0.12
8) Stand by Letter of Credit issued to bank 40.68 23.84
9) Investments Nil 26.76
Balances
1) Debtors 10.76 7.87
2) Investments 27.99 27.99
3) Loans and advances 3.00 3.00
Maximum balance 31.47 25.65
4) Interest accrued on loans
Maximum Balance
0.01
0.03
0.01
0.34
5) Stand by Letter of Credit issued to a bank 106.02 67.47

136
M A R I C O L I M I T E D
d) Subsidiary: Kaya Limited (100% holding by Marico Limited)
March 31, 2011
rs. crore
March 31, 2010
rs. crore
nature of transactions
transactions during the year
1) Payments made on behalf of Subsidiary (Net) 8.43 3.06
2) Loans and advances given 130.98 0.77
3) Loans and advances recovered 103.13 22.97
Balances
1) Investments 73.00 73.00
2) Loans and advances 112.92 79.97
Maximum balance 186.70 79.97
3) Corporate guarantees given to a bank 8.00 8.00
e) Subsidiary: Kaya Middle East FZE. (100% subsidiary of Marico Middle East FZE)
March 31, 2011
rs. crore
March 31, 2010
rs. crore
nature of transactions
transactions during the year
1) Loans and advances recovered 0.01 1.01
2) Payments made on behalf of Subsidiary Nil 0.01
Balances
1) Loans and advances Nil 0.01
Maximum balance 0.02 1.07
f) Subsidiary: Sundari LLC. (100% holding by Marico Limited upto June 8, 2009)
March 31, 2011
rs. crore
March 31, 2010
rs. crore
nature of transactions
transactions during the year
1) Loss on sale of Investments Nil 6.05
2) Withdrawals from the provisions made in earlier years Nil 6.05
3) Sale of Investments Nil 0.01
Balances
1) Loans and advances Nil Nil
noteS to the accountS

137
M A R I C O L I M I T E D
g) Subsidiary: MEL Consumer Care (100% holding by Marico Middle East FZE)
March 31, 2011
rs. crore
March 31, 2010
rs. crore
nature of transactions
transactions during the year
1) Repayment of amount due to subsidiary 0.05 Nil
2) Recovery of Stand by Letter of Credit Charges Nil 0.02
3) Stand by Letter of Credit cancelled Nil 18.04
4) Loans and advances recovered Nil 0.40
5) Advances from Subsidiary Nil 0.07
Balances
1) Loans and advances Nil Nil
Maximum balance Nil 0.40
2) Due to Subsidiary Nil 0.05
3) Stand by Letter of Credit to a bank Nil 8.98
h) Subsidiary: Marico Egypt Industries Company (100% holding by MEL Consumer Care)
March 31, 2011
rs. crore
March 31, 2010
rs. crore
nature of transactions
transactions during the year
1) Purchases 1.18 1.76
2) Royalty income 0.25 0.52
3) Payments made on behalf of Subsidiary 0.44 0.09
Balances
1) Loans and advances 0.67 0.61
Maximum balance 1.07 0.95
2) Due to Subsidiary 0.31 1.10
i) Subsidiary : Egyptian American Investment & Industrial Development Company
(100 % holding by Marico Middle East FZE)
March 31, 2011
rs. crore
March 31, 2010
rs. crore
nature of transactions
transactions during the year
1) Royalty income 0.07 0.17
2) Payments on behalf of Subsidiary Nil 0.09
3) Purchases 0.56 1.54
Balances
1) Loans and advances 0.07 0.26
Maximum balance 0.28 0.28
2) Due to Subsidiary 0.10 0.43
noteS to the accountS

138
M A R I C O L I M I T E D
noteS to the accountS
j) Subsidiary: Marico South Africa Consumer Care (Pty) Limited (100 % holding by Marico Limited)
March 31, 2011
rs. crore
March 31, 2010
rs. crore
nature of transactions
transactions during the year
1) Interest income 3.77 3.87
2) Loans and advances given 12.08 Nil
Balances
1) Investments 25.37 25.37
2) Loans and advances 52.04 37.01
Maximum balance 53.99 39.68
3) Interest accrued on Loans and Advances 1.47 0.68
Maximum balance 1.47 1.98
k) Subsidiary: Marico South Africa (Pty) Limited (100 % holding by Marico South Africa Consumer Care (Pty) Limited)
March 31, 2011
rs. crore
March 31, 2010
rs. crore
nature of transactions
transactions during the year
1) Payments made on behalf of Subsidiary 0.06 0.24
2) Sale of assets Nil 0.25
Balances
1) Loans and advances 0.06 0.48
Maximum balance 0.56 0.48
2) Corporate guarantees given to a bank 44.58 Nil
l) Subsidiary: Marico Malaysia Sdn. Bhd. (100% holding by Marico Middle East FZE)
March 31, 2011
rs. crore
March 31, 2010
rs. crore
nature of transactions
transactions during the year
1) Expenses paid on behalf of Subsidiary 0.26 Nil
2) Standby Letter of Credit given to a bank 2.23 Nil
Balances
1) Loans and advances 0.26 Nil
Maximum balance 0.26 Nil
2) Stand by Letter of Credit given to a bank 2.45 Nil
m) Subsidiary: International Consumer Products Corporation (85% holding by Marico Limited) (w.e.f. February 18, 2011)
March 31, 2011
rs. crore
March 31, 2010
rs. crore
nature of transactions
transactions during the year
1) Investments 254.98 Nil
Balances
1) Investments 254.98 Nil

139
M A R I C O L I M I T E D
noteS to the accountS
n) Subsidiary: Derma – Rx International Aesthetics Pte. Ltd. (100% holding by Kaya Limited) (w.e.f. May 22, 2010)
March 31, 2011
rs. crore
March 31, 2010
rs. crorenature of transactionstransactions during the year1) Corporate guarantee commission Income 0.23 Nil2) Corporate guarantee given to a bank 82.93 NilBalances1) Loans and Advances 0.23 Nil
Maximum Balance 0.23 Nil2) Corporate guarantees given to a bank 84.86 Nil
o) Subsidiary firm: Wind Company (99% stake by MEL Consumer Care SAE)
March 31, 2011
rs. crore
March 31, 2010
rs. crorenature of transactionstransactions during the year1) Sales 1.88 1.822) Sale of assets Nil 0.12Balances1) Debtors Nil 0.02
p) Enterprise over which Key Managerial Personnel exercise significant influence: The Bombay Oil Private Limited
March 31, 2011
rs. crore
March 31, 2010
rs. crore
nature of transactions
transactions during the year
1) Rent Paid 0.15 0.90
2) Payment made on behalf of the entity Nil 1.20
3) Recovery of payments made on behalf of the entity 1.20 Nil
Balances
1) Sundry creditors 0.01 Nil
2) Loans and advances Nil 0.30
q) Other related parties where control exists, however, with whom the Company did not have any transactions during the
year:
1) CPF International (Pty) Limited (100% holding by Marico south Africa (Pty) Ltd)
2) The DRx Clinic Pte. Ltd. (100% holding by Derma – Rx International Aesthetics Pte. Ltd.) w.e.f. May 25, 2010
3) The DRx Medispa Pte. Ltd. (100% holding by Derma – Rx International Aesthetics Pte. Ltd.) w.e.f. May 25, 2010
4) DRx Investments Pte. Ltd. (100% holding by Derma – Rx International Aesthetics Pte. Ltd.) w.e.f. May 25, 2010
5) DRx Aesthetics Sdn. Bhd. (100% holding by DRx Investments Pte. Ltd.) w.e.f. May 25, 2010
6) DRx Meditech Pte. Ltd. (w.e.f. May 25, 2010 upto Feb 28, 2011 – merged with Derma – Rx International Aesthetics
Pte. Ltd. w.e.f. March 1, 2011)
7) Beauté Cosmétique Societé Par Actions (99% holding by International Consumer Products Corporation) w.e.f. Feb
18, 2011
8) Thuan Phat Foodstuff Joint Stock Company (87% holding by International Consumer Products Corporation) w.e.f.
Feb 18, 2011

140
M A R I C O L I M I T E D
noteS to the accountS
Key management personnel and their relatives:
r) Whole-time director: Harsh Mariwala, Chairman and Managing Director
nature of transactions March 31, 2011
rs. crore
March 31, 2010
rs. crore
Remuneration for the year 3.58 3.03
s) Employee: Rishabh Mariwala, son of Harsh Mariwala
nature of transactions March 31, 2011
rs. crore
March 31, 2010
rs. cror
Remuneration for the year 0.13 0.11
19) Managerial Remuneration:
nature of transactions: March 31, 2011
rs. crore
March 31, 2010
rs. crore
Payments and provisions on account of remuneration to Chairman and Managing
Director included in the Profit and Loss account
Salary 2.26 1.96
Contribution to provident and pension funds 0.26 0.23
Other perquisites 0.09 0.08
Annual performance incentives 0.97 0.76
3.58 3.03
Remuneration to non-whole time directors (including Sitting fees) 0.46 0.25
Notes:
1. The above remuneration to Chairman and Managing Director does not include contribution to Gratuity Fund and provision
for Leave encashment, as these are lump sum amounts for all relevant employees based on actuarial valuation.
2. Since no commission is payable during the year, computation of net profits for the year under section 198 of the
Companies Act, 1956 has not been given.
20) The Following table sets forth the funded status of the plan and the amounts relating to gratuity and leave encashment
recognized in the Company’s Financials:
A. Defined Benefit plan (Gratuity):
March 31, 2011
rs. crore
March 31, 2010
rs. crore
i. actuarial assumptions for Gratuity benefits and compensated absence
for employees:
Discount rate 8.00% 7.50%
Rate of return on Plan assets* 8.00% 8.50%
Future salary rise** 10.00% 10.00%
Attrition rate 17.00% 17.00%
Mortality Published notes under the IC (1994-96) Mortality tables
*The expected rate of return on plan assets is based on expectation of the average long term rate of return expected
on investment of the fund during the estimated term of the obligations.
**The estimates of future salary increases, considered in actuarial valuation, take account of inflation, seniority, promotion,
and other relevant factors such as supply and demand factors in the employment market. The expected rate of return
on plan assets is based on the current portfolio of assets, investment strategy and market scenario.

141
M A R I C O L I M I T E D
noteS to the accountS
March 31, 2011
rs. crore
March 31, 2010
rs. crore
ii. changes in benefit obligations:
Liability at the beginning of the year 10.57 9.56
Interest cost 0.80 0.72
Current service cost 1.42 1.38
Past service cost (non vested benefit) Nil Nil
Past service cost (vested benefit) Nil Nil
Benefits paid (0.68) (0.49)
Actuarial (gain)/loss on obligations (0.47) (0.60)
Liability at the end of the year 11.64 10.57
iii. fair value of plan assets :
Fair value of plan assets at the beginning of the year 11.39 9.02
Expected return on plan assets 0.91 0.79
Contributions Nil 0.54
Benefits paid (0.68) (0.49)
Actuarial gain/(loss) on plan assets (0.16) 1.53
Fair value of plan assets at the end of the year 11.46 11.39
Total Actuarial (gain)/loss to be recognized (0.31) (2.13)
iV. actual return on plan assets :
Expected return on plan assets 0.91 0.79
Actuarial gain/(loss) on plan assets (0.16) 1.53
Actual return on plan assets 0.75 2.32
March 31, 2011
rs. crore
March 31, 2010
rs. crore
Vi. Percentage of each category of plan assets to total fair value of plan assets:
Administered by HDFC Standard Life Insurance 93.32% 94.72%
Special deposit scheme, Fixed deposit scheme and others 6.68% 5.28%
Total 100% 100%
Vii. expenses recognised in the Profit and loss account :
Current service cost 1.42 1.38
Interest cost 0.80 0.72
Expected return on plan assets (0.91) (0.79)
Net actuarial (gain)/loss to be recognized (0.31) (2.13)
Past service cost (non vested benefit) recognized Nil Nil
Past service cost (vested benefit) recognized Nil Nil
(Income) / Expense recognised in the Profit and
Loss account 1.00 (0.82)
March 31,V. amount recognised in the Balance Sheet : 2011
rs. crore2010
rs. crore2009
rs. crore2008
rs. crore2007
rs. croreLiability at the end of the year 11.64 10.57 9.56 9.17 7.76
Fair value of plan assets at the end of the year 11.46 11.39 9.02 9.05 5.01Difference 0.18 (0.82) 0.54 0.12 2.75Unrecognised past service cost Nil Nil Nil Nil Nil(Assets) / Liability recognised in the Balance Sheet 0.18 (0.82) 0.54 0.12 2.75

142
M A R I C O L I M I T E D
March 31, 2011 rs. crore
March 31, 2010 rs. crore
Viii. Balance Sheet reconciliation
Opening net liability (0.82) 0.54
(Income) / Expense as above 1.00 (0.82)
Employers contribution Nil (0.54)
Closing net liability 0.18 (0.82)
iX. experience adjustments March 31, 2011 rs. crore
March 31, 2010 rs. crore
March 31, 2009 rs. crore
On Plan liability (gain) / loss 0.17 (0.34) 1.93On plan asset (loss) / gain (0.16) 1.53 (0.46)
As per actuarial valuation report, expected employer’s contribution in next year Rs. 0.40 Crore (actual contribution in previous
year Rs. Nil).
B. Privileged leave (Compensated Absence for Employees):
The Company permits encashment of privileged leave accumulated by its employees on retirement and separation. The
liability for unexpired leave is determined and provided on the basis of actuarial valuation at the Balance Sheet date.
The privileged leave liability is not funded.
Amount recognized in the Balance Sheet and movements in net liability:
Particulars March 31, 2011 rs. crore
March 31, 2010 rs. crore
Opening Balance of Compensated Absences (a) 5.35 5.04Present value of Compensated Absences(As per actuary valuation) as at the
year end (b)
5.57 5.35
(Excess)/ Unfunded liability of Compensated Absences recognized in the
Profit and Loss account for the year (b-a)
0.22 0.31
C. Defined contribution plan :
The Company has recognised Rs. 5.11 Crore (Rs. 5.03 Crore) towards contribution to provident fund, Rs 0.56 Crore
(Rs. 0.64 Crore) towards contribution to superannuation fund and Rs. 0.23 Crore (Rs. 0.18 Crore) towards employee
state insurance plan in Profit and Loss account.
21) The Guidance Note on implementing AS 15, Employee benefits (revised 2005) issued by Accounting Standards Board (ASB)
states that benefits involving employer-established provident funds, which require interest shortfalls to be recompensed, are to be
considered as defined benefit plans. Pending the issuance of the guidance note from the Actuarial Society of India, the Company’s
actuary has expressed an inability to reliably measure provident fund liabilities. Accordingly, the Company has accounted for the
same as a defined contribution plan. However, as permitted by the circular number 2009/104919 issued by the Employees’ Provident
Fund Organization, the interest shortfall can be adjusted against the Reserve available with the trust. Based on the unaudited
financial statements of the fund as at March 31, 2011, the Reserve available with the fund are adequate to cover interest shortfalls
arising till the said date. Hence no provision for liability is required to be created on such interest shortfall as on March 31, 2011.
22) Dues payable to Micro and Small Enterprises which are outstanding for more than 45 days as at March 31, 2011 are as under:
Particulars March 31, 2011 rs. crore
March 31, 2010 rs. crore
Amount remaining unpaid to any supplier as at the end of the accounting year 1.53 NilInterest paid by the Company during the year under the Act Nil NilInterest due on principal amounts paid beyond the due date during the year but
without the interest amounts under the Act
Nil Nil
Interest accrued but not due 0.01 NilInterest due but not paid 0.01 Ni
noteS to the accountS

143
M A R I C O L I M I T E D
This information as required to be disclosed under the Micro, Small and Medium Enterprises Development Act, 2006 has
been determined to the extent such parties have been identified on the basis of information available with the Company.
23) a) Secured Debentures represent 300 8.25% Rated Taxable Redeemable Non- convertible Debentures of Face Value Rs.
10 lakhs each, aggregating to Rs. 30.00 Crore which were issued on May 8, 2009 and are redeemable at par after 3
years. As per the terms of the issue Put / Call option is available with the Investor / Company at the end of 2 years.
These debentures are listed on the National Stock Exchange.
b) During the year, on March 30, 2011, The Company has issued 500 10.05% Rated Taxable Unsecured Redeemable
Non-convertible debentures of face value of Rs. 10 lakhs each aggregating to Rs. 50.00 Crore which are redeemable
at par after 30 months. These debentures have been listed on the National Stock Exchange after the Balance Sheet
date.
24) During the year, on March 25, 2011, the Company divested its edible oil brand “Sweekar” to Cargill India Private Limited for a
consideration of Rs. 50.00 Crore The divestment comprised assignment of trademark, designs, copyrights as also a non-compete
agreement and limited period licensing for some of the intellectual rights. The profit arising from this divestment aggregating
Rs. 50 Crore has been reflected as part of “Exceptional Items” in the Profit and Loss account (Refer Note 13 above).
25) During the year ended March 31, 2010, the Company had made a provision of Rs. 29.35 Crore towards 75% of possible
excise duty obligation which may arise in the event of unfavorable outcome of the matter in respect of coconut oil packed in
container size up to 200ml and cleared on and after June 3, 2009, which is being contested by the Company. Based on the
facts of the case and the legal opinion obtained in this regard, the Company had made an assessment that the probability
of success in the matter is more likely than not. In terms of Accounting Standard (AS) 29 “Provisions, Contingent Liabilities
and Contingent Assets”, the possible obligation on this account could be in the nature of contingent liabilities, which need
not be provided for in the accounts. Pending outcome of the matter, the Company had made the aforesaid provision in the
accounts for the year ended March 31, 2010. The Management had, while finalizing financial results for the quarters ended
June 30, 2010, September 30, 2010 and December 31, 2010, continued to make provision on the said basis and had provided
Rs. 26.61 Crore for the first nine months ended December 31, 2010.
The Auditors had qualified their audit report for the year ended March 31, 2010 and the limited review reports for the said
quarter to the effect that the said provisioning was not in accordance with the requirements of AS 29.
As at March 31, 2011, the Company has reviewed the matter again and has taken a legal opinion, which has reaffirmed the
earlier assessment that the probability of success in the matter is more likely than not. Considering the continued strength of
the Company’s case, the Company has, during the year, reversed the entire provision of Rs. 29.35 Crore and Rs. 26.61 Crore
made during the year ended March 31, 2010 and during the nine months ended December 31, 2010 respectively, having
regard to the fact that the said provision was not in accordance with the requirements of AS 29. The reversal of the provision
pertaining to the year ended March 31, 2010 aggregating to Rs. 29.35 Crore has been included under the head “Exceptional
Items” in the Profit and Loss account. Further, deferred tax asset of Rs. 9.75 Crore created during the year ended March 31,
2010 has been reversed and included in Deferred Tax charge for the year in the Profit and Loss account. Provisions of Rs.
26.61 Crore made in the first nine months ended December 31, 2010 were reversed in the quarter ended March 31, 2011,
which has no impact for the results of the full year ended March 31, 2011.
Consequentially, the possible excise duty obligation of Rs. 88.97 Crore for clearances made after June 03, 2009 till March
31, 2011 and Rs. 121.77 Crore for clearances made prior to June 03, 2009 has been disclosed as Contingent Liability to the
extent of the time horizon covered by show-cause notices issued by the excise department within the normal period of one
year (from the date of clearance) under the excise laws.
Had the Company continued to make provisions on the same basis as in the previous year, the Profit before tax and Exceptional
Items for the year would have been lower by Rs.37.38 Crore. Further, balances as at March 31, 2011 in Deferred Tax Asset
and Provisions would have been higher by Rs. 21.65 Crore and Rs. 66.73 Crore respectively and balance in Reserve and
Surplus would have been lower by Rs. 45.08 Crore.
The Company will continue to review this matter during the coming accounting periods based on the developments on the
outcomes in the pending cases and the legal advice that it may receive from time to time.
noteS to the accountS

144
M A R I C O L I M I T E D
26) During the year, the Company has recognized impairment of intangible assets comprising of Trademark relating to Fiancée
brand, which is used by Egyptian American Investment & Industrial Development Company. The Company charges royalty from
the said subsidiary for the use of Trademark. Having regard to the impairment indicators such as losses incurred in the Fiancée
business due to multiple factors like shifting consumer habits, trade issues, weakening brand strength, etc , the Company has
recognized a provision of Rs. 13.88 Crore towards Impairment of Fiancée Trademark, which is included in “Exceptional Items”
in the Profit and Loss account. The Company has considered pre-tax discount rate of 19 % for determining value in use.
27) As at March 31, 2011, Marico Limited (“Marico”) holds 100 % of the Equity Capital of Kaya Limited (“Kaya”) at a cost of
Rs.73.00 Crore (Rs.73.00 Crore). The Company has also advanced loans to Kaya of Rs. 112.92 Crore (Rs. 79.97 Crore). As
per the latest audited financial statements, Kaya has negative net-worth as at March 31, 2011. The management believes
that these losses are not reflective of future trends and operations of the Company and the Kaya business model continues
to be robust and offers significant long term growth opportunities. Further, the operations of Kaya are expected to improve
significantly due to positive changes in the economic environment, focus on same store growth, expansion of Kaya’s range
of services and product offerings, savings resulting from cost management initiatives and leveraging the synergies from the
acquisition of Derma Rx business in Singapore (by its wholly owned subsidiary) and by increasing the share of product sales
in the total business.
Having regard to the above factors, and based on the fundamentals of Kaya and its future business plans, the management
is of the opinion that it is strategically desirable for Marico to continue to support Kaya through funding (equity / debt infusion),
through either fresh funds or conversion of existing loans into equity. Accordingly, the management perceives that the erosion
in the value of investments in Kaya is not other than temporary. Hence, no provision for diminution in value is considered
necessary in respect of the Company’s investments in Kaya or of the loans and advances given to Kaya.
28) The Company has advanced long term loan to its wholly owned subsidiary Marico South Africa Consumer Care (Pty) Limited
which is outstanding at the year ended March 31, 2011. The operations of the said subsidiary are classified as ‘Non – integral
foreign operations’. Accordingly, as per the requirements of Accounting Standard 11 ‘The effect of changes in Foreign Exchange
Rates’, exchange gain of Rs. 5.74 Crore (Rs. 3.23 Crore) arising on revaluation of the said loan is accumulated in ‘Foreign
Currency Translation Reserve’, to be recognized as income or expenses in the Profit and Loss account upon disposal of the
net investment in said subsidiary.
29) The following amounts are payable towards the Investors Education and Protection Fund account as on March 31, 2011:
Payables March 31, 2011
rs. crore
March 31, 2010
rs. crore
Third interim dividend of year 2003-04 0.01 Nil
Preference Shares redemption 0.02 Nil
30) (a) The figures in brackets represent those of the previous year
(b) The figures for the previous year have been restated / regrouped where necessary to conform to current period’s
classification.
Signatures to Schedules A to R
As per our attached report of even date
for Price WaterhouseChartered Accountants Firm Registration No. 301112E
VilaS Y. ranePartner Membership No. F-33220
Place : Mumbai Date : May 2, 2011
for and on behalf of the Board of directors
harSh MariWala Chairman and Managing Director
niKhil Khattau Director and Chairman of Audit Committee
Milind SarWate Group Chief Financial Officer and Chief Human Resource Officer
heManGi WadKar Company Secretary & Compliance Officer
Place : Mumbai Date : May 2, 2011
noteS to the accountS

145
M A R I C O L I M I T E D
a) registration details:
Registration No. : 11-49208
Balance Sheet Date : March 31, 2011
b) capital raised during the year: rs. crore
Public Issue Nil
Bonus Issue Nil
Bonus Preference Shares Nil
Rights Issue Nil
Private placement Nil
* Issue of shares upon exercise of Options under Employee Stock Option Schemes: Rs. 0.51 Crore
c) Position of mobilisation and deployment of funds:
Total Liabilities — Rs. 1425.61 Crore
Total Assets — Rs. 1425.61 Crore
Sources of funds (rs. crore) application of funds (rs. crore)
Paid up Capital 61.44 Net Fixed Assets 268.16
Reserves & Surplus 811.68 Investments 470.36
Secured Loans 332.42 Net Current Assets 660.55
Unsecured Loans 220.07 Deferred Tax Asset 26.54
Deferred Tax Liability Nil
Accumulated losses Nil
total Sources 1,425.61 total application 1,425.61
d) Performance of the company: (rs. crore)
Turnover (Sales & Other Income) 2,372.04
Total Expenditure 2,062.97
Profit before Tax 374.54
Profit after Tax 315.32
Earnings per share (in Rs.) 5.15
Dividend rate (%) 65.99%
e) Generic names of the three principal products/services of the company:
item code no. Product description
(i.t.c. code)
1513 11 00 Coconut Oil
1512 19 10 Sunflower Oil
1512 19 30 Safflower Oil
Signatures to Schedules A to R
for and on behalf of the Board of directors
harSh MariWala Chairman and Managing Director
niKhil Khattau Director and Chairman of Audit Committee
Milind SarWate Group Chief Financial Officer and
Chief Human Resource Officer
heManGi WadKar Company Secretary & Compliance Officer
Place : Mumbai Date : May 2, 2011
inforMation PurSuant to Part iV of Schedule Vi to the coMPanieS act, 1956 :

M A R I C O LIMITED
146
STA
TEM
EN
T P
UR
SU
AN
T TO
SE
CTI
ON
212
(1)(
e) O
F TH
E C
OM
PAN
IES
AC
T, 1
956.
* A
mou
nt in
Cro
re
Nam
e of
the
subs
idia
ry
com
pany
Mar
ico
Ban
glad
esh
Lim
ited
MB
L In
dust
ries
Lim
ited
#K
aya
Lim
ited
Mar
ico
Mid
dle
Eas
t FZE
Kay
a M
iddl
e E
ast
FZE
#M
EL
Con
sum
er
Car
e S
AE
#E
gypt
ian
Am
eric
an
Inve
stm
ent
and
Indu
stria
l D
evel
opm
ent
Com
pany
#
Mar
ico
Sou
th
Afr
ica
Con
sum
er
Car
e (P
ty)
Lim
ited
Mar
ico
Sou
th
Afr
ica
(Pty
) L
imite
d #
CP
F In
tern
atio
nal
(Pty
) Li
mite
d #
Nam
e of
the
hold
ing
co
mpa
nyM
aric
o Li
mite
d
Mar
ico
Mid
dle
Eas
t FZE
Mar
ico
Lim
ited
Mar
ico
Lim
ited
Mar
ico
Mid
dle
Eas
t FZE
Mar
ico
Mid
dle
Eas
t FZE
Mar
ico
Mid
dle
Eas
t FZE
Mar
ico
Lim
ited
Mar
ico
Sou
th
Afr
ica
Con
sum
er
Car
e (P
ty)
Lim
ited
Mar
ico
Sou
th
Afr
ica
(Pty
) Li
mite
d
Rep
ortin
g C
urre
ncy
BD
TR
s.B
DT
Rs.
Rs.
Rs.
AE
DR
s.A
ED
Rs.
EG
PR
s.E
GP
Rs.
ZAR
Rs.
ZAR
Rs.
ZAR
Rs.
Exc
hang
e R
ate
0.6
15
0.6
15
1.0
00
12.
139
12.
139
7.4
83
7.4
83
6.5
82
6.5
82
6.5
82
Hol
ding
Com
pany
’s in
tere
st
28,3
50,0
00 o
rdin
ary
shar
es o
f Tak
a 10
ea
ch, f
ully
pai
d up
100,
000
ordi
nary
sh
ares
of T
aka
10
each
, ful
ly p
aid
up
14,5
00,0
00 o
rdin
ary
shar
es o
f Rs.
10
each
, ful
ly p
aid
up
22 o
rdin
ary
shar
e of
AE
D 1
,000
,000
ea
ch, f
ully
pai
d up
1 E
quity
sha
re o
f A
ED
1,5
0,00
0 fu
lly
paid
up
250
Equ
ity s
hare
of
EG
P 1
,000
fully
pa
id u
p
68,9
20 o
rdin
ary
shar
es o
f EG
P 1
00
each
, ful
ly p
aid
up
800
ordi
nary
sha
res
of Z
AR
1 e
ach,
fully
pa
id u
p
500,
000
ordi
nary
sh
ares
of Z
AR
0.0
1 ea
ch, f
ully
pai
d up
100
ordi
nary
sha
res
of Z
AR
1 e
ach,
fully
pa
id u
p
Ext
ent o
f Hol
ding
as
on 3
1st
Mar
ch 2
011
90%
100%
100%
100%
100%
100%
100%
100%
100%
100%
The
“fin
anci
al y
ear”
of t
he
subs
idia
ry c
ompa
ny e
nded
on
Mar
ch 3
1,20
11S
epte
mbe
r 30,
20
10M
arch
31,
201
1M
arch
31,
201
1M
arch
31,
201
1M
arch
31,
201
1D
ecem
ber 3
1, 2
010
Mar
ch 3
1, 2
011
Mar
ch 3
1, 2
011
Mar
ch 3
1, 2
011
Am
ount
in C
rore
Am
ount
in C
rore
Am
ount
in C
rore
Am
ount
in C
rore
Am
ount
in C
rore
Am
ount
in C
rore
Am
ount
in C
rore
Am
ount
in C
rore
Am
ount
in C
rore
Am
ount
in C
rore
BD
TR
s.B
DT
Rs.
Rs.
Rs.
AE
DR
s.A
ED
Rs.
EG
PR
s.E
GP
Rs.
ZAR
Rs.
ZAR
Rs.
ZAR
Rs.
Net
agg
rega
te a
mou
nt o
f the
su
bsid
iary
com
pany
’s p
rofit
s/
(loss
es) d
ealt
with
in th
e ho
ldin
g co
mpa
ny’s
acc
ount
s
For t
he s
ubsi
diar
y’s
afor
esai
d fin
anci
al y
ear
7.0
9 4
.36
Nil
Nil
Nil
Nil
Nil
Nil
Nil
Nil
Nil
Nil
Nil
Nil
Nil
Nil
Nil
Nil
Nil
Nil
For t
he p
revi
ous
finan
cial
ye
ars
sinc
e it
beca
me
subs
idia
ry
17.
04
10.
71
Nil
Nil
Nil
Nil
Nil
Nil
Nil
Nil
Nil
Nil
Nil
Nil
Nil
Nil
Nil
Nil
1.3
7 7
.31
Net
agg
rega
te a
mou
nt o
f the
su
bsid
iary
com
pany
’s p
rofit
s/
(loss
es) n
ot d
ealt
with
in th
e ho
ldin
g co
mpa
ny’s
acc
ount
s
For t
he s
ubsi
diar
y’s
afor
esai
d fin
anci
al y
ear
96.
15
59.
13
(0.6
2) (0
.38)
(41.
26)
(41.
26)
(1.2
0) (1
4.55
) (0
.82)
(10.
00)
(0.0
7) (0
.49)
(0.3
3) (2
.47)
(0.0
3) (0
.18)
(0.1
7) (1
.11)
-
-
For t
he p
revi
ous
finan
cial
ye
ars
sinc
e it
beca
me
subs
idia
ry
112
.65
72.
26
(2.2
9) (1
.57)
(25.
02)
(25.
02)
1.6
0 2
0.26
(0
.49)
(6.1
1) (1
.20)
(10.
25)
(1.5
7) (1
4.91
) (0
.30)
(1.1
8) (0
.34)
(2.2
1) 0
.01
0.0
1
Cha
nges
, if a
ny, i
n th
e ho
ldin
g co
mpa
ny’s
inte
rest
in
the
subs
idia
ry b
etw
een
the
end
of th
e fin
anci
al y
ear o
f th
e su
bsid
iary
and
that
of t
he
hold
ing
com
pany
NA
NA
NA
NA
NA
NA
NA
NA
NA
NA
Mat
eria
l cha
nges
, if
any,
bet
wee
n th
e en
d of
th
e fin
anci
al y
ear o
f the
su
bsid
iary
and
that
of t
he
hold
ing
com
pany
NA
NA
NA
NA
NA
NA
NA
NA
NA
NA

M A R I C O LIMITED
147
STA
TEM
EN
T P
UR
SU
AN
T TO
SE
CTI
ON
212
(1)(
e) O
F TH
E C
OM
PAN
IES
AC
T, 1
956.
* A
mou
nt in
Cro
re
Nam
e of
the
subs
idia
ry
com
pany
Mar
ico
Egy
pt
Indu
strie
s C
ompa
ny#
Mar
ico
Mal
aysi
a S
dn. B
hd#
Der
ma
Rx
Inte
rnat
iona
l A
esth
etic
s P
te.
Ltd
#
The
DR
x C
linic
P
te. L
td
#Th
e D
Rx
Med
ispa
P
te. L
td #
DR
x In
vest
men
ts
Pte
. Ltd
#
DR
x A
esth
etic
s S
dn B
hd
#In
tern
atio
nal
Con
sum
er
Pro
duct
s C
orpo
ratio
n #
Bea
uté
Cos
mét
ique
S
ocie
té P
ar
Act
ions
#
Thua
n P
hat
Food
stuf
f Joi
nt
stoc
k C
ompa
ny
#
Nam
e of
the
hold
ing
co
mpa
nyM
EL
Con
sum
er
Car
e S
AE
Mar
ico
Mid
dle
Eas
t FZE
Kay
a Li
min
ted
Der
ma
Rx
Inte
rnat
iona
l A
esth
etic
s P
te. L
td
Der
ma
Rx
Inte
rnat
iona
l A
esth
etic
s P
te. L
td
Der
ma
Rx
Inte
rnat
iona
l A
esth
etic
s P
te. L
td
DR
x In
vest
men
ts
Pte
. Ltd
Mar
ico
Lim
ited
Inte
rnat
iona
l C
onsu
mer
P
rodu
cts
Cor
pora
tion
Inte
rnat
iona
l C
onsu
mer
P
rodu
cts
Cor
pora
tion
Rep
ortin
g C
urre
ncy
EG
PR
s.M
YRR
s.S
GD
Rs.
SG
DR
s.S
GD
Rs.
SG
DR
s.M
YRR
s.VN
DR
s.VN
DR
s.VN
DR
s.
Exc
hang
e R
ate
7.4
83
14.
747
35.3
5735
.357
35.3
5735
.357
14.
747
0.00
2133
0.00
2133
0.00
2133
Hol
ding
Com
pany
’s in
tere
st
1,22
8,76
9 E
quity
sh
ares
of E
GP
10
each
, ful
ly p
aid
17,6
60,2
40 E
quity
sh
ares
of M
YR 1
ea
ch, f
ully
pai
d
7,00
0,00
0 E
quity
sh
ares
of S
GD
1
each
fully
pai
d up
100,
000
Equ
ity
shar
es o
f SG
D 1
ea
ch fu
lly p
aid
up
100,
000
Equ
ity
shar
es o
f SG
D 1
ea
ch fu
lly p
aid
up
748,
343
Equ
ity
shar
es o
f SG
D 1
ea
ch fu
lly p
aid
up
990,
000
Equ
ity
shar
es o
f MYR
1
each
fully
pai
d up
11,2
17,7
60 E
quity
sh
ares
of V
ND
10
,000
eac
h fu
lly
paid
up
2,00
0,00
0 E
quity
sh
ares
of V
ND
10
,000
eac
h fu
lly
paid
up
3,14
0,00
0 E
quity
sh
ares
of V
ND
10
,000
eac
h fu
lly
paid
up
Ext
ent o
f Hol
ding
as
on 3
1st
Mar
ch 2
011
100%
100%
100%
100%
100%
100%
100%
85%
99%
87%
The
“fin
anci
al y
ear”
of t
he
subs
idia
ry c
ompa
ny e
nded
on
Dec
embe
r 31,
201
0M
arch
31,
201
1M
arch
31,
201
1M
arch
31,
201
1M
arch
31,
201
1M
arch
31,
201
1M
arch
31,
201
1D
ecem
ber 3
1, 2
010
Dec
embe
r 31,
201
0D
ecem
ber 3
1, 2
010
Am
ount
in C
rore
Am
ount
in C
rore
Am
ount
in C
rore
Am
ount
in C
rore
Am
ount
in C
rore
Am
ount
in C
rore
Am
ount
in C
rore
Am
ount
in C
rore
Am
ount
in C
rore
Am
ount
in C
rore
EG
PR
s.M
YRR
s.S
GD
Rs.
SG
DR
s.S
GD
Rs.
SG
DR
s.M
YRR
s.VN
DR
s.VN
DR
s.VN
DR
s.
Net
agg
rega
te a
mou
nt o
f the
su
bsid
iary
com
pany
’s p
rofit
s/
(loss
es) d
ealt
with
in th
e ho
ldin
g co
mpa
ny’s
acc
ount
s
For t
he s
ubsi
diar
y’s
afor
esai
d fin
anci
al y
ear
Nil
Nil
Nil
Nil
Nil
Nil
Nil
Nil
Nil
Nil
Nil
Nil
Nil
Nil
Nil
Nil
Nil
Nil
Nil
Nil
For t
he p
revi
ous
finan
cial
ye
ars
sinc
e it
beca
me
subs
idia
ry
Nil
Nil
Nil
Nil
Nil
Nil
Nil
Nil
Nil
Nil
Nil
Nil
Nil
Nil
Nil
Nil
Nil
Nil
Nil
Nil
Net
agg
rega
te a
mou
nt o
f the
su
bsid
iary
com
pany
’s p
rofit
s/
(loss
es) n
ot d
ealt
with
in th
e ho
ldin
g co
mpa
ny’s
acc
ount
s
For t
he s
ubsi
diar
y’s
afor
esai
d fin
anci
al y
ear
1.4
3 1
0.72
(0
.20)
(2.9
2) 0
.01
0.1
4 0
.28
9.7
9 0
.09
3.0
2 (0
.01)
(0.0
2) 0
.03
0.5
0 1
,233
.68
2.6
3 4
48.1
9 0
.96
(217
.17)
(0.4
6)
For t
he p
revi
ous
finan
cial
ye
ars
sinc
e it
beca
me
subs
idia
ry
3.1
5 2
6.71
N
A
NA
N
A
NA
N
A
NA
N
A
NA
N
A
NA
N
A
NA
N
A
NA
N
A
NA
N
A
NA
Cha
nges
, if a
ny, i
n th
e ho
ldin
g co
mpa
ny’s
inte
rest
in
the
subs
idia
ry b
etw
een
the
end
of th
e fin
anci
al y
ear o
f th
e su
bsid
iary
and
that
of t
he
hold
ing
com
pany
NA
NA
NA
NA
NA
NA
NA
on F
ebru
ary
18,
2011
, Mar
ico
Lim
ited
acqu
ired
cont
rolli
ng e
quity
st
ake
on F
ebru
ary
18,
2011
, Mar
ico
Lim
ited
acqu
ired
cont
rolli
ng e
quity
st
ake
in IC
P
on F
ebru
ary
18,
2011
, Mar
ico
Lim
ited
acqu
ired
cont
rolli
ng e
quity
st
ake
in IC
P
Mat
eria
l cha
nges
, if
any,
bet
wee
n th
e en
d of
th
e fin
anci
al y
ear o
f the
su
bsid
iary
and
that
of t
he
hold
ing
com
pany
NA
NA
NA
NA
NA
NA
NA
NA
NA
NA

M A R I C O LIMITED
148
STA
TEM
EN
T P
UR
SU
AN
T TO
SE
CTI
ON
212
(1)(
e) O
F TH
E C
OM
PAN
IES
AC
T, 1
956.
The
Indi
an ru
pee
equi
vale
nts
of th
e fig
ures
giv
en in
fore
ign
curr
enci
es in
the
acco
unts
of t
he s
ubsi
diar
y co
mpa
nies
, hav
e be
en g
iven
bas
ed o
n th
e ex
chan
ge ra
tes
as o
n M
arch
31,
201
1.#
By
virtu
e of
Sec
tion
4 (1
) (c)
of t
he C
ompa
nies
Act
, 195
6,
a)
MB
L In
dust
ries
Lim
ited
(MB
LIL)
is a
sub
sidi
ary
of th
e C
ompa
ny a
s M
aric
o M
iddl
e E
ast F
ZE, a
sub
sidi
ary
of th
e C
ompa
ny, h
olds
100
% s
take
in M
BLI
L,
b)
Kay
a M
iddl
e E
ast F
ZE (
KM
E),
ME
L C
onsu
mer
Car
e S
AE
(M
ELC
C)
and
Egy
ptia
n A
mer
ican
Indu
stria
l and
Inve
stm
ent D
evel
opm
ent C
ompa
ny (
EA
IIDC
) ar
e su
bsid
iarie
s of
the
com
pany
as
Mar
ico
Mid
dle
Eas
t FZE
, a s
ubsi
diar
y of
the
Com
pany
, hol
ds 1
00%
sta
ke in
KM
E, M
ELC
C a
nd E
AIID
C,
c)
Mar
ico
Sou
th A
frica
(Pty
) Lim
ited
(MS
A) i
s a
subs
idia
ry o
f the
com
pany
as
Mar
ico
Sou
th A
frica
Con
sum
er C
are
(Pty
) Lim
ited
(MS
AC
C),
a su
bsid
iary
of t
he C
ompa
ny, h
olds
100
% s
take
in M
SA
,
d)
CP
F In
tern
atio
nal (
Pty
) Lim
ited
(CP
F) is
a s
ubsi
diar
y of
the
Com
pany
, as
MS
A w
hich
hol
ds 1
00%
sta
ke in
CP
F is
a 1
00%
sub
sidi
ary
of M
SA
CC
, whi
ch is
a 1
00%
sub
sidi
ary
of th
e C
ompa
ny,
e)
Mar
ico
Egy
pt In
dust
ries
Com
pany
is a
sub
sidi
ary
of th
e th
e C
ompa
ny, a
s M
ELC
C w
hich
hol
ds 1
00%
sta
ke in
ME
IC is
a 1
00%
sub
sidi
ary
of M
ME
, whi
ch is
a 1
00%
sub
sidi
ary
of th
e C
ompa
ny.
f) D
erm
a R
x In
tern
atio
nal A
esth
etic
s P
te. L
td (D
IAL)
is a
sub
sidi
ary
of th
e th
e C
ompa
ny, a
s K
aya
Lim
ited
(KA
L) ,
a su
bsid
iary
of t
he C
ompa
ny, h
olds
100
% s
take
in D
IAL.
g)
The
DR
x C
linic
Pte
. Ltd
(DC
PL)
, The
DR
x M
edis
pa P
te. L
td (D
MS
PL)
, DR
x In
vest
men
ts P
te. L
td (D
IPL)
are
sub
sidi
arie
s of
the
com
pany
, as
DIA
L w
hich
hol
ds 1
00%
sta
ke in
DC
PL,
DM
SP
L, D
IPL,
is a
100
% s
ubsi
diar
y of
KA
L , w
hich
is a
10
0% s
ubsi
diar
y of
the
Com
pany
,
h)
DR
x A
esth
etic
s S
dn B
hd (D
AS
B) i
s a
subs
idia
ry o
f the
Com
pany
, as
DIP
L w
hich
hol
ds 1
00%
sta
ke in
DA
SB
is a
100
% s
ubsi
diar
y of
DIA
L, w
hich
is a
100
% s
ubsi
diar
y of
the
Com
pany
,
i) B
eaut
é C
osm
étiq
ue S
ocie
té P
ar A
ctio
ns (B
CS
) and
Thu
an P
hat F
oods
tuff
Join
t sto
ck C
ompa
ny (T
P) a
re s
ubsi
diar
ies
of th
e C
ompa
ny, a
s In
tern
atio
nal C
onsu
mer
Pro
duct
s C
orpo
ratio
n (IC
P) w
hich
hol
ds 9
9% s
take
in B
CS
and
87%
sta
ke
in T
P, is
a s
ubsi
diar
y in
whi
ch th
e C
ompa
ny h
old
85%
sta
ke.
For
and
On
beh
alf o
f Boa
rd o
f Dire
ctor
s H
AR
SH
MA
RIW
ALA
C
hairm
an a
nd M
anag
ing
Dire
ctor
N
IKH
IL K
HA
TTA
U
Dire
ctor
and
Cha
irman
of A
udit
Com
mitt
ee
MIL
IND
SA
RW
ATE
G
roup
Chi
ef F
inan
cial
Offi
cer a
nd C
hief
Hum
an R
esou
rce
Offi
cer
HE
MA
NG
I WA
DK
AR
C
ompa
ny S
ecre
tary
& C
ompl
ianc
e O
ffice
r P
lace
: M
umba
i D
ate
: May
2, 2
011

M A R I C O LIMITED
149
(Am
ount
in C
rore
)S
r. N
o.N
ame
of th
e su
bsi
dia
ry c
omp
any
Rep
ortin
g
Cur
renc
y E
xcha
nge
Rat
e C
apita
l R
eser
ves
Tota
l A
sset
sTo
tal
Liab
ilitie
sD
etai
ls o
f Inv
estm
ent
(Exc
lud
ing
Inve
stm
ent
in S
ubsi
dia
ries)
Turn
over
Pro
fit /
( Lo
ss)
Bef
ore
Tax
Pro
visi
on
for
Tax
Pro
fit /
(Los
s)
Afte
r Ta
xP
rop
osed
Div
iden
d
incl
udin
g D
ivid
end
d
ecla
red
dur
ing
the
year
1M
aric
o B
angl
ades
h Li
mite
dB
DT
Rs.
– 0
.615
3
1.50
1
9.37
2
14.7
6 1
32.0
8 4
61.3
1 2
83.7
0 2
15.0
5 1
32.2
5 2
.96
1.8
2 8
20.4
0 5
04.5
5 1
43.7
3 8
8.39
4
0.49
2
4.90
1
03.2
4 6
3.49
1
1.03
6
.78
2M
BL
Indu
strie
s Li
mite
dB
DT
Rs.
– 0
.615
0
.10
0.0
6 2
.50
1.5
4 3
.17
1.9
5 0
.57
0.3
5 –
–
1.7
8 1
.10
(0.6
1) (0
.37)
0.0
1 0
.01
(0.6
2) (0
.38)
–
–
3K
aya
Ski
n C
are
Lim
ited
Rs.
Rs.
– 1
.000
1
4.50
1
4.50
(5
6.14
) (5
6.14
) 1
12.4
1 1
12.4
1 1
54.0
5 1
54.0
5 – –
105
.12
105
.12
(41.
27)
(41.
27)
(0.0
1) (0
.01)
(41.
26)
(41.
26)
– –
5M
aric
o M
iddl
e E
ast
FZE
AE
DR
s.–
12.
139
2.2
0 2
6.71
(0
.10)
(1.2
4) 1
3.07
1
58.6
5 1
0.72
1
30.1
9 – –
9
.98
121
.16
(1.2
0) (1
4.55
) – –
(1.2
0) (1
4.55
) – –
6K
aya
Mid
dle
Eas
t FZE
AE
DR
s.–
12.
139
0.0
2 0
.18
(1.3
2) (1
6.00
) 4
.54
55.
14
1.5
6 1
8.95
–
–
4
.65
56.
47
(0.8
2) (1
0.00
) – –
(0.8
2) (1
0.00
) –
–
7M
EL
Con
sum
er C
are
SA
EE
GP
Rs.
– 7
.483
0
.03
0.1
9 (0
.90)
(6.7
1) 2
.98
22.
29
3.8
5 2
8.81
– –
–
– (0
.07)
(0.4
9) –
–
(0.0
7) (0
.49)
–
–8
Egy
ptia
n A
mer
ican
Inve
stm
ent a
nd
Indu
stria
l Dev
elop
men
t Com
pany
E
GP
Rs.
– 7
.483
0
.69
5.1
6 (1
.38)
(10.
31)
1.5
5 1
1.61
2
.24
16.
77
–
–
2.2
1 1
6.50
(0
.32)
(2.4
6) 0
.01
0.0
1 (0
.33)
(2.4
7) – –
9
Mar
ico
Sou
th A
frica
Con
sum
er C
are
(Pty
) Li
mite
dZA
RR
s.–
6.5
82
0.0
1 0
.01
4.0
5 2
6.68
1
2.19
8
0.22
8
.13
53.
53
– –– –
(0.0
3) (0
.18)
– – (0
.03)
(0.1
8) –
–
10M
aric
o S
outh
Afri
ca (P
ty) L
imite
dZA
RR
s.–
6.5
82
0.0
1 0
.01
0.3
2 2
.12
10.
77
70.
88
10.
45
68.
75
– –
13.
78
90.
71
(0.1
4) (0
.92)
0.0
3 0
.19
(0.1
7) (1
.11)
– –11
CP
F In
tern
atio
nal (
Pty
) Lim
ited
ZAR
Rs.
– 6
.582
0
.01
0.0
1 (0
.01)
(0.0
1) – –
- - –
–
– –
– – – –
- - –
–
12M
aric
o E
gypt
Indu
strie
s C
ompa
nyE
GP
Rs.
– 7
.483
1
.23
9.1
9 4
.33
32.
38
7.6
3 5
7.09
2
.07
15.
52
– –
9.1
3 6
8.35
1
.43
10.
72
– –
1.4
3 1
0.72
– –
13M
aric
o M
alay
sia
Sdn
. Bhd
.M
YR Rs.
– 1
4.74
7 1
.77
26.
04
(0.2
0) (2
.92)
2.0
0 2
9.48
0
.43
6.3
6 – –
1.1
3 1
6.70
(0
.20)
(2.9
2) – –
(0.2
0) (2
.92)
– –
14D
erm
a R
x In
tern
atio
nal A
esth
etic
s P
te.
Ltd.
S
GD
Rs.
– 3
5.35
7 0
.70
24.7
5 0
.01
0.14
4.2
2 14
9.17
3.5
1 12
4.28
– – 0
.17
6.00
0.0
1 0.
14 – –
0
.01
0.14
–
–
15Th
e D
Rx
Clin
ic P
te. L
td.
S
GD
Rs.
– 3
5.35
7 0
.01
0.3
5 0
.16
5.4
8 0
.35
12.
20
0.1
8 6
.36
– – 1
.12
39.
53
0.3
2 1
1.48
0
.04
1.6
9 0
.28
9.7
9 – –
16Th
e D
Rx
Med
ispa
Pte
. Ltd
. S
GD
Rs.
– 3
5.35
7 0
.01
0.35
(0.1
2) (4
.33)
0.2
4 8.
53 0
.35
12.5
1– –
0.6
8 23
.91
0.1
1 4.
06 0
.02
0.69
0.0
9 3.
37 – –
17
DR
x In
vest
men
ts P
te. L
td.
S
GD
Rs.
– 3
5.35
7 0
.07
2.65
(0.0
7) (2
.63)
0.0
1 0.
04 0
.01
0.02
– – –
–
(0
.01)
(0.0
2) – –
(0
.01)
(0.0
2) – –
18
DR
x A
esth
etic
s S
dn. B
hd.
M
YR Rs.
– 1
4.74
7 0
.10
1.46
(0.2
6) (3
.86)
0.0
4 0.
61 0
.20
3.02
– – 0
.12
1.82
0.0
3 0.
51 0
.01
0.01
0.0
3 0.
50 – –
19
Inte
rnat
iona
l Con
sum
er P
rodu
cts
Cor
pora
tion
VN
DR
s.–
0.0
0213
3 11
,217
.76
23.
93 1
2,47
0.69
2
6.60
2
7,57
7.07
5
8.82
3
,888
.62
8.2
9 –
–
39
,087
.05
83.
37
1,7
10.8
1 3
.65
477
.13
1.0
2 1
,233
.68
2.6
3 –
20B
eaut
é C
osm
étiq
ue S
ocie
té P
ar A
ctio
ns
VND
Rs.
– 0
.002
133
2,0
00.0
0 4
.27
250
.51
0.5
3 3
,274
.99
6.9
9 1
,024
.48
2.1
9 –
–
8,6
30.7
1 1
8.41
6
25.7
9 1
.33
177
.60
0.3
8 4
48.1
9 0
.95
– –
21Th
uan
Phat
Foo
dstu
ff Jo
int s
tock
Com
pany
VN
DR
s.–
0.0
0213
3 3
,140
.00
6.6
98
374
.29
0.7
98
6,0
82.4
6 1
2.97
4 2
,568
.17
5.4
78
–
7,7
00.3
5 1
6.42
5 (1
89.6
6) (0
.40)
27.
51
0.0
6 (2
17.1
7) (0
.46)
– –
STA
TEM
EN
T P
UR
SU
AN
T TO
SE
CTI
ON
212
(8)
OF
THE
CO
MPA
NIE
S A
CT,
195
6.
As
per
AS
21
issu
ed b
y th
e In
stitu
te o
f Cha
rtere
d A
ccou
ntan
ts o
f Ind
ia, t
he fi
nanc
ial s
tate
men
ts o
f the
Com
pany
refle
ctin
g th
e co
nsol
idat
ion
of th
e ac
coun
ts o
f its
sub
sidi
ary
com
pani
es to
the
exte
nt o
f equ
ity h
oldi
ng o
f the
com
pani
es a
re
incl
uded
in th
e re
port.
In te
rms
of a
ppro
val g
rant
ed b
y th
e C
entra
l Gov
ernm
ent,
Dep
t. of
Com
pany
Affa
irs v
ide
App
rova
l let
ter n
o. 4
7/31
3/20
10-C
L-III
dat
ed M
ay 1
0, 2
010
u/s
212
(8) o
f the
Com
pani
es A
ct, 1
956,
cop
y of
the
Bal
ance
She
et, P
rofit
and
Los
s ac
coun
t, re
port
of th
e B
oard
of D
irect
ors
and
the
repo
rt of
the
Aud
itors
of t
he s
ubsi
diar
y co
mpa
nies
hav
e no
t bee
n at
tach
ed to
this
ann
ual r
epor
t. Th
e ac
coun
ts o
f the
se c
ompa
nies
hav
e be
en s
epar
atel
y au
dite
d as
per
Gen
eral
ly A
ccep
ted
Acc
ount
ing
Prin
cipl
es /
Pra
ctic
es a
s ap
plic
able
in th
eir r
espe
ctiv
e ju
risdi
ctio
n of
the
coun
try o
f inc
orpo
ratio
n. A
sta
tem
ent p
ursu
ant t
o th
e ab
ove
orde
r giv
ing
deta
ils o
f the
sub
sidi
arie
s is
atta
ched
her
ewith
:
The
amou
nts
give
n in
the
tabl
e ab
ove
are
from
the
annu
al a
ccou
nts
mad
e fo
r the
resp
ectiv
e fin
anci
al y
ear e
nd fo
r eac
h of
the
com
pani
es.
The
Indi
an ru
pee
equi
vale
nts
of th
e fig
ures
giv
en in
fore
ign
curre
ncie
s in
the
acco
unts
of t
he s
ubsi
diar
y co
mpa
nies
, hav
e be
en g
iven
bas
ed o
n th
e ex
chan
ge ra
tes
as o
n M
arch
31,
201
1.
Und
erta
king
:
We
unde
rtake
that
the
annu
al a
ccou
nts
of th
e su
bsid
iary
com
pani
es a
nd th
e re
late
d de
taile
d in
form
atio
n w
ill be
mad
e av
aila
ble
to th
e sh
areh
olde
rs, w
ho s
eek
such
info
rmat
ion,
at a
ny p
oint
of t
ime.
The
ann
ual a
ccou
nts
of th
e su
bsid
iary
com
pani
es
will
also
be
kept
for i
nspe
ctio
n by
the
inve
stor
in th
e R
egis
tere
d / H
ead
offic
e of
Mar
ico
and
that
of s
ubsi
diar
y co
mpa
nies
con
cern
ed.
Fo
r an
d O
n b
ehal
f of B
oard
of D
irect
ors
HA
RS
H M
AR
IWA
LA
Cha
irman
and
Man
agin
g D
irect
or
NIK
HIL
KH
AT
TAU
D
irect
or a
nd C
hairm
an o
f Aud
it C
omm
ittee
M
ILIN
D S
AR
WA
TE
Gro
up C
hief
Fin
anci
al O
ffice
r and
Chi
ef H
uman
Res
ourc
e O
ffice
r H
EM
AN
GI W
AD
KA
R
Com
pany
Sec
reta
ry &
Com
plia
nce
Offi
cer
Pla
ce :
Mum
bai
Dat
e : M
ay 2
, 201
1

The highlights pertain to the financial performance of Marico Consolidated Amount in Rs. Crore
Year ended March 31, 2002 2003 2004 2005 2006 2007 2008 2009 2010 2011
Sales & Services 695.7 775.5 888.5 1,007.0 1,143.9 1,556.9 1,905.0 2,388.4 2,660.8 3,128.3
EBITDA 74.8 75.7 74.5 88.3 144.3 198.7 246.4 304.0 375.1 409.8
Profit before Interest & Tax (PBIT) 61.9 64.9 64.5 75.0 103.1 156.7 225.1 280.4 333.3 366.9
Profit before Tax 57.8 63.8 63.3 73.0 98.0 136.0 194.5 244.7 307.7 327.6
Extraordinary / Exceptional items - - - - - (14.0) (10.6) 15.0 9.8 (48.9)
Profit before Tax (PBT) 57.8 64.0 65.1 74.3 98.0 150.1 205.0 229.6 296.0 376.5
Profit after Tax (PAT) 50.1 56.2 59.0 70.1 86.9 112.9 169.1 188.7 231.7 291.5
Cash Profits (Profit after Current Tax
+ Depreciation + Amortisation) 67.2 78.2 72.1 82.8 137.2 187.1 220.1 258.4 294.8 350.4
Economic Value Added 29.1 31.3 38.2 46.0 50.7 79.3 131.5 144.4 196.0 201.0
Goodwill on consolidation - - - 1.7 1.7 45.0 84.2 85.0 85.0 397.6
Net Fixed Assets 141.3 105.7 112.5 145.9 381.3 165.4 257.3 311.1 399.7 489.7
Investments 0.0 13.9 0.5 12.4 18.5 0.0 0.01 13.0 82.7 89.2
Net Current Assets 66.9 93.9 90.2 128.3 107.7 117.7 233.0 355.3 483.3 702.6
Miscellaneous Expenditure - 0.7 0.5 0.4 0.3 0.1 - - - -
Deferred Tax Asset - - - - - 115.2 98.2 64.1 61.6 30.1
Total Capital Employed 208.2 214.1 203.6 288.7 509.4 443.3 672.7 828.5 1,112.4 1,709.2
Equity Share Capital 14.5 29.0 29.0 58.0 58.0 60.9 60.9 60.9 60.9 61.4
Advance against Equity - - 0.2 - - - - - - -
Preference Share Capital - 29.0 - - - - - - - -
Reserves 182.7 135.0 155.2 158.9 203.5 131.5 253.7 392.6 593.0 854.1
Net Worth 197.2 193.0 184.4 216.9 261.5 192.4 314.6 453.5 654.0 915.5
Minority interest - 3.1 1.9 - - 0.0 0.1 - 12.5 21.9
Borrowed Funds 5.0 12.0 11.1 65.7 239.7 251.0 358.0 375.0 445.9 771.8
Deferred Tax Liability 6.0 6.1 6.2 6.1 8.3 - - - - -
Total Funds Employed 208.2 214.1 203.6 288.7 509.4 443.3 672.7 828.5 1,112.4 1,709.2
EBITDA Margin (%) 10.8 9.8 8.4 8.8 12.6 12.8 12.9 12.7 14.1 13.1
Profit before Tax to Turnover (%) 8.3 8.2 7.3 7.4 8.6 9.6 10.8 9.6 11.1 12.0
Profit after Tax to Turnover (%) 7.2 7.2 6.6 7.0 7.6 7.3 8.9 7.9 8.7 9.3
Return on Net Worth (%)
(PAT / Average Net Worth $) 27.2 28.8 31.2 35.0 36.3 49.7 66.7 49.1 41.8 37.1
Return on Capital Employed
(PBIT* / Average Total Capital Employed @) 32.3 30.8 31.7 31.0 25.8 35.8 40.3 37.4 34.2 25.7
Net Cash Flow from Operations per share (Rs.)
(Refer Cash Flow Statement)##, ### 4.5 2.2 2.7 0.7 2.8 3.1 2.3 3.0 3.4 4.4
Earning per Share (EPS) (Rs.)
(PAT / No. of Equity Shares)##, ### 3.5 1.9 2.0 1.2 1.5 1.9 2.8 3.1 3.8 4.7
Economic Value Added per Share (Rs.)##, ### 2.0 1.1 1.3 0.8 0.9 1.3 2.2 2.4 3.2 3.3
Dividend per Share (Rs.)##, ### 1.4 0.5 0.4 0.5 0.6 0.7 0.7 0.7 0.7 0.8
Debt / Equity 0.0 0.1 0.1 0.3 0.9 1.3 1.1 0.8 0.7 0.8
Book Value per Share (Rs.)
(Net Worth / No. of Equity Shares)##, ### 13.6 6.7 6.4 3.7 4.5 3.2 5.2 7.4 10.7 14.9
Sales to Average Capital Employed @ 3.6 3.7 4.3 4.1 2.9 3.3 3.4 3.2 2.7 2.2
Sales to Average Net Working Capital # 12.2 9.6 9.7 9.2 9.7 13.8 10.9 8.1 6.3 5.3
* PBIT includes extraordinary items@ Average Capital Employed = (Opening Capital Employed + Closing Capital Employed)/2$ Average Net Worth = (Opening Net Worth + Closing Net Worth)/2# Average Net Working Capital = (Opening Net Current Assets + Closing Net Current Assets)/2## Per share information for 2004-05 is re-calculated on enhanced equity share capital of Rs. 58 crores (5.8 crore shares)### Previous year figures have been recomputed based on the post split face value of Re. 1Note: 1 crore equals 10 million
10 YEARS HIGHLIGHTS CONSOLIDATED QUARTERLY FINANCIALS 2010-11 (Amount in Rupees Crore)
Particulars Three Months Ended Annual
Jun. 30, 10 Sept. 30, 10 Dec. 31, 10 Mar. 31, 11 FY 11
Total Revenue 791.7 783.1 824.6 756.7 3,156.2
Total Expenditure 673.0 668.5 708.5 668.6 2,718.6
Finance Charges 7.0 6.5 7.6 18.2 39.3
Gross profit after Finance Charges
but before Depreciation and Taxation 111.7 108.1 108.5 69.9 398.3
Depreciation & Amortisation 12.0 14.0 14.6 30.2 70.8
Profit before Taxation and Exceptional Item 99.7 94.2 93.9 39.8 327.5
Exceptional Item (8.8) (8.2) (9.6) 75.5 48.9
Profit before Tax 90.9 86.0 84.3 115.3 376.4
Minority Interest & Goodwill on consolidation 1.0 1.8 1.5 0.8 5.0
Profit before Tax after minority interest & goodwill 89.9 84.2 82.9 114.4 371.4
Provision for Tax (Current) 22.9 24.0 20.3 29.7 96.9
MAT Credit (6.7) (11.6) (15.1) (10.2) (43.6)
Fringe Benefit Tax - - - - -
Profit after Tax (Current) 73.7 71.7 77.6 94.9 318.1
Provision for Tax (Deferred Taxation) 0.0 0.2 8.1 23.3 31.6
Profit after Tax 73.7 71.6 69.5 71.6 286.4
Equity Share Capital 60.9 61.4 61.4 61.4 61.4
Earnings per Share - (Rs.) 1.2 1.2 1.1 1.2 4.7
Note: Previous period / year figures have been regrouped / restated wherever necessary.
2009-10 (Amount in Rupees Crore)
Particulars Three Months Ended Annual
Jun. 30, 09 Sept. 30, 09 Dec. 31, 09 Mar. 31, 10 FY 10
Total Revenue 699.9 697.8 675.2 607.6 2,680.4
Total Expenditure 600.3 597.2 570.8 517.3 2,285.6
Finance Charges 8.6 5.6 6.4 5.0 25.7
Gross profit after Finance Charges
but before Depreciation and Taxation 91.0 95.0 98.0 85.2 369.1
Depreciation & Amortisation 9.9 17.9 16.6 15.7 60.1
Profit before Taxation and Exceptional Item 81.1 77.1 81.4 69.5 309.1
Exceptional Item 4.1 - - 5.7 9.8
Profit before Tax 77.0 77.1 81.4 63.8 299.3
Minority Interest & Goodwill on consolidation - 0.1 0.9 0.9 1.9
Profit before Tax after minority interest & goodwill 77.0 77.0 80.5 62.9 297.4
Provision for Tax (Current) 18.4 14.5 18.2 12.8 63.8
MAT Credit (0.5) 1.6 (1.1) (2.5) (2.6)
Fringe Benefit Tax - - - - -
Profit after Tax (Current) 59.1 61.0 63.5 52.6 236.1
Provision for Tax (Deferred Taxation) 3.1 (2.8) 1.3 1.5 3.1
Profit after Tax 56.0 63.8 62.2 51.1 233.1
Equity Share Capital 60.9 60.9 60.9 60.9 60.9
Earnings per Share - (Rs.) 0.9 1.0 1.0 0.8 3.8

M A R I C O LIMITED
152
NOTICENOTICE is hereby given that the Twenty Third Annual General Meeting of Marico Limited will be held on Wednesday, July 27, 2011
at 3.30 p.m. at IES Management College & Research Centre, Gate No.4, Seminar Hall, 6th Floor, Plot No.791, S K Marg, VMDL
Complex, Bandra Reclamation, Bandra (W) Mumbai – 400050 to transact the following business:
ORDINARY BUSINESS
1. To receive, consider and adopt the audited Balance Sheet as at March 31, 2011 and the Profit and Loss Account of the
Company for the year ended on that date together with the Reports of the Directors and the Auditors.
2. To confirm interim dividends of Re. 0.30 and Re.0.36 per equity share of Re. 1 each, declared for the financial year ended
March 31, 2011.
3. To appoint a Director in place of Ms. Hema Ravichandar, who retires by rotation, and being eligible, offers herself for re-
appointment.
4. To appoint a Director in place of Mr. Nikhil Khattau, who retires by rotation, and being eligible, offers himself for re-appointment.
5. To re-appoint M/s. Price Waterhouse, Chartered Accountants, as Statutory Auditors and fix their remuneration for the financial
year ending March 31, 2012.
SPECIAL BUSINESS
6. Re-appointment of Mr. Harsh Mariwala as the Managing Director of the Company
To consider and, if thought fit, to pass, with or without modification, the following resolution as an ORDINARY RESOLUTION:
“RESOLVED THAT pursuant to Sections 198, 269, 309 and 310 read with Schedule XIII and all other applicable provisions of
the Companies Act, 1956 (“the Act”), the rules and regulations enacted under the Act, including any statutory modification(s)
or re-enactment thereof, for the time being in force :
a) approval of the Company be and is hereby accorded for reappointment of Mr. Harsh Mariwala as the Managing Director
of the Company for a period of 3 (three) years with effect from April 1, 2011 on the terms and conditions as set out in
the Explanatory Statement annexed to this Notice;
b) the Board of Directors of the Company (hereinafter called “the Board” which term shall be deemed to include any
Committee which the Board may have constituted or hereinafter constitute to exercise its powers including the power
conferred by this resolution), be and are hereby severally authorized to :
(i) alter or vary the terms and conditions of the said appointment, with the prior consent of Mr. Harsh Mariwala,
provided however, that the altered or varied remuneration shall not exceed the maximum limits for payment of
managerial remuneration as may be specified in the Act including any statutory modification(s) or re-enactment
thereof, for the time being in force;
(ii) authorize any individual Director or Company Secretary or any Officer or Manager of the Company jointly or severally
to execute any document(s) and/or to take such decisions or actions as may be necessary to give effect to the
foregoing;
(iii) settle any question, difficulty or doubt, that may arise in giving effect to this resolution;
(iv) do all such acts, deeds, matters and things, as it may in its absolute discretion deem necessary and think fit to
give effect to this resolution;
(v) delegate all or any of the powers herein conferred to any Committee of Directors or any other Officer(s) of the
Company.”
NOTES:
1. A member entitled to attend and vote at the meeting is entitled to appoint a proxy to attend and vote instead of himself
and the proxy need not be a member of the Company. The instrument appointing the proxy must be deposited at the
registered office of the Company not less than 48 hours before the commencement of the meeting.

M A R I C O LIMITED
153
2. Members/proxies should bring duly filled attendance slips sent herewith to attend the meeting.
3. The Register of Members and Share Transfer Books of the Company will remain closed from Monday, July 25, 2011 to
Wednesday, July 27, 2011, both days inclusive, for the purpose of the Annual General Meeting.
4. All dividends declared for and upto the 3rd interim equity dividend 2003-04 on equity shares of the Company & preference
shares redemption amount, which remained unclaimed for a period of seven years as per Section 205A of the Companies
Act, 1956 (the Act), have been transferred to the Investor Education and Protection Fund (IEPF) established by the Central
Government under Section 205C of the Act.
Members, who have not yet encashed their dividend warrant(s), for any dividends declared after the aforesaid dividends, are
requested to forward their claims to the Company at its registered address mentioned below.
It may be noted that once the unclaimed dividend is transferred to the IEPF, as above, no claim shall lie against the Company
or the aforesaid Fund in respect of such amount.
5. Members whose shareholding is in the electronic mode are requested to direct change of address notifications and
updations of bank mandates (details of bank name and account no.) to their respective Depository Participants. Members
other than those holding shares in electronic mode are requested to direct change of address notification and updation of
bank mandates, if any, to the Registrar and Share Transfer Agents, M/s Link Intime India Pvt. Limited (Unit: Marico Ltd.), C
-13 Pannalal Silk Mills Compound, LBS Road, Bhandup (West), Mumbai 400 078. Tel.: 022-25946970, Fax: 022-25946969,
E-mail id: [email protected]
6. Additional information on Directors seeking re-election at the Annual General Meeting is available in the Corporate Governance
Report forming part of the Annual Report for the year 2010 - 11.
7. In compliance with the Secretarial Standards and as a good governance practice, your Company does not give gifts to its
members and also does not offer its products at discounted rates. However, your Company is committed to shareholders’
wealth maximization through superior performance reflected in corporate benefits like dividend and increased market
capitalization.
8. Your Company seeks your support to the “Green Initiative” of the Ministry of Corporate Affairs (“MCA”) introduced on April
21, 2011. The Company has already approached the members for their consent to allow paperless compliances by serving
documents through electronic mode. We propose to send documents like the notice calling the general meetings, audited
financial statements, directors’ report, auditors’ report, etc. in electronic form, at the email address provided by you and/or
made available to us by the Depositories.
Members holding shares in demat mode who have not registered their e-mail address are requested to register the same
with their respective Depository Participants. Members holding shares in physical form are requested to provide with their
email address to the Company or M/s. Link Intime India Pvt. Ltd, the Registrar & Share Transfer Agents.
For the members who desire to receive the documents mentioned above in physical form, they may request the Company in
writing for the same. The Company shall upon receiving such request furnish free of cost copies of such documents requested
for.
We solicit and appreciate members’ support to the “Green Initiative” taken by MCA and your Company’s desire to participate
in such initiatives.
Place: Mumbai By Order of the Board
Date: May 2, 2011 For MARICO LIMITED
Registered Office:
“Rang Sharda” Hemangi WadkarKrishnachandra Marg, Bandra Reclamation, Company Secretary andBandra (West), Mumbai - 400 050 Compliance Officer
NOTICE

M A R I C O LIMITED
154
EXPLANATORY STATEMENT PURSUANT TO SECTION 173(2) OF THE COMPANIES ACT, 1956
ITEM NO. 6
Re-appointment of Mr. Harsh Mariwala as the Managing Director of the Company
Mr. Harsh Mariwala has been the Managing Director of the Company (MD) in terms of various successive agreements between the
Company and the MD, since July 1, 1991. Mr. Mariwala was last appointed as the MD vide a resolution passed by the Shareholders
of the Company through Postal Ballot, results whereof were declared on June 15, 2006, for a period of 5 years with effect from
April 1, 2006. The said appointment was valid upto March 31, 2011.
The Board of Directors at its meeting held on January 27, 2011 has re-appointed Mr. Harsh Mariwala as the MD for a further
period of 3 years with effect from April 1, 2011 subject to the approval of the Shareholders inter alia on the following terms
and conditions :
I. REMUNERATION
The MD shall be entitled to remuneration as under:
A. FIXED REMUNERATION AND PERQUISITES
A. 1. FIXED REMUNERATION
The Corporate Governance Committee may, from time to time and in consultation with the MD, fix the exact remuneration
under this head, within the following band-that is not less than Rs. 275 Lacs and not more than Rs. 525 Lacs per annum
comprising of:
A.1.a) Basic Salary of not less than Rs. 18 Lacs per month
A.1.b ) Other Items, comprising the following:
(i) Contribution to Provident Fund at the applicable rate
(ii) Contribution to Pension Fund/ Superannuation Fund at the applicable rate, not exceeding Rs. 1 Lac or
such other amount as may be agreed between the Company and the MD
(iii) Leave Travel Allowance according to the Company’s policy
A. 2. PERQUISITES
A.2.a) Fully furnished rent free accommodation or HRA (All repairs to house, including insurance, gas, electricity,
water etc. to be borne by the Company)
A.2.b) Use of 2 cars to be provided by the Company, along with driver, insurance, petrol, maintenance and garage
rent.
B. VARIABLE REMUNERATION
B.1. Incentive payable annually in accordance with the Company’s Incentive Scheme, from time to time, which currently
is subject to a limit of 50% of the Fixed Remuneration
C. OTHER ITEMS TO BE INCURRED BY THE COMPANY WITHOUT LIMITS ON ACTUALS
C.1. Reimbursement of Medical expenses incurred by the MD and his family (the Company may take a medical insurance
policy in which case the cost of the premium will be charged as a part of the remuneration)
C.2. Personal accident insurance of an amount commensurate with the MD’s earnings

M A R I C O LIMITED
155
C.3. Use of such Communication facilities, as may be required, at the residence of Mr. Harsh Mariwala – including but
not limited to Telephones (land lines/mobiles), Faxes, Computers/Laptops and Internet connection
C.4. Membership and Use of not more than 4 corporate/ health clubs
C.5. Other benefits, schemes, privileges and amenities such as housing loans and other loans at concessional
rate of interest, credit cards, etc. as may be granted from time to time to the employees of the Company, in
accordance with the relevant schemes. Housing and other loans shall be governed by such regulations as
may be applicable
C.6. Leave / Leave Encashment on cessation of service, as per Rules of the Company
C.7. Gratuity at the rate of fifteen days’ salary for every completed year of service since the date on which Mr. Harsh
Mariwala was first appointed as the Managing Director i.e. since July 1, 1991, payable on cessation of service on
any ground;
Provided that the Gratuity for each term shall be calculated separately based on the salary drawn last at the end
of each term.
For the purpose of payment of gratuity, Mr. Harsh Mariwala shall be deemed to be in continuous employment of
the Company from the date of his first appointment up to the date of cessation of his office.
It is clarified that reimbursement of entertainment, Traveling and any other expenses actually incurred for the
business of the Company shall not form a part of the remuneration.
II. OTHER PROVISIONS RELATED TO REMUNERATION:
1. Minimum Remuneration :
If in any financial year during the tenure of the Managing Director, the Company has no profits or its profits are
inadequate, the Company shall pay to him remuneration by way of salary and perquisites as specified above as
minimum remuneration subject to the limits laid down and in the manner as stipulated in Schedule XIII to the Companies
Act, 1956, as in force and as amended from time to time.
2. Maximum Remuneration :
Except with the permission of the Central Government, remuneration to the Managing Director shall not exceed the
limits specified under the provisions of Section 198, 309, 310 & Schedule XIII to the Companies Act, 1956.
3. Disentitlements :
The Managing Director shall not be entitled:
a. To supplement his earnings under the Agreement with any buying or selling commission involving the Company’s
transactions.
b. To sitting fees for attending Meetings of the Board of Directors of the Company or any Committee or Committees
thereof.
c. To Employee Stock Option Scheme (ESOS)/ Employee Stock Purchase Scheme (ESPS), as may be formed and
announced by the Company, from time to time, through which shares may be allotted to employees.
4. Demise of the Director :
In case of the demise of Mr. Harsh Mariwala during the course of his employment, the Company shall pay to his
legal heirs, salary and other emoluments due to him together with any such further sum as the Board of Directors in
its sole discretion, may determine.

M A R I C O LIMITED
156
The proposed remuneration of the MD is within the limits prescribed under Part II Section I of Schedule XIII of the
Companies Act, 1956.
The terms of remuneration of MD has the approval of the Corporate Governance Committee (erstwhile Remuneration
Committee) of the Board of Directors of the Company.
The terms of re-appointment of Mr. Harsh Mariwala as MD and the payment of remuneration to him as stated here
may be treated as an Abstract under Section 302 of the Companies Act, 1956.
A copy of the draft Agreement to be executed with Mr. Harsh Mariwala is available for inspection by the Members of the
Company at the Registered Office of the Company on all working days of the Company, between 10.00 a.m. and 1.00 p.m.
None of the Directors of the Company except Mr. Harsh Mariwala is in any way concerned or interested in this resolution.
Place: Mumbai By Order of the Board
Date: May 2, 2011 For MARICO LIMITED
Registered Office:
“Rang Sharda” Hemangi WadkarKrishnachandra Marg, Bandra Reclamation, Company Secretary andBandra (West), Mumbai - 400 050 Compliance Officer

MARICO LIMITEDRegistered Office : “Rang Sharda”, Krishnachandra Marg, Bandra Reclamation, Bandra (West), Mumbai - 400 050.
PROXY FORM
TWENTY THIRD ANNUAL GENERAL MEETING ON WEDNESDAY, JULY 27, 2011 AT 3.30 P.M.
Regd. Folio No. / DP Client ID
No. of shares held
I/We___________________________________________________________ of___________________________________ being
a member / members of the above-named Company hereby appoint ________________________________________________
of_______________________________or failing him______________________________________________________________
of______________________________________as my/our proxy to vote for me/us on my/our behalf at the TWENTY THIRD ANNUAL
GENERAL MEETING of the Company to be held at IES Management College & Research Centre, Gate No.4, Seminar Hall, 6th
Floor, Plot No.791, S K Marg, VMDL Complex, Bandra Reclamation, Bandra (W) Mumbai – 400050 at 3.30 p.m. on Wednesday,
July 27, 2011. and at any adjournment(s) thereof.
Signed this day of 2011 Signature
Notes: 1. A Member entitled to attend and vote is entitled to appoint a proxy to attend and vote instead of himself.2. A Proxy need not be a Member.3. This form in order to be effective must be duly stamped, completed and signed and must be deposited at the Registered Office of the Company, not later than 48 hours before the commencement of the meeting.
Affix One
RupeeRevenueStamp
MARICO LIMITEDRegistered Office: “Rang Sharda”, Krishnachandra Marg, Bandra Reclamation, Bandra (West), Mumbai - 400 050.
ATTENDANCE SLIP
TWENTY THIRD ANNUAL GENERAL MEETING ON WEDNESDAY, JULY 27, 2011 AT 3.30 P.M.
Regd. Folio No. / DP Client ID
No. of shares held
I certify that I am a registered shareholder / proxy for the registered shareholder of the Company.
I hereby record my presence at the TWENTY THIRD ANNUAL GENERAL MEETING of the Company to be held at IES
Management College & Research Centre, Gate No.4, Seminar Hall, 6th Floor, Plot No.791, S K Marg, VMDL Complex, Bandra
Reclamation, Bandra (W) Mumbai – 400050 at 3.30 p.m. on Wednesday, July 27, 2011.
Member’s / Proxy’s name in BLOCK letters Member’s / Proxy’s signature
Note : Please fill in the attendance slip and hand it over at the entrance of the Meeting Hall.


Dear Shareholder(s),
Sub: Dividend Disbursement through National Electronic Clearing Service (NECS)
Currently, as per directive from Securities and Exchange Board of India, all companies use Electronic Clearing Service (ECS) facility
introduced by Reserve Bank of India (RBI) for disbursing dividends. In this system, the shareholder’s bank account is directly
credited under advice to the shareholder.
As advised by the Reserve Bank of India (RBI), the remittance of money through ECS is proposed to be replaced by National
Electronic Clearing Service (NECS). The advantages of NECS over ECS include faster credit of remittances to beneficiary’s account,
coverage of more branches as also ease of operation.
NECS essentially operates on the new and unique bank account number, allotted by banks post implementation of Core Banking
Solutions (CBS) for centralized processing of inward instructions and efficiency in handling bulk transactions.
Please follow the below mentioned procedure for updating your new CBS bank account number:
A. For shareholders holding shares in Demat form
In case you hold your shares in Demat form, please furnish your new Bank Account Number allotted to you by your bank
after implementation of CBS, along with a photocopy of a cheque pertaining to the concerned account, to your Depository
Participant (DP).
Please do not send the same to the company or to the R&T Agent.
B. For shareholders holding shares in physical form
In case you hold your shares in physical form, please furnish the new Bank Account Number allotted to you by your bank
after implementation of CBS, in the form printed overleaf.
Please do not e-mail or fax the same.
In your own interest please comply with the above requirement at the earliest possible, so that the bank details are
updated before the payment of future dividends.
If you do not provide your new bank account number, allotted after implementation of CBS by your Bank, then please note
that ECS to your old account may either be rejected or returned, which will delay the payment of dividend to you.
In case you have already provided your new bank account number, this communication may be ignored. Assuring you of our
best services at all times.
Yours faithfully,
For Marico Limited
Hemangi Wadkar
Company Secretary & Compliance Officer

To be filled, signed and returned in original by a shareholder holding shares in physical form. Shareholders holding shares
in demat form are requested to give the bank details to their DP and not to the Company.
M/s Link Intime India Pvt LimitedUnit: Marico LimitedC -13 Pannalal Silk Mills Compound,LBS Road, Bhandup (West),Mumbai 400 078.
Tel.: 022 - 25946970
Dear Sirs,
Sub: Updation of new bank account number for dividend payment through NECS
This has reference to your communication regarding National Electronic Clearing Service (NECS), printed overleaf. Since banks
have changed the customer account number post migration to Core Banking Solution (CBS), I request you to update the bank
details against my folio as per details given below:
Folio No.
No. of Shares
First Holder’s Name
Contact Telephone Number (with STD code)
Personal E-mail ID
New Account no. after implementation of CBS
Bank Name
Bank Branch & Address
9 Digit Bank Code No. (as printed on the cheque leaf)
RTGS / NEFT IFSC Code (as printed on the cheque leaf)
(A cancelled cheque leaf from the cheque book issued by bank for the operation of the above account is enclosed )
If the payment transaction is delayed or not effected at all for any reason(s) beyond the control of the Company, I would not hold
the company responsible.
Yours truly,
(Signature of first named shareholder)

OUR PRESENCE
MUMBAI
GOA
BHIWANDI
JALGAON
JAMMU
ZIRAKPUR
DEHRADUNROHTAK
JAIPUR
NCR
GHAZIABAD
LUCKNOWPATNA
GUWAHATI
AGARTALA
RANCHI
KOLKATA
INDORE
AHMEDABAD
DAMAN
CHANDIGARH
NAGPUR
HYDERABAD
VIJAYAWADA
RAIPUR
CUTTACK
PUNE
HUBLI
BANGALORE
CHENNAI
PONDICHERRY
KANJIKODE
COCHIN
COIMBATORE
BANGLADESHDHAKA
MOUCHAK
PARWANOO
PORT BLAIR
SILIGURI
PAONTA SAHIB
BADDI
HEAD OFFICE FACTORIES REGIONAL OFFICES DEPOTS REDISTRIBUTION CENTRES
CONSIGNMENT SALES AGENTS REGISTERED OFFICE - MARICO BANGLADESH LIMITED
KAYA CLINICS (SOUTH - 20; WEST- 33; NORTH - 22; EAST- 6)
JALANDHARLUDHIANA
VISHAKAPATNAM
BHOPAL
NASHIK
SURAT
VADODARA
Manufacturing & Supply Chain
• IMC Ramkrishna Bajaj National Quality Award (RBNQA) 2009 – Outstanding Achievement Trophy.
• 'Food Supply Chain Innovative Company of the Year' Award at the KPMG
– Supply Chain Leadership Council Food, Retail, Logistics and Packaging Awards
• IMC Ramkrishna Bajaj National Quality Award (RBNQA) 2010 (Certificate of Merit).
• Kerala State Safety Award 2010 in the food product category.
• 'Rajiv Gandhi National Quality Commendation Certificate 2009' in the large-scale manufacturing industry
- Food & Drug Category.
• Third highest honor 'Quest for Excellence' at the International Asia Pacific Quality Awards (IAPQA).
• Greentech Safety Silver Award 2010, for outstanding achievement in Safety Management,
in the FMCG sector.
• 'Gold Award' at the prestigious Economic Times 'India Manufacturing Excellence Awards' 2010
in partnership with Frost & Sullivan.
Sustainability
• Kerala State Energy Conservation Commendation Award 2010, in the large scale energy
consumers category.
• 'Silver' at the Greentech Environment Excellence Award 2010, in the FMCG sector.
• Runners-up trophy at the G-CUBE
• Good Green Governance Award.
IT
• Adjudged as one of the Top 5 winners of the most prestigious CIO ASIA 100 Award 2011.
• Great Minds Challenge for Business Award – 2010' in the Business Analytics category.
• NASSCOM CNBC TV18 - IT User Award 2010, for excellence in IT application, in the manufacturing category.
• 2 EDGE Awards – the Diamond EDGE Award for 'Mobile–based solution for boosting productivity
of farmers' and another EDGE Award for the 'Darpan' project.
• Intelligent Enterprise Award 2010' in the Retail and Consumer Products category.
• Marico's IT Head (Girish Rao) was awarded the CIO 100 Award 2010
• Red Hat Consumer Showcase Award 2010, for pioneering the use of open source.
HR
• All India Management Association (AIMA) - Indian Oil Corporation Ltd. (IOCL) Award for
'Best Motivational Practice' in the manufacturing sector.
AWARDS & ACKNOWLEDGEMENTS
161

OUR PRESENCE
MUMBAI
GOA
BHIWANDI
JALGAON
JAMMU
ZIRAKPUR
DEHRADUNROHTAK
JAIPUR
NCR
GHAZIABAD
LUCKNOWPATNA
GUWAHATI
AGARTALA
RANCHI
KOLKATA
INDORE
AHMEDABAD
DAMAN
CHANDIGARH
NAGPUR
HYDERABAD
VIJAYAWADA
RAIPUR
CUTTACK
PUNE
HUBLI
BANGALORE
CHENNAI
PONDICHERRY
KANJIKODE
COCHIN
COIMBATORE
BANGLADESHDHAKA
MOUCHAK
PARWANOO
PORT BLAIR
SILIGURI
PAONTA SAHIB
BADDI
HEAD OFFICE FACTORIES REGIONAL OFFICES DEPOTS REDISTRIBUTION CENTRES
CONSIGNMENT SALES AGENTS REGISTERED OFFICE - MARICO BANGLADESH LIMITED
KAYA CLINICS (SOUTH - 20; WEST- 33; NORTH - 22; EAST- 6)
JALANDHARLUDHIANA
VISHAKAPATNAM
BHOPAL
NASHIK
SURAT
VADODARA
Manufacturing & Supply Chain
• IMC Ramkrishna Bajaj National Quality Award (RBNQA) 2009 – Outstanding Achievement Trophy.
• 'Food Supply Chain Innovative Company of the Year' Award at the KPMG
– Supply Chain Leadership Council Food, Retail, Logistics and Packaging Awards
• IMC Ramkrishna Bajaj National Quality Award (RBNQA) 2010 (Certificate of Merit).
• Kerala State Safety Award 2010 in the food product category.
• 'Rajiv Gandhi National Quality Commendation Certificate 2009' in the large-scale manufacturing industry
- Food & Drug Category.
• Third highest honor 'Quest for Excellence' at the International Asia Pacific Quality Awards (IAPQA).
• Greentech Safety Silver Award 2010, for outstanding achievement in Safety Management,
in the FMCG sector.
• 'Gold Award' at the prestigious Economic Times 'India Manufacturing Excellence Awards' 2010
in partnership with Frost & Sullivan.
Sustainability
• Kerala State Energy Conservation Commendation Award 2010, in the large scale energy
consumers category.
• 'Silver' at the Greentech Environment Excellence Award 2010, in the FMCG sector.
• Runners-up trophy at the G-CUBE
• Good Green Governance Award.
IT
• Adjudged as one of the Top 5 winners of the most prestigious CIO ASIA 100 Award 2011.
• Great Minds Challenge for Business Award – 2010' in the Business Analytics category.
• NASSCOM CNBC TV18 - IT User Award 2010, for excellence in IT application, in the manufacturing category.
• 2 EDGE Awards – the Diamond EDGE Award for 'Mobile–based solution for boosting productivity
of farmers' and another EDGE Award for the 'Darpan' project.
• Intelligent Enterprise Award 2010' in the Retail and Consumer Products category.
• Marico's IT Head (Girish Rao) was awarded the CIO 100 Award 2010
• Red Hat Consumer Showcase Award 2010, for pioneering the use of open source.
HR
• All India Management Association (AIMA) - Indian Oil Corporation Ltd. (IOCL) Award for
'Best Motivational Practice' in the manufacturing sector.
AWARDS & ACKNOWLEDGEMENTS
162

A PRODUCT PORTFOLIO THAT'S ALWAYS GETTING WIDER,
STRONGER, BETTER. BECAUSE AT MARICO, IF IT'S
GOOD ENOUGH, IT'S TIME TO DO MORE.
Every brand in Marico’s portfolio continuously evolves – offering more products, increased benefits, enhanced performance. In the process,
delivering more value to the consumer. Parachute Advansed stands for care & nurturance and fulfills the needs of its myriad consumers through its various offerings
Marico’s international brands have a strong presence in the male grooming portfolio and ethnic segment in South-East Asia and Africa.
Kaya's range of services and skin care products, developed with world-class technology and years of expertise.
Saffola stands for healthy living and achieves it through the creation of healthy food products, which are good for you.
163

A PRODUCT PORTFOLIO THAT'S ALWAYS GETTING WIDER,
STRONGER, BETTER. BECAUSE AT MARICO, IF IT'S
GOOD ENOUGH, IT'S TIME TO DO MORE.
Every brand in Marico’s portfolio continuously evolves – offering more products, increased benefits, enhanced performance. In the process,
delivering more value to the consumer. Parachute Advansed stands for care & nurturance and fulfills the needs of its myriad consumers through its various offerings
Marico’s international brands have a strong presence in the male grooming portfolio and ethnic segment in South-East Asia and Africa.
Kaya's range of services and skin care products, developed with world-class technology and years of expertise.
Saffola stands for healthy living and achieves it through the creation of healthy food products, which are good for you.
164

Registered Office:
Marico LimitedRang Sharda, Krishnachandra Marg,Bandra Reclamation, Bandra (West),Mumbai 400 050, India.Tel: (91-22) 6648 0480.Fax: (91-22) 6649 0112.Email: [email protected]
www.marico.com www.maricobd.comwww.kayaclinic.comwww.parachuteadvansed.comwww.parachutearabia.comwww.saffolalife.comwww.haircodeworld.comwww.icpvn.comwww.maricoinnovationfoundation.org