Witan Investment Trust plc 2011 Annual General Meeting 10 May 2011.

Annual Report 2009
2 NIT Annual Report 2009
Dear Shareholder,
The National Investment Trust Ltd is pleased to present its Annual Report for the year ended 30th June 2009.
This innovative format comprises in hard copy, the Notice of Annual Meeting of Shareholders, a proxy form and extracts of the key figures of the report, namely the Balance Sheets, Income Statements, Statements of Changes in Equity and Cash flow Statements. This CD includes the full version of the report.
Should you wish to obtain a printed copy of the Annual Report, kindly complete the closed order form and send it back to us. The report will be forwarded to you free of charge.
Yours faithfully,
Gaetan Wong To WingChief Executive Officer
CHAIRMANRaj Ringadoo
DIRECTORSMazahir AdamjeeChaya DawonauthAndré José Poncini, g.o.s.k.Imrith RamtohulJayavadee Sooben
CHIEF EXECUTIVE OFFICERGaetan Wong To Wing
COMPANY SECREATARYSoundararajen Ramsamy
AUDITORSKemp Chatteris Deloitte(Charted Accountants)
BANKERSThe Hong Kong and Shanghai Banking Corporation LtdThe Mauritius Commercial Bank LtdBNPI Offshore Banking LtdBarclays Bank PLC
REGISTER AND TRANSFER OFFICELevel 8, Newton TowerSir William Newton StreetPort Louis
REGISTERED OFFICELevel 8, Newton TowerSir William Newton StreetPort Louis
Corporate Information

3
Notice is hereby given that the Annual General Meeting of National Investment Trust Ltd will be held at 10.00 a.m. on Saturday 12th December 2009 at Centre Social Marie Reine de la Paix, Port Louis to transact the following business.
1. To approve the Minutes of Proceedings of the previous meeting of shareholders.
2. To receive and adopt the financial statements to June 2009 and the report of the Directors and Auditors thereon.
3. To ratify the dividend declared by the Board of Directors and paid to all shareholders registered at the close of business on 19th November 2009.
4. To elect the existing Directors in accordance with the provisions of the Articles of Association and the Companies Act 2001.
5. To reappoint Messrs Kemp Chatteris Deloitte as Auditors for the current year and to authorize the Board of Directors to fix their remuneration.
6. To transact such other business, if any, as may be transacted at an Annual General Meeting.
By order of the Board
Soundararajen RamsamyCompany Secretary25 November 2009
Notes:
1. A member of the Company entitled to attend and vote at this meeting may appoint a proxy (whether a member or not) to attend and vote on his behalf. The appointment of a proxy must be made in writing on a proxy form and deposited at the Registered Office of the Company, Level 8 Newton Tower, Sir William Newton Street, Port Louis not less than twenty-four hours before the meeting.
Notice of Meeting

4 NIT Annual Report 2009
National Investment Trust Ltd Annual Report 2009
5
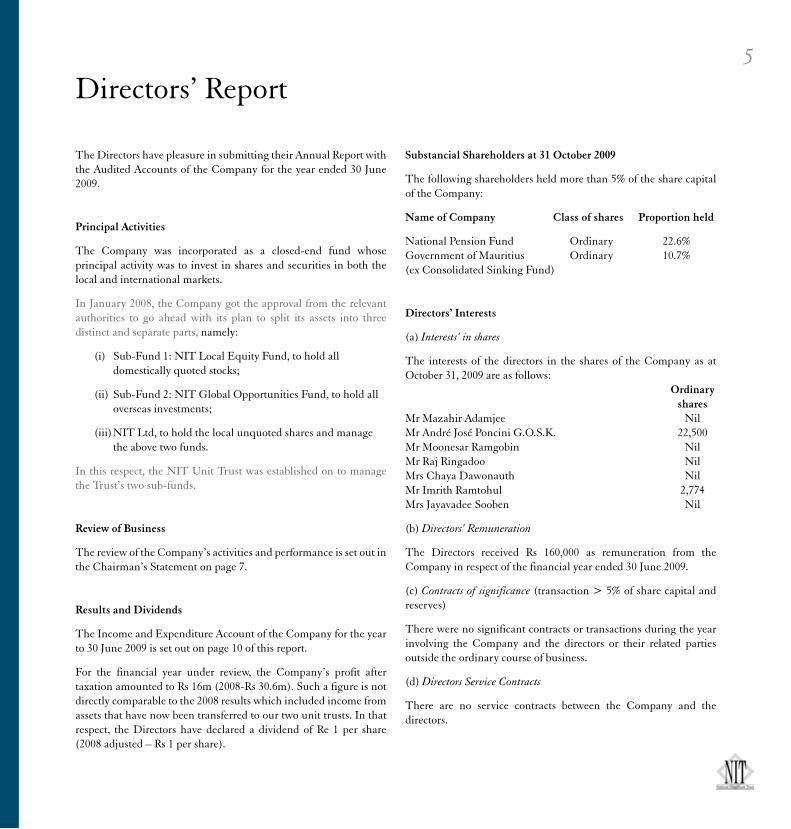
The Directors have pleasure in submitting their Annual Report with the Audited Accounts of the Company for the year ended 30 June 2009.
Principal Activities
The Company was incorporated as a closed-end fund whose principal activity was to invest in shares and securities in both the local and international markets.
In January 2008, the Company got the approval from the relevant authorities to go ahead with its plan to split its assets into three distinct and separate parts, namely:
(i) Sub-Fund 1: NIT Local Equity Fund, to hold all domestically quoted stocks;
(ii) Sub-Fund 2: NIT Global Opportunities Fund, to hold all overseas investments;
(iii) NIT Ltd, to hold the local unquoted shares and manage the above two funds.
In this respect, the NIT Unit Trust was established on to manage the Trust’s two sub-funds.
Review of Business
The review of the Company’s activities and performance is set out in the Chairman’s Statement on page 7.
Results and Dividends
The Income and Expenditure Account of the Company for the year to 30 June 2009 is set out on page 10 of this report.
For the financial year under review, the Company’s profit after taxation amounted to Rs 16m (2008-Rs 30.6m). Such a figure is not directly comparable to the 2008 results which included income from assets that have now been transferred to our two unit trusts. In that respect, the Directors have declared a dividend of Re 1 per share (2008 adjusted – Rs 1 per share).
Substancial Shareholders at 31 October 2009
The following shareholders held more than 5% of the share capital of the Company:
Name of Company Class of shares Proportion held
National Pension Fund Ordinary 22.6%Government of Mauritius Ordinary 10.7%(ex Consolidated Sinking Fund)
Directors’ Interests
(a) Interests’ in shares
The interests of the directors in the shares of the Company as at October 31, 2009 are as follows: Ordinary sharesMr Mazahir Adamjee NilMr André José Poncini G.O.S.K. 22,500Mr Moonesar Ramgobin NilMr Raj Ringadoo NilMrs Chaya Dawonauth Nil Mr Imrith Ramtohul 2,774Mrs Jayavadee Sooben Nil
(b) Directors’ Remuneration
The Directors received Rs 160,000 as remuneration from the Company in respect of the financial year ended 30 June 2009.
(c) Contracts of significance (transaction > 5% of share capital and reserves)
There were no significant contracts or transactions during the year involving the Company and the directors or their related parties outside the ordinary course of business.
(d) Directors Service Contracts
There are no service contracts between the Company and the directors.
Directors’ Report

6 NIT Annual Report 2009
Secretary’s CertificateIn terms of Section 166 (d) of the Companies Act 2001, I certify that, to the best of my knowledge, the Company has lodged with the Registrar of Companies all such returns as are required in terms of the Companies Act 2001 for the year ended June 30, 2009.
Soundararajen RamsamyCompany Secretary24 November 2009
Auditors
Messrs Kemp Chatteris Deloitte have expressed their willingness to continue to act as auditors of the company.
Corporate Governance
The Company has carried its business and activities in a manner which is in line with the best corporate practices as regard to the decision making process, procedures at Board level and management issues.
Directors
The Directors who served during the year are given below:
ChairmanRaj Ringadoo
DirectorsMazahir AdamjeeChaya DawonauthAndré José Poncini, g.o.s.k.Moonesar Ramgobin (resigned on 20.12.08)Imrith Ramtohul (appointed on 20.12.08)Jayavadee Sooben (appointed on 04.03.09)

7
I am pleased to present the sixteenth report of the Company together with the audited financial statements for the year ended 30 June 2009.
Performance Review
Asset Allocation as at 30.06.09
Net Asset Value
For the financial year under review, the Company’s Net Asset Value per share has decreased by 9.7% falling from Rs 47.82 on 01 July 2008 to reach Rs 43.20 on 30 June 2009. Such a performance is mainly attributable to the fact that, our portfolio of unquoted shares fell by around Rs 65.5m following the lower rating of most comparable listed companies as at 30 June 2009.
Income
For its first full year of operation as a management company that holds some unquoted assets, the Company’s net income after tax stood at Rs 16m. Such a figure is not directly comparable to the 2008 results which included income from assets that have now been transferred to our two unit trusts namely, NIT Local Equity Fund and NIT Global Opportunities Fund.
Prospects
Given the nature of our business, the size of funds under management and de facto, the evolution of stock-markets both locally and worldwide is critical in determining our performance. Furthermore, the fact that the valuation of our unquoted assets also takes into account the market ratios of comparable listed companies accentuates such dependence.
Taking into account the fact that since the end of the first quarter of the year equity markets (both locally and internationally) have rallied on the back of the end of the global recession and the emergence of some green shoots on the economic front, present indications seem to suggest that the worst is behind us and that the markets will be in for a easier ride amid, a very volatile one. In fact, since the beginning of the present financial year, the Semdex and the Msci World have gained about 18.6% and 13.7% respectively.
The Way ForwardIn line with its constant quest to create value for shareholders, the Board is currently exploring alternative avenues that would enable the Company to diversify its income stream going forward. In line with this, we have acquired some prime location in the Newton Tower and, an application for an investment adviser licence has been made to the Financial Services Commission. More details will be given to shareholders and the market once a concrete breakthrough is made.
Bearing in mind these latest developments, our current stance is one of cautious optimism.
Chairman30 October 2009
Chairman’s Statement

8 NIT Annual Report 2009
This report is made solely to the company’s shareholders, as a body, in accordance with section 205 of the Mauritius Companies Act 2001. Our audit work has been undertaken
so that we might state to the company’s shareholders those matters we are required to state to them in an auditor’s report and for no other purpose. To the fullest extent permitted by law, we do not accept or assume responsibility to anyone other than the company and the company’s shareholders as a body, for our audit work, for this report, or for the opinions we have formed.
Report on the Financial Statements
We have audited the financial statements of the National Investment Trust Ltd on pages 9 to 26 which comprise the statement of assets and liabilities as at 30 June 2009 and the income statement, statement of changes in equity and cash flow statement for the year then ended and a summary of significant accounting policies and other explanatory notes.
Directors’ responsibilities for the financial statements
The directors are responsible for the preparation and fair presentation of these financial statements in accordance with International Financial Reporting Standards and in compliance with the requirements of the Mauritius Companies Act 2001. This responsibility includes: designing, implementing and maintaining internal control relevant to the preparation and fair presentation of financial statements that are free from material misstatement, whether due to fraud or error; selecting and applying appropriate accounting policies; and making accounting estimates that are reasonable in the circumstances.
Auditor’s responsibility
Our responsibility is to express an opinion on these financial statements based on our audit. We conducted our audit in accordance with International Standards on Auditing. Those standards require that we comply with ethical requirements and plan and perform the audit to obtain reasonable assurance whether the financial statements are free from material misstatement.
An audit involves performing procedures to obtain audit evidence about the amounts and disclosures in the financial statements. The
procedures selected depend on the auditor’s judgment, including the assessment of the risks of material misstatement of the financial statements, whether due to fraud or error. In making those risk assessments, the auditor considers internal control relevant to the entity’s preparation and fair presentation of the financial statements in order to design audit procedures that are appropriate in the circumstances, but not for the purpose of expressing an opinion on the effectiveness of the entity’s internal control. An audit also includes evaluating the appropriateness of accounting policies used and the reasonableness of accounting estimates made by management, as well as evaluating the overall presentation of the financial statements.
We believe that the audit evidence we have obtained is sufficient and appropriate to provide a basis for our audit opinion.
Opinion
In our opinion, the financial statements on pages 9 to 26 give a true and fair view of the financial position of the company as at 30 June 2009, and of its financial performance and cash flows for the year then ended in accordance with International Financial Reporting Standards and comply with the requirements of the Mauritius Companies Act 2001.
Report on other legal requirements
In accordance with the requirements of the Mauritius Companies Act 2001, we report as follows:
• we have no relationship with, or interests in, the companyother than in our capacities as auditors and tax advisors;
• we have obtained all information and explanations that wehave required; and
• inouropinion,properaccountingrecordshavebeenkeptbythe company as far as appears from our examination of those records.
Kemp Chatteris DeloitteChartered Accountants3rd Floor, Cerné House
La Chaussée, Port Louis
Independent auditor’s report to the shareholdersof the National Investment Trust Ltd
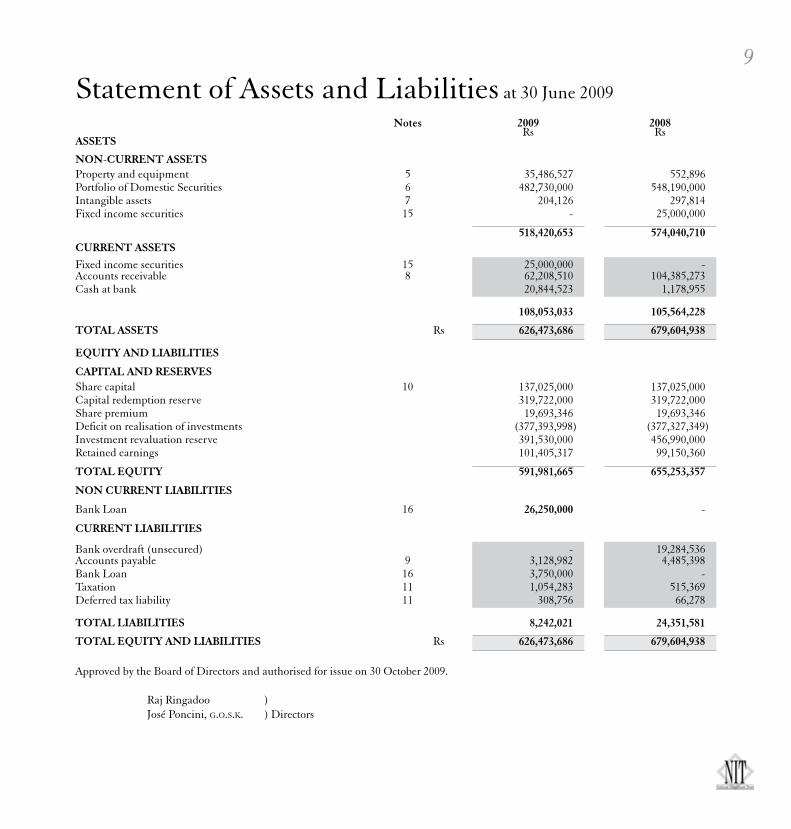
9Statement of Assets and Liabilities at 30 June 2009
Notes 2009 2008Rs Rs
ASSETS
NON-CURRENT ASSETSProperty and equipment 5 35,486,527 552,896Portfolio of Domestic Securities 6 482,730,000 548,190,000Intangible assets 7 204,126 297,814Fixed income securities 15 - 25,000,000
518,420,653 574,040,710CURRENT ASSETSFixed income securities 15 25,000,000 -Accounts receivable 8 62,208,510 104,385,273Cash at bank 20,844,523 1,178,955
108,053,033 105,564,228
TOTAL ASSETS Rs 626,473,686 679,604,938
EQUITY AND LIABILITIES
CAPITAL AND RESERVESShare capital 10 137,025,000 137,025,000Capital redemption reserve 319,722,000 319,722,000Share premium 19,693,346 19,693,346Deficit on realisation of investments (377,393,998) (377,327,349)Investment revaluation reserve 391,530,000 456,990,000Retained earnings 101,405,317 99,150,360
TOTAL EQUITY 591,981,665 655,253,357
NON CURRENT LIABILITIES
Bank Loan 16 26,250,000 -
CURRENT LIABILITIES
Bank overdraft (unsecured) - 19,284,536Accounts payable 9 3,128,982 4,485,398Bank Loan 16 3,750,000 -Taxation 11 1,054,283 515,369Deferred tax liability 11 308,756 66,278
TOTAL LIABILITIES 8,242,021 24,351,581
TOTAL EQUITY AND LIABILITIES Rs 626,473,686 679,604,938
Approved by the Board of Directors and authorised for issue on 30 October 2009.
Raj Ringadoo ) José Poncini, g.o.s.k. ) Directors

10 NIT Annual Report 2009
Income Statement for the year ended 30 June 2009
Notes 2009 2008Rs Rs
INCOMEDomestic dividend receivable 9,300,000 22,638,803Domestic interest receivable 5,477,103 5,997,457Overseas investment income - 1,271,985Management fees receivable 11,712,604 7,003,219Exit fees receivable 2,788,663 11,774,554Initial service charge 83,459 -(Deficit)/Surplus on portfolio of investments (65,526,649) 186,273,898
(36,164,820) 234,959,916LESS: EXPENSESGlobal service charge 13 5,016,466 5,454,719Salaries, allowances and pension fund contributions 3,049,018 2,949,291Management fees - 2,091,114Director fees 160,000 151,250Printing, postage and stationery 461,076 1,293,470Corporate information expenses 737,522 1,688,898Audit fees 28,750 193,200Professional fees 118,450 167,250Listing fees 383,883 342,656Secretarial fees 30,000 26,500Company licence 9,000 9,000General expenses 161,396 145,469Bank charges 45,543 87,631Overseas travelling 255,661 378,217Reference books and subscriptions 15,696 37,425Training costs and seminars 5,400 8,500Telephone and fax 28,798 30,015Repairs and maintenance 103,220 44,028Motor vehicle running expenses 386,433 220,561Interest on bank overdraft 417,042 452,239Depreciation of property and equipment 285,364 347,961Amortisation of intangible assets 111,688 127,543
11,810,406 16,246,937(LOSS)/ INCOME FOR THE YEAR BEFORE TAXATION (47,975,226) 218,712,979TAXATION 11 (1,594,266) (1,815,010)(LOSS)/ INCOME FOR THE YEAR (49,569,492) 216,897,969MOVEMENT IN PORTFOLIO OF INVESTMENTS TRANSFERRED TO:- DEFICIT ON REALISATION OF INVESTMENTS 66,649 (55,933,161)- INVESTMENT REVALUATION RESERVE 65,460,000 (130,340,737)
65,526,649 (186,273,898)NET DISTRIBUTABLE INCOME FOR THE YEAR 15,957,157 30,624,071(LOSS)/EARNINGS PER SHARE BEFORE MOVEMENT ON PORTFOLIO OF INVESTMENTS (I.E. BASED ON (LOSS)/ INCOME FOR THE YEAR): 17 Rs (3.62) 6.70
EARNINGS PER SHARE AFTER MOVEMENT ON PORTFOLIO OF INVESTMENTS (I.E. BASED ON DISTRIBUTABLE INCOME FOR THE YEAR):
17Rs 1.16 0.95

11Statement of Changes in Equity for the year ended 30 June 2009
NoteSharecapital
CapitalReduction
Sharepremium
Surplus/(deficit) on
realisation ofinvestments
Investmentrevaluation
reserve
Retainedearnings
Total
Rs Rs Rs Rs Rs Rs Rs
Balance at 1 July 2007 456,750,000 - 19,693,346 226,613,678 1,386,770,915 95,931,289 2,185,759,228
Capital reduction (319,725,000) 319,725,000 - - - - -
Fractional shares to be refunded
- (3,000) - - - - (3,000)
Profit for the year - - - - - 216,897,969 216,897,969
Distribution upon restructuring
- - - (1,689,975,003) - - (1,689,975,003)
Profit on realisation of investments transferred
- - - 55,933,161 - (55,933,161) -
Deficit on revaluation on transfer of investments
- - - 1,030,101,174 (1,030,101,174) - -
Surplus on revaluation of investments transferred to fair value reserve
- - - - 130,340,737(130,340,737) -
Surplus on disposals of investments transferred
- - - - (30,020,839) - (30,020,839)
Dividend 14 - - - - - (27,405,000) (27,405,000)
Adjustment - - - (359) 361 - 2
Balance at 30 June 2008 Rs 137,025,000 319,722,000 19,693,346 (377,327,349) 456,990,000 99,150,360 655,253,357
Balance at 1 July 2008 137,025,000 319,722,000 19,693,346 (377,327,349) 456,990,000 99,150,360 655,253,357
Loss for the year - - - - (49,569,492) (49,569,492)
Deficit on realisation of investments
(66,649) 66,649 -
Deficit on revaluation of investments transferred to fair value reserve
- - - (65,460,000) 65,460,000 -
Dividend 14 - - - - (13,702,200) (13,702,200)
Balance at 30 June 2009 Rs 137,025,000 319,722,000 19,693,346 (377,393,998) 391,530,000 101,405,317 591,981,665

12 NIT Annual Report 2009
Cash Flow Statement for the year ended 30 June 2009
2009 2008Rs Rs
CASH FLOWS FROM OPERATING ACTIVITIES(Loss)/Profit before taxation (47,975,226) 218,712,979
Adjustments for:Deficit/(Surplus) on portfolio of investments 65.526,649 (186,273,898)Depreciation of property and equipment 285,364 347,961Amortisation of intangible assets 111,688 127,543Fractional shares to be refunded - (3,000)OPERATING PROFIT BEFORE WORKING CAPITAL CHANGES 17,948,475 32,911,585
MOVEMENT IN WORKING CAPITALDecrease/(Increase) in accounts receivable 42,110,114 (99,101,031)(Decrease)/Increase in accounts payable (1,356,416) 53,439
40,753,698 (99,047,592)NET CASH GENERATED FROM/(USED IN) OPERATIONS 58,702,173 (66,136,007)Taxation (812,874) -
NET CASH GENERATED FROM/(USED IN) OPERATING ACTIVITIES 57,889,299 (66,136,007)
CASH FLOWS FROM INVESTING ACTIVITIESProceeds from sale of investments - 155,297,427Purchase of investments - (60,622,571)Purchase of intangible assets (18,000) (333,752)Purchase of property and equipment (35,218,995) (266,984)
NET CASH (USED IN)/ GENERATED FROM INVESTING ACTIVITIES (35,236,995) 94,074,120
CASH FLOWS FROM FINANCING ACTIVITIESApplication money to NIT Global Opportunities Fund - (46,200,025)Dividends paid (13,702,200) (27,405,000)Loan received 30,000,000 -
NET CASH GENERATED FROM /(USED IN) FINANCING ACTIVITIES 16,297,800 (73,605,025)
NET INCREASE/(DECREASE) IN CASH AND CASH EQUIVALENTS 38,950,104 (45,666,912)
CASH AND CASH EQUIVALENTS AT 1 JULY (18,105,581) 27,561,331
CASH AND CASH EQUIVALENTS AT 30 JUNE Rs 20,844,523 (18,105,581)Represented by:
Cash at bank 20,844,523 1,178,955Bank overdraft - (19,284,536)
Rs 20,844,523 (18,105,581)

13Notes to the Financial Statementsfor the year ended 30 June 2009
1. LEGAL FORM AND ACTIVITIES
The company was incorporated on 18 March 1993 as a public company . It has taken over with effect from 1 July 2001 the management of NMF General Fund and NMF Property Trust under subcontract from National Mutual Fund.
Following the restructuring of the company in January 2008 ,the company acts as a management company which also holds securities.The company was appointed as the manager of NIT Local Equity Fund and NIT Global Opportunities Fund as established by a Trust Deed dated 19th and 20th October 2007.
2. ADOPTION OF NEW AND REVISED INTERNATIONAL FINANCIAL REPORTING STANDARDS (IFRS)
In the current year, the company has adopted all of the new and revised standard and interpretations issued by the International Accounting Standards Board (the “IASB”) and the International Financial Reporting Interpretations Committee (“IFRIC”) of the IASB that are relevant to its operations and effective for accounting periods beginning on 1 July 2008. The adoption of these new and revised standards and interpretations has not resulted in any changes to the company’s accounting policies that would affect the amounts reported for the current or prior years.
At the date of authorisation of these financial statements, the following Standards and Interpretations were in issue but effective on annual periods beginning on or after the respective dates as indicated:
IAS 1 Presentation of Financial Statements - Comprehensive revision including requiring a statement of comprehensive income (effective 1 January 2009)
IAS 1 Presentation of Financial Statements - Amendments relating to disclosure of puttable instruments and obligations arising on liquidation (effective 1 January 2009)
IAS 1 Presentation of Financial Statements - Amendments resulting from May 2008 Annual Improvements to IFRSs (effective 1 January 2009)
IAS 1 Presentation of Financial Statements – Amendments resulting from April 2009 Annual Improvements to IFRSs (effective 1 January 2010)
IAS 7 Statement of Cash Flows – Amendments resulting from April 2009 Annual Improvements to IFRSs (effective 1 January 2010)
IAS 16 Property, Plant and Equipment - Amendments resulting from May 2008 Annual Improvements to IFRSs (effective 1 January 2009)
IAS 17 Leases - Amendments resulting from April 2009 Annual Improvements to IFRSs (effective 1 January 2010)IAS 19 Employee Benefits - Amendments resulting from May 2008 Annual improvement to IFRSs (effective 1 January 2009)IAS 20 Government Grants and Disclosure of Government Assistance - Amendments resulting from May 2008 Annual
Improvements to IFRSs (effective 1 January 2009)IAS 23 Borrowing Costs - Comprehensive revision to prohibit immediate expensing (effective 1 January 2009)IAS 23 Borrowings Costs - Amendments resulting from May 2008 Annual Improvements to IFRSs (effective 1 January 2009)IAS 27 Consolidated and Separate Financial Statements - Consequential amendments arising from amendments to IFRS 3
(effective 1 July 2009)IAS 27 Consolidated and Separate Financial Statements - Amendment relating to cost of an investment on first time adoption
(effective 1 January 2009)

14 NIT Annual Report 2009
IAS 27 Consolidated and Separate Financial Statements - Amendments resulting from May 2008 Annual Improvements to IFRSs (effective 1 January 2009)
IAS 28 Investments in Associates - Consequential amendments arising from amendments to IFRS 3 (effective 1 July 2009)IAS 28 Investments in Associates - Amendments resulting from May 2008 Annual improvements to IFRSs (effective 1 January
2009)IAS 29 Financial Reporting in Hyperinflationary Economies - Amendments resulting from May 2008 Annual Improvements to
IFRSs (effective 1 January 2009)IAS 31 Interests in Joint Ventures - Consequential amendments arising from amendments to IFRS 3 (effective 1 July 2009)IAS 31 Interests in Joint Ventures - Amendments resulting from May 2008 Annual Improvements to IFRSs (effective 1 January
2009)IAS 32 Financial Instruments: Presentation - Amendments relating to puttable instruments and obligations arising on
liquidation (effective 1 January 2009)IAS 36 Impairment of Assets - Amendments resulting from May 2008 Annual Improvements to IFRSs (effective 1 January 2009)IAS 36 Impairment of Assets - Amendments resulting from April 2009 Annual Improvements to IFRSs (effective 1 January
2010)IAS 38 Intangible Assets - Amendments resulting from May 2008 Annual Improvements to IFRSs (effective 1 January 2009)IAS 38 Intangible Assets - Amendments resulting from April 2009 Annual Improvements to IFRSs (effective 1 January 2010)IAS 39 Financial Instruments: Recognition and Measurement - Amendments resulting from May 2008 Annual Improvements
to IFRSs (effective 1 January 2009)IAS 39 Financial Instruments: Recognition and Measurement - Amendments for eligible hedged items (effective 1 July 2009)IAS 39 Financial Instruments: Recognition and Measurement – Amendments for embedded derivatives when reclassifying
financial instruments (effective 1 July 2009)IAS 39 Financial Instruments: Recognition and Measurement – amendments resulting from April 2009 Annual Improvements
to IFRSs (effective 1 January 2010)IAS 40 Investment Property - Amendments resulting from May 2008 Annual Improvements to IFRSs (effective 1 January 2009)IAS 41 Agriculture - Amendments resulting from May 2008 Annual Improvements to IFRSs (effective 1 January 2009)IFRS 1 First-time Adoption of International Financial Reporting Standards - Amendment relating to cost of an investment on
first-time adoption (effective 1 January 2009)IFRS 2 Share-based Payment - Amendment relating to vesting conditions and cancellations (effective 1 January 2009)IFRS 2 Share-based Payment - Amendments resulting from April 2009 Annual Improvements to IFRSs (effective 1 July 2009)IFRS 2 Share-based Payment – Amendments relating to Group cash-settled share-based payment transactions (effective 1
January 2010)IFRS 3 Business Combinations - Comprehensive revision on applying the acquisition method (effective 1 July 2009)IFRS 5 Non-current Assets Held for Sale and Discontinued Operations - Amendments resulting from May 2008 Annual
Improvements to IFRSs (effective 1 July 2009)IFRS 5 Non-current Assets Held for Sale and Discontinued Operations - Amendments resulting from April 2009 Annual
Improvements to IFRSs (effective 1 January 2010)IFRS 7 Financial Instruments - Disclosures - Amendments enhancing disclosures about fair value and liquidity risk (effective 1
January 2009)IFRS 8 Operating segments (effective 1 January 2009)IFRS 8 Operating Segments - Amendments resulting from April 2009 Annual Improvements to IFRSs (effective 1 January 2010)IFRIC 15 Agreements for the Construction of Real Estate (effective 1 January 2009)IFRIC 16 Hedges of a Net Investment in a Foreign Operation (effective 1 October 2008)IFRIC 17 Distributions of Non-Cash Assets to Owners (effective 1 July 2009)IFRIC 18 Transfers of Assets from Customers (effective 1 July 2009)
The directors anticipate that the adoption of these Standards and Interpretations on the above effective dates in future periods will have no material impact on the financial statements of the company.
153. ACCOUNTING POLICIES
The principal accounting policies adopted by the company are as follows:
(a) Basis of preparation
The financial statements are prepared under the historical cost convention as modified by the revaluation of investments and in accordance with International Financial Reporting Standards (IFRS).
(b) Property and equipment
Property and equipment are stated at cost less accumulated depreciation and impairment losses.
Depreciation
Depreciation of property and equipment is calculated so as to write off the cost of these assets in use on a straight line basis over their expected useful lives.Depreciation on newly acquired property and equipment is calculated pro rata from date of acquisition The annual depreciation rates used for the purpose are as follows:
Buildings - 5% Computer hardware - 20% Office equipment - 10% Motor vehicles - 20%
(c) Deferred taxation
Deferred taxation is provided on the comprehensive basis using the liability method.
Deferred tax liabilities are recognised on all temporary differences arising between the tax bases of assets and liabilities and their carrying values for financial reporting purposes.
Deferred tax assets are recognised for all deductible temporary differences to the extent that it is possible that taxable profit will be available against which the deductible temporary differences can be utilised.
(d) Investment valuation
Fair value is determined as follows:
The Company classifies its investments as fair value through profit or loss (“FVTPL”). Purchases and sales of investments are recognised on the trade-date basis – the date on which the Company commits to purchase or sell the asset. Investments are initially recognised at fair value for all financial assets. Investments are derecognised when the rights to receive cash flows from the investments have expired or have been transferred and the company has transferred substantially all risks and rewards of ownership.
Unrealised gains or losses arising from changes in fair value of FVTPL assets are included in the Income Statement and subsequently transferred to investment revaluation reserve, as the gains/losses are not distributable.
The gains and losses on disposal of FVTPL assets are recognised in the Income Statement. Gains or losses on disposal of quoted and overseas investment are subsequently transferred to surplus on realisation of investments.
Management determines the appropriate classification of the investments and re-evaluates such classification on a regular basis.

16 NIT Annual Report 2009
(i) Unquoted Investments
Unquoted investments are valued by the Directors based on the average weighted earnings per share of the companies concerned over the last three years and the average price earnings ratios of comparable companies quoted on the stock market, after applying a discounting factor of 20% for their restricted marketability.
(e) Investment Income
(i) Dividends from investments are accounted for on an accrued basis when the company’s right to receive payment is established.
(ii) Fixed interest investments
Interest receivable from bank and short term deposits and fixed interest stocks debentures and Treasury Bills are accrued for on a daily basis.
(f) Foreign currency transactions
Monetary assets and liabilities in foreign currencies outstanding at year end are translated into rupee at rates of exchange ruling at the end of the accounting period. Revenue items denominated in foreign currencies are converted into rupee at the exchange rates ruling at the date of transactions.
(g) Cash and cash equivalents
Cash comprises cash at bank and in hand and demand deposits. Cash equivalents are short-term highly liquid investments that are readily convertible to known amounts of cash and which are subject to an insignificant risk to change in value.
(h) Retirement benefit obligations
The present value of unfunded obligations is recognised in the balance sheet as a non-current liability.
(i) Intangible assets
The intangible assets relate to computer software and are amortised over 3 years.
(j) Financial instruments
Financial assets and liabilities are recognised on the balance sheet when the company has become party to the contractual provisions of the financial instruments.
The carrying amounts of the company’s financial instruments approximate their fair values due to the short-term nature of the balances involved. These instruments are measured as follows:
(i) Investments
Investments in equity securities are stated at fair value. The accounting policy for investment securities is disclosed in note 3(d).
(ii) Investment in Treasury Bills
Treasury Bills are accounted for under the effective interest method.
(iii) Accounts receivables
Accounts receivables originated by the company are stated at amortised cost. An allowance for doubtful debts is made based on a review of all outstanding amounts at balance sheet date. Bad debts are written off during the period in which they are identified.

17(iv) Cash and cash equivalents
Cash and cash equivalents are measured at fair value, based on the relevant exchange rates at balance sheet date.
(v) Accounts payables
Accounts payables are stated at their amortised cost.
(vi) Fixed income securities
Fixed income securities are measured at amortised cost.
(k) Impairment
The carrying amounts of assets are assessed at each year date to determine whether there is any indication of impairment. If such indication exists, the Fund estimates the recoverable amount of the assets, being the higher of assets’ net selling price and their value in use, and reduces the carrying amount of the assets to their recoverable amounts.
(l) Provisions
A provision is recognised when and only when there is a present obligation (legal or constructive) as a result of a past event, and it is probable that an outflow of resources embodying economic benefits will be required to settle the obligation, and a reliable estimate can be made of the amount of the obligation. Provisions are reviewed at each year end and adjusted to reflect the current best estimate.
(m) Related parties
Related parties are individuals and companies where the individual or company has the ability, directly or indirectly, to control the other party or exercise significant influence over the other party in making financial and operating decisions.
4. ACCOUNTING JUDGEMENTS AND KEY SOURCES OF ESTIMATION UNCERTAINTY
The preparation of financial statements in accordance with IFRS requires the directors and management to exercise judgement in the process of applying the accounting policies. It also requires the use of accounting estimates and assumptions that may affect the reported amounts and disclosures in the financial statements. Judgements and estimates are continuously evaluated and are based on historical experience and other factors, including expectations and assumptions concerning future events that are believed to be reasonable under the circumstances. The actual results could, by definition therefore, often differ from the related accounting estimates.
Where applicable, the notes to the financial statements set out areas where management has applied a higher degree of judgement that have a significant effect on the amounts recognised in the financial statements, or estimations and assumptions that have a significant risk of causing a material adjustment to the carrying amounts of assets and liabilities within the next financial year.
Financial crisis
The company may, from time to time, hold investments that are not quoted on active markets. Fair values of such investments are determined by the Directors based on the average weighted earnings per share of the companies concerned over the last three years and the average price earnings ratios of comparable companies quoted on the stock market,after applying a discount factor of 20% for their restricted marketability. Changes in assumptions about these factors could affect the reported fair value of the financial instruments.

18 NIT Annual Report 2009
5. PROPERTY AND EQUIPMENT
Computer Office Motor Buildings hardware equipment vehicles Total
Rs Rs Rs Rs RsCOST
At 01 July 2007 - 688,864 193,323 1,491,595 2,373,782Additions - 136,574 130,410 - 266,984
At 30 June 2008 Rs - 825,438 323,733 1,491,595 2,640,766
At 01 July 2008 - 825,438 323,733 1,491,595 2,640,766Additions 35,200,915 18,080 - - 35,218,995
At 30 June 2009 Rs 35,200,915 843,518 323,733 1,491,595 37,859,761
DEPRECIATION
At 01 July 2007 - 550,300 98,014 1,091,595 1,739,909Charge for the year - 97,269 32,373 218,319 347,961
At 30 June 2008 Rs - 647,569 130,387 1,309,914 2,087,870
At 01 July 2008 - 647,569 130,387 1,309,914 2,087,870Charge for the year - 71,310 32,374 181,680 285,364
At 30 June 2009 Rs - 718,879 162,761 1,491,594 2,373,234
NET BOOK VALUE
At 30 June 2009 Rs 35,200,915 126,639 160,972 - 35,486,527
At 30 June 2008 Rs - 177,869 193,346 181,681 552,896
6. PORTFOLIO OF DOMESTIC SECURITIES - UNQUOTED
Fair value through profit or lossUNQUOTED
At fair value 2009Rs
2008Rs
At 1 July 548,190,000 711,798,471Disposals - (15,018,472)
Movement in fair value (65,460,000) (148,589,999)
At 30 June Rs 482,730,000 548,190,000
The investments were revalued as per note 3 (d).

196.1 PORTFOLIO OF DOMESTIC SECURITIES
SHARE SHARE MARKETHOLDINGS HOLDINGS VALUE
2009 2008 2009Rs Rs Rs
State Investment Corporation Ltd 1,500,000 1,500,000 279,000,000SICOM Ltd 30,000 30,000 201,930,000Mauritius Shopping Paradise Ltd 18,000 18,000 1,800,000
TOTAL PORTFOLIO OF DOMESTIC SECURITIES Rs 482,730,000
6.2 SIGNIFICANT HOLDINGS
Details of investments in which the Company holds a 10% interest or more are set out below:
Class of ProportionName of Company Shares Held
Mauritius Shopping Paradise Ltd Ordinary 15.0%
SICOM Ltd Ordinary 12.0%
State Investment Corporation Ltd Ordinary 15.0%
7. INTANGIBLE ASSETS 2009 2008
Computer software Rs Rs
Cost At 1 July 1,191,660 857,908Additions 18,000 333,752At 30 June 1,209,660 1,191,660Amortisation At 1 July 893,846 766,303Charge for the year 111,688 127,543At 30 June 1,005,534 893,846Net book value At 30 June Rs 204,126 297,814
8. ACCOUNTS RECEIVABLE2009 2008Rs Rs
Trade receivables - 581,980Other receivables 38,731,426 15,732,243Loan receivable from NIT Local Equity Fund 11,132,095 80,099,273Accrued income 12,249,104 7,863,105Prepayments 95,885 108,672
Rs 62,208,510 104,385,273
Loan receivable from NIT Local Equity Fund carries interest of 5.5%(2008:8%) and repayable at call.

20 NIT Annual Report 2009
9. ACCOUNTS PAYABLE2009 2008Rs Rs
Other payables 432,099 1,826,732Accruals 142,695 189,000Unclaimed dividends 2,554,188 2,469,666
Rs 3,128,982 4,485,398
The company has financial risk management policies in place to ensure that all payables are paid within the timeframe.
10. SHARE CAPITAL2008 & 2009
At 30 June Rs
13,702,500 shares of Rs10 each 137,025,000
Ordinary shares are not redeemable, carry voting rights, entitlement to dividends or distributions and on winding up to any surplus on assets of the company.
11. TAXATION
(i) Income Tax
Income tax is calculated at the rate of 15% (2008:15%) on the profit for the year as adjusted for income tax purposes. 2009 2008Rs Rs
Provision for the year 1,054,283 515,369Underprovision in previous year 297,505 -Deferred tax expense 242,478 1,299,641
Taxation expense 1,594,266 1,815,010
(ii) Tax Reconciliation2009 2008
% %Applicable income tax rate 15.00 15.00Tax effect of:- Investment revaluation reserve - (12.78)- Non taxable income 2.91 (1.55)- Expenses not deductible for tax purposes (0.12) 0.14- Overprovision in deferred tax in current year - 0.01- Overprovision in taxation in current year - 0.01Underprovision in taxation in previous year (0.62) -Investment revaluation reserve (20.49)
Effective tax rate (3.32) 0.83
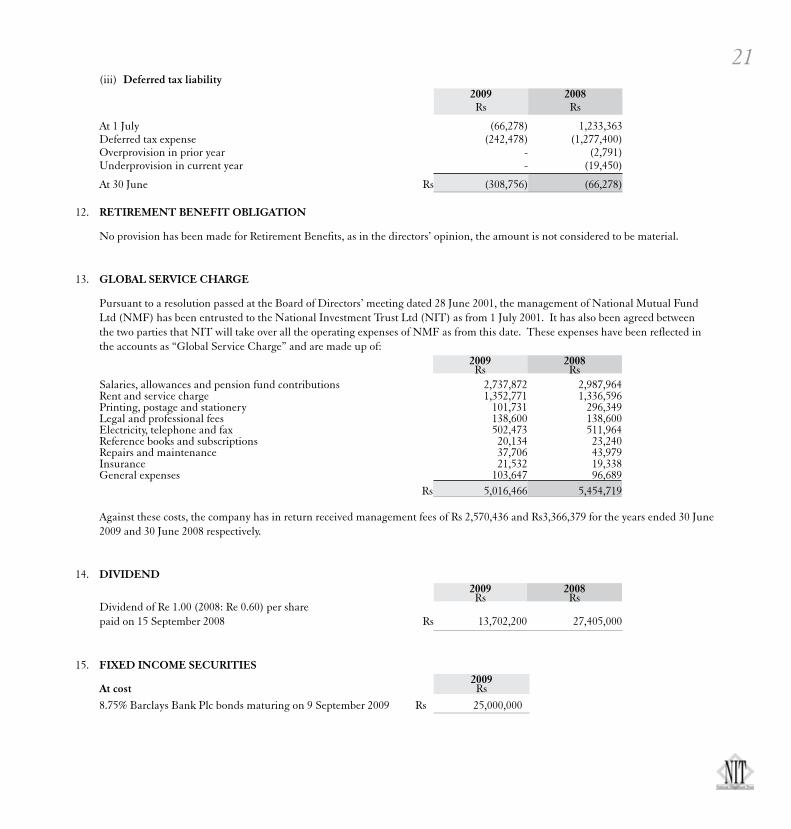
21 (iii) Deferred tax liability
2009 2008Rs Rs
At 1 July (66,278) 1,233,363Deferred tax expense (242,478) (1,277,400)Overprovision in prior year - (2,791)Underprovision in current year - (19,450)
At 30 June Rs (308,756) (66,278)
12. RETIREMENT BENEFIT OBLIGATION
No provision has been made for Retirement Benefits, as in the directors’ opinion, the amount is not considered to be material.
13. GLOBAL SERVICE CHARGE
Pursuant to a resolution passed at the Board of Directors’ meeting dated 28 June 2001, the management of National Mutual Fund Ltd (NMF) has been entrusted to the National Investment Trust Ltd (NIT) as from 1 July 2001. It has also been agreed between the two parties that NIT will take over all the operating expenses of NMF as from this date. These expenses have been reflected in the accounts as “Global Service Charge” and are made up of:
2009 2008Rs Rs
Salaries, allowances and pension fund contributions 2,737,872 2,987,964Rent and service charge 1,352,771 1,336,596Printing, postage and stationery 101,731 296,349Legal and professional fees 138,600 138,600Electricity, telephone and fax 502,473 511,964Reference books and subscriptions 20,134 23,240Repairs and maintenance 37,706 43,979Insurance 21,532 19,338General expenses 103,647 96,689
Rs 5,016,466 5,454,719
Against these costs, the company has in return received management fees of Rs 2,570,436 and Rs3,366,379 for the years ended 30 June 2009 and 30 June 2008 respectively.
14. DIVIDEND2009 2008Rs Rs
Dividend of Re 1.00 (2008: Re 0.60) per sharepaid on 15 September 2008 Rs 13,702,200 27,405,000
15. FIXED INCOME SECURITIES2009
At cost Rs8.75% Barclays Bank Plc bonds maturing on 9 September 2009 Rs 25,000,000

22 NIT Annual Report 2009
16. BANK LOAN2009Rs
9.25% loan repayable by quarterly instalments Rs 30,000,000
Disclosed as follows :Within 1 year 3,750,000More than 1 year 26,250,000
30,000,000
The loan is repayable in 32 consecutive quarterly instalments in the aggregate of Rs937,500 each and is secured by fixed charge on commercial space and floating charge on assets.
17. (LOSS)/EARNINGS PER SHARE
The calculation of loss per share before movement on portfolio of investments is based on loss for the year of Rs 49,569,492 (2008: profit of Rs 216,897,969) and 13,702,500 weighted average number of ordinary shares (2008: 32,353,000 ordinary shares) in issue during the year.
The calculation of earnings per share after movement on portfolio of investment is based on net distributable income for the year of Rs 15,957,157 (2008: Rs 30,624,071) and 13,702,500 weighted average number of ordinary shares (2008: 32,353,000 ordinary shares) in issue during the year.
18. FINANCIAL STATISTICS 2009 2008 2007 2006 2005
Rs Rs Rs Rs RsEarnings per share, based on net distributable income for the year 1.16 0.95 0.62 0.53 0.88Dividend per share 1.00 0.60 0.50 0.95 0.75Net Asset per share 43.20 47.82 47.85 30.23 32.27
19. RELATED PARTY TRANSACTIONS
The Company is making the following disclosures in respect of related party transactions:
2009 2008Rs Rs
(i) Outstanding balancesReceivables from related parties:- National Mutual Fund 239,655 320,849- NIT Local Equity Fund 32,436,331 92,344,910- NIT Global Opportunities Fund 9,956,639 4,885,899
Payables to related parties:
- National Mutual Fund 384,781 350,196- NIT Global Opportunities Fund - 1,429,217

23(ii) Management fees receivable
- NMF Property Trust 388,471 521,526- NMF General Fund 2,181,965 2,844,853- NIT Local Equity Fund 5,514,288 2,410,372- NIT Global Opportunities Fund 3,627,880 1,226,468
(iii) Global service charge - National Mutual Fund Ltd 5,016,466 5,454,719
Compensation to key management personnel
2009 2008Rs Rs
Directors feeNon-executive 160,000 150,000
20. FINANCIAL INSTRUMENTS
Capital risk management
The company manages its capital to ensure that the company will be able to continue as a going concern. The capital structure of the company consists of stated capital, revaluation reserve, surplus on realisation of investments and retained surplus.
Significant accounting policies
Details of the significant accounting policies and methods adopted, including the criteria for recognition, the basis of measurement and the basis on which income and expenses are recognised, in respect of each class of financial asset, financial liability and equity instrument are disclosed in note 3 to the financial statements.
Fair values
The carrying amounts of financial assets and liabilities approximate to their fair values due to the short term nature of the balances involved.
Categories of financial instruments2009 2008Rs Rs
Financial assets
Investments at fair value though profit or loss (FVTPL) 482,730,000 548,190,000Fixed income securities 25,000,000 25,000,000Accounts receivable 62,112,625 104,276,601Cash and cash equivalents 20,844,523 1,178,955
590,687,148 678,645,556Financial liabilities
Bank overdraft - 19,284,536Accounts payable, amortised cost 3,128,982 4,485,398Loan 30,000,000 -
33,128,982 23,769,934
Prepayments amounting to Rs 95,885 (2008: Rs 108,672) have not been included in financial assets.

24 NIT Annual Report 2009
Financial risk management objectives
The company holds both domestic and overseas investments and manages the financial risks relating to its operations by monitoring the risks and implementing policies to mitigate these risk exposures. These risks include market risk (including currency risk, interest rate risk and price risk), credit risk and liquidity risk.
Market risk
Market risk represents the potential loss that can be caused by a change in the market value of financial instruments. The company’s exposure to market risk is determined by a number of factors, including interest rates, foreign currency exchange rates and market volatility.
The currency profile of the company’s financial assets and financial liabilities at 30 June is summarised as follows:2009 2008
Financial Financial Financial Financial assets liabilities assets liabilities
Currency Rs Rs Rs Rs
MUR 590,687,148 33,128,982 678,645,556 23,769,934
Credit risk
The company does not have significant concentration of credit risk which is primarily attributable to its trade receivables. Trade receivables consist mainly of dividend receivable from a large number of investee companies spread across diverse industries.
Credit risk refers to the risk that counterparty will default on its contractual obligations resulting in financial loss to the company.
Interest rate risk management
The company is exposed to interest rate risk as the company used its overdraft facility at floating interest rates. The risk is managed by the company by providing floating rate loans.
The interest rate profile of the company’s financial assets and financial liabilities as at 30 June was:2009 2008% p.a % p.a
Financial assets
Cash at bank - MRU 4.5 7.00 - USD - 1.00 - EURO - 2.75 - GBP - 3.00Loan receivable 5.50 8.00
Financial liabilities
Bank overdraft - 10.50Loan 9.25 -
Interest rate sensitivity analysis
The sensitivity analysis below has been determined based on the exposure to interest rates for loans receivable at the balance sheet date. The analysis is prepared assuming the amount of loan receivable at the balance sheet date was outstanding for the whole year. A 50 basis points increase or decrease represents management’s assessment of the reasonably possible change in interest rates.

25If interest rates had been 50 basis points higher and all other variables were held constant, the company’s results would be affected as follows:
2009 2008Rs Rs
Profit 98,831 30,995
Had the interest rates been 50 basis points lower and all other variables were held constant, there would be an equal and opposite impact on profit.
Other price risks
The company is exposed to equity price risks arising from equity investments which the company held for trading purposes.
Equity price sensitivity analysis
The sensitivity analysis below has been determined based on the exposure to equity price risks at the reporting date.
If equity prices had been 5% higher/lower:
Equity reserves would increase/decrease by Rs 24,136,500 (2008: Rs 27,490,500) as a result of the changes in fair value of investments.
Liquidity risk management
The company manages liquidity risk by maintaining adequate reserves and banking facilities, by continuously monitoring forecast and actual cash flows.
Liquidity and interest risk tables
The following tables detail the company’s remaining contractual maturity for its non-derivative financial assets and liabilities. The tables have been drawn up based on the undiscounted cash flows of financial assets and liabilities based on the earliest date on which the company can be required to earn or pay.
2009
Weighted average effective
interest rateAt call
Less than 1 month
1-3 months
3 months to 1 year
More than 1 year Total
% p.a Rs Rs Rs Rs Rs RsFinancial assetsNon interest bearing n/a - - - - 482,730,000 482,730,000Variable interest rate instruments 20,844,523 - 87,112,625 - - 107,957,148
20,844,523 - 87,112,625 - 482,730,000 590,687,148
Financial liabilitiesNon interest bearing - - - - - -Variable interest rate instrument 21 - - 3,128,982 - - 3,128,982Fixed interest rate instruments 3,750,000 26,250,000 30,000,000
Rs - - 3,128,982 3,750,000 26,250,000 33,128,982

26 NIT Annual Report 2009
2009
Weighted average effective
interest rateAt call
Less than 1 month
1-3 months
3 months to 1 year
More than 1 year Total
% p.a Rs Rs Rs Rs Rs Rs
Financial assetsNon interest bearing n/a 1,722,898 581,963 17 21,875,206 548,190,000 572,370,084Variable interest rate instruments 7.50 81,275,472 - - - - 81,275,472Fixed interest rate instruments 8.00 25,000,000 - - - - 25,000,000
107,998,370 581,963 17 21,875,206 548,190,000 678,645,556
Financial liabilitiesNon interest bearing n/a - 539,196 1,476,536 2,469,666 - 4,485,398Variable interest rate instrument 10.50 19,284,536 - - - - 19,284,536
Rs 19,284,536 539,196 1,476,536 2,469,666 - 23,769,934

NIT Local Equity Fund Annual Report 2009
28 NIT LEF Annual Report 2009
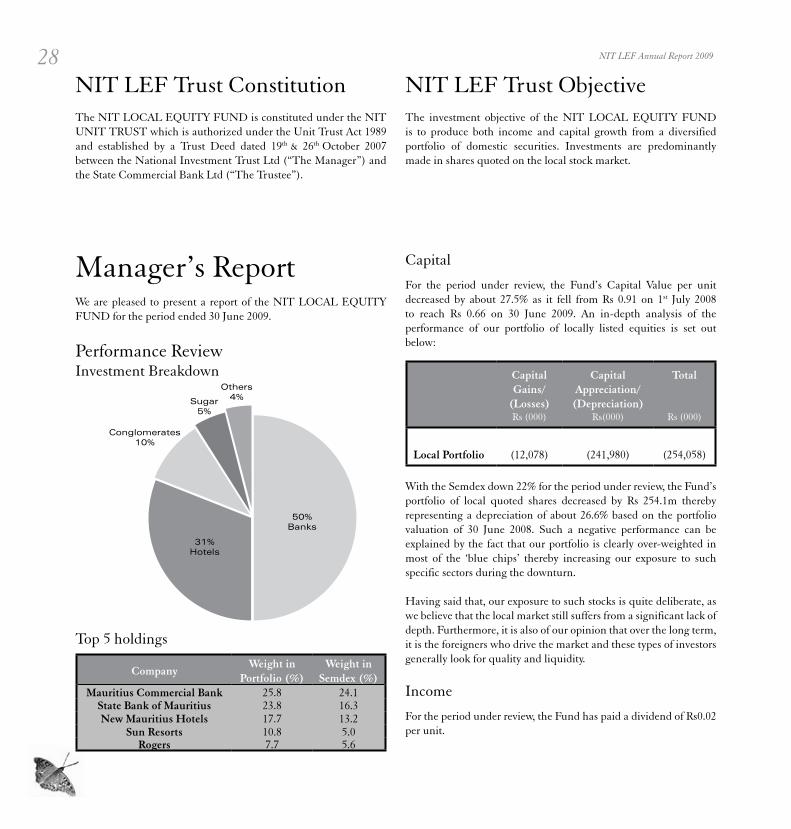
Manager’s ReportWe are pleased to present a report of the NIT LOCAL EQUITY FUND for the period ended 30 June 2009.
Performance ReviewInvestment Breakdown
Top 5 holdings
CompanyWeight in
Portfolio (%)Weight in
Semdex (%)Mauritius Commercial Bank 25.8 24.1
State Bank of Mauritius 23.8 16.3New Mauritius Hotels 17.7 13.2
Sun Resorts 10.8 5.0Rogers 7.7 5.6
Capital
For the period under review, the Fund’s Capital Value per unit decreased by about 27.5% as it fell from Rs 0.91 on 1st July 2008 to reach Rs 0.66 on 30 June 2009. An in-depth analysis of the performance of our portfolio of locally listed equities is set out below:
CapitalGains/
(Losses)Rs (000)
CapitalAppreciation/
(Depreciation) Rs(000)
Total
Rs (000)
Local Portfolio (12,078) (241,980) (254,058)
With the Semdex down 22% for the period under review, the Fund’s portfolio of local quoted shares decreased by Rs 254.1m thereby representing a depreciation of about 26.6% based on the portfolio valuation of 30 June 2008. Such a negative performance can be explained by the fact that our portfolio is clearly over-weighted in most of the ‘blue chips’ thereby increasing our exposure to such specific sectors during the downturn.
Having said that, our exposure to such stocks is quite deliberate, as we believe that the local market still suffers from a significant lack of depth. Furthermore, it is also of our opinion that over the long term, it is the foreigners who drive the market and these types of investors generally look for quality and liquidity.
Income
For the period under review, the Fund has paid a dividend of Rs0.02 per unit.
NIT LEF Trust ConstitutionThe NIT LOCAL EQUITY FUND is constituted under the NIT UNIT TRUST which is authorized under the Unit Trust Act 1989 and established by a Trust Deed dated 19th & 26th October 2007 between the National Investment Trust Ltd (“The Manager”) and the State Commercial Bank Ltd (“The Trustee”).
NIT LEF Trust Objective
The investment objective of the NIT LOCAL EQUITY FUND is to produce both income and capital growth from a diversified portfolio of domestic securities. Investments are predominantly made in shares quoted on the local stock market.

29
ProspectsThe performance of our portfolio is closely linked to the evolution of the local stock market.
Since balance sheet date, the market continued to move north with the Semdex gaining 18.6%. Such a performance results from the ability of the local economy to ride the wave during such uncertain times. In fact, the resilience shown by the major local players both in terms of debt and profitability levels has boosted up the confidence of both local and international investors to re-enter the market.
Furthermore, based on existing fundamentals with a market P.E of 10.1X and dividend yield of 3.3%, the local stocks does offer good potential especially when taking into account the fact that the bank rate currently stands at 5.75%. Having said that, the lack of depth of the domestic stock market continues to be a cause of concern in such volatile times.
Against such a background, our current stance is one of cautious optimism.
The National Investment Trust Ltd
30 NIT LEF Annual Report 2009
This report is made solely to the Fund’s unitholders, as a body. Our audit work has been undertaken so that we might state to the Fund’s unitholders those matters we are
required to state to them in an auditor’s report and for no other purpose. To the fullest extent permitted by law, we do not accept or assume responsibility to anyone other than the Fund’s unitholders as a body, for our audit work, for this report, or for the opinions we have formed.
Report on the Financial Statements
We have audited the financial statements of NIT Local Equity Fund on pages 31 to 48 which comprise the statement of assets and liabilities as at 30 June 2009 and the statement of movements in net assets, income and distribution statement and cash flow statement for the year then ended and a summary of significant accounting policies and other explanatory notes.
Responsibilities of manager and trustee
The manager and trustee are responsible for the preparation and fair presentation of these financial statements in accordance with International Financial Reporting Standards and in compliance with the requirements of the Trust Deed. This responsibility includes: designing, implementing and maintaining internal control relevant to the preparation and fair presentation of financial statements that are free from material misstatement, whether due to fraud or error; selecting and applying appropriate accounting policies; and making accounting estimates that are reasonable in the circumstances.
Auditor’s responsibility
Our responsibility is to express an opinion on these financial statements based on our audit. We conducted our audit in accordance with International Standards on Auditing. Those standards require that we comply with ethical requirements and plan and perform the audit to obtain reasonable assurance whether the financial statements are free from material misstatement.
An audit involves performing procedures to obtain audit evidence about the amounts and disclosures in the financial statements. The procedures selected depend on the auditor’s judgment, including the assessment of the risks of material misstatement of the financial statements, whether due to fraud or error. In making those risk
assessments, the auditor considers internal control relevant to the entity’s preparation and fair presentation of the financial statements in order to design audit procedures that are appropriate in the circumstances, but not for the purpose of expressing an opinion on the effectiveness of the Fund’s internal control. An audit also includes evaluating the appropriateness of accounting policies used and the reasonableness of accounting estimates made by management, as well as evaluating the overall presentation of the financial statements.
We believe that the audit evidence we have obtained is sufficient and appropriate to provide a basis for our audit opinion.
Opinion
In our opinion, the financial statements on pages 31 to 48 give a true and fair view of the financial position of the Fund as at 30 June 2009, and of its financial performance and cash flows for the year then ended in accordance with International Financial Reporting Standards and comply with the requirements of the Trust Deed.
Report on other legal requirements
In accordance with the requirements of the Trust Deed, we report as follows:
• wehavenorelationshipwith,orinterestsin,theFundotherthan in our capacities as auditors and tax advisors;
• we have obtained all information and explanations that wehave required; and
• in our opinion, proper accounting records have been keptby the Fund as far as appears from our examination of those records.
Kemp Chatteris DeloitteChartered Accountants3rd Floor, Cerné House
La Chaussée, Port Louis
Independent auditor’s report to the unitholdersof the NIT Local Equity Fund constituted under the NIT Unit Trust

31Statement of Assets and Liabilities at 30 June 2009
2009 2008Notes % of % of
Rs Fund Rs Fund
ASSETS
Non-Current Assets
Portfolio of Domestic Securities 5 635,330,366 108.56 954,765,285 110.62
Current Assets
Accounts receivable 6 223,907 0.04 919,548 0.11Cash at bank 674,466 0.12 4,366,379 0.51
898,373 0.16 5,285,927 0.62
TOTAL ASSETS 636,228,739 108.72 960,051,212 111.24
LIABILITIES
Current Liabilities
Accounts payable 7 21,579,162 3.70 12,313,137 1.43Loan 8 11,132,095 1.90 80,099,273 9.28Distribution to unitholders 9 18,263,631 3.12 4,473,886 0.52Taxation 10 36,958 - 28,598 0.01
TOTAL LIABILITIES 51,011,846 8.72 96,914,894 11.24
NET ASSETS ATTRIBUTABLE TO UNITHOLDERS Rs 585,216,893 100.00 863,136,318 100.00
Approved by the Manager of the NIT Local Equity Fund and authorised for issue on 30 October 2009.
The Manager

32 NIT LEF Annual Report 2009
Statement of Movements in Net Assetsfor the year ended 30 June 2009
Other net Investments assets Total
Rs Rs Rs
NET ASSETS TRANSFERRED FROM NATIONAL INVESTMENT TRUST PER TRUST DEED DATED 19th AND 26th OCTOBER 2007 1,141,875,003 - 1,141,875,003
Cash received for units created - 4,186,789 4,186,789Cash paid for units liquidated - (179,336,977) (179,336,977)
NET CASH MOVEMENT FROM UNITS - (175,150,188) (175,150,188)
Proceeds from sale of investments (83,521,222) 83,521,222 -
NET CASH MOVEMENT FROM INVESTMENTS (83,521,222) 83,521,222 -
Loss after loss on investments for the period - (103,588,497) (103,588,497)Transfer of gains on investments (103,588,497) 103,588,497 -
(103,588,497) - (103,588,497)NET ASSETS ATTRIBUTABLE TO UNITHOLDERSAT 30 JUNE 2008 Rs 954,765,284 (91,628,966) 863,136,318
NET ASSETS ATTRIBUTABLE TO UNITHOLDERS AT 1 JULY 2008 954,765,284 (91,628,966) 863,136,318
Cash received for units created - 7,336,087 7,336,087Cash paid for units liquidated - (31,196,986) (31,196,986)
NET CASH MOVEMENT FROM UNITS - (23,860,899) (23,860,899)
Additions 105,559 (105,559) -Proceeds from sale of investments (65,481,951) 65,481,951 -
NET CASH MOVEMENT FROM INVESTMENTS (65,376,392) 65,376,392 -
Loss after loss on investments - (254,058,526) (254,058,526)Transfer of loss on investments (254,058,526) 254,058,526 -
(254,058,526) - (254,058,526)NET ASSETS ATTRIBUTABLE TO UNITHOLDERSAT 30 JUNE 2009 Rs 635,330,366 (50,113,473) 585,216,893

33Income and Distribution Statementfor the year ended 30 June 2009
Year ended 30 June 2009
Period from26 October 2007 to 30 June 2008
Notes Rs Rs
INVESTMENT INCOME
Dividend income 26,362,333 9,110,957Interest income 355,239 343,449
26,717,572 9,454,406
FUND EXPENSES
Management fees 11 5,514,288 2,410,372Audit fees 190,000 15,000Trustee fees 12 150,000 37,500Finance cost 2,198,507 1,720,141Printing 128,180 15,000Bank charges 6,414 8,085
8,187,389 4,206,098
INCOME FROM OPERATING ACTIVITIES 18,530,183 5,248,308
EQUALISATION
Income received on units created 164,072 29,458Income paid on units liquidated (393,666) (775,282)
(229,594) (745,824)
INCOME BEFORE TAXATION 18,300,589 4,502,484
TAXATION EXPENSE 10 (36,958) (28,598)
INCOME AFTER TAXATION 18,263,631 4,473,886
FINANCE COSTS - DISTRIBUTION TO UNITHOLDERS
9(18,263,631) (4,473,886)
INCOME BEFORE NET LOSS ON INVESTMENTS - -
LOSS ON INVESTMENTS
Net decrease in fair value of HFT investments (241,980,223) (87,958,077)Loss realised on disposals of HFT investments (12,078,303) (15,630,420)
(254,058,526) (103,588,497)
LOSS AFTER NET LOSS ON INVESTMENTS Rs (254,058,526) (103,588,497)
34 NIT LEF Annual Report 2009
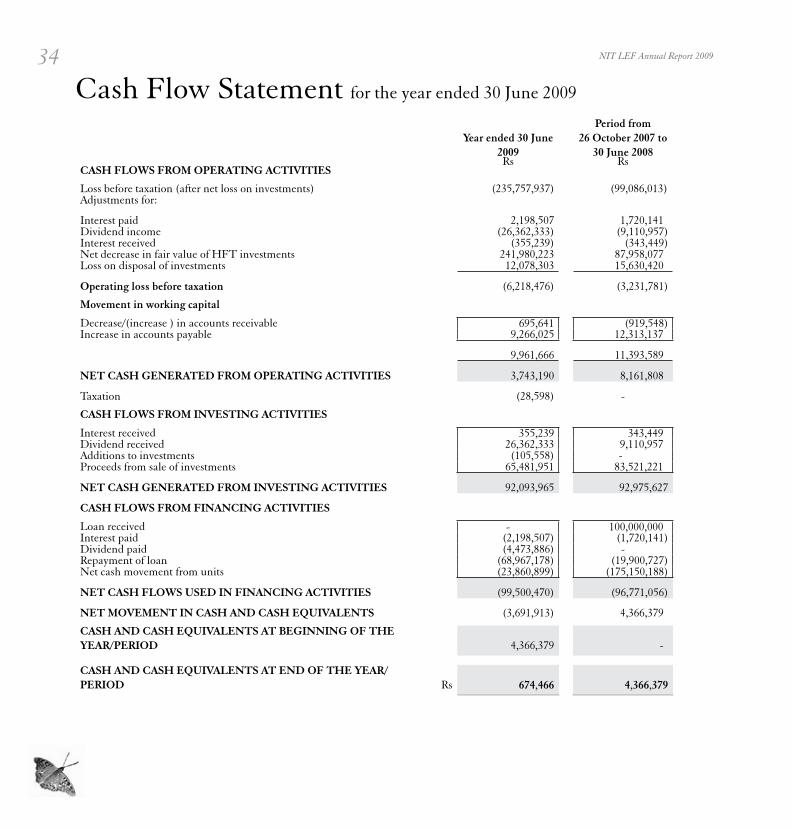
Cash Flow Statement for the year ended 30 June 2009
Year ended 30 June 2009
Period from26 October 2007 to
30 June 2008Rs Rs
CASH FLOWS FROM OPERATING ACTIVITIES
Loss before taxation (after net loss on investments) (235,757,937) (99,086,013)Adjustments for:
Interest paid 2,198,507 1,720,141Dividend income (26,362,333) (9,110,957)Interest received (355,239) (343,449)Net decrease in fair value of HFT investments 241,980,223 87,958,077Loss on disposal of investments 12,078,303 15,630,420
Operating loss before taxation (6,218,476) (3,231,781)
Movement in working capital
Decrease/(increase ) in accounts receivable 695,641 (919,548)Increase in accounts payable 9,266,025 12,313,137
9,961,666 11,393,589
NET CASH GENERATED FROM OPERATING ACTIVITIES 3,743,190 8,161,808
Taxation (28,598) -
CASH FLOWS FROM INVESTING ACTIVITIES
Interest received 355,239 343,449Dividend received 26,362,333 9,110,957Additions to investments (105,558) -Proceeds from sale of investments 65,481,951 83,521,221
NET CASH GENERATED FROM INVESTING ACTIVITIES 92,093,965 92,975,627
CASH FLOWS FROM FINANCING ACTIVITIES
Loan received - 100,000,000Interest paid (2,198,507) (1,720,141)Dividend paid (4,473,886) -Repayment of loan (68,967,178) (19,900,727)Net cash movement from units (23,860,899) (175,150,188)
NET CASH FLOWS USED IN FINANCING ACTIVITIES (99,500,470) (96,771,056)
NET MOVEMENT IN CASH AND CASH EQUIVALENTS (3,691,913) 4,366,379
CASH AND CASH EQUIVALENTS AT BEGINNING OF THE YEAR/PERIOD 4,366,379 -
CASH AND CASH EQUIVALENTS AT END OF THE YEAR/PERIOD Rs 674,466 4,366,379

35Notes to the Financial Statementsfor the year ended 30 June 2009
1. GENERAL INFORMATION
The NIT Local Equity Fund is a public open-ended collective Investment scheme which is constituted under NIT Unit Trust. It was established by a Trust Deed dated 19th and 26th October 2007 made between National Investment Trust Ltd (“The Manager”) and State Bank of Mauritius Ltd (“The Trustee”).
The investment objective of the NIT Local Equity Fund is to produce both income and capital growth from a diversified portfolio of assets. Investments are mostly in equities and fixed interest securities in the domestic stock market.
2. ADOPTION OF NEW AND REVISED INTERNATIONAL FINANCIAL REPORTING STANDARDS (IFRS)
The Fund has adopted all of the new and revised standard and interpretations issued by the International Accounting Standards Board (the “IASB”) and the International Financial Reporting Interpretations Committee (“IFRIC”) of the IASB that are relevant to its operations and effective for accounting periods beginning on 1 July 2008.
At the date of authorisation of these financial statements, the following Standards and Interpretations were in issue but effective on annual periods beginning on or after the respective dates as indicated:
IAS 1 Presentation of Financial Statements - Comprehensive revision including requiring a statement of comprehensive income (effective 1 January 2009)
IAS 1 Presentation of Financial Statements - Amendments relating to disclosure of puttable instruments and obligations arising on liquidation (effective 1 January 2009)
IAS 1 Presentation of Financial Statements - Amendments resulting from May 2008 Annual Improvements to IFRSs (effective 1 January 2009)
IAS 1 Presentation of Financial Statements - Amendments resulting from April 2009 Annual improvements to IFRSs (effective 1 January 2010)
IAS 7 Statement of Cash Flows - Amendments resulting from April 2009 Annual improvements to IFRSs (effective 1 January 2010)
IAS 16 Property, Plant and Equipment - Amendments resulting from May 2008 Annual Improvements to IFRSs (effective 1 January 2009)
IAS 17 Leases - Amendments resulting from April 2009 Annual improvements to IFRSs (effective 1 January 2010)IAS 19 Employee Benefits - Amendments resulting from May 2008 Annual improvement to IFRSs (effective 1 January 2009)IAS 20 Government Grants and Disclosure of Government Assistance - Amendments resulting from May 2008 Annual
Improvements to IFRSs (effective 1 January 2009)IAS 23 Borrowing Costs - Comprehensive revision to prohibit immediate expensing (effective 1 January 2009)IAS 23 Borrowings Costs - Amendments resulting from May 2008 Annual Improvements to IFRSs (effective 1 January 2009)IAS 27 Consolidated and Separate Financial Statements - Consequential amendments arising from amendments to IFRS 3
(effective 1 July 2009)IAS 27 Consolidated and Separate Financial Statements - Amendment relating to cost of an investment on first time adoption
(effective 1 January 2009)IAS 27 Consolidated and Separate Financial Statements - Amendments resulting from May 2008 Annual Improvements to
IFRSs (effective 1 January 2009)

36 NIT LEF Annual Report 2009
IAS 28 Investments in Associates - Consequential amendments arising from amendments to IFRS 3 (effective 1 July 2009)IAS 28 Investments in Associates - Amendments resulting from May 2008 Annual improvements to IFRSs (effective 1 January
2009)IAS 29 Financial Reporting in Hyperinflationary Economies - Amendments resulting from May 2008 Annual Improvements to
IFRSs (effective 1 January 2009)IAS 31 Interests in Joint Ventures - Consequential amendments arising fromIAS 31 Interests in Joint Ventures - Amendments resulting from May 2008 Annual Improvements to IFRSs (effective 1 January
2009)IAS 32 Financial Instruments: Presentation - Amendments relating to puttable instruments and obligations arising on
liquidation (effective 1 January 2009) amendments to IFRS 3 (effective 1 July 2009)IAS 36 Impairments of Assets - Amendments resulting from April 2009 Annual Improvements to IFRS (effective 1 January
2010)IAS 36 Impairment of Assets - Amendments resulting from May 2008 Annual Improvements to IFRSs (effective 1 January 2009)IAS 38 Intangible Assets - Amendments resulting from May 2008 Annual Improvements to IFRSs (effective 1 January 2009)IAS 38 Intangible Assets - Amendments resulting from April 2009 Annual improvements to IFRSs (effective 1 July 2009)IAS 39 Financial Instruments: Recognition and Measurement - Amendments resulting from May 2008 Annual Improvements
to IFRSs (effective 1 January 2009)IAS 39 Financial Instruments – Recognition and Measurement – Amendments for embedded derivatives when reclassifying
financial instruments (effective 30 June 2009)IAS 39 Financial Instruments: Recognition and Measurement - Amendments for embedded derivatives when reclassifying
financial instruments (effective 30 June 2009)IAS 39 Financial Instruments: Recognition and Measurement - Amendments resulting from April 2009 Annual Improvements
to IFRSs (effective 1 January 2010)IAS 40 Investment Property - Amendments resulting from May 2008 Annual Improvements to IFRSs (effective 1 January 2009)IAS 41 Agriculture - Amendments resulting from May 2008 Annual Improvements to IFRSs (effective 1 January 2009)IFRS 1 First-time Adoption of International Financial Reporting Standards - Amendment relating to cost of an investment on
first-time adoption (effective 1 January 2009)IFRS 2 Share-based Payment - Amendment relating to vesting conditions and cancellations (effective 1 January 2009)IFRS 2 Share-based Payment – Amendments resulting from April 2009 Annual Improvements to IFRSs(effective 1 July 2009)IFRS 2 Share-based Payment – Amendments relating to Group cash-settled share-based payment transactions (effective 1
January 2010)IFRS 3 Business Combinations - Comprehensive revision on applying the acquisition method (effective 1 July 2009)IFRS 5 Non-current Assets Held for Sale and Discontinued Operations - Amendments resulting from May 2008 Annual
Improvements to IFRSs (effective 1 July 2009)IFRS 5 Non-current Assets Held for Sale and Discontinued Operations – Amendments resulting from April 2009 Annual
Improvement to IFRSs(effective 1 January 2010)IFRS 7 Financial Instruments: Disclosures- Amendments enhancing disclosures about fair value and liquidity risk (effective 1
January 2009)IFRS 8 Operating Segments- Amendments resulting from April 2009 Annual improvements to IFRSs(effective 1 January 2010)IFRS 8 Operating segments (effective 1 January 2009)IFRIC 15 Agreements for the construction of Real Estate (effective 1 January 2009)IFRIC 16 Hedges of a Net Investments in a Foreign Operation (effective 1 October 2008)IFRIC 17 Distributions of Non-Cash Assets to Owners (effective 1 July 2009)IFRIC 18 Transfers of Assets from Customers (effective 1July 2009)
The Manager and the Trustee anticipate that the adoption of these Standards and Interpretations on the above effective dates in future periods will have no material impact on the financial statements of the Fund.

373. ACCOUNTING POLICIES
The principal accounting policies adopted by the Fund are as follows:
(a) Basis of preparation
The financial statements are prepared under the historical cost convention as modified by the revaluation of investments and in accordance with International Financial Reporting Standards (“IFRS”).
(b) Dividend and interest income
(i) Dividends receivable from listed investments are credited to the Income and Distribution Statement when they are first quoted ex-dividend.
(ii) Interest receivable from bank and short term deposits is credited to the Income and Distribution Statement on an accrual basis.
(c) Deferred taxation
Deferred taxation is provided on the comprehensive basis using the liability method.
Deferred tax liabilities are recognised on all temporary differences arising between the tax bases of assets and liabilities and their carrying values for financial reporting purposes.
Deferred tax assets are recognised for all deductible temporary differences to the extent that it is possible that taxable profit will be available against which the deductible temporary differences can be utilised.
(d) Cash and cash equivalents
Cash comprises cash at bank and in hand and demand deposits. Cash equivalents are short-term highly liquid investments that are readily convertible to known amounts of cash and which are subject to an insignificant risk to change in value.
(e) Investment valuation
Fair value is determined as follows:
The Company classifies its investments as fair value through profit or loss (“FVTPL”). Purchases and sales of investments are recognised on the trade-date basis – the date on which the Company commits to purchase or sell the asset. Investments are initially recognised at fair value for all financial assets. Investments are derecognised when the rights to receive cash flows from the investments have expired or have been transferred and the company has transferred substantially all risks and rewards of ownership.
Unrealised gains or losses arising from changes in fair value of FVTPL assets are included in the Income Statement and subsequently transferred to investment revaluation reserve, as the gains/losses are not distributable.
The gains and losses on disposal of FVTPL assets are recognised in the Income Statement. Gains or losses on disposal of quoted and overseas investment are subsequently transferred to surplus on realisation of investments.
Management determines the appropriate classification of the Fund’s investments and re-evaluates such classification on a regular basis.
38 NIT LEF Annual Report 2009
Fair value of the investments is determined by the Fund as follows:
• Investmentsquotedonthelocalmarketarevaluedonthebasisofthemarketpricesprevailingatyearendorat the trading sessions immediately preceding the year end.
• Dividendsreceivedinspeciearedebitedandcreditedtoinvestmentaccountanddueadjustmentsmadetocapitalaccounton revaluation of investments.
(f) Financial instruments
Financial assets and liabilities are recognised on the statement of Assets and Liabilities when the Fund has become party to the contractual provisions of the financial instruments.
Measurement
Financial instruments are initially measured at cost, which includes transaction costs. Subsequent to initial recognition these instruments are measured as set out below:-
(i) Investments
Investments in equity securities are stated at fair value. The accounting policy for investment securities is disclosed in note 3(e).
(ii) Accounts receivable
Accounts receivable originated by the Fund are stated at cost less provision for doubtful debts. An estimate of doubtful debts is made based on a review of all outstanding amounts at balance sheet date. Bad debts are written off during the period in which they are identified.
(iii) Cash and cash equivalents
Cash and cash equivalents are measured at fair value, based on the relevant exchange rates at the year end.
(iv) Accounts payable
Accounts payable are stated at their amortised cost.
(v) Units
Units of the Fund, which are redeemable at any time at the option of the unitholder for cash, do not have a par value and an unlimited number of units may be issued. The units are financial liabilities and therefore the net assets attributable to unitholders are classified within liabilities in the statement of Assets and Liabilities and distributions to unitholders are included as finance costs in the Income and Distribution Statement.
(g) Impairment
The carrying amounts of assets are assessed at each year date to determine whether there is any indication of impairment. If such indication exists, the Fund estimates the recoverable amount of the assets, being the higher of assets’ net selling price and their value in use, and reduces the carrying amount of the assets to their recoverable amounts.
(h) Provisions
A provision is recognised when and only when there is a present obligation (legal or constructive) as a result of a past event, and it is probable that an outflow of resources embodying economic benefits will be required to settle the obligation, and a

39 reliable estimate can be made of the amount of the obligation. Provisions are reviewed at each year end and adjusted to reflect the current best estimate.
(i) Equalisation
Accrued income included in the issue and repurchase of prices of units are dealt with in the Income and Distribution Statement.
(j) Related parties
Related parties are individuals and companies where the individual or company has the ability, directly or indirectly, to control the other party or exercise significant influence over the other party in making financial and operating decisions.
4. ACCOUNTING JUDGEMENTS AND KEY SOURCES OF ESTIMATION UNCERTAINTY
The preparation of financial statements in accordance with IFRS requires management to exercise judgement in the process of applying the accounting policies. It also requires the use of accounting estimates and assumptions that may affect the reported amounts and disclosures in the financial statements. Judgements and estimates are continuously evaluated and are based on historical experience and other factors, including expectations and assumptions concerning future events that are believed to be reasonable under the circumstances. The actual results could, by definition therefore, often differ from the related accounting estimates.
Where applicable, the notes to the financial statements set out areas where management has applied a higher degree of judgement that have a significant effect on the amounts recognised in the financial statements, or estimations and assumptions that have a significant risk of causing a material adjustment to the carrying amounts of assets and liabilities within the next financial year.
5. PORTFOLIO OF DOMESTIC SECURITIES
(i) Fair-value-through profit and loss
Development &Enterprises
Quoted Market TotalRs Rs Rs
At fair valueAt 1 July 2008 934,747,080 20,018,205 954,765,285Additions - 105,559 105,559Disposals (70,112,255) (7,448,000) (77,560,255)Deficit on revaluation (239,077,382) (2,902,841) (241,980,223)
At 30 June 2009 625,557,287 9,773,078 635,330,366
At 30 June 2008 934,747,080 20,018,205 954,765,285
Sales proceeds 58,802,624 6,679,327 65,481,951

40 NIT LEF Annual Report 2009
(ii) Details of domestic securities
Fair value Portfolio2009 2009Rs %
LEISURE AND TOURISMOfficial ListNew Mauritius Hotels Limited 112,278,417 17.67 Sun Resorts Limited 68,828,643 10.83 Naiade Resort Ltd 13,308,750 2.09
Development & Enterprises MarketCasino Ltd (Knowledge Economies Ltd) 2,554,420 0.40
196,970,230 30.99
BANK, INSURANCE AND FINANCEOfficial ListThe Mauritius Commercial Bank Ltd 163,787,652 25.78 State Bank of Mauritius Ltd 151,146,310 23.79 Mauritian Eagle Insurance Co Ltd 3,122,200 0.49 Swan Insurance Co. Ltd 2,511,696 0.40
320,567,858 50.46
COMMERCEOfficial ListShell Mauritius Limited 2,285,640 0.36
PROPERTY AND CONSTRUCTIONOfficial ListCaudan Development Limited 563,200 0.09
Development & Enterprises MarketCOVIFRA Ltée 206,064 0.03
769,264 0.12
FOOD AND BEVERAGESOfficial ListInnodis Limited 299,733 0.05 Phoenix Beverages Ltd 6,174 -
Development & Enterprises MarketLes Moulins de la Concorde Ltée 47,257 0.01
353,164 0.06

41Fair value Portfolio
2009 2009Rs %
MANUFACTURING AND INDUSTRIALOfficial ListMauritius Oil Refineries Limited 2,770,187 0.44 United Basalt Products Limited 7,958,851 1.25 Development & Enterprises MarketChemco Ltd 21,750 - CIEL Textile Ltd 23,328 - Espitalier Noel Ltd - Preference Shares 732,000 0.12 United Docks 445,000 0.07
11,951,116 1.88 CONGLOMERATEOfficial ListIreland Blyth Ltd 15,438,203 2.43 Rogers and Company Ltd 49,113,820 7.73
64,552,023 10.16
SUGAR INDUSTRYOfficial ListHarel Freres Ltd 649,994 0.10 Omnicane Limited 27,180,093 4.28 The Mount Sugar Estates Company Limited 461,940 0.07
Development & Enterprises MarketAlma Investment Co Ltd 521,560 0.08 Deep River Beau Champ Ltd - Preference Shares 286,875 0.05 Flacq United Estates Ltd - Ordinary Shares 2,828,520 0.45 Medine Share Holdings 437,400 0.07 The Union Sugar Estate Ltd 792 -
32,367,174 5.10
INVESTMENTSOfficial ListBritish American Investment Co. (Mauritius) Ltd 1,928,766 0.30 Belle Mare Holdings 272,800 0.04
Development & Enterprises MarketCiel Investment Limited 1,822,974 0.30 Excelsior United Development Companies Ltd 6,097 - Forward Investment and Development Enterprises Limited 3,720 - Phoenix Investment 280,320 0.04
4,314,677 0.68
AIR TRANSPORTOfficial ListAir Mauritius Limited 1,199,220 0.19
TOTAL VALUE OF DOMESTIC SECURITIES Rs 635,330,366 100.00

42 NIT LEF Annual Report 2009
(iii) Portfolio changes
HOLDINGS SOLD DURING THE YEAROfficial ListBritish American Investment Co Ltd (Ord)Mauritius Commercial Bank Ltd (Ord)New Mauritius Hotels Ltd (Ord)Rogers Ltd (Ord)State Bank of Mauritius Ltd (Ord)Sun Resorts Ltd (Ord)
Development & Enterprises MarketDeep River Beau Champ (Ord)Beau Champ Holdings Company Limited
HOLDINGS ACQUIRED DURING THE YEARDevelopment & Enterprises MarketCiel Investment
6. ACCOUNTS RECEIVABLE2009 2008Rs Rs
Trade receivables 223,907 445,648Amount due by NIT Global Opportunities Fund - 473,900
Rs 223,907 919,548
Trade receivables represent dividend receivable from listed and DEM companies which is accrued on the basis of the date of dividend declaration.
There are no past due dividend receivable.
7. ACCOUNTS PAYABLE2009 2008Rs Rs
Other payables 9,510,855 8,115,124Accruals 12,068,307 4,198,013
Rs 21,579,162 12,313,137
The company has financial risk management policies in place to ensure that all payables are paid within the timeframe.

438. LOAN
2009 2008Rs Rs
Balance at 1 July 80,099,273 -Additions - 100,000,000Repayments (68,967,178) (19,900,727)
Balance at 30 June Rs 11,132,095 80,099,273
The above loan due to National Investment Trust Ltd is unsecured, repayable at call and bears an interest rate of 5.5% to 8% p.a. (2008: 8% p.a.)
9. FINANCE COSTS - DISTRIBUTIONS TO UNITHOLDERS
2009 2008Rs Rs
Final distribution of Re 0.02 per unit (2008 Re 0.005) Rs 18,263,631 4,473,886
10. TAXATION
(i) Income tax
Income tax is charged on the net income of the Fund, as adjusted for tax purposes, at the rate of 15 %( 2008: 15 %) as follows:
2009 2008Rs Rs
Provision for current period 36,958 28,598
Taxation charge Rs 36,958 28,598
(ii) Tax reconciliation
2009 2008Rs Rs
Net income before taxation Rs 18,300,589 4,502,484
Tax at 15% 2,745,088 675,373Tax effects of:- Exempt income (3,954,350) (1,366,644)- Expenses attributable to exempt income 1,246,220 719,869
Taxation expense Rs 36,958 28,598
(iii) Deferred tax
The Fund had no deferred tax asset/liability at 30 June 2009.
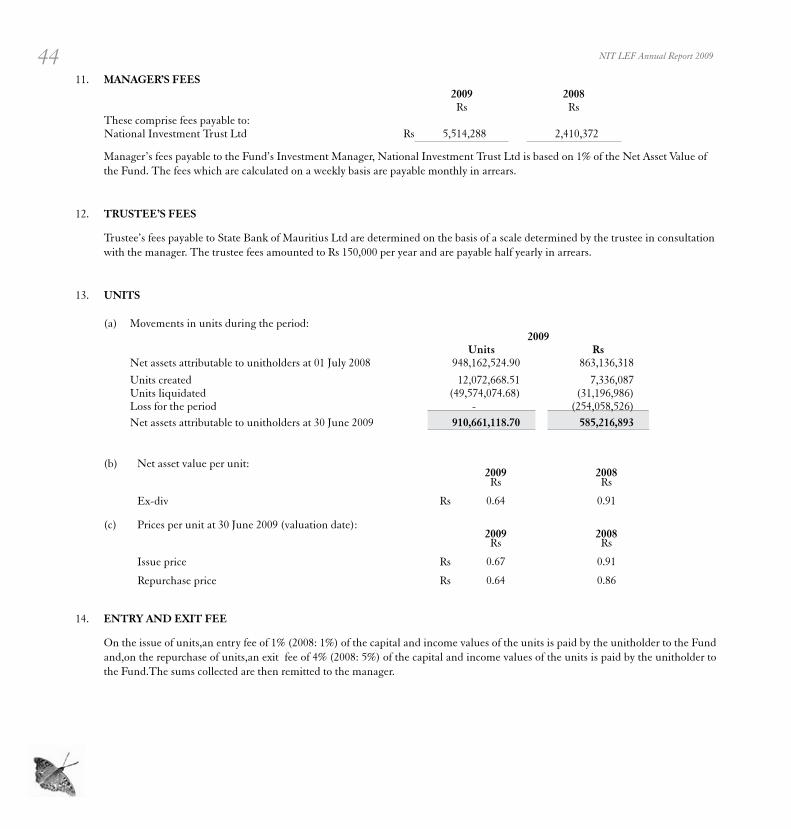
44 NIT LEF Annual Report 2009
11. MANAGER’S FEES 2009 2008
Rs RsThese comprise fees payable to:National Investment Trust Ltd Rs 5,514,288 2,410,372
Manager’s fees payable to the Fund’s Investment Manager, National Investment Trust Ltd is based on 1% of the Net Asset Value of the Fund. The fees which are calculated on a weekly basis are payable monthly in arrears.
12. TRUSTEE’S FEES
Trustee’s fees payable to State Bank of Mauritius Ltd are determined on the basis of a scale determined by the trustee in consultation with the manager. The trustee fees amounted to Rs 150,000 per year and are payable half yearly in arrears.
13. UNITS
(a) Movements in units during the period:2009
Units RsNet assets attributable to unitholders at 01 July 2008 948,162,524.90 863,136,318
Units created 12,072,668.51 7,336,087Units liquidated (49,574,074.68) (31,196,986)Loss for the period - (254,058,526)Net assets attributable to unitholders at 30 June 2009 910,661,118.70 585,216,893
(b) Net asset value per unit:2009 2008Rs Rs
Ex-div Rs 0.64 0.91
(c) Prices per unit at 30 June 2009 (valuation date):2009 2008Rs Rs
Issue price Rs 0.67 0.91
Repurchase price Rs 0.64 0.86
14. ENTRY AND EXIT FEE
On the issue of units,an entry fee of 1% (2008: 1%) of the capital and income values of the units is paid by the unitholder to the Fund and,on the repurchase of units,an exit fee of 4% (2008: 5%) of the capital and income values of the units is paid by the unitholder to the Fund.The sums collected are then remitted to the manager.

4515. RELATED PARTY TRANSACTIONS
The Fund is making the following disclosures in respect of related party transactions:
2009 2008Rs Rs
(i) Outstanding balances
Receivable from related partiesNIT Global Opportunities Fund Rs - 473,900
Payable to related parties
National Investment Trust Ltd 32,486,257 92,344,909State Bank of Mauritius Ltd 75,000 37,500
Rs 32,561,257 92,382,409
Bank balances and short term deposits with State Bank of Mauritius Ltd Rs 674,466 4,366,379
(ii) Manager’s fees toNational Investment Trust Ltd Rs 5,514,288 2,410,372
(iii) Trustee’s fees toState Bank of Mauritius Ltd Rs 150,000 37,500
(iv) Interest income from State Bank of Mauritius Ltd Rs 355,239 343,449
(v) Bank charges payable to State of Mauritius Ltd Rs 6,414 8,085
Compensation to key management personnel
There was no compensation to key management personnel for the period ended 30 June 2009. (2008: Nil)
16. FINANCIAL INSTRUMENTS
Capital risk management
The Fund manages its capital to ensure that the Fund will be able to continue as a going concern. The capital structure of the Fund consists of cash and cash equivalents and net assets attributable to unitholders.
Gearing ratio
The Fund reviews the capital structure on a regular basis and as part of this review, management considers the cost of capital and the risks associated with each class of capital. The Fund has a target gearing ratio of 10% determined as the proportion of net debt to equity.
The gearing ratio at the year end was as follows:2009 2008Rs Rs
Debt (i) 11,132,095 80,099,273Cash and cash equivalents (674,466) (4,366,379)Net debt 10,457,629 75,732,894Equity (ii) 585,216,893 863,136,318Net debt to equity ratio 2% 9%

46 NIT LEF Annual Report 2009
(i) Debt is defined as loan, as detailed in note 8.
(ii) Equity is defined as net assets attributable to unitholders.
Significant accounting policies
Details of the significant accounting policies and methods adopted, including the criteria for recognition, the basis of measurement and the basis on which income and expenses are recognised, in respect of each class of financial asset, financial liability and equity instrument are disclosed in note 3 to the financial statements.
Fair values
The carrying amounts of financial assets and liabilities approximate to their fair values due to the short term nature of the balances involved.
Categories of financial instruments
2009 2008Rs Rs
Financial assets
Investments at fair value through profit or loss (FVTPL) 635,330,366 954,765,285Accounts receivable 223,907 919,548Cash and cash equivalents 674,466 4,366,379
Rs 636,228,739 960,051,212Financial Liabilities
Accounts payable, at amortised cost 32,711,257 92,412,410Distribution to unitholders 18,263,631 4,473,886
Rs 50,974,888 96,886,296
Financial risk management objectives
The Fund deals with domestic securities only and manages the financial risks relating to its operations by monitoring the risks and implementing policies to mitigate these risk exposures. These risks include market risk (including currency risk, interest rate risk and price risk), credit risk and liquidity risk.
Market risk
Market risk represents the potential loss that can be caused by a change in the market value of financial instruments. The Fund’s exposure to market risk is determined by a number of factors, including interest rates and market volatility.
Foreign currency risk management
The Fund is not exposed to any currency risk since all its financial assets and liabilities are denominated in Mauritian Rupees.
Credit risk
The Fund does not have significant concentration of credit risk which is primarily attributable to its trade receivables. Trade receivables consist mainly of dividend receivable from a large number of investee companies spread across diverse industries.
Credit risk refers to the risk that counterparty will default on its contractual obligations resulting in financial loss to the Fund.
47 Interest rate risk management
The Fund is exposed to interest rate risk as the Fund has borrowings at fixed interest rates. The risk is managed by the Fund by maintaining adequate cash reserves at floating interest rates.
The interest rate profile of the Fund’s financial assets and financial liabilities as at 30 June 2009 was:
2009 2008% p.a % p.a
Financial assetsCash at bank 4.50 7.00
Financial liabilitiesLoan 5.50 to 8.00 8.00
Interest rate sensitivity analysis
The sensitivity analysis below has been determined based on the exposure to interest rates for loan outstanding at the balance sheet date. The analysis is prepared assuming the amount of loan outstanding at the balance sheet date was due for the whole period. A 50 basis points increase or decrease is used when reporting interest rate risk internally to key management personnel and represents management’s assessment of the reasonably possible change in interest rates.
If interest rates had been 50 basis points higher and all other variables were held constant, the Fund’s results would be affected as
follows:2009 2008
Rs
Loss 522,881 3,786,648
Had the interest rates been 50 basis points lower and all other variables were held constant, there would be an equal and opposite impact on profit.
Other price risks
The Fund is exposed to equity price risks arising from equity investments which the Fund held for trading purposes.
Equity price sensitivity analysis
The sensitivity analysis below has been determined based on the exposure to equity price risks at the reporting date.
If equity prices had been 5% higher/lower, equity reserves would increase/decrease by Rs 30.9M as a result of the changes in fair value of the held-for-trading shares.
Liquidity risk management
The Fund manages liquidity risk by maintaining adequate reserves and banking facilities, by continuously monitoring forecast and actual cash flows and matching the maturity profiles of financial assets and liabilities.
Liquidity and interest risk tables
The following tables detail the Fund’s remaining contractual maturity for its non-derivative financial assets and liabilities. The tables have been drawn up based on the undiscounted cash flows of financial assets and liabilities based on the earliest date on which the Fund can be required to earn or pay.

48 NIT LEF Annual Report 2009
Weighted average effective
interest rate At callLess than 1 month
1-3 months
3 months to 1 year
More than 1 year Total
2009 % p.a Rs Rs Rs Rs Rs
Financial assetsNon interest bearing - 223,907 - - 635,330,366 635,554,273Variable interest rate instruments 4.5% 674,466 - - - - 674,466
Rs 674,466 223,907 - - 635,330,366 636,228,739Financial liabilities
Non interest bearing n/a - 90,000 135,000 35,699,145 - 35,939,145Variable interest rate instruments 5.5% 15,050,743 - - - - 15,050,743
Rs 15,050,743 90,000 135,000 14,999,382 - 50,974,888
Weighted average effective
interest rate At callLess than 1 month
1-3 months
3 months to 1 year
More than 1 year Total
2008 % p.a Rs Rs Rs Rs Rs
Financial assetsNon interest bearing - 445,648 - - 954,765,285 955,684,833Variable interest rate instruments 4.5% 4,366,379 - - - - 4,366,379
Rs 4,366,379 445,648 - - 954,765,285 960,051,212Financial liabilities
Non interest bearing n/a - 15,000 52,500 14,999,382 - 15,066,882Variable interest rate instruments 5.5% 81,819,414 - - - - 81,819,414
Rs 81,819,414 15,000 52,500 14,999,382 - 96,886,296

NIT Global Opportunities Fund Annual Report 2009

50 NIT GOF Annual Report 2009
Manager’s ReportWe are pleased to present a report of the NIT GLOBAL OPPORTUNITIES FUND for the period ended 30 June 2009.
Performance ReviewInvestment Breakdown at 30 June 2009
Capital
For the period under review, the Fund’s Capital Value per unit decreased by about 8.9% as it fell from Rs 0.91 on 1 July 2008 to reach Rs 0.86 on 30 June 2009. A detailed analysis of the performance of our portfolio of foreign investments is set out below:
Realised Currency
Gains/(Losses)
Realised Capital Gains/
(Losses)
Unrealised Gains/
(Losses) on Currency
Unrealised Gains/
(Losses) on Capital
Total
Rs (000) Rs (000) Rs (000) Rs (000) Rs (000)
Portfolio 11,369 (10,188) 61,258 (92,798) (30,359)
For the year under review, our portfolio of overseas investments posted a negative result of Rs 30.4m which, based on the portfolio valuation of 1 July 2008, represents a depreciation of about 8.9%. In USD terms, with the MSCI World Index down 30.8%, the Company’s portfolio fell by 23.1%. Such a performance is primarily explained by the fact that about 28% of our portfolio is invested in alternative investments and cash which has mitigated our exposure to equities during such uncertain times. Finally, it is worth noting that during the period under review, the USD has appreciated by 19.2%, 12.5% and 21.1% against the Rupee, the Euro and the GBP respectively. The table below compares the performance of the Funds in which we have invested against their respective benchmarks.
Performances in forex terms from 01.07.08 to 30.06.09Investment % Benchmark (Hedged) %
UBS -20.3 Msci World -30.8In-House Portfolio -21.4JF India -4.4 Sensex (adj USD) 1.4JF China -7.3JF Eastern Europe -53.0 Msci Eastern Europe -53.1JF Japan -31.7 Nikkei 225 (adj USD) -16.5JF Latin America -39.1 Msci Latin America -35.7SJPI GAM USD -19.6 Msci World -30.8SJPI THSP USD -27.0 Msci World -30.8SJPI Far East GBP -3.9 Msci Far east (adj USD) -0.27SJPI GAM GBP -8.7 Msci World (adj GBP) -9.6SJPI THSP Pound -18.8 Msci World (adj GBP) -9.6
Income
Given the nature of our underlying investments where much of the emphasis is on long-term capital growth, the dividend income received from our holdings has been quite minimal. As such, for the period under review, the Fund has not been able to pay any dividend.
NIT GOF Trust ConstitutionThe NIT GLOBAL OPPORTUNITIES FUND is constituted under the NIT UNIT TRUST which is authorized under the Unit Trust Act 1989 and established by a Trust Deed dated 19th & 26th
October 2007 between the National Investment Trust Ltd (“The Manager”) and the State Commercial Bank Ltd (“The Trustee”).
NIT GOF Trust Objective The investment objective of the NIT GLOBAL OPPORTUNITIES FUND is to produce both income and capital growth from a diversified portfolio of international securities. Investment can be made in overseas equities, fixed-interest securities and other financial assets.
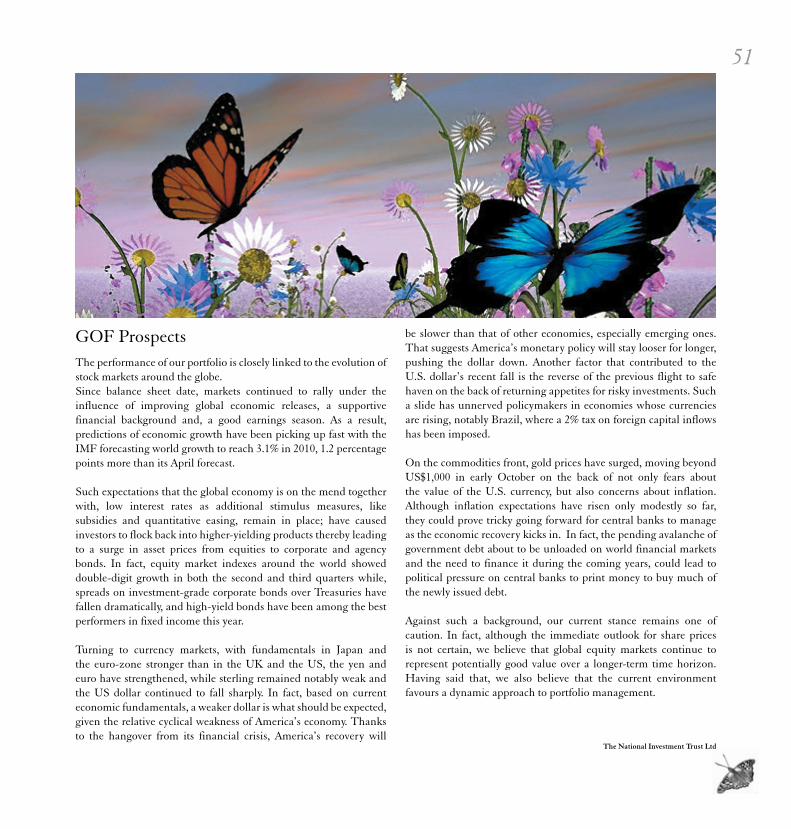
51
GOF ProspectsThe performance of our portfolio is closely linked to the evolution of stock markets around the globe. Since balance sheet date, markets continued to rally under the influence of improving global economic releases, a supportive financial background and, a good earnings season. As a result, predictions of economic growth have been picking up fast with the IMF forecasting world growth to reach 3.1% in 2010, 1.2 percentage points more than its April forecast.
Such expectations that the global economy is on the mend together with, low interest rates as additional stimulus measures, like subsidies and quantitative easing, remain in place; have caused investors to flock back into higher-yielding products thereby leading to a surge in asset prices from equities to corporate and agency bonds. In fact, equity market indexes around the world showed double-digit growth in both the second and third quarters while, spreads on investment-grade corporate bonds over Treasuries have fallen dramatically, and high-yield bonds have been among the best performers in fixed income this year.
Turning to currency markets, with fundamentals in Japan and the euro-zone stronger than in the UK and the US, the yen and euro have strengthened, while sterling remained notably weak and the US dollar continued to fall sharply. In fact, based on current economic fundamentals, a weaker dollar is what should be expected, given the relative cyclical weakness of America’s economy. Thanks to the hangover from its financial crisis, America’s recovery will
be slower than that of other economies, especially emerging ones. That suggests America’s monetary policy will stay looser for longer, pushing the dollar down. Another factor that contributed to the U.S. dollar’s recent fall is the reverse of the previous flight to safe haven on the back of returning appetites for risky investments. Such a slide has unnerved policymakers in economies whose currencies are rising, notably Brazil, where a 2% tax on foreign capital inflows has been imposed.
On the commodities front, gold prices have surged, moving beyond US$1,000 in early October on the back of not only fears about the value of the U.S. currency, but also concerns about inflation. Although inflation expectations have risen only modestly so far, they could prove tricky going forward for central banks to manage as the economic recovery kicks in. In fact, the pending avalanche of government debt about to be unloaded on world financial markets and the need to finance it during the coming years, could lead to political pressure on central banks to print money to buy much of the newly issued debt.
Against such a background, our current stance remains one of caution. In fact, although the immediate outlook for share prices is not certain, we believe that global equity markets continue to represent potentially good value over a longer-term time horizon. Having said that, we also believe that the current environment favours a dynamic approach to portfolio management.
The National Investment Trust Ltd
52 NIT GOF Annual Report 2009
This report is made solely to the Fund’s unit holders, as a body. Our audit work has been undertaken so that we might state to the Fund’s unit holders those matters we are
required to state to them in an auditor’s report and for no other purpose. To the fullest extent permitted by law, we do not accept or assume responsibility to anyone other than the Fund’s unit holders as a body, for our audit work, for this report, or for the opinions we have formed.
Report on the Financial Statements
We have audited the financial statements of NIT Global Opportunities Fund on pages 53 to 70 which comprise the statement of assets and liabilities as at 30 June 2009 and the statement of movements in net assets, income and distribution statement and cash flow statement for the year then ended and a summary of significant accounting policies and other explanatory notes.
Responsibilities of manager and trustee
The manager and the trustee are responsible for the preparation and fair presentation of these financial statements in accordance with International Financial Reporting Standards and in compliance with the requirements of the Trust Deed. This responsibility includes: designing, implementing and maintaining internal control relevant to the preparation and fair presentation of financial statements that are free from material misstatement, whether due to fraud or error; selecting and applying appropriate accounting policies; and making accounting estimates that are reasonable in the circumstances.
Auditor’s responsibility
Our responsibility is to express an opinion on these financial statements based on our audit. We conducted our audit in accordance with International Standards on Auditing. Those standards require that we comply with ethical requirements and plan and perform the audit to obtain reasonable assurance whether the financial statements are free from material misstatement.
An audit involves performing procedures to obtain audit evidence about the amounts and disclosures in the financial statements. The procedures selected depend on the auditor’s judgment, including the assessment of the risks of material misstatement of the financial
statements, whether due to fraud or error. In making those risk assessments, the auditor considers internal control relevant to the entity’s preparation and fair presentation of the financial statements in order to design audit procedures that are appropriate in the circumstances, but not for the purpose of expressing an opinion on the effectiveness of the Fund’s internal control. An audit also includes evaluating the appropriateness of accounting policies used and the reasonableness of accounting estimates made by management, as well as evaluating the overall presentation of the financial statements.
We believe that the audit evidence we have obtained is sufficient and appropriate to provide a basis for our audit opinion.
Opinion
In our opinion, the financial statements on pages 53 to 70 give a true and fair view of the financial position of the Fund as at 30 June 2009, and of its financial performance and cash flows for the year then ended in accordance with International Financial Reporting Standards and comply with the requirements of the Trust Deed.
Report on other legal requirements
In accordance with the requirements of the Trust Deed, we report as follows:
• we have no relationship with, or interests in, the Fund other than in our capacities as auditors and tax advisors;
• we have obtained all information and explanations that we have required; and
• in our opinion, proper accounting records have been kept by the Fund as far as appears from our examination of those records.
Kemp Chatteris DeloitteChartered Accountants3rd Floor, Cerné House
La Chaussée, Port Louis
Independent auditor’s report to the unitholdersof the NIT Global Opportunities Fund constituted under the NIT Unit Trust
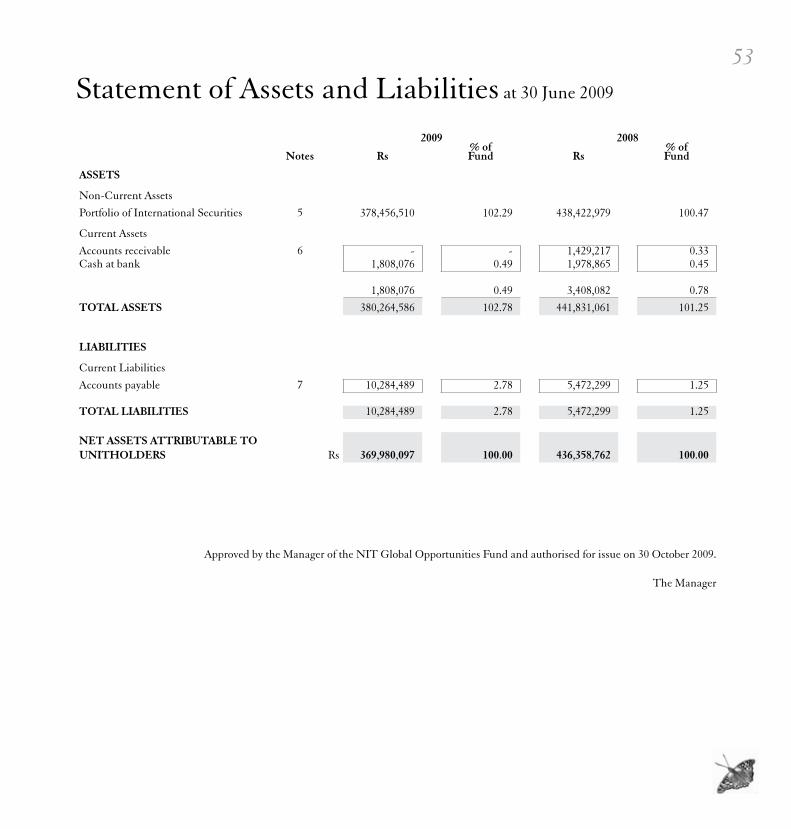
53Statement of Assets and Liabilities at 30 June 2009
2009 2008% of % of
Notes Rs Fund Rs Fund
ASSETS
Non-Current Assets
Portfolio of International Securities 5 378,456,510 102.29 438,422,979 100.47
Current Assets
Accounts receivable 6 - - 1,429,217 0.33Cash at bank 1,808,076 0.49 1,978,865 0.45
1,808,076 0.49 3,408,082 0.78TOTAL ASSETS 380,264,586 102.78 441,831,061 101.25
LIABILITIES
Current Liabilities
Accounts payable 7 10,284,489 2.78 5,472,299 1.25
TOTAL LIABILITIES 10,284,489 2.78 5,472,299 1.25
NET ASSETS ATTRIBUTABLE TO UNITHOLDERS Rs 369,980,097 100.00 436,358,762 100.00
Approved by the Manager of the NIT Global Opportunities Fund and authorised for issue on 30 October 2009.
The Manager

54 NIT GOF Annual Report 2009
Statement of Movements in Net Assetsfor the year ended 30 June 2009
Other net Investments assets Total
Rs Rs RsNET ASSETS TRANSFERRED FROM NATIONAL INVESTMENT TRUST AS PER TRUST DEED DATED 19th AND 26th OCTOBER 2007 501,899,975 46,200,025 548,100,000
Cash received for units created - 7,108,882 7,108,882Cash paid for units liquidated - (73,030,928) (73,030,928)
NET CASH MOVEMENT FROM UNITS - (65,922,046) (65,922,046)
Net cost of investments purchased 50,179,620 (50,179,620) -Proceeds from sale of investments (69,925,648) 69,925,648 -
NET CASH MOVEMENT FROM INVESTMENTS (19,746,028) 19,746,028 -
Loss after loss on investments for the period - (45,819,192) (45,819,192)Transfer of loss on investments (43,730,968) 43,730,968 -
(43,730,968) (2,088,224) (45,819,192)
NET ASSETS ATTRIBUTABLE TO UNITHOLDERS AT 30 JUNE 2008 Rs 438,422,979 (2,064,217) 436,358,762
NET ASSETS ATTRIBUTABLE TO UNITHOLDERS AT 1 JULY 2008 438,422,979 (2,064,217) 436,358,762
Cash received for units created - 2,766,306 2,766,306Cash paid for units liquidated - (34,101,258) (34,101,258)
NET CASH MOVEMENT FROM UNITS - (31,334,952) (31,334,952)
Net cost of investments purchased 92,775,838 (92,775,838) -Proceeds from sale of investments (122,960,042) 122,960,042 -
NET CASH MOVEMENT FROM INVESTMENTS (30,184,204) 30,184,204 -
Loss after loss on investments for the year - (35,043,713) (35,043,713)Transfer of loss on investments (29,782,265) 29,782,265 -
(29,782,265) (5,261,448) (35,043,713)NET ASSETS ATTRIBUTABLE TO UNITHOLDERS AT 30 JUNE 2009 Rs 378,456,510 (8,476,413) 369,980,097

55Income and Distribution Statementfor the year ended 30 June 2009
Notes Year ended 30 June 2009
Period from26 October 2007to 30 June 2008
Rs Rs
INVESTMENT INCOMEDividend income 1,365,364 323,260Interest income 141,787 238,894Overseas Interest 71,070 -
1,578,221 562,154
FUND EXPENSESManagement fees 9 6,340,217 2,541,857Audit fees 190,000 15,000Trustee fees 10 150,000 37,500Interest Cost 265,825 -Printing 129,880 15,000Bank charges 102,071 43,146
7,177,993 2,652,503
LOSS FROM OPERATING ACTIVITIES (5,599,772) (2,090,349)
EQUALISATION Income paid on units created (36,012) (10,946)Income received on units liquidated 374,336 13,071
338,324 2,125
BALANCE BEFORE LOSS ON INVESTMENTS (5,261,448) (2,088,224)Net decrease in fair value of HFT investments (30,785,372) (37,280,751)(Gain)/Loss on disposals of HFT investments 1,003,107 (6,450,217)
(29,782,265) (43,730,968)
LOSS AFTER LOSS ON INVESTMENTS Rs (35,043,713) (45,819,192)

56 NIT GOF Annual Report 2009
Cash Flow Statement for the year ended 30 June 2009
Year ended 30 June 2009
Period from26 October 2007to 30 June 2008
Rs Rs
CASH FLOWS FROM OPERATING ACTIVITIES
Loss before taxation (after net loss on investments) (35,043,713) (45,819,192)
Adjustments for:Interest expense 265,825 -Dividend income 1,365,364 (323,260)Interest income (212,857) (238,894)Net decrease in fair value of HFT investments 30,785,372 37,280,751(Gain)/Loss on disposals of investments (1,003,107) 6,450,217
Operating loss before taxation (3,843,116) (2,650,378)
Movement in working capitalAccounts receivable 1,429,217 (1,429,217)Accounts payable 4,812,190 5,472,299
6,241,407 4,043,082
CASH GENERATED FROM OPERATIONS 2,398,291 1,392,704
Interest paid (265,825) -
CASH GENERATED BY OPERATING ACTIVITIES 2,132,466 1,392,704
CASH FLOWS FROM INVESTING ACTIVITIESAdditions to investments (92,775,838) (50,179,620)Proceeds from sale of investments 122,960,042 69,925,648Interest income 212,857 323,260Dividend income (1,365,364) 238,894
NET CASH GENERATED FROM INVESTING ACTIVITIES 29,031,697 20,308,182
CASH FLOWS FROM FINANCING ACTIVITIESApplication money received - 46,200,025Net cash movement from units (31,334,952) (65,922,046)
NET CASH FLOWS USED IN FINANCING ACTIVITIES (31,334,952) (19,722,021)
NET MOVEMENT IN CASH AND CASH EQUIVALENTS (170,789) 1,978,865
CASH AND CASH EQUIVALENTS AT BEGINNING OF THE YEAR/PERIOD 1,978,865 -CASH AND CASH EQUIVALENTS AT THE END OF YEAR/PERIOD Rs 1,808,076 1,978,865

57Notes to the Financial Statementsfor the year ended 30 June 2009
1. GENERAL INFORMATION
The NIT Global Opportunities Fund is a public open-ended collective investment scheme which is constituted under NIT Unit Trust. It was established by a Trust Deed dated 19th and 26th October 2007 made between National Investment Trust Ltd (“The Manager”) and State Bank of Mauritius Ltd (“The Trustee”).
The investment objective of the NIT Global Opportunities Fund is to produce both income and capital growth from a diversified portfolio of assets. Investments are mostly in equities and fixed interest securities in the international stock market.
2. ADOPTION OF NEW AND REVISED INTERNATIONAL FINANCIAL REPORTING STANDARDS (IFRS)
The Fund has adopted all of the new and revised standard and interpretations issued by the International Accounting Standards Board (the “IASB”) and the International Financial Reporting Interpretations Committee (“IFRIC”) of the IASB that are relevant to its operations and effective for accounting periods beginning on 1 July 2008.
At the date of authorisation of these financial statements, the following Standards and Interpretations were in issue but effective on annual periods beginning on or after the respective dates as indicated:
IAS 1 Presentation of Financial Statements - Comprehensive revision including requiring a statement of comprehensive income (effective 1 January 2009)
IAS 1 Presentation of Financial Statements - Amendments relating to disclosure of puttable instruments and obligations arising on liquidation (effective 1 January 2009)
IAS 1 Presentation of Financial Statements - Amendments resulting from May 2008 Annual Improvements to IFRSs (effective 1 January 2009)
IAS 1 Presentation of Financial Statements – Amendments resulting from April 2009 Annual Improvements to IFRSs (effective 1 January 2010)
IAS 7 Statement of Cash Flows – Amendments resulting from April 2009 Annual Improvements to IFRSs (effective 1 January 2010)
IAS 16 Property, Plant and Equipment - Amendments resulting from May 2008 Annual Improvements to IFRSs (effective 1 January 2009)
IAS 17 Leases - Amendments resulting from April 2009 Annual Improvements to IFRSs (effective 1 January 2010)IAS 19 Employee Benefits - Amendments resulting from May 2008 Annual improvement to IFRSs (effective 1 January 2009)IAS 20 Government Grants and Disclosure of Government Assistance - Amendments resulting from May 2008 Annual
Improvements to IFRSs (effective 1 January 2009)IAS 23 Borrowing Costs - Comprehensive revision to prohibit immediate expensing (effective 1 January 2009)IAS 23 Borrowings Costs - Amendments resulting from May 2008 Annual Improvements to IFRSs (effective 1 January 2009)IAS 27 Consolidated and Separate Financial Statements - Consequential amendments arising from amendments to IFRS 3
(effective 1 July 2009)IAS 27 Consolidated and Separate Financial Statements - Amendment relating to cost of an investment on first time adoption
(effective 1 January 2009)IAS 27 Consolidated and Separate Financial Statements - Amendments resulting from May 2008 Annual Improvements to
IFRSs (effective 1 January 2009)

58 NIT GOF Annual Report 2009
IAS 28 Investments in Associates - Consequential amendments arising from amendments to IFRS 3 (effective 1 July 2009)IAS 28 Investments in Associates - Amendments resulting from May 2008 Annual improvements to IFRSs (effective 1 January
2009)IAS 29 Financial Reporting in Hyperinflationary Economies - Amendments resulting from May 2008 Annual Improvements to
IFRSs (effective 1 January 2009)IAS 31 Interests in Joint Ventures - Consequential amendments arising from amendments to IFRS 3 (effective 1 July 2009)IAS 31 Interests in Joint Ventures - Amendments resulting from May 2008 Annual Improvements to IFRSs (effective 1 January
2009)IAS 32 Financial Instruments: Presentation - Amendments relating to puttable instruments and obligations arising on
liquidation (effective 1 January 2009)IAS 36 Impairment of Assets - Amendments resulting from May 2008 Annual Improvements to IFRSs (effective 1 January 2009)IAS 36 Impairment of Assets - Amendments resulting from April 2009 Annual Improvements to IFRSs (effective 1 January
2010)IAS 38 Intangible Assets - Amendments resulting from May 2008 Annual Improvements to IFRSs (effective 1 January 2009)IAS 38 Intangible Assets - Amendments resulting from April 2009 Annual Improvements to IFRSs (effective 1 January 2010)IAS 39 Financial Instruments: Recognition and Measurement - Amendments resulting from May 2008 Annual Improvements
to IFRSs (effective 1 January 2009)IAS 39 Financial Instruments: Recognition and Measurement - Amendments for eligible hedged items (effective 1 July 2009)IAS 39 Financial Instruments: Recognition and Measurement – Amendments for embedded derivatives when reclassifying
financial instruments (effective 1 July 2009)IAS 39 Financial Instruments: Recognition and Measurement – amendments resulting from April 2009 Annual Improvements
to IFRSs (effective 1 January 2010)IAS 40 Investment Property - Amendments resulting from May 2008 Annual Improvements to IFRSs (effective 1 January 2009)IAS 41 Agriculture - Amendments resulting from May 2008 Annual Improvements to IFRSs (effective 1 January 2009)IFRS 1 First-time Adoption of International Financial Reporting Standards - Amendment relating to cost of an investment on
first-time adoption (effective 1 January 2009)IFRS 2 Share-based Payment - Amendment relating to vesting conditions and cancellations (effective 1 January 2009)IFRS 2 Share-based Payment - Amendments resulting from April 2009 Annual Improvements to IFRSs (effective 1 July 2009)IFRS 2 Share-based Payment – Amendments relating to Group cash-settled share-based payment transactions (effective 1
January 2010)IFRS 3 Business Combinations - Comprehensive revision on applying the acquisition method (effective 1 July 2009)IFRS 5 Non-current Assets Held for Sale and Discontinued Operations - Amendments resulting from May 2008 Annual
Improvements to IFRSs (effective 1 July 2009)IFRS 5 Non-current Assets Held for Sale and Discontinued Operations - Amendments resulting from April 2009 Annual
Improvements to IFRSs (effective 1 January 2010)IFRS 7 Financial Instruments - Disclosures - Amendments enhancing disclosures about fair value and liquidity risk (effective 1
January 2009)IFRS 8 Operating segments (effective 1 January 2009)IFRS 8 Operating Segments - Amendments resulting from April 2009 Annual Improvements to IFRSs (effective 1 January 2010)IFRIC 15 Agreements for the Construction of Real Estate (effective 1 January 2009)IFRIC 16 Hedges of a Net Investment in a Foreign Operation (effective 1 October 2008)IFRIC 17 Distributions of Non-Cash Assets to Owners (effective 1 July 2009)IFRIC 18 Transfers of Assets from Customers (effective 1 July 2009)
The Manager and the Trustee anticipate that the adoption of these Standards and Interpretations on the above effective dates in future periods will have no material impact on the financial statements of the Fund.

593. ACCOUNTING POLICIES
The principal accounting policies adopted by the Fund are as follows:
(a) Basis of preparation
The financial statements are prepared under the historical cost convention as modified by the revaluation of investments and in accordance with International Financial Reporting Standards (“IFRS”).
(b) Dividend and interest income
(i) Dividends receivable from listed investments are credited to the Income and Distribution Statement when they are first quoted ex-dividend.
(ii) Interest receivable from bank and short term deposits is credited to the Income and Distribution Statement on accrual basis.
(c) Deferred taxation
Deferred taxation is provided on the comprehensive basis using the liability method.
Deferred tax liabilities are recognised on all temporary differences arising between the tax bases of assets and liabilities and their carrying values for financial reporting purposes.
Deferred tax assets are recognised for all deductible temporary differences to the extent that it is possible that taxable profit will be available against which the deductible temporary differences can be utilised.
(d) Cash and cash equivalents
Cash comprises cash at bank and in hand and demand deposits. Cash equivalents are short-term highly liquid investments that are readily convertible to known amounts of cash and which are subject to an insignificant risk to change in value.
(e) Investment Valuation
Fair value is determined as follows:
The Company classifies its investments as fair value through profit or loss (“FVTPL”). Purchases and sales of investments are recognised on the trade-date basis – the date on which the Company commits to purchase or sell the asset. Investments are initially recognised at fair value for all financial assets. Investments are derecognised when the rights to receive cash flows from the investments have expired or have been transferred and the company has transferred substantially all risks and rewards of ownership.
Unrealised gains or losses arising from changes in fair value of FVTPL assets are included in the Income Statement and subsequently transferred to investment revaluation reserve, as the gains/losses are not distributable.
The gains and losses on disposal of FVTPL assets are recognised in the Income Statement. Gains or losses on disposal of quoted and overseas investment are subsequently transferred to surplus on realisation of investments.
Management determines the appropriate classification of the Fund’s investments and re-evaluates such classification on a regular basis.
The fair values of the overseas investments are determined by reference to the available bid price or market price prevailing at balance sheet date or according to the trading session immediately preceding the balance sheet date.

60 NIT GOF Annual Report 2009
(f) Financial instruments
Financial assets and liabilities are recognised on the statement of Assets and Liabilities when the Fund has become party to the contractual provisions of the financial instruments.
Measurement
Financial instruments are initially measured at cost, which includes transaction costs. Subsequent to initial recognition these instruments are measured as set out below:
(i) InvestmentsInvestments in equity securities are stated at fair value. The accounting policy for investment securities is disclosed in note 3(e).
(ii) Accounts receivableAccounts receivable originated by the Fund are stated at cost less provision for doubtful debts. An estimate of doubtful debts is made based on a review of all outstanding amounts at balance sheet date. Bad debts are written off during the period in which they are identified.
(iii) Cash and cash equivalentsCash and cash equivalents are measured at fair value, based on the relevant exchange rates at the year end.
(iv) Accounts payable Accounts payable are stated at their amortised cost.
(v) Units Units of the Fund, which are redeemable at any time at the option of the unitholder for cash, do not have a par value and an unlimited number of units may be issued. The units are financial liabilities and therefore the net assets attributable to unitholders are classified within liabilities in the statement of Assets and Liabilities and distributions to unitholders are included as finance costs in the Income and Distribution Statement.
(g) Impairment
The carrying amounts of assets are assessed at each year date to determine whether there is any indication of impairment. If such indication exists, the Fund estimates the recoverable amount of the assets, being the higher of assets’ net selling price and their value in use, and reduces the carrying amount of the assets to their recoverable amounts.
(h) Provisions
A provision is recognised when and only when there is a present obligation (legal or constructive) as a result of a past event, and it is probable that an outflow of resources embodying economic benefits will be required to settle the obligation, and a reliable estimate can be made of the amount of the obligation. Provisions are reviewed at each year end and adjusted to reflect the current best estimate.
(i) Equalisation
Accrued income included in the issue and repurchase of prices of units are dealt with in the Income and Distribution Statement.
(j) Related parties
Related parties are individuals and companies where the individual or company has the ability, directly or indirectly, to control the other party or exercise significant influence over the other party in making financial and operating decisions.

614. ACCOUNTING JUDGEMENTS AND KEY SOURCES OF ESTIMATION UNCERTAINTY
The preparation of financial statements in accordance with IFRS requires management to exercise judgement in the process of applying the accounting policies. It also requires the use of accounting estimates and assumptions that may affect the reported amounts and disclosures in the financial statements. Judgements and estimates are continuously evaluated and are based on historical experience and other factors, including expectations and assumptions concerning future events that are believed to be reasonable under the circumstances. The actual results could, by definition therefore, often differ from the related accounting estimates.
Where applicable, the notes to the financial statements set out areas where management has applied a higher degree of judgement that have a significant effect on the amounts recognised in the financial statements, or estimations and assumptions that have a significant risk of causing a material adjustment to the carrying amounts of assets and liabilities within the next financial year.
5. PORTFOLIO OF INTERNATIONAL SECURITIES
Fair-value-through profit and loss2009 2008Rs Rs
At fair valueAt 1 July 438,422,979 501,899,975Additions 92,775,838 50,179,620Disposals (121,956,935) (76,375,865)Deficit on revaluation (30,785,372) (37,280,751)
At 30 June 378,456,510 438,422,979
Sales proceeds 122,960,042 69,925,648
5.1. PORTFOLIO OF OVERSEAS INVESTMENT EQUITIES
HOLDINGS MARKET
VALUE MARKET
VALUE % OVERSEAS PORTFOLIO
2009 2009 2009 2009USD Rs
UNITED STATES OF AMERICAABB 900 14,202 447,874 0.12Accenture 500 16,730 527,597 0.14Adobe Systems 600 16,980 535,481 0.14Allstate Corporation 100 2,440 76,948 0.02Altria Group 300 4,917 155,062 0.04AMR 800 3,216 101,419 0.03Apple 150 21,365 673,767 0.18Baker Hughes Incorporation 400 14,576 459,668 0.12Bank of America 273 3,604 113,655 0.03Barrick Gold 800 26,840 846,426 0.22Best Buy 400 13,396 422,456 0.11Boeing 250 10,625 335,070 0.09Canadian Nat Railway Co 350 15,036 474,176 0.13

62 NIT GOF Annual Report 2009
Cisco Systems 800 14,912 470,265 0.12Delphi 2,000 130 4,100 0.0013EMC Corporation 1,000 13,042 411,292 0.11Encana Corporation 250 12,368 390,037 0.10Fannie Mae 250 145 4,572 0.0012Fedex 200 11,124 350,806 0.09General Electric Co 1,000 11,720 369,602 0.10Goldman Scahs 180 26,539 836,934 0.22Google 60 25,295 797,703 0.21Halliburton Hldg 800 16,560 522,236 0.14Hewlett Packard 400 15,460 487,546 0.13Intel 1,000 16,550 521,921 0.14JP Morgan Chase 400 13,644 430,277 0.10KB Home 800 10,944 345,130 0.09
Kellogg 300 13,971 440,589 0.12Kraft Foods 600 15,204 479,473 0.13Mc Donald’s 350 20,122 634,567 0.17Medtronics 300 10,467 330,087 0.09Microsoft 1,000 23,770 749,612 0.20Myriad Genetics 1,650 58,823 1,855,042 0.48Myriad Pharmaceutical 412 1,916 60,423 0.02News Corporation Ltd 1,000 10,570 333,335 0.09Oracle Corporation 900 19,278 607,951 0.16Petro Canada 390 14,984 472,535 0.12Pfizer Inc 900 13,500 425,736 0.11Philip Morris Int’l 300 13,086 412,680 0.11Procter&Gamble 300 15,330 483,447 0.13Symantec Corp 1,000 15,560 490,700 0.13Teva Pharmaceuticals 700 34,538 1,089,190 0.29Time Warner 1,000 11,017 347,432 0.09Toll Brothers 800 13,576 428,133 0.11United Technologies 300 15,588 491,583 0.13UBS Equity Fund - USA 16,000 1,080,800 34,084,109 9.01UBS SEC POR-US EMU B 2,220 251,992 7,946,819 2.10UBS SECPOR-US COD B 2,790 207,381 6,539,967 1.73UBS SECPOR-US IND B 2,285 165,411 5,216,402 1.38UBS SECPOR-US CST B 1,420 155,746 4,911,606 1.30UBS SECPOR-US HCA B 2,460 219,284 6,915,340 1.83UBS SECPOR-US FIN B 3,200 136,512 4,305,042 1.14UBS SECPOR-US ITT B 2,990 281,718 8,884,259 2.35UBS KS SUSEQUSPA 9,890 104,636 3,299,801 0.87
3,277,140 103,347,880 27.31
HOLDINGS MARKET
VALUE MARKET
VALUE % OVERSEAS PORTFOLIO
2009 2009 2009 2009USD Rs
UNITED STATES OF AMERICA

63
HOLDINGS MARKET
VALUE MARKET
VALUE % OVERSEAS PORTFOLIO
2009 2009 2009 2009 USD Rs
EUROPE-EURO ZONE EXCLUDING UKAlcatel-Lucent 1,700 4,263 134,438 0.04Ahold 800 9,362 295,240 0.08Alstom 250 14,747 465,061 0.13AXA 400 7,513 236,930 0.06Basf 280 11,381 358,911 0.09Deutsche Post 400 5,209 164,271 0.04EADS 700 11,682 368,403 0.11Infineon Technologies 1,000 3,693 116,463 0.03Siemens AG 125 8,834 278,589 0.07Technip 300 14,682 463,011 0.13Tui 700 5,150 162,410 0.04Vivendi Universal 450 10,752 339,075 0.09UBS Equity Fund - Euro Countries 1,100 138,569 4,369,912 1.15UBS SEC POR-EMU EMUB 375 62,961 1,985,538 0.52UBS SEC POR-EMU FINB 670 64,356 2,029,531 0.54UBS SEC POR-EMU ITTB 270 34,937 1,101,773 0.29UBS SECPOR-EMU CDIB 195 24,431 770,456 0.20UBS SECPOR-EMU INDB 165 20,360 642,073 0.17UBS SECPOR-EMU CSHB 200 26,953 849,990 0.22
479,835 15,132,075 4.00
UNITED KINGDOMBAE Systems 1,900 10,592 334,029 0.09Barclays 2,300 10,719 338,034 0.09BHP Billiton Plc 600 13,478 425,042 0.11Carnival Corporation 400 10,308 325,073 0.09Glaxo Smith Kline 500 17,670 557,242 0.15Kingfisher 5,000 14,640 461,687 0.12Prudential 800 5,448 171,808 0.05Rolls Royce Group 1,500 8,930 281,617 0.07Standard Chartered 650 12,203 384,834 0.10Vectura Group 9,000 10,301 324,852 0.09UBS Equity Fund - Great Britain B 975 126,560 3,991,196 1.05
240,849 7,595,413 2.01
JAPANMits UFG FULGR- ADR 2,000 12,280 387,262 0.10Panasonic 1,300 17,407 548,947 0.15JF Japan 6,645 60,066 1,894,255 0.50
89,753 2,830,464 0.75BRAZILHSBC-Brazil 255,626 8,061,477 2.13
CHINAChina Mobile 500 25,040 789,662 0.21Petrochina 140 15,467 487,768 0.13Shanda Interactive 350 18,302 577,172 0.15

64 NIT GOF Annual Report 2009
CHINA (continued)SINA 380 11,202 353,266 0.09JF CHINA 9,101 367,122 11,577,554 3.06
437,133 13,785,423 3.64
INDIAJF India 4,386 659,516 20,798,509 5.50
REGION SPECIFIC EQUITY FUNDSUBS Equity Funds - Emmaus B 10,500 208,950 6,589,447JF Eastern Europe 15,709 395,741 12,547,534JF Latin America 4,240 115,613 3,645,973HSBC Global Emerging Markets Equity Freestyle 10,205 93,035 2,933,966SJPI/Far East 25,890 631,282 20,117,778
1,444,621 45,834,698 12.11
SPECIALISTS FUNDSSJPI/GAM Managed USD 329,182 10,381,075SJPI/THSP Managed USD 382,617 12,066,220SJPI/GAM Managed GBP 242,566 7,730,145 SJPI/THSPManaged GBP 397,508 12,667,839
1,100,465 42,845,279 11.32
TOTAL OVERSEAS EQUITIES 7,984,938 260,231,219 68.76
PROPERTYUBS WM Global Property 32,100 350,172 11,043,024 2.92
ALTERNATIVE INVESTMENTSGam Trading IV 2,800 416,220 13,125,914JPY/EUR Bear Ct110 1,100 23,082 727,914DCI IRL Feed One 1,600 175,744 5,542,263Global Division Alt 49,000 577,844 18,222,888FS-GLBDUSB 650 65,046 2,051,290O’ Connor CRPJ 95 144,148 4,545,851Emerging Markets 15 UBSL 910 115,643 3,646,916MSCI Perles 06 UBSL 26,000 241,415 7,613,263Shorty S&P500 Ct09 1,540 53,592 1,690,077ShortySX5E Ct09 1,100 54,804 1,728,299MDDLEMU Ct05 UBS 280 65,262 2,058,102MSCI Perles 08 PXJ 4,810 132,660 4,183,566NDDLUK PERL 06 UBSL 1,935 151,271 4,770,482PRE DEBIT ACF USD 13,110 110,262 3,477,222PRED UBS MMAF USD A 10,583 105,882 3,339,095MSCI CT 13 CAD SGA 965 28,684 904,579UBS MSA USD 8,800 98,324 3,100,746UBS 100 INDEX-FD CH 28 95,434 3,009,607
2,655,317 83,738,074 22.13
HOLDINGS MARKET
VALUE MARKET
VALUE % OVERSEAS PORTFOLIO
2009 2009 2009 2009USD Rs

65
CASH INVESTMENTSBNP IPB - USD A/C 6,676 210,546UBS Managed - USD 4,167 131,411UBS Managed – EUR 77 2,428UBS Managed – CHF 2,086 65,784UBS Non-Managed – USD 63,814 2,012,438UBS Non-Managed – Euro 53,835 1,697,741UBS Non-Managed – GBP 8,001 252,320Swissquote – USD 154,428 4,870,041Swissquote – Euro 66,118 2,085,097Swissquote – CHF 975 30,748SBM – USD 285,280 8,996,605SBM – EURO 80,048 2,563,391SBM – GBP 8,465 269,761UBP – USD 384 12,096Barclays – USD 7,730 243,786
742,084 23,444,193 6.19
TOTAL OVERSEAS INVESTMENTS 11,732,511 378,456,510 100.00
6. ACCOUNTS RECEIVABLE2009 2008Rs Rs
Application money - 1,200,025Other receivables - 229,192
Rs - 1,429,217
7. ACCOUNTS PAYABLE
2009 2008Rs Rs
Other payables 5,136,092 3,659,431Accruals 5,148,397 1,812,868
Rs 10,284,489 5,472,299
The company has financial risk management policies in place to ensure that all payables are paid within the timeframe.
HOLDINGS MARKET
VALUE MARKET
VALUE % OVERSEAS PORTFOLIO
2009 2009 2009 2009USD Rs

66 NIT GOF Annual Report 2009
8. TAXATION
(i) Income tax
Net income of the Fund, as adjusted for tax purposes is subject to income tax at the rate of 15% (2008: 15%). At 30 June 2009, the fund has a tax loss of Rs939,966 to be carried forward.
(ii) Deferred tax
The Fund had no deferred tax asset/liability at 30 June 2009.
9. MANAGER’S FEES
2009 2008Rs Rs
These comprise fees payable to:
UBS 2,357,081 1,118,868St James’ Place 358,207 196,522National Investment Trust Ltd 3,624,929 1,226,467
Rs 6,340,217 2,541,857
Manager’s fees payable to the fund’s Investment manager, National Investment Trust Ltd is based on 1% of the Net Asset Value of the fund. The fees which are calculated on a weekly basis are payable monthly in arrears.
10. TRUSTEE’S FEES
Trustee’s fees payable to State Bank of Mauritius Ltd are determined on the basis of a scale determined by the trustee in consultation with the manager.The trustee fees amounted to Rs150,000 per year and are payable half yearly in arrears.
11. UNITS
(a) Movements in units during the period:
2009Units Rs
Net assets attributable to unitholders at 01 July 2008 477,018,750.70 436,358,762
Units created 3,645,486.52 2,766,306Units liquidated (40,163,631.18) (34,101,258)Loss for the period - (35,043,713)
Net assets attributable to unitholders at 30 June 2009 440,500,606 369,980,097
(b) Prices per unit at 30 June 2009 (valuation date)
2009 2008Rs Rs
Issue price Rs 0.85 0.91
Repurchase price Rs 0.81 0.87

6712. ENTRY AND EXIT FEE
On the issue of units,an entry fee of 1% (2008: 1%) of the capital and income values of the units is paid by the unitholder to the Fund and,on the repurchase of units,an exit fee of 4% (2008: 5%) of the capital and income values of the units is paid by the unitholder to the Fund.The sums collected are then remitted to the manager.
13. RELATED PARTY TRANSACTIONS
The Fund is making the following disclosures in respect of related party transactions:
2009 2008Rs Rs
(i) Outstanding balances
Receivable from related partiesNational Investment Trust Ltd Rs - 1,429,217
Payable to related partiesNational Investment Trust Ltd 9,987,489 4,885,899NIT Local Equity Fund - 473,900
Rs 9,987,489 5,359,799
Bank balances and short term deposits with State Bank of Mauritius Ltd Rs 1,808,076 1,978,865
(ii) Manager’s fees toNational Investment Trust Ltd Rs 3,624,929 1,226,467
(iii) Trustee’s fees toState Bank of Mauritius Ltd Rs 150,000 37,500
(iv) Interest income from State Bank of Mauritius Ltd Rs 141,787 238,894
(v) Bank charges payable to State Bank of Mauritius Ltd Rs 7,163 8,026
Compensation to key management personnel
There was no compensation to key management personnel for the period ended 30 June 2009. (2008: Nil)
14. FINANCIAL INSTRUMENTS
Capital risk management
The Fund manages its capital to ensure that the Fund will be able to continue as a going concern. The capital structure of the Fund consists of cash and cash equivalents and net assets attributable to unitholders.
Significant accounting policies
Details of the significant accounting policies and methods adopted, including the criteria for recognition, the basis of measurement

68 NIT GOF Annual Report 2009
and the basis on which income and expenses are recognised, in respect of each class of financial asset, financial liability and equity instrument are disclosed in note 3 to the financial statements.
Fair values
The carrying amounts of financial assets and liabilities approximate to their fair values due to the short term nature of the balances involved.
Categories of financial instruments2009 2008Rs Rs
Financial assets
Investments at fair value though profit or loss (FVTPL) 378,456,510 438,422,979Loan and receivables - 1,429,217Cash and cash equivalents 1,808,076 1,978,865
380,264,586 441,831,061Financial liabilities
Accounts payable, amortised cost 10,284,489 5,472,299
Financial risk management objectives
The Fund deals with international securities only and manages the financial risks relating to its operations by monitoring the risks and implementing policies to mitigate these risk exposures. These risks include market risk (including currency risk, interest rate risk and price risk), credit risk and liquidity risk.
Market risk Market risk represents the potential loss that can be caused by a change in the market value of financial instruments. The Fund’s
exposure to market risk is determined by a number of factors, including interest rates and market volatility.
Foreign currency risk management
The Fund undertakes certain transactions denominated in foreign currencies. Consequently, the Fund is exposed to the risk that the carrying amounts of assets and liabilities denominated in foreign currency may change due to fluctuations in foreign exchange rates.
The currency profile of the Fund’s financial assets and financial liabilities at 30 June is summarised as follows: 2009 2008
Financial Financial Financial Financialassets liabilities Assets liabilities
Currency Rs Rs Rs Rs
MUR 1,808,076 10,284,489 3,408,082 5,472,299USD 322,560,062 - 352,235,732 -EURO 15,110,925 - 40,263,522 -GBP 40,785,523 - 45,875,753 -JPY - - 16,002 -CHF - - 31,970 -
Rs 380,264,586 10,284,489 441,831,061 5,472,299
The company is mainly exposed to the USD, EURO and GBP.

69 The following table details the Fund’s sensitivity to a 10% increase and decrease in the Mauritian Rupee against the relevant foreign
currencies. 10% represents management’s assessment of the reasonably possible change in foreign exchange rates. A positive number below indicates a decrease in profit and equity where the Mauritian Rupee strengthens 10% against the relevant foreign currencies. For a 10% weakening of the Mauritian Rupee against the relevant foreign currencies, there would be an equal and opposite impact on the profit and equity and the balance below would be negative.
Equity2009 2008Rs Rs
Foreign Currency Impact
USD 32,256,006 35,223,573EURO 1,511,093 4,026,352GBP 4,078,552 4,587,575JPY - 1,600CHF - 3,197
Rs 37,845,651 43,842,297 The above foreign currency impact is mainly attributable to the foreign currency exposure on investment balances.
Credit risk
The Fund does not have significant concentration of credit risk which is primarily attributable to its trade receivables. Trade receivables consist mainly of application money receivable from National Investment Trust Ltd “The Manager”.
Credit risk refers to the risk that counterparty will default on its contractual obligations resulting in financial loss to the Fund.
Interest rate risk management
The interest rate profile of the Fund’s financial assets as at 30 June 2009 was:
2009 2008% p.a % p.a
Financial assetsCash at bank 4.50 7.00
Interest rate sensitivity analysis
The sensitivity analysis below has been determined based on the exposure to interest rates for loans receivable at the balance sheet date. The analysis is prepared assuming the amount of loan receivable at the balance sheet date was outstanding for the whole year. A 50 basis points increase or decrease represents management’s assessment of the reasonably possible change in interest rates.
If interest rates had been 50 basis points higher and all other variables were held constant, the Fund’s results would be affected as follows:
2009 2008Rs Rs
Profit 90,404 989
Had the interest rates been 50 basis points lower and all other variables were held constant, there would be an equal and opposite impact on profit.

70 NIT GOF Annual Report 2009
Other price risks
The Fund is exposed to equity price risks arising from equity investments which the company held for trading purposes.
Equity price sensitivity analysis
The sensitivity analysis below has been determined based on the exposure to equity price risks at the reporting date.
If equity prices had been 5% higher/lower, net assets attributable to unitholders would increase/decrease by Rs 21,921,149 as a result of the changes in fair value of the held-for-trading shares.
Liquidity risk management
The Fund manages liquidity risk by maintaining adequate reserves and banking facilities, by continuously monitoring forecast and actual cash flows.
Liquidity and interest risk tables
The following tables detail the Fund’s remaining contractual maturity for its non-derivative financial assets and liabilities. The tables have been drawn up based on the undiscounted cash flows of financial assets and liabilities based on the earliest date on which the Fund can be required to earn or pay.
Weighted average effective interest
rateAt call
Less than 1 month
1-3 months
3 months to 1 year
More than 1year Total
2009 % p.a Rs Rs Rs Rs Rs
Financial assetsNon interest bearing n/a - - - - 378,456,510 378,456,510Variable interest rate instruments 4.50 1,808,076 - - - - 1,808,076
Rs 1,808,076 - - - 378,456,510 380,264,586Financial liabilitiesNon interest bearing n/a Rs - 207,000 90,000 9,987,489 - 10,284,489
Weighted average effective interest
rateAt call
Less than 1 month
1-3 months
3 months to 1 year
More than 1year Total
2008 % p.a Rs Rs Rs Rs Rs
Financial assetsNon interest bearing n/a - 229,192 1,200,025 - 438,422,979 439,852,196Variable interest rate instruments 4.50 1,978,865 - - - - 1,978,865
Rs 1,978,865 229,192 1,200,025 - 438,422,979 441,831,061Financial liabilitiesNon interest bearing n/a Rs - 97,500 15,000 5,359,799 - 5,472,299

Contact:Level 8 Newton Tower, Sir William Newton Street, Port Louis, MauritiusTel.: (230) 211 54 84 - E-Mail: [email protected] - Website: www.nit.mu