ANNUAL REPORT 2009 - AnnualReports.com and complementary building products in North America. With...
88
ANNUAL REPORT 2009 THE EXPERIENCE YOU WANT • THE SERVICE YOU EXPECT • THE VALUE YOU DESERVE EST. 1928 Beacon Roofing Supply, Inc. 2009 Annual Report
Transcript of ANNUAL REPORT 2009 - AnnualReports.com and complementary building products in North America. With...

ANNUAL REPORT 2009THE EXPERIENCE YOU WANT • THE SERVICE YOU EXPECT • THE VALUE YOU DESERVE
EST. 1928
Beacon’s Growing Family of Regional Distributors
One Lakeland Park Drive • Peabody, MA 01960 • Phone: 877-645-7663 • Fax: 978-535-7358 • beaconroofingsupply.com
Beacon Roofing Supply, Inc. 2009 Annual Report
BE25184_Cvr.indd 1 12/28/09 8:05:11 AM

Beacon Roofing Supply, Inc. has grown to be one of the largest distributors of roofing
materials and complementary building products in North America. With more than
40,000 customers, Beacon is the largest or second largest distributor in many of the
regions we serve (see map below). We have a reputation for quality people who
provide our customers with “The Experience You Want, The Service You Expect,
The Value You Deserve.” Our people are supported by a strong, values-oriented
corporate culture. We are in our 81st year! We originated with Beacon Sales
Company, founded in Charlestown, Massachusetts in 1928.
Our local branches stock a comprehensive product line that caters to the local
market. In addition to residential and commercial roofing, our product categories
include windows, siding, decking, doors, waterproofing and other exterior
products. Beacon distributes the roofing and complementary products
of brand-name manufacturers. These manufacturers understand that
our staff’s expertise and quality service will ensure the successful
application of their premium products.
Our knowledgeable and experienced sales and marketing team includes
outside sales and business development specialists, inside sales/
customer service representatives, manufacturer/architectural
representatives and product specialists. Contractors trust the product
knowledge and application expertise of Beacon’s staff. They rely on
this expertise, along with on-time delivery and product availability,
to deliver successful, profitable and on-time projects. As a result,
successful partnerships that go beyond the industry norm are formed
between Beacon branches and our customers. We have grown by opening new
branches, expanding our product offerings and by making strategic acquisitions.
Our business is well-balanced, with non-discretionary re-roofing applications and
discretionary new construction and remodeling in both the residential and commercial
markets. We have a solid foundation for continued growth based on a highly scalable
platform, a proven business model, results-oriented management, a strong people-
focused corporate culture and a company-wide enterprise resource planning system.
CORPORATE PROFILE AND BEACON’S GROWTH
1928Beacon Sales Company is established in Charlestown, Massachusetts.
1984Andrew Logie buys a majority interest in Beacon Sales Company.
1984–97Beacon grows in sales and reputation, opening four new branches in New England.
1997Equity firm Code, Hennessy & Simmons III, L.P.purchases a majority interest, and Beacon Roofing Supply is formed.
1998Quality Roofing Supply in Pennsylvania becomes Beacon’s first acquisition.
1999–2000Best Distributing in the Carolinas joins the Beacon family. Groupe Bedard and Exeltherm Supply are acquired and become Beacon Canada.
2001The Roof Center in Maryland/Virginia and West End Lumber in Texas are acquired.
2004Beacon goes public with its IPO (Nasdaq: BECN). JGA Corp. in Georgia and Florida becomes part of Beacon.
2005Shelter Distribution with more than 50 branches in 14 Midwestern and Southern states is acquired. Beacon gains a presence on the West Coast with Pacific Supply.
2006–2007Mississippi Roofing Supply, Alabama Roofing Supply, Roof Depot and RSM Supply are acquired. North Coast Commercial Roofing Systems is acquired.
2008–2009Beacon achieves record sales in 2008 and record profits in 2009.
Beacon’s complete history can be read about on the company web site at www.beaconroofingsupply.com/about-us/history/default.html.
PROFIT GROWTHNet income in 2009 was a record $52.4 million. Diluted net income per share increased by 28% to a record $1.15 from $0.90 in 2008.
CASHBuilt to $83 million in 2009 from $26 million in 2008.
Fiscal Year 2009 Accomplishments
172 branches in 37 states in the United States and in Eastern Canada
Fiscal Year 2009 Accomplishments
Robert R. BuckChairman and Chief Executive Officer
Paul M. IsabellaPresident and Chief Operating Officer
David R. GraceSenior Vice President andChief Financial Officer
C. Eric SwankSenior Vice President, Oversees The Roof Center
Ross D. Cooper
Senior Vice-President, General Counsel and Corporate Secretary
James I. MacKimmSenior Vice President,Oversees Beacon Sales Company and Quality Roofing Supply
Patrick MurphySenior Vice President,Oversees Southeast Regions and Corporate Procurement
David WrabelVice President, Credit
Rick C. WelkerVice President and Corporate Controller
John P. MassarelliVice President, Sales and Marketing
Christopher NelsonVice President, Chief Information Officer
Sergio PadronVice President, Corporate Safety and Risk Management
David M. Pasternak Vice President, Human Resources
John C. Smith, Jr.Regional Vice President, Shelter Southwest Region
Munroe BestRegional Vice President,Best Distributing Company
Scott WadeRegional Vice President, JGA Beacon
Robert K. Greer, Jr.Regional Vice President,West End Roofing, Siding and Windows
Marc AllaireRegional Vice President, Beacon Canada
Gerard HillRegional Vice President, Beacon Sales Company
Ken HeitkampRegional Manager, Beacon Pacific
Kent C. GardnerRegional Vice President,Shelter Midwest Region
David Lowery Regional Vice President, North Coast Commercial Roofing Systems
Fred PrattVice President, North Coast Commercial Roofing Systems
Board of Directors
Robert R. BuckChairman and Chief Executive Officer
H. Arthur Bellows, Jr.Chairman of Braeburn Associatesand The Finance Network
James J. GaffneyChairman of the Board of DirectorsImperial Sugar Company
Peter GotschManaging Partner, Ellipse Capital, LLC and Chairman of the Board, Hillman Companies, Inc.
Andrew R. LogieFounder and Former Chairman and CEO Beacon Roofing Supply, Inc.
Stuart A. RandlePresident, CEO and Director GI Dynamics
Wilson B. SextonChairman of the Board andFormer Chief Executive OfficerPool Corporation
Executive Management
September 2009 Executive Meeting • Standing (L–R): Ken Heitkamp, Munroe Best, Jeff Metz, Jim MacKimm, Jack Smith, Paul Isabella, Dave Wrabel, Robert Buck, Chris Nelson, David Grace, Kent Gardner, Ross Cooper, Gerard Hill, Scott Wade, Ken Greer
Seated (L–R): Sergio Padron, Jake Gosa, David Pasternak, Marc Allaire, Eric Swank, Dave Lowery, Pat Murphy, John Massarelli
Transfer Agent and RegistrarComputershare Investor Services350 Indiana Street • Suite 750Golden, Colorado 80401
Annual MeetingFebruary 5, 2010 • 8:00 a.m. EST505 Huntmar Park DriveSuite 300 • Herndon, Virginia 20170
Independent Registered Public Accounting Firm Ernst & Young LLP200 Clarendon Street Boston, Massachusetts 02116
Corporate HeadquartersBeacon Roofing Supply, Inc.One Lakeland Park Drive Peabody, Massachusetts 01960Phone: 978-535-7668
Form 10-KAdditional copies of the company’s Annual Report on Form 10-K are available from the company at no charge. Requests should be directed to the company’s corporate headquarters at the number above.
The shares of Beacon Roofing Supply, Inc. are traded on the Nasdaq Global Select Market under the symbol BECN.
On the InternetInterested investors may visit the company’s web site at www.beaconroofingsupply.com for updated information, including press releases, share trading data and SEC filings.
BE25184_Cvr.indd 2 12/28/09 8:05:16 AM

FINANCIAL HIGHLIGHTS
Fiscal year (1): 2006 2007 2008 2009 Net sales $1,500,637 $1,645,785 $1,784,495 $1,733,967 Gross margin % 24.3% 22.7% 23.5% 23.7% Operating income $100,301 $69,808 $94,710 $109,209
Operating income % 6.7% 4.2% 5.3% 6.3% Net income $49,311 $25,279 $40,306 $52,418 Diluted net income
Total assets $839,890 $1,006,660 $1,067,816 $1,040,786 Stockholders’ equity $291,169 $323,850 $366,701 $423,573
(1) The fiscal year for the Company was a 52- or 53-week period ending the last Saturday in September until 2007 when it changed to the last day of September. All years except 2006 contain 52 weeks.
Operating IncomeIn Thousands
Net SalesIn Thousands
$ in 000’s except per share amounts
$1.12 $0.56 $0.90 $1.15 per share

LETTER TO SHAREHOLDERS
We are pleased to have this opportunity to share the details of our
financial and operational accomplishments in 2009. In the face of difficult
economic conditions, we exceeded expectations and achieved record net
income and earnings per share. We attribute these accomplishments to
our talented, experienced and dedicated staff, and to our commitment to
our corporate values and exceptional customer service. Our Texas team
performed especially well in 2009, servicing customers efficiently under
very challenging circumstances following Hurricane Ike.
In 2009, net income was $52.4 million on sales of $1.73 billion. That
net income represents an increase of 30.1% over 2008’s net income
of $40.3 million. Our diluted earnings per share was $1.15 in 2009
compared to $0.90 in 2008.
Our three major product lines were negatively impacted by economic
conditions in 2009, which included lower levels of new construction
and remodeling. Residential roofing sales benefited in the first part
of the year from inflation and from product demand in the areas affected
by Hurricane Ike. For the year, residential roofing sales increased 18.3%
while non-residential roofing declined 17.1%, and complementary product
sales declined 21.6%.
We opened three new branches in late 2009, which included assuming
the operation of two branches of a former regional distributor. We closed
six branches during the course of the year, which accounted for some of
the reduction in sales.
Our gross margin rate increased to 23.7% from 23.5% last year due
primarily to the sales mix shift to residential roofing products. Operating
expenses declined $23.4 million, or 7.2%, and as a percentage of net
sales to 17.4% from 18.2%. This was attributable mostly to tight controls
and a lower provision for bad debts.
Dear Shareholders and Friends
2009
THE EXPERIENCE YOU WANT THE SERVICE YOU EXPECT THE VALUE YOU DESERVE

Paul Isabella PRESIDENT and COO
Robert Buck CHAIRMAN and CEO
David Grace CHIEF FINANCIAl OFFICER
Cash flow from operations increased to $87.6 million from $49.6 million in 2008.
We continued to reduce our outstanding debt and had $82.7 million of cash on
hand at the end of 2009, compared to $26.0 million at the end of 2008.
We are especially proud of being able to decrease our expenses as a percentage
of sales and increase cash in the face of lower sales. We controlled overtime and
inventories, and managed receivables very well so as to minimize bad debts.
We also further improved our already strong relationships with our key vendors.
In addition, we continued to make substantial progress in keeping all of our
employees, facilities and equipment as safe as possible.
As the second largest company in our industry, with operations in 37 states, our
business sometimes benefits from storm activities, as we did from Hurricane Ike
during the first part of 2009. In addition, our size provided us with the ability to buy
residential roofing products in bulk ahead of the inflation the industry experienced
in 2008 and early 2009. As 2009 progressed and the benefits of the Hurricane Ike
business and the inflation diminished for us, what kept Beacon on track for a
successful year was our staff of hardworking, knowledgeable associates, who
were able to manage our business effectively despite the lower sales.
We look optimistically to a solid level of performance as the challenging economic
conditions continue into fiscal 2010. We believe we have the product mix,
geographic diversity, experienced staff, exceptional customer service, sustainable
culture and a strong balance sheet to perform well under any conditions. Should
business conditions improve, we will be ready to take full advantage of them.
We continue to look for and evaluate acquisition opportunities that will further
grow our sales and profits and create additional opportunities for our talented staff.
We are proud of our past accomplishments, including our record 2009 earnings,
and look forward to the exciting opportunities to improve our business and market
share in 2010 and beyond. We thank you for your continued support.
Paul Isabella PRESIDENT and COO
Robert Buck CHAIRMAN and CEO
David Grace CHIEF FINANCIAl OFFICER
In 2009 our people
again proved they are
the most productive
in the industry.

COMPANY VALUES
Our personal values are based upon these foundational principles:
• Honesty and integrity in everything we do.
• loyalty to each other and our company.
• Caring and compassionate regarding each other.
• Pride in a job well done.
• Morality in dealing with each other, our customers, vendors and other constituents.
Our business values encompass these traits and characteristics:
• Results oriented – It’s important to deliver on our promises.
• Strong work ethic – Something to be admired.
• Perseverance – Setbacks will occur, but this value will keep us focused on achieving our goals.
• Passion – We love our business and our people. Passion for one’s work is key to our success.
• Frugality – We take care of the resources entrusted to us. Waste is not fair to those who trust us.
• Credibility – We deliver on our commitments. We can be counted on!
• Teamwork – We recognize that we depend on each other in all we do.
• Discipline – No shortcuts. Before decisions are made, we have the discipline to research all the facts. We seek good advice before moving ahead.
• No fear
• No politics
• No secrets
• Lean and clean
The Best Environment
• Cherish people
• Honesty and integrity
• When one hurts, we all help

UNITED STATESSECURITIES AND EXCHANGE COMMISSION
Washington, D.C. 20549
FORM 10-K� ANNUAL REPORT PURSUANT TO SECTION 13 OR 15(d) OF THE
SECURITIES AND EXCHANGE ACT OF 1934For the Fiscal Year Ended September 30, 2009
� TRANSITION REPORT PURSUANT TO SECTION 13 OR 15(d) OF THESECURITIES EXCHANGE ACT OF 1934
For the Transition Period from to
Commission File Number 000-50924
BEACON ROOFING SUPPLY, INC.(Exact name of registrant as specified in its charter)
Delaware 36-4173371(State or other jurisdiction of (I.R.S. Employerincorporation or organization) Identification No.)
Address of principal executive offices: One Lakeland Park Drive, Peabody, MA 01960
Registrant’s telephone number, including area code: (978) 535-7668
Securities registered pursuant to section 12(b) of the Act:
Title of each classCommon Stock, $.01 par value
Name of each exchange on which registered:The NASDAQ Global Select Market
Securities registered pursuant to section 12(g) of the Act:None
Indicate by check mark if the registrant is a well-known seasoned issuer, as defined in Rule 405 of the SecuritiesAct. Yes � No �
Indicate by check mark if the registrant is not required to file reports pursuant to Section 13 or Section 15(d) of theAct. Yes � No �
Indicate by check mark whether the registrant (1) has filed all reports required to be filed by Section 13 or 15(d) of theSecurities and Exchange Act of 1934 during the preceding 12 months (or for such shorter period that the registrant was required tofile such reports), and (2) has been subject to such filing requirements for the past 90 days. Yes � No �
Indicate by check mark whether the registrant has submitted electronically and posted on its corporate Web site, if any, everyInteractive Data File required to be submitted and posted pursuant to Rule 405 of Regulation S-T (§232.405 of this chapter) duringthe preceding 12 months (or for such shorter period that the registrant was required to submit and post such files). � YES � NO
Indicate by check mark if disclosure of delinquent filers pursuant to Item 405 of Regulation S-K is not contained herein, andwill not be contained, to the best of Registrant’s knowledge, in definitive proxy or information statements incorporated by reference inPart III of this Form 10-K or any amendment to this Form 10-K. �
Indicate by check mark whether the registrant is a large accelerated filer, an accelerated filer, a non-accelerated filer or asmaller reporting company. See definition of ‘‘large accelerated filer,’’ ‘‘accelerated filer’’ and ‘‘smaller reporting company’’ inRule 12b-2 of the Exchange Act. (Check one):
Large accelerated filer � Accelerated filer � Non-accelerated filer � Smaller reporting company �(do not check if a
smaller reporting company)
Indicate by check mark whether the registrant is a shell company (as defined in Rule 12b-2 of the ExchangeAct). Yes � No �
The aggregate market value of the voting stock (common stock) held by non-affiliates of the registrant as of the end of thesecond quarter ended March 31, 2009 was $583,763,636.
The number of shares of common stock outstanding as of November 1, 2009 was 45,265,967.
DOCUMENTS INCORPORATED BY REFERENCE
The information required by Part III (Items 10, 11, 12, 13 and 14) will be incorporated by reference from the Registrant’sdefinitive proxy statement (to be filed pursuant to Regulation 14A).


Table of Contents
BEACON ROOFING SUPPLY, INC.Index to Annual Report
on Form 10-K
Year Ended September 30, 2009
PART I . . . . . . . . . . . . . . . . . . . . . . . . . . . . . . . . . . . . . . . . . . . . . . . . . . . . . . . . . . . . . . . . . . . 1
Item 1. Business . . . . . . . . . . . . . . . . . . . . . . . . . . . . . . . . . . . . . . . . . . . . . . . . . . . . . . . . . 1
Item 1A. Risk Factors . . . . . . . . . . . . . . . . . . . . . . . . . . . . . . . . . . . . . . . . . . . . . . . . . . . . . . 11
Item 1B. Unresolved Staff Comments . . . . . . . . . . . . . . . . . . . . . . . . . . . . . . . . . . . . . . . . . . 14
Item 2. Properties . . . . . . . . . . . . . . . . . . . . . . . . . . . . . . . . . . . . . . . . . . . . . . . . . . . . . . . . 14
Item 3. Legal Proceedings . . . . . . . . . . . . . . . . . . . . . . . . . . . . . . . . . . . . . . . . . . . . . . . . . . 15
Item 4. Submission of Matters to a Vote of Security Holders . . . . . . . . . . . . . . . . . . . . . . . . . 15
PART II . . . . . . . . . . . . . . . . . . . . . . . . . . . . . . . . . . . . . . . . . . . . . . . . . . . . . . . . . . . . . . . . . . 16
Item 5. Market for Registrant’s Common Equity, Related Stockholder Matters and IssuerPurchases of Equity Securities . . . . . . . . . . . . . . . . . . . . . . . . . . . . . . . . . . . . . . . 16
Item 6. Selected Financial Data . . . . . . . . . . . . . . . . . . . . . . . . . . . . . . . . . . . . . . . . . . . . . . 18
Item 7. Management’s Discussion and Analysis of Financial Condition and Results ofOperations . . . . . . . . . . . . . . . . . . . . . . . . . . . . . . . . . . . . . . . . . . . . . . . . . . . . . 20
Item 7A. Quantitative and Qualitative Disclosures About Market Risk . . . . . . . . . . . . . . . . . . . 39
Item 8. Financial Statements and Supplementary Data . . . . . . . . . . . . . . . . . . . . . . . . . . . . . 41
Item 9. Changes In and Disagreements with Accountants on Accounting and FinancialDisclosure . . . . . . . . . . . . . . . . . . . . . . . . . . . . . . . . . . . . . . . . . . . . . . . . . . . . . . 70
Item 9A. Controls and Procedures . . . . . . . . . . . . . . . . . . . . . . . . . . . . . . . . . . . . . . . . . . . . . 70
Item 9B. Other Information . . . . . . . . . . . . . . . . . . . . . . . . . . . . . . . . . . . . . . . . . . . . . . . . . 72
PART III . . . . . . . . . . . . . . . . . . . . . . . . . . . . . . . . . . . . . . . . . . . . . . . . . . . . . . . . . . . . . . . . . 73
PART IV . . . . . . . . . . . . . . . . . . . . . . . . . . . . . . . . . . . . . . . . . . . . . . . . . . . . . . . . . . . . . . . . . 73
Item 15. Exhibits and Financial Statement Schedules . . . . . . . . . . . . . . . . . . . . . . . . . . . . . . . 73
i

Forward-looking statements
The matters discussed in this Form 10-K that are forward-looking statements are based on currentmanagement expectations that involve substantial risks and uncertainties, which could cause actualresults to differ materially from the results expressed in, or implied by, these forward-lookingstatements. These statements can be identified by the fact that they do not relate strictly to historical orcurrent facts. They use words such as ‘‘aim,’’ ‘‘anticipate,’’ ‘‘believe,’’ ‘‘could,’’ ‘‘estimate,’’ ‘‘expect,’’‘‘intend,’’ ‘‘may,’’ ‘‘plan,’’ ‘‘project,’’ ‘‘should,’’ ‘‘will be,’’ ‘‘will continue,’’ ‘‘will likely result,’’ ‘‘would’’and other words and terms of similar meaning in conjunction with a discussion of future operating orfinancial performance. You should read statements that contain these words carefully, because theydiscuss our future expectations, contain projections of our future results of operations or of ourfinancial position or state other ‘‘forward-looking’’ information.
We believe that it is important to communicate our future expectations to our investors. However,there are events in the future that we are not able to accurately predict or control. The factors listedunder Item 1A, Risk Factors, as well as any cautionary language in this Form 10-K, provide examplesof risks, uncertainties and events that may cause our actual results to differ materially from theexpectations we describe in our forward-looking statements. Although we believe that our expectationsare based on reasonable assumptions, actual results may differ materially from those in the forwardlooking statements as a result of various factors, including, but not limited to, those described underItem 1A, Risk Factors and elsewhere in this Form 10-K.
Forward-looking statements speak only as of the date of this Form 10-K. Except as required underfederal securities laws and the rules and regulations of the SEC, we do not have any intention, and donot undertake, to update any forward-looking statements to reflect events or circumstances arising afterthe date of this Form 10-K, whether as a result of new information, future events or otherwise. As aresult of these risks and uncertainties, readers are cautioned not to place undue reliance on theforward-looking statements included in this Form 10-K or that may be made elsewhere from time totime by or on behalf of us. All forward-looking statements attributable to us are expressly qualified bythese cautionary statements.
ii

PART I
ITEM 1. BUSINESS
Overview
We are one of the largest distributors of residential and non-residential roofing materials in theUnited States and Canada. We also distribute other complementary building materials, including siding,windows, specialty lumber products and waterproofing systems for residential and nonresidentialbuilding exteriors. We currently operate 172 branches in 37 states and 3 Canadian provinces, carryingup to 10,000 SKUs and serving more than 40,000 customers. We are a leading distributor of roofingmaterials in key metropolitan markets in the Northeast, Mid-Atlantic, Midwest, Central Plains, Southand Southwest regions of the United States and in Eastern Canada.
For the fiscal year ended September 30, 2009, residential roofing products comprised 52% of oursales, non-residential roofing products accounted for 34% of our sales, and siding, waterproofingsystems, windows, specialty lumber and other exterior building products provided the remaining 14% ofour sales.
We also provide our customers a comprehensive array of value-added services, including:
• advice and assistance to contractors throughout the construction process, including productidentification, specification and technical support;
• job site delivery, rooftop loading and logistical services;• tapered insulation design and layout services;• metal fabrication and related metal roofing design and layout services;• trade credit; and• marketing support, including project leads for contractors.
We believe the additional services we provide strengthen our relationships with our customers anddistinguish us from our competition. The vast majority of orders require at least some of these services.Our ability to provide these services efficiently and reliably can save contractors time and money. Wealso believe that our value-added services enable us to achieve attractive gross profit margins on ourproduct sales. We have earned a reputation for a high level of product availability, excellent employees,professionalism and high-quality service, including timely, accurate and safe delivery of products.
Our diverse customer base represents a significant portion of the residential and non-residentialroofing contractors in most of our markets. Reflecting the overall market for roofing products, we sellthe majority of our products to roofing contractors that are involved on a local basis in thereplacement, or re-roofing, component of the roofing industry. We utilize a branch-based operatingmodel in which branches maintain local customer relationships but benefit from centralized functionssuch as information technology, accounting, financial reporting, credit, purchasing, legal and taxservices. This allows us to provide customers with specialized products and personalized local servicestailored to a geographic region, while benefiting from the resources and scale efficiencies of a nationaldistributor.
We have achieved our growth through a combination of sixteen strategic and complementaryacquisitions between 1999 and 2009, opening new branch locations, acquiring branches and broadeningour product offering. We have grown from $127.0 million in sales in fiscal year 1999 to $1.734 billion insales in fiscal year 2009, which represents a compound annual growth rate of 29.9%. Our internalgrowth, which includes growth from existing and newly opened branches but excludes growth fromacquired branches, was 4.1% per annum over the same period. Acquired branches are excluded frominternal growth measures until they have been under our ownership for at least four full fiscal quartersat the start of the reporting period. During this eleven-year period, we opened thirty-five new branchlocations (of which we have only closed one), while our same store sales increased an average of 0.7%
1

per annum. Same store sales are defined as the aggregate sales from branches open for the entirecomparable annual periods within the eleven-year period. Income from operations has increased from$8.5 million in fiscal year 1999 to $109.2 million in fiscal year 2009, which represents a compoundannual growth rate of 29.1%. We believe that our proven business model can deliver industry-leadinggrowth and operating profit margins.
In fiscal year 2009, we had percentage changes in sales and income from operations of �2.8% and15.3%, respectively, over fiscal year 2008. Both fiscal years 2009 and 2008 had 253 business days. Wealso opened three new branches, closed six branches, and did not acquire any branches during fiscalyear 2009.
Our annual report on Form 10-K, quarterly reports on Form 10-Q, current reports on Form 8-K,and amendments to those reports filed or furnished pursuant to Section 13(a) or 15(d) of the SecuritiesExchange Act of 1934 are available free of charge on our website at www.beaconroofingsupply.com assoon as reasonably practical after we electronically file such reports with, or furnish them to, theSecurities and Exchange Commission.
History
Our predecessor, Beacon Sales Company, Inc., was founded in Charlestown, Massachusetts (a partof Boston) in 1928. In 1984, when our former Chairman Andrew Logie acquired Beacon SalesCompany with other investors, Beacon operated three distribution facilities and generatedapproximately $16 million in annual revenue. In August 1997, Code, Hennessy & Simmons III, L.P., aChicago-based private equity fund, and certain members of management, purchased Beacon SalesCompany to use it as a platform to acquire leading regional roofing materials distributors throughoutthe United States and Canada. At the time of the purchase by Code Hennessy and management,Beacon Sales Company operated seven branches in New England and generated approximately$72 million of revenue annually, primarily from the sale of non-residential roofing products. Since 1997,we have made seventeen strategic and complementary acquisitions. Also since 1997, we have opened atotal of thirty-six new branches (of which we have only closed one). We have also expanded ourproduct offerings to offer more residential roofing products and complementary exterior buildingmaterials and related services. Our strategic acquisitions, branch expansions, and product lineextensions have increased the diversity of both our customer base and local market focus and generatedcost savings through increased purchasing power and reduced overhead expenses as a percentage of netsales. We completed an initial public offering (‘‘IPO’’) and became a public company in September2004, and completed a follow-on stock offering in December 2005.
We were incorporated in Delaware in 1997. Our principal executive offices are located at OneLakeland Park Drive, Peabody, MA 01960 and our telephone number is (978) 535-7668. Our Internetwebsite address is www.beaconroofingsupply.com.
U.S. Industry Overview
The U.S. roofing market, based upon manufacturer sales to distributors and others, was estimatedto be approximately $13.7 billion in 2007, which is the latest industry information available to us, and isprojected to grow 2.6% annually through 2012 to $15.6 billion. We believe this rate of growth is withinthe range the stable long-term growth rates in the industry over the past 40 years.
The U.S. roofing market can be separated into two categories: the residential roofing market andthe non-residential roofing market. The residential roofing market accounted for approximately 62% ofthe total U.S. market by unit volume (46% of total dollar demand) in 2007. Through 2012, residentialroofing construction is expected to grow faster than non-residential roofing construction as residentialconstruction is projected to rebound from current low levels.
2

Over 70% of expenditures in the roofing market are for re-roofing projects, with the balance beingfor new construction. Re-roofing projects are generally considered maintenance and repair expendituresand are less likely than new construction projects to be postponed during periods of recession or sloweconomic growth. As a result, demand for roofing products is less volatile than overall demand forconstruction products.
Regional variations in economic activity influence the level of demand for roofing products acrossthe United States. Of particular importance are regional differences in the level of new homeconstruction and renovation, since the residential market for roofing products accounts forapproximately 62% of demand. Demographic trends, including population growth and migration,contribute to regional variations in residential demand for roofing products through their influence onregional housing starts and existing home sales.
Roofing distributors
Wholesale distribution is the dominant distribution channel for both residential and nonresidentialroofing products. Wholesale roofing product distributors serve the important role of facilitating thepurchasing relationships between roofing materials manufacturers and thousands of contractors.Wholesale distributors also maintain localized inventories, extend trade credit, give product advice andprovide delivery and logistics services.
Despite some recent consolidation, the roofing materials distribution industry remains highlyfragmented. The industry is characterized by a large number of small and local regional participants. Asa result of their small size, many of these distributors lack the corporate, operating and ITinfrastructure required to compete effectively.
Residential roofing market
Within the residential roofing market, the re-roofing market is more than twice the size of the newroofing market, accounting for approximately 77% of the residential roofing demand in 2007, comparedto a historic rate of about 67%. Re-roofing demand is expected to continue to exceed new roofingdemand with similar share through 2012.
Driving this demand for re-roofing is an aging U.S. housing stock. Over one-third of the U.S.housing stock was built prior to 1960, with the median age of U.S. homes being over 30 years. Asphaltshingles, which dominate the residential re-roofing market with over an 80% share, have an expecteduseful life of 15 to 20 years. A number of factors also generate re-roofing demand, including one-timeweather damage (such as Hurricanes Katrina and Rita which increased demand in 2006), improvementexpenditures and homeowners looking to upgrade their homes. Sales of existing homes can affectre-roofing demand, as some renovation decisions are made by sellers preparing their houses for saleand others made by new owners within the first year or two of occupancy.
Within the new construction portion of the residential roofing market, housing starts together withlarger average roof sizes have supported prior growth in new residential roofing demand. New housingstarts declined during 2006 through 2009, and the pace may continue at the lower levels or declinefurther in the near future.
Non-residential roofing market
Demand for roofing products used on non-residential buildings is forecast to continue to grow at asimilar rate compared to the previous five years, but slower than the expected renewed future growthof roofing products used in residential construction. In recent years up until 2009, new non-residentialroofing was the fastest-growing portion of the U.S. roofing market. However, more challengingeconomic conditions, including tighter credit markets, caused a decline in 2009 in new commercial
3

projects and, to a lesser extent, re-roofing projects, and will likely continue to influence expendituresfor non-residential roofing in the near term.
In 2007, re-roofing projects represented approximately 78% of the total non-residential demand.Re-roofing activity tends to be less cyclical than new construction and depends in part upon the typesof materials on existing roofs, their expected lifespan and intervening factors such as wind or waterdamage.
The non-residential roofing market includes an office and commercial market, an industrial marketand an institutional market. Office and commercial roofing projects is the single largest component ofthe non-residential roofing market at 54%, while industrial roofing projects, which represent 22% ofnon-residential roofing product sales, are expected to see the fastest gains in re-roofing.
The institutional market is comprised primarily of healthcare and educational constructionactivities. This market will continue to benefit from an aging baby boom population that will driveincreases in the nation’s healthcare infrastructure, as well as increasing school enrollments that willrequire new and replacement facilities.
Complementary building products
Demand for complementary building products such as siding, windows and doors for both theresidential and non-residential markets also grew in recent years. As in the roofing industry, demandfor these products is driven by the repair and remodeling market as well as the new constructionmarket.
These complementary products also significantly contribute to the overall building productsmarket. In 2007, the U.S. siding market was approximately $10.5 billion and the U.S. window and doorindustry was approximately $34.9 billion. Both of these markets have been negatively impacted by thedecline in new housing starts in recent years but are are expected to grow in line with that of theroofing industry over the next several years.
Our Strengths
We believe the sales and earnings growth we have achieved over time has been and will continueto be driven by our primary competitive strengths, which include the following:
• National scope combined with regional expertise. We believe we are the second largest roofingmaterials distributor in the United States and Canada. We utilize a branch-based operatingmodel in which branches maintain local customer relationships but benefit from centralizedfunctions such as information technology, accounting, financial reporting, credit, purchasing,legal and tax services. This allows us to provide customers with specialized products andpersonalized local services tailored to a geographic region, while benefiting from the resourcesand scale efficiencies of a national distributor.
• Diversified business model that reduces impact of economic downturns. We believe that ourbusiness is meaningfully protected in an economic downturn because of our high concentrationin re-roofing, the relative non-discretionary nature of re-roofing, the mix of our sales betweenresidential and non-residential products, our geographic and customer diversity, and the financialand operational ability we have to expand our business and obtain market share.
• Superior customer service. We believe that our high level of customer service and supportdifferentiates us from our competitors. We employ experienced salespeople who provide adviceand assistance in properly identifying products for various applications. We also provide servicessuch as safe and timely job site delivery, logistical support and marketing assistance. We believe
4

that the services provided by our employees improve our customers’ efficiency and profitabilitywhich, in turn, strengthens our customer relationships.
• Strong platform for growth and acquisition. Since 1997, we have consistently increased revenueat rates well in excess of the growth in the overall roofing materials distribution industry. Wehave expanded our business through strategic acquisitions, new branch openings, branchacquisitions and the diversification of our product offering. We have successfully acquiredcompanies and, for most of them, improved their financial and operating performance afteracquisition.
• Sophisticated IT platform. All of our locations, except for one fabrication facility, operate onthe same management information systems. We have made a significant investment in ourinformation systems, which we believe are among the most advanced in the roofing distributionindustry. These systems provide us with a consistent platform across all of our operations thathelp us achieve additional cost reductions, greater operating efficiencies, improved purchasing,pricing and inventory management and a higher level of customer service. Our systems havesubstantial capacity to handle our future growth without requiring significant additionalinvestment.
• Industry-leading management team. We believe that our key personnel, including branchmanagers, are among the most experienced in the roofing industry. Our executive officers,regional vice presidents and branch managers have an average of over 11 years of roofingindustry experience.
• Extensive product offering and strong supplier relationships. We have a product offering of upto 10,000 SKUs, representing an extensive assortment of high-quality branded products. Webelieve that our extensive product offering has been a significant factor in attracting andretaining many of our customers. Because of our significant scale, product expertise andreputation in the markets that we serve, we have established strong ties to the major residentialroofing materials manufacturers and are able to achieve substantial volume discounts.
Growth Strategies
Our objective is to become the preferred supplier of roofing and other exterior building productmaterials in the U.S. and Canadian markets while continuing to increase our revenue base andmaximize our profitability. We plan to attain these goals by executing the following strategies:
• Expand geographically through new branch openings. Significant opportunities exist to expandour geographic focus by opening additional branches in existing or contiguous regions. Since1997, we and our acquired companies have successfully entered numerous markets throughgreenfield expansion. Our strategy with respect to greenfield opportunities is to typically openbranches: (1) within our existing markets; (2) where existing customers have expanded into newmarkets; or (3) in areas that have limited or no acquisition candidates and are a good fit withour business model. At times, we have acquired small distributors with one to three branches tofill in existing regions.
• Pursue acquisitions of regional market-leading roofing materials distributors. Acquisitions arean important component of our growth strategy. We believe that there are significantopportunities to grow our business through disciplined, strategic acquisitions. With only a fewlarge, well-capitalized competitors in the industry, we believe we can continue to build on ourdistribution platform by successfully acquiring additional roofing materials distributors. Between1998 and 2007, we successfully integrated seventeen strategic and complementary acquisitions.
• Expand product and service offerings. We believe that continuing to increase the breadth of ourproduct line and customer services are effective methods of increasing sales to current customers
5

and attracting new customers. We work closely with customers and suppliers to identify newbuilding products and services, including windows, siding, waterproofing systems, insulation andmetal fabrication. In addition, we believe we can expand our business by introducing productsthat we currently only offer in certain of our markets into some of our other markets. We alsobelieve we can expand particular product sales that are stronger in certain of our markets intoour markets where those products have not sold as well (e.g. expanding nonresidential roofingsales in markets that sell mostly residential roofing).
Products and Services
Products
The ability to provide a broad range of products is essential in roofing materials distribution. Wecarry one of the most extensive arrays of high-quality branded products in the industry, enabling us todeliver products to our customers on a timely basis. We are able to fulfill approximately 95% of ourorders through our in-stock inventory as a result of the breadth and depth of our inventory at ourbranches. Our product portfolio includes residential and non-residential roofing products as well ascomplementary building products such as siding, windows and specialty lumber products. Our productlines are designed primarily to meet the requirements of both residential and non-residential roofingcontractors.
Product Portfolio
Complementary building productsResidential Non-residentialroofing products roofing products Siding Windows/Doors
Asphalt shingles Single-ply roofing Vinyl siding Vinyl windowsSynthetic slate and tile Asphalt Red, white and yellow Aluminum windowsClay tile Metal cedar siding Wood windowsConcrete tile Modified bitumen Fiber cement siding Turn-key windowsSlate Built-up roofing Soffits Wood doorsNail base insulation Cements and coatings House wraps Patio doorsMetal roofing Insulation—flat stock Vapor barriersFelt and tapered Stone veneerWood shingles and Commercial fasteners
Other Specialty Lumbershakes Metal edges andWaterproofing systems RedwoodNails and fasteners flashingsBuilding insulation Red cedar deckingMetal edgings and Skylights, smoke ventsAir barrier systems Mahogany deckingflashings and roof hatchesGypsum Pressure treated lumberPrefabricated flashings Sheet metal, includingMoldings Fire treated plywoodRidges and soffit vents copper, aluminumPatio covers Synthetic deckingGutters and and steel
PVC trim boardsdownspouts Other accessoriesMillworkOther accessoriesCustom millwork
The products that we distribute are supplied by the industry’s leading manufacturers of high-qualityroofing materials and related products, such as Alcoa, BPCO, Carlisle, CertainTeed, Dow, Firestone,GAF/Elk Materials, James Hardie, Johns Manville, Owens Corning, Simonton, Tamko, and RevereCopper.
6

In the residential market, asphalt shingles comprise the largest share of the products we sell. Webelieve that we have also developed a specialty niche in the residential roofing market by distributingproducts such as high-end shingles, copper gutters and metal roofing products, as well as specialtylumber products for residential applications, including redwood, white and red cedar shingles, and redcedar siding. Additionally, we distribute gutters, downspouts, tools, nails, vinyl siding, windows, deckingand related exterior shelter products to meet the needs of our residential roofing customers.
In the non-residential market, single-ply roofing systems comprise the largest share of ourproducts. Our single-ply roofing systems consist primarily of Ethylene Propylene Diene Monomer(synthetic rubber), or EPDM, and thermoplastic, or TPO, roofing materials and related components. Inaddition to the broad range of single-ply roofing components, we sell the insulation that is required aspart of most non-residential roofing applications. Our insulation products include tapered insulation,which has been a high-growth product line. Our remaining non-residential products include metalroofing and flashings, fasteners, fabrics, coatings, roof drains, modified bitumen, built-up roofing andasphalt.
Services
We emphasize service to our customers. We employ a knowledgeable staff of salespeople. Oursales personnel possess in-depth technical knowledge of roofing materials and applications and arecapable of providing advice and assistance to contractors throughout the construction process. Inparticular, we support our customers with the following value-added services:
• advice and assistance throughout the construction process, including product identification,specification and technical support;
• job site delivery, rooftop loading and logistical services;• tapered insulation design and layout services;• metal fabrication and related metal roofing design and layout services;• trade credit; and• marketing support, including project leads for contractors.
Customers
Our diverse customer base consists of more than 40,000 contractors, home builders, buildingowners, and other resellers primarily in the Southeast, Northeast, Central Plains, Midwest, Southwestand Mid-Atlantic regions of the United States, as well as in Eastern Canada. Our typical customervaries by end market, with relatively small contractors in the residential market and small to large-sizedcontractors in the non-residential market. To a lesser extent, our customer base includes generalcontractors, retailers and building materials suppliers.
As evidenced by the fact that a significant number of our customers have relied on us or ourpredecessors as their vendor of choice for decades, we believe that we have strong customerrelationships that our competitors cannot easily displace or replicate. No single customer accounts formore than 1.50% of our revenues.
Sales and Marketing
Sales strategy
Our sales strategy is to provide a comprehensive array of high-quality products and superior value-added services to residential and non-residential roofing contractors reliably, accurately and on time.We fulfill approximately 95% of our warehouse orders through our in-stock inventory as a result of thebreadth and depth of our inventory at our local branches. We believe that our focus on providing
7

superior value-added services and our ability to fulfill orders accurately and rapidly enables us to attractand retain customers.
Sales organization
We have attracted and retained an experienced sales force of about 900 people who areresponsible for generating revenue at the local branch level. The expertise of our salespeople helps usto increase sales to existing customers and add new customers.
Each of our branches is headed by a branch manager, who also functions as the branch’s salesmanager. In addition, each branch employs one to four outside salespeople and one to five insidesalespeople who report to their branch manager. Branches that focus on the residential market typicallystaff a larger number of outside salespeople.
The primary responsibilities of our outside salespeople are to prospect for new customers andincrease sales to existing customers. One of the ways our outside salespeople accomplish theseobjectives is by reviewing information from our proprietary LogicTrack software system, which extractsjob and bid information from construction reports and other industry news services. The system extractsinformation on construction projects in our local markets from those industry services. Once aconstruction project is identified, our design and estimating team creates job quotes, which, along withpertinent bid and job information, are readily available to our salespeople through LogicTrack. Ouroutside salespeople then contact potential customers in an effort to solicit their interest in participatingwith us in the project. Throughout this process, LogicTrack maintains a record of quoting activity, duedates, and other data to allow tracking of the projects and efficient follow-up. By seeking a contractorto ‘‘partner’’ with on a bid, we increase the likelihood that the contractor will purchase their roofingmaterials and related products from us in the event that the contractor is selected for the project.
To complement our outside sales force, we have built a strong and technically proficient insidesales staff. Our inside sales force is responsible for fielding incoming orders, providing pricingquotations and responding to customer inquiries. Our inside sales force provides vital product expertiseto our customers.
In addition to our outside and inside sales forces, we represent certain manufacturers for particularmanufacturers’ products. Currently, we have developed relationships with Carlisle, Johns Manville,Owens Corning and Firestone on this basis. We currently employ 31 representatives who act as liaisons(on behalf of property owners, architects, specifiers and consultants) between these roofing materialsmanufacturers and professional contractors.
Marketing
In order to capitalize on the local customer relationships that we have established and benefit fromthe brands developed by our regional branches, we have maintained the trade names of most of thebusinesses that we have acquired. These trade names, such as Alabama Roofing Supply, BeaconRoofing Supply Canada Company, Beacon Sales Company, Best Distributing Company, Coastal MetalService, Dealer’s Choice, Forest Siding Supply, GLACO, Groupe Bedard, JGA Beacon, LafayetteWood Works, North Coast Commercial Roofing Systems, Mississippi Roofing Supply, Pacific SupplyCompany, Quality Roofing Supply Company, Roof Depot, RSM Supply, Roofing and Sheet MetalSupply, Shelter Distribution, Southern Roof Center, The Roof Center, West End Roofing Siding andWindows, West End Lumber Company, and Wholesale Roofing Supply—are well-known in the localmarkets in which the respective branches compete and are associated with the provision of high-qualityproducts and customer service.
As a supplement to the efforts of our sales force, each of our branches communicates withresidential and non-residential contractors in their local markets through newsletters, direct mail and
8

the Internet. In order to build and strengthen relationships with customers and vendors, we sponsorand promote our own regional trade shows, which feature general business and roofing seminars forour customers and product demonstrations by our vendors. In addition, we attend numerous industrytrade shows throughout the regions in which we compete, and we are an active member of the NationalRoofing Contractors Association, as well as regional contractors’ associations.
Purchasing and Suppliers
Our status as a leader in our core geographic markets, as well as our reputation in the industry,has allowed us to forge strong relationships with numerous manufacturers of roofing materials andrelated products, including Alcoa, BPCO, Carlisle, CertainTeed, Dow, Firestone, GAF/Elk Materials,James Hardie, Johns Manville, Owens Corning, Simonton, Tamko and Revere Copper.
We are viewed by our suppliers as a key distributor due to our industry expertise, significantmarket share in our core geographic markets and the substantial volume of products that we distribute.We have significant relationships with more than 50 suppliers and maintain multiple supplierrelationships for each product line.
We manage the procurement of products through our headquarters for the vast majority of theproducts that we distribute. We believe this enables us to purchase products more economically thanmost of our competitors. Product is shipped directly by the manufacturers to our branches orcustomers.
Operations
Facilities
Our network of 172 branches serves metropolitan areas in 37 states and 3 Canadian provinces.This network has enabled us to effectively and efficiently serve a broad customer base and to achieve aleading market position in each of our core geographic markets.
Operations
Our branch-based model provides each location with a significant amount of autonomy to operatewithin the parameters of our overall business model. Operations at each branch are tailored to meetthe local needs of their customers. Depending on market needs, branches carry from about 1,000 to10,000 SKUs.
Branch managers are responsible for sales, pricing and staffing activities, and have full operationalcontrol of customer service and deliveries. We provide our branch managers with significant incentivesthat allow them to share in the profitability of their respective branches as well as the company as awhole. Personnel at our corporate operations assist the branches with purchasing, procurement, creditservices, information systems support, contract management, accounting and legal services, benefitsadministration and sales and use tax services.
Distribution/fulfillment process
Our distribution/fulfillment process is initiated upon receiving a request for a contract job order ordirect product order from a contractor. Under a contract job order, a contractor typically requestsroofing or other construction materials and technical support services. The contractor discusses theproject’s requirements with a salesperson and the salesperson provides a price quotation for thepackage of products and services. Subsequently, the salesperson processes the order and we deliver theproducts to the customer’s job site.
9

Fleet
Our distribution infrastructure supports over 400,000 deliveries annually. To accomplish this, wemaintain a dedicated owned fleet of 586 straight trucks, 251 tractors and 409 trailers. Nearly all of ourdelivery vehicles are equipped with specialized equipment, including 665 truck-mounted forklifts,cranes, hydraulic booms and conveyors, which are necessary to deliver products to rooftop job sites inan efficient and safe manner.
Our branches focus on providing materials to customers who are located within a two-hour radiusof their respective facilities. We typically make deliveries five days per week.
Management information systems
We have fully integrated management information systems. Our systems are consistentlyimplemented across our branches and acquired businesses are promptly moved to our system followingacquisition. Our systems support every major internal operational function, except payroll, providingcomplete integration of purchasing, receiving, order processing, shipping, inventory management, salesanalysis and accounting. The same databases are shared within the systems, allowing our branches toeasily acquire products from other branches or schedule deliveries by other branches, greatly enhancingour customer service. Our systems also include a sophisticated pricing matrix which allows us to refinepricing by region, branch, type of customer, customer, or even a specific customer project. In addition,our systems allow us to monitor all branch and regional performance centrally. We have centralizedmany functions to leverage our size, including accounts payable, insurance, employee benefits, vendorrelations, and banking.
All of our branches are connected to our IBM AS400 computer network by secure Internetconnections or private data lines. We maintain a second IBM AS400 as a disaster recovery system, andinformation is backed up to this system throughout each business day. We have the capability ofelectronically switching our domestic operations to the disaster recovery system.
We have created a financial reporting package that allows us to send branches information theycan use to compare branch by branch financial performance, which we believe is essential to operatingeach branch efficiently and more profitably. We have also developed a benchmarking report whichenables us to compare all of our branches’ performance in 12 critical areas.
We can place purchase orders electronically with some of our major vendors. The vendors thentransmit their invoices electronically to us. Our system automatically matches these invoices with therelated purchase orders and schedules payment. We have the capability to handle customer processingelectronically, although most customers prefer ordering through our sales force.
Government Regulations
We are subject to regulation by various federal, state, provincial and local agencies. These agenciesinclude the Environmental Protection Agency, Department of Transportation, Interstate CommerceCommission, Occupational Safety and Health Administration and Department of Labor and EqualEmployment Opportunity Commission. We believe we are in compliance in all material respects withexisting applicable statutes and regulations affecting environmental issues and our employment,workplace health and workplace safety practices.
Competition
Although we are one of the two largest roofing materials distributors in the United States andCanada, the U.S. roofing supply industry is highly competitive. The vast majority of our competitioncomes from local and regional roofing supply distributors, and, to a much lesser extent, other buildingsupply distributors and ‘‘big box’’ retailers. Among distributors, we compete against a small number of
10

large distributors and many small, local, privately-owned distributors. The principal competitive factorsin our business include, but are not limited to, the availability of materials and supplies; technicalproduct knowledge and expertise; advisory or other service capabilities; pricing of products; andavailability of credit. We generally compete on the basis of the quality of our services, product quality,and, to a lesser extent, price. We compete not only for customers within the roofing supply industry butalso for personnel.
Employees
As of September 30, 2009, we had 2,258 employees, consisting of 666 in sales and marketing,257 in branch management, including supervisors, 1,046 warehouse workers, helpers and drivers, and289 general and administrative personnel. We believe that our employee relations are good.Twenty-four employees are currently represented by labor unions.
Order Backlog
Order backlog is not a material aspect of our business and no material portion of our business issubject to government contracts.
Seasonality
In general, sales and net income are highest during our first, third and fourth fiscal quarters, whichrepresent the peak months of construction, especially in our branches in the northeastern U.S. and inCanada. Our sales are substantially lower during the second quarter, when we usually incur net losses.These quarterly fluctuations have diminished as we have diversified into the southern regions of theUnited States.
Geographic Data
For geographic data about our business, please see Note 15 to our Consolidated FinancialStatements included elsewhere in this Form 10-K.
ITEM 1A. RISK FACTORS
You should carefully consider the risks and uncertainties described below and other informationincluded in this Form 10-K in evaluating us and our business. If any of the events described below occur,our business and financial results could be adversely affected in a material way. This could cause thetrading price of our common stock to decline, perhaps significantly.
We may not be able to effectively integrate newly acquired businesses into our operations or achieve expectedprofitability from our acquisitions.
Our growth strategy includes acquiring other distributors of roofing materials and complementaryproducts. Acquisitions involve numerous risks, including:
• Unforeseen difficulties in integrating operations, technologies, services, accounting andpersonnel;
• diversion of financial and management resources from existing operations;• unforeseen difficulties related to entering geographic regions where we do not have prior
experience;• potential loss of key employees;• unforeseen liabilities associated with businesses acquired; and• inability to generate sufficient revenue to offset acquisition or investment costs.
11

As a result, if we fail to evaluate and execute acquisitions properly, we might not achieve theanticipated benefits of these acquisitions, and we may incur costs in excess of what we anticipate. Theserisks may be greater in the case of larger acquisitions.
We may not be able to successfully identify acquisition candidates, which would slow our growth rate.
We continually seek additional acquisition candidates in selected markets and from time to timeengage in exploratory discussions with potential candidates. If we are not successful in finding attractiveacquisition candidates that we can acquire on satisfactory terms, or if we cannot complete acquisitionsthat we identify, it is unlikely that we will sustain the historical growth rates of our business.
An inability to obtain the products that we distribute could result in lost revenues and reduced margins anddamage relationships with customers.
We distribute roofing and other exterior building materials that are manufactured by a number ofmajor suppliers. Although we believe that our relationships with our suppliers are strong and that wewould have access to similar products from competing suppliers should products be unavailable fromcurrent sources, any disruption in our sources of supply, particularly of the most commonly sold items,could result in a loss of revenues and reduced margins and damage relationships with customers.Supply shortages may occur as a result of unanticipated demand or production or delivery difficulties.When shortages occur, roofing material suppliers often allocate products among distributors.
Loss of key personnel or our inability to attract and retain new qualified personnel could hurt our ability tooperate and grow successfully.
Our future success is highly dependent upon the services of Robert Buck, Chief Executive Officerand Chairman of the Board, Paul Isabella, President and Chief Operating Officer, and David Grace,Chief Financial Officer. Our success will continue to depend to a significant extent on our executiveofficers and key management personnel, including our regional vice presidents. We do not have keyman life insurance covering any of our executive officers. We may not be able to retain our executiveofficers and key personnel or attract additional qualified management. The loss of any of our executiveofficers or other key management personnel, or our inability to recruit and retain qualified personnel,could hurt our ability to operate and make it difficult to execute our acquisition and internal growthstrategies.
A change in vendor rebates could adversely affect our income and gross margins.
The terms on which we purchase product from many of our vendors entitle us to receive a rebatebased on the volume of our purchases. These rebates effectively reduce our costs for products. Ifmarket conditions change, vendors may adversely change the terms of some or all of these programs.Although these changes would not affect the net recorded costs of product already purchased, it maylower our gross margins on products we sell or income we realize in future periods.
Cyclicality in our business could result in lower revenues and reduced profitability.
We sell a portion of our products for new residential and non-residential construction. Thestrength of these markets depends on new housing starts and business investment, which are a functionof many factors beyond our control, including credit availability, interest rates, employment levels, andconsumer confidence. Downturns in the regions and markets we serve could result in lower revenuesand, since many of our expenses are fixed, lower profitability. New housing starts declined during 2006through 2009 and the pace may continue at the lower levels or decline further. Commercialconstruction activity, which was high in recent years until 2009, when it declined, could continue todecline as well. Tougher economic conditions, including tighter availability of commercial credit,
12

contributed to the 2009 decline in new commercial projects and, to a lesser extent, a decline inreroofing projects, and may continue to have a negative effect on current and future levels ofconstruction, especially new non-residential construction.
Seasonality in the construction and re-roofing industry generally results in second quarter losses.
Our second quarter is typically adversely affected by winter construction cycles and weatherpatterns in colder climates as the level of activity in the new construction and re-roofing marketsdecreases. Because many of our expenses remain relatively fixed throughout the year, we generallyrecord a loss during our second quarter. We expect that these seasonal variations will continue in thefuture.
If we encounter difficulties with our management information systems, we could experience problems withinventory, collections, customer service, cost control and business plan execution.
We believe our management information systems are a competitive advantage in maintaining ourleadership position in the roofing distribution industry. If we experience problems with ourmanagement information systems, we could experience, among other things, product shortages and/oran increase in accounts receivable. Any failure by us to properly maintain our management informationsystems could adversely impact our ability to attract and serve customers and could cause us to incurhigher operating costs and experience delays in the execution of our business plan.
An impairment of goodwill and/or other intangible assets could reduce net income.
Acquisitions frequently result in the recording of goodwill and other intangible assets. AtSeptember 30, 2009, goodwill represented approximately 34% of our total assets. Goodwill is notamortized for financial reporting purposes and is subject to impairment testing at least annually using afair-value based approach. The identification and measurement of goodwill impairment involves theestimation of the fair value of our reporting units. Our accounting for impairment contains uncertaintybecause management must use judgment in determining appropriate assumptions to be used in themeasurement of fair value. We determine the fair values of our reporting units by using both a marketand discounted cash flow approach.
We evaluate the recoverability of goodwill for impairment in between our annual tests when eventsor changes in circumstances indicate that the carrying amount of goodwill may not be recoverable. Anyimpairment of goodwill will reduce net income in the period in which the impairment is recognized.
We might need to raise additional capital, which may not be available, thus limiting our growth prospects.
We may require additional equity or further debt financing in order to consummate an acquisitionor for additional working capital for expansion or if we suffer losses. In the event additional equity ordebt financing is unavailable to us, we may be unable to expand or make acquisitions and our stockprice may decline as a result of the perception that we have more limited growth prospects.
Further disruptions in the capital and credit markets may impact the availability of credit and businessconditions.
If the financial institutions that have extended credit commitments to us are adversely affected bythe conditions of the capital and credit markets, they may become unable to fund borrowings underthose credit commitments, which could have an adverse impact on our financial condition and ourability to borrow funds, if needed, for working capital, acquisitions, capital expenditures and othercorporate purposes.
13

Continued market disruptions could cause broader economic downturns, which may lead to lowerdemand for our products and increased incidence of customers’ inability to pay their accounts. Further,bankruptcies or similar events by customers may cause us to incur bad debt expense at levels higherthan historically experienced. Also, our suppliers may potentially be impacted, causing disruption ordelay of product availability. These events would adversely impact our results of operations, cash flowsand financial position.
ITEM 1B. UNRESOLVED STAFF COMMENTS
None.
ITEM 2. PROPERTIES
We lease 186 facilities, including our headquarters and other support facilities, throughout theUnited States and Eastern Canada. These leased facilities range in size from approximately 3,400square feet to 137,000 square feet. We sublease one facility. In addition, we own thirteen sales/warehouse facilities located in Manchester, New Hampshire; Reading, Pennsylvania; Montreal,Quebec (2); Sainte-Foy, Quebec; Delson, Quebec; Salisbury, Maryland; Hartford, Connecticut;Cranston, Rhode Island; Lancaster, Pennsylvania; Jacksonville, Florida; Easton, Maryland; andManassas, Virginia. These owned facilities range in size from 11,500 square feet to 68,000 square feet.All of the owned facilities are mortgaged to our senior lenders. We believe that our properties are ingood operating condition and adequately serve our current business operations.
As of November 1, 2009, our 172 branches, a few with multiple leased facilities, and 8 otherfacilities were located in the following states and provinces:
Number ofState Branches Other
Alabama . . . . . . . . . . . . . . . . . . . . . . . . . . . . . . . . . . . . . . . . . . 4Arkansas . . . . . . . . . . . . . . . . . . . . . . . . . . . . . . . . . . . . . . . . . . 4California . . . . . . . . . . . . . . . . . . . . . . . . . . . . . . . . . . . . . . . . . . 4Colorado . . . . . . . . . . . . . . . . . . . . . . . . . . . . . . . . . . . . . . . . . . 1Connecticut . . . . . . . . . . . . . . . . . . . . . . . . . . . . . . . . . . . . . . . . 2 1Delaware . . . . . . . . . . . . . . . . . . . . . . . . . . . . . . . . . . . . . . . . . . 2Florida . . . . . . . . . . . . . . . . . . . . . . . . . . . . . . . . . . . . . . . . . . . . 2Georgia . . . . . . . . . . . . . . . . . . . . . . . . . . . . . . . . . . . . . . . . . . . 7Illinois . . . . . . . . . . . . . . . . . . . . . . . . . . . . . . . . . . . . . . . . . . . . 7Indiana . . . . . . . . . . . . . . . . . . . . . . . . . . . . . . . . . . . . . . . . . . . 6Iowa . . . . . . . . . . . . . . . . . . . . . . . . . . . . . . . . . . . . . . . . . . . . . 1Kansas . . . . . . . . . . . . . . . . . . . . . . . . . . . . . . . . . . . . . . . . . . . . 4Kentucky . . . . . . . . . . . . . . . . . . . . . . . . . . . . . . . . . . . . . . . . . . 4Louisiana . . . . . . . . . . . . . . . . . . . . . . . . . . . . . . . . . . . . . . . . . . 4 2Maine . . . . . . . . . . . . . . . . . . . . . . . . . . . . . . . . . . . . . . . . . . . . 1Maryland . . . . . . . . . . . . . . . . . . . . . . . . . . . . . . . . . . . . . . . . . . 14 1Massachusetts . . . . . . . . . . . . . . . . . . . . . . . . . . . . . . . . . . . . . . . 8Michigan . . . . . . . . . . . . . . . . . . . . . . . . . . . . . . . . . . . . . . . . . . 4Minnesota . . . . . . . . . . . . . . . . . . . . . . . . . . . . . . . . . . . . . . . . . 2Mississippi . . . . . . . . . . . . . . . . . . . . . . . . . . . . . . . . . . . . . . . . . 2Missouri . . . . . . . . . . . . . . . . . . . . . . . . . . . . . . . . . . . . . . . . . . . 6Nebraska . . . . . . . . . . . . . . . . . . . . . . . . . . . . . . . . . . . . . . . . . . 3New Hampshire . . . . . . . . . . . . . . . . . . . . . . . . . . . . . . . . . . . . . 1New Jersey . . . . . . . . . . . . . . . . . . . . . . . . . . . . . . . . . . . . . . . . . 1
14

Number ofState Branches Other
New Mexico . . . . . . . . . . . . . . . . . . . . . . . . . . . . . . . . . . . . . . . . 1New York . . . . . . . . . . . . . . . . . . . . . . . . . . . . . . . . . . . . . . . . . 1North Carolina . . . . . . . . . . . . . . . . . . . . . . . . . . . . . . . . . . . . . . 10Ohio . . . . . . . . . . . . . . . . . . . . . . . . . . . . . . . . . . . . . . . . . . . . . 4Oklahoma . . . . . . . . . . . . . . . . . . . . . . . . . . . . . . . . . . . . . . . . . 3Pennsylvania . . . . . . . . . . . . . . . . . . . . . . . . . . . . . . . . . . . . . . . . 12Rhode Island . . . . . . . . . . . . . . . . . . . . . . . . . . . . . . . . . . . . . . . 1South Carolina . . . . . . . . . . . . . . . . . . . . . . . . . . . . . . . . . . . . . . 3Tennessee . . . . . . . . . . . . . . . . . . . . . . . . . . . . . . . . . . . . . . . . . . 4Texas . . . . . . . . . . . . . . . . . . . . . . . . . . . . . . . . . . . . . . . . . . . . . 19Vermont . . . . . . . . . . . . . . . . . . . . . . . . . . . . . . . . . . . . . . . . . . 1Virginia . . . . . . . . . . . . . . . . . . . . . . . . . . . . . . . . . . . . . . . . . . . 8 3West Virginia . . . . . . . . . . . . . . . . . . . . . . . . . . . . . . . . . . . . . . . 2
Subtotal—U.S. . . . . . . . . . . . . . . . . . . . . . . . . . . . . . . . . . . . . . . 163 7
Canadian ProvincesManitoba . . . . . . . . . . . . . . . . . . . . . . . . . . . . . . . . . . . . . . . . . . 1Ontario . . . . . . . . . . . . . . . . . . . . . . . . . . . . . . . . . . . . . . . . . . . 4Quebec . . . . . . . . . . . . . . . . . . . . . . . . . . . . . . . . . . . . . . . . . . . 4 1
Subtotal—Canada . . . . . . . . . . . . . . . . . . . . . . . . . . . . . . . . . . . . 9 1
Total . . . . . . . . . . . . . . . . . . . . . . . . . . . . . . . . . . . . . . . . . . . . . 172 8
ITEM 3. LEGAL PROCEEDINGS
From time to time, we are involved in lawsuits that are brought against us in the normal course ofbusiness. We are not currently a party to any legal proceedings that would be expected, eitherindividually or in the aggregate, to have a material adverse effect on our business or financialcondition.
ITEM 4. SUBMISSION OF MATTERS TO A VOTE OF SECURITY HOLDERS
No matters were submitted to a vote of our security holders during the fourth quarter of the yearended September 30, 2009.
15

PART II
ITEM 5. MARKET FOR REGISTRANT’S COMMON EQUITY, RELATED STOCKHOLDERMATTERS AND ISSUER PURCHASES OF EQUITY SECURITIES
Our common stock trades on The NASDAQ Global Select Market under the symbol ‘‘BECN’’.The following table lists quarterly information on the price range of our common stock based on thehigh and low reported sale prices for our common stock as reported by NASDAQ for the periodsindicated below:
High Low
Year ended September 30, 2008:
First quarter . . . . . . . . . . . . . . . . . . . . . . . . . . . . . . . . . . . . . . $12.17 $ 7.03Second quarter . . . . . . . . . . . . . . . . . . . . . . . . . . . . . . . . . . . . . $10.00 $ 7.30Third quarter . . . . . . . . . . . . . . . . . . . . . . . . . . . . . . . . . . . . . . $12.97 $ 9.59Fourth quarter . . . . . . . . . . . . . . . . . . . . . . . . . . . . . . . . . . . . . $17.72 $10.06
Year ended September 30, 2009:
First quarter . . . . . . . . . . . . . . . . . . . . . . . . . . . . . . . . . . . . . . $14.84 $ 9.72Second quarter . . . . . . . . . . . . . . . . . . . . . . . . . . . . . . . . . . . . . $14.99 $10.57Third quarter . . . . . . . . . . . . . . . . . . . . . . . . . . . . . . . . . . . . . . $17.65 $13.08Fourth quarter . . . . . . . . . . . . . . . . . . . . . . . . . . . . . . . . . . . . . $17.15 $14.05
There were 30 holders of record of our common stock as of November 1, 2009.
Purchases of Equity Securities by the Issuer and Affiliated Purchasers
No purchases of our equity securities were made by us or any affiliated entity during the fourthquarter of the year ended September 30, 2009.
Recent Sales of Unregistered Securities
None.
Dividends
We have not paid cash dividends on our common stock and do not anticipate paying dividends inthe foreseeable future. Our board of directors currently intends to retain any future earnings forreinvestment in our business. Our revolving credit facilities currently prohibit the payment of dividendswithout the prior written consent of our lender. Any future determination to pay dividends will be atthe discretion of our board of directors and will be dependent upon our results of operations and cashflows, our financial position and capital requirements, general business conditions, legal, tax, regulatoryand any contractual restrictions on the payment of dividends, and any other factors our board ofdirectors deems relevant.
Performance Graph
The following graph compares the cumulative total shareholder return (including reinvestment ofdividends) of Beacon Roofing Supply, Inc.’s common stock based on its market prices, beginning withthe start of fiscal year 2005 and each fiscal year thereafter, with (i) the Nasdaq Index and (ii) theS&P 1500 Building Products Index.
16

25NOV200914373268
Comparison of Cumulative Total Return
9/25/04
$250
$200
$150
$100
$50
$0
9/24/05 9/30/06 9/30/07 9/30/08 9/30/09
S&P 1500 Building Products IndexNasdaq IndexBeacon Roofing Supply, Inc.
The line graph assumes that $100 was invested in our common stock, the Nasdaq Index and theS&P 1500 Building Products Index on September 25, 2004. The closing price of our common stock onSeptember 30, 2009 was $15.98. The stock price performance of Beacon Roofing Supply, Inc.’s commonstock depicted in the graph above represents past performance only and is not necessarily indicative offuture performance.
17

ITEM 6. SELECTED FINANCIAL DATA
You should read the following selected financial information together with our financial statementsand related notes and ‘‘Management’s discussion and analysis of financial condition and results ofoperations’’ also included in this Form 10-K. We have derived the statement of operations data for theyears ended September 30, 2009, September 30, 2008, and September 30, 2007, and the balance sheetinformation at September 30, 2009 and September 30, 2008, from our audited financial statementsincluded in this Form 10-K. We have derived the statements of operations data for the years endedSeptember 30, 2006 and September 24, 2005, and the balance sheet data at September 30, 2007,September 30, 2006 and September 24, 2005, from our audited financial statements not included in thisForm 10-K.
Statement of operations data
Fiscal year ended
September 30,September 30, September 30, September 30, 2006 September 24,
(Dollars in Thousands) 2009 2008 2007 (53 weeks) 2005
Net sales . . . . . . . . . . . . . . . . . . . . . . . $ 1,733,967 $ 1,784,495 $ 1,645,785 $ 1,500,637 $ 850,928Cost of products sold . . . . . . . . . . . . . . 1,322,845 1,364,487 1,271,868 1,136,500 643,733
Gross profit . . . . . . . . . . . . . . . . . . . . 411,122 420,008 373,917 364,137 207,195Operating expenses . . . . . . . . . . . . . . . 301,913 325,298 304,109 263,836 146,476
Income from operations . . . . . . . . . . . . 109,209 94,710 69,808 100,301 60,719Interest expense . . . . . . . . . . . . . . . . . (22,887) (25,904) (27,434) (19,461) (4,911)Loss on early retirement of debt . . . . . — — — — (915)Income taxes . . . . . . . . . . . . . . . . . . . . (33,904) (28,500) (17,095) (31,529) (21,976)
Net income . . . . . . . . . . . . . . . . . . . . . $ 52,418 $ 40,306 $ 25,279 $ 49,311 $ 32,917
Net income per shareBasic . . . . . . . . . . . . . . . . . . . . . . . . $ 1.16 $ 0.91 $ 0.57 $ 1.15 $ 0.83Diluted . . . . . . . . . . . . . . . . . . . . . . $ 1.15 $ 0.90 $ 0.56 $ 1.12 $ 0.80
Weighted average shares outstandingBasic . . . . . . . . . . . . . . . . . . . . . . . . 45,007,313 44,346,293 44,083,915 42,903,279 39,716,933Diluted . . . . . . . . . . . . . . . . . . . . . . 45,493,786 44,959,357 44,971,932 44,044,769 41,118,944
Other financial and operating data:Depreciation and amortization . . . . . . . $ 30,389 $ 34,240 $ 32,863 $ 23,792 $ 8,748Capital expenditures (excluding
acquisitions) . . . . . . . . . . . . . . . . . . $ 13,656 $ 5,739 $ 23,132 $ 19,063 $ 10,811Number of branches at end of period . . 172 175 178 155 84
18

Balance sheet data
September 30, September 30, September 30, September 30, September 24,(In Thousands) 2009 2008 2007 2006 2005
Cash and cash equivalents . . . . . . . . . $ 82,742 $ 26,038 $ 6,469 $ 1,847 $ —
Total assets . . . . . . . . . . . . . . . . . . . $1,040,786 $1,067,816 $1,006,660 $839,890 $386,987
Current debt and warrant derivativeliability:Cash overdraft . . . . . . . . . . . . . . . . . $ — $ — $ — $ — $ 6,107
Borrowings under revolving lines ofcredit, current portions of long-termdebt and other obligations . . . . . . . . . 15,092 19,926 34,773 6,657 6,348
$ 15,092 $ 19,926 $ 34,773 $ 6,657 $ 12,455
Long-term debt, net of current portions:Borrowings under revolving lines of
credit . . . . . . . . . . . . . . . . . . . . . . $ — $ — $ — $229,752 $ 63,769Senior notes payable and other
obligations . . . . . . . . . . . . . . . . . . 322,090 332,500 343,000 69,282 20,156Other long-term obligations . . . . . . . 16,257 25,143 31,270 10,610 1,668
$ 338,347 $ 357,643 $ 374,270 $309,644 $ 85,593
Stockholders’ equity . . . . . . . . . . . . . . . $ 423,573 $ 366,701 $ 323,850 $291,169 $178,745
19

ITEM 7. MANAGEMENT’S DISCUSSION AND ANALYSIS OF FINANCIAL CONDITION ANDRESULTS OF OPERATIONS
The following discussion should be read in conjunction with our consolidated financial statements andrelated notes and other financial information appearing elsewhere in this Form 10-K. In addition tohistorical information, the following discussion and other parts of this Form 10-K contain forward-lookinginformation that involves risks and uncertainties. Our actual results could differ materially from thoseanticipated by this forward-looking information due to the factors discussed under ‘‘Risk factors,’’ ‘‘Forward-looking statements’’ and elsewhere in this Form 10-K. Certain tabular information will not foot due torounding.
Overview
We are one of the largest distributors of residential and non-residential roofing materials in theUnited States and Canada. We are also a distributor of other building materials, including siding,windows, specialty lumber products and waterproofing systems for residential and nonresidentialbuilding exteriors. We purchase products from a large number of manufacturers and then distributethese goods to a customer base consisting of contractors and, to a lesser extent, general contractors,retailers and building material suppliers.
We carry up to 10,000 SKUs through 172 branches in the United States and Canada. In fiscal year2009, approximately 94% of our net sales were in the United States. We stock one of the mostextensive assortments of high-quality branded products in the industry, enabling us to deliver productsto our customers on a timely basis.
Execution of the operating plan at each of our branches drives our financial results. Revenues areimpacted by the relative strength of the residential and non-residential roofing markets we serve. Weallow each of our branches to develop its own marketing plan and mix of products based upon its localmarket. We differentiate ourselves from the competition by providing customer services, including jobsite delivery, tapered insulation layouts and design and metal fabrication, and by providing credit. Weconsider customer relations and our employees’ knowledge of roofing and exterior building materials tobe important to our ability to increase customer loyalty and maintain customer satisfaction. We investsignificant resources in training our employees in sales techniques, management skills and productknowledge. While we consider these attributes important drivers of our business, we continually payclose attention to controlling operating costs.
Our growth strategy includes both internal growth (opening new branches, growing sales withexisting customers, adding new customers and introducing new products) and acquisition growth. Ourmain acquisition strategy is to target market leaders in geographic areas that we presently do not serve.Our April 2007 acquisition of North Coast Commercial Roofing Systems, Inc is an example of thisapproach. North Coast is a leading distributor of commercial roofing systems and related accessories,based in Twinsburg, Ohio, which had 16 locations in Ohio, Illinois, Indiana, Kentucky, Michigan, NewYork, Pennsylvania and West Virginia at the time of the acquisition. There was minimal branch overlapwith our existing operations. We also have acquired smaller companies to supplement branch openingswithin an existing region. Our May 2007 acquisition of Wholesale Roofing Supply (‘‘WRS’’), a singlelocation distributor of residential and commercial roofing products located in Knoxville, Tennessee,which we integrated into our Best Distributing region in the Carolinas, is an example of such anacquisition.
20

General
We sell all materials necessary to install, replace and repair residential and non-residential roofs,including:
• shingles;• single-ply roofing;• metal roofing and accessories;• modified bitumen;• built up roofing;• insulation;• slate and tile;• fasteners, coatings and cements; and• other roofing accessories.
We also sell complementary building products such as:
• vinyl siding;• doors, windows and millwork;• wood and fiber cement siding;• residential insulation; and• waterproofing systems.
The following is a summary of our net sales by product group for the last three full fiscal years.Percentages may not total due to rounding.
Year Ended
September 30, September 30, September 30,2009 2008 2007
Net Net NetSales Mix Sales Mix Sales Mix
Residential roofing products . . . . . . . . . $ 897,410 51.8% $ 758,491 42.5% $ 691,693 42.0%Non-residential roofing products . . . . . . 599,568 34.6% 723,742 40.6% 605,857 36.8%Complementary building products . . . . . 236,989 13.7% 302,262 16.9% 348,235 21.2%
$1,733,967 100.0% $1,784,495 100.0% $1,645,785 100.0%
We have over 40,000 customers, none of which represents more than 1.50% of our net sales. Manyof our customers are small to mid-size contractors with relatively limited capital resources. We maintainstrict credit approval and review policies, which has helped to keep losses from customer receivableswithin our expectations. For the seven years prior to 2008, bad debts averaged approximately 0.3% ofnet sales. In 2009 and 2008, we experienced increases to 0.4% and 0.6% of net sales, respectively,which is still within our tolerances in consideration of the tougher economic and credit climate.
Our expenses consist primarily of the cost of products purchased for resale, labor, fleet, occupancy,and selling and administrative expenses. We compete for business and may respond to competitivepressures at times by lowering prices in order to maintain our market share.
In September 2007, we amended our by-laws to change our year-end date to September 30 of eachfiscal year. Prior to that amendment, we used a 52/53 week fiscal year ending on the last Saturday ofSeptember. Our fiscal years ended September 30, 2009 (‘‘2009’’), September 30, 2008 (‘‘2008’’), andSeptember 30, 2007 (‘‘2007’’) all contained 52 weeks.
Since 1997, we have made seventeen strategic and complementary acquisitions and opened 36 newbranches. We opened eight branches in 2007, one in 2008 and three in 2009. We slowed the pace ofnew branch openings beginning in 2008, mostly as a result of the slowdown in our business experienced
21

since 2007. Typically, when we open a new branch, we transfer a certain level of existing business froman existing branch to the new branch. This allows the new branch to commence with a base businessand also allows the existing branch to target other growth opportunities.
In managing our business, we consider all growth, including the opening of new branches, to beinternal growth unless it is a result of an acquisition. In our management’s discussion and analysis offinancial condition and results of operations, when we refer to growth in existing markets, we includegrowth from existing and newly-opened branches but exclude growth from acquired branches until theyhave been under our ownership for at least four full fiscal quarters at the start of the reporting period.Our average annual internal sales growth over the five fiscal years since our IPO was 4.5%.
Results of operations
The following discussion compares our results of operations for 2009, 2008 and 2007.
The following table shows, for the periods indicated, information derived from our consolidatedstatements of operations expressed as a percentage of net sales for the periods presented. Percentagesmay not total due to rounding.
Year ended
September 30, September 30, September 30,2009 2008 2007
Net sales . . . . . . . . . . . . . . . . . . . . . . . . . 100.0% 100.0% 100.0%Cost of products sold . . . . . . . . . . . . . . . . 76.3 76.5 77.3
Gross profit . . . . . . . . . . . . . . . . . . . . . 23.7 23.5 22.7Operating expenses . . . . . . . . . . . . . . . . . 17.4 18.2 18.5
Income from operations . . . . . . . . . . . . . . 6.3 5.3 4.2Interest expense . . . . . . . . . . . . . . . . . . . . (1.3) (1.5) (1.7)
Income before income taxes . . . . . . . . . . . 5.0 3.9 2.6Income taxes . . . . . . . . . . . . . . . . . . . . . . (2.0) (1.6) (1.0)
Net income . . . . . . . . . . . . . . . . . . . . . . . 3.0% 2.3% 1.5%
2009 compared to 2008
Net Sales
Consolidated net sales decreased $50.5 million, or 2.8%, to $1,734.0 million in 2009 from$1,784.5 million in 2008. For 2009, all of our sales were considered to be from existing market as wedid not acquire any branches in 2009 or 2008. The product group sales for 2009 and 2008 were asfollows (percentages may not total due to rounding):
2009 2008 Change
(dollars in millions) Net Sales Mix Net Sales Mix
Residential roofing products . . . . . . . . . . . . . . . $ 897.4 51.8% $ 758.5 42.5% $ 138.9 18.3%Non-residential roofing products . . . . . . . . . . . . 599.6 34.6% 723.7 40.6% (124.1) (17.1)%Complementary building products . . . . . . . . . . . 237.0 13.7% 302.3 16.9% (65.3) (21.6)%
$1,734.0 100.0% $1,784.5 100.0% $ (50.5) (2.8)%
22

Our 2009 sales were affected primarily by the following factors, most of which resulted fromtougher economic conditions:
• significant decline in non-residential roofing activity;• continued weakness in new residential roofing activity in most markets;• continued weak complementary product sales in most markets; and• six fewer branches for most of the year;
partially offset by the positive impact of:
• higher average year-over-year prices, especially in residential roofing products; and• increased re-roofing activity in the areas affected by Hurricane Ike, primarily in our Southwest
region.
We estimate inflation increased this year’s sales by 7-9% over last year, indicating a drop involume of 10-12%, mostly in non-residential roofing and complementary product sales. We openedthree new branches late in 2009 and closed six branches during the year. We had 253 business days inboth 2009 and 2008. Net sales by geographical region grew or (declined) as follows: Northeast (12.6%);Mid-Atlantic (9.7%); Southeast 4.3%; Southwest 38.1%; Midwest (14.5%); West (21.6%); and Canada(10.8%). These variations were primarily caused by short-term factors such as local economicconditions and storm activity.
Gross Profit
2009 2008 Change
(dollars in millions)
Gross profit . . . . . . . . . . . . . . . . . . . . . . . . . . . . . . $411.1 $420.0 $(8.9) (2.1)%
Gross margin . . . . . . . . . . . . . . . . . . . . . . . . . . . . . 23.7% 23.5% (0.2)%
In 2009, gross profit decreased $8.9 million or 2.1% as compared to 2008, while gross marginincreased to 23.7% from 23.5%. The margin rate increase was largely the result of a product mix shiftto more residential roofing products, which have substantially higher gross margins than the morecompetitive non-residential market, partially offset by margin rate pressures from increased competitionfor fewer orders. In addition, the benefit of lower weighted-average costs of residential roofing productsin comparison to the current prices of those products in the marketplace continued from the fourthquarter of fiscal year 2008 into the first quarter of this year. This weighted-average cost effect endedduring the second quarter of 2009 and we currently expect our future overall gross margin to rangefrom 23-24%, depending upon product mix.
Direct sales (products shipped by our vendors directly to our customers), which typically havesubstantially lower gross margins than our warehouse sales, represented 19.0% and 21.7% of our netsales for 2009 and 2008, respectively. The decrease in the percentage of direct sales was attributable tothe lower mix of non-residential roofing product sales. There were no material changes in the directsales mix of our geographical regions.
Operating Expenses
2009 2008 Change
(dollars in millions)
Operating expenses . . . . . . . . . . . . . . . . . . . . . . . $301.9 $325.3 $(23.4) (7.2)%
Operating expenses as a % of sales . . . . . . . . . . . . 17.4% 18.2% (0.8)%
23

Our operating expenses decreased by $23.4 million to $301.9 million in 2009 from $325.3 million in2008. The following factors were the leading causes of our lower operating expenses:
• savings of $7.8 million in payroll and related costs, primarily driven by a lower headcount, lowerincentive-based pay, and reductions in overtime, partially offset by less favorable medical claimsexperience;
• savings of $6.9 million in selling expenses, primarily from lower transportation costs resultingfrom lower fuel prices and the lower sales volumes, partially offset by an increase in credit cardfees;
• reductions of $2.9 million in various general & administrative expenses, mainly from decreases inworkmen’s compensation and auto insurance costs;
• a reduction of $2.9 million in the provision for bad debts primarily due to collections of agedreceivables; and
• reduced depreciation and amortization expense of $3.9 million due to lower amortization ofintangible assets and the impact of very low capital expenditures in 2008;
partially offset by:
• an increase of $0.9 million in warehouse expenses, mostly due to costs associated with theclosing of the six branches.
In 2009, we expensed a total of $12.2 million for the amortization of intangible assets recordedunder purchase accounting compared to $15.0 million in 2008. Our operating expenses as a percentageof net sales decreased to 17.4% in 2009 from 18.2% in 2008 as we were able to control our variablecosts and reduce fixed costs.
Interest Expense
Interest expense decreased $3.0 million to $22.9 million in 2009 from $25.9 million in 2008. Thisdecrease was primarily due to a continued pay down of debt and lower average interest rates, whichaffected the unhedged portion of our variable-rate debt. Interest expense would have been $8.3 and$2.8 million less in 2009 and 2008, respectively, without the impact of our derivatives.
Income Taxes
Income tax expense increased to $33.9 million in 2009 from $28.5 million in 2008. Our 2009effective income tax rate was 39.3%, compared to our 2008 effective income tax rate of 41.4%. Therate decrease was primarily due to refunds for prior years’ tax credits and favorable state income taxaudit results. We also experienced a reduction in our state income tax rate due to a higherapportionment in states with lower income tax rates. We expect our future effective income tax rate tofluctuate around 39.5%, depending primarily upon the results of our operations in Canada and in thevarious states in which we operate.
2008 compared to 2007
The following table shows a summary of our results of operations for 2008 and 2007, broken downby existing markets and acquired markets.
24

For the Fiscal Years Ended
Existing Markets Acquired Markets Consolidated
(in thousands) 2008 2007 2008 2007 2008 2007
Net sales . . . . . . . . . . . . . . . $1,508,564 $1,489,297 $275,931 $156,488 $1,784,495 $1,645,785
Gross profit . . . . . . . . . . . . . 373,929 349,343 46,079 24,574 420,008 373,917Gross margin . . . . . . . . . . . . 24.8% 23.5% 16.7% 15.7% 23.5% 22.7%
Operating expenses . . . . . . . . 283,521 282,727 41,777 21,382 325,298 304,109Operating expenses as a % of
net sales . . . . . . . . . . . . . . 18.8% 19.0% 15.1% 13.7% 18.2% 18.5%
Operating income . . . . . . . . . $ 90,408 $ 66,616 $ 4,302 $ 3,192 $ 94,710 $ 69,808Operating margin . . . . . . . . . 6.0% 4.5% 1.6% 2.0% 5.3% 4.2%
Net Sales
Consolidated net sales increased $138.7 million, or 8.4%, to $1,784.5 million in 2008 from$1,645.8 million in 2007. Sales from acquired markets increased $119.4 million, while existing marketssaw internal growth of $19.3 million, or 1.3%. There was one additional business day in 2008 ascompared to 2007, which we believe increased annual existing market sales by approximately 0.4%.During 2008, we opened one new branch and closed four branches. The product group sales for ourexisting markets were as follows:
For the Fiscal Years Ended
Existing Markets
2008 2007 Change
(dollars in millions) Net Sales Mix Net Sales Mix
Residential roofing products . . . . . . . . . . . . . . . $ 736.1 48.8% $ 684.5 46.0% $ 51.6 7.5%Non-residential roofing products . . . . . . . . . . . . 479.4 31.8% 463.1 31.1% 16.3 3.5%Complementary building products . . . . . . . . . . . 293.1 19.4% 341.7 22.9% (48.6) (14.2)%
$1,508.6 100.0% $1,489.3 100.0% $ 19.3 1.3%
Note: Total 2008 existing market sales of $1,508.6 million plus 2008 sales from acquired markets of$275.9 million equal the total 2008 sales of $1,784.5 million. Our acquired markets had product groupsales of $20.2, $246.5 and $9.2 million in residential roofing products, non-residential roofing products,and complementary building products, respectively for 2008. Total 2007 existing market sales of$1,489.3 million plus 2007 sales from acquired markets of $156.5 million equal the total 2007 sales of$1,645.8 million. Our acquired markets had product group sales of $7.2, $142.8 and $6.5 million inresidential roofing products, non-residential roofing products, and complementary building products,respectively for 2007. We believe the existing market information is useful to investors because it helpsexplain organic growth or decline.
Our existing market sales were affected by the following factors:
• a rapid rise in prices beginning in February 2008, especially in residential roofing products;• strong re-roofing activity in storm-affected regions;• continued strength in non-residential roofing activity in most markets; and• one additional business day in 2008 as compared to 2007.
25

partially offset by the negative impact of:
• continued weakness in new residential roofing activity in most markets; and• lower complementary product sales in most markets, especially where we have had historically
higher levels of new residential construction.
Gross Profit
2008 2007 Change
(dollars in millions)
Gross profit . . . . . . . . . . . . . . . . . . . . . . . . . . . . . $420.0 $373.9 $46.1 12.3%Existing markets . . . . . . . . . . . . . . . . . . . . . . . . 373.9 349.3 24.6 7.0%
Gross margin . . . . . . . . . . . . . . . . . . . . . . . . . . . . 23.5% 22.7% 0.8%Existing markets . . . . . . . . . . . . . . . . . . . . . . . . 24.8% 23.5% 1.3%
In 2008, existing markets’ gross profit increased $24.6 million or 7.0% as compared to 2007, whileour acquired markets’ gross profit increased $21.5 million. Our overall gross margin increased to 23.5%from 22.7%, while our existing markets’ gross margin increased to 24.8% in 2008 from 23.5% in 2007.These increases were mostly in our residential roofing products and resulted principally from thepass-through of increases in shingle prices as we were notified of a series of price increases from ourvendors, which we were experiencing beginning in February 2008. However, our cost of goods sold didnot increase at the same time or rate due to favorable buying programs and the lower cost inventory onhand before the price increases. Our existing markets’ gross margin in non-residential roofing andcomplementary products, excluding vendor incentives, which represents our invoiced gross margin, wasrelatively consistent with 2007. The effect of the price increases was partially offset in our overall grossmargins by an increase in the sales mix of traditionally lower gross margin non-residential roofingproducts, while gross margin in our existing markets benefited from an increase of residential roofingproducts in our existing market product sales mix, which have higher gross margins than our otherproducts.
Operating Expenses
2008 2007 Change
(dollars in millions)
Operating expenses . . . . . . . . . . . . . . . . . . . . . . . . . $325.3 $304.1 $21.2 7.0%Existing markets . . . . . . . . . . . . . . . . . . . . . . . . . . 283.5 282.7 0.8 0.3%
Operating expenses as a % of sales . . . . . . . . . . . . . . 18.2% 18.5% (0.3)%Existing markets . . . . . . . . . . . . . . . . . . . . . . . . . . 18.8% 19.0% (0.2)%
Our existing markets’ operating expenses increased by only $0.8 million or 0.3% to $283.5 millionin 2008 from $282.7 million in 2007, while our acquired markets’ operating expenses increased$20.4 million. The following factors were the leading causes of the change in our existing marketoperating expenses:
• an increase in bad debts of $4.4 million, as we experienced higher write-offs and increased ourreserves due to the economic and credit climate; and
• an increase of $2.5 million in selling and warehouse expenses due primarily to highertransportation expenses resulting from significantly higher petroleum costs and from higher salesrelated costs, including credit card fees;
26

mostly offset by:
• a decrease of $2.9 million from both expense reduction initiatives and the benefit fromleveraging certain expenses over existing and acquired markets;
• reduced depreciation and amortization of $2.0 million due to lower amortization of intangibleassets and somewhat from substantially lower capital expenditures in 2008; and
• payroll and related costs decreased by $1.2 million primarily from a lower headcount andfavorable medical insurance claims, partially offset by higher incentive-based pay and profitsharing.
Existing markets’ operating expenses as a percentage of net sales decreased to 18.8% in 2008 from19.0% in 2007 as we were able to control our variable costs and leverage our fixed costs. Overalloperating expenses decreased to 18.2% of net sales from 18.5% due to the same factors and also fromblending in the lower operating expense level of North Coast. In 2008, we expensed a total of$8.5 million for the amortization of intangible assets recorded under purchase accounting in ourexisting markets compared to $10.3 million in 2007, while acquired markets expensed $6.5 million and$3.9 million for 2008 and 2007, respectively.
Interest Expense
Interest expense decreased $1.5 million to $25.9 million in 2008 from $27.4 million in 2007,primarily from lower levels of debt. Average interest rates during 2008 also decreased somewhat fromthe prior year, which affected interest expense on our variable-rate debt. Interest expense would havebeen $2.8 million lower in 2008 and $0.4 million higher in 2007 without the impact of our derivatives.
Income Taxes
Income tax expense increased to $28.5 million in 2008 from $17.1 million in 2007. Our 2008effective income tax rate was 41.4%, compared to our 2007 effective income tax rate of 40.3%. Therate increase was primarily due to 2007 adjustments of previously accrued income taxes related topreviously filed tax returns that benefited the 2007 income tax rate.
Seasonality and quarterly fluctuations
In general, sales and net income are highest during our first, third and fourth fiscal quarters, whichrepresent the peak months of construction and re-roofing, especially in our northeastern U.S. andCanada regions. Our sales are substantially lower during the second quarter, when we usually incur netlosses. These quarterly fluctuations have diminished as we have diversified into the southern regions ofthe United States.
We generally experience an increase of inventory, accounts receivable and accounts payable duringthe first, third and fourth quarters of the year as a result of seasonality. When we need to borrow, ourborrowings generally peak during the third quarter as accounts payable offered by our supplierstypically are payable in April, May and June, while our peak accounts receivable collections typicallyoccur from June through November.
We usually experience a slowing of collections of our accounts receivable during our secondquarter, mainly due to the inability of our customers to conduct their businesses effectively in inclementweather. We continue to attempt to collect those receivables which require payment under our standardterms. We do not provide any concessions to our customers during this period of the year to incentivizesales. Also, during the second quarter, we generally experience our lowest availability under our seniorsecured credit facilities, which are based on accounts receivable.
27

Certain quarterly financial data
The following table sets forth certain unaudited quarterly data for the fiscal years 2009 and 2008which, in the opinion of management, reflect all adjustments (consisting of normal recurringadjustments) considered necessary for a fair presentation of this data. Results of any one or morequarters are not necessarily indicative of results for an entire fiscal year or of continuing trends. Totalsmay not total due to rounding.
Fiscal year 2009 Fiscal year 2008
Qtr 1 Qtr 2 Qtr 3 Qtr 4 Qtr 1 Qtr 2 Qtr 3 Qtr 4
(dollars in millions, except per share data)(unaudited)
Net sales . . . . . . . . . . . . . . . . . . . . . . . $463.3 $319.3 $463.6 $487.7 $398.4 $304.3 $514.6 $567.2Gross profit . . . . . . . . . . . . . . . . . . . . . 116.0 74.3 107.8 113.0 91.7 68.4 120.2 139.7Income (loss) from operations . . . . . . . . 37.7 1.5 33.6 36.5 15.8 (6.9) 36.9 48.9Net income (loss) . . . . . . . . . . . . . . . . . $ 18.6 $ (2.4) $ 17.2 $ 19.0 $ 5.2 $ (8.1) $ 18.3 $ 24.9
Earnings (loss) per share—basic . . . . . . . $ 0.42 $(0.05) $ 0.38 $ 0.42 $ 0.12 $(0.18) $ 0.41 $ 0.56Earnings (loss) per share—fully diluted . . $ 0.41 $(0.05) $ 0.38 $ 0.42 $ 0.12 $(0.18) $ 0.41 $ 0.55
Quarterly sales as % of year’s sales . . . . . 26.7% 18.4% 26.7% 28.1% 22.3% 17.1% 28.8% 31.8%Quarterly gross profit as % of year’s gross
profit . . . . . . . . . . . . . . . . . . . . . . . . 28.2% 18.1% 26.2% 27.5% 21.8% 16.3% 28.6% 33.3%Quarterly income (loss) from operations
as % of year’s income from operations . 34.5% 1.4% 30.7% 33.4% 16.7% (7.3)% 39.0% 51.6%
Note: Qtr 1 of 2009 had one less business day compared to Qtr 1 of 2008, while Qtr 2 of 2009 had oneadditional business day compared to Qtr 2 of 2008.
Impact of inflation
We believe that our results of operations are not materially impacted by moderate changes in theinflation rate. In general, we have been able to pass on price increases from our vendors to ourcustomers in a timely manner. Inflation and changing prices did not have a material impact on ouroperations in 2007. However, during the fourth quarter of 2008, we experienced unusual and frequentprice increases in many our products that are derived from petroleum-based raw materials, especiallyasphalt shingles in our residential roofing products. We estimate that this unusual inflation increasedour 2008 sales by approximately 2.1% and our fourth quarter 2008 sales by approximately 7% abovehistorical annual inflation for our industry. We further estimate that this caused a temporary increase inour gross margin of approximately 60 basis points for the fourth quarter. We also estimate that thisinflation increased our 2008 gross profit by approximately $11.5 million, net income by $4.7 million andfully diluted earnings per share by $0.11. These conditions continued into the first few months of 2009,but did not have a material impact on our 2009 earnings results compared to 2008.
Liquidity and capital resources
We had cash and cash equivalents of $82.7 million at September 30, 2009 compared to$26.0 million at September 30, 2008. Our net working capital was $334.9 million at September 30, 2009compared to $274.8 million at September 30, 2008.
2009 compared to 2008
Our net cash provided by operating activities was $87.6 million in 2009 compared to $49.6 millionin 2008. In addition to the benefit from improved operating results, accounts receivable decreased by$56.1 million in 2009 due primarily to the collection of the high prior year-end receivables and the
28

lower 2009 fourth quarter sales. In addition, inventories decreased by $14.2 million due to the lowersales and purchasing activity. The favorable impact from those changes was partially offset by adecrease of $67.5 million in accounts payable and accrued expenses, due to lower forth quarterpurchasing levels, voluntary accelerated payments to certain vendors in order to receive additionaldiscounted terms, and the payment of previously accrued income taxes. An increase of $2.3 million inprepaid expenses and other assets was also an unfavorable impact on cash from operating activities.The number of days outstanding for accounts receivable, based upon sales for each year, decreased in2009 from 2008 mainly from the favorable impact of a higher mix of residential roofing products (whichhave shorter payment terms), while inventory turns were up slightly in 2009 as compared to 2008.
Net cash used in investing activities increased by $8.0 million in 2009 to $13.7 million from$5.7 million in 2008, due primarily to increased capital spending for transportation and materialhandling equipment, and the purchase of the land and building at one of our prior leased facilities forapproximately $2.0 million. We continue to closely manage our capital expenditures during thesechallenging economic times and we expect future fiscal year capital expenditures to total approximately0.6%-0.9% of net sales, exclusive of the impact of any branch openings.
Net cash used by financing activities was $17.6 million in 2009 compared to $23.8 million in 2008.These amounts primarily reflect repayments under our revolving lines of credit and term loan. Underthe Excess Cash Flow provision of the Credit Facility described below, there was a $7 millionaccelerated payment due under the term loan that was made in April 2009.
2008 compared to 2007
Our net cash provided by operating activities was $49.6 million for 2008 compared to $63.8 millionfor 2007. Although our income from operations increased to $94.7 million in 2008 from $69.8 million in2007, we increased our inventories by $44.1 million, especially in residential asphalt shingles, in reactionto announced price increases from our vendors and to ensure sufficient availability in the regionsaffected by storms. Due to this build up, inventory turns were down in 2008 as compared to 2007, butwe gained an advantage by having lower cost inventory to sell. Average inventory per branch was upabout 27% in 2008 as compared to 2007, primarily from the build-up, but also due to the high inflationin our product cost since 2007. Accounts receivable increased by $17.4 million in 2008, primarily due toincreased sales in the fourth quarter, partially offset by an increase in our doubtful accounts, while thenumber of days outstanding for accounts receivable increased slightly in 2008.
Prepaid expenses and other assets also increased by $9.6 million, mainly due to higher levels ofvendor rebates caused by increased purchases during the third and fourth quarters. Accounts payableand accrued expenses increased $44.1 million in 2008, mostly from the higher level of inventorypurchases, increases in income taxes payable and performance-based pay accruals.
Net cash used in investing activities in 2008 was $5.7 million compared to $143.3 million in 2007,due primarily to our acquisitions for which we paid $120.2 in 2007. We also substantially reducedcapital spending from $23.1 million in 2007 to $5.7 million in 2008 due to a slowdown in our businessduring 2007 and the first half of 2008 and the prior-year required upgrades to the truck fleets of someof our recent acquisitions.
Net cash used by financing activities was $23.8 million in 2008 compared to net cash provided byfinancing activities of $83.7 million in 2007. The net cash used by financing activities in 2008 primarilyreflected repayments under our revolving lines of credit and term loans. The net cash provided byfinancing activities in 2007 primarily reflected net term loan borrowings under our new credit facility,which refinanced our prior revolving facilities and term loans, payment of related deferred financingcosts, and the financing of our acquisitions as mentioned above.
29

Capital Resources
Our principal source of liquidity at September 30, 2009 was our cash and cash equivalents of$82.7 million and our available borrowings of $158.9 million under revolving lines of credit. Ourborrowing base availability is determined primarily by trade accounts receivable, less outstandingborrowings. Borrowings outstanding under the revolving lines of credit in the accompanying balancesheet at September 30, 2009 and 2008 were classified as short-term debt since we paid off thoseborrowings subsequent to the respective year-ends and there is no current expectation of a minimumlevel of outstanding revolver borrowings during the subsequent 12 months.
Liquidity is defined as the current amount of readily available cash and the ability to generateadequate amounts of cash to meet the current needs for cash. We assess our liquidity in terms of ourcash and cash equivalents on hand and the ability to generate cash to fund our operating activities,taking into consideration the seasonal nature of our business. Our cash equivalents are comprised ofhighly liquid money market funds which in invest in commercial paper or bonds with a rating of A-1 orbetter, or in a US Treasury money market fund.
Significant factors which could affect future liquidity include the following:
• the adequacy of available bank lines of credit;• the ability to attract long-term capital with satisfactory terms;• cash flows generated from operating activities;• acquisitions; and• capital expenditures.
Our primary capital needs are for working capital obligations and other general corporatepurposes, including acquisitions and capital expenditures. Our primary sources of working capital arecash from operations and cash equivalents, supplemented by bank borrowings. In the past, we havefinanced acquisitions initially through increased bank borrowings, the issuance of common stock and/orother borrowings. We then repay any such borrowings with cash flows from operations. The November2006 refinancing of our credit facilities discussed below provided us with approximately $47 million ofadditional funds at the time of the closing for future acquisitions and ongoing working capitalrequirements. We have funded our past capital expenditures through increased bank borrowings,including equipment financing, or through capital leases, and then have reduced these obligations withcash flows from operations.
We believe we have adequate current liquidity and availability of capital to fund our presentoperations, meet our commitments on our existing debt and fund anticipated growth, includingexpansion in existing and targeted market areas. We continually seek potential acquisitions and fromtime to time hold discussions with acquisition candidates. If suitable acquisition opportunities orworking capital needs arise that would require additional financing, we believe that our financialposition and earnings history provide a strong base for obtaining additional financing resources atcompetitive rates and terms, as we have in the past. We may also issue additional shares of commonstock to raise funds, which we did in December 2005, or we may issue preferred stock.
Indebtedness
We currently have the following credit facilities:
• a senior secured credit facility in the U.S.;• a Canadian senior secured credit facility; and• an equipment financing facility.
30

Senior Secured Credit Facilities
On November 2, 2006, we entered into an amended and restated seven-year $500 million U.S.senior secured credit facility and a C$15 million senior secured Canadian credit facility with GEAntares Capital (‘‘GE Antares’’) and a syndicate of other lenders (combined, the ‘‘Credit Facility’’).The Credit Facility refinanced the prior $370 million credit facilities that also were provided throughGE Antares. The Credit Facility provides us with lower interest rates and available funds for futureacquisitions and ongoing working capital requirements. In addition, the Credit Facility increased theallowable total equipment financing and/or capital lease financing to $35 million. The Credit Facilityprovides for a cash receipts lock-box arrangement that gives us sole control over the funds in lock-boxaccounts, unless excess availability is less than $10 million or an event of default occurs, in which casethe senior secured lenders would have the right to take control over such funds and to apply suchfunds to repayment of the senior debt.
The Credit Facility consists of a U.S. revolving credit facility of $150 million (the ‘‘US Revolver’’),which includes a sub-facility of $20 million for letters of credit, and an initial $350 million term loan(the ‘‘Term Loan’’). The Credit Facility also includes a C$15 million senior secured revolving creditfacility provided by GE Canada Finance Holding Company (the ‘‘Canada Revolver’’). There was acombined $158.9 million available for borrowings and less than $0.1 million was outstanding under theUS Revolver and Canadian Revolver at September 30, 2009. There were $5.1 million of outstandingstandby letters of credit at September 30, 2009. The Term Loan requires amortization of 1% per year,payable in quarterly installments of approximately $0.9 million, plus any required prepayments underthe Excess Cash Flow, discussed below, and with the remainder due in 2013. The Credit Facility mayalso be expanded by up to an additional $200 million under certain conditions. There are mandatoryprepayments under the Credit Facility under certain conditions, including the following cash flowcondition:
Excess Cash Flow
On May 15 of each fiscal year, commencing on May 15, 2008, we must pay an amount equal to50% of the Excess Cash Flow (as defined in the Credit Facility) for the prior fiscal year, not to exceed$7.0 million with respect to any fiscal year. Based on our results for 2009, we will be required to makea $7.0 million payment by May 15, 2010. The amounts payable under this provision were classified asshort-term debt at September 30, 2009 and 2008.
Interest
Interest on borrowings under the U.S. credit facility is payable at our election at either of thefollowing rates:
• the base rate (that is the higher of (a) the base rate for corporate loans quoted in The WallStreet Journal or (b) the Federal Reserve overnight rate plus 1⁄2 of 1%) plus a margin of 0.75%for the Term Loan.
• the current LIBOR Rate plus a margin of 1.00% (for US Revolver loans) or 2.00% (for TermLoan).
Interest under the Canadian credit facility is payable at our election at either of the followingrates:
• an index rate (that is the higher of (1) the Canadian prime rate as quoted in The Globe andMail and (2) the 30-day BA Rate plus 0.75%), or
• the BA rate as described in the Canadian facility plus 1.00%.
The US Revolver currently carries an interest rate at the base rate (3.25% at September 30, 2009),while the Canada revolver carries an interest rate of the Canadian prime rate plus 0.75% (2.50% at
31

September 30, 2009), and the Term Loan carries an interest rate of LIBOR plus 2% (2.60% and 2.25%for two LIBOR arrangements under the Term Loan at September 30, 2009). Unused fees on therevolving credit facilities are 0.25% per annum. Availability under the revolving credit facilities islimited to 85% of eligible accounts receivable, increasing to 90% from January through April of eachyear. Financial covenants, which apply only to the Term Loan, are limited to a leverage ratio and ayearly capital expenditure limitation as follows:
Maximum Consolidated Leverage Ratio
On the last day of each fiscal quarter, our Consolidated Leverage Ratio, as defined, must not begreater than 4.00:1.0. At September 30, 2009, this ratio was 1.90:1.0.
Capital Expenditures
We cannot incur aggregate Capital Expenditures, as defined, in excess of three percent (3.00%) ofconsolidated gross revenue for any fiscal year.
As of September 30, 2009, we were in compliance with these covenants. Substantially all of ourassets, including the capital stock and assets of wholly-owned subsidiaries, secure obligations under theCredit Facility.
Prior Senior Secured Credit Facilities
The credit facilities in place prior to the Credit Facility discussed above were scheduled to matureon October 14, 2010 and consisted of a $280 million U.S. revolving line of credit and a C$15 millionCanadian revolving line of credit, referred to as revolvers, and term loans totaling $90 million. Thesefacilities provided for the same lock-box arrangements as under the Credit Facility. At the time of therefinancing discussed above, there was $227.8 million of borrowings outstanding under the priorrevolvers.
Equipment Financing Facilities
We have an equipment financing facility which allows for the financing of up to $5.5 million ofpurchased transportation and material handling equipment through February 15, 2010 at an interestrate approximately 3% above the 5- or 6-year term swap rate at the time of the advances. There wereno amounts outstanding under this facility at September 30, 2009; however, there were $19.9 million ofequipment financing loans outstanding under prior equipment financing facilities at September 30,2009, with fixed interest rates ranging from 5.5% to 7.4%.
32

Contractual Obligations
At September 30, 2009, our contractual obligations were as follows:
Fiscal years
2010 2011 2012 2013 2014 Thereafter
Senior bank debt and revolver . . . . . . . . . . . . . . . . . . . . . . . $10.5 $ 3.4 $ 3.4 $315.2 $ — $ —Equipment financing . . . . . . . . . . . . . . . . . . . . . . . . . . . . . . 4.7 4.9 4.3 3.4 2.5 0.1Operating leases . . . . . . . . . . . . . . . . . . . . . . . . . . . . . . . . . 22.8 17.8 13.9 9.6 7.2 6.4Interest(1) . . . . . . . . . . . . . . . . . . . . . . . . . . . . . . . . . . . . . 18.6 16.0 16.9 18.2 0.1 —Non-cancelable purchase obligations(2) . . . . . . . . . . . . . . . . — — — — — —
Total . . . . . . . . . . . . . . . . . . . . . . . . . . . . . . . . . . . . . . . . . $56.6 $42.1 $38.5 $346.4 $9.8 $6.5
(1) Interest payments reflect all currently scheduled amounts along with projected amounts to be paidunder the senior bank debt using a LIBOR Curve to estimate the future interest rates andconsidering our current interest rate hedges.
(2) In general, we purchase products under purchase obligations that are cancelable by us without costor expire after 30 days.
Capital Expenditures
Excluding acquisitions, we incurred net capital expenditures of $13.7, $5.7 and $23.1 million in2009, 2008 and 2007, respectively. Over 85% of our capital expenditures have generally been made fortransportation and material handling equipment. In 2009, we resumed a more normal spend rate (withcapital expenditures at 0.8% of sales) after we substantially reduced capital expenditures in 2008 (0.3%of sales) due to the business slowdown. Capital expenditures in 2007 as a percentage of sales were1.4%, as we upgraded the fleet of our acquired companies. We continue to closely manage our capitalexpenditures during these challenging economic times and we expect future annual capital expendituresto total approximately 0.6%-0.9% of net sales, exclusive of the impact of new branch openings.
Off-Balance Sheet Arrangements
We have no off-balance sheet arrangements.
Critical accounting policies
Critical accounting policies are those that are both important to the accurate portrayal of acompany’s financial condition and results and require subjective or complex judgments, often as a resultof the need to make estimates about the effect of matters that are inherently uncertain.
In order to prepare financial statements that conform to accounting principles generally acceptedin the United States, commonly referred to as U.S. GAAP, we make estimates and assumptions thataffect the amounts reported in our financial statements and accompanying notes. Certain estimates areparticularly sensitive due to their significance to the financial statements and the possibility that futureevents may be significantly different from our expectations.
We have identified the following accounting policies that require us to make the most subjective orcomplex judgments in order to fairly present our consolidated financial position and results ofoperations.
Stock-Based Compensation
We began using the fair value method of accounting for employee and non-employee directorstock-based compensation in 2006. After our IPO in 2004 and through 2005, no compensation expense
33

was recognized for stock options granted to employees and non-employee directors because all suchstock options granted had exercise prices equal to the market value of our stock on the date of thegrant.
Compensation expense recognized after 2005 included: (a) compensation cost for all unvestedshare-based awards granted prior to 2006, based on the grant date fair value estimated and(b) compensation cost for all share-based awards granted subsequent to 2005, based on the grant dateestimated. Results of prior periods were not restated. We also estimate forfeitures in calculating theexpense related to stock-based compensation. The impact of estimating forfeitures upon adoption wasnot material. In addition, we report the benefits of tax deductions in excess of recognized compensationcost as both a financing cash inflow and an operating cash outflow. The excess tax benefit classified asa financing activity would have been classified as an operating inflow if we did not use the fair valuemethod.
Interest Rate Swaps and Collars
We enter into interest rate swaps and collars to minimize the risks and costs associated withfinancing activities, as well as to maintain an appropriate mix of fixed-and floating-rate debt. The swapagreements are contracts to exchange variable-rate for fixed-interest rate payments over the life of theagreements. The collar agreements provide for fixed-rate caps and floors. Our current derivativeinstruments are designated as cash flow hedges, for which we record the effective portions of changesin their fair value, net of tax, in other comprehensive income. We recognize any ineffective portion ofour hedges in earnings, of which there has been none to date. Our derivative instruments prior to April2007 were not designated as hedges and therefore changes in their fair values were recorded in interestexpense.
Allowance for Doubtful Accounts
We maintain an allowance for doubtful accounts for estimated losses due to the failure of ourcustomers to make required payments. We perform periodic credit evaluations of our customers andtypically do not require collateral, although we typically obtain payment and performance bonds for anytype of public work and have the ability to lien projects under certain circumstances. Consistent withindustry practices, we require payment from most customers within 30 days, except for sales to ourcommercial roofing contractors, which we typically require to pay in 60 days.
As our business is seasonal in certain regions, our customers’ businesses are also seasonal. Salesare lowest in the winter months and our past due accounts receivable balance as a percentage of totalreceivables generally increases during this time. Throughout the year, we record estimated reservesbased upon our judgment of specific customer situations, aging of accounts and our historical write-offsof uncollectible accounts.
Periodically, we perform a specific analysis of all accounts past due and write off account balanceswhen we have exhausted reasonable collection efforts and determined that the likelihood of collectionis remote based upon the following factors:
• aging statistics and trends;• customer payment history;• review of the customer’s financial statements when available;• independent credit reports; and• discussions with customers.
We charge these write-offs against our allowance for doubtful accounts. In the past, bad debtstypically averaged approximately 0.3% of net sales. In 2009 and 2008, we experienced an increase to0.4% and 0.6% of net sales, respectively, which is still within our tolerances and reflective of thetougher economic and credit climate.
34

Inventory Valuation
Product inventories represent one of our largest assets and are recorded at net realizable value.Our goal is to manage our inventory so that we minimize out of stock positions. To do this, wemaintain an adequate inventory of SKUs at each branch based on sales history. At the same time, wecontinuously strive to better manage our slower moving classes of inventory. We monitor our inventorylevels by branch and record provisions for excess inventories based on slower moving inventory. Wedefine potential excess inventory as the amount of inventory on hand in excess of the historical usage,excluding items purchased in the last three months. We then apply our judgment as to forecasteddemand and other factors, including liquidation value, to determine the required adjustments to netrealizable value. In addition, at the end of each year, we evaluate our inventory at each branch andwrite off and dispose of obsolete products. Our inventories are generally not susceptible totechnological obsolescence.
During the year, we perform periodic cycle counts and write off excess or damaged inventory asneeded. At year-end we take a physical inventory and record any necessary additional write-offs.
Vendor Rebates
Our typical rebate arrangements with our vendors provide for us to receive a rebate of a specifiedamount, payable to us when we achieve any of a number of measures generally related to the volumeof purchases from our vendors. We account for these rebates as a reduction of the prices of the relatedvendors’ products, which reduces the inventory cost until the period in which we sell the product, atwhich time these rebates reduce cost of sales in our income statement. Throughout the year, weestimate the amount of rebates receivable based upon the expected level of purchases. We continuallyrevise these estimates to reflect actual rebates earned based on actual purchase levels. Historically, ouractual rebates have been within our expectations used for our estimates. If we fail to achieve a measurewhich is required to obtain a vendor rebate, we will have to record a charge in the period that wedetermine the criteria or measure for the vendor rebate will not be met to the extent the vendor rebatewas estimated and included as a reduction to cost of sales.
If market conditions were to change, vendors may change the terms of some or all of theseprograms. Although these changes would not affect the amounts which we have recorded related toproducts already purchased, it may impact our gross margin on products we sell or revenues earned infuture periods.
Revenue Recognition
We recognize revenue when the following four basic criteria are met:
• persuasive evidence of an arrangement exists;• delivery has occurred or services have been rendered;• the price to the buyer is fixed or determinable; and• collectability is reasonably assured.
We generally recognize revenue at the point of sale or upon delivery to the customer’s site. Forgoods shipped by third party carriers, we recognize revenue upon shipment since the terms are FOBshipping point. Approximately 80% of our revenues are for products delivered by us or picked up byour customers at our facilities, which provides for timely and accurate revenue recognition.
We also ship certain products directly from the manufacturer to the customer. Revenues arerecognized upon notifications of deliveries from our vendors. Delays in receiving delivery notificationscould impact our financial results, although it has not been material to our consolidated results ofoperations in the past.
35

We also provide certain job site delivery services, which include crane rentals and rooftopdeliveries of certain products, for which the associated revenues are recognized upon completion of theservices. These revenues represent less than 1% of our net sales.
All revenues recognized are net of sales taxes collected, allowances for discounts and estimatedreturns, which are provided for at the time of pick up or delivery. In the past, customer returns havenot been material to our consolidated results of operations. All sales taxes collected are subsequentlyremitted to the appropriate government authorities.
Income Taxes
We account for income taxes using the liability method, which requires us to recognize a currenttax liability or asset for current taxes payable or refundable and a deferred tax liability or asset for theestimated future tax effects of temporary differences between the financial statement and tax reportingbases of assets and liabilities to the extent that they are realizable. Deferred tax expense (benefit)results from the net change in deferred tax assets and liabilities during the year.
We have operations in 37 U.S. states and three provinces in Canada and we are subject topotential tax audits in each of these jurisdictions and federally in both the United States and Canada.These audits may involve complex issues, which may require an extended period of time to resolve.Accruals for uncertain tax positions require us to make estimates and judgments with respect to theultimate outcome of potential tax audits. Actual results could differ from these estimates.
We adopted the accounting guidance originally issued in FASB Interpretation No. 48, Accountingfor Uncertainty in Income Taxes (codified primarily in FASB ASC Topic 740, Income Taxes), effectiveOctober 1, 2007, which prescribes a recognition threshold and measurement attribute for the financialstatement recognition and measurement of a tax position taken or expected to be taken in a tax return.In connection with the adoption, we analyzed our filing positions in all of the federal and statejurisdictions where we are required to file income tax returns, as well as all open tax years in thesejurisdictions. There was no material impact on our consolidated financial statements upon adoption.
Goodwill
Goodwill represents the excess paid to acquire businesses over the estimated fair value of tangibleassets and identifiable intangible assets acquired, less liabilities assumed. At September 30, 2009, ourgoodwill balance was approximately $354.2 million, representing approximately 34% of our total assets.
We test goodwill for impairment in the fourth quarter of each fiscal year or at any other timewhen impairment indicators exist. Examples of such indicators include a significant change in thebusiness climate, unexpected competition, loss of key personnel or a decline in our marketcapitalization below our net book value. In performing the impairment test, we utilize a two-stepapproach. The first step requires a comparison of each reporting unit’s fair value to the respectivecarrying value. If the carrying value exceeds the fair value, a second step is performed to measure theamount of impairment loss, if any.
We assess goodwill for impairment at the reporting unit level, which is defined as an operatingsegment or one level below an operating segment, referred to as a component (defined as a businessfor which discrete financial information is available and regularly reviewed by component managers),which in our case is our regions. We aggregate components within a reporting unit that have similareconomic characteristics. For purposes of determining our aggregation, we evaluate the distributionmethod, sales mix, and operating results of each of our regions and conclude if these have or will besustained over a long-term basis. For purposes of this evaluation, we would expect our regions toexhibit similar economic characteristics 3-5 years after events such as an acquisition within our coreroofing business or management/business restructuring. This evaluation also considers major stormactivity or local economic challenges that may impact the short term operations of the region. Based on
36

our evaluation at September 30, 2009, two of our regions did not exhibit similar economiccharacteristics and therefore were individually evaluated for goodwill impairment as separate reportingunits. The remaining components were aggregated into a third reporting unit (the ‘‘AggregatedReporting Unit’’) and tested in total for goodwill impairment.
The fair value of each reporting unit is estimated using a market approach, an income approach,or a weighted average of the two approaches. The market approach utilizes a guideline transactionmethod, which derives applicable market multiples from the prices at which comparable companies aretrading in an active marketplace. We believe the market approach generally provides a meaningfulindicator of fair value as it reflects the current value at which shares of comparable companies areactively traded in a free and open market. The income approach utilizes a discounted cash flow method(‘‘DCF’’) that estimates after-tax cash flows on a debt-free basis, discounted to present value using arisk-adjusted discount rate. We believe the DCF provides a meaningful indicator of fair value as well,since it appropriately measures the income producing assets and reflects the income potential thatwould establish the amount paid by an investor.
The key assumptions used in the market approach included:
• The use of comparable publicly traded companies, which we considered to be distributors ofindustrial construction products.
• The application of adjustments for a control premium and for risk and growth considerations,which were consistent with premiums and considerations in recent acquisitions.
The key assumptions used in the DCF approach included:
• The reporting unit’s five-year projections of financial results (including sales and marginimprovements), which were based on our strategic plans and long-range forecasts. Sales growthrates represent estimates based on current and forecasted sales mix and market conditions. Theprofit margins were projected by each reporting unit based on historical margins, projected salesmix, current expense structure and anticipated expense reductions.
• The projected terminal value, which reflected the total present value of projected cash flowsbeyond the last period in the DCF. This value reflected our estimate for stable, perpetual growthof each reporting unit.
• The discount rate was set by using a weighted average cost of capital method that consideredmarket and industry data as well as Company-specific risk factors.
We utilized a market approach to determine the fair value of the Aggregated Reporting Unit anda combination of income and market approaches to determine the fair values of our other tworeporting units. Given the size of the respective reporting units, relative to the overall Company, webelieve these approaches provide the best indications of the fair values. To corroborate our calculations,we reconciled the Company’s total market capitalization value to the sum of the fair values of the threereporting units. Our market capitalization reflects an implied control premium that we believe isconsistent with recent acquisitions in the industry.
Based on our calculations, the fair value of the Aggregated Reporting Unit significantly exceededthe respective carrying value. In addition, for one of the two remaining reporting units, with$63.3 million in goodwill, our calculations indicated a fair value which significantly exceeded its carryingvalue, while the other reporting unit, with $70.8 million in goodwill, provided fair value indicationsranging from 5% to 8% above its carrying value. The significant inputs used in the fair valuecalculations discussed above represent our best estimate. Management performed sensitivity analysesutilizing more conservative assumptions for the fair value estimate of the reporting unit that had only a5% to 8% excess fair value. For example, management changed the discount rate and the terminalgrowth rate by 100 basis points each and reduced the forecasted cash flows and market multiples by10% each. These analyses noted that an individual change to any one of these assumptions would notreduce the fair value below the carrying value; however any combination of these changes in
37

assumptions would reduce the fair value below its carrying value. As a result, if actual operating resultsand/or the underlying assumptions used in the analyses differ from expected, a future impairmentcharge may be necessary.
Based on the results of the first step of the impairment test, the second step was not required andno impairment was recognized. If circumstances change or events occur to indicate that the fair valueof any of our reporting units (under the guidelines discussed above) has fallen below its carrying value,we will compare the estimated fair value of the goodwill to its carrying value. If the book value of thegoodwill exceeds the implied fair value of the goodwill, we will recognize the difference as animpairment loss in the determination of operating income.
Adoption of Recent Accounting Pronouncements
In June 2009, the FASB issued guidance related to the FASB Accounting Standards Codification(‘‘ASC’’). Effective for interim and annual financial periods ending after September 15, 2009, the ASChas become the source of authoritative generally accepted accounting principles in the United Statesand supersedes all existing non-SEC accounting and reporting standards. All other non-grandfatherednon-SEC accounting literature not included in the ASC has become non-authoritative. This newguidance affected the way in which we reference and report accounting and reporting standardsbeginning with this Form 10-K.
In May 2009, the FASB issued guidance on subsequent events that establishes general standards ofaccounting for and disclosure of events that occur after the balance sheet date and requires thedisclosure of the date through which an entity has evaluated subsequent events and whether thatrepresents the date the financial statements were issued or were available to be issued. This newguidance was effective for us in 2009 and, consistent with our prior practice, we evaluated allsubsequent events that occurred through the time this Form 10-K was filed with the SEC onDecember 1, 2009.
In April 2009, the FASB issued disclosure guidance about fair value of financial instruments ininterim financial statements. This was effective for us in 2009 but had no impact on our financialstatements.
Effective October 1, 2008, we followed new guidance from the FASB that clarifies the fair valueobjective and establishes a framework for developing fair value estimates. This new guidance alsoestablishes a fair value hierarchy that prioritizes the inputs used to measure fair value, giving thehighest priority to unadjusted quoted prices in active markets for identical assets or liabilities (Level 1inputs), the next priority to observable market based inputs or unobservable inputs that arecorroborated by market data (Level 2 inputs) and the lowest priority to unobservable inputs (Level 3inputs). Our assets and liabilities that are measured at fair value on a recurring basis are our interestrate swaps and collars (see Item 7A).
Also beginning October 1, 2008, new FASB guidance permits companies to measure many financialinstruments and certain other items at fair value at specified election dates. There was no impact to usfrom this change as we chose to retain our current accounting valuation methods for those items.
In March 2008, the FASB issued guidance that requires enhanced disclosures about an entity’sderivative and hedging activities. In addition to disclosing the fair values of derivative instruments andtheir gains and losses in a tabular format, entities are required to provide enhanced disclosures about(a) how and why an entity uses derivative instruments, (b) how derivative instruments and relatedhedged items are accounted for, and (c) how derivative instruments and related hedged items affect anentity’s financial position, financial performance and cash flows. This new guidance was effective for usin the quarter ended March 31, 2009.
38

Other Recent Accounting Pronouncements
In June 2009, the FASB issued guidance that changes the way entities account for securitizationsand special purpose entities. This new guidance is effective for annual reporting periods beginning afterNovember 15, 2009. We do not expect this change to impact our financial statements.
In December 2007, the FASB issued guidance that will significantly change the accounting for andreporting of business combination transactions and noncontrolling (minority) interests in consolidatedfinancial statements. This is guidance will be effective for our financial statements in the fiscal yearbeginning October 1, 2009. Earlier adoption is prohibited. We believe the adoption of this guidancecould have a significant impact on the accounting for our future acquisitions, depending on thecircumstances and the terms of the acquisitions.
ITEM 7A. QUANTITATIVE AND QUALITATIVE DISCLOSURES ABOUT MARKET RISK
We are exposed to certain market risks as part of our on-going business operations. Our primaryexposure includes changes in interest rates and foreign exchange rates.
Interest Rate Risk
Our interest rate risk relates primarily to the variable-rate borrowings under our Credit Facility.The following discussion of our interest rate swaps and collars (see ‘‘Financial Derivatives’’ below) isbased on a 10% change in interest rates. These changes are hypothetical scenarios used to calibratepotential risk and do not represent our view of future market changes. As the hypothetical figuresdiscussed below indicate, changes in fair value based on the assumed change in rates generally cannotbe extrapolated because the relationship of the change in assumption to the change in fair value maynot be linear. The effect of a variation in a particular assumption is calculated without changing anyother assumption. In reality, changes in one factor may result in changes in another, which maymagnify or counteract the sensitivities.
At September 30, 2009, we had $332.5 million of term loans and less than $0.1 million of revolvingcredit outstanding under our Credit Facility. Our weighted-average effective interest rate on that debt,after considering the effect of the interest rate swaps, was 6.18% at September 30, 2009. A hypothetical10% increase in interest rates in effect at September 30, 2009, would have increased annual interestexpense on the borrowings outstanding at that date by approximately $0.1 million.
We enter into interest rate swaps and collars to minimize the risks and costs associated withfinancing activities, as well as to maintain an appropriate mix of fixed- and floating-rate debt. The swapagreements discussed below are contracts to exchange variable-rate for fixed-interest rate paymentsover the life of the agreements. The collar agreements, also discussed below, provide for fixed-rate capsand floors. The aggregate fair value of these swaps and collars represented a loss of $12.3 million atSeptember 30, 2009. A hypothetical increase (or decrease) of 10% in interest rates from the level ineffect at September 30, 2009, would result in an aggregate unrealized gain or (loss) in value of theswaps and collars of approximately $0.2 million or ($0.2) million, respectively.
Financial Derivatives
The Company uses derivative financial instruments for hedging and non-trading purposes tomanage its exposure to changes in interest rates. Use of derivative financial instruments in hedgingprograms subjects the Company to certain risks, such as market and credit risks. Market risk representsthe possibility that the value of the derivative instrument will change. In a hedging relationship, thechange in the value of the derivative is offset to a great extent by the change in the value of theunderlying hedged item. Credit risk related to derivatives represents the possibility that thecounterparty will not fulfill the terms of the contract. The notional, or contractual, amount of the
39

Company’s derivative financial instruments is used to measure interest to be paid or received and doesnot represent the Company’s exposure due to credit risk. The Company’s current derivative instrumentsare with counterparties rated highly by nationally recognized credit rating agencies.
The Company is using interest rate derivative instruments to manage the risk of interest ratechanges by converting a portion of its variable-rate borrowings into fixed-rate borrowings. As ofSeptember 30, 2009, the following interest rate derivative instruments were outstanding: a) interest rateswaps totaling $200 million, expiring in April 2010, with a fixed rate of 4.97%; b) a $50 million interestrate collar expiring in April 2010 with a floor rate of 3.99% and a cap rate of 5.75%; c) a $50 millioninterest rate collar expiring in April 2010 with a floor rate of 3.75% and a cap rate of 6.00%;d) a $100 million future-starting interest rate swap executed in May 2009, with interest cash flowscommencing in April 2010 and expiring in April 2013 and with a fixed rate of 2.72%; e) a $50 millionfuture-starting interest rate swap executed in June 2009, with interest cash flows commencing inApril 2010 and expiring in April 2013 and with a fixed rate of 3.12%; and f) a $50 million future-starting interest rate swap executed in June 2009, with interest cash flows commencing in April 2010and expiring in April 2013 and with a fixed rate of 3.11%. At no time during the terms of the forward-stating derivatives do the associated cash flows overlap with those associated with the derivativesexpiring in April 2010.
These derivative instruments are designated as cash flow hedges, for which the Company recordsthe effective portions of changes in their fair value, net of taxes, in other comprehensive income. Theeffectiveness of the hedges is periodically assessed by the Company during the lives of the hedges by1) comparing the current terms of the hedges with the related hedged debt to assure they continue tocoincide and 2) through an evaluation of the counterparties to the hedges to honor their obligationsunder the hedges. Any ineffective portion of the hedges is recognized in earnings, of which there hasbeen none to date and none is anticipated.
The Company records any differences paid or received on its interest rate hedges as adjustmentsto interest expense. Since inception, the Company has not recognized any gains or losses on thesehedges. The table below presents the combined fair values of the interest rate swap and collarinstruments on the indicated balance sheets:
Unrealized Losses
September 30, September 30,Location on Balance Sheet 2009 2008 Fair Value Hierarchy
(Dollars in thousands)
Accrued expenses . . . . . . . . . . . . . . . . . . . . . . . . . . . . $12,348 $7,396 Level 2
The fair values of the interest rate swaps and collars were determined through the use of pricingmodels, which utilize verifiable inputs such as market interest rates that are observable at commonlyquoted intervals (generally referred to as the ‘‘LIBOR Curve’’) for the full terms of the swap and collaragreements.
Foreign Currency Exchange Rate Risk
We have exposure to foreign currency exchange rate fluctuations for revenues generated by ouroperations outside the United States, which can adversely impact our net income and cash flows.Approximately 6% of our revenues in 2009 were derived from sales to customers in Canada. Thisbusiness is primarily conducted in the local currency. This exposes us to risks associated with changes inforeign currency that can adversely affect revenues, net income and cash flows. We do not enter intofinancial instruments to manage this foreign currency exchange risk.
40

ITEM 8. FINANCIAL STATEMENTS AND SUPPLEMENTARY DATA
Beacon Roofing Supply, Inc.
Index to consolidated financial statements
Page
Report of Independent Registered Public Accounting Firm . . . . . . . . . . . . . . . . . . . . . . . . . . . . 42
Consolidated Balance Sheets as of September 30, 2009 and 2008 . . . . . . . . . . . . . . . . . . . . . . . . 43
Consolidated Statements of Operations for the Years Ended September 30, 2009, 2008 and 2007 . 44
Consolidated Statements of Stockholders’ Equity and Comprehensive Income for the YearsEnded September 30, 2009, 2008 and 2007 . . . . . . . . . . . . . . . . . . . . . . . . . . . . . . . . . . . . . . 45
Consolidated Statements of Cash Flows for the Years Ended September 30, 2009, 2008 and 2007 . . 46
Notes to Consolidated Financial Statements . . . . . . . . . . . . . . . . . . . . . . . . . . . . . . . . . . . . . . . 47
41

27FEB200923311029
Report of Independent Registered Public Accounting Firm
The Board of Directors and Shareholders ofBeacon Roofing Supply, Inc.
We have audited the accompanying consolidated balance sheets of Beacon Roofing Supply, Inc.(the Company) as of September 30, 2009 and 2008 and the related consolidated statements ofoperations, stockholders’ equity and comprehensive income, and cash flows for each of the three yearsin the period ended September 30, 2009. These financial statements are the responsibility of theCompany’s management. Our responsibility is to express an opinion on these financial statements basedon our audits.
We conducted our audits in accordance with the standards of the Public Company AccountingOversight Board (United States). Those standards require that we plan and perform the audit to obtainreasonable assurance about whether the financial statements are free of material misstatement. Anaudit includes examining, on a test basis, evidence supporting the amounts and disclosures in thefinancial statements. An audit also includes assessing the accounting principles used and significantestimates made by management, as well as evaluating the overall financial statement presentation. Webelieve that our audits provide a reasonable basis for our opinion.
In our opinion, the financial statements referred to above present fairly, in all material respects,the consolidated financial position of Beacon Roofing Supply, Inc. at September 30, 2009 and 2008, andthe consolidated results of its operations and its cash flows for each of the three years in the periodended September 30, 2009, in conformity with U.S. generally accepted accounting principles.
We also have audited, in accordance with the standards of the Public Company AccountingOversight Board (United States), Beacon Roofing Supply, Inc.’s internal control over financial reportingas of September 30, 2009, based on criteria established in Internal Control-Integrated Frameworkissued by the Committee of Sponsoring Organizations of the Treadway Commission and our reportdated December 1, 2009 expressed an unqualified opinion thereon.
As discussed in Note 2 to the consolidated financial statements, effective October 1, 2007, theCompany adopted the guidance originally issued in Financial Accounting Standards Board Accounting(FASB) Interpretation No. 48, Accounting for Uncertainty in Income Taxes (codified primarily in FASBASC Topic 740, Income Taxes).
Boston, MassachusettsDecember 1, 2009
42

Beacon Roofing Supply, Inc.
Consolidated Balance Sheets
September 30, September 30,(Dollars in thousands, except per share data) 2009 2008
AssetsCurrent assets:
Cash and cash equivalents . . . . . . . . . . . . . . . . . . . . . . . . . . . . . . . . . . $ 82,742 $ 26,038Accounts receivable, less allowance for doubtful accounts of $13,442 in
2009 and $12,978 in 2008 . . . . . . . . . . . . . . . . . . . . . . . . . . . . . . . . . 227,379 283,652Inventories . . . . . . . . . . . . . . . . . . . . . . . . . . . . . . . . . . . . . . . . . . . . . . 195,011 209,255Prepaid expenses and other current assets . . . . . . . . . . . . . . . . . . . . . . . 52,714 45,799Deferred income taxes . . . . . . . . . . . . . . . . . . . . . . . . . . . . . . . . . . . . . 19,323 18,126
Total current assets . . . . . . . . . . . . . . . . . . . . . . . . . . . . . . . . . . . . . . . . . 577,169 582,870Property and equipment, net . . . . . . . . . . . . . . . . . . . . . . . . . . . . . . . . . . 52,965 56,712Goodwill . . . . . . . . . . . . . . . . . . . . . . . . . . . . . . . . . . . . . . . . . . . . . . . . . 354,193 354,269Other assets, net . . . . . . . . . . . . . . . . . . . . . . . . . . . . . . . . . . . . . . . . . . . 56,459 73,965
Total assets . . . . . . . . . . . . . . . . . . . . . . . . . . . . . . . . . . . . . . . . . . . . . . . $1,040,786 $1,067,816
Liabilities and stockholders’ equityCurrent liabilities:
Accounts payable . . . . . . . . . . . . . . . . . . . . . . . . . . . . . . . . . . . . . . . . . $ 151,683 $ 198,429Accrued expenses . . . . . . . . . . . . . . . . . . . . . . . . . . . . . . . . . . . . . . . . . 75,536 89,755Current portions of long-term obligations . . . . . . . . . . . . . . . . . . . . . . . 15,092 19,926
Total current liabilities . . . . . . . . . . . . . . . . . . . . . . . . . . . . . . . . . . . . . . 242,311 308,110Senior notes payable, net of current portion . . . . . . . . . . . . . . . . . . . . . . . 322,090 332,500Deferred income taxes . . . . . . . . . . . . . . . . . . . . . . . . . . . . . . . . . . . . . . . 36,555 35,362Long-term obligations under equipment financing and other, net of current
portion . . . . . . . . . . . . . . . . . . . . . . . . . . . . . . . . . . . . . . . . . . . . . . . . 16,257 25,143
Commitments and contingencies (Notes 9 and 14)
Stockholders’ equity:Common stock (voting); $.01 par value; 100,000,000 shares authorized;
45,244,837 issued in 2009 and 44,820,550 issued in 2008 . . . . . . . . . . . 452 448Undesignated Preferred Stock; 5,000,000 shares authorized, none issued
or outstanding . . . . . . . . . . . . . . . . . . . . . . . . . . . . . . . . . . . . . . . . . — —Additional paid-in capital . . . . . . . . . . . . . . . . . . . . . . . . . . . . . . . . . . . 226,793 219,669Retained earnings . . . . . . . . . . . . . . . . . . . . . . . . . . . . . . . . . . . . . . . . 199,364 146,946Accumulated other comprehensive loss . . . . . . . . . . . . . . . . . . . . . . . . . (3,036) (362)
Total stockholders’ equity . . . . . . . . . . . . . . . . . . . . . . . . . . . . . . . . . . . . . 423,573 366,701
Total liabilities and stockholders’ equity . . . . . . . . . . . . . . . . . . . . . . . . . . $1,040,786 $1,067,816
See accompanying notes.
43

Beacon Roofing Supply, Inc.
Consolidated Statements of Operations
Year Ended
September 30, September 30, September 30,2009 2008 2007
(Dollars in thousands, except per share data)
Net sales . . . . . . . . . . . . . . . . . . . . . . . . . . . . . . . . . . . . . . $ 1,733,967 $ 1,784,495 $ 1,645,785Cost of products sold . . . . . . . . . . . . . . . . . . . . . . . . . . . . . 1,322,845 1,364,487 1,271,868
Gross profit . . . . . . . . . . . . . . . . . . . . . . . . . . . . . . . . . . . . 411,122 420,008 373,917Operating expenses . . . . . . . . . . . . . . . . . . . . . . . . . . . . . . . 301,913 325,298 304,109
Income from operations . . . . . . . . . . . . . . . . . . . . . . . . . . . 109,209 94,710 69,808
Interest expense . . . . . . . . . . . . . . . . . . . . . . . . . . . . . . . . . 22,887 25,904 27,434
Income before provision for income taxes . . . . . . . . . . . . . . 86,322 68,806 42,374Provision for income taxes . . . . . . . . . . . . . . . . . . . . . . . . . . 33,904 28,500 17,095
Net income . . . . . . . . . . . . . . . . . . . . . . . . . . . . . . . . . . . . $ 52,418 $ 40,306 $ 25,279
Net income per share:Basic . . . . . . . . . . . . . . . . . . . . . . . . . . . . . . . . . . . . . . . $ 1.16 $ 0.91 $ 0.57
Diluted . . . . . . . . . . . . . . . . . . . . . . . . . . . . . . . . . . . . . . $ 1.15 $ 0.90 $ 0.56
Weighted average shares used in computing net income pershare:Basic . . . . . . . . . . . . . . . . . . . . . . . . . . . . . . . . . . . . . . . 45,007,313 44,346,293 44,083,915
Diluted . . . . . . . . . . . . . . . . . . . . . . . . . . . . . . . . . . . . . . 45,493,786 44,959,357 44,971,932
See accompanying notes.
44
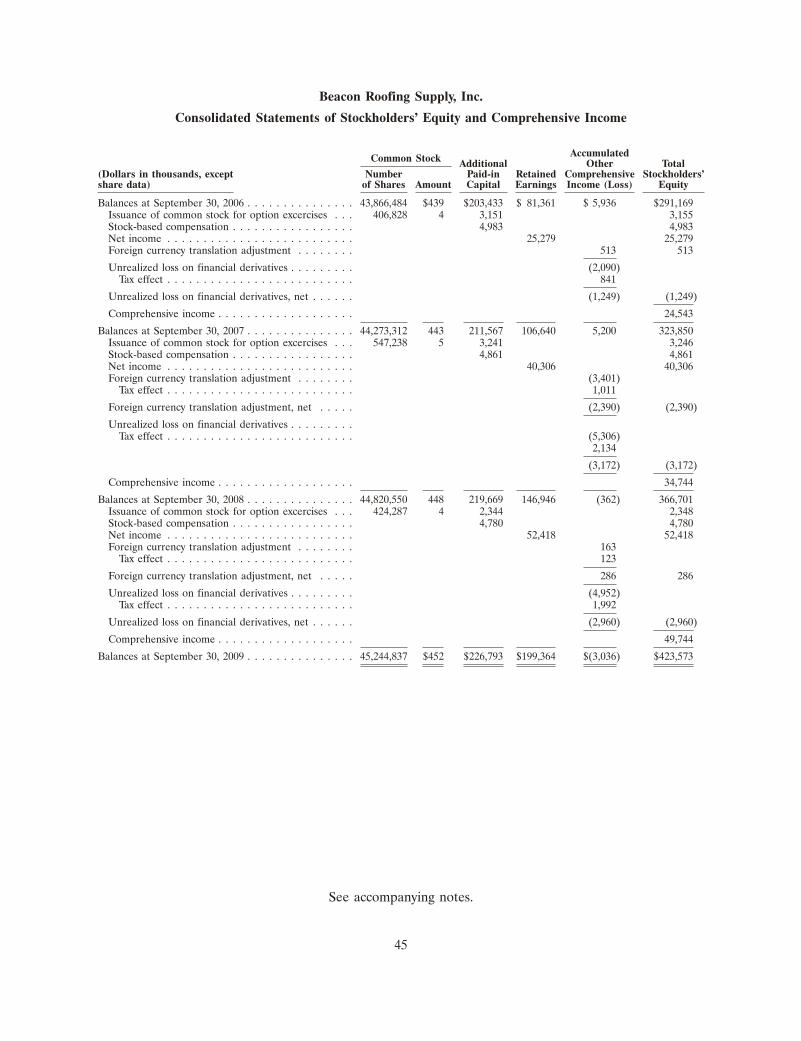
Beacon Roofing Supply, Inc.
Consolidated Statements of Stockholders’ Equity and Comprehensive Income
AccumulatedCommon Stock Additional Other Total(Dollars in thousands, except Number Paid-in Retained Comprehensive Stockholders’share data) of Shares Amount Capital Earnings Income (Loss) Equity
Balances at September 30, 2006 . . . . . . . . . . . . . . . 43,866,484 $439 $203,433 $ 81,361 $ 5,936 $291,169Issuance of common stock for option excercises . . . 406,828 4 3,151 3,155Stock-based compensation . . . . . . . . . . . . . . . . . 4,983 4,983Net income . . . . . . . . . . . . . . . . . . . . . . . . . . 25,279 25,279Foreign currency translation adjustment . . . . . . . . 513 513
Unrealized loss on financial derivatives . . . . . . . . . (2,090)Tax effect . . . . . . . . . . . . . . . . . . . . . . . . . . 841
Unrealized loss on financial derivatives, net . . . . . . (1,249) (1,249)
Comprehensive income . . . . . . . . . . . . . . . . . . . 24,543
Balances at September 30, 2007 . . . . . . . . . . . . . . . 44,273,312 443 211,567 106,640 5,200 323,850Issuance of common stock for option excercises . . . 547,238 5 3,241 3,246Stock-based compensation . . . . . . . . . . . . . . . . . 4,861 4,861Net income . . . . . . . . . . . . . . . . . . . . . . . . . . 40,306 40,306Foreign currency translation adjustment . . . . . . . . (3,401)
Tax effect . . . . . . . . . . . . . . . . . . . . . . . . . . 1,011
Foreign currency translation adjustment, net . . . . . (2,390) (2,390)
Unrealized loss on financial derivatives . . . . . . . . .Tax effect . . . . . . . . . . . . . . . . . . . . . . . . . . (5,306)
2,134
(3,172) (3,172)
Comprehensive income . . . . . . . . . . . . . . . . . . . 34,744
Balances at September 30, 2008 . . . . . . . . . . . . . . . 44,820,550 448 219,669 146,946 (362) 366,701Issuance of common stock for option excercises . . . 424,287 4 2,344 2,348Stock-based compensation . . . . . . . . . . . . . . . . . 4,780 4,780Net income . . . . . . . . . . . . . . . . . . . . . . . . . . 52,418 52,418Foreign currency translation adjustment . . . . . . . . 163
Tax effect . . . . . . . . . . . . . . . . . . . . . . . . . . 123
Foreign currency translation adjustment, net . . . . . 286 286
Unrealized loss on financial derivatives . . . . . . . . . (4,952)Tax effect . . . . . . . . . . . . . . . . . . . . . . . . . . 1,992
Unrealized loss on financial derivatives, net . . . . . . (2,960) (2,960)
Comprehensive income . . . . . . . . . . . . . . . . . . . 49,744
Balances at September 30, 2009 . . . . . . . . . . . . . . . 45,244,837 $452 $226,793 $199,364 $(3,036) $423,573
See accompanying notes.
45

Beacon Roofing Supply, Inc.
Consolidated Statements of Cash Flows
Year Ended
September 30, September 30, September 30,(In thousands) 2009 2008 2007
Operating activitiesNet income . . . . . . . . . . . . . . . . . . . . . . . . . . . . . . . . . . . . . $ 52,418 $ 40,306 $ 25,279Adjustments to reconcile net income to net cash provided by
operating activities:Depreciation and amortization . . . . . . . . . . . . . . . . . . . . . 30,389 34,240 32,863Stock-based compensation . . . . . . . . . . . . . . . . . . . . . . . . 4,780 4,861 4,983Deferred income taxes . . . . . . . . . . . . . . . . . . . . . . . . . . . (599) (2,838) 2,022Changes in assets and liabilities, net of the effects of
businesses acquired:Accounts receivable . . . . . . . . . . . . . . . . . . . . . . . . . . . 56,143 (17,434) (22,048)Inventories . . . . . . . . . . . . . . . . . . . . . . . . . . . . . . . . . . 14,168 (44,050) 13,815Prepaid expenses and other assets . . . . . . . . . . . . . . . . . (2,256) (9,645) 7,008Accounts payable and accrued expenses . . . . . . . . . . . . . (67,467) 44,127 (107)
Net cash provided by operating activities . . . . . . . . . . . . . . . 87,576 49,567 63,815
Investing activitiesPurchases of property and equipment, net of sale proceeds . . (13,656) (5,739) (23,132)Acquisition of businesses, net of cash acquired . . . . . . . . . . . — — (120,154)
Net cash used in investing activities . . . . . . . . . . . . . . . . . . . (13,656) (5,739) (143,286)
Financing activitiesRepayments under revolving lines of credit . . . . . . . . . . . . . . (4,955) (20,899) (203,684)Borrowings (repayments) under senior notes payable, and
other . . . . . . . . . . . . . . . . . . . . . . . . . . . . . . . . . . . . . . . (14,969) (6,131) 287,355Proceeds from exercise of options . . . . . . . . . . . . . . . . . . . . 1,717 1,302 1,115Payment of deferred financing costs . . . . . . . . . . . . . . . . . . . — — (3,087)Income tax benefit from stock-based compensation
deductions in excess of the associated compensation cost . . 631 1,944 2,040
Net cash provided (used) by financing activities . . . . . . . . . . (17,576) (23,784) 83,739Effect of exchange rate changes on cash . . . . . . . . . . . . . . . . 360 (475) 354
Net increase in cash and cash equivalents . . . . . . . . . . . . . . . 56,704 19,569 4,622Cash and cash equivalents at beginning of year . . . . . . . . . . . 26,038 6,469 1,847
Cash and cash equivalents at end of year . . . . . . . . . . . . . . . $ 82,742 $ 26,038 $ 6,469
Non-cash transactions:Conversion of senior notes payable to new senior notes
payable . . . . . . . . . . . . . . . . . . . . . . . . . . . . . . . . . . . . $ — $ — $ 66,839
Cash paid during the year for:Interest . . . . . . . . . . . . . . . . . . . . . . . . . . . . . . . . . . . . . . $ 22,929 $ 26,924 $ 22,835Income taxes, net of refunds . . . . . . . . . . . . . . . . . . . . . . $ 49,805 $ 11,695 $ 21,223
See accompanying notes
46

Beacon Roofing Supply, Inc.
Notes to Consolidated Financial Statements
Year Ended September 30, 2009
(dollars in thousands, except per share data or as otherwise indicated)
1. The Company
Business
Beacon Roofing Supply, Inc. (the ‘‘Company’’), which was formed on August 22, 1997, operates in37 states and three provinces in Canada and is incorporated in Delaware. During the periodspresented, the Company distributed roofing materials and other complementary building materials tocustomers in the United States and Canada through its wholly-owned subsidiaries, Beacon SalesAcquisition, Inc., Quality Roofing Supply Company, Inc., Beacon Roofing Supply Canada Company,Best Distributing Co., The Roof Center, Inc., West End Lumber Company, Inc., JGA Beacon, Inc,Shelter Distribution, Inc., Beacon Pacific, Inc. and North Coast Commercial Roofing Systems, Inc. OnOctober 1, 2009, the Company merged all of its U.S. subsidiaries into Beacon Sales Acquisition, Inc.After this merger, the Company’s remaining subsidiaries are Beacon Sales Acquisition, Inc., BeaconCanada, Inc. and Beacon Roofing Supply Canada Company. The Company continues to operate itsregional businesses under trade names associated with the former subsidiary corporate names.
Estimates
The preparation of consolidated financial statements requires management to make estimates andassumptions that affect the reported amounts of assets and liabilities, and disclosures of contingentassets and liabilities, at the date of the consolidated financial statements. Actual amounts could differfrom those estimates.
Adoption of Recent Accounting Pronouncements
In June 2009, the FASB issued guidance related to the FASB Accounting Standards Codification(‘‘ASC’’). Effective for interim and annual financial periods ending after September 15, 2009, the ASChas become the source of authoritative generally accepted accounting principles in the United Statesand supersedes all existing non-SEC accounting and reporting standards. All other non-grandfatherednon-SEC accounting literature not included in the ASC has become non-authoritative. This newguidance affected the way in which the Company references and reports accounting and reportingstandards beginning with these financial statements.
In May 2009, the FASB issued guidance on subsequent events that establishes general standards ofaccounting for and disclosure of events that occur after the balance sheet date and requires thedisclosure of the date through which an entity has evaluated subsequent events and whether thatrepresents the date the financial statements were issued or were available to be issued. This newguidance was effective for the Company in 2009 and, consistent with its prior practice, the Companyevaluated all subsequent events that occurred through the time these financial statements were filedwith the SEC on December 1, 2009.
In April 2009, the FASB issued disclosure guidance about fair value of financial instruments ininterim financial statements. This was effective for the Company in 2009 but had no impact on thefinancial statements.
Effective October 1, 2008, the Company followed new guidance from the FASB that clarifies thefair value objective and establishes a framework for developing fair value estimates. This new guidancealso establishes a fair value hierarchy that prioritizes the inputs used to measure fair value, giving the
47

Beacon Roofing Supply, Inc.
Notes to Consolidated Financial Statements (Continued)
Year Ended September 30, 2009
(dollars in thousands, except per share data or as otherwise indicated)
1. The Company (Continued)
highest priority to unadjusted quoted prices in active markets for identical assets or liabilities (Level 1inputs), the next priority to observable market based inputs or unobservable inputs that arecorroborated by market data (Level 2 inputs) and the lowest priority to unobservable inputs (Level 3inputs). The Company’s assets and liabilities that are measured at fair value on a recurring basis are itsinterest rate swaps and collars. Please refer to Note 17 for the related disclosures.
Also beginning October 1, 2008, new FASB guidance permits companies to measure many financialinstruments and certain other items at fair value at specified election dates. There was no impact onthe financial statements from this change as the Company chose to retain its current accountingvaluation methods for those items.
In March 2008, the FASB issued guidance that requires enhanced disclosures about an entity’sderivative and hedging activities. In addition to disclosing the fair values of derivative instruments andtheir gains and losses in a tabular format, entities are required to provide enhanced disclosures about(a) how and why an entity uses derivative instruments, (b) how derivative instruments and relatedhedged items are accounted for, and (c) how derivative instruments and related hedged items affect anentity’s financial position, financial performance and cash flows. This new guidance was effective for theCompany in the quarter ended March 31, 2009. Please refer to Note 17 for the related disclosures.
2. Summary of Significant Accounting Policies
Consolidation
The consolidated financial statements include the accounts of the Company and its wholly-ownedsubsidiaries. All inter-company transactions have been eliminated. Certain reclassifications have beenmade to the prior year information to conform to the current year presentation.
Fiscal Year
The fiscal years ended September 30, 2009 (‘‘2009’’), September 30, 2008 (‘‘2008’’), andSeptember 30, 2007 (‘‘2007’’) were all comprised of 52 weeks. Each of the Company’s first threequarters ends on the last day of the calendar month.
Industry Segment Information
Based on qualitative and quantitative criteria, the Company has determined that it operates withinone reportable segment, which is the wholesale distribution of building materials. Please refer to the‘‘Goodwill’’ summary below for discussion of the Company’s reporting units and the related impairmentreview.
Cash and Cash Equivalents
The Company considers all highly liquid investments with maturities of three months or less whenpurchased to be cash equivalents. Cash and cash equivalents also include unsettled credit cardtransactions. Our cash equivalents are comprised of money market funds which invest in commercialpaper or bonds with a rating of A-1 or better or in a U.S. Treasury money market fund.
48

Beacon Roofing Supply, Inc.
Notes to Consolidated Financial Statements (Continued)
Year Ended September 30, 2009
(dollars in thousands, except per share data or as otherwise indicated)
2. Summary of Significant Accounting Policies (Continued)
Inventories and Rebates
Inventories, consisting substantially of finished goods, are valued at the lower of cost or market.Cost is determined using the moving weighted-average cost method.
The Company’s arrangements with vendors typically provide for monthly, quarterly and/or annualrebates of a specified amount of consideration payable when a number of measures have beenachieved, generally related to a specified cumulative level of calendar-year purchases.
The Company accounts for such rebates as a reduction of the prices of the vendor’s inventory untilthe product is sold, at which time such rebates reduce cost of sales in the consolidated statements ofoperations. Throughout the year, the Company estimates the amount of the rebates based upon theexpected level of purchases. The Company continually revises these estimates to reflect actual rebatesearned based on actual purchase levels. Amounts due from vendors under these arrangements as ofSeptember 30, 2009 and September 30, 2008 totaled $38.9 and $36.3 million, respectively, and areincluded in ‘‘Prepaid expenses and other current assets’’ in the accompanying consolidated balancesheets.
Property and Equipment
Property and equipment acquired in connection with acquisitions are recorded at fair value as ofthe date of the acquisition and depreciated utilizing the straight-line method over the remaining lives.All other additions are recorded at cost, and depreciation is computed using the straight-line methodover the following estimated useful lives:
Asset Estimated Useful Life
Buildings and improvements . . . . . . . . . 10 to 40 yearsEquipment . . . . . . . . . . . . . . . . . . . . . . 3 to 10 yearsFurniture and fixtures . . . . . . . . . . . . . . 5 to 10 yearsLeasehold improvements . . . . . . . . . . . . Shorter of the estimated useful life or
the term of the lease, consideringrenewal options expected to be exercised.
Revenue Recognition
The Company recognizes revenue when the following four basic criteria are met:
• persuasive evidence of an arrangement exists;• delivery has occurred or services have been rendered;• the price to the buyer is fixed or determinable; and• collectability is reasonably assured.
Based on these criteria, the Company generally recognizes revenue at the point of sale or upondelivery to the customer site. For goods shipped by third party carriers, the Company recognizesrevenue upon shipment since the terms are generally FOB shipping point. The Company also arrangesfor certain products to be shipped directly from the manufacturer to the customer. The Company
49

Beacon Roofing Supply, Inc.
Notes to Consolidated Financial Statements (Continued)
Year Ended September 30, 2009
(dollars in thousands, except per share data or as otherwise indicated)
2. Summary of Significant Accounting Policies (Continued)
recognizes the gross revenue for these sales upon notifications of deliveries from the vendors. TheCompany also provides certain job site delivery services, which include crane rentals and rooftopdeliveries of certain products, for which the associated revenues are recognized upon completion of theservices. These revenues represent less than 1% of the Company’s sales. All revenues recognized arenet of sales taxes collected, allowances for discounts and estimated returns, which are provided for atthe time of pick up or delivery. Sales taxes collected are subsequently remitted to the appropriategovernment authorities.
Shipping and Handling Costs
The Company classifies shipping and handling costs, consisting of driver wages and vehicleexpenses, as operating expenses in the accompanying consolidated statements of operations. Shippingand handling costs were approximately $68,470 in 2009, $81,537 in 2008, and $79,272 in 2007.
Financial Derivatives
The Company enters into interest rate swaps and collars to minimize the risks and costs associatedwith financing activities, as well as to maintain an appropriate mix of fixed- and floating-rate debt. Theswap agreements are contracts to exchange variable-rate for fixed-interest rate payments over the life ofthe agreements. The collar agreements provide for fixed-rate caps and floors. The Company’s currentderivative instruments are designated as cash flow hedges, for which the Company records the effectiveportions of changes in their fair value, net of tax, in other comprehensive income. The Companyrecognizes any ineffective portion of the hedges in earnings, of which there has been none to date. TheCompany’s derivative instruments prior to April 2007 were not designated as hedges and thereforechanges in their fair values were recorded in interest expense.
Concentrations of Risk
Financial instruments, which potentially subject the Company to concentration of credit risk,consist principally of accounts receivable. The Company’s accounts receivable are primarily fromcustomers in the building industry located in the United States and Canada. Concentration of creditrisk with respect to accounts receivable is limited due to the large number of customers comprising theCompany’s customer base. The Company performs credit evaluations of its customers; however, theCompany’s policy is not to require collateral. At September 30, 2009 and 2008, the Company had nosignificant concentrations of credit risk.
Approximately 67% of the Company’s total cost of inventory purchases was from 7 vendors in2009, 9 vendors in 2008, and 11 vendors in 2007. In addition, inventory purchases exceeding 10% of thetotal cost of purchases were made from each of three vendors in 2009.
Impairment of Long-Lived Assets
Impairment losses are required to be recorded on long-lived assets when indicators of impairmentare present and the undiscounted cash flows estimated to be generated by those assets are less than theassets’ carrying value. If such assets are considered to be impaired, the impairment to be recognized is
50

Beacon Roofing Supply, Inc.
Notes to Consolidated Financial Statements (Continued)
Year Ended September 30, 2009
(dollars in thousands, except per share data or as otherwise indicated)
2. Summary of Significant Accounting Policies (Continued)
the total by which the carrying value exceeds the fair value determined using a discounted cash flowmodel.
Amortizable and Other Intangible Assets
The Company amortizes identifiable intangible assets consisting of non-compete agreements,customer relationships and deferred financing costs because these assets have finite lives. Non-competeagreements are generally amortized over the terms of the associated contractual agreements; customerrelationship assets are amortized on an accelerated basis based on the expected cash flows generated bythe existing customers; and deferred financing costs are amortized over the lives of the associatedfinancings. Trademarks are not amortized because they have indefinite lives. The Company evaluates itstrademarks for impairment on an annual basis based on the fair value of the underlying assets.
Goodwill
Goodwill represents the excess paid to acquire businesses over the estimated fair value of tangibleassets and identifiable intangible assets acquired, less liabilities assumed.
The Company tests goodwill for impairment in the fourth quarter of each fiscal year or at anyother time when impairment indicators exist. Examples of such indicators include a significant changein the business climate, unexpected competition, loss of key personnel or a decline in the Company’smarket capitalization below its net book value. In performing the impairment test, the Company utilizesa two-step approach. The first step requires a comparison of each reporting unit’s fair value to therespective carrying value. If the carrying value exceeds the fair value, a second step is performed tomeasure the amount of impairment loss, if any.
The Company assesses goodwill for impairment at the reporting unit level, which is defined as anoperating segment or one level below an operating segment, referred to as a component (defined as abusiness for which discrete financial information is available and regularly reviewed by componentmanagers), which in the Company’s case is its regions. The Company aggregates components within areporting unit that have similar economic characteristics. For purposes of determining the aggregation,the Company evaluates the distribution method, sales mix, and operating results of each of its regionsand concludes if these have or will be sustained over a long-term basis. For purposes of this evaluation,the Company would expect its regions to exhibit similar economic characteristics 3-5 years after eventssuch as an acquisition within its core roofing business or management/business restructuring. Thisevaluation also considers major storm activity or local economic challenges that may impact the shortterm operations of the region. Based on the Company’s evaluation at September 30, 2009, two of itsregions did not exhibit similar economic characteristics and therefore were individually evaluated forgoodwill impairment as separate reporting units. The remaining components were aggregated into athird reporting unit (the ‘‘Aggregated Reporting Unit’’) and tested in total for goodwill impairment.
The fair value of each reporting unit is estimated using a market approach, an income approach,or a weighted average of the two approaches. The market approach utilizes a guideline transactionmethod, which derives applicable market multiples from the prices at which comparable companies aretrading in an active marketplace. The Company believes the market approach generally provides a
51

Beacon Roofing Supply, Inc.
Notes to Consolidated Financial Statements (Continued)
Year Ended September 30, 2009
(dollars in thousands, except per share data or as otherwise indicated)
2. Summary of Significant Accounting Policies (Continued)
meaningful indicator of fair value as it reflects the current value at which shares of comparablecompanies are actively traded in a free and open market. The income approach utilizes a discountedcash flow method (‘‘DCF’’) that estimates after-tax cash flows on a debt-free basis, discounted topresent value using a risk-adjusted discount rate. The Company believes the DCF provides ameaningful indicator of fair value as well, since it appropriately measures the income producing assetsand reflects the income potential that would establish the amount paid by an investor.
The key assumptions used in the market approach included:
• The use of comparable publicly traded companies, which the Company considers to bedistributors of industrial construction products.
• The application of adjustments for a control premium and for risk and growth considerations,which were consistent with premiums and considerations in recent acquisitions.
The key assumptions used in the DCF approach included:
• The reporting unit’s five-year projections of financial results (including sales and marginimprovements), which were based on management’s strategic plans and long-range forecasts.Sales growth rates represent estimates based on current and forecasted sales mix and marketconditions. The profit margins were projected by each reporting unit based on historical margins,projected sales mix, current expense structure and anticipated expense reductions.
• The projected terminal value, which reflected the total present value of projected cash flowsbeyond the last period in the DCF. This value reflected our estimate for stable, perpetual growthof each reporting unit.
• The discount rate was set by using a weighted average cost of capital method that consideredmarket and industry data as well as Company-specific risk factors.
The Company utilized a market approach to determine the fair value of the Aggregated ReportingUnit and a combination of income and market approaches to determine the fair values of the twoother reporting units. Given the size of the respective reporting units, relative to the overall Company,the Company believes these approaches provide the best indications of the fair values. To corroborateits calculations, management reconciled the Company’s total market capitalization to the sum of thefair values of the three reporting units. The Company’s market capitalization reflects an implied controlpremium, which the Company believes is consistent with recent acquisitions in the industry.
Based on the Company’s calculations, the fair value of the Aggregated Reporting Unit significantlyexceeded the respective carrying value. In addition, for one of the two remaining reporting units, with$63.3 million in goodwill, the Company’s calculations indicated a fair value which significantly exceededthe unit’s carrying value, while the other reporting unit with $70.8 million in goodwill, provided fairvalue indications ranging from 5% to 8% above its carrying value. The significant inputs used in thefair value calculations discussed above represent the Company’s best estimate. Management performedsensitivity analyses utilizing more conservative assumptions for the fair value estimate of the reportingunit that had only a 5% to 8% excess fair value. For example, management changed the discount rateand the terminal growth rate by 100 basis points each and reduced the forecasted cash flows andmarket multiples by 10% each. These analyses noted that an individual change to any one of theseassumptions would not reduce the fair value below the carrying value; however any combination of
52

Beacon Roofing Supply, Inc.
Notes to Consolidated Financial Statements (Continued)
Year Ended September 30, 2009
(dollars in thousands, except per share data or as otherwise indicated)
2. Summary of Significant Accounting Policies (Continued)
these changes in assumptions would reduce the fair value below its carrying value. As a result, if actualoperating results and/or the underlying assumptions used in the analyses differ from expected, a futureimpairment charge may be necessary.
Based on the results of the first step of the impairment test, the second step was not required andno impairment was recognized. If circumstances change or events occur to indicate that the fair valueof any of the Company’s reporting units (under the guidelines discussed above) has fallen below itscarrying value, management will compare the estimated fair value of the goodwill to its carrying value.If the book value of the goodwill exceeds the implied fair value of the goodwill, the Company willrecognize the difference as an impairment loss in the determination of operating income.
Stock-Based Compensation
The Company accounts for employee and non-employee director stock-based compensation usingthe fair value method of accounting. The Company estimates forfeitures in calculating the expenserelated to stock-based compensation. In addition, the Company reports the benefits of tax deductionsin excess of recognized compensation cost as both a financing cash inflow and an operating cashoutflow. The excess tax benefit classified as a financing activity would have been classified as anoperating inflow if the Company did not use the fair value method.
Compensation cost arising from stock options granted to employees and non-employee directors isrecognized as expense using the straight-line method over the vesting period, which represents therequisite service period. As of September 30, 2009, there was $4.3 million of total unrecognizedcompensation cost related to stock options. That cost is expected to be recognized over a weighted-average period of 1.9 years. The Company recorded stock-based compensation expense of $4.8 million($2.9 million net of tax) or $0.06 per basic share and per diluted share in 2009, $4.9 million($2.9 million net of tax) or $0.06 per basic share and per diluted share in 2008, and $5.0 million($3.0 million net of tax) or $0.07 per basic share and per diluted share in 2007.
The fair values of the options were estimated on the dates of the grants using the Black-Scholesoption-pricing model with the following weighted-average assumptions:
Year Ended
September 30, September 30, September 30,2009 2008 2007
Dividend yield . . . . . . . . . . . . . . . . . . . . . . . . . . . . . . . . . . — — —Expected life in years . . . . . . . . . . . . . . . . . . . . . . . . . . . . . 7 6 5Risk-free interest rate . . . . . . . . . . . . . . . . . . . . . . . . . . . . . 2.49% 3.91% 4.78%Expected volatility . . . . . . . . . . . . . . . . . . . . . . . . . . . . . . . . 48.00% 45.00% 45.00%Weighted average fair value of options granted . . . . . . . . . . . $ 6.35 $ 4.55 $10.06
Expected lives of the options granted are based primarily on historical option activity, whileexpected volatilities are based on the historical volatilities of the Company’s stock and stocks ofcomparable public companies. Estimated cumulative forfeiture rates of 0.0-15.0% were utilized in theexpense recognition of options in 2009 and 2008 and 0.0-10% in 2007. The risk-free interest rates are
53

Beacon Roofing Supply, Inc.
Notes to Consolidated Financial Statements (Continued)
Year Ended September 30, 2009
(dollars in thousands, except per share data or as otherwise indicated)
2. Summary of Significant Accounting Policies (Continued)
based on the market yields on U.S. Treasury securities at a 5-year constant maturity, quoted on aninvestment basis, on the dates of the grants. The Company has not paid any cash dividends and doesnot anticipate paying dividends in the foreseeable future.
Comprehensive Loss
Accumulated other comprehensive loss consisted of the following:
September 30, September 30,2009 2008
Foreign currency translation adjustment . . . . . . . . . . . . . $ 6,683 $ 6,520Tax effect . . . . . . . . . . . . . . . . . . . . . . . . . . . . . . . . . (2,338) (2,461)
Foreign currency translation adjustment, net . . . . . . . . . . 4,345 4,059
Unrealized loss on financial derivatives . . . . . . . . . . . . . (12,348) (7,396)Tax effect . . . . . . . . . . . . . . . . . . . . . . . . . . . . . . . . . 4,967 2,975
Unrealized loss on financial derivatives, net . . . . . . . . . . (7,381) (4,421)
Accumulated other comprehensive loss . . . . . . . . . . . . . . $ (3,036) $ (362)
Net Income per Share
Basic net income per common share is computed by dividing net income by the weighted averagenumber of common shares outstanding. Diluted net income per common share is computed by dividingnet income by the weighted average number of common shares and dilutive common share equivalentsthen outstanding using the treasury stock method. Common equivalent shares consist of theincremental common shares issuable upon the exercise of stock options.
The following table reflects the calculation of weighted average shares outstanding for each periodpresented:
Year Ended
September 30, September 30, September 30,2009 2008 2007
Weighted-average common shares outstanding for basic . . . . . 45,007,313 44,346,293 44,083,915Dilutive effect of employee stock options . . . . . . . . . . . . . . . 486,473 613,064 888,017
Weighted-average shares assuming dilution . . . . . . . . . . . . . . 45,493,786 44,959,357 44,971,932
54

Beacon Roofing Supply, Inc.
Notes to Consolidated Financial Statements (Continued)
Year Ended September 30, 2009
(dollars in thousands, except per share data or as otherwise indicated)
2. Summary of Significant Accounting Policies (Continued)
Fair Value of Financial Instruments
Financial instruments consist mainly of cash and cash equivalents, accounts receivable, accountspayable, borrowings under the Company’s revolving lines of credit and long-term debt. Except for thelong-term debt, these instruments are short-term in nature, and there is currently no known tradingmarket for the Company’s debt. Therefore, at September 30, 2009 and 2008, the Company believes thecarrying amounts of its financial instruments approximated their fair values. Please refer to Note 17 fordisclosures of the Company’s financial derivatives that are recorded at fair value.
Income Taxes
The Company accounts for income taxes using the liability method, which requires it to recognizea current tax liability or asset for current taxes payable or refundable and a deferred tax liability orasset for the estimated future tax effects of temporary differences between the financial statement andtax reporting bases of assets and liabilities to the extent that they are realizable. Deferred tax expense(benefit) results from the net change in deferred tax assets and liabilities during the year.
The Company adopted the accounting guidance originally issued in FASB Interpretation No. 48,Accounting for Uncertainty in Income Taxes (codified primarily in FASB ASC Topic 740, Income Taxes)effective October 1, 2007, which prescribes a recognition threshold and measurement attribute for thefinancial statement recognition and measurement of a tax position taken or expected to be taken in atax return. In connection with the adoption, the Company analyzed its filing positions in all of thefederal and state jurisdictions where it is required to file income tax returns, as well as all open taxyears in these jurisdictions. There was no material impact on the consolidated financial statementsupon adoption.
Foreign Currency Translation
The assets and liabilities of the Company’s foreign subsidiary, Beacon Roofing Supply CanadaCompany (‘‘BRSCC’’), are translated into U.S. dollars at current exchange rates as of the balance sheetdate, and revenues and expenses are translated at average monthly exchange rates. Net unrealizedtranslation gains or losses are recorded directly to a separate component of stockholders’ equity, net ofrecognized deferred taxes. Foreign currency transactions were minimal and realized gains and losseswere not material for any of the periods presented. The Company has inter-company debt fromBRSCC, which has been considered as long-term for financial reporting purposes since repayment isnot planned or anticipated in the foreseeable future. Accordingly, the balance is marked to market eachperiod with a corresponding entry recorded as a separate component of stockholders’ equity.
Recent Accounting Pronouncements
In June 2009, the FASB issued guidance that changes the way entities account for securitizationsand special purpose entities. This new guidance is effective for annual reporting periods beginning afterNovember 15, 2009. The Company believes this change will not have an impact on its financialstatements.
55

Beacon Roofing Supply, Inc.
Notes to Consolidated Financial Statements (Continued)
Year Ended September 30, 2009
(dollars in thousands, except per share data or as otherwise indicated)
2. Summary of Significant Accounting Policies (Continued)
In December 2007, the FASB issued guidance that will significantly change the accounting for andreporting of business combination transactions and noncontrolling (minority) interests in consolidatedfinancial statements. This guidance will be effective for the Company’s financial statements in the fiscalyear beginning October 1, 2009. Earlier adoption is prohibited. The Company believes the adoption ofthis guidance could have a significant impact on the accounting for its future acquisitions, depending onthe circumstances and the terms of the acquisitions.
3. Goodwill, Intangibles and Other Assets
Goodwill was $354,193 and $354,269 at September 30, 2009 and 2008, respectively, of which$223,244 can be amortized for income tax purposes. The Company’s goodwill decreased by $76 and$886 in 2009 and 2008, respectively, due to changes in foreign currency translation.
Intangibles and other assets, included in other long-term assets, consisted of the following:
September 30, September 30,2009 2008
Amortizable intangible assetsNon-compete agreememts . . . . . . . . . . . . . . . . . . . . . $ 5,150 $ 5,150Customer relationships . . . . . . . . . . . . . . . . . . . . . . . . 88,746 88,746Beneficial lease arrangements . . . . . . . . . . . . . . . . . . . 610 610Deferred financing costs and other . . . . . . . . . . . . . . . 7,334 7,345
101,840 101,851Less: accumulated amortization . . . . . . . . . . . . . . . . . 55,131 42,136
46,709 59,715Unamortizable trademarks . . . . . . . . . . . . . . . . . . . . . . . 9,750 9,750Other assets . . . . . . . . . . . . . . . . . . . . . . . . . . . . . . . . . — 4,500
Total other intangible assets . . . . . . . . . . . . . . . . . . . . . . $ 56,459 $ 73,965
Amortization expense related to intangible assets amounted to approximately $12,995, $15,859, and$15,071 in 2009, 2008, and 2007, respectively. The intangible lives range from one to fifteen years andthe weighted average remaining life was 11.6 years at September 30, 2009. Estimated future annualamortization for the above intangible assets as of September 30, 2009 is $10,451, $8,587, $6,859, $5,426,$3,757 and $11,629 for 2010, 2011, 2012, 2013, 2014 and thereafter, respectively.
4. Acquisitions
On April 2, 2007, the Company purchased 100% of the outstanding stock of North CoastCommercial Roofing Systems, Inc. and certain of its subsidiaries and affiliates (together ‘‘NorthCoast’’), a Twinsburg, Ohio-based distributor of commercial roofing systems and related accessories,with 16 locations in eight U.S. states at the time of the acquisition. North Coast had branches in Ohio,Illinois, Indiana, Kentucky, Michigan, New York, Pennsylvania and West Virginia. This purchase wasfunded with cash on hand along with funds borrowed under the Company’s U.S. revolving line of
56

Beacon Roofing Supply, Inc.
Notes to Consolidated Financial Statements (Continued)
Year Ended September 30, 2009
(dollars in thousands, except per share data or as otherwise indicated)
4. Acquisitions (Continued)
credit. North Coast had net sales of $235 million (unaudited) for the year ended March 31, 2006. Atotal of $4.5 million of the acquisition price remains in escrow at September 30, 2009 for post-closingindemnification claims, which is included in other current assets and accrued expenses. The Companyhas included the results of operations for North Coast from the date of acquisition and appliedpurchase accounting, which, along with certain purchase price adjustments, resulted in recordedgoodwill of $62.3 million as per below (in 000’s). The Company finalized the purchase accounting inthe third quarter of 2008.
Accounts receivable . . . . . . . . . . . . . . . . . . . . . . . . . . . . . . . . . . . . . . . . $ 31,706Inventories . . . . . . . . . . . . . . . . . . . . . . . . . . . . . . . . . . . . . . . . . . . . . . 13,349Prepaid expenses and other . . . . . . . . . . . . . . . . . . . . . . . . . . . . . . . . . . 982Property and equipment . . . . . . . . . . . . . . . . . . . . . . . . . . . . . . . . . . . . . 4,150Deferred taxes . . . . . . . . . . . . . . . . . . . . . . . . . . . . . . . . . . . . . . . . . . . . (10,400)Accounts payable and accrued expenses . . . . . . . . . . . . . . . . . . . . . . . . . (19,189)
Net assets . . . . . . . . . . . . . . . . . . . . . . . . . . . . . . . . . . . . . . . . . . . . . . . 20,598Non-compete . . . . . . . . . . . . . . . . . . . . . . . . . . . . . . . . . . . . . . . . . . . . 3,300Customer relationships . . . . . . . . . . . . . . . . . . . . . . . . . . . . . . . . . . . . . 29,550Goodwill . . . . . . . . . . . . . . . . . . . . . . . . . . . . . . . . . . . . . . . . . . . . . . . . 62,282
Purchase price . . . . . . . . . . . . . . . . . . . . . . . . . . . . . . . . . . . . . . . . . . . . $115,730
Unaudited pro forma net sales for the year ended September 30, 2007, assuming the acquisition ofNorth Coast had occurred at the beginning of the year were $1,744 million. Pro forma net income andnet income per share for that period were not presented as the impact of the North Coast acquisitionon net income was not material.
5. Prepaid Expenses and Other Current Assets
The significant components of prepaid expenses and other current assets were as follows:
September 30, September 30,2009 2008
Vendor rebates . . . . . . . . . . . . . . . . . . . . . . . . . . . . . . . $38,857 $36,303Refundable income taxes . . . . . . . . . . . . . . . . . . . . . . . . 3,545 —Other . . . . . . . . . . . . . . . . . . . . . . . . . . . . . . . . . . . . . . 10,312 9,496
$52,714 $45,799
57

Beacon Roofing Supply, Inc.
Notes to Consolidated Financial Statements (Continued)
Year Ended September 30, 2009
(dollars in thousands, except per share data or as otherwise indicated)
6. Property and Equipment, net
Property and equipment, net, consisted of the following:
September 30, September 30,2009 2008
Land . . . . . . . . . . . . . . . . . . . . . . . . . . . . . . . . . . . . . . $ 3,190 $ 2,159Buildings and leasehold improvements . . . . . . . . . . . . . . 18,725 16,651Equipment . . . . . . . . . . . . . . . . . . . . . . . . . . . . . . . . . . 100,731 95,774Furniture and fixtures . . . . . . . . . . . . . . . . . . . . . . . . . . 10,478 10,092
133,124 124,676Less: accumulated depreciation and amortization . . . . . . 80,159 67,964
$ 52,965 $ 56,712
Depreciation and amortization of property and equipment totaled $17,394, $18,381 and $17,792 in2009, 2008 and 2007, respectively.
7. Accrued Expenses
The significant components of accrued expenses were as follows:
September 30, September 30,2009 2008
Uninvoiced inventory receipts . . . . . . . . . . . . . . . . . . . . $19,970 $23,044Employee-related accruals . . . . . . . . . . . . . . . . . . . . . . . 18,736 19,903Income taxes payable . . . . . . . . . . . . . . . . . . . . . . . . . . — 15,293Unrealized loss on financial derivatives . . . . . . . . . . . . . 12,348 7,396Other . . . . . . . . . . . . . . . . . . . . . . . . . . . . . . . . . . . . . . 24,482 24,119
$75,536 $89,755
8. Financing Arrangements
Senior Secured Credit Facilities
On November 2, 2006, the Company entered into an amended and restated seven-year$500 million U.S. senior secured credit facility and a C$15 million senior secured Canadian creditfacility with GE Antares Capital (‘‘GE Antares’’) and a syndicate of other lenders (combined, the‘‘Credit Facility’’). The Credit Facility refinanced the prior $370 million credit facilities that also wereprovided through GE Antares. The Credit Facility provides the Company with lower interest rates andavailable funds for future acquisitions and ongoing working capital requirements. In addition, theCredit Facility increases the allowable total equipment financing and/or capital lease financing to$35 million. The Credit Facility provides for a cash receipts lock-box arrangement that gives theCompany sole control over the funds in lock-box accounts, unless excess availability is less than$10 million or an event of default occurs, in which case the senior secured lenders would have the rightto take control over such funds and to apply such funds to repayment of the senior debt.
58

Beacon Roofing Supply, Inc.
Notes to Consolidated Financial Statements (Continued)
Year Ended September 30, 2009
(dollars in thousands, except per share data or as otherwise indicated)
8. Financing Arrangements (Continued)
The Credit Facility consists of a U.S. revolving credit facility of $150 million (the ‘‘US Revolver’’),which includes a sub-facility of $20 million for letters of credit, and an initial $350 million term loan(the ‘‘Term Loan’’). The Credit Facility also includes a C$15 million senior secured revolving creditfacility provided by GE Canada Finance Holding Company (the ‘‘Canada Revolver’’). There was acombined $158.9 million available for borrowings and less than $0.1 million outstanding under the USRevolver and Canadian Revolver at September 30, 2009. There were $5.1 million of outstandingstandby letters of credit at September 30, 2009. The Term Loan requires amortization of 1% per year,payable in quarterly installments of approximately $0.9 million, plus any required prepayments underthe Excess Cash Flow and the remainder is due in 2013. The Credit Facility may also be expanded byup to an additional $200 million under certain conditions. There are mandatory prepayments under theCredit Facility under certain conditions, including the following cash flow condition:
Excess Cash Flow
On May 15 of each fiscal year, commencing on May 15, 2008, the Company must pay an amountequal to 50% of the Excess Cash Flow (as defined in the Credit Facility) for the prior fiscal year, notto exceed $7.0 million with respect to any fiscal year. Based on its results for 2009, the Company willbe required to make a $7.0 million payment by May 15, 2010. The amounts payable of $7.0 millionunder this provision at September 30, 2009 and 2008 were classified as short-term debt.
Interest
Interest on borrowings under the U.S. credit facility is payable at the Company’s election at eitherof the following rates:
• the base rate (that is the higher of (a) the base rate for corporate loans quoted in The WallStreet Journal or (b) the Federal Reserve overnight rate plus 1⁄2 of 1%) plus a margin of 0.75%for the Term Loan.
• the current LIBOR Rate plus a margin of 1.00% (for US Revolver loans) or 2.00% (for TermLoan).
Interest under the Canadian credit facility is payable at the Company’s election at either of thefollowing rates:
• an index rate (that is the higher of (1) the Canadian prime rate as quoted in The Globe andMail and (2) the 30-day BA Rate plus 0.75%), or
• the BA rate as described in the Canadian facility plus 1.00%.
The US Revolver currently carries an interest rate at the base rate (3.25% at September 30, 2009),while the Canada revolver carries an interest rate of the Canadian prime rate plus 0.75% (2.5% atSeptember 30, 2009), and the Term Loan carries an interest rate of LIBOR plus 2% (2.25% and 2.60%for two LIBOR arrangements under the Term Loan at September 30, 2009). Unused fees on therevolving credit facilities are 0.25% per annum. Availability under the revolving credit facilities islimited to 85% of eligible accounts receivable, increasing to 90% from January through April of each
59

Beacon Roofing Supply, Inc.
Notes to Consolidated Financial Statements (Continued)
Year Ended September 30, 2009
(dollars in thousands, except per share data or as otherwise indicated)
8. Financing Arrangements (Continued)
year. Financial covenants, which apply only to the Term Loan, are limited to a leverage ratio and ayearly capital expenditure limitation as follows:
Maximum Consolidated Leverage Ratio
On the last day of each fiscal quarter, the Company’s Consolidated Leverage Ratio, as defined,must not be greater than 4.00:1.0. At September 30, 2009, this ratio was 1.90:1.0.
Capital Expenditures
The Company cannot incur aggregate Capital Expenditures, as defined, in excess of three percent(3.00%) of consolidated gross revenue for any fiscal year.
As of September 30, 2009, the Company was in compliance with these covenants. Substantially allof the Company’s assets, including the capital stock and assets of wholly-owned subsidiaries, secureobligations under the Credit Facility.
Senior Notes Payable
Senior notes payable under the Term Loan consisted of the following:
September 30, September 30,2009 2008
Senior notes payable to commercial lenders, due in equalquarterly payments of principal of $0.9 million with theremainder due in 2013, plus required prepaymentamounts and interest at the base rate, as defined, plus0.75% or LIBOR plus 2.0% (2.25% and 2.60% atSeptember 30, 2009) through November 2013 . . . . . . . $332,518 $343,000
Less current portion . . . . . . . . . . . . . . . . . . . . . . . . . . . 10,428 10,500
$322,090 $332,500
Prior Senior Secured Credit Facilities
The credit facilities in place prior to the Credit Facility discussed above were scheduled to matureon October 14, 2010 and consisted of a $280 million U.S. revolving line of credit and a C$15 millionCanadian revolving line of credit, referred to as revolvers, and term loans totaling $90 million. Thesefacilities provided for the same lock-box arrangements as under the Credit Facility. At the time of therefinancing discussed above, there was $227.8 million of borrowings outstanding under the priorrevolvers.
Equipment Financing Facilities
The Company has an equipment financing facility which allows for the financing of up to$5.5 million of purchased transportation and material handling equipment through February 15, 2010 at
60

Beacon Roofing Supply, Inc.
Notes to Consolidated Financial Statements (Continued)
Year Ended September 30, 2009
(dollars in thousands, except per share data or as otherwise indicated)
8. Financing Arrangements (Continued)
an interest rate approximately 3% above the 5- or 6-year term swap rate at the time of the advances.There were no amounts outstanding under this facility at September 30, 2009; however, there were$19.9 million of equipment financing loans outstanding under prior equipment financing facilities atSeptember 30, 2009, with fixed interest rates ranging from 5.5% to 7.4%.
Other Information
Annual principal payments for all outstanding borrowings for each of the next five years andthereafter as of September 30, 2009 were as follows:
RevolvingSenior Secured Equipment Lines of
Fiscal year Credit Facility Financing Credit Total
2010 . . . . . . . . . . . . . . . . . . . . . . . . $ 10,428 $ 4,653 $11 $ 15,0922011 . . . . . . . . . . . . . . . . . . . . . . . . 3,428 4,899 — 8,3272012 . . . . . . . . . . . . . . . . . . . . . . . . 3,428 4,302 — 7,7302013 . . . . . . . . . . . . . . . . . . . . . . . . 315,234 3,403 — 318,6372014 . . . . . . . . . . . . . . . . . . . . . . . . — 2,547 — 2,547Thereafter . . . . . . . . . . . . . . . . . . . . — 54 — 54
Subtotal . . . . . . . . . . . . . . . . . . . . . 332,518 19,858 11 352,387Less current portion . . . . . . . . . . . . . 10,428 4,653 11 15,092
Total long-term debt . . . . . . . . . . . . . $322,090 $15,205 $— $337,295
9. Leases
The Company mostly operates in leased facilities, which are accounted for as operating leases. Theleases typically provide for a base rent plus real estate taxes. Certain of the leases provide forescalating rents over the lives of the leases and rent expense is recognized over the terms of thoseleases on a straight-line basis. The Company leases two buildings from a limited liability entity that ispartly owned by one of the Company’s directors for an aggregate expense of approximately $0.4 millionin 2009, $0.5 million in 2008, and $0.6 million in 2007. The director’s interest in the dollar value ofthese lease arrangements was approximately 33% at September 30, 2009.
61

Beacon Roofing Supply, Inc.
Notes to Consolidated Financial Statements (Continued)
Year Ended September 30, 2009
(dollars in thousands, except per share data or as otherwise indicated)
9. Leases (Continued)
At September 30, 2009, the minimal rental commitments under all non-cancelable operating leaseswith initial or remaining terms of more than one year were as follows:
OperatingYear ending September Leases
2010 . . . . . . . . . . . . . . . . . . . . . . . . . . . . . . . . . . . . . . . . . . . . . . . . . . . $22,8452011 . . . . . . . . . . . . . . . . . . . . . . . . . . . . . . . . . . . . . . . . . . . . . . . . . . . 17,7692012 . . . . . . . . . . . . . . . . . . . . . . . . . . . . . . . . . . . . . . . . . . . . . . . . . . . 13,8742013 . . . . . . . . . . . . . . . . . . . . . . . . . . . . . . . . . . . . . . . . . . . . . . . . . . . 9,5752014 . . . . . . . . . . . . . . . . . . . . . . . . . . . . . . . . . . . . . . . . . . . . . . . . . . . 7,180Thereafter . . . . . . . . . . . . . . . . . . . . . . . . . . . . . . . . . . . . . . . . . . . . . . . 6,392
Total minimum lease payments . . . . . . . . . . . . . . . . . . . . . . . . . . . . . . . . $77,635
Rent expense was $25,761 in 2009, $24,823 in 2008 and $23,022 in 2007. Sublet income wasimmaterial for these years.
10. Stock Options
Stock Option Plans
The Company is currently making stock-based awards under its 2004 Stock Plan, which wasadopted on September 21, 2004. The 2004 Stock Plan allows for the granting of up to 5.05 millionshares of Common Stock in the form of stock options or stock awards to key employees and membersof the Board of Directors. The key terms of the grants are determined by the Company’s Board ofDirectors.
The 1998 Stock Plan allowed for the granting of options to purchase up to 3.1 million shares ofCommon Stock. Options were generally allowed to be exercised beginning 18 months after the date ofgrant and will terminate ten years from the grant date. No further awards will be made under the 1998Stock Plan.
In the event of a change in control of the Company, all outstanding options are immediatelyvested.
62

Beacon Roofing Supply, Inc.
Notes to Consolidated Financial Statements (Continued)
Year Ended September 30, 2009
(dollars in thousands, except per share data or as otherwise indicated)
10. Stock Options (Continued)
Information regarding the Company’s stock options is summarized below (not in thousands):
Weighted-Weighted- AverageAverage Remaining Aggregate
Number Exercise Contractual Intrinsicof Shares Price Life Value
(in Millions)
Outstanding at September 30, 2006 . . . . . . . . . . . . . . . 2,800,659 $ 8.47Granted . . . . . . . . . . . . . . . . . . . . . . . . . . . . . . . . . 736,250 21.89Exercised . . . . . . . . . . . . . . . . . . . . . . . . . . . . . . . . (406,828) 2.74Canceled . . . . . . . . . . . . . . . . . . . . . . . . . . . . . . . . . (84,961) 20.35
Outstanding at September 30, 2007 . . . . . . . . . . . . . . . 3,045,120 12.15Granted . . . . . . . . . . . . . . . . . . . . . . . . . . . . . . . . . 759,023 9.34Exercised . . . . . . . . . . . . . . . . . . . . . . . . . . . . . . . . (547,238) 2.38Canceled . . . . . . . . . . . . . . . . . . . . . . . . . . . . . . . . . (174,825) 17.26
Outstanding at September 30, 2008 . . . . . . . . . . . . . . . 3,082,080 $12.90Granted . . . . . . . . . . . . . . . . . . . . . . . . . . . . . . . . . 873,356 12.20Exercised . . . . . . . . . . . . . . . . . . . . . . . . . . . . . . . . (424,287) 4.05Canceled . . . . . . . . . . . . . . . . . . . . . . . . . . . . . . . . . (113,395) 16.56
Outstanding at September 30, 2009 . . . . . . . . . . . . . . . 3,417,754 $13.70 7.0 $13.6
Vested or Expected to Vest at September 30, 2009 . . . . 3,316,493 $13.73 7.0 $13.2
Exercisable at September 30, 2009 . . . . . . . . . . . . . . . . 1,971,164 $14.46 5.9 $ 7.6
There were options available for grants to purchase 1,734,763 shares of Common Stock under the2004 Stock Plan at September 30, 2009. The Company granted 800,000 additional options under the2004 Stock Plan to management in November 2009. The weighted-average grant date fair values ofstock options granted during 2009, 2008 and 2007 were $6.35, $4.55 and $10.06, respectively. Theintrinsic values of stock options exercised during 2009 and 2008 were $4.2 million and $7.2 million,respectively. At September 30, 2009, the Company had $14.1 million of excess tax benefits available forpotential deferred tax write-offs related to option accounting.
63

Beacon Roofing Supply, Inc.
Notes to Consolidated Financial Statements (Continued)
Year Ended September 30, 2009
(dollars in thousands, except per share data or as otherwise indicated)
10. Stock Options (Continued)
Details regarding options to purchase common stock outstanding as of September 30, 2009 were asfollows:
WeightedOptions Range of Average Contractual Options
Outstanding Exercise Prices Life in Years Exercisable
300,095 $0.85 - $2.33 3.3 300,09545,000 8.04 8.1 15,000
645,195 $8.67 - $10.60 7.9 256,3221,200,131 $11.56 - $12.93 7.9 351,282
68,250 $13.64 - $14.18 5.5 67,250484,498 $16.63 - $18.64 6.3 484,498646,460 $22.16 - $24.38 6.9 468,59228,125 $26.09 - $27.17 6.4 28,125
3,417,754 1,971,164
Special CEO Options Grant
The Company granted stock options to its President and Chief Executive Officer (CEO) inOctober 2003 under an executive securities agreement. The grant included options to purchase 505,050shares of common stock at the then fair value and was scheduled to vest over two years. In January2004, the Company and the CEO amended the special purchase option agreement to increase thenumber of shares that could be purchased under the options to 612,366 shares. Such amendment didnot change the exercise price, contractual term or vesting of the original award. Under this grant, theexercise price must be paid in cash, unless the Company permits otherwise. The options became fullyvested after the completion of the Company’s IPO and expire on October 20, 2013. These options werenot granted under the Company’s 1998 Stock Plan or 2004 Stock Plan. Options to purchase 150,000,220,000, and 200,000 shares under this grant were exercised in 2006, 2008, and 2009, respectively,leaving 42,366 and 242,366 options outstanding under the special CEO grant at September 30, 2009 and2008, respectively.
11. Benefit Plans
The Company maintains defined contribution plans covering all full-time employees of theCompany who have 90 days of service and are at least 21 years old. An eligible employee may elect tomake a before-tax contribution of between 1% and 100% of his or her compensation through payrolldeductions, not to exceed the annual limit set by law. The Company currently matches the first 50% ofparticipant contributions limited to 6% of a participant’s gross compensation (maximum Companymatch is 3%). Additional amounts associated with profit sharing were contributed in the three yearspresented and are scheduled to be contributed in 2010 for 2009 as well. All Company contributions aresubject to the discretion of management and the board of directors. The combined expense for thisplan and a similar plan for our Canadian employees was $6,253 in 2009, $5,775 in 2008 and $4,485 in2007.
64

Beacon Roofing Supply, Inc.
Notes to Consolidated Financial Statements (Continued)
Year Ended September 30, 2009
(dollars in thousands, except per share data or as otherwise indicated)
11. Benefit Plans (Continued)
The Company also contributes to an external pension fund for certain of its employees who belongto a local union. Annual contributions were $101, $109 and $116 in 2009, 2008, and 2007, respectively.
12. Income Taxes
The income tax provision consisted of the following:
Fiscal year
2009 2008 2007
Current:Federal . . . . . . . . . . . . . . . . . . . . . . . . . . . . . . . . . $27,280 $23,443 $ 8,760Foreign . . . . . . . . . . . . . . . . . . . . . . . . . . . . . . . . . 1,956 1,980 2,480State . . . . . . . . . . . . . . . . . . . . . . . . . . . . . . . . . . . 5,268 5,915 3,833
34,504 31,338 15,073
Deferred:Federal . . . . . . . . . . . . . . . . . . . . . . . . . . . . . . . . . (76) (2,445) 1,626Foreign . . . . . . . . . . . . . . . . . . . . . . . . . . . . . . . . . 29 (26) (21)State . . . . . . . . . . . . . . . . . . . . . . . . . . . . . . . . . . . (553) (367) 417
(600) (2,838) 2,022
$33,904 $28,500 $17,095
The following table shows the principal reasons for the differences between the effective incometax rate and the statutory federal income tax rate:
Fiscal Year
2009 2008 2007
Federal income taxes at statutory rate . . . . . . . . . . . . . . . . . . 35.00% 35.00% 35.00%State income taxes, net of federal benefit . . . . . . . . . . . . . . . 3.83 5.24 6.09Foreign income taxes in excess of 35% . . . . . . . . . . . . . . . . . 0.18 0.04 0.21Non-deductible meals and entertainment . . . . . . . . . . . . . . . 0.25 0.50 1.16Tax reserves . . . . . . . . . . . . . . . . . . . . . . . . . . . . . . . . . . . . 0.56 (0.08) (0.71)Other . . . . . . . . . . . . . . . . . . . . . . . . . . . . . . . . . . . . . . . . . (0.54) 0.72 (1.41)
Total . . . . . . . . . . . . . . . . . . . . . . . . . . . . . . . . . . . . . . . . . . 39.28% 41.42% 40.34%
65

Beacon Roofing Supply, Inc.
Notes to Consolidated Financial Statements (Continued)
Year Ended September 30, 2009
(dollars in thousands, except per share data or as otherwise indicated)
12. Income Taxes (Continued)
The components of the Company’s deferred taxes were as follows:
September 30, September 30,2009 2008
Deferred tax liabilities:Excess tax over book depreciation and amortization . . . $40,719 $38,649Foreign currency translation adjustment . . . . . . . . . . . 2,339 2,461Other . . . . . . . . . . . . . . . . . . . . . . . . . . . . . . . . . . . . 401 300
43,459 41,410
Deferred tax assets:Deferred compensation . . . . . . . . . . . . . . . . . . . . . . . 6,903 6,048Allowance for doubtful accounts . . . . . . . . . . . . . . . . . 5,122 5,091Accrued vacation & other . . . . . . . . . . . . . . . . . . . . . 2,267 2,313Unrealized loss on financial derivatives . . . . . . . . . . . . 4,705 2,901Inventory valuation . . . . . . . . . . . . . . . . . . . . . . . . . . 7,230 7,821
26,227 24,174
Net deferred income tax liabilities . . . . . . . . . . . . . . . . . $17,232 $17,236
As of September 30, 2009, there was available tax benefits totaling $539 related to tax credit andnet operating loss (NOL) carryforwards. Of this total, $317 represents an available benefit from foreigntax credit carryforwards, most of which expires in fiscal year 2017, and $222 represents an availablebenefit from state NOL carryforwards, most of which expires in fiscal year 2027. The Company hasrecorded a valuation allowance to fully reserve for these amounts since future recognition is uncertain.As of September 30, 2008, there was available tax benefits totaling $677 related to tax credit and NOLcarryfowards, of which $440 represented an available benefit from foreign tax credit carryforwards and$237 represented an available benefit from state NOL carryforwards. The Company recorded avaluation allowance to fully reserve for these amounts since future recognition was uncertain.
As of September 30, 2009, the total amount of gross unrecognized tax benefits (excluding thefederal benefit received from state positions) was $481, all of which, if recognized, would affect theCompany’s effective tax rate. The Company’s continuing practice is to recognize any interest andpenalties related to income tax matters in income tax expense in the consolidated statements ofoperations. There were no significant accrued interest and penalty amounts resulting from unrecognizedtax benefits at September 30, 2009. The Company currently anticipates its unrecognized tax benefits willdecline by approximately 50% during the next twelve months.
In 2009, 2008, and 2007, the Company had reductions in income taxes payable of $1,565, $2,873and $2,286, respectively, as a result of stock option exercises.
The Company has operations in 37 U.S. states and three provinces in Canada and is subject to taxaudits in each of these jurisdictions and federally in both the United States and Canada. These auditsmay involve complex issues, which may require an extended period of time to resolve. The Company
66

Beacon Roofing Supply, Inc.
Notes to Consolidated Financial Statements (Continued)
Year Ended September 30, 2009
(dollars in thousands, except per share data or as otherwise indicated)
12. Income Taxes (Continued)
has provided for its estimate of taxes payable in the accompanying financial statements. Additionaltaxes are reasonably possible however the amounts cannot be estimated at this time. The Company isno longer subject to U.S. federal tax examinations for tax years prior to 2005. For the majority ofstates, the Company is also no longer subject to tax examinations for tax years before 2005.
13. Related-Party Transactions
The Company leases two buildings from a limited liability entity that is partly owned by one of theCompany’s directors for an aggregate expense of approximately $0.4 million in 2009, $0.5 million in2008, and $0.6 million in 2007. The director’s interest in the dollar value of these lease arrangementswas approximately 33% at September 30, 2009.
14. Contingencies
The Company is subject to loss contingencies pursuant to various federal, state and localenvironmental laws and regulations; however, the Company is not aware of any reasonably possiblelosses that would have a material impact on its results of operations, financial position, or liquidity.Potential loss contingencies include possible obligations to remove or mitigate the effects on theenvironment of the placement, storage, disposal or release of certain chemical or other substances bythe Company or by other parties. In connection with its acquisitions, the Company has beenindemnified for any and all known environmental liabilities as of the respective dates of acquisition.Historically, environmental liabilities have not had a material impact on the Company’s results ofoperations, financial position or liquidity.
The Company is subject to litigation from time to time in the ordinary course of business; howeverthe Company does not expect the results, if any, to have a material adverse impact on its results ofoperations, financial position or liquidity.
15. Geographic and Product Data
The Company’s geographic and product information was as follows:
Year Ended
September 30, 2009 September 30, 2008 September 30, 2007
Property Property PropertyIncome and Income and Income and
Net before Equipment, Net before Equipment, Net before Equipment,Revenues taxes net Revenues taxes net Revenues taxes net
U.S. . . . . . . . . $1,637,831 $80,502 $47,108 $1,676,735 $63,103 $50,891 $1,539,617 $35,152 $62,303Canada . . . . . 96,136 5,820 5,857 107,760 5,703 5,821 106,168 7,222 7,450
Total . . . . . . . $1,733,967 $86,322 $52,965 $1,784,495 $68,806 $56,712 $1,645,785 $42,374 $69,753
67

Beacon Roofing Supply, Inc.
Notes to Consolidated Financial Statements (Continued)
Year Ended September 30, 2009
(dollars in thousands, except per share data or as otherwise indicated)
15. Geographic and Product Data (Continued)
Net revenues from external customers by product group were as follows:
Year Ended
September 30, September 30, September 30,2009 2008 2007
Residential roofing products . . . . . . . . . . . $ 897,410 $ 758,491 $ 691,693Non-residential roofing products . . . . . . . . 599,568 723,742 605,857Complementary building products . . . . . . . 236,989 302,262 348,235
Total . . . . . . . . . . . . . . . . . . . . . . . . . . . . $1,733,967 $1,784,495 $1,645,785
Prior year revenues by product group are presented in a manner consistent with the current year’sproduct classifications.
16. Allowance for Doubtful Accounts
The activity in the allowance for doubtful accounts consisted of the following:
Balance atbeginning Provision Balance at
Fiscal Year of year Additions Write-offs end of year
September 30, 2009 . . . . . . . . . . . . . . . . $12,978 $ 7,413 $(6,949) $13,442September 30, 2008 . . . . . . . . . . . . . . . . $ 7,970 $10,954 $(5,946) $12,978September 30, 2007 . . . . . . . . . . . . . . . . $ 5,020 $ 7,916 $(4,966) $ 7,970
17. Financial Derivatives
The Company uses derivative financial instruments for hedging and non-trading purposes tomanage its exposure to changes in interest rates. Use of derivative financial instruments in hedgingprograms subjects the Company to certain risks, such as market and credit risks. Market risk representsthe possibility that the value of the derivative instrument will change. In a hedging relationship, thechange in the value of the derivative is offset to a great extent by the change in the value of theunderlying hedged item. Credit risk related to derivatives represents the possibility that thecounterparty will not fulfill the terms of the contract. The notional, or contractual, amount of theCompany’s derivative financial instruments is used to measure interest to be paid or received and doesnot represent the Company’s exposure due to credit risk. The Company’s current derivative instrumentsare with counterparties rated highly by nationally recognized credit rating agencies.
The Company is using interest rate derivative instruments to manage the risk of interest ratechanges by converting a portion of its variable-rate borrowings into fixed-rate borrowings. As ofSeptember 30, 2009, the following interest rate derivative instruments were outstanding: a) interest rateswaps totaling $200 million, expiring in April 2010, with a fixed rate of 4.97%; b) a $50 million interestrate collar expiring in April 2010 with a floor rate of 3.99% and a cap rate of 5.75%; c) a $50 millioninterest rate collar expiring in April 2010 with a floor rate of 3.75% and a cap rate of 6.00%;d) a $100 million future-starting interest rate swap executed in May 2009, with interest cash flows
68

Beacon Roofing Supply, Inc.
Notes to Consolidated Financial Statements (Continued)
Year Ended September 30, 2009
(dollars in thousands, except per share data or as otherwise indicated)
17. Financial Derivatives (Continued)
commencing in April 2010 and expiring in April 2013 and with a fixed rate of 2.72%; e) a $50 millionfuture-starting interest rate swap executed in June 2009, with interest cash flows commencing inApril 2010 and expiring in April 2013 and with a fixed rate of 3.12%; and f) a $50 million future-starting interest rate swap executed in June 2009, with interest cash flows commencing in April 2010and expiring in April 2013 and with a fixed rate of 3.11%. At no time during the terms of the forward-stating derivatives do the associated cash flows overlap with those associated with the derivativesexpiring in April 2010.
These derivative instruments are designated as cash flow hedges, for which the Company recordsthe effective portions of changes in their fair value, net of taxes, in other comprehensive income(Note 4). The effectiveness of the hedges is periodically assessed by the Company during the lives ofthe hedges by 1) comparing the current terms of the hedges with the related hedged debt to assurethey continue to coincide and 2) through an evaluation of the counterparties to the hedges to honortheir obligations under the hedges. Any ineffective portion of the hedges is recognized in earnings, ofwhich there has been none to date and none is anticipated.
The Company records any differences paid or received on its interest rate hedges as adjustmentsto interest expense. Since inception, the Company has not recognized any gains or losses on thesehedges. The table below presents the combined fair values of the interest rate swap and collarinstruments:
Unrealized Losses
September 30, September 30,Location on Balance Sheet 2009 2008 Fair Value Hierarchy
(Dollars in thousands)
Accrued expenses . . . . . . . . . . . . . . . $12,348 $7,396 Level 2
The fair values of the interest rate swaps and collars were determined through the use of pricingmodels, which utilize verifiable inputs such as market interest rates that are observable at commonlyquoted intervals (generally referred to as the ‘‘LIBOR Curve’’) for the full terms of the swap and collaragreements.
69

ITEM 9. CHANGES IN AND DISAGREEMENTS WITH ACCOUNTANTS ON ACCOUNTING ANDFINANCIAL DISCLOSURE
None.
ITEM 9A. CONTROLS AND PROCEDURES
1. Disclosure Controls and Procedures
Our management, with the participation of our chief executive officer and chief financial officer,evaluated the effectiveness of our disclosure controls and procedures (as defined in Rules 13a-15(e)and 15d-15(e) under the Securities Exchange Act of 1934) as of September 30, 2009. Based on thisevaluation, our chief executive officer and chief financial officer concluded that, as of September 30,2009, our disclosure controls and procedures were (1) designed to ensure that material informationrelating to Beacon Roofing Supply, Inc., including its consolidated subsidiaries, is made known to ourchief executive officer and chief financial officer by others within those entities, particularly during theperiod in which this report was being prepared and (2) effective, in that they provide reasonableassurance that information required to be disclosed by us in the reports that we file or submit underthe Securities Exchange Act of 1934 is recorded, processed, summarized and reported within the timeperiods specified in the SEC’s rules and forms.
2. Internal Control over Financial Reporting
(a) Management’s Annual Report on Internal Control Over Financial Reporting
Our management is responsible for establishing and maintaining adequate internal control overfinancial reporting. Internal control over financial reporting is defined in Rule 13a-15(f) or 15d-15(f)promulgated under the Securities Exchange Act of 1934 as a process designed by, or under thesupervision of, the company’s principal executive and principal financial officers, and effected by thecompany’s board of directors, management and other personnel, to provide reasonable assuranceregarding the reliability of financial reporting and the preparation of financial statements for externalpurposes in accordance with generally accepted accounting principles and includes those policies andprocedures that:
• Pertain to the maintenance of records that in reasonable detail accurately and fairly reflect thetransactions and dispositions of the assets of the company;
• Provide reasonable assurance that transactions are recorded as necessary to permit preparationof financial statements in accordance with generally accepted accounting principles, and thatreceipts and expenditures of the company are being made only in accordance with authorizationsof management and directors of the company; and
• Provide reasonable assurance regarding prevention or timely detection of unauthorizedacquisition, use or disposition of the company’s assets that could have a material effect on thefinancial statements.
Our internal control system was designed to provide reasonable assurance to our management andBoard of Directors regarding the preparation and fair presentation of published financial statements.All internal control systems, no matter how well designed, have inherent limitations which may notprevent or detect misstatements. Therefore, even those systems determined to be effective can provideonly reasonable assurance with respect to financial statement preparation and presentation. Projectionsof any evaluation of effectiveness to future periods are subject to the risk that controls may becomeinadequate because of changes in conditions, or that the degree of compliance with the policies orprocedures may deteriorate.
70

Our management assessed the effectiveness of our internal controls over financial reporting as ofSeptember 30, 2009. In making this assessment, we used the criteria set forth in Internal Control-Integrated Framework issued by the Committee of Sponsoring Organizations of the TreadwayCommission (COSO). Based on our assessment, we believe that, as of September 30, 2009, our internalcontrol over financial reporting is effective at the reasonable assurance level based on those criteria.
Our Independent Registered Public Accounting Firm has issued a report on the Company’sinternal control over financial reporting. This report appears below.
(b) Attestation Report of the Independent Registered Public Accounting Firm
Report of Independent Registered Public Accounting Firm
The Board of Directors and Shareholders ofBeacon Roofing Supply, Inc.
We have audited Beacon Roofing Supply, Inc.’s internal control over financial reporting as ofSeptember 30, 2009, based on criteria established in Internal Control—Integrated Framework issued bythe Committee of Sponsoring Organizations of the Treadway Commission (the COSO criteria). BeaconRoofing Supply, Inc.’s management is responsible for maintaining effective internal control overfinancial reporting, and for its assessment of the effectiveness of internal control over financialreporting included in the accompanying Management’s Annual Report on Internal Control overFinancial Reporting. Our responsibility is to express an opinion on the company’s internal control overfinancial reporting based on our audit.
We conducted our audit in accordance with the standards of the Public Company AccountingOversight Board (United States). Those standards require that we plan and perform the audit to obtainreasonable assurance about whether effective internal control over financial reporting was maintainedin all material respects. Our audit included obtaining an understanding of internal control overfinancial reporting, assessing the risk that a material weakness exists, testing and evaluating the designand operating effectiveness of internal control based on the assessed risk, and performing such otherprocedures as we considered necessary in the circumstances. We believe that our audit provides areasonable basis for our opinion.
A company’s internal control over financial reporting is a process designed to provide reasonableassurance regarding the reliability of financial reporting and the preparation of financial statements forexternal purposes in accordance with generally accepted accounting principles. A company’s internalcontrol over financial reporting includes those policies and procedures that (1) pertain to themaintenance of records that, in reasonable detail, accurately and fairly reflect the transactions anddispositions of the assets of the company; (2) provide reasonable assurance that transactions arerecorded as necessary to permit preparation of financial statements in accordance with generallyaccepted accounting principles, and that receipts and expenditures of the company are being made onlyin accordance with authorizations of management and directors of the company; and (3) providereasonable assurance regarding prevention or timely detection of unauthorized acquisition, use, ordisposition of the company’s assets that could have a material effect on the financial statements.
Because of its inherent limitations, internal control over financial reporting may not prevent ordetect misstatements. Also, projections of any evaluation of effectiveness to future periods are subjectto the risk that controls may become inadequate because of changes in conditions, or that the degreeof compliance with the policies or procedures may deteriorate.
In our opinion, Beacon Roofing Supply, Inc. maintained, in all material respects, effective internalcontrol over financial reporting as of September 30, 2009, based on the COSO criteria.
71

We also have audited, in accordance with the standards of the Public Company AccountingOversight Board (United States), the consolidated balance sheets of Beacon Roofing Supply, Inc. as ofSeptember 30, 2009 and 2008 and the related consolidated statements of operations, stockholders’equity and comprehensive income, and cash flows for each of the three years in the period endedSeptember 30, 2009 and our report dated December 1, 2009 expressed an unqualified opinion thereon.
/s/ ERNST & YOUNG LLP
Boston, MassachusettsDecember 1, 2009
(c) Changes in Internal Control Over Financial Reporting
No change in our internal control over financial reporting (as defined in Rules 13a-15(f) and15d-15(f) under the Securities Exchange Act of 1934) occurred during the fiscal quarter endedSeptember 30, 2009 that has materially affected, or is reasonably likely to materially affect, our internalcontrol over financial reporting.
ITEM 9B. OTHER INFORMATION
We have no information to report pursuant to Item 9B.
72

PART III
This part of our Form 10-K, which includes Items 10 through 14, is omitted because we will filedefinitive proxy material pursuant to Regulation 14A not more than 120 days after the close of ouryear-end, which proxy material will include the information required by Items 10 through 14 and isincorporated herein by reference.
PART IV
ITEM 15. EXHIBITS AND FINANCIAL STATEMENT SCHEDULES
(a) (1) Financial Statements
The following financial statements of our Company and Report of the Independent RegisteredPublic Accounting Firm are included in Part II, Item 8 of this Report:
• Report of Independent Registered Public Accounting Firm
• Consolidated Balance Sheets as of September 30, 2009 and 2008
• Consolidated Statements of Operations for the years ended September 30, 2009, 2008 and 2007
• Consolidated Statements of Stockholders’ Equity for the years ended September 30, 2009, 2008and 2007
• Consolidated Statements of Cash Flows for the years ended September 30, 2009, 2008 and 2007
• Notes to Consolidated Financial Statements
(2) Financial Statement Schedules
Financial statement schedules have been omitted because they are either not applicable or therequired information has been disclosed in the financial statements or notes thereto.
(3) Exhibits
Exhibits are set forth on the attached exhibit index.
73

SIGNATURES
Pursuant to the requirements of Section 13 or 15(d) of the Securities Exchange Act of 1934, theregistrant has duly caused this report to be signed on its behalf by the undersigned, thereunto dulyauthorized.
BEACON ROOFING SUPPLY, INC.(REGISTRANT)
By: /s/ DAVID R. GRACE
David R. GraceChief Financial and Accounting Officer
Date: December 1, 2009
Pursuant to the requirements of the Securities Exchange Act of 1934, this report has been signedbelow by the following persons on behalf of the registrant and in the capacities and on the datesindicated.
SIGNATURE TITLE DATE
/s/ ROBERT R. BUCKChairman and Chief Executive Officer December 1, 2009
Robert R. Buck
/s/ DAVID R. GRACE Senior Vice President, Chief Financial December 1, 2009Officer and Chief Accounting OfficerDavid R. Grace
/s/ ANDREW R. LOGIEDirector December 1, 2009
Andrew R. Logie
/s/ H. ARTHUR BELLOWS, JR.Director December 1, 2009
H. Arthur Bellows, Jr.
/s/ JAMES J. GAFFNEYDirector December 1, 2009
James J. Gaffney
/s/ PETER M. GOTSCHDirector December 1, 2009
Peter M. Gotsch
/s/ WILSON B. SEXTONDirector December 1, 2009
Wilson B. Sexton
/s/ STUART A. RANDLEDirector December 1, 2009
Stuart A. Randle
74

INDEX TO EXHIBITS
EXHIBIT
EXHIBITNUMBER
3.1 Second Amended and Restated Certificate of Incorporation of Beacon Roofing Supply, Inc.(incorporated herein by reference to Exhibit 3.1 to Beacon Roofing Supply, Inc.’s annualreport on Form 10-K for the year ended September 25, 2004)
3.2 Amended and Restated By-Laws of Beacon Roofing Supply, Inc. (incorporated by referenceto Exhibit 3.2 to Beacon Roofing Supply, Inc.’s annual report on Form 10-K for the yearended September 30, 2007)
4.1 Form of Specimen Common Stock Certificate of Beacon Roofing Supply, Inc. (incorporatedherein by reference to Exhibit 4.1 to Beacon Roofing Supply, Inc.’s Registration Statementon S-1 (Registration No. 333-116027))
10.1 Fourth Amended and Restated Credit Agreement, dated as of November 2, 2006, amongBeacon Sales Acquisition, Inc., as borrower, Beacon Roofing Supply, Inc., as one of theGuarantors, the Lenders and L/C Issuers party thereto, and General Electric CapitalCorporation, as Administrative Agent and Collateral Agent (incorporated by reference toExhibit 10.1 of Beacon Roofing Supply, Inc.’s current report on Form 8-K filed November 3,2006).
10.2 Fourth Amended and Restated Loan and Security Agreement, dated as of November 2,2006, among Beacon Roofing Supply Canada Company, GE Canada Finance HoldingCompany and the financial institutions party thereto (incorporated by reference toExhibit 10.2 to Beacon Roofing Supply, Inc’s current report on Form 8-K filed November 3,2006).
10.3 Form of Beacon Roofing Supply, Inc. 2004 Stock Plan Stock Option Agreement for allemployees, including executive officers who are not directors (incorporated by reference toExhibit 10.3 to Beacon Roofing Supply, Inc.’s annual report on Form 10-K for the yearended September 30, 2008).*
10.4 Form of Beacon Roofing Supply, Inc. 2004 Stock Plan Stock Option Agreement fornon-employee directors (incorporated by reference to Exhibit 10.3 to Beacon RoofingSupply, Inc.’s quarterly report on Form 10-Q for the quarter ended March 31, 2006).*
10.5 Form of Beacon Roofing Supply, Inc. 2004 Stock Plan Stock Option Agreement foremployee directors (incorporated by reference to Exhibit 10.5 to Beacon RoofingSupply, Inc.’s annual report on Form 10-K for the year ended September 30, 2008).*
10.6 Executive Securities Agreement dated as of October 20, 2003 by and between BeaconRoofing Supply, Inc., Robert Buck and Code, Hennessy & Simmons III, L.P. (incorporatedherein by reference to Exhibit 10.5 to Beacon Roofing Supply, Inc.’s Registration Statementon Form S-1 (Registration No. 333-116027))
10.7 Amendment to Executive Securities Agreement dated as of January 28, 2004 by and betweenBeacon Roofing Supply, Inc., Robert Buck and Code, Hennessy & Simmons III, L.P.(incorporated herein by reference to Exhibit 10.6 to Beacon Roofing Supply, Inc.’sRegistration Statement on Form S-1 (Registration No. 333-116027))
10.8 1998 Stock Plan (incorporated herein by reference to Exhibit 4.1 to Beacon RoofingSupply, Inc.’s Registration Statement on Form S-8 (Registration No. 333-119747))*
75

EXHIBITNUMBER
10.9 Amended and Restated 2004 Stock Plan (incorporated herein by reference to Exhibit 10.1 toBeacon Roofing Supply, Inc.’s current report on Form 8-K filed on February 11, 2008)*
10.10 Amended and Restated Special Purchase Option Agreement dated January 28, 2004 by andbetween Beacon Roofing Supply, Inc. and Robert Buck (incorporated herein by reference toExhibit 10.10 to Beacon Roofing Supply, Inc.’s Registration Statement on Form S-1(Registration No. 333-116027))*
10.11 Description of Management Cash Bonus Plan (incorporated herein by reference toExhibit 10 to Beacon Roofing Supply, Inc.’s quarterly report on Form 10-Q for the quarterended December 31, 2008)*
21 Subsidiaries of Beacon Roofing Supply, Inc.
23.1 Consent of Ernst & Young LLP, Independent Registered Public Accounting Firm
31.1 CEO certification pursuant to Section 302 of the Sarbanes-Oxley Act of 2002
31.2 CFO certification pursuant to Section 302 of the Sarbanes-Oxley Act of 2002
32.1 CEO certification pursuant to Section 906 of the Sarbanes-Oxley Act of 2002
32.2 CFO certification pursuant to Section 906 of the Sarbanes-Oxley Act of 2002
* Compensatory plan or arrangement.
76

Beacon Roofing Supply, Inc. has grown to be one of the largest distributors of roofing
materials and complementary building products in North America. With more than
40,000 customers, Beacon is the largest or second largest distributor in many of the
regions we serve (see map below). We have a reputation for quality people who
provide our customers with “The Experience You Want, The Service You Expect,
The Value You Deserve.” Our people are supported by a strong, values-oriented
corporate culture. We are in our 81st year! We originated with Beacon Sales
Company, founded in Charlestown, Massachusetts in 1928.
Our local branches stock a comprehensive product line that caters to the local
market. In addition to residential and commercial roofing, our product categories
include windows, siding, decking, doors, waterproofing and other exterior
products. Beacon distributes the roofing and complementary products
of brand-name manufacturers. These manufacturers understand that
our staff’s expertise and quality service will ensure the successful
application of their premium products.
Our knowledgeable and experienced sales and marketing team includes
outside sales and business development specialists, inside sales/
customer service representatives, manufacturer/architectural
representatives and product specialists. Contractors trust the product
knowledge and application expertise of Beacon’s staff. They rely on
this expertise, along with on-time delivery and product availability,
to deliver successful, profitable and on-time projects. As a result,
successful partnerships that go beyond the industry norm are formed
between Beacon branches and our customers. We have grown by opening new
branches, expanding our product offerings and by making strategic acquisitions.
Our business is well-balanced, with non-discretionary re-roofing applications and
discretionary new construction and remodeling in both the residential and commercial
markets. We have a solid foundation for continued growth based on a highly scalable
platform, a proven business model, results-oriented management, a strong people-
focused corporate culture and a company-wide enterprise resource planning system.
CORPORATE PROFILE AND BEACON’S GROWTH
1928Beacon Sales Company is established in Charlestown, Massachusetts.
1984Andrew Logie buys a majority interest in Beacon Sales Company.
1984–97Beacon grows in sales and reputation, opening four new branches in New England.
1997Equity firm Code, Hennessy & Simmons III, L.P.purchases a majority interest, and Beacon Roofing Supply is formed.
1998Quality Roofing Supply in Pennsylvania becomes Beacon’s first acquisition.
1999–2000Best Distributing in the Carolinas joins the Beacon family. Groupe Bedard and Exeltherm Supply are acquired and become Beacon Canada.
2001The Roof Center in Maryland/Virginia and West End Lumber in Texas are acquired.
2004Beacon goes public with its IPO (Nasdaq: BECN). JGA Corp. in Georgia and Florida becomes part of Beacon.
2005Shelter Distribution with more than 50 branches in 14 Midwestern and Southern states is acquired. Beacon gains a presence on the West Coast with Pacific Supply.
2006–2007Mississippi Roofing Supply, Alabama Roofing Supply, Roof Depot and RSM Supply are acquired. North Coast Commercial Roofing Systems is acquired.
2008–2009Beacon achieves record sales in 2008 and record profits in 2009.
Beacon’s complete history can be read about on the company web site at www.beaconroofingsupply.com/about-us/history/default.html.
PROFIT GROWTHNet income in 2009 was a record $52.4 million. Diluted net income per share increased by 28% to a record $1.15 from $0.90 in 2008.
CASHBuilt to $83 million in 2009 from $26 million in 2008.
Fiscal Year 2009 Accomplishments
172 branches in 37 states in the United States and in Eastern Canada
Fiscal Year 2009 Accomplishments
Robert R. BuckChairman and Chief Executive Officer
Paul M. IsabellaPresident and Chief Operating Officer
David R. GraceSenior Vice President andChief Financial Officer
C. Eric SwankSenior Vice President, Oversees The Roof Center
Ross D. Cooper
Senior Vice-President, General Counsel and Corporate Secretary
James I. MacKimmSenior Vice President,Oversees Beacon Sales Company and Quality Roofing Supply
Patrick MurphySenior Vice President,Oversees Southeast Regions and Corporate Procurement
David WrabelVice President, Credit
Rick C. WelkerVice President and Corporate Controller
John P. MassarelliVice President, Sales and Marketing
Christopher NelsonVice President, Chief Information Officer
Sergio PadronVice President, Corporate Safety and Risk Management
David M. Pasternak Vice President, Human Resources
John C. Smith, Jr.Regional Vice President, Shelter Southwest Region
Munroe BestRegional Vice President,Best Distributing Company
Scott WadeRegional Vice President, JGA Beacon
Robert K. Greer, Jr.Regional Vice President,West End Roofing, Siding and Windows
Marc AllaireRegional Vice President, Beacon Canada
Gerard HillRegional Vice President, Beacon Sales Company
Ken HeitkampRegional Manager, Beacon Pacific
Kent C. GardnerRegional Vice President,Shelter Midwest Region
David Lowery Regional Vice President, North Coast Commercial Roofing Systems
Fred PrattVice President, North Coast Commercial Roofing Systems
Board of Directors
Robert R. BuckChairman and Chief Executive Officer
H. Arthur Bellows, Jr.Chairman of Braeburn Associatesand The Finance Network
James J. GaffneyChairman of the Board of DirectorsImperial Sugar Company
Peter GotschManaging Partner, Ellipse Capital, LLC and Chairman of the Board, Hillman Companies, Inc.
Andrew R. LogieFounder and Former Chairman and CEO Beacon Roofing Supply, Inc.
Stuart A. RandlePresident, CEO and Director GI Dynamics
Wilson B. SextonChairman of the Board andFormer Chief Executive OfficerPool Corporation
Executive Management
September 2009 Executive Meeting • Standing (L–R): Ken Heitkamp, Munroe Best, Jeff Metz, Jim MacKimm, Jack Smith, Paul Isabella, Dave Wrabel, Robert Buck, Chris Nelson, David Grace, Kent Gardner, Ross Cooper, Gerard Hill, Scott Wade, Ken Greer
Seated (L–R): Sergio Padron, Jake Gosa, David Pasternak, Marc Allaire, Eric Swank, Dave Lowery, Pat Murphy, John Massarelli
Transfer Agent and RegistrarComputershare Investor Services350 Indiana Street • Suite 750Golden, Colorado 80401
Annual MeetingFebruary 5, 2010 • 8:00 a.m. EST505 Huntmar Park DriveSuite 300 • Herndon, Virginia 20170
Independent Registered Public Accounting Firm Ernst & Young LLP200 Clarendon Street Boston, Massachusetts 02116
Corporate HeadquartersBeacon Roofing Supply, Inc.One Lakeland Park Drive Peabody, Massachusetts 01960Phone: 978-535-7668
Form 10-KAdditional copies of the company’s Annual Report on Form 10-K are available from the company at no charge. Requests should be directed to the company’s corporate headquarters at the number above.
The shares of Beacon Roofing Supply, Inc. are traded on the Nasdaq Global Select Market under the symbol BECN.
On the InternetInterested investors may visit the company’s web site at www.beaconroofingsupply.com for updated information, including press releases, share trading data and SEC filings.
BE25184_Cvr.indd 2 12/28/09 8:05:16 AM

ANNUAL REPORT 2009THE EXPERIENCE YOU WANT • THE SERVICE YOU EXPECT • THE VALUE YOU DESERVE
EST. 1928
Beacon’s Growing Family of Regional Distributors
One Lakeland Park Drive • Peabody, MA 01960 • Phone: 877-645-7663 • Fax: 978-535-7358 • beaconroofingsupply.com
Beacon Roofing Supply, Inc. 2009 Annual Report
BE25184_Cvr.indd 1 12/28/09 8:05:11 AM