1994 1993 - AnnualReports.com
48
Transcript of 1994 1993 - AnnualReports.com


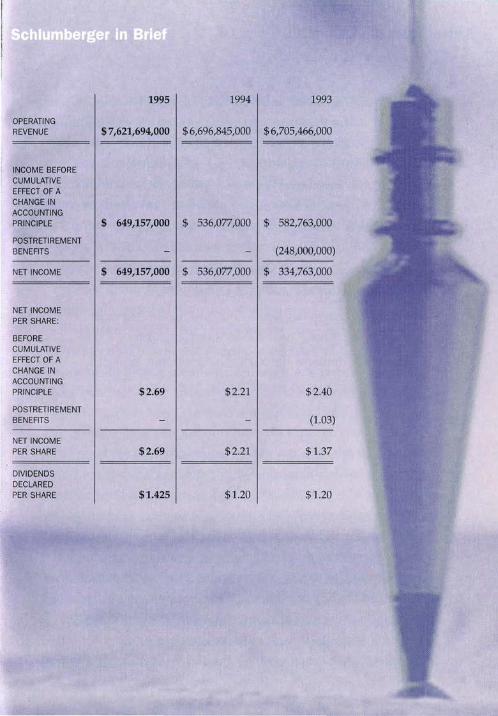
1995 1994 1993
OPERATING REVENUE $ 7,621,694,000 $6,696,845,000 $6,705,466,000
INCOME BEFORE CUMULATIVE EFFECT OF A CHANGE IN ACCOUNTING PRINCIPLE $ 649,157,000 $ 536,077,000 $ 582,763,000
POSTRETIREMENT BENEFITS (248,000,000)
NET INCOME $ 649,157,000 $ 536,077,000 $ 334,763,000
NET INCOME PER SHARE:
BEFORE CUMULATIVE EFFECT OF A CHANGE IN ACCOUNTING PRINCIPLE $2.69 $2.21 $2.40
POSTRETIREMENT BENEFITS (1.03)
NET INCOME PER SHARE $2.69 $2.21 $1.37
DIVIDENDS DECLARED PER SHARE $1.425 $1.20 $1.20
Letter from the Chairman
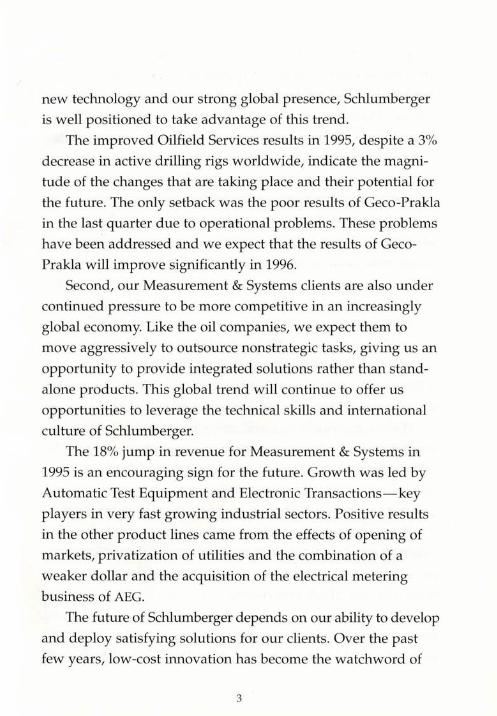
S THE BASIC FIGURES INDICATE, SCHLUMBERGER
had a strong year in 1995. Net income at $649 million
and earnings per share at $2.69 were 21% and 22%,
respectively, above 1994, while operating revenue
increased by 14% to $7.6 billion. These results were
in line with our expectations and reversed the trend
of the past three years. The improvements were due to four
main factors:
• Rig count outside North America increased by
3% after hitting a 22-year low in 1994
• Significant expansion in our production services
that are largely independent of rig count
• Strong demand for our high-technology services
• Much improved results in the Measurement &
Systems businesses.
Mainly as a result of the continued opening of markets
worldwide, it appears that we are embarking on a new economic
cycle in the industrial world-moderate long-term growth
accompanied by low inflation. This has important implications
for all our businesses.
First, in the oil business we can expect that over the next few
years improvements in productivity will make it possible for the
industry to satisfy the 2% annual increase in oil demand with
out the need for higher oil prices. Oil companies are increasingly
looking outward for technologies that enhance profitability by
lowering finding and producing costs. Because of the large
investments we have made over the last 10 years to develop
2
new technology and our strong global presence, Schlumberger
is well positioned to take advantage of this trend.
The improved Oilfield Services results in 1995, despite a 3%
decrease in active drilling rigs worldwide, indicate the magni
tude of the changes that are taking place and their potential for
the future. The only setback was the poor results of Geco-Prakla
in the last quarter due to operational problems. These problems
have been addressed and we expect that the results of Geco
Prakla will improve significantly in 1996.
Second, our Measurement & Systems clients are also under
continued pressure to be more competitive in an increasingly
global economy. Like the oil companies, we expect them to
move aggressively to outsource nonstrategic tasks, giving us an
opportunity to provide integrated solutions rather than stand
alone products. This global trend will continue to offer us
opportunities to leverage the technical skills and international
culture of Schlumberger.
The 18% jump in revenue for Measurement & Systems in
1995 is an encouraging sign for the future . Growth was led by
Automatic Test Equipment and Electronic Transactions-key
players in very fast growing industrial sectors. Positive results
in the other product lines came from the effects of opening of
markets, privatization of utilities and the combination of a
weaker dollar and the acquisition of the electrical metering
business of AEG.
The future of Schlumberger depends on our ability to develop
and deploy satisfying solutions for our clients. Over the past
few years, low-cost innovation has become the watchword of
3
our product development process. The concept embraces many
ideas but its central theme is our determination to bring more
cost-effective, new technology to market faster than our com
petitors. Much of the process is not new. What is new is the
commitment with which the detailed implementation is made
and the momentum that has been generated by successful
products being developed in record time.
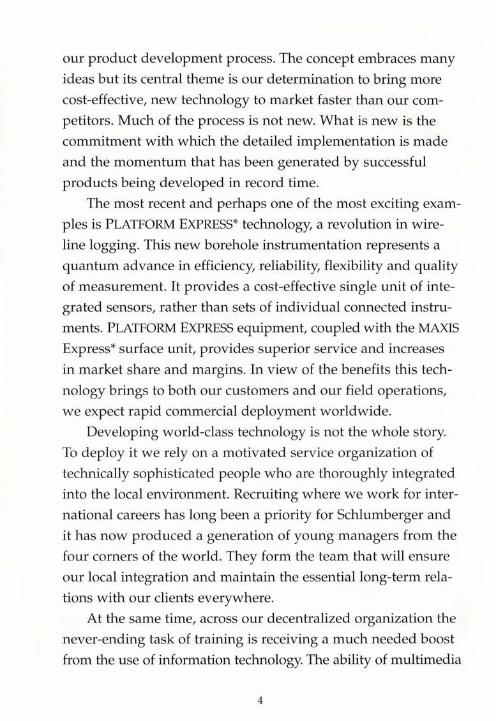
The most recent and perhaps one of the most exciting exam
ples is PLATFORM EXPRESS* technology, a revolution in wire
line logging. This new borehole instrumentation represents a
quantum advance in efficiency, reliability, flexibility and quality
of measurement. It provides a cost-effective single unit of inte
grated sensors, rather than sets of individual connected instru
ments. PLATFORM EXPRESS equipment, coupled with the MAXIS
Express* surface unit, provides superior service and increases
in market share and margins. In view of the benefits this tech
nology brings to both our customers and our field operations,
we expect rapid commercial deployment worldwide.
Developing world-class technology is not the whole story.
To deploy it we rely on a motivated service organization of
technically sophisticated people who are thoroughly integrated
into the local environment. Recruiting where we work for inter
national careers has long been a priority for Schlumberger and
it has now produced a generation of young managers from the
four corners of the world. They form the team that will ensure
our local integration and maintain the essential long-term rela
tions with our clients everywhere.
At the same time, across our decentralized organization the
never-ending task of training is receiving a much needed boost
from the use of information technology. The ability of multimedia
4
to transmit ideas and information is enormous and the capability
of the Schlumberger Information Network to make material
available to our worldwide field organization is growing daily.
The Schlumberger in Motion CD-ROM, which is a part of this
year's annual report, gives you a feeling for the power of this
new communications tool. We believe that its animation and
interactivity are able to convey to you, in a way that printed
words and images cannot, the nature of our technology and the
quality and enthusiasm of our people who will always be at
the heart of our success.
For the past seven years, we have strengthened the com
pany by reinvesting our free cash-defined as net income plus
depreciation, amortization and R&D expenses-44% in fixed
assets, 24% in R&D, and 10% in acquisitions, net of divestitures;
16% of the cash generated has been returned to you, either as
dividends or in a stock buy-back program. As 1995 unfolded,
we sensed that we were entering a period of stronger growth.
We increased the dividend by 25% and revisited the priorities
of our three-year strategic plan. The new plan uncovered a
strong consensus from deep in the organization that over the
next few years our best opportunities would come from focus
ing on our present businesses, supplemented, as in the past, by
modest strategic acquisitions. As a result, over the next three
years, we expect our use of cash will be similar to that of the
recent past. We are confident that in this way your interests as
shareholders will be well served.
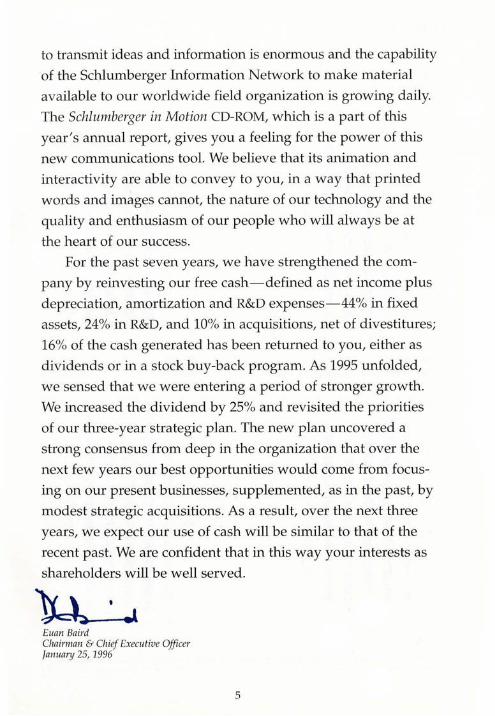
Euan Baird Chairman & Chief Executive Officer January 25, 1996
5
Schlumberger
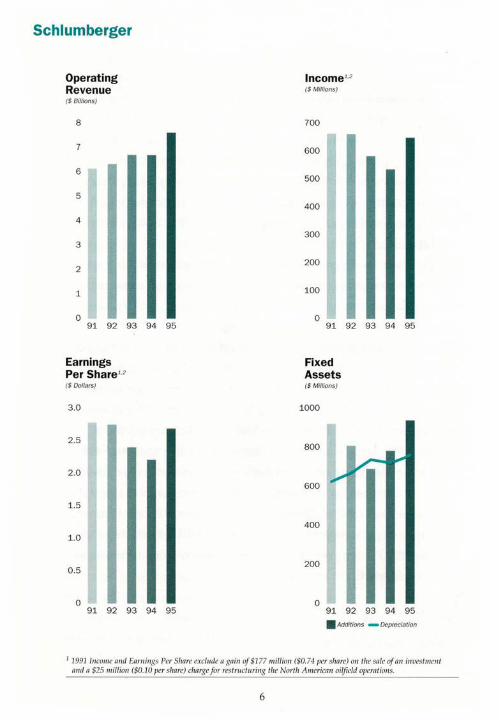
Operating Revenue ($Billions)
8
7
6
5
4
3
2
1
0 91 92 93 94 95
Earnings Per Share'·2
($Dollars)
3.0
2.5
2.0
1.5
1.0
0 .5
0 91 92 93 94 95
lncome'·2
($ Millions)
700
600
500
400
300
200
100
0 91 92 93 94 95
Fixed Assets ($ Millions)
1000
800
600
400
200
0 91 92 93 94 95
• Additions - Depreciation
1 1991 lnco111e and Earnings Per Share exclude a ga ir1 of$177 mil/io11 ($0.74 per share) on the sale of an invest me/'ll and a $25 million ($0.10 per share) charge for res tructuring the Nor tit American oilfield opernliof'l s.
6
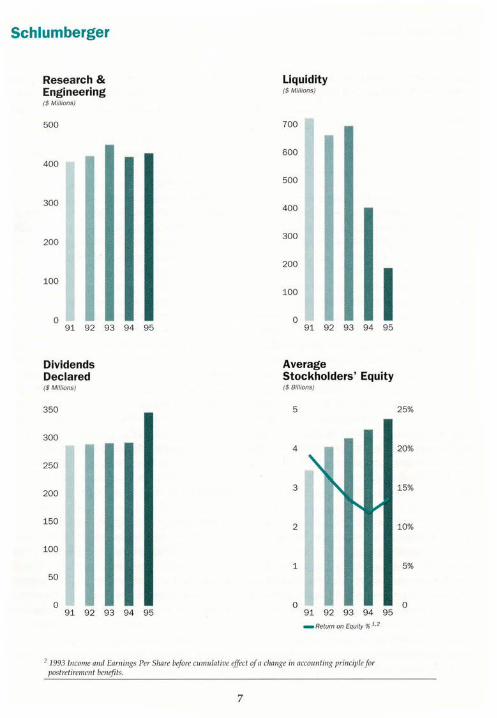
Schlumberger
Research & Engineering ($ Millions)
500
400
300
200
100
0 91 92 93 94 95
Dividends Declared ($ Millions)
350
300
250
200
150
100
50
0 91 92 93 94 95
Liquidity ($Millions)
700
600
500
400
300
200
100
0 I 91 92 93 94 95
Average Stockholders' Equity ($Billions)
5
4
3
2
1
0 91 92 93 94 95
- Return on Equity % 1·2
2 1.993 l11come and Earnings Per Share before cttmttfative effect of a change in accounting principle for postretirement benefits.
7
25%
20%
15%
10%
5%
0
Financial Review
MANAGEMENT'S DISCUSSION AND ANALYSIS OF RESULTS OF OPERATIONS
(Slated in milliollS)
OPERATING REVENUE 1995 1994 1993
--- --- ---OILFIELD SERVICES $4,868 $4,365 $ 4,338 MEASUREMENT & SYSTEMS $2,759 $ 2,339 $2,370
The Company has two reportab le industry segments-Oilfield Services and Measurement & Systems. Within Oilfield Services, Wireline & Testing and Dowell opera ting revenues exceeded 10% of consolidated revenue. In Meas urem ent & Sys tem s, only Electricity Management had operating revenue w hich exceeded 10% of consolidated revenue.
In each of the three years in the period ended December 31, 1995, Wireline & Testing revenue was about 25% of consolidated revenue. Product line revenue increased 6% but decreased 1% and 2% in 1995, 1994 and 1993, respectively. The increase in opera ting income in 1995 of Wireline & Testing represented 23% of the overall increase in Oilfield Services opera ting income. In 1994, the product line opera ting income was 3% below 1993 and 1993 operating income was level with 1992.
In each of the three years in the period ended December 31, 1995, Dowell revenue was about 18% of consolidated revenue. The p roduct line revenue increased 12%, 4% and 11% in 1995, 1994 and 1993, respectively. The increase in operating income in 1995 of Dowell represented 20% of the overall increase in Oilfield Services opera ting income. In 1994, the product line opera ting income was 5% below 1993 and 1993 opera ting income was level with 1992.
For each of the three years in the period ended December 31, 1995, Electricity Management revenue was about 10% of consolidated reven ue. Product line revenue increased 20%
8
and 3% in 1995 and 1994, respectively, but declined 2% in 1993. Over the three years, p roduct line operating in come as a percentage of revenue has declined . In 1994, the prod uct line rep resented 21% of the decline in Measurement & Systems opera ting income.
OILFIELD SERVICES
Wireline & Testing
Revenue in 1995 increased 6% over last yea r. In North America, revenue rose 6% despite an 8% decline in rig cow1t. Outside North America, led by South America, the North Sea and Africa, revenue increased 6% while rig count increased 3%. The continued introduction of new technologies, developed to enhan ce wellsite efficiency and well p roductivity, contributed to revenue ga in s.
PLATFORM EXPRESS technology continues to set new standards fo r efficiency, reliability and answers in the wireline logging industry. After performing 4000 jobs, PLATFORM EXPRESS services have es tablished a reliability fi ve times greater than previous logging systems, whi le reducing the time required to perform logging opera tions up to 30% and substantially reducing w~p costs for customers. With 35 systems in the field at year end, the added value of PLATFORM EXPRESS services has significantly increased revenue per well. Additional systems will be deployed worldwide in 1996, includ ing offshore loca tions.
Customer acceptance of the CMR* Combinab le Magnetic Resonan ce tool continued to accelera te. The combinability of this measurement with other sensors optimizes the amount of reservoir information which can be acquired with one descent into a well. The CMR tool has superior vertical resolution and evaluates cr itical reservoir p roperties, which are used to identify producible hydrocarbons and
previously overlooked thin pay zones. Worldwide demand for Modular Early
Production Faci lities continued. These facilities provide the capabiUty to fully evaluate reserves and optimize field development.
Testing services revenue increased compared to 1994. Sales of the Universal Pressure Platform including permanent downhole pressure gauges and the recently introduced FlowWatcher• integrated permanent production monitor, continued to grow. These products assist customers in diagnosing reservoir performance to optimize hydrocarbon production and recovery. 1994 RESULTS
In 1994, revenue was 1% below 1993 with heal thy growth in North and South America being offse t by a decline in the Eastern Hemisphere. Revenue grew 11% in North America and decreased 5% outside North America.
Worldwide deployment of the MAXIS 500* wellsite surface instrumentation was aggressively pursued in 1994. Combining the capabilities of the imaging tools with the MAXIS 500 system allows the acquisition and processing of an Lmprecedented number of logging measurements in a single rw1 in the well. Also, the successful introduction of the MAXIS Express high-efficiency acquisition sys tem was achieved in North America.
Demand for DSI* Dipole Shear Sonic Imager measurements increased because of the tool's ability to define the orientation of natural fractures. The MDT* Modular Formation Dynamics Tester tool gained client acceptance due to superior performance and time-saving features. 1993 RESULTS
Field revenue in 1993 was 1% above 1992, reflec ting a natural gas-driven recovery in Nor th America that offset declines in the Eastern Hemisphere and Latin America regions.
9
Revenue was up 35% in North America and down 6% outside North America.
Expansion of MAXIS 500 Lmits and associa ted ima ging tools con tinu ed worldwide. During 1993, the MAXIS Express acquisition system was field tested in the US. The MAXIS Express W1it utilizes the complete range of new-generation tools.
Three new MAXIS tools were introduced in 1993, the IPL* Integra ted Porosity Lithology tool, the UBI* Ultrasonic Borehole Imager and the slim RST* Reservoir Saturation Tool.
Dowell
Dowell revenue rose 12% over 1994, while the rig count decreased 3%. A significant rise in activity took place in Latin America, followed by Europe, Africa, the Far East and the Middle East.
In North America, revenue slipped 1%, in spite of the weak gas prices which caused the rig cow1t to decline 8%. Outside North America, revenue increased 24%, outperforming the 3% rise in rig count.
Drilling Fluids grew 40% over 1994. Increasing acceptance of ULTIDRILL • biodegradable synthetic-based fluid and QUA DRILL • inhibitive water-based drilling fluid contributed to the growth. Latin America and the UK sector of the North Sea experienced significan t increases in activity.
In 1995, Sand Control services continued its exceptional growth, mainly driven by the success of STIMPAC* technology, product demand in the Middle East, participation in North Sea horizontal wells and client acceptance of the QUANTUM* line of packers and accessories.
Coiled Tubing services growth continued at a healthy pace, led by sharp increases in the Gulf of Mexico, Venezuela and Africa. Coiled Tubing Drilling services are improving production from existing wells using reentry lateral
drilling. An interdisciplinary Coiled Tubing Drilling business development team has been fo rmed to manage this service.
Despite weak gas prices in the US, revenue in fracturing services was flat as a result of the successful introduction of new technologies. In North America, Prop NET* p roppant fl owback control technology, which forms a net-like structu re to keep fracture trea tment in place, performed 650 jobs in a variety of environments. The successful commercializa tion of the YFlOOLG* crosslinked, water-base frac turing fluid system was completed during the yea r, with more than 1000 jobs pumped. This product provides clients with a more conductive frac ture, yielding increased production rates at a lower cos t.
The number of engineers in the DESC* Design and Evaluation Services for Clients program continued to increase, especially outside North America. Also, the crea tion of the Production Enhancement Group (PEG) has reinforced the technical support provided to clients. These groups of engineers from vari ous Schlumberger Oilfield Services companies tackle complex p roduction problems and offer optimized solutions. 1994 RESULTS
In 1994, revenue increased 4% over 1993. In North America, revenue rose 16% in
1994. A decrease in natural gas prices ca used the pace of fracturing grow th to slow in the second half of the year. This was offse t by a significant boost in Coiled Tubing services, rigrelated activity and client acceptance of the DESC program .
Outside North America, benefiting from the newly acquired Drilling Fluids activity, revenue increased 2% from 1993. Improvements were recorded in the Far East and Latin America, offse tting the decline of activity in
10
the Middle East. Rigless activity remained strong as a result
of the DESC p rogram in North America and cost-effective Coiled Tubing applica tions for slimholes and well reentries. In the North Sea, ULTIDRILL fluid was successfull y deployed. 1993 RESULTS
Revenue rose 11% in 1993, which included the impact of International Drilling Fluids acquired in September 1993. In January 1993, Schl.umberger completed the purchase of the 50% Dow Chemical interest in the Dowell Schl.umberger group of companies.
In North Am erica, revenue rose 27%. Contributing to this growth was an increase in drilling activity, a high level of s timula tion ac tivity in US gas fields initiated during the fourth quarter of 1992 and additional ac tivity generated from alliances with customers.
Outside North America, revenue decreased 3% from 1992 with declines in all regions except Europe.
Coiled Tubing continued to grow in 1993 as new applica tions, incl uding downhole measurements and reentry drilling in ex isting wells, were introduced .
The Dowell Industrial ~ervice ac tivity was sold in December 1993.
Geco-Prakla
Revenue increased 12%, with a significa nt improvement in results compared to 1994.
Positive momentum experienced in the first three quarters was offset in the fourth quarter by severe wea ther in the Gulf of Mexico and the North Sea, lower profitability on Non-Exclusive Proprietary Surveys (NEPS) sales and by technical and operational difficulties in Transition Zone (TZ) opera tions.
In Marine, activity increased 11%. The upgraded vessels Ceca Beta, Searcher and
Emerald were introduced in early 1995, and Beta completed the industry's first 8-streamer survey. Deployment of Monowing* multi streamer towing technology and TRILOGY* onboard data management system continued. These new technologies have enabled GecoPrakla to secure the majority of large surveys, awarded to date, for the 1996 season in Northwest Europe.
Geco-Pra kla completed the first phase of the industry's firs t deep water seismic reservoir monitoring project. During production, 40 seismic w ill be used to enhance reservoir unders tanding in the Foinaven field. Also known as time- lapse 30 seismic, this 40 seismic project involves deployment of permanently buried seismic cables and am1ua lly repea ted 30 seismic surveys.
Lan d and TZ revenue rose by 15%. The loss from TZ operations increased due to start up problems and poor wea ther. Geco-Prakla's position in the Midd le East grew signi ficantly, primarily due to the awa rd of two multiyear contracts in Kuwait for large 30 crews and the thi rd quarter acquisition of land operations in Saudi Arabia. Deployment of the Olympus-IMS* land informa tion management system continued with 11 systems in the field at year-end. Olympus-IMS technology improves the management of data from complex 30 land opera tions thereby increasing crew efficiency. The TZ business line was formed to focus on the transition zone market.
Data Processing revenue grew 25% in 1995.
Strong global growth continued in concurrent processing, which links onboard processing with onshore ca pabilities, and in areas where Geco-Prakla continued aggressive deployment of new technology. Productivity gains were achieved in all centers with significant capacity upgrades made in Gatwick and Houston. This
11
included the massive parallel processing system used to provide Inversion Services, which addresses tl1e growing demand for pre- and post-s tack depth migration an d stratigraphic inversion . In 1995, with a number of commercial p rojects underway, Geco-Prakla began introduction of the new SEISMOS* seismic data processing package. 1994 RESULTS
In 1994, revenue declined 16% compared to 1993. Geco-Prakla reorganized into worldwide product lines in the first half of the year, which reduced costs while maintaining seismic crew capacity.
Marine revenue declined 3% in 1994.
Strong sales of NEPS data were more than offset by weaker prices in proprietary marine. Fleet upgrades continued with the expansion in the number of streamers towed per vessel. Upgrading of the Ceca Gamma was completed, and upgrading of the Ceca Beta and Ceca Searcher to handle 8-p lus strea mer configurations began . These vessels utilize GecoPrakla's Monowing multistreamer towing technology and TRILOGY onboard data management system.
Land and TZ revenue decreased 20% compared to 1993. A decline in ac ti vity outside North America and civil unrest in Nigeria and Yemen ad versely affected revenue. Results improved during the second half of the year. For transition zone operations, the Digiseis FLX* transition zone telemetric acquisition system was successfully introduced. For complex land operations, the Olympus-TMS new generation land information management system was introduced .
Data Processing revenue was down 8% compared to 1993. Improved productivity was more than offse t by continuing pricing pressures in conventional onshore process ing.
During the year, significant restructuring was
undertaken to streamline and link local centers
to high-capacity Megacenters in Ga twick and
Houston. Growth continued for VIVID* seis
mic imaging services. A new business unit,
Inversion Services, was formed to concentra te
on stratigraphic inversion and VIVID services.
1993 RESULTS
Revenue dropped 10% in 1993, including the
opera tions of Seismograph Services Limited
(SSL). Geco-Prakla streamlined its opera tions
throughout the year. A charge was taken in the
fourth quarter to cover consolidation of facilities
and reduction in personnel and equipment.
In 1993, Marine revenue declined 23% com
pared to a strong prior year. Activity, particu
larly in the second half of the year, declined
significan tl y. This led to overcapacity which re
quired an industry-wide reduction in 20 vessels.
Geco-Prakla retired seven low-tech vessels and
added four purpose-built, leading technology
vessels. A t year-end, the fleet consisted of 17
high-technology 30 vessels and two support vessels, 10% fewer than one year earlier.
Land and TZ revenue was 10% higher than
1992, including the addition of SSL's operations.
These gains reflected stronger activity in North
America, Latin America, Africa, the Common
wealth of Independent States (CIS) and the
Middle East.
Data Processing revenue was 7% above
1992, reflecting the addition of SSL, and
impacted by price erosion despite a 47% in
crease in processing volume. Consolidation of
Data Processing continued throughout the year.
Three noncore activities were divested
during 1993.
Sedco Forex
Revenue for the year was 13% higher than
1994, driven by higher activity and improved
12
dayrates in both the North Sea and WL"'l
Africa. This improvement was partly offse t by
a temporary softening in the swamp barge and
tender markets and falling demand for semi
submersibles in Southeas t Asia.
The average Sedco Forex rig utilization rate
for 1995 was 66% compared to 63% in the pre
vious year. Average offshore rig utiliza tion
increased from 84% to 89%, aided by jackup
utilization of 99%. Industry-wide competiti ve
offshore rig utilization was 81% compared to
77% last year. The Sedco Forex average land rig
utilization for the year remained flat at 40%.
At December 31, 1995, the Sedco Forex fleet
consisted of 76 rigs: 34 land and 42 offshore. In
March, the semi-submersible Dundee Explorer was acquired and renamed Sedco Explorer. After undergoing life enhancement, the rig
commenced opera tions in the North Sea in
July. In the first quarter, the semi-submersibl es
Sedco 708 and Sedco 709 were redeployed from
Southeast Asia to begin con~·acts offshore Wes t
Africa, where they benefited from increased
activity in the region and firmer dayrates. In
June, the Trident 15 jackup was awarded J n integrated service contrac t in Th ailand wi th
Anadrill, Dowell and Wireline & Testing.
During the third quarter, Sedco Forex was :
awarded the management contract for the
semi-submersible Omega, which commenced
opera tions in Angola in November. Tn
December, Sedco Forex acquired full owner
ship of the Sedco 714, foLlowing an agreement
to purchase the remaining 50% interest.
Following the award of a contract in
Eastern Venezuela, two previously idle ultra
heavy land rigs were reactivated and com
menced operations in the fourth quarter. This
is the first time Sedco Forex has ente red the
land market in Venezuela. With a manageml'nt
contract for the dynamically positioned Sl'mi -
submersible Amethyst in Brazil, Sedco Forex will commence operations in July 1996.
In March, Sedco Forex was awarded a fi veyear integra ted service contract in Gabon, involving the construction of a new modular design land rig, SIMPLER* 101. Construction was completed during the fourth quarter, and opera tions will begin in March 1996. In December, the award of drilling make-ready and management contracts for the semisubmersible Laffit Pil1eay will enable Sedco Forex to reenter the Gulf of Mexico early in 1996, after an absence of five years. 1994 RESULTS
In 1994, revenue was flat compared to 1993. Weak activity in the North Sea and Africa in the first half of the year was offset by positive momentum in the second half, particularly in the fourth quarter.
The Sedco Forex offshore rig utiliza tion rate increased from 82% in 1993 to 84% in 1994. Industry-wide competitive offshore rig utilization decreased from 78% to 77%. Sedco Forex average land rig utiliza tion rate slipped from 51% to 40% during the same period.
At December 31, 1994, the Sed co Forex fl eet consisted of 74 r igs: 40 offshore and 34 land. In the fourth quarter, the jackup Sonny Voss was p urchased and renamed Trident 18.
The semi-submersibles Sedco 700 and Sedneth 701 were life enhanced in 1994 and contracted for tender-assisted drilling in 1995. Three significant tender-assisted drilling contracts began in 1994 for the Sedco 600, the Sedco 706 and the Searex 10.
In 1994, Sedco Forex realigned its management s tructure and opened offices in Dubai and Caracas. 1993 RESULTS
Revenue in 1993 declined 15% compared to 1992. Growth in Asia was more than offset by
13
weak activity in the North Sea, a decline in West Africa and a decrease in land rig demand in the Middle East.
The Sedco Forex rig utilization rate in 1993 was 67% compared to 71% in 1992. Land rig utiliza tion fell from 61% to 51% while offshore rig utilization rose from 80% to 82%. Over the same period, the industry-wide competitive offshore rig utiliza tion rate increased from 69% to 78%, with activity in the Gulf of Mexico being a major driver.
At December 31, 1993, the Sedco Forex fleet consisted of 74 rigs: 39 offshore and 35 land. During 1993, two jackups in the North Sea, Trident 10 and 11, were exchanged for three jackups in Southeast Asia, which were subsequently renamed, Trident 15, 16 and 17. In addition, the remaining 50% interes t in Sedco 711 was acquired. During the year, the Land Rig 32 was retired and the jackup Sedneth Luanda was sold.
The Sedco Forex fl eet underwent a significant repositioning in 1993, with an emphasis on the Asian market.
Sedco 601 and Sedco 706 were awarded tender-assisted drilling contracts, demonstra ting the flexibility of semi-submersib les in this growing market.
Anadrill
Revenue in 1995 was up by 31% with the strongest activity gains in the Middle East, South America and West Africa.
Directiona l drilling activity grew by 56%. Throughout the year, the PowerPak* fl eet of motors continued to expand and achieve technica l success with the introd uction of the PowerPak XF short-radius and PowerPak XP extended-reach motors. In the UK, Ana drill set new world records for foota ge drilled and operating hours in a single bit run with MWD and a
steerable motor. Another record was set for the longest extended-reach well, which had a horizontal displacement of over five miles. Ana drill has now provided services on the majority of the world 's top extended-reach wells.
During 1995, Anadrill further increased its market and technological leadership in MWD and logging while drilling (LWD) services. Strong growth continued in MWD w ith Slim 1* MWD increasing by 45% and LWD by 36%. New IDEA L • Integrated Drilling Evaluation and Logging sys tems were deployed worldwide. The Power Pulse* MWD tool continued to se t new standards for reliability and durability. The ARCS* Array Resis tivity Compensa ted tool was introduced in many parts of the world w ith w ide client acceptance. This tool gives the most accurate resis tivity measurements in slim wellbores. The first commercial borehole IWD* Imaging While Drilling and formation dip measurements were introduced with the RAB* Resistivity-a t-the-Bit tool. 1994 RESULTS
Revenue in 1994 grew by 25% mainly in South America, North America and Asia .
Directional drilling activity rose by 46% in 1994, due to an increase in activity in North America, South America and the Far East. This growth was made possible by the continued additions to the fleet of PowerPak steerable motors and the successful integration of Great Land Directional Drilling.
During the year, Anadrill 's market and technological leadership was consolidated in MWD and LWD services. MWD continued to grow with Sliln 1 services increasing 56%. LWD services also continued to climb. The GeoSteering* tool performed well when rw1 in the Gulf of Mexico, the North Sea, Africa and the Far East. The RAB tool produced the industry's first borehole images while drilling.
14
1993 RESULTS
In 1993, revenue increased 19% compared to 1992. North America experienced the largest growth followed by South America and Asia.
The introduction of IDEAL technology es tablished Ana drill as the technology leader in horizontal drilling by providing the industry's first "at-the-bit" measurements. Grea t Land Directional Drilling Inc., the leader in direc tional drilling in Alaska, was acquired in September 1993. Including this acquisition, directional drilling revenue increased 59% over 1992.
The Slim 1 MWD system was the fastes t growing p roduct, with an increase of 60'!1,,, LWD services rose by more than 40%, w ith activity in all major offshore areas.
GeoQuest
Revenue grew 18% in 1995, w ith strong grow th in Software Products and Information Technology Serv ices. During the fourth quarter of 1995, GeoQues t purchased the Petroleum Division of Intera Information Technologies C . •
orporat10n. Software Products revenue in 1995
increased 16% over 1994. Sales grew worldwide, fu eled by continued demand for geological, petrophysical and seismic interpreta ti on software products coupled with recentl y released software introducing new interpretation techniques. The reservoir characteriza tion suite of p roducts met with strong demand, supported by the rapid introduction of the GeoFrame* platform and the Desktop Geology* set of applica tions. Data Management products, especially Finder* and LogDB* applications, continued to show excellent growth as more companies adopt these products to manage their exploration and production data.
Interpretation, well data processing and related data services revenue grew 1% over
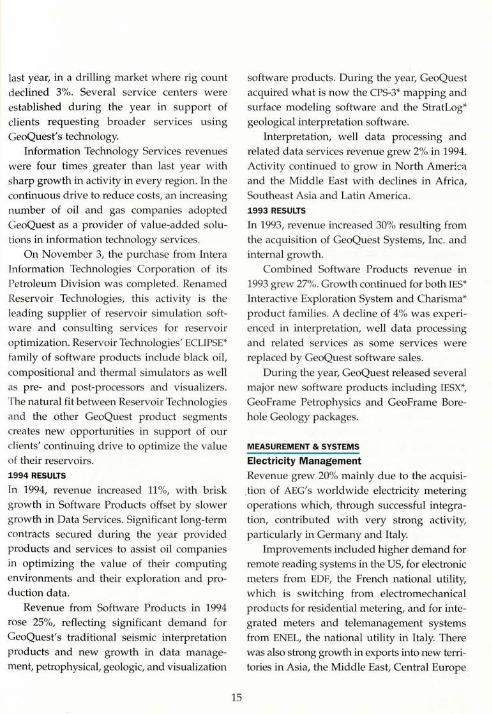
last year, in a drilling market where rig count declined 3%. Several service centers were established during the year in support of clients reques ting broader services using GeoQuest's technology.
Information Technology Services revenues were four times greater than last year with sharp growth in activity in every region. In the continuous drive to reduce costs, an increasing number of oil and gas companies adopted GeoQuest as a provider of value-added solutions in information technology services.
On November 3, the purchase from Intera Information Technologies Corporation of its Petroleum Division was completed. Renamed Reservoir Technologies, this ac tivity is the leading supplier of reservoir simulation software and consulting services for reservoir optimization. Reservoir Technologies' ECLIPSE* family of software products include black oil, compositional and thermal simulators as well as pre- and post-processors and visualizers. The natural fit between Reservoir Technologies and the other GeoQuest product segments creates new opportunities in support of our clients' continuing drive to optimize the value of their reservoirs. 1994 RESULTS
In 1994, revenue increased 11%, with brisk growth in Software Products offset by slower growth in Data Services. Significant long- term contracts secured during the year provided products and services to assist oil companies in optimizing the value of their computing environments and their exploration and production data.
Revenue from Software Products in 1994 rose 25%, reflecting significant demand for GeoQuest's traditional seismic interpretation products and new growth in data management, petrophysical, geologic, and visualiza tion
15
software products. During the year, GeoQuest acquired what is now the CPS-3* mapping and surface modeling software and the StratLog* geological interpretation software.
Interpre tation, well data processing and related data services revenue grew 2% in 1994. Activity continued to grow in North America and the Middle East with declines in Africa, Southeast Asia and Latin America . 1993 RESULTS
In 1993, revenue increased 30% resulting from the acquisition of GeoQuest Systems, Inc. and internal growth.
Combined Software Products revenue in 1993 grew 27%. Growth continued for both IES* Interactive Exploration System and Charisma* product families. A decline of 4% was experienced in interpretation, well data processing and related services as some services were replaced by GeoQuest software sales.
During the year, GeoQuest released several major new software products including IESX*, GeoFrame Petrophysics and GeoFrame Borehole Geology packages.
MEASUREMENT & SYSTEMS
Electricity Management
Revenue grew 20% mainly due to the acquisi_tion of AEG's worldwide electricity metering operations which, through successful integration, contributed with very strong activity, particularly in Germany and Italy.
Improvements included higher demand for remote reading systems in the US, for electronic meters from EDF, the French national utility, which is switching from electromechanical products for residential metering, and for integrated meters and telemanagement systems from ENEL, the national utility in Italy. There was also strong growth in exports into new territories in Asia, the Middle East, Central Europe
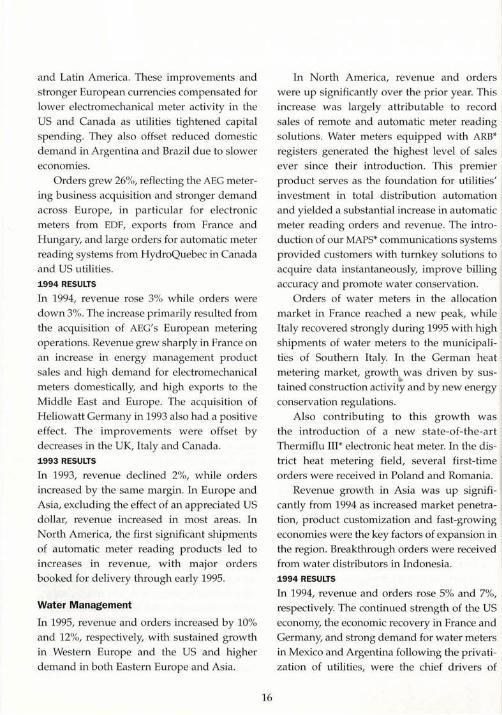
and Latin America. These improvements and stronger European currencies compensated for lower electromechanical meter activity in the US and Canada as utilities tightened capital spending. They also offset reduced domestic demand in Argentina and Brazil due to slower economies.
Orders grew 26%, reflecting the AEG metering business acquisition and stronger demand across Europe, in particular for elec tronic meters from EDF, exports from France and Hungary, and large orders for automatic meter reading systems from HydroQuebec in Canada and US utilities. 1994 RESULTS
In 1994, revenue rose 3% while orders were down 3%. The increase primari ly resulted from the acquisition of AEG's European metering operations. Revenue grew sharply in France on an increase in energy management product sales and high demand for elec tromechanical meters domestically, and high expor ts to the Middle East and Europe. The acquisition of Heliowatt Germany in 1993 also had a positive effect. The improvements were offse t by decreases in the UK, Italy and Canada. 1993 RESULTS
In 1993, revenue declined 2%, while orders increased by the same margin. In Europe and Asia, excluding the effec t of an appreciated US dollar, revenue increased in most areas. In Nor th America, the first significant shipmen ts of automatic meter reading products led to increases in revenue, with major orders booked for delivery through early 1995.
Water Management
In 1995, revenue and orders increased by 10% and 12%, respectively, with sustained growth in Western Europe and the US and higher demand in both Eastern Europe and Asia.
16
In North America, revenue and orders were up significantly over the prior year. This increase w as largely a ttributable to record sales of remote and automatic meter reading solutions. Water meters equipped with ARB* registers generated the highest level of sales ever since their introduction. This premier product serves as the foundation for utilities' investment in total distribution automation and yielded a substantial increase in automatic meter reading orders and revenue. The introduction of our MAPS* communications systems provided customers with turnkey solutions to acquire data instantaneously, improve billing accuracy and promote water conserva tion.
Orders of wa ter meters in the allocation market in France reached a new peak, while Italy recovered strongly during 1995 with high shipments of water meters to the municipalities of Southern Italy. In the German heat metering market, grow th• was driven by sustained construction activity and by new energy conservation regulations.
Also contributing to this grow th w as the introd uction of a new s ta te-of-the-art Therrniflu III* electronic heat meter. In the district heat metering field, several first-time orders were received in Poland and Romania .
Revenue growth in Asia was up significan tly from 1994 as increased market penetration, product custornization and fa st-growing economies were the key fac tors of expansion in the region. Breakthrough orders were received from wa ter distributors in Indonesia. 1994 RESULTS
In 1994, revenue and orders rose 5% and 7%, respectively. The continued strength of the US economy, the economic recovery in France and Germany, and strong demand for water meters in Mexico and Argentina following the privatization of utilities, were the chief drivers of
growth. The positive trend was only slightly offse t by an unfavorable business environment in Italy and weak demand in Eastern Europe. 1993 RESULTS
Revenue and orders decreased by 8% and 6%, respectively. Europe declined due to an appreciated US dollar and weak demand in Italy, only partially offset by growth in heat meters and the launching of the new CFlOO* district heating product. North America experienced a sharp increase in water meter revenue as a result of continued growth in automatic meter reading systems, in particular the newly introduced Advance* reading unit.
Gas Management
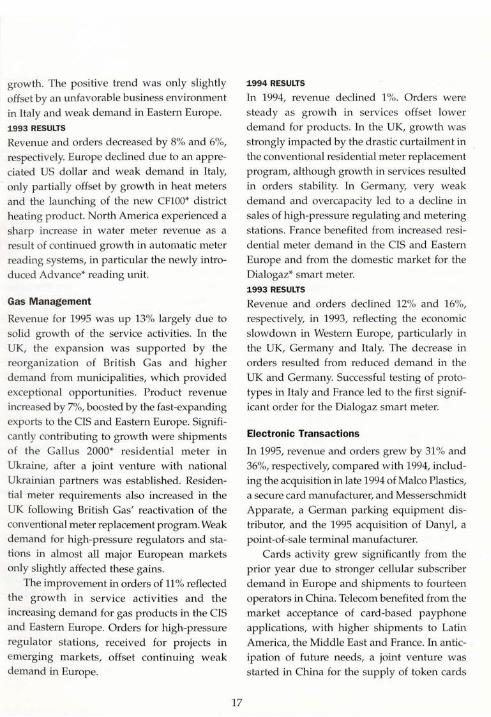
Revenue for 1995 was up 13% largely due to solid growth of the service activities. In the UK, the expansion was supported by the reorganization of British Gas and higher demand from municipalities, which provided exceptional opportunities. Product revenue increased by 7%, boosted by the fas t-expanding exports to the CIS and Eastern Europe. Significantly contributing to growth were shipments of the Gallus 2000* residential m eter in Ukraine, after a joint venture with national Ukrainian partners was es tablished. Residential meter requirements also increased in the UK following British Gas' reactivation of the conventional meter replacement program. Weak demand for high-pressure regulators and stations in almost all major European markets only slightly affected these gains.
The improvement in orders of 11% reflected the growth in service ac tivities and the increasing demand for gas products in the CIS and Eastern Europe. Orders for high-pressure regulator stations, received for projects in emerging markets, offset continuing weak demand in Europe.
17
1994 RESULTS
In 1994, revenue declined 1%. Orders were stead y as growth in services offset lower demand for products. In the UK, growth was strongly impacted by the drastic curtailment in the conventional residential meter replacement program, although growth in services resulted in orders stability. In Germany, very weak demand and overcapacity led to a decline in sales of high-pressure regulating and metering stations. France benefited from increased residential meter demand in the CIS and Eastern Europe and from the domestic market for the Dialogaz* smart meter. 1993 RESULTS
Revenue and orders declined 12% and 16%, respectively, in 1993, reflecting the economic slowdown in Western Europe, particularly in the UK, Germany and Italy. The decrease in orders resulted from reduced demand in the UK and Germany. Successful testing of prototypes in Italy and France Jed to the firs t significant order for the Dialogaz smart meter.
Electronic Transactions
In 1995, revenue and orders grew by 31% and 36%, respectively, compared with 1994, including the acquisition in late 1994 ofMalco Plastics, a secure card manufacturer, and Messerschmidt Appara te, a German parking equipment distributor, and the 1995 acquisition of Danyl, a point-of-sale terminal manufacturer.
Cards activity grew significantly from the prior year due to stronger cellular subscriber demand in Europe and shipments to fourteen operators in China. Telecom benefi ted from the market acceptance of card-based payphone applications, with higher shipments to Latin America, the Middle East and France. In anticipation of future needs, a joint venture was started in China for the supply of token cards

and card-based telephones. Retail Petroleum Systems experi enced
increases in both equipment and service revenue for North America and Eastern Europe, furth er enhanced by a new service opera tion in Russia and the latmching of a joint venture in China for the manufacture of gasoline dispensers. Transaction Terminals also contributed to the growth with shipments to South Africa, while European demand remained flat. 1994 RESULTS
In 1994, revenue and orders increased by 9% and 6%, respectively. In most countries, Retail Petro leum Systems revenue increased for both equipment and services, although lower product prices resulted in significantly reduced ma rgins. Messerschmidt Apparate and Malco Plastics were acquired late in the year. 1993 RESULTS
Revenue decreased by 4%, and orders were flat in 1993. In Europe, the economic recession and depressed au to industry impacted revenue at Reta il Petroletun Systems, while in North America, revenue improved. Strong growth outside Europe in parking, payphones and phone cards compensa ted for reduced activity in parking and banking terminals in France. Urban Terminals & Systems received a large order for ticket vending machines from the French ra ilways, and Telecommunications' grow th continued on major orders in Argentina, Mexico and Pakistan .
Automatic Test Equipment
Compared with 1994, both revenue and orders were up 32%. Sustained growth at Test Systems was driven by continued strong demand for the ITS9000* family of semiconductor test systems in Nor th America, Europe and Asia . Revenue a t Automated Systems more · than doubled from last year with contributions from the
18
entire product range. Ac tivity for Diagnostic Systems products expanded significantly, with growth in North America and Japan more than compensating for reduced demand in Europe. Board Sys tems was adversely a ffected by declines in the military and telecom markets. 1994 RESULTS
In 1994, revenue and orders were up 23% and 29%, respectively. All ac tivities experienced growth during the year. Diagnostic Systems successfully launched the IDSlOOOO* system, Automated Systems doubled its ac tivity run rate with contributions from all activ ities, and Board Systems rebound showed the grow ing success of its Telecom Test products. Throughout 1994, activity continued to increase in all regions, notably Asia. 1993 RESULTS
Revenue and orders rose 22% and 35%, respecti vely, compared with 1992. Component Test Systems continued to sustain rapid growth, driven by strong demand for lTS9000 semiconductor test systems. Diagnostic Systems experienced strong product activity in North America and Europe, while Board Test Systems slipped on continued decline · defense-related business, slightly offset by shipments ofTelecom Test products. The acquisition of TLA Technology, completed in July, contributed to growth.
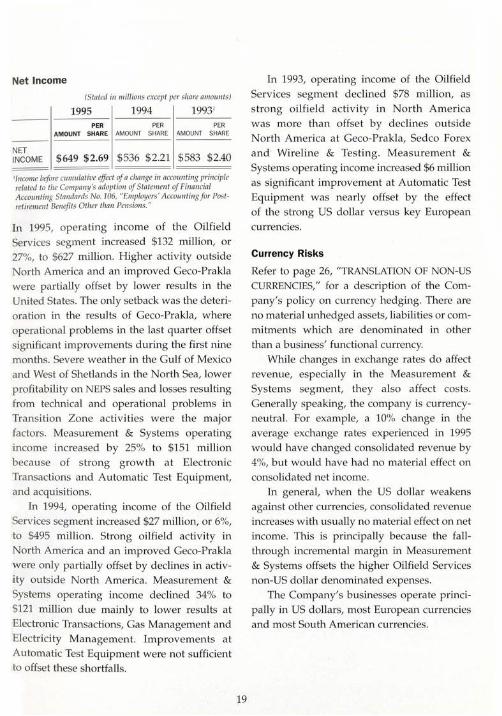
Net Income
(Stated i11 millions except per share amounts)
NET INCOME
1995 PER
AMOUNT SHARE
$649 $2.69
1994 1993' PER PER
AMOUNT SHARE AMOUNT SHARE
$536 $2.21 $583 $2.40
1[n come before wmtdative effect of a change in nccottnfing principle related to the Compa ny's adoption of Statement of Finan cial Accounti11g Standards No.106, "Employers' Accounting for Postretirement Benefits Other than Pensions."
In 1995, operating income of the Oilfield Services segment increased $132 million, or 27%, to $627 mii!ion. Higher activity outside North America and an improved Geco-Prakla were partially offset by lower results in the United States. The only se tback was the deterioration in the results of Geco-Prakla, where operational problems in the las t quarter offset significant improvements during the first nine months. Severe weather in the Gulf of Mexico and West of Shetlands in the North Sea, lower profitability on NEPS sales and losses resulting from technical and operational problems in Transition Zone ac tivities were the major factors. Measurement & Systems operating income increased by 25% to $151 million because of s trong grow th a t Electronic Transactions and Automatic Test Equipment, and acquisitions.
In 1994, opera ting income of the Oilfield Services segment increased $27 million, or 6%,
to $495 million . Strong oilfield ac tivi ty in North America and an improved Geco-Prakla were only partially offset by declines in activity outside North America. Measurement &
Systems operating income declined 34% to $121 million due mainly to lower results at Electronic Transactions, Gas Management and Electricity Management. Improvements a t Automatic Test Equipment were not sufficient to offset these shortfalls.
19
In 1993, opera ting income of the Oilfield Services segment declined $78 million, as s trong oilfield ac tivity in North America was more than offse t by declines outside North America a t Geco-Prakla, Sedco Forex and Wireline & Tes ting. Measurem ent &
Systems opera ting income increased $6 million as significant improvement at Automatic Test Equipment was nearly offset by the effect of the strong US dollar versus key European currencies.
Currency Risks
Refer to page 26, "TRANSLATION OF NON-US
CURRENCIES," for a description of the Company's policy on currency hedging. There are no material unl1edged assets, liabilities or commitments w hich are denominated in other than a business' functional currency.
While changes in exchange rates do affect revenue, especially in the Measurement &
Systems segment, they also affec t cos ts. Generally speaking, the company is currencyneutral. For example, a 10% change in the average exchange rates experienced in 1995
would have changed consolidated revenue by 4%, but would have had no material effec t on consolidated net income.
In general, when the US dollar weakens against other currencies, consolidated revenue increases with usually no material effec t on net income. This is principally because the fallthrough incremental margin in Measurement & Systems offse ts the higher Oilfield Services non-US dollar denominated expenses.
The Company's businesses operate principally in US dollars, most European currencies and most South American currencies.
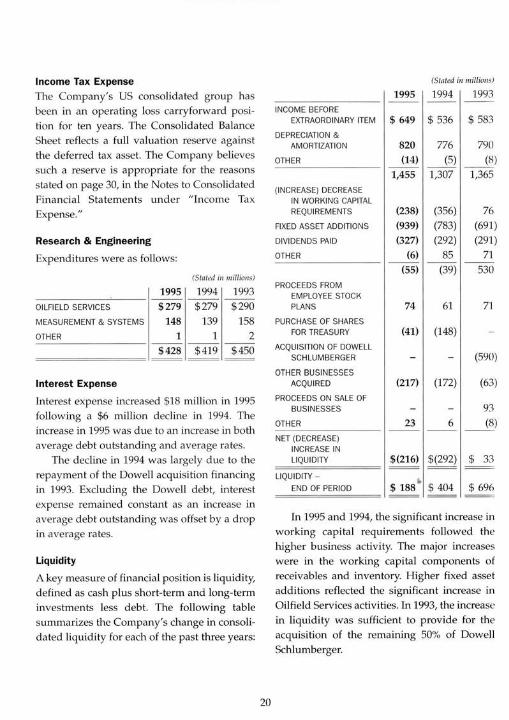
Income Tax Expense
The Company's US consolidated group has been in an operating loss carryforward position for ten years. The Consolidated Balance Sheet reflects a full valuation reserve against the deferred tax asset. The Company believes such a reserve is appropriate for the reasons stated on page 30, in the Notes to Consolidated Financial Statements under "Income Tax Expense."
Research & Engineering
Expenditures were as follows:
1995 ~~-
OILFIELD SERVICES $279
MEASUREMENT & SYSTEMS 14S
OTHER 1 ~~-
$42S
(S tated in millions)
1994 1993 ~~-
$ 279 $290
139 158
1 2 ~~-
$ 419 $450 =========
Interest Expense
Interest expense increased $18 million in 1995
following a $6 million decline in 1994. The increase in 1995 was due to an increase in both average debt outstanding and average rates.
The decline in 1994 was largely d ue to the repayment of the Dowell acquisition financing in 1993. Excluding the Dowell debt, interest expense remained constant as an increase in average debt outstanding was offset by a drop in average rates.
Liquidity
A key measure of financial position is liquidity, defined as cash plus short-term and long-term inves tments less debt. The following table summarizes the Company's change in consolidated liquidity for each of the past three years:
20
(Stated hi miifiOIIS)
1995 1994 1993
INCOME BEFORE EXTRAORDINARY ITEM $ 649 $ 536 $ 583
DEPRECIATION & AMORTIZATION S20 776 790
OTHER (14) (5) __ (8)
1,455 1,307 1,365
(INCREASE) DECREASE IN WORKING CAPITAL REQUIREMENTS (238) (356) 76
FIXED ASSET ADDITIONS (939) (783) (691)
DIVIDENDS PAID (327) (292) (291)
OTHER (6) 85 71 (55) (39) 530
PROCEEDS FROM EMPLOYEE STOCK PLANS 74 61 71
PURCHASE OF SHARES FOR TREASURY (41) (148)
ACQUISITION OF DOWELL SCHLUMBERGER (590)
OTHER BUSINESSES ACQUIRED (217) (172) (63)
PROCEEDS ON SALE OF BUSINESSES 93
OTHER 23 6 (8)
NET (DECREASE) INCREASE IN LIQUIDITY $(216) $(292) $ 33
LIQUIDITY -$Iss" END OF PERIOD $404 $ 696 ==
In 1995 and 1994, the significant increase in working capital requirements followed the higher business activity. The major increases were in the working capital components of receivables and inven tory. Higher fixed asset additions reflec ted the significant increase in Oilfield Services activities. In 1993, the increase in liquidity was sufficient to provide for the acquisition of the remaining 50% of Dowell Schl umberger.
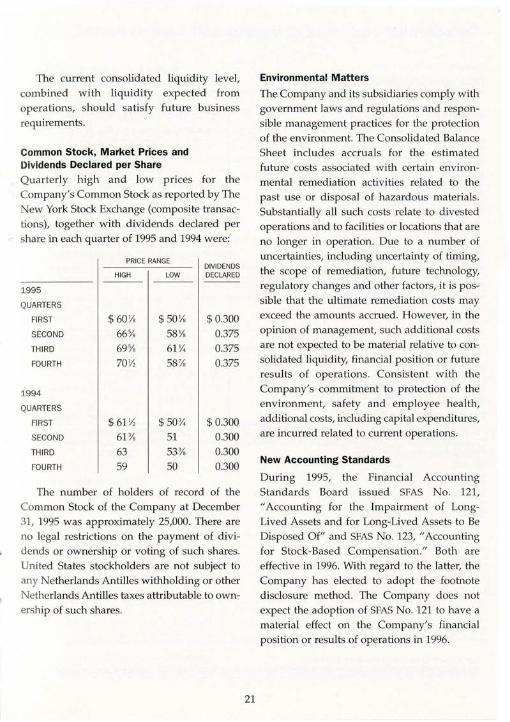
The current consolidated liquidity level, combined with liquidity expected from opera tions, should satisfy future business requirements.
Common Stock, Market Prices and Dividends Declared per Share
Quarterly high and low prices for the Company's Common Stock as reported by The New York Stock Exchange (composite transactions), together with dividends declared per share in each quarter of 1995 and 1994 were:
1995
QUARTERS
FIRST
SECOND
THIRD
FOURTH
1994
QUARTERS
FIRST
SECOND
THIRD
FOU RTH
PRICE RANGE
HIGH ---
$ 60 Ys
66%
69% 70 Y,
$ 61 y, 61 %
63
59
LOW ---
$ SO Y.
58 Ys
61 Y.
58 ';'.
$50%
51
53%
50
DIVIDENDS DECLARED
$ 0.300
0.375
0.375
0.375
$ 0.300
0.300
0.300
0.300
The number of holders of record of the Common Stock of the Company at December 31, 1995 was approximately 25,000. There are no legal restrictions on the payment of dividends or ownership or voting of such shares. United States stockholders are not subject to any Netherlands Antilles withholding or other Netherlands Antilles taxes attributable to ownership of such shares.
21
Environmental Matters
The Company and its subsidiaries comply with government laws and regulations and responsible management prac tices for the protection of the environment. The Consolidated Balan ce Sheet includes accruals for the es timated future costs associated with certain environmental remediation activities related to the past use or disposal of hazardous materials. Substantially all such costs relate to divested operations and to facilities or locations that are no longer in operation. Due to a number of uncertainties, including uncertainty of timing, the scope of remediation, future technology, regulatory changes and other factors, it is possible that the ultimate remediation costs may exceed the amounts accrued . However, in the opinion of management, such additional costs are no t expected to be material relative to consolidated liquidity, financial position or future results of operations. Consisten t with the Company's commitment to protection of the environment, sa fety and employee health, additional costs, including capital expenditures, are incurred related to curren t operations.
New Accounting Standards
During 1995, the Financial Accounting Standards Board issued SFAS No. 121,
"Accounting for the Impairment of LongLived Assets and for Long-Lived Assets to Be Disposed Of" and SFAS No. 123, "Accounting for Stock-Based Compensation. " Both are effective in 1996. With regard to the latter, the Company has elected to adopt the footnote disclosure method. The Company does not expect the adoption of SFAS No. 121 to have a material effect on the Company's financial position or results of operations in 1996.
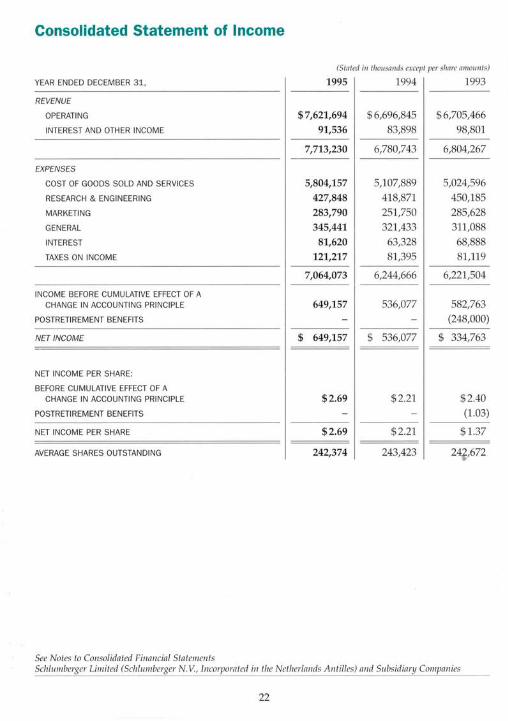
Consolidated Statement of Income
(Staled i11 tlwusn11ds except per share muow1ts)
YEAR ENDED DECEMBER 31, 1995 1994 1993
REVENUE
OPERATING $7,621,694 $ 6,696,845 $ 6,705,466
INTEREST AND OTHER INCOME 91,536 83,898 98,801
7,713,230 6,780,743 6,804,267
EXPENSES
COST OF GOODS SOLD AND SERVICES 5,804,157 5,107,889 5,024,596
RESEARCH & ENGINEERING 427,848 418,871 450,185
MARKETING 283,790 251,750 285,628
GENERAL 345,441 321,433 311,088
INTEREST 81,620 63,328 68,888
TAXES ON INCOME 121,217 81,395 81,119
7,064,073 6,244,666 6,221,504
INCOME BEFORE CUMULATIVE EFFECT OF A CHANGE IN ACCOUNTING PRINCIPLE 649,157 536,077 582,763
POSTRETIREMENT BENEFITS (248,000)
NET INCOME $ 649,157 $ 536,077 $ 334,763
NET INCOME PER SHARE:
BEFORE CUMULATIVE EFFECT OF A CHANGE IN ACCOUNTING PRINCIPLE $2.69 $ 2.21 $ 2.40
POSTRETIREMENT BENEFITS (1.03)
NET INCOME PER SHARE $2.69 $ 2.21 $ 1.37
AVERAGE SHARES OUTSTANDING 242,374 243,423 24t ,672
See Notes to Consolidated Financial Statements Schlumberger Lilnited (Schlwnberger N. V , In corpora ted in the Netherlands Antilles) and Subsidiary Companies
22
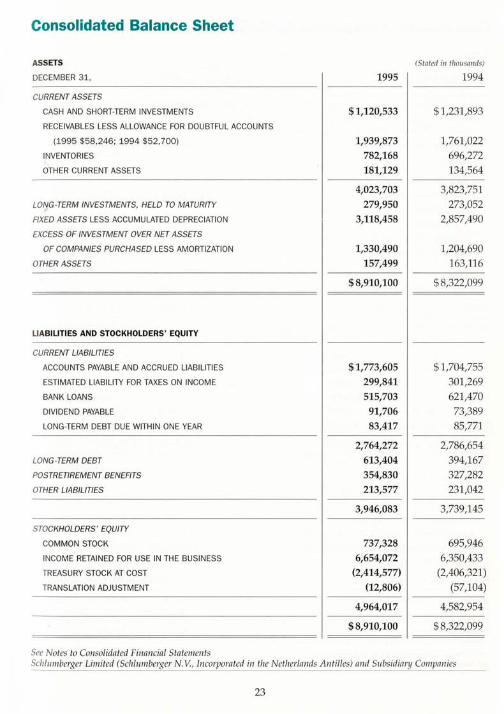
Consolidated Balance Sheet
ASSETS
DECEMBER 31,
CURRENT ASSETS
CASH AND SHORT-TERM INVESTMENTS
RECEIVABLES LESS ALLOWANCE FOR DOUBTFUL ACCOUNTS
(1995 $58,246; 1994 $52,700)
INVENTORIES
OTHER CURRENT ASSETS
LONG-TERM INVESTMENTS, HELD TO MATURITY
FIXED ASSETS LESS ACCUMULATED DEPRECIATION
EXCESS OF INVESTMENT OVER NET ASSETS
OF COMPANIES PURCHASED LESS AMORTIZATION
OTHER ASSETS
LIABILITIES AND STOCKHOLDERS' EQUITY
CURRENT LIABILITIES
ACCOUNTS PAYABLE AND ACCRUED LIABILITIES
ESTIMATED LIABILITY FOR TAXES ON INCOME
BANK LOANS
DIVIDEND PAYABLE
LONG-TERM DEBT DUE WITHIN ONE YEAR
LONG-TERM DEBT
POSTRETIREMENT BENEFITS
OTHER LIABILITIES
STOCKHOLDERS ' EQUITY
COMMON STOCK
INCOME RETAINED FOR USE IN THE BUSINESS
TREASURY STOCK AT COST
TRANSLATION ADJUSTMENT
See Notes to Consolidated Financial Statements
(Stated i11 tlwusn11ds)
1995 1994
$1,120,533 $ 1,231,893
1,939,873 1,761,022
782,168 696,272
181,129 134,564
4,023,703 3,823,751
279,950 273,052
3,118,458 2,857,490
1,330,490 1,204,690
157,499 163,116
$8,910,100 $8,322,099
$1,773,605 $ 1,704,755
299,841 301,269
515,703 621,470
91,706 73,389
83,417 85,771
2,764,272 2,786,654
613,404 394,167
354,830 327,282
213,577 231,042
3,946,083 3,739,145
737,328 695,946
6,654,072 6,350,433 (2,414,577) (2,406,321)
(12,806) (57,104)
4,964,017 4,582,954
$8,910,100 $ 8,322,099
Scfl lumberger Limited (Schlumberger N. V , l11corporated i11 tile Netherla11ds A11tilles) a11d Subsidiary Compa11 ies
23
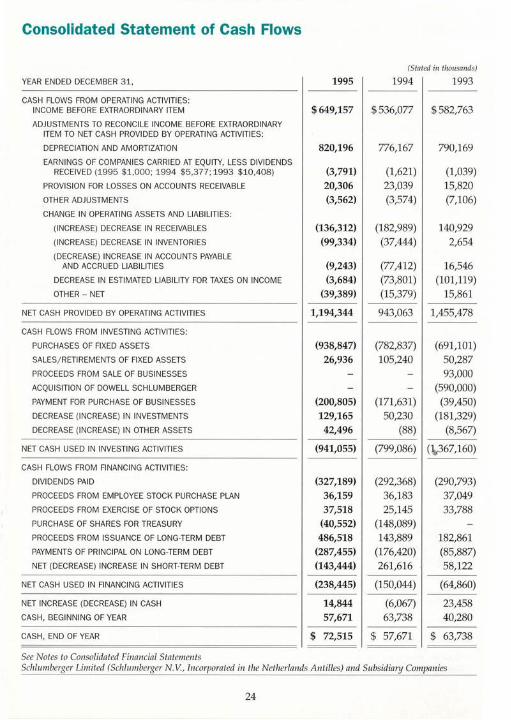
Consolidated Statement of Cash Flows
(Stated in thousands)
YEAR ENDED DECEMBER 31, 1995 1994 1993
CASH FLOWS FROM OPERATING ACTIVITIES: INCOME BEFORE EXTRAORDI NARY ITEM $649,157 $536,077 $582,763 ADJUSTM ENTS TO RECONCILE INCOME BEFORE EXTRAORDINARY
ITEM TO NET CASH PROVIDED BY OPERATING ACTIVITIES:
DEPRECIATION AND AMORTIZATION 820,196 776,167 790,169 EARNINGS OF COMPANIES CARRIED AT EQUITY, LESS DIVIDENDS
RECEIVED (1995 $1,000; 1994 $5,377; 1993 $10,408) (3,791) (1,621) (1,039) PROVISION FOR LOSSES ON ACCOU NTS RECEIVABLE 20,306 23,039 15,820 OTHER ADJUSTMENTS (3,562) (3,574) (7,106) CHANGE IN OPERATING ASSETS AND LIAB ILITI ES:
(INCREASE) DECREASE IN RECEIVABLES (136,312) (182,989) 140,929 (INCREASE) DECREASE IN INVENTORI ES (99,334) (37,444) 2,654 (DECREASE) INCREASE IN ACCOU NTS PAYABLE
AND ACCRU ED LIABILITIES (9,243) (77,412) 16,546 DECREASE IN ESTIMATED LIAB ILITY FOR TAXES ON INCOME (3,684) (73,801) (101,119) OTHER - NET (39,389) (15,379) 15,861
NET CASH PROVIDED BY OPERATING ACTIVITIES 1,194,344 943,063 1,455,478
CASH FLOWS FROM INVESTING ACTIVITI ES:
PURC HASES OF FIXED ASSETS (938,847) (782,837) (691,101) SALES/RETIREMENTS OF FIXED ASSETS 26,936 105,240 50,287 PROCEEDS FROM SALE OF BUSINESSES 93,000 ACQUISITION OF DOWELL SCHLUMBERGER (590,000) PAYMENT FOR PURCHASE OF BUSINESSES (200,805) (171,631) (39,450) DECREASE (INCREASE) IN INVESTMENTS 129,165 50,230 (181,329) DECREASE (INCREASE) IN OTHER ASSETS 42,496 (88) (8,567)
NET CASH USED IN INVESTING ACTIVITIES (941,055) (799,086) (\,367,160)
CASH FLOWS FROM FI NANCING ACTIVITIES:
DIVIDENDS PAID (327,189) (292,368) (290,793) PROCEEDS FROM EMPLOYEE STOCK PURCHASE PLAN 36,159 36,183 37,049 PROCEEDS FRO M EXERCISE OF STOCK OPTIONS 37,518 25,145 33,788 PURCHASE OF SHARES FOR TREASURY (40,552) (148,089) PROCEEDS FROM ISSUANCE OF LONG-TERM DEBT 486,518 143,889 182,861 PAYMENTS OF PRINCIPAL ON LONG-TERM DEBT (287,455) (176,420) (85,887) NET (DECREASE) INCREASE IN SHORT-TERM DEBT (143,444) 261,616 58,122
NET CASH USED IN FINANCING ACTIVITIES (238,445) (150,044) (64,860)
NET INCREASE (DECREASE) IN CASH 14,844 (6,067) 23,458 CASH, BEGINNING OF YEAR 57,671 63,738 40,280
CASH, END OF YEAR $ 72,515 $ 57,671 $ 63,738
See Notes to Consolidated Financial Statements Schlwnberger Limited (Schlumberger N. V., Incorporated in the Netherlands Antilles) and Subsidiary Companies
24
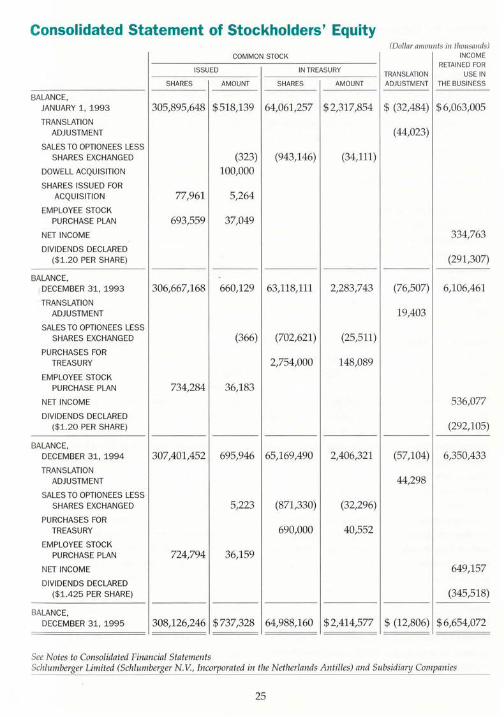
Consolidated Statement of Stockholders' Equity (Dollar amounts in thousands)
COMMON STOCK INCOME
ISSUED IN TREASURY RETAINED FOR
TRANSLATION USE IN SHARES AMOUNT SHARES AMOUNT ADJUSTMENT THE BUSINESS
BALANCE, JANUARY 1 , 1993 305,895,648 $518,139 64,061,257 $ 2,317,854 $ (32,484) $6,063,005
TRANSLATION ADJUSTMENT (44,023)
SALES TO OPTIONEES LESS SHARES EXCHANGED (323) (943,146) (34,111)
DOWELL ACQUISITION 100,000 SHARES ISSUED FOR
ACQU ISITION 77,961 5,264
EMPLOYEE STOCK PURCHASE PLAN 693,559 37,049
NET INCOME 334,763 DIVIDENDS DECLARED
($1 .20 PER SHARE) (291,307)
BALANCE, DECEMBER 31, 1993 306,667,168 660,129 63,118,111 2,283,743 (76,507) 6,106,461
TRANSLATION ADJUSTMENT 19,403
SALES TO OPTIONEES LESS SHARES EXCHANGED (366) (702,621) (25,511)
PURCHASES FOR TREAS URY 2,754,000 148,089
EMPLOYEE STOCK PURCHASE PLAN 734,284 36,183
NET INCOME 536,077
DIVIDENDS DECLARED ($1.20 PER SHARE) (292,105)
BALANCE, DECEMBER 31, 1994 307,401,452 695,946 65,169,490 2,406,321 (57,104) 6,350,433
TRANSLATION ADJUSTMENT 44,298
SALES TO OPTIONEES LESS SHARES EXCHANGED 5,223 (871,330) (32,296)
PURCHASES FOR TREASURY 690,000 40,552
EMPLOYEE STOCK PURCHASE PLAN 724,794 36,159
NET INCOME 649,157
DIVIDENDS DECLARED ($1.425 PER SHARE) (345,518)
BALANCE, DECEMBER 31, 1995 308,126,246 $737,328 64,988,160 $2,414,577 $ (12,806) $ 6,654,072
See Notes to Consolidated Financial Statements Schlumberger Limited (Schlumberger N. V. , Incorporated in the Netherlands Antilles) and Subsidiary Companies
25
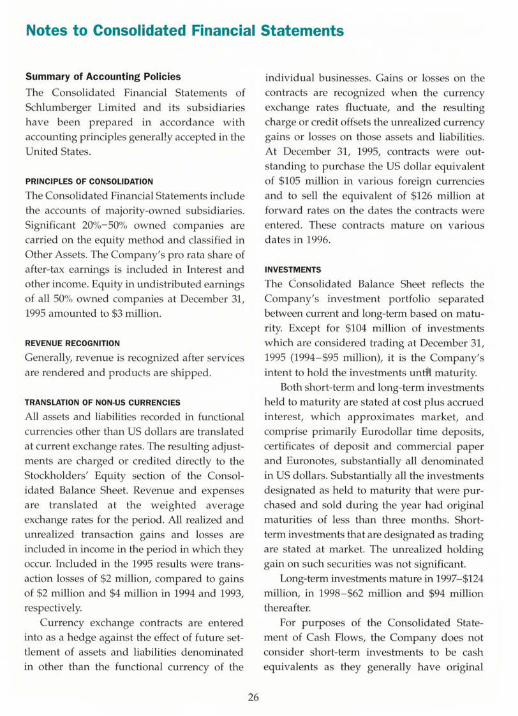
Notes to Consolidated Financial Statements
Summary of Accounting Policies
The Consolidated Financial Statements of SchJumberger Limited and its subsid iaries have been prepared in accordance with accow1ting principles generally accepted in the United States.
PRINCIPLES OF CONSOLIDATION
The Consolidated Financial Statements incl ude the accounts of majority-owned subsidiaries. Significant 20%-50% owned companies are carried on the equity method and classified in Other Assets. The Company's pro rata share of after-tax earnings is included in Interest and other income. Equity in w1distributed earnings of all 50% owned companies at December 31, 1995 amounted to $3 million.
REVENUE RECOGNITION
Genera lly, revenue is recognized after services are rendered and products are shipped.
TRANSLATION OF NON-US CURRENCIES
All assets and liab ilities recorded in functional currencies other than US dollars are translated at current exchan ge rates. The resulting adjustments are charged or credited directly to the Stockholders' Equity section of the Consolidated Balance Sheet. Revenue and expenses are transla ted a t the weighted average exchange ra tes for the period. All realized and unrealized transaction gains and losses are included in income in the period in which they occur. Included in the 1995 results were transac tion losses of $2 million, compared to gains of $2 million and $4 million in 1994 and 1993, respectively.
Currency exchange contrac ts are entered into as a hedge against the effect of future se ttlement of asse ts and liabilities denominated in other than the functional currency of the
26
individual businesses. Gains or losses on the contracts are recognized when the currency exchange rates fluctuate, and the resulting charge or credit offsets the Wliealized currency gains or losses on those assets and liab ilities. At December 31, 1995, contracts were outstanding to purchase the US dollar equivalent of $105 million in various foreign currencies and to sell the equi va lent of $126 million at forward rates on the dates the contracts were entered. These contracts mature on va ri ous dates in 1996.
INVESTMENTS
The Consolidated Ba lance Sheet reflects the Company's investment portfolio separated between current and long-term based on maturity. Except for $104 million of inves tments which are considered trading at December 31, 1995 (1994-$95 million), it is the Company's intent to hold the investments unt" maturity.
Both short-term and long- term investments held to maturity are stated at cost p lus accrued interest, which approximates m arke t, and comprise primarily Eurodollar time deposits, certifica tes of deposit and commercial paper and Euronotes, substantially all denomina ted in US dollars . Substantially all the inves tments designated as held to maturity that were purchased and sold during the year had original maturities of less than three months. Shortterm investments that are designated as trading are s tated at market. The Wliealized holding gain on such securities was not significant.
Long-term investments mature in 1997-$124 million, in 1998-$62 million and $94 million thereafter.
For purposes of the Consolidated Statement of Cash Flows, tl1e Company does not consider short-term investments to be cash equivalents as they generally have original
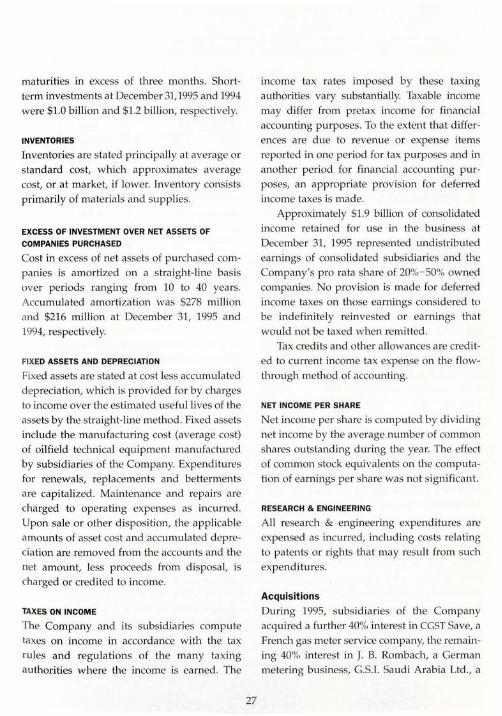
maturities in excess of three months. Shortterm investments at December 31,1995 and 1994
were $1.0 billion and $1.2 billion, respectively.
INVENTORIES
Inventories are stated principally at average or standard cost, which approximates average cost, or at market, if lower. Inventory consists primarily of materials and supplies.
EXCESS OF INVESTMENT OVER NET ASSETS OF
COMPANIES PURCHASED
Cost in excess of net assets of purchased companies is amortized on a straight-line basis over periods ranging from 10 to 40 years. Accumulated amor tiza tion was $278 million and $216 rrlillion at December 31, 1995 and 1994, respectively.
FIXED ASSETS AND DEPRECIATION
Fixed assets are stated at cos t less accumulated depreciation, which is provided for by charges to income over the es timated useful lives of the asse ts by the straight-line method . Fixed asse ts include the manufacturing cost (average cost) of oilfield technical equipment manufac tured by subsidiaries of the Company. Expenditures for renewals, replacements and betterments are capitalized. Maintenance and repairs are charged to operating expenses as incurred. Upon sale or other disposition, the applicable amounts of asset cost and accumulated depreciation are removed from the accounts and the net amount, less proceeds from disposal, is charged or credited to income.
TAXES ON INCOME
The Company and its subsidiaries compute taxes on income in accordance with the tax rules and regulations of the many taxing authorities where the income is earned . The
27
income tax rates imposed by these taxing authorities vary substantially. Taxable income may differ from pretax income for financial accounting purposes. To the extent that differences are due to revenue or expense items reported in one period for tax purposes and in another period for financial accounting purposes, an appropriate provision for deferred income taxes is made.
Approximately $1.9 billion of consolidated income retained for use in the business at December 31, 1995 represented undistributed earnings of consolidated subsidiaries and the Company's pro rata share of 20%-50% owned companies. No provision is made for deferred income taxes on those earnings considered to be indefinitely reinvested or earnings that would not be taxed when rerrlitted.
Tax credits and other allowances are credited to current income tax expense on the flowthrough method of accounting.
NET INCOME PER SHARE
Net income per share is computed by dividing net income by the average number of common shares outstanding during the year. The effect of common stock equivalents on the computation of earnings per share was not significan t.
RESEARCH & ENGINEERING
All research & engineering expenditures are expensed as incurred, including costs relating to patents or rights that may result from such expenditures.
Acquisitions
During 1995, subsidiaries of the Company acquired a further 40% interes t in CGST Save, a French gas meter service company, the remaining 40% interest in J. B. Rombach, a German metering business, G.S.I. Saudi Arabia Ltd., a
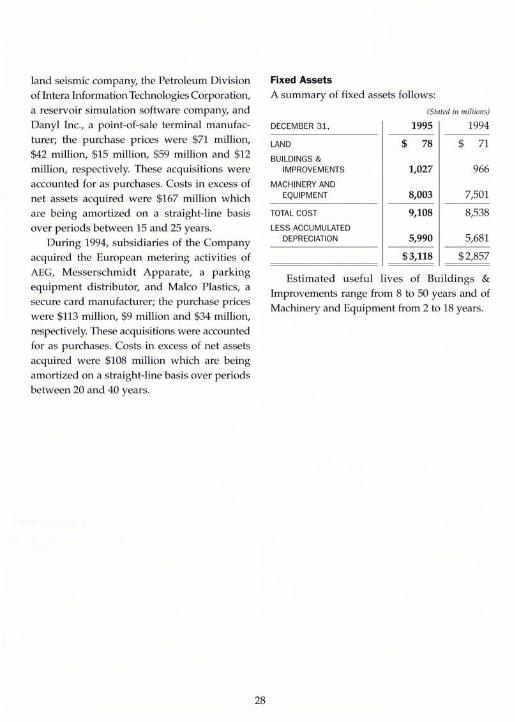
land seismic company, the Petroleum Division of Intera Information Technologies Corporation, a reservoir simulation software company, and Danyl Inc., a point-of-sale terminal manufacturer; the purchase prices were $71 million, $42 million, $15 million, $59 million and $12 million, respectively. These acquisitions were accounted for as purchases. Costs in excess of net assets acquired were $167 million which are being amortized on a straight-line basis over periods between 15 and 25 years.
During 1994, subsidiaries of the Company acquired the European metering activities of AEG, Messerschmidt Apparate, a parking equipment distributor, and Malco Plastics, a secure card manufacturer; the purchase prices were $113 million, $9 million and $34 million, respectively. These acquisitions were accounted for as purchases. Costs in excess of net assets acquired were $108 million which are being amortized on a straight-line basis over periods between 20 and 40 years.
28
Fixed Assets
A summary of fixed assets follows:
(Stated in millions)
DECEMBER 31, 1995 1994
LAND $ 78 $ 71 BU ILDINGS &
IMPROVEMENTS 1,027 966 MACHINERY AND
EQUIPMENT 8,003 7,501
TOTAL COST 9,108 8,538 LESS ACCUMULATED
DEPRECIATION 5,990 5,681
$3,118 $2,857
Estimated useful lives of Buildings &
Improvements range from 8 to 50 years and of Machinery and Equipment from 2 to 18 years.
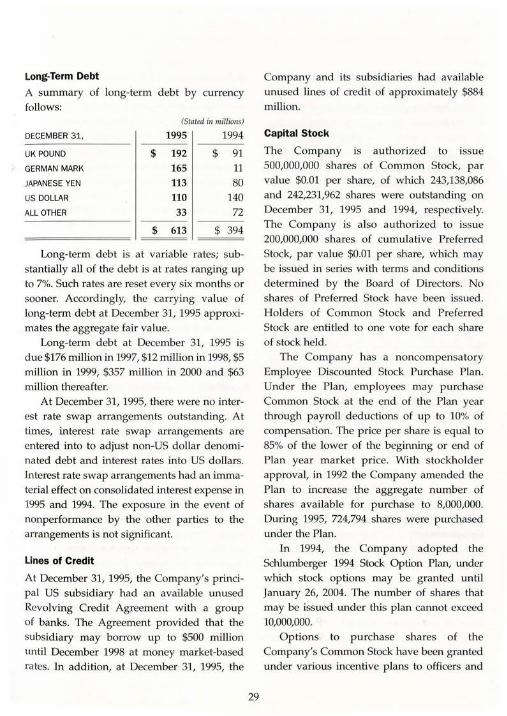
Long-Term Debt
A summary of long-term debt by currency
follows:
DECEMBER 31,
UK POUND
GERMAN MARK
JAPANESE YEN
US DOLLAR
ALL OTHER
(Stated in millions)
1995
$ 192 165 113
110
33
$ 613
1994
$ 91 11
80
140 72
$ 394
Long-term debt is a t variable ra tes; sub
stantially all of the debt is a t rates ranging up
to 7%. Such rates are reset every six months or
sooner. Accordingly, the carrying value of
long-term debt at December 31, 1995 approxi
mates the aggregate fair value.
Long-term debt at December 31, 1995 is
due $176 million in 1997, $12 million in 1998, $5
million in 1999, $357 million in 2000 and $63
million thereafter.
At December 31, 1995, there were no inter
est rate swap arrangements outs tanding. At
times, interest rate swap arrangements are
entered into to adjust non-US dollar denomi
nated debt and interest rates into US dollars.
Interest rate swap arrangements had an imma
terial effect on consolidated interest expense in
1995 and 1994. The exposure in the event of
nonperformance by the other parties to the
arrangements is not significant.
Lines of Credit
At December 31, 1995, the Company's princi
pal US subsidiary had an available unused
Revolving Credit Agreement with a group
of banks. The Agreement provided that the
subsidiary may borrow up to $500 million
until December 1998 at money market-based
rates. In addition, at December 31, 1995, the
29
Company and its subsidiaries had available
unused lines of credit of approximately $884
million.
Capital Stock
The Company is authorized to issue
500,000,000 shares of Common Stock, par
value $0.01 per share, of which 243,138,086
and 242,231,962 shares were outstanding on
December 31, 1995 and 1994, respectively.
The Company is also authorized to issu e
200,000,000 sh ares of cumulative Preferred
Stock, par value $0.01 per sh are, which may
be issued in series with terms and conditions
determined by the Board of Directors. No
shares of Preferred Stock have been issued .
Holders of Common Stock and Preferred
Stock are entitled to one vote for each share
of stock held.
The Company h as a noncompensa tory
Employee Discounted Stock Purchase Plan.
Under the Plan, employees may purchase
Common Stock at the end of the Plan year
through payroll deductions of up to 10% of
compensation. The price per share is equ al to
85% of the lower of the beginning or end of
Plan year market price. With s tockholder
approval, in 1992 the Company amended the
Plan to increase the aggregate number of
shares available for purchase to 8,000,000.
During 1995, 724,794 shares were purchased
under the Plan.
In 1994, the Company adopted the
Schlumberger 1994 Stock Option Plan, under
which stock options may be granted until
January 26, 2004. The number of shares that
may be issued under this p lan cannot exceed
10,000,000.
Options to purch ase shares of the
Company's Common Stock have been granted
under various incentive plans to officers and
key employees at prices equal to 100% of the fair market va lue at the date of grant.
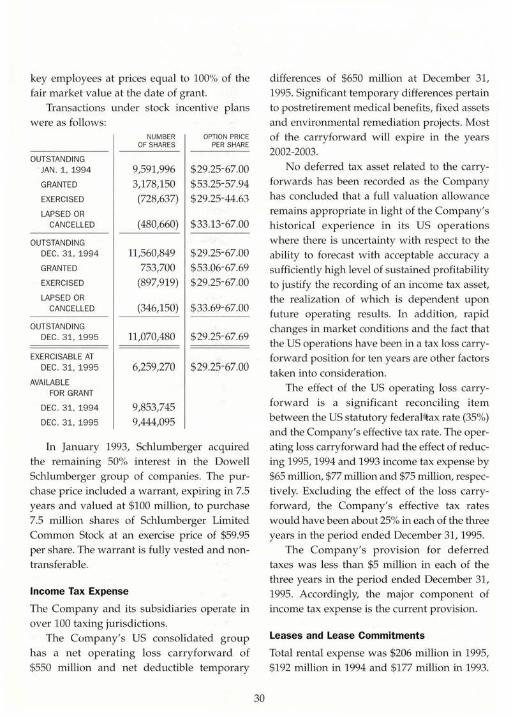
Transactions under stock incentive p lans were as follows:
NUMBER OPTION PRICE OF SHARES PER SHARE
OUTSTANDING JAN . 1, 1994 9,591,996 $29.25-67.00 GRANTED 3,178,150 $53.25-57.94 EXERCISED (728,637) $29.25-44.63 LAPSED OR
CANCELLED (480,660) $33.13-67.00
OUTSTANDING DEC.31, 1994 11,560,849 $29.25-67.00 GRANTED 753,700 $53.06-67.69 EXERCISED (897,919) $29.25-67.00 LAPSED OR
CANCELLED (346,150) $33.69-67.00
OUTSTAN DING DEC. 31, 1995 11,070,480 $29.25-67.69
EXERCISABLE AT DEC. 31, 1995 6,259,270 $29.25-67.00
AVAILABLE FOR GRANT
DEC. 31, 1994 9,853,745 DEC. 31, 1995 9,444,095
In January 1993, Schlumberger acquired the remaining 50% interes t in the Dowell Schlumberger group of companies. The purchase price included a warrant, expiring in 7.5 years and valued at $100 million, to purchase 7.5 million shares of Schlumberger Limited Common Stock at an exercise price of $59.95 per share. The warrant is fully ves ted and nontransferable.
Income Tax Expense
The Company and its subsidiaries operate in over 100 taxing jurisdictions.
The Company's US consolidated group has a net opera ting loss carryforward of $550 million and net deductible temporary
30
differences of $650 million at December 31, 1995. Significant temporary differences pertain to postretirement medical benefits, fixed assets and environmental remediation projects. Most of the carryforward will expire in the years 2002-2003.
No deferred tax asse t related to the carryforwards has been recorded as the Company has concluded that a full valuation allowance remains appropriate in light of the Compan y's h istorical experience in its US op erati ons where there is uncertainty with respect to the ability to forecast with acceptable accuracy a sufficiently high level of sustained profitability to justify the recording of an income tax asse t, the realization of which is dependent upon future operating results. In addition, rapid changes in market conditions and the fact that the US operations have been in a tax loss carryforward position for ten years are other fac tors taken into considera tion.
The effect of the US operating loss carryforward is a significant reconciling item between the US statu tory federal tax ra te (35%) and the Company's effective tax rate. The operating loss carryforward had the effect of reducing 1995, 1994 and 1993 income tax expense by $65 million, $77 million and $75 million, respectively. Excluding the effect of the loss carryforward, the Company's effective tax rates would have been about 25% in each of the three years in the period ended December 31, 1995.
The Company's provision for deferred taxes was less than $5 million in each of the three years in the period ended December 31, 1995. Accordingly, the major component of income tax expense is the current provision.
Leases and Lease Commitments
Total rental expense was $206 million in 1995, $192 million in 1994 and $177 million in 1993.
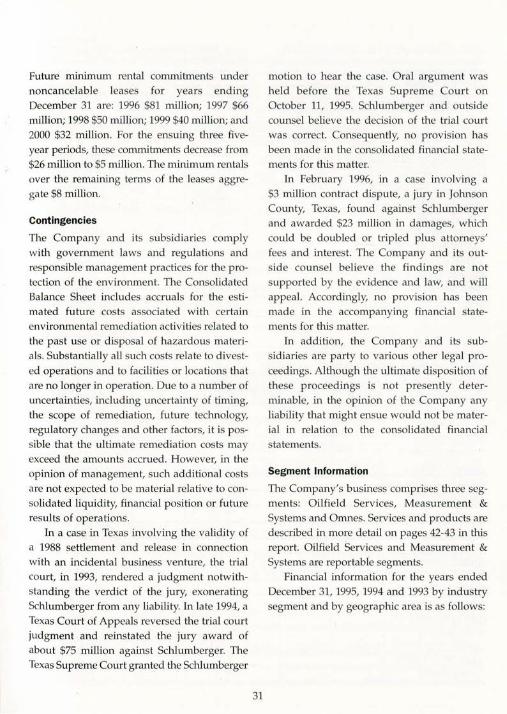
Future minimum rental commitments w1der noncancelable leases for years ending December 31 are: 1996 $81 million; 1997 $66 million; 1998 $50 million; 1999 $40 million; and 2000 $32 million. For the ensuing three fiveyear periods, these commitments decrease from $26 million to $5 million. The minimum rentals over the remaining terms of the leases aggrega te $8 million.
Contingencies
The Company and its subsidiaries comply with government laws and regulations and responsible management practices for the protection of the environment. The Consolidated Balance Sheet includes accruals for the es ti mated future costs associated with certain environmental remediation activities related to the past use or disposal of hazardous materials. Substantially all such costs relate to divested operations and to facilities or loca tions that are no longer in operation. Due to a number of uncertainties, including uncertainty of timing, the scope of remediation, future teclmology, regu latory changes and other factors, it is possible that the ultimate remediation costs may exceed the amounts accrued. However, in the opinion of management, such additional cos ts are not expected to be material relative to consolidated liquidity, financial position or future results of operations.
In a case in Texas involving the validity of a 1988 settlement and release in connection with an incidental business venture, the trial court, in 1993, rendered a judgment notwithstanding the verdict of the jury, exonerating Schlumberger from any liability. In late 1994, a Texas Court of Appeals reversed the trial court judgment and reinstated the jury award of about $75 million against Schlumberger. The Texas Supreme Court granted the Schlumberger
31
motion to hear the case. Oral argument was held before the Texas Supreme Court on October 11, 1995. Schlumberger and outside counsel believe the decision of the trial court was correct. Consequently, no p rovision has been made in the consolidated financial statements for this matter.
In February 1996, in a case involving a $3 million contrac t dispute, a ju ry in Johnson County, Texas, found against Schlumberger and awarded $23 million in dam ages, which could be doubled or tripled plus attorneys' fees and interest. The Company and its outside counsel believe the findin gs are not supported by the evidence and law, and will appeal. Accordingly, no p rov ision has been made in the accompanying financial s tatements for this rna tter.
In addition, the Company and its subsidiaries are party to various other legal proceedings. Although the ultimate disposition of these proceedings is not p resently determinable, in the opinion of the Company any liability that might ensue would not be material in relation to the consolidated financial statements.
Segment Information
The Company's business comprises three segments: Oilfield Services, Measurement &
Systems and Omnes. Services and products are described in more detail on pages 42-43 in this report. Oilfield Services and Measurement &
Systems are reportable segments. Financial information for the years ended
December 31, 1995, 1994 and 1993 by industry segment and by geographic area is as follows:
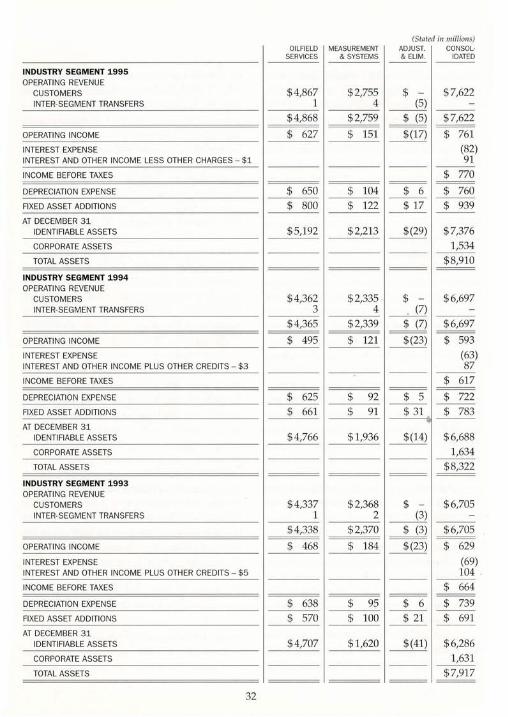
INDUSTRY SEGMENT 1995 OPERATING REVENUE
CUSTOMERS INTER-SEGMENT TRANSFERS
OPERATING INCOME
INTEREST EXPENSE INTEREST AND OTHER INCOME LESS OTHER CHARGES- $1
INCOME BEFORE TAXES
DEPRECIATION EXPENSE
FIXED ASSET ADDITIONS
AT DECEMBER 31 IDENTIFIABLE ASSETS
CORPORATE ASSETS
TOTAL ASSETS
INDUSTRY SEGMENT 1994 OPERATING REVENUE
CUSTOMERS INTER-SEGMENT TRANSFERS
OPERATING INCOME
INTEREST EXPENSE INTEREST AND OTH ER INCOME PLUS OTHER CREDITS - $3
INCOME BEFORE TAXES
DEPRECIATION EXPENSE
FIXED ASSET ADDITIONS
AT DECEMBER 31 IDENTIFIABLE ASSETS
CORPORATE ASSETS
TOTAL ASSETS
INDUSTRY SEGMENT 1 993 OPERATING REVENUE
CUSTOMERS INTER-SEGMENT TRANSFERS
OPERATING INCOME
INTEREST EXPENSE INTEREST AND OTHER INCOME PLUS OTHER CREDITS - $5
INCOME BEFORE TAXES
DEPRECIATION EXPENSE
FIXED ASSET ADDITIONS
AT DECEMBER 31 IDENTIFIABLE ASSETS
CORPORATE ASSETS
TOTAL ASSETS
32
OILFIELD SERVICES
$4,867 1
$4,868
$ 627
$ 650 $ 800
$5,192
$4,362 3
$4,365
$ 495
$ 625
$ 661
$4,766
$4,337 1
$4,338
$ 468
$ 638 $ 570
$4,707
(Stated in millions) MEASUREMENT
& SYSTEMS ADJUST. CONSOL-& ELIM. I DATED
$2,755 $ --------'--4 _____Q)
$2,759 ~
------
$7,622
$7,622
$ 761 (82) 91
$ 770
$ 104 $ 122
$ 6 $ 760 $ 17 $ 939
$2,213 $(29) $7,376
---
$2,335 $ -__ ___::_4 ~
$ 2,339 _____!___0 $ 121 $(23)
$ 92 $ 5 $ 91 $ 31
1,534 $8,910
$6,697
$6,697
$ 593 (63) 87
$ 617
$ 722
$ 783
$1,936 _____!_Q±) $6,688
---
$2,368 $ -__ --=.2 ____Q)
$ 2,3 70 _____!___@.) $ 184 $(23)
$ 95 $ 100
$ 6 $ 21
1,634 $8,322
$6,705
$6,705
$ 629
(69) 104
$ 664
$ 739 $ 691
$1,620 ~ $6,286 1,631
---$7,917
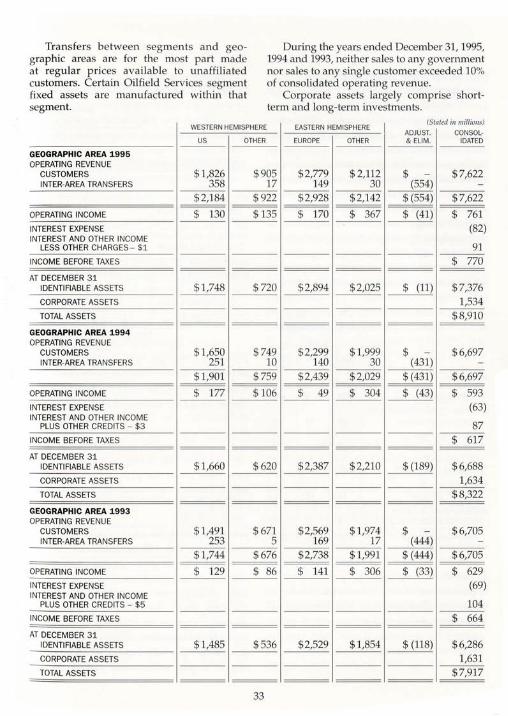
Tra nsfe rs be tween segments and geographic areas are for the most part made at regular prices ava ilable to unaffiliated customers. Certain Oilfield Services segment fixed assets are manufac tured within that segment.
During the years ended December 31, 1995, 1994 and 1993, neither sales to any government nor sales to an y single customer exceeded 10% of consolidated opera ting revenue.
Corporate assets largely comprise shortterm and long-term investments.
n e 111111 1 /0 115 WESTERN HEMISPHERE EASTERN HEMISPHERE I
(51 I d . "// " )
ADJUST. CONSOL-us OTH ER EUROPE OTHER & ELIM. I DATED
GEOGRAPHIC AREA 1 995 OPERATI NG REVENU E
CUSTOMERS $ 1,826 $905 $2,779 $ 2,112 $ - $ 7,622 INTER-AREA TRANSFERS 358 17 149 30 (554) -
$ 2,184 $922 $2,928 $2,142 $ (554) $7,622
OPERATING INCOME $ 130 $ 135 $ 170 $ 367 $ (41) $ 761 INTEREST EXPENSE (82) INTEREST AND OTHER INCOME
LESS OTHER CHARGES- $1 91 INCOME BEFORE TAXES $ 770
AT DECEMBER 31 IDENTIFIABLE ASSETS $ 1,748 $ 720 $2,894 $ 2,025 $ (11) $7,376 CORPORATE ASSETS 1,534 TOTAL ASSETS $8,910
GEOGRAPHIC AREA 1994 OPERATI NG REVENUE
CUSTOMERS $ 1,650 $ 749 $2,299 $ 1,999 $ - $6,697 INTER-AREA TRANSFERS 251 10 140 30 (431) -
$ 1,901 $ 759 $2,439 $2,029 $ (431) $ 6,697
OPERATING INCOME $ 177 $ 106 $ 49 $ 304 $ (43) $ 593 INTEREST EXPENSE (63) INTEREST AND OTH ER INCOME
PLUS OTHER CREDITS - $3 87 INCOME BEFORE TAXES $ 617
AT DECEMBER 31 IDENTIFIABLE ASSETS $ 1,660 $620 $2,387 $2,210 $ (189) $6,688 CORPORATE ASSETS 1,634 TOTAL ASSETS $ 8,322
GEOGRAPHIC AREA 1993 OPERATING REVENUE
CUSTOMERS $ 1,491 $671 $2,569 $1,974 $ - $6,705 INTER-AREA TRANSFERS 253 5 169 17 (444) -
$ 1,744 $676 $2,738 $ 1,991 $(444) $6,705
OPERATING INCOME $ 129 $ 86 $ 141 $ 306 $ (33) $ 629 INTEREST EXPENSE (69) INTEREST AND OTHER INCOME
PLUS OTHER CREDITS - $5 104 INCOME BEFORE TAXES $ 664
AT DECEMBER 31 IDENTI FIABLE ASSETS $ 1,485 $536 $2,529 $1,854 $ (118) $6,286 CO RPORATE ASSETS 1,631 TOTAL ASSETS $ 7,917
33

Pension and Other Benefit Plans
US PENSION PLANS
The Company and its US subsidiary sponsor several defined benefit pension plans that cover substantially all employees. The benefits are based on years of service and compensation on a career-average pay basis. These plans are substantially fully funded with a trustee in respect to past and current service. Charges to expense are based upon costs computed by independent actuaries. The funding policy is to contribute annually amounts that can be deducted for federal income tax purposes. These contributions are intended to provide for benefits earned to date and those expected to be earned in the future.
Net pension cost in the US for 1995, 1994
and 1993 included the following components:
(S tated in millions)
1995 1994 1993
SERVICE COST -BENEFITS EARNED DURING THE PERIOD $26 $25 $ 20
INTEREST COST ON PROJECTED BENEFIT OBLIGATION 46 44 42
EXPECTED RETURN ON PLAN ASSETS (ACTUAL RETURN: 1995 $137; 1994 $3; 1993 $87) (47) (46) (42)
AMORTIZATION OF TRANSITION ASSET (2) (2) (2)
AMORTIZATION OF PRIOR SERVICE COST/ OTHER 4 6 3
-- --NET PENSION COST $27 $27 $21
Effective January 1, 1996, the Company and its subsidiaries amended their pension plans to improve retirement benefits for current employees. The funded status at December 31, 1995 reflects the amendment.
34
The funded status of the plans at December 31, 1995 and 1994 was as follows:
(Stated in millions)
1995 1994 -------------- ---- ----ACTUARIAL PRESENT VALUE
OF OBLI GATIONS:
VESTED BENEFIT OBLIGATION $ 615 $577 ========= ----- -----
ACCUMULATED BENEFIT OBLIGATION $ 617 $579
========= = = PROJECTED BENEFIT OBLI GATION $ 675 $645
PLAN ASSETS AT MARKET VALUE 698 584 ------------ ---- ----EXC ESS OF ASSETS OVER PROJECTED
BENEFIT OBLIGATION
UNRECOGNIZED NET LOSS (GAIN)
UNRECOGNIZED PRIOR SERVICE COST
UNRECOGNIZED NET ASSET
23 (61) (96) 9
39 28
AT TRANSITION DATE (9) (10) ------------ ---- ----PENSION LIABILITY $ (43) $ (34) ========= ----- -----
Assumed discount rate and rate of compensa tion increases used to determine the projected benefit obliga tions were 7.5% and 4.5%, respectively; the expected long-term rate of return on plan assets was 8.5%. Plan assets at December 31, 1995 consist of common stocks ($432 million), cash or cas~equivalents
($46 million), fixed income investments ($134
million) and other investments ($86 million). Less th an 1% of the plan assets a t December 31, 1995 represented Schlumberger Limited Common Stock.
NON-US PENSION PLANS
Outside of the US, subsidiaries of the Company sponsor several defined benefit and defined contribution plans that cover substantially all employees who are not covered by statutory plans. For defined benefit plans, charges to expense are based upon costs computed by independent actuaries. These plans are substantially fully funded with trustees in respect to past and current service. For all
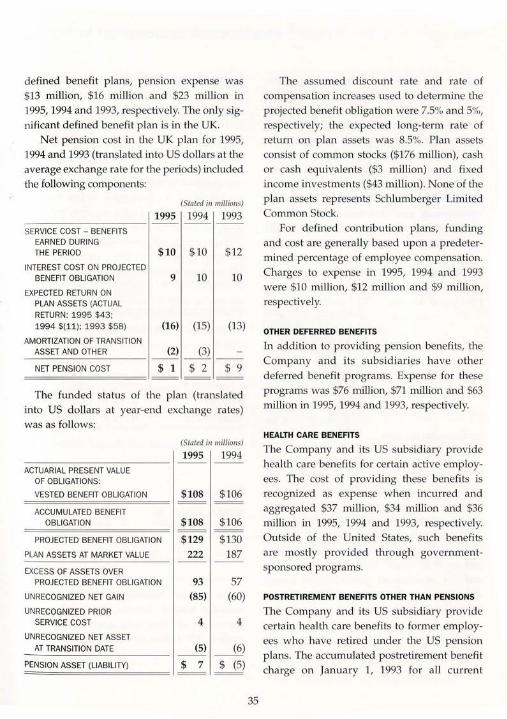
defined benefit plans, pension expense was $13 million, $16 million and $23 million in 1995, 1994 and 1993, respectively. The only significant defined benefit plan is in the UK.
Net pension cost in the UK plan for 1995, 1994 and 1993 (translated into US dollars at the average exchange ra te for the periods) included the following components:
(Stated in millions)
1995 1994 1993 - - -------- -- --SERVICE COST - BENEFITS
EARNED DURING THE PERIOD
INTEREST COST ON PROJECTED BENEFIT OBLIGATION
EXPECTED RETURN ON PLAN ASSETS (ACTUAL RETURN: 1995 $43; 1994 $(11); 1993 $58)
AMORTIZATION OF TRANSITION
$10 $ 10 $ 12
9 10 10
(16) (15) (13)
_ A_S_SE_T_A_N_D_O_T_HE_R _____ (2_) (3) __
NET PENSION COST $ 1 $ 2 $ 9 = = ===== -- - -- ---- -- -- - --
The funded status of the plan (translated into US dollars at year-end exchange rates) was as follows:
(Stated in millions)
1995 1994 -- --
ACTUARIAL PRESENT VALUE OF OBLIGATIONS:
VESTED BENEFIT OBLI GATION $108 $ 106
ACCUMULATED BENEFIT OBLIGATION $108 $106
PROJECTED BENEFIT OBLIGATION $129 $130 PLAN ASSETS AT MARKET VALUE 222 187
EXCESS OF ASSETS OVER PROJECTED BENEFIT OBLIGATION 93 57
UNRECOGNIZED NET GAIN (85) (60) UNRECOGNIZED PRIOR
SERVICE COST 4 4 UNRECOGNIZED NET ASSET
AT TRANSITION DATE (5) (6)
PENSION ASSET (LIABILITY) $ 7 $ (5)
35
The assumed discount rate and rate of compensation increases used to determine the projected benefit obliga tion were 7.5% and 5%, respectively; the expected long-term rate of return on plan asse ts was 8.5%. Plan assets consist of common stocks ($176 million), cash or cash equivalents ($3 million) and fixed incom e investments ($43 million). None of the plan assets represents Schlumberger Limited Common Stock.
For defined contribution plans, funding and cost are generally based upon a predetermined percentage of employee compensa tion. Charges to expense in 1995, 1994 and 1993 were $10 million, $12 million and $9 million, respectively.
OTHER DEFERRED BENEFITS
In addition to providing pension benefits, the Company and its subsidiaries have other deferred benefit programs. Expense for these programs was $76 million, $71 million and $63 million in 1995, 1994 and 1993, respectively.
HEALTH CARE BENEFITS
The Company and its US subsidiary provide health care benefits for certain active employees. The cost of providing these benefits is recognized as expense when incurred and aggregated $37 million, $34 million and $36 million in 1995, 1994 and 1993, respectively. Outside of the United States, such benefits are mostly provided through governmentsponsored programs.
POSTRETIREMENT BENEFITS OTHER THAN PENSIONS
The Company and its US subsidiary provide certain health care benefits to former employees who have retired under the US pension plans. The accumulated postretirement benefit charge on January 1, 1993 for all current
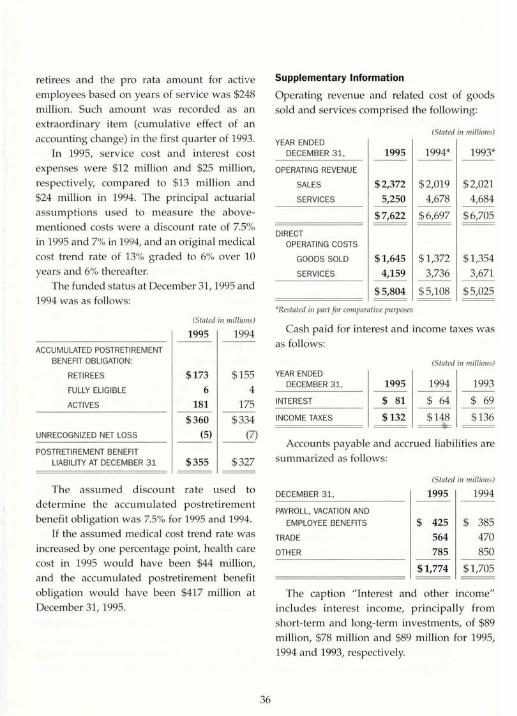
retirees and the pro rata amount for acti·.re employees based on years of service was $248 million. Such amount was recorded as an extraordinary item (cumulative effect of an accow1ting change) in the first quarter of 1993.
In 1995, service cos t and interest cos t expenses were $12 million and $25 million, respectively, compared to $13 million and $24 million in 1994. The principal actuarial assumptions used to measure the abovementioned costs were a discount rate of 7.5% in 1995 and 7% in 1994, and an original medical cost trend rate of 13% graded to 6% over 10 years and 6% thereafter.
The funded status at December 31, 1995 and 1994 was as follows:
(Stated i11 111illions)
1995 1994 --- ---
ACCUMULATED POSTRETIREMENT BENEFIT OBLIGATION:
RETIREES $173 $ 155 FULLY ELIGIBLE 6 4 ACTIVES 181 175
--- ---$360 $334
UNRECOGNIZED NET LOSS (5) (7)
POSTRETIREMENT BENEFIT LIABILITY AT DECEMBER 31 $355 $327
The assumed discount rate used to determine the accumulated postre tirement beneiit obligation was 7.5% for 1995 and 1994.
If the assumed medical cost trend rate was increased by one percentage point, health care cost in 1995 would have been $44 million, and the accumulated postretirement benefit obliga tion would have been $417 million at December 31, 1995.
36
Supplementary Information
Operating revenue and related cost of goods sold and services comprised the following:
(Stated in millions) YEAR ENDED
DECEMBER 31, 1995 1994* 1993*
OPERATING REVENUE
SALES $2,372 $2,019 $2,021 SERVICES 5,250 4,678 4,684
$7,622 $6,697 $ 6,705
DIRECT OPERATING COSTS
GOODS SOLD $1,645 $ 1,372 $ 1,354 SERVICES 4,159 3,736 3,671
$5,804 $5,108 $5,025
>~-Restated in part for comparative purposes
Cash paid for interest and income taxes was as follows:
YEAR ENDED DECEMBER 31,
INTEREST
INCOME TAXES
1995
$ 81
$132
(S tated in millions)
1994
$ 64
$148 ~
1993
$ 69
$ 136
Accounts payable and accrued liabilities are summarized as follows:
(Stated il1 millions)
DECEMBER 31, 1995 1994
PAYROLL, VACATION AND
EMPLOYEE BENEFITS $ 425 $ 385 TRADE 564 470 OTHER 785 850
---$1,774 $ 1,705
The caption "Interes t and other income" includes interest income, principally from short-term and long- term investments, of $89
million, $78 million and $89 million for 1995, 1994 and 1993, respectively.
Report of Independent Accountants
To the Board of Directors and Stockholders of Schlumberger Limited
In our opinion, the accompanying consolidated balance sheet and the related consolidated statements of income, of stockholders ' equity and of cash flows present fairly, in all material respects, the financial position of Schlumberger Limited and its subsidiaries at December 31, 1995 and 1994, and the results of their operations and their cash fl ows for each of the three years in the period ended December 31, 1995, in conformity with generally accepted accounting principles. These financial s tatements are the responsibility of the Company's management; our responsibility is to express an opinion on these financial statements based on our audits. We conducted our aud its of these statements in accordance with generally accepted auditing standards which require that we plan and perform the aud it to obtain reasonable assurance about w hether the financial
37
statements are free of material miss tatement. An audit includes examining, on a test basis, evidence suppor ting the amounts and disclosures in the financial statements, assessing the accounting principles used and significant esti mates made by management, and evaluating the overall financial s tatement presentation. We believe that our audits provide a reasonable basis for the opinion expressed above.
rr~ wf- J...J...r
Price Waterhouse LLP New York, New York January 23, 1996, except as to the petlUltimate paragraph of the Contingencies note on page 31, which is as of February 20, 1996
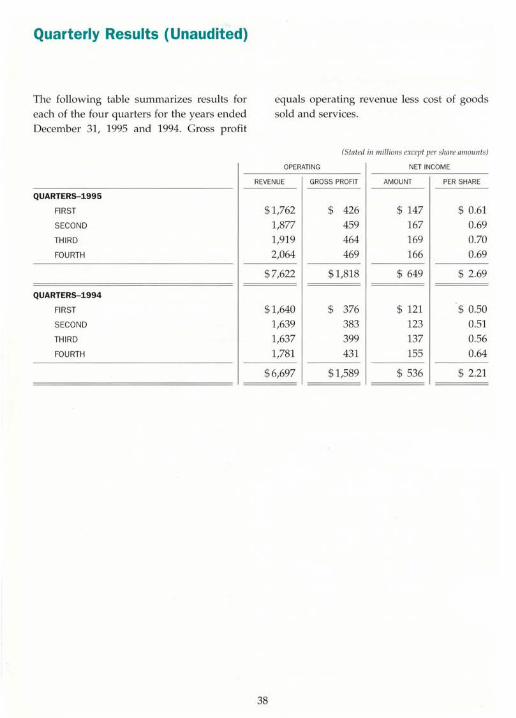
Quarterly Results (Unaudited)
The following table summarizes results for each of the four quarters for the years ended December 31, 1995 and 1994. Gross profit
QUARTERS- 1995
FIRST
SECOND
THIRD
FOURTH
QUARTERS-1994
FIRST
SECOND
THIRD
FOURTH
equals operating revenue less cost of goods sold and services.
(S lated in millio11s except per sllnre nmo11nt s)
OPERATING NET INCOME
REVENUE GROSS PROFIT AMOUNT PER SHARE
$1,762 $ 426 $ 147 $ 0.61 1,877 459 167 0.69 1,919 464 169 0.70 2,064 469 166 0.69
$7,622 $1,818 $ 649 $ 2.69
$ 1,640 $ 376 $ 121 $ 0.50 1,639 383 123 0.51 1,637 399 137 0.56 1,781 431 155 0.64
$6,697 $1,589 $ 536 $ 2.21
38
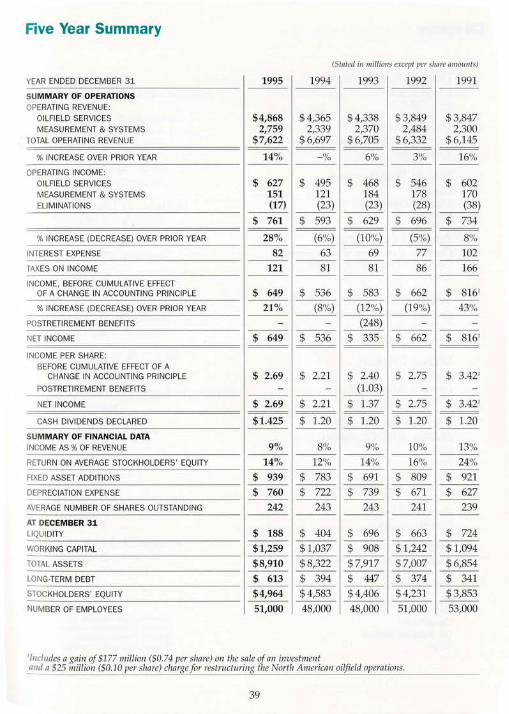
Five Year Summary
(Stated in millions except per share amounts)
YEAR ENDED DECEMBER 31 1995 1994 1993 1992 1991 SUM MARY OF OPERATIONS OPERATING REVENUE:
OILFIELD SERVICES $4,868 $4,365 $4,338 $3,849 $3,847 MEASUREMENT & SYSTEMS 2,759 2,339 2,370 2,484 2,300
TOTAL OPERATING REVENUE $7,622 $6,697 $6,705 $6,332 $6,145
% INCREASE OVER PRIOR YEAR 14% -% 6% 3% 16% OPERATING INCOME:
OI LFIELD SERVICES $ 627 $ 495 $ 468 $ 546 $ 602 MEASUREMENT & SYSTEMS 151 121 184 178 170 ELIMINATIONS (17) (23) (23) ~ (38)
$ 761 $ 593 $ 629 $ 696 $ 734
% INCREASE (DECREASE) OVER PRIOR YEAR 28% (6%) (10%) (5%) 8% INTEREST EXPEN SE 82 63 69 77 102 --- ---TAXES ON INCOME 121 81 81 86 166 INCOME, BEFORE CUMULATIVE EFFECT
OF A CHANGE IN ACCOUNTING PRINCIPLE $ 649 $ 536 $ 583 $ 662 $ 816' % INCREASE (DECREASE) OVER PRIOR YEAR 21% ~ (12%) (19%) 43%
POSTRETIREMENT BENEFITS (248)
NET INCOME $ 649 $ 536 $ 335 $ 662 $ 816'
INCO ME PER SHARE: BEFORE CUMULATIVE EFFECT OF A
CHANGE IN ACCOUNTING PRINCIPLE $ 2.69 $ 2_21 $ 2-40 $ 2_75 $ 3.42' POSTRETIREMENT BENEFITS (1.03)
NET INCOME $ 2.69 $ 2.21 $ 1.37 $ 2_75 $ 3-42'
CASH DIVIDENDS DECLARED $1.425 $ 1.20 $ 1.20 $ 1.20 $ 1.20 SUM M ARY OF FINANCIAL DATA INCOME AS % OF REVENUE 9% 8% 9% 10% 13%
--- ---RETURN ON AVERAGE STOCKHOLDERS' EQUITY 14% 12% 14% 16% 24% FIXED ASSET ADDITIONS $ 939 $ 783 $ 691 $ 809 $ 921 DEPR ECIATION EXPENSE $ 760 $ 722 $ 739 $ 671 $ 627 AVERAGE NUMBER OF SHARES OUTSTANDING 242 243 243 241 239 AT DECEMBER 31 LIQUIDITY $ 188 $ 404 $ 696 $ 663 $ 724 WORKI NG CAPITAL $1,259 $1,037 $ 908 $ 1,242 $ 1,094 TOTAL ASSETS $8,910 $8,322 $7,917 $7,007 $6,854 LONG-TERM DEBT $ 613 $ 394 $ 447 $ 374 $ 341 STOCKHOLDERS' EQUITY $4,964 $4,583 $4,406 $4,231 $3,853 NUMBER OF EMPLOYEES 51,000 48,000 48,000 51,000 53,000
'Includes a gain of $177 million ($0.74 per share) on the sale of an investment and a $25 million ($0.10 per share) charge f or restructuring the North American oilfield operations.
39
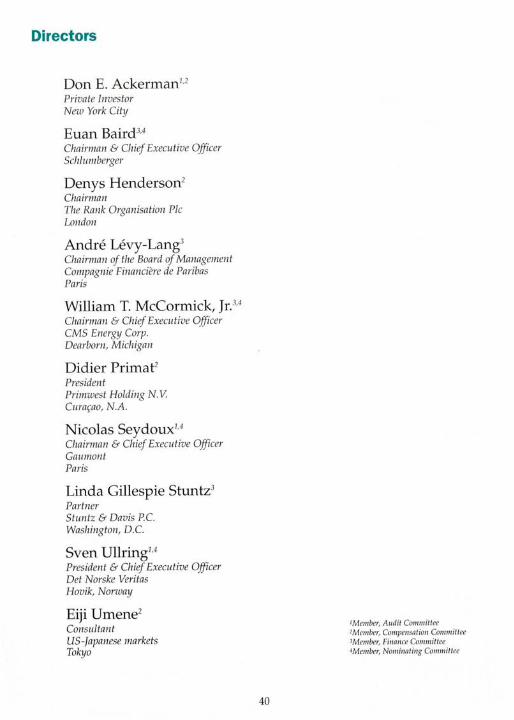
Directors
Don E. Ackerman1•2
Private Investor New York City
Euan Baird3•4
Chairman & Chief Executive Officer Schlumberger
Denys Henderson2
Chairman The Rank Organisation Pic London
Andre Levy-Lang3
Chairman of the Board of Management Compagnie Financiere de Paribas Paris
William T. McCormick, Jr.3·4
Chairman & Chief Executive Officer CMS Energy Corp. Dearborn, Michigan
Didier Primaf President Prinnvest Holding N. V. Cura~ao, N.A.
Nicolas Seydoux1•4
Chairman & Chief Executive Officer Gaumont Paris
Linda Gillespie Stuntz3
Partner Stuntz & Davis PC. Washington, D.C.
Sven UllringJ.4
President & Chief Executive Officer Det Norske Veritas Hovik, Norway
Eiji Umene2
Consultant US-Japanese markets Tokyo
40
I Member, Audit Committee 2Member, Compensation Committee JMember, Finance Committee 4Member, Nominati11g Committee
Officers
Euan Baird Chairnum & Chief Executive Officer
Arthur Lindenauer Executive Vice Pres ident- Finance Chief Firwncial Officer
Victor E. Grijalva Executive Vice President
Clermont A. Matton Executive Vice Pres ident
Ian Strecker Executive Vice President
David S. Browning Secretary & General Counsel
Pierre E. Bismuth Vice Pres ident- Personnel
Jean-Marc Perraud Vice Pres ident
Jean-Dominique Percevault Vice President
William J. Prins Vice Pres ident
Michel Soublin Vice President
Pierre-Jean Sivignon Treasurer
Carole H . Finamore Assista11t Secretary
41
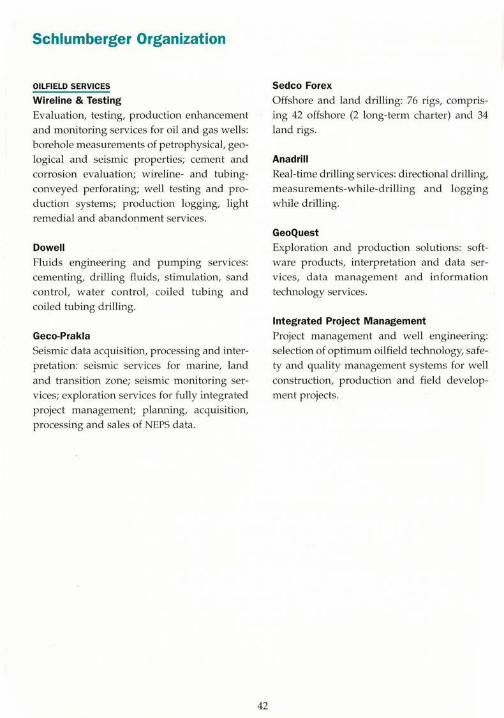
Schlumberger Organization
OILFIELD SERVICES
Wireline & Testing
Evaluation, testing, production enhancement and monitoring services for oil and gas wells: borehole measurements of petrophysical, geological and seismic properties; cement and corrosion evaluation; wireline- and tubingconveyed perforating; well testing and production sys tems; production logging, light remedial and abandonment services.
Dowell
Fluids engineering and pumping services: cementing, drilling fluids, stimula tion, sand control, wa ter control, coiled tubing and coiled tubing drilling.
Geco-Prakla
Seismic data acquisition, p rocessing and interpretation: seismic services for marine, land and transition zone; seismic monitoring services; explora tion services for fully integra ted project management; planning, acquisition, processing and sales of NEPS data .
42
Sedco Forex
Offshore and land drilling: 76 rigs, comprising 42 offshore (2 long-term charter) and 34 land rigs.
Anadrill
Real-time drilling services: directional drilling, m easurements-while-drilling and logging while drilling.
GeoQuest
Explora tion and production solutions: softw are products, interpretation and data services, da ta managemen t and informa tion technology services.
Integrated Project Management
Project management and well engineering: selec tion of optimum oilfield technology, safety and quality management systems for well construction, production and field development p rojects.

MEASUREMENT & SYSTEMS
Electricity Management
Systems for management of electricity d istribu tion and usage: residential metering and energy management sys tems; uti li ty revenue collection systems and serv ices; commercia I, industrial, transmission and distribution measurement and billing products and systems; local and remote automatic meter reading systems and services; load management systems.
Water Management
Systems for management of water usage: automatic meter reading and billing systems; water management and meter insta lla tion services; water submetering services for multi dwelling buildings; meters for measuring wa ter, therma l energy and industri al fluid s consumption.
Gas Management
Systems for management of gas usage: res idential, commercial and industria l gas meters; regulators, governors, sa fety va lves, s tations and systems; gas trea tment including filtration, odoriza tion and hea ting; network management systems including remote read ing and control, and prepayment sys tems.
43
Electronic Transactions
Electronic transactions sys tems: ca rd applications, including magnetic stripe cards, smart cards and terminals and management systems for transac tions in a wide range of sectors, including telecommun ications, reta il and banking; systems for retail petroleum, parking and mass transit, health ca re management and ca mpus communities.
Automatic Test Equipment
Measurement and hand ling equipment for semiconductor manufac ture: automated systems for semiconductor tes ting and assembly, board tes t sys tems and diagnostic systems.
OMNES
Com munications and information technology so luti ons: wid e- a nd loca l-area networks, security, Internet, messaging and business a ppli ca tion solutions for the energy exploration and producti on sector tha t a llow information technology sys tems to communi ca te anyw here in the world.