Annual Report 2008 - Clarion · Profile Jay Kay Vocalist for the world-famous jazz-funk band...
20
Clarion Co., Ltd. Annual Report 2008 For the fiscal year ended March 2008 Clarion Co., Ltd. 7-2 Shintoshin, Chuo-ku, Saitama-shi, Saitama 330-0081, Japan http://www.clarion.com/ This annual report is printed on recycled paper Printed in Japan
Transcript of Annual Report 2008 - Clarion · Profile Jay Kay Vocalist for the world-famous jazz-funk band...

Clarion Co., Ltd.
Annual Report 2008For the fiscal year ended March 2008
Clarion Co., Ltd.7-2 Shintoshin, Chuo-ku, Saitama-shi, Saitama 330-0081, Japan
http://www.clarion.com/ This annual report is printed on recycled paper Printed in Japan

Profile
Jay KayVocalist for the world-famous jazz-funk band Jamiroquai.
VAD.HOThe Clarion H.M.I. concept car created by Italdesign-Giugiaro, one of the world’s top automotive and industrial design firms.
Since its establishment in 1940, Clarion Co., Ltd. has created a number of advanced products as a pioneer connecting automobiles with music and information. In 1951, we introduced Japan’s first car radio dedicated to passenger cars; in 1963, Japan’s first car stereo; and in 1998, the world’s first PC for automobiles (AutoPC). Our product range has expanded beyond car audio products to include car navigation systems, rear-view monitor systems and networked auto-guidance systems for community buses. Under the corporate philosophy to strive “to improve society by seeking to develop the relationship between sound, information and human interaction, and by creating products to meet those needs,” Clarion will constantly pursue new fields of business for in-vehicle devices. Clarion became a member of the Hitachi Group in December 2006. Through this structural reorganization, we aim to maximize synergies as a means to strengthen our product planning and R&D competencies as well as sales network for car navigation systems and in-vehicle entertainment systems.
Selected world-famous musician Jay Kay of Jamiroquai, and Giugiaro Design’s concept car VAD.HO, as brand communicators to spread the Clarion brand worldwide.
Forward-Looking StatementsThe figures contained in this annual report with respect to Clarion’s plans and strategies and other statements that are not historical facts are forward-looking statements about the future performance of Clarion. Such statements are based on management’s assumptions and beliefs in light of the information currently available to it and involve risks and uncertainties. Actual results may differ from those in the forward-looking statements as a result of various factors. Potential risks and uncertainties include, without limitation, general economic conditions in Clarion’s market.
C O N T E N T S
Profile01 Financial Highlight02 Message from the President05 Special Feature08 Corporate Social Responsibility09 Corporate Governance
Millions of Yen Thousands of U.S. Dollars
2008 2007 2008
For the Year: Net sales ································································· ¥246,806 ¥181,041 $2,463,380 Operating income ···················································· 5,465 3,072 54,553 Net income (loss) ····················································· 1,378 (784) 13,754
At Year-end: Total assets ····························································· 150,841 149,490 1,505,554 Net assets ································································ 32,125 34,231 320,645 Interest-bearing borrowings ····································· 42,838 41,483 427,577
Yen U.S. Dollars
2008 2007 2008
Per Share:Net income (loss) ······················································· ¥4.88 ¥(2.78) $0.05Cash dividends ·························································· 2.00 2.00 0.02
Clarion Co., Ltd. and its Consolidated SubsidiariesYears ended March 31
Financial Highlight
Note: U.S. dollar amounts have been translated from yen, for convenience only, at the rate of US$1 = ¥100.19, the approximate exchange rate on March 31, 2008.
19 Notes to the Consolidated Financial Statements35 Report of Independent Auditors37 Corporate Data
10 Financial Review13 Six-Year Financial Summary14 Consolidated Balance Sheets16 Consolidated Statements of Operations17 Consolidated Statements of Net Assets18 Consolidated Statements of Cash Flows
01

Message from the President
Aiming for Further Growth through Forward-looking Business Strategies
Review of Operations for Fiscal 2007, Ended March 31, 2008Clarion is working toward becoming a “more valuable enterprise” based on our corporate vision, “Vision-70.” In 2006, Clarion became a consolidated subsidiary of Hitachi, Ltd. (Hitachi), in turn making Xanavi Informatics Corporation (Xanavi) a wholly owned subsidiary. We are currently pursuing synergies designed to encourage growth and greater efficiency.
Amid this environment, Clarion saw growth in its business for the OEM (Original Equipment Manufacturer) market worldwide as well as the option business for car dealers in the Japanese market. At the same time, sales of the EMS (Electronic Manufacturing Services) business increased in the Americas and Europe, whereas making Xanavi a subsidiary led to growth in sales of car navigation systems. As a result, consolidated net sales for fiscal 2007 amounted to ¥246,806 million, up 36.3% year-on-year.
Consolidated operating income totaled ¥5,465 million, up 77.9%. Despite rising raw material prices and an increase in strategic R&D investment, this was achieved through the benefits of our alliance with Hitachi and Xanavi as well as successful improvement in the reduction of selling, general and administrative expenses.
Consolidated net income amounted to ¥1,378 million, a remarkable turnaround from a net loss of ¥784 million in the previous fiscal year. Income of ¥2,891 million was derived mainly from gain on foreign currency transactions; reversal of allowance for doubtful accounts; proceeds from sales of property, plant and equipment arising from the sale of the Gunma office buildings and structures; and gain on reversal of patent fees in prior years. Nonetheless, the Company also posted expenses of ¥4,058 million due primarily to loss on sales and disposal of property, plant and equipment from the sale of land; impairment loss on fixed assets; provision for retirement benefits for directors and corporate auditors; provision for warranty costs; and loss on devaluation of investments in securities.
Medium- to Long-term Management StrategyThe Clarion Group is striving to establish a structure that will enable timely response to changes in the business environment such as changing market conditions and technological innovation. We are also working to restructure our business portfolio and to increase management efficiency.
Accordingly, we are engaged in activities based on “Vision-70,” which states “in an environment of ‘Mobile-Infoentertainment*’ where people can enjoy sound and information in their cars, we will create products that emphasize a ‘Fresh feeling of Safety’ and ‘Fresh Pleasure’ and provide excitement and satisfaction to our customers.”
Clarion is targeting the medium-term management goal of ¥280,000 million in net sales and a consolidated operating ratio of 5% for the fiscal year ending March 31, 2011. We will focus efforts on the following points to achieve these goals:
1. Completion of B.N.1 ActivitiesClarion is pursuing “B.N.1 (Be Number One)” activities to maximize the synergetic benefits of the alliance with Hitachi and consolidation of Xanavi. We are aiming to be global No. 1 in the respective areas of sales/marketing, product planning, R&D, purchasing/procurement, production, quality and services. We will accelerate B.N.1 activities as we implement structural reforms from a customer viewpoint.
2. Improvement of Product QualityWe will strive to improve quality control from upstream processes through consolidation of the Group quality management system in order to earn the trust of our customers and bring them satisfaction.
3. Sales & Marketing StrategyWe will strive to improve profitability in our businesses by reforming the sales structure and system. We will aim for the global sales expansion to boost profitability and introduce our unique products that anticipate the changing needs of the market to ensure our success.
4. Brand StrategyWith “Clarion H.M.I. (Human Mobile Music Media Interface)” as our brand slogan, we are promoting greater added value in the various activities undertaken within the Group with the goal of enhancing brand value.
5. R&D StrategyWe are working to strengthen Group competitiveness through improved R&D efficiency by implementing reforms in the Group’s structure and environment while simultaneously working to align our intellectual property and R&D strategies.
6. Improvement of Cost ManagementWe aim to achieve competitive, efficient development while improving our cost management for the upstream processes of product planning and development, including the introduction of a PM (Product Manager) system. We will expand the scope of joint procurement with Hitachi as well as realize global procurement of materials from optimal locations at the lowest cost.
7. Enhancement of Group OrganizationWe are working to enhance organizational capabilities through a comprehensive review of the existing organizational structure and operational processes.
8. Commitment to CSR (Corporate Social Responsibility)Based on “Basic Regulations for Compliance Management,” we will strive to let corporate ethics take deeper root and to establish a more solid and efficient internal control system.
Priority Management Issues
In the CIS (Car Information System) industry, we project market expansion in the car electronics field centered around car navigation systems. However, we also expect the severe business environment to persist in markets worldwide as a result of such factors as increased R&D investment accompanying fast-paced technological innovation, declining prices worldwide due to the increasing commoditization of products and rising prices for raw materials.
Through an alliance with Hitachi, we are promoting organizational selection and concentration in the areas of technological development, purchasing/procurement, production, sales/marketing and quality, enabling us to respond to customers and the market even more quickly.
In our B.N.1 activities, we believe improving the Group’s global cost management as quickly as possible is one of the most important and pressing issues. We aim to achieve this by integrating platforms for car navigation systems, boosting development efficiency by shortening development lead times, reducing costs through greater concentration of purchasing and re-establishing optimal production through reconfiguration of production infrastructure.
As we promote mutual use of Group management resources, we intend to capitalize on each other’s strengths while shoring up weaknesses. By realizing the synergetic benefits of the alliance and consolidation quickly, we are working to transform Clarion into a more valuable enterprise with the goal of building an efficient and highly profitable corporate platform.
Tatsuhiko IzumiPresident
*Mobile-Infoentertainment is a mixture of Mobile, Information and Entertainment.
02 03

Tatsuhiko IzumiPresident
August 2008
Achieving Mid-term Management Goals
Clarion’s mid-term management plan aims to achieve ¥280,000 million in consolidated net sales and a consolidated operating income ratio of 5% for the fiscal year ending March 31, 2011 (fiscal 2010). We would like to explain specific measures and plans on how we intend to achieve these goals. Clarion is implementing eight measures to achieve our mid-term goals. These are separated into “opportunities and threats” and “strengths and weaknesses.”
The following three measures take advantage of our strengths to maximize opportunities.
Business Outlook
In the automobile industry, technological innovations continue at breakneck speed in the car information systems field. In particular, in the car audio-visual equipment sector, in addition to dedicated audio-visual and navigation devices, integrated AV-navigation devices are becoming more widespread, while demand for PNDs (Personal Navigation Devices) has been expanding. Besides providing products that meet customer needs in a timely manner, it is imperative to develop appealing content and offer an array of solutions. In addition, there has been a flurry of new entrants into this field from different industries, and the competition is expected to get fiercer.
In fiscal 2008, we will introduce into the PND market a new strategic product dubbed “MiND (Mobile Internet Navigation Device),” which enables connection to the Internet. We launched a portal site in Japan at the end of 2007 called “Chizuru-to-Susumu (Map-Route-Advance)” that provides maps and navigation, and we intend to create similar sites for the United States and Europe. Our aim is to expand our solutions business through unique products and services that enhance safety, reassurance and comfort around the world.
We will proceed with BN1 activities, which include maximizing synergies through the integration with Xanavi in the areas of increased sales, enhanced development efficiency and a reduction in material procurement and production costs. Synergetic benefits are also gradually starting to emerge in the areas of intellectual property and other areas.
For fiscal 2008, we forecast consolidated net sales of ¥240,000 million, a decrease of 2.8% year-on-year; operating income of ¥6,000 million, an increase of 9.8%; and net income of ¥1,500 million, an increase of 8.9%. The exchange rates are projected to be ¥110 to the U.S. dollar and ¥150 to the euro.
Basic Approach to CSR
As stated in our corporate commitment, “Clarion strives to improve society by seeking to develop the relationship between sound, information and human interaction, and by creating products to meet those needs.” Based on this commitment, we are working to enhance our CSR activities. Our compliance guidelines “Guiding Principles of Conducts and Behaviors” was laid out and comprehensively applied throughout our Group companies worldwide in an effort to fulfill our social responsibilities as a global corporation in the areas of quality control, environmental protection and social contributions.
Environmental issues are expected to become increasingly important in the automobile industry in particular. Clarion will strive to expand the range of eco-friendly products to develop car information systems that help make cars more environmentally friendly.
Corporate Governance
We have developed a corporate governance structure in recognition of its importance to the Company. Through efforts to enhance our risk management system and internal control system, we strive to respond swiftly and appropriately to any kind of risk while ensuring management transparency.
To Our Shareholders and Investors
Clarion views maintaining good communication with our stakeholders as a very important responsibility. With this in mind, we aim to attain continued growth as we tackle challenges and work hard to achieve our goals.
I ask for your continued support and guidance as we forge ahead.
Expansion of Overseas SalesCurrently, our major OEM customers are Nissan Motor Co., Ltd., Honda Motor Co., Ltd. and Suzuki Motor Corporation. We have recently secured large-scale new business for navigation and audio systems from Ford Motor Company. This will make them our No. 2 customer after Nissan by fiscal 2010. The business for Renault operated by Xanavi will also contribute to the expansion of OEM sales overseas. We are already engaged in substantial business throughout China, and we will focus on Shanghai General Motors Co., Ltd. as one of the main pillars for our business in the country.
Enhancement of the Navigation System LineupWe forecast sales expansion of navigation systems to Ford and other OEM customers. To meet increasingly diverse demands, we will work to enhance our navigation system lineup in response to product grade and variations as well as global sales channels. Through this measure, we expect to greatly increase the percentage of navigation systems in our complete product range from the current 39% to 53%.
Eight Management Measures
Special Feature
Expansion of the Solution BusinessWe will also work to expand the content business, which provides services in the software area for hardware products such as navigation systems, and solution business for the commercial-use vehicle market.
The following two measures will be taken to convert our weaknesses into strengths to take full advantage of emerging opportunities.
Entry into the Markets of Emerging NationsIn addition to China, we will pursue expansion of the OEM business in India, Thailand and other Asian countries as well as in South America, Russia and Eastern Europe and the Middle East.
Focusing More Efforts on the Aftermarket and Selection and Concentration of Markets and Products (Markets and Products with Higher Profitability)We will select and concentrate on products and channels with higher aftermarket potential. In the Japanese market, we will work to strengthen the highly profitable option business, sales to retail stores and B2B (business-to-business) channels. We will also launch advanced products such as PNDs and MiND products ahead of competitors. Our overseas strategy in this area includes reorganization of our sales structure to meet requirements for expanding sales to mass merchandisers. MiND products will be launched in North America in October 2008 and in Europe and Japan in 2009.
04 05


Compliance Promotion FrameworkClarion has established the Compliance Committee, chaired by the President. Regular meetings are held, with the CSR Group of the Personnel and Administration Department acting as secretariat. In these sessions, reports are made on the compliance activities of each department, and ideas and opinions on compliance-related issues are exchanged and shared by the members.
Promotional Framework of Environmental Management SystemAt Clarion, we engage in business activities aimed at a sustainable enterprise seeking harmony among people, society and nature. We are committed to striving for corporate activities with consideration to the environment, including the effective utilization of the Earth’s finite resources and the efficient use of energy.
A Standing Committee on the Environment, chaired by the President, has been set up in order to advance environmental protection activities throughout the Company. Within the Committee are six subcommittees to address environmental protection issues in each specific field from a Company-wide perspective.
ISO 14001 CertificationClarion completed establishment of a Company-wide environmental management system, and ISO 14001 certification was awarded to the entire Company in April 2000. At our overseas affiliates and subsidiaries, 11 sites, mainly production sites, have successfully been certified.
Mid-term Environmental PlanIn order to reduce environmental impact to the greatest extent possible, every year Clarion reviews its mid-term environmental plan based on an evaluation of environmental performance in the previous year. In fiscal 2007, we reviewed the mid-term environmental plan created in fiscal 2006 and formulated a new three-year environmental plan covering the period through March 2010 based on the Hitachi Group’s environmental action plan. The new plan sets ambitious objectives covering the diverse fields of our activities, from promoting resource conservation and recycling-oriented design, management and reduction of harmful substances in developed products, and the application of lead-free solders to a 10% reduction in energy usage by the end of March 2011 compared with 1990 levels, reduction of waste, expansion of recycling activities and the promotion and continuance of zero waste output.
Promoting Communication with StakeholdersThe Clarion Report is published annually, detailing initiatives and results concerning environmental protection and social contribution activities as one measure to maintain communications with a wide range of stakeholders. The report can also be viewed on the Company’s Website.
Pursuing Sound and Highly Transparent Management
Corporate Governance StructureClarion operates under an auditor system. The Board of Directors consists of nine directors (including three outside directors) and the Board of Corporate Auditors has five corporate auditors (including three outside auditors). The Board of Directors sets basic management policies from a Group-wide perspective and supervises important managerial decision-making and other business administration matters. An executive officer system has been instituted to facilitate the quick execution of business. The Corporate Management Meeting, comprised of directors and corporate officers, has been created as a consultative body to assist the Board. It is here that management direction and policies are clarified. The term of office for directors and corporate officers has been set at one year to clarify responsibilities and enable greater flexibility.
Efforts to Enhance the Internal Control SystemThe Internal Audit Office conducts regular audits of all the Company’s departments and Group companies. The Office verifies business activities in terms of efficiency, conformity and compliance with laws and internal regulations. The findings are reported to the President, and corrective actions are taken if found necessary.
We reviewed our internal control system in line with the May 2006 enactment of the Corporate Law of Japan. As a member of the Hitachi Group, we redeveloped the internal control system in fiscal 2007 at 23 subsidiaries in Japan and overseas in compliance with the U.S. Sarbanes-Oxley (SOX) Act. In fiscal 2008 (ending March 31, 2009), we will promote compliance with the Financial Instruments and Exchange Law (Japanese version of the SOX Act) throughout the Clarion Group as a means to improve the quality of internal controls.
Enhancing Risk ManagementClarion formulated “Regulations for Risk Management” to identify the various risks we face in business in order to maintain/increase corporate value. The Risk Management Committee oversees and responds to risks encountered in general management. Under the umbrella of this body, various committees respond to risks in specific areas such as crisis management, compliance, information disclosure, information security, security trade control and the environment. The Internal Audit Office regularly monitors these efforts and implements the PDCA (Plan-Do-Check-Act) cycle to drive ongoing improvement.
Information DisclosureClarion strives to fulfill its accountability to stakeholders and raise management transparency. As part of these efforts, we deliver Shareholders Bulletins (in Japanese) twice a year, while annual reports and Clarion Reports are published every year and the Company’s Website is regularly updated. Through these activities, we ensure that fair and accurate corporate information is disclosed in a timely manner. In relation, the Information Disclosure Committee has been established to guarantee the appropriateness of information and the method of disclosure.
Promoting Sincere Compliance and Environmental Protection Activities
We acknowledge that compliance management and environmental protection activities are key issues in ensuring sound corporate activities. Based on this belief, we make diverse efforts aimed at being a company that society can trust and have confidence in. The following outlines key compliance and environment-related initiatives.
Bolstering Compliance ManagementAs a good corporate citizen and member of society, Clarion not only observes laws but also promotes Group-wide awareness of business ethics. As the foundation of such activities, we established compliance guidelines (“Guiding Principles of Conducts and Behaviors” in July 2003 and “Basic Regulations for Compliance Management” in March 2007) to which employees must adhere in conducting business activities. Deployed on a global scale, our compliance program has now been introduced at six Group companies in Japan and 15 overseas. Each of these companies formulated their own “Guiding Principles of Conducts and Behaviors” in compliance with the Headquarters’ guidelines. Overseas, these guiding principles have been created in a total of eight languages, including English, Chinese and Malay. Compliance audits and compliance awareness surveys have been conducted since 2004 to regularly check and ensure these guiding principles are being observed and no compliance-related problems have arisen. Through these periodic audits, we issue directions for improvement when deemed necessary.
Clarion places importance on corporate governance and has developed a system that embodies that awareness. Through its efforts to develop a risk management system and redevelop internal controls, Clarion is striving to ensure the transparency of management at all times and respond promptly and appropriately to risks.
Clarion Report 2008
Corporate Governance System
Corporate Social Responsibility Corporate Governance
08 09

impairment loss on fixed assets; provision for retirement benefits for directors and corporate auditors; provision for warranty costs; and loss on devaluation of investments in securities.
After income taxes (both current and deferred), consolidated net income amounted to ¥1,378 million as opposed to a net loss of ¥784 million in the previous fiscal year. Net income per share was ¥4.88 compared with a net loss per share of ¥2.78.
An overview by business segment is as follows.■ Car Audio-Visual Equipment SegmentThis segment is our core segment that involves car navigation and car multimedia devices. Favorable sales in Japanese and overseas OEM markets, despite negative factors such as deterioration of sales prices in the Japanese retail market due to increasingly severe competition and a decrease in new car sales, contributed to an increase in sales in this segment to ¥217,522 million, up 34.5% compared with the previous fiscal year. Operating income increased 162.8% to ¥4,330 million thanks to increased income due to increased sales and a reduction in selling, general and administration expenses, which were more than enough to offset increased material costs and strategic R&D investment.
■ Special Equipment SegmentIn this segment, which comprises AV (Audio-Visual) equipment and other products for commercial vehicles, we made efforts to increase sales of IT-based Automatic Guidance Systems as well as a Bus Location System both for tourist and community buses, around-the-vehicle-view monitor equipment with CCD cameras and drive-recorder devices, taking advantage of increased safety awareness in driving. Net sales rose 11.5% to ¥8,732 million. Operating income fell 38.6% to ¥739 million due to increased material costs, price deterioration reflecting severe market conditions and increased R&D investment.
■ Others Business SegmentWithin this segment, we have developed EMS business mainly in the Americas and Europe. Thanks to the flourishing mobile phone business in the Americas in line with receiving special orders combined with increased orders for in-vehicle meter PC boards, net sales increased 79.9% to ¥20,551 million. Operating income rose 79.7% to ¥395 million.
Results by geographic segments are as follows.■ JapanIn the automobile industry, sales of new cars slumped in Japan as the tough business environment continued. In terms of results, an increase in sales in the OEM market partially due to the consolidation of Xanavi combined with strong sales in the option business for car dealers led to net sales of ¥151,015 million, up 61.7% year-on-year. Despite an in-crease in strategic R&D investment, operating income jumped 226.5% to ¥4,165 million due mainly to a reduction in selling, general and ad-ministrative expenses and the positive effect of sales gains.
■ AmericasAn increase in sales in the EMS business culminated in net sales of ¥55,497 million, up 12.0%. Operating income dipped 3.4% to ¥1,096 million owing to a harsh environment in the aftermarket, characterized by a decline in sales prices.
■ Asia and AustraliaIn Asia, we saw an increase in new car sales and steady consumer spending reflecting strong growth in China. Conversely, car sales in Taiwan declined substantially year-on-year in an extremely difficult market environment. Additionally, the fiscal year was changed to the calendar year for subsidiaries in Hong Kong and China. As a result, net sales decreased 10.5% to ¥12,952 million. Despite a reduction in fixed costs, operating income decreased 0.9% to ¥466 million due primarily to an increase in development costs in China.
Review of OperationsDuring the fiscal year under review, we saw some expansion in the first half amid an increase in capital investment and solid export sector. In the second half, however, corporate earnings plummeted owing to hikes in oil and other material prices, appreciation of the yen against the dollar, a stagnant stock market and weak personal spending. Overseas, the Asian economies, especially China, as well as that of Russia, made steady progress. Conversely, the subprime loan issue in the United States considerably impacted the real economy. In Europe as well, slackening of economies became more evident.
In the automotive industry, with which we are most closely related, sales of new cars in the Japanese, U.S. and European markets floundered, influenced by soaring gas prices and economic contraction. Alternatively, sales in markets like China, Russia and other BRICs countries expanded, supported by economic growth.
Consolidated net sales for fiscal 2007 amounted to ¥246,806 million, up 36.3% year-on-year. Business for the OEM market worldwide as well as the option business for car dealers in the Japanese market was brisk, while sales of the EMS business increased in the Americas and Europe. Furthermore, sales of car navigation systems increased, which was attributable to Xanavi Informatics Corporation (Xanavi) becoming a wholly owned subsidiary of Clarion.
With regard to income, consolidated operating income totaled ¥5,465 million, up 77.9% over the previous fiscal year. Despite rising raw material prices and an increase in strategic R&D investment, we reduced selling, general and administrative expenses.
Income before income taxes amounted to ¥4,298 million, representing a significant increase from ¥167 million recorded in the previous fiscal year. Income of ¥2,891 million was derived mainly from gain on foreign currency transactions; reversal of allowance for doubtful accounts; proceeds from sales of property, plant and equipment arising from the sale of the Gunma Office buildings and structures; and gain on reversal of patent fees in prior years. Nonetheless, the Company also posted expenses of ¥4,058 million due primarily to loss on sales and disposal of property, plant and equipment from the sale of land;
Financial PositionCurrent assets were up ¥5,306 million, or 5.8%, to ¥96,215 million. The main reasons were an increase of ¥1,862 million in cash on hand and in banks to ¥12,608 million and an increase of ¥3,629 million in notes and accounts receivable to ¥48,227 million. The total of investment in securities, property, plant and equipment and other assets fell ¥3,956 million, or 6.8% versus the previous fiscal year-end, to ¥54,625 million. Property, plant and equipment rose ¥821 million from the previous fiscal year-end to ¥27,568 million, due mainly to the completion of construction of the Headquarters and Technical Center. Investments in securities decreased ¥956 million to ¥2,344 million, due to loss on devaluation, while other assets declined ¥3,820 million to ¥24,713 million due partially to withdrawal of deferred tax assets. As a result, total assets at year-end increased ¥1,350 million, or 0.9%, compared with the previous fiscal year-end, to ¥150,841 million.
Total liabilities increased ¥3,457 million, or 3.0%, from the previous fiscal year-end, to ¥118,716 million. Current liabilities were up ¥5,844 million, or 7.4%, to ¥84,763 million. Total long-term liabilities decreased ¥2,387 million, or 6.6%, to ¥33,952 million, attributable mainly to a decrease in long-term loans. Total net assets totaled ¥32,125 million. The net assets ratio was down 1.6 percentage points to 21.3%.
■ EuropeDespite an adverse environment in this region, including sales price declines due to intense price competition in the aftermarket together with the changeover period for OEM orders, net sales increased 15.5% to ¥27,340 million. Operating income stood at ¥147 million compared with operating income of ¥1 million in the previous fiscal year as a re-sult of the positive effect of a reduction in fixed costs through structural reforms.
■ Net Sales, Overseas Sales and Overseas Sales Ratio
■ Operating Income and Operating Income Ratio
■ Net Income (Loss) and Return on Sales ■ Net Income (Loss) per Share
■ Total Assets, Net Assets and Net Assets Ratio ■ Depreciation and Amortization
* Years ended March 31
Financial Review
10 11

Clarion Co., Ltd. and Subsidiaries
Years ended March 31
Thousands of U.S. dollars, Millions of yen, except per- except per-share amounts share amounts
2003 2004 2005 2006 2007 2008 2008
FortheYear
Net sales
Car audio-visual equipment
Audio entertainment equipment
Special equipment
Others
Japan
Americas
Asia and Australia
Europe
Cost of sales
Selling, general and administrative expenses
Operating income
Other expenses, net
Income before income taxes and minority interests
Provision (benefit) for income taxes
Minority interests in subsidiaries
Net income (loss)
Research and development expenses
Capital investment
Net cash provided by operating activities
Net cash used in investing activities
Net cash provided by (used in) financing activities
Pershare
(Yen and U.S. dollars):
Net income
Cash dividends
Atyear-end
Total assets
Total net assets
Interest-bearing debt
Ratio(%)
Net assets ratio
ROE
ROA
Current ratio
Notes: 1. Research and development expenses include labor and other expenses reported as cost of sales. 2. The translations of the Japanese yen amounts into U.S. dollars are included solely for the convenience of readers, using the prevailing
exchange rate at March 31, 2008, which was ¥100.19 to US$1.
¥246,806
217,522
—
8,732
20,551
151,015
55,497
12,952
27,340
205,058
36,281
5,465
1,167
4,298
2,903
17
1,378
27,772
6,855
10,771
(9,247)
1,061
¥4.88
¥2.00
¥150,841
32,125
42,838
21.3
4.2
0.9
113.5
¥184,176
168,686
—
8,306
7,183
99,511
43,725
15,063
25,877
147,123
31,824
5,228
694
4,534
(1,337)
8
5,862
11,340
8,106
9,236
(1,055)
(7,938)
¥20.76
¥2.00
¥122,119
34,661
34,227
28.3
19.2
4.9
125.5
¥178,325
166,365
—
6,949
5,010
96,658
38,577
10,737
32,351
140,786
27,956
9,582
6,631
2,950
(2,328)
167
5,111
10,659
3,066
8,038
(6,030)
(17,537)
¥18.09
—
¥119,527
26,878
41,619
22.5
21.4
4.1
108.7
¥168,947
159,544
—
6,126
3,275
88,843
33,657
9,893
36,552
132,103
26,491
10,352
4,451
5,900
(514)
109
6,305
9,943
1,816
16,058
(158)
(16,467)
¥22.32
—
¥128,536
21,879
58,585
17.0
35.4
4.7
100.0
¥185,530
168,716
5,162
5,235
6,416
97,333
39,291
10,141
38,763
146,946
29,049
9,534
7,132
2,402
727
119
1,555
9,569
2,410
12,153
(530)
(2,158)
¥7.82
—
¥140,621
15,588
74,416
11.1
16.8
1.1
90.9
$2,463,380
2,171,098
—
87,155
205,125
1,507,289
553,925
129,280
272,884
2,046,695
362,131
54,553
11,649
42,903
28,978
171
13,754
277,201
68,426
107,511
(92,298)
10,590
$0.05
$0.02
$1,505,554
320,645
427,577
21.3
4.2
0.9
113.5
Six-YearFinancialSummary
¥181,041
161,786
—
7,833
11,422
93,365
49,537
14,475
23,663
148,200
29,768
3,072
2,905
167
938
13
(784)
12,560
6,074
8,820
(20,501)
10,054
¥(2.78)
¥2.00
¥149,490
34,231
41,483
22.9
(2.3)
(0.6)
115.2
13
■ Capital Investment ■ Cash Flows ■ ROE and ROA
* Years ended March 31
Cash FlowsNet cash provided by operating activities was ¥10,771 million. This was due mainly to income before income taxes of ¥4,298 million, depreciation and amortization of ¥6,364 million as well as a decrease in inventories and an increase in notes and accounts payable. Net cash provided at the end of the previous fiscal year was ¥8,820 million.
Net cash used in investing activities was ¥9,247 million. This was due mainly to payment for purchases of property, plant and equipment primarily for die-cast and production equipment as well as investment in construction of the new Headquarters and Technical Center in addition to payment for purchases of intangible assets such as software, offsetting proceeds from sales of property, plant and equipment associated with the sale of the Gunma Office buildings and structures. Net cash used at the end of the previous fiscal year was ¥20,501 million.
As a result, free cash flow totaled ¥1,524 million (compared with a negative cash flow of ¥11,680 million at the previous fiscal year-end).
Net cash provided by financing activities was ¥1,061 million due mainly to proceeds from long-term loans despite dividends paid in the amount of ¥564 million. Net cash provided at the end of the previous fiscal year was ¥10,054 million.
As a result of the above, cash and cash equivalents at the end of the year were ¥12,563 million, an increase of ¥1,871 million versus ¥10,691 million at the previous fiscal year-end.
Outlook for Fiscal 2008, Ending March 31, 2009In the automobile industry, technological innovations continue at breakneck speed in the car information systems field. In particular, in the car AV equipment sector, in addition to dedicated AV and navigation devices, integrated AV-navigation devices are becoming more widespread, while demand for PNDs (Personal Navigation Devices) has been expanding. Besides providing products that meet customer needs in a timely manner, it is imperative to develop appealing content and offer an array of solutions. In addition, there has been a flurry of new entrants into this field from different industries, and the competition is expected to get fiercer.
Amid such a business environment, Clarion became a consolidated subsidiary of Hitachi, Ltd. in 2006 upon which Xanavi was made a wholly owned subsidiary of Clarion. This move will enable the integration of Clarion’s accumulated expertise in car navigation and AV systems with the technological know-how of the Hitachi Group. We will proceed with BN1 activities, which include maximizing synergies through the integration with Xanavi in the areas of increased sales, enhanced development efficiency and a reduction in material procurement and production costs. Synergetic benefits are also gradually starting to emerge in the areas of intellectual property and other areas.
In fiscal 2008, we will introduce into the PND market a new strategic product dubbed “MiND (Mobile Internet Navigation Device),” which enables connection to the Internet. We launched a portal site in Japan in December 2007 called “Chizuru-to-Susumu (Map-Route-Advance)” that provides maps and navigation, and we intend to create similar sites for the United States and Europe. Our aim is to expand our solutions business through unique products and services that enhance safety, reassurance and comfort around the world.
For fiscal 2008, we forecast consolidated net sales of ¥240,000 million, a decrease of 2.8% year-on-year; operating income of ¥6,000 million, an increase of 9.8%; and net income of ¥1,500 million, an increase of 8.9%. The exchange rates are projected to be ¥110 to the U.S. dollar and ¥150 to the euro.
Financial Review
12 1313

14 1514 15
ConsolidatedBalanceSheets March 31
2008 2007 2008
(Thousandsof (Millionsofyen) U.S.dollars)
LIABILITIESANDNETASSETS
Current liabilities:
Short-term loans (Note 9) ..............................................................................................
Notes and accounts payable.........................................................................................
Accrued bonuses ...........................................................................................................
Accrued expenses .........................................................................................................
Accrued income taxes ...................................................................................................
Accrued warranty costs ................................................................................................
Other current liabilities ..................................................................................................
Total current liabilities ................................................................................................
Long-term liabilities:
Long-term loans (Note 9) ..............................................................................................
Accrued pension and severance costs (Note 10) ........................................................
Deferred tax liabilities on revaluation of land (Note 12) ...............................................
Deferred tax liabilities (Note 13) ....................................................................................
Accrued retirement benefit for directors and corporate auditors ...............................
Accrued warranty costs ................................................................................................
Other long-term liabilities ..............................................................................................
Total long-term liabilities............................................................................................
Commitments and contingencies (Note 17)
Net assets:
Shareholders’ equity (Note 11):
Common stock, no par value
Authorized: 450,000,000 shares
Issued: 282,744,185 shares at March 31, 2008 and 2007 ........................................
Additional paid-in capital ..............................................................................................
Retained earnings (Note 21) ..........................................................................................
Treasury stock ...............................................................................................................
Total shareholders’ equity .........................................................................................
Valuation, translation adjustments and other:
Net unrealized gains on revaluation of land (Note 12) .................................................
Net deferred (losses)/gains on hedge .........................................................................
Foreign currency translation adjustments ....................................................................
Net unrealized gains on other securities ......................................................................
Total valuation, translation adjustments and other ..................................................
Minority interests in subsidiaries ......................................................................................
Total net assets ..........................................................................................................
Total liabilities and net assets................................................................................
March 31
2008 2007 2008
(Thousandsof (Millionsofyen)
U.S.dollars)
ASSETS
Current assets:
Cash on hand and in banks ..........................................................................................
Notes and accounts receivable.....................................................................................
Allowance for doubtful accounts ..................................................................................
Inventories (Note 6) .......................................................................................................
Deferred tax assets (Note 13) .......................................................................................
Other current assets ......................................................................................................
Total current assets ...................................................................................................
Investments in securities (Note 7) .....................................................................................
Property, plant and equipment (Note 5)
Buildings and structures (Note 9) .................................................................................
Machinery and equipment (Note 9) ..............................................................................
Land (Note 9) .................................................................................................................
Construction in progress ...............................................................................................
Accumulated depreciation ............................................................................................
Property, plant and equipment, net ..........................................................................
Other assets:
Intangible assets (Note 5)..............................................................................................
Deferred tax assets (Note 13) .......................................................................................
Other ..............................................................................................................................
Total other assets .......................................................................................................
Total assets ............................................................................................................
The accompanying notes are an integral part of these consolidated financial statements.
Clarion Co., Ltd. and Subsidiaries
$0,233,317
386,556
15,870
106,808
13,078
22,839
67,558
846,028
194,259
105,420
6,433
601
4,296
10,090
17,778
338,880
260,508
26,645
83,633
(941)
369,845
8,115
(67)
(60,597)
1,324
(51,224)
2,024
320,645
$1,505,554
¥018,687
37,859
593
12,054
302
2,919
6,501
78,919
22,795
11,334
651
238
—
249
1,070
36,339
26,100
2,669
7,349
(83)
36,035
1,029
7
(3,666)
622
(2,007)
203
34,231
¥149,490
¥023,376
38,729
1,590
10,701
1,310
2,288
6,768
84,763
19,462
10,562
644
60
430
1,010
1,781
33,952
26,100
2,669
8,379
(94)
37,054
813
(6)
(6,071)
132
(5,132)
202
32,125
¥150,841
$0125,847
481,362
(4,875)
270,820
36,927
50,250
960,332
23,396
207,734
485,269
93,528
11,530
(522,902)
275,160
182,979
33,459
30,224
246,663
$1,505,554
¥010,746
44,598
(1,255)
29,606
3,288
3,924
90,908
3,300
17,129
47,393
10,496
2,811
(51,084)
26,747
18,141
5,108
5,284
28,533
¥149,490
¥012,608
48,227
(488)
27,133
3,699
5,034
96,215
2,344
20,812
48,619
9,370
1,155
(52,389)
27,568
18,332
3,352
3,028
24,713
¥150,841

16 1716 17
¥26,878
5,862
35
(10)
1,893
34,661
(784)
(564)
(43)
963
34,231
1,378
(564)
(10)
(2,909)
¥32,125
$339,643
13,754
(5,634)
(106)
(29,037)
$320,645
¥(8,031)
—
1,367
—
1,771
(4,891)
—
—
—
1,225
(3,666)
—
—
—
(2,404)
¥(6,071)
$(36,596)
—
—
—
(24,001)
$(60,597)
¥2,934
5,862
(1,331)
—
1,017
8,483
(784)
(564)
—
215
7,349
1,378
(564)
—
216
¥8,379
$73,355
13,754
(5,634)
—
2,157
$83,633
¥(29)
—
—
(10)
—
(39)
—
—
(43)
—
(83)
—
—
(10)
—
¥(94)
$(835)
—
—
(106)
—
$(941)
¥148
—
—
—
28
176
—
—
—
27
203
—
—
—
(0)
¥202
$2,034
—
—
—
(9)
$2,024
¥(4,944)
—
1,367
—
847
(2,728)
—
—
—
721
(2,007)
—
—
—
(3,124)
¥(5,132)
$(20,039)
—
—
—
(31,185)
$(51,224)
ConsolidatedStatementsofOperations Year ended March 31
2008 2007 2006 2008
(Thousandsof (Millionsofyen) U.S.dollars)
Net sales...................................................................................................
Cost of sales ............................................................................................
Gross profit .......................................................................................
Selling, general and administrative expenses (Notes 14 and 19) ............
Operating income .............................................................................
Other income:
Interest and dividend income ...............................................................
Exchange gains, net .............................................................................
Gain on reversal of allowance for doubtful accounts ..........................
Gain on sales of property, plant and equipment ..................................
Gain on reversal of patent fee for prior years ......................................
Equity in earnings of affiliates ..............................................................
Other .....................................................................................................
Other expenses:
Interest expenses .................................................................................
Exchange losses, net ...........................................................................
Loss on sales and disposal of property, plant and equipment ............
Purification cost for land ......................................................................
Impairment loss on fixed assets (Note 5) ............................................
Accrued retirement benefit for directors and corporate auditors ........
Provision for warranty costs .................................................................
Loss on devaluation of investments in securities ................................
Additional severance costs ..................................................................
Other .....................................................................................................
Income before income taxes and minority interests ........................
Income taxes (Note 13):
Current ..................................................................................................
Deferred ................................................................................................
Income/(loss) before minority interests ............................................
Minority interests in subsidiaries .............................................................
Net income/(loss) ..............................................................................
The accompanying notes are an integral part of these consolidated financial statements.
Clarion Co., Ltd. and Subsidiaries
$2,463,380
2,046,695
416,684
362,131
54,553
3,232
3,933
4,308
3,578
3,045
1,025
9,733
28,856
7,936
—
6,133
—
3,641
3,072
3,024
2,962
317
13,417
40,506
42,903
17,738
11,239
28,978
13,925
171
$0,013,754
¥184,176
147,123
37,053
31,824
5,228
270
—
—
2,000
—
222
2,698
5,192
835
327
812
—
1,335
—
—
54
417
2,102
5,886
4,534
588
(1,925)
(1,337)
5,871
8
¥005,862
¥181,041
148,200
32,841
29,768
3,072
336
—
—
259
—
22
476
1,095
867
9
341
1,436
113
—
—
16
112
1,103
4,000
167
651
287
938
(770)
13
¥0 0(784)
¥246,806
205,058
41,747
36,281
5,465
323
394
431
358
305
102
975
2,891
795
—
614
—
364
307
303
296
31
1,344
4,058
4,298
1,777
1,126
2,903
1,395
17
¥001,378
Balance at March 31, 2005 .............
Changes in:
Net income .................................
Accounting standard for overseas subsidiary ..........
Treasury stock ............................
Items other than shareholders’ equity ..........
Balance at March 31, 2006 .............
Changes in:
Net loss ......................................
Dividends....................................
Treasury stock ............................
Items other than shareholders’ equity ..........
Balance at March 31, 2007 .............
Changes in:
Net income .................................
Dividends....................................
Treasury stock ............................
Items other than shareholders’ equity ..........
Balance at March 31, 2008 .............
Balance at March 31, 2007 ..........
Changes in:
Net income ..............................
Dividends .................................
Treasury stock .........................
Items other than shareholders’ equity ........
Balance at March 31, 2008 ..........
The accompanying notes are an integral part of these consolidated financial statements.
282,744
—
—
—
—
282,744
—
—
—
—
282,744
—
—
—
—
282,744
282,744
—
—
—
—
282,744
ConsolidatedStatementsofNetAssets
Totalnet
assets
Minorityinterests insubsidiaries
Foreign currency
translation adjustments
Net unrealized gains on
other securities
Net unrealized gains on
revaluation of land
Clarion Co., Ltd. and Subsidiaries
Netdeferred
gains/(losses)on hedge
Totalnet
assets
Minorityinterests insubsidiaries
Foreign currency
translation adjustments
Net unrealized gain onother
securities
Net unrealized gains on
revaluation of land
Netdeferred
gains/(losses)on hedge
Total valuation,translation
adjustmentsand other
Total valuation,translation
adjustmentsand other
Valuation, translation adjustments and otherShareholders’ equity
Valuation, translation adjustments and otherShareholders’ equity
¥26,100
—
—
—
—
26,100
—
—
—
—
26,100
—
—
—
—
¥26,100
$260,508
—
—
—
—
$260,508
¥2,669
—
—
—
—
2,669
—
—
—
—
2,669
—
—
—
—
¥2,669
$26,645
—
—
—
—
$26,645
¥31,674
5,862
(1,331)
(10)
1,017
37,213
(784)
(564)
(43)
215
36,035
1,378
(564)
(10)
216
¥37,054
$359,673
13,754
(5,634)
(106)
2,157
$369,845
¥2,272
—
—
—
(1,028)
1,244
—
—
—
(215)
1,029
—
—
—
(216)
¥813
$10,272
—
—
—
(2,157)
$8,115
¥813
—
—
—
104
918
—
—
—
(295)
622
—
—
—
(489)
¥132
$6,212
—
—
—
(4,887)
$1,324
Number of common shares
outstanding
(Thousands)
Number of common shares
outstanding
(Thousands)
Common stock
Common stock
Additional paid-in capital
Additional paid-in capital
Retained earnings
Retained earnings
Treasurystock
Treasurystock
Totalshareholders’
equity
Totalshareholders’
equity
(Millionsofyen)
(ThousandsofU.S.dollars)
—
—
—
—
—
—
—
—
—
7
7
—
—
—
(13)
¥(6)
$ 71
—
—
—
(139)
$(67)

18 1918 19
ConsolidatedStatementsofCashFlows NotestotheConsolidatedFinancialStatements
1.Basisofpresentingconsolidatedfinancialstatements
Clarion Co., Ltd. (“Clarion”) and its subsidiaries in Japan maintain
their records and prepare their financial statements in accordance
with accounting principles generally accepted in Japan, while its
foreign subsidiaries maintain their records and prepare their finan-
cial statements in conformity with accounting principles generally
accepted in their respective countries of domicile. The accompa-
nying consolidated financial statements of Clarion, its subsidiaries
and affiliates (collectively, “the Company”) are prepared on the
basis of accounting principles generally accepted in Japan, which
are different in certain respects as to the application of and disclo-
sure requirements of International Financial Reporting Standards,
and are compiled from consolidated financial statements prepared
by the Company as required by the Financial Instruments and
Exchange Law of Japan.
The accompanying consolidated financial statements include
certain reclassifications and rearrangements in order to pres-
ent them in a form that is more familiar to readers outside Japan.
In addition, the notes to the consolidated financial statements
include information that is not required under generally accepted
accounting principles and practices in Japan, but which is pro-
vided herein as additional information. None of the reclassifica-
tions nor rearrangements have a material effect on the consoli-
dated financial statements.
Certain notes and amounts previously reported have been rear-
ranged and reclassified to conform to the current year presenta-
tion.
The amounts presented in millions of yen are truncated for
amounts less than 1 million. Totals may not add up exactly
because of such truncation.
2.Summaryofsignificantaccountingpolicies
(1) Consolidation and investments in affiliates
The accompanying consolidated financial statements include the
accounts of Clarion and its subsidiaries that are controlled by
Clarion. Under the effective control approach, all majority-owned
companies are to be consolidated. Additionally, companies in
which share ownership equals 50% or less may be required to
be consolidated in cases where such companies are effectively
controlled by other companies through the interests held by a
party who has a close relationship with the parent company in
accordance with accounting standards generally accepted in
Japan. All significant intercompany transactions and accounts and
unrealized intercompany profits are eliminated in consolidation.
Investments in affiliates in which Clarion has significant influence
are accounted for using the equity method. Net income in the
accompanying consolidated statements of operations includes
Clarion’s equity in earnings or losses of affiliates after elimination
of unrealized intercompany profits.
A difference in fiscal periods of Clarion and its subsidiaries
does not by itself justify the exclusion of a subsidiary from con-
solidation. As the difference is not more than three months, it is
acceptable to use, for consolidation purposes, the subsidiaries’
financial statements for their fiscal periods. For significant trans-
actions during the period between those subsidiaries’ fiscal year-
end and the balance sheet date of Clarion, necessary adjustments
are made in the consolidated financial statements.
The excess of the cost over the underlying fair value of invest-
ments in subsidiaries is recognized as goodwill. Goodwill relating
to Mexican subsidiaries is being amortized over a period of 20
years. Goodwill relating to Xanavi Informatics Corp. is being amor-
tized over a period of 10 years.
(2) Translation of foreign currency transactions and balances
Foreign currency transactions are generally translated using for-
eign exchange rates prevailing at the transaction dates. Assets
and liabilities denominated in foreign currencies are translated at
the current exchange rates at the balance sheet date.
All assets and liabilities of overseas subsidiaries are translated
at current rates at the respective balance sheet dates whereas
shareholders’ equity is translated at historical rates and all income
and expense accounts are translated at average rates for the
respective periods.
(3) Cash and cash equivalents
Cash and cash equivalents in the consolidated statements of cash
flows is comprised of cash on hand, bank deposits able to be
withdrawn on demand, and short-term highly liquid investments
with original maturities of three months or less, which represent a
minor risk of fluctuations in value.
(4) Financial instruments
(a) Securities
Investments in debt and equity securities are classified into three
categories: 1) trading securities, 2) held-to-maturity debt securi-
ties, and 3) other securities. These categories are treated differ-
ently for the purpose of measuring and accounting for changes in
fair value.
Clarion Co., Ltd. and Subsidiaries Clarion Co., Ltd. and Subsidiaries
Year ended March 31
2008 2007 2006 2008 (Thousandsof (Millionsofyen)
U.S.dollars)
Cash flows from operating activities: Income before income taxes and minority interests .............................. Adjustments to reconcile income before income taxes and minority interests to cash flows from operating activities: Depreciation and amortization ............................................................... Amortization of goodwill ......................................................................... Equity in earnings of affiliates ................................................................ Decrease in allowance for doubtful accounts ........................................ (Decrease)/increase in accrued pension and severance costs, less payment ............ Increase in accrued retirement benefit for directors and corporate auditors .............. Increase in accrued warranty costs ...................................................... Interest and dividend income ................................................................ Interest expense ..................................................................................... Devaluation of investments in securities ................................................ Gain on sales of investments in securities ............................................. Gain on sales of property, plant and equipment .................................... Loss on sales and disposal of property, plant and equipment .............. Impairment loss on fixed assets ............................................................ Purification cost for land ........................................................................ Changes in assets and liabilities: Notes and accounts receivable .......................................................... Inventories .......................................................................................... Notes and accounts payable .............................................................. Other, net ............................................................................................ Sub-total ..................................................................................... Interest and dividend received ............................................................... Interest paid ............................................................................................ Income taxes paid .................................................................................. Net cash provided by operating activities ......................................
Cash flows from investing activities: Increase in time deposits ....................................................................... Decrease in time deposits ...................................................................... Payment for purchases of property, plant and equipment .................... Proceeds from sales of property, plant and equipment ......................... Payment for purchases of intangible assets .......................................... Proceeds from sales of investments in securities .................................. Increase in loans receivable ................................................................... Decrease in loans receivable .................................................................. Payment for acquisition of shares of a subsidiary, net of cash acquired (Note15) ............................................................................... Other, net ................................................................................................ Net cash used in investing activities ..................................................
Cash flows from financing activities: (Decrease)/increase in short-term loans, net ........................................ Proceeds from long-term loans .............................................................. Repayment of long-term loans ............................................................... Cash dividends ....................................................................................... Other, net ................................................................................................ Net cash provided by/(used in) financing activities ............................
Effect of exchange rate changes on cash and cash equivalents ..............
Net increase/(decrease) in cash and cash equivalents ..............................Cash and cash equivalents at beginning of year .......................................
Cash and cash equivalents at end of year (Note 13) .................................
The accompanying notes are an integral part of these consolidated financial statements.
$42,903 63,527 9,385 (1,025) (8,069) (7,552) 3,613 3,177 (3,232) 7,936 2,962 (8) (3,578) 6,133 3,641 — (50,903) 10,880 20,975 21,481 122,249 3,839 (8,098) (10,479) 107,511
— 70 (68,426) 14,798 (39,306) 271 (93) 430 — (42) (92,298) (21,134) 69,867 (32,401) (5,634) (106) 10,590 (7,119) 18,684 106,716 $125,400
¥04,534 4,955 82 (222) (67) 382 — — (270) 835 54 (1,373) (2,000) 812 1,335 — 1,446 (732) 553 (31) 10,295 270 (849) (479) 9,236
(134) — (8,106) 7,802 (3,092) 2,430 (6) 65 — (13) (1,055) (10,880) 10,000 (7,047) — (10) (7,938) 694 937 11,016 ¥11,954
¥00 167 5,447 85 (22) (243) 161 — — (336) 867 16 (50) (259) 341 113 1,436 1,618 (1,128) 2,898 (1,193) 9,920 385 (849) (636) 8,820
— 145 (6,074) 1,108 (2,768) 673 (7) 155 (13,716) (17) (20,501) 5,709 12,000 (7,045) (564) (43) 10,054 363 (1,262) 11,954 ¥10,691
¥04,298 6,364 940 (102) (808) (756) 362 318 (323) 795 296 (0) (358) 614 364 — (5,100) 1,090 2,101 2,152 12,248 384 (811) (1,049) 10,771
— 7 (6,855) 1,482 (3,938) 27 (9) 43 — (4) (9,247) (2,117) 7,000 (3,246) (564) (10) 1,061 (713) 1,871 10,691 ¥12,563
March 31, 2008

20 2120 21
financial statements.
Clarion obtained approval from the National Tax Agency in
Japan to file under a consolidated tax return system effective the
year beginning April 1, 2002. Clarion has adopted the consolidated
tax return system for the calculation of income taxes since the
year ended March 31, 2003. Under the consolidated tax return
system, Clarion consolidates all wholly-owned domestic subsidiar-
ies based on the Japanese tax regulations.
(16) Revenue recognition
Sales are generally recognized at the time goods are delivered to
customers.
(17) Leases
Finance leases other than those which are deemed to transfer the
ownership of the leased assets to the lessee are accounted for by
a method similar to that applicable to ordinary operating leases.
(18) Amount per share
Basic net income per share is computed based on the net income
available for distribution to shareholders of common stock and
weighted-average number of shares of common stock outstanding
during the year. Diluted net income per share is computed based
on the net income available for distribution to the shareholders
and the weighted-average number of shares of common stock
outstanding during each year after giving effect to the dilutive
potential of shares of common stock to be issued upon the con-
version of convertible bonds or the exercise of warrants.
Net assets per share is computed based on the net assets
available for distribution to shareholders of common stock and the
number of shares of common stock outstanding at the balance
sheet date.
Trading securities are held for the purpose of generating profits
from changes in market value and are recognized at their fair value
in the consolidated balance sheets. Unrealized gains and losses
are included in current income. Held-to-maturity debt securities
are expected to be held to maturity and are recognized at histori-
cal or amortized cost in the consolidated balance sheets. Other
securities, for which market quotations are available, are recog-
nized at fair value in the consolidated balance sheets. Unrealized
gains and losses on these other securities were classified as a
separate component of net assets at a net-of-tax amount.
Other securities for which market quotations are unavailable are
stated at cost, based on the weighted-average cost method.
(b) Derivative financial instruments
All derivatives are stated at fair value, with changes in fair value
charged to current income for the period in which they arise,
except for derivatives that are designated as “hedging instru-
ments” (see (c) Hedge accounting below).
(c) Hedge accounting
The Company has a policy to utilize hedging instruments to
reduce their exposure to the risk of fluctuation in foreign currency
exchange rates.
Gains or losses arising from changes in fair value of the deriva-
tives designated as “hedging instruments” are deferred as a sepa-
rate component of net assets at a net-of-tax amount and charged
to income in the same period the gains and losses on the hedged
items or transactions are recognized.
The derivatives designated as hedging instruments by the
Company are principally forward foreign currency exchange con-
tracts.
(5) Allowance for doubtful accounts
The allowance for doubtful accounts is calculated based on the
aggregate amount of estimated credit losses for doubtful receiv-
ables, in addition to an amount calculated using historical write-off
experience from certain prior periods for receivables other than
doubtful receivables.
(6) Inventories
For Clarion and its domestic subsidiaries, inventories are stated
principally at cost determined by the weighted-average method.
As for overseas subsidiaries, inventories are stated at the lower of
cost, which is mainly determined by the first-in, first-out method,
or market. Supplies are stated at cost, which is determined by last
purchase price method.
(7) Property, plant and equipment
Property, plant and equipment, including significant renewals and
improvements, are carried at cost less accumulated depreciation.
Maintenance and repairs, including minor renewals, are charged
to income as incurred.
For Clarion and its domestic subsidiaries, depreciation, except
for dies, is computed under the declining-balance method at
rates based on the estimated useful lives of the assets, which are
prescribed by the Corporation Tax Law of Japan. For buildings
acquired by Clarion and some of the domestic subsidiaries on or
after April 1, 1998, depreciation is computed under the straight-
line method. Dies, included in machinery and equipment, are
depreciated under the straight-line method over the estimated
useful lives of the assets for Clarion, while a domestic subsid-
iary applies the declining-balance method at rates based on the
estimated useful lives of the assets. For overseas subsidiaries,
depreciation is computed under the straight-line method in accor-
dance with the generally accepted accounting principles generally
accepted in the respective countries of domicile.
In line with the fiscal year 2007 Japanese tax reforms, effective
April 1, 2007, property, plant and equipment that were acquired
before April 1, 2007, and that have been depreciated to the final
depreciable limit (5% of acquisition costs), are to be depreciated
to ¥1 over a period of five years commencing the year following
the year in which they have been fully depreciated to their respec-
tive depreciable limits using the straight-line method. As the result
of this change, operating income and income before taxes and
minority interests for the year ended March 31, 2008 decreased by
¥90 million ($903 thousand), respectively, compared with those
would have been recorded under previous method.
(8) Intangible assets
Intangible assets, including goodwill and capitalized software
costs, are carried at cost less accumulated amortization.
Goodwill represents the excess of purchase price and related
costs over the fair value of the business acquired and is amortized
using the straight-line method.
Capitalized software costs consist of costs of purchased or
developed software. Amortization of software for internal use and
for sales purpose is computed using the straight-line method over
periods of five years and three years, respectively.
(9) Impairment of fixed assets
The accumulated impairment loss is deducted from the net book
value of each asset. Impairment loss are measured and recog-
nized as required by accounting principles generally accepted in
the respective countries of domicile of the companies.
(10) Accrued bonuses
Accrued bonuses to employees are provided at the estimated
amounts, which Clarion and some of its subsidiaries expect to pay
to employees after the fiscal year-end, based on services provided
during the current period.
(11) Accrued pension and severance costs
For Clarion and its domestic subsidiaries, accrued pension and
severance costs are stated at an amount calculated based on
the projected benefit obligation and the fair value of pension plan
assets as adjusted for unrecognized net obligation at transition,
unrecognized actuarial differences and unrecognized prior ser-
vice costs. Unrecognized net obligation at transition is amortized
over a period of 10 years. Unrecognized actuarial differences are
amortized on a straight-line basis over a period of 7 to 15 years
commencing the year following the year in which they arise.
Unrecognized prior service costs of Clarion are amortized on a
straight-line basis over a period of 13 years which is within the
average remaining years of services of employees. Some of the
overseas subsidiaries are posting necessary amounts as required
by accounting principles generally accepted in the respective
countries of domicile.
(12) Accrued warranty costs
For Clarion and a domestic subsidiary, accrued warranty costs
are provided based on the past actual results of such expense.
Some of the overseas subsidiaries are posting necessary amounts
as required by accounting principles generally accepted in their
respective countries of domicile.
(13) Accrued retirement benefit for directors and corpo-
rate auditors
Accrued retirement benefit for directors and corporate audi-
tors have been made for the vested benefits to which they were
entitled if they were to retire or sever immediately at the balance
sheet date.
(14) Research and development costs
Research and development costs are expensed as incurred.
(15) Income taxes
The provision for income taxes is computed based on income
before income taxes and minority interests in the consolidated
statements of operations. The asset and liability approach is used
to recognize deferred tax assets and liabilities for the expected
future tax consequences of temporary differences between the
tax basis of assets and liabilities and their reported amount in the
3.Accountingchanges
(1) Change in depreciation method
In line with the fiscal year 2007 Japanese tax reforms, effec-
tive April 1, 2007, Clarion and its domestic subsidiaries have
changed their depreciation method of the property, plant and
equipment acquired on or after April 1, 2007, as prescribed by the
Corporation Tax Law of Japan. The method requires that property,
plant and equipment be depreciated to ¥1 (memorandum value)
at the end of their useful lives. As a result of this change, operat-
ing income and income before taxes and minority interests for the
year ended March 31, 2008 decreased by ¥134 million ($1,345
thousand), respectively, compared with those would have been
recorded under previous method.
(2) Change in accounting for warranty costs
Effective the year ended March 31, 2008, Clarion has changed its
method of accounting for warranty costs and provided an accrual
for warranty costs instead of recognizing such costs when war-
ranty services are actually rendered in order to unify its accounting
policy with that of Hitachi, Ltd., parent company. As a result of this
change, operating income and income before income taxes and
minority interests for the year ended March 31, 2008 decreased by
¥58 million ($578 thousand) and ¥361 million ($3,603 thousand),
respectively, compared with those would have been recorded
under the previous method.
(3) Change in accounting for retirement benefit for direc-
tors and corporate auditors
Effective the year ended March 31, 2008, Clarion has changed its
method of accounting for retirement benefit for directors and cor-
porate auditors and provided an accrual for retirement benefit for
directors and corporate auditors instead of recognizing such costs
when paid.

22 2322 23
The Company assessed impairment of each group of assets, which
are grouped on the basis of managerial accounting and for invest-
ment decision-making purposes.
Due to the decline in real estate value and poor performance of
assets, operating profitability has worsened substantially. Therefore,
the Company has decided to mark the assets down to the recover-
able value, and recognized impairment loss of ¥364 million ($3,641
thousand), ¥113 million and ¥1,335 million for the years ended
March 31, 2008, 2007 and 2006, respectively which comprises of
land totaling ¥333 million ($3,327 thousand), ¥68 million and ¥717
million, respectively, and other totaling ¥31 million ($314 thousand),
¥45 million and ¥617 million, respectively.
The recoverable value is determined as the higher of the net sell-
ing value or the value in use.
6.Inventories
Inventories as of March 31, 2008 and 2007 consisted of the following:
Finished goods ...................................................................................................................
Work in process .................................................................................................................
Raw materials and supplies ...............................................................................................
Total...................................................................................................................................................
7.Marketablesecuritiesandinvestmentsinsecurities
The aggregate cost and market value of other securities with market values, which were included in investment securities as of March 31,
2008 and 2007, are as follows:
March31,2008
Gross unrealized
(Millionsofyen)
Other securities ............................................................................................
Debt securities .............................................................................................
Other .............................................................................................................
Total ..........................................................................................................
Market value (carrying value)
¥1,590
—
—
¥1,590
Loss
¥(133)
—
—
¥(133)
Gain
¥272
—
—
¥272
Cost
¥1,451
—
—
¥1,451
March 31, 2007
Gross unrealized
(Millionsofyen)
Other securities ............................................................................................
Debt securities .............................................................................................
Other .............................................................................................................
Total ..........................................................................................................
Market value (carrying value)
¥2,517
–
–
¥2,517
Loss
¥(153)
–
–
¥(153)
Gain
¥918
–
–
¥918
Cost
¥1,753
–
–
¥1,753
March 31
(Millionsofyen)
March31,2008
Gross unrealized
(ThousandsofU.S.dollars)
Other securities ............................................................................................
Debt securities .............................................................................................
Other .............................................................................................................
Total ..........................................................................................................
Market value (carrying value)
$15,877
–
–
$15,877
Loss
$(1,330)
–
–
$(1,330)
Gain
$2,715
–
–
$2,715
Cost
$14,492
–
–
$14,492
Other securities sold for the years ended March 31, 2008, 2007 and 2006 are as follows:
2008
¥27
0
(5)
Year ended March 31
At March 31, 2008 and 2007, the carrying value of the securities classified as other securities for which market quotation were unavailable
were as follows:
(Millionsofyen)
Other securities
Unlisted equity securities ...............................................................................................
March 31
5.Impairmentlossonfixedassets
The Company has recognized impairment loss of ¥364 million ($3,641 thousand), ¥113 million, and ¥1,335 million for the following group of
assets as of March 31, 2008, 2007 and 2006 respectively:
Impairment loss
Location
Use
Category
2008 2007 2006 2008 (Millionsofyen) (Thousandsof U.S.dollars)
Ninohe county, Iwate Others
Land and buildings ¥059 —
—
$592 prefecture and others
Moerfelden, Germany Office Land ¥305 — — $3,048
Others Others Land and intangible assets — ¥ 113 ¥ 153 —
Gunma office in Logistic Land and buildings and —
—
¥01,181
— Japan warehouse structures
2008(ThousandsofU.S.dollars)
$154,672
20,398
95,749
$270,820
2007
¥16,234
2,813
10,558
¥29,606
2008
¥15,496
2,043
9,593
¥27,133
2008(ThousandsofU.S.dollars)
$271
8
(57)
2006
¥2,430
1,373
(0)
2007
¥128
50
—
2008(ThousandsofU.S.dollars)
$641
2007
¥69
2008
¥64
4.U.S.dollaramounts
U.S. dollar amounts stated in the consolidated financial statements
are included solely for convenience of readers outside Japan. The
rate of ¥100.19 = US$1, the approximate rate of exchange as of
March 31, 2008, has been used in translation. These translations
should not be construed as representations that the Japanese yen
This change was made because it has been genellary required
to make an accrual for compensation for directors based on
“Accounting Standard for Directors’ Bonus” issued by the
Accounting Standards Board of Japan and is in line with the
release dated April 13, 2007 of the Japanese Institute of Certified
Public Accountants Audit and Assurance Practice Committee
Report No.42, “Reserve for Executive Retirement Benefit”.
As a result of this change, operating income and income before
income taxes and minority interests for the year ended March 31,
2008 decreased by ¥89 million ($896 thousand) and ¥367 million
($3,669 thousand), respectively, computed with those would have
been recorded under the previous method.
amounts actually represent, or have been or could be converted
into U.S. dollars. The amounts presented in thousands of U.S.
dollars are truncated for amounts less than 1 thousand. Totals may
not be added up exactly because of such truncation.
(Millionsofyen)
Sales amount ............................................................................................
Total gain on sales ....................................................................................
Total loss on sales ....................................................................................

24 2524 25
These forward foreign exchange contracts were entered into for
hedging purposes. Unrealized gains and losses from these con-
tracts are recognized in earnings. Forward foreign exchange con-
tracts to which hedge accounting is applied are excluded from the
above table.
Forward foreign exchange contracts:
Selling
U.S. dollar ...................................................................................................................
Euro.............................................................................................................................
Singapore dollar .........................................................................................................
Buying
U.S. dollar ...................................................................................................................
Euro.............................................................................................................................
British pound ..............................................................................................................
Total unrealized loss from forward foreign currency exchange contracts .........................
Unrealized gain/(loss)
¥ 9
(57)
(3)
3
4
1
¥(41)
Fair value
¥4,527
4,637
341
803
785
231
Contract amount
¥4,536
4,580
337
800
780
229
March 31, 2007
(Millionsofyen)
Forward foreign exchange contracts:
Selling
U.S. dollar ...................................................................................................................
Euro.............................................................................................................................
Buying
U.S. dollar ...................................................................................................................
Euro.............................................................................................................................
British pound ..............................................................................................................
Total unrealized gain from forward foreign currency exchange contracts .........................
Unrealized gain
$1,117
3
73
6
13
$1,214
Fair value
$22,175
56,639
7,444
867
1,987
Contract amount
$23,293
56,642
7,370
861
1,974
March31,2008
(ThousandsofU.S.dollars)
9.Short-termandlong-termloans
Short-term and long-term loans as of March 31, 2008 and 2007 consisted of the following:
Short-term loans ................................................................................................................
Current portion of long-term loans ...................................................................................
Total short-term loans ....................................................................................................
Long-term loans .................................................................................................................
Total ............................................................................................................................
March 31
(Millionsofyen)
The weighted-average rates for short-term loans, current portion of long-term loans and long-term loans as of March 31, 2008 were 1.60%,
1.49% and 1.26%, respectively.
The maturity of long-term loans from banks and insurance companies is as follows:
Year ending March 31 (Millionsofyen) (ThousandsofU.S.dollars)
2009 ¥10,242 $102,231
2010 12,044 120,217
2011 7,046 70,332
2012 49 490
2013 51 510
Forward foreign exchange contracts:
Selling
U.S. dollar ...................................................................................................................
Euro.............................................................................................................................
Buying
U.S. dollar ...................................................................................................................
Euro.............................................................................................................................
British pound ..............................................................................................................
Total unrealized gain from forward foreign currency exchange contracts .........................
Unrealized gain
¥111
0
7
0
1
¥121
Fair value
¥2,221
5,674
745
86
199
Contract amount
¥2,333
5,675
738
86
197
March31,2008
(Millionsofyen)
8.Fairvaluesofderivativefinancialinstruments
The Company enters into forward foreign currency exchange con-
tracts to manage market risks relating to fluctuations in the foreign
currency exchange rates. The Company does not hold or issue
financial instruments for trading purposes. The listed contract
amount and fair values as of March 31, 2008 and 2007 were as fol-
lows:2008
(ThousandsofU.S.dollars)
$131,086
102,231
233,317
194,259
$427,577
2007
¥15,440
3,247
18,687
22,795
¥41,483
2008
¥13,133
10,242
23,376
19,462
¥42,838
As of March 31, 2008 and 2007, assets pledged as collateral for short-term and long-term loans are as follows:
Buildings and structures, net .............................................................................................
Machinery and equipment, net ..........................................................................................
Land ...................................................................................................................................
Total ................................................................................................................................
March 31
(Millionsofyen)
There was no such pledged as a guarantee as of March 31, 2008 in spite the Company was pledged time deposits of ¥7 million as a guaran-
tee as of March 31, 2007.
Secured loans as of March 31, 2008 and 2007 are as follows:
Short-term loans ................................................................................................................
Long-term loans .................................................................................................................
Total ................................................................................................................................
March 31
(Millionsofyen)
2008(ThousandsofU.S.dollars)
$4,975
293
1,090
$6,360
2007
¥627
46
128
¥802
2008
¥498
29
109
¥637
2008(ThousandsofU.S.dollars)
$425
4,620
$5,045
2007
¥047
595
¥643
2008
¥42
462
¥505
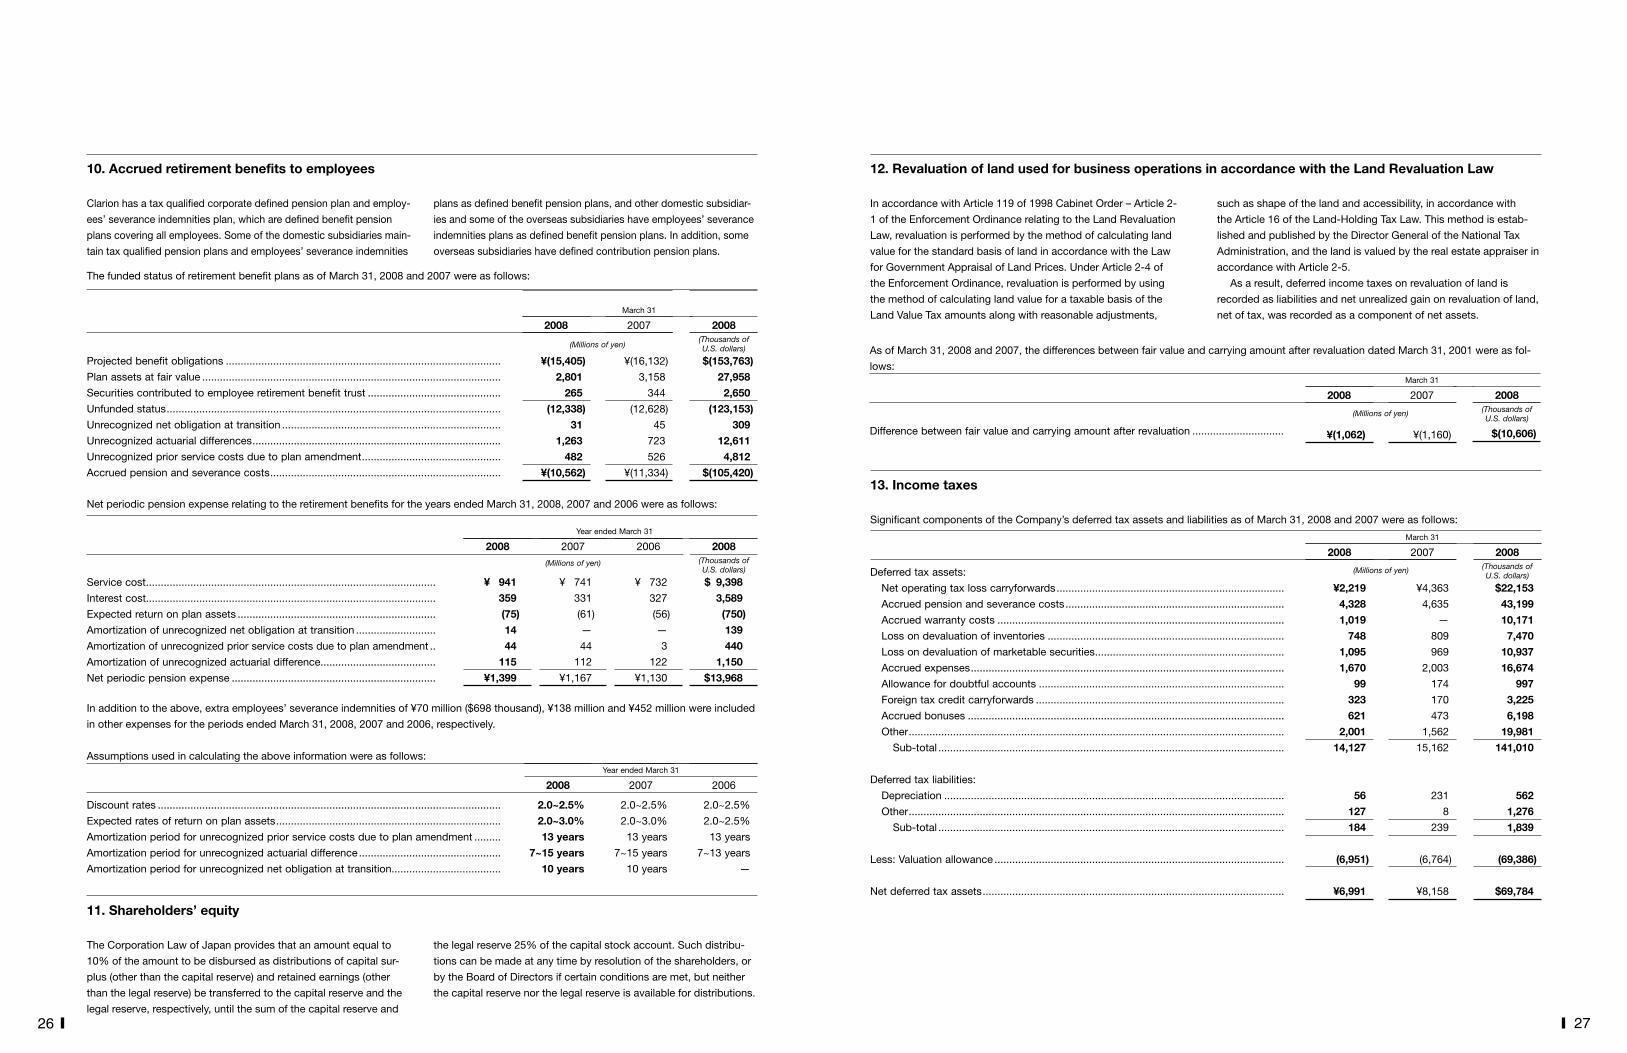
26 2726 27
10.Accruedretirementbenefitstoemployees
Clarion has a tax qualified corporate defined pension plan and employ-
ees’ severance indemnities plan, which are defined benefit pension
plans covering all employees. Some of the domestic subsidiaries main-
tain tax qualified pension plans and employees’ severance indemnities
plans as defined benefit pension plans, and other domestic subsidiar-
ies and some of the overseas subsidiaries have employees’ severance
indemnities plans as defined benefit pension plans. In addition, some
overseas subsidiaries have defined contribution pension plans.
Projected benefit obligations .............................................................................................
Plan assets at fair value .....................................................................................................
Securities contributed to employee retirement benefit trust .............................................
Unfunded status .................................................................................................................
Unrecognized net obligation at transition ..........................................................................
Unrecognized actuarial differences ....................................................................................
Unrecognized prior service costs due to plan amendment ...............................................
Accrued pension and severance costs ..............................................................................
March 31
(Millionsofyen)
Net periodic pension expense relating to the retirement benefits for the years ended March 31, 2008, 2007 and 2006 were as follows:
Service cost ..................................................................................................
Interest cost..................................................................................................
Expected return on plan assets ...................................................................
Amortization of unrecognized net obligation at transition ...........................
Amortization of unrecognized prior service costs due to plan amendment ..
Amortization of unrecognized actuarial difference.......................................
Net periodic pension expense .....................................................................
Year ended March 31
(Millionsofyen)
In addition to the above, extra employees’ severance indemnities of ¥70 million ($698 thousand), ¥138 million and ¥452 million were included
in other expenses for the periods ended March 31, 2008, 2007 and 2006, respectively.
Assumptions used in calculating the above information were as follows:
Discount rates ....................................................................................................................
Expected rates of return on plan assets ............................................................................
Amortization period for unrecognized prior service costs due to plan amendment .........
Amortization period for unrecognized actuarial difference ................................................
Amortization period for unrecognized net obligation at transition.....................................
2006
2.0~2.5%
2.0~2.5%
13 years
7~13 years
—
2007
2.0~2.5%
2.0~3.0%
13 years
7~15 years
10 years
2008
2.0~2.5%
2.0~3.0%
13years
7~15years
10years
Year ended March 31
12.RevaluationoflandusedforbusinessoperationsinaccordancewiththeLandRevaluationLaw
In accordance with Article 119 of 1998 Cabinet Order – Article 2-
1 of the Enforcement Ordinance relating to the Land Revaluation
Law, revaluation is performed by the method of calculating land
value for the standard basis of land in accordance with the Law
for Government Appraisal of Land Prices. Under Article 2-4 of
the Enforcement Ordinance, revaluation is performed by using
the method of calculating land value for a taxable basis of the
Land Value Tax amounts along with reasonable adjustments,
such as shape of the land and accessibility, in accordance with
the Article 16 of the Land-Holding Tax Law. This method is estab-
lished and published by the Director General of the National Tax
Administration, and the land is valued by the real estate appraiser in
accordance with Article 2-5.
As a result, deferred income taxes on revaluation of land is
recorded as liabilities and net unrealized gain on revaluation of land,
net of tax, was recorded as a component of net assets.
Difference between fair value and carrying amount after revaluation ...............................
The funded status of retirement benefit plans as of March 31, 2008 and 2007 were as follows:
As of March 31, 2008 and 2007, the differences between fair value and carrying amount after revaluation dated March 31, 2001 were as fol-
lows:
2008
¥0,941
359
(75)
14
44
115
¥1,399
2008(ThousandsofU.S.dollars)
$9,398
3,589
(750)
139
440
1,150
$13,968
2006
¥0,732
327
(56)
—
3
122
¥1,130
2007
¥0,741
331
(61)
—
44
112
¥1,167
2008(ThousandsofU.S.dollars)
$(10,606)
2007
¥(1,160)
2008
¥(1,062)
March 31
(Millionsofyen)
2008(ThousandsofU.S.dollars)
$(153,763)
27,958
2,650
(123,153)
309
12,611
4,812
$(105,420)
2007
¥(16,132)
3,158
344
(12,628)
45
723
526
¥(11,334)
2008
¥(15,405)
2,801
265
(12,338)
31
1,263
482
¥(10,562)13.Incometaxes
Significant components of the Company’s deferred tax assets and liabilities as of March 31, 2008 and 2007 were as follows:
Deferred tax assets:
Net operating tax loss carryforwards .............................................................................
Accrued pension and severance costs ..........................................................................
Accrued warranty costs .................................................................................................
Loss on devaluation of inventories ................................................................................
Loss on devaluation of marketable securities ................................................................
Accrued expenses ..........................................................................................................
Allowance for doubtful accounts ...................................................................................
Foreign tax credit carryforwards ....................................................................................
Accrued bonuses ...........................................................................................................
Other ...............................................................................................................................
Sub-total .....................................................................................................................
Deferred tax liabilities:
Depreciation ...................................................................................................................
Other ...............................................................................................................................
Sub-total .....................................................................................................................
Less: Valuation allowance ..................................................................................................
Net deferred tax assets ......................................................................................................
March 31
(Millionsofyen)
2008(ThousandsofU.S.dollars)
$22,153
43,199
10,171
7,470
10,937
16,674
997
3,225
6,198
19,981
141,010
562
1,276
1,839
(69,386)
$69,784
2007
¥4,363
4,635
—
809
969
2,003
174
170
473
1,562
15,162
231
8
239
(6,764)
¥8,158
2008
¥2,219
4,328
1,019
748
1,095
1,670
99
323
621
2,001
14,127
56
127
184
(6,951)
¥6,991
11.Shareholders’equity
The Corporation Law of Japan provides that an amount equal to
10% of the amount to be disbursed as distributions of capital sur-
plus (other than the capital reserve) and retained earnings (other
than the legal reserve) be transferred to the capital reserve and the
legal reserve, respectively, until the sum of the capital reserve and
the legal reserve 25% of the capital stock account. Such distribu-
tions can be made at any time by resolution of the shareholders, or
by the Board of Directors if certain conditions are met, but neither
the capital reserve nor the legal reserve is available for distributions.

28 2928 29
The differences between the Company’s statutory income tax rate and effective income tax rates reflected in the consolidated statements of
operations were reconciled as follows:
Statutory income tax rate ..........................................................................................................................
Permanent differences ..............................................................................................................................
Fixed levy of local inhabitant taxes ...........................................................................................................
Valuation allowance ...................................................................................................................................
Variance of effective tax rate between Clarion and the subsidiaries ........................................................
Amortization of goodwill............................................................................................................................
Foreign income tax credit .........................................................................................................................
Reversal of net unrealized gain on revaluation of land .............................................................................
Other ..........................................................................................................................................................
Effective income tax rates .........................................................................................................................
2007
40.7%
31.7
24.3
539.6
(61.7)
—
(11.8)
—
(3.4)
559.4%
2008
40.7%
13.0
1.0
8.6
(1.3)
8.9
(2.9)
1.9
(2.4)
67.5%
March 31
14.Researchanddevelopmentexpenses
Research and development expenses included in selling, general and administrative expenses for the years ended March 31, 2008, 2007 and
2006 totaled ¥2,255 million ($22,517 thousand), ¥975 million and ¥710 million, respectively.
16.Leases
The Company, as a lessee, charges periodic lease payments for
finance leases which do not transfer ownership of the leased prop-
erty to the lessee to expense on payment. Such payments for the
years ended March 31, 2008, 2007 and 2006 were ¥1,542 million
($15,391 thousand), ¥1,587 million and ¥1,757 million, respectively.
The amount of outstanding future lease payments for finance
leases as of March 31, 2008 and 2007, excluding the interest
thereon, are summarized as follows:
Future lease payments:
Due within one year ........................................................................................................
Due after one year ..........................................................................................................
Total ............................................................................................................................
March 31
(Millionsofyen)
2008(ThousandsofU.S.dollars)
$12,554
22,520
$35,075
2007
¥1,291
2,098
¥3,389
2008
¥1,257
2,256
¥3,514
15.Cashflowinformation
Reconciliations between cash and cash equivalents and cash on hand and in bank as of March 31, 2008 and 2007 were as follows:
Cash on hand and in banks ...............................................................................................
Deposits with original maturities of more than three months ............................................
Cash and cash equivalents ................................................................................................
March 31
(Millionsofyen)
2008(ThousandsofU.S.dollars)
$125,847
(446)
$125,400
2007
¥10,746
(54)
¥10,691
2008
¥12,608
(44)
¥12,563
The following is a summary of the assets acquired, the liabilities assumed, goodwill and net cash payment in connection with the acquisition
of common stock of XanaviInformaticsCorp.(“Xanavi”):
Current assets ......................................................................................................................................................................
Fixed assets .........................................................................................................................................................................
Goodwill ................................................................................................................................................................................
Current liabilities ...................................................................................................................................................................
Non current liabilities ............................................................................................................................................................
Acquisition costs of Xanavi ..................................................................................................................................................
Cash and cash equivalents acquired ...................................................................................................................................
Net cash payment for the acquisition ..............................................................................................................................
Year endedMarch 31, 2007
(Millionsofyen)
¥ 21,007
2,865
8,566
(17,526)
(822)
14,090
(373)
¥ 13,716
Due within one year ........................................................................................................
Due after one year ..........................................................................................................
Total ............................................................................................................................
March 31
(Millionsofyen)
17.Commitmentsandcontingencies
There was no such contingencies as of March 31, 2008 in spite that the Company was contingently liable for transfer of notes receivables
due to factoring, amounting to ¥333 million as of March 31, 2007.
Future lease obligations for non-cancelable operating leases at March 31, 2008 and 2007 follow:
2008(ThousandsofU.S.dollars)
$ 3,466
7,747
$11,214
2007
¥1,397
1,063
¥1,460
2008
¥ 347
776
¥1,123
Acquisition cost ..................................................................................................................
Accumulated depreciation .................................................................................................
Net book value ...................................................................................................................
Depreciation expense.........................................................................................................
Interest expense .................................................................................................................
March 31
(Millionsofyen)
Depreciation is calculated based on the straight-line method over
the lease term of the assets with no residual value. Interest expense
on leased assets is calculated as the difference between the total
lease payments and the assumed acquisition cost for the asset and
is allocated over the lease term using the effective interest method.
2008(ThousandsofU.S.dollars)
$64,881
(36,416)
$28,464
$13,786
$ 1,450
2007
¥6,674
(3,891)
¥2,782
¥1,474
¥0 104
2008
¥6,500
(3,648)
¥2,851
¥1,381
¥ 145
Pro forma information as of and for the years ended March 31, 2008 and 2007 relating to acquisition cost, accumulated depreciation,
depreciation expense and interest expense for property held under finance leases which do not transfer ownership of the leased property to
the lessee if finance lease accounting had been applied to finance leases currently accounted for as operating leases are as follows:

30 3130 31
Net sales..................................................................
Operating expenses ................................................
Operating income ...................................................
Total assets .............................................................
Depreciation ............................................................
Impairment loss .......................................................
Capital expenditures ...............................................
Consolidated total
¥246,806
241,340
¥ 5,465
¥150,841
¥ 7,092
¥364
¥ 11,255
Elimination and corporate
¥—
—
¥—
¥(12,063)
¥—
¥—
¥—
Other
¥20,551
20,156
¥ 395
¥14,392
¥ 196
¥ 3
¥ 294
YearendedMarch31,2008
(Millionsofyen)
Special equipment
¥8,732
7,992
¥739
¥5,447
¥ 230
¥ 10
¥ 444
Car audio- visual equipment
¥217,522
213,191
¥ 4,330
¥143,065
¥ 6,665
¥ 351
¥10,516
Net sales..................................................................
Operating expenses ................................................
Operating income ...................................................
Total assets .............................................................
Depreciation ............................................................
Impairment loss .......................................................
Capital expenditures ...............................................
Consolidated total
¥181,041
177,968
¥003,072
¥149,490
¥006,149
¥00 113
¥0 9,511
Elimination and corporate
¥00,0,—
—
¥00,0,—
¥(12,836)
¥000 —
¥ 113
¥000 —
Other
¥ 11,422
11,202
¥ 00,220
¥ 12,964
¥0 0127
¥ 0,0—
¥ ,0224
Year ended March 31, 2007
(Millionsofyen)
Special equipment
¥7,833
6,628
¥1,204
¥5,305
¥ 204
¥ —
¥0,386
Car audio- visual equipment
¥161,786
160,138
¥001,648
¥144,056
¥005,817
¥0 0—
¥ 8,900
Net sales..................................................................
Operating expenses ................................................
Operating income ...................................................
Total assets .............................................................
Depreciation ............................................................
Impairment loss .......................................................
Capital expenditures ...............................................
Consolidated total
¥184,176
178,948
¥005,228
¥122,119
¥005,591
¥001,335
¥012,320
Elimination and corporate
¥00,0,—
—
¥00,0,—
¥(15,270)
¥00,0,—
¥00,0,—
¥00,0,—
Other
¥07,183
6,984
¥00,199
¥10,569
¥00,039
¥00 —
¥000 74
Year ended March 31, 2006
(Millionsofyen)
Special equipment
¥8,306
6,855
¥1,451
¥5,880
¥0,178
¥0, 56
¥ 517
Car audio- visual equipment
¥168,686
165,108
¥0 3,578
¥120,939
¥005,373
¥001,278
¥011,728
Net sales..................................................................
Operating expenses ................................................
Operating income ...................................................
Total assets .............................................................
Depreciation ............................................................
Impairment loss .......................................................
Capital expenditures ...............................................
Consolidated total
$2,463,380
2,408,826
$ 54,553
$1,505,554
$ 70,789
$ 3,641
$ 112,345
Elimination and corporate
$0,00,0 —
—
$0,00,0 —
$(120,408)
$0,00,0 —
$0,00,0 —
$0,00,0 —
Other
$205,125
201,178
$ 3,947
$143,651
$ 1,985
$ 31
$ 2,939
YearendedMarch31,2008
(ThousandsofU.S.dollars)
Special equipment
$87,155
79,776
$7,379
$54,367
$02,301
$ 106
$ 4,435
Car audio- visual equipment
$2,171,098
2,127,871
$ 43,227
$1,427,944
$ 66,530
$3,503
$0104,970
18.Segmentinformation
(1) Information by business segment
The Company operates principally in three business segments.
(a) Car audio-visual equipment: Car navigation system, Car audios,
Car multimedia equipments, and peripheral devices
(b) Special equipment: Audio and visual equipment for public
transportation, Bus location system, and CCD (Charged-Coupled
Devices) surrounding view cameras
(c) Other: SS (Spread Spectrum) wireless communication
equipment, Mobile-phone, EMS (Electronics Manufacturing Service)
business, and other
Sales to outside customers .......
Inter-segment sales .....................
Total sales ................................
Operating expenses ....................
Operating income ........................
Total assets .................................
Consolidated total
¥181,041
—
181,041
177,968
¥003,072
¥149,490
Elimination and corporate
¥(000,—
(89,890)
(89,890)
(90,080)
¥000189
¥(47,766)
Europe (*3)
¥23,663
284
23,948
23,947
¥000 01
¥14,883
Year ended March 31, 2007
(Millionsofyen)
Asia and Australia (*2)
¥14,475
48,130
62,605
62,134
¥00,470
¥20,757
Americas (*1)
¥49,537
1,051
50,588
49,453
¥01,135
¥25,908
Japan
¥093,365
40,424
133,789
132,513
¥001,275
¥135,707
Sales to outside customers .......
Inter-segment sales .....................
Total sales ................................
Operating expenses ....................
Operating income/(loss) ..............
Total assets .................................
Consolidated total
¥184,176
—
184,176
178,948
¥005,228
¥122,119
Elimination and corporate
¥(00,0—
(92,683)
(92,683)
(92,681)
¥(000, (1)
¥(47,575)
Europe (*3)
¥25,877
250
26,128
26,482
¥00(354)
¥15,063
Year ended March 31, 2006
(Millionsofyen)
Asia and Australia (*2)
¥15,063
50,228
65,292
64,563
¥00,728
¥21,771
Americas (*1)
¥43,725
1,024
44,749
43,692
¥01,057
¥20,575
Japan
¥099,511
41,179
140,690
136,892
¥003,798
¥112,284
Corporate assets included in “Elimination and corporate” mainly
consist of investments in securities. Such investments in securities
for the years ended March 31, 2008, 2007 and 2006 were ¥289
million ($2,885 thousand), ¥492 million and ¥1,392 million,
respectively.
As described in 3-(1), Clarion and its domestic subsidiaries
have changed their depreciation method of property, plant and
equipment. The total effect of this change and another change
described in 2-(7) on the operating results of each segment
compared with those would have been recorded under the previous
method was as follows: For car audio-visual equipment business,
operating expenses increased by ¥213 million ($2,128 thousand),
and operating income decreased by the same amount. As well, ¥9
million ($92 thousand) of effect was given for special equipment
business and ¥2 million ($27 thousand) of effect for other business.
As described in 3-(2), Clarion has changed its method of
accounting for warranty costs. The effect of this change on the
operating results of each segment compared with those would have
been recorded under the previous method was as follows: For car
audio-visual equipment business, operating expenses increased by
¥54 million ($543 thousand), and operating income decreased by
the same amount. As well, ¥3 million ($35 thousand) of effect was
given for special equipment business.
As described in 3-(3), Clarion has changed its method of
accounting for retirement benefit for directors and corporate
auditors. The effect of this change on the operating results of each
segment compared with those would have been recorded under the
previous method was as follows: For car audio-visual equipment
business, operating expenses increased by ¥84 million ($841
thousand), and operating income decreased by the same amount.
As well, ¥5 million ($55 thousand) of effect was given for special
equipment business.
Sales to outside customers ........
Inter-segment sales .....................
Total sales ................................
Operating expenses ....................
Operating income ........................
Total assets .................................
Consolidated total
¥246,806
—
246,806
241,340
¥ 5,465
¥150,841
Elimination and corporate
¥(000,—
(79,271)
(79,271)
(78,861)
¥ (410)
¥(44,795)
Europe (*3)
¥27,340
357
27,697
27,550
¥ 147
¥15,582
YearendedMarch31,2008
(Millionsofyen)
Asia and Australia (*2)
¥12,952
39,791
52,744
52,277
¥ 466
¥22,809
Americas (*1)
¥55,497
1,257
56,755
55,659
¥ 1,096
¥21,570
Japan
¥151,015
37,864
188,880
184,714
¥ 4,165
¥135,674
(2) Information by geographic segment
Sales of the Company classified by geographic area for the years ended March 31, 2008, 2007 and 2006, respectively, are summarized as follows:

32 3332 33
Sales to outside customers ........
Inter-segment sales .....................
Total sales ................................
Operating expenses ....................
Operating income ........................
Total assets .................................
Notes:(*1) Americas: U.S.A., Canada, Mexico and Brazil(*2) Asia and Australia: People’s Republic of China, Taiwan R.O.C., Singapore, Malaysia, Philippines and Australia(*3) Europe: Germany, U.K., Spain, France and Hungary
Consolidated total
$2,463,380
—
2,463,380
2,408,826
$ 54,553
$1,505,554
Elimination and corporate
$000,0(—
(791,211)
(791,211)
(787,119)
$ (4,092)
$(447,102)
Europe (*3)
$272,884
3,567
276,452
274,981
$ 1,471
$155,526
YearendedMarch31,2008
(ThousandsofU.S.dollars)
Asia and Australia (*2)
$129,280
397,160
526,440
521,786
$ 4,654
$227,662
Americas (*1)
$553,925
12,554
566,480
555,535
$ 10,944
$215,300
Japan
$1,507,289
377,929
1,885,218
1,843,642
$ 41,575
$1,354,167
(3) Overseas sales
Overseas sales, which include export sales of Clarion and its domestic consolidated subsidiaries and sales (other than exports to Japan) of
the foreign consolidated subsidiaries, for the years ended March 31, 2008, 2007 and 2006 are as follows:
Overseas sales:
Americas (*1).............................................................................................
Europe (*2) ................................................................................................
Other (*3) ..................................................................................................
Consolidated net sales .................................................................................
Ratio .............................................................................................................
Notes:(*1) Americas: U.S.A., Canada, Mexico, Brazil and Venezuela(*2) Europe: Germany, U.K., Spain and France(*3) Other: Australia, People’s Republic of China, the Republic of Korea, Taiwan R.O.C., Singapore and Malaysia
Year ended March 31
(Millionsofyen)
As described in 3-(2), Clarion has changed its method of
accounting for warranty costs. As a result of this change, operat-
ing expenses of the Japan segment increased by ¥58 million ($578
thousand), and operating income decreased by the same amount
compared with those would have been recorded under the previous
method.
As described in 3-(3), Clarion has changed its method of
accounting for retirement benefit for directors and corporate audi-
tors. As a result of this change, operating expenses of the Japan
segment increased by ¥89 million ($896 thousand) and operating
income decreased by the same amount compared with those would
have been recorded under the previous method.
2008
¥055,871
37,141
14,414
107,428
¥246,806
43.5%
2008(ThousandsofU.S.dollars)
$0,557,656
370,711
143,875
1,072,243
$2,463,380
43.5%
2006
¥043,701
25,874
15,431
85,007
¥184,176
46.2%
2007
¥049,357
23,668
16,268
89,295
¥181,041
49.3%
19.Analysisofselling,generalandadministrativeexpenses
An analysis of selling, general and administrative expenses for the years ended March 31, 2008, 2007 and 2006 are as follows:
Payroll costs .................................................................................................
Provision for bonuses...................................................................................
Pension expenses ........................................................................................
Freight out ....................................................................................................
Provision for retirement benefit for directors and corporate auditors .........
Other .............................................................................................................
Total ..........................................................................................................
Year ended March 31
(Millionsofyen)
2008
¥9,971
578
562
4,157
107
20,903
¥36,281
2008(ThousandsofU.S.dollars)
$99,527
5,772
5,611
41,500
1,077
208,641
$362,131
2006
¥ 9,108
293
496
4,340
—
17,585
¥31,824
2007
¥ 9,394
261
516
3,859
—
15,736
¥29,768
20.Transactionswithrelatedparties
As the result of TOB on Company’s common stocks, as of December 7, 2006, Hitachi, Ltd. became a parent company.
Category
Parent Company
Name
Hitachi, Ltd.
Ownership of voting Rights/%
Hitachi: 64.02%
Relationship
Loans from Hitachi’s pooling system
Description of transaction
Borrowing of fund........................
Borrowing of fund........................
(Millionsofyen)
¥ (5,349)
¥07,000
(ThousandsofU.S.dollars)
$ (53,389)
$069,867
Amount of transaction Subject
Short-term loans .........................
Long-term loans ..........................
(Millionsofyen)
¥6,707
¥7,000
(ThousandsofU.S.dollars)
$66,948
$69,867
Balance at the end of period
Year ended March 31, 2008:
Category
Parent Company
Name
Hitachi, Ltd.
Ownership of voting Rights/%
Hitachi: 64.02%
Relationship
Loans from Hitachi’s pooling system
Description of transaction
Borrowing of fund........................
Acquisition of shares of
subsidiary ..................................
(Millionsofyen)
¥14,000
¥14,000
Amount of transaction Subject
Short-term loans .........................
(Millionsofyen)
¥12,056
Balance at the end of period
Year ended March 31, 2007:
Corporate assets included in “Elimination and corporate” mainly
consist of investments in securities. Such investments in securities
for the years ended March 31, 2008, 2007 and 2006 were ¥289 mil-
lion ($2,885 thousand), ¥492 million and ¥1,392 million, respectively.
As described in 3-(1), Clarion and its domestic subsidiaries have
changed their depreciation method of property, plant and equip-
ment. The total effect of this change and another change described
in 2-(7) on the operating results of the segments compared with
those would have been recorded under the previous method was as
follows: For the Japan segment, operating expenses increased by
¥225 million ($2,248 thousand), and operating income decreased by
the same amount.
Short-term loans were made under the Hitachi’s pooling system and the transaction amount shown above represents the decrease in the
short-term loan balance as of March 31, 2008 compared with that as of March 31, 2007.
The Company has participated in the Hitachi’s pooling system since December 2006.

34 3534 35
21.Amountspershare
Net income per share for the years ended March 31, 2008, 2007 and 2006 and net assets per share as of March 31, 2008 and 2007 are as
follows:
Net income/(loss) per share:
Basic .................................................................................................
Diluted ...............................................................................................
Year ended March 31
(Yen)
2008
(U.S.dollars)
$0.05
—
2006
¥20.76
—
2007
¥ (2.78)
—
2008
¥4.88
—
Net assets per share ......................................................................................................
March 31
(Yen)
2008
(U.S.dollars)
$1.12
2007
¥120.56
2008
¥113.12
Diluted net income per share is not disclosed because Clarion had no potentially dilutive shares.
22.Subsequentevent
The following appropriation of retained earnings of Clarion, which has not been reflected in the accompanying consolidated financial state-
ments for the year ended March 31, 2008, was approved at an ordinary general meeting of shareholders held on June 25, 2008:
Year-end cash dividends
(¥2.00=U.S.$0.02 per share) ....................................................................................................................
(Thousandsof
U.S.dollars)
$5,634
(Millionsofyen)
¥ 564
35

36
Corporate Data
Company Name:Headquarters & Technology Center
Registered Head Office:
Established:Paid-in Capital:Number of Shares Outstanding:Stock Exchange ListingNumber of Shareholders:Number of Employees:
Main Products
■ Company Profile (as of March 31, 2008)
Clarion Co., Ltd.7-2 Shintoshin, Chuo-ku, Saitama-shi, Saitama330-0081, JapanTEL: (81) 48-601-37005-35-2 Hakusan, Bunkyo-ku, Tokyo, 112-8608, JapanTEL: (81) 3-3815-1121December 1940¥26,100 million282,744,000 sharesTokyo Stock Exchange, First Section (Ticker Code: 6796)15,66811,186 (consolidated)1,081 (non-consolidated)Car navigation systems, car audio systems, in-vehicle cameras, visual equipment, bus equipment, communications equipment
Director and PresidentDirectors
Corporate Auditors
* Outside director** Outside auditor
■ Board of Directors and Corporate Auditors
Tatsuhiko IzumiYutaka WakamoriTetsuro YoshimineYasuhiko WadaOsamu NumataToyoji AidaMinoru Tsukada*Yasuhiko Honda*Masatsugu Shinozaki*Masayuki KawaharaKatsutoshi TakizawaYasuhiro Sasai**Shunjiro Karasawa**Yuji Yuasa**
Executive Corporate Officers
Corporate Officers
■ Corporate Officers
Yutaka WakamoriTetsuro YoshimineYasuhiko WadaOsamu NumataShoichi MinagawaSeishi KasaiTsuneo HayashiHidetoshi KawamotoToyoji AidaToshiharu OsakaShiro OhashiHiroyuki NomuraShoji NakajimaNobuyuki OyachiTatsuo Enokida
■ Principal Subsidiaries (as of June 25, 2008)
<Domestic>Xanavi Informatics CorporationClarion Associe Co., Ltd.Clarion Sales Co., Ltd.Clarion Manufacturing “Protech” Co., Ltd.
<Overseas>Clarion Corporation of AmericaElectronica Clarion, S.A. de C.V.Clarion Europa GmbHClarion Europe S.A.S.Clarion Hungary Electronics Kft.Clarion (H.K.) Industries Co., Ltd.Clarion Manufacturing Corporation of the Philippines
(as of June 25, 2008) (as of June 25, 2008)