ANNUAL REPORT 2005 - Renata Limited
46
ANNUAL REPORT 2005 Report and Financial Statements for the year ended 31 December 2005
Transcript of ANNUAL REPORT 2005 - Renata Limited

ANNUAL REPORT
2005
Report and Financial Statements for the year ended 31 December 2005

Directors’ Report TO THE MEMBERS The Directors of the Company are pleased to present their Report together with the Audited Accounts of the Company for the year ended December 31, 2005. BUSINESS ACTIVITIES Turnover during 2005 was Taka 1,608.6 million registering a growth of 19% over last year’s turnover of Taka 1,351.8 million. Profit after tax was Taka 192.6 million – a growth of 32%. Earnings per Share (EPS) stood at Taka.287.66 against Taka 260.79 of 2004. The following formulations were introduced during the year 2005: Pharmaceutical Products 1. Algin 5mg Injection 10. Trucef 100mg Tablet 2. Algin 50mg FC Tablet 11. Trucef 200mg Tablet 3. Becosules Capsule 12. Trucef DPS 4. Ceclofen 100mg Tablet 13. Trucef 5. Flontin Suspention 14. Valzide 160 mg +12.5 mg. Tablet 6. Levoking 250mg Tablet 15. Valzide 80 mg +12.5mg Tablet 7. Levoking 500 mg Tablet 16. Relexid 200mg Tablet 8. Orcef 200 mg Tablet 9. Orcef 400 mg Tablet
FINANCIAL RESULTS
The Directors take pleasure in reporting the following financial results of the Company for the year 2005:
2005 2004 2003 Taka Taka Taka
Profit before tax 279,387,690 208,308,833 150,434,885 Less: Provision for tax 86,819,430 62,820,892 44,873,677 Net Profit after tax 192,568,260 145,487,941 105,561,208 Add: Un-appropriated profit brought forward 313,458,030 216,734,815 152,689,300 Profit available for appropriation 506,026,290 362,222,756 258,250,508
APPROPRATION RECOMMENDED: Tax holiday reserve 2,197,657 6,924,906 6,649,168 Dividend proposed: a) Cash dividend @ Taka 50/- per Share b) Stock dividend (Bonus Share) in the ratio of one bonus share for every five (1:5) Shares held
33,471,850 13,388,740
27,893,200 11,157,280
23,244,350 9,297,740
46,860,590 39,050,480 32,542,090 Dividend distribution tax @ 10% of cash dividend - 2,769,320 2,324,435 Balance Un-appropriated profit carried forward 456,968,043 313,478,050 216,734,815 506,026,290 362,222,756 258,250,505

DIVIDEND While there is reasonable profit available for distribution, the investment pipeline is also rich. Hence the Directors deem it necessary to retain adequate funds to finance the capital expenditures for capacity building to sustain the growth of the company. The Board of Directors is pleased to recommend a cash dividend of Taka 50 per ordinary share of Taka 100. This dividend will entail a payment of Taka 33,471,850. The Board of Directors also recommend for declaration of Stock Dividend (Bonus Shares) in the ratio of one Bonus Share for every five shares held (1:5) for which an amount of Taka 13,388,740 will have to be transferred to Share Capital Account. The appropriation, if approved by the shareholders at the Annual General Meeting of the Company, will absorb Taka 46,860,590. CONTRIBUTION TO NATIONAL EXCHEQUER During the year under review your Company paid Taka 380 million to the National Exchequer in the form of Corporate Income Tax, Dividend distribution Tax, Import Duties and Value Added Tax (VAT) DIRECTORS The Directors retiring by rotation under Articles 109, 115 and 116 of the Articles of Association of the Company are Mr. S H. Kabir, Dr. Sarwar Ali and Mr. Md. Ziaul Haque Khondker who, being eligible, offer themselves for re-election. AUDITORS The Company’s Auditors Messrs Rahman Rahman Huq Chartered Accountants retire at the thirty third Annual General Meeting and being eligible offer themselves for reappointment as Auditors for the year 2006 with re-fixation of their remuneration. CAPITAL EXPENDITURE The following capital expenditure made by the Company during the year amounted to Tk.145 million.
Taka in MillionsFreehold Land 3.74 Plant and Machinery 15.03 Office Equipment, Furniture & Fixtures 2.85 Hormone Plant 123.38 145.00
The entire investment was made from internally generated funds. CONSOLIDATION OF ACCOUNTS The Company is consistently following the code of International Accounting Standard as adopted by the Institute of Chartered Accountants of Bangladesh. According to Bangladesh Accounting Standard-27, (BAS-27) the Company has presented all the relevant consolidated financial statements with those of its subsidiaries.

ADDITIONAL STATEMENTS: as per SEC order no. SEC/CMRRCD/2006-158/Admin/02-08 dated 20th February 2006. The Directors are pleased to recount on the following additional statements in respect of Report prepared under section 184 of the companies Act 1994.
a) The financial statements prepared by the management of the Company for the year 2005 present fairly its state of affairs, the results of its operations, cash flows and changes in equity.
b) Proper books of accounts have been maintained by the company as required by applicable
Laws, Rules and Standard. c) Appropriate accounting policies have been consistently applied in preparation of the financial
statements and that accounting estimates are based on reasonable and prudent judgments. d) In preparation of the financial statement, the International Accounting Standard, as
applicable in Bangladesh has been followed and there has been no departure from the policies.
e) The system of internal control and internal check are in effect and monitored properly. f) The company has sound and strong operational strengths to continue as a going concern. As
such, there is no doubt of its continuity. g) There is no unusual deviation from last year in operating results to address. h) The key operating and financial data for preceding five years have been shown in the
Financial Highlights. i) The Directors, have recommended a dividend of TK. 50 per share of TK. 100 each and Stock
dividend (bonus share) in the ratio of one share for every 5 (five) shares are held (1:5).
j) During the year four Board Meeting were held and attendance by each Director are given below :
Name Meetings Attended
Mr. Syed Humayan Kabir Chairman of the Board 4 (Four) Mr. Syed S. Kaiser Kabir Managing Director 4 (Four) Mr. Sajida Humayan Kabir Director 4 (Four) Dr. Sarwar Ali Director 4 (Four) Mr. Md. Ziaul Haque Khondker Director 2 {Two) Mr. A. Hasanat Khan Director 4 (Four)
k) The pattern of Shareholding
(i) Parent/ subsidiary/ associated companies: The Shareholding information as of 31st December 2005 and other related information are
set out in note- 4.

(ii) Directors:
1. Mr. Syed Humayun Kabir 296 Shares 2. Mr. Syed S. Kaiser Kabir 720 Shares 3. Mr. Sajida Humayun Kabir 0 4. Dr. Sarwar Ali 38 Shares 5. Mr. Md. Ziaul Haque Khondker 0 6. Mr. A. Hasanat Khan 0
Chief Financial Officer & Company Secretary: Mr. Md. Shafiul Alam 1,202 Shares
(iii) Executives:
1. Mr. M. Alamgir Hossain 149 Shares 2. Mr. Nurul Islam 15 Shares
(iv) Shareholders holding 10% or more voting interest:
1. Sajida Foundation 341,412 Shares
2. Business Research International Corp. 169,548 Shares 3. ICB Unit Fund & First ICB Mutual Fund 68,782 Shares
STATUS OF COMPLAINACE Status of compliance as stated in SEC Order No. SEC/CMRRCD/2006-158/Admin/02-08 dated 20th February 2006 is annexed.
PERSONNEL The Directors record their appreciation for the contribution made by the employees to the operation of the Company.
ACKNOWLEDGEMENT: The Board wishes to thank the Shareholders, Officials of the Drug Administration and other Government officials, Doctors, Chemists, Medical Institutions, Bankers, the Securities and Exchange Commission, the Dhaka Stock Exchange Limited and all well-wishers for their continued support. By the grace of the Almighty, the Directors look forward to a bright future for the Company. On behalf of the Board of Directors
Syed S. Kaiser Kabir Managing Director April 30, 2006

Director’s Report We created a new Company named Purnava in August 2004 to explore the prospects of entering into Fast Moving Consumer Goods (FMCG). However, since then we have decided to focus on our core business. Hence, Purnava at present has no commercial activities. On behalf of the Board of Directors
Syed S. Kaiser Kabir Chairman
Auditors’ Reportto
the shareholdersof
Renata Limited
We have audited the accompanying balance sheet of the Renata Limited as of 31 December 2005 and therelated profit and loss account, statement of changes in equity and cash flow statement for the year thenended. We have also examined the attached consolidated balance sheet, profit and loss account, statementof changes in equity and cash flow statement of Renata Limited and its subsidiaries viz Renata AgroIndustries Limited and Purnava Limited (collectivelyreferred to as "Renata group") as of 31 December2005. These financial statements are the responsibilityof the company’s management. Our responsibilityisto express an independent opinion on these financial statements based on our audit.
We conducted our audit in accordance with Bangladesh Standards on Auditing. Those standards requirethat we plan and perform the audit to obtain reasonable assurance about whether the financial statementsare free of material misstatement. An audit includes examining, on a test basis, evidence supporting theamounts and disclosures in the financial statements. An audit also includes assessing the accountingprinciples used and significant estimates made by management, as well as evaluating the overall financialstatement presentation. We believe that our audit provides a reasonable basis for our opinion.
The financial statements of the company's subsidiaries - Renata Agro Industries Limited and PurnavaLimited, whose financial statements reflect total assets of Tk 187,000,022 and Tk 2,500,000 respectivelyas at 31 December 2005 and total revenue of Renata Agro Industries Limited of Tk 176,361,544 for theyear then ended. These financial statements have been audited by other auditors whose reports have beenfurnished to us and our opinion, in so far as it relates to the amounts included in respect of the company'ssubsidiaries, is based solely on the reports of the other auditors.
In our opinion, the financial statements of the company and the consolidated financial statements, drawnup on the consideration of the separate audit reports of the subsidiariesas at 31 December 2005, preparedin accordance with Bangladesh Accounting Standards, give a true and fair view of the state of the companyand of its subsidiaries, and the results of their operations and cash flows for the year then ended whichcomply with the Companies Act 1994, the Securities and Exchange Rules 1987 and other applicablelawsand regulations.
We also report that:
a) we have obtained all the information and explanations which to the best of our knowledge andbelief were necessary for the purposes of our audit and made due verification thereof;
b) in our opinion, proper books of account as required by law have been kept by the company so far asit appeared from our examination of these books;
c) the company's balance sheet and profit and loss account dealt with by the report are in agreementwith the books of account; and
d) the expenditure incurred was for the purposes of the company's business.
Dhaka, 30 April 2006
1

Renata LimitedBalance Sheet as at 31 December 2005
2005 2004Sources of fund Notes Taka Taka
Shareholders' equity:Share capital 4 66,943,700 55,786,400 Proposed bonus shares 13,388,700 11,157,300 Revaluation surplus 5 156,482,355 156,774,863 Tax holiday reserve 46,862,514 44,664,857 Unappropriated profit 6 456,968,084 313,458,030
740,645,353 581,841,450
Deferred liability - staff gratuity 7 60,324,000 52,822,000 Deferred tax liability 8 55,975,450 57,663,916
856,944,803 692,327,366
Applications of fund
Property, plant and equipment: 9At cost/revaluation 619,228,840 597,325,841 Less: Accumulated depreciation 219,989,057 194,770,823
399,239,783 402,555,018
Capital work in-progress 10 139,891,546 10,683,181
Investment at cost 11 63,070,376 63,070,376
Current assets:Stocks and stores 12 388,384,007 361,664,208 Debtors 13 162,224,078 112,899,272 Advances, deposits and prepayments 14 32,294,635 28,141,978 Cash and bank balances 15 89,452,557 70,710,981
672,355,277 573,416,439 Less: Current liabilities:
Creditors of goods 16,645,268 3,653,923 Accrued expenses 65,951,508 39,594,897 Other finance 16 27,154,025 19,658,040 Short term bank loans 17 192,425,445 206,014,979 Provision for taxation 18 80,483,330 56,807,350 Unclaimed dividend 1,480,753 985,939 Proposed cash dividend 33,471,850 27,893,200 Dividend distribution tax - 2,789,320
417,612,179 357,397,648 Net current assets 254,743,098 216,018,791
856,944,803 692,327,366
The accompanying notes 1 to 35 form an integral part of these financial statements.
_________________ _________________ _________________Managing Director Director Company Secretary
As per our annexed report of same date.
____________________Dhaka, 30 April 2006 Auditors
2

Renata Limited
Profit and Loss Account for the year ended 31 December 2005
2005 2004Non-taxholiday Tax holiday
Notes Unit 1 & 2 Unit 3 Total TotalSchedule-A
Taka Taka Taka Taka
Turnover 19 1,535,985,743 72,570,096 1,608,555,839 1,351,797,184 Cost of goods sold 20 (772,535,952) (56,661,484) (829,197,436) (697,413,608) Gross profit 763,449,791 15,908,612 779,358,403 654,383,576 Other income 21 16,957,354 - 16,957,354 7,676,622
780,407,145 15,908,612 796,315,757 662,060,198 Operating expenses:
Administrative, selling and distribution expenses 22 (478,827,482) (529,600) (479,357,082) (417,069,271)
Operating profit 301,579,663 15,379,012 316,958,675 244,990,927 Non-operating expenses (net) 23 (22,826,562) (1,090,000) (23,916,562) (26,266,652)
278,753,101 14,289,012 293,042,113 218,724,275 Contribution to WPPF (12,973,993) (680,430) (13,654,423) (10,415,442) Profit before tax 265,779,108 13,608,582 279,387,690 208,308,833 Tax expenses: Current tax 18 (85,567,896) (2,596,622) (88,164,518) (59,322,757) Deferred tax 1,345,089 - 1,345,089 (3,498,135)
(84,222,807) (2,596,622) (86,819,429) (62,820,892) Profit after tax 181,556,301 11,011,960 192,568,261 145,487,941
Unappropriated profit brought forward 313,458,030 216,734,815 Profit available for appropriation 506,026,291 362,222,756 Appropriation: Tax holiday reserve (2,197,657) (6,924,906) Proposed bonus shares (1 share for 5 shares held) (13,388,700) (11,157,300) Proposed cash dividend (Tk 50 per share) (33,471,850) (27,893,200) Dividend distribution tax - (2,789,320)
(49,058,207) (48,764,726) Unappropriated profit carried forward 456,968,084 313,458,030
Basic earnings per share (par value Tk 100) - Note 24 287.66 260.79
The accompanying notes 1 to 35 form an integral part of these financial statements.
__________________ _________________ _______________________Managing Director Director Company Secretary
As per our annexed report of same date.
____________________Dhaka, 30 April 2006 Auditors
4

Renata Limited
Statement of changes in equity for the year ended 31 December 2005
Share Proposed Revaluation Tax holiday Unappropriatedcapital bonus shares surplus reserve profit TotalTaka Taka Taka Taka Taka Taka
Balance at 31 December 2003 46,488,700 9,297,740 157,410,748 37,739,951 216,734,815 467,671,954
Bonus shares issued 9,297,700 (9,297,700) - - - - Depreciation adjustment on revaluation surplus - - (635,885) - - (635,885) Deferred tax on revaluation surplus - - - - - - Net profit after tax for the year - - - - 145,487,941 145,487,941 Tax holiday reserve - - - 6,924,906 (6,924,906) - Proposed bonus shares - 11,157,300 - - (11,157,300) - Proposed cash dividend - (40) - - (27,893,200) (27,893,240) Dividend distribution tax - - - - (2,789,320) (2,789,320)
Balance at 31 December 2004 55,786,400 11,157,300 156,774,863 44,664,857 313,458,030 581,841,450
Bonus shares 11,157,300 (11,157,300) - - - - Deferred tax on revaluation surplus 343,377 343,377 Depreciation adjustment on revaluation surplus - - (635,885) - - (635,885) Net profit after tax for the year - - - - 192,568,261 192,568,261 Tax holiday reserve - - - 2,197,657 (2,197,657) - Proposed bonus shares - 13,388,700 - - (13,388,700) - Proposed cash dividend - - - - (33,471,850) (33,471,850) Balance at 31 December 2005 66,943,700 13,388,700 156,482,355 46,862,514 456,968,084 740,645,353
6

Renata Limited
Cash flow statement for the year ended 31 December 2005
2005 2004Taka Taka
A. Cash flows from operating activities:
Collection from customers and other income 1,836,005,683 1,563,365,046 Payment of VAT (243,974,768) (207,944,797) Payment to suppliers and employees (1,292,169,955) (1,189,842,753) Cash generated from operation 299,860,960 165,577,496
Financing cost (23,916,562) (26,417,268) Payment of tax (64,488,538) (48,129,584) Net cash from operating activities 211,455,860 91,030,644
B. Cash flows from investing activities:
Purchase of property, plant and equipment (151,986,364) (89,370,581) Investment in shares - (2,499,900) Sale proceeds of property, plant and equipment 260,000 269,375 Net cash used in investing activities (151,726,364) (91,601,106)
C. Cash flows from financing activities:
Medium term loan repaid - (10,000,000) Dividend paid (27,398,386) (23,081,044) Net cash from financing activities (27,398,386) (33,081,044)
D. Net cash outflows for the year (A+B+C) 32,331,110 (33,651,506)
E. Opening cash and cash equivalents (135,303,998) (101,652,492)
F. Closing cash and cash equivalents (D+E) (Note 25) (102,972,888) (135,303,998)
8

Renata Limited
Notes to the financial statements for the year ended 31 December 2005
1 Introduction
2 Nature of business
3 Accounting policies
3.1 Basis of accounting
3.2 Consolidation procedure
3.3 Taxation
The company qualifies as a “Publicly Traded Company” and accordingly the rate of income tax applied forthe year is 30% with applicable rebate on dividend declared. The applicable tax rate will be confirmed bythe Finance Act 2006.
Renata Limited is a public limited company incorporated in Bangladesh under the Companies Act 1913 withan authorised capital of Tk 100,000,000 divided into 1,000,000 ordinary shares of Tk 100 each out of whichpaid up capital is Tk 66,943,700 divided into 669,437 ordinary shares of Tk 100 each. The shares of thecompany are publicly traded on the floor of Dhaka Stock Exchange Limited.
The company manufactures and sells various pharmaceutical, animal health, animal nutritional, oral salineand other medical products in the local and foreign markets.
The financial statements have been prepared under the historical cost convention as modified to includerevaluation of certain fixed assets. These financial statements have been prepared in accordance withapplicable Bangladesh Accounting Standards issued by the Institute of Chartered Accountants of Bangladeshand where relevant with presentational requirements of the law.
The company prepared consolidated financial statements for 2005 applying Bangladesh Accounting Standard27. Figures used in the consolidated financial statements are based on the audited financial statements ofRenata Agro Industries Ltd. and Purnava Limited audited by other firm of auditors.
10

3.3.1 Deferred tax
3.3.2 Tax holiday units
3.4 Property, plant and equipment and depreciation
Building 33.3 yearsMachinery and equipment 5 - 20 yearsAutomobiles and trucks 4 yearsOffice equipment 8 - 10 yearsFurniture and fixtures 20 years
3.5 Investment
The company recognises deferred tax in accordance with the provision of BAS 12. Deferred tax arises due totemporary difference deductible or taxable for the events or transaction recognised in the profit and lossaccount resulting in deferred tax asset or deferred tax liability. A temporary difference is the differencebetween the tax base of an asset or liability and its carrying amount/reported amount in the financialstatement. Deferred tax asset or liability is the amount of income tax payable or recoverable in futureperiod(s) recognised in the current period. The deferred tax asset/income or liability/expenses does notcreate a legal liability/recoverability to and from the income tax authority. This is recognised for bookpurpose as equalisation item presented in the financial statements to show the retained earnings as aconsistent reflection of the business events.
Property, plant and equipment are stated at cost or revaluation less accumulated depreciation. Freehold landand buildings were revalued during the year ended 31 December 1995 by a firm of professional valuers.
Gains and losses on disposal or retirement of assets are credited or charged to the results of operation.
The tax holiday period on unit 3 (ORS unit project) expired on May 2005. As such the operating results ofunit 3 is entitled to five months tax holiday from 1 January to 31 May 2005. The operating results ofremaining seven months from 1 June to 31 December 2005 is taxable.
Investments are classified as long term assets as these are intended to be held for more than one year fromthe balance sheet date and are stated at cost.
Depreciation is charged on all other fixed assets on straight-line basis and over the following periods exceptfreehold:
11

3.6 Stocks
3.7 Trade and other receivables
3.8 Provisions
3.9 Cash and cash equivalents
3.10 Provision for gratuity
3.11 Revenue recognition
3.12 Foreign currency
A provision is recognised in the balance sheet when the company has a present obligation (legal orconstructive) as a result of a past event, it is probable that an outflow of economic benefits will be requiredto settle the obligation and a reliable estimate can be made of the amount of the obligation.
Transactions in foreign currencies are translated to Bangladesh Taka at the foreign exchange rate ruling atthe date of the transaction. Monetary assets and liabilities denominated in foreign currencies at the balancesheet date are translated to Bangladesh Taka at the foreign exchange rate ruling at that date. Foreignexchange differences arising on translation are recognised in the profit and loss account.
Turnover comprises of sales recognised on the basis of invoices raised and goods delivered. Revenue fromsale of goods is recognised in the profit and loss account when significant risk and reward of ownership havebeen transferred to the buyer.
Cost of work-in-progress and finished stocks are arrived at by using FIFO cost formula including allocationof manufacturing overheads related to bringing the inventories to their present condition. The company usesstandard cost method for measurement of cost of finished goods.
Cost of active materials, raw materials and packing materials are valued at by using FIFO formula.
Trade and other receivables are stated net of provisions for amounts estimated to be doubtful of recovery.
Cash and cash equivalents consist of cash and bank balances. For the purpose of the presenting cash flowstatement, cash and cash equivalents are presented net of bank overdrafts.
The company operates an unfunded gratuity scheme, provision for which is made annually covering all itspermanent employees as per gratuity rules of the company.
Stocks are valued at lower of cost and net realisable value except for goods in transits which are valued atcost.
12

4 Share capital 2005 2004Taka Taka
Authorised:1,000,000 Ordinary shares of Taka 100 each 100,000,000 100,000,000
Issued, subscribed and paid up:129,426 Ordinary shares of Taka 100 each issued for cash 12,942,600 12,942,600
172,449 Ordinary shares of Taka 100 each 17,244,900 17,244,900 issued for consideration other than cash
367,562 Ordinary shares (2004: 255,989) of Taka 100 each issued as fully paid bonus shares 36,756,200 25,598,900
669,437 66,943,700 55,786,400
At 31 December 2005 share holding position of the company was as follows:
Number of % of totalshares Face value holding
TakaSajida Foundation 341,412 34,141,200 51.00Business Research International Corp. Inc. 169,548 16,954,800 25.33ICB Unit Fund 64,216 6,421,600 9.60First ICB Mutual Fund 4,566 456,600 0.68Shadharan Bima Corporation 29,289 2,928,900 4.37Other local shareholders 60,406 6,040,600 9.02
669,437 66,943,700 100.00
Classification of shareholders by holdings:2005 2004
Number % of total % of totalHoldings of holders holdings holdingsLess than 500 shares 962 6.03 7.13 501 to 5,000 shares 24 3.67 3.27 5,001 to 10,000 shares - - - 10,001 to 20,000 shares - - - 20,001 to 30,000 shares 1 4.37 4.37 30,001 to 40,000 shares - - - 40,001 to 50,000 shares - - 8.90 50,001 to 100,000 shares 1 9.60 - 100,001 to 1,000,000 shares 2 76.33 76.33 Over 1,000,000 shares - - -
990 100.00 100.00
4.1 Share holding position in Renata Agro Industries Limited
2005 2004Number of Face value % of total Number of % of total
shares Taka holding shares holdingGroup company:
Renata Limited 419,949 41,994,900 99.99% 419,949 99.99%
Minority/outside group company:Mr. Syed S. Kaiser Kabir 51 5,100 0.01% 51 0.01%
420,000 42,000,000 100.00% 420,000 100.00%
4.2 Share holding position in Purnava Limited
Group company:Renata Limited 24,999 2,499,900 99.996% 24,999 99.996%
Minority/outside group company:Mr. Syed S. Kaiser Kabir 1 100 0.004% 1 0.004%
25,000 2,500,000 100.000% 25,000 100.00%
The shares are listed in the Dhaka Stock Exchange Limited and quoted at Tk 3,000.00 per share at 31 December 2005
13

5 Revaluation surplus
2005 2004Taka Taka
Land 179,132,078 179,132,078 Building 35,863,198 36,499,083
214,995,276 215,631,161
Less: Depreciation charged during the year on revaluation of building (Note 9) 635,885 635,885 214,359,391 214,995,276
Less: Adjustment of deferred tax thereon (Note 8) 57,877,036 58,220,413 156,482,355 156,774,863
6 Unappropriated profit
7 Deferred liability - staff gratuity
Opening balance 52,822,000 47,180,850 Add: Provision made during the year 15,211,973 14,774,069
68,033,973 61,954,919 Less: Paid during the year 7,709,973 9,132,919 Closing balance 60,324,000 52,822,000
The unappropriated profit includes 90% of accumulated pre-tax profit on sale of property, plant and equipment upto 1992amounting to Taka 2,033,135 which is considered to be not distributable to the shareholders as per directive of BangladeshBank (central bank). Since 1993, the requirement to create such reserve on profit from sale of property, plant and equipmenthas been withdrawn.
The company operates an unfunded gratuity scheme for its employees. Provision for gratuity is charged to profits annually tocover obligations under the scheme on the basis of estimate made by the management of the company to maintain fullprovision at the balance sheet date. The break-up of accumulated provision for gratuity is as follows:
The freehold land and buildings have been revalued from an effective date of 31 December 1995 by professional valuers andresulting increase in value of Tk 220,423,329 has been shown as revaluation surplus. The breakup of revaluation is asfollows:
14

8 Deferred tax liability
2005 2004Taka Taka
Opening balance 57,663,916 54,165,781 Provision made during the year for deferred tax expense (1,345,089) 3,498,135
56,318,827 57,663,916
Deferred tax on revaluation surplus (343,377) - Closing balance 55,975,450 57,663,916
Carrying Taxable/amount on (deductible)
balance sheet temporary date Tax base differenceTaka Taka Taka
At 31 December 2005
Property, plant and equipment (excluding land):At cost less accumulated depreciation 160,764,770 99,827,807 60,936,963 Revaluation surplus 214,359,391 - 214,359,391
375,124,161 99,827,807 275,296,354
Provision for staff gratuity (net of payment) (60,324,000) - (60,324,000)Provision for doubtful debts (7,655,877) - (7,655,877)Net temporary difference 207,316,477 Applicable tax rate 27%Deferred tax liability/(asset) 55,975,450
At 31 December 2004
At cost less accumulated depreciation 157,154,389 98,101,728 59,052,661 Revaluation surplus 214,995,276 - 214,995,276
372,149,665 98,101,728 274,047,937 Provision for staff gratuity (net of payment)Provision for doubtful debts (52,822,000) - (52,822,000)Temporary difference (7,655,877) - (7,655,877)Applicable tax rate 213,570,060 Deferred tax liability/(asset) 27%
57,663,916
Deferred tax liability recognized in accordance with the provision of BAS 12, is arrived as follows:
Property, plant and equipment(excluding land on taxable units):
15

9 Property, plant and equipment
Cost/revaluations DepreciationDisposal/ Disposal/ Written
Particulars At Additions adjustment At Rate At Charge adjustment At down value at1 January during during 31 December 1 January during during 31 December 31 December
2005 the year the year 2005 2005 the year the year 2005 2005Taka Taka Taka Taka % Taka Taka Taka Taka Taka
Freehold land: At cost 20,374,222 3,741,400 - 24,115,622 - - - - 24,115,622 On revaluation 179,132,078 - 179,132,078 - - - - 179,132,078
199,506,300 3,741,400 - 203,247,700 - - - - - 203,247,700
Building: At cost 24,403,248 - - 24,403,248 1.33 - 4 13,090,336 625,685 - 13,716,021 10,687,227 On revaluation 41,291,251 - - 41,291,251 1.33 - 4 5,428,053 635,885 - 6,063,938 35,227,313
65,694,499 - - 65,694,499 18,518,389 1,261,570 - 19,779,959 45,914,540
Plant and machinery 254,721,371 15,027,281 - 269,748,652 5 - 20 126,965,212 19,201,677 - 146,166,889 123,581,763 Automobile and trucks 31,106,070 - 875,000 30,231,070 25 28,416,366 1,901,211 875,000 29,442,577 788,493 Office equipments 34,152,650 2,850,388 - 37,003,038 10 - 12.5 16,321,480 3,193,637 - 19,515,117 17,487,921 Furniture and fixture 12,144,951 1,158,930 - 13,303,881 5 4,549,376 535,139 - 5,084,515 8,219,366 Total 2005 597,325,841 22,777,999 875,000 619,228,840 194,770,823 26,093,234 875,000 219,989,057 399,239,783
Total 2004 520,473,441 78,687,400 1,835,000 597,325,841 173,470,984 22,913,964 1,614,125 194,770,823 402,555,018
9.1 Value of fully depreciated assets included in property, plant and equipment are as follows:
CostTaka
Building 3,547,076 Plant and machinery 84,666,288 Automobile and trucks 26,709,100 Office equipments 8,901,461 Furniture and fixture 2,138,244
125,962,169
9.2 The land of the company measuring 12 acres of freehold land is located at Mirpur, Dhaka and 9 feet above highest flood level recorded in 1988. Out of 12 acres of land, 4.75 acresare secured against short-term bank loans by registered mortgage.
9.3 Depreciation for the year charged to:Taka
Cost of goods sold - Non-tax holiday units 1&2 (Note 20.1) 18,450,181 Cost of goods sold - Tax holiday unit 3 (Note 20.1) 2,207,689
20,657,870 Operating expenses (Note 22) 4,799,479 Revaluation surplus (Note 5) - 635,885
26,093,234
9.4 The freehold land and buildings were revalued by a firm of professional valuers in the year 1995 and the increase in net carrying amount as a result of revaluation were shown asadditions/revaluations on that year.
16

9.5 Sale of property, plant and equipment
Original Accumulated Net book Sale Profit/ Mode ofParticulars cost depreciation value proceeds (loss) disposal Purchaser
Taka Taka Taka Taka Taka
Automobiles:
Toyota Hiace 1300cc 495,000 495,000 - 210,000 210,000 Tender Mr. MD. Tofazzel Hossain Model - 1995 Chowdhury, Sylhet
380,000 380,000 - 50,000 50,000 Company Mr. Kh. Mahbubul Haque policy
875,000 875,000 - 260,000 260,000
Toyota Covered Van 1300cc Model - 1999
17

10 Capital work in-progress2005 2004
Opening Balance 10,683,181 - Add : Addition during the year 151,986,364 89,371,581
162,669,545 89,371,581 Less : Capitalised as property, plant and equipment 22,777,999 78,688,400
139,891,546 10,683,181
11 Investment at cost
2005 2004Share No. ofholding shares Value Value
% Taka Taka
99.99 419,949 60,570,476 60,570,476 Purnava Limited 99.99 24,999 2,499,900 2,499,900
444,948 63,070,376 63,070,376
12 Stocks and stores
Finished goods - Pharmaceutical (unit 1) 101,704,293 95,032,422 - Premix (unit 2) 45,599,357 28,381,433 - ORS (unit 3) 368,503 -
147,672,153 123,413,855
Work-in-progress 30,969,925 41,357,063 Raw materials 43,854,358 45,296,587 Bulk materials 57,374,479 42,518,779 Packing materials 36,050,187 37,126,621 Raw and packaging materials Premix (unit 2) 20,504,506 24,182,598 Raw and packaging materials ORS (unit 3) 3,535,233 10,154,881 Consumable stores and spares 4,811,398 4,368,571 Stock in transit 43,611,768 33,245,253
388,384,007 361,664,208
All stocks, present and future, are secured against short term bank loans (Note 17).
This represents mainly constraction of building of hormon plant, installation of plant and machinery, theircomponants and other fixed assets procured from foreign and local vendors.
This represents investmentin share capital of Renata Agro Industries Limited and Purnava Limited. Renata Limited,being the group company, is the owner of 99.99% shares in both the companies.
Renata Agro Industries Limited
19

13 Debtors
Trade debtors-unsecuired (Notes 13.1) 101,844,274 74,661,231 Less: Provision for doubtful debts 7,655,877 7,655,877 Trade debtors considered good 94,188,397 67,005,354
Sundry debtors - unsecured considered good 46,704,475 26,836,515 Value Added Tax (VAT) recoverable 21,331,206 19,057,403
162,224,078 112,899,272
All present and future debtors are secured against short term bank loans (Note 17).
13.1 Trade debtors
Debts due over six months 65,394,079 35,987,231 Debts due below six months 36,450,195 38,674,000
101,844,274 74,661,231
20

14 Advances, deposits and prepayments
Advances: For inventories 1,667,295 - To employees 13,793,746 13,477,464
15,461,041 13,477,464 Deposits and prepayments: Security deposits 4,697,271 4,335,446 Prepaid expenses 12,136,323 10,329,068
16,833,594 14,664,514 32,294,635 28,141,978
Advance to employees 2,547,066 2,673,068 Prepaid expenses 2,802,981 4,083,030
5,350,047 6,756,098
a)
b)
15 Cash and bank balances
Cash in hand 440,000 465,000 Cash at banks in current accounts 89,012,557 70,245,981
89,452,557 70,710,981
16 Other finance
Workers' profit participation fund 23,359,428 16,390,665 Others 3,794,597 3,267,375
27,154,025 19,658,040
17 Short term bank loansLimit 2005 2004Taka Taka Taka
Overdraft accounts with:Eastern Bank Limited, Dhaka 145,000,000 22,232,370 16,452,768
The Hongkong Shanghai Corporation Ltd., Dhaka 210,000,000 70,427,568 100,471,583 Standard Chartered Bank, Dhaka 192,500,000 89,588,131 89,090,628 Citibank N.A 120,000,000 10,177,376 -
667,500,000 192,425,445 206,014,979
Security
The following amount included in advances and pre-payments are due for repayment after twelve months from thedate of balance sheet.
No amount was due by the Directors (including Managing Director) or associated undertakings.
Advance to employees includesTk 11,271,321 and Tk 11,540,491 due from the officers at 31 December 2005and 2004 respectively.
21

i)
ii)
iii)
Others:Not availed of
Total facilities at balanceavailable sheet date
Taka Taka
Letters of credit 450,000,000 295,021,774
18 Provision for taxation
Opening balance 56,807,350 45,614,177 Add: Provision for current year 88,164,518 59,322,757
144,971,868 104,936,934 Less: Tax paid during the year 64,488,538 48,129,584 Closing balance 80,483,330 56,807,350
First charge over all present and future plant and machinery of Renata Limited jointly as above.
Equitable mortgage over land and building thereon, of the factory premises of Renata Limited at Mirpurmeasuring 4.75 acres approximately as above
(including 180 days revolving time loan for import finance)
First charge over all present and future stocks and book debts of Renata Limited jointly with Eastern BankLimited, The Hongking Shanghai Banking Corporation Limited, Citibank N.A and Standard Chartered Bankunder pari-passu security sharing agreement.
22

19 Turnover 2005 2004Gross Turnover Turnover
Turnover Less: VAT (net) (net)Taka Taka Taka Taka
Non-tax holiday (unit 1, 2 ):Pharmaceutical products (unit-1) 1,355,250,498 187,118,988 1,168,131,510 966,241,945 Animal health products (unit-1) 264,613,512 39,088,179 225,525,333 191,114,083 Animal nutritional products ( unit 2 ) 142,328,900 - 142,328,900 114,072,960
1,762,192,910 226,207,167 1,535,985,743 1,271,428,988 Tax holiday (Unit 3) - ORS:
Tax holiday period: January to May 2005 42,146,820 8,149,196 33,997,624 80,368,196 Non tax holiday period: June to December 2005 48,190,877 9,618,405 38,572,472 -
90,337,697 17,767,601 72,570,096 80,368,196 1,852,530,607 243,974,768 1,608,555,839 1,351,797,184
19.1
19.2
Figures in thousand
Opening Production/ Closing TurnoverMajor product group Unit stocks purchases Less: Sales stocks (net)
Sterile dry fill (injectable) Vials 1,720 5,190 5,843 1,067 159,095 Sterile liquid fill (injectable) Vials & Ampoules 712 4,891 4,663 940 113,922 Ointments and eye/ear drops Tube 160 1,264 1,292 132 18,786 Capsules and tablets Capsule & Tablet 45,750 384,234 372,324 57,660 746,458 Oral liquid and dry syrup Bottle 1,046 6,582 6,047 1,581 178,922 Rabipur Vaccine Vials 9.220 349.527 342.806 15.941 118,567 Premix - Animal nutrition Kg 202 4,989 5,026 165 150,096 - Animal nutrition Sachets 141 549 520 170 50,140 Oral saline Sachets - 43,744 43,471 273 72,570
Taka '000 123,414 700,810 829,198 147,672 1,608,556
During the year sale of pharmaceutical products includes export sale of Tk 25,021,893 equivalent to US$ 389,989.20
Item-wise production/purchases and sale of 350 finished goods formulations consisting of pharmaceutical products, animal health products, premixfeed supplement and other medical products in various forms viz capsules, tablets, vials, ampoules, dry and liquid syrup, ointments, sachets, etc. arestated below by major product group and their total value:
25

20 Cost of goods sold 2004Non-tax holiday Tax holiday
Unit-1 & 2 Unit-3 Total TotalTaka Taka Taka Taka
Opening stock of finished goods 123,413,855 - 123,413,855 120,017,839 Add: Cost of goods manufactured (Note 20.1) 693,627,108 57,029,987 750,657,095 637,740,113 Cost of finished goods purchased 102,798,639 - 102,798,639 63,069,511
919,839,602 57,029,987 976,869,589 820,827,463
Less: Closing stock of finished goods 147,303,650 368,503 147,672,153 123,413,855 772,535,952 56,661,484 829,197,436 697,413,608
20.1 Cost of goods manufactured
Cost of materials:Opening work-in-process 41,357,063 - 41,357,063 19,435,139 Add: Cost of raw materials consumed (Note 20.2) 537,042,817 53,032,693 590,075,510 521,925,363
578,399,880 53,032,693 631,432,573 541,360,502 Less: Closing work-in-process 30,969,925 - 30,969,925 41,357,063 Total cost of materials 547,429,955 53,032,693 600,462,648 500,003,439
Manufacturing overhead:Salaries, wages and other benefits 68,844,771 556,562 69,401,333 56,165,990 Company's contribution to provident fund 791,547 8,520 800,067 680,937 Net periodic cost for gratuity 3,763,684 13,846 3,777,530 8,156,000 Electricity and fuel 10,765,128 881,541 11,646,669 11,795,388 Consumable stores,supplies and manufacturing expenses 11,691,613 59,340 11,750,953 11,317,178 Insurance 1,233,596 48,550 1,282,146 1,279,324 Land revenue and taxes 537,923 10,810 548,733 377,663 Rental and leases 377,015 - 377,015 377,487 Automobile expenses 1,777,083 - 1,777,083 1,988,328 Postage and telephone 671,289 14,252 685,541 617,622 Printing and stationery 944,650 8,412 953,062 814,135 Uniform to workers 1,578,995 48,397 1,627,392 2,166,722 Travelling, moving and entertainment 5,055,128 - 5,055,128 5,336,639 Repair and maintenance 8,293,527 17,846 8,311,373 9,861,246 Lunch, snacks and tea expenses 10,735,789 121,529 10,857,318 10,053,672 Depreciation 18,450,181 2,207,689 20,657,870 16,357,531 Other overhead expenses 685,234 - 685,234 390,812
146,197,153 3,997,294 150,194,447 137,736,674 Total cost of goods manufactured 693,627,108 57,029,987 750,657,095 637,740,113
20.2 Cost of raw materials consumed
Opening stock 149,124,585 10,154,881 159,279,466 101,874,382 Add: Purchase 545,701,762 46,413,045 592,114,807 579,330,447
694,826,347 56,567,926 751,394,273 681,204,829
Less: Closing stock (Note 20.3) 157,783,530 3,535,233 161,318,763 159,279,466 537,042,817 53,032,693 590,075,510 521,925,363
2005
26

20.3
Opening ClosingMajor material group stocks Purchases Consumtion stocks
Taka Taka Taka Taka
Active materials 42,518,779 293,657,361 278,801,661 57,374,479 Raw materials 45,296,587 70,929,915 72,372,144 43,854,358 Packaging materials 37,126,621 108,314,789 109,391,223 36,050,187 Premix - Raw and packaging materials 24,182,598 72,799,697 76,477,789 20,504,506
149,124,585 545,701,762 537,042,817 157,783,530
ORS (Tax holiday unit 3) 10,154,881 46,413,045 53,032,693 3,535,233 159,279,466 592,114,807 590,075,510 161,318,763
Consumable stores 2,265,310 2,517,827 1,170,000 3,613,137 Maintenance stores and spares 2,103,261 - 905,000 1,198,261
4,368,571 2,517,827 2,075,000 4,811,398 163,648,037 594,632,634 592,150,510 166,130,161
20.4 Summarised quantity of purchases, issues and stocks of raw materials
Active materials:Opening Closing
Major product group Unit stocks Purchases Issues stocks
Local KG/KGA 1,412 16,536 15,490 2,458 Imported KG/KGA/BU 13,871 94,909 93,473 15,307
Taka 42,518,779 293,657,361 278,801,661 57,374,479
Procurement of Active materials consist of 95 items of which 94% of the total value are imported during the year.
Raw materialsOpening Closing
Major product group Unit stocks Purchases Issues stocks
Excepients KG 21,028 136,446 75,398 82,076 Colour KG 356 300 274 382 Empty gelatin capsules PCS 684,826,000 66,734,000 32,881,000 718,679,000 Flavor KG 628 2,530 735 2,423 Sugar KG 207,353 86,000 208,194 85,159 Sorbitol KG 65,512 22,000 82,393 5,119 Glucose KG 10,350 30,300 35,665 4,985 Lactose KG 7,690 44,320 43,988 8,022
Taka 45,296,587 70,929,915 72,372,144 43,854,358
Purchase of raw materials involving 156 items of which 89% in value are imported during the year.
Purchases, issues and stocks of raw materials are of over 750 items involvingproduction of 220 finished goods formulation. The measurement areexpressed in different units viz kilogram, activity, liter, pieces etc. In view of different units in use, the following table has been presented in valueonly.
Summarised quantity of purchases, issues and stocks of raw materials are stated below by their major product group and their total value.
Purchases, issues and stocks of raw materials
27

Packaging materials:Opening Closing
Major product group Unit stocks Purchases Issues stocks
Carton PC 4,816,390 13,518,478 12,261,485 6,073,383 Label PC 5,787,900 12,494,440 9,514,464 8,767,876 Direction slip PC 4,899,350 13,093,360 9,984,366 8,008,344 Catch cover PC 945,690 3,752,994 1,758,239 2,940,445 Vials PC 935,207 6,648,837 5,718,101 1,865,943 Bottles PC 1,600,284 4,293,877 4,981,425 912,736 Ampoules PC 443,828 3,017,529 3,250,311 211,046 Alluminium tubes PC 322,000 1,142,746 1,256,608 208,138 Plastic spoon/dropper PC 1,391,100 7,133,300 7,058,510 1,465,890 PP cap/Al seals PC 4,776,800 11,997,170 12,053,380 4,720,590 Rubber pluck PC 2,641,500 1,876,000 2,703,500 1,814,000 Alluminium foil KG 14,247 56,288 47,468 23,067 PVC hard KG 16,799 3,547 3,587 16,759
Taka 37,126,621 108,314,789 109,391,223 36,050,187
Packaging materials involving about 504 items of which 47% in value are imported during the year.
India Japan Italy DenmarkChina Thailand UK The NetherlandsHong Kong South Korea Spain New ZealandSingapore Germany Belgium USAMalaysia France Austria Indonesia
21 Other income
Manufacturing charges received for manufacturing SK+F products 10,658,119 6,741,782 Dividend income 6,299,235 - Royalty received from Deurali-Janta Pharmaceuticals Pvt. Ltd., Nepal - 934,840
16,957,354 7,676,622
Materials available locally were procured from their local manufacturers. Moreover, materials were imported from the following countries eitherdirectly from the manufacturers or suppliers approved by the Drug Administration:
28
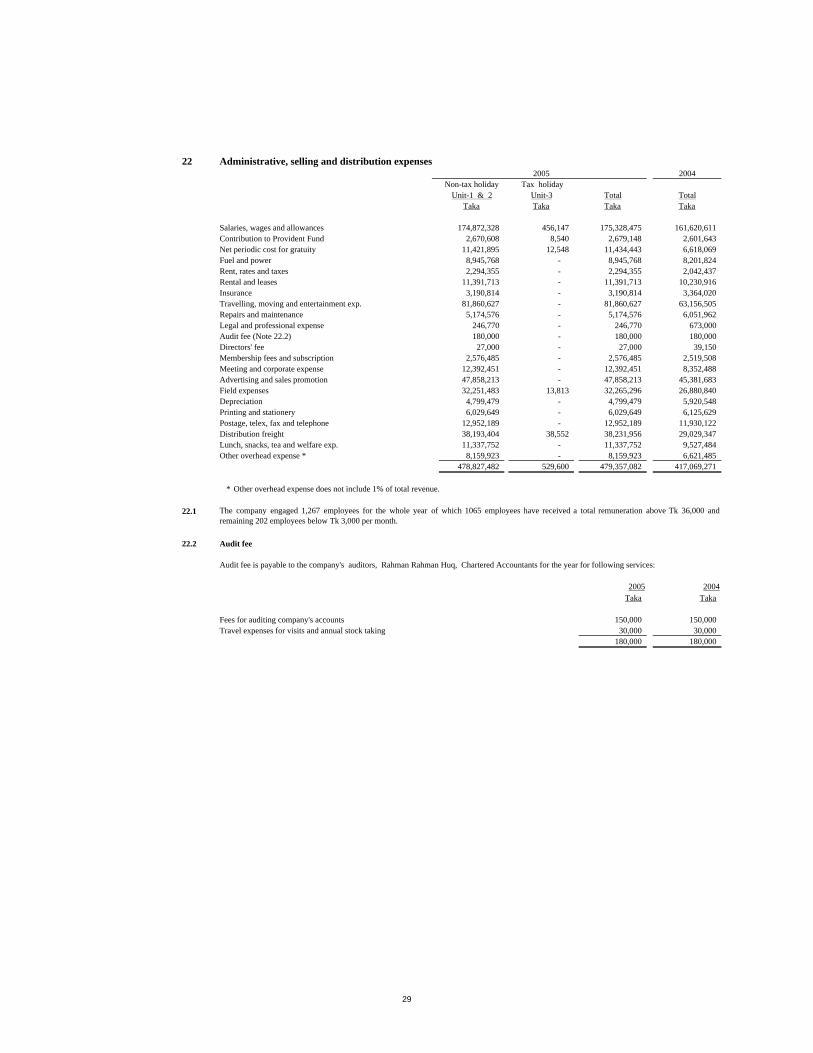
22 Administrative, selling and distribution expenses2005 2004
Non-tax holiday Tax holidayUnit-1 & 2 Unit-3 Total Total
Taka Taka Taka Taka
Salaries, wages and allowances 174,872,328 456,147 175,328,475 161,620,611 Contribution to Provident Fund 2,670,608 8,540 2,679,148 2,601,643 Net periodic cost for gratuity 11,421,895 12,548 11,434,443 6,618,069 Fuel and power 8,945,768 - 8,945,768 8,201,824 Rent, rates and taxes 2,294,355 - 2,294,355 2,042,437 Rental and leases 11,391,713 - 11,391,713 10,230,916 Insurance 3,190,814 - 3,190,814 3,364,020 Travelling, moving and entertainment exp. 81,860,627 - 81,860,627 63,156,505 Repairs and maintenance 5,174,576 - 5,174,576 6,051,962 Legal and professional expense 246,770 - 246,770 673,000 Audit fee (Note 22.2) 180,000 - 180,000 180,000 Directors' fee 27,000 - 27,000 39,150 Membership fees and subscription 2,576,485 - 2,576,485 2,519,508 Meeting and corporate expense 12,392,451 - 12,392,451 8,352,488 Advertising and sales promotion 47,858,213 - 47,858,213 45,381,683 Field expenses 32,251,483 13,813 32,265,296 26,880,840 Depreciation 4,799,479 - 4,799,479 5,920,548 Printing and stationery 6,029,649 - 6,029,649 6,125,629 Postage, telex, fax and telephone 12,952,189 - 12,952,189 11,930,122 Distribution freight 38,193,404 38,552 38,231,956 29,029,347 Lunch, snacks, tea and welfare exp. 11,337,752 - 11,337,752 9,527,484 Other overhead expense * 8,159,923 - 8,159,923 6,621,485
478,827,482 529,600 479,357,082 417,069,271
*
22.1
22.2 Audit fee
2005 2004Taka Taka
Fees for auditing company's accounts 150,000 150,000 Travel expenses for visits and annual stock taking 30,000 30,000
180,000 180,000
Audit fee is payable to the company's auditors, Rahman Rahman Huq, Chartered Accountants for the year for following services:
The company engaged 1,267 employees for the whole year of which 1065 employees have received a total remuneration above Tk 36,000 andremaining 202 employees below Tk 3,000 per month.
Other overhead expense does not include 1% of total revenue.
29

23 Non-operating expenses (net)2005 2004
Non-tax holiday Tax holidayUnit-1 & 2 Unit-3 Total Total
Taka Taka Taka Taka
Interest on overdraft 21,912,949 1,090,000 23,002,949 24,601,521 Bank charges 1,610,236 - 1,610,236 1,815,747 Profit on disposal of fixed assets (Note 9.5) (260,000) - (260,000) (48,500) Miscellaneous income (436,623) - (436,623) (102,116)
22,826,562 1,090,000 23,916,562 26,266,652
2005 2004Taka Taka
24 Basic earnings per share (EPS)
The computation of EPS is given below:
Earnings attributable to the ordinary shareholders (net profit after tax) 192,568,261 145,487,941 Weighted average number of ordinary shares outstanding during the year 669,437 557,864 Basic Earning Per Share (EPS) 287.66 260.79
25 Cash and cash equivalents
Cash and bank balancesCash in hand 440,000 465,000 Cash at banks 89,012,557 70,245,981
89,452,557 70,710,981
Bank overdraft (192,425,445) (206,014,979) (102,972,888) (135,303,998)
30

26 Payments to directors and officers
Directors OfficersTaka Taka
Remuneration 1,008,000 43,222,986 House rent 873,600 61,063,763 Bonus 420,000 11,998,533 Contribution to provident fund 100,800 3,079,214 Gratuity 126,000 10,164,120 Medical expenses 87,530 5,488,062 Conveyance allowance and transport 192,000 19,405,382 Other welfare expenses 295,320 14,806,392
26.1
27 Capacity utilisation - single shift basis
2005 2004Actual Actual
Major product group Unit Capacity production Utilisation production Utilisation(In '000) (In '000) % (In '000) %
Sterile dry fill (injectable) Vials 18,500 5,190 28.05% 6,639 35.89%Sterile liquid (injectable) Vials &
ampoules 8000 4,891 61.14% 4,355 54.44%Ointments Tubes 1,440 1,264 87.78% 1,199 83.26%Capsules and tablets Cap/Tab 242,000 384,234 158.77% 331,695 137.06%Oral liquid & dry syrup Bottles 6,840 6,582 96.23% 6,596 96.43%Water for injection Ampoules 2,000 1,521 76.05% 1,207 60.35%Premix feed supplement Kg 2,000 4,989 249.45% 848 424.00%Premix feed supplement Sachet 1,200 549 45.75% 549 45.75%ORAL saline Sachet 24,400 43,744 179.28% 35,813 248.70%
27.1
28 Contingent liabilities
28.1
28.2 Additional contingent liabilities exist in respect of the following:2005 2004Taka Taka
Outstanding letters of credit (Note 28.2.1) 158,978,226 76,512,322 Outstanding guarantees issued by the banks 1,600,415 224,285
28.2.1 Outstanding letters of creditLimit 2005 2004Taka Taka
The Hongkong and Shanghai Banking Corporation Ltd. 150,000,000 13,100,633 8,006,439 Standard Chartered Bank 150,000,000 105,137,051 53,959,494 Eastern Bank Limited 70,000,000 39,132,327 14,546,389 City Bank N.A 80,000,000 1,608,215 -
450,000,000 158,978,226 76,512,322
The aggregate amount paid provided during the year in respect of directors and officers of the Company are disclosed below as required by theSecurities and Exchange Rules 1987.
Capacity for Sterile dry fill (injectable) was built on the basis of high volume of Pronapen injection. The demand for Pronapen is declining. Thecompany has been introducing other injectables to utilise the excess capacity.
There are contingent liabilities on account of unresolved disputed corporate income tax assessments involving tax claims by the tax authorityamounting to Tk 33,237,896 which has been referred to the High Court and appeals have been pending with Taxes Appellate Tribunal. However, taxpaid and provided for the relevant years are more than adequate to meet the demanded tax, in the event the High Court maintains the decision of theAppellate Tribunal and the Tribunal upholds the order of the Commissioner of Taxes (Appeal).
During the year no payment has been made to any non-executive Directors for any special services rendered.
The company operates multi-products plant. As a result plant utilisationare not comparable with capacity due to variation of product mix. However,actual production and utilisation for major products group are as follows:
31

29 Capital expenditure commitment
There was no unprovided committed capital expenditure as at 31 December 2005.
30 Lease commitments
The company has lease commitments amounting to Tk 27,008,175 and payments due within one year amounts to Tk 6,228,444
31 Dividend paid to non-resident shareholders
Dividend paid to non-resident shareholder, Business Research International Corp. Inc. during the year 2005 was Tk 7,064,500equivalent to US$ 109,492.29 for their 141,290 shares.
32 Claims against the company not acknowledged as debt
None as at 31 December 2005
33 Payments/received in foreign currency
33.1 During the year the following payments were made in foreign currency for imports calculated on CIF basis of:
Foreign Local currency currency
US$ Taka
Active, raw and packaging materials 8,304,639 564,632,420 Machinery and spares 1,478,024 100,505,630
9,782,663 665,138,050
33.2 The following expenses were incurred during the year in foreign exchange on account of:
Professional consultation fee for ISO 9001 US$ 3,180.00 Export promotional expenses US$ 15,097.37 Subscription for IMS and Medical Journal US$ 3,614.36 Training US$ 3,252.00
33.3 Foreign exchange was earned in respect of the following:
Export of goods on FOB US$ 389,989.20
34 Subsequent events (disclosures under BAS 10 "Events after the balance sheet date")
There is no significant events subsequent to balance sheet date.
35 General
35.1 The accounts are expressed in Bangladesh Taka currency and rounded off to the nearest integer.
35.2 Previous year's figures have been rearranged wherever considered necessary to conform to current year's presentation.
32

Schedule - A
Tax holiday Non-tax holidayperiod period
(January to (June toMay 2005) December 2005) Total
Notes Taka Taka Taka
Turnover 19 33,997,624 38,572,472 72,570,096 Cost of goods sold (Schedule A/1) 20 (27,557,107) (29,104,377) (56,661,484) Gross profit 6,440,517 9,468,095 15,908,612
Operating expenses : Administrative, selling and distribution expenses (Schedule A/2) 22 (220,667) (308,933) (529,600) Operating profit 6,219,850 9,159,162 15,379,012 Non-operating expenses (net) 23 (451,000) (639,000) (1,090,000)
5,768,850 8,520,162 14,289,012 Contribution to WPPF (274,708) (405,722) (680,430) Profit before tax 5,494,142 8,114,440 13,608,582 Tax expenses: Current tax - (2,596,621) (2,596,622)
Profit after tax 5,494,142 5,517,819 11,011,960
Profit and Loss Account for the year ended on 31 December 2005
Tax Holiday Unit 3 - O.R.SRenata Limited
33

Tax holiday Non-tax holidayperiod period
(January to (June toMay 2005) December 2005) Total
Taka Taka Taka Cost of goods sold :
Opening stocks of finished goods - - - Add : Cost of goods manufactured [ref. (a) below] 27,557,107 29,472,880 57,029,987 : Cost of finished goods purchased - - -
27,557,107 29,472,880 57,029,987 Less : Closing stocks of finished goods - 368,503 368,503
27,557,107 29,104,377 56,661,484
(a) Cost of goods manufactured
Cost of materials :Opening work-in-progress - - - Add : Cost of raw materials consumed [ref. (b) below] 25,891,568 27,141,125 53,032,693
25,891,568 27,141,125 53,032,693 Less : Closing work-in-progress - - -
25,891,568 27,141,125 53,032,693 Manufacturing overhead :
Salaries, wages, and other benefits 231,901 324,661 556,562 Company's contribution to provident fund 3,550 4,970 8,520 Net periodic cost for gratuity 5,769 8,077 13,846 Electricity and fuel 367,309 514,232 881,541 Manufacturing supplies and expenses 24,725 34,615 59,340 Insurance 20,229 28,321 48,550 Land revenue and taxes 4,504 6,306 10,810 Postage, and telephone 5,938 8,314 14,252 Printing and stationery 3,505 4,907 8,412 Uniform to Workers 20,165 28,232 48,397 Repair and maintenances 7,436 10,410 17,846 Lunch, snacks and tea expenses 50,637 70,892 121,529 Depreciation 919,870 1,287,819 2,207,689
1,665,539 2,331,755 3,997,294 Cost of goods manufactured 27,557,107 29,472,880 57,029,987
(b) Cost of raw materials consumed
Opening stocks 10,154,881 7,939,699 10,154,881 Purchases 23,676,386 22,736,659 46,413,045
33,831,267 30,676,358 56,567,926 Less : Closing stocks 7,939,699 3,535,233 3,535,233
25,891,568 27,141,125 53,032,693
Tax Holiday Unit 3 - O. R. SRenata Limited
Details of cost of goods sold for the year ended 31 December 2005
34

Schedule - A/2
Tax holiday Non-tax holidayperiod period
(January to (June toMay 2005) December 2005) Total
Taka Taka Taka
Salaries, wages and allowances 190,061 266,086 456,147 Contribution to provident fund 3,558 4,982 8,540 Net periodic cost for gratuity 5,228 7,320 12,548 Field expenses 5,755 8,058 13,813 Distribution freight 16,063 22,489 38,552
220,667 308,933 529,600
Renata LimitedTax Holiday Unit 3 - O. R. S
Details of administrative, selling and distribution expenses for the year ended 31 December 2005
35

Renata Limitedand its subsidiaries
Consolidated Balance Sheet as at 31 December 2005
2005 2004Sources of fund Notes Taka Taka
Shareholders equity:Equity attributable to group company shareholders:
Share capital 4 66,943,700 55,786,400 Proposed bonus shares 13,388,700 11,157,300 Revaluation surplus 5 156,482,355 156,774,863 Tax holiday reserve 63,031,510 48,811,353 Capital reserve 535,560 535,560 Unappropriated profit 6 460,083,974 304,843,055
760,465,799 577,908,531 Minority interest 9,863 6,978
760,475,662 577,915,509 Medium term loan 65,888,889 78,781,724 Deferred liability - staff gratuity 7 60,324,000 52,822,000 Deferred tax liability 8 55,975,450 57,663,916
942,664,001 767,183,149
Applications of fund
Property, plant and equipment: 9aAt cost/revaluation 791,097,953 770,433,813 Less: Accumulated depreciation 258,130,790 225,847,402
532,967,163 544,586,411 Add : Capital work-in progress 10 139,891,546 10,683,181
Investment at cost 11a 4,147,000 4,147,000
Current assets:Stocks and stores 12a 421,550,952 404,933,019 Debtors 13a 142,013,933 103,542,006 Advances, deposits and prepayments 14a 35,446,873 30,471,080 Cash and bank balances 15a 99,169,926 72,576,481
698,181,684 611,522,586 Less: Current liabilities:
Creditors of goods 27,839,795 14,371,923 Accrued expenses 69,959,290 42,159,873 Other finance 16a 26,862,164 17,814,158 Short term bank loans 17a 192,425,445 240,934,266 Provision for taxation 18a 80,483,330 56,807,350 Unclaimed dividend 1,481,518 985,939 Proposed cash dividend 33,471,850 27,893,200 Dividend distribution tax - 2,789,320
432,523,392 403,756,029 Net current assets 265,658,292 207,766,557
942,664,001 767,183,149
The accompanying notes 1 to 35 form an integral part of these financial statements.
_________________ _________________ _________________Managing Director Director Company Secretary
As per our annexed report of same date.
____________________Dhaka, 30 April 2006 Auditors
3

Renata Limitedand its subsidiaries
Consolidated Profit and Loss Account for the year ended 31 December 2005
2005 2004Notes Taka Taka
Turnover 19a 1,784,917,383 1,470,130,349 Cost of goods sold 20a (949,216,872) (804,087,997) Gross profit 835,700,511 666,042,352 Other income 11,107,847 10,236,351
846,808,358 676,278,703 Operating expenses:
Administrative, selling and distribution expenses 22a (492,289,604) (427,598,666)
Operating profit 354,518,754 248,680,037 Non-operating expenses (net) 23a (36,216,813) (38,180,613)
318,301,941 210,499,424 Contribution to WPPF (15,157,236) (10,415,442) Profit before tax 303,144,705 200,083,982 Tax expenses: Current tax 18 (88,164,518) (59,322,757) Deferred tax 1,345,089 (3,498,135)
(86,819,429) (62,820,892) Profit after tax 216,325,276 137,263,090
Minority interest (3,650) 999 216,321,626 137,264,089
Unappropriated profit brought forward:Unappropriated profit brought forward 304,843,055 216,343,692
304,843,055 216,343,692 Profit available for appropriation 521,164,681 353,607,781
Appropriation:Tax holiday reserve (14,220,157) (6,924,906)
Proposed bonus shares (1 share for 5 shares held ) (13,388,700) (11,157,300) Proposed cash dividend (Tk 50 per share) (33,471,850) (27,893,200) Dividend distribution tax - (2,789,320)
(61,080,707) (48,764,726)
Unappropriated profit carried forward 460,083,974 304,843,055
Basic earnings per share (par value Tk. 100) - Note 24a 323.15 246.05
The accompanying notes 1 to 35 form an integral part of these financial statements.
__________________ _________________ ______________________ Managing Director Director Company Secretary
As per our annexed report of same date.
____________________Dhaka, 30 April 2006 Auditors
5

Renata Limitedand its subsidiaries
Consolidated statement of changes in equity for the year ended 31 December 2005
Equity attributable to group company shareholdersShare Proposed Revaluation Tax holiday Capital Unappropriated Minority Totalcapital bonus shares surplus reserve reserve profit Total interestTaka Taka Taka Taka Taka Taka Taka Taka Taka
Balance at 31 December 2003 46,488,700 9,297,740 157,410,748 41,886,447 535,560 216,343,692 471,962,887 7,877 471,970,764
Adjustment on consolidation of subsidiary - - - - - - - 100 100 Bonus share issued 9,297,700 (9,297,700) - - - - - - - Depreciation adjustment - - (635,885) - - - (635,885) - (635,885) Net profit after tax for the year - - - - - 137,264,089 137,264,089 (999) 137,263,090 Transferred to tax holiday reserve - - - 6,924,906 - (6,924,906) - - - Proposed bonus shares - 11,157,300 - - - (11,157,300) - - - Proposed cash dividend - (40) - - - (27,893,200) (27,893,240) - (27,893,240) Dividend distribution tax - - - - - (2,789,320) (2,789,320) - (2,789,320)
Balance at 31 December 2004 55,786,400 11,157,300 156,774,863 48,811,353 535,560 304,843,055 577,908,531 6,978 577,915,509
Bonus share issued 11,157,300 (11,157,300) - - - - - - - Deferred tax on revaluation surplus 343,377 343,377 343,377 Depreciation adjustment - - (635,885) - - - (635,885) - (635,885) Net profit after tax for the year - - - - - 216,321,626 216,321,626 3,650 216,325,276 Proposed dividend to minority shareholder - - - - - (765) (765) Transferred to tax holiday reserve - - - 14,220,157 - (14,220,157) - - - Proposed bonus shares - 13,388,700 - - - (13,388,700) - - - Proposed cash dividend - - - - - (33,471,850) (33,471,850) - (33,471,850) Balance at 31 December 2005 66,943,700 13,388,700 156,482,355 63,031,510 535,560 460,083,974 760,465,799 9,863 760,475,662
Particulars
7

Renata Limitedand its subsidiaries
Consolidated cash flow statement for the year ended 31 December 2005
2005 2004Taka Taka
A. Cash flows from operating activities:
Collection from customers and other income 2,017,370,599 1,684,383,449 Payment of VAT (243,974,768) (207,944,797) Payment to suppliers and employees (1,404,112,025) (1,301,237,618) Cash generated from operation 369,283,806 175,201,034
Financing cost (36,216,813) (38,331,229) Payment of tax (64,488,538) (48,129,584) Net cash from operating activities 268,578,455 88,740,221
B. Cash flows from investing activities:
Purchase of property, plant and equipment (153,444,968) (125,031,909) Sale proceeds of property, plant and equipment 260,000 269,375 Net cash used in investing activities (153,184,968) (124,762,534)
C. Cash flows from financing activities:
Medium term loan received (net) (12,892,835) 36,470,034 Dividend paid (27,398,386) (23,081,044) Net cash from financing activities (40,291,221) 13,388,990
D. Net cash (outflows for the year (A+B+C) 75,102,266 (22,633,323)
E. Opening cash and cash equivalents (168,357,785) (145,724,462)
F. Closing cash and cash equivalents (D+E) (Note 25a) (93,255,519) (168,357,785)
9

t
a
m
e
5
n
8a Consolidated deferred tax liability
Renata Agro Industries Limited, subsidiary of Renata limited is enjoying tax holiday as such no deferred tax adjustments have been considered.
As another subsidiary, Purnava Limited yet to start commercial operation, no deferred tax adjustment has been considered.
9a Consolidated property, plant and equipment
Cost/revaluation DepreciationDisposal/ Disposal/ Written
Particulars At Additions adjustment At Rate At Charge adjustment At down value at1 January during during 31 December 1 January during during 31December 31 December
2005 the year the year 2005 2005 the year the year 2005 2005Taka Taka Taka Taka % Taka Taka Taka Taka Taka
Freehold land: At cos 28,899,377 4,303,828 - 33,203,205 - - - - 33,203,205 On rev 179,132,078 - - 179,132,078 - - - - 179,132,078
208,031,455 4,303,828 - 212,335,283 - - - - - 212,335,283
Building: At cost 87,416,683 - - 87,416,683 1.33-4 18,987,452 4,496,821 - 23,484,273 63,932,410 At cost 2,547,463 - 2,547,463 - 33.33 1,969,309 578,154 2,547,463 - - On rev 41,291,251 - - 41,291,251 1.33-4 6,277,123 635,885 - 6,913,008 34,378,243
131,255,397 - 2,547,463 128,707,934 27,233,884 5,710,860 2,547,463 30,397,281 98,310,653
Plant and 349,016,022 15,809,492 135,000 364,690,514 5-20 147,969,130 23,945,316 17,600 171,896,846 192,793,668
Automobil 33,850,022 - 1,025,000 32,825,022 25-20 29,310,111 2,317,301 1,002,500 30,624,912 2,200,110
Office equip 34,276,250 2,920,138 (135,000) 37,331,388 10-12. 16,344,880 3,230,321 (17,600) 19,592,801 17,738,587
Furniture a 14,004,667 1,203,145 - 15,207,812 5 4,989,397 629,553 - 5,618,950 9,588,862

Total 2005 770,433,813 24,236,603 3,572,463 791,097,953 225,847,402 35,833,351 3,549,963 258,130,790 532,967,163
Total 2004 657,920,085 114,380,728 1,867,000 770,433,813 197,588,724 29,879,203 1,620,525 225,847,402 544,586,411 - - - - -
9a.1 Value of fully depreciated assets included in property, plant and equipment are as follows:
CostTaka
Building 3,747,076 Plant and machinery 84,666,288 Automobile and trucks 26,709,100 Office equipments 8,901,461 Furniture and fixture 2,138,244
126,162,169
9a.2 The land of the company measuring 12 acres of freehold land located at Mirpur, Dhaka and 9 feet above highest flood level recorded in 1988. Out of 12 acres of land,4.75 acres are secured against short-term bank loans by registered mortgage.
9a.3 Depreciation for the year charged to:Taka
Cost of goods sold - Non-tax holiday units 1&2 (Note 20.1) 18,450,181 Cost of goods sold - Tax holiday unit 3 (Note 20.1) 2,207,689
20,657,870 Renata Agro Industries Limited 9,740,117 Operating expenses (Note 22) 4,799,479 Revaluation surplus (Note 5) 635,885
35,833,351 -
9.a.4 The freehold land and buildings have been revalued by a firm of professional valuers and the increase in net carrying amount as a result of revaluation has been shownas additions/revaluations in the year 1995.
11a Consolidated investment - at cost

The following amounts are invested for maintaining equivalent amount of tax holiday reserve @ 10% on exempted net profit of Renata AgroIndustries Limited:
2005 2004Taka Taka
Protirokka Sanchaya Patra 2,447,000 2,447,000 Investment Development Bonds 1,700,000 1,700,000
4,147,000 4,147,000
12a Consolidated stocks and stores 2005 2004Taka Taka
Finished goods - Pharmaceutical (unit 1) 101,704,293 95,032,422 - Premix (unit 2) 45,599,357 28,381,433 - ORS (unit 3) 368,503 -
147,672,153 123,413,855
Work-in-progress 30,969,925 41,357,063 Raw materials 43,854,358 45,296,587 Bulk materials 57,374,479 42,518,779 Packing materials 36,050,187 37,126,621 Raw and packaging materials Premix (unit 2) 20,504,506 24,182,598 Raw and packaging materials ORS (unit 3) 3,535,233 10,154,881 Consumable stores and spares 5,990,921 6,148,137 Stock-in transit 43,611,768 33,245,253 Raw materials - Renata Agro Industries Limited 31,987,422 41,489,245
421,550,952 404,933,019
All present and future stocks of Renata Limited are secured against short term bank loans (Note 17).
2005 2004Taka Taka
13a Consolidated debtors

Trade debtors- unsecured (Note 13a.1) 111,810,880 84,303,965 Less: Provision for doubtful debts 10,255,877 9,655,877 Trade debtors considered good 101,555,003 74,648,088
Sundry debtors - considered good 19,127,724 9,836,515 Value Added Tax (VAT) recoverable 21,331,206 19,057,403
142,013,933 103,542,006
All present and future debtors of Renata Limited are secured against short term bank loans (Note 17).
13a.1 Trade debtors
Debts due over six months 71,864,489 35,987,231 Debts due below six months 39,946,391 38,674,000
111,810,880 74,661,231
2005 2004Taka Taka
14a Consolidated advances, deposits and prepayments
Advances: For inventories 1,667,295 - To employees 13,897,244 13,660,462
15,564,539 13,660,462 Deposits and prepayments: Security deposits 4,697,271 4,335,446 Prepaid expenses 14,190,568 12,331,752 Other advances 994,495 143,420
19,882,334 16,810,618 35,446,873 30,471,080
15a Consolidated cash and bank balances
Cash in hand 1,262,162 1,467,841 Cash at banks in current accounts 97,907,764 71,108,640

99,169,926 72,576,481
16a Consolidated other finance
Workers' profit participation fund 23,359,428 17,046,683 Others 3,502,736 767,475
26,862,164 17,814,158
17a Consolidated short term bank loansLimit 2005 2004Taka Taka Taka
Overdraft accounts with:
Eastern Bank Limited, Dhaka 165,000,000 22,232,370 51,372,055 The Hongkong and Shanghai Banking Corporation Ltd., Dhaka 210,000,000 70,427,568 100,471,583 Standard Chartered Bank, Dhaka 192,500,000 89,588,131 89,090,628 Citibank N. A 120,000,000 10,177,376 -
687,500,000 192,425,445 240,934,266
18a Consolidated provision for taxation
Renata Agro Industries Limited, a subsidiary of Renata Limited, is enjoying tax holiday hence no tax provision has been made on its profit.
No provision has been made for Purnava Limited as the company has not yet started any commercial operation.
19a Consolidated turnover2005 2004Taka Taka
Non-tax holiday (unit 1):Pharmaceutical products 1,168,131,510 966,241,945

Animal health products 225,525,333 114,072,960 Premix ( unit - 2) 142,328,900 191,114,083 ORS (unit 3) 38,572,472 -
1,574,558,215 1,271,428,988
Tax holiday (unit 3) - ORS 33,997,624 80,368,196
Renata Agro Industries Ltd. - Products 176,361,544 118,333,165 1,784,917,383 1,470,130,349
2005 2004Taka Taka
20a Consolidated cost of goods sold
Opening stock of finished goods 123,413,855 120,017,839 Add: Cost of goods manufactured 870,676,531 744,414,502 Cost of finished goods purchased 102,798,639 63,069,511
1,096,889,025 927,501,852
Less: Closing stock of finished goods 147,672,153 123,413,855 949,216,872 804,087,997
22a Consolidated administrative, selling and distribution expenses
Salaries, wages and allowances 180,997,007 166,406,872 Contribution to Provident Fund 2,679,148 2,601,643 Net periodic cost for gratuity 10,020,176 6,618,069 Fuel and power 8,945,768 8,313,804 Rent, rates and taxes 2,294,355 2,322,237 Rental and leases 11,391,713 10,230,916 Insurance 3,190,814 3,377,820 Travelling, moving and entertainment exp. 81,860,627 63,898,955 Repairs and maintenance 5,174,576 6,176,944 Legal and professional expense 246,770 850,377 Audit fee 180,000 235,000 Provision for bad debt 600,000 -
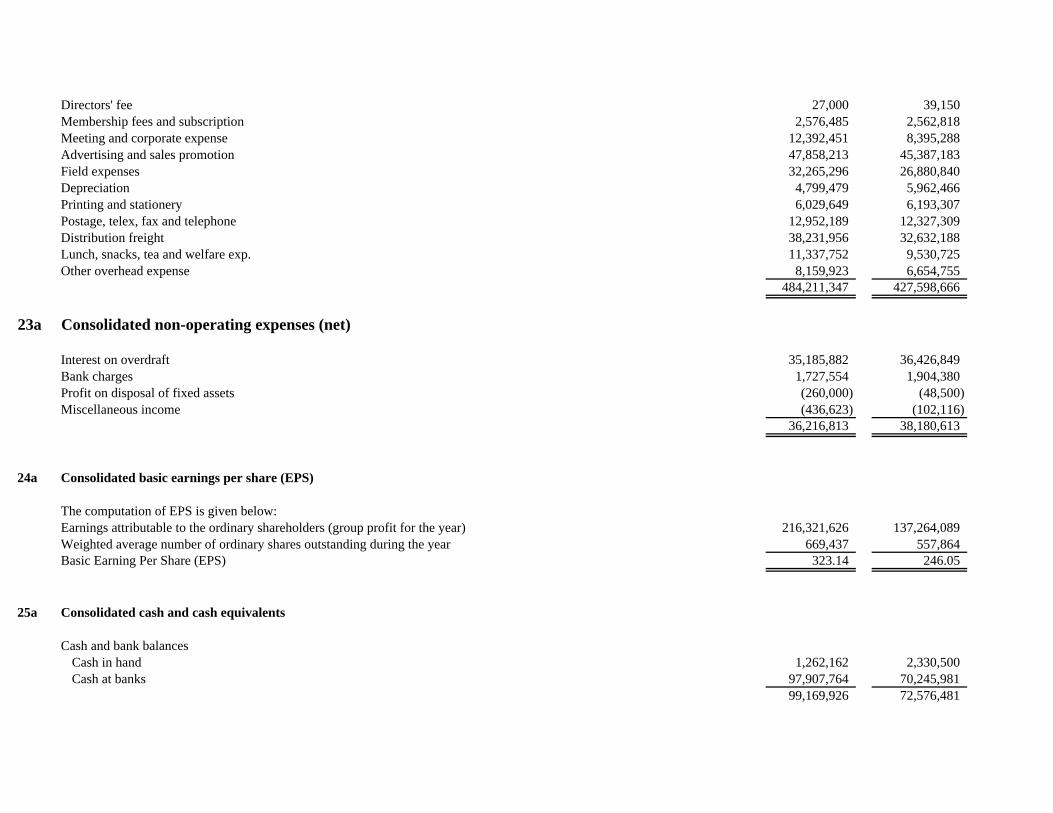
Directors' fee 27,000 39,150 Membership fees and subscription 2,576,485 2,562,818 Meeting and corporate expense 12,392,451 8,395,288 Advertising and sales promotion 47,858,213 45,387,183 Field expenses 32,265,296 26,880,840 Depreciation 4,799,479 5,962,466 Printing and stationery 6,029,649 6,193,307 Postage, telex, fax and telephone 12,952,189 12,327,309 Distribution freight 38,231,956 32,632,188 Lunch, snacks, tea and welfare exp. 11,337,752 9,530,725 Other overhead expense 8,159,923 6,654,755
484,211,347 427,598,666
23a Consolidated non-operating expenses (net)
Interest on overdraft 35,185,882 36,426,849 Bank charges 1,727,554 1,904,380 Profit on disposal of fixed assets (260,000) (48,500) Miscellaneous income (436,623) (102,116)
36,216,813 38,180,613
24a Consolidated basic earnings per share (EPS)
The computation of EPS is given below:Earnings attributable to the ordinary shareholders (group profit for the year) 216,321,626 137,264,089 Weighted average number of ordinary shares outstanding during the year 669,437 557,864 Basic Earning Per Share (EPS) 323.14 246.05
25a Consolidated cash and cash equivalents
Cash and bank balancesCash in hand 1,262,162 2,330,500 Cash at banks 97,907,764 70,245,981
99,169,926 72,576,481

Bank overdraft (192,425,445) (240,934,266) (93,255,519) (168,357,785)