Annual Report 2003 Bank van de Nederlandse Antillen Willemstad, July 5, 2004.
45
k van de Nederlandse Antill k van de Nederlandse Antill Annual Report 2003 Annual Report 2003 Bank van de Nederlandse Antillen Bank van de Nederlandse Antillen Willemstad, July 5, 2004
-
date post
20-Dec-2015 -
Category
Documents
-
view
213 -
download
0
Transcript of Annual Report 2003 Bank van de Nederlandse Antillen Willemstad, July 5, 2004.
Ban
k v
an
de N
ed
erl
an
dse
An
till
en
Ban
k v
an
de N
ed
erl
an
dse
An
till
en
Annual Report 2003Annual Report 2003Bank van de Nederlandse Bank van de Nederlandse
AntillenAntillen
Annual Report 2003Annual Report 2003Bank van de Nederlandse Bank van de Nederlandse
AntillenAntillen
Willemstad, July 5, 2004

Annual Report 2003 2
Ban
k v
an
de N
ed
erl
an
dse
An
till
en
Ban
k v
an
de N
ed
erl
an
dse
An
till
en
July
5, 2
004
Developments in Developments in the real sectorthe real sector
Annual Report 2003 3
Ban
k v
an
de N
ed
erl
an
dse
An
till
en
Ban
k v
an
de N
ed
erl
an
dse
An
till
en
July
5, 2
004
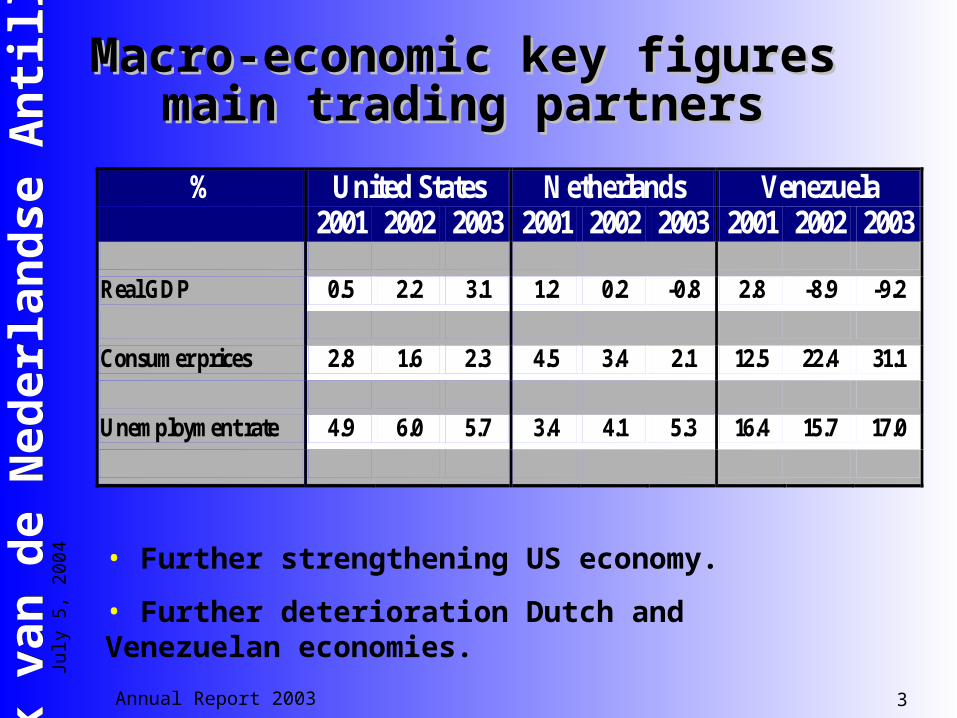
Macro-economic key figures Macro-economic key figures main trading partners main trading partners
% United States Netherlands Venezuela 2001 2002 2003 2001 2002 2003 2001 2002 2003 Real GDP 0.5 2.2 3.1 1.2 0.2 -0.8 2.8 -8.9 -9.2 Consumer prices 2.8 1.6 2.3 4.5 3.4 2.1 12.5 22.4 31.1 Unemployment rate 4.9 6.0 5.7 3.4 4.1 5.3 16.4 15.7 17.0
• Further strengthening US economy.
• Further deterioration Dutch and Venezuelan economies.
Annual Report 2003 4
Ban
k v
an
de N
ed
erl
an
dse
An
till
en
Ban
k v
an
de N
ed
erl
an
dse
An
till
en
July
5, 2
004
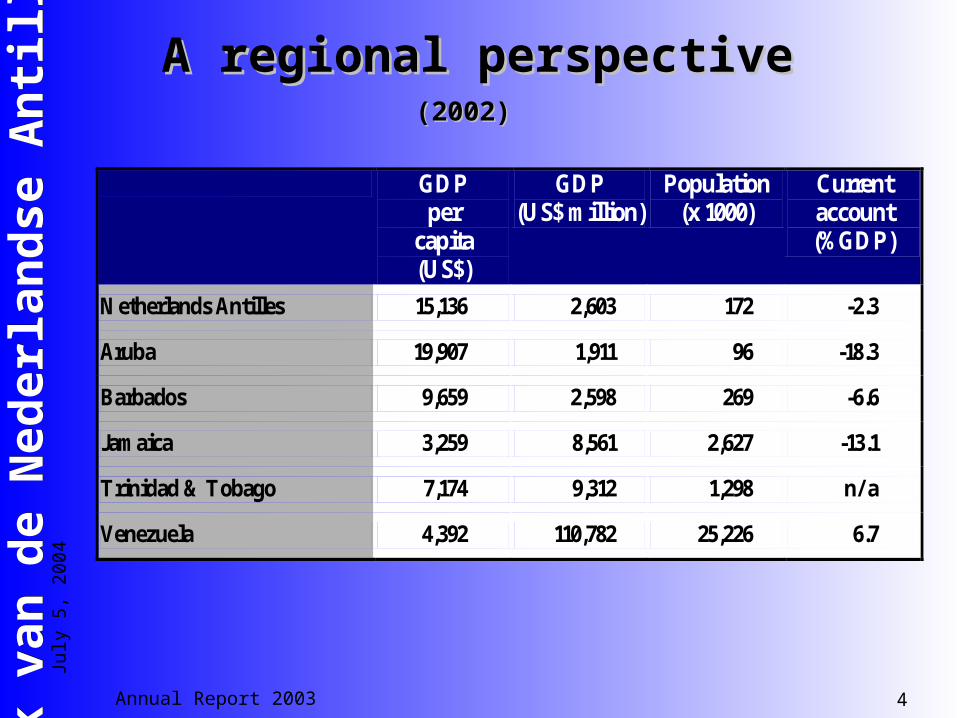
A regional perspectiveA regional perspective(2002)(2002)
GDP per
capita (US$)
GDP (US$ million)
Population (x 1000)
Current account (%GDP)
Netherlands Antilles 15,136 2,603 172 -2.3
Aruba 19,907 1,911 96 -18.3
Barbados 9,659 2,598 269 -6.6
Jamaica 3,259 8,561 2,627 -13.1
Trinidad & Tobago 7,174 9,312 1,298 n/ a
Venezuela 4,392 110,782 25,226 6.7
Annual Report 2003 5
Ban
k v
an
de N
ed
erl
an
dse
An
till
en
Ban
k v
an
de N
ed
erl
an
dse
An
till
en
July
5, 2
004
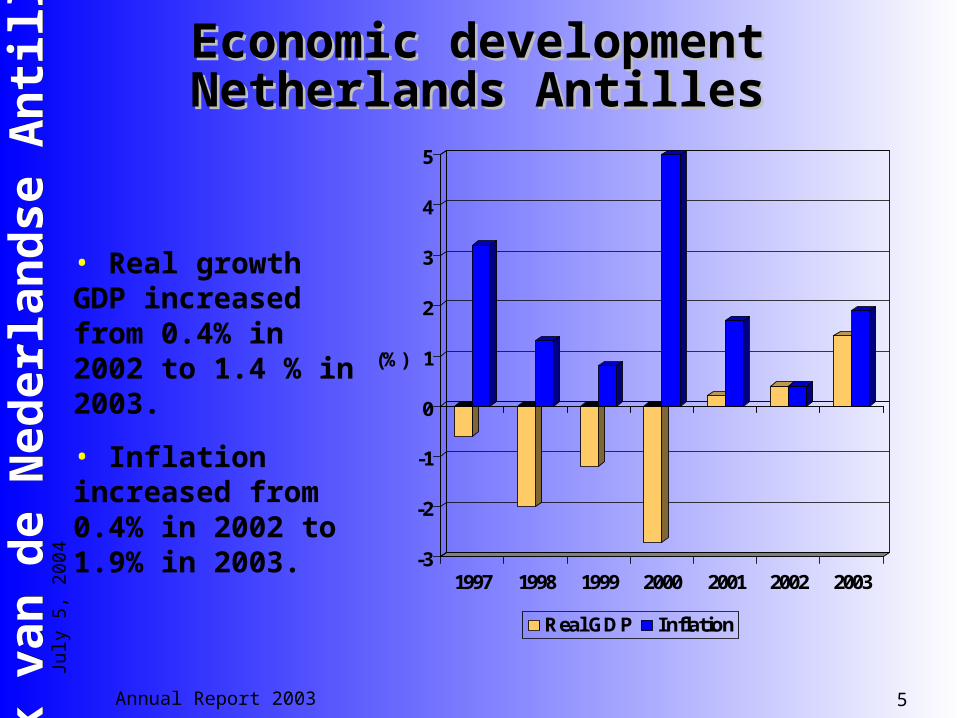
Economic developmentEconomic developmentNetherlands AntillesNetherlands Antilles
-3
-2
-1
0
1
2
3
4
5
(%)
1997 1998 1999 2000 2001 2002 2003
Real GDP Inflation
• Real growth GDP increased from 0.4% in 2002 to 1.4 % in 2003.
• Inflation increased from 0.4% in 2002 to 1.9% in 2003.
Annual Report 2003 6
Ban
k v
an
de N
ed
erl
an
dse
An
till
en
Ban
k v
an
de N
ed
erl
an
dse
An
till
en
July
5, 2
004
Main developments in 2003Main developments in 2003
• Continuation economic recovery: Growth export Higher consumption (private and
government)• Export growth due to:
Further growth in tourism. Favorable performance transportation
sector. Decline in private investment.• Decline in activities international
financial and business services sector.
• Increase in unemployment rate.
Annual Report 2003 7
Ban
k v
an
de N
ed
erl
an
dse
An
till
en
Ban
k v
an
de N
ed
erl
an
dse
An
till
en
July
5, 2
004
Main developments in 2003 Main developments in 2003 (cont.)(cont.)
• Increase in inflation: Increase utility prices due to
higher oil prices Appreciation euro Higher inflation main trading
partners USA and Venezuela
Annual Report 2003 8
Ban
k v
an
de N
ed
erl
an
dse
An
till
en
Ban
k v
an
de N
ed
erl
an
dse
An
till
en
July
5, 2
004
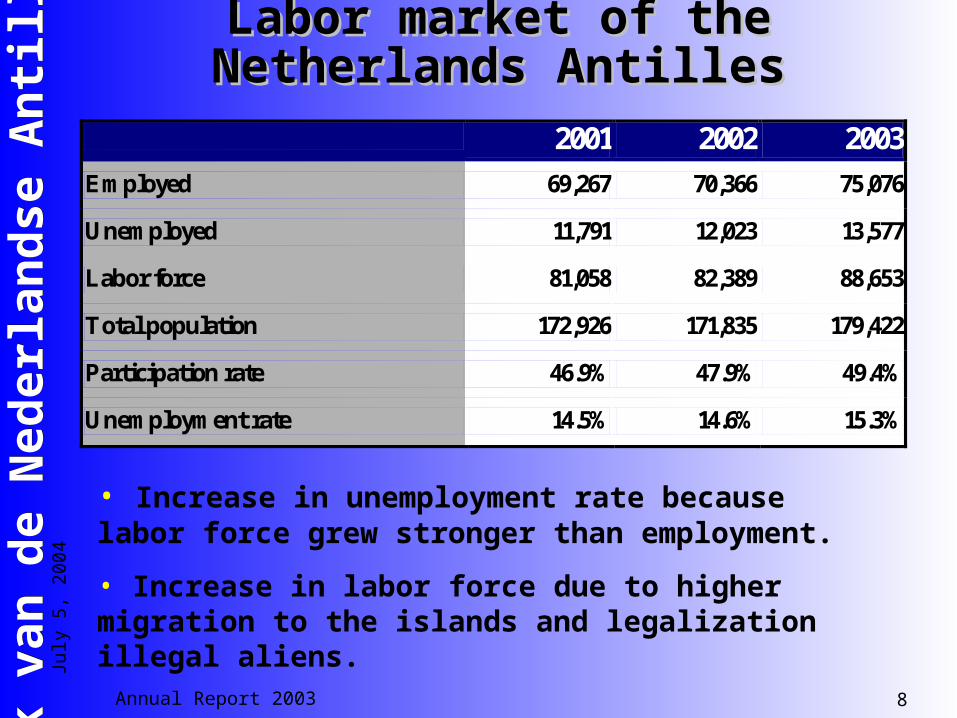
Labor market of the Labor market of the Netherlands AntillesNetherlands Antilles
2001 2002 2003 Employed 69,267 70,366 75,076
Unemployed 11,791 12,023 13,577
Labor force 81,058 82,389 88,653
Total population 172,926 171,835 179,422
Participation rate 46.9% 47.9% 49.4%
Unemployment rate 14.5% 14.6% 15.3%
• Increase in unemployment rate because labor force grew stronger than employment.
• Increase in labor force due to higher migration to the islands and legalization illegal aliens.

Annual Report 2003 9
Ban
k v
an
de N
ed
erl
an
dse
An
till
en
Ban
k v
an
de N
ed
erl
an
dse
An
till
en
July
5, 2
004
Public sector Public sector developmentsdevelopments
Annual Report 2003 10
Ban
k v
an
de N
ed
erl
an
dse
An
till
en
Ban
k v
an
de N
ed
erl
an
dse
An
till
en
July
5, 2
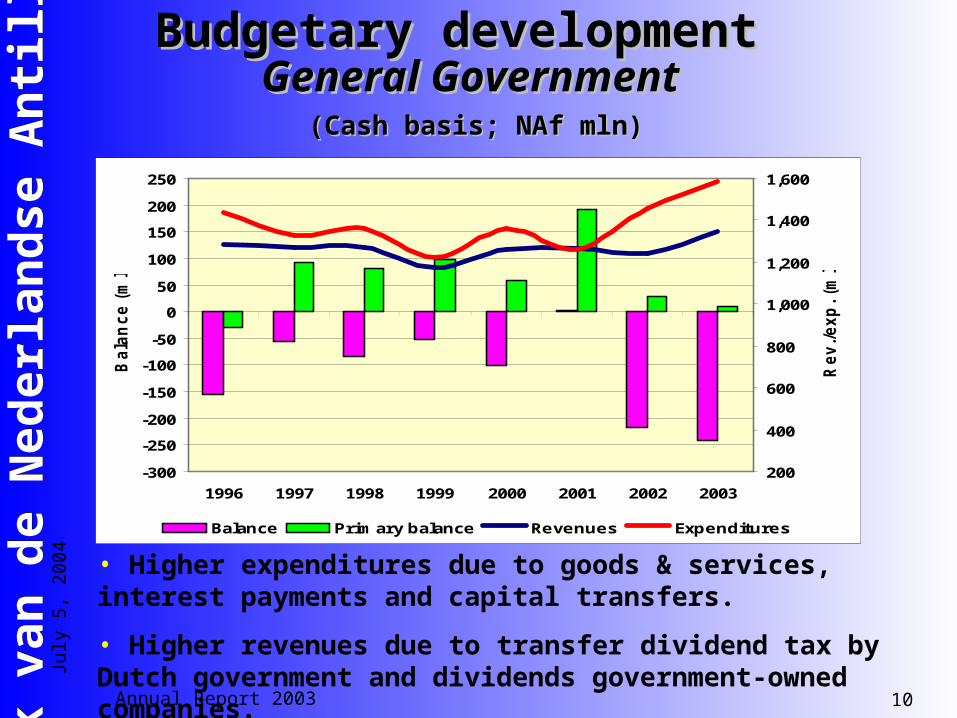
004Budgetary developmentBudgetary development
General GovernmentGeneral Government (Cash basis; NAf mln)(Cash basis; NAf mln)
-300
-250
-200
-150
-100
-50
0
50
100
150
200
250
1996 1997 1998 1999 2000 2001 2002 2003
Bala
nce (
mln
)
200
400
600
800
1,000
1,200
1,400
1,600
Rev./exp
. (m
ln)
Balance Primary balance Revenues Expenditures
• Higher expenditures due to goods & services, interest payments and capital transfers.
• Higher revenues due to transfer dividend tax by Dutch government and dividends government-owned companies.
Annual Report 2003 11
Ban
k v
an
de N
ed
erl
an
dse
An
till
en
Ban
k v
an
de N
ed
erl
an
dse
An
till
en
July
5, 2
004
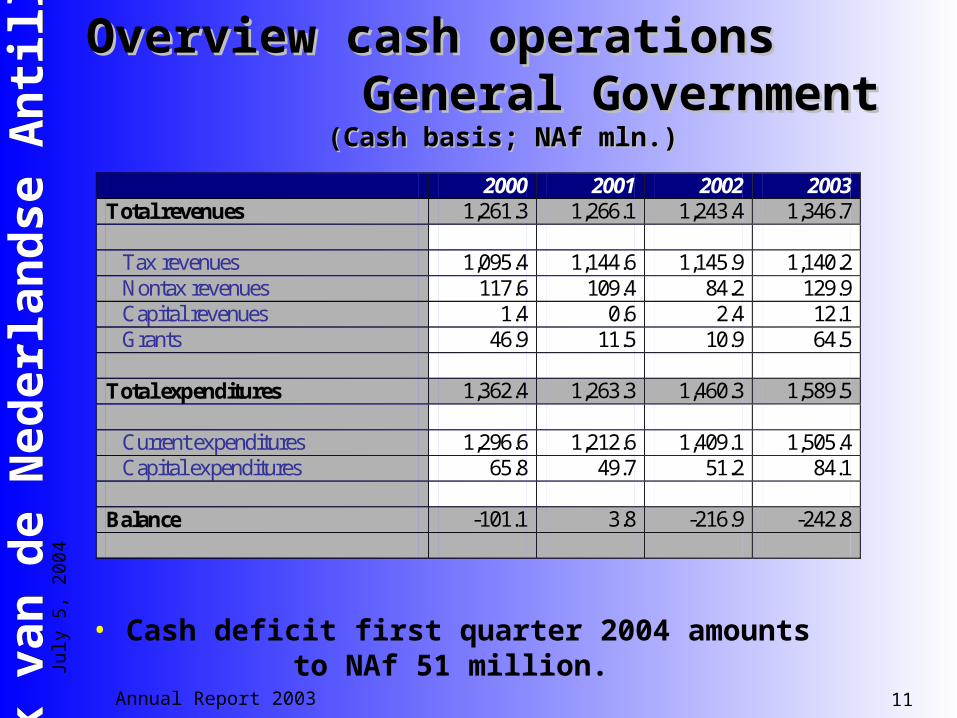
Overview cash operations Overview cash operations General GovernmentGeneral Government
(Cash basis; NAf mln.)(Cash basis; NAf mln.)
2000 2001 2002 2003 Total revenues 1,261.3 1,266.1 1,243.4 1,346.7 Tax revenues 1,095.4 1,144.6 1,145.9 1,140.2 Nontax revenues 117.6 109.4 84.2 129.9 Capital revenues 1.4 0.6 2.4 12.1 Grants 46.9 11.5 10.9 64.5 Total expenditures 1,362.4 1,263.3 1,460.3 1,589.5 Current expenditures 1,296.6 1,212.6 1,409.1 1,505.4 Capital expenditures 65.8 49.7 51.2 84.1 Balance -101.1 3.8 -216.9 -242.8
• Cash deficit first quarter 2004 amounts to NAf 51 million.
Annual Report 2003 12
Ban
k v
an
de N
ed
erl
an
dse
An
till
en
Ban
k v
an
de N
ed
erl
an
dse
An
till
en
July
5, 2
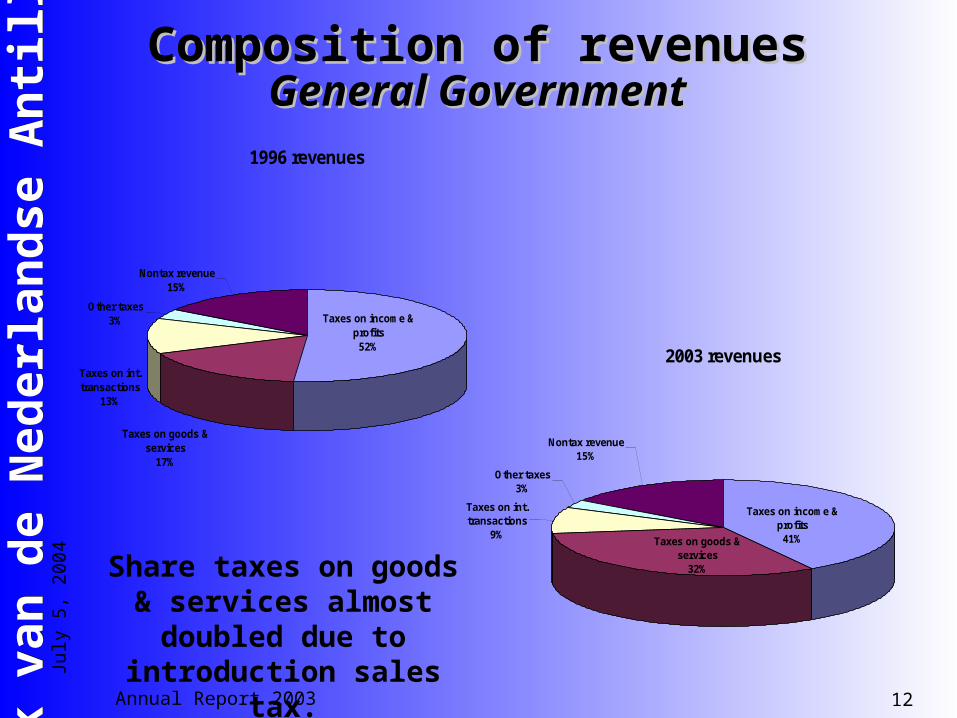
004Composition of revenuesComposition of revenues
General GovernmentGeneral Government1996 revenues
Taxes on goods & services
17%
Taxes on int. transactions
13%
Other taxes3%
Nontax revenue15%
Taxes on income & profits52%
2003 revenues
Taxes on int. transactions
9%
Other taxes3%
Nontax revenue15%
Taxes on goods & services
32%
Taxes on income & profits41%
Share taxes on goods & services almost
doubled due to introduction sales
tax.
Annual Report 2003 13
Ban
k v
an
de N
ed
erl
an
dse
An
till
en
Ban
k v
an
de N
ed
erl
an
dse
An
till
en
July
5, 2
004
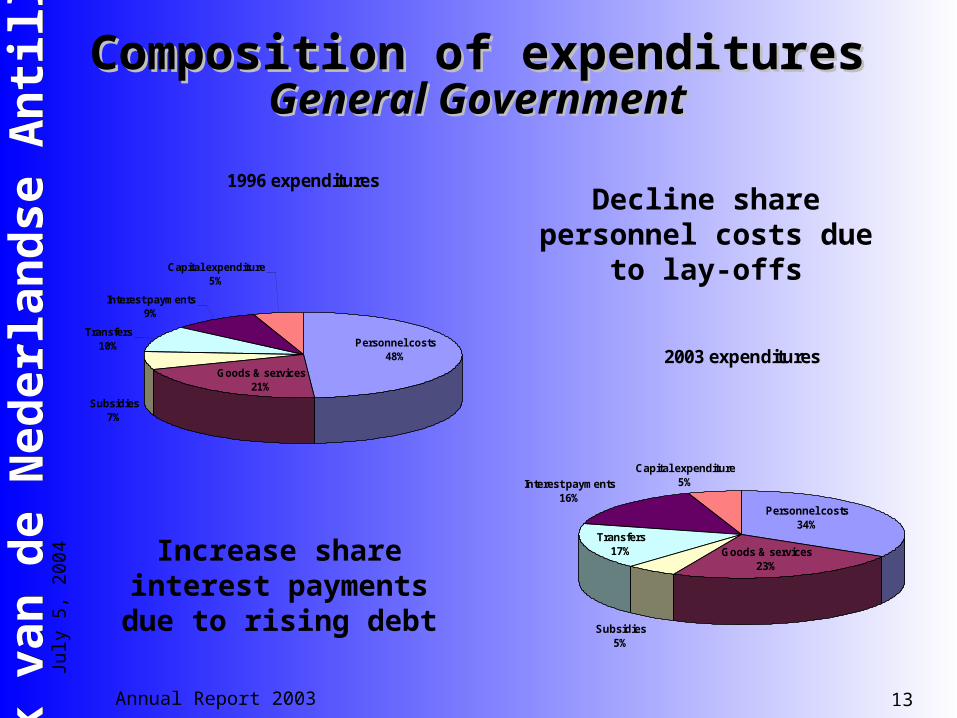
Composition of expendituresComposition of expendituresGeneral GovernmentGeneral Government
1996 expenditures
Subsidies 7%
Transfers10%
Interest payments9%
Capital expenditure5%
Goods & services 21%
Personnel costs48% 2003 expenditures
Subsidies 5%
Interest payments16%
Capital expenditure5%
Transfers17%
Personnel costs34%
Goods & services 23%
Decline share personnel costs due
to lay-offs
Increase share interest payments due to rising debt
Annual Report 2003 14
Ban
k v
an
de N
ed
erl
an
dse
An
till
en
Ban
k v
an
de N
ed
erl
an
dse
An
till
en
July
5, 2
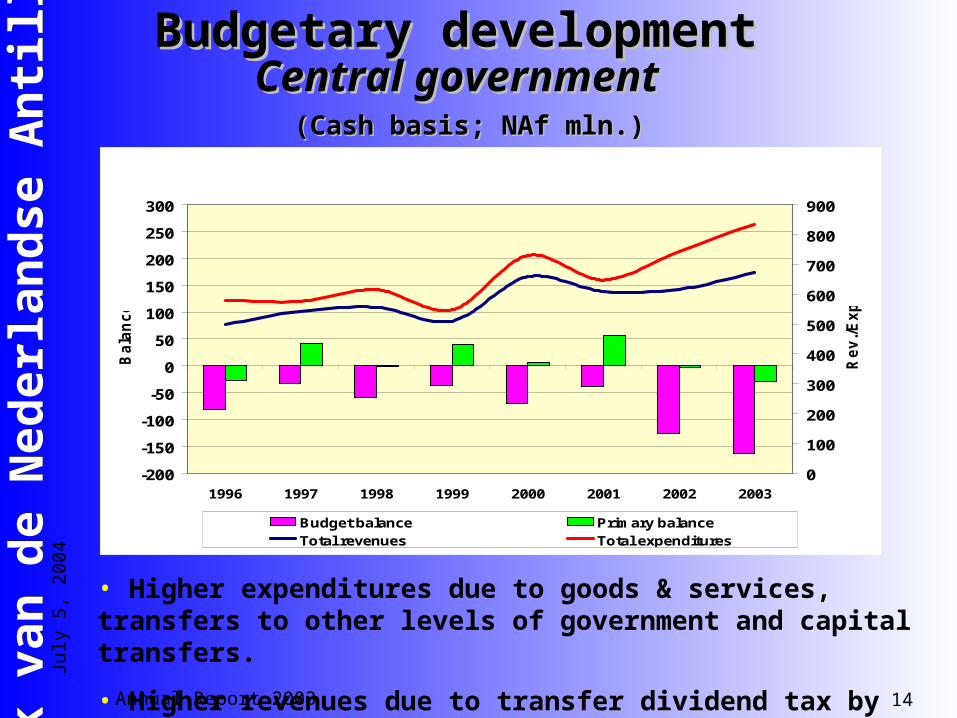
004Budgetary developmentBudgetary development
Central governmentCentral government (Cash basis; NAf mln.)(Cash basis; NAf mln.)
-200
-150
-100
-50
0
50
100
150
200
250
300
1996 1997 1998 1999 2000 2001 2002 2003
Bala
nce
0
100
200
300
400
500
600
700
800
900
Rev./E
xp
.
Budget balance Primary balanceTotal revenues Total expenditures
• Higher expenditures due to goods & services, transfers to other levels of government and capital transfers.
• Higher revenues due to transfer dividend tax by Dutch government.
Annual Report 2003 15
Ban
k v
an
de N
ed
erl
an
dse
An
till
en
Ban
k v
an
de N
ed
erl
an
dse
An
till
en
July
5, 2
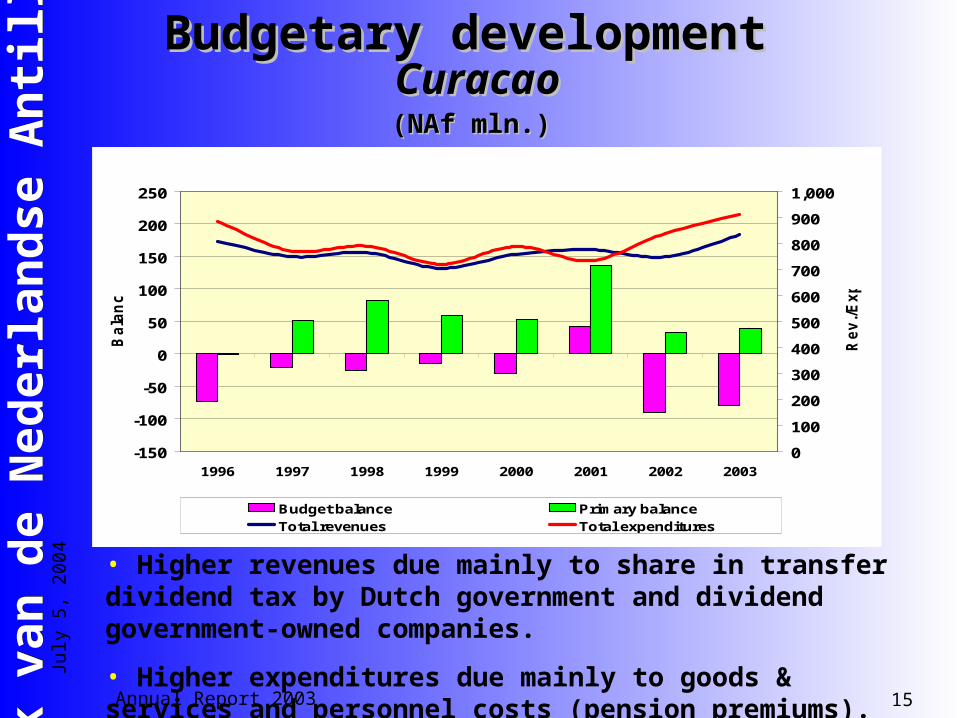
004Budgetary developmentBudgetary development
CuracaoCuracao (NAf mln.)(NAf mln.)
-150
-100
-50
0
50
100
150
200
250
1996 1997 1998 1999 2000 2001 2002 2003
Bala
nce
0
100
200
300
400
500
600
700
800
900
1,000
Rev./E
xp
.
Budget balance Primary balanceTotal revenues Total expenditures
• Higher revenues due mainly to share in transfer dividend tax by Dutch government and dividend government-owned companies.
• Higher expenditures due mainly to goods & services and personnel costs (pension premiums).
Annual Report 2003 16
Ban
k v
an
de N
ed
erl
an
dse
An
till
en
Ban
k v
an
de N
ed
erl
an
dse
An
till
en
July
5, 2
004
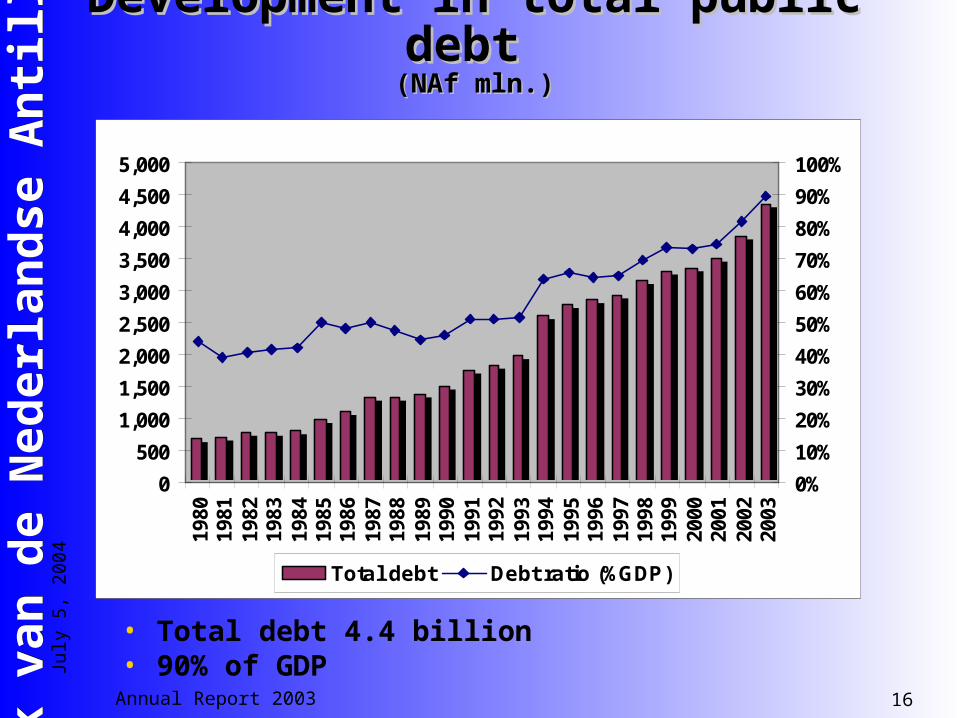
Development in total public Development in total public debtdebt
(NAf mln.)(NAf mln.)
• Total debt 4.4 billion• 90% of GDP
0
500
1,000
1,500
2,000
2,500
3,000
3,500
4,000
4,500
5,000
1980
1981
1982
1983
1984
1985
1986
1987
1988
1989
1990
1991
1992
1993
1994
1995
1996
1997
1998
1999
2000
2001
2002
2003
0%
10%
20%
30%
40%
50%
60%
70%
80%
90%
100%
Total debt Debt ratio (%GDP)
Annual Report 2003 17
Ban
k v
an
de N
ed
erl
an
dse
An
till
en
Ban
k v
an
de N
ed
erl
an
dse
An
till
en
July
5, 2
004
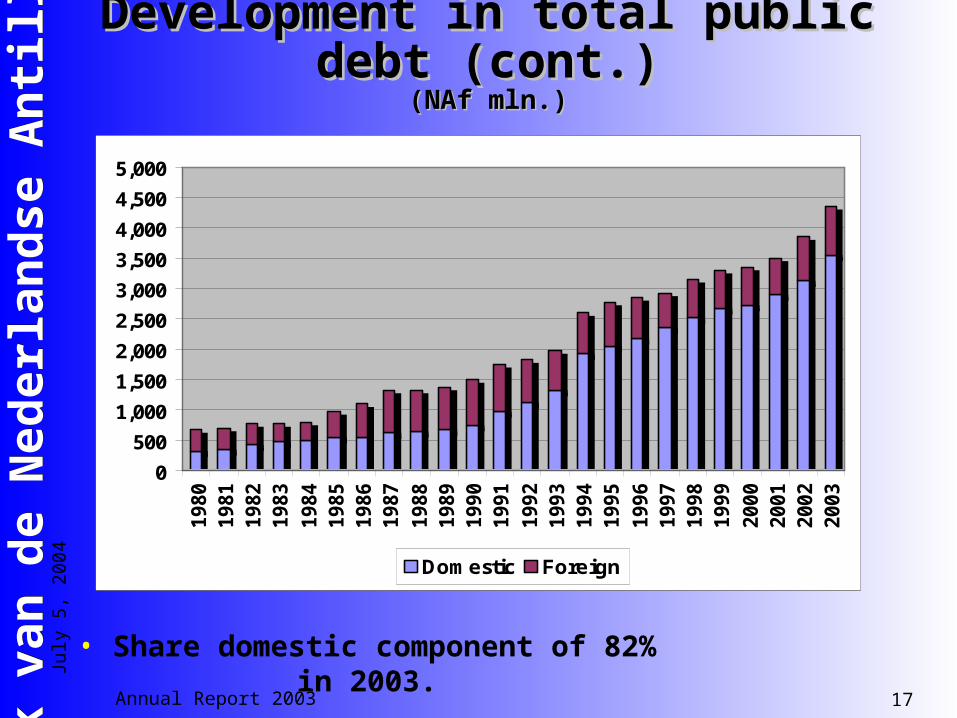
Development in total public Development in total public debt (cont.)debt (cont.)
(NAf mln.)(NAf mln.)
0
500
1,000
1,500
2,000
2,500
3,000
3,500
4,000
4,500
5,000
1980
1981
1982
1983
1984
1985
1986
1987
1988
1989
1990
1991
1992
1993
1994
1995
1996
1997
1998
1999
2000
2001
2002
2003
Domestic Foreign
• Share domestic component of 82% in 2003.
Annual Report 2003 18
Ban
k v
an
de N
ed
erl
an
dse
An
till
en
Ban
k v
an
de N
ed
erl
an
dse
An
till
en
July
5, 2
004
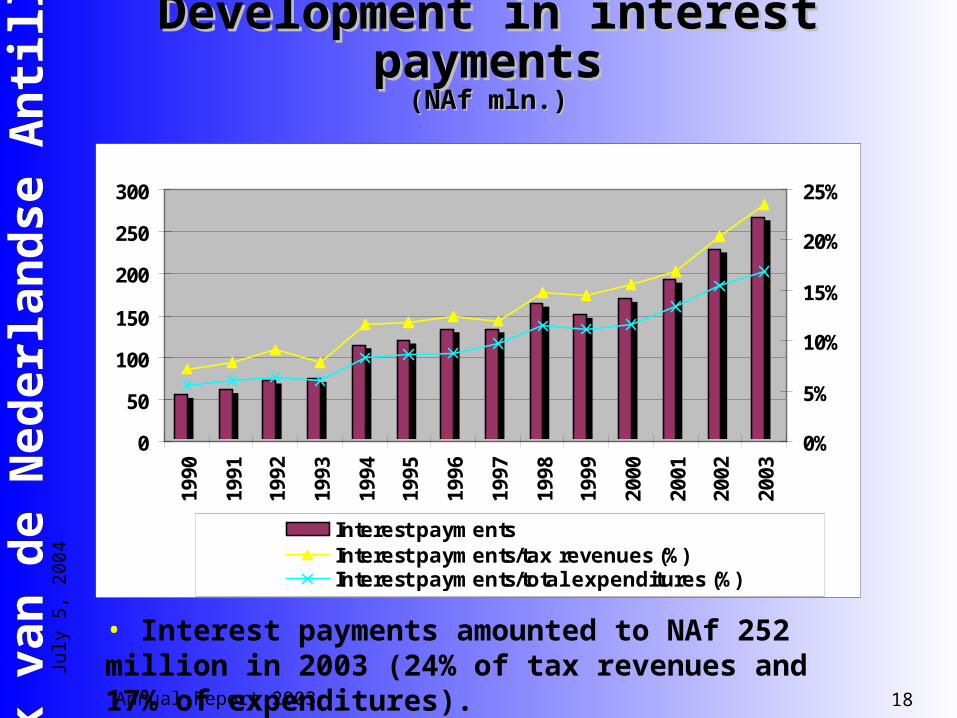
Development in interest Development in interest paymentspayments
(NAf mln.)(NAf mln.)
0
50
100
150
200
250
30019
90
1991
1992
1993
1994
1995
1996
1997
1998
1999
2000
2001
2002
2003
0%
5%
10%
15%
20%
25%
Interest paymentsInterest payments/tax revenues (%)Interest payments/total expenditures (%)
• Interest payments amounted to NAf 252 million in 2003 (24% of tax revenues and 17% of expenditures).
Annual Report 2003 19
Ban
k v
an
de N
ed
erl
an
dse
An
till
en
Ban
k v
an
de N
ed
erl
an
dse
An
till
en
July
5, 2
004
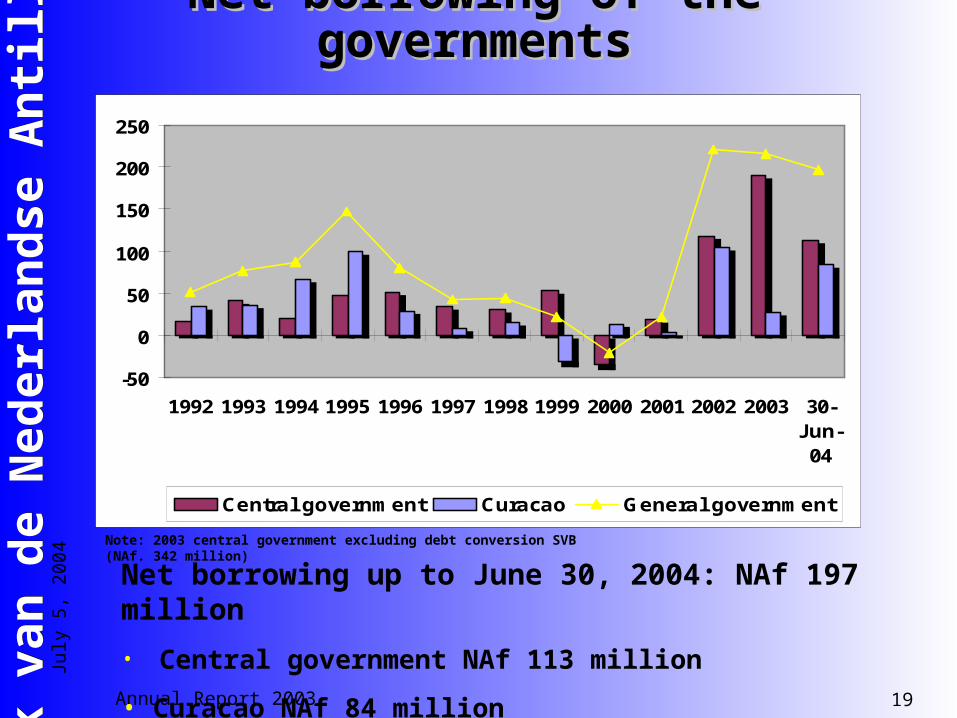
Net borrowing of the Net borrowing of the governmentsgovernments
Net borrowing up to June 30, 2004: NAf 197 million
• Central government NAf 113 million
• Curacao NAf 84 million
Note: 2003 central government excluding debt conversion SVB (NAf. 342 million)
-50
0
50
100
150
200
250
1992 1993 1994 1995 1996 1997 1998 1999 2000 2001 2002 2003 30-Jun-04
Central government Curacao General government
Annual Report 2003 20
Ban
k v
an
de N
ed
erl
an
dse
An
till
en
Ban
k v
an
de N
ed
erl
an
dse
An
till
en
July
5, 2
004
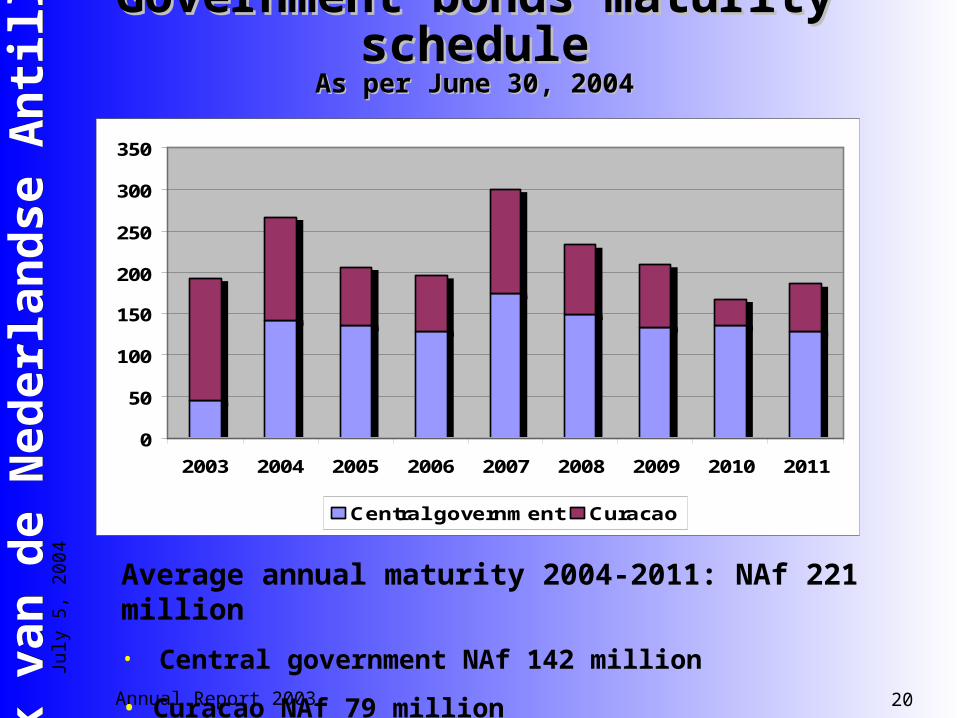
Government bonds maturity Government bonds maturity scheduleschedule
As per June 30, 2004As per June 30, 2004
0
50
100
150
200
250
300
350
2003 2004 2005 2006 2007 2008 2009 2010 2011
Central government Curacao
Average annual maturity 2004-2011: NAf 221 million
• Central government NAf 142 million
• Curacao NAf 79 million

Annual Report 2003 21
Ban
k v
an
de N
ed
erl
an
dse
An
till
en
Ban
k v
an
de N
ed
erl
an
dse
An
till
en
July
5, 2
004
The external The external sectorsector
Annual Report 2003 22
Ban
k v
an
de N
ed
erl
an
dse
An
till
en
Ban
k v
an
de N
ed
erl
an
dse
An
till
en
July
5, 2
004
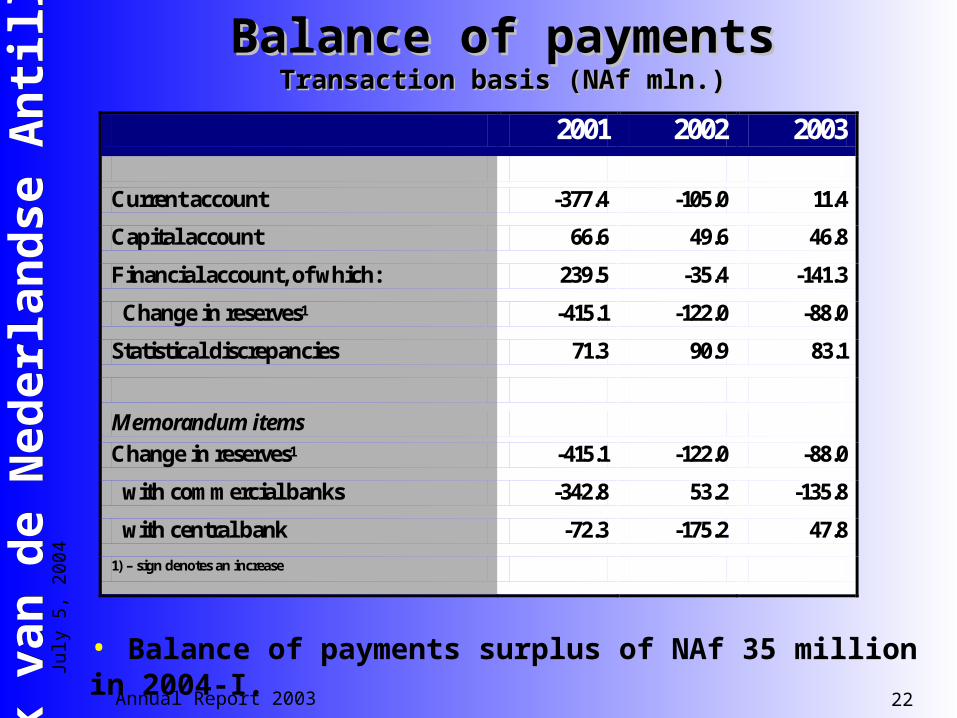
Balance of paymentsBalance of paymentsTransaction basis (NAf mln.)Transaction basis (NAf mln.)
2001 2002 2003 Current account -377.4 -105.0 11.4
Capital account 66.6 49.6 46.8
Financial account, of which: 239.5 -35.4 -141.3
Change in reserves1 -415.1 -122.0 -88.0
Statistical discrepancies 71.3 90.9 83.1
Memorandum items Change in reserves1 -415.1 -122.0 -88.0
with commercial banks -342.8 53.2 -135.8
with central bank -72.3 -175.2 47.8 1) – sign denotes an increase
• Balance of payments surplus of NAf 35 million in 2004-I.
Annual Report 2003 23
Ban
k v
an
de N
ed
erl
an
dse
An
till
en
Ban
k v
an
de N
ed
erl
an
dse
An
till
en
July
5, 2
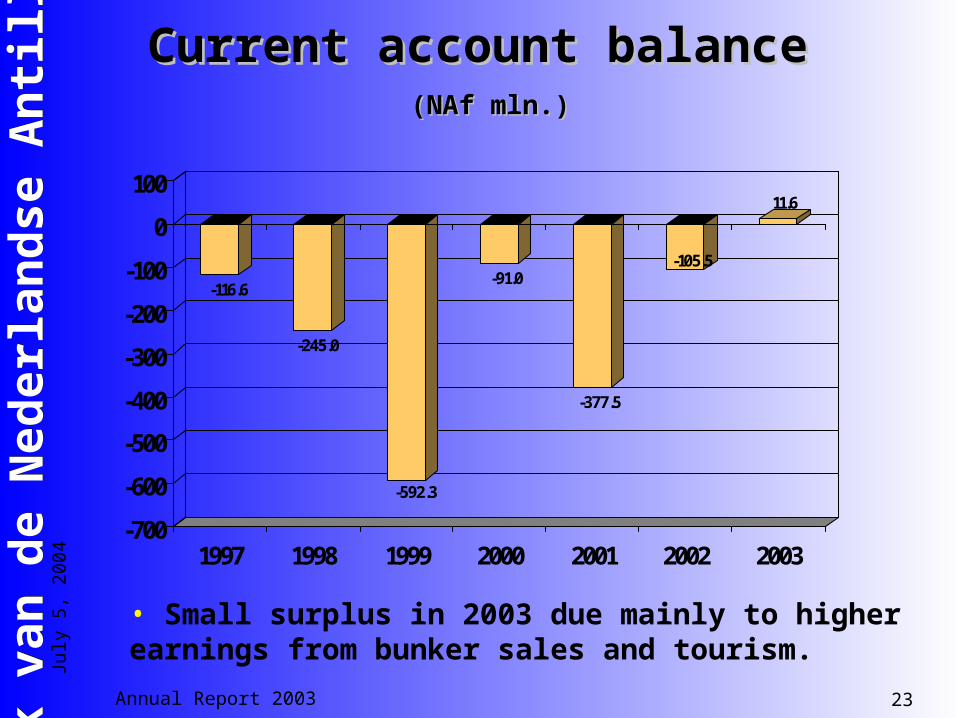
004Current account balanceCurrent account balance
(NAf mln.)(NAf mln.)
-116.6
-245.0
-592.3
-91.0
-377.5
-105.5
11.6
-700
-600
-500
-400
-300
-200
-100
0
100
1997 1998 1999 2000 2001 2002 2003
• Small surplus in 2003 due mainly to higher earnings from bunker sales and tourism.
Annual Report 2003 24
Ban
k v
an
de N
ed
erl
an
dse
An
till
en
Ban
k v
an
de N
ed
erl
an
dse
An
till
en
July
5, 2
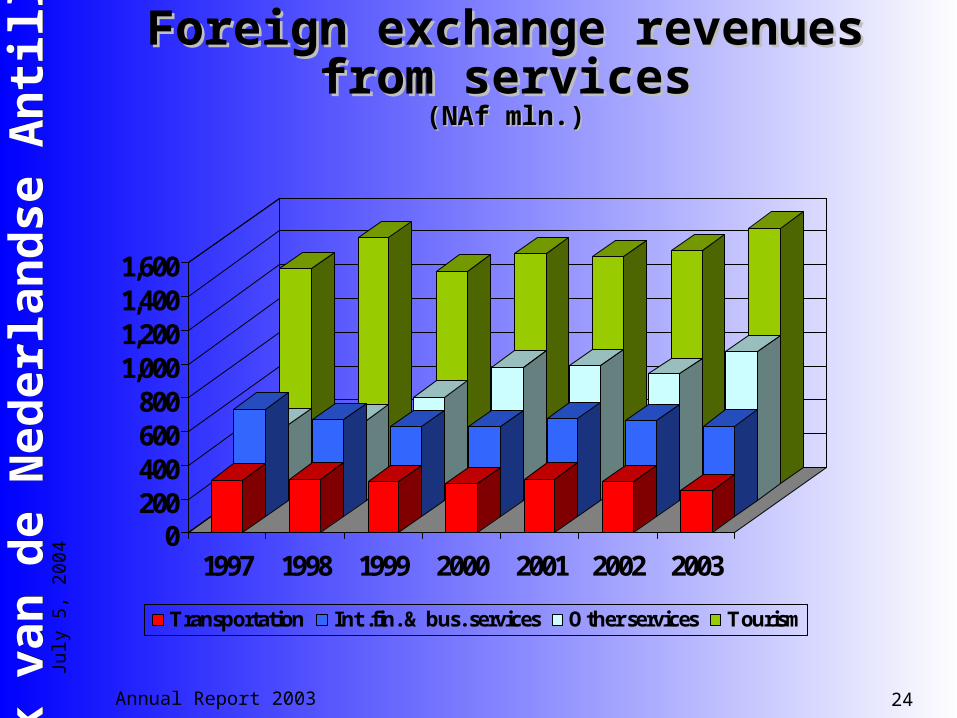
004Foreign exchange revenues Foreign exchange revenues
from servicesfrom services(NAf mln.)(NAf mln.)
0200400600800
1,0001,2001,4001,600
1997 1998 1999 2000 2001 2002 2003
Transportation Int .fin. & bus. services Other services Tourism
Annual Report 2003 25
Ban
k v
an
de N
ed
erl
an
dse
An
till
en
Ban
k v
an
de N
ed
erl
an
dse
An
till
en
July
5, 2
004
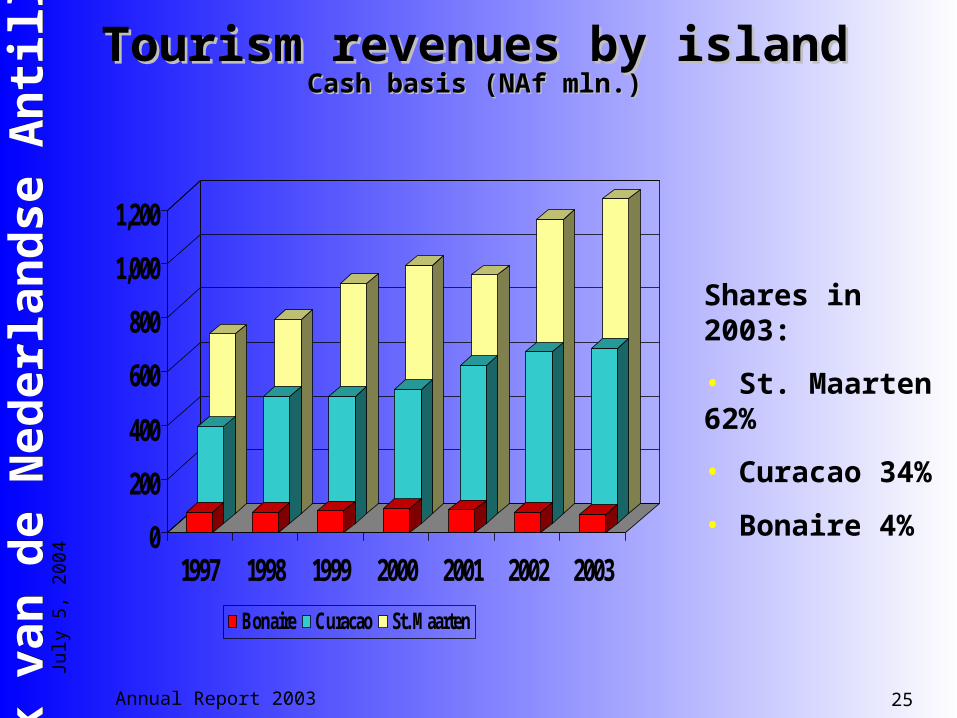
Tourism revenues by islandTourism revenues by islandCash basis (NAf mln.)Cash basis (NAf mln.)
0
200
400
600
800
1,000
1,200
1997 1998 1999 2000 2001 2002 2003
Bonaire Curacao St. Maarten
Shares in 2003:
• St. Maarten 62%
• Curacao 34%
• Bonaire 4%
Annual Report 2003 26
Ban
k v
an
de N
ed
erl
an
dse
An
till
en
Ban
k v
an
de N
ed
erl
an
dse
An
till
en
July
5, 2
004
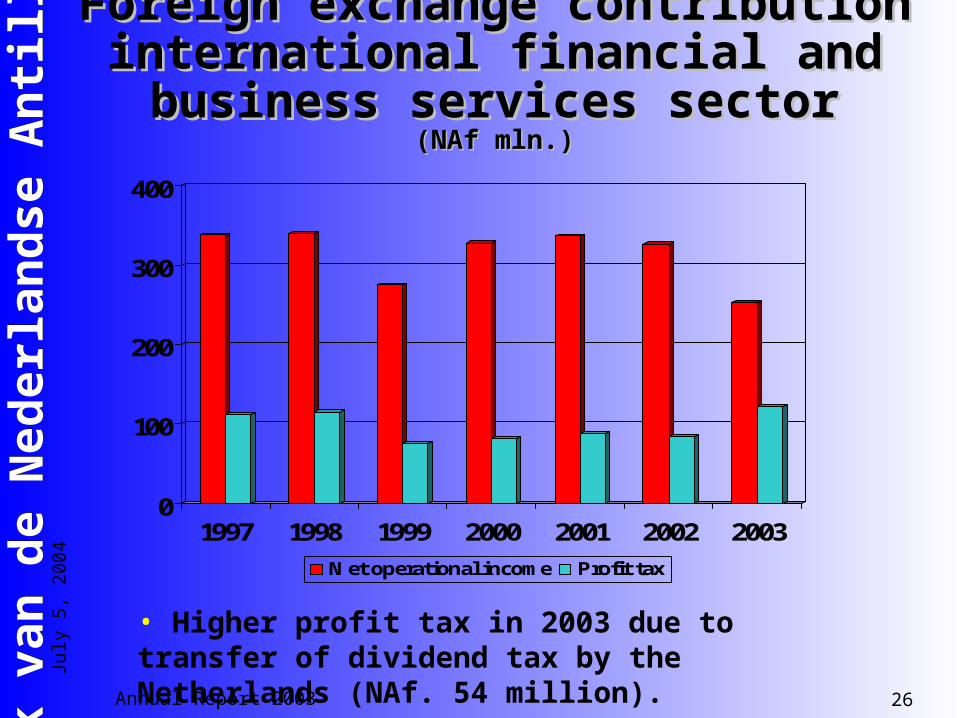
Foreign exchange contribution Foreign exchange contribution international financial and international financial and
business services sectorbusiness services sector(NAf mln.)(NAf mln.)
0
100
200
300
400
1997 1998 1999 2000 2001 2002 2003
Net operational income Profit tax
• Higher profit tax in 2003 due to transfer of dividend tax by the Netherlands (NAf. 54 million).
Annual Report 2003 27
Ban
k v
an
de N
ed
erl
an
dse
An
till
en
Ban
k v
an
de N
ed
erl
an
dse
An
till
en
July
5, 2
004
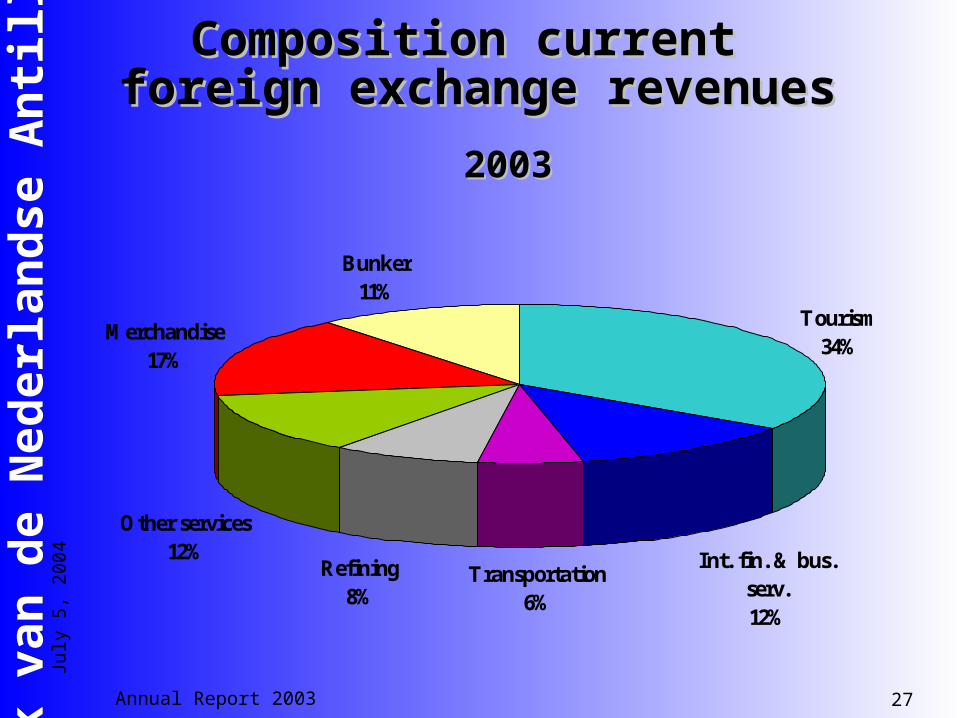
20032003
Composition current Composition current foreign exchange revenuesforeign exchange revenues
Tourism34%
Int. fin. & bus. serv.12%
Transportation6%
Refining8%
Other services12%
Merchandise17%
Bunker11%
Annual Report 2003 28
Ban
k v
an
de N
ed
erl
an
dse
An
till
en
Ban
k v
an
de N
ed
erl
an
dse
An
till
en
July
5, 2
004
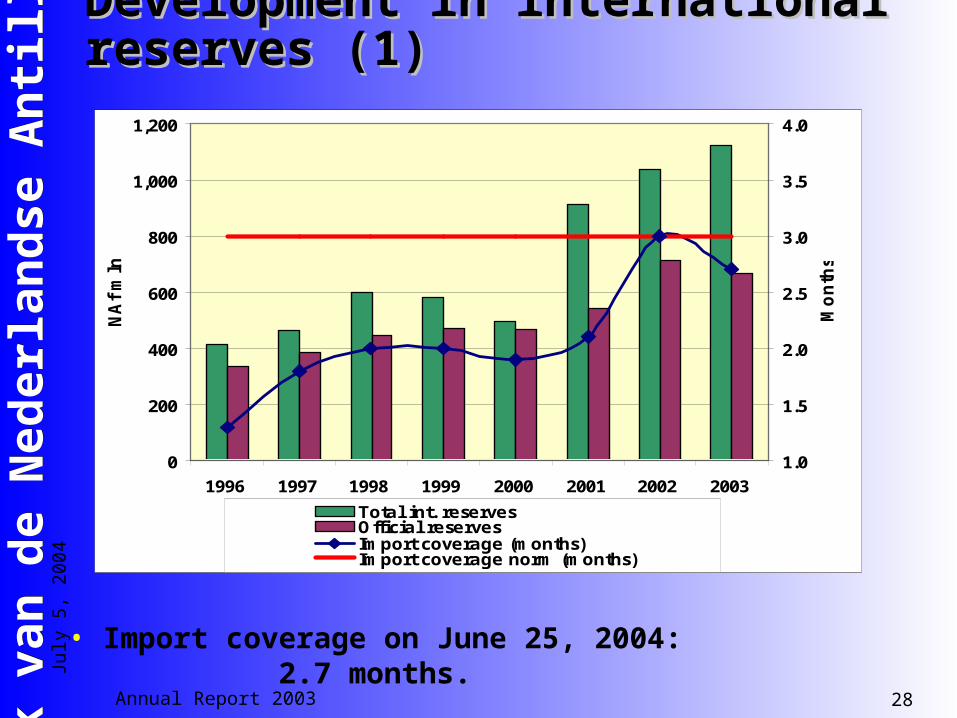
Development in international Development in international reserves (1)reserves (1)
0
200
400
600
800
1,000
1,200
1996 1997 1998 1999 2000 2001 2002 2003
NA
f m
ln.
1.0
1.5
2.0
2.5
3.0
3.5
4.0
Mo
nth
s
Total int. reservesOfficial reservesImport coverage (months)Import coverage norm (months)
• Import coverage on June 25, 2004: 2.7 months.
Annual Report 2003 29
Ban
k v
an
de N
ed
erl
an
dse
An
till
en
Ban
k v
an
de N
ed
erl
an
dse
An
till
en
July
5, 2
004
MonetaryMonetary
developmedevelopmentsnts
Annual Report 2003 30
Ban
k v
an
de N
ed
erl
an
dse
An
till
en
Ban
k v
an
de N
ed
erl
an
dse
An
till
en
July
5, 2
004
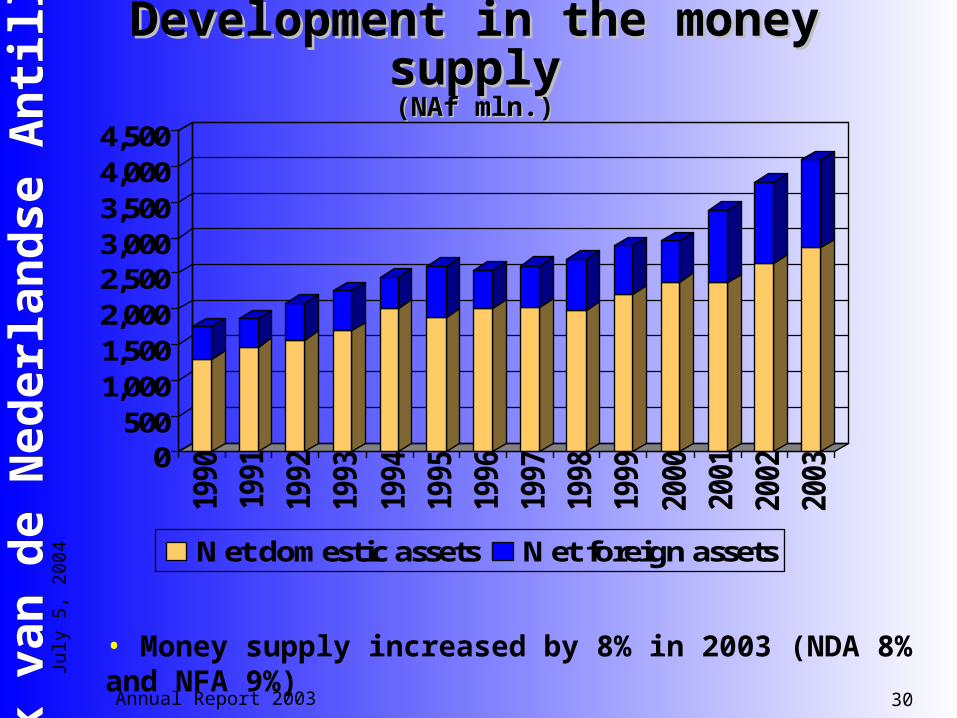
Development in the money Development in the money supplysupply(NAf mln.)(NAf mln.)
0500
1,0001,5002,0002,5003,0003,5004,0004,500
1990
1991
1992
1993
1994
1995
1996
1997
1998
1999
2000
2001
2002
2003
Net domestic assets Net foreign assets
• Money supply increased by 8% in 2003 (NDA 8% and NFA 9%)
Annual Report 2003 31
Ban
k v
an
de N
ed
erl
an
dse
An
till
en
Ban
k v
an
de N
ed
erl
an
dse
An
till
en
July
5, 2
004
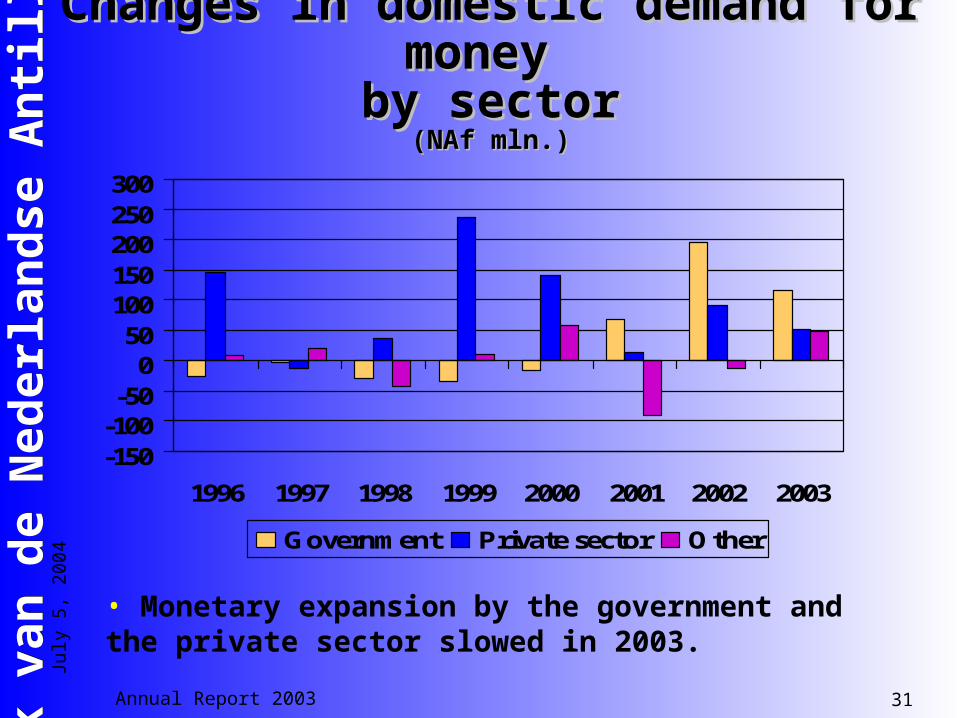
Changes in domestic demand for Changes in domestic demand for money money
by sectorby sector(NAf mln.)(NAf mln.)
-150-100-50
050
100150200250300
1996 1997 1998 1999 2000 2001 2002 2003
Government Private sector Other
• Monetary expansion by the government and the private sector slowed in 2003.
Annual Report 2003 32
Ban
k v
an
de N
ed
erl
an
dse
An
till
en
Ban
k v
an
de N
ed
erl
an
dse
An
till
en
July
5, 2
004
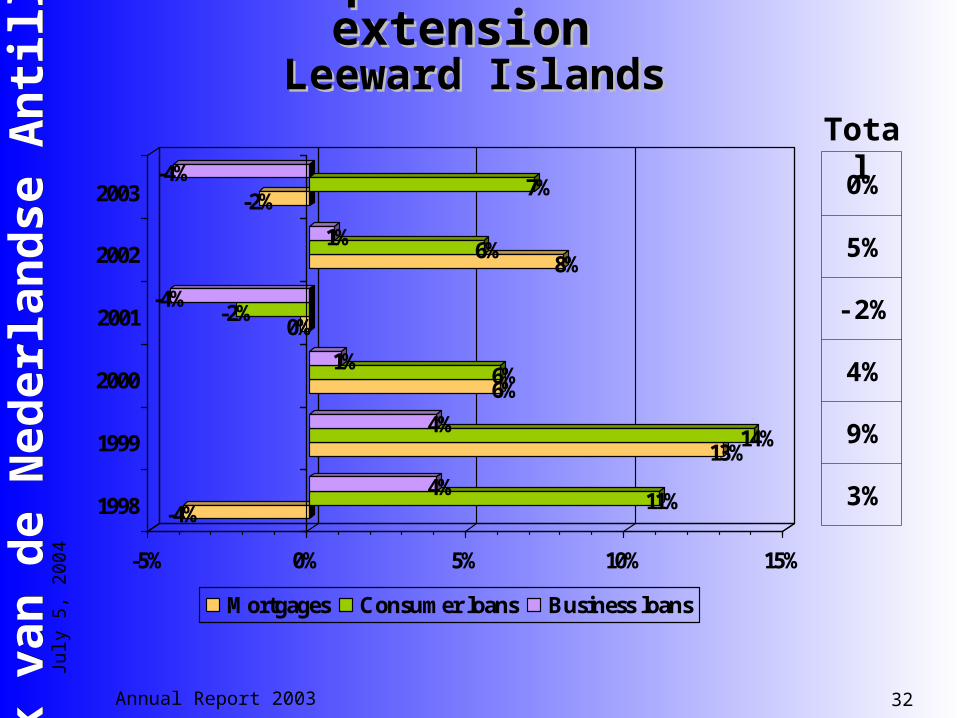
Development in credit Development in credit extension extension
Leeward IslandsLeeward Islands
-4% 11%4%
13%14%
4%
6%6%
1%
0%-2%
-4%
8%6%1%
-2%7%
-4%
-5% 0% 5% 10% 15%
1998
1999
2000
2001
2002
2003
Mortgages Consumer loans Business loans
0%
5%
-2%
4%
9%
3%
Total
Annual Report 2003 33
Ban
k v
an
de N
ed
erl
an
dse
An
till
en
Ban
k v
an
de N
ed
erl
an
dse
An
till
en
July
5, 2
004
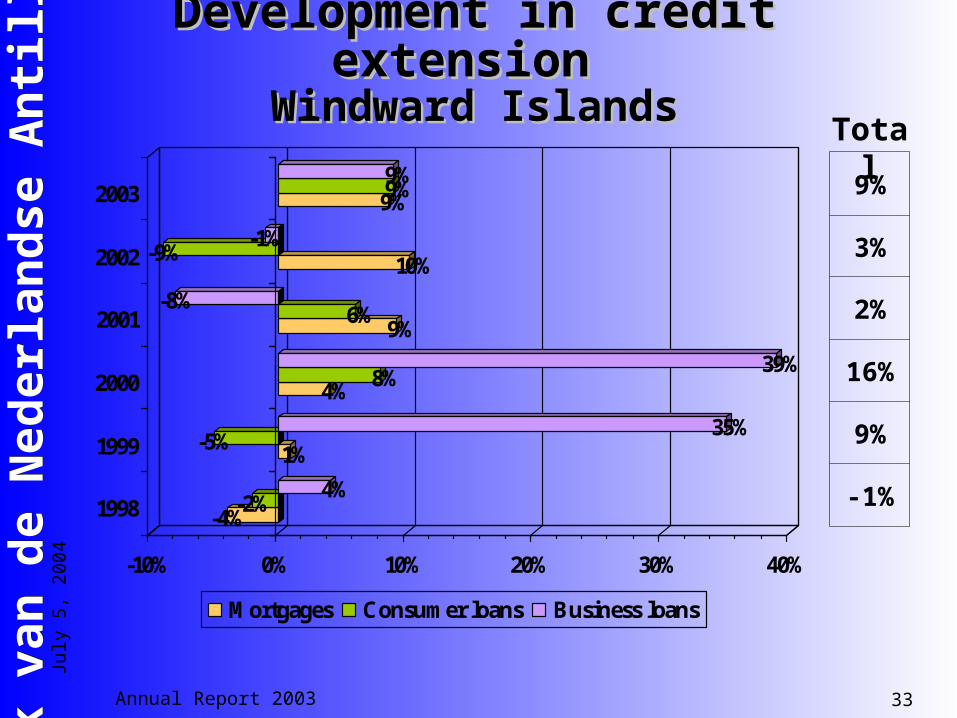
Development in credit Development in credit extension extension
Windward IslandsWindward Islands
-4%-2%
4%
1%-5%35%
4% 8%39%
9%6%
-8%
10%-9%-1%
9%9%9%
-10% 0% 10% 20% 30% 40%
1998
1999
2000
2001
2002
2003
Mortgages Consumer loans Business loans
9%
3%
2%
16%
9%
-1%
Total
Annual Report 2003 34
Ban
k v
an
de N
ed
erl
an
dse
An
till
en
Ban
k v
an
de N
ed
erl
an
dse
An
till
en
July
5, 2
004
Development in domestic Development in domestic interest ratesinterest rates
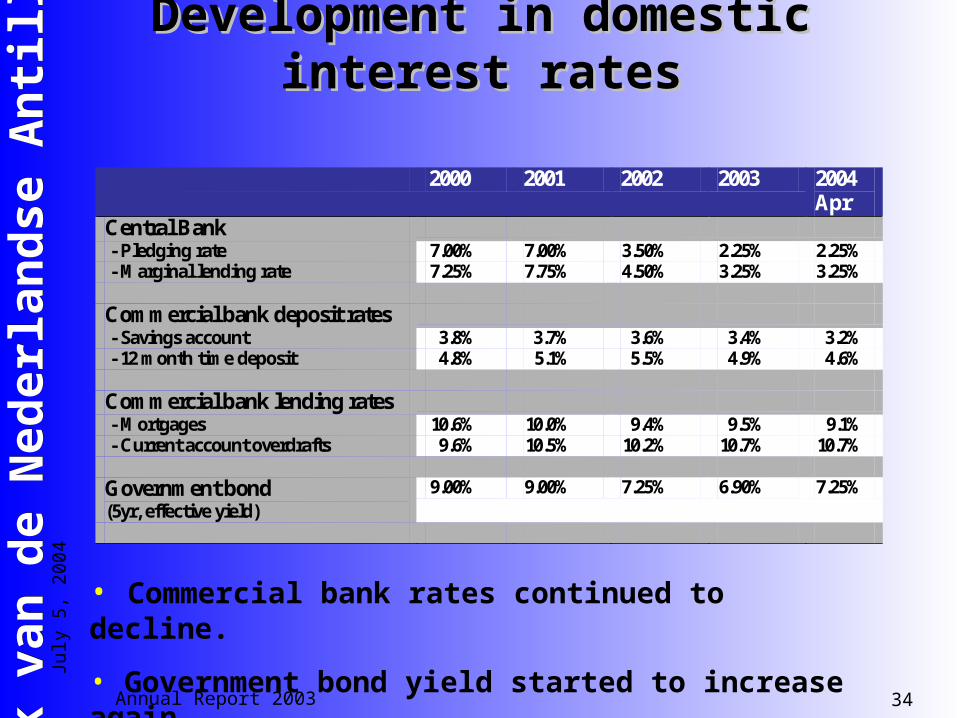
2000 2001 2002 2003 2004 Apr
Central Bank - Pledging rate 7.00% 7.00% 3.50% 2.25% 2.25% - Marginal lending rate 7.25% 7.75% 4.50% 3.25% 3.25% Commercial bank deposit rates - Savings account 3.8% 3.7% 3.6% 3.4% 3.2% - 12 month time deposit 4.8% 5.1% 5.5% 4.9% 4.6% Commercial bank lending rates - Mortgages 10.6% 10.0% 9.4% 9.5% 9.1% - Current account overdrafts 9.6% 10.5% 10.2% 10.7% 10.7% Government bond (5yr, effective yield)
9.00% 9.00% 7.25% 6.90% 7.25%
• Commercial bank rates continued to decline.
• Government bond yield started to increase again.

Annual Report 2003 35
Ban
k v
an
de N
ed
erl
an
dse
An
till
en
Ban
k v
an
de N
ed
erl
an
dse
An
till
en
July
5, 2
004
The financial The financial sectorsector
Annual Report 2003 36
Ban
k v
an
de N
ed
erl
an
dse
An
till
en
Ban
k v
an
de N
ed
erl
an
dse
An
till
en
July
5, 2
004
Macro-prudential indicatorsMacro-prudential indicators
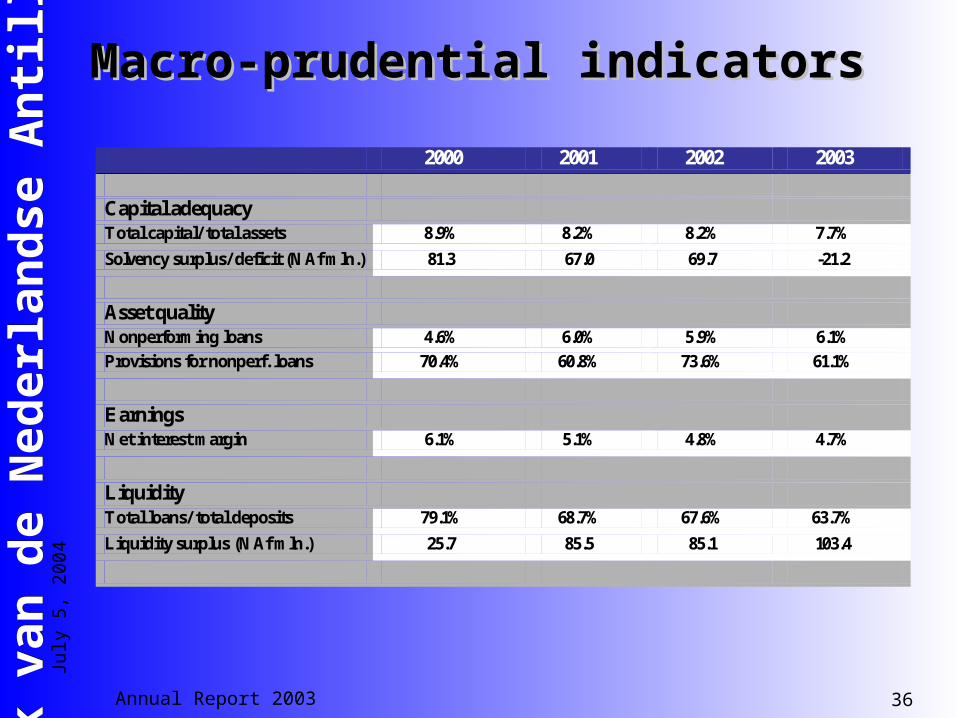
2000 2001 2002 2003 Capital adequacy Total capital/ total assets 8.9% 8.2% 8.2% 7.7%
Solvency surplus/ deficit (NAf mln.) 81.3 67.0 69.7 -21.2
Asset quality Nonperforming loans 4.6% 6.0% 5.9% 6.1% Provisions for nonperf. loans 70.4% 60.8% 73.6% 61.1%
Earnings Net interest margin 6.1% 5.1% 4.8% 4.7%
Liquidity Total loans/ total deposits 79.1% 68.7% 67.6% 63.7%
Liquidity surplus (NAf mln.) 25.7 85.5 85.1 103.4
Annual Report 2003 37
Ban
k v
an
de N
ed
erl
an
dse
An
till
en
Ban
k v
an
de N
ed
erl
an
dse
An
till
en
July
5, 2
004
Balance sheet development Balance sheet development domestic banksdomestic banks
(NAf mln.)(NAf mln.)
0
1,000
2,000
3,000
4,000
5,000
6,000
7,000
1998 1999 2000 2001 2002 2003
Total assets Total liabilities Capital
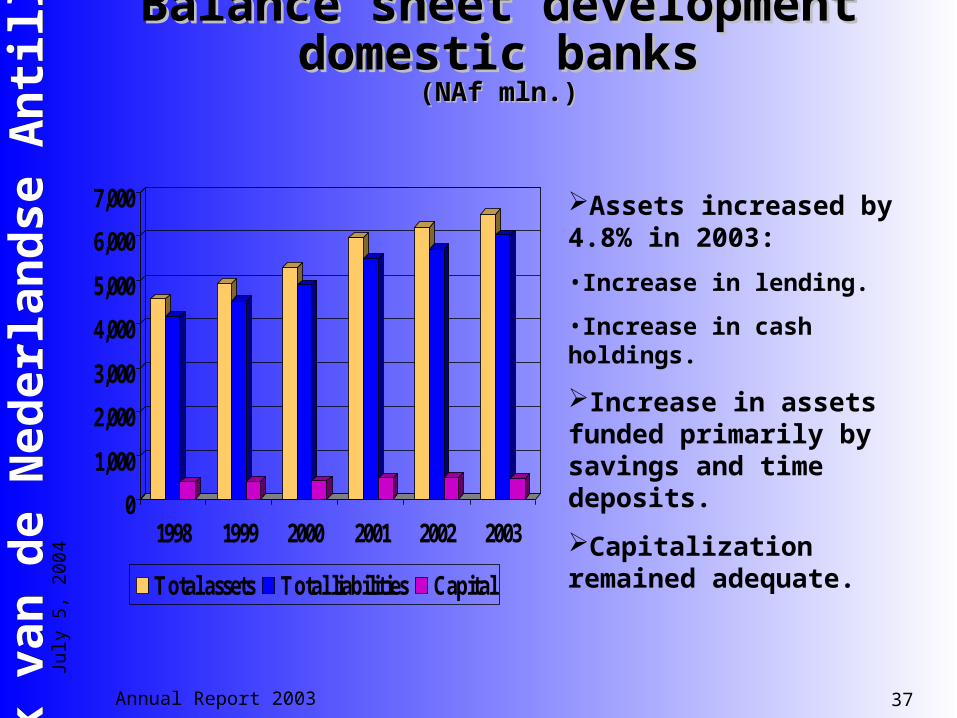
Assets increased by 4.8% in 2003:
•Increase in lending.
•Increase in cash holdings.
Increase in assets funded primarily by savings and time deposits.
Capitalization remained adequate.
Annual Report 2003 38
Ban
k v
an
de N
ed
erl
an
dse
An
till
en
Ban
k v
an
de N
ed
erl
an
dse
An
till
en
July
5, 2
004
P & L development domestic P & L development domestic banksbanks(NAf mln.)(NAf mln.)
050
100150200250300350400450
1998 1999 2000 2001 2002 2003
Operational income Operational exp. NOIBT
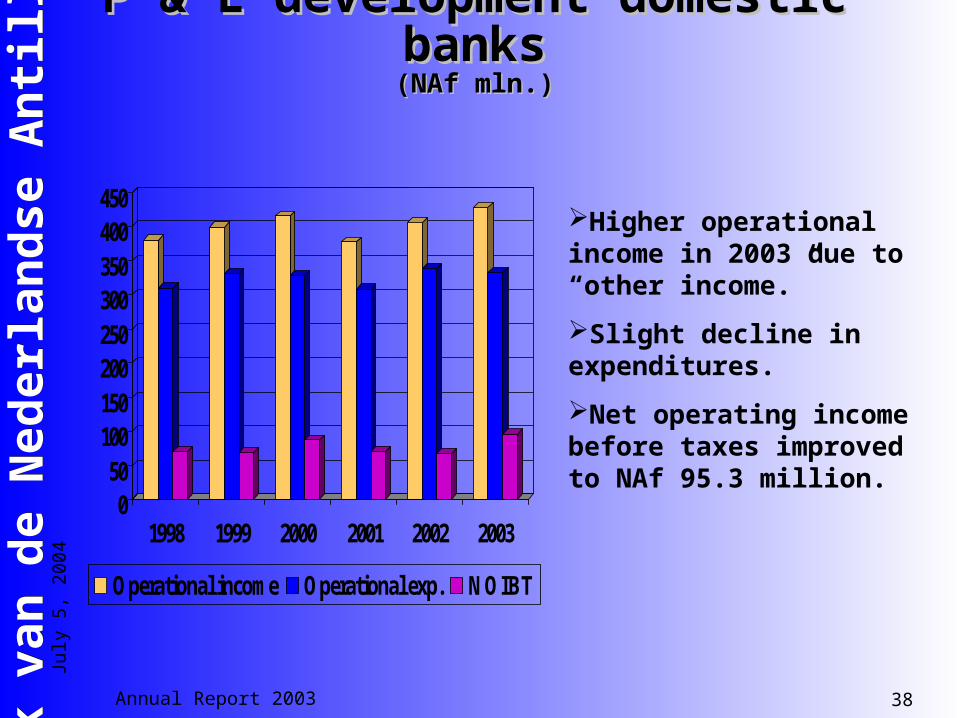
Higher operational income in 2003 due to “other income.”
Slight decline in expenditures.
Net operating income before taxes improved to NAf 95.3 million.
Annual Report 2003 39
Ban
k v
an
de N
ed
erl
an
dse
An
till
en
Ban
k v
an
de N
ed
erl
an
dse
An
till
en
July
5, 2
004
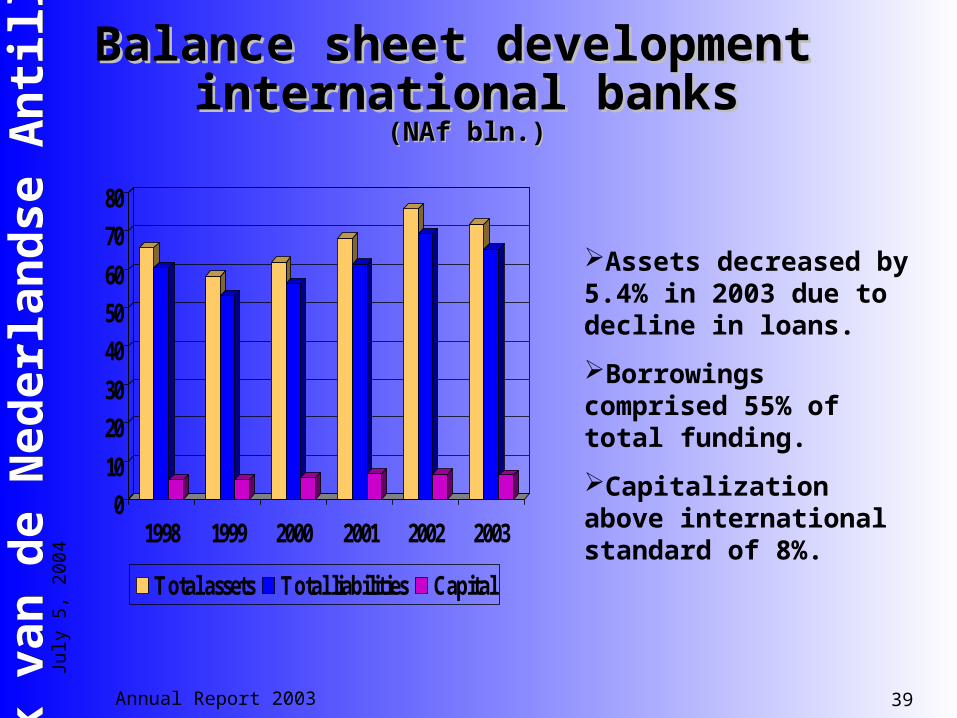
Balance sheet development Balance sheet development international banksinternational banks
(NAf bln.)(NAf bln.)
010
2030
405060
7080
1998 1999 2000 2001 2002 2003
Total assets Total liabilities Capital
Assets decreased by 5.4% in 2003 due to decline in loans.
Borrowings comprised 55% of total funding.
Capitalization above international standard of 8%.

Annual Report 2003 40
Ban
k v
an
de N
ed
erl
an
dse
An
till
en
Ban
k v
an
de N
ed
erl
an
dse
An
till
en
July
5, 2
004
Institutional Institutional investorsinvestors
Annual Report 2003 41
Ban
k v
an
de N
ed
erl
an
dse
An
till
en
Ban
k v
an
de N
ed
erl
an
dse
An
till
en
July
5, 2
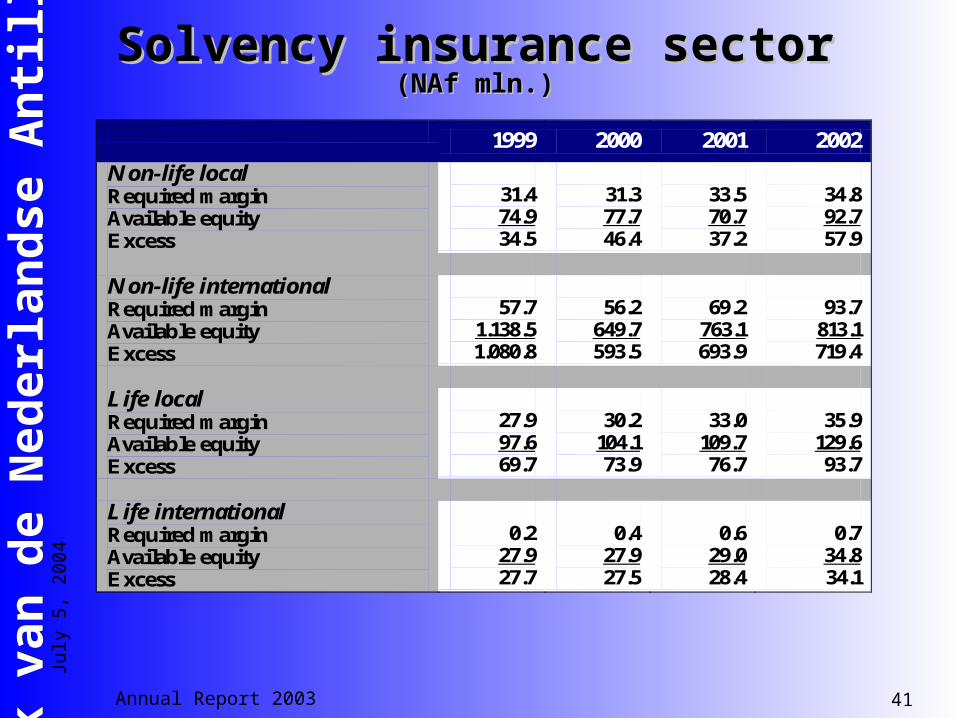
004Solvency insurance sectorSolvency insurance sector
(NAf mln.)(NAf mln.)
1999 2000 2001 2002
Non-life local Required margin Available equity Excess
31.4 74.9 34.5
31.3 77.7 46.4
33.5 70.7 37.2
34.8 92.7 57.9
Non-life international Required margin Available equity Excess
57.7
1.138.5 1.080.8
56.2
649.7 593.5
69.2
763.1 693.9
93.7 813.1 719.4
Life local Required margin Available equity Excess
27.9 97.6 69.7
30.2 104.1 73.9
33.0
109.7 76.7
35.9
129.6 93.7
Life international Required margin Available equity Excess
0.2
27.9 27.7
0.4
27.9 27.5
0.6
29.0 28.4
0.7
34.8 34.1
Annual Report 2003 42
Ban
k v
an
de N
ed
erl
an
dse
An
till
en
Ban
k v
an
de N
ed
erl
an
dse
An
till
en
July
5, 2
004
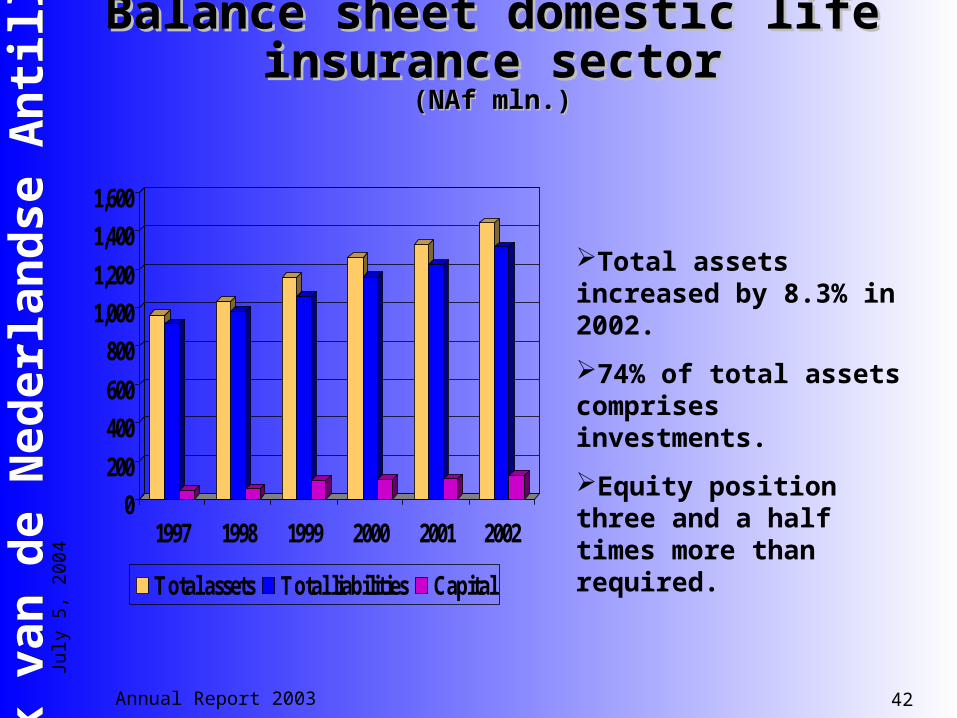
Balance sheet domestic life Balance sheet domestic life insurance sectorinsurance sector
(NAf mln.)(NAf mln.)
0200
400600
8001,0001,200
1,4001,600
1997 1998 1999 2000 2001 2002
Total assets Total liabilities Capital
Total assets increased by 8.3% in 2002.
74% of total assets comprises investments.
Equity position three and a half times more than required.
Annual Report 2003 43
Ban
k v
an
de N
ed
erl
an
dse
An
till
en
Ban
k v
an
de N
ed
erl
an
dse
An
till
en
July
5, 2
004
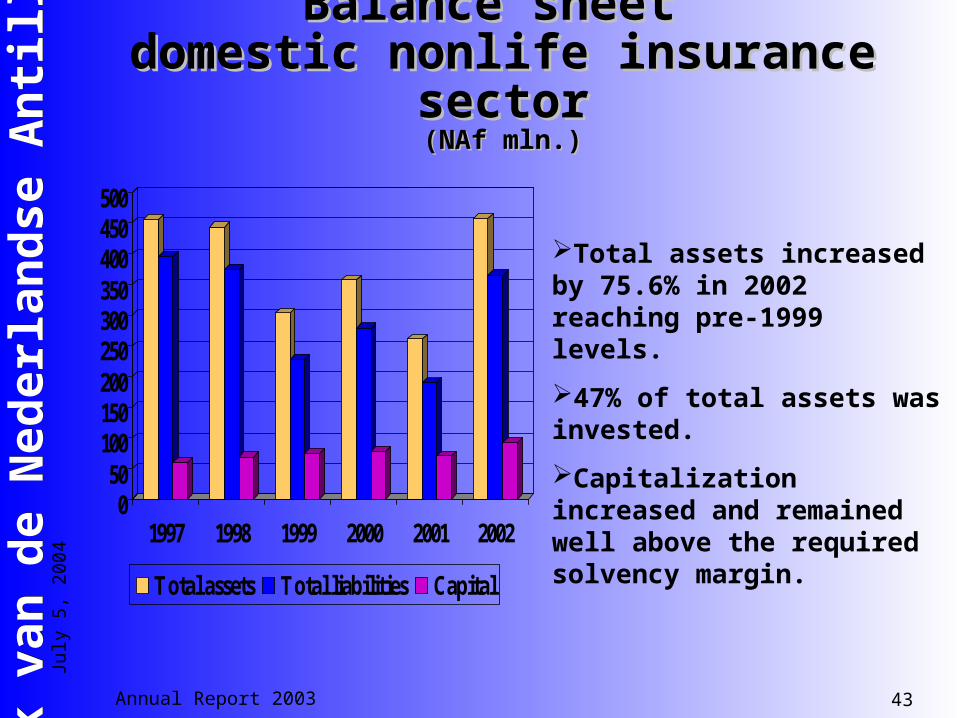
Balance sheet Balance sheet domestic nonlife insurance domestic nonlife insurance
sectorsector(NAf mln.)(NAf mln.)
050
100150200250300350400450500
1997 1998 1999 2000 2001 2002
Total assets Total liabilities Capital
Total assets increased by 75.6% in 2002 reaching pre-1999 levels.
47% of total assets was invested.
Capitalization increased and remained well above the required solvency margin.
Annual Report 2003 44
Ban
k v
an
de N
ed
erl
an
dse
An
till
en
Ban
k v
an
de N
ed
erl
an
dse
An
till
en
July
5, 2
004
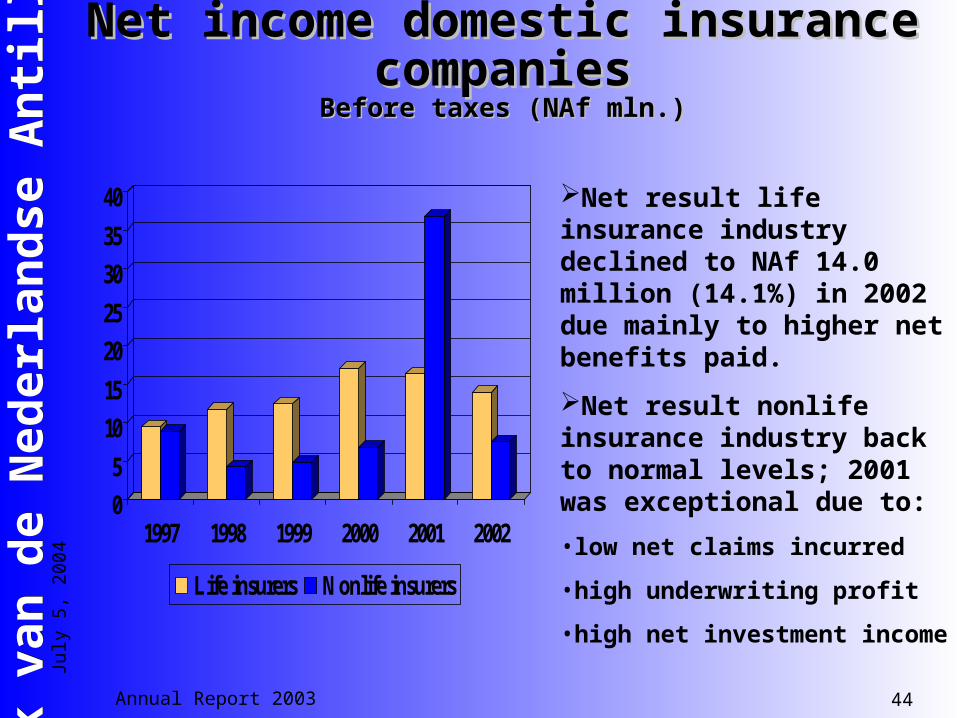
Net income domestic insurance Net income domestic insurance companiescompanies
Before taxes (NAf mln.)Before taxes (NAf mln.)
05
1015
2025
3035
40
1997 1998 1999 2000 2001 2002
Life insurers Nonlife insurers
Net result life insurance industry declined to NAf 14.0 million (14.1%) in 2002 due mainly to higher net benefits paid.
Net result nonlife insurance industry back to normal levels; 2001 was exceptional due to:
•low net claims incurred
•high underwriting profit
•high net investment income

Annual Report 2003 45
Ban
k v
an
de N
ed
erl
an
dse
An
till
en
Ban
k v
an
de N
ed
erl
an
dse
An
till
en
July
5, 2
004
The EndThe EndThe EndThe End