Annual Labour Force Survey -2017 - အလုပ်သမား၊ … Government of the Republic of...
34
The Governm Ministr Annual September, 2017 ment of the Republic of the Union of ry of Labour, Immigration and Popula Department of Labour l Labour Force Survey Quarterly Report (1 st Quarter, January-March 2017) Technically supported by the ILO Myanmar ation -2017 Nay Pyi Taw
Transcript of Annual Labour Force Survey -2017 - အလုပ်သမား၊ … Government of the Republic of...
The Government of the Republic of the Union of MyanmarMinistry of Labour, Immigration and Population
Annual Labour Force Survey
September, 2017
The Government of the Republic of the Union of MyanmarMinistry of Labour, Immigration and Population
Department of Labour
Annual Labour Force Survey
Quarterly Report (1st Quarter, January-March 2017)
Technically supported by the ILO
The Government of the Republic of the Union of Myanmar Ministry of Labour, Immigration and Population
-2017
Nay Pyi Taw


���� х���� ���3������������������
��������+���х��
(����������� ���� х���� 4���(5�+�-����)
Annual Labour Force Survey-2017
Quarterly Report
(1st Quarter, January-March 2017)


U�VW�43�
��������� �'(���)*к+�,к���������- �����'.������(��*к+�/��� ��������01��,к�����
2�+�/������!��- ������������ ����� �хWк���к��W�� 3� к������������������- ���+хW���
���к� �����к�����������#�)���х���к� ��������������"к� ���3������������������к�
���*к���х"#�к�к�V'������� ������������ �X����. +��хWк���� "#�����х#-�� ������������ �X��Y
х"�-���ZхWк��� ���� х���� ���3������������������ �к�к�V'�х�����������W��к� � ����"к�х#-
�5���7
���� х���� ���3�������������������к�к�V'���"�� ��������� ����� ��������
������!"#$ (ILO) к ���������-���к'�+���х#-]�+� ����������&^���"�!��- �к�к�V'� ����"к�х#-�х���
�!��5���7 ���3������������������ ����� 2�+��к����+����- ��������к����+��.к�
������W������- ��������� ����� ��������хWк��W����������!"#$ 01��,к�������_�хWZ���W������-
�!"#$(���W���!��- !"#$���` ������к�к�V'�) �������3��W�� ���������������"к� ��������
+��х��.х"#�)����- �������01��,к��хWк��W���!��- 2�� ���2��"к���Z � ����"к�х#-,к�5���7
���� х���� ���3������������������ (����*к���) �к�к�V'�х���к� 4���(5�+���
������� ����������V������5�(�� ������a�*к+�� �����V���+��+���� ������к�к�к"к�
�b� �� ��'����������� �c,�c� ���������к� к"��� ����к�к�V'��� � ����"к�х#-��������
���d��+������a�*к+�� кхW�������V�����- ����������V���.�� ������к�к�к"к� b к"к�к�
�V�������хZ� �)���х����� �к�к�V'����х#-�х�������х#-���-��"к� ��5��� ������к�к�к"к� ���
к"к��� ��'�������������5��� �e,bfg ���������к� к"��� ����к�к�V'����х#-�5���7 к"��� ���
����� �к�к�V'�х�����������W�� � ����"к������"к� ��������01��,к�����2�+�/����
(�������W��к� +3��'� *к+�,к�������_�����- ������к�к��W����!� ��+��+���(��������х#-]�+�
�������������к�к�V'��Z���/��х"#�� (�������W��к����� ������������������!"#$��!�
�+��х����(�������� � ����"к�х#-�5���7
������������������!"#$�� ��(������'�W��к �хWк���к��W�� ����к���)���������"к�
к"��� ����к�к�V'�)��������W��к� к"��� ���*к+�,к��� ����"к�х#-]�+� к"��� ����к�к�V'̀ �����.
��������х"����1��W��к� ���)�W����Z���х#-,к�5���7 ��]�+����х"����1��W�� к"���W_�������
����"����х���к� ILO Y�к'��+�!��- ������������ National Statistical Office, Social Statistics
Bureau �� Mr. Chirawat Poonsab к ��(��V'���������х#-��� CSPro �хWк���к�
����"����х����X�p����!��- ���������"����х���к� ���� х���� ��������- q]�+���.�"�� (������ �� 2�
�!��- Double Entry � ����"к�х#-]�+� ����"���������-�хWк���к��W�� к�к��+�) ���� ����к� Data
Entry Manager e 2�к *к+�,к��� ����"к�х#-�5���7 ����"���]�+� �хWк���к��W��к�
Mr. Chirawat Poonsab к�����к����)�W����Z���х#-]�+� �хWк���к��W�����V'�х���� Weight
�"к�хWк��х�������- �+���х����������Z�х�����.��"к� ILO Regional Office for Asia and the
Pacific �� Regional Labour Statistician Mr. Tite Habiyakare к�����к�̀ *к+�,к��
� ����"к����х#-�5���7
Vхк#-��. ������к�к�V'�)�������3��W�� ������������������ � ����"к��������
�&к�&к��� �'���5���� ����"к����х#-,к��� ILO �� ��(������'�W��� ������W������- ���������
����� ��������хWк��W����������!"#$ �����'.������2�+�/���� ��(������'�W������- (�������W���
��������01��,к�����2�+�/���� (�������W��� �к� ������V�����W����� ���к"к�� �кW��"�
���хWZ�������_��W������- (�������W��� ��������_�� V�������_�W��� ��'���!��- ���х"����W��к� ��! �
���х#-,к�5��� �����'�W��к� ��'�����кW�4'��������5�,к���� �!��������5���7
Vх������к�к�V'�х����� ����������хWк���к��W���!��- ����������!"�$]!�Z�����к����
����- ��Z������������#�����������W�� ��'���!��- �����������- ������������� �'(5a�W���
+��к�����W�� хW������к��������!�����"�� �����к�"�������Z�������z к{��������!��-
����к�"� V�,к����|�����-���5�,к���� �!��������5���7
2������� "
���������(��*к+�
��������� �'(���)*к+�,к���������- �����'.������(��*к+�/��
����������� ���������������������

����������� �����������������

Annual Labour Force Survey, 2017 - 1st Quarter Report
���� х���� ���3������������������ - �����������+���х��
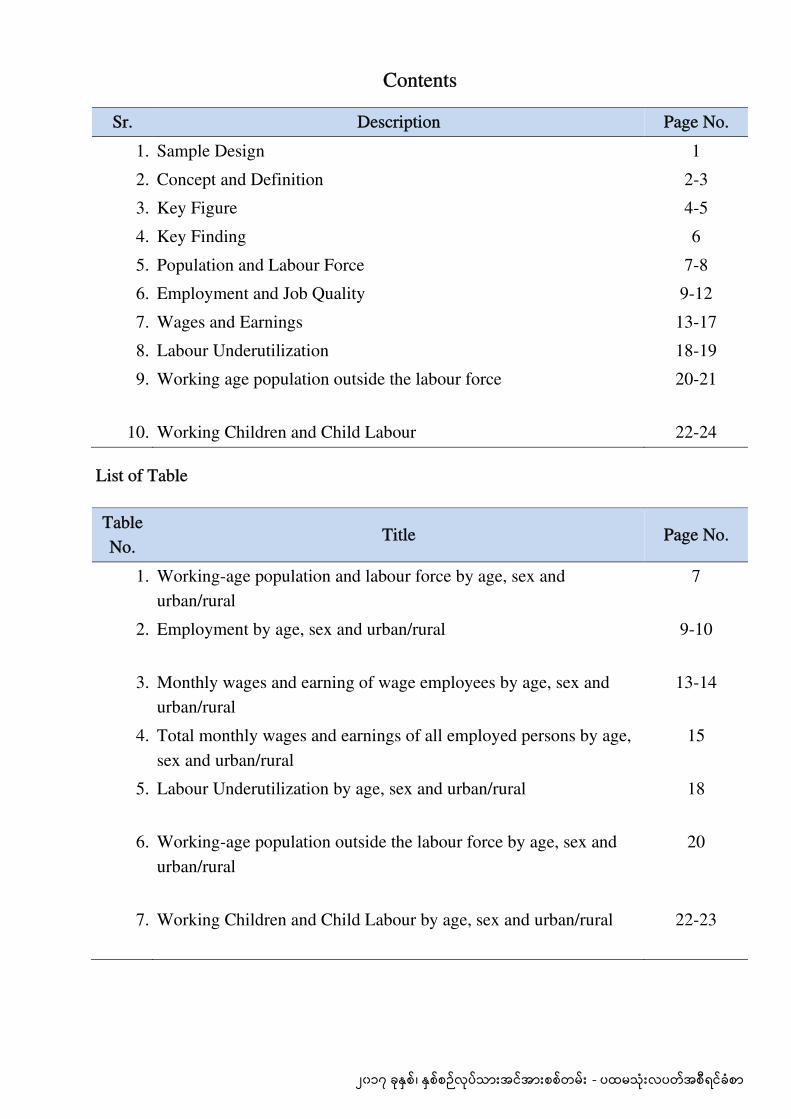
Contents
Sr. Description Page No.
1. Sample Design 1
2. Concept and Definition 2-3
3. Key Figure 4-5
4. Key Finding 6
5. Population and Labour Force 7-8
6. Employment and Job Quality 9-12
7. Wages and Earnings 13-17
8. Labour Underutilization 18-19
9. Working age population outside the labour force
20-21
10. Working Children and Child Labour 22-24
List of Table
Table No.
Title Page No.
1. Working-age population and labour force by age, sex and urban/rural
7
2. Employment by age, sex and urban/rural
9-10
3. Monthly wages and earning of wage employees by age, sex and urban/rural
13-14
4. Total monthly wages and earnings of all employed persons by age, sex and urban/rural
15
5. Labour Underutilization by age, sex and urban/rural
18
6. Working-age population outside the labour force by age, sex and urban/rural
20
7. Working Children and Child Labour by age, sex and urban/rural
22-23

���� х���� ���3������������������ - �����������+���х��
Sample Design
The sample design will be a two stage sampling design. Each type of residency rural
or urban in a State / Region /Union Territory will be treated as a basic stratum. As there are
in total 7 States, 7 Regions and one Union Territory (UT) in the country, there will be
(7+7+1)× 2 = 30 basic strata in total.
Expecting quarterly labour force survey will be conducted after a couple of years,
now it is intended to collect labour market information at high and low seasons. It is
planned to collect first round, Q1 at January-March and at September-November for the
second round Q2. Considering, cost, time and manpower resources the targeted sample
size in terms of FSUs has been determined as 780EAs per each round. In each EA 18
households will be selected for survey. As such, the total expected number of households
to be surveyed will be about 14040 for each round. For annual labour force survey, it will
use data from all rounds.
For allocation of FSUs among urban and rural areas, urban areas were given higher
weight-age to rural areas as 1.5 to 1.0 considering the higher heterogeneity among the
employment characteristics in urban areas and its relatively low population size.
Proportion of urban population in the State ‘Yangon’ was much higher and as such no
over weight-age was given to its urban area. Both urban and rural areas were given the
same weights i.e. 1:1. Further, with a view to produce both domain-level and national-level
estimates the proportional allocation will be adopted with adjustment for minimum sample
size at State level.
���� х���� ���3������������������ - �����������+���х��
2
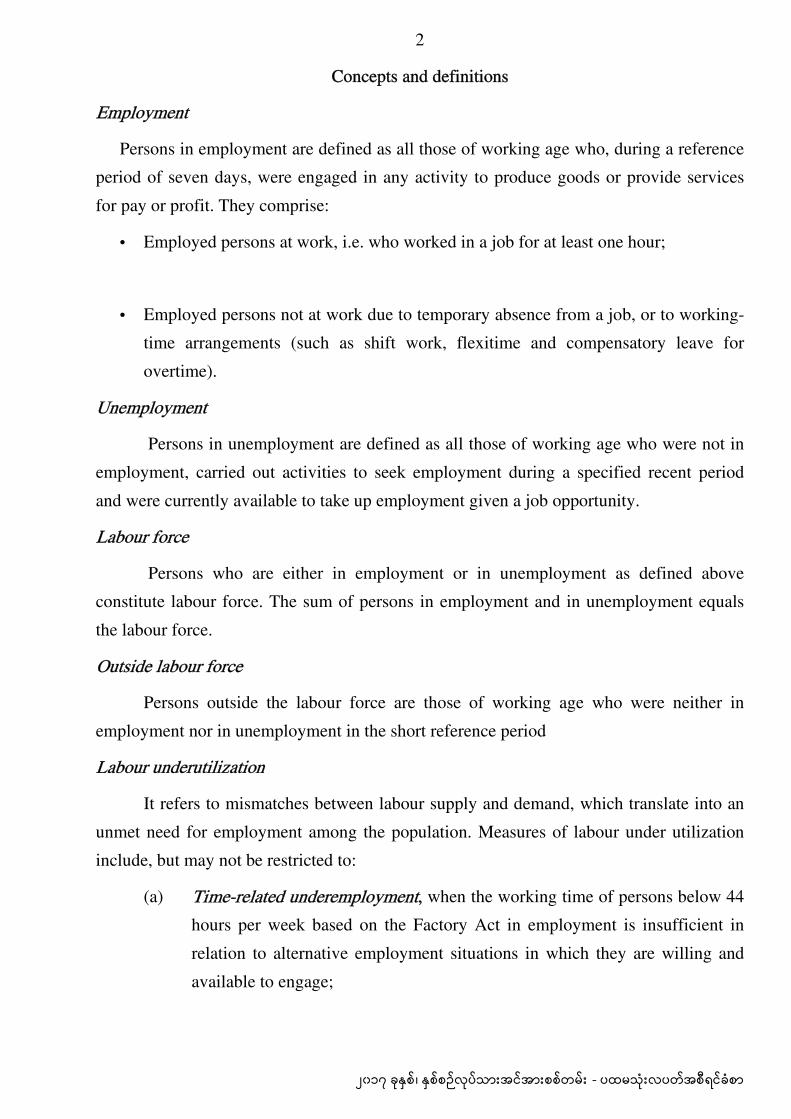
Concepts and definitions
Employment
Persons in employment are defined as all those of working age who, during a reference
period of seven days, were engaged in any activity to produce goods or provide services
for pay or profit. They comprise:
• Employed persons at work, i.e. who worked in a job for at least one hour;
• Employed persons not at work due to temporary absence from a job, or to working-
time arrangements (such as shift work, flexitime and compensatory leave for
overtime).
Unemployment
Persons in unemployment are defined as all those of working age who were not in
employment, carried out activities to seek employment during a specified recent period
and were currently available to take up employment given a job opportunity.
Labour force
Persons who are either in employment or in unemployment as defined above
constitute labour force. The sum of persons in employment and in unemployment equals
the labour force.
Outside labour force
Persons outside the labour force are those of working age who were neither in
employment nor in unemployment in the short reference period
Labour underutilization
It refers to mismatches between labour supply and demand, which translate into an
unmet need for employment among the population. Measures of labour under utilization
include, but may not be restricted to:
(a) Time-related underemployment, when the working time of persons below 44
hours per week based on the Factory Act in employment is insufficient in
relation to alternative employment situations in which they are willing and
available to engage;

���� х���� ���3������������������ - �����������+���х��
3
(b) Unemployment, reflecting an active job search by persons not in employment
who are available for this form of work; and
(c) Potential labour force, referring to persons not in employment who express
an interest in this form of work but for whom existing conditions limit their
active job search and/or their availability.
Child
In accordance with the ILO—s Worst Forms of Child Labour Convention No. 182
(1999), and the United Nations Convention on the Rights of the Child, a child should be
defined as an individual under 18 years old. For this survey, the target population for
measuring child labour comprises all persons in the age group from 5 to 17 years, where
age is measured as the number of completed years at the child—s last birthday.
Child labour
As such, in Myanmar, there is no official definition on child labour yet. Therefore,
the definitions followed in this survey are in accordance with the international practices
where working children of the following types are considered as child labour:
i. Age 5-17 and engaged in hazardous work for pay or profit for at least one hour per week or working in the night time (6 p.m. to 6 a.m.) for pay or profit;
OR
ii. Age 5-11 and engaged for at least one hour per week for pay or profit;
OR
iii. Age 12-14 and engaged for more than 24 hours per week;
OR
iv. Age 15-17 and engaged in work more than 44 hours a week for pay or profit.
The remaining working children are not regarded as child labour in this report and
are labelled working children other than child labour.
���� х���� ���3������������������ - �����������+���х��
4
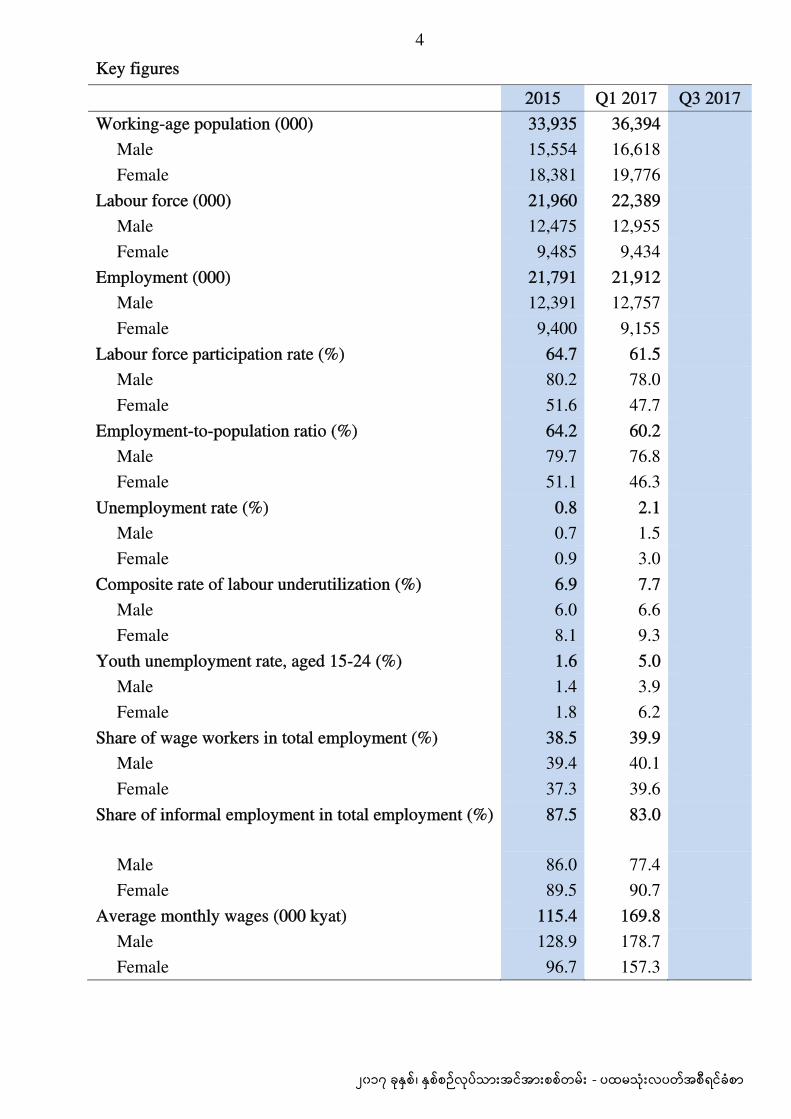
Key figures
2015 Q1 2017 Q3 2017 Working-age population (000) 33,935 36,394
Male 15,554 16,618 Female 18,381 19,776
Labour force (000) 21,960 22,389 Male 12,475 12,955 Female 9,485 9,434
Employment (000) 21,791 21,912 Male 12,391 12,757 Female 9,400 9,155
Labour force participation rate (%) 64.7 61.5 Male 80.2 78.0 Female 51.6 47.7
Employment-to-population ratio (%) 64.2 60.2 Male 79.7 76.8 Female 51.1 46.3
Unemployment rate (%) 0.8 2.1 Male 0.7 1.5 Female 0.9 3.0
Composite rate of labour underutilization (%) 6.9 7.7 Male 6.0 6.6 Female 8.1 9.3
Youth unemployment rate, aged 15-24 (%) 1.6 5.0 Male 1.4 3.9 Female 1.8 6.2
Share of wage workers in total employment (%) 38.5 39.9 Male 39.4 40.1 Female 37.3 39.6
Share of informal employment in total employment (%)
87.5 83.0
Male 86.0 77.4 Female 89.5 90.7
Average monthly wages (000 kyat) 115.4 169.8 Male 128.9 178.7 Female 96.7 157.3

���� х���� ���3������������������ - �����������+���х��
5
2015 Q1 2017 Q3 2017 Total children population aged 5-17 years(000) 12,146 12,410
Male 6,010 6,157 Female 6,136 6,253
Working children in total population of children (%)
10.5 6.5
Male 11.3 7.3 Female 9.8 5.7
Child labour in total population of children (%) 9.3 5.0 Male 10.0 5.7 Female 8.5 4.4

���� х���� ���3������������������ - �����������+���х��
6
Key findings
• In 2017, the working-age population (aged 15+) was 36,394 thousand, of which slightly
more than one-half were women.
• The labour force participation rate was 61.5 percent, however the rate for men was
considerably higher than that for women by 30.3 percentage points.
• Employment totalled 21,912 thousand, with women accounting for only 41.8 percent,
and the vast majority of employment was based in rural areas (72.3 percent).
• Only 39.9 percent of all workers were wage employees, and a vast majority (77.7
percent) were either own-account or contributing family workers.
• Employment was heavily concentrated in the agricultural sector (48.8 percent),
followed by wholesale and retail trade (15.9 percent), Manufacturing (10.8 percent) and
transportation and storage (4.7 percent).Education accounted for 3.0 percent of total
employment.
• The overall unemployment rate was 2.1 percent, with a male-female gap of 1.5
percentage points, which is double for female compared to male rate.
• The overall composite rate of labour underutilization was 7.7 percent, and the male-
female gap was 2.7 in percentage points. The key component that drives such high
labour underutilization is not unemployment, but rather underemployment (at 6.6
percent).
• In comparison, the youth unemployment rate was significantly higher (5.0 percent), and
the rate was higher for young women (6.2 percent) compared to young men (3.9
percent).
• Average monthly wages were 169.8 thousand kyat and substantially lower for women
vis-à-vis men.
• Total population of children (aged 5-17) accounted for 12,410 thousand. Among them,
805 thousand are working children, and 637 thousand were found in child labour, i.e.
5.1 percent (5.9 percent for males and 4.4 percent for female).

���� х���� ���3������������������ - �����������+���х��
7
1. Population and labour force
Table 1. Working-age population and labour force by age, sex and urban/rural
Male Female Urban Rural Total
Working-age population (000)
16,618 19,776 10,591 25,803 36,394
By age 15-24 4,115 4,513 2,408 6,220 8,628 25-34 3,593 4,196 2,174 5,615 7,789 35-44 3,230 3,733 2,030 4,933 6,963 45-54 2,630 3,172 1,816 3,986 5,802 55-64 1,800 2,284 1,185 2,899 4,084 65+ 1,250 1,878 978 2,150 3,128
Labour force (000) 12,955 9,434 6,241 16,148 22,389 By age
15-24 2,541 2,120 1,117 3,544 4,661 25+ 10,414 7,314 5,124 12,604 17,728
By education (% distribution) Less than primary 24.7 24.9 13.2 29.3 24.8 Completed primary 59.6 55.2 53.7 59.4 57.8 Completed secondary 9.3 7.8 14.3 6.6 8.7 Tertiary (first stage or
completed) 6.3 12.0 18.9 4.8 8.7
Labour force participation rate (%) 78.0 47.7 58.9 62.6 61.5 By age
15-24 61.7 47.0 46.4 57.0 54.0 25+ 83.3 47.9 62.6 64.4 63.9
Source: Myanmar Annual Labour Force Survey, Q1 2017
In 2017, the working-age population (aged 15+) was 36.4 million and among them
females constitute 54.3 percent while males, 45.7 percent. In terms of rural and urban
areas, rural area is covers 70.9 percent of working age population while urban area, 29.1
percent. It is relatively higher percentage in younger age groups among the distribution of
working age population for each 10 years age groups of working age population.

���� х���� ���3������������������ - �����������+���х��
8
The labour force was 22.4 million and in which youths constitute20.8 percent while
adults, 79.2 percent. The labour force participation for youth was lower than that of adult,
but female participation rates of both youths and adults were nearly equal as 47.0 percent
and 47.9 percent.
61.5 percent of working age population in the country constitutes labour force and
remaining 38.5 percent is outside the labour force. Among the males, labour force
constitutes 78.0 percent and for females, 51.4 percent. For both males and females, labour
force participation is higher in rural areas than urban areas and for both urban and rural
areas labour force participation is higher for males than females.
The labour force participation in urban and rural areas is somewhat close to working
age population structure in urban and rural areas. In contrast, participation of females is
lower than males although females are numerically higher in working age population.
The distribution of persons by attainment of education level for labour force, the
highest was at primary completed level. Although there is gross similarity between the
distributions of males and females, the proportion of females is higher at the tertiary of
whether first stage or completed. As regards to attaining a higher level of education, the
proportion is favourable in urban compared to rural.

���� х���� ���3������������������ - �����������+���х��
9
2. Employment and job quality
Table 2. Employment by age, sex and urban/rural
Male Female Urban Rural Total
Employment (000) 12,757 9,155 6,071 15,841 21,912 By age
15-24 2,442 1,988 1,033 3,397 4,430 25+ 10,315 7,167 5,038 12,444 17,482
By broad industry (% distribution) Agriculture 51.6 44.9 9.3 63.9 48.8 Industry 19.1 16.1 28.0 13.9 17.8 Services 29.3 39.0 62.7 22.1 33.4 By economic sector (% distribution)
Agriculture, forestry and fishery 51.6 44.9 9.3 63.9 48.8 Mining and quarrying 1.7 0.5 0.8 1.4 1.2 Manufacturing 8.7 13.7 17.4 8.3 10.8 Electricity, gas, etc 0.1* 0.0* 0.2* 0.1* 0.1* water supply and other 0.2* 0.1* 0.4* 0.0* 0.2* Construction 8.3 1.7 9.2 4.2 5.5 Wholesale and retail trade 10.9 23.0 31.2 10.1 15.9 Transportation and storage
7.7 0.4* 9.3 2.9 4.7
Accommodation and food services 1.4 2.3 3.4 1.2 1.8 Information and communications 0.2* 0.1* 0.5 0.0* 0.2 Financial and insurance activities 0.2* 0.6 1.1 0.1* 0.4 Real estate activities 0.2* 0.1* 0.4* 0.1* 0.2* Professional, technical 0.3 0.3* 0.6 0.2* 0.3 Administrative 1.0 0.9 2.6 0.3* 0.9 Public administration and defence 0.8 0.5 1.3 0.4 0.7 Education 1.3 5.4 5.1 2.2 3.0 Human health and social work activities 0.4 0.9 1.7 0.2* 0.6 Arts, Entertainment and Recreation
0.2* 0.1* 0.4* 0.0* 0.1*
Other service activities 4.6 4.3 4.6 4.4 4.5 Activities of households as employers 0.1* 0.1* 0.2* 0.0* 0.1* Activities of extraterritorial
0.0* 0.1* 0.2* 0.0* 0.0*
Source: Myanmar Annual Labour Force Survey, Q1 2017 * Denotes high relative error from too few observations (<50 cases)

���� х���� ���3������������������ - �����������+���х��
10
Male Female Urban Rural Total
By employment status (% distribution) Employees 40.1 39.6 47.5 37.0 39.9 Employers 3.2 1.2 2.2 2.5 2.4 Own-account workers 41.1 24.2 35.4 33.5 34.0 Contributing family workers 15.5 35.0 14.9 27.0 23.7
By occupation (% distribution) Managers 0.8 0.5 2.0 0.2 0.7 Professionals 1.5 5.8 5.8 2.3 3.3 Technicians and associate professionals 1.8 1.1 3.6 0.7 1.5 Clerical support workers
1.4 2.6 4.7 0.8 1.9
Services and sales workers 11.6 24.3 33.1 10.6 16.9 Skilled agricultural workers
36.6 30.4 7.3 44.2 34.0
Craft and related trades workers 12.1 10.0 19.0 8.2 11.2 Plant and machine operators and assemblers
8.1 1.5 9.8 3.6 5.3
Elementary occupations 26.1 23.8 14.5 29.2 25.1 Armed forces occupations 0.2 0.1 0.2 0.1 0.1
By informal status (% distribution)
Informal 77.4 90.7 78.7 84.6 83.0 Formal 22.6 9.3 21.3 15.4 17.0 Employment in the informal sector
58.9 62.1 55.7 62.0 60.2
Informal employment outside the informal sector
19.6 29.8 23.8 23.9 23.9
Source: Myanmar Annual Labour Force Survey, Q1 2017

���� х���� ���3������������������ - �����������+���х��
11
In 2017, 48.8 percent of the employed persons were working in Agriculture, forestry
and fishing section. It is followed by Wholesale and retail trade (15.9 percent),
manufacturing (10.8 percent), construction (5.5 percent), transportation and storage (4.7
percent), other service activities (4.5 percent), education (3.0 percent). All other section
accounts less than 3percent.
The main occupations are: skilled agricultural workers (34.0percent), elementary
occupations (25.1 percent), service and sales workers (16.9 percent) and craft and related
trades workers (11.2 percent).
Comparing over male and female, the pattern of distribution by industry section is
more or less similar. But, the proportion of females in industry section (i) manufacturing
section (ii) Wholesale and retail trade and (iii) education is significantly higher than males
while the just opposite for industry sections (i) Construction and (ii) Transportation and
Storage.
Comparing type of residence, in rural area, the distribution of agriculture, forestry
and fishery section occupied large portion (63.9 percent), higher share of distribution from
other sections are developed in urban area.
Among the 15+ population employed persons constitute 60.2 percent and in turn
employees constitute 39.9 percent of the employed persons while employer occupied 2.4
percent, own account accounts 34 percent and 23.7 percent by unpaid family workers.
In urban areas proportion of employees among employed persons is higher than
rural areas while it is just opposite for unpaid family worker. The proportion of employers
also own account worker are more or less in both urban and rural areas.

���� х���� ���3������������������ - �����������+���х��
12
As regards male and female employed persons, the category employer has higher
proportion for males than females and the same is true for own account workers. Females
are proportionately higher in the category unpaid family workers. This shows the
household or family business are prone to be owned by male partners and females are
prone to be unpaid family workers. And there is gross similarity between the distributions
of males and females, for the employees.
The same as other developing countries, informal employment is very large and at
the national level, informal employment is accounted 83 percent. Relatively, presence of
formal employment is higher in urban areas than rural areas. For the gender perspective,
the share of females in informal employment was much higher than that of male. At the
national level, employment in the informal sector was 60.2 percent and informal
employment outside the informal sector was 23.9 percent.

���� х���� ���3������������������ - �����������+���х��
13
3. Wages and earnings
Table 3. Monthly wages and earnings of wage employees by age, sex and urban/rural
Male Female Urban Rural Total
Average monthly wages and earnings (000 kyat)
178.7 157.3 235.9 137.4 169.8
By age 15-24 150.3 144.5 171.1 137.8 147.6 25+ 188.0 162.7 256.1 137.2 177.9
By economic sector Agriculture, forestry and fishery 114.3 82.6 209.9 94.7 100.2 Mining and quarrying 157.6 * 213.5 135.8 147.9 Manufacturing 213.9 191.4 218.0 190.2 202.2 Electricity, gas, * * * * * water supply and other * * * * * Construction 184.6 178.5 213.7 159.4 183.8 Wholesale and retail trade 216.9 141.4 209.5 128.9 180.4 Transportation and storage 273.2 * 284.9 248.3 266.9 Accommodation and food services
193.1 180.8 201.3 * 187.3
Information and communications * * * * * Financial and insurance activities * 435.6 412.0 * 375.6 Real estate activities * * * * * Professional, technical * * * * * Administrative 271.0 233.6 265.4 255.2 Public administration and defence 241.9 421.9 325.4 271.2 300.6 Education 191.4 223.7 185.8 241.9 216.2 Human health and social work activities
223.7 419.1 381.9 344.8
Arts, Entertainment and Recreation
* * * * *
Other service activities 175.0 103.8 270.3 106.0 145.8 Activities of households as employers * * * * * Activities of extraterritorial
* * * * *
Source: Myanmar Annual Labour Force Survey, Q1 2017 * Denotes high relative error from too few observations (<50 cases)

���� х���� ���3������������������ - �����������+���х��
14
Male Female Urban Rural Total
By occupation Managers 685.7 390.6 646.3 289.3 590.9 Professionals 291.7 223.2 239.7 237.5 238.5 Technicians and associate professionals
296.1 250.3 275.1 278.4 276.0
Clerical support workers
275.2 324.8 339.8 228.1 303.9
Services and sales workers 162.7 193.8 197.3 146.3 178.0 Skilled agricultural workers
118.1 88.0 173.3 101.9 106.0
Craft and related trades workers 197.4 222.0 207.1 203.0 204.9 Plant and machine operators and assemblers
256.0 112.7 228.2 236.1 232.4
Elementary occupations 131.6 92.6 184.0 100.3 115.4 Armed forces occupations * * * * *
By education Less than primary 129.4 89.9 146.9 107.3 114.5 Completed primary 159.5 124.9 182.3 131.9 146.5 Completed secondary 215.0 173.9 200.3 199.4 199.9 Tertiary (first stage or completed)
412.1 283.4 395.7 224.0 327.6
By informal status Informal 167.8 146.4 213.4 135.0 159.1 Formal 392.1 304.6 398.7 229.7 348.2 Employment in the informal sector
145.5 124.0 176.5 122.8 137.1
Informal employment outside the informal sector
221.9 211.4 261.8 188.1 217.2
Median Monthly wages ('000 Kyat) 120.0 102.9 161.5 108.0 120.0 Source: Myanmar Annual Labour Force Survey, Q1 2017 * Denotes high relative error from too few observations (<50 cases)

���� х���� ���3������������������ - �����������+���х��
15
Table 4. Total monthly wages and earnings of all employed persons by age, sex and urban/rural
Male Female Urban Rural Total
Average monthly wages and earnings (000 kyat)
224.6 165.8 230.1 191.9 203.7
By age 15-24 154.6 141.8 167.8 141.0 148.9 25+ 236.0 172.1 241.6 202.1 214.4
By broad economic sector Agriculture 232.9 134.7 252.9 203.9 206.4 Industry 207.5 172.7 219.5 176.4 195.1 Services 224.1 183.1 232.8 176.4 205.7
By status in employment Employees 178.7 157.3 235.9 137.4 169.8 Self-employed 266.0 179.1 222.8 247.9 240.7 Of which: Employers 415.0 372.2 437.0 395.3 406.0
By informal status Informal 191.6 148.5 206.2 161.4 174.7 Formal 314.8 268.9 301.2 305.9 304.3 Employment in the informal sector
184.1 136.2 183.9 159.2 165.9
Informal employment outside the informal sector
222.8 210.9 262.8 188.0 217.5
150.0 112.7 165.0 120.0 142.0 Source: Myanmar Annual Labour Force Survey, Q1 2017

���� х���� ���3������������������ - �����������+���х��
16
The Wages and earnings of the employed persons were presented for paid
employment and all employment either paid or self-employed including employer. For the
paid employment, the wages and earnings were collected the component of wages also
their received benefits, if any receiving during the period of the last 30 days preceding the
date of survey.
For the paid employment, the average monthly rate was 169.8 kyats in thousand and
the adult (177.9 kyats in thousand) get higher rate than youth (147.6 Kyats in thousand) in
all genders and all type of residences. It is much higher in urban and males get higher than
females. One of the interesting point is in rural areas, adult and youth get the same rate.
Among the industrial sectors, it was highest for the industrial sector activities of
extraterritorial, 474.2 kyats in thousand and the lowest for agriculture, forestry and fishery
activities, 100.2 kyats in thousand. Managers get the highest monthly average rate of 590.9
kyats in thousand and again, the skilled agricultural workers get the lowest rate of 106.0
kyats in thousand.
The employees get higher average rate in line with higher educational attainment.
Considering informal status, employee, working in informal employment get lesser wages
and earnings than the one, in formal employment. But the employees working in informal
employment outside the informal sector can earned more than employees in informal
employment.

���� х���� ���3������������������ - �����������+���х��
17
For all employed persons, the average monthly rate was 203.7 kyats in thousand and
the adult (214.4 kyats in thousand) get higher rate than youth (148.9 kyats in thousand) in
all genders and types of residences. By broad economic sector, the agriculture sector gets
the highest earning average rate. By status in employment, employees get the lowest rate
of (169.8 kyats in thousand) and in general self-employed gets (240.7 kyat in thousand), of
which employers get the highest rate of 406.0 kyats in thousand. The same as paid
employment, for all employed persons, working in informal employment get lesser wages
and earnings than the one, in formal employment. And for all employed persons, working
in informal employment outside the informal sector can earned more than those of working
in informal employment and the rates are the same value for employees alone.

���� х���� ���3������������������ - �����������+���х��
18
4. Labour underutilization
Table 5. Labour underutilization by age, sex and urban/rural
Male Female Urban Rural Total
Labour underutilization (Aged 15+) (000)
Time-related underemployment
572 431 187 816 1,003
Unemployment 197 280 170 307 477 Potential labour force (marginal attachment)
94 179 61 212 273
Unemployment rate (%) 1.5 3.0 2.7 1.9 2.1 Composite rate of labour underutilization (%)
6.6 9.3 6.6 8.2 7.7
Youth labour underutilization, aged 15-24 (000)
Time-related underemployment
180 157 * 294 337
Unemployment 99 132 84 147 231 Potential labour force * 77 * 91 119
Unemployment rate (%) 3.9 6.2 7.5 4.1 5.0 Composite rate of labour underutilization (%)
12.4 16.7 13.5 14.7 14.4
Source: Myanmar Annual Labour Force Survey, Q1 2017 * Denotes high relative error from too few observations (<50 cases)
At the national level the unemployment rate is 2.1 percent. Although the rate is low,
it is higher for younger ages (15-24) (5.0 percent). Further, it shows that the rate is almost
double for females, than males.

���� х���� ���3������������������ - �����������+���х��
19
The unemployment rate in the country is low especially because the country does
not have social security system and people had to take up job irrespective of their choice
for their survival. In the circumstances, it is prudent to use Labour Underutilisation (LU)
indicators for policy formulation in the country. Labour underutilization refers to
mismatches between labour supply and demand leading to an unmet need of employment
among the population.
Potential labour force is the working age population outside the labour force but
either not available for a job but seeking a job or available for a job but not seeking any job
for pay or profit. The potential labour force was 273 thousands and among then females
constitute 65.7 percent while males, 34.3 percent. In terms of rural and urban areas, rural
area is covers 77.7 percent of potential labour force while urban area, 22.3 percent. In
youth, 119 thousands have marginal attachment with labour market and of which nearly
mostly are females (77 thousands) also in rural (91 thousands).
Composite rate of labour underutilization takes in to account the unemployed, and
those working less than the desired working hours ( time related underemployment), those
not counted in the labour force but are available for work but not seeking work and those
seeking work but may not be currently available for work.
Overall 7.7 percent of the working age population falls within the composite rate of
labour underutilization and for the youth (aged 15-24), the rate is 14.4 percent. Both cases,
this percentage is higher for female also is higher in rural areas.
���� х���� ���3������������������ - �����������+���х��
20
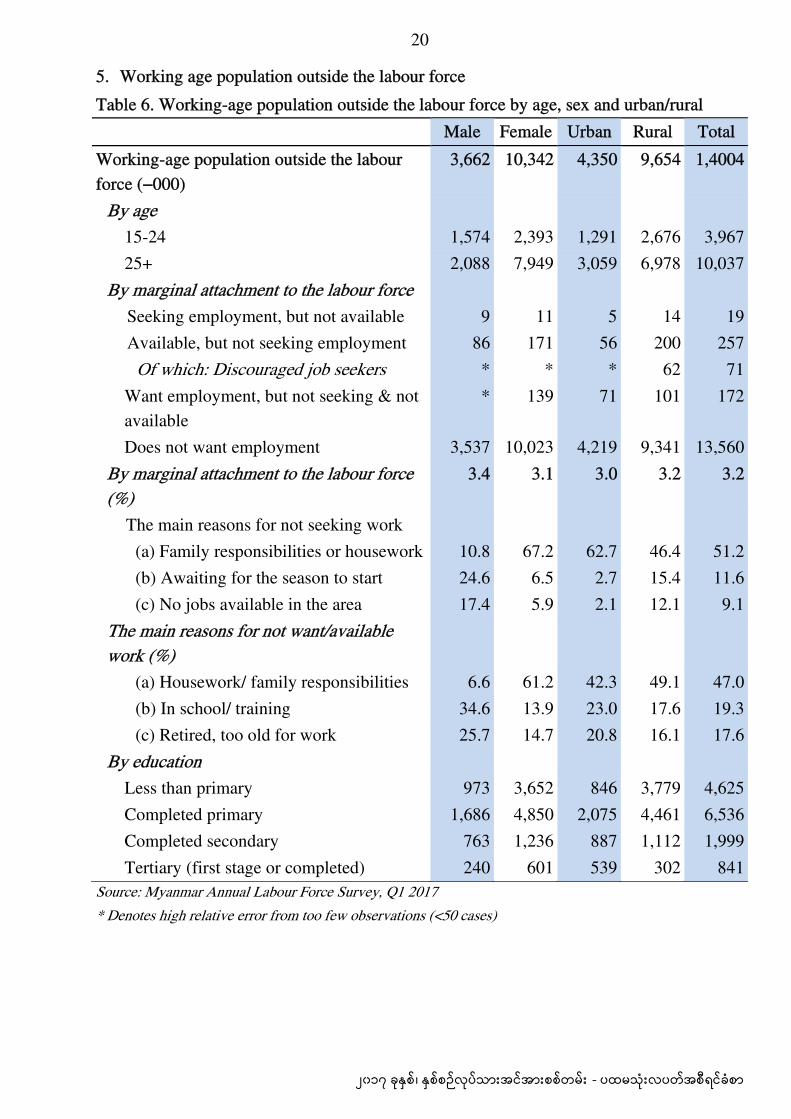
5. Working age population outside the labour force
Table 6. Working-age population outside the labour force by age, sex and urban/rural Male Female Urban Rural Total
Working-age population outside the labour force (–000)
3,662 10,342 4,350 9,654 1,4004
By age 15-24 1,574 2,393 1,291 2,676 3,967 25+ 2,088 7,949 3,059 6,978 10,037
By marginal attachment to the labour force Seeking employment, but not available 9 11 5 14 19 Available, but not seeking employment 86 171 56 200 257
Of which: Discouraged job seekers * * * 62 71 Want employment, but not seeking & not available
* 139 71 101 172
Does not want employment 3,537 10,023 4,219 9,341 13,560 By marginal attachment to the labour force (%)
3.4 3.1 3.0 3.2 3.2
The main reasons for not seeking work (a) Family responsibilities or housework 10.8 67.2 62.7 46.4 51.2 (b) Awaiting for the season to start 24.6 6.5 2.7 15.4 11.6 (c) No jobs available in the area 17.4 5.9 2.1 12.1 9.1
The main reasons for not want/available work (%)
(a) Housework/ family responsibilities 6.6 61.2 42.3 49.1 47.0 (b) In school/ training 34.6 13.9 23.0 17.6 19.3 (c) Retired, too old for work 25.7 14.7 20.8 16.1 17.6
By education Less than primary 973 3,652 846 3,779 4,625 Completed primary 1,686 4,850 2,075 4,461 6,536 Completed secondary 763 1,236 887 1,112 1,999 Tertiary (first stage or completed) 240 601 539 302 841
Source: Myanmar Annual Labour Force Survey, Q1 2017 * Denotes high relative error from too few observations (<50 cases)

���� х���� ���3������������������ - �����������+���х��
21
Being in school or busy with family chores are cited as the two major reasons for
being outside the labour force. The youth who are not part of the labour force have
reported about 67.2 percent of them as still in educational institutions and this percentage
is much higher for urban (75.3 percent) and male (78.9 percent)youth compared to rural
and female youth.
Busy with family chores are cited as a clear distinction between sexes but not in
type of residence. In the country 51.2 percent of currently not employed persons have
reported family responsibilities of housework as the reason for not seeking work. For the
women about 61.2 percent of them have reported family responsibilities or household
chores. This percentage is higher for adult female (69.5 percent) compared to youth female
(33.2 percent).
Among out of the labour force, only 3.2 percent have reported as being marginal
attachment to the labour force. The rest are reported that they do not want employment.
In countries with a substantial informal economy dominated by family enterprises, it
is not expected that the unemployed will make visible attempts to seek jobs especially if
they do not have any specialized skills or high educational achievements. Currently not
employed persons have reported about 16 percent as discourage job seekers and this rate is
higher for male youth and in rural.

���� х���� ���3������������������ - �����������+���х��
22
6. Working children and child labour
Table 7. Working children and child labour by age, sex and urban/rural
Male Female Urban Rural Total Total children population (000) 6,157 6,253 3,025 9,385 12,410
By age 5-11 3,336 3,336 1,537 5,135 6,672 12-14 1,451 1,493 719 2,225 2,944 15-17 1,370 1,424 769 2,025 2,794
By sub-categories Working children 448 357 159 646 805 Child labour 350 273 124 499 623 Hazardous child labour 343 265 122 486 608
By sub-categories (% of total child population)
Working children% of total child population
7.3 5.7 5.3 6.9 6.5
Child Labour % of total child pop. 5.7 4.4 4.1 5.3 5.0 Hazardous child labour% of total child population
5.6 4.2 4.0 5.2 4.9
Child labourers by age ('000) 5-11 1* 3* 2* 2* 4* 12-14 55 33* 19* 69 88 15-17 294 237 103 428 531
Child labourers, by age (%) 5-11 0.0* 0.1* 0.1* 0.0* 0.1* 12-14 3.8 2.2* 2.6* 3.1 3.0 15-17 21.4 16.7 13.5 21.1 19.0
Child labourers, by education ('000) Less than primary 68 58 25* 101 126 Completed primary 267 200 92 375 467 Completed secondary 15* 13* 7* 21* 28* Tertiary (first stage or completed) 0* 2* 0* 2* 2*
Source: Myanmar Annual Labour Force Survey, Q1 2017 * Denotes high relative error from too few observations (<50 cases)

���� х���� ���3������������������ - �����������+���х��
23
Male Female Urban Rural Total Child Labours by education (%)
Below Primary 19.6 21.2 20.5* 20.2 20.3 Primary 41.2 48.2 40.6 45.2 44.3 Middle 35.0* 25.1* 33.1* 30.1* 30.7* High School and above 4.2* 5.5* 5.8* 4.5* 4.8*
Source: Myanmar Annual Labour Force Survey, Q1 2017 * Denotes high relative error from too few observations (<50 cases)
The child population (aged 5-17) is over 12,410 thousands, of which 6,157
thousands are boys and 6,235 thousands are girls. A majority of the children, over half of
the total, fall in the broad age group of 5-11 years (53.8 percent), followed by 12-14 years
group (about 24 percnet), accounting for less than half of the first group. The lowest
percentage is observed in the ultimate stage of 15-17 years, with falling short of a quarter
of the entire child population. In the older broad age two groups, the number of boys
matches closely with that of the girls, with higher shares of the girls except the equal share
of boys and girls in youngest group. The overwhelming majority (75.5 percent) of children
reside in rural areas.
At the national level, the size of the working child population 805 thousands out of
a child population of 12,410 thousands. The worker-population ratio (WPR) is 6.5 percent
with a higher participation rate for the boys (7.3 percent) compared to the girls (5.7
percent) and mostly working in rural areas.
In 2017, 5.0 percent or 623 thousands out of a total of 12,410 thousands are child
labour. 5.7 percent of all boys and 4.4 percent of all girls are employed as child labour. In
absolute terms, these are 349,605 and 273,247. Rural children (5.3 percent), amongst them
boys (6.3 percent) more disposed towards joining the child labour, compared to urban
children (4.1 percent) and urban boys (4.5 percent). The percentage of children who are
working but are not necessarily child labour is also higher in rural areas, both for boys and
girls.

���� х���� ���3������������������ - �����������+���х��
24
The most prolific group of children, from the point of view of their participation in
the labour market is of course the 15-17 age range. These children are at the threshold of
joining the wider labour market. About one fifth of these boys (21.4 percent), a little higher
than the girls (16.7 percent), are child labour. By the level of education attained, almost all
child labour were educated only completed primary level. The youngest and the most
numerous group 5-11 years, accounts for only 0.1 percent as child labour. The 12-14 age
group has 3.0 percent in child labour and is poised to join the 15-17 group in a big way
(19.0 percent), a few years hence.
The child population is over 12,410 thousands, of which 608 thousands are exposed
to the perils of hazardous work. In terms of boys and girls, there are 343 thousands and
265 thousands. Expectedly, an overwhelmingly large proportion of the children engaged in
hazardous work are from 15-17 age group.