
Annual Financial Report - Board of...
64
Annual Financial Report Retirement Plan 10/11
-
Upload
duongthien -
Category
Documents
-
view
215 -
download
0
Transcript of Annual Financial Report - Board of...

AnnualFinancialReportRetirement Plan
10/11


U n i v e r s i t y o f C a l i f o r n i a
10/11 annual financial report retirement Plan
t a b l e o f C o n t e n t s
University of California Retirement Plan (UCRP):
2 summary statement
3 Plan overview and administration
4 Changes in the Plan/Membership
5 Contribution Policy
6 Plan benefits
7 investments
8 Historical investment Performance
9 equity Portfolio
10 fixed income Portfolio
12 Management’s Discussion and analysis
17 financial statements
20 notes to financial statements
36 supplementary information
University of California PERS + 5 Plan:
40 Management’s Discussion and analysis
43 financial statements
45 notes to financial statements
57 supplementary information
60 Plan oversight—the board of regents

2
This report contains information about the University of California Retirement Plan (UCRP or the Plan) as of and for the fiscal year ended June 30, 2011, and includes audited financial statements. Significant statistics relating to the Plan and its membership base as of the 2010–2011 fiscal year-end are as follows:
summary statement
Net assets $41.9 billionNet investment gain $7.6 billionContributions $1.8 billionBenefit payments (excluding member withdrawals and lump sum cashouts) $1.8 billionPlan administrative and other expenses $31.1 million
aC t i v e Pl a n M e M b er s H i P
Senate Faculty and Non-Faculty Academics 22,991 members
Management/Senior Professional 8,842 members
Professional/Support Staff 83,735 members
Total 115,568 membersAverage Annual Salary
Senate Faculty $117,972
Non-Faculty Academics $75,762
Management/Senior Professional $120,564
Professional/Support Staff $61,405
Average AgeSenate Faculty 50 years
Non-Faculty Academics 44 years
Management/Senior Professional 50 years
Professional/Support Staff 43 years
i n aC t i v e Pl a n M e M b er s H i P / ot H er
Total 60,903 members
r e t i r ee M e M b er s H i P
Faculty 5,187 retirees
Management/Senior Professional 7,049 retirees
Professional/Support Staff 35,007 retirees
Total 47,243 retireesAverage Retirement Age
Faculty 64 years
Management/Senior Professional 60 years
Professional/Support Staff 59 years
Average Service Credit at RetirementFaculty 26 years
Management/Senior Professional 22 years
Professional/Support Staff 20 years
Average Annual UCRP IncomeFaculty $72,809
Management/Senior Professional $52,834
Professional/Support Staff $28,730
Survivor/Beneficiary 6,969 recipients
Disabled 2,084 recipients
U n i v e r s i t y o f c a l i f o r n i a 1 0 / 1 1 a n n U a l f i n a n c i a l r e p o r t / r e t i r e m e n t p l a n 3
Plan overview and administration
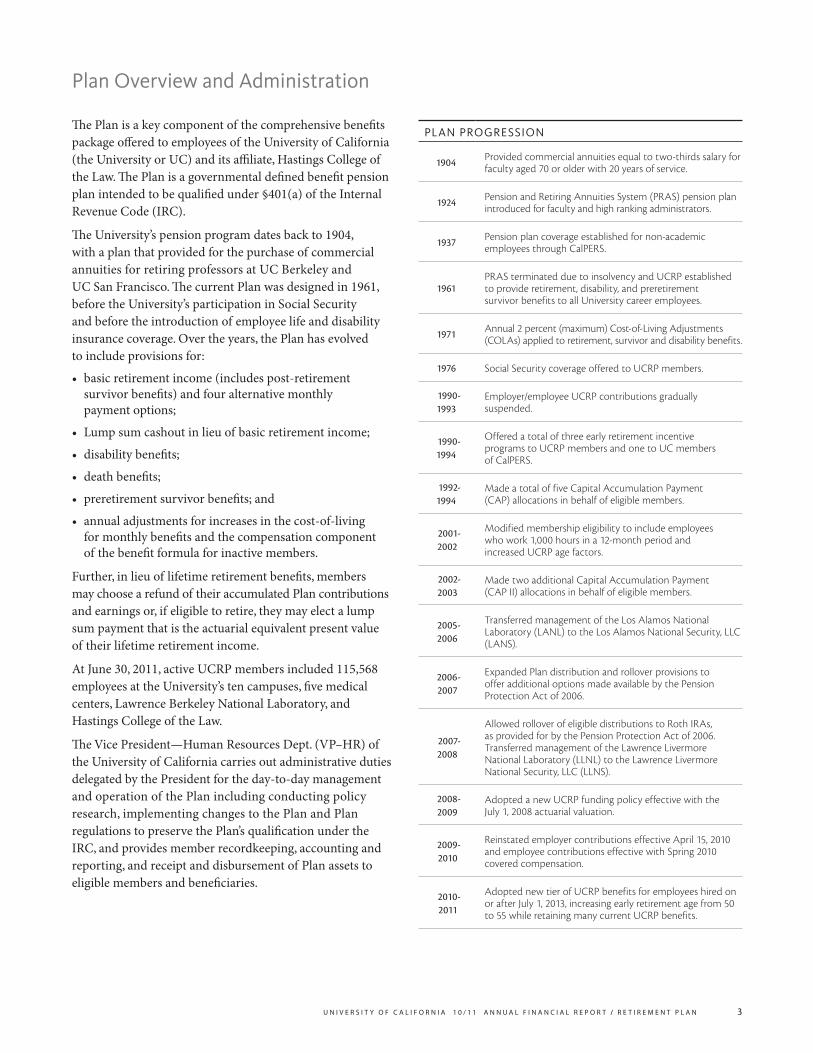
The Plan is a key component of the comprehensive benefits package offered to employees of the University of California (the University or UC) and its affiliate, Hastings College of the Law. The Plan is a governmental defined benefit pension plan intended to be qualified under §401(a) of the Internal Revenue Code (IRC).
The University’s pension program dates back to 1904, with a plan that provided for the purchase of commercial annuities for retiring professors at UC Berkeley and UC San Francisco. The current Plan was designed in 1961, before the University’s participation in Social Security and before the introduction of employee life and disability insurance coverage. Over the years, the Plan has evolved to include provisions for:
• basic retirement income (includes post-retirement survivor benefits) and four alternative monthly payment options;
• Lump sum cashout in lieu of basic retirement income;
• disability benefits;
• death benefits;
• preretirement survivor benefits; and
• annual adjustments for increases in the cost-of-living for monthly benefits and the compensation component of the benefit formula for inactive members.
Further, in lieu of lifetime retirement benefits, members may choose a refund of their accumulated Plan contributions and earnings or, if eligible to retire, they may elect a lump sum payment that is the actuarial equivalent present value of their lifetime retirement income.
At June 30, 2011, active UCRP members included 115,568 employees at the University’s ten campuses, five medical centers, Lawrence Berkeley National Laboratory, and Hastings College of the Law.
The Vice President—Human Resources Dept. (VP–HR) of the University of California carries out administrative duties delegated by the President for the day-to-day management and operation of the Plan including conducting policy research, implementing changes to the Plan and Plan regulations to preserve the Plan’s qualification under the IRC, and provides member recordkeeping, accounting and reporting, and receipt and disbursement of Plan assets to eligible members and beneficiaries.
Plan ProGression
1904 Provided commercial annuities equal to two-thirds salary for faculty aged 70 or older with 20 years of service.
1924 Pension and Retiring Annuities System (PRAS) pension plan introduced for faculty and high ranking administrators.
1937 Pension plan coverage established for non-academic employees through CalPERS.
1961PRAS terminated due to insolvency and UCRP established to provide retirement, disability, and preretirement survivor benefits to all University career employees.
1971 Annual 2 percent (maximum) Cost-of-Living Adjustments (COLAs) applied to retirement, survivor and disability benefits.
1976 Social Security coverage offered to UCRP members.
1990-1993
Employer/employee UCRP contributions gradually suspended.
1990-1994
Offered a total of three early retirement incentive programs to UCRP members and one to UC members of CalPERS.
1992-1994
Made a total of five Capital Accumulation Payment (CAP) allocations in behalf of eligible members.
2001-2002
Modified membership eligibility to include employees who work 1,000 hours in a 12-month period and increased UCRP age factors.
2002-2003
Made two additional Capital Accumulation Payment (CAP II) allocations in behalf of eligible members.
2005-2006
Transferred management of the Los Alamos National Laboratory (LANL) to the Los Alamos National Security, LLC (LANS).
2006-2007
Expanded Plan distribution and rollover provisions to offer additional options made available by the Pension Protection Act of 2006.
2007-2008
Allowed rollover of eligible distributions to Roth IRAs, as provided for by the Pension Protection Act of 2006. Transferred management of the Lawrence Livermore National Laboratory (LLNL) to the Lawrence Livermore National Security, LLC (LLNS).
2008-2009
Adopted a new UCRP funding policy effective with the July 1, 2008 actuarial valuation.
2009-2010
Reinstated employer contributions effective April 15, 2010 and employee contributions effective with Spring 2010 covered compensation.
2010-2011
Adopted new tier of UCRP benefits for employees hired on or after July 1, 2013, increasing early retirement age from 50 to 55 while retaining many current UCRP benefits.
4
Changes in the Plan
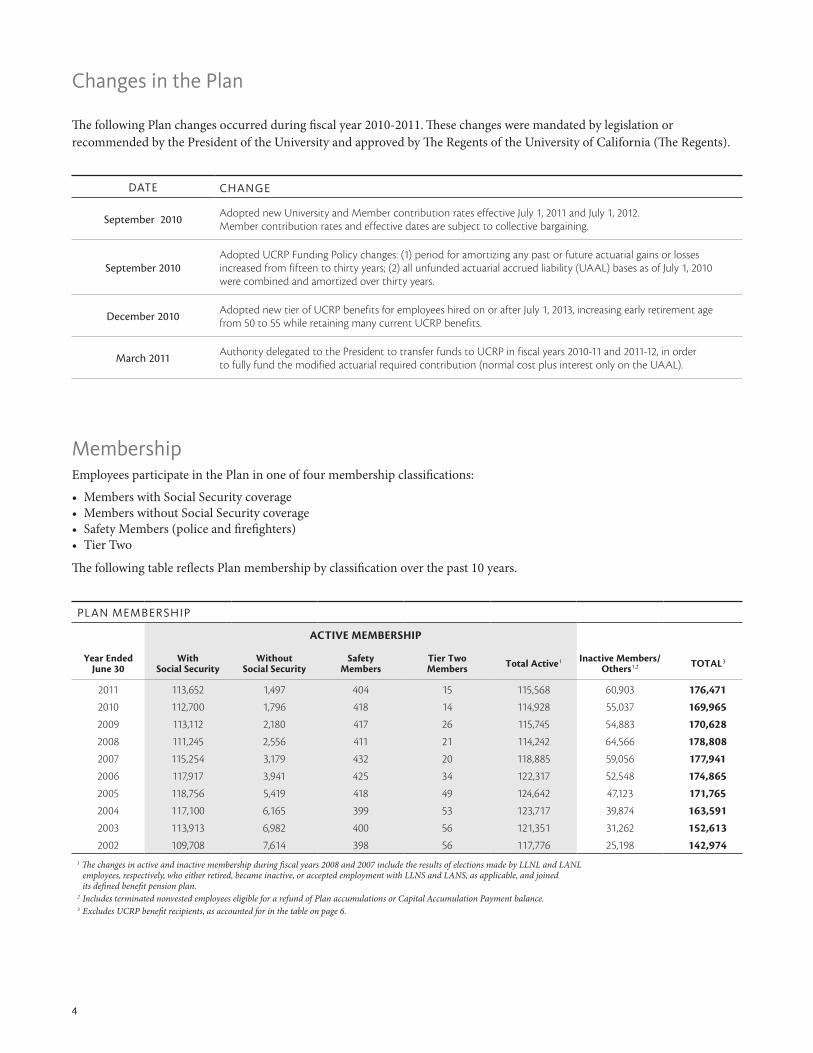
The following Plan changes occurred during fiscal year 2010-2011. These changes were mandated by legislation or recommended by the President of the University and approved by The Regents of the University of California (The Regents).
Date CHanGe
September 2010 Adopted new University and Member contribution rates effective July 1, 2011 and July 1, 2012. Member contribution rates and effective dates are subject to collective bargaining.
September 2010Adopted UCRP Funding Policy changes: (1) period for amortizing any past or future actuarial gains or losses increased from fifteen to thirty years; (2) all unfunded actuarial accrued liability (UAAL) bases as of July 1, 2010 were combined and amortized over thirty years.
December 2010 Adopted new tier of UCRP benefits for employees hired on or after July 1, 2013, increasing early retirement age from 50 to 55 while retaining many current UCRP benefits.
March 2011 Authority delegated to the President to transfer funds to UCRP in fiscal years 2010-11 and 2011-12, in order to fully fund the modified actuarial required contribution (normal cost plus interest only on the UAAL).
Membership Employees participate in the Plan in one of four membership classifications:
• Members with Social Security coverage • Members without Social Security coverage• Safety Members (police and firefighters) • Tier Two
The following table reflects Plan membership by classification over the past 10 years.
Plan MeMbersHiP
ACTIve MeMBeRShIP
Year ended June 30
With Social Security
Without Social Security
Safety Members
Tier TwoMembers Total Active1 Inactive Members/
Others1,2 TOTAL3
2011 113,652 1,497 404 15 115,568 60,903 176,4712010 112,700 1,796 418 14 114,928 55,037 169,9652009 113,112 2,180 417 26 115,745 54,883 170,6282008 111,245 2,556 411 21 114,242 64,566 178,8082007 115,254 3,179 432 20 118,885 59,056 177,9412006 117,917 3,941 425 34 122,317 52,548 174,8652005 118,756 5,419 418 49 124,642 47,123 171,7652004 117,100 6,165 399 53 123,717 39,874 163,5912003 113,913 6,982 400 56 121,351 31,262 152,6132002 109,708 7,614 398 56 117,776 25,198 142,974
1 The changes in active and inactive membership during fiscal years 2008 and 2007 include the results of elections made by LLNL and LANL employees, respectively, who either retired, became inactive, or accepted employment with LLNS and LANS, as applicable, and joined its defined benefit pension plan.
2 Includes terminated nonvested employees eligible for a refund of Plan accumulations or Capital Accumulation Payment balance.3 Excludes UCRP benefit recipients, as accounted for in the table on page 6.
U n i v e r s i t y o f c a l i f o r n i a 1 0 / 1 1 a n n U a l f i n a n c i a l r e p o r t / r e t i r e m e n t p l a n 5
Contribution Policy
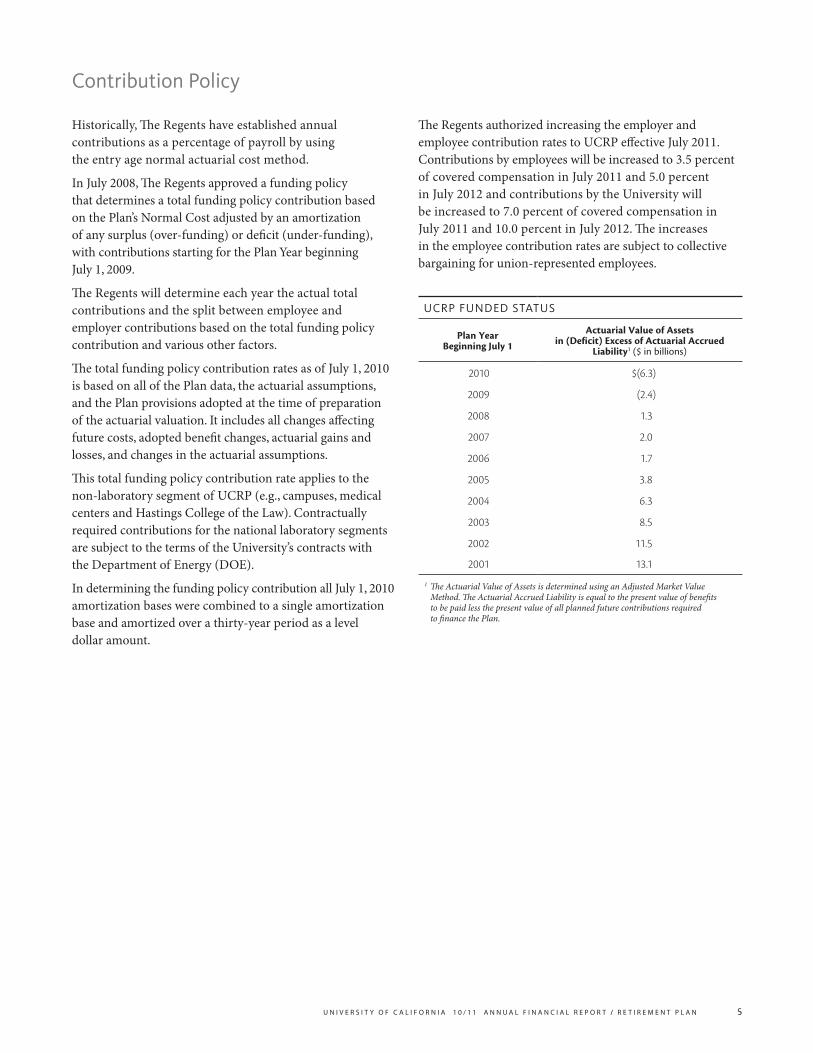
Historically, The Regents have established annual contributions as a percentage of payroll by using the entry age normal actuarial cost method.
In July 2008, The Regents approved a funding policy that determines a total funding policy contribution based on the Plan’s Normal Cost adjusted by an amortization of any surplus (over-funding) or deficit (under-funding), with contributions starting for the Plan Year beginning July 1, 2009.
The Regents will determine each year the actual total contributions and the split between employee and employer contributions based on the total funding policy contribution and various other factors.
The total funding policy contribution rates as of July 1, 2010 is based on all of the Plan data, the actuarial assumptions, and the Plan provisions adopted at the time of preparation of the actuarial valuation. It includes all changes affecting future costs, adopted benefit changes, actuarial gains and losses, and changes in the actuarial assumptions.
This total funding policy contribution rate applies to the non-laboratory segment of UCRP (e.g., campuses, medical centers and Hastings College of the Law). Contractually required contributions for the national laboratory segments are subject to the terms of the University’s contracts with the Department of Energy (DOE).
In determining the funding policy contribution all July 1, 2010 amortization bases were combined to a single amortization base and amortized over a thirty-year period as a level dollar amount.
The Regents authorized increasing the employer and employee contribution rates to UCRP effective July 2011. Contributions by employees will be increased to 3.5 percent of covered compensation in July 2011 and 5.0 percent in July 2012 and contributions by the University will be increased to 7.0 percent of covered compensation in July 2011 and 10.0 percent in July 2012. The increases in the employee contribution rates are subject to collective bargaining for union-represented employees.
UCrP fUnDeD statUs
Plan Year Beginning July 1
Actuarial value of Assets in (Deficit) excess of Actuarial Accrued
Liability1 ($ in billions)
2010 $(6.3)
2009 (2.4)
2008 1.3
2007 2.0
2006 1.7
2005 3.8
2004 6.3
2003 8.5
2002 11.5
2001 13.1
1 The Actuarial Value of Assets is determined using an Adjusted Market Value Method. The Actuarial Accrued Liability is equal to the present value of benefits to be paid less the present value of all planned future contributions required to finance the Plan.

6
Plan benefits
The Plan paid approximately $1.8 billion in retirement, disability, and preretirement survivor benefits to 56,296 members and their beneficiaries during fiscal year 2010-2011. Retirement payments include cost-of-living adjustments and
exclude lump sum cashouts. Payments to survivors include basic death payments. The table below reflects total benefits paid in each category over the past 10 years.
The number of UCRP benefit recipients in each category for the year ended June 30 for each of the past 10 years is shown below.
UCrP benefit PayMents ($ in thousands)
Year ended June 30 Retirement Disability Death & Survivor TOTAL1
2011 $1,761,580 $35,298 $45,059 $1,841,937
2010 1,634,114 35,331 41,129 1,710,574
2009 1,517,717 35,984 39,949 1,593,650
2008 1,403,778 36,098 39,624 1,479,500
2007 1,260,092 35,815 36,487 1,332,394
2006 1,106,711 34,771 34,338 1,175,820
2005 984,816 33,434 33,254 1,051,504
2004 877,696 31,900 30,731 940,327
2003 794,861 29,311 28,534 852,706
2002 730,115 27,132 26,475 783,7221 Does not include non-periodic member withdrawals (including CAP distributions) and lump sum cashouts.
UCrP benefit reCiPients
Year ended June 30 Retired Members DisabledMembers Deceased Members Survivors TOTAL1
2011 47,243 2,084 1,790 6,969 56,296
2010 45,111 2,110 1,920 6,681 53,902
2009 42,969 2,157 1,659 6,527 51,653
2008 41,584 2,218 1,964 6,369 50,171
2007 39,261 2,269 1,817 6,152 47,682
2006 37,289 2,269 1,686 5,884 45,442
2005 33,590 2,225 1,774 5,662 41,477
2004 32,072 2,194 1,781 5,472 39,738
2003 30,655 2,129 1,603 5,083 37,867
2002 29,247 2,096 589 4,822 36,1651 Does not include deceased Members.

U n i v e r s i t y o f c a l i f o r n i a 1 0 / 1 1 a n n U a l f i n a n c i a l r e p o r t / r e t i r e m e n t p l a n 7
investments
Investment ManagementIn a defined benefit plan such as UCRP, the Plan bears the mortality and investment risk because members’ benefits are based on the employer’s promise rather than the contributions or plan assets available to pay the benefits.
The Office of the Treasurer has primary responsibility for investing the Plan’s assets consistent with policies established by The Regents. The Regents has fiduciary responsibility for establishing investment policy for the Plan and for overseeing the implementation of that policy.
The assets of the Plan are held in trust separately from the University’s assets under a custodial agreement with State Street Bank & Trust Co. The bank carries insurance against loss of property caused by employee dishonesty, theft, misplacement, damage, distribution or mysterious disappearance.
Asset AllocationUCRP is a multi-asset strategy investment fund of $42.3 billion in total investments. $18.7 billion of the investment portfolio is invested in U.S. and non-U.S. equity securities and $4.1 billion in U.S. and non-U.S. commingled equity funds. The $ 2.9 billion private equity segment includes $940.0 million in venture capital, $1.9 billion in buyout funds, $27.0 million non-U.S. private equity and $3.0 million in common stock distributions. Another $10.1 billion is invested in fixed income securities, of which $3.9 billion is in high quality government securities; $5.6 billion is invested in corporate, foreign and mortgage-backed bonds, and commercial paper; and $500.6 million in U.S. bond funds; and $103.8 million in foreign currency denominated government and corporate issues. The fund also includes allocations of $4.2 billion in other commingled funds comprised of $2.8 billion in absolute return funds and $1.4 billion in money market funds. In addition, the fund holds $2.0 billion in institutional private and public real estate investments, $327.2 million in real assets, and $15.0 million in investment derivatives.
Fixed Income 23.75%
Commingled Funds 9.98%
Private Equity 6.80%
Real Estate 4.69%
Equity 53.97%
Real Assets 0.77% Derivative Investments 0.04%page 7: Asset Allocation page 9: Quality & Diverse. page 9: private equity segment
page 10: Quailty page 10: Diversification
UCrP asset alloCation
Proxy Voting PolicyThe Chief Investment Officer has instructed The Regents’ custodian bank to vote all proxies on behalf of The Regents according to guidelines established by The Regents.

8
Historical investment Performance
annUaliZeD rates of retUrn at JUne 30, 2011
1-Year 3-Year 5-Year 10-Year
UCRP Total Fund Policy Benchmark
22.45%21.64
3.87%3.27
4.65%4.38
4.98%4.90
U.S. Equity Portfolio Policy Benchmark(1)
31.8232.16
3.763.82
2.783.19
2.553.30
Non-U.S. Equity-Developed Policy Benchmark(2)
30.3930.19
(0.80)(1.69)
2.481.90
6.315.92
Non-U.S. Equity-Emerging Market Policy Benchmark(3)
28.3627.80
4.474.22
11.4111.42
15.7916.26
Global Equity Policy Benchmark(4)
31.3631.00
n/an/a
n/an/a
n/an/a
Core Fixed Income Policy Benchmark(5)
4.773.90
7.436.89
6.897.07
6.656.52
High Yield Bond Policy Benchmark(6)
15.4515.31
11.6512.17
8.639.07
n/an/a
Emerging Market Debt Policy Benchmark(7)
11.7311.39
10.7411.10
9.9910.05
n/an/a
TIPS Portfolio Policy Benchmark(8)
8.11 7.74
5.76 5.28
7.32 6.91
n/an/a
Private Equity(9) 17.83 3.63 7.42 6.72
Absolute Return-DiversifiedPolicy Benchmark(10)
12.282.49
2.195.14
n/an/a
n/an/a
Absolute Return-Cross Asset ClassPolicy Benchmark(11)
12.846.83
n/an/a
n/an/a
n/an/a
Real AssetsPolicy Benchmark(12)
9.259.25
n/an/a
n/an/a
n/an/a
Public Real EstatePolicy Benchmark(13)
31.3032.88
n/an/a
n/an/a
n/an/a
Private Real EstatePolicy Benchmark(13)
21.7020.08
(19.99)(18.45)
(8.06)(7.75)
n/an/a
CUrrent PoliCy benCHMarks
Asset Class BenchmarkPolicy Asset Allocation
of Total Fund(1) U.S. Equity Russell 3000 Tobacco Free (TF) Index 28.5%
(2) Non-U.S. Equity-Developed MSCI World ex-U.S. (net dividends) TF 22.0%
(3) Emerging Market Equity MSCI Emerging Market (net dividends) 5.0%
(4) Global Equity MSCI All Country World Index Net - IMI - TF 2.0%
(5) Core Fixed Income Barclays Capital U.S. Aggregate Bond Index 12.0%
(6) High Yield Bond Merrill Lynch High Yield Cash Pay Index 2.5%
(7) Emerging Market Debt J.P. Morgan Emerging Market Bond Index Global Diversified 2.5%
(8) TIPS Barclays Capital U.S. TIPS 8.0%
(9) Private Equity Actual Private Equity Returns 6.0%
(10) Absolute Return 50% HFRX Absolute Return Index + 50% HFRX Market Directional Index 6.5%
(11) Real Assets Commodities: S&P GSCI Reduced Energy Index; All Other: Actual Portfolio Return 1.0%
(12) Real Estate (Public and Private) Public: FTSE EPRA NAREIT Global Index; Private: NFI-ODCE Index – NCREIF Funds Index-Open End Diversified Core Equity Index (lagged 3 months)
4.0%

U n i v e r s i t y o f c a l i f o r n i a 1 0 / 1 1 a n n U a l f i n a n c i a l r e p o r t / r e t i r e m e n t p l a n 9
equity Portfolio
Quality and DiversificationThe $22.8 billion Equity Portfolio (including equity funds) is diversified across multiple strategic global economic and industry sectors within actively managed accounts of equity securities and passively-managed index funds. Of the Equity Portfolio, $18.7 billion (or 82.2%) was invested in U.S. and non-U.S. equity securities and $4.1 billion (or 17.8%) was invested in U.S. and non-U.S. equity funds. Combined, U.S. equity securities and U.S. equity funds totaled $11.42 billion (or 50.1%) and foreign equity securities and non-U.S. Equity funds totaled $11.38 billion (or 49.9%).
Private Equity SegmentThe $2.9 billion private equity segment is invested in venture capital partnerships, buyout funds and international private equity. The private equity segment includes $940.0 million in venture capital, $1.9 billion in buyout funds, and $27.0 million non-U.S. private equity and $3.0 million in common stock distributions.
U.S. Equity Securities and Funds 50.1%
Non- U.S. Equity Securities and Funds 49.9%
page 7: Asset Allocation page 9: Quality & Diverse. page 9: private equity segment
page 10: Quailty page 10: Diversification
Buyouts 66.4%
Venture Capital 32.6%
Non-U.S. 0.9%page 7: Asset Allocation page 9: Quality & Diverse. page 9: private equity segment
page 10: Quailty page 10: Diversification
UCrP QUalit y anD Diversif iCation UCrP Private eQUit y seGMent
Distributions 0.1%

10
page 7: Asset Allocation page 9: Quality & Diverse. page 9: private equity segment
page 10: Quailty page 10: Diversification
fixed income Portfolio
The Fixed Income Portfolio of $9.6 billion accounts for 22.6 percent of the Total Fund and is invested primarily in high quality, call-protected, global bonds. The Fixed Income Portfolio is comprised of the Core Fixed Income ($4.5 billion or 46.7 percent), High Yield Bond ($1.1 billion or 11.2 percent), Emerging Market Debt ($963.0 million or 10.1 percent), and TIPS ($3.0 billion or 32.0 percent) portfolios.
Quality*
The effective duration of the Core Fixed Income portfolio as of June 30, 2011, was 4.9, and the weighted average quality rating was AA/A. The High Yield Bond portfolio had an effective duration of 4.4, and weighted average quality of B. The Emerging Market Debt portfolio had an effective duration of 6.0, and weighted average quality of BBB/BB. The TIPS portfolio had a weighted average quality of AAA/AA. The quality and diversification characteristics of the Core Fixed Income portfolio are shown below.
DiversificationApproximately 12.8 percent of the $6.5 billion Core Fixed Income portfolio (not including the TIPS portfolio) consists of U.S. government-guaranteed securities, and 40.5 percent of the portfolio consists of high quality corporate issues rated investment grade or better, 28.4 percent in government agency and asset-backed securities, 18.3 percent in supranational foreign securities. The quality of the holdings is illustrated below.
The Quality and Diversification Core Fixed Income portfolio investments are diversified among the sectors illustrated below.
* Credit Ratings U.S. Treasury Obligations: Guaranteed by the full faith and credit of the United States and rated AAA by Moody’s and AA+ by Standard & Poor’s.
Standard & Poor’s (S&P) and Other Bond Ratings: AAA: Extremely strong capacity to meet financial commitments. Highest Rating.
AA: Very strong capacity to meet financial commitments.
A: Strong capacity to meet financial commitments, but somewhat susceptible to adverse economic conditions and changes in circumstances
BBB: Adequate capacity to meet financial commitments, but more subject to adverse economic conditions.
BB: Less vulnerable in the near-term but faces major ongoing uncertainties to adverse business, financial and economic conditions.
B: More vulnerable to adverse business, financial and economic conditions but currently has the capacity to meet financial commitments.
CCC or below: Currently highly vulnerable.
page 7: Asset Allocation page 9: Quality & Diverse. page 9: private equity segment
page 10: Quailty page 10: DiversificationUS GovernmentGuaranteed 12.8%
BB 6.6%
A 10.9%
B 15.4%
AA 2.3%
BBB 15.6%
CCC or below 4.0%
AAA 32.4%
US GovernmentGuaranteed 12.8%
Other 0.1%
Corporate Bonds 28.2%
US Agencies 10.0%
Supranational/ foreign 18.3%
Corporate Asset-backed
Securities 12.2%
QUalit y Diversif iCation
US Agencies Asset-backed Securities 18.4%

U n i v e r s i t y o f c a l i f o r n i a 1 0 / 1 1 a n n U a l f i n a n c i a l r e p o r t / r e t i r e m e n t p l a n 11
12 m a n a g e m e n t ’ s d i s c U s s i o n a n d a n a l y s i s
UCrP Management’s Discussion & analysis (Unaudited)
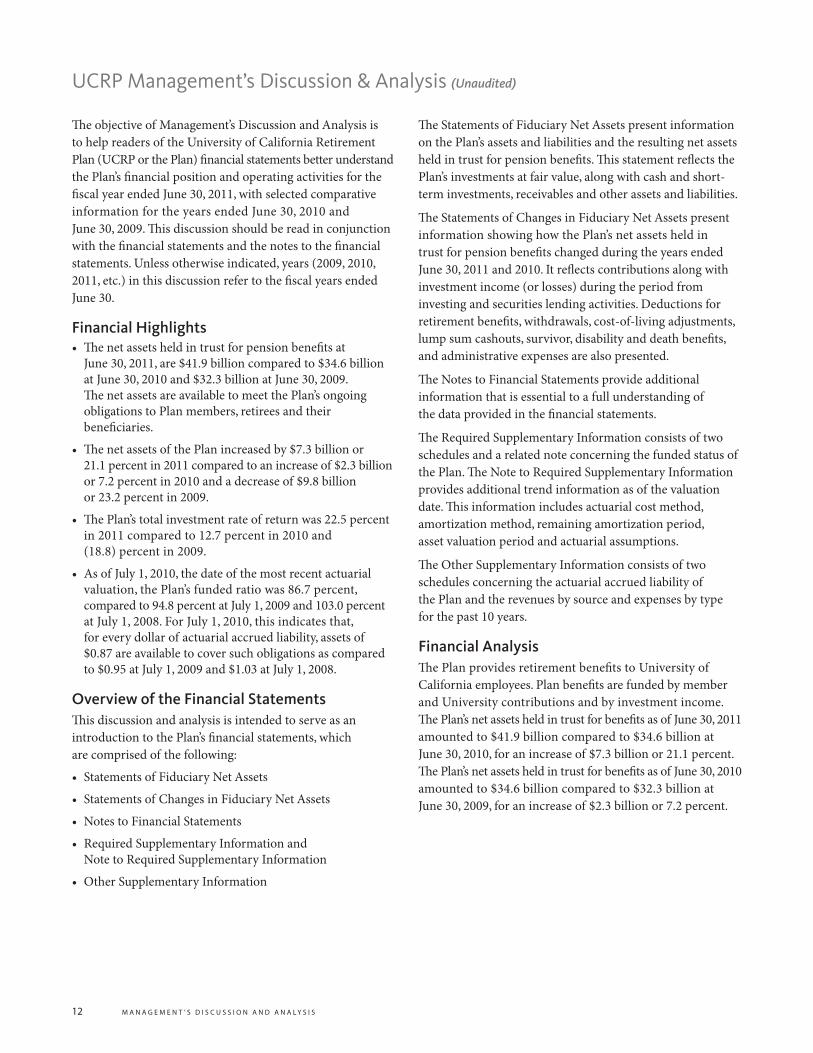
The objective of Management’s Discussion and Analysis is to help readers of the University of California Retirement Plan (UCRP or the Plan) financial statements better understand the Plan’s financial position and operating activities for the fiscal year ended June 30, 2011, with selected comparative information for the years ended June 30, 2010 and June 30, 2009. This discussion should be read in conjunction with the financial statements and the notes to the financial statements. Unless otherwise indicated, years (2009, 2010, 2011, etc.) in this discussion refer to the fiscal years ended June 30.
Financial Highlights• The net assets held in trust for pension benefits at
June 30, 2011, are $41.9 billion compared to $34.6 billion at June 30, 2010 and $32.3 billion at June 30, 2009. The net assets are available to meet the Plan’s ongoing obligations to Plan members, retirees and their beneficiaries.
• The net assets of the Plan increased by $7.3 billion or 21.1 percent in 2011 compared to an increase of $2.3 billion or 7.2 percent in 2010 and a decrease of $9.8 billion or 23.2 percent in 2009.
• The Plan’s total investment rate of return was 22.5 percent in 2011 compared to 12.7 percent in 2010 and (18.8) percent in 2009.
• As of July 1, 2010, the date of the most recent actuarial valuation, the Plan’s funded ratio was 86.7 percent, compared to 94.8 percent at July 1, 2009 and 103.0 percent at July 1, 2008. For July 1, 2010, this indicates that, for every dollar of actuarial accrued liability, assets of $0.87 are available to cover such obligations as compared to $0.95 at July 1, 2009 and $1.03 at July 1, 2008.
Overview of the Financial StatementsThis discussion and analysis is intended to serve as an introduction to the Plan’s financial statements, which are comprised of the following:
• Statements of Fiduciary Net Assets
• Statements of Changes in Fiduciary Net Assets
• Notes to Financial Statements
• Required Supplementary Information and Note to Required Supplementary Information
• Other Supplementary Information
The Statements of Fiduciary Net Assets present information on the Plan’s assets and liabilities and the resulting net assets held in trust for pension benefits. This statement reflects the Plan’s investments at fair value, along with cash and short-term investments, receivables and other assets and liabilities.
The Statements of Changes in Fiduciary Net Assets present information showing how the Plan’s net assets held in trust for pension benefits changed during the years ended June 30, 2011 and 2010. It reflects contributions along with investment income (or losses) during the period from investing and securities lending activities. Deductions for retirement benefits, withdrawals, cost-of-living adjustments, lump sum cashouts, survivor, disability and death benefits, and administrative expenses are also presented.
The Notes to Financial Statements provide additional information that is essential to a full understanding of the data provided in the financial statements.
The Required Supplementary Information consists of two schedules and a related note concerning the funded status of the Plan. The Note to Required Supplementary Information provides additional trend information as of the valuation date. This information includes actuarial cost method, amortization method, remaining amortization period, asset valuation period and actuarial assumptions.
The Other Supplementary Information consists of two schedules concerning the actuarial accrued liability of the Plan and the revenues by source and expenses by type for the past 10 years.
Financial AnalysisThe Plan provides retirement benefits to University of California employees. Plan benefits are funded by member and University contributions and by investment income. The Plan’s net assets held in trust for benefits as of June 30, 2011 amounted to $41.9 billion compared to $34.6 billion at June 30, 2010, for an increase of $7.3 billion or 21.1 percent. The Plan’s net assets held in trust for benefits as of June 30, 2010 amounted to $34.6 billion compared to $32.3 billion at June 30, 2009, for an increase of $2.3 billion or 7.2 percent.

U n i v e r s i t y o f c a l i f o r n i a 1 0 / 1 1 a n n U a l f i n a n c i a l r e p o r t / r e t i r e m e n t p l a n 13
fiDUCiary net assets ($ in thousands)
June 30 2011 2010 2009
ASSeTS
Investments (including Short-Term Investment Pool) $ 42,273,447 $ 35,140,000 $ 32,709,694
Investment of securities lending collateral 5,099,459 6,363,777 6,596,311
Receivables 482,147 292,511 818,983
Total Assets 47,855,053 41,796,288 40,124,988
LIABILITIeS
Payable for securities purchased, member withdrawals, refunds and other payables 882,962 855,157 1,246,622
Collateral held for securities lending 5,099,436 6,366,677 6,619,824
Total Liabilities 5,982,398 7,221,834 7,866,446
Net Assets held in Trust for Pension Benefits $41,872,655 $34,574,454 $32,258,542
CHanGes in fiDUCiary net assets ($ in thousands)
Year ended June 30 2011 2010 2009
ADDITIONS (ReDUCTIONS)
University contributions $ 1,677,921 $ 148,446 $ 454
Member contributions 143,261 23,374 1,300
Investment income (loss) 7,625,501 4,149,541 (7,910,150)
Other 4,226 4,756 5,246
Total Additions (Reductions) 9,450,909 4,326,117 (7,903,150)
DeDUCTIONS
Retirement, cost-of-living adjustments, lump sum cashouts, survivor, disability, and death payments 2,042,844 1,901,066 1,750,223
Member withdrawals 78,776 76,485 78,794
Administrative and other expenses 31,088 32,654 32,453
TOTAL DeDUCTIONS 2,152,708 2,010,205 1,861,470
Increase (Decrease) in Net Assets held in Trust for Pension Benefits 7,298,201 2,315,912 (9,764,620)
NeT ASSeTS heLD IN TRUST FOR PeNSION BeNeFITS
Beginning of Year 34,574,454 32,258,542 42,023,162
end of Year $41,872,655 $34,574,454 $32,258,542

14 m a n a g e m e n t ’ s d i s c U s s i o n a n d a n a l y s i s
At June 30, 2011, the Plan held $21.6 billion in U.S. equity, non-U.S., and private equity securities, compared to $18.6 billion at June 30, 2010 and $18.3 billion at June 30, 2009.
The U.S. equity portfolio return was 31.8 percent in 2011, 15.8 percent in 2010 and (26.8) percent in 2009, compared to the Plan’s domestic equity policy benchmark returns of 32.2 percent, 15.7 percent, and (26.8) percent, respectively. The non-U.S. equity (developed countries) portfolio return was 30.4 percent in 2011, 8.3 percent in 2010, and (30.9) percent in 2009, compared to the Plan’s non-U.S. equity policy benchmark returns of 30.2 percent, 6.8 percent, and (31.7) percent, respectively. The non-U.S. equity (emerging market countries) portfolio return was 28.4 percent in 2011, 25.9 percent in 2010 and (29.5) percent in 2009, compared to the benchmark returns of 27.8 percent, 23.2 percent, and (28.1) percent, respectively.
The private equity portfolio return was 17.8 percent in 2011, 19.2 percent in 2010, and (20.8) percent in 2009, respectively.
At June 30, 2011, the Plan held $6.5 billion in U.S. government (excluding the TIPS portfolio), other U.S. dollar denominated and non-U.S. fixed income securities compared to $6.0 billion at June 30, 2010 and $5.8 billion at June 30, 2009.
The core fixed income portfolio (excluding TIPS) earned a total return of 4.8 percent in 2011, 10.5 percent in 2010 and 7.1 percent in 2009, compared to the Plan’s fixed income policy benchmark returns of 3.9 percent, 9.5 percent, and 7.3 percent, respectively.
At June 30, 2011, the Plan held $3.0 billion in TIPS, compared to $2.8 billion at June 30, 2010 and $2.3 billion at June 30, 2009. The TIPS portfolio earned a total return of 8.1 percent in 2011, 9.7 percent in 2010 and (0.2) percent in 2009, compared to the Plan’s TIPS policy benchmark returns of 7.7 percent, 9.5 percent, and (1.1) percent, respectively.
At June 30, 2011, the Plan also held $2.0 billion in institutional private and public real estate investments compared to $949.0 million in 2010 and $980.0 million in 2009. The private real estate portfolio earned a total return of 21.7 percent in 2011 compared to (29.0) percent in 2010 and (40.4) percent in 2009, compared to policy benchmark returns of 20.1 percent, (27.3) percent, and (37.5) percent, respectively.
The public real estate portfolio earned a total return of 31.3 percent in 2011 and 18.8 percent in 2010 compared to the Plan’s public real estate policy benchmark returns of 32.9 percent and 31.2 percent, respectively.
The Plan’s total fund investment rate of return was 22.5 percent in 2011, 12.7 percent in 2010 and (18.8) percent in 2009, compared to the Plan’s total fund policy benchmark returns of 21.6 percent, 11.6 percent, and (18.9) percent, respectively.
Additions to or reductions from the Plan’s net assets held in trust for benefits include contributions and investment income or loss. In 2011 net additions were $9.5 billion compared to additions of $4.3 billion in 2010 and reductions of $7.9 billion in 2009. Net additions in 2011 reflect significantly higher Member and University contributions and net investment income earned by the Plan as a result of the net appreciation in the fair value of investments.
Member and University contributions during 2011 amounted to $1.8 billion, compared to $171.8 million in 2010 and $1.8 million in 2009. The increase in the amount for 2011 and 2010 over that for 2009 is the result of the reinstatement of Member and University contributions during the fourth quarter of the 2010 fiscal year. Note that the increase in contributions for 2011 is also due to funding of the modified Annual Required Contribution (ARC).
The Plan recognized net investment income of $7.6 billion during 2011, compared to net investment income of $4.1 billion in 2010 and net investment losses of $7.9 billion in 2009. The net investment income in 2011 and 2010 was due primarily to positive returns in the equity portfolios. The net investment loss in 2009 was due primarily to adverse conditions in the global financial markets resulting in negative returns across all equity portfolios of the investment pool.
During 2011, $2.1 billion in retirement benefit payments were made from the Plan to retired members and survivors and disabled members, compared to $1.9 billion made in 2010 and $1.8 billion made in 2009. Member withdrawals from the Plan totaled $78.8 million in 2011 compared to $76.5 million in 2010 and $78.8 million in 2009. Administrative expenses of $31.1 million were paid from the Plan in 2011 compared to $32.7 million in 2010 and $32.5 million in 2009.

U n i v e r s i t y o f c a l i f o r n i a 1 0 / 1 1 a n n U a l f i n a n c i a l r e p o r t / r e t i r e m e n t p l a n 15
Funded StatusThe Plan’s actuarial value of assets available for benefits was $41.2 billion at July 1, 2010 compared to $42.8 billion at July 1, 2009 and $43.8 billion at July 1, 2008. The actuarial accrued liability was $47.5 billion at July 1, 2010 compared to $45.2 billion at July 1, 2009 and $42.6 billion at July 1, 2008. The Plan’s actuarial deficit was $6.3 billion at July 1, 2010 compared to a deficit of $2.4 billion at July 1, 2009 and a surplus of $1.3 billion at July 1, 2008. The funded ratio at July 1, 2010, was 86.7 percent compared to 94.8 percent at July 1, 2009 and 103.0 percent at July 1, 2008. An analysis of the funding progress and University contributions and a discussion of actuarial assumptions and methods is set forth in the required supplementary information section of the financial statements.
While all assets of the Plan are available to pay any member’s benefits, assets and liabilities for the campus and medical center segment of the Plan are internally tracked separately from the DOE national laboratory segment of the Plan. The funded ratio of the campus and medical center segment of the Plan at July 1, 2010 was 86.2 percent compared to 94.8 percent at July 1, 2009 and 103.4 percent at July 1, 2008. For the DOE national laboratory segment of the Plan the funded ratio was 89.0 percent at July 1, 2010, compared to 94.8 percent at July 1, 2009 and 101.3 percent at July 1, 2008. The DOE has a continuing obligation to the University to reimburse the University for University contributions made to the Plan to fund Plan benefits for the laboratory segment retirees.
Looking ForwardPlan costs are funded by a combination of investment earnings, employee member and employer contributions. The unfunded liability for the campuses and medical centers as of July 1, 2010 actuarial valuation was $5.4 billion or 86.2 percent funded. The total funding policy contributions in the July 1, 2010 actuarial valuations represent 23.25 percent of covered compensation. As of July 1, 2011, the funded ratio is expected to decrease to approximately 82.5 percent. At its September 2010 meeting, The Regents approved increasing the employer and employee contribution rates to the Plan. Contributions by members will be increased to 3.5 percent of covered compensation in July 2011 and 5 percent in July 2012 and contributions
by the University will be increased to 7 percent of covered compensation in July 2011 and 10 percent in July 2012. These contribution rates are below the Plan’s total funding contributions. The Regents also approved a new tier of pension benefits applicable to employees hired on or after July 1, 2013, which would increase the early retirement age from 50 to 55, but retain many of the current features of the Plan. The new tier will not offer lump sum cashouts, inactive member cost-of-living adjustments (COLAs), or subsidized survivor annuities for spouses and domestic partners. These changes are subject to collective bargaining for union-represented employees.
Cautionary Note Regarding Forward-Looking Statements
Certain information provided by the University, including written information as outlined above or oral statements made by its representatives, may contain forward-looking statements as defined in the Private Securities Litigation Reform Act of 1995. All statements, other than statements of historical facts, which address activities, events, or developments that the University expects or anticipates will or may occur in the future contain forward-looking information.
Fiduciary Responsibilities
The Vice President, Human Resources, has primary responsibility for Plan administrative functions and the Chief Investment Officer has primary fiduciary responsibility for implementing Plan investment policy. The Regents determines investment policy and retains broad oversight fiduciary responsibility for investment and administrative functions used for the exclusive benefit of plan members, retirees and their beneficiaries and for administrative expenses.

U n i v e r s i t y o f c a l i f o r n i a 1 0 / 1 1 a n n U a l f i n a n c i a l r e p o r t / r e t i r e m e n t p l a n 17
to the regents of the University of California:
in our opinion, the accompanying statements of fiduciary net assets and the related statements of changes in fiduciary net assets
(presented on pages 18 through 35) present fairly, in all material respects, the financial position of the University of California
retirement Plan (the “Plan”) at June 30, 2011 and 2010, and the changes in fiduciary net assets for the years then ended in conformity
with accounting principles generally accepted in the United states of america. these financial statements are the responsibility
of the Plan’s management. our responsibility is to express an opinion on these financial statements based on our audits.
We conducted our audits of these statements in accordance with auditing standards generally accepted in the United states of america.
those standards require that we plan and perform the audit to obtain reasonable assurance about whether the financial statements
are free of material misstatement. an audit includes examining, on a test basis, evidence supporting the amounts and disclosures
in the financial statements, assessing the accounting principles used and significant estimates made by management, and evaluating
the overall financial statement presentation. We believe that our audits provide a reasonable basis for our opinion.
as discussed in note 1, the financial statements of the Plan are intended to present the fiduciary net assets and the changes in fiduciary
net assets of only that portion of activities that are attributable to the Plan. they do not purport to, and do not, present fairly the
financial position of the University of California as of June 30, 2011 and 2010, and the changes in its financial position and cash flows
for the years then ended in conformity with accounting principles generally accepted in the United states of america.
the required supplementary information (“rsi”) on pages 36 and 37 is not a required part of the financial statements but is
supplementary information required by the Governmental accounting standards board. We have applied certain limited procedures,
which consisted principally of inquiries of management regarding the methods of measurement and presentation of the rsi.
However, we did not audit the information and express no opinion on it.
s a n f r a n C i s C o, C a l i f o r n i a
o C t o b e r 1 2 , 2 0 1 1
report of independent auditors

18 2 0 1 0 / 2 0 1 1 s t a t e m e n t s
financial statements
stateMents of fiDUCiary net assets ($ in thousands)
June 30 2011 2010
ASSeTS
Investments, at fair value:
Equity securities:
Domestic $10,283,299 $ 9,395,222
Foreign 8,467,617 6,805,831
Private equities 2,875,906 2,349,932
Fixed income securities:
U.S. government 3,860,494 3,135,090
Other U.S. dollar denominated 5,597,391 6,295,104
Foreign 103,798 18,734
Commingled funds 8,759,512 6,037,654
Real estate 1,983,283 948,640
Real assets 327,189 161,114
Investment derivatives 14,958 (7,321)
Total Investments 42,273,447 35,140,000
Investment of Cash Collateral 5,099,459 6,363,777
Receivables:
Contributions 301,000 163,167
Interest and dividends 69,681 75,459
Securities sales and other 111,466 53,885
Total Receivables 482,147 292,511
Total Assets 47,855,053 41,796,288
LIABILITIeS
Payable for securities purchased 668,484 650,348
Member withdrawals, refunds and other payables 214,478 204,809
Collateral held for securities lending 5,099,436 6,366,677
Total Liabilities 5,982,398 7,221,834
Net Assets held in Trust for Pension Benefits* $41,872,655 $34,574,454
* See Required Supplementary Schedule of Funding Progress. See accompanying Notes to Financial Statements.
U n i v e r s i t y o f c a l i f o r n i a 1 0 / 1 1 a n n U a l f i n a n c i a l r e p o r t / r e t i r e m e n t p l a n 19
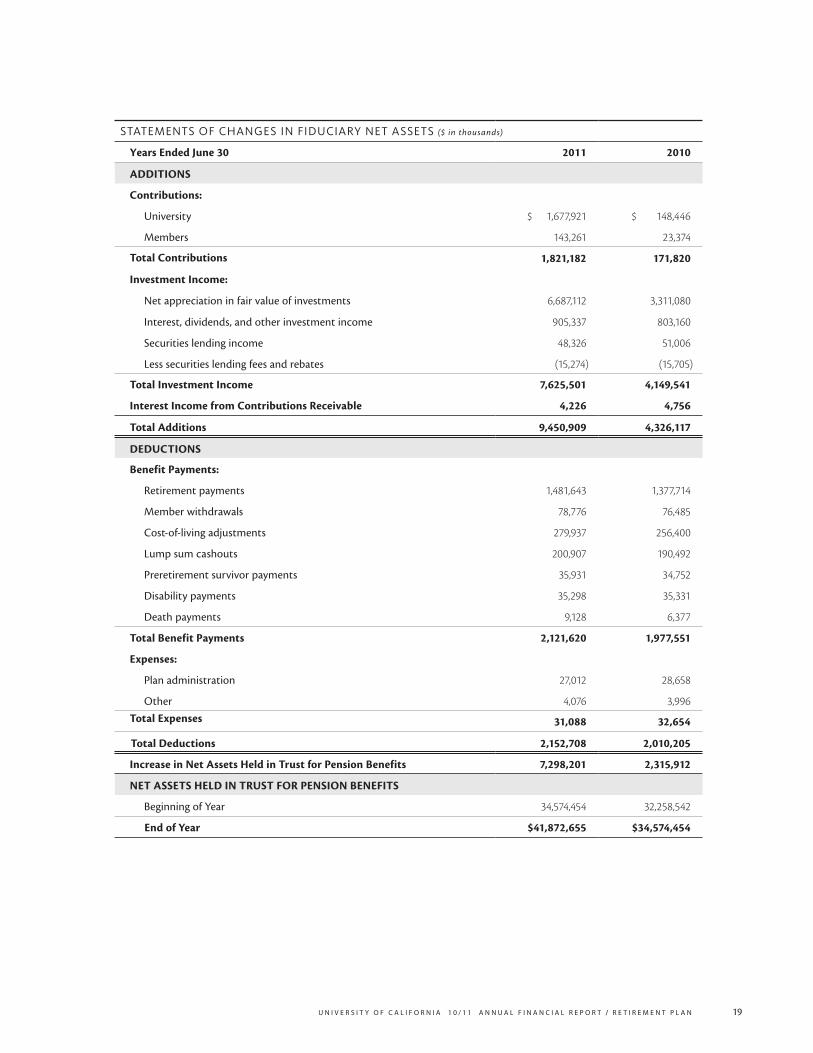
stateMents of CHanGes in fiDUCiary net assets ($ in thousands)
Years ended June 30 2011 2010
ADDITIONS
Contributions:
University $ 1,677,921 $ 148,446
Members 143,261 23,374
Total Contributions 1,821,182 171,820
Investment Income:
Net appreciation in fair value of investments 6,687,112 3,311,080
Interest, dividends, and other investment income 905,337 803,160
Securities lending income 48,326 51,006
Less securities lending fees and rebates (15,274) (15,705)
Total Investment Income 7,625,501 4,149,541
Interest Income from Contributions Receivable 4,226 4,756
Total Additions 9,450,909 4,326,117
DeDUCTIONS
Benefit Payments:
Retirement payments 1,481,643 1,377,714
Member withdrawals 78,776 76,485
Cost-of-living adjustments 279,937 256,400
Lump sum cashouts 200,907 190,492
Preretirement survivor payments 35,931 34,752
Disability payments 35,298 35,331
Death payments 9,128 6,377
Total Benefit Payments 2,121,620 1,977,551
expenses:
Plan administration 27,012 28,658
Other 4,076 3,996
Total expenses 31,088 32,654
Total Deductions 2,152,708 2,010,205
Increase in Net Assets held in Trust for Pension Benefits 7,298,201 2,315,912
NeT ASSeTS heLD IN TRUST FOR PeNSION BeNeFITS
Beginning of Year 34,574,454 32,258,542
end of Year $41,872,655 $34,574,454
20 n o t e s t o f i n a n c i a l s t a t e m e n t s
notes to financial statements YEARS ENDED June 30, 2011 and 2010
NOtE 1 — Description of the Plan and Significant Accounting Policies
General IntroductionThe University of California Retirement Plan (UCRP or the Plan) is a defined benefit plan providing lifetime retirement income, disability protection, death benefits, and postretirement and preretirement survivor benefits to eligible employees of the University of California (the University) and its affiliate, Hastings College of the Law.
Established in 1961, membership in the Plan is required for all employees appointed to work at least 50 percent time for one year or more or for an indefinite period. Effective January 1, 2001, employees with limited appointments, employees in contract positions, employees in “non-career” positions at the Department of Energy’s (DOE) Lawrence Berkeley National Laboratory (LBNL), and certain academic employees are eligible for UCRP membership after working 1,000 hours (750 hours for the Non-Senate Instructional Unit) in a continuous 12-month period.
Generally, five years of service are required for entitlement to Plan benefits. The amount of the monthly pension benefit is determined under the basic formula of covered compensation times age factor times years of service credit. The maximum monthly benefit cannot exceed 100 percent of the employee’s highest average plan compensation over a 36-month period, as adjusted for the annual Internal Revenue Code (IRC) §401(a)(17) limit on covered compensation. The annual benefit is subject to limitations established by IRC §415. Annual cost-of-living adjustments (COLAs) are made to monthly benefits according to a specified formula based on the Consumer Price Index (CPI). Ad hoc COLAs may be granted subject to funding availability.
Effective July 1, 2013, UCRP will be amended to provide a new tier of pension benefits applicable to employees hired on or after July 1, 2013. The new tier would increase the early retirement age from 50 to 55, but retain many of the current features of UCRP. The new tier would not offer lump sum cashouts, inactive member COLAs, or subsidized survivor annuities for spouses and domestic partners. For represented employees, all changes would be subject to collective bargaining.
The Plan offered three Voluntary Early Retirement Incentive Programs (VERIPs) adopted by The Regents of the University of California (The Regents), which granted enhanced benefits to certain eligible members upon
electing early retirement. The VERIPs are known as Plus 5 (fiscal year 1990-1991), Take 5 (fiscal year 1992-1993) and VERIP III (fiscal year 1993-1994).
The Plan includes four membership classifications: members with Social Security, members without Social Security, Safety members (police and firefighters), and Tier Two members. At June 30, 2011, active Plan membership consisted of 113,652 members with Social Security, 1,497 members without Social Security, 404 Safety members and 15 Tier Two members.
Members’ contributions are recorded separately and accrue interest at a rate determined by The Regents, the Plan’s trustee, from time to time. Currently member contributions accrue interest at an annual compounded rate of 6.0 percent, credited monthly. Upon termination, members may elect a refund of their contributions plus accumulated interest (and their Capital Accumulation Payment (CAP) balance if any); vested terminated members who are eligible to retire may also elect a lump sum payment equal to the actuarially equivalent present value of their accrued benefits. Both actions forfeit the member’s right to monthly benefits based on the same service credit.
From July 1, 1966, to June 30, 1971, the Plan maintained a noncontributory period for most members; contributions were required only from members who had reached age thirty and had at least one year of service. Member plan accounts designated “Plan 02” were established to keep track of contributions that would have been made had a member been contributing during this period. Future retirement benefits for members with Plan 02 accounts are reduced to account for the contributions that were not made, unless the member repays the Plan 02 balance.
For the period from July 1, 1987 to July 1, 1990, qualifying Plan members could elect to participate in noncontributory Plan membership known as Tier Two. Tier Two provides a lower level of retirement income, disability protection and survivor benefits, calculated using specific Tier Two formulas based on the member’s covered compensation times age factor times years of service credit.
Plan members may also have a balance in the Plan consisting of CAP allocations, which were credited in behalf of eligible members on various dates in 1992, 1993, 1994, 2002 and 2003. Provided to supplement basic Plan benefits, the allocations were equal to a percentage of the eligible member’s covered compensation paid during the specified period. The CAP balance is generally payable in a lump sum at retirement or separation from service and includes

U n i v e r s i t y o f c a l i f o r n i a 1 0 / 1 1 a n n U a l f i n a n c i a l r e p o r t / r e t i r e m e n t p l a n 21
interest credited monthly equal to an annual percentage yield (APY) of 8.5 percent for allocations made in 1992, 1993, and 1994. For allocations made in 2002 and 2003, the interest credited monthly is equal to the Plan’s actuarial investment rate of return assumption, which currently equates to an APY of 7.5 percent. The APY applied to the 2002 and 2003 allocation will vary according to changes in the investment rate of return assumption for the Plan.
At June 30, 2011, Plan membership included 56,296 retirees, beneficiaries, and disabled members currently receiving benefits, 32,159 terminated vested employees entitled to benefits but not yet receiving them, and 28,744 terminated non-vested employees entitled to a refund of their Plan accumulations and/or CAP balances, including the balances for Los Alamos National Laboratory (LANL) and Lawrence Livermore National Laboratory (LLNL) members who transferred their benefits and service credit to the defined benefit pension plans established by Los Alamos National Security (LANS) or Lawrence Livermore National Security (LLNS), as applicable, and are eligible for a CAP distribution. Of current active employees, 69,979 are fully vested and 45,589 are non-vested active employees covered by the Plan.
Employer contributions are made to the Plan on behalf of all members. The rate of University contributions is established annually pursuant to The Regents’ funding policy (see Note 5 on page 33). For LLNL and LANL retirees and inactive members who remain members in the Plan, the DOE has an ongoing financial responsibility to reimburse the University for contributions to the Plan, if needed, to satisfy the liabilities attributable to the benefits of members who previously worked at LLNL and LANL.
Basis of AccountingThe financial statements have been prepared in accordance with accounting principles generally accepted in the United States of America, including all applicable effective statements of the Governmental Accounting Standards Board (GASB), and the accrual basis of accounting.
GASB Statement No. 59, Financial Instruments Omnibus, was adopted by the Plan during the year ended June 30, 2011. This Statement updates existing standards regarding financial reporting and disclosure requirements of certain financial instruments and external investment pools. Implementation of Statement No. 59 had no effect on the Plan’s fiduciary net assets or changes in fiduciary net assets for the years ended June 30, 2011 and 2010.
GASB Statement No. 62, Codification of Accounting and Financial Reporting Guidance Contained in Pre-November 30, 1989 FASB and AICPA Pronouncements, was adopted by the Plan during the year ended June 30, 2011. This Statement incorporates into GASB’s authoritative literature certain accounting and financial reporting guidance that is included in Financial Accounting Standards Board Statements and Interpretations, Accounting Principles Board Opinions and Accounting Research Bulletins of the American Institute of Certified Public Accountants’ Committee on Accounting Procedures that were issued on or before November 30, 1989. Implementation of Statement No. 62 had no effect on the Plan’s fiduciary net assets or changes in fiduciary net assets for the years ended June 30, 2011 and 2010.
Valuation of InvestmentsInvestments are recorded at fair value. Securities, including derivative investments, are valued at the last sale price on the last business day of the fiscal year, as quoted on a recognized exchange or an industry standard pricing service, when available. Securities for which no sale was reported as of the close of the last business day of the fiscal year are valued at the quoted bid price of a dealer who regularly trades in the security being valued. Certain securities may be valued on a basis of a price provided by a single source.
As a result of inactive or illiquid markets, certain investments in non-agency mortgage-backed fixed income securities are valued on the basis of their estimated future principal and interest payments using appropriate risk-adjusted discount rates.
Investments include private equities, absolute return funds and real estate. Private equities include venture capital partnerships, buyout and international funds. Interests in private equity and real estate partnerships are based upon valuations provided by the general partners of the respective partnerships as of March 31, adjusted for cash receipts, cash disbursements and securities distributions through June 30. Investments in absolute return partnerships are valued as of May 31, adjusted for cash receipts and cash disbursements through June 30. Interests in certain direct investments in real estate are estimated based upon independent appraisals. The Plan believes the carrying amount of these financial instruments and real estate is a reasonable estimate of fair value at June 30. Because the private equity, real estate and absolute return partnerships, along with direct investments in real estate, are not readily marketable, their estimated value is subject to uncertainty and, therefore, may differ significantly from the value that would be used had a ready market for such investments existed. Investments in
22 n o t e s t o f i n a n c i a l s t a t e m e n t s
registered investment companies are valued based upon the reported net asset value of those companies.
Derivative instruments are recorded at fair value. Futures contracts, foreign currency exchange contracts, forward contracts, stock rights and warrants are valued at the last sales price on the last day of the fiscal year, as quoted on a recognized exchange or an industry standard pricing service.
Accounting for InvestmentsInvestment transactions are recorded on the date the securities are purchased or sold (trade date). Realized gains or losses are recorded as the difference between the proceeds from the sale and the average cost of the investment sold.Dividend income is recorded on the ex-dividend date and interest income is accrued as earned.
Investments denominated in foreign currencies are translated into U.S. dollar equivalents using year-end spot foreign currency exchange rates. Purchases and sales of investments and their related income are translated at the rate of exchange on the respective transaction dates. Realized and unrealized gains and losses resulting from foreign currency changes are included in the Plan’s statement of changes in fiduciary net assets.
Administrative ExpensesAdministrative expenses are incurred in connection with the operation of the Plan for items such as staff salaries and benefits, investment management, information systems, leased space, supplies and equipment, and professional services rendered by the Plan actuary, legal counsel, and independent auditor. Total Plan administrative expenses, which are paid from Plan assets, represent approximately $31.1 million or 0.07 percent and $32.7 million or 0.09 percent, respectively, of the net assets held in trust for pension benefits for fiscal years 2011 and 2010.
Income Tax StatusThe form of the Plan is intended to qualify under IRC §401(a) and the regulations thereunder and the Plan’s trust is intended to be exempt from taxation under IRC §501(a).
In a letter to the University dated November 8, 2007, the Internal Revenue Service (IRS) confirmed its determination that the form of the Plan as amended through December 11, 2002 (other than amendments authorized by the Economic Growth and Tax Relief Reconciliation
Act of 2001) met the requirements for qualification under IRC §401(a). Since then, the Plan has been amended to comply with subsequent tax acts and state laws and to make certain design changes recommended by the President of the University and approved by The Regents. Tax counsel for the Plan is not aware of any existing circumstances related to such amendments that indicate a failure to comply with the relevant requirements of the IRC in any material respect. To the best of tax counsel’s knowledge, the Plan has been administered in accordance with its terms and the applicable provisions of the IRC and related regulations thereunder, in all material respects.
Use of Estimates in the Preparation of Financial StatementsThe preparation of financial statements in conformity with accounting principles generally accepted in the United States of America requires management to make estimates and assumptions that affect the reported amounts of assets and liabilities and disclosure of contingent assets and liabilities at the date of the financial statements and the reported amounts of revenues and expenditures during the reporting period. Although management believes the estimates and assumptions are reasonable, they are based upon information available at the time the estimate or judgment is made and actual amounts could differ from those estimates.
The financial statements of the Plan are intended to present the fiduciary net assets and the changes in fiduciary net assets of only that portion of activities that are attributable to the Plan. They do not purport to, and do not, present fairly the financial position of the University of California as of June 30, 2011 and 2010.
ReclassificationsIn connection with the preparation of the June 30, 2011 financial statements, $655.6 million of forward contracts on a to-be-announced basis held by the Plan were reclassified from derivatives to fixed or variable income securities. The effect on the prior period financial statements is not material. However, management elected to make the revisions in classification to the Plan’s 2010 presentation. This revision had no effect on Fiduciary net assets or changes in Fiduciary net assets.

U n i v e r s i t y o f c a l i f o r n i a 1 0 / 1 1 a n n U a l f i n a n c i a l r e p o r t / r e t i r e m e n t p l a n 23
NOtE 2 — InvestmentsThe Regents, as the governing board and as trustee, is responsible for the oversight of the Plan’s investments and establishes investment policy, which is carried out by the Chief Investment Officer. The Chief Investment Officer has primary fiduciary responsibility for investing the Plan’s assets consistent with the policies established by The Regents. The Regents establishes investment policies for the Plan and has fiduciary responsibility for overseeing the implementation of those policies.
Participation in the Short Term Investment Pool (STIP) maximizes the returns on short-term cash balances by taking advantage of the economies of scale of investing in a large pool with a broad range of maturities. STIP is managed to maximize current earned income. The available cash in the Plan awaiting investment or for administrative expenses is also invested in STIP. Investments authorized by The Regents for STIP include fixed income securities with a maximum maturity of five and one-half years.
Investments authorized by The Regents for the Plan’s investment pools and separate investments include equity securities, fixed-income securities and certain other asset classes. The equity portion of the investment portfolios may include both domestic and foreign common and preferred stocks, and actively managed and passive (index) strategies, along with a modest exposure to private equities. Private equities include venture capital partnerships, buyouts and international funds. The Plan’s investment portfolios may include certain foreign currency denominated equity securities.
The fixed income portion of the investment portfolios may include both domestic and foreign securities, along with certain securitized investments, including mortgage-backed and asset-backed securities. Fixed income investment guidelines permit the use of futures and options on fixed income instruments in the ongoing management of the portfolios. Derivative contracts are authorized for portfolio rebalancing in accordance with The Regents’ asset allocation policy and as substitutes for physical securities. Real estate investments and absolute return strategies are authorized for the Plan. Absolute return strategies may incorporate short sales, plus derivative positions to implement or hedge an investment position. They are not used for speculative purposes.

24 n o t e s t o f i n a n c i a l s t a t e m e n t s
CoMPosition of investMents ($ in thousands)
2011 2010
eqUITY SeCURITIeS:
Domestic $ 10,283,299 $ 9,395,222
Foreign 8,467,617 6,805,831
equity Securities 18,750,916 16,201,053
FIxeD INCOMe SeCURITIeS:
U.S. government guaranteed:
U.S. Treasury bills, notes and bonds 547,406 310,818
U.S. Treasury strips 271,844 54,458
U.S. TIPS 3,026,651 2,753,781
U.S. government-backed securities 14,593 16,033
Fixed Income Securities 3,860,494 3,135,090
OTheR U.S. DOLLAR DeNOMINATeD:
Corporate bonds 1,739,829 2,111,288
U.S. agencies 653,372 598,275
U.S. agencies asset-backed securities 1,200,554 993,302
Corporate asset-backed securities 797,244 1,248,191
Supranational/foreign 1,197,143 1,334,604
Other 9,249 9,444
Other U.S. Dollar Denominated 5,597,391 6,295,104
FOReIgN CURReNCY DeNOMINATeD:
Corporate 103,798 18,734
Foreign Currency Denominated 103,798 18,734
COMMINgLeD FUNDS:
Absolute Return 2,831,652 2,340,230
U.S. equity funds 1,144,974 1,004,011
Non-U.S. equity funds 2,918,345 1,956,186
U.S. bond funds 476,681 4,429
Money market funds* 1,387,860 732,798
Commingled Funds* 8,759,512 6,037,654
PRIvATe eqUITY 2,875,906 2,349,932
ReAL ASSeTS 327,189 161,114
ReAL eSTATe 1,983,283 948,640
INveSTMeNT DeRIvATIveS 14,958 (7,321)
Total Investments $42,273,447 $35,140,000
*Includes investment of $162,208 and $74,163 in the Short Term Investment Pool as of June 30, 2011 and 2010, respectively.
The composition of investments and derivative instruments, by investment type at June 30, 2011 and 2010 is as follows:
U n i v e r s i t y o f c a l i f o r n i a 1 0 / 1 1 a n n U a l f i n a n c i a l r e p o r t / r e t i r e m e n t p l a n 25
Investment Risk FactorsThere are many factors that can affect the value of investments. Some, such as custodial credit risk, concentration of credit risk, and foreign currency risk may affect both equity and fixed income securities. Equity securities respond to such factors as economic conditions, individual company earnings performance, and market liquidity, while fixed income securities are particularly sensitive to credit risks and changes in interest rates. Alternative investment strategies and their underlying assets and rights are also subject to an array of economic and market vagaries that can limit or erode value.
Credit RiskFixed income securities are subject to credit risk, which is the chance that a bond issuer will fail to pay interest or principal in a timely manner, or that negative perceptions of the issuer’s ability to make these payments will cause security prices to decline. These circumstances may arise due to a variety of factors such as financial weakness, bankruptcy, litigation and/or adverse political developments.
A bond’s credit quality is an assessment of the issuer’s ability to pay interest on the bond, and ultimately to pay the principal. Credit quality is evaluated by one of the independent bond-rating agencies, for example, Moody’s Investors Service (Moody’s) or Standard and Poor’s (S&P). The lower the rating, the greater the chance, in the rating agency’s opinion, that the bond issuer will default, or fail to meet its payment obligations. Generally, the lower a bond’s credit rating, the higher its yield should be to compensate for the additional risk.
Certain fixed income securities, including obligations of the U.S. government or those explicitly guaranteed by the U.S. government, are not considered to have credit risk. On August 8, 2011, the S&P downgraded the credit ratings of certain long-term debt instruments issued by Fannie Mae and Freddie Mac and other U.S. government agencies linked to long-term U.S. debt. These downgrades could adversely affect the market value of such instruments and the credit risk associated with our investments in U.S. Treasury securities held as investments by the Plan.
Asset-backed securities are debt obligations that represent claims to the cash flows from pools of commercial, mortgage, credit card or student loans. Mortgage backed securities issued by Ginnie Mae are backed by the full faith and credit of the U.S. government. Effective September 2008, Fannie Mae and Freddie Mac were placed under the conservatorship of the Federal Housing Finance Agency. At the same time, the U.S. Treasury put in place a set of financing agreements to ensure Fannie Mae and Freddie Mac have the ability to fulfill their obligations to holders of bonds that they have issued or guaranteed.
The investment guidelines for STIP recognize that a limited amount of credit risk, properly managed and monitored, is prudent and provides incremental risk-adjusted return over its benchmark. (The benchmark for STIP, the 2-year Treasury Note, does not contain credit risk.) No more than 5 percent of the total market value of the STIP portfolio may be invested in securities rated below investment grade (BB, Ba or lower). The average credit quality of STIP must be A or better, and commercial paper must be rated at least A-1, P-1, or F-1.
Credit risk is appropriate in balanced investment pools such as the Plan by virtue of the benchmark chosen for the fixed income portion of the pool.
The fixed income benchmark for the Plan, the Barclays Capital U.S. Aggregate Bond Index, is comprised of approximately 25 percent corporate bonds and 35 percent mortgage/asset-backed securities, all of which carry some degree of credit risk. The remaining 40 percent is government-issued bonds.
Credit risk in the Plan is managed primarily by diversifying across issuers. In addition, portfolio guidelines for the Plan mandate that no more than 10 percent of the market value of fixed income securities may be invested in issues with a credit rating below investment grade. Further, the weighted average credit rating must be A or higher.
In addition, the investment policy for the Plan allows for dedicated allocations to non-investment grade and emerging market bonds, investment in which entails credit, default and/or sovereign risk.

26 n o t e s t o f i n a n c i a l s t a t e m e n t s
The credit risk profile for fixed or variable income securities at June 30, 2011 and 2010 is as follows: fixeD or variable inCoMe seCUrities ($ in thousands)
2011 2010
U.S. government guaranteed $3,860,494 $3,135,090
Other U.S. dollar denominated:AAA 2,124,980 2,819,117 AA 148,775 194,707 A 713,169 542,681 BBB 932,059 1,002,259 BB 431,429 544,791 B 987,663 849,983 CCC or below 256,532 330,274 A1/P1/F1 773 9,756 Not rated 2,011 1,536
Foreign currency denominated:AAA 88,318 – B 15,480 18,734
Commingled funds:U.S. bond funds: Not rated 476,681 4,429
Money market funds: Not rated 1,387,860 732,798
Custodial Credit RiskCustodial credit risk is the risk that, in the event of the failure of the custodian, the investments may not be returned. The Plan’s securities are registered in the name of The Regents as trustee of the Plan by the custodial bank. Other types of investments represent ownership interests that do not exist in physical or book-entry form. As a result, custodial credit risk for such investments is remote.
Concentration of Credit RiskConcentration of credit risk is the risk associated with a lack of diversification, such as having substantial investments in a few individual issuers, thereby exposing the Plan to greater risks resulting from adverse economic, political, regulatory, geographic, or credit developments.
The U.S. and non-U.S. equity portions of the plan may be managed either passively or actively. For the portion managed passively, the concentration of individual securities is exactly equal to their concentration in the benchmark. While some securities have a larger representation in the benchmark than others, the Plan’s trustee considers that passive management results in an absence of concentration of credit risk. For the portion managed actively, asset class guidelines do not specifically address concentration risk, but do state that the U.S. equity asset class in the aggregate will be appropriately diversified to control overall risk and
will exhibit portfolio characteristics similar to the asset class benchmark (including concentration of credit risk). Concentration risk for individual portfolios is monitored relative to their individual benchmarks and agreed-upon risk parameters in their guidelines.
Investment guidelines addressing concentration of credit risk related to the investment-grade fixed income portion of the Plan portfolio include a limit of no more than 3 percent of the portfolio’s market value to be invested in any single issuer (except for securities issued by the U.S. government or its agencies) at the time of purchase. These same guidelines apply to the STIP. For high-yield and emerging market debt, the corresponding limit is 5 percent.
There are no investments in issuers other than U.S. government guaranteed securities that represent 5 percent or more of the total investments at June 30, 2011 or 2010.
Interest Rate RiskInterest rate risk is the risk that the value of fixed and variable income securities will decline because of changing interest rates. The prices of fixed income securities with a longer time to maturity, measured by effective duration, tend to be more sensitive to changes in interest rates and, therefore, more volatile than those with shorter durations. Effective duration is the approximate change in price of a security resulting from a 100 basis point (1 percentage point) change in the level of interest rates. It is not a measure of time.
Interest rate risk for the STIP is managed by constraining the maturity of all individual securities to be less than five and one-half years. There is no restriction on weighted average maturity of the portfolio as it is managed relative to the liquidity demands of the investors. The nature and maturity of individual securities in the STIP allow for the use of weighted average maturity as an effective risk management tool, rather than the more complex measure, effective duration.
Portfolio guidelines for the fixed income portion of the Plan limit weighted average effective duration to the effective duration of the benchmark Barclays Capital U.S. Aggregate Bond Index, plus or minus 20 percent. These portfolio guidelines constrain the potential price movement due to interest rate changes of the portfolio to be similar to that of the benchmark. There are similar restrictions for the high-yield and emerging market debt portfolios relative to their benchmarks.
U n i v e r s i t y o f c a l i f o r n i a 1 0 / 1 1 a n n U a l f i n a n c i a l r e p o r t / r e t i r e m e n t p l a n 27
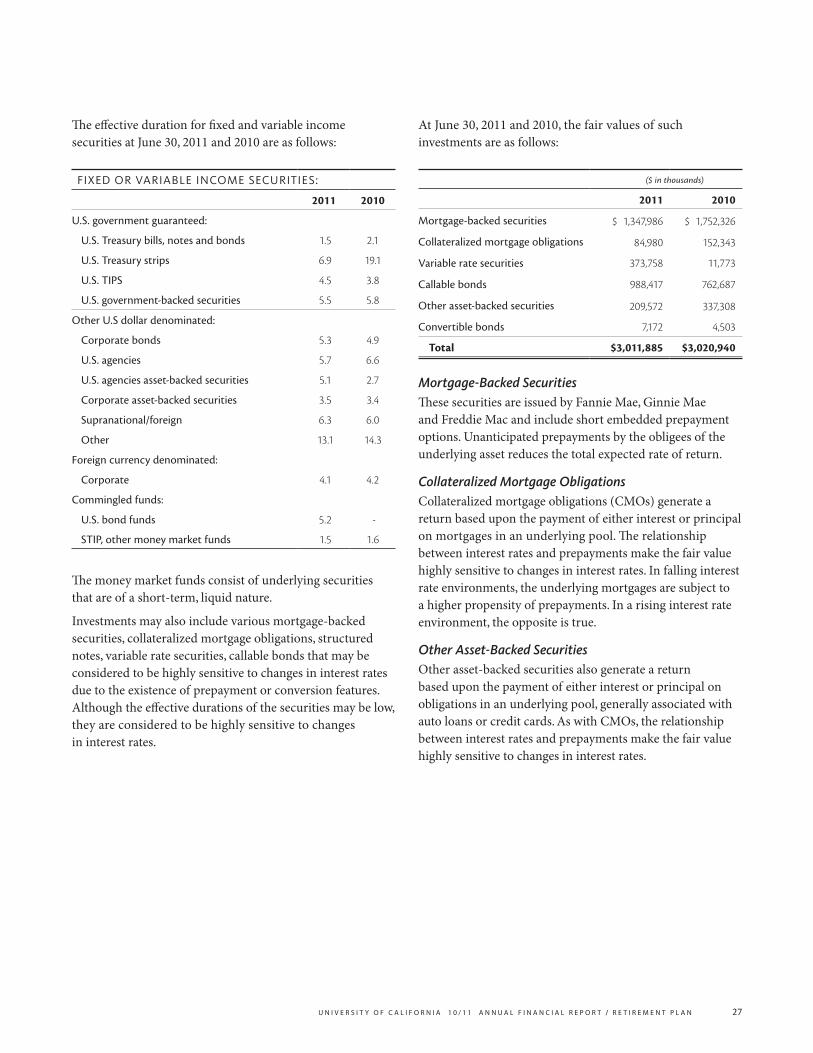
The effective duration for fixed and variable income securities at June 30, 2011 and 2010 are as follows: fixeD or variable inCoMe seCUrities:
2011 2010
U.S. government guaranteed:
U.S. Treasury bills, notes and bonds 1.5 2.1
U.S. Treasury strips 6.9 19.1
U.S. TIPS 4.5 3.8
U.S. government-backed securities 5.5 5.8
Other U.S dollar denominated:
Corporate bonds 5.3 4.9
U.S. agencies 5.7 6.6
U.S. agencies asset-backed securities 5.1 2.7
Corporate asset-backed securities 3.5 3.4
Supranational/foreign 6.3 6.0
Other 13.1 14.3
Foreign currency denominated:
Corporate 4.1 4.2
Commingled funds:
U.S. bond funds 5.2 -
STIP, other money market funds 1.5 1.6
The money market funds consist of underlying securities that are of a short-term, liquid nature.
Investments may also include various mortgage-backed securities, collateralized mortgage obligations, structured notes, variable rate securities, callable bonds that may be considered to be highly sensitive to changes in interest rates due to the existence of prepayment or conversion features. Although the effective durations of the securities may be low, they are considered to be highly sensitive to changes in interest rates.
At June 30, 2011 and 2010, the fair values of such investments are as follows:
($ in thousands)
2011 2010
Mortgage-backed securities $ 1,347,986 $ 1,752,326
Collateralized mortgage obligations 84,980 152,343
Variable rate securities 373,758 11,773
Callable bonds 988,417 762,687
Other asset-backed securities 209,572 337,308
Convertible bonds 7,172 4,503
Total $3,011,885 $3,020,940
Mortgage-Backed SecuritiesThese securities are issued by Fannie Mae, Ginnie Mae and Freddie Mac and include short embedded prepayment options. Unanticipated prepayments by the obligees of the underlying asset reduces the total expected rate of return.
Collateralized Mortgage ObligationsCollateralized mortgage obligations (CMOs) generate a return based upon the payment of either interest or principal on mortgages in an underlying pool. The relationship between interest rates and prepayments make the fair value highly sensitive to changes in interest rates. In falling interest rate environments, the underlying mortgages are subject to a higher propensity of prepayments. In a rising interest rate environment, the opposite is true.
Other Asset-Backed SecuritiesOther asset-backed securities also generate a return based upon the payment of either interest or principal on obligations in an underlying pool, generally associated with auto loans or credit cards. As with CMOs, the relationship between interest rates and prepayments make the fair value highly sensitive to changes in interest rates.
28 n o t e s t o f i n a n c i a l s t a t e m e n t s
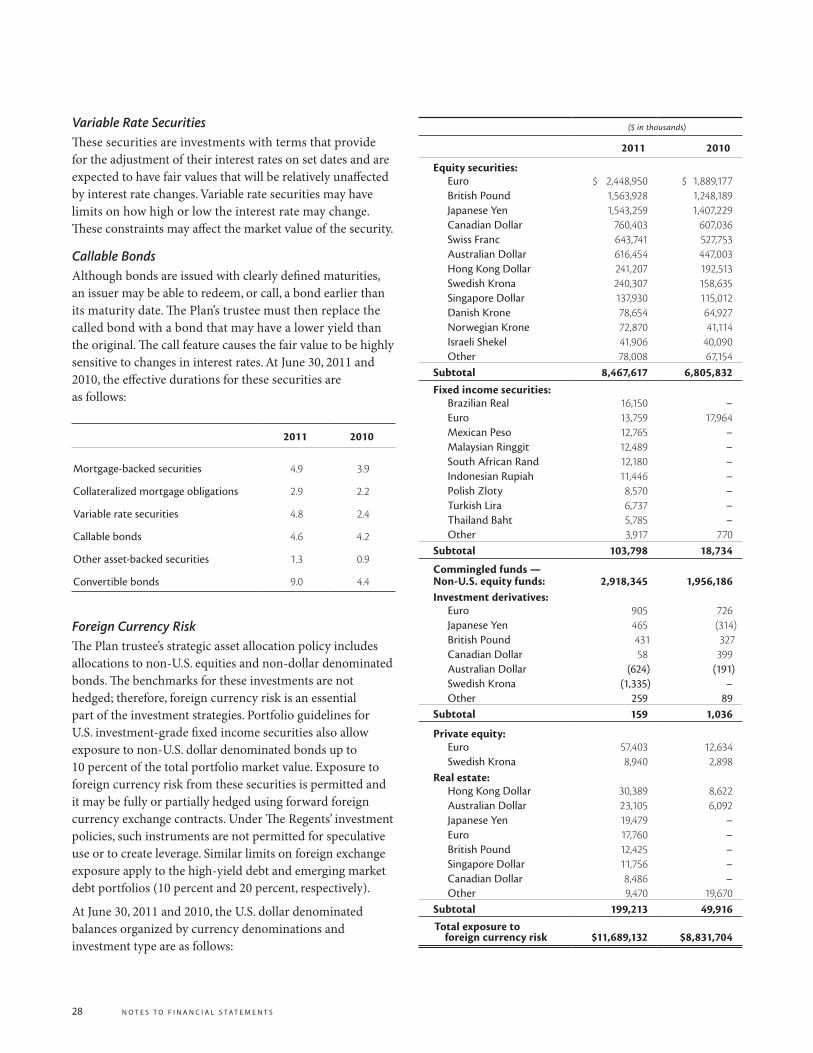
Variable Rate SecuritiesThese securities are investments with terms that provide for the adjustment of their interest rates on set dates and are expected to have fair values that will be relatively unaffected by interest rate changes. Variable rate securities may have limits on how high or low the interest rate may change. These constraints may affect the market value of the security.
Callable BondsAlthough bonds are issued with clearly defined maturities, an issuer may be able to redeem, or call, a bond earlier than its maturity date. The Plan’s trustee must then replace the called bond with a bond that may have a lower yield than the original. The call feature causes the fair value to be highly sensitive to changes in interest rates. At June 30, 2011 and 2010, the effective durations for these securities are as follows:
2011 2010
Mortgage-backed securities 4.9 3.9
Collateralized mortgage obligations 2.9 2.2
Variable rate securities 4.8 2.4
Callable bonds 4.6 4.2
Other asset-backed securities 1.3 0.9
Convertible bonds 9.0 4.4
Foreign Currency RiskThe Plan trustee’s strategic asset allocation policy includes allocations to non-U.S. equities and non-dollar denominated bonds. The benchmarks for these investments are not hedged; therefore, foreign currency risk is an essential part of the investment strategies. Portfolio guidelines for U.S. investment-grade fixed income securities also allow exposure to non-U.S. dollar denominated bonds up to 10 percent of the total portfolio market value. Exposure to foreign currency risk from these securities is permitted and it may be fully or partially hedged using forward foreign currency exchange contracts. Under The Regents’ investment policies, such instruments are not permitted for speculative use or to create leverage. Similar limits on foreign exchange exposure apply to the high-yield debt and emerging market debt portfolios (10 percent and 20 percent, respectively).
At June 30, 2011 and 2010, the U.S. dollar denominated balances organized by currency denominations and investment type are as follows:
($ in thousands)
2011 2010
equity securities:Euro $ 2,448,950 $ 1,889,177 British Pound 1,563,928 1,248,189 Japanese Yen 1,543,259 1,407,229 Canadian Dollar 760,403 607,036 Swiss Franc 643,741 527,753 Australian Dollar 616,454 447,003 Hong Kong Dollar 241,207 192,513 Swedish Krona 240,307 158,635 Singapore Dollar 137,930 115,012 Danish Krone 78,654 64,927 Norwegian Krone 72,870 41,114 Israeli Shekel 41,906 40,090 Other 78,008 67,154
Subtotal 8,467,617 6,805,832Fixed income securities:
Brazilian Real 16,150 – Euro 13,759 17,964 Mexican Peso 12,765 – Malaysian Ringgit 12,489 – South African Rand 12,180 – Indonesian Rupiah 11,446 – Polish Zloty 8,570 – Turkish Lira 6,737 – Thailand Baht 5,785 – Other 3,917 770
Subtotal 103,798 18,734
Commingled funds — Non-U.S. equity funds: 2,918,345 1,956,186 Investment derivatives:
Euro 905 726 Japanese Yen 465 (314)British Pound 431 327 Canadian Dollar 58 399 Australian Dollar (624) (191)Swedish Krona (1,335) – Other 259 89
Subtotal 159 1,036
Private equity:Euro 57,403 12,634 Swedish Krona 8,940 2,898
Real estate:Hong Kong Dollar 30,389 8,622 Australian Dollar 23,105 6,092 Japanese Yen 19,479 – Euro 17,760 – British Pound 12,425 – Singapore Dollar 11,756 – Canadian Dollar 8,486 – Other 9,470 19,670
Subtotal 199,213 49,916Total exposure to
foreign currency risk $11,689,132 $8,831,704
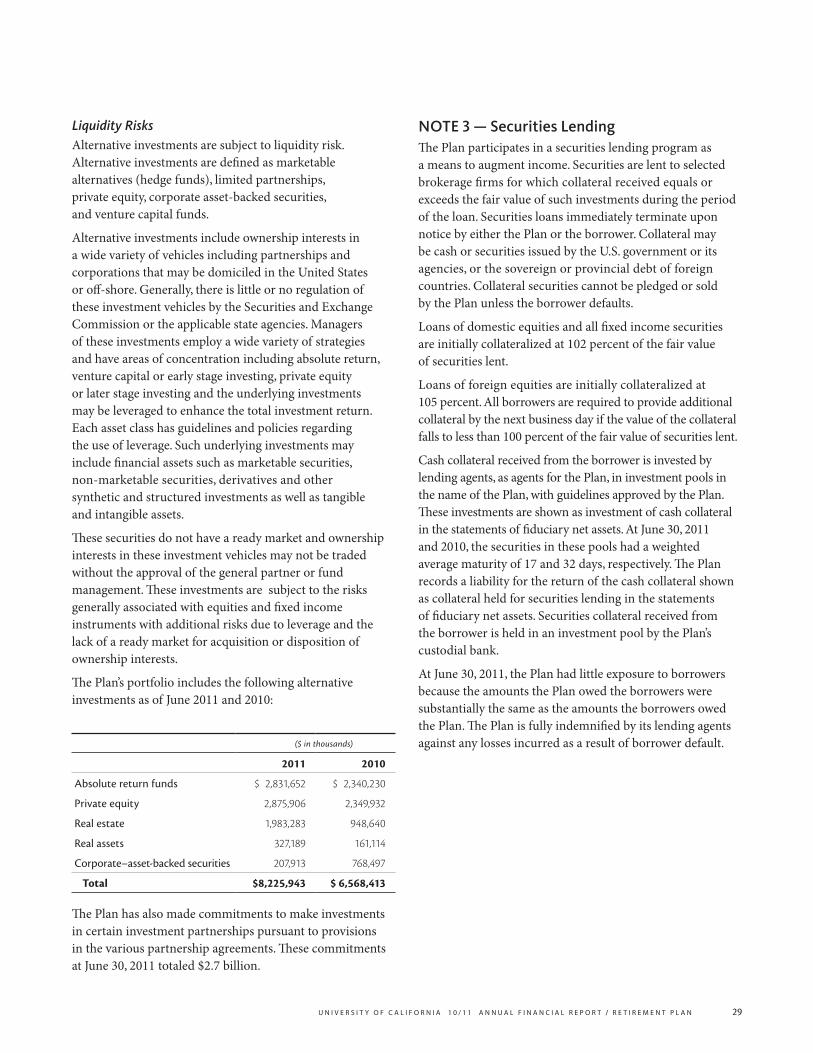
U n i v e r s i t y o f c a l i f o r n i a 1 0 / 1 1 a n n U a l f i n a n c i a l r e p o r t / r e t i r e m e n t p l a n 29
Liquidity RisksAlternative investments are subject to liquidity risk. Alternative investments are defined as marketable alternatives (hedge funds), limited partnerships, private equity, corporate asset-backed securities, and venture capital funds.
Alternative investments include ownership interests in a wide variety of vehicles including partnerships and corporations that may be domiciled in the United States or off-shore. Generally, there is little or no regulation of these investment vehicles by the Securities and Exchange Commission or the applicable state agencies. Managers of these investments employ a wide variety of strategies and have areas of concentration including absolute return, venture capital or early stage investing, private equity or later stage investing and the underlying investments may be leveraged to enhance the total investment return. Each asset class has guidelines and policies regarding the use of leverage. Such underlying investments may include financial assets such as marketable securities, non-marketable securities, derivatives and other synthetic and structured investments as well as tangible and intangible assets.
These securities do not have a ready market and ownership interests in these investment vehicles may not be traded without the approval of the general partner or fund management. These investments are subject to the risks generally associated with equities and fixed income instruments with additional risks due to leverage and the lack of a ready market for acquisition or disposition of ownership interests.
The Plan’s portfolio includes the following alternative investments as of June 2011 and 2010:
($ in thousands)
2011 2010
Absolute return funds $ 2,831,652 $ 2,340,230
Private equity 2,875,906 2,349,932
Real estate 1,983,283 948,640
Real assets 327,189 161,114
Corporate–asset-backed securities 207,913 768,497
Total $8,225,943 $ 6,568,413
The Plan has also made commitments to make investments in certain investment partnerships pursuant to provisions in the various partnership agreements. These commitments at June 30, 2011 totaled $2.7 billion.
NOtE 3 — Securities LendingThe Plan participates in a securities lending program as a means to augment income. Securities are lent to selected brokerage firms for which collateral received equals or exceeds the fair value of such investments during the period of the loan. Securities loans immediately terminate upon notice by either the Plan or the borrower. Collateral may be cash or securities issued by the U.S. government or its agencies, or the sovereign or provincial debt of foreign countries. Collateral securities cannot be pledged or sold by the Plan unless the borrower defaults.
Loans of domestic equities and all fixed income securities are initially collateralized at 102 percent of the fair value of securities lent.
Loans of foreign equities are initially collateralized at 105 percent. All borrowers are required to provide additional collateral by the next business day if the value of the collateral falls to less than 100 percent of the fair value of securities lent.
Cash collateral received from the borrower is invested by lending agents, as agents for the Plan, in investment pools in the name of the Plan, with guidelines approved by the Plan. These investments are shown as investment of cash collateral in the statements of fiduciary net assets. At June 30, 2011 and 2010, the securities in these pools had a weighted average maturity of 17 and 32 days, respectively. The Plan records a liability for the return of the cash collateral shown as collateral held for securities lending in the statements of fiduciary net assets. Securities collateral received from the borrower is held in an investment pool by the Plan’s custodial bank.
At June 30, 2011, the Plan had little exposure to borrowers because the amounts the Plan owed the borrowers were substantially the same as the amounts the borrowers owed the Plan. The Plan is fully indemnified by its lending agents against any losses incurred as a result of borrower default.

30 n o t e s t o f i n a n c i a l s t a t e m e n t s
Securities lending transactions at June 30, 2011 and 2010 are as follows:
($ in thousands)
2011 2010
seCUrities lent
For cash collateral:
Equity securities:
Domestic $ 1,730,369 $ 1,940,705
Foreign 719,626 698,872
Fixed income securities:
U.S. government 1,907,528 2,623,266
Other U.S. dollar denominated 636,042 914,575
Lent for Cash Collateral 4,993,565 6,177,418
For securities collateral:
Equity securities:
Domestic 155,398 196,241
Foreign 1,298,332 535,505
Fixed income securities:
U.S. government 1,084,932 176,995
Other U.S. dollar denominated 222,293 367,363
Foreign currency denominated 3,428 3,618
Lent for Securities Collateral 2,764,383 1,279,722
Total Securities Lent $7,757,948 $ 7,457,140
Collateral reCeiveD
Cash $5,099,436 $ 6,366,677
Securities 2,868,956 1,324,546
Total Collateral Received $7,968,392 $7,691,223
investMent of CasH reCeiveD
Fixed or variable income securities:
Other U.S. dollar denominated:
Corporate bonds $ 462,489 $ 368,964
Commercial paper 180,744 406,257
Repurchase agreements 2,735,896 1,952,399
Corporate asset-backed securities 296,508 513,130
Certificates of deposit/time deposits 456,571 2,140,343
Supranational/foreign 707,934 688,747
U.S. Agencies 258,230 248,279
Commingled funds: Money market funds: Not rated – 48,278
Assets (liabilities), net* 1,087 (2,620)
Total Investment of Cash Collateral $5,099,459 $6,363,777
*Assets (liabilities), net is comprised of pending settlements of cash collateral investments.
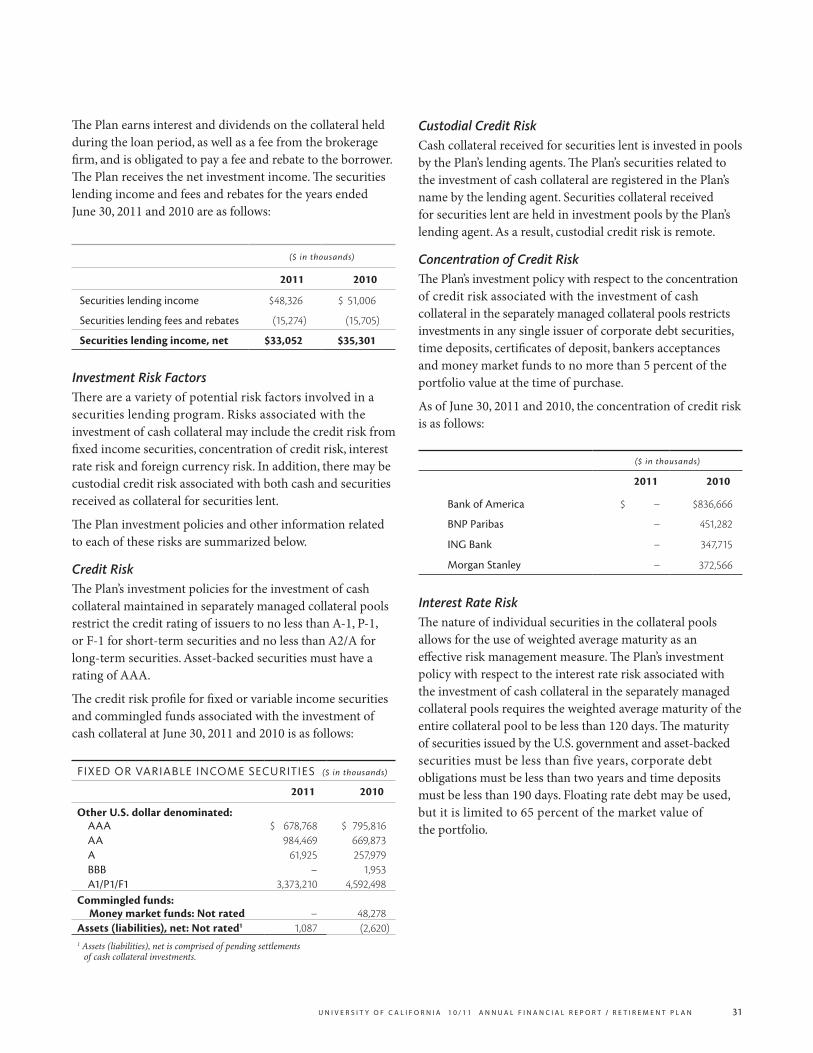
U n i v e r s i t y o f c a l i f o r n i a 1 0 / 1 1 a n n U a l f i n a n c i a l r e p o r t / r e t i r e m e n t p l a n 31
The Plan earns interest and dividends on the collateral held during the loan period, as well as a fee from the brokerage firm, and is obligated to pay a fee and rebate to the borrower. The Plan receives the net investment income. The securities lending income and fees and rebates for the years ended June 30, 2011 and 2010 are as follows:
($ in thousands)
2011 2010
Securities lending income $48,326 $ 51,006
Securities lending fees and rebates (15,274) (15,705)
Securities lending income, net $33,052 $35,301
Investment Risk FactorsThere are a variety of potential risk factors involved in a securities lending program. Risks associated with the investment of cash collateral may include the credit risk from fixed income securities, concentration of credit risk, interest rate risk and foreign currency risk. In addition, there may be custodial credit risk associated with both cash and securities received as collateral for securities lent.
The Plan investment policies and other information related to each of these risks are summarized below.
Credit RiskThe Plan’s investment policies for the investment of cash collateral maintained in separately managed collateral pools restrict the credit rating of issuers to no less than A-1, P-1, or F-1 for short-term securities and no less than A2/A for long-term securities. Asset-backed securities must have a rating of AAA.
The credit risk profile for fixed or variable income securities and commingled funds associated with the investment of cash collateral at June 30, 2011 and 2010 is as follows: fixeD or variable inCoMe seCUrities ($ in thousands)
2011 2010
Other U.S. dollar denominated:AAA $ 678,768 $ 795,816 AA 984,469 669,873 A 61,925 257,979 BBB – 1,953 A1/P1/F1 3,373,210 4,592,498
Commingled funds:Money market funds: Not rated – 48,278
Assets (liabilities), net: Not rated1 1,087 (2,620)1 Assets (liabilities), net is comprised of pending settlements
of cash collateral investments.
Custodial Credit RiskCash collateral received for securities lent is invested in pools by the Plan’s lending agents. The Plan’s securities related to the investment of cash collateral are registered in the Plan’s name by the lending agent. Securities collateral received for securities lent are held in investment pools by the Plan’s lending agent. As a result, custodial credit risk is remote.
Concentration of Credit RiskThe Plan’s investment policy with respect to the concentration of credit risk associated with the investment of cash collateral in the separately managed collateral pools restricts investments in any single issuer of corporate debt securities, time deposits, certificates of deposit, bankers acceptances and money market funds to no more than 5 percent of the portfolio value at the time of purchase.
As of June 30, 2011 and 2010, the concentration of credit risk is as follows:
($ in thousands)
2011 2010
Bank of America $ – $836,666
BNP Paribas – 451,282
ING Bank – 347,715
Morgan Stanley – 372,566
Interest Rate RiskThe nature of individual securities in the collateral pools allows for the use of weighted average maturity as an effective risk management measure. The Plan’s investment policy with respect to the interest rate risk associated with the investment of cash collateral in the separately managed collateral pools requires the weighted average maturity of the entire collateral pool to be less than 120 days. The maturity of securities issued by the U.S. government and asset-backed securities must be less than five years, corporate debt obligations must be less than two years and time deposits must be less than 190 days. Floating rate debt may be used, but it is limited to 65 percent of the market value of the portfolio.

32 n o t e s t o f i n a n c i a l s t a t e m e n t s
The weighted average maturity expressed in days outstanding for fixed or variable income securities associated with the investment of cash collateral at June 30, 2011 and 2010 is as follows: fixeD or variable inCoMe seCUrities (in days)
2011 2010
Other U.S. dollar denominated:
Corporate bonds 23 37
Commercial paper 31 12
Repurchase agreements 8 51
U.S. Agencies 15 –
Corporate asset-backed securities 15 15
Certificates of deposit/time deposits 26 25
Supranational/foreign 38 27
Commingled funds: Money market funds: Not rated –
1
Investment of cash collateral may include various asset-backed securities, structured notes and variable rate securities that may be considered to be highly sensitive to changes in interest rates due to the existence of prepayment or conversion features, although the weighted average maturity may be short.
At June 30, 2011 and 2010, the fair value of investments that are considered to be highly sensitive to changes in interest rates is as follows:
($ in thousands)
2011 2010
Other asset-backed securities $ 296,508 $ 513,130
Variable rate investments 1,170,422 1,057,710
At June 30, 2011 and 2010, the weighted average maturity expressed in days outstanding for asset-backed securities was 15 days and 15 days, respectively; 32 days and 30 days, respectively, for variable rate investments.
Foreign Currency RiskThe Plan’s investment policy with respect to the foreign currency risk associated with the investment of cash collateral maintained in separate collateral pools restricts investments to U.S. dollar denominated securities. Therefore, there is no foreign currency risk.
NOtE 4 — Financial Derivative InstrumentsThe Plan may use derivatives including futures, foreign currency exchange contracts, options, forward contracts, stock rights and warrants as a substitute for investment in equity and fixed income securities or to reduce the effect of fluctuating foreign currencies on foreign currency denominated investments.
The Plan enters into futures contracts for the purpose of acting as a substitute for investment in equity and fixed income securities. A futures contract is an agreement between two parties to buy and sell a security or financial index, interest rate or foreign currency at a set price on a future date. They are standardized contracts that can be easily bought and sold and are exchange-traded. Upon entering into such a contract, the Plan is required to pledge to the broker an amount of cash or securities equal to the minimum initial margin requirements of the exchange on which the contract is traded. Pursuant to the contract, the Plan agrees to receive from, or pay to, the counterparty an amount of cash equal to the daily fluctuation in the value of the contract. These contracts are settled on a daily basis, with the resulting realized gain or loss included in the statement of revenues, expenses and changes in net assets. The settlement amount at the end of each day for each of the contracts, or variation margin, is included in investments and represents the fair value of the contracts.
Forward contracts are similar to futures contracts, although they are not exchange-traded. Foreign currency exchange contracts are forward contracts used to hedge against foreign currency exchange rate risks on non-U.S. dollar denominated investment securities and to increase or decrease exposure to various foreign currencies.

U n i v e r s i t y o f c a l i f o r n i a 1 0 / 1 1 a n n U a l f i n a n c i a l r e p o r t / r e t i r e m e n t p l a n 33
An option contract gives the Plan the right, but not the obligation, to buy or sell a specified security or index at a fixed price during a specified period for a nonrefundable fee (the ‘‘premium’’). The maximum loss to the Plan is limited to the premium originally paid for covered options. The Plan records premiums paid for the purchase of these options in the statements of fiduciary net assets as an investment which is subsequently adjusted to reflect the fair value of the options, with unrealized gains and losses included in the statements of changes in fiduciary net assets. The Plan held no option contracts at June 30, 2011 or 2010.
The Plan considers its futures, foreign currency exchange contracts, options, forward contracts, stock rights and warrants to be investment derivatives.
The fair value balances and notional amounts of derivative instruments outstanding at June 30, 2011 and 2010, categorized by type, and the changes in fair value of such derivatives for the years then ended are as follows:
investMent Derivatives ($ in thousands)
Category Notional Amount Fair value-Positive (Negative) Changes In Fair value
2011 2010 Classification 2011 2010 Classification 2011 2010Futures contracts:
Domestic equity futures:
Long positions 825,109 557,329 Investments $ 8,502 $ (8,455) Net appreciation $ 155,964 $ 202,160
Short positions – (11,712) Investments – 99 Net depreciation (2,582) (2,392)
Foreign equity futures:
Long positions 210,384 163,198 Investments 2,548 (557) Net appreciation 22,601 24,301
Short positions (75,643) (37,001) Investments (1,031) 421 Net depreciation (7,032) (2,668)
Futures contracts, net 10,019 (8,492) 168,952 221,401
Foreign currency exchange contracts:Long positions 193,691 143,701 Investments (937) 1,542 Net appreciation 34,892 7,119
Short positions (225,686) (159,977) Investments (436) (370) Net depreciation (35,342) (1,935)
Foreign currency exchange contracts, net (1,374) 1,172 (449) 5,184
Stock rights/warrants – – Investments 6,313 – Net appreciation 2,331 –
Total investment derivatives $14,958 $ (7,321) $170,834 $226,585
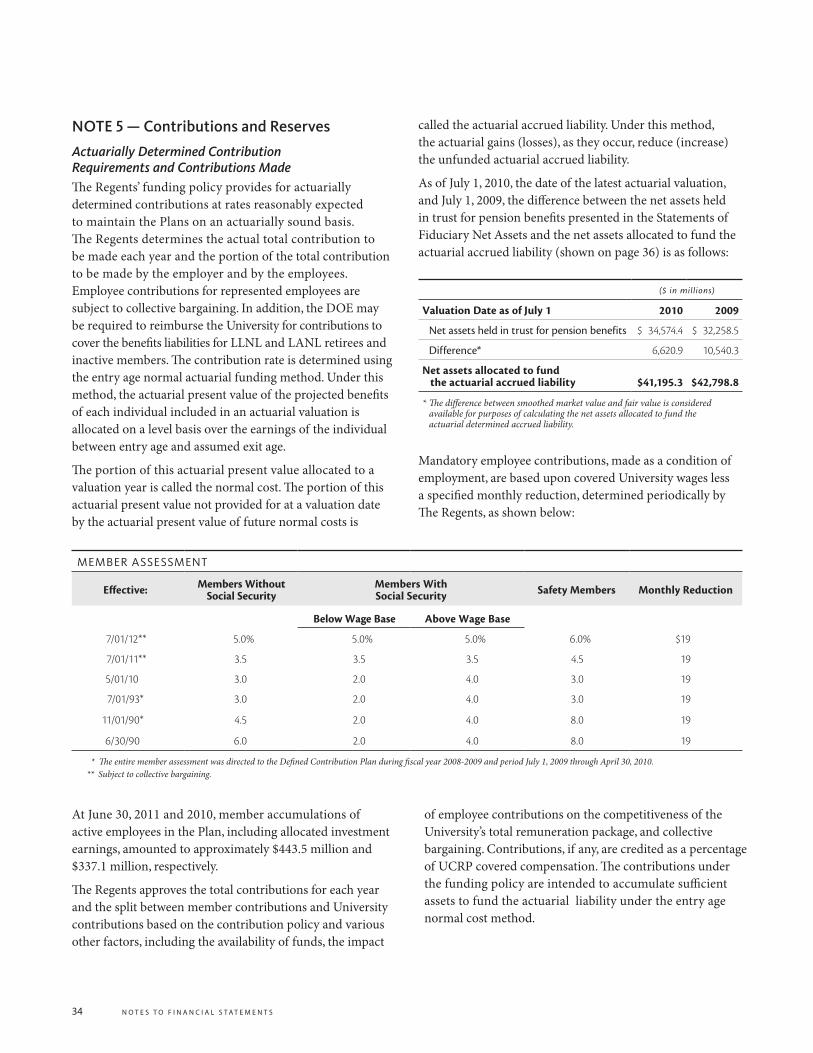
34 n o t e s t o f i n a n c i a l s t a t e m e n t s
NOtE 5 — Contributions and Reserves
Actuarially Determined Contribution Requirements and Contributions MadeThe Regents’ funding policy provides for actuarially determined contributions at rates reasonably expected to maintain the Plans on an actuarially sound basis. The Regents determines the actual total contribution to be made each year and the portion of the total contribution to be made by the employer and by the employees. Employee contributions for represented employees are subject to collective bargaining. In addition, the DOE may be required to reimburse the University for contributions to cover the benefits liabilities for LLNL and LANL retirees and inactive members. The contribution rate is determined using the entry age normal actuarial funding method. Under this method, the actuarial present value of the projected benefits of each individual included in an actuarial valuation is allocated on a level basis over the earnings of the individual between entry age and assumed exit age.
The portion of this actuarial present value allocated to a valuation year is called the normal cost. The portion of this actuarial present value not provided for at a valuation date by the actuarial present value of future normal costs is
called the actuarial accrued liability. Under this method, the actuarial gains (losses), as they occur, reduce (increase) the unfunded actuarial accrued liability.
As of July 1, 2010, the date of the latest actuarial valuation, and July 1, 2009, the difference between the net assets held in trust for pension benefits presented in the Statements of Fiduciary Net Assets and the net assets allocated to fund the actuarial accrued liability (shown on page 36) is as follows:
($ in millions)
valuation Date as of July 1 2010 2009
Net assets held in trust for pension benefits $ 34,574.4 $ 32,258.5
Difference* 6,620.9 10,540.3
Net assets allocated to fund the actuarial accrued liability $41,195.3 $42,798.8
* The difference between smoothed market value and fair value is considered available for purposes of calculating the net assets allocated to fund the actuarial determined accrued liability.
Mandatory employee contributions, made as a condition of employment, are based upon covered University wages less a specified monthly reduction, determined periodically by The Regents, as shown below:
MeMber assessMent
effective: Members Without Social Security
Members With Social Security Safety Members Monthly Reduction
Below Wage Base Above Wage Base
7/01/12** 5.0% 5.0% 5.0% 6.0% $19
7/01/11** 3.5 3.5 3.5 4.5 19
5/01/10 3.0 2.0 4.0 3.0 19
7/01/93* 3.0 2.0 4.0 3.0 19
11/01/90* 4.5 2.0 4.0 8.0 19
6/30/90 6.0 2.0 4.0 8.0 19
* The entire member assessment was directed to the Defined Contribution Plan during fiscal year 2008-2009 and period July 1, 2009 through April 30, 2010.** Subject to collective bargaining.
At June 30, 2011 and 2010, member accumulations of active employees in the Plan, including allocated investment earnings, amounted to approximately $443.5 million and $337.1 million, respectively.
The Regents approves the total contributions for each year and the split between member contributions and University contributions based on the contribution policy and various other factors, including the availability of funds, the impact
of employee contributions on the competitiveness of the University’s total remuneration package, and collective bargaining. Contributions, if any, are credited as a percentage of UCRP covered compensation. The contributions under the funding policy are intended to accumulate sufficient assets to fund the actuarial liability under the entry age normal cost method.
U n i v e r s i t y o f c a l i f o r n i a 1 0 / 1 1 a n n U a l f i n a n c i a l r e p o r t / r e t i r e m e n t p l a n 35
On December 13, 2010, The Regents delegated to the President discretion to fully fund the modified Annual Required Contribution (ARC) for the Plan in the following two phases: (1) from fiscal year 2010-11 through fiscal year 2018-19, the University would contribute to UCRP, to the extent practical, the modified ARC, that would include normal cost plus interest only on the unfunded actuarial accrued liability (UAAL); (2) beyond fiscal 2018-19, the University would contribute the full ARC payment, that would include normal cost on the pension, interest on the UAAL and an amount that represents the annual principal contribution of the 30-year amortization of the UAAL. In 2011, employer contributions included $1.1 billion that was contributed to the Plan at the President’s discretion.
Employer and employee contributions were $1.7 billion and $143.3 million, respectively, during the year ended June 30, 2011. Employer and employee contributions were $148.4 million and $23.4 million, respectively, during the year ended June 30, 2010.
LBNL is required to make employer and employee contributions in conformity with The Regents’ funding policy. In addition, under certain circumstances the University makes contributions to UCRP in behalf of LANL and LLNL retirees based upon a contractual arrangement with the DOE designed to maintain the 100 percent funded status of the LANL and LLNL segments within UCRP, and is reimbursed by the DOE.
Employee contributions to UCRP are accounted for separately and currently accrue interest at 6.0 percent annually. Upon termination, members may elect a refund of their contributions plus accumulated interest; vested terminated members who are eligible to retire may also elect monthly retirement income or a lump sum equal to the present value of their accrued benefits.
NOtE 6 — Contributions Receivable from the State of CaliforniaContributions receivable includes $43.8 million and $50.8 million at June 30, 2011 and 2010, respectively, related to agreements between the state of California (the state) and the University on behalf of the Plan. In 1984, the state agreed to pay the University for contributions due to the Plan of $66.5 million in 30 annual installments of approximately $5.9 million, including interest at 8.00 percent, based on the discount rate used in the 1984 actuarial valuation. Similarly, in fiscal year 1990, the state agreed to pay the University for contributions due to the Plan of $57.2 million in 30 annual installments of approximately $5.3 million, including interest at 8.46 percent, based on the discount rate used in the 1990 actuarial valuation.
NOtE 7 — Plan terminationThe Regents expects to continue the Plan indefinitely, but reserves the right to amend or discontinue the Plan at any time provided that any such action shall not lessen accrued benefits of any members. In the event that the Plan is terminated, its assets shall be applied solely for the benefit of retired, vested or active participants and beneficiaries, until all liabilities of the Plan have been satisfied. Once all liabilities have been satisfied, any excess assets shall revert to The Regents.
The benefits of the Plan are not insured by the Pension Benefit Guaranty Corporation, a federal insurance agency established under Title IV of the Employee Retirement Income Security Act of 1974.

36
Actuarial InformationAnalysis of dollar amounts of the actuarial value of assets, actuarial accrued liability, and actuarial value of assets less than or in excess of the actuarial accrued liability in isolation can be misleading. Expressing the actuarial value of assets as a percentage of the actuarial accrued liability provides one indication of the funding status on a going concern basis. Analysis of this percentage over time indicates whether a plan is becoming financially stronger or weaker.
Generally, the greater this percentage, the stronger the plan. Trends in the unfunded actuarial accrued liability or assets in excess of the actuarial accrued liability and annual covered payroll are both affected by inflation. Expressing the unfunded actuarial accrued liability or surplus as a percentage of annual covered payroll generally adjusts for the effects of inflation and aids in the analysis of progress made in accumulating sufficient assets to pay benefits when due.
reQUireD sUPPleMentary sCHeDUle of fUnDinG ProGress for tHe Past six years
vALUATION DATe AS OF JULY 1 ($ in millions)
Actuarial valuation Date
(1) Actuarial value
of Assets
(2) Actuarial Accrued
Liability
(3) Actuarial (Deficit)
Surplus
(4) Total Funded Ratio
(1)÷(2)
(5)Annual Covered
Payroll
(6)Actuarial (Deficit) Surplus
as a Percentage of Annual Covered Payroll
(3)÷(5)
2010 $41,195.3 $47,504.3 $(6,309.0) 86.7% $7,995.4 (78.9)%
2009 42,798.8 45,160.5 (2,361.7) 94.8 7,873.7 (30.0)
2008 43,840.3 42,576.8 1,263.5 103.0 7,468.9 16.9
2007 * 43,434.0 41,436.6 1,997.4 104.8 7,612.7 26.2
2006 41,972.5 40,301.7 1,670.8 104.1 8,259.0 20.2
2005 41,084.9 37,252.4 3,832.5 110.3 8,149.6 47.0
* The July 1, 2007 information includes changes in actuarial assumptions that decreased the July 1, 2007 actuarial accrued liability by $535 million. A change in an actuarial method for projecting covered payroll is also included. Covered payroll is now reduced to anticipate members who leave active status during the year. This decreased the July 1, 2007 annual covered payroll by $814 million.
required supplementary information
Actuarial valuations represent a long-term perspective and involve estimates of the value of reported amounts and assumptions about the probability of occurrence of events far into the future. The projection of benefits does not explicitly incorporate the potential effects of the results of collective bargaining discussions on the contribution rate. Actuarially determined amounts are subject to periodic revisions as actual results are compared with past expectations and new estimates are made about the future. The schedule of funding progress presents multi-year trend information about whether the actuarial value of assets is increasing or decreasing over time relative to the actuarial accrued liability for benefits.
Required Schedule of Employer and Employee ContributionsThe Regents’ funding policy provides for actuarially determined contributions at rates reasonably expected to maintain the plan on an actuarially sound basis.
The Regents determines the total funding policy based on a thirty-year amortization period for the deficit as of July 1, 2010. Employee contributions by represented employees are subject to collective bargaining agreements. During the year ended June 30, 2010, University and employee contributions were reinstated.
Effective March 2011, The Regents delegated to the President discretion to fully fund the modified ARC for the Plan.
LBNL is required to make employer and employee contributions in conformity with The Regents’ funding policy. In addition, under certain circumstances the University makes contributions to the UCRP on behalf of LANL and LLNL retirees based upon a contractual arrangement with the DOE designed to maintain the 100 percent funded status of the LANL and LLNL segments within the UCRP, and is reimbursed by the DOE.
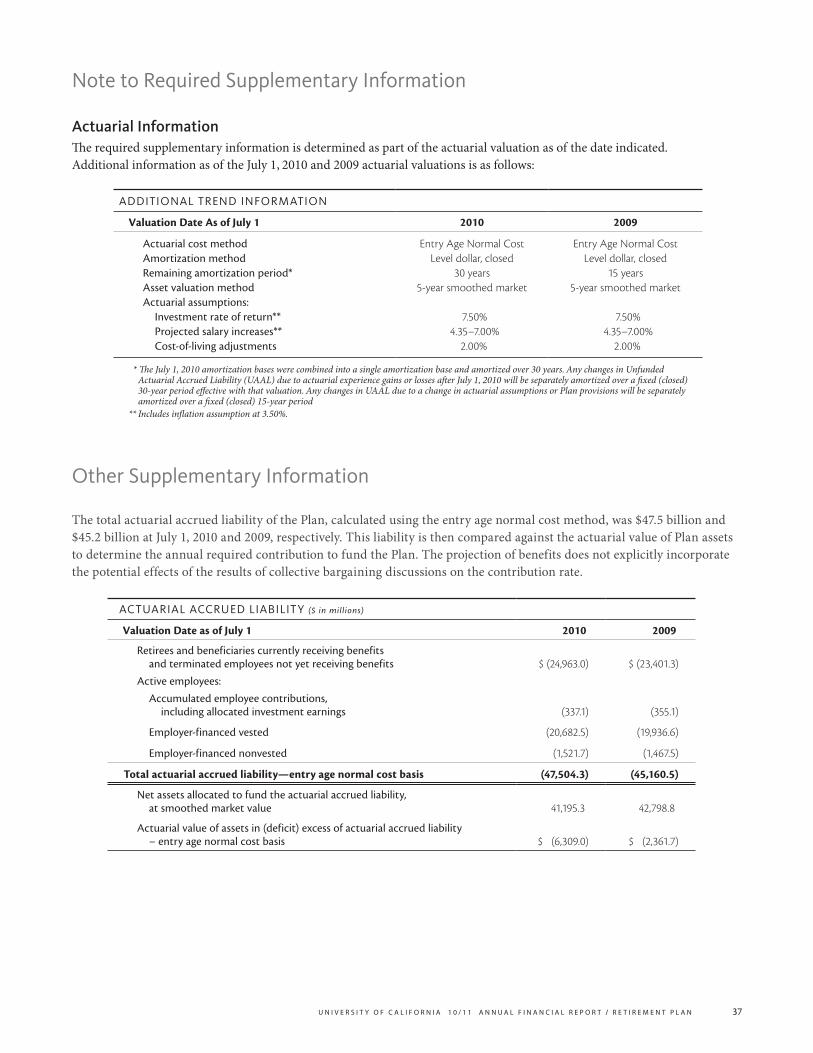
U n i v e r s i t y o f c a l i f o r n i a 1 0 / 1 1 a n n U a l f i n a n c i a l r e p o r t / r e t i r e m e n t p l a n 37
Actuarial InformationThe required supplementary information is determined as part of the actuarial valuation as of the date indicated. Additional information as of the July 1, 2010 and 2009 actuarial valuations is as follows:
aDDitional trenD inforMation
valuation Date As of July 1 2010 2009
Actuarial cost method Entry Age Normal Cost Entry Age Normal CostAmortization method Level dollar, closed Level dollar, closedRemaining amortization period* 30 years 15 yearsAsset valuation method 5-year smoothed market 5-year smoothed marketActuarial assumptions:
Investment rate of return** 7.50% 7.50%Projected salary increases** 4.35–7.00% 4.35–7.00%Cost-of-living adjustments 2.00% 2.00%
* The July 1, 2010 amortization bases were combined into a single amortization base and amortized over 30 years. Any changes in Unfunded Actuarial Accrued Liability (UAAL) due to actuarial experience gains or losses after July 1, 2010 will be separately amortized over a fixed (closed) 30-year period effective with that valuation. Any changes in UAAL due to a change in actuarial assumptions or Plan provisions will be separately amortized over a fixed (closed) 15-year period
** Includes inflation assumption at 3.50%.
note to required supplementary information
other supplementary information
The total actuarial accrued liability of the Plan, calculated using the entry age normal cost method, was $47.5 billion and $45.2 billion at July 1, 2010 and 2009, respectively. This liability is then compared against the actuarial value of Plan assets to determine the annual required contribution to fund the Plan. The projection of benefits does not explicitly incorporate the potential effects of the results of collective bargaining discussions on the contribution rate.
aCtUarial aCCrUeD liability ($ in millions)
valuation Date as of July 1 2010 2009
Retirees and beneficiaries currently receiving benefits and terminated employees not yet receiving benefits $ (24,963.0) $ (23,401.3)
Active employees:
Accumulated employee contributions, including allocated investment earnings (337.1) (355.1)
Employer-financed vested (20,682.5) (19,936.6)
Employer-financed nonvested (1,521.7) (1,467.5)
Total actuarial accrued liability—entry age normal cost basis (47,504.3) (45,160.5)
Net assets allocated to fund the actuarial accrued liability, at smoothed market value 41,195.3 42,798.8
Actuarial value of assets in (deficit) excess of actuarial accrued liability – entry age normal cost basis $ (6,309.0) $ (2,361.7)
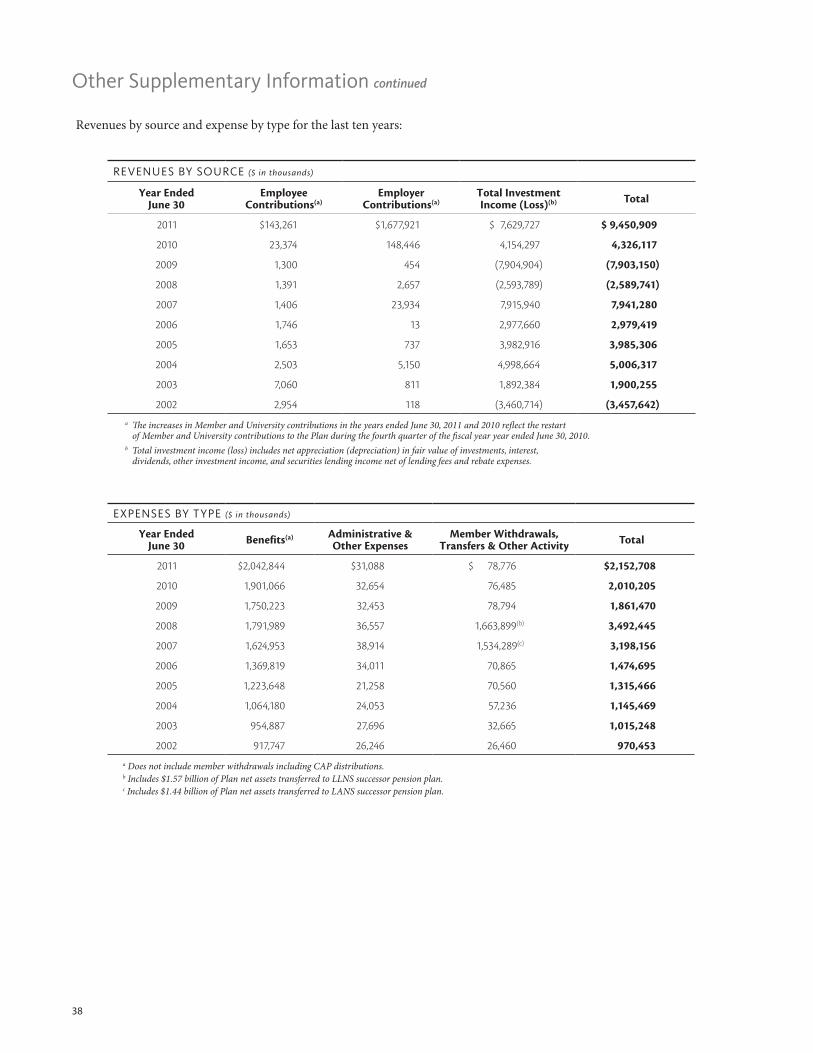
38
other supplementary information continued
revenUes by soUrCe ($ in thousands)
Year ended June 30
employee Contributions(a)
employer Contributions(a)
Total Investment Income (Loss)(b) Total
2011 $143,261 $1,677,921 $ 7,629,727 $ 9,450,909
2010 23,374 148,446 4,154,297 4,326,117
2009 1,300 454 (7,904,904) (7,903,150)
2008 1,391 2,657 (2,593,789) (2,589,741)
2007 1,406 23,934 7,915,940 7,941,280
2006 1,746 13 2,977,660 2,979,419
2005 1,653 737 3,982,916 3,985,306
2004 2,503 5,150 4,998,664 5,006,317
2003 7,060 811 1,892,384 1,900,255
2002 2,954 118 (3,460,714) (3,457,642)a The increases in Member and University contributions in the years ended June 30, 2011 and 2010 reflect the restart
of Member and University contributions to the Plan during the fourth quarter of the fiscal year year ended June 30, 2010.b Total investment income (loss) includes net appreciation (depreciation) in fair value of investments, interest,
dividends, other investment income, and securities lending income net of lending fees and rebate expenses.
exPenses by tyPe ($ in thousands)
Year ended June 30 Benefits(a) Administrative &
Other expensesMember Withdrawals,
Transfers & Other Activity Total
2011 $2,042,844 $31,088 $ 78,776 $2,152,708
2010 1,901,066 32,654 76,485 2,010,205
2009 1,750,223 32,453 78,794 1,861,470
2008 1,791,989 36,557 1,663,899(b) 3,492,445
2007 1,624,953 38,914 1,534,289(c) 3,198,156
2006 1,369,819 34,011 70,865 1,474,695
2005 1,223,648 21,258 70,560 1,315,466
2004 1,064,180 24,053 57,236 1,145,469
2003 954,887 27,696 32,665 1,015,248
2002 917,747 26,246 26,460 970,453a Does not include member withdrawals including CAP distributions.b Includes $1.57 billion of Plan net assets transferred to LLNS successor pension plan.c Includes $1.44 billion of Plan net assets transferred to LANS successor pension plan.
Revenues by source and expense by type for the last ten years:

U n i v e r s i t y o f c a l i f o r n i a 1 0 / 1 1 a n n U a l f i n a n c i a l r e p o r t / r e t i r e m e n t p l a n 39

40 m a n a g e m e n t ’ s d i s c U s s i o n a n d a n a l y s i s
The objective of Management’s Discussion and Analysis is to help readers of the University of California (UC) PERS Voluntary Early Retirement Incentive Program (the PERS Plus 5 Plan or the Plan) financial statements better understand the PERS Plus 5 Plan’s financial position and operating activities for the fiscal year ended June 30, 2011, with selected comparative information for the years ended June 30, 2010 and 2009. This discussion should be read in conjunction with the financial statements and the notes to the financial statements. Unless otherwise indicated, years (2009, 2010, 2011, etc.) in this discussion refer to the fiscal years ended June 30.
Financial Highlights• The net assets of the PERS Plus 5 Plan at June 30, 2011,
are $67.5 million compared to $59.4 million at June 30, 2010 and $56.9 million at June 30, 2009. The net assets are available to meet the Plan’s ongoing obligations to Plan retirees and their beneficiaries.
• The net assets of the PERS Plus 5 Plan increased by $8.1 million, or 13.6 percent in 2011, compared to an increase of $2.5 million in 2010, or 4.4 percent, and a decrease of $19.4 million in 2009, or 25.4 percent.
• The PERS Plus 5 Plan’s total investment rate of return was 22.5 percent in 2011 compared to 12.7 percent in 2010 and (18.8) percent in 2009.
• As of July 1, 2010, the date of the most recent actuarial valuation, the PERS Plus 5 Plan’s funded ratio was 167.3 percent compared to 150.5 percent at July 1, 2009 and 191.9 percent at July 1, 2008. For July 1, 2010, this indicates that for every dollar of actuarial accrued liability, assets of $1.67 are available to cover such obligations compared to $1.51 at July 1, 2009 and $1.92 at July 1, 2008.
Overview of the Financial Statements This discussion and analysis is intended to serve as an introduction to the PERS Plus 5 Plan’s basic financial statements, which are comprised of the following:
• Statements of Fiduciary Net Assets
• Statements of Changes in Fiduciary Net Assets
• Notes to Financial Statements
• Required Supplementary Information and Note to Required Supplementary Information
• Other Supplementary Information
The Statements of Fiduciary Net Assets present informa tion on the PERS Plus 5 Plan’s assets and liabilities and the resulting net assets held in trust for pension benefits. They reflect the plan’s investments at fair value, along with cash and short-term investments, receivables, and other assets and liabilities.
The Statements of Changes in Fiduciary Net Assets present information showing how the PERS Plus 5 Plan’s net assets held in trust for PERS Plus 5 Plan changed during the years ended June 30, 2011 and 2010. They reflect investment income (or losses) during the period from investing and securities lending activities. Deductions for retirement benefits are also presented.
The Notes to Financial Statements provide additional information that is essential to a full understanding of the data provided in the financial statements.
The Required Supplementary Information consists of two schedules and a related note concerning the funded status of the PERS Plus 5 Plan.
The Note to Required Supplementary Information provides additional trend information as of the valuation date. This information includes actuarial cost method, amortization method, remaining amortization period, asset valuation period, and actuarial assumptions.
The Other Supplementary Information consists of a schedule concerning the actuarial accrued liability of the PERS Plus 5 Plan.
Financial AnalysisThe PERS Plus 5 Plan provides retirement benefits to UC-PERS members who elected early retirement under the provisions of the Plan. Plan benefits are funded by employer contributions and by investment income. The Plan’s net assets held in trust for benefits at June 30, 2011, amounted to $67.5 million compared to $59.4 million at June 30, 2010 and $56.9 million at June 30, 2009. Additions to the Plan’s net assets held in trust for benefits include investment income or loss. There were no University contributions during the fiscal years ending 2009-2011. The Plan recognized net investment income of $13.0 million in 2011 compared to net investment income of $7.4 million in 2010 and net investment loss of $14.4 million in 2009, respectively. The net investment income in 2011 and 2010 was due primarily to higher total returns in the equity portfolios. The investments loss in 2009 was due primarily to adverse conditions in the global markets resulting in negative returns across all equity portfolios of the University of California Retirement Plan (UCRP) in a UCRP master trust investment pool.
Retirement benefit payments and other expenses were the only deductions from the PERS Plus 5 Plan’s net assets held in trust for benefits. For 2011, deductions were $4.9 million, compared to $4.9 million in 2010 and $5.0 million in 2009.
university of california pers plus 5 plan
Management’s Discussion & analysis (Unaudited)

U n i v e r s i t y o f c a l i f o r n i a 1 0 / 1 1 a n n U a l f i n a n c i a l r e p o r t / p e r s + 5 p l a n 41
InvestmentsThe assets of the PERS Plus 5 Plan are combined for investment purposes with the assets of the UCRP master trust investment pool but are accounted for separately.
Funded StatusAt July 1, 2010, the PERS Plus 5 Plan’s actuarial value of assets available for benefits was $59.4 million, compared to $56.9 million at July 1, 2009 and $76.3 million at July 1, 2008. The actuarial accrued liability was $35.5 million at July 1, 2010, compared to $37.8 million at July 1, 2009 and $39.8 million at July 1, 2008. The Plan’s total surplus was $23.9 million at July 1, 2010, compared to $19.1 million at July 1, 2009 and $36.6 million at July 1, 2008.
Fiduciary ResponsibilitiesThe Vice President—Human Resources Department, has primary responsibility for the Plan administrative functions and the Chief Investment Officer has primary fiduciary responsibility for implementing plan investment policy. The Regents determines the Plan investment policy and retains broad oversight fiduciary responsibility for investment and administrative functions. Under law, the assets can only be used for the exclusive benefit of plan members, retirees and their beneficiaries and for administrative expenses.
fiDUCiary net assets ($ in thousands)
June 30 2011 2010 2009
Total Assets $77,357 $71,941 $ 70,953
Total Liabilites 9,829 12,517 14,012
Net Assets held in Trust for Pension Benefits $67,528 $59,424 $ 56,941
CHanGes in fiDUCiary net assets ($ in thousands)
Year ended June 30 2011 2010 2009
ADDITIONS (ReDUCTIONS)
Net investment income (loss) $ 13,014 $ 7,363 $ (14,398)
Total Additions (Reductions) 13,014 7,363 (14,398)
DeDUCTIONS
Retirement payments and other expenses 4,910 4,880 4,997
Total Deductions 4,910 4,880 4,997
Increase (Decrease) in Net Assets held in Trust for Pension Benefits 8,104 2,483 (19,395)
NeT ASSeTS heLD IN TRUST FOR PeNSION BeNeFITS
Beginning of Year 59,424 56,941 76,336
end of Year $67,528 $59,424 $ 56,941


U n i v e r s i t y o f c a l i f o r n i a 1 0 / 1 1 a n n U a l f i n a n c i a l r e p o r t / p e r s + 5 p l a n 43
to the regents of the University of California:
in our opinion, the accompanying statements of fiduciary net assets and the related statements of changes in fiduciary net assets
(presented on pages 44 through 56) present fairly, in all material respects, the financial position of the University of California
Pers Plus 5 Plan (the “Plan”) at June 30, 2011 and 2010, and the changes in fiduciary net assets for the years then ended in conformity
with accounting principles generally accepted in the United states of america. these financial statements are the responsibility
of the Plan’s management. our responsibility is to express an opinion on these financial statements based on our audits.
We conducted our audits of these statements in accordance with auditing standards generally accepted in the United states of america.
those standards require that we plan and perform the audit to obtain reasonable assurance about whether the financial statements
are free of material misstatement. an audit includes examining, on a test basis, evidence supporting the amounts and disclosures
in the financial statements, assessing the accounting principles used and significant estimates made by management, and evaluating
the overall financial statement presentation. We believe that our audits provide a reasonable basis for our opinion.
as discussed in note 1, the financial statements of the Plan are intended to present the fiduciary net assets and the changes in fiduciary
net assets of only that portion of activities that are attributable to the Plan. they do not purport to, and do not, present fairly the
financial position of the University of California as of June 30, 2011 and 2010, and the changes in its financial position and cash flows
for the years then ended in conformity with accounting principles generally accepted in the United states of america.
the required supplementary information (“rsi”) on pages 57 and 58 is not a required part of the financial statements but is
supplementary information required by the Governmental accounting standards board. We have applied certain limited procedures,
which consisted principally of inquiries of management regarding the methods of measurement and presentation of the rsi.
However, we did not audit the information and express no opinion on it.
s a n f r a n C i s C o, C a l i f o r n i a
o C t o b e r 1 2 , 2 0 1 1
report of independent auditors

44 2 0 1 0 / 2 0 1 1 s t a t e m e n t s
stateMents of fiDUCiary net assets ($ in thousands)
June 30 2011 2010
ASSeTS
Investments, at fair value $ 68,862 $ 60,821
Investment of cash collateral 8,290 10,985
Other assets - securities sales and investment income 205 135
Total Assets 77,357 71,941
LIABILITIeS
Payable for securities purchased, and member withdrawals 1,539 1,528
Collateral held for securities lending 8,290 10,989
Total Liabilities 9,829 12,517
NeT ASSeTS heLD IN TRUST FOR PeNSION BeNeFITS $67,528 $59,424
See accompanying Notes to Financial Statements.
stateMents of CHanGes in fiDUCiary net assets ($ in thousands)
Years ended June 30 2011 2010
ADDITIONS
Net Investment income $ 13,014 $ 7,363
Total Additions 13,014 7,363
DeDUCTIONS
Retirement payments 4,903 4,873
Administrative expenses 7 7
Total Deductions 4,910 4,880
Increase in Net Assets Held in Trust for Pension Benefits 8,104 2,483
NeT ASSeTS heLD IN TRUST FOR PeNSION BeNeFITS:
Beginning of Year 59,424 56,941
end of Year $67,528 $59,424
See accompanying Notes to Financial Statements.
university of california pers plus 5 plan
financial statements

U n i v e r s i t y o f c a l i f o r n i a 1 0 / 1 1 a n n U a l f i n a n c i a l r e p o r t / p e r s + 5 p l a n 45
NOtE 1 — Description of the Plan and Significant Accounting Policies
General IntroductionSome University employees became members of the California Public Employees’ Retirement Plan (CalPERS) before UCRP was established and continued to participate in CalPERS during their University employment. The University of California contributed to CalPERS on behalf of these UC-CalPERS members. The University of California Voluntary Early Retirement Incentive Program (the PERS Plus 5 Plan or PERS Plan) is a defined benefit pension plan established by the University that provides lifetime supplemental retirement income and survivor benefits to PERS Plan members who elected early retirement under CalPERS.
Generally, to participate in the PERS Plus 5 Plan, an eligible employee was required to elect concurrent retirement under PERS and the PERS Plan effective October 1, 1991, and must have had a combined age plus Service Credit equal to 80 years as of September 30, 1991, if classified as a Qualified Academic Senate Faculty Member, or equal to 75 years if not classified as a Qualified Academic Senate Faculty Member. Of 1,579 eligible employees, 879 elected to retire under the PERS Plan.
The cost of contributions made to the PERS Plus 5 Plan was borne entirely by the University. Over the five-year period ended June 30, 1996, the University was required to make contributions to the Plan as determined by the plan actuary sufficient to maintain funding for the promised benefits. No additional contributions are required as long as the Plan remains fully funded under the actuarial basis used by the Plan.
Effective April 1, 2011, the PERS Plus 5 Plan was amended to provide a 15.2 percent ad hoc cost-of-living adjustment (COLA) to all monthly benefits. Effective July 1, 2011, the PERS Plus 5 Plan will be amended, subject to funding availability, to provided annual COLAs to monthly benefits according to a specified formula based on the Consumer Price Index (CPI). Ad hoc COLAs may also be granted subject to funding availability.
Basis of AccountingThe financial statements have been prepared in accordance with accounting principles generally accepted in the United States of America, including all applicable effective statements of the Governmental Accounting Standards Board (GASB), and on the accrual basis of accounting.
GASB Statement No. 59, Financial Instruments Omnibus, was adopted by the Plan during the year ended June 30, 2011. This Statement updates existing standards regarding financial reporting and disclosure requirements of certain financial instruments and external investment pools. Implementation of Statement No. 59 had no effect on the Plan’s net assets or changes in net assets for the years ended June 30, 2011 and 2010.
GASB Statement No. 62, Codification of Accounting and Financial Reporting Guidance Contained in Pre-November 30, 1989 FASB and AICPA Pronouncements, was adopted by the Plan during the year ended June 30, 2011. This Statement incorporates into GASB’s authoritative literature certain accounting and financial reporting guidance that is included in Financial Accounting Standards Board Statements and Interpretations, Accounting Principles Board Opinions and Accounting Research Bulletins of the American Institute of Certified Public Accountants’ Committee on Accounting Procedures that were issued on or before November 30, 1989. Implementation of Statement No. 62 had no effect on the Plan’s net assets or changes in net assets for the years ended June 30, 2011 and 2010.
Valuation of InvestmentsInvestments are recorded at fair value. Securities, including derivative investments, are valued at the last sale price on the last business day of the fiscal year, as quoted on a recognized exchange or an industry standard pricing service, when available. Securities for which no sale was reported as of the close of the last business day of the fiscal year are valued at the quoted bid price of a dealer who regularly trades in the security being valued. Certain securities may be valued on a basis of a price provided by a single source.
As a result of inactive or illiquid markets, certain investments in non-agency mortgage-backed fixed income securities are valued on the basis of their estimated future principal and interest payments using appropriate risk-adjusted discount rates.
Investments include private equities, absolute return funds and real estate. Private equities include venture capital partnerships, buyout and international funds. Interests in private equity and real estate partnerships are based upon valuations provided by the general partners of the respective partnerships as of March 31, adjusted for cash receipts, cash disbursements and securities distributions through June 30. Investments in absolute return partnerships are valued as of May 31, adjusted for cash receipts and cash disbursements through June 30. Interests in certain direct investments in
university of california pers plus 5 plan
notes to financial statements YE AR S END ED June 30 , 2011 and 2010

46 n o t e s t o f i n a n c i a l s t a t e m e n t s
real estate are estimated based upon independent appraisals. The Plan believes the carrying amount of these financial instruments and real estate is a reasonable estimate of fair value at June 30. Because the private equity, real estate and absolute return partnerships, along with direct investments in real estate, are not readily marketable, their estimated value is subject to uncertainty and, therefore, may differ significantly from the value that would be used had a ready market for such investments existed. Investments in registered investment companies are valued based upon the reported net asset value of those companies.
Derivative instruments are recorded at fair value. Futures contracts, foreign currency exchange contracts, forward contracts, stock rights and warrants are valued at the last sales price on the last day of the fiscal year, as quoted on a recognized exchange or an industry standard pricing service.
Accounting for InvestmentsInvestment transactions are recorded on the date the securities are purchased or sold (trade date). Realized gains or losses are recorded as the difference between the proceeds from the sale and the average cost of the investment sold.Dividend income is recorded on the ex-dividend date and interest income is accrued as earned.
Investments denominated in foreign currencies are translated into U.S. dollar equivalents using year-end spot foreign currency exchange rates. Purchases and sales of investments and their related income are translated at the rate of exchange on the respective transaction dates. Realized and unrealized gains and losses resulting from foreign currency changes are included in the Plan’s statement of changes in fiduciary net assets.
Administrative ExpensesReasonable administrative expenses are assessed to the PERS Plus 5 Plan through an annual account servicing charge.
Income Tax StatusThe form of the PERS Plus 5 Plan is intended to satisfy the qualification requirement under IRC §401(a) and the regulations thereunder, and the Plan’s trust is intended to be exempt from taxation under IRC §501(a). Tax counsel for the Plan is not aware of any circumstances that indicate a material failure to comply with such requirements. To the best of tax counsel’s knowledge, the Plan has been administered in accordance with its terms and the applicable provisions of the IRC and the regulations thereunder, in all material respects.
Use of Estimates in the Preparation of Financial StatementsThe preparation of financial statements in conformity with generally accepted accounting principles requires management to make estimates and assumptions that affect the reported amounts of net assets held in trust for pension benefits at the date of the financial statements and the reported amounts of changes in net assets held in trust for pension benefits during the reporting period. Actual results could differ from those estimates.
The financial statements of the PERS Plus 5 Plan are intended to present the fiduciary net assets and the changes in fiduciary net assets of only that portion of activities that are attributable to the Plan. They do not purport to, and do not, present fairly the financial position of the University of California as of June 30, 2011 and 2010.
ReclassificationsIn connection with the preparation of the June 30, 2011 financial statements, $1.1 million of forward contracts on a to-be-announced basis held by the Plan were reclassified from derivatives to fixed or variable income securities. The effect on the prior period financial statements is not material. However, management elected to make the revisions in classification to the Plan’s 2010 presentation. This revision had no effect on Fiduciary net assets or changes in Fiduciary net assets.
NOtE 2 — InvestmentsThe Regents, as the governing board and as trustee, is responsible for the oversight of the Plan’s investments and establishes investment policy, which is carried out by the Chief Investment Officer. The Chief Investment Officer has primary fiduciary responsibility for investing the Plan’s assets consistent with the policies established by The Regents. The Regents establishes investment policies for the Plan and has fiduciary responsibility for overseeing the implementation of those policies.
Participation in the Short Term Investment Pool (STIP) maximizes the returns on short-term cash balances by taking advantage of the economies of scale of investing in a large pool with a broad range of maturities. STIP is managed to maximize current earned income. The available cash in the Plan awaiting investment or for administrative expenses is also invested in STIP. Investments authorized by The Regents for STIP include fixed income securities with a maximum maturity of five and one-half years.

U n i v e r s i t y o f c a l i f o r n i a 1 0 / 1 1 a n n U a l f i n a n c i a l r e p o r t / p e r s + 5 p l a n 47
Investments authorized by The Regents for the Plan’s investment pools and separate investments include equity securities, fixed-income securities and certain other asset classes. The equity portion of the investment portfolios may include both domestic and foreign common and preferred stocks, and actively managed and passive (index) strategies, along with a modest exposure to private equities. Private equities include venture capital partnerships, buyouts and international funds. The Plan’s investment portfolios may include certain foreign currency–denominated equity securities.
The fixed income portion of the investment portfolios may include both domestic and foreign securities, along with certain securitized investments, including mortgage-backed and asset-backed securities. Fixed income investment guidelines permit the use of futures and options on fixed income instruments in the ongoing management of the portfolios. Derivative contracts are authorized for portfolio rebalancing in accordance with The Regents’ asset allocation policy and as substitutes for physical securities. Real estate investments and absolute return strategies are authorized for the Plan. Absolute return strategies may incorporate short sales, plus derivative positions to implement or hedge an investment position. They are not used for speculative purposes.
Investment Risk FactorsThere are many factors that can affect the value of investments. Some, such as custodial credit risk, concentration of credit risk, and foreign currency risk may affect both equity and fixed income securities. Equity securities respond to such factors as economic conditions, individual company earnings performance, and market liquidity, while fixed income securities are particularly sensitive to credit risks and changes in interest rates. Alternative investment strategies and their underlying assets and rights are also subject to an array of economic and market vagaries that can limit or erode value.
Credit RiskFixed income securities are subject to credit risk, which is the chance that a bond issuer will fail to pay interest or principal in a timely manner, or that negative perceptions of the issuer’s ability to make these payments will cause security prices to decline. These circumstances may arise due to a variety of factors such as financial weakness, bankruptcy, litigation and/or adverse political developments.
A bond’s credit quality is an assessment of the issuer’s ability to pay interest on the bond, and ultimately to pay
the principal. Credit quality is evaluated by one of the independent bond-rating agencies, for example, Moody’s Investors Service (Moody’s) or Standard and Poor’s (S&P). The lower the rating, the greater the chance, in the rating agency’s opinion, that the bond issuer will default, or fail to meet its payment obligations. Generally, the lower a bond’s credit rating, the higher its yield should be to compensate for the additional risk.
Certain fixed income securities, including obligations of the U.S. government or those explicitly guaranteed by the U.S. government, are not considered to have credit risk. On August 8, 2011, the S&P downgraded the credit ratings of certain long-term debt instruments issued by Fannie Mae and Freddie Mac and other U.S. government agencies linked to long-term U.S. debt. These downgrades could adversely affect the market value of such instruments and the credit risk associated with our investments in U.S. Treasury securities held as investments by the Plan.
Asset backed securities are debt obligations that represent claims to the cash flows from pools of commercial, mortgage, credit card or student loans. Mortgage backed securities issued by Ginnie Mae are backed by the full faith and credit of the U.S. government. Effective September 2008, Fannie Mae and Freddie Mac were placed under the conservatorship of the Federal Housing Finance Agency. At the same time, the U.S. Treasury put in place a set of financing agreements to ensure Fannie Mae and Freddie Mac have the ability to fulfill their obligations to holders of bonds that they have issued or guaranteed.
The investment guidelines for STIP recognize that a limited amount of credit risk, properly managed and monitored, is prudent and provides incremental risk-adjusted return over its benchmark. (The benchmark for STIP, the 2-year Treasury Note, does not contain credit risk.) No more than 5 percent of the total market value of the STIP portfolio may be invested in securities rated below investment grade (BB, Ba or lower). The average credit quality of STIP must be A or better, and commercial paper must be rated at least A-1, F-1, or P-1.
Credit risk is appropriate in a balanced investment pool such as the Plan, by virtue of the benchmarks chosen for the fixed income portion of the pool. The fixed income benchmark Barclays Capital U.S. Aggregate Bond Index, is comprised of approximately 25 percent corporate bonds and 35 percent mortgage/asset-backed securities, all of which carry some degree of credit risk. The remaining 40 percent are government-issued bonds. Credit risk in the Plan is managed primarily by diversifying across issuers, and portfolio

48 n o t e s t o f i n a n c i a l s t a t e m e n t s
guidelines mandate that no more than 10 percent of the market value of fixed income securities may be invested in issues with credit rating below investment grade. Further, the weighted average credit rating must be A or higher.
In addition, the investment policy for the Plan allows for dedicated allocations to non-investment grade and emerging market bonds, investment in which entails credit, default and/or sovereign risk.
The credit risk profile for fixed or variable income securities at June 30, 2011 and 2010 is as follows:
fixeD or variable inCoMe seCUrities ($ in thousands)
2011 2010
U.S. government guaranteed $6,276 $5,413 Other U.S. dollar denominated:
AAA 3,457 4,867 AA 242 336 A 1,159 937 BBB 1,515 1,730 BB 701 940 B 1,606 1,467 CCC or lower 417 570 A-1/P-1/F-1 1 17 Not rated 3 3
Foreign currency denominated:BBB 144 – B 25 32
Commingled funds:U.S. bond funds: Not rated 775 8 Money market funds: Not rated 2,390 1,427
Custodial Credit Risk
Custodial credit risk is the risk that in the event of the failure of the custodian, the investments may not be returned. The PERS Plus 5 Plan’s securities are registered in the Plan’s name by the custodial bank as an agent for the Plan. Other types of investments represent ownership interests that do not exist in physical or book-entry form. As a result, custodial credit risk for such investments is remote.
Concentration of Credit RiskConcentration of credit risk is the risk associated with a lack of diversification, such as having substantial investments in a few individual issuers, thereby exposing the Plan to greater risks resulting from adverse economic, political, regulatory, geographic or credit developments.
The U.S. and non-U.S. equity portions of the PERS Plus 5 Plan investment fund may be managed either passively or actively. For the portion managed passively, the concentration of individual securities is exactly equal to their concentration
in the benchmark. While some securities have a larger representation in the benchmark than others, the Plan considers that passive management results in an absence of concentration of credit risk. For the portion managed actively, asset class guidelines do not specifically address concentration risk, but do state that the U.S. equity asset class in the aggregate will be appropriately diversified to control overall risk and will exhibit portfolio characteristics similar to the asset class benchmark (including concentration of credit risk). Concentration risk for individual portfolios is monitored relative to their individual benchmarks and agreed-upon risk parameters in their guidelines.
Investment guidelines addressing concentration of credit risk related to the investment-grade fixed income portion of the PERS Plus 5 Plan portfolio include a limit of no more than three percent of the portfolio’s market value to be invested in any single issuer (except for securities issued by the U.S. government or its agencies). These same guidelines apply to STIP. For high-yield and emerging market debt, the corresponding limit is five percent.
Interest Rate RiskInterest rate risk is the risk that the value of fixed and variable income securities will decline because of changing interest rates. The prices of fixed income securities with a longer time to maturity, measured by effective duration, tend to be more sensitive to changes in interest rates and, therefore, more volatile than those with shorter durations. Effective duration is the approximate change in price of a security resulting from a 100 basis point (1 percentage point) change in the level of interest rates. It is not a measure of time.
Interest rate risk for the STIP is managed by constraining the maturity of all individual securities to be less than 5½ years. There is no restriction on weighted average maturity of the portfolio as it is managed relative to the maturity structure of the liabilities, that is, the liquidity demands of the investors.
Portfolio guidelines for the fixed income portion of the PERS Plus 5 Plan limit weighted average effective duration to the effective duration of the benchmarks (Citigroup Large Pension Fund Index and Barclays Capital U.S. Aggregate Bond Index), plus or minus 20 percent. These portfolio guidelines constrain the potential price movement due to interest rate changes of the portfolio to be similar to that of the benchmark. There are similar restrictions for the high-yield and emerging market debt portfolios relative to their benchmarks.

U n i v e r s i t y o f c a l i f o r n i a 1 0 / 1 1 a n n U a l f i n a n c i a l r e p o r t / p e r s + 5 p l a n 49
CoMPosition of investMents ($ in thousands)
2011 2010
eqUITY SeCURITIeS:
Domestic $16,722 $ 16,218
Foreign 13,766 11,747
equity Securities 30,488 27,965
FIxeD OR vARIABLe INCOMe SeCURITIeS:
U.S. government guaranteed:
U.S. Treasury bills, notes and bonds 889 537
U.S. Treasury strips 442 94
U.S. TIPS 4,921 4,753
U.S. government backed securities 24 28
Fixed or variable Income Securities 6,276 5,412
OTheR U.S. DOLLAR DeNOMINATeD:
Corporate bonds 2,830 3,645
U.S. agencies 1,062 1,033
U.S. agencies—asset-backed securities 1,952 1,715
Corporate—asset-backed securities 1,296 2,155
Supranational/foreign 1,946 2,304
Other 15 16
Other U.S. Dollar Denominated 9,101 10,868
FOReIgN CURReNCY DeNOMINATeD:
Corporate 169 32
Foreign Currency Denominated 169 32
COMMINgLeD FUNDS:
Absolute return funds 4,603 4,040
U.S. equity funds 1,860 1,733
Non-U.S. equity funds 4,744 3,377
U.S. bond funds 775 8
Money market funds* 2,390 1,427
Commingled Funds* 14,372 10,585
PRIvATe eqUITY 4,675 4,056
ReAL ASSeTS 532 278
ReAL eSTATe 3,224 1,638
INveSTMeNT DeRIvATIveS 25 (13)
Total Investments $68,862 $60,821
*Includes investment of $397 and $291 in the Short Term Investment Pool as of June 30, 2011 and 2010, respectively.
The composition of investments and derivative instruments, by investment type, at June 30, 2011 and 2010 is as follows:

50 n o t e s t o f i n a n c i a l s t a t e m e n t s
The effective durations for fixed and variable income securities at June 30, 2011 and 2010 are as follows:
fixeD or variable inCoMe seCUrities
2011 2010
U.S. government guaranteed: U.S. Treasury bills, notes and bonds 1.5 2.1
U.S. Treasury strips 6.9 19.1
U.S. TIPS 4.5 3.8
U.S. government-backed securities 5.5 5.8
Other U.S dollar denominated:Corporate bonds 5.3 4.9
U.S. agencies 5.7 6.6
U.S. agencies—asset-backed securities 5.1 2.7
Corporate—asset-backed securities 3.5 3.4
Supranational/foreign 6.3 6.0
Other 13.1 14.3
Foreign currency denominated:Corporate 4.1 4.2
Commingled funds:STIP, other money market funds 1.5 1.6
U.S. bond funds 5.2 – The money market funds consist of underlying securities that are of a short-term, liquid nature.
Investments may also include various mortgage-backed securities, collateralized mortgage obligations, structured notes, variable rate securities, callable bonds and convertible bonds that may be considered to be highly sensitive to changes in interest rates due to the existence of prepayment or conversion features. Although the effective durations of the securities may be low, they are considered to be highly sensitive to changes in interest rates.
At June 30, 2011 and 2010, the fair values of such investments are as follows:
($ in thousands)
2011 2010
Mortgage-backed securities $ 2,191 $ 3,025
Collateralized mortgage obligations 138 263
Variable rate securities 608 20
Callable bonds 1,607 1,317
Convertible bonds 12 8
Other asset-backed securities 341 582
Total $4,897 $5,215
Mortgage-Backed SecuritiesThese securities are issued by Fannie Mae, Ginnie Mae and Freddie Mac and include short embedded prepayment options. Unanticipated prepayments by the obligees of the underlying asset reduce the total expected rate of return.
Collateralized Mortgage ObligationsCollateralized mortgage obligations (CMOs) generate a return based upon the payment of either interest or principal on mortgages in an underlying pool. The relationship between interest rates and prepayments make the fair value highly sensitive to changes in interest rates. In falling interest rate environments, the underlying mortgages are subject to a higher propensity of prepayments. In a rising interest rate environment, the opposite is true.
Other Asset-Backed SecuritiesOther asset-backed securities also generate a return based upon the payment of either interest or principal on obligations in an underlying pool, generally associated with auto loans or credit cards. As with CMOs, the relationship between interest rates and prepayments make the fair value highly sensitive to changes in interest rates.
Variable Rate SecuritiesThese securities are investments with terms that provide for the adjustment of their interest rates on set dates and are expected to have fair values that will be relatively unaffected by interest rate changes. Variable rate securities may have limits on how high or low the interest rate may change. These constraints may affect the market value of the security.
Callable BondsAlthough bonds are issued with clearly defined maturities, an issuer may be able to redeem, or call, a bond earlier than its maturity date. The Plan’s trustee must then replace the called bond with a bond that may have a lower yield than the original. The call feature causes the fair value to be highly sensitive to changes in interest rates.

U n i v e r s i t y o f c a l i f o r n i a 1 0 / 1 1 a n n U a l f i n a n c i a l r e p o r t / p e r s + 5 p l a n 51
At June 30, 2011 and 2010, the effective durations for these securities are as follows:
2011 2010
Mortgage-backed securities 4.9 3.9
Collateralized mortgage obligations 2.9 2.2
Variable rate securities 4.8 2.4
Callable bonds 4.6 4.2
Other asset-backed securities 1.3 0.9
Convertible bonds 9.0 4.4
Foreign Currency RiskThe Plan trustee’s strategic asset allocation policy includes allocations to non-U.S. equities and non-dollar denominated bonds. The benchmarks for these investments are not hedged; therefore, foreign currency risk is an essential part of the investment strategies. Portfolio guidelines for U.S. investment-grade fixed income securities also allow exposure to non-U.S. dollar denominated bonds up to 10 percent of the total portfolio market value. Exposure to foreign currency risk from these securities is permitted and it may be fully or partially hedged using forward foreign currency exchange contracts. Under The Regents’ investment policies, such instruments are not permitted for speculative use or to create leverage. Similar limits on foreign exchange exposure apply to the high-yield debt and emerging market debt portfolios (10 percent and 20 percent, respectively).
At June 30, 2011 and 2010, the U.S. dollar denominated balances organized by currency denominations and investment type are as follows:
($ in thousands)
2011 2010
equity securities:Euro $ 3,981 $ 3,259 British Pound 2,543 2,155 Japanese Yen 2,509 2,429 Canadian Dollar 1,236 1,048 Swiss Franc 1,047 911 Australian Dollar 1,002 772 Hong Kong Dollar 392 332 Swedish Krona 391 274 Singapore Dollar 224 199 Danish Krone 128 112 Norwegian Krone 118 71 Israeli Shekel 68 69 Other 127 116
Subtotal 13,766 11,747 Fixed income securities:
Brazilian Real 27 – Euro 21 –Mexican Peso 20 –Malaysian Ringgit 22 31 South African Rand 20 – Indonesian Rupiah 19 – Polish Zloty 14 –Turkish Lira 11 –Thailand Baht 9 – Other 6 1
Subtotal 169 32
Commingled funds — Non-U.S. equity funds: 4,744 3,377 Investment derivatives:
Euro 1 1 Japanese Yen 1 1 British Pound 1 (1)Canadian Dollar – – Australian Dollar (1) – Swedish Krona (2) –Other – 1
Subtotal – 2 Private equity:
Euro 93 22 Swedish Krona 15 5
Real estate:Hong Kong Dollar 49 15 Australian Dollar 38 – Japanese Yen 32 11 Euro 29 – British Pound 20 – Singapore Dollar 19 – Canadian Dollar 14 – Other 15 34
Subtotal 324 87
Total exposure to foreign currency risk $19,003 $15,245

52 n o t e s t o f i n a n c i a l s t a t e m e n t s
Liquidity RisksAlternative investments are subject to liquidity risk. Alternative investments are defined as marketable alternatives (hedge funds), limited partnerships, private equity, venture capital funds and certain asset-backed securities.
Alternative investments include ownership interests in a wide variety of vehicles including partnerships and corporations that may be domiciled in the United States or off-shore. Generally, there is little or no regulation of these investment vehicles by the Securities and Exchange Commission or the applicable state agencies. Managers of these investments employ a wide variety of strategies and have areas of concentration including absolute return, venture capital or early stage investing, private equity or later stage investing and the underlying investments may be leveraged to enhance the total investment return. Each asset class has guidelines and policies regarding the use of leverage. Such underlying investments may include financial assets such as marketable securities, non-marketable securities, derivatives and other synthetic and structured investments as well as tangible and intangible assets.
These securities do not have a ready market and ownership interests in these investment vehicles may not be traded without the approval of the general partner or fund management. These investments are subject to the risks generally associated with equities and fixed income instruments with additional risks due to leverage and the lack of a ready market for acquisition or disposition of ownership interests.
The Plan’s portfolio includes the following alternative investments as of June 2011 and 2010:
($ in thousands)
2011 2010Absolute return funds $ 4,603 $ 4,040 Private equity 4,675 4,056 Real estate 3,224 1,638 Real assets 532 278 Corporate–asset-backed securities 338 1,327
Total $13,372 $11,339
The Plan has also made commitments to make investments in certain investment partnerships pursuant to provisions in the various partnership agreements. These commitments at June 30, 2011 totaled $4.3 million.
Note 3—Securities LendingThe PERS Plus 5 Plan participates in a securities lending program through the UCRP investment portfolio as a means to augment income. Securities are lent to selected brokerage firms for which collateral received equals or exceeds the fair value of such investments during the period of the loan. Securities loans immediately terminate upon notice by either the Plan or the borrower. Collateral may be cash or securities issued by the U.S. government or its agencies, or the sovereign or provincial debt of foreign countries. Collateral securities cannot be pledged or sold by the Plan unless the borrower defaults.
Loans of domestic equities and all fixed income securities are initially collateralized at 102 percent of the fair value of securities lent.
Loans of foreign equities are initially collateralized at 105 percent. All borrowers are required to provide additional collateral by the next business day if the value of the collateral falls to less than 100 percent of the fair value of securities lent.
Cash collateral received from the borrower is invested by lending agents, as agents for the Plan, in investment pools in the name of the Plan, with guidelines approved by the Plan. At June 30, 2011 and 2010, the securities in these pools had a weighted average maturity of 17 and 32 days, respectively. The Plan records a liability for the return of the cash collateral shown as collateral held for securities lending in the statement of fiduciary net assets. Securities collateral received from the borrower is held in an investment pool by the Plan’s custodial bank. At June 30, 2011, the Plan had no exposure to borrowers because the amounts the Plan owed the borrowers exceeded the amounts the borrowers owed the Plan. The Plan is fully indemnified by its lending agents against any losses incurred as a result of borrower default.
The Plan earns interest and dividends on the collateral held during the loan period, as well as a fee from the brokerage firm, and is obligated to pay a fee and rebate to the borrower. The Plan receives the net investment income. The securities
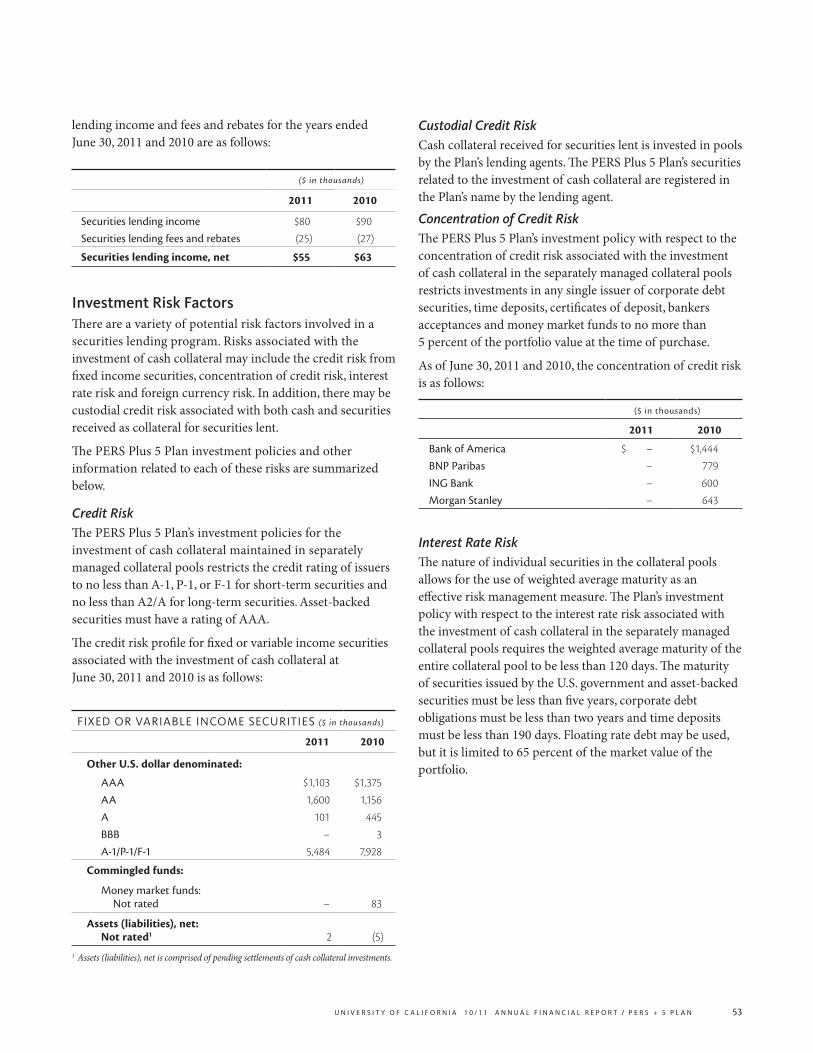
U n i v e r s i t y o f c a l i f o r n i a 1 0 / 1 1 a n n U a l f i n a n c i a l r e p o r t / p e r s + 5 p l a n 53
lending income and fees and rebates for the years ended June 30, 2011 and 2010 are as follows:
($ in thousands)
2011 2010
Securities lending income $80 $90
Securities lending fees and rebates (25) (27)
Securities lending income, net $55 $63
Investment Risk FactorsThere are a variety of potential risk factors involved in a securities lending program. Risks associated with the investment of cash collateral may include the credit risk from fixed income securities, concentration of credit risk, interest rate risk and foreign currency risk. In addition, there may be custodial credit risk associated with both cash and securities received as collateral for securities lent.
The PERS Plus 5 Plan investment policies and other information related to each of these risks are summarized below.
Credit RiskThe PERS Plus 5 Plan’s investment policies for the investment of cash collateral maintained in separately managed collateral pools restricts the credit rating of issuers to no less than A-1, P-1, or F-1 for short-term securities and no less than A2/A for long-term securities. Asset-backed securities must have a rating of AAA.
The credit risk profile for fixed or variable income securities associated with the investment of cash collateral at June 30, 2011 and 2010 is as follows:
fixeD or variable inCoMe seCUrities ($ in thousands)
2011 2010
Other U.S. dollar denominated:
AAA $1,103 $1,375
AA 1,600 1,156
A 101 445
BBB – 3
A-1/P-1/F-1 5,484 7,928
Commingled funds:
Money market funds: Not rated – 83
Assets (liabilities), net: Not rated1 2 (5)
1 Assets (liabilities), net is comprised of pending settlements of cash collateral investments.
Custodial Credit RiskCash collateral received for securities lent is invested in pools by the Plan’s lending agents. The PERS Plus 5 Plan’s securities related to the investment of cash collateral are registered in the Plan’s name by the lending agent.
Concentration of Credit RiskThe PERS Plus 5 Plan’s investment policy with respect to the concentration of credit risk associated with the investment of cash collateral in the separately managed collateral pools restricts investments in any single issuer of corporate debt securities, time deposits, certificates of deposit, bankers acceptances and money market funds to no more than 5 percent of the portfolio value at the time of purchase.
As of June 30, 2011 and 2010, the concentration of credit risk is as follows:
($ in thousands)
2011 2010
Bank of America $ – $1,444
BNP Paribas – 779
ING Bank – 600
Morgan Stanley – 643
Interest Rate RiskThe nature of individual securities in the collateral pools allows for the use of weighted average maturity as an effective risk management measure. The Plan’s investment policy with respect to the interest rate risk associated with the investment of cash collateral in the separately managed collateral pools requires the weighted average maturity of the entire collateral pool to be less than 120 days. The maturity of securities issued by the U.S. government and asset-backed securities must be less than five years, corporate debt obligations must be less than two years and time deposits must be less than 190 days. Floating rate debt may be used, but it is limited to 65 percent of the market value of the portfolio.

54 n o t e s t o f i n a n c i a l s t a t e m e n t s
($ in thousands)
2011 2010
seCUrities lent
For cash collateral:
Equity securities:
Domestic $ 2,813 $ 3,350
Foreign 1,170 1,206
Fixed income securities:
U.S. government guaranteed 3,101 4,528
Other U.S. dollar denominated 1,034 1,579
Lent for Cash Collateral 8,118 10,663
For securities collateral:
Equity securities:
Domestic 253 339
Foreign 2,111 924
Fixed income securities:
U.S. government 1,764 306
Other U.S. dollar denominated 361 634
Foreign currency denominated 6 6
Lent for Securities Collateral 4,494 2,209
Total Securities Lent $12,612 $12,872
Collateral reCeiveD
Cash $ 8,290 $ 10,989
Securities 4,664 2,286
Total Collateral Received $12,954 $13,275
investMent of CasH Collateral
Fixed or variable income securities:
Other U.S. dollar denominated:
Corporate bonds $ 752 $ 637
Commercial paper 294 701
Repurchase agreements 4,448 3,370
Corporate asset-backed securities 482 886
Certificates of deposit/time deposits 742 3,695
Supranational/foreign 1,151 1,189
U.S. agencies 420 429
Commingled funds: Money market funds: Not rated – 83
Assets (liabilities), net* 2 (5)
Total Investment of Cash Collateral $8,290 $10,985
* Assets (liabilities), net is comprised of pending settlements of cash collateral investments.
Securities lending transactions at June 30, 2011 and 2010 are as follows:
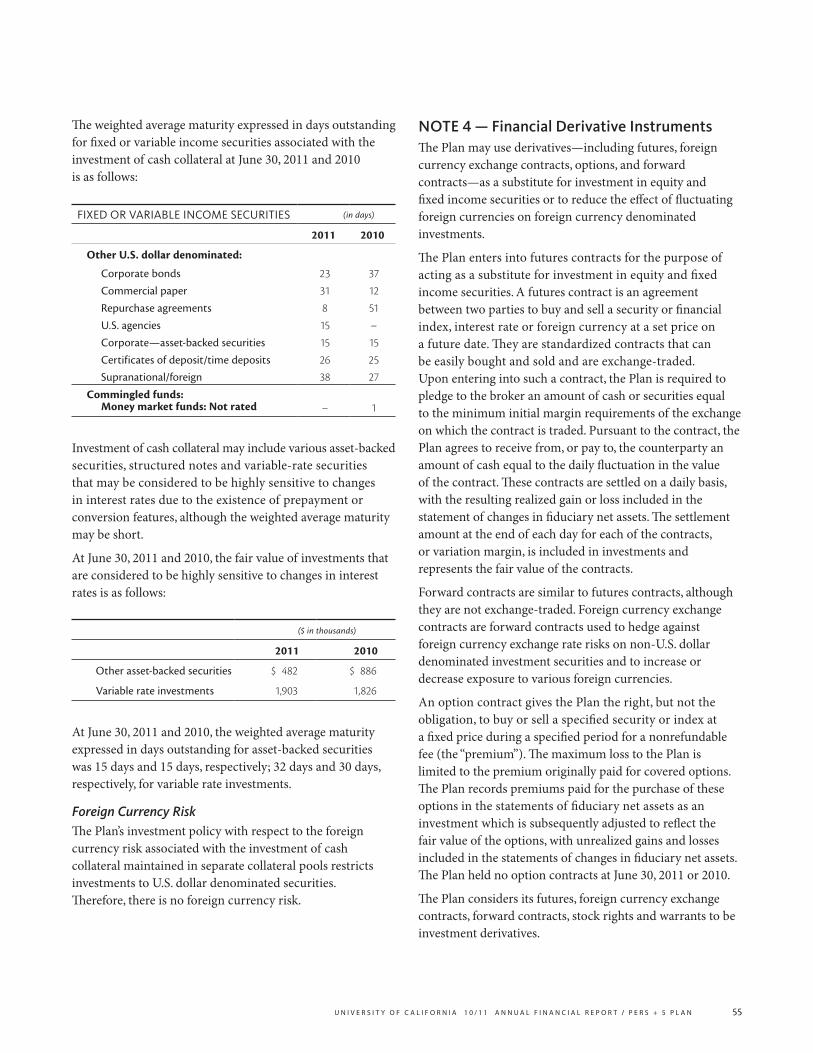
U n i v e r s i t y o f c a l i f o r n i a 1 0 / 1 1 a n n U a l f i n a n c i a l r e p o r t / p e r s + 5 p l a n 55
The weighted average maturity expressed in days outstanding for fixed or variable income securities associated with the investment of cash collateral at June 30, 2011 and 2010 is as follows: fixeD or variable inCoMe seCUrities (in days)
2011 2010
Other U.S. dollar denominated:
Corporate bonds 23 37
Commercial paper 31 12
Repurchase agreements 8 51
U.S. agencies 15 –
Corporate—asset-backed securities 15 15
Certificates of deposit/time deposits 26 25
Supranational/foreign 38 27
Commingled funds: Money market funds: Not rated –
1
Investment of cash collateral may include various asset-backed securities, structured notes and variable-rate securities that may be considered to be highly sensitive to changes in interest rates due to the existence of prepayment or conversion features, although the weighted average maturity may be short.
At June 30, 2011 and 2010, the fair value of investments that are considered to be highly sensitive to changes in interest rates is as follows:
($ in thousands)
2011 2010
Other asset-backed securities $ 482 $ 886
Variable rate investments 1,903 1,826
At June 30, 2011 and 2010, the weighted average maturity expressed in days outstanding for asset-backed securities was 15 days and 15 days, respectively; 32 days and 30 days, respectively, for variable rate investments.
Foreign Currency RiskThe Plan’s investment policy with respect to the foreign currency risk associated with the investment of cash collateral maintained in separate collateral pools restricts investments to U.S. dollar denominated securities. Therefore, there is no foreign currency risk.
NOtE 4 — Financial Derivative InstrumentsThe Plan may use derivatives—including futures, foreign currency exchange contracts, options, and forward contracts—as a substitute for investment in equity and fixed income securities or to reduce the effect of fluctuating foreign currencies on foreign currency denominated investments.
The Plan enters into futures contracts for the purpose of acting as a substitute for investment in equity and fixed income securities. A futures contract is an agreement between two parties to buy and sell a security or financial index, interest rate or foreign currency at a set price on a future date. They are standardized contracts that can be easily bought and sold and are exchange-traded. Upon entering into such a contract, the Plan is required to pledge to the broker an amount of cash or securities equal to the minimum initial margin requirements of the exchange on which the contract is traded. Pursuant to the contract, the Plan agrees to receive from, or pay to, the counterparty an amount of cash equal to the daily fluctuation in the value of the contract. These contracts are settled on a daily basis, with the resulting realized gain or loss included in the statement of changes in fiduciary net assets. The settlement amount at the end of each day for each of the contracts, or variation margin, is included in investments and represents the fair value of the contracts.
Forward contracts are similar to futures contracts, although they are not exchange-traded. Foreign currency exchange contracts are forward contracts used to hedge against foreign currency exchange rate risks on non-U.S. dollar denominated investment securities and to increase or decrease exposure to various foreign currencies.
An option contract gives the Plan the right, but not the obligation, to buy or sell a specified security or index at a fixed price during a specified period for a nonrefundable fee (the ‘‘premium’’). The maximum loss to the Plan is limited to the premium originally paid for covered options. The Plan records premiums paid for the purchase of these options in the statements of fiduciary net assets as an investment which is subsequently adjusted to reflect the fair value of the options, with unrealized gains and losses included in the statements of changes in fiduciary net assets. The Plan held no option contracts at June 30, 2011 or 2010.
The Plan considers its futures, foreign currency exchange contracts, forward contracts, stock rights and warrants to be investment derivatives.
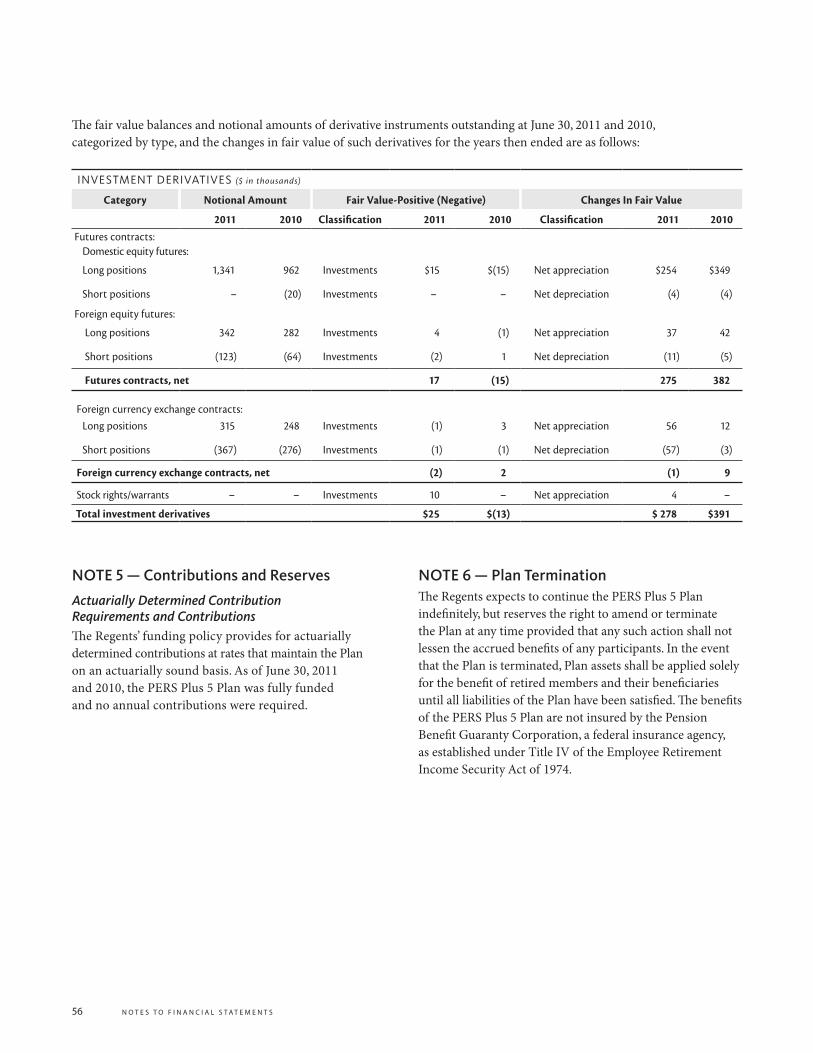
56 n o t e s t o f i n a n c i a l s t a t e m e n t s
The fair value balances and notional amounts of derivative instruments outstanding at June 30, 2011 and 2010, categorized by type, and the changes in fair value of such derivatives for the years then ended are as follows:
investMent Derivatives ($ in thousands)
Category Notional Amount Fair value-Positive (Negative) Changes In Fair value
2011 2010 Classification 2011 2010 Classification 2011 2010Futures contracts:
Domestic equity futures:
Long positions 1,341 962 Investments $15 $(15) Net appreciation $254 $349
Short positions – (20) Investments – – Net depreciation (4) (4)
Foreign equity futures:
Long positions 342 282 Investments 4 (1) Net appreciation 37 42
Short positions (123) (64) Investments (2) 1 Net depreciation (11) (5)
Futures contracts, net 17 (15) 275 382
Foreign currency exchange contracts:Long positions 315 248 Investments (1) 3 Net appreciation 56 12
Short positions (367) (276) Investments (1) (1) Net depreciation (57) (3)
Foreign currency exchange contracts, net (2) 2 (1) 9
Stock rights/warrants – – Investments 10 – Net appreciation 4 –
Total investment derivatives $25 $(13) $ 278 $391
NOtE 5 — Contributions and Reserves
Actuarially Determined Contribution Requirements and ContributionsThe Regents’ funding policy provides for actuarially determined contributions at rates that maintain the Plan on an actuarially sound basis. As of June 30, 2011 and 2010, the PERS Plus 5 Plan was fully funded and no annual contributions were required.
NOtE 6 — Plan terminationThe Regents expects to continue the PERS Plus 5 Plan indefinitely, but reserves the right to amend or terminate the Plan at any time provided that any such action shall not lessen the accrued benefits of any participants. In the event that the Plan is terminated, Plan assets shall be applied solely for the benefit of retired members and their beneficiaries until all liabilities of the Plan have been satisfied. The benefits of the PERS Plus 5 Plan are not insured by the Pension Benefit Guaranty Corporation, a federal insurance agency, as established under Title IV of the Employee Retirement Income Security Act of 1974.

U n i v e r s i t y o f c a l i f o r n i a 1 0 / 1 1 a n n U a l f i n a n c i a l r e p o r t / p e r s + 5 p l a n 57
Actuarial InformationAnalysis of dollar amounts of the actuarial value of assets, actuarial accrued liability, and actuarial value of assets in excess of the actuarial accrued liability in isolation can be misleading. Expressing the actuarial value of assets as a
percentage of the actuarial accrued liability provides one indication of the funding status on a going concern basis. Analysis of this percentage over time indicates whether a plan is becoming financially stronger or weaker. Generally, the greater this percentage, the stronger the plan.
reQUireD sUPPleMentary sCHeDUle of fUnDinG ProGress for tHe Past six years
vALUATION DATe AS OF JULY 1 ($ in thousands)
Actuarial valuation Date
(1) Actuarial value
of Assets*
(2) Actuarial Accrued
Liability**
(3) Actuarial Surplus
(4) Total Funded Ratio
(1)÷(2)
2010 $59,424 $35,514 $23,910 167.3%
2009 56,941 37,833 19,108 150.5
2008 76,336 39,777 36,559 191.9
2007 86,150 42,346 43,804 203.4
2006 77,830 43,877 33,953 177.4
2005 77,773 45,804 31,969 169.8 * Reported at fair value.** Includes present value of administrative expenses equal to one percent of actuarial accrued liability. Note: Because 100 percent of the members in the PERS Plus 5 Plan are retired, there is no annual covered payroll.
Actuarial valuations represent a long-term perspective and involve estimates of the value of reported amounts and assumptions about the probability of occurrence of events far into the future. Actuarially determined amounts are subject to periodic revisions as actual results are compared with past expectations and new estimates are made about the future. The schedule of funding progress presents multi-year trend information about whether the actuarial value of assets is increasing or decreasing over time relative to the actuarial accrued liability for benefits.
Required Schedule of University ContributionsSince 1996, the University has not been required to make contributions to the PERS Plus 5 Plan due to its fully funded status.
university of california pers plus 5 plan
required supplementary information
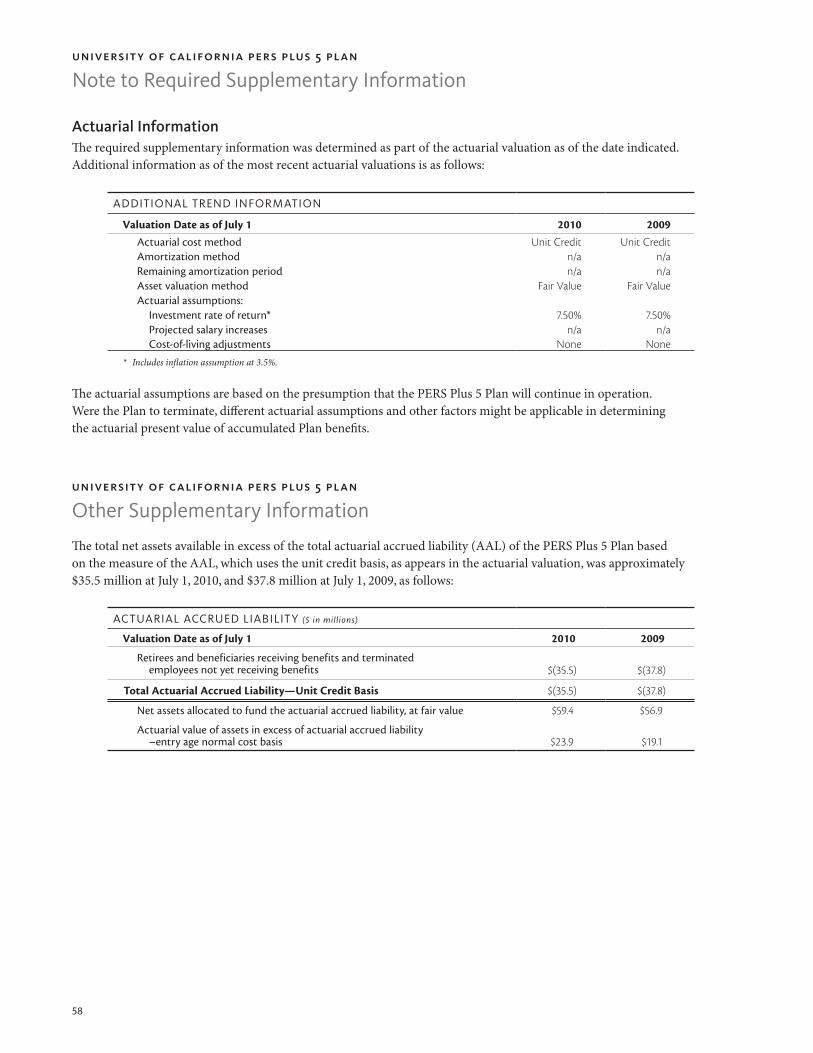
58
The total net assets available in excess of the total actuarial accrued liability (AAL) of the PERS Plus 5 Plan based on the measure of the AAL, which uses the unit credit basis, as appears in the actuarial valuation, was approximately $35.5 million at July 1, 2010, and $37.8 million at July 1, 2009, as follows:
university of california pers plus 5 plan
other supplementary information
aCtUarial aCCrUeD liability ($ in millions)
valuation Date as of July 1 2010 2009
Retirees and beneficiaries receiving benefits and terminated employees not yet receiving benefits $(35.5) $(37.8)
Total Actuarial Accrued Liability—Unit Credit Basis $(35.5) $(37.8)
Net assets allocated to fund the actuarial accrued liability, at fair value $59.4 $56.9
Actuarial value of assets in excess of actuarial accrued liability –entry age normal cost basis $23.9 $19.1
Actuarial InformationThe required supplementary information was determined as part of the actuarial valuation as of the date indicated. Additional information as of the most recent actuarial valuations is as follows:
aDDitional trenD inforMation
valuation Date as of July 1 2010 2009Actuarial cost method Unit Credit Unit CreditAmortization method n/a n/aRemaining amortization period n/a n/aAsset valuation method Fair Value Fair ValueActuarial assumptions:
Investment rate of return* 7.50% 7.50%Projected salary increases n/a n/aCost-of-living adjustments None None
* Includes inflation assumption at 3.5%.
The actuarial assumptions are based on the presumption that the PERS Plus 5 Plan will continue in operation. Were the Plan to terminate, different actuarial assumptions and other factors might be applicable in determining the actuarial present value of accumulated Plan benefits.
university of california pers plus 5 plan
note to required supplementary information


60
U n i v e r s i t y o f C a l i f o r n i a
Plan oversight — the board of regents
Sherry L. Lansing Chairman; ex officio member on all Committees except Committee on Governance
Bruce D. Varner Vice Chairman; Chairman, Committee on Finance; Vice Chairman, Committee on Governance; Member of Committee on Compensation; Oversight of the DOE Laboratories
Monica C. Lozano Chairman, Committee on Governance; Vice Chairman of Committee on Finance Vice Chairman, Committee on Compensation; Member of Committee on Health Services
Paul D. Wachter Chair, Committee on Investments; Member of Committees on Finance and Governance
George M. Marcus Vice Chairman, Committee on Investments; Member of Committees on Educational Policy and Long Range Planning; Oversight of the DOE Laboratories
Mark G. Yudof University President and Plan Administrator
i n v e s t M e n t M a n a G e M e n t | Chief investment office
Marie N. Berggren Chief Investment Officer and Vice President, Investments and Acting Treasurer
Melvin L. Stanton Associate Chief Investment Officer, Investments and Chief Operating Officer
Susan Rossi Communications Director
P l a n a D M i n i s t r a t i o n | office of the President Nathan Brostrom Executive Vice President, Business Operations
Dwaine B. Duckett Plan Administration Oversight and Vice President Human Resources
Michael C. Baptista Executive Director, Benefits Programs and Strategy, Human Resources Department
Esther C. Hill Director, HR Benefits Information Systems, Benefits Programs and Strategy, Human Resources Department
Joe Lewis Director, Retirement Administration Service Center, Human Resources Department
David L. Olson Director, Benefit Plan Accounting, CFO Division, Financial Accounting
Gary Schlimgen Director, Pension and Retirement Programs, Human Resources Department
P l a n f i n a n C i a l r e P o r t i n G & o v e r s i G H t
Peggy Arrivas Associate Vice President and Systemwide Controller, CFO Division, Financial Accounting
Barbara A. Clark University Counsel, The Regents
The Segal Company Plan Actuary
PricewaterhouseCoopers LLP Independent Plan Auditor
Requests for Information: This financial report is designed to provide The Regents, Plans’ retirees and others with a general overview of the Plans’ financial positions and results. Questions concerning this report should be addressed to:University of California Office of the President Human Resources Department P.O. Box 24570 Oakland, CA 94623-1570